microorganisms Article Transcriptomic Analysis Reveals Host miRNAs Correlated with Immune Gene Dysregulation during Fatal Disease Progression in the Ebola Virus Cynomolgus Macaque Disease Model Christopher P. Stefan 1, * ,† , Catherine E. Arnold 1,† , Charles J. Shoemaker 1,† , Elizabeth E. Zumbrun 2 , Louis A. Altamura 1 , Christina E. Douglas 1 , Cheryl L. Taylor-Howell 1 , Amanda S. Graham 1 , Korey L. Delp 1 , Candace D. Blancett 1 , Keersten M. Ricks 1 , Scott P. Olschner 1 , Joshua D. Shamblin 2 , Suzanne E. Wollen 2 , Justine M. Zelko 2 , Holly A. Bloomfield 2 , Thomas R. Sprague 2 , Heather L. Esham 2 and Timothy D. Minogue 1, * Citation: Stefan, C.P.; Arnold, C.E.; Shoemaker, C.J.; Zumbrun, E.E.; Altamura, L.A.; Douglas, C.E.; Taylor-Howell, C.L.; Graham, A.S.; Delp, K.L.; Blancett, C.D.; et al. Transcriptomic Analysis Reveals Host miRNAs Correlated with Immune Gene Dysregulation during Fatal Disease Progression in the Ebola Virus Cynomolgus Macaque Disease Model. Microorganisms 2021, 9, 665. https://doi.org/10.3390/ microorganisms9030665 Academic Editor: Andrea Marzi Received: 25 February 2021 Accepted: 19 March 2021 Published: 23 March 2021 Publisher’s Note: MDPI stays neutral with regard to jurisdictional claims in published maps and institutional affil- iations. Copyright: © 2021 by the authors. Licensee MDPI, Basel, Switzerland. This article is an open access article distributed under the terms and conditions of the Creative Commons Attribution (CC BY) license (https:// creativecommons.org/licenses/by/ 4.0/). 1 Diagnostic Systems Division, U.S. Army Medical Research Institute of Infectious Diseases, Ft. Detrick, MD 21702, USA; [email protected] (C.E.A.); [email protected] (C.J.S.); [email protected] (L.A.A.); [email protected] (C.E.D.); [email protected] (C.L.T.-H.); [email protected] (A.S.G.); [email protected] (K.L.D.); [email protected] (C.D.B.); [email protected] (K.M.R.); [email protected] (S.P.O.) 2 Virology Division, U.S. Army Medical Research Institute of Infectious Diseases, Ft. Detrick, MD 21702, USA; [email protected] (E.E.Z.); [email protected] (J.D.S.); [email protected] (S.E.W.); [email protected] (J.M.Z.); holly.a.bloomfi[email protected] (H.A.B.); [email protected] (T.R.S.); [email protected] (H.L.E.) * Correspondence: [email protected] (C.P.S.); [email protected] (T.D.M.); Tel.: +1-(301)-619-6352 (T.D.M.) † Contributed equally. Abstract: Ebola virus is a continuing threat to human populations, causing a virulent hemorrhagic fever disease characterized by dysregulation of both the innate and adaptive host immune responses. Severe cases are distinguished by an early, elevated pro-inflammatory response followed by a pronounced lymphopenia with B and T cells unable to mount an effective anti-viral response. The precise mechanisms underlying the dysregulation of the host immune system are poorly understood. In recent years, focus on host-derived miRNAs showed these molecules to play an important role in the host gene regulation arsenal. Here, we describe an investigation of RNA biomarkers in the fatal Ebola virus disease (EVD) cynomolgus macaque model. We monitored both host mRNA and miRNA responses in whole blood longitudinally over the disease course in these non-human primates (NHPs). Analysis of the interactions between these classes of RNAs revealed several miRNA markers significantly correlated with downregulation of genes; specifically, the analysis revealed those involved in dysregulated immune pathways associated with EVD. In particular, we noted strong interactions between the miRNAs hsa-miR-122-5p and hsa-miR-125b-5p with immunological genes regulating both B and T-cell activation. This promising set of biomarkers will be useful in future studies of severe EVD pathogenesis in both NHPs and humans and may serve as potential prognostic targets. Keywords: Ebola virus; non-human primate; pathogenesis; transcriptome; immunology; miRNA; mRNA; cytokine; inflammation; apoptosis 1. Introduction Ebola virus is a member of the negative single strand RNA virus family Filoviridae, noted for causing a virulent hemorrhagic fever in humans and non-human primates (NHPs) termed Ebola virus disease (EVD). The genus Ebolavirus includes five species with case fatality rates up to 90%. Zaire Ebolavirus (EBOV) is the most common species in human Microorganisms 2021, 9, 665. https://doi.org/10.3390/microorganisms9030665 https://www.mdpi.com/journal/microorganisms

Welcome message from author
This document is posted to help you gain knowledge. Please leave a comment to let me know what you think about it! Share it to your friends and learn new things together.
Transcript

microorganisms
Article
Transcriptomic Analysis Reveals Host miRNAs Correlated withImmune Gene Dysregulation during Fatal Disease Progressionin the Ebola Virus Cynomolgus Macaque Disease Model
Christopher P. Stefan 1,*,† , Catherine E. Arnold 1,† , Charles J. Shoemaker 1,†, Elizabeth E. Zumbrun 2,Louis A. Altamura 1, Christina E. Douglas 1, Cheryl L. Taylor-Howell 1, Amanda S. Graham 1, Korey L. Delp 1,Candace D. Blancett 1, Keersten M. Ricks 1, Scott P. Olschner 1, Joshua D. Shamblin 2, Suzanne E. Wollen 2 ,Justine M. Zelko 2, Holly A. Bloomfield 2, Thomas R. Sprague 2, Heather L. Esham 2 and Timothy D. Minogue 1,*
�����������������
Citation: Stefan, C.P.; Arnold, C.E.;
Shoemaker, C.J.; Zumbrun, E.E.;
Altamura, L.A.; Douglas, C.E.;
Taylor-Howell, C.L.; Graham, A.S.;
Delp, K.L.; Blancett, C.D.; et al.
Transcriptomic Analysis Reveals Host
miRNAs Correlated with Immune
Gene Dysregulation during Fatal
Disease Progression in the Ebola
Virus Cynomolgus Macaque Disease
Model. Microorganisms 2021, 9, 665.
https://doi.org/10.3390/
microorganisms9030665
Academic Editor: Andrea Marzi
Received: 25 February 2021
Accepted: 19 March 2021
Published: 23 March 2021
Publisher’s Note: MDPI stays neutral
with regard to jurisdictional claims in
published maps and institutional affil-
iations.
Copyright: © 2021 by the authors.
Licensee MDPI, Basel, Switzerland.
This article is an open access article
distributed under the terms and
conditions of the Creative Commons
Attribution (CC BY) license (https://
creativecommons.org/licenses/by/
4.0/).
1 Diagnostic Systems Division, U.S. Army Medical Research Institute of Infectious Diseases,Ft. Detrick, MD 21702, USA; [email protected] (C.E.A.);[email protected] (C.J.S.); [email protected] (L.A.A.);[email protected] (C.E.D.); [email protected] (C.L.T.-H.);[email protected] (A.S.G.); [email protected] (K.L.D.);[email protected] (C.D.B.); [email protected] (K.M.R.);[email protected] (S.P.O.)
2 Virology Division, U.S. Army Medical Research Institute of Infectious Diseases, Ft. Detrick, MD 21702, USA;[email protected] (E.E.Z.); [email protected] (J.D.S.);[email protected] (S.E.W.); [email protected] (J.M.Z.);[email protected] (H.A.B.); [email protected] (T.R.S.);[email protected] (H.L.E.)
* Correspondence: [email protected] (C.P.S.); [email protected] (T.D.M.);Tel.: +1-(301)-619-6352 (T.D.M.)
† Contributed equally.
Abstract: Ebola virus is a continuing threat to human populations, causing a virulent hemorrhagicfever disease characterized by dysregulation of both the innate and adaptive host immune responses.Severe cases are distinguished by an early, elevated pro-inflammatory response followed by apronounced lymphopenia with B and T cells unable to mount an effective anti-viral response. Theprecise mechanisms underlying the dysregulation of the host immune system are poorly understood.In recent years, focus on host-derived miRNAs showed these molecules to play an important rolein the host gene regulation arsenal. Here, we describe an investigation of RNA biomarkers inthe fatal Ebola virus disease (EVD) cynomolgus macaque model. We monitored both host mRNAand miRNA responses in whole blood longitudinally over the disease course in these non-humanprimates (NHPs). Analysis of the interactions between these classes of RNAs revealed several miRNAmarkers significantly correlated with downregulation of genes; specifically, the analysis revealedthose involved in dysregulated immune pathways associated with EVD. In particular, we notedstrong interactions between the miRNAs hsa-miR-122-5p and hsa-miR-125b-5p with immunologicalgenes regulating both B and T-cell activation. This promising set of biomarkers will be useful infuture studies of severe EVD pathogenesis in both NHPs and humans and may serve as potentialprognostic targets.
Keywords: Ebola virus; non-human primate; pathogenesis; transcriptome; immunology; miRNA;mRNA; cytokine; inflammation; apoptosis
1. Introduction
Ebola virus is a member of the negative single strand RNA virus family Filoviridae,noted for causing a virulent hemorrhagic fever in humans and non-human primates (NHPs)termed Ebola virus disease (EVD). The genus Ebolavirus includes five species with casefatality rates up to 90%. Zaire Ebolavirus (EBOV) is the most common species in human
Microorganisms 2021, 9, 665. https://doi.org/10.3390/microorganisms9030665 https://www.mdpi.com/journal/microorganisms

Microorganisms 2021, 9, 665 2 of 20
outbreaks and has claimed the most lives to date. Natural outbreaks of filoviruses inhumans have occurred in numerous countries in Central and Western Africa since itsdiscovery in 1976, with the 2013–2016 EBOV outbreak in West Africa being the largest todate. Characteristic EVD symptoms include fever, myalgia, headache, and gastrointestinalsymptoms with patients potentially developing a maculopapular rash [1,2]. Fatal outcomescorrelate with increased viremia, impaired immune responses, septic shock, disseminatedintravascular coagulation, and multi-organ failure [1–3]. Promising EVD experimentalvaccines and therapeutics have emerged in recent years; however, the primary treatmentregimen for infected persons is intensive supportive care focused on maintenance of fluids,electrolytes, and blood pressure [4]. Early diagnosis of EVD is critical for implementationof effective clinical interventions as well as limiting disease spread.
In general, both NHP and human survivors of hemorrhagic fever viruses controlviral loads early during the infection. In these cases, balanced immune responses arecharacterized by modest and transient early pro-inflammatory responses that transitionto virus-directed antibody and cell-mediated adaptive responses [5,6]. By contrast, severeor fatal outcomes are associated with high viremia and dysregulated immune responses,notably a significant early pro-inflammatory reaction. This hyperactive immune state isthought to be driven by selective EBOV infection of macrophages and immature mono-cytes, which in turn secrete key cytokine/chemokine mediators of inflammation [7–9].Paired with this exaggerated inflammatory response is a greatly diminished effective Band T-cell response. For example, in humans, a robust IgG antibody response to EBOVantigens is largely absent or diminished in fatal cases [5]. In severe EVD cases, the initialpro-inflammatory immune response manifests at both the gene and protein levels. Thisinflammatory state has numerous secondary effects, including the premature activationof immune pathways associated with the maturation and activation of B cells, cytotoxicT cells, and Natural Killer (NK) cells [6,10–12]. This early activation is later followedby widespread lymphocyte apoptosis [13]. The precise mechanism leading to this lym-phopenic end state and how it relates to the initial viral-driven inflammation responseremain unresolved.
An emerging field in diagnostics involves host transcriptomic biomarkers, whichincludes the total RNA changes present in various relevant clinical matrices compared touninfected baseline. One of the more relevant clinical matrices for this analysis is wholeblood as it is an easily accessible systemic tissue. The presence in blood of multiple celltypes relevant to immune response, including lymphocytes, macrophages, monocytes,eosinophils, basophils, and neutrophils, allows for the surveillance of diverse transcrip-tomic biomarkers during the course of infection, including messenger RNA (mRNA) andmicroRNA (miRNA) [14]. Our lab and many others have reported mRNA transcriptomicresponses to EBOV infection in NHPs [15–18]. Early mRNA biomarkers that have beenidentified and which correlate with human EVD are largely players in the innate immuneresponse pathway; examples of such genes include DDX58, IFI44, IFIT2, IFIT3, MX1,and OASL.
While host mRNAs are common targets for pathogen signature discovery, miRNAsare emerging as appealing diagnostic targets. miRNAs are short (~22 nt) non-coding RNAsequences that control gene expression through binding specific mRNAs, consequentlytargeting them for degradation and limiting their translation [19]. miRNAs can be of eitherhost or viral origin; examples of virally derived miRNAs can be found with viruses asdiverse as Epstein-Barr Virus and EBOV [20]. In the instance of EBOV, multiple virus-encoded miRNAs have been discovered, including EBOV-miR-1-5p, which is believed toplay a role in evasion of the host immune response [21]. The vast majority of detectablemiRNAs, however, are host-derived and these play important roles in the maintenance ofhomeostasis, both under healthy conditions and as a response to microbial infection. Incomparison to mRNAs or proteins, fewer discrete miRNAs have been identified as eachmiRNA can regulate multiple gene expression networks [22]. While mostly studied asmarkers of cancer biogenesis, miRNAs have been recognized in recent years as important
Microorganisms 2021, 9, 665 3 of 20
regulators of inflammatory and immune processes linked with infectious diseases includ-ing viral infection [23–26]. Limited research has been reported on the role that host-derivedmiRNAs play in modulating the immune response surrounding EBOV infection. We choseto investigate their role in Cynomolgus macaques (Macaca fascicularis) during EVD; thisNHP model for EBOV infection is favored due to the similarities in disease course seenrelative to humans [27]. In this study, we report a high-resolution temporal analysis, includ-ing during pre-symptomatic timepoints, of both host mRNA and miRNA transcriptomicresponses in cynomolgus macaques during fatal EBOV infection. Furthermore, we identifypotential miRNA regulation of key immune pathways that are implicated in severe EVD.
2. Materials and Methods2.1. Ethics Statement
This work was supported by an approved USAMRIID Institutional Animal Care andUse Committee (IACUC) animal research protocol (AP-17-020; approved September 2017)in compliance with the Animal Welfare Act, PHS Policy, and other Federal statutes andregulations relating to animals and experiments involving animals. The facility where thisresearch was conducted is accredited by the Association for Assessment and Accreditationof Laboratory Animal Care, International and adheres to principles stated in the Guidefor the Care and Use of Laboratory Animals, National Research Council, 2011. ApprovedUnited States Army Medical Research Institute of Infectious Diseases (USAMRIID) animalresearch protocols undergo an annual review every year. Animals are cared for by a largestaff of highly qualified veterinarians, veterinary technicians, and animal caretakers. Allpersonnel caring for and working with animals at USAMRIID have substantial trainingto ensure only the highest quality animal care and use. All steps were taken to enrich thewelfare and to avoid the suffering of the animals in accordance with the “Weatherall reportfor the use of nonhuman primates” recommendations. Animals were housed in adjoiningindividual primate cages allowing social interactions, under controlled conditions of hu-midity, temperature, and light (12 h light/12 h dark cycles). Food and water were availablead libitum. Animals were monitored and fed commercial monkey chow, treats, and fruittwice daily by trained personnel. Environmental enrichment consisted of commercial toys.Post-exposure, animals were evaluated daily for signs of illness. Following developmentof clinical signs, animals were checked multiple times daily. Institute scoring criteria wereused to determine timing of humane euthanasia under anesthesia. Highly trained per-sonnel completed all procedures under the oversight of an attending veterinarian and allinvasive clinical procedures were performed while animals were anesthetized. NHPs werehumanely euthanized by administration of greater than or equal to 6 mg/kg Telazol until asurgical plane of anesthesia was achieved, terminally bled via intracardiaccly (IC) puncture,and administered 0.3–0.4 ml/kg pentobarbital-based euthanasia solution (Fatal-Plus) IC.
2.2. Animals and Study Design
Nine, clinically normal, adult cynomolgus macaques (Macaca fascicularis), originallyobtained from World Wide Primates and housed in the USAMRIID NHP colony, were usedfor this study. The NHPs, mixed male (n = 5) and female (n = 4), were 8 to 9 years of age,and ranged in body weight from 4.80 to 10.40 kg at the time of challenge. None of theseNHPs were exposed to infectious pathogens in previous studies, and all were serologicallyscreened by ELISA and found to be negative for filovirus (Marburg/Ebola), Herpes B,STLV-1, SIV, SRV1, 2, and 3, Tuberculosis, Salmonella, Campylobacter, hypermucoid HVMKlebsiella, and Shigella infections. For the EBOV challenge, eight animals were challengedintramuscularly in the right lateral thigh with 1 mL of prepared virus inoculum witha target dose of 100 plaque forming units (PFU). The actual challenge dose was laterdetermined to be 152.5 PFU as determined by plaque assay. For an uninfected control,one animal was injected intramuscularly (in the thigh) with 1 mL of diluent consistingof Minimum Essential Media (MEM) +2% Heat Inactivated Fetal Calf Serum (HI-FCS).After EBOV exposure, all animals were monitored for temperature changes (rectal checks),
Microorganisms 2021, 9, 665 4 of 20
while weight loss trends, clinical signs of disease, survival trends, and blood sampleswere collected on days −14, −7, and 1–8 for virological, molecular, and chemical analyses.Animals were humanely euthanized when they reached a predetermined euthanasia scoreof 4 (out of 4). The uninfected control animal was euthanized immediately after the firstEBOV challenged animal was euthanized at 6 days post-infection (DPI). All experimentsusing live virus were performed in an animal Biosafety Level 4 (ABSL-4) containmentlaboratory at USAMRIID with trained personnel in positive pressure encapsulating suits.
2.3. Challenge Virus Stock
EBOV strain Kikwit95-7U was originally isolated from a 65 year female during anoutbreak occurring in 1995 in the Democratic Republic of the Congo (formerly Zaire). Thepatient exhibited disease, was hospitalized, and died. The passage of virus, designatedvirus seed pool 807223, was conducted at the CDC using Vero E6 cells. A second passageof virus, designated WRC000121, was conducted at the University of Texas Medical Branch.WRC000121 was transferred to USAMRIID and propagated on BEI-Vero E6 cells to producethe USAMRIID master seed stock, R4542, a 7U variant. The stock was subsequently plaquetitrated, sequenced, and confirmed negative for mycoplasma and endotoxin. On the dayof challenge, viral inoculum was prepared using viral seed stock diluted with MinimumEssential Media (MEM) + 2% Heat Inactivated Fetal Calf Serum (HI-FCS). The challengedose received by the animals was 152.5 PFU as determined by neutral red plaque assay aspreviously described [28].
2.4. Blood Chemistries and Sample Collection
Serum was isolated using a gel-based serum separator (Sarstedt, Numbrecht, Ger-many) and was stored at −80 ◦C for subsequent analysis. Blood chemistries were per-formed on serum with a Piccolo chemistry analyzer (Abaxis, Union City, CA, USA) utilizingGeneral Chemistry 13 detection discs according to manufacturer’s instructions. Wholeblood, saliva, nasal secretions, and rectal swabs were collected from anesthetized animals.Urine was collected from free-catch metabolic pans. All whole blood samples were ini-tially diluted 1:1 with purified molecular grade water, prior to being vigorously mixedwith a 3:1 ratio of TRIzol™ LS (ThermoFisher Scientific, Waltham, MA, USA). All othersample types were mixed at a 3:1 TRIzol™ LS ratio and were then frozen at −80 ◦C untilsubsequent extraction.
2.5. EBOV Antibody and Antigen Detection
For EBOV antibody detection, we utilized recombinant EBOV antigens producedin Drosophila S2 cell lines by Axel Lehrer at the University of Hawaii; these includedglycoprotein (GP), nucleoprotein (NP), and viral matrix protein (VP40). All antigen targetswere conjugated to magnetic microspheres using the Luminex xMAP® antibody couplingkit (Luminex Inc., Austin, TX, USA) according to the manufacturer’s instructions. Briefly,500 µL of Magplex microspheres (12.5 × 10⁶ microspheres/mL) were washed three timesusing a magnetic microcentrifuge tube holder, and resuspended in 480 µL of activationbuffer. Then, 10 µL of both sulfo-N-hydroxysulfosuccinimide (sulfo-NHS) and 1-Ethyl-3-(3-dimethylaminopropyl) carbodiimide hydrochloride (EDC) solutions were added to theresuspended microspheres. The tube was covered with aluminum foil and placed on abenchtop rotating mixer for 20 min. After surface activation with EDC, the microsphereswere washed three times with activation buffer prior to adding the recombinant proteinantigen at a final concentration of 4 µg antigen: 1×10⁶ microspheres. This concentration ofrecombinant protein coupled to the surface of microspheres has been shown to be optimalfor IgG and IgM detection. The tube was again covered with aluminum foil and placed ona benchtop rotating mixer for 2 h. After this coupling step, the microspheres were washedthree times with wash buffer and resuspended in 500 µL of wash buffer for future use.EBOV NP, VP40, and GP were coupled to Magplex microsphere regions #66, #77, and #19,
Microorganisms 2021, 9, 665 5 of 20
respectively, in order to facilitate multiplexing experiments. Beads were stored at 4 ◦C untilfurther use.
NHP serum samples were diluted 1:100 in 1X PBS containing 0.02% Tween-20 (Sigma,St. Louis, MO, USA) (PBST) and 5% skim milk (PBST-SK). Each individual antigen-coupledbead was mixed at a 1:1 ratio prior to diluting in PBST to 5×10⁴ microspheres/mL, andthe mixture was added to the wells of a Costar polystyrene 96-well plate at 50 µL per well(2500 microspheres of each antigen bead set/well). The plate was placed on a magneticplate separator (Luminex Corp, Austin, TX, USA), covered with foil, and microspheres wereallowed to collect for 60 s. While still attached to the magnet, the buffer was removed fromthe plate by inverting. Then, 50 µL of diluted serum samples were added to appropriatewells. The plate was covered with a black, vinyl plate cover and incubated with shaking for1 h at ambient temperature. The plate was washed three times with 100 µL of PBST for eachwash, using the plate magnet to retain the Magplex microspheres in the wells. Liquid wasdiscarded by inverting as above. Next, 50 µL of a 1:100 dilution of mouse anti-human IgMphycoerythrin conjugate (Invitrogen, MA1-10381, Carlsbad, CA, USA) or goat anti-humanIgG phycoerythrin conjugate (Sigma, P9170, St. Louis, MO, USA) in PBST-SK was addedto the appropriate wells. The plate was covered again with a black, vinyl plate sealer andincubated with shaking for 1 h at ambient temperature. After incubation, the plate waswashed three times as detailed above, and the Magplex microspheres were resuspended in100 µL of PBST for analysis on the Magpix instrument (Luminex Corp, Austin, TX, USA).Raw data was reported as median fluorescence intensity for each bead set in the multiplex.
For EBOV antigen detection, anti-VP40 (A10A produced at USAMRIID), anti-GP(AH05 produced at USAMRIID), and anti-NP (ZNP31-1-8 produced by Hokkaido Univer-sity Research Center) monoclonal antibodies were coupled to Magplex magnetic micro-spheres as described above. Anti-VP40, anti-GP, and anti-NP monoclonal antibodies werecoupled to bead regions #77, #19, and #26, respectively. Anti-VP40 (AE11 produced at US-AMRIID), anti-GP (13C6 produced at USAMRIID), and anti-NP (ZNP24-4-2 produced byHokkaido University Research Center) detector monoclonal antibodies were biotinylatedper EZ-Link™ Sulfo-NHS-Biotin kit instructions (Thermo Scientific, Waltham, MA, USA).NHP plasma samples were diluted 1:20 in 1X PBS containing 0.02% Tween-20 (Sigma,St. Louis, MO, USA) (PBST) and 5% skim milk (PBST-SK). Each individual antigen-coupledbead was mixed at a 1:1 ratio prior to diluting in PBST to 5×10⁴ microspheres/mL, andthe mixture was added to the wells of a Costar polystyrene 96-well plate at 50 µL per well(2500 microspheres of each antigen bead set/well). The plate was placed on a magneticplate separator (Luminex Corp, Austin, TX, USA), covered with foil, and microspheres wereallowed to collect for 60 sec. While still attached to the magnet, the buffer was removedfrom the plate by inverting. Then, 50 µL of diluted serum samples were added to appropri-ate wells. The plate was covered with a black, vinyl plate cover and incubated with shakingfor 1 h at ambient temperature. The plate was washed three times with 100 µL of PBSTfor each wash, using the plate magnet to retain the Magplex microspheres in the wells.Liquid was discarded by inverting as above. Next, 50 µL of a 4 µg/mL solution of all threebiotinylated detector antibodies diluted in PBST-SK was added to the wells. The plate wascovered again with a black, vinyl plate sealer and incubated with shaking for 1 h at ambienttemperature. After incubation, the plate was washed three times as detailed above prior toadding 50µL of streptavidin-phycoerythrin (SAPE, ThermoFisher Scientific, Waltham, MA,USA) diluted in PBST-SK, and incubated for 30 min at RT, covered with a black plate sealer.Finally, the plate was washed three times with 100 µL of PBST. The Magplex microsphereswere resuspended in 100 µL of PBST for analysis on the Magpix instrument (Luminex Corp,Austin, TX, USA). Raw data were reported as median fluorescence intensity for each beadset in the multiplex.
2.6. RNA Extraction and Quantitation
RNA for RT-qPCR analysis was extracted with the Qiagen EZ1 Advanced robot withthe EZ1 Virus Mini 2.0 Kit (Qiagen, Germantown, MD, USA) according to the manufac-
Microorganisms 2021, 9, 665 6 of 20
turer’s directions. RNA for NanoString and miRNA sequencing analysis was manuallyextracted using the miRNeasy kit (Qiagen, Germantown, MD, USA) following the man-ufacturer’s instructions with the modification that the initial TRIzol™ LS/water/wholeblood mixture was placed in a Phasemaker phase separation tube (Invitrogen) prior tobeing centrifuged at 12,000× g for 15 min at room temperature. The top aqueous layerwas then transferred into a 2 mL tube with 1.5 times the volume of 100% ethanol added.The samples were then transferred to a miRNeasy kit spin column 700 µL at a time. Eachsample was centrifuged for 30 s at 8000× g until the entire sample passed through thecolumn. Next, the samples were cleaned by adding 700 µL of buffer RWT to each columnand centrifuged for 30 s at 8000× g, followed by 500 µL of buffer RPE being added to thecolumns and centrifuged twice for 30 s at 8000× g. A final drying spin at 10,000× g for2 min removed any residual ethanol from the columns. The samples were then eluted in50 µL RNase-free water by centrifugation for 2 min at 10,000× g. Purified RNA sampleswere quantitated using the Qubit RNA HS Assay Kit (ThermoFisher Scientific, Waltham,MA, USA) according to the manufacturer’s recommendations and concentrations werereported in ng/µL.
2.7. Determination of Viremia in NHP Clinical Specimens by RT-qPCR
For all RT-qPCR assays, the previously designed Ebola-Zaire MGB assay targeting theviral NP was utilized [29]. Standard curves using RNA generated from EBOV Kikwit viruswere run for each sample matrix, and both positive control compensation wells and internalnegative control wells were run on each plate. Reactions were run on the LightCycler480 (Roche, Basel, Switzerland) with the following cycling conditions: 50 ◦C for 15 min(1 cycle); 95 ◦C for 5 min (1 cycle); 95 ◦C for 1 s and 60 ◦C for 20 s (45 cycles); and 40 ◦Cfor 30 s (1 cycle). A single fluorescence read was taken at the end of each 60 ◦C step, anda sample was considered positive if the Cq value was less than 40 cycles. Samples wereassayed in technical triplicate.
2.8. NanoString Processing and Analysis
We performed targeted gene expression profiling using total RNA isolated fromwhole blood using the NanoString NHP Immunology v. 2 panel CodeSet (NanoStringTechnologies, Inc., Seattle, WA, USA). Sample preparation for NanoString nCounter assayswas performed according to the manufacturer’s protocols. In brief, 8 µL of ReporterCodeSet was combined with 2 µL of Capture ProbeSet and 5 µL sample RNA. We dilutedRNA samples as necessary for a total concentration of 50 ng in 5 µL. In cases where theRNA concentration was insufficient, we used 5 µL of the undiluted samples. The reactionswere incubated for 17 h at 65 ◦C, followed by a 4 ◦C hold step until ready for analysis.After the hybridization period, the samples were loaded on NanoString SPRINT cartridges.The cartridges were then imaged by a SPRINT Profiler System (NanoString Technologies,Inc., Seattle, WA, USA), which counts the fluorescent molecular barcodes present in thecartridge. This data is converted to a text file (RCC) which indicates total counts per genetarget (i.e., gene expression).
All RCC files were imported into the nSolver 4.0 software to perform the following:assay quality assessments, background determination, positive control spike-in normal-ization, and reference gene normalization. The nCounter Advanced Analysis Module(nCAAM; v. 2.0.115) was used to perform initial quality control assessments, referencegene identification, and other analyses. Quality control (QC) was performed on RCC files,samples that did not pass initial QC were re-run on the NanoString nSolver platform. Rawcounts were then normalized to geometric mean counts of the synthetic positive controlsincluded on the codeset. nCAAM and the geNorm algorithm was used to normalize eachdataset by taking the five most stable housekeeping genes across samples and using it on alldatasets (Tables S1 and S2). Housekeeping genes used are listed in Table S3. For secondaryanalysis, data were processed using JMP genomics 8.1 software (SAS Institute, Cary, NC,USA). For sample binning, samples were binned into four phases including incubation,

Microorganisms 2021, 9, 665 7 of 20
early, mid, and late phases. Samples were categorized as follows: incubation phase sampleswere infected but not viremic, early phase samples were viremic and non-symptomatic,mid phase samples were viremic with responsiveness scores <2, and late phase sampleswere viremic with responsiveness scores >2. Expression changes for each phase werecompared to day −7 and −14 non-infected control samples. Variability resulting fromindividual NHPs was removed prior to analysis. Cutoff for differential gene expressionwas ±1 log2 fold-change with an FDR-adjusted p-value of 0.05.
2.9. miRNA Library Preparation, Sequencing and Analysis
Individual miRNA sequences were assigned Unique Molecular Indexes (UMI) usingQIAseq miRNA Library Prep kit (Qiagen, Germantown, MD, USA) with QIAseq miRNANGS 48 Index IL adapters (Qiagen, Germantown, MD, USA) following manufacturerecommendations. Sequencing libraries were quantified using a Qubit Fluorometer (Ther-moFisher Scientific, Waltham MA, USA) and library size was determined using the AgilentTapestation HS DNA 1000 assay (Agilent technologies, Santa Clara, CA, USA). Librarieswhere normalized to 2 nM and quantified using KAPA Biosystems Library QuantificationKit for Illumina platforms (KAPA Biosystems, Boston, MA, USA). Libraries were pooledat equal volume ratios. Pooled libraries were denatured with 0.1N NaOH for 5 min thenfurther diluted to 10–14 pM prior to sequencing on the MiSeq System (Illumina, San Diego,CA, USA) using a MiSeq kit V3 150 cycle kit following manufacture recommendations.
Primary analysis on raw FASTQ data, including mapping miRNA sequences andcounting UMIs, was performed using Qiagen Gene Globe Data Analysis Center (Table S4)(Qiagen, Germantown, MD, USA). For secondary analysis, data were processed usingJMP genomics 8.1 software (SAS Institute, Cary, NC, USA). Counts were given a thresholdof 10 and normalized to counts per million reads based on total counts for each sample.Data were log2 transformed prior to further analysis. Comparison of days -7 and -14 DPIresulted in one significant differentially expressed miRNA/piRNAs (DEM), hsa-miR-6126;therefore, these datasets were combined and utilized as pairwise comparators to all DPIsimilar to mRNA analysis. One pre-infection NHP sample was identified as an outlierand removed prior to analysis. Variability resulting from individual NHPs was removedprior to analysis. Cutoff for differential gene expression was ±1 log2 fold-change with anFDR-adjusted p-value of 0.05.
2.10. Pathway and Correlation Analysis
Ingenuity Pathway Analysis (IPA) (Qiagen) was used to determine enriched canonicalpathways and predicted upstream regulators using the comparison analysis. CIBERSORTwas used with averaged normalized mRNA counts for each day to determine estimatedcell population quantities using the LM22 human mixture dataset for comparison with500 permutations for statistical analysis [30]. KEGG pathway analysis was performed ondifferentially expressed miRNAs using DIANA-miRPath v3 [31]. Predicted interactions be-tween miRNAs and mRNAs were discovered using several databases within IPA includingTarBase, TargetScan, miRecords, and Ingenuity expert findings. Spearman Rho correlationswere calculated using JMP genomics 8.1 on matched NHP miRNA and mRNA normalizedcounts using DPI 0–8.
3. Results3.1. Challenge Design and Sample Characterization
Intramuscular challenge of eight NHPs with a 100 PFU target dose (152.5 actualdose) of Ebola-Kikwit with one sham infected (MEM + 2% HI-FCS diluent), showedthat all infected NHPs developed clinical signs starting at 5 days post-infection (DPI).Infected NHPs progressed to a severe disease state and reached endpoint euthanasiacriteria between 6–8 DPI (Figure 1a,b). All blood samples, which were collected terminally,showed elevated levels of the liver enzymes aspartate aminotransferase (AST) and alanineaminotransferase (ALT), which are blood chemical markers of liver distress common in

Microorganisms 2021, 9, 665 8 of 20
primates exposed to EBOV (Table S5) [32,33]. Additionally, we observed elevated levelsof blood urea nitrogen (BUN) and serum creatinine (CRE), which are markers of renaldamage [34]. Other clinical signs of EVD in NHPs included widespread maculopapularrash (8/8 infected animals), lymphadenopathy (2/8 infected animals), and nasal bleeding(1/8). No clinical signs of disease were observed in the uninfected control animal at anytime during the study.
Microorganisms 2021, 9, x 8 of 21
on differentially expressed miRNAs using DIANA-miRPath v3 [31]. Predicted interac-tions between miRNAs and mRNAs were discovered using several databases within IPA including TarBase, TargetScan, miRecords, and Ingenuity expert findings. Spearman Rho correlations were calculated using JMP genomics 8.1 on matched NHP miRNA and mRNA normalized counts using DPI 0–8.
3. Results 3.1. Challenge Design and Sample Characterization
Intramuscular challenge of eight NHPs with a 100 PFU target dose (152.5 actual dose) of Ebola-Kikwit with one sham infected (MEM + 2% HI-FCS diluent), showed that all in-fected NHPs developed clinical signs starting at 5 days post-infection (DPI). Infected NHPs progressed to a severe disease state and reached endpoint euthanasia criteria be-tween 6–8 DPI (Figure 1a,b). All blood samples, which were collected terminally, showed elevated levels of the liver enzymes aspartate aminotransferase (AST) and alanine ami-notransferase (ALT), which are blood chemical markers of liver distress common in pri-mates exposed to EBOV (Table S5) [32,33]. Additionally, we observed elevated levels of blood urea nitrogen (BUN) and serum creatinine (CRE), which are markers of renal dam-age [34]. Other clinical signs of EVD in NHPs included widespread maculopapular rash (8/8 infected animals), lymphadenopathy (2/8 infected animals), and nasal bleeding (1/8). No clinical signs of disease were observed in the uninfected control animal at any time during the study.
Figure 1. Clinical response, viremia, and digital sorting of whole blood non-human primate (NHP) samples infected with EBOV. (a) Kaplan-Meier survival curve of 9 cynomolgus macaques in this study. NHP 1 was a sham-challenge with dilu-ent whereas NHPs 2–9 were challenged intramuscularly with 152 PFU of EBOV. (b) Responsiveness scores. Scale of 0–4 with 0 displaying no symptoms and 4 showing severe symptoms. NHP1 data represent sham infected control. (c) Digital
Figure 1. Clinical response, viremia, and digital sorting of whole blood non-human primate (NHP) samples infected withEBOV. (a) Kaplan-Meier survival curve of 9 cynomolgus macaques in this study. NHP 1 was a sham-challenge with diluentwhereas NHPs 2–9 were challenged intramuscularly with 152 PFU of EBOV. (b) Responsiveness scores. Scale of 0–4 with0 displaying no symptoms and 4 showing severe symptoms. NHP1 data represent sham infected control. (c) Digital cellsorting of whole blood transcriptomic data. Relative percentage of immune cells present in whole blood were estimatedbased on normalized count data and compared to a human control dataset (LM22). P-values were calculated to determinethe statistical significance of the deconvolution result across cell types. * indicates p-value ≤0.05 and ** indicates p-value≤0.005. All NHPs for each timepoint were averaged prior to analysis save 8 days post-infection (DPI) which only containedone NHP. (d) Percentage of samples positive with viral RNA as determined by RT-qPCR in multiple matrices; excludingsham infected NHP #1.
CIBERSORT, a digital cell sorting program, determined the immune cell populationspresent during the course of infection in lieu of a complete blood count (CBC). Specifically,normalized counts for the NanoString NHP Immunology v. 2 codeset served as an inputyielding predicted relative cell population numbers for nine different immune cell popu-lations (Figure 1c). This transcriptomic signature indicated that NHPs experienced lossof lymphocytes, including both T- and B-cells, during disease progression. Pre-exposureshowed that B- and T-cells make up a total of 55.21% of the predicted immune cell pop-ulation. This dropped to the lowest percentage of 7.92% at 7 DPI. There was an increasein predicted monocytes and macrophages starting at 3 DPI and increasing through 8 DPI.Predicted percentage of monocytes and macrophages started at 6.08% at baseline and

Microorganisms 2021, 9, 665 9 of 20
increased to 46.86% at 8 DPI. An increase of predicted neutrophils occurred from 2 DPIthrough 5 DPI and began to decrease through 8 DPI, reaching 59.48% at 6 DPI, up frombaseline value of 25.69%.
Processing and analysis by RT-qPCR of samples determined both the qualitativescoring of infection state, as well as a semi-quantitative estimate of viral load in multiplematrices. Some whole blood samples showed detectable virus as early as 2 days post-infection, and in all NHPs by 4 DPI, while other matrices had virus at later DPI (Figure 1d).Analysis for the presence of Ebola antigen VP40, GP, and NP yielded positive results byDPI 4 in most plasma NHP samples, however no significant IgM or IgG response was seenin any of the NHP samples (Figure 2 and Figure S1).
Microorganisms 2021, 9, x 9 of 21
cell sorting of whole blood transcriptomic data. Relative percentage of immune cells present in whole blood were esti-mated based on normalized count data and compared to a human control dataset (LM22). P-values were calculated to determine the statistical significance of the deconvolution result across cell types. * indicates p-value ≤0.05 and ** indicates p-value ≤0.005. All NHPs for each timepoint were averaged prior to analysis save 8 days post-infection (DPI) which only contained one NHP. (d) Percentage of samples positive with viral RNA as determined by RT-qPCR in multiple matrices; excluding sham infected NHP #1.
CIBERSORT, a digital cell sorting program, determined the immune cell populations present during the course of infection in lieu of a complete blood count (CBC). Specifically, normalized counts for the NanoString NHP Immunology v. 2 codeset served as an input yielding predicted relative cell population numbers for nine different immune cell popu-lations (Figure 1c). This transcriptomic signature indicated that NHPs experienced loss of lymphocytes, including both T- and B-cells, during disease progression. Pre-exposure showed that B- and T-cells make up a total of 55.21% of the predicted immune cell popu-lation. This dropped to the lowest percentage of 7.92% at 7 DPI. There was an increase in predicted monocytes and macrophages starting at 3 DPI and increasing through 8 DPI. Predicted percentage of monocytes and macrophages started at 6.08% at baseline and in-creased to 46.86% at 8 DPI. An increase of predicted neutrophils occurred from 2 DPI through 5 DPI and began to decrease through 8 DPI, reaching 59.48% at 6 DPI, up from baseline value of 25.69%.
Processing and analysis by RT-qPCR of samples determined both the qualitative scoring of infection state, as well as a semi-quantitative estimate of viral load in multiple matrices. Some whole blood samples showed detectable virus as early as 2 days post-in-fection, and in all NHPs by 4 DPI, while other matrices had virus at later DPI (Figure 1d). Analysis for the presence of Ebola antigen VP40, GP, and NP yielded positive results by DPI 4 in most plasma NHP samples, however no significant IgM or IgG response was seen in any of the NHP samples (Figure 2 and Figure S1).
Figure 2. VP40, GP, and NP antigen, response in EBOV infected NHPs. Box and whisker plots for MFI of serum (a) viral protein (VP40), (b) glycoprotein (GP), and (c) nucleoprotein (NP) levels across all timepoints. Whiskers represent min and max values, box indicates the 25th and 75th, and centerline indicates the mean. Dots represent each NHP. The aver-age of uninfected (day 7) samples plus three standard deviations were used as a cutoff and represented by a dashed line.
3.2. Differential Gene Expression Trends Evaluation across the 754 genes in the NanoString NHP Immunology v. 2 panel-
codeset, showed 528 were differentially expressed genes (DEGs) for at least one timepoint during infection (Table S6). Differential gene expression (DGE) analysis using a combina-tion of the day −7 and day −14 DPI blood draws for pairwise comparisons to post-exposure timepoints produced no differentially expressed genes (DEGs), therefore we combined both sample sets as a pre-exposure baseline. As only one NHP survived to 8 DPI, one sample was used for DGE analysis at this timepoint. Our analysis did not include the con-trol NHP. DGE analysis resulted in significant fold changes for genes starting at 1 DPI. The number of DEGs increased in number and fold change with 2 DPI through 8 DPI
Figure 2. VP40, GP, and NP antigen, response in EBOV infected NHPs. Box and whisker plots for MFI of serum (a) viralprotein (VP40), (b) glycoprotein (GP), and (c) nucleoprotein (NP) levels across all timepoints. Whiskers represent min andmax values, box indicates the 25th and 75th, and centerline indicates the mean. Dots represent each NHP. The average ofuninfected (day 7) samples plus three standard deviations were used as a cutoff and represented by a dashed line.
3.2. Differential Gene Expression Trends
Evaluation across the 754 genes in the NanoString NHP Immunology v. 2 panelcodeset,showed 528 were differentially expressed genes (DEGs) for at least one timepoint duringinfection (Table S6). Differential gene expression (DGE) analysis using a combinationof the day −7 and day −14 DPI blood draws for pairwise comparisons to post-exposuretimepoints produced no differentially expressed genes (DEGs), therefore we combined bothsample sets as a pre-exposure baseline. As only one NHP survived to 8 DPI, one sample wasused for DGE analysis at this timepoint. Our analysis did not include the control NHP. DGEanalysis resulted in significant fold changes for genes starting at 1 DPI. The number of DEGsincreased in number and fold change with 2 DPI through 8 DPI (Figure 3a). The greatestnumbers of DEGs were seen at 7 DPI; 425 total with 95 downregulated and 320 upregulated,coinciding with peak clinical illness. Of note, five genes differentially expressed at 1 DPIincluded interferon-stimulated genes IFIT2, IFIT3, and IFI44. Decreased expression of thechemokine CCL3 at 1 DPI later increased, peaking at 5 DPI. IL8 is upregulated at 1 DPIand demonstrates fluctuating levels of expression over the course of disease (Figure 3b).These genes appeared prior to the emergence of physical symptoms of illness and prior todetection of virus in whole blood for a majority of animals. Antigen presentation-relatedgenes were strongly impacted over the course of infection with the genes TAP1, TAPBP,HLA-A, HLA-B, B2M, MR1, PSMB8, and PSMB9 showed strong upregulation. In contrast,EVD infection resulted in downregulation of many MHC II-specific genes at multipletimepoints, including CD74, HLA-DMA, DLA-DPA1, HLA-DPB1, HLA-DQA1, HLA-DRA,and HLA-DRB1 (Table S6).

Microorganisms 2021, 9, 665 10 of 20
Microorganisms 2021, 9, x 10 of 21
(Figure 3a). The greatest numbers of DEGs were seen at 7 DPI; 425 total with 95 downreg-ulated and 320 upregulated, coinciding with peak clinical illness. Of note, five genes dif-ferentially expressed at 1 DPI included interferon-stimulated genes IFIT2, IFIT3, and IFI44. Decreased expression of the chemokine CCL3 at 1 DPI later increased, peaking at 5 DPI. IL8 is upregulated at 1 DPI and demonstrates fluctuating levels of expression over the course of disease (Figure 3b). These genes appeared prior to the emergence of physical symptoms of illness and prior to detection of virus in whole blood for a majority of ani-mals. Antigen presentation-related genes were strongly impacted over the course of in-fection with the genes TAP1, TAPBP, HLA-A, HLA-B, B2M, MR1, PSMB8, and PSMB9 showed strong upregulation. In contrast, EVD infection resulted in downregulation of many MHC II-specific genes at multiple timepoints, including CD74, HLA-DMA, DLA-DPA1, HLA-DPB1, HLA-DQA1, HLA-DRA, and HLA-DRB1 (Table S6).
Figure 3. mRNA expression profile of NHPs infected with EBOV. (a). Total number of significantly expressed mRNAs in whole blood NHP samples at each DPI plotted against log10(1+copies/mL) Ebola virus as determined by quantitative RT-PCR. (b). Log2 (normalized counts) of significant differentially expressed genes (DEGs) at 1 DPI plotted versus DPI. Data were baseline subtracted to 0 DPI. (c) Samples were binned into for groups according to responsiveness and viremia (see methods). VENN diagram displays overlap of significantly expressed mRNAs across all groups. (d) Top 20 significant pathways determined by IPA analysis of DEGs ranked by activation z-score.
Figure 3. mRNA expression profile of NHPs infected with EBOV. (a). Total number of significantly expressed mRNAsin whole blood NHP samples at each DPI plotted against log10(1+copies/mL) Ebola virus as determined by quantitativeRT-PCR. (b). Log2 (normalized counts) of significant differentially expressed genes (DEGs) at 1 DPI plotted versus DPI.Data were baseline subtracted to 0 DPI. (c) Samples were binned into for groups according to responsiveness and viremia(see methods). VENN diagram displays overlap of significantly expressed mRNAs across all groups. (d) Top 20 significantpathways determined by IPA analysis of DEGs ranked by activation z-score.
Further exploration of mRNA expression changes during EBOV infection with wholeblood NHP samples binned based on viremic status coupled with overt symptoms (SeeSection 2) demonstrated expression patterns specific to phases during disease course.VENN diagrams corresponding to these bins showed most DEGs significantly expressedacross mid and late, 183, or early, mid, and late phases, 136, of the disease progression(Figure 3c and Table S7). Only 4 genes ubiquitously expressed at significant levels acrossall phases of infection. These included IRF7, S100A8, S100A9, and IFI44. S100A9 encodesthe protein complex calprotectin; known to be secreted during inflammation [35]. IRF7 isa vital interferon regulatory transcription factor. Interestingly, several genes were foundsignificantly expressed in selective phases including 7 genes: CD19, FCGR3, PRDM1, IRF1,CXCR2, IL13RA1, and CD79A. These genes were found only in the early stages of infection.Multiple genes, 42 and 80 respectively, were uniquely significantly expressed during themid and late phases of infection.
Microorganisms 2021, 9, 665 11 of 20
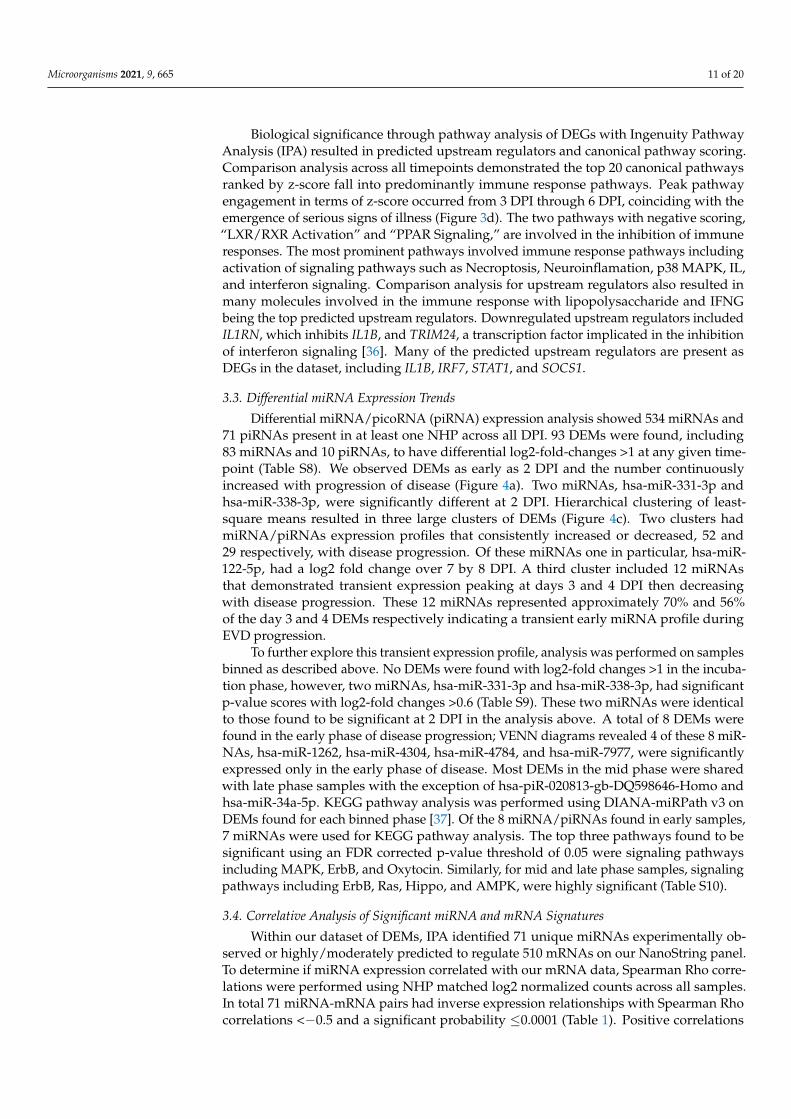
Biological significance through pathway analysis of DEGs with Ingenuity PathwayAnalysis (IPA) resulted in predicted upstream regulators and canonical pathway scoring.Comparison analysis across all timepoints demonstrated the top 20 canonical pathwaysranked by z-score fall into predominantly immune response pathways. Peak pathwayengagement in terms of z-score occurred from 3 DPI through 6 DPI, coinciding with theemergence of serious signs of illness (Figure 3d). The two pathways with negative scoring,“LXR/RXR Activation” and “PPAR Signaling,” are involved in the inhibition of immuneresponses. The most prominent pathways involved immune response pathways includingactivation of signaling pathways such as Necroptosis, Neuroinflamation, p38 MAPK, IL,and interferon signaling. Comparison analysis for upstream regulators also resulted inmany molecules involved in the immune response with lipopolysaccharide and IFNGbeing the top predicted upstream regulators. Downregulated upstream regulators includedIL1RN, which inhibits IL1B, and TRIM24, a transcription factor implicated in the inhibitionof interferon signaling [36]. Many of the predicted upstream regulators are present asDEGs in the dataset, including IL1B, IRF7, STAT1, and SOCS1.
3.3. Differential miRNA Expression Trends
Differential miRNA/picoRNA (piRNA) expression analysis showed 534 miRNAs and71 piRNAs present in at least one NHP across all DPI. 93 DEMs were found, including83 miRNAs and 10 piRNAs, to have differential log2-fold-changes >1 at any given time-point (Table S8). We observed DEMs as early as 2 DPI and the number continuouslyincreased with progression of disease (Figure 4a). Two miRNAs, hsa-miR-331-3p andhsa-miR-338-3p, were significantly different at 2 DPI. Hierarchical clustering of least-square means resulted in three large clusters of DEMs (Figure 4c). Two clusters hadmiRNA/piRNAs expression profiles that consistently increased or decreased, 52 and29 respectively, with disease progression. Of these miRNAs one in particular, hsa-miR-122-5p, had a log2 fold change over 7 by 8 DPI. A third cluster included 12 miRNAsthat demonstrated transient expression peaking at days 3 and 4 DPI then decreasingwith disease progression. These 12 miRNAs represented approximately 70% and 56%of the day 3 and 4 DEMs respectively indicating a transient early miRNA profile duringEVD progression.
To further explore this transient expression profile, analysis was performed on samplesbinned as described above. No DEMs were found with log2-fold changes >1 in the incuba-tion phase, however, two miRNAs, hsa-miR-331-3p and hsa-miR-338-3p, had significantp-value scores with log2-fold changes >0.6 (Table S9). These two miRNAs were identicalto those found to be significant at 2 DPI in the analysis above. A total of 8 DEMs werefound in the early phase of disease progression; VENN diagrams revealed 4 of these 8 miR-NAs, hsa-miR-1262, hsa-miR-4304, hsa-miR-4784, and hsa-miR-7977, were significantlyexpressed only in the early phase of disease. Most DEMs in the mid phase were sharedwith late phase samples with the exception of hsa-piR-020813-gb-DQ598646-Homo andhsa-miR-34a-5p. KEGG pathway analysis was performed using DIANA-miRPath v3 onDEMs found for each binned phase [37]. Of the 8 miRNA/piRNAs found in early samples,7 miRNAs were used for KEGG pathway analysis. The top three pathways found to besignificant using an FDR corrected p-value threshold of 0.05 were signaling pathwaysincluding MAPK, ErbB, and Oxytocin. Similarly, for mid and late phase samples, signalingpathways including ErbB, Ras, Hippo, and AMPK, were highly significant (Table S10).
3.4. Correlative Analysis of Significant miRNA and mRNA Signatures
Within our dataset of DEMs, IPA identified 71 unique miRNAs experimentally ob-served or highly/moderately predicted to regulate 510 mRNAs on our NanoString panel.To determine if miRNA expression correlated with our mRNA data, Spearman Rho corre-lations were performed using NHP matched log2 normalized counts across all samples.In total 71 miRNA-mRNA pairs had inverse expression relationships with Spearman Rhocorrelations <−0.5 and a significant probability ≤0.0001 (Table 1). Positive correlations

Microorganisms 2021, 9, 665 12 of 20
were ignored for this analysis, as this would indicate an indirect method of miRNA regula-tion of mRNA transcripts. Of these 71 miRNA-mRNA pairs, three had a Spearman Rhocorrelation <−0.7.
Microorganisms 2021, 9, x 12 of 21
Figure 4. Differentially expressed miRNAs/piRNAs (DEM) expression profile of NHPs infected with EBOV. (a) Total num-ber of DEMs at each DPI plotted against log10 (1+copies/mL) EBOV as determined by quantitative RT-PCR. (b) Hierarchical clustered heat map of least square means calculated for each significantly expressed DEM across all timepoints. Colors indicate 2 clusters of continuously upregulated/downregulated DEMs and 1 cluster of transiently expressed DEM (c). VENN diagram of DEMs resulting from binning samples into four groups according to responsiveness and viremia.
To further explore this transient expression profile, analysis was performed on sam-ples binned as described above. No DEMs were found with log2-fold changes >1 in the incubation phase, however, two miRNAs, hsa-miR-331-3p and hsa-miR-338-3p, had sig-nificant p-value scores with log2-fold changes >0.6 (Table S9). These two miRNAs were identical to those found to be significant at 2 DPI in the analysis above. A total of 8 DEMs were found in the early phase of disease progression; VENN diagrams revealed 4 of these 8 miRNAs, hsa-miR-1262, hsa-miR-4304, hsa-miR-4784, and hsa-miR-7977, were signifi-cantly expressed only in the early phase of disease. Most DEMs in the mid phase were shared with late phase samples with the exception of hsa-piR-020813-gb-DQ598646-Homo and hsa-miR-34a-5p. KEGG pathway analysis was performed using DIANA-miRPath v3 on DEMs found for each binned phase [37]. Of the 8 miRNA/piRNAs found in early sam-ples, 7 miRNAs were used for KEGG pathway analysis. The top three pathways found to be significant using an FDR corrected p-value threshold of 0.05 were signaling pathways including MAPK, ErbB, and Oxytocin. Similarly, for mid and late phase samples, signal-ing pathways including ErbB, Ras, Hippo, and AMPK, were highly significant (Table S10).
Figure 4. Differentially expressed miRNAs/piRNAs (DEM) expression profile of NHPs infected with EBOV. (a) Total numberof DEMs at each DPI plotted against log10 (1+copies/mL) EBOV as determined by quantitative RT-PCR. (b) Hierarchicalclustered heat map of least square means calculated for each significantly expressed DEM across all timepoints. Colorsindicate 2 clusters of continuously upregulated/downregulated DEMs and 1 cluster of transiently expressed DEM (c). VENNdiagram of DEMs resulting from binning samples into four groups according to responsiveness and viremia.
We assessed correlations between mRNAs within our NanoString panel and the sevenDEMs, hsa-miR-125b-5p, hsa-miR-1262, hsa-miR-7977, hsa-miR-4784, hsa-miR-338-3p, hsa-miR-144-3p, and hsa-miR-4304, that were identified early in disease progression. Predictiveanalysis suggested these miRNAs regulated 181 mRNAs within the NanoString panelof which 10 miRNA-mRNA pairs had Spearman Rho correlations <−0.5 and a p-value≤0.0001. Of these 10 pairs, miRNA hsa-miR-125b-5p was over-represented and correlatedwith mRNAs IL16, ETS1, BCL2, PPP1R12B, IRF4, CD244, and CASP2. Interestingly, the earlyphase miRNAs hsa-miR-144-3p and hsa-miR-338-3p, were also significantly correlatedwith ETS1 gene repression (Table 1).

Microorganisms 2021, 9, 665 13 of 20
Table 1. Spearman Rho correlations of log2 (normalized data) between miRNA and mRNA transcripts.
miRNA mRNA SpearmanRho Prob>|Rho| miRNA mRNA Spearman
Rho Prob>|Rho|
hsa-miR-125b-5p * IL16 −0.767 <0.0001 hsa-miR-423-5p LTF −0.5655 <0.0001
hsa-miR-424-5p AKT3 −0.7083 <0.0001 hsa-miR-143-3p GZMK −0.5647 <0.0001
hsa-miR-125b-5p * ETS1 −0.7004 <0.0001 hsa-miR-424-5p ICOS −0.5634 <0.0001
hsa-miR-424-5p IL7R −0.6876 <0.0001 hsa-miR-423-5p CHIT1 −0.5619 <0.0001
hsa-miR-21-5p MALT1 −0.6873 <0.0001 hsa-miR-199b-5p ETS1 −0.5581 <0.0001
hsa-miR-143-3p CD3D −0.6799 <0.0001 hsa-miR-122-5p CD3E −0.5548 <0.0001
hsa-miR-143-3p MAP4K1 −0.6787 <0.0001 hsa-miR-423-5p TNFRSF13C −0.5541 <0.0001
hsa-miR-223-5p KLRC3 −0.6655 <0.0001 hsa-miR-338-3p * ETS1 −0.5505 <0.0001
hsa-miR-122-5p LILRB1 −0.6615 <0.0001 hsa-miR-19b-3p RPS6KA5 −0.549 <0.0001
hsa-miR-125b-5p * BCL2 −0.6473 <0.0001 hsa-miR-34a-5p KLRK1 −0.549 <0.0001
hsa-miR-122-5p CCL5 −0.6421 <0.0001 hsa-miR-424-5p HLA-DQA1 −0.5477 <0.0001
hsa-miR-199a-3p PLCB1 −0.6324 <0.0001 hsa-miR-199b-5p GZMB −0.5455 <0.0001
hsa-miR-27a-3p IRF4 −0.6323 <0.0001 hsa-miR-223-5p HLA-DPB1 −0.545 <0.0001
hsa-miR-423-5p MAFG −0.6271 <0.0001 hsa-miR-19b-3p MAF −0.5431 <0.0001
hsa-miR-424-5p BCL2 −0.6242 <0.0001 hsa-miR-1260b TNFRSF13C −0.5386 <0.0001
hsa-miR-1260b MAFG −0.6224 <0.0001 hsa-miR-423-3p MAFG −0.5381 <0.0001
hsa-miR-370-3p SMAD3 −0.622 <0.0001 hsa-miR-671-5p KLRC3 −0.5373 <0.0001
hsa-miR-424-5p CD3E −0.6184 <0.0001 hsa-miR-423-5p ATG7 −0.5363 <0.0001
hsa-miR-27a-3p HLA-DRA −0.6113 <0.0001 hsa-miR-27a-3p MEF2C −0.535 <0.0001
hsa-miR-1260b TNFSF14 −0.6082 <0.0001 hsa-miR-19b-3p GZMK −0.5329 <0.0001
hsa-miR-296-5p IKBKE −0.6064 <0.0001 hsa-miR-143-3p MAF −0.5326 <0.0001
hsa-miR-199b-5p KLRF1 −0.6012 <0.0001 hsa-miR-125b-5p * CASP2 −0.5308 <0.0001
hsa-miR-144-3p * ETS1 −0.5972 <0.0001 hsa-miR-29c-3p DPP4 −0.529 <0.0001
hsa-miR-34a-5p HLA-DQA1 −0.5925 <0.0001 hsa-miR-432-5p RELA −0.5284 <0.0001
hsa-miR-23a-3p KLRF1 −0.5905 <0.0001 hsa-miR-125b-5p CD244 −0.5235 <0.0001
hsa-miR-125b-5p * PPP1R12B −0.5882 <0.0001 hsa-miR-1260b CHIT1 −0.5228 <0.0001
hsa-miR-10b-5p CD3G −0.5852 <0.0001 hsa-miR-676-3p CD3G −0.5212 <0.0001
hsa-miR-143-3p HLA-DPB1 −0.5805 <0.0001 hsa-miR-1260b DAXX −0.5208 <0.0001
hsa-miR-127-3p PLAUR −0.5763 <0.0001 hsa-miR-143-3p BCL2 −0.5199 <0.0001
hsa-miR-27a-3p ICOS −0.5752 <0.0001 hsa-miR-1262 * ANP32B −0.5167 <0.0001
hsa-miR-6865-5p THY1 −0.5751 <0.0001 hsa-miR-423-5p TNFRSF14 −0.5164 <0.0001
hsa-miR-34a-5p KLRD1 −0.5749 <0.0001 hsa-miR-423-5p PLA2G6 −0.5154 <0.0001
hsa-miR-23a-3p BCL2 −0.5747 <0.0001 hsa-miR-296-5p CD22 −0.514 <0.0001
hsa-miR-21-5p TGFBI −0.5714 <0.0001 hsa-miR-423-5p CSF3 −0.5125 <0.0001
hsa-miR-125b-5p * IRF4 −0.5683 <0.0001 hsa-miR-29c-3p TRAF5 −0.5113 <0.0001
hsa-miR-223-5p DPP4 −0.5675 <0.0001 - - - -
* Indicates has-miRNAs found to be significantly expressed early in disease progression.
4. Discussion
Future efforts in Ebola virus research and clinical treatment depend on improveddiagnostics and medical countermeasures. Definition of reliable host biomarkers/classifiersof EVD determinant of disease status, both diagnostically and prognostically, will beinvaluable. To this end, we sought to further refine host transcriptomic miRNA andmRNA signatures in a key animal model of EVD. We focused this analysis on identificationof host miRNAs involved in EVD pathogenesis. Our focus on miRNAs as biomarkertargets of interest continues previous research by our group evaluating these molecules as

Microorganisms 2021, 9, 665 14 of 20
potentially robust host diagnostic targets for viral hemorrhagic fevers including EVD [38].We investigated miRNAs occurring during EBOV pathogenesis in a key NHP model ofEVD. For all EBOV-challenged cynomolgus macaques in this study, the clinical progressionof EVD was consistent with previous reports for this model and was uniformly fatal(Figure 1a, Table S1). Our RT-qPCR data demonstrated escalating viremia in all challengedNHPs, consistent with fulminate infection and an insufficient host immune response(Figure 1c,d, Figures 3a and 4a). As such, this challenge cohort appears typical of the EVDNHP model, and was suitable for investigation of disease-associated biomarkers.
Severe EVD pathogenesis in primates bears many of the hallmarks of sepsis andis frequently described as having two distinct phases: (1) an initial pro-inflammatoryphase characterized by widespread activation of cytokines/chemokines like TNF-α andIL-1β, and (2) a disrupted anti-inflammatory response that can limit successful lymphocyteactivation and function, and which is distinguished by dramatic lymphopenia [6]. Insevere cases, the end result of this immune dysregulation is impaired multi-organ failure,septic shock, and death [9]. In this study, we detected the pro-inflammatory transcriptionalresponse as early as 1 DPI with full engagement in all NHPs by 3 DPI. Here, we observedsome mRNA DEGs, including CCL3, IF44, IFIT2, and IFIT3 appearing prior to both onset ofclinical signs of illness and detection of EBOV genome by qPCR (Figures 1d and 3b). Theseearly mRNA biomarkers primarily belong to the family of interferon-stimulated genes(ISGs) implicated in the host anti-viral responses associated with a number of other RNAviruses [39–42]. Pronounced ISG upregulation is a known biomarker for severe EVD withhigher viremia stimulating higher inflammatory responses. Indeed, in both human andanimal models, strong ISG upregulation often correlates with fatal outcomes for EVD [16].mRNA pathway analysis further highlighted this early pro-inflammatory phase emergingby 1 DPI with gene expression pathways associated with hypercytokinemia (Figure 3d).Interestingly, we identified numerous pro-inflammatory genes that are associated with bothinterferon signaling and host response to bacterial lipopolysaccharide (LPS) stimulation.In vitro studies have previously reported that both LPS simulation and EBOV infection oftarget cells trigger many of the same inflammatory signaling responses, including TLR4activation and ISG upregulation [43]. Additional pathways that showed signs of earlyand continuous activation based on mRNA expression included IL6, IL17, and p38 MAPKsignaling, all of which are associated with a pro-inflammatory state commonly seen inEVD [44–47]. Beyond activation of innate antiviral immune defenses, this exaggeratedinflammatory state, and its associated cytokines also drive premature activation of B andT-cell lymphocyte populations [6,12].
As expected from this fatal disease model, pathway analysis of our NHP data in-dicated massive dysregulation of numerous immune pathways related to viral infection(Figure 3c). Positive regulation of p38 MAPK signaling in later timepoints was consistentwith previous studies showing that p38 signaling is important for EBOV infection of antigenpresenting cells (APCs) [46]. The upregulation of “Production of Nitric Oxide and ReactiveOxygen Species in Macrophages” and “iNOS Signaling” pathways are consistent withother studies that showed an elevated level of nitric oxide in the blood of both human andNHP EVD [10]. This increased nitric oxide synthesis contributes to lymphocyte apoptosisand vascular tissue damage, both hallmarks of EVD. During early infection, transcriptionalfactors associated with negative regulation of immune function, including IL1RN, SOCS1,and TRIM24 were downregulated. Suppression of these factors likely contributes to theobserved pro-inflammatory state. Later timepoints displayed downregulation of LXR/RXRactivation and peroxisome proliferator-activated receptors (PPARs) transcriptional factors,which are important for lipogenesis and other core metabolic homeostatic functions innumerous organ systems, including the liver [10]. Both PPAR and LXR/RXR, which werealso identified in an earlier EBOV NHP transcriptomic study by our group, are crucial forsuccessful anti-inflammatory host regulation. In addition to these pathways, we notedthat gene expression associated with antigen presentation was dysregulated during infec-

Microorganisms 2021, 9, 665 15 of 20
tion similar to previous reports [12,48]. In particular, many MHC-II-related genes weredownregulated starting at 4 DPI, including CD74 and numerous HLA markers.
Our integrated analysis of miRNA interactions with mRNA expression during EVDin NHPs revealed potential roles for multiple host miRNAs in contributing to EBOVpathogenesis. Numerous host miRNAs correlated closely with down-regulation of keyimmunomodulatory genes involved in both innate and adaptive immunity (Table 1). ThemicroRNA hsa-miR-122-5p was highly upregulated in most NHPs by day 5 (Figure 4b,c,Table S8), and present in all late phase disease NHPs. Detectable in both the blood andliver, hsa-miR-122-5p has been mostly studied as a marker of liver injury for hepatotropicviruses including Hepatitis C [49–51]. Some mRNAs highly correlated with hsa-miR-122-5pincluded the genes CCL5, CD3E, and AKT3 (Table 1). CD3E, a marker of T-cell developmentappears targeted for degradation by hsa-miR-122-5p and by hsa-miR-143-3p over the courseof EVD in this study [52]. CCL5 (RANTES), a pro-inflammatory chemokine associated withT-cell activation and recruitment to sites of inflammation is known to be upregulated inhuman survivors of EVD, even years after infection [53]. Its apparent downregulation inour study suggests a potential miRNA-induced subversion of this defense mechanismduring EBOV pathogenesis. A mediator of the innate immune response that appearsimplicated with both miR-122-5p and hsa-miR-424-5p is the serine/threonine kinase AKT3.While AKT3 is known to be involved in the PI3K signaling pathway and to play a role inthe innate immune response, its relevance for EBOV infection is not fully understood [54].Of note, however, an in vitro siRNA screen of cells infected by EBOV suggested a role forAKT3 in limiting EBOV infection, suggesting that miRNA downregulation of this targetcould in fact undermine a host defense mechanism [55]. In the cases of CCL5 and CD3E,these regulatory molecules appear to be dysregulated by these miRNAs during infection,likely contributing further to EVD pathogenesis and fatal outcome. Similarly, expressionof the miRNA hsa-miR-424-5p was associated with downregulation of the gene IL7R, animportant factor for B and T-cell development [56].
Another significant host miRNA in our transcriptomic analysis that appears closelylinked to some of the aforementioned immune dysregulation mechanisms is hsa-miR-125b-5p. This miRNA was significantly upregulated in all three phases of viremic infection(Figure 4b,c, Table S8). Messenger RNAs whose downregulation appear closely associatedwith its expression include IL16, ETS1, BCL2, PPP1R12B, CASP2, and IRF4 (Table 1). Similarto the previously described inhibitory action of hsa-miR-122-5p on T- cell activation, hsa-miR-125b-5p may impair these immune cells as well, in this case through the degradation ofthe immunomodulatory proteins IL16 and PP1R12B, both of which play a role in successfulCD4+ T-cell activation [57,58]. Their inhibition by this miRNA would likely subvert thiscell type’s ability to counter EBOV infection. In a similar vein, hsa-miR-125b-5p’s strongassociation with IRF4 repression in our study also links it with inhibition of B lymphocytefunction. Based on the study of B-cell leukemia, hsa-miR-125b-5p is known to repressIRF4 activity and with it the ability of B cells to undergo germinal center differentiationto antibody producing plasma cells [59]. As shown in Figure 2 and Supplemental FigureS1, despite abundant circulating viral antigens, virtually no EBOV-specific IgM or IgGresponse was observed in this study; failure to mount a successful humoral response isa hallmark of severe and fatal cases of EVD in humans [6]. Another significant miRNA-mRNA interaction potentially impactful in B and T-cell activation and proliferation wasthat of hsa-miR-21-5p on the procaspase-encoding gene MALT1 [60]. Similarly, expressionof the miRNA hsa-miR-223-5p was observed to be closely related to downregulation of theNatural Killer cell activating gene KLRC3. Natural killer cells are important elements of theimmune response to viral infection, in particular the clearance of virus infected cells; theirsuppression in fatal cases of EVD in humans and NHPs has been observed [61,62]. KLRC3is a known regulator of NK cell activity and its downregulation is associated with reducedNK cell function [63–65].
A notable feature of fatal EBOV infection is the widespread apoptosis of B and T lym-phocytes during infection, not as a result of direct infection, but because of pro-apoptotic

Microorganisms 2021, 9, 665 16 of 20
stimuli directed towards the lymphocytes by their cellular environment, a process com-monly called “bystander apoptosis” [6]. It is of particular interest that many of the down-regulated mRNAs detailed above, including ETS1, BCL2, and CASP2 are involved inapoptosis and are all known to be negatively regulated by hsa-miR-125b-5p expression [66].ETS1 is an antiviral transcription factor known to positively upregulate BCL2, which isitself a known repressor of apoptosis [67,68]. By targeting these proteins for degradation,hsa-miR-125b-5p and other ETS1 or BCL2-targeting miRNAs identified in this study likehsa-miR-424-5p, hsa-miR-144-3p and hsa-miR-338-3p are likely driving lymphocytes fur-ther down the apoptotic pathway. Lymphopenia is well documented in both human andNHP infections studies and this dataset is consistent with this phenomenon, showing adrastic decrease in B-cells and T-cells over the course of infection (Figure 1c) [11,62,69,70].
Previous studies reported upregulation of hsa-miR-122-5p during EBOV infection [38,71],however, its role in EVD pathogenesis remains unclear and its association with downregu-lation of the immune targets described herein during EVD is novel. The identification ofthis and other significant host miRNAs in our study, in particular hsa-miR-125b-5p, andtheir possible inhibition of numerous genes involved in the orchestration of a successfulanti-EBOV immune response in primates is notable. An outstanding question with regardto the role that these miRNAs play is how much of this selective miRNA expression is avirus-directed process and how much is a downstream consequence of other pathophysio-logical processes that systemic EBOV infection is precipitating [20,25]. Those miRNAs thatwe identified that most closely correlate with immune suppression only begin to emergeduring the mid to late infection phase, after upregulation of multiple pro-inflammatorymRNAs. Since an exaggerated pro-inflammatory state, such as that seen during the earlyinfection phase in our NHPs, is known to prematurely activate components of the adaptiveimmune system, one possibility is that this miRNA response may be part of an immunedampening mechanism designed to prevent premature activation or differentiation of Tand B lymphocytes, respectively, both by inhibiting their function as well as by initiatingapoptosis. Based on the end result of wide-spread lymphopenia and general uncheckedviral dissemination, however, it would seem that this response only further undermineshost defenses and contributes to the fatal end state. It is also worth noting that the genestargeted by host miRNAs are still being identified, and therefore it is possible that addi-tional miRNA-mRNA interactions may have gone undetected in the present study. Futureinvestigations should also evaluate whether these miRNA-mRNA interactions are relevantfor human EVD.
Pre-symptomatic differential expression of miRNAs in whole blood as early as 2 DPIshowed the potential of these markers as diagnostic targets, especially in cases wheredifferential expression appeared before EBOV positivity triggered by qPCR (Figure 1b,cand Figure 4a). If these miRNAs prove relevant for human EBOV infection, their diag-nostic utility should be evaluated. miRNAs are remarkably robust and survive nucleasedegradation, with previous studies documenting detection in various bodily fluids such asblood (serum, plasma), cerebrospinal fluid, breast milk, urine, and saliva [72]. Similar towork previously done by our lab with hsa-miR-122-5p, it will be of particular interest toevaluate these other miRNA markers on human clinical samples of EVD to confirm theirdiagnostic potential [38]. Transitioning some of these disease biomarkers to a lower cost,shorter-sample-to-answer assay format such as an RT-PCR assay or point-of-care platformswould be a useful next step.
There are multiple use-case scenarios for an EVD miRNA assay. In one, miRNAscould be used to alert clinicians to patients that are likely to develop a severe EBOV diseasestate with its attendant immune dysregulation. As has been demonstrated by the clinicalresponses to the COVID-19 pandemic, patient risk stratification can be a powerful tool ininforming optimal resource management practices (staffing, therapeutics, etc.) [73,74]. In asecond scenario, these miRNAs could be used for monitoring convalescent EVD patients forsigns of long-term disease sequelae. Only after the 2013-2016 West African EVD outbreakand subsequent long-term longitudinal monitoring of patients was it discovered that there

Microorganisms 2021, 9, 665 17 of 20
is a high incidence of long-term pathologies associated with survival post-acute EVD phase.These include musculoskeletal pain, neurocognitive, and ocular disorders. Furthermore,there appear to be long term immunological consequences from EVD including severeimmune function abnormalities and a persistent elevated inflammatory profile [53]. Theutilization of a miRNA detection approach including such markers described here couldbe advantageous for identifying subtle long-term modulation of the immune response andshed light on the pathophysiology of this disease in survivors.
Supplementary Materials: The following are available online at https://www.mdpi.com/2076-2607/9/3/665/s1. Table S1: Sample MetaData; Table S2: mRNA Normalized NanoString counts;Table S3: Stable housekeeping genes selected by nCAAM and geNorm for NanoString count nor-malization; Table S4: miRNA primary analysis counts; Table S5: Study design and clinical outcomefor NHPs challenged with EBOV; Table S6: mRNA expression analysis; Table S7: Binned mRNAexpression analysis; Table S8: miRNA Expression analysis; Table S9: Binned miRNA expressionanalysis; Table S10: KEGG pathway analysis of DEMs for early, mid, and late phases; Figure S1: IgG,and IgM response in Ebola infected NHPs.
Author Contributions: Conceptualization, C.E.A., C.P.S., and C.J.S.; methodology, C.P.S., C.E.A.,C.J.S., and K.M.R.; formal analysis, C.P.S., C.E.A., C.J.S., and K.M.R.; investigation, C.L.T.-H., C.P.S.,C.J.S., L.A.A., E.E.Z., K.M.R., C.E.D., C.L.T.-H., A.S.G., K.L.D., C.D.B., S.P.O., J.D.S., S.E.W., J.M.Z.,H.A.B., T.R.S., and H.L.E.; resources, L.A.A., E.E.Z.; data curation, C.P.S. and C.E.A.; writing—original draft preparation, C.E.A., C.P.S., and C.J.S.; writing—review and editing, C.P.S., C.J.S., C.E.A.,and T.D.M.; visualization, C.P.S., C.E.A., and C.J.S.; supervision, T.D.M.; project administration,T.D.M.; funding acquisition, T.D.M. All authors have read and agreed to the published version ofthe manuscript.
Funding: This work was supported by Project Number CB10245 from The Joint Science & TechnologyOffice for Chemical & Biological Defense (JSTO-CBD). Opinions, interpretations, conclusions, andrecommendations are those of the authors and are not necessarily endorsed by the U.S. Army.
Institutional Review Board Statement: This work was supported by an approved animal researchprotocol in compliance with the Animal Welfare Act, PHS Policy, and other Federal statutes andregulations relating to animals and experiments involving animals. The study was conductedaccording to the guidelines of the Declaration of Helsinki, and approved by the Animal Care andUse Committee (IACUC) of USAMRIID (AP-17-020; approval date 24 May 2017).
Data Availability Statement: All data presented in this study are available within the article andSupplementary Materials.
Acknowledgments: The authors wish to thank Yasuhiko Suzuki of the Hokkaido University ResearchCenter for Zoonosis Control for the generous gift of the mouse monoclonal antibodies ZNP31-1-8,ZNP41-2-4, ZNP74-7, and ZNP24-4-2.
Conflicts of Interest: The authors declare no conflict of interest. The funders had no role in the designof the study; in the collection, analyses, or interpretation of data; in the writing of the manuscript, orin the decision to publish the results.
References1. Baseler, L.; Chertow, D.S.; Johnson, K.M.; Feldmann, H.; Morens, D.M. The Pathogenesis of Ebola Virus Disease. Annu. Rev.
Pathol. Mech. Dis. 2017, 12, 387–418. [CrossRef]2. Malvy, D.; McElroy, A.K.; de Clerck, H.; Günther, S.; van Griensven, J. Ebola virus disease. Lancet 2019, 393, 936–948. [CrossRef]3. Jacob, S.T.; Crozier, I.; Wahl, V.; Griffiths, A.; Bollinger, L.; Kuhn, J.H.; Fischer, W.A., II; Hewlett, A.; Kraft, C.S.; De La Vega, M.-A.;
et al. Ebola virus disease. Nat. Rev. Dis. Prim. 2020, 6, 13. [CrossRef] [PubMed]4. Lamontagne, F.; A Fowler, R.; Adhikari, N.K.; Murthy, S.; Brett-Major, D.M.; Jacobs, M.; Uyeki, T.M.; Vallenas, C.; Norris,
S.L.; A Fischer, W.; et al. Evidence-based guidelines for supportive care of patients with Ebola virus disease. Lancet 2018,391, 700–708. [CrossRef]
5. Colavita, F.; Biava, M.; Castilletti, C.; Lanini, S.; Miccio, R.; Portella, G.; Vairo, F.; Ippolito, G.; Capobianchi, M.R.; Di Caro, A.;et al. Inflammatory and Humoral Immune Response during Ebola Virus Infection in Survivor and Fatal Cases Occurred in SierraLeone during the 2014–2016 Outbreak in West Africa. Viruses 2019, 11, 373. [CrossRef] [PubMed]
6. Prescott, J.B.; Marzi, A.; Safronetz, D.; Robertson, S.J.; Feldmann, H.; Best, S.M. Immunobiology of Ebola and Lassa virusinfections. Nat. Rev. Immunol. 2017, 17, 195–207. [CrossRef] [PubMed]

Microorganisms 2021, 9, 665 18 of 20
7. Bray, M.; Geisbert, T.W. Ebola virus: The role of macrophages and dendritic cells in the pathogenesis of Ebola hemorrhagic fever.Int. J. Biochem. Cell Biol. 2005, 37, 1560–1566. [CrossRef] [PubMed]
8. Wahl-Jensen, V.; Kurz, S.; Feldmann, F.; Buehler, L.K.; Kindrachuk, J.; DeFilippis, V.; Correia, J.D.S.; Früh, K.; Kuhn, J.H.; Burton,D.R.; et al. Ebola Virion Attachment and Entry into Human Macrophages Profoundly Effects Early Cellular Gene Expression.PLOS Negl. Trop. Dis. 2011, 5, e1359. [CrossRef]
9. Reynard, S.; Journeaux, A.; Gloaguen, E.; Schaeffer, J.; Varet, H.; Pietrosemoli, N.; Mateo, M.; Baillet, N.; Laouenan, C.; Raoul, H.;et al. Immune parameters and outcomes during Ebola virus disease. JCI Insight 2019, 4. [CrossRef]
10. Jankeel, A.; Menicucci, A.R.; Woolsey, C.; Fenton, K.A.; Mendoza, N.; Versteeg, K.; Cross, R.W.; Geisbert, T.W.; Messaoudi, I.Early Transcriptional Changes within Liver, Adrenal Gland, and Lymphoid Tissues Significantly Contribute to Ebola VirusPathogenesis in Cynomolgus Macaques. J. Virol. 2020, 94. [CrossRef]
11. Geisbert, T.W.; Hensley, L.E.; Larsen, T.; Young, H.A.; Reed, D.S.; Geisbert, J.B.; Scott, D.P.; Kagan, E.; Jahrling, P.B.; Davis, K.J.Pathogenesis of Ebola Hemorrhagic Fever in Cynomolgus Macaques. Am. J. Pathol. 2003, 163, 2347–2370. [CrossRef]
12. Younan, P.; Iampietro, M.; Bukreyev, A. Disabling of lymphocyte immune response by Ebola virus. PLoS Pathog. 2018, 14, e1006932.[CrossRef] [PubMed]
13. Agrati, C.; Castilletti, C.; Casetti, R.; Sacchi, A.; Falasca, L.; Turchi, F.; Tumino, N.; Bordoni, V.; Cimini, E.; Viola, D.; et al.Longitudinal characterization of dysfunctional T cell-activation during human acute Ebola infection. Cell Death Dis. 2016, 7, e2164.[CrossRef] [PubMed]
14. Donohue, D.E.; Gautam, A.; Miller, S.-A.; Srinivasan, S.; Abu-Amara, D.; Campbell, R.; Marmar, C.R.; Hammamieh, R.; Jett, M.Gene expression profiling of whole blood: A comparative assessment of RNA-stabilizing collection methods. PLoS ONE 2019,14, e0223065. [CrossRef]
15. Rubins, K.H.; Hensley, L.E.; Wahl-Jensen, V.; Daddario DiCaprio, K.M.; Young, H.A.; Reed, D.S.; Jahrling, P.B.; Brown, P.O.;Relman, D.A.; Geisbert, T.W. The temporal program of peripheral blood gene expression in the response of nonhuman primatesto Ebola hemorrhagic fever. Genome Biol. 2007, 8, R174. [CrossRef]
16. Speranza, E.; Connor, J.H. Host Transcriptional Response to Ebola Virus Infection. Vaccines 2017, 5, 30. [CrossRef] [PubMed]17. Speranza, E.; Altamura, L.A.; Kulcsar, K.; Bixler, S.L.; Rossi, C.A.; Schoepp, R.J.; Nagle, E.; Aguilar, W.; Douglas, C.E.; Delp, K.L.;
et al. Comparison of Transcriptomic Platforms for Analysis of Whole Blood from Ebola-Infected Cynomolgus Macaques. Sci. Rep.2017, 7, 1–15. [CrossRef]
18. Speranza, E.; Bixler, S.L.; Altamura, L.A.; Arnold, C.E.; Pratt, W.D.; Taylor-Howell, C.; Burrows, C.; Aguilar, W.; Rossi, F.;Shamblin, J.D.; et al. A conserved transcriptional response to intranasal Ebola virus exposure in nonhuman primates prior toonset of fever. Sci. Transl. Med. 2018, 10, eaaq1016. [CrossRef] [PubMed]
19. Wu, L.; Fan, J.; Belasco, J.G. MicroRNAs direct rapid deadenylation of mRNA. Proc. Natl. Acad. Sci. USA 2006, 103, 4034–4039. [CrossRef]20. Mishra, R.; Kumar, A.; Ingle, H.; Kumar, H. The Interplay Between Viral-Derived miRNAs and Host Immunity During Infection.
Front. Immunol. 2020, 10, 3079. [CrossRef]21. Liu, Y.; Sun, J.; Zhang, H.; Wang, M.; Gao, G.F.; Li, X. Ebola virus encodes a miR-155 analog to regulate importin-α5 expression.
Cell. Mol. Life Sci. 2016, 73, 3733–3744. [CrossRef]22. Pritchard, C.C.; Cheng, H.H.; Tewari, M. MicroRNA profiling: Approaches and considerations. Nat. Rev. Genet. 2012, 13,
358–369. [CrossRef]23. Wang, L.; Zheng, J.; Sun, C.; Jin, G.; Xin, L.; Jin, Z.; Wang, D.; Li, Z.; Wang, L.; Wang, N. MicroRNA expression levels as diagnostic
biomarkers for intraductal papillary mucinous neoplasm. Oncotarget 2017, 8, 58765–58770. [CrossRef]24. Szilágyi, B.; Fejes, Z.; Pócsi, M.; Kappelmayer, J.; Nagy, B., Jr. Role of sepsis modulated circulating microRNAs. EJIFCC 2019,
30, 128–145.25. Girardi, E.; López, P.; Pfeffer, S. On the Importance of Host MicroRNAs During Viral Infection. Front. Genet. 2018, 9, 439.
[CrossRef] [PubMed]26. Condrat, C.E.; Thompson, D.C.; Barbu, M.G.; Bugnar, O.L.; Boboc, A.; Cretoiu, D.; Suciu, N.; Cretoiu, S.M.; Voinea, S.C. miRNAs as
Biomarkers in Disease: Latest Findings Regarding Their Role in Diagnosis and Prognosis. Cells 2020, 9, 276. [CrossRef] [PubMed]27. St Claire, M.C.; Ragland, D.R.; Bollinger, L.; Jahrling, P.B. Animal Models of Ebolavirus Infection. Comp. Med. 2017, 67, 253–262.28. Shurtleff, A.; Biggins, J.; Keeney, A.; Zumbrun, E.; Bloomfield, H.; Kuehne, A.; Audet, J.; Alfson, K.; Griffiths, A.; Olinger, G.; et al.
Standardization of the Filovirus Plaque Assay for Use in Preclinical Studies. Viruses 2012, 4, 3511–3530. [CrossRef] [PubMed]29. Trombley, A.R.; Wachter, L.; Garrison, J.; Buckley-Beason, V.A.; Jahrling, J.; Hensley, L.E.; Schoepp, R.J.; Norwood, D.A.;
Goba, A.; Fair, J.N.; et al. Comprehensive Panel of Real-Time TaqMan™ Polymerase Chain Reaction Assays for Detectionand Absolute Quantification of Filoviruses, Arenaviruses, and New World Hantaviruses. Am. J. Trop. Med. Hyg. 2010,82, 954–960. [CrossRef] [PubMed]
30. Newman, A.M.; Liu, C.L.; Green, M.R.; Gentles, A.J.; Feng, W.; Xu, Y.; Hoang, C.D.; Diehn, M.; Alizadeh, A.A. Robust enumerationof cell subsets from tissue expression profiles. Nat. Methods 2015, 12, 453–457. [CrossRef] [PubMed]
31. Guo, Y.; Zhang, Y.; Zhang, S.J.; Ma, Y.N.; He, Y. Comprehensive analysis of key genes and microRNAs in radioresistantnasopharyngeal carcinoma. BMC Med Genom. 2019, 12, 73. [CrossRef] [PubMed]
32. Marzi, A.; Feldmann, F.; Hanley, P.W.; Scott, D.P.; Günther, S.; Feldmann, H. Delayed Disease Progression in CynomolgusMacaques Infected with Ebola Virus Makona Strain. Emerg. Infect. Dis. 2015, 21, 1777–1783. [CrossRef] [PubMed]

Microorganisms 2021, 9, 665 19 of 20
33. Reisler, R.B.; Yu, C.; Donofrio, M.J.; Warren, T.K.; Wells, J.B.; Stuthman, K.S.; Garza, N.L.; VanTongeren, S.A.; Donnelly, G.C.;Kane, C.D.; et al. Clinical Laboratory Values as Early Indicators of Ebola Virus Infection in Nonhuman Primates. Emerg. Infect.Dis. 2017, 23, 1316–1324. [CrossRef] [PubMed]
34. Lanini, S.; Portella, G.; Vairo, F.; Kobinger, G.P.; Pesenti, A.; Langer, M.; Kabia, S.; Brogiato, G.; Amone, J.; Castilletti, C.; et al.Relationship Between Viremia and Specific Organ Damage in Ebola Patients: A Cohort Study. Clin. Infect. Dis. 2017, 66, 36–44.[CrossRef] [PubMed]
35. Havelka, A.; Sejersen, K.; Venge, P.; Pauksens, K.; Larsson, A. Calprotectin, a new biomarker for diagnosis of acute respiratoryinfections. Sci. Rep. 2020, 10, 1–7. [CrossRef] [PubMed]
36. Tisserand, J.; Khetchoumian, K.; Thibault, C.; Dembélé, D.; Chambon, P.; Losson, R. Tripartite Motif 24 (Trim24/Tif1α)Tumor Suppressor Protein Is a Novel Negative Regulator of Interferon (IFN)/Signal Transducers and Activators ofTranscription (STAT) Signaling Pathway Acting through Retinoic Acid Receptor α (Rarα) Inhibition. J. Biol. Chem. 2011,286, 33369–33379. [CrossRef] [PubMed]
37. Vlachos, I.S.; Zagganas, K.; Paraskevopoulou, M.D.; Georgakilas, G.; Karagkouni, D.; Vergoulis, T.; Dalamagas, T.; Hatzigeorgiou,A.G. DIANA-miRPath v3.0: Deciphering microRNA function with experimental support. Nucleic Acids Res. 2015, 43, W460–W466.[CrossRef] [PubMed]
38. Duy, J.; Koehler, J.W.; Honko, A.N.; Schoepp, R.J.; Wauquier, N.; Gonzalez, J.-P.; Pitt, M.L.; Mucker, E.M.; Johnson, J.C.; O’Hearn,A.; et al. Circulating microRNA profiles of Ebola virus infection. Sci. Rep. 2016, 6, 24496. [CrossRef]
39. Caballero, I.S.; Honko, A.N.; Gire, S.K.; Winnicki, S.M.; Melé, M.; Gerhardinger, C.; Lin, A.E.; Rinn, J.L.; Sabeti, P.C.;Hensley, L.E.; et al. In vivo Ebola virus infection leads to a strong innate response in circulating immune cells. BMC Genom.2016, 17, 1–13. [CrossRef]
40. Cao, Y.; Huang, Y.; Xu, K.; Liu, Y.; Li, X.; Xu, Y.; Zhong, W.; Hao, P. Differential responses of innate immunity triggered bydifferent subtypes of influenza a viruses in human and avian hosts. BMC Med. Genom. 2017, 10, 41–54. [CrossRef]
41. Zapata, J.C.; Salvato, M.S. Genomic profiling of host responses to Lassa virus: Therapeutic potential from primate to man. Futur.Virol. 2015, 10, 233–256. [CrossRef]
42. Schoggins, J.W. Interferon-stimulated genes: Roles in viral pathogenesis. Curr. Opin. Virol. 2014, 6, 40–46. [CrossRef]43. Olejnik, J.; Forero, A.; Deflubé, L.R.; Hume, A.J.; Manhart, W.A.; Nishida, A.; Marzi, A.; Katze, M.G.; Ebihara, H.; Rasmussen,
A.L.; et al. Ebolaviruses Associated with Differential Pathogenicity Induce Distinct Host Responses in Human Macrophages.J. Virol. 2017, 91, e00179-17. [CrossRef]
44. Bachstetter, A.D.; Van Eldik, L.J. The p38 MAP Kinase Family as Regulators of Proinflammatory Cytokine Production inDegenerative Diseases of the CNS. Aging Dis. 2010, 1, 199–211.
45. Herlaar, E.; Brown, Z. p38 MAPK signalling cascades in inflammatory disease. Mol. Med. Today 1999, 5, 439–447. [CrossRef]46. Johnson, J.C.; Martinez, O.; Honko, A.N.; Hensley, L.E.; Olinger, G.G.; Basler, C.F. Pyridinyl imidazole inhibitors of p38 MAP
kinase impair viral entry and reduce cytokine induction by Zaire ebolavirus in human dendritic cells. Antivir. Res. 2014,107, 102–109. [CrossRef] [PubMed]
47. Banadyga, L.; Siragam, V.; Zhu, W.; He, S.; Cheng, K.; Qiu, X. The Cytokine Response Profile of Ebola Virus Disease in a LargeCohort of Rhesus Macaques Treated With Monoclonal Antibodies. Open Forum Infect. Dis. 2019, 6, ofz046. [CrossRef] [PubMed]
48. McElroy, A.K.; Mühlberger, E.; Muñoz-Fontela, C. Immune barriers of Ebola virus infection. Curr. Opin. Virol. 2018, 28, 152–160.[CrossRef] [PubMed]
49. Ferraris, O.; Moroso, M.; Siracusa, J.; Jarjaval, F.; Goriot, M.-E.; Peyrefitte, C.N.; Banzet, S. Circulating microRNA profile in amouse model of Crimean-Congo haemorrhagic fever. Virus Res. 2019, 263, 16–20. [CrossRef] [PubMed]
50. Raitoharju, E.; Seppälä, I.; Lyytikäinen, L.-P.; Viikari, J.; Ala-Korpela, M.; Soininen, P.; Kangas, A.J.; Waldenberger, M.; Klopp, N.;Illig, T.; et al. Blood hsa-miR-122-5p and hsa-miR-885-5p levels associate with fatty liver and related lipoprotein metabolism—TheYoung Finns Study. Sci. Rep. 2016, 6, 38262. [CrossRef]
51. Zhou, X.-J.; Wang, J.; Ye, H.-H.; Fa, Y.-Z. Signature MicroRNA expression profile is associated with lipid metabolism in Africangreen monkey. Lipids Health Dis. 2019, 18, 55. [CrossRef]
52. Yang, Y.; Zang, Y.; Zheng, C.; Li, Z.; Gu, X.; Zhou, M.; Wang, Z.; Xiang, J.; Chen, Z.; Zhou, Y. CD3D is associated with immunecheckpoints and predicts favorable clinical outcome in colon cancer. Immunotherapy 2020, 12, 25–35. [CrossRef]
53. Wiedemann, A.; POSTEBOGUI Study Group; Foucat, E.; Hocini, H.; Lefebvre, C.; Hejblum, B.P.; Durand, M.; Krüger, M.;Keita, A.K.; Ayouba, A.; et al. Long-lasting severe immune dysfunction in Ebola virus disease survivors. Nat. Commun.2020, 11, 1–11. [CrossRef]
54. Fruman, D.A.; Chiu, H.; Hopkins, B.D.; Bagrodia, S.; Cantley, L.C.; Abraham, R.T. The PI3K Pathway in Human Disease. Cell2017, 170, 605–635. [CrossRef]
55. Kolokoltsov, A.A.; Saeed, M.F.; Freiberg, A.N.; Holbrook, M.R.; Davey, R.A. Identification of novel cellular targets for therapeuticintervention against Ebola virus infection by siRNA screening. Drug Dev. Res. 2009, 70, 255–265. [CrossRef]
56. Tani-Ichi, S.; Shimba, A.; Wagatsuma, K.; Miyachi, H.; Kitano, S.; Imai, K.; Hara, T.; Ikuta, K. Interleukin-7 receptor controlsdevelopment and maturation of late stages of thymocyte subpopulations. Proc. Natl. Acad. Sci. USA 2012, 110, 612–617. [CrossRef]
57. Cruikshank, W.; Little, F. lnterleukin-16: The ins and outs of regulating T-cell activation. Crit. Rev. Immunol. 2008,28, 467–483. [CrossRef]

Microorganisms 2021, 9, 665 20 of 20
58. Skundric, D.S.; Cruikshank, W.W.; Drulovic, J. Role of IL-16 in CD4+ T cell-mediated regulation of relapsing multiple sclerosis.J. Neuroinflamm. 2015, 12, 1–4. [CrossRef] [PubMed]
59. So, A.Y.-L.; Zhao, J.L.; Baltimore, D. The Yin and Yang of microRNAs: Leukemia and immunity. Immunol. Rev. 2013, 253, 129–145.[CrossRef] [PubMed]
60. Thome, M. CARMA1, BCL-10 and MALT1 in lymphocyte development and activation. Nat. Rev. Immunol. 2004, 4, 348–359.[CrossRef] [PubMed]
61. Mohamadzadeh, M.; Chen, L.; Schmaljohn, A.L. How Ebola and Marburg viruses battle the immune system. Nat. Rev. Immunol.2007, 7, 556–567. [CrossRef]
62. Reed, D.S.; Hensley, L.E.; Geisbert, J.B.; Jahrling, P.B.; Geisbertl, T.W. Depletion of Peripheral Blood T Lymphocytes and NK Cells Duringthe Course of Ebola Hemorrhagic Fever in Cynomolgus Macaques. Viral Immunol. 2004, 17, 390–400. [CrossRef] [PubMed]
63. Aid, M.; Ram, D.R.; Bosinger, S.E.; Barouch, D.H.; Reeves, R.K. Delineation and Modulation of the Natural Killer Cell Transcrip-tome in Rhesus Macaques During ZIKV and SIV Infections. Front. Cell. Infect. Microbiol. 2020, 10, 194. [CrossRef]
64. Hanna, J.; Bechtel, P.; Zhai, Y.; Youssef, F.; McLachlan, K.; Mandelboim, O. Novel Insights on Human NK Cells’ ImmunologicalModalities Revealed by Gene Expression Profiling. J. Immunol. 2004, 173, 6547–6563. [CrossRef]
65. Bongen, E.; Vallania, F.; Utz, P.J.; Khatri, P. KLRD1-expressing natural killer cells predict influenza susceptibility. Genome Med.2018, 10, 1–12. [CrossRef] [PubMed]
66. Sun, Y.-M.; Lin, K.-Y.; Chen, Y.-Q. Diverse functions of miR-125 family in different cell contexts. J. Hematol. Oncol. 2013, 6, 6.[CrossRef] [PubMed]
67. Pei, H.; Li, C.; Adereth, Y.; Hsu, T.; Watson, D.K.; Li, R. Caspase-1 Is a Direct Target Gene of ETS1 and Plays a Role in ETS1-InducedApoptosis. Cancer Res. 2005, 65, 7205–7213. [CrossRef]
68. Yang, D.; Zhan, M.; Chen, T.; Chen, W.; Zhang, Y.; Xu, S.; Yan, J.; Huang, Q.; Wang, J. miR-125b-5p enhances chemotherapysensitivity to cisplatin by down-regulating Bcl2 in gallbladder cancer. Sci. Rep. 2017, 7, srep43109. [CrossRef] [PubMed]
69. Wauquier, N.; Becquart, P.; Padilla, C.; Baize, S.; Leroy, E.M. Human Fatal Zaire Ebola Virus Infection Is Associated with anAberrant Innate Immunity and with Massive Lymphocyte Apoptosis. PLoS Negl. Trop. Dis. 2010, 4, e837. [CrossRef]
70. Baize, S.; Leroy, E.M.; Georges-Courbot, M.-C.; Capron, M.; Lansoud-Soukate, J.; Debré, P.; Fisher-Hoch, S.P.; McCormick, J.B.;Georges, A.J. Defective humoral responses and extensive intravascular apoptosis are associated with fatal outcome in Ebolavirus-infected patients. Nat. Med. 1999, 5, 423–426. [CrossRef]
71. Garamszegi, S.; Yen, J.Y.; Honko, A.N.; Geisbert, J.B.; Rubins, K.H.; Geisbert, T.W.; Xia, Y.; Hensley, L.E.; Connor, J.H. Transcrip-tional Correlates of Disease Outcome in Anticoagulant-Treated Non-Human Primates Infected with Ebolavirus. PLoS Negl. Trop.Dis. 2014, 8, e3061. [CrossRef]
72. Weber, J.A.; Baxter, D.H.; Zhang, S.; Huang, D.Y.; Huang, K.H.; Lee, M.J.; Galas, D.J.; Wang, K. The MicroRNA Spectrum in 12Body Fluids. Clin. Chem. 2010, 56, 1733–1741. [CrossRef] [PubMed]
73. Knight, S.R.; Ho, A.; Pius, R.; Buchan, I.; Carson, G.; Drake, T.M.; Dunning, J.; Fairfield, C.J.; Gamble, C.; A Green, C.; et al.Risk stratification of patients admitted to hospital with covid-19 using the ISARIC WHO Clinical Characterisation Protocol:Development and validation of the 4C Mortality Score. BMJ 2020, 370, m3339. [CrossRef] [PubMed]
74. Vastrad, B.; Vastrad, C.; Tengli, A. Identification of potential mRNA panels for severe acute respiratory syndrome coronavirus 2(COVID-19) diagnosis and treatment using microarray dataset and bioinformatics methods. 3 Biotech 2020, 10, 1–65. [CrossRef]
Related Documents