RESEARCH Open Access Transcriptome profiling in engrailed-2 mutant mice reveals common molecular pathways associated with autism spectrum disorders Paola Sgadò 1*† , Giovanni Provenzano 1† , Erik Dassi 2 , Valentina Adami 3 , Giulia Zunino 1 , Sacha Genovesi 1 , Simona Casarosa 4,5 and Yuri Bozzi 1,5 Abstract Background: Transcriptome analysis has been used in autism spectrum disorder (ASD) to unravel common pathogenic pathways based on the assumption that distinct rare genetic variants or epigenetic modifications affect common biological pathways. To unravel recurrent ASD-related neuropathological mechanisms, we took advantage of the En2 -/- mouse model and performed transcriptome profiling on cerebellar and hippocampal adult tissues. Methods: Cerebellar and hippocampal tissue samples from three En2 -/- and wild type (WT) littermate mice were assessed for differential gene expression using microarray hybridization followed by RankProd analysis. To identify functional categories overrepresented in the differentially expressed genes, we used integrated gene-network analysis, gene ontology enrichment and mouse phenotype ontology analysis. Furthermore, we performed direct enrichment analysis of ASD-associated genes from the SFARI repository in our differentially expressed genes. Results: Given the limited number of animals used in the study, we used permissive criteria and identified 842 differentially expressed genes in En2 -/- cerebellum and 862 in the En2 -/- hippocampus. Our functional analysis revealed that the molecular signature of En2 -/- cerebellum and hippocampus shares convergent pathological pathways with ASD, including abnormal synaptic transmission, altered developmental processes and increased immune response. Furthermore, when directly compared to the repository of the SFARI database, our differentially expressed genes in the hippocampus showed enrichment of ASD-associated genes significantly higher than previously reported. qPCR was performed for representative genes to confirm relative transcript levels compared to those detected in microarrays. Conclusions: Despite the limited number of animals used in the study, our bioinformatic analysis indicates the En2 -/- mouse is a valuable tool for investigating molecular alterations related to ASD. Keywords: En2, Neurodevelopmental disorders, Mouse models, Immune response, Synaptic function, Scn1a, Grm5, Nrxn3 Background Autism spectrum disorder (ASD) defines a complex group of neurodevelopmental disabilities characterized by a wide range of impairments in social and communicative skills, stereotyped behaviors, and restricted mental flexi- bility [1]. The neurodevelopmental and neuroanatomical bases of ASD have been confirmed by a number of clinical, neuroimaging and neuropathological studies [1-3]. The most evident abnormality in ASD consists in an early (perinatal) brain overgrowth followed by an arrest of growth during the first year of age [4]. Neuropathological studies on post-mortem samples from ASD patients also showed a number of cellular and cytoarchitectural abnormalities at the level of the cerebral cortex, cerebellum, amygdala and forebrain limbic structures. Anomalies in the cerebellum are the most reproducible neuropathological alterations in ASD patients [3,5]. A large series of evidence clearly indicates that neuro- pathological features and behavioral deficits of ASD have * Correspondence: [email protected] † Equal contributors 1 Laboratory of Molecular Neuropathology, Centre for Integrative Biology (CIBIO), University of Trento, Via delle Regole 101, 38123 Trento, Italy Full list of author information is available at the end of the article © 2013 Sgadò et al.; licensee BioMed Central Ltd. This is an open access article distributed under the terms of the Creative Commons Attribution License (http://creativecommons.org/licenses/by/2.0), which permits unrestricted use, distribution, and reproduction in any medium, provided the original work is properly cited. Sgadò et al. Molecular Autism 2013, 4:51 http://www.molecularautism.com/content/4/1/51

Welcome message from author
This document is posted to help you gain knowledge. Please leave a comment to let me know what you think about it! Share it to your friends and learn new things together.
Transcript
Sgadò et al. Molecular Autism 2013, 4:51http://www.molecularautism.com/content/4/1/51
RESEARCH Open Access
Transcriptome profiling in engrailed-2 mutantmice reveals common molecular pathwaysassociated with autism spectrum disordersPaola Sgadò1*†, Giovanni Provenzano1†, Erik Dassi2, Valentina Adami3, Giulia Zunino1, Sacha Genovesi1,Simona Casarosa4,5 and Yuri Bozzi1,5
Abstract
Background: Transcriptome analysis has been used in autism spectrum disorder (ASD) to unravel commonpathogenic pathways based on the assumption that distinct rare genetic variants or epigenetic modifications affectcommon biological pathways. To unravel recurrent ASD-related neuropathological mechanisms, we took advantageof the En2−/− mouse model and performed transcriptome profiling on cerebellar and hippocampal adult tissues.
Methods: Cerebellar and hippocampal tissue samples from three En2−/− and wild type (WT) littermate mice wereassessed for differential gene expression using microarray hybridization followed by RankProd analysis. To identifyfunctional categories overrepresented in the differentially expressed genes, we used integrated gene-networkanalysis, gene ontology enrichment and mouse phenotype ontology analysis. Furthermore, we performed directenrichment analysis of ASD-associated genes from the SFARI repository in our differentially expressed genes.
Results: Given the limited number of animals used in the study, we used permissive criteria and identified 842differentially expressed genes in En2−/− cerebellum and 862 in the En2−/− hippocampus. Our functional analysisrevealed that the molecular signature of En2−/− cerebellum and hippocampus shares convergent pathologicalpathways with ASD, including abnormal synaptic transmission, altered developmental processes and increasedimmune response. Furthermore, when directly compared to the repository of the SFARI database, our differentiallyexpressed genes in the hippocampus showed enrichment of ASD-associated genes significantly higher thanpreviously reported. qPCR was performed for representative genes to confirm relative transcript levels compared tothose detected in microarrays.
Conclusions: Despite the limited number of animals used in the study, our bioinformatic analysis indicates theEn2−/− mouse is a valuable tool for investigating molecular alterations related to ASD.
Keywords: En2, Neurodevelopmental disorders, Mouse models, Immune response, Synaptic function, Scn1a, Grm5, Nrxn3
BackgroundAutism spectrum disorder (ASD) defines a complexgroup of neurodevelopmental disabilities characterized by awide range of impairments in social and communicativeskills, stereotyped behaviors, and restricted mental flexi-bility [1]. The neurodevelopmental and neuroanatomicalbases of ASD have been confirmed by a number of clinical,
* Correspondence: [email protected]†Equal contributors1Laboratory of Molecular Neuropathology, Centre for Integrative Biology(CIBIO), University of Trento, Via delle Regole 101, 38123 Trento, ItalyFull list of author information is available at the end of the article
© 2013 Sgadò et al.; licensee BioMed CentralCommons Attribution License (http://creativecreproduction in any medium, provided the or
neuroimaging and neuropathological studies [1-3]. Themost evident abnormality in ASD consists in an early(perinatal) brain overgrowth followed by an arrest of growthduring the first year of age [4]. Neuropathological studieson post-mortem samples from ASD patients also showed anumber of cellular and cytoarchitectural abnormalities atthe level of the cerebral cortex, cerebellum, amygdala andforebrain limbic structures. Anomalies in the cerebellumare the most reproducible neuropathological alterations inASD patients [3,5].A large series of evidence clearly indicates that neuro-
pathological features and behavioral deficits of ASD have
Ltd. This is an open access article distributed under the terms of the Creativeommons.org/licenses/by/2.0), which permits unrestricted use, distribution, andiginal work is properly cited.
Sgadò et al. Molecular Autism 2013, 4:51 Page 2 of 12http://www.molecularautism.com/content/4/1/51
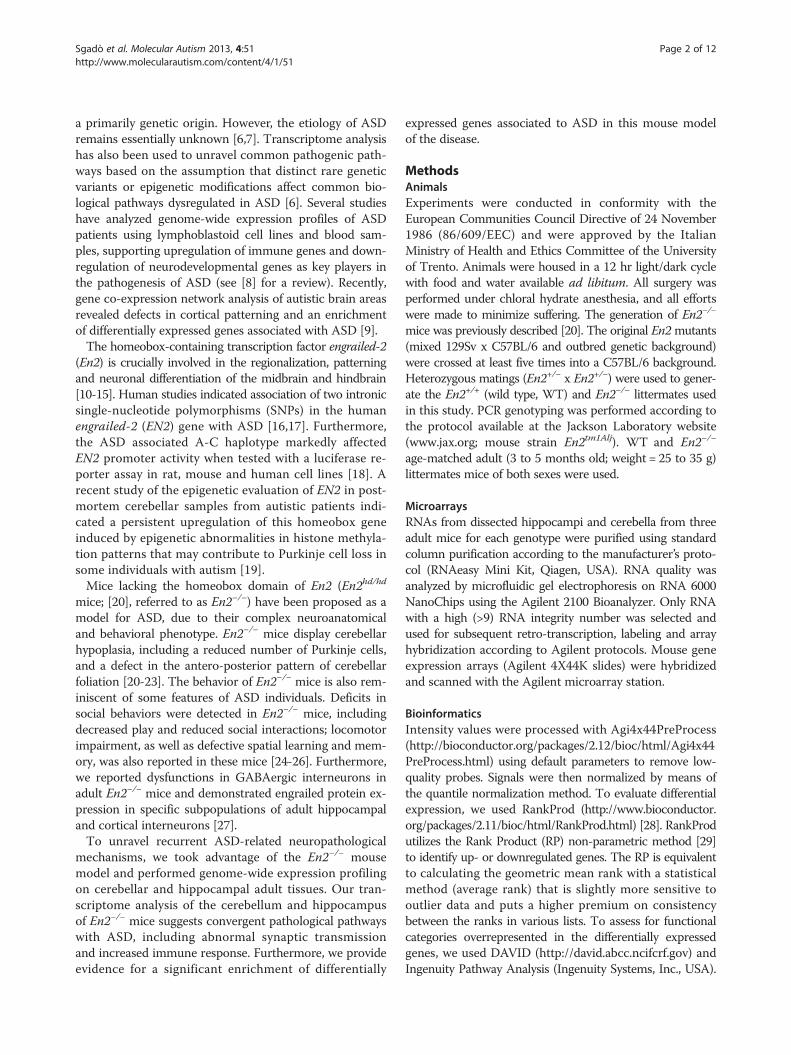
a primarily genetic origin. However, the etiology of ASDremains essentially unknown [6,7]. Transcriptome analysishas also been used to unravel common pathogenic path-ways based on the assumption that distinct rare geneticvariants or epigenetic modifications affect common bio-logical pathways dysregulated in ASD [6]. Several studieshave analyzed genome-wide expression profiles of ASDpatients using lymphoblastoid cell lines and blood sam-ples, supporting upregulation of immune genes and down-regulation of neurodevelopmental genes as key players inthe pathogenesis of ASD (see [8] for a review). Recently,gene co-expression network analysis of autistic brain areasrevealed defects in cortical patterning and an enrichmentof differentially expressed genes associated with ASD [9].The homeobox-containing transcription factor engrailed-2
(En2) is crucially involved in the regionalization, patterningand neuronal differentiation of the midbrain and hindbrain[10-15]. Human studies indicated association of two intronicsingle-nucleotide polymorphisms (SNPs) in the humanengrailed-2 (EN2) gene with ASD [16,17]. Furthermore,the ASD associated A-C haplotype markedly affectedEN2 promoter activity when tested with a luciferase re-porter assay in rat, mouse and human cell lines [18]. Arecent study of the epigenetic evaluation of EN2 in post-mortem cerebellar samples from autistic patients indi-cated a persistent upregulation of this homeobox geneinduced by epigenetic abnormalities in histone methyla-tion patterns that may contribute to Purkinje cell loss insome individuals with autism [19].Mice lacking the homeobox domain of En2 (En2hd/hd
mice; [20], referred to as En2−/−) have been proposed as amodel for ASD, due to their complex neuroanatomicaland behavioral phenotype. En2−/− mice display cerebellarhypoplasia, including a reduced number of Purkinje cells,and a defect in the antero-posterior pattern of cerebellarfoliation [20-23]. The behavior of En2−/− mice is also rem-iniscent of some features of ASD individuals. Deficits insocial behaviors were detected in En2−/− mice, includingdecreased play and reduced social interactions; locomotorimpairment, as well as defective spatial learning and mem-ory, was also reported in these mice [24-26]. Furthermore,we reported dysfunctions in GABAergic interneurons inadult En2−/− mice and demonstrated engrailed protein ex-pression in specific subpopulations of adult hippocampaland cortical interneurons [27].To unravel recurrent ASD-related neuropathological
mechanisms, we took advantage of the En2−/− mousemodel and performed genome-wide expression profilingon cerebellar and hippocampal adult tissues. Our tran-scriptome analysis of the cerebellum and hippocampusof En2−/− mice suggests convergent pathological pathwayswith ASD, including abnormal synaptic transmissionand increased immune response. Furthermore, we provideevidence for a significant enrichment of differentially
expressed genes associated to ASD in this mouse modelof the disease.
MethodsAnimalsExperiments were conducted in conformity with theEuropean Communities Council Directive of 24 November1986 (86/609/EEC) and were approved by the ItalianMinistry of Health and Ethics Committee of the Universityof Trento. Animals were housed in a 12 hr light/dark cyclewith food and water available ad libitum. All surgery wasperformed under chloral hydrate anesthesia, and all effortswere made to minimize suffering. The generation of En2−/−
mice was previously described [20]. The original En2mutants(mixed 129Sv x C57BL/6 and outbred genetic background)were crossed at least five times into a C57BL/6 background.Heterozygous matings (En2+/− x En2+/−) were used to gener-ate the En2+/+ (wild type, WT) and En2−/− littermates usedin this study. PCR genotyping was performed according tothe protocol available at the Jackson Laboratory website(www.jax.org; mouse strain En2tm1Alj). WT and En2−/−
age-matched adult (3 to 5 months old; weight = 25 to 35 g)littermates mice of both sexes were used.
MicroarraysRNAs from dissected hippocampi and cerebella from threeadult mice for each genotype were purified using standardcolumn purification according to the manufacturer’s proto-col (RNAeasy Mini Kit, Qiagen, USA). RNA quality wasanalyzed by microfluidic gel electrophoresis on RNA 6000NanoChips using the Agilent 2100 Bioanalyzer. Only RNAwith a high (>9) RNA integrity number was selected andused for subsequent retro-transcription, labeling and arrayhybridization according to Agilent protocols. Mouse geneexpression arrays (Agilent 4X44K slides) were hybridizedand scanned with the Agilent microarray station.
BioinformaticsIntensity values were processed with Agi4x44PreProcess(http://bioconductor.org/packages/2.12/bioc/html/Agi4x44PreProcess.html) using default parameters to remove low-quality probes. Signals were then normalized by means ofthe quantile normalization method. To evaluate differentialexpression, we used RankProd (http://www.bioconductor.org/packages/2.11/bioc/html/RankProd.html) [28]. RankProdutilizes the Rank Product (RP) non-parametric method [29]to identify up- or downregulated genes. The RP is equivalentto calculating the geometric mean rank with a statisticalmethod (average rank) that is slightly more sensitive tooutlier data and puts a higher premium on consistencybetween the ranks in various lists. To assess for functionalcategories overrepresented in the differentially expressedgenes, we used DAVID (http://david.abcc.ncifcrf.gov) andIngenuity Pathway Analysis (Ingenuity Systems, Inc., USA).

Figure 1 Venn diagram of differentially expressed genes inEn2−/− adult cerebellum and hippocampus. A total of 842 and862 differentially expressed genes were identified in the adultcerebellum (CB, blue) and hippocampus (Hippo, red) of En2−/−
mice, respectively. Among these, 238 show differential expressionin both tissues.
Sgadò et al. Molecular Autism 2013, 4:51 Page 3 of 12http://www.molecularautism.com/content/4/1/51
To focus the functional analysis on brain expressed geneswe used, as background for our functional analyses, a list oftissue specific ‘expressed genes’ for both the cerebellumand the hippocampus. Our ‘expressed genes’ lists were ob-tained by filtering the genes by the normalized expressionvalues and excluding the ones with the lowest expressionlevels (<10th percentile), and include 13,652 genes for thecerebellum and 13,141 for the hippocampus. The hypergeo-metric test and the Student’s t-test were computed with R(http://www.r-project.org).
Quantitative PCRTotal RNAs were extracted by Trizol™ reagent (InvitrogenLife Technologies, USA) from dissected hippocampi andcerebella from four WTand four En2−/− adult mice. RNAswere DNAse-treated and purified with RNeasy MiniKit (Qiagen, USA). cDNA was synthesized from pooledRNAs (2 μg) using the SuperScript™ VILO™ (InvitrogenLife Technologies, USA) according to the manufacturer’sinstructions. Individual PCR reactions were conducted ina volume of 20 μl using the KAPA FAST SYBR qPCR kit(KAPABiosystems, USA) according to manufacturer’sinstructions. Mouse mitochondrial ribosomal proteinL41 (Mrpl41) was used as a standard for quantificationas previously shown [30]. Primers (MWG, Germany)were designed on different exons to avoid amplification ofgenomic DNA. A list of primer sequences is reported inAdditional file 1. Each PCR cycle consisted of denaturationfor 10 s at 94°C, annealing for 20 s at 60°C and extensionfor 30 s at 72°C. The fluorescence intensity of SYBR green Iwas read and acquired at 72°C after completion of the ex-tension step of each cycle. PCR conditions for individualprimer sets were optimized by varying template cDNA andprimer concentration in order to obtain a single PCR prod-uct and amplification efficiency >90%. Relative expressionvalues were calculated using the Pfaffl method [31].
ResultsDifferential gene expression in cerebellum andhippocampus of En2−/− miceThe cerebellum of En2−/− mice shows Purkinje cell lossand structural abnormalities resembling the neuropatho-logical features observed in ASD patients [20,21,23]. Toidentify genes and pathways altered in En2−/− mice, we ini-tially performed transcriptome profiling of the whole cere-bellar tissue. En2−/− and WT cerebella from adult micewere assessed for differential gene expression by microarrayand bioinformatical analysis (see Methods). We found 842differentially expressed genes in the cerebellum of En2−/−
mice compared to their control littermates. Among these,407 and 435 were up- and downregulated, respectively.Alterations in limbic structures have also been shown inthe temporal lobes of autistic patients. The main abnormal-ities were shown in the superior temporal sulcus and the
ventral-basal temporal region, both of which are involvedin decoding social stimuli and therefore are associated withthe social deficits [32-34]. Most importantly, we previouslyshowed anatomical defects in the En2−/− hippocampus thatmight contribute to the behavioral deficits displayed bythese mutants [27]. We therefore combined the cerebellargene expression profile to that of the hippocampus.We found 862 differentially expressed genes in the hippo-campus, among those 378 were upregulated and 484 weredownregulated in En2−/− mice compared to their littermatecontrols. Additional file 2 shows the entire list of genesdifferentially expressed in the cerebellum and hippocampusof En2−/− mice with the differential expression P value andthe percentage of false prediction (pfp) value calculated byRankProd. Given the profound structural and cytoarchitec-tural phenotype of the En2−/− cerebellum and the variabilityof the phenotype among individuals, we chose to be morepermissive and include genes with smaller differentialexpression fold changes applying a moderate cutoff to theuncorrected P value [see Additional file 2]. Differentiallyexpressed genes, which are common in the hippocampusand the cerebellum, are summarized in Figure 1 and listedin Additional file 3. Remarkably, En2 was not among thedifferentially expressed genes. The microarray probe forEn2 (A_51_P397876) was designed on the 3′ untranslatedregion of the gene that is not deleted in the En2−/− locus[20]. Our data confirm the previous reports indicating thepresence of a residual transcript from the En2−/− locus [20].Furthermore, real-time quantitative PCR (qPCR) ana-lysis of En2 expression using homeobox specific primersrevealed no expression of the full-length gene in En2−/−
mice [see Additional file 4].
Functional analysisTo explore the biological processes most relevant to thephenotype of the En2−/− mice, the differentially expressed
Sgadò et al. Molecular Autism 2013, 4:51 Page 4 of 12http://www.molecularautism.com/content/4/1/51
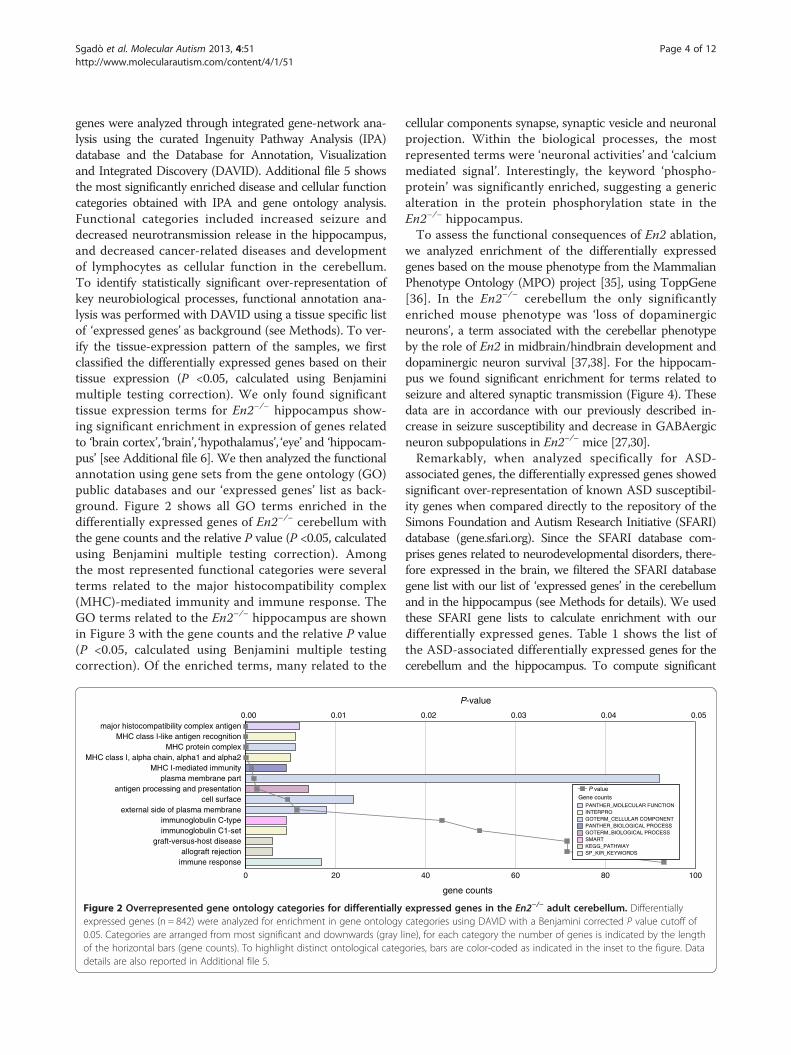
genes were analyzed through integrated gene-network ana-lysis using the curated Ingenuity Pathway Analysis (IPA)database and the Database for Annotation, Visualizationand Integrated Discovery (DAVID). Additional file 5 showsthe most significantly enriched disease and cellular functioncategories obtained with IPA and gene ontology analysis.Functional categories included increased seizure anddecreased neurotransmission release in the hippocampus,and decreased cancer-related diseases and developmentof lymphocytes as cellular function in the cerebellum.To identify statistically significant over-representation ofkey neurobiological processes, functional annotation ana-lysis was performed with DAVID using a tissue specific listof ‘expressed genes’ as background (see Methods). To ver-ify the tissue-expression pattern of the samples, we firstclassified the differentially expressed genes based on theirtissue expression (P <0.05, calculated using Benjaminimultiple testing correction). We only found significanttissue expression terms for En2−/− hippocampus show-ing significant enrichment in expression of genes relatedto ‘brain cortex’, ‘brain’, ‘hypothalamus’, ‘eye’ and ‘hippocam-pus’ [see Additional file 6]. We then analyzed the functionalannotation using gene sets from the gene ontology (GO)public databases and our ‘expressed genes’ list as back-ground. Figure 2 shows all GO terms enriched in thedifferentially expressed genes of En2−/− cerebellum withthe gene counts and the relative P value (P <0.05, calculatedusing Benjamini multiple testing correction). Amongthe most represented functional categories were severalterms related to the major histocompatibility complex(MHC)-mediated immunity and immune response. TheGO terms related to the En2−/− hippocampus are shownin Figure 3 with the gene counts and the relative P value(P <0.05, calculated using Benjamini multiple testingcorrection). Of the enriched terms, many related to the
20 0
immune responseallograft rejection
graft-versus-host diseaseimmunoglobulin C1-setimmunoglobulin C-type
external side of plasma membranecell surface
antigen processing and presentationplasma membrane part
MHC I-mediated immunityMHC class I, alpha chain, alpha1 and alpha2
MHC protein complexMHC class I-like antigen recognition
major histocompatibility complex antigen0.00 0.01
Figure 2 Overrepresented gene ontology categories for differentiallyexpressed genes (n = 842) were analyzed for enrichment in gene ontology0.05. Categories are arranged from most significant and downwards (gray lof the horizontal bars (gene counts). To highlight distinct ontological categdetails are also reported in Additional file 5.
cellular components synapse, synaptic vesicle and neuronalprojection. Within the biological processes, the mostrepresented terms were ‘neuronal activities’ and ‘calciummediated signal’. Interestingly, the keyword ‘phospho-protein’ was significantly enriched, suggesting a genericalteration in the protein phosphorylation state in theEn2−/− hippocampus.To assess the functional consequences of En2 ablation,
we analyzed enrichment of the differentially expressedgenes based on the mouse phenotype from the MammalianPhenotype Ontology (MPO) project [35], using ToppGene[36]. In the En2−/− cerebellum the only significantlyenriched mouse phenotype was ‘loss of dopaminergicneurons’, a term associated with the cerebellar phenotypeby the role of En2 in midbrain/hindbrain development anddopaminergic neuron survival [37,38]. For the hippocam-pus we found significant enrichment for terms related toseizure and altered synaptic transmission (Figure 4). Thesedata are in accordance with our previously described in-crease in seizure susceptibility and decrease in GABAergicneuron subpopulations in En2−/− mice [27,30].Remarkably, when analyzed specifically for ASD-
associated genes, the differentially expressed genes showedsignificant over-representation of known ASD susceptibil-ity genes when compared directly to the repository of theSimons Foundation and Autism Research Initiative (SFARI)database (gene.sfari.org). Since the SFARI database com-prises genes related to neurodevelopmental disorders, there-fore expressed in the brain, we filtered the SFARI databasegene list with our list of ‘expressed genes’ in the cerebellumand in the hippocampus (see Methods for details). We usedthese SFARI gene lists to calculate enrichment with ourdifferentially expressed genes. Table 1 shows the list ofthe ASD-associated differentially expressed genes for thecerebellum and the hippocampus. To compute significant
P-value
gene counts
4 60 80 10 00
0.02 0.03 0.04 0.05
Gene countsP value
GOTERM_CELLULAR COMPONENT
GOTERM_BIOLOGICAL PROCESS
KEGG_PATHWAY
INTERPRO
SP_KIR_KEYWORDS
SMART
PANTHER_MOLECULAR FUNCTION
PANTHER_BIOLOGICAL PROCESS
expressed genes in the En2−/− adult cerebellum. Differentiallycategories using DAVID with a Benjamini corrected P value cutoff ofine), for each category the number of genes is indicated by the lengthories, bars are color-coded as indicated in the inset to the figure. Data

0 50 100 150 200 250 300 350
calcium mediated signalingcalmodulin-binding
cell cortex partcytoskeleton
alternative splicingtight junction
phosphoproteinmelanogenesis
vascular smooth muscle contractiondendrite
extrinsic to membranecoated vesicle
potassium transportpotassium channel
cortical cytoskeletonvoltage-gated sodium channel
neuronal activitiesvoltage-gated ion channel
neuron projectionactin-binding
cytoskeletal proteinsynaptic vesicle
cell projectioncell junction
clathrin-coated vesicleplasma membrane part
plasma membranevoltage-gated channel
synapse
0.00 0.01 0.02 0.03 0.04 0.05
Gene countsP value
GOTERM_CELLULAR COMPONENT
KEGG_PATHWAY
SP_KIR_KEYWORDS
PANTHER_MOLECULAR FUNCTION
PANTHER_BIOLOGICAL PROCESS
P-value
gene counts
Figure 3 Overrepresented gene ontology categories for differentially expressed genes in the En2−/− adult hippocampus. Differentiallyexpressed genes (n = 862) were analyzed for enrichment in gene ontology categories using public databases with a Benjamini corrected P valuecutoff of 0.05. Further details regarding the figure and inset are described in the legend to Figure 2. Data details are also reported in Additional file 5.
Sgadò et al. Molecular Autism 2013, 4:51 Page 5 of 12http://www.molecularautism.com/content/4/1/51
enrichment between our differentially expressed genes andthe SFARI genes, we employed the hypergeometric test. Thestatistical analysis indicated significant enrichment only forthe hippocampus (P <0.05), whereas no significant enrich-ment was observed for the cerebellum.To compare our findings with the three major genome-
wide expression studies on ASD brain tissue [9,39,40], wematched the publicly available differentially expressedgenes with the same ASD-related gene lists that weused for our analysis. To increase accuracy, we computed,for each study, the hypergeometric test and obtained anenrichment P value that we used for direct comparison.Table 2 summarizes the results of the enrichment analyses,
0
abnormal excitatory postsynaptic currentsseizures
abnormal synaptic transmissionabnormal CNS synaptic transmission
0.00 0.01
10
Figure 4 Mouse phenotype categories associated with differentially egenes in En2−/− hippocampus were analyzed for enrichment in mouse pheCategories are arranged from most significant and downwards (gray line); nhorizontal bars (gene counts).
separated in tissue-specific groups, and the comparisonbetween the studies. For Voineagu et al. [9] we re-analyzedthe cerebellum data using the GEO2R tool with default pa-rameters and used these results to evaluate the correspond-ence with our study. The results for cerebellum show asignificant enrichment with ASD-associated genes only forthe Voineagu et al. study (4.75% enrichment, P = 0.0343).Our study, however, was the only one to display significantenrichment of ASD-related genes (4.24% enrichment,p = 0.0265) in the limbic regions.To validate microarray findings with qPCR analysis, we
selected eight and eighteen representative genes from thecerebellum and the hippocampus differentially expressed
2 50 0
0.0 .0
30 40
2 0 3 0.04 0.05
Gene countsP value
MOUSE PHENOTYPE
Gene counts
P-value
xpressed genes in the En2−/− hippocampus. Differentially expressednotypes using ToppGene with a corrected P value cutoff of 0.05.umber of genes in the category is indicated by the length of the

Table 1 Enrichment of autism spectrum disorder (ASD)-related genes in En2−/− cerebellum and hippocampusdifferentially expressed genes
(a) Cerebellum
Gene Symbol Gene Name P value Fold change
Ada adenosine deaminase 3.50E-03 1.705
Ahi1 Abelson helper integration site 1 4.70E-03 1.690
Cacna1g calcium channel, voltage-dependent, T type, alpha 1G subunit 8.20E-03 0.670
Cdh10 cadherin 10 4.40E-03 1.662
Eml1 echinoderm microtubule associated protein like 1 2.80E-03 0.581
Erbb4 v-erb-a erythroblastic leukemia viral oncogene homolog 4 (avian) 9.90E-03 0.653
Glo1 glyoxalase 1 6.00E-03 0.625
Gnas GNAS (guanine nucleotide binding protein, alpha stimulating) complex locus 5.60E-03 1.565
Grm5 glutamate receptor, metabotropic 5 3.70E-03 1.656
Itgb7 integrin beta 7 1.00E-04 0.453
Kdm5c lysine (K)-specific demethylase 5C 8.50E-03 0.660
Kit kit oncogene 3.00E-03 0.591
Nrp2 neuropilin 2 0.00 2.503
Nrxn3 neurexin III 1.80E-03 1.843
Park2 Parkinson disease (autosomal recessive, juvenile) 2, parkin 5.20E-03 1.723
Pinx1 PIN2/TERF1 interacting, telomerase inhibitor 1 1.00E-03 1.871
Plcb1 phospholipase C, beta 1 3.60E-03 1.677
Rb1cc1 RB1-inducible coiled-coil 1 6.90E-03 1.635
Rpp25 ribonuclease P 25 subunit (human) 8.00E-03 0.619
Stk39 serine/threonine kinase 39, STE20/SPS1 homolog (yeast) 9.40E-03 1.548
Th tyrosine hydroxylase 7.90E-03 1.564
(b) Hippocampus
Gene Symbol Gene Name P value Fold change
Aff4 AF4/FMR2 family, member 4 1.30E-03 4.490
Atp2b2 ATPase, Ca++ transporting, plasma membrane 2 2.80E-03 0.544
Baiap2 brain-specific angiogenesis inhibitor 1-associated protein 2 8.00E-04 0.478
Camta1 calmodulin binding transcription activator 1 4.40E-03 0.561
Dab1 disabled homolog 1 (Drosophila) 4.10E-03 0.552
Dctn5 dynactin 5 4.10E-03 1.733
Dlg4 discs, large homolog 4 (Drosophila) 0.00 0.346
Egr2 early growth response 2 7.00E-04 2.099
Eif4ebp2 eukaryotic translation initiation factor 4E binding protein 2 3.90E-03 0.551
Ep400 E1A binding protein p400 2.00E-04 2.361
Foxp1 forkhead box P1 3.00E-04 0.425
Gabra4 gamma-aminobutyric acid (GABA) A receptor, subunit alpha 4 4.00E-04 2.151
Gnas GNAS (guanine nucleotide binding protein, alpha stimulating) complex locus 3.90E-03 0.555
Gsk3b glycogen synthase kinase 3 beta 3.50E-03 0.541
Gtf2i general transcription factor II I 3.80E-03 0.552
Kit kit oncogene 2.00E-04 0.417
Klc2 kinesin light chain 2 4.80E-03 0.565
Lrrc1 leucine rich repeat containing 1 4.20E-03 1.742
Nrcam neuron-glia-CAM-related cell adhesion molecule 3.10E-03 1.777
Ntng1 netrin G1 1.90E-03 1.842
Sgadò et al. Molecular Autism 2013, 4:51 Page 6 of 12http://www.molecularautism.com/content/4/1/51

Table 1 Enrichment of autism spectrum disorder (ASD)-related genes in En2−/− cerebellum and hippocampusdifferentially expressed genes (Continued)
Ntrk3 neurotrophic tyrosine kinase, receptor, type 3 1.00E-04 0.426
Park2 Parkinson disease (autosomal recessive, juvenile) 2, parkin 1.00E-04 2.402
Plcb1 phospholipase C, beta 1 8.00E-04 0.487
Prkcb protein kinase C, beta 8.00E-04 0.490
Rpp25 ribonuclease P 25 subunit (human) 1.10E-03 0.487
Sbf1 SET binding factor 1 4.40E-03 0.562
Scn1a sodium channel, voltage-gated, type I, alpha 1.00E-04 0.410
Scn8a sodium channel, voltage-gated, type VIII, alpha 1.00E-04 0.414
Syn1 synapsin I 5.00E-04 0.469
Syne1 synaptic nuclear envelope 1 4.80E-03 0.562
Thra thyroid hormone receptor alpha 1.00E-04 0.419
Ube2h ubiquitin-conjugating enzyme E2H 4.00E-03 0.559
Ubl7 ubiquitin-like 7 (bone marrow stromal cell-derived) 3.70E-03 0.557
ASD-related genes enriched in the En2−/− (a) cerebellum and (b) hippocampus with their differential expression P value and fold change.
Sgadò et al. Molecular Autism 2013, 4:51 Page 7 of 12http://www.molecularautism.com/content/4/1/51
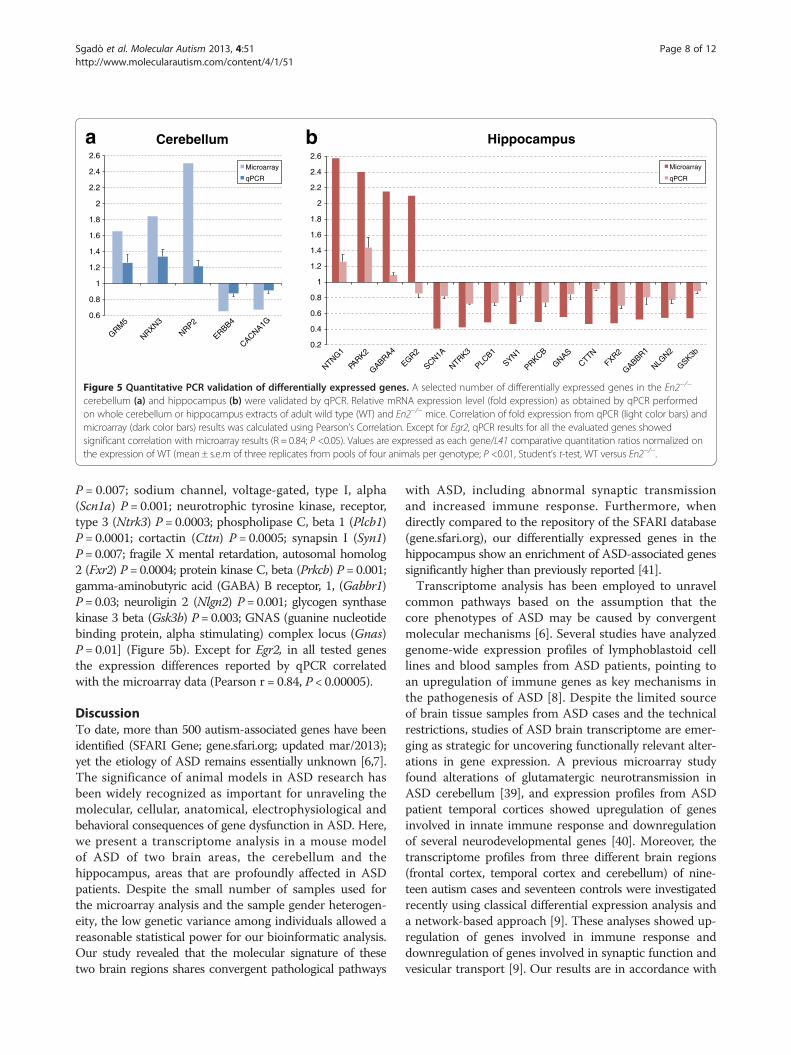
gene lists, respectively. The selected genes reported dif-ferential expression values in microarray experiments ran-ging between 0.41 fold decrease to 2.5 fold increase. WithqPCR, five of the eight selected genes showed statisticallysignificant differential expression in the En2−/− cerebellum[glutamate receptor, metabotropic 5 (Grm5) P = 0.031;neurexin III (Nrxn3) P = 0.032; neuropilin 2 (Nrp2) P =0.009; v-erb-a erythroblastic leukemia viral oncogene
Table 2 Correlation of Simons Foundation and Autism Researtranscriptome studies in Autism Spectrum Disorder (ASD) bra
Cerebellum # SFARIgenes
% enrichment P value
This study (3 En2−/−, 3 WT) 21 2.79% 4.98E-01
Voineagu et al. [9](11 autism, 10 controls)
16 4.75% 3.43E-02 (*)
Purcell et al. [39](9 autism, 9 controls)
1 3.33% 5.85E-01
Limbic regions # SFARIgenes
% enrichment P value
This study (3 En2−/−, 3 WT) 33 4.24% 2.65E-02 (*)
Voineagu et al. [9](13 autism, 13 controls)
36 3.70% 1.04E-01
Garbett et al. [40](6 autism, 6 controls)
4 3.05% 5.52E-01
Percentage of enrichment calculated on SFARI ASD-associated genes compared toVoineagu et al. [9] calculated using GEO2R analysis. Genes present in at least two ohypergeometric test, (*) P <0.05.
homolog 4 (Erbb4) P = 0.003; calcium channel, voltage-dependent, T type, alpha 1G subunit (Cacna1g) P = 0.003](Figure 5a). Fifteen genes of the eighteen selected wereinstead significantly changed in the En2−/− hippocam-pus [netrin G1 (Ntng1) P = 0.008; Parkinson disease(autosomal recessive, juvenile) 2, parkin, (Park2) P = 0.004;gamma-aminobutyric acid (GABA) A receptor, subunitalpha 4 (Gabra4) P = 0.007; early growth response 2 (Egr2)
ch Initiative (SFARI) database genes with publishedin and our study
Gene names
Ada, Ahi1, Cacna1g, Cdh10, Eml1, Erbb4, Glo1, Gnas, Grm5, Itgb7,Kdm5c, Kit, Nrp2, Nrxn3, Park2, Pinx1, Plcb1, Rb1cc1, Rpp25, Stk39, Th
AHI1, ANK3, CACNA1G, CBS, EN2, EPHB6, FAT1, FOXP1,GAP43, GRIN2A,HSD11B1, NLGN3, NTNG1, RAB11FIP5, SLC30A5, UBE3A
CNR1
Gene names
Aff4, Atp2b2, Baiap2, Camta1, Dab1, Dctn5, Dlg4, Egr2, Eif4ebp2,Ep400, Foxp1, Gabra4, Gnas, Gsk3b, Gtf2i, Kit, Klc2, Lrrc1, Nrcam,Ntng1, Ntrk3, Park2, Plcb1, Prkcb, Rpp25, Sbf1, Scn1a, Scn8a, Syn1,Syne1, Thra, Ube2h, Ubl7
AHI1, APBA2, ATP2B2, ATRNL1, AUTS2, BCL2, BTAF1, CADM1, CD99L2,DNM1L, DPP10, EIF4EBP2, FAT1, GRIN2A, ICA1, MAOA, MSN, NTRK3,PCDH9, PPFIA1, PRKCB, PTCHD1, RAB11FIP5, RGS7, RPP25, SLC16A3,SLC25A12, SLC9A9, STXBP1, SYT17, TOMM20, TSC2, TUBGCP5, UBE2H,UBR5, UPF3B
AHI1, MSN, SDC2, SLC9A9
the number of differentially expressed genes. Differentially expressed genes inf the studies are shown in bold. Enrichment P values calculated with the
0.6
0.8
1
1.2
1.4
1.6
1.8
2
2.2
2.4
2.6
GRM5
NRXN3
NRP2
ERBB4
CACNA1G
Cerebellum
Microarray
qPCR
0.2
0.4
0.6
0.8
1
1.2
1.4
1.6
1.8
2
2.2
2.4
2.6
NTNG1
PARK2
GABRA4
EGR2
SCN1A
NTRK3
PLCB1
SYN1
PRKCB
GNAS
CTTN
FXR2
GABBR1
NLGN2
GSK3b
Hippocampus
Microarray
qPCR
a b
Figure 5 Quantitative PCR validation of differentially expressed genes. A selected number of differentially expressed genes in the En2−/−
cerebellum (a) and hippocampus (b) were validated by qPCR. Relative mRNA expression level (fold expression) as obtained by qPCR performedon whole cerebellum or hippocampus extracts of adult wild type (WT) and En2−/− mice. Correlation of fold expression from qPCR (light color bars) andmicroarray (dark color bars) results was calculated using Pearson’s Correlation. Except for Egr2, qPCR results for all the evaluated genes showedsignificant correlation with microarray results (R = 0.84; P <0.05). Values are expressed as each gene/L41 comparative quantitation ratios normalized onthe expression of WT (mean ± s.e.m of three replicates from pools of four animals per genotype; P <0.01, Student’s t-test, WT versus En2−/−.
Sgadò et al. Molecular Autism 2013, 4:51 Page 8 of 12http://www.molecularautism.com/content/4/1/51
P = 0.007; sodium channel, voltage-gated, type I, alpha(Scn1a) P = 0.001; neurotrophic tyrosine kinase, receptor,type 3 (Ntrk3) P = 0.0003; phospholipase C, beta 1 (Plcb1)P = 0.0001; cortactin (Cttn) P = 0.0005; synapsin I (Syn1)P = 0.007; fragile X mental retardation, autosomal homolog2 (Fxr2) P = 0.0004; protein kinase C, beta (Prkcb) P = 0.001;gamma-aminobutyric acid (GABA) B receptor, 1, (Gabbr1)P = 0.03; neuroligin 2 (Nlgn2) P = 0.001; glycogen synthasekinase 3 beta (Gsk3b) P= 0.003; GNAS (guanine nucleotidebinding protein, alpha stimulating) complex locus (Gnas)P = 0.01] (Figure 5b). Except for Egr2, in all tested genesthe expression differences reported by qPCR correlatedwith the microarray data (Pearson r = 0.84, P < 0.00005).
DiscussionTo date, more than 500 autism-associated genes have beenidentified (SFARI Gene; gene.sfari.org; updated mar/2013);yet the etiology of ASD remains essentially unknown [6,7].The significance of animal models in ASD research hasbeen widely recognized as important for unraveling themolecular, cellular, anatomical, electrophysiological andbehavioral consequences of gene dysfunction in ASD. Here,we present a transcriptome analysis in a mouse modelof ASD of two brain areas, the cerebellum and thehippocampus, areas that are profoundly affected in ASDpatients. Despite the small number of samples used forthe microarray analysis and the sample gender heterogen-eity, the low genetic variance among individuals allowed areasonable statistical power for our bioinformatic analysis.Our study revealed that the molecular signature of thesetwo brain regions shares convergent pathological pathways
with ASD, including abnormal synaptic transmissionand increased immune response. Furthermore, whendirectly compared to the repository of the SFARI database(gene.sfari.org), our differentially expressed genes in thehippocampus show an enrichment of ASD-associated genessignificantly higher than previously reported [41].Transcriptome analysis has been employed to unravel
common pathways based on the assumption that thecore phenotypes of ASD may be caused by convergentmolecular mechanisms [6]. Several studies have analyzedgenome-wide expression profiles of lymphoblastoid celllines and blood samples from ASD patients, pointing toan upregulation of immune genes as key mechanisms inthe pathogenesis of ASD [8]. Despite the limited sourceof brain tissue samples from ASD cases and the technicalrestrictions, studies of ASD brain transcriptome are emer-ging as strategic for uncovering functionally relevant alter-ations in gene expression. A previous microarray studyfound alterations of glutamatergic neurotransmission inASD cerebellum [39], and expression profiles from ASDpatient temporal cortices showed upregulation of genesinvolved in innate immune response and downregulationof several neurodevelopmental genes [40]. Moreover, thetranscriptome profiles from three different brain regions(frontal cortex, temporal cortex and cerebellum) of nine-teen autism cases and seventeen controls were investigatedrecently using classical differential expression analysis anda network-based approach [9]. These analyses showed up-regulation of genes involved in immune response anddownregulation of genes involved in synaptic function andvesicular transport [9]. Our results are in accordance with

Sgadò et al. Molecular Autism 2013, 4:51 Page 9 of 12http://www.molecularautism.com/content/4/1/51
these findings. Using gene ontology enrichment, integratedgene-network analysis and mouse phenotypes analysis, wereport significantly enriched functions and pathways thatwere previously associated to ASD [42]. In detail, we foundincreased immune response and major histocompatibilitycomplex-related immunity in the En2−/− cerebellum;decreased and abnormal neurotransmission and increasedseizures in the En2−/− hippocampus [see Additional file 5for details]. Moreover, by direct comparison with the SFARIrepository of ASD-related genes, we show that the gene ex-pression changes observed in the En2−/− hippocampus weresignificantly enriched in ASD-related genes. Furthermore,the proportion of ASD-associated genes enrichment inEn2−/− hippocampus was significantly higher than previousstudies (Table 2) when compared with Voineagu et al. [9],likely the most comprehensive transcriptome study of ASDpost-mortem brain to date. In the case of the cerebellum,in contrast to Voineagu et al. [9] we did not find significantenrichment of ASD-associated genes in En2−/− mice. Suchdifference could be the result of the complex structuraland cytoarchitectural abnormalities in En2−/− cerebellum[20,21] and the consequent phenotypical variability, orcould simply reflect differences between mouse and humanphenotypes, as the incidence of cerebellar hypoplasia wasnot reported in the diagnostic criteria used in the study [9].Remarkably, EN2 was among the differentially expressedgenes found in Voineagu et al. [9], confirming our evidenceabout the role of En2 in the neuropathology of ASD, and inanterior brain structures [27].Among the differentially expressed genes, Grm5, Nrxn3
and Scn1a are of particular interest for ASD. Grm5 encodesmGluR5, a G-protein coupled receptor for the neuro-transmitter glutamate [43]. In a recent study, mGluR5has been shown to participate in the pathogenesis of fragileX syndrome (FXS) while genetic downregulation of Grm5was able to compensate for some of the symptoms in amouse model of FXS [44]. Furthermore, Grm5 was shownto be downregulated in hippocampal neurons lackingShank3, another ASD-associated gene [45]. These datasupport a central role for Grm5 in neurobiological pathwaysrelated to ASD pathogenesis. Our results show an increasedexpression of Grm5 in the cerebellum of En2−/− mice, sug-gesting a role of Grm5 in the cerebellar phenotype of thesemice. The contribution of Grm5 and its interaction withFmr1 in the En2−/− hippocampus remains to be establishedand could open new perspective of pharmacological andgenetic rescue of the ASD-related phenotype of these mice.Nrxn3 encodes neuronal adhesion proteins of the
Neurexin (NRXN) family. NRXNs are presynaptic celladhesion proteins that form trans-synaptic complexeswith their postsynaptic counterpart neuroligins (NLGNs)and have important roles in synapse development andfunction [46]. Recently, a report of hemizygous and de novodeletions involving NRXN3 in ASD families provided
strong support for a causative link between the loss ofNRXN3 and the development of ASD [47]. Our results ofan increased expression of Nrxn3 in the cerebellum suggestalterations in Purkinje cell synaptic formation, whereNRXNs have been shown to participate to the forma-tion of glutamatergic synapses through interaction withCerebellin 1 precursor protein (also downregulated inthe En2−/− cerebellum) and GluR∂2 [48,49].Scn1a encodes the voltage-gated sodium channel alpha
subunit. De novo null mutations in SCN1A result in severemyoclonic epilepsy of infancy [50]. SCN1A mutations havebeen associated to a number of neurological disorders,including generalized epilepsy with febrile seizures plus,Dravet syndrome, borderline myoclonic epilepsy in infancy,intractable childhood epilepsy with generalized tonic-clonicseizures, familial hemiplegic migraine, and a number ofcryptogenic focal and generalized epilepsies. Recently,de novo mutations in SCN1A have been associated withASD [51], and a report of a recognized mutation in SCN1Asuggests a wide phenotypic variation of the gene mutationscausing a variety of neurologic disorders, including ASD[52]. In mice, heterozygous loss-of-function mutation inScn1a (Scn1a+/−), reproduces several of the symptoms asso-ciated to the human mutation, such as thermally inducedand spontaneous seizures, premature death, ataxia andsleep disorder [53,54]. Scn1a+/− mice show both cognitivedeficits and autistic traits that are caused by impairedGABAergic neurotransmission and can be rescued by drugtreatment. Scn1a down-regulation in the En2−/− hippo-campus could contribute to the abnormal excitability andaltered GABAergic neurotransmission shown in these miceby our previous studies [27,30]. Pharmacological rescue ofthe hippocampal phenotype in the En2−/− with GABAergicdrugs is currently under investigation.Anomalies in the cerebellum are the most reproducible
neuropathological alterations in ASD patients. Several cere-bellar abnormalities have been observed in mouse modelsof both En2 gain- and loss-of-function. Ectopic overexpres-sion of En2 in Purkinje cells during late embryonic andpostnatal cerebellar development results in reduced cere-bellar volume and loss of Purkinje cells and other cerebellarneurons [55,56]. Interestingly, En2 knock-out causes defect-ive cerebellar patterning, reduced Purkinje cell number andabnormal dendritic foliation [10,57], indicating that alter-ations in En2 expression levels during development causesimilar phenotypes. Furthermore, deficits in social behav-iors as well as defective spatial learning and memory werealso reported in En2−/− mice [24-26]. A recent epigeneticanalysis of EN2 promoter methylation in the cerebellum ofASD individuals indicated hypermethylation of the pro-moter region and persistent upregulation of the gene. Theauthors report that promoter hypermethylation is normallyassociated with a decrease in gene expression and suggestthe possibility of a developmental mechanism intended to
Sgadò et al. Molecular Autism 2013, 4:51 Page 10 of 12http://www.molecularautism.com/content/4/1/51
support downregulation of EN2 during perinatal develop-ment [19]. Taken together, this evidence suggests that anoverall imbalance in EN2 expression may be relevant forASD pathogenesis, as it could produce alterations in criticalbrain functions. Comparable evidence of a similar dosageeffect has been reported in the case of mutations of othergenes critically involved in gene expression regulation andmaintenance of synaptic and neuronal homeostasis, suchas MECP2 and ARX [58,59]. It remains to be establishedwhether En2 overexpressing mice display abnormal be-haviors relevant to autism. Microarray data have beenproduced for En2 overexpressing Purkinje cells on a differ-ent platform; however, the results overlap only marginallywith the herein reported study [60].
ConclusionsUsing transcriptome analysis, we identified over 800 genesdifferentially expressed in the cerebellum and hippocampusof En2−/− mice. Despite the small number of samples usedand the relatively small statistical power, our study is thefirst to analyze molecular changes occurring in two brainstructures with neuroanatomical alterations relevant toASD in a mouse model of this disease. Our bioinformaticanalysis of the molecular signature of En2−/− cerebellumand hippocampus shows a significant convergence ofneurobiological pathways previously linked to ASD path-ology in brain samples from ASD patients. Overall, thepresent study points to a strong impact of transcriptomeanalysis on mouse models for identifying neurobiologicalpathways commonly altered when ASD genes are disruptedin a human patient and in a mouse model alike. Further-more, together with the frequent association of cerebellarneuroanatomical alterations to the neuropathology of ASD,our molecular analysis suggests a contribution also for thehippocampus, where molecular changes relevant to ASDmay occur also in human patients. This notion is supportedby the consistent enrichment of ASD-related genes inthe En2−/− hippocampus compared to the cerebellumand to other similar studies performed on ASD patienttissue samples [41]. Finally, our results confirm theEn2−/− mouse model of ASD as a valuable tool for in-vestigating neuroanatomical, behavioral, as well as mo-lecular alterations related to ASD.
Availability of supporting dataThe data sets supporting the results of this article areavailable in the GEO repository, GSE51612.
Additional files
Additional file 1: RT-qPCR primers used in the study.
Additional file 2: Differentially expressed gene in the cerebellumand in the hippocampus of En2−/− mice. Tables showing differentiallyexpressed genes in the En2−/− (a) cerebellum and (b) hippocampus with
fold change expression compared to WT littermates, differentialexpression P value and percentage of false prediction (pfp) calculatedwith RankProd. P value cut-off P <0.01 for the cerebellum and P <0.005for the hippocampus.
Additional file 3: Genes differentially expressed in both En2−/−
cerebellum and hippocampus. Genes commonly regulated in theEn2−/− cerebellum and hippocampus with differential expression P valueand fold change.
Additional file 4: En2 full-length expression. Quantitative PCR analysisof En2 full-length expression in the WT and En2−/− cerebellum andhippocampus. Values are expressed as En2/L41 comparative quantitationratios normalized on the expression of WT in the cerebellum(mean ± s.e.m of three replicates from pools of three animals pergenotype; P <0.01, Student’s t-test, WT versus En2−/−).
Additional file 5: Integrated gene-network analysis and geneontology enrichment. Tables a-f show the ten most significant diseaseand functional annotations obtained with Ingenuity Pathways Analysis(IPA) for En2−/− cerebellum (a-c) and En2−/− hippocampus (d-f) differentiallyexpressed genes. Functional categories and annotations are shown with theirP value, the predicted activation state, the activation z-score, the associatedgenes and the number of enriched genes. Activation z-score >2 or < −2indicates significantly increased or decreased annotations. Tables g-j showgene ontology analysis details for En2−/− cerebellum (g, h) and En2−/−
hippocampus (i, j) differentially expressed genes. Gene ontology annotationsare shown with gene counts and corrected P values. Significant disease andfunctions for up- (c, f, h) and downregulated (b, e, j) genes are shownseparately.
Additional file 6: Tissue expression of differentially expressedgenes in En2−/− hippocampus. Table showing gene ontology tissueexpression annotations for differentially expressed genes in the En2−/−
hippocampus. No significant tissue expression annotations were foundfor differentially expressed genes in En2−/− cerebellum.
AbbreviationsASD: Autism spectrum disorders; pfp: Percentage of false positives;DAVID: Database for Annotation, Visualization and Integrated Discovery;FXS: Fragile X syndrome; GABA: Gamma aminobutyric acid; GO: Geneontology; IPA: Ingenuity pathway analysis; MHC: Major histocompatibilitycomplex; MPO: Mammalian phenotype ontology; NLGN: Neuroligin;NRXN: Neurexin; RP: Rank product; SFARI: Simons Foundation and AutismResearch Initiative; SNP: Single-nucleotide polymorphism; WT: Wild type.
Competing interestsThe authors declare that they have no competing interests.
Authors’ contributionPS, GP and YB conceived the study. PS, GP, VA, GZ and SG performedmicroarray and qPCR experiments. PS, GP and ED performed bioinformaticanalysis. PS, GP and YB analyzed data. PS and YB wrote the paper. PS, SC andYB provided funding. All authors read and approved the final manuscript.
AcknowledgementsP.S. is supported by Provincia Autonoma di Trento and the EuropeanCommunity’s FP7/2007-2013 under grant agreement Marie Curie FP7 -PCOFUND-GA-2008- 226070 ‘progetto Trentino’, project EnCort. This workwas funded by the Italian Ministry of University and Research (PRIN 2008grant # 200894SYW2_002 and PRIN 2010–2011 grant # 2010N8PBAA_002 to Y.B.) and the University of Trento (CIBIO start-up grant to S.C. and Y.B.). We thankAndrea Messina, Federico Vaggi and Tommaso Schiavinotto for helpfuldiscussions, and Patrizia Paoli for administrative support.
Author details1Laboratory of Molecular Neuropathology, Centre for Integrative Biology(CIBIO), University of Trento, Via delle Regole 101, 38123 Trento, Italy.2Laboratory of Translational Genomics, Centre for Integrative Biology (CIBIO),University of Trento, Via delle Regole 101, 38123 Trento, Italy. 3HighThroughput Screening Core Facility, Centre for Integrative Biology (CIBIO),University of Trento, Via delle Regole 101, 38123 Trento, Italy. 4Laboratory ofDevelopmental Neurobiology, Centre for Integrative Biology (CIBIO),

Sgadò et al. Molecular Autism 2013, 4:51 Page 11 of 12http://www.molecularautism.com/content/4/1/51
University of Trento, Via delle Regole 101, 38123 Trento, Italy. 5C.N.R.Neuroscience Institute, via G. Moruzzi 1, 56124 Pisa, Italy.
Received: 8 July 2013 Accepted: 27 November 2013Published: 19 December 2013
References1. Rapin I, Tuchman RF: Autism: definition, neurobiology, screening,
diagnosis. Pediatr Clin North Am 2008, 46:1129. viii.2. Dicicco-Bloom E, Lord C, Zwaigenbaum L, Courchesne E, Dager SR, Schmitz
C, Schultz RT, Crawley J, Young LJ: The developmental neurobiology ofautism spectrum disorder. J Neurosci 2006, 26:6897–6906.
3. Pardo CA, Eberhart CG: The neurobiology of autism. Brain Pathol 2007,17:434–447.
4. Courchesne E: Brain development in autism: early overgrowth followedby premature arrest of growth. Ment Retard Dev Disabil Res Rev 2004,10:106–111.
5. Bailey A, Luthert P, Dean A, Harding B, Janota I, Montgomery M, Rutter M,Lantos P: A clinicopathological study of autism. Brain 1998, 121:889–905.
6. Voineagu I: Gene expression studies in autism: moving from the genometo the transcriptome and beyond. Neurobiol Dis 2012, 45:69–75.
7. Huguet G, Ey E, Bourgeron T: The genetic landscapes of autism spectrumdisorders. Annu Rev Genomics Hum Genet 2013, 14:191–213.
8. Lintas C, Sacco R, Persico AM: Genome-wide expression studies in autismspectrum disorder, Rett syndrome, and Down syndrome. Neurobiol Dis2012, 45:57–68.
9. Voineagu I, Wang X, Johnston P, Lowe JK, Tian Y, Horvath S, Mill J, CantorRM, Blencowe BJ, Geschwind DH: Transcriptomic analysis of autistic brainreveals convergent molecular pathology. Nature 2011, 474:380–384.
10. Cheng Y, Sudarov A, Szulc KU, Sgaier SK, Stephen D, Turnbull DH, Joyner AL:The Engrailed homeobox genes determine the different foliationpatterns in the vermis and hemispheres of the mammalian cerebellum.Development 2010, 137:519–529.
11. Gherbassi D, Simon HH: The engrailed transcription factors and themesencephalic dopaminergic neurons. J Neural Transm Suppl 2006, 70:47–55.
12. Herrup K, Murcia C, Gulden F, Kuemerle B, Bilovocky N: The genetics ofearly cerebellar development: networks not pathways. Prog Brain Res2005, 148:21–27.
13. Joyner AL: Engrailed, Wnt and Pax genes regulate midbrain–hindbraindevelopment. Trends Genet 1996, 12:15–20.
14. Sgaier SK, Lao Z, Villanueva MP, Berenshteyn F, Stephen D, Turnbull RK,Joyner AL: Genetic subdivision of the tectum and cerebellum intofunctionally related regions based on differential sensitivity to engrailedproteins. Development 2007, 134:2325–2335.
15. Orvis GD, Hartzell AL, Smith JB, Barraza LH, Wilson SL, Szulc KU, Turnbull DH,Joyner AL: The engrailed homeobox genes are required in multiple celllineages to coordinate sequential formation of fissures and growth ofthe cerebellum. Dev Biol 2012, 367:25–39.
16. Gharani N, Benayed R, Mancuso V, Brzustowicz LM, Millonig JH: Associationof the homeobox transcription factor, ENGRAILED 2, 3, with autismspectrum disorder. Mol Psychiatry 2004, 9:474–484.
17. Benayed R, Gharani N, Rossman I, Mancuso V, Lazar G, Kamdar S, Bruse SE,Tischfield S, Smith BJ, Zimmerman RA, Dicicco-Bloom E, Brzustowicz LM,Millonig JH: Support for the homeobox transcription factor gene ENGRAILED2 as an autism spectrum disorder susceptibility locus. Am J Hum Genet 2005,77:851–868.
18. Benayed R, Choi J, Matteson PG, Gharani N, Kamdar S, Brzustowicz LM,Millonig JH: Autism-associated haplotype affects the regulation of thehomeobox gene, ENGRAILED 2. Biol Psychiatry 2009, 66:911–917.
19. James SJ, Shpyleva S, Melnyk S, Pavliv O, Pogribny IP: Complex epigeneticregulation of Engrailed-2 (EN-2) homeobox gene in the autism cerebellum.Transl Psychiatry 2013, 3:e232.
20. Joyner AL, Herrup K, Auerbach BA, Davis CA, Rossant J: Subtle cerebellarphenotype in mice homozygous for a targeted deletion of the En-2homeobox. Science 1991, 251:1239–1243.
21. Millen KJ, Wurst W, Herrup K, Joyner AL: Abnormal embryonic cerebellardevelopment and patterning of postnatal foliation in two mouseEngrailed-2 mutants. Development 1994, 120:695–706.
22. Millen KJ, Hui CC, Joyner AL: A role for En-2 and other murine homologuesof Drosophila segment polarity genes in regulating positional informationin the developing cerebellum. Development 1995, 121:3935–3945.
23. Kuemerle B, Zanjani H, Joyner A, Herrup K: Pattern deformities and cellloss in Engrailed-2 mutant mice suggest two separate patterning eventsduring cerebellar development. J Neurosci 1997, 17:7881–7889.
24. Gerlai R, Millen KJ, Herrup K, Fabien K, Joyner AL, Roder J: Impaired motorlearning performance in cerebellar En-2 mutant mice. Behav Neurosci1996, 110:126–133.
25. Cheh MA, Millonig JH, Roselli LM, Ming X, Jacobsen E, Kamdar S, WagnerGC: En2 knockout mice display neurobehavioral and neurochemicalalterations relevant to autism spectrum disorder. Brain Res 2006,1116:166–176.
26. Brielmaier J, Matteson PG, Silverman JL, Senerth JM, Kelly S, Genestine M,Millonig JH, Dicicco-Bloom E, Crawley JN: Autism-relevant social abnormalitiesand cognitive deficits in engrailed-2 knockout mice. PLoS ONE 2012, 7:e40914.
27. Sgadò P, Genovesi S, Kalinovsky A, Zunino G, Macchi F, Allegra M, Murenu E,Provenzano G, Tripathi PP, Casarosa S, Joyner AL, Bozzi Y: Loss of GABAergicneurons in the hippocampus and cerebral cortex of Engrailed-2 null mutantmice: Implications for autism spectrum disorders. Exp Neurol 2013, 247:496–505.
28. Hong F, Breitling R, McEntee CW, Wittner BS, Nemhauser JL, Chory J:RankProd: a bioconductor package for detecting differentially expressedgenes in meta-analysis. Bioinformatics 2006, 22:2825–2827.
29. Breitling R, Armengaud P, Amtmann A, Herzyk P: Rank products: a simple,yet powerful, new method to detect differentially regulated genes inreplicated microarray experiments. FEBS Lett 2004, 573:83–92.
30. Tripathi PP, Sgado P, Scali M, Viaggi C, Casarosa S, Simon HH, Vaglini F,Corsini GU, Bozzi Y: Increased susceptibility to kainic acid-inducedseizures in Engrailed-2 knockout mice. Neuroscience 2009, 159:842–849.
31. Pfaffl MW: A new mathematical model for relative quantification inreal-time RT-PCR. Nucleic Acids Res 2001, 29:e45.
32. Lauvin M-A, Martineau J, Destrieux C, Andersson F, Bonnet-Brilhault F,Gomot M, El-Hage W, Cottier J-P: Functional morphological imaging ofautism spectrum disorders: current position and theories proposed.Diagn Interv Imaging 2012, 93:139–147.
33. Boddaert N, Chabane N, Gervais H, Good CD, Bourgeois M, Plumet M-H,Barthélémy C, Mouren M-C, Artiges E, Samson Y, Brunelle F, Frackowiak RSJ,Zilbovicius M: Superior temporal sulcus anatomical abnormalities inchildhood autism: a voxel-based morphometry MRI study.Neuroimage 2004, 23:364–369.
34. Gendry Meresse I, Zilbovicius M, Boddaert N, Robel L, Philippe A, Sfaello I,Laurier L, Brunelle F, Samson Y, Mouren M-C, Chabane N: Autism severityand temporal lobe functional abnormalities. Ann Neurol 2005, 58:466–469.
35. Smith CL, Goldsmith C-AW, Eppig JT: The Mammalian PhenotypeOntology as a tool for annotating, analyzing and comparing phenotypicinformation. Genome Biol 2005, 6:R7.
36. Chen J, Xu H, Aronow BJ, Jegga AG: Improved human disease candidategene prioritization using mouse phenotype. BMC Bioinformatics 2007, 8:392.
37. Alvarez-Fischer D, Fuchs J, Castagner F, Stettler O, Massiani-Beaudoin O,Moya KL, Bouillot C, Oertel WH, Lombès A, Faigle W, Joshi RL, Hartmann A,Prochiantz A: Engrailed protects mouse midbrain dopaminergic neuronsagainst mitochondrial complex I insults. Nat Neurosci 2011, 14:1260–1266.
38. Sgadò P, Albéri L, Gherbassi D, Galasso SL, Ramakers GMJ, Alavian KN, SmidtMP, Dyck RH, Simon HH: Slow progressive degeneration of nigraldopaminergic neurons in postnatal Engrailed mutant mice. Proc NatlAcad Sci USA 2006, 103:15242–15247.
39. Purcell AE, Jeon OH, Zimmerman AW, Blue ME, Pevsner J: Postmortembrain abnormalities of the glutamate neurotransmitter system in autism.Neurology 2001, 57:1618–1628.
40. Garbett K, Ebert PJ, Mitchell A, Lintas C, Manzi B, Mirnics K, Persico AM:Immune transcriptome alterations in the temporal cortex of subjectswith autism. Neurobiol Dis 2008, 30:303–311.
41. Ziats MN, Rennert OM: Expression profiling of autism candidate genesduring human brain development implicates central immune signalingpathways. PLoS ONE 2011, 6:e24691.
42. Buxbaum JD, Betancur C, Bozdagi O, Dorr NP, Elder GA, Hof PR: Optimizingthe phenotyping of rodent ASD models: Enrichment analysis of mouseand human neurobiological phenotypes associated with high-risk autismgenes identifies morphological, electrophysiological, neurological, andbehavioral features. Mol Autism 2012, 3:1.
43. Bear MF, Huber KM, Warren ST: The mGluR theory of fragile X mentalretardation. Trends Neurosci 2004, 27:370–377.
44. Dölen G, Osterweil E, Rao BSS, Smith GB, Auerbach BD, Chattarji S, Bear MF:Correction of fragile X syndrome in mice. Neuron 2007, 56:955–962.

Sgadò et al. Molecular Autism 2013, 4:51 Page 12 of 12http://www.molecularautism.com/content/4/1/51
45. Verpelli C, Dvoretskova E, Vicidomini C, Rossi F, Chiappalone M, Schoen M,Di Stefano B, Mantegazza R, Broccoli V, Böckers TM, Dityatev A, Sala C:Importance of Shank3 Protein in Regulating Metabotropic GlutamateReceptor 5 (mGluR5) Expression and Signaling at Synapses. J Biol Chem2011, 286:34839–34850.
46. Siddiqui TJ, Craig AM: Synaptic organizing complexes. Curr Opin Neurobiol2011, 21:132–143.
47. Vaags AK, Lionel AC, Sato D, Goodenberger M, Stein QP, Curran S, Ogilvie C,Ahn JW, Drmic I, Senman L, Chrysler C, Thompson A, Russell C, Prasad A,Walker S, Pinto D, Marshall CR, Stavropoulos DJ, Zwaigenbaum L, FernandezBA, Fombonne E, Bolton PF, Collier DA, Hodge JC, Roberts W, Szatmari P,Scherer SW: Rare deletions at the neurexin 3 locus in autism spectrumdisorder. Am J Hum Genet 2012, 90:133–141.
48. Uemura T, Lee S-J, Yasumura M, Takeuchi T, Yoshida T, Ra M, Taguchi R,Sakimura K, Mishina M: Trans-Synaptic Interaction of GluRδ2 and Neurexinthrough Cbln1 Mediates Synapse Formation in the Cerebellum. Cell 2010,141:1068–1079.
49. Mishina M, Uemura T, Yasumura M, Yoshida T: Molecular mechanism ofparallel fiber-Purkinje cell synapse formation. Front Neural Circuits 2012, 6:90.
50. Claes L, Del-Favero J, Ceulemans B, Lagae L, Van Broeckhoven C, De JongheP: De novo mutations in the sodium-channel gene SCN1A cause severemyoclonic epilepsy of infancy. Am J Hum Genet 2001, 68:1327–1332.
51. O’Roak BJ, Vives L, Fu W, Egertson JD, Stanaway IB, Phelps IG, Carvill G,Kumar A, Lee C, Ankenman K, Munson J, Hiatt JB, Turner EH, Levy R, O’DayDR, Krumm N, Coe BP, Martin BK, Borenstein E, Nickerson DA, Mefford HC,Doherty D, Akey JM, Bernier R, Eichler EE, Shendure J: Multiplex targetedsequencing identifies recurrently mutated genes in autism spectrumdisorders. Science 2012, 338:1619–1622.
52. Frosk P, Mhanni AA, Rafay MF: SCN1A Mutation associated with intractableMyoclonic Epilepsy and Migraine Headache. J Child Neurol 2013, 28:389–391.
53. Yu FH, Mantegazza M, Westenbroek RE, Robbins CA, Kalume F, Burton KA,Spain WJ, McKnight GS, Scheuer T, Catterall WA: Reduced sodium currentin GABAergic interneurons in a mouse model of severe myoclonicepilepsy in infancy. Nat Neurosci 2006, 9:1142–1149.
54. Oakley JC, Kalume F, Yu FH, Scheuer T, Catterall WA: Temperature- andage-dependent seizures in a mouse model of severe myoclonic epilepsyin infancy. Proc Natl Acad Sci USA 2009, 106:3994–3999.
55. Jankowski J, Holst MI, Liebig C, Oberdick J, Baader SL: Engrailed-2negatively regulates the onset of perinatal Purkinje cell differentiation.J Comp Neurol 2004, 472:87–99.
56. Baader SL, Sanlioglu S, Berrebi AS, Parker-Thornburg J, Oberdick J: Ectopicoverexpression of engrailed-2 in cerebellar Purkinje cells causes restricted cellloss and retarded external germinal layer development at lobule junctions.J Neurosci 1998, 18:1763–1773.
57. Sillitoe RV, Vogel MW, Joyner AL: Engrailed homeobox genes regulateestablishment of the cerebellar afferent circuit map. J Neurosci 2010,30:10015–10024.
58. Olivetti PR, Noebels JL: Interneuron, interrupted: molecular pathogenesisof ARX mutations and X-linked infantile spasms. Curr Opin Neurobiol 2012,22:859–865.
59. Na ES, Nelson ED, Kavalali ET, Monteggia LM: The impact of MeCP2 loss- orgain-of-function on synaptic plasticity. Neuropsychopharmacology 2013,38:212–219.
60. Holst MI, Maercker C, Pintea B, Masseroli M, Liebig C, Jankowski J, MiethingA, Martini J, Schwaller B, Oberdick J, Schilling K, Baader SL: Engrailed-2regulates genes related to vesicle formation and transport in cerebellarPurkinje cells. Mol Cell Neurosci 2008, 38:495–504.
doi:10.1186/2040-2392-4-51Cite this article as: Sgadò et al.: Transcriptome profiling in engrailed-2mutant mice reveals common molecular pathways associated with autismspectrum disorders. Molecular Autism 2013 4:51.
Submit your next manuscript to BioMed Centraland take full advantage of:
• Convenient online submission
• Thorough peer review
• No space constraints or color figure charges
• Immediate publication on acceptance
• Inclusion in PubMed, CAS, Scopus and Google Scholar
• Research which is freely available for redistribution
Submit your manuscript at www.biomedcentral.com/submit
Related Documents