BioMed Central Page 1 of 22 (page number not for citation purposes) BMC Physiology Open Access Research article Transcriptional profile of isoproterenol-induced cardiomyopathy and comparison to exercise-induced cardiac hypertrophy and human cardiac failure Cristi L Galindo 1 , Michael A Skinner 2 , Mounir Errami 1 , L Danielle Olson 1 , David A Watson 1 , Jing Li 1 , John F McCormick 1 , Lauren J McIver 1 , Neil M Kumar 1 , Thinh Q Pham 1 and Harold R Garner* 1 Address: 1 McDermott Center for Human Growth and Development, University of Texas Southwestern Medical Center, Dallas, Texas, USA and 2 Department of Surgery, University of Texas Southwestern Medical Center and Children's Medical Center of Dallas, Texas, USA Email: Cristi L Galindo - [email protected]; Michael A Skinner - [email protected]; Mounir Errami - [email protected]; L Danielle Olson - [email protected]; David A Watson - [email protected]; Jing Li - [email protected]; John F McCormick - [email protected]; Lauren J McIver - [email protected]; Neil M Kumar - [email protected]; Thinh Q Pham - [email protected]; Harold R Garner* - [email protected] * Corresponding author Abstract Background: Isoproterenol-induced cardiac hypertrophy in mice has been used in a number of studies to model human cardiac disease. In this study, we compared the transcriptional response of the heart in this model to other animal models of heart failure, as well as to the transcriptional response of human hearts suffering heart failure. Results: We performed microarray analyses on RNA from mice with isoproterenol-induced cardiac hypertrophy and mice with exercise-induced physiological hypertrophy and identified 865 and 2,534 genes that were significantly altered in pathological and physiological cardiac hypertrophy models, respectively. We compared our results to 18 different microarray data sets (318 individual arrays) representing various other animal models and four human cardiac diseases and identified a canonical set of 64 genes that are generally altered in failing hearts. We also produced a pairwise similarity matrix to illustrate relatedness of animal models with human heart disease and identified ischemia as the human condition that most resembles isoproterenol treatment. Conclusion: The overall patterns of gene expression are consistent with observed structural and molecular differences between normal and maladaptive cardiac hypertrophy and support a role for the immune system (or immune cell infiltration) in the pathology of stress-induced hypertrophy. Cross-study comparisons such as the results presented here provide targets for further research of cardiac disease that might generally apply to maladaptive cardiac stresses and are also a means of identifying which animal models best recapitulate human disease at the transcriptional level. Published: 9 December 2009 BMC Physiology 2009, 9:23 doi:10.1186/1472-6793-9-23 Received: 16 April 2009 Accepted: 9 December 2009 This article is available from: http://www.biomedcentral.com/1472-6793/9/23 © 2009 Galindo et al; licensee BioMed Central Ltd. This is an Open Access article distributed under the terms of the Creative Commons Attribution License (http://creativecommons.org/licenses/by/2.0 ), which permits unrestricted use, distribution, and reproduction in any medium, provided the original work is properly cited.

Welcome message from author
This document is posted to help you gain knowledge. Please leave a comment to let me know what you think about it! Share it to your friends and learn new things together.
Transcript
BioMed CentralBMC Physiology
ss
Open AcceResearch articleTranscriptional profile of isoproterenol-induced cardiomyopathy and comparison to exercise-induced cardiac hypertrophy and human cardiac failureCristi L Galindo1, Michael A Skinner2, Mounir Errami1, L Danielle Olson1, David A Watson1, Jing Li1, John F McCormick1, Lauren J McIver1, Neil M Kumar1, Thinh Q Pham1 and Harold R Garner*1Address: 1McDermott Center for Human Growth and Development, University of Texas Southwestern Medical Center, Dallas, Texas, USA and 2Department of Surgery, University of Texas Southwestern Medical Center and Children's Medical Center of Dallas, Texas, USA
Email: Cristi L Galindo - [email protected]; Michael A Skinner - [email protected]; Mounir Errami - [email protected]; L Danielle Olson - [email protected]; David A Watson - [email protected]; Jing Li - [email protected]; John F McCormick - [email protected]; Lauren J McIver - [email protected]; Neil M Kumar - [email protected]; Thinh Q Pham - [email protected]; Harold R Garner* - [email protected]
* Corresponding author
AbstractBackground: Isoproterenol-induced cardiac hypertrophy in mice has been used in a number ofstudies to model human cardiac disease. In this study, we compared the transcriptional responseof the heart in this model to other animal models of heart failure, as well as to the transcriptionalresponse of human hearts suffering heart failure.
Results: We performed microarray analyses on RNA from mice with isoproterenol-inducedcardiac hypertrophy and mice with exercise-induced physiological hypertrophy and identified 865and 2,534 genes that were significantly altered in pathological and physiological cardiac hypertrophymodels, respectively. We compared our results to 18 different microarray data sets (318 individualarrays) representing various other animal models and four human cardiac diseases and identified acanonical set of 64 genes that are generally altered in failing hearts. We also produced a pairwisesimilarity matrix to illustrate relatedness of animal models with human heart disease and identifiedischemia as the human condition that most resembles isoproterenol treatment.
Conclusion: The overall patterns of gene expression are consistent with observed structural andmolecular differences between normal and maladaptive cardiac hypertrophy and support a role forthe immune system (or immune cell infiltration) in the pathology of stress-induced hypertrophy.Cross-study comparisons such as the results presented here provide targets for further researchof cardiac disease that might generally apply to maladaptive cardiac stresses and are also a meansof identifying which animal models best recapitulate human disease at the transcriptional level.
Published: 9 December 2009
BMC Physiology 2009, 9:23 doi:10.1186/1472-6793-9-23
Received: 16 April 2009Accepted: 9 December 2009
This article is available from: http://www.biomedcentral.com/1472-6793/9/23
© 2009 Galindo et al; licensee BioMed Central Ltd. This is an Open Access article distributed under the terms of the Creative Commons Attribution License (http://creativecommons.org/licenses/by/2.0), which permits unrestricted use, distribution, and reproduction in any medium, provided the original work is properly cited.
Page 1 of 22(page number not for citation purposes)
BMC Physiology 2009, 9:23 http://www.biomedcentral.com/1472-6793/9/23
BackgroundPhysiological increase in cardiac muscle mass occurs nor-mally during development, during pregnancy, and inresponse to sustained exercise [1]. Conversely, pathologi-cal cardiac hypertrophy is an adaptive response toincreased pressure load, such as with hypertension or inthe setting of aortic stenosis, or it may be associated withan inherited disease characterized by thickening of the leftventricle and disarray of myocytes [2]. Moreover, regionalhypertrophy can result as a consequence of myocardialinfarction in response to ischemic heart failure. Cardiacfailure remains a major source of human morbidity andmortality in the United States [3]. The disease has multi-ple specific etiologies, and much research has been per-formed to elucidate some of the multiple molecularpathways important in the development of myocardialfailure [4,5]. Many animal models of cardiac failure havebeen devised, and they have played an important role inunderstanding this complicated disease [6]. However, inmany cases the specific method of inducing heart failurein animals does not obviously correlate with commonhuman diseases [7].
For example, some of the animal models of heart failureare induced by pharmacologic agents to induce a directcardiomyopathy; however, it is relatively rare for thehuman heart to be injured through such a mechanism [7].Even the surgical occlusion of a coronary artery to induceacute ischemia of the animal heart does not preciselymodel the more common chronic ischemia that charac-terizes the failing human myocardium [8]. Although crea-tion of a pressure overloaded heart by aortic bandingmight very closely model the pressure overloaded humanheart, such as might be seen in aortic valvular disease, it islikely that there are significant differences in myocardialresponse to acute pressure load induced in the animalwhen compared to the more chronic human situation.Therefore, it is difficult to know which animal models bestexemplify particular types of heart failure in humans.
Genetic expression array analysis allows the characteriza-tion of tissue by assessing the expression patterns of thou-sands of genes. Such investigations of diseased humanmyocardium have been used to elucidate which molecu-lar pathways are altered in particular etiologies of heartfailure [9,10]. In some cases, the differences in geneticexpression patterns elucidated by microarray analysis aresignificant enough for clustering algorithms to distinguishdifferent categories of human heart failure. We hypothe-sized that the sensitivity of this approach will allow us todetermine how closely a common animal model of car-diac failure recapitulates the genetic milieu of the humandisease.
We induced cardiac hypertrophy in mice using isoproter-enol, which has been shown to induce significant cardiac
dysfunction associated with a high mortality rate (up to80%) [7]. We subjected the myocardium to geneticexpression array analysis. Genes demonstrating alteredexpression compared to normal control myocardium andmyocardium that was hypertrophied following an exer-cise regimen were compared to various other animal mod-els of cardiac hypertrophy (e.g., aortic banding, hormonetreatment, and high salt diet) and also human diseasedmyocardial expression data obtained from publicly avail-able databases. We reasoned that microarray geneticexpression analysis of a murine heart failure model mightexhibit similarities at the genetic expression level withsome category of human disease, and would thereforehelp determine which animal models correlate most pre-cisely with particular human diseases.
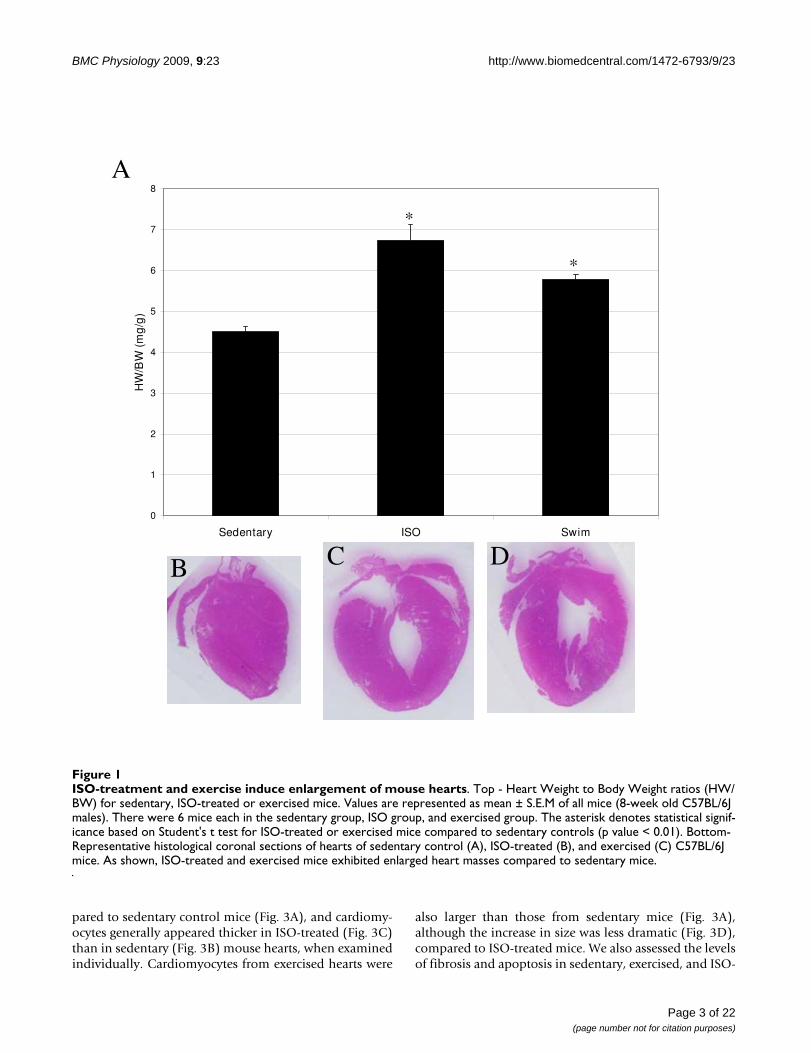
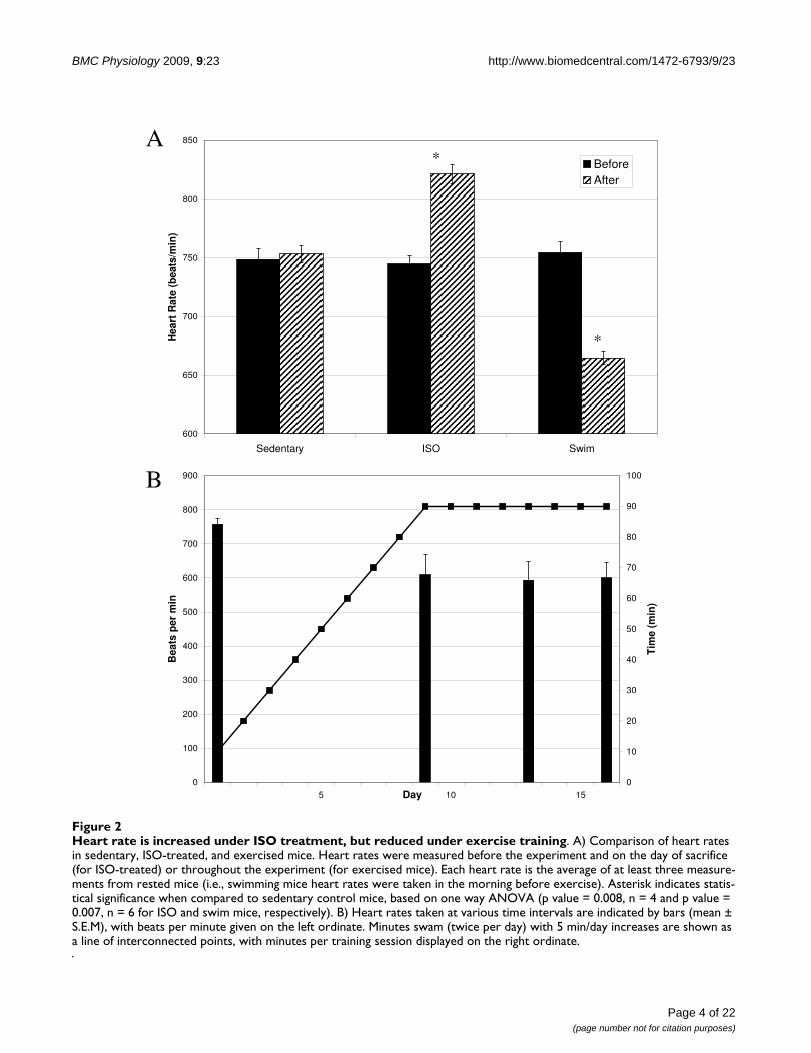
ResultsAnalysis of pathological and physiological cardiac hypertrophy mouse modelsIsoproteronol (ISO) administration and chronic exercisetraining successfully created cardiac hypertrophy in exper-imental animals. As shown in Fig. 1A, heart weight/bodyweight ratios increased significantly (p values > 0.01, n =6) for both the ISO-treated (6.7 ± 0.85 mg/g) and exer-cised mice (5.8 ± 0.40 mg/g), compared to sedentary ani-mals (4.5 ± 0.31 mg/g). However, the increase in heartweight was much more pronounced for mice with ISO-induced cardiac hypertrophy than for exercised mice. Sim-ilar results were obtained when heart weight/tibia lengthratios were compared (7.1 ± 0.32 mg/mm for sedentarymice versus 10.8 ± 1.1 mg/mm and 7.9 ± 0.41 mg/mm forISO-treated and exercised mice, respectively, p value <0.01, n = 6). Hearts were also visibly larger, particularlyafter ISO-treatment, as determined by examination ofH&E stained cryosections (Fig. 1B-D). While both ISOtreatment and exercise induced enlargement of the heart,only the pathological hypertrophy model resulted in anincreased heart rate (745 ± 15 beats/min before ISO treat-ment and 821 ± 16 beats/min after ISO-treatment, p value0.02, n = 4; Fig. 2A). This finding may be related to treat-ment with the beta-agonist isoproterenol, and may not beunique to myocardial hypertrophy. Exercised mice, on theother hand, experienced a profound reduction in heartrate (754 ± 19 beats/min before exercise and 665 ± 13after swimming, p value 0.002, n = 6; Fig. 2A) that was evi-dent within the first 10 days of the swimming regimen(Fig. 2B).
To determine whether the increase in heart size was due toincreased myocyte size or increased numbers of cardiomy-ocytes, we quantified cell cross-sectional area in H&Estained heart cryosections. Each cell examined had a circu-larity (height/width) = 0.90, and > 400 cells were meas-ured for each sample type (i.e., sedentary, exercised, andISO-treated). As expected, myocyte cross-sectional areawas significantly increased in mice treated with ISO, com-
Page 2 of 22(page number not for citation purposes)
BMC Physiology 2009, 9:23 http://www.biomedcentral.com/1472-6793/9/23
pared to sedentary control mice (Fig. 3A), and cardiomy-ocytes generally appeared thicker in ISO-treated (Fig. 3C)than in sedentary (Fig. 3B) mouse hearts, when examinedindividually. Cardiomyocytes from exercised hearts were
also larger than those from sedentary mice (Fig. 3A),although the increase in size was less dramatic (Fig. 3D),compared to ISO-treated mice. We also assessed the levelsof fibrosis and apoptosis in sedentary, exercised, and ISO-
ISO-treatment and exercise induce enlargement of mouse heartsFigure 1ISO-treatment and exercise induce enlargement of mouse hearts. Top - Heart Weight to Body Weight ratios (HW/BW) for sedentary, ISO-treated or exercised mice. Values are represented as mean ± S.E.M of all mice (8-week old C57BL/6J males). There were 6 mice each in the sedentary group, ISO group, and exercised group. The asterisk denotes statistical signif-icance based on Student's t test for ISO-treated or exercised mice compared to sedentary controls (p value < 0.01). Bottom- Representative histological coronal sections of hearts of sedentary control (A), ISO-treated (B), and exercised (C) C57BL/6J mice. As shown, ISO-treated and exercised mice exhibited enlarged heart masses compared to sedentary mice.
0
1
2
3
4
5
6
7
8
Sedentary ISO Swim
HW
/BW
(m
g/g
)
A
*
*
C D B
Page 3 of 22(page number not for citation purposes)
BMC Physiology 2009, 9:23 http://www.biomedcentral.com/1472-6793/9/23
Page 4 of 22(page number not for citation purposes)
Heart rate is increased under ISO treatment, but reduced under exercise trainingFigure 2Heart rate is increased under ISO treatment, but reduced under exercise training. A) Comparison of heart rates in sedentary, ISO-treated, and exercised mice. Heart rates were measured before the experiment and on the day of sacrifice (for ISO-treated) or throughout the experiment (for exercised mice). Each heart rate is the average of at least three measure-ments from rested mice (i.e., swimming mice heart rates were taken in the morning before exercise). Asterisk indicates statis-tical significance when compared to sedentary control mice, based on one way ANOVA (p value = 0.008, n = 4 and p value = 0.007, n = 6 for ISO and swim mice, respectively). B) Heart rates taken at various time intervals are indicated by bars (mean ± S.E.M), with beats per minute given on the left ordinate. Minutes swam (twice per day) with 5 min/day increases are shown as a line of interconnected points, with minutes per training session displayed on the right ordinate.
600
650
700
750
800
850
Sedentary ISO Swim
Hea
rt R
ate
(bea
ts/m
in)
BeforeAfter
0
100
200
300
400
500
600
700
800
900
5 10 15Day
Bea
ts p
er m
in
0
10
20
30
40
50
60
70
80
90
100
Tim
e (m
in)
B
*
*
A

BMC Physiology 2009, 9:23 http://www.biomedcentral.com/1472-6793/9/23
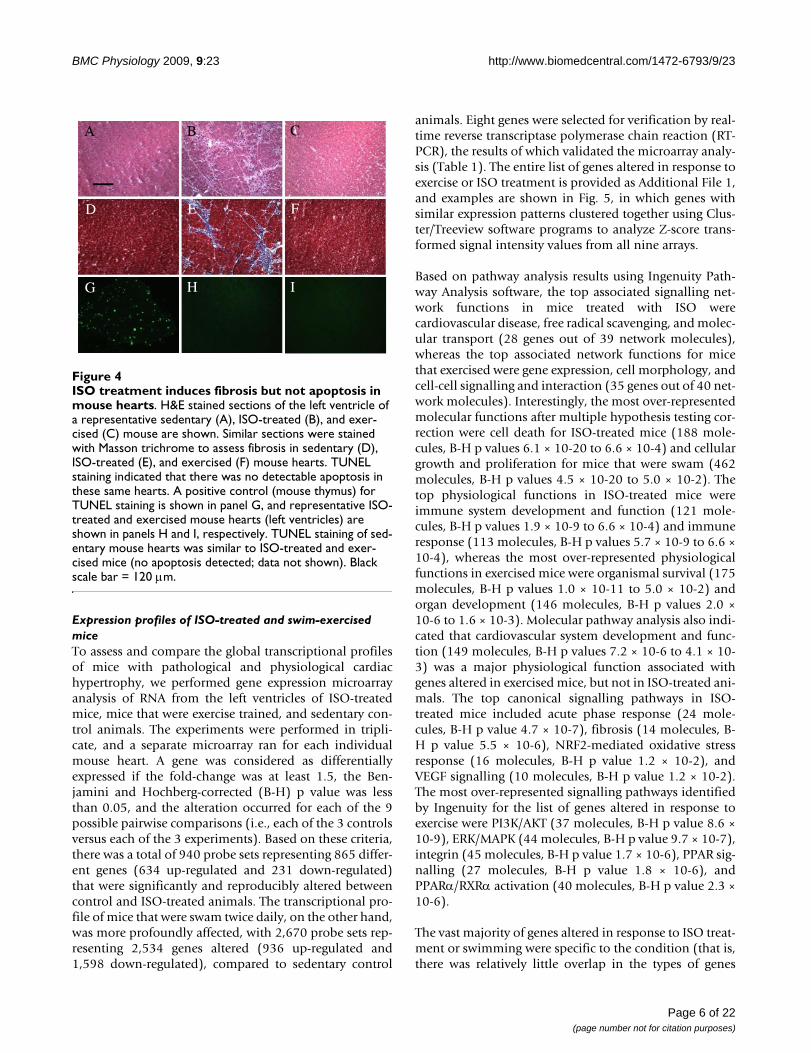
treated hearts (Fig. 4). As shown by H&E and trichromestaining, there was significant fibrosis detected in ISO-treated hearts (Fig. 4B and 4E) that was not observed insedentary (Fig. 4A and 4D) or exercised (Fig. 4C and 4F)mouse hearts. Conversely, there was no evidence of apop-tosis in any of the experimental groups apart from the
positive control (mouse thymus), as measured by TUNELassay (Fig. 4G-I). Considered together, these data indi-cated that the two models induced the desired effects:maladaptive and beneficial increases in heart mass repre-senting pathological and physiological hypertrophy,respectively.
ISO-treatment and exercise induce enlargement of cardiomyocytesFigure 3ISO-treatment and exercise induce enlargement of cardiomyocytes. A) 2-dimensional cell surface area of stained cardiomyocytes was measured using ImageJ software. At least 5 images were taken of the left-ventricle of three different hearts (for each group). Bars represent mean ± S.E.M of at least 400 cells. Asterisks indicate statistical significance after application of one-way ANOVA (p value < 0.0001). H&E stained sections of the left ventricle of a representative sedentary (B), ISO-treated (C), and exercised (D) mouse are also shown. Black scale bar = 60 μm.
0
200
400
600
800
1,000
1,200
1,400
1,600
1,800
2,000
Sedentary ISO SWIM
Cro
ss-s
ecti
on
al A
rea
(m
2 )
*
*
A
B D C
Page 5 of 22(page number not for citation purposes)
BMC Physiology 2009, 9:23 http://www.biomedcentral.com/1472-6793/9/23
Expression profiles of ISO-treated and swim-exercised miceTo assess and compare the global transcriptional profilesof mice with pathological and physiological cardiachypertrophy, we performed gene expression microarrayanalysis of RNA from the left ventricles of ISO-treatedmice, mice that were exercise trained, and sedentary con-trol animals. The experiments were performed in tripli-cate, and a separate microarray ran for each individualmouse heart. A gene was considered as differentiallyexpressed if the fold-change was at least 1.5, the Ben-jamini and Hochberg-corrected (B-H) p value was lessthan 0.05, and the alteration occurred for each of the 9possible pairwise comparisons (i.e., each of the 3 controlsversus each of the 3 experiments). Based on these criteria,there was a total of 940 probe sets representing 865 differ-ent genes (634 up-regulated and 231 down-regulated)that were significantly and reproducibly altered betweencontrol and ISO-treated animals. The transcriptional pro-file of mice that were swam twice daily, on the other hand,was more profoundly affected, with 2,670 probe sets rep-resenting 2,534 genes altered (936 up-regulated and1,598 down-regulated), compared to sedentary control
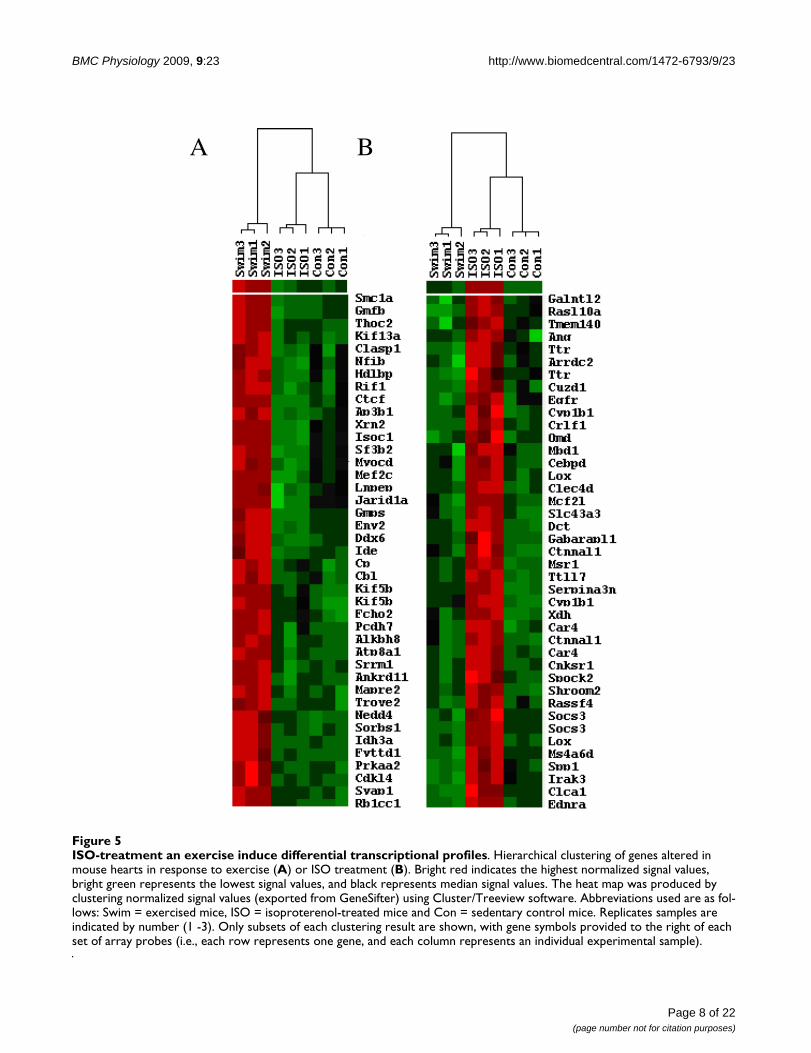
animals. Eight genes were selected for verification by real-time reverse transcriptase polymerase chain reaction (RT-PCR), the results of which validated the microarray analy-sis (Table 1). The entire list of genes altered in response toexercise or ISO treatment is provided as Additional File 1,and examples are shown in Fig. 5, in which genes withsimilar expression patterns clustered together using Clus-ter/Treeview software programs to analyze Z-score trans-formed signal intensity values from all nine arrays.
Based on pathway analysis results using Ingenuity Path-way Analysis software, the top associated signalling net-work functions in mice treated with ISO werecardiovascular disease, free radical scavenging, and molec-ular transport (28 genes out of 39 network molecules),whereas the top associated network functions for micethat exercised were gene expression, cell morphology, andcell-cell signalling and interaction (35 genes out of 40 net-work molecules). Interestingly, the most over-representedmolecular functions after multiple hypothesis testing cor-rection were cell death for ISO-treated mice (188 mole-cules, B-H p values 6.1 × 10⁻²⁰ to 6.6 × 10⁻⁴) and cellulargrowth and proliferation for mice that were swam (462molecules, B-H p values 4.5 × 10⁻²⁰ to 5.0 × 10⁻²). Thetop physiological functions in ISO-treated mice wereimmune system development and function (121 mole-cules, B-H p values 1.9 × 10⁻⁹ to 6.6 × 10⁻⁴) and immuneresponse (113 molecules, B-H p values 5.7 × 10⁻⁹ to 6.6 ×10⁻⁴), whereas the most over-represented physiologicalfunctions in exercised mice were organismal survival (175molecules, B-H p values 1.0 × 10⁻¹¹ to 5.0 × 10⁻²) andorgan development (146 molecules, B-H p values 2.0 ×10⁻⁶ to 1.6 × 10⁻³). Molecular pathway analysis also indi-cated that cardiovascular system development and func-tion (149 molecules, B-H p values 7.2 × 10⁻⁶ to 4.1 × 10⁻³) was a major physiological function associated withgenes altered in exercised mice, but not in ISO-treated ani-mals. The top canonical signalling pathways in ISO-treated mice included acute phase response (24 mole-cules, B-H p value 4.7 × 10⁻⁷), fibrosis (14 molecules, B-H p value 5.5 × 10⁻⁶), NRF2-mediated oxidative stressresponse (16 molecules, B-H p value 1.2 × 10⁻²), andVEGF signalling (10 molecules, B-H p value 1.2 × 10⁻²).The most over-represented signalling pathways identifiedby Ingenuity for the list of genes altered in response toexercise were PI3K/AKT (37 molecules, B-H p value 8.6 ×10⁻⁹), ERK/MAPK (44 molecules, B-H p value 9.7 × 10⁻⁷),integrin (45 molecules, B-H p value 1.7 × 10⁻⁶), PPAR sig-nalling (27 molecules, B-H p value 1.8 × 10⁻⁶), andPPARα/RXRα activation (40 molecules, B-H p value 2.3 ×10⁻⁶).
The vast majority of genes altered in response to ISO treat-ment or swimming were specific to the condition (that is,there was relatively little overlap in the types of genes
ISO treatment induces fibrosis but not apoptosis in mouse heartsFigure 4ISO treatment induces fibrosis but not apoptosis in mouse hearts. H&E stained sections of the left ventricle of a representative sedentary (A), ISO-treated (B), and exer-cised (C) mouse are shown. Similar sections were stained with Masson trichrome to assess fibrosis in sedentary (D), ISO-treated (E), and exercised (F) mouse hearts. TUNEL staining indicated that there was no detectable apoptosis in these same hearts. A positive control (mouse thymus) for TUNEL staining is shown in panel G, and representative ISO-treated and exercised mouse hearts (left ventricles) are shown in panels H and I, respectively. TUNEL staining of sed-entary mouse hearts was similar to ISO-treated and exer-cised mice (no apoptosis detected; data not shown). Black scale bar = 120 μm.
A C B
D F E
G I H
Page 6 of 22(page number not for citation purposes)
BMC Physiology 2009, 9:23 http://www.biomedcentral.com/1472-6793/9/23
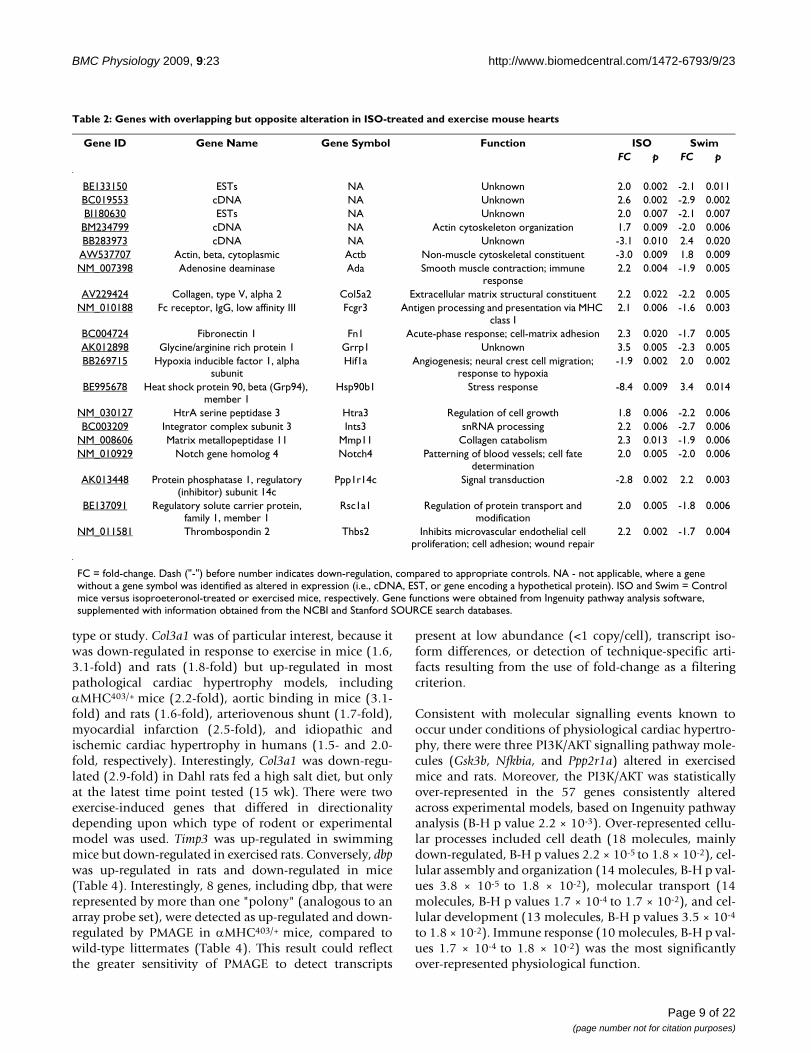
altered under these two conditions.) However, there were159 genes that were altered by both types of cardiac hyper-trophy, whose functions were mainly related to immuneresponse, particularly antigen presentation (14 molecules,B-H p values 2.1 × 10⁻⁵ to 3.1 × 10⁻²) and hematologicalsystem development and function (29 molecules, B-H pvalues 1.4 × 10⁻⁶ to 4.0 × 10⁻²). Of these 159 overlappinggenes, 139 were altered in the same direction in patholog-ical and physiological cardiac hypertrophy models (i.e.,42 up-regulated and 97 down-regulated in ISO-treatedand exercised trained mice, compared to sedentary con-trol animals). Conversely, there were 20 genes that werealtered in each condition in the opposite direction (e.g.,up-regulated in ISO-treated mice and down-regulated inexercised animals) (Table 2).
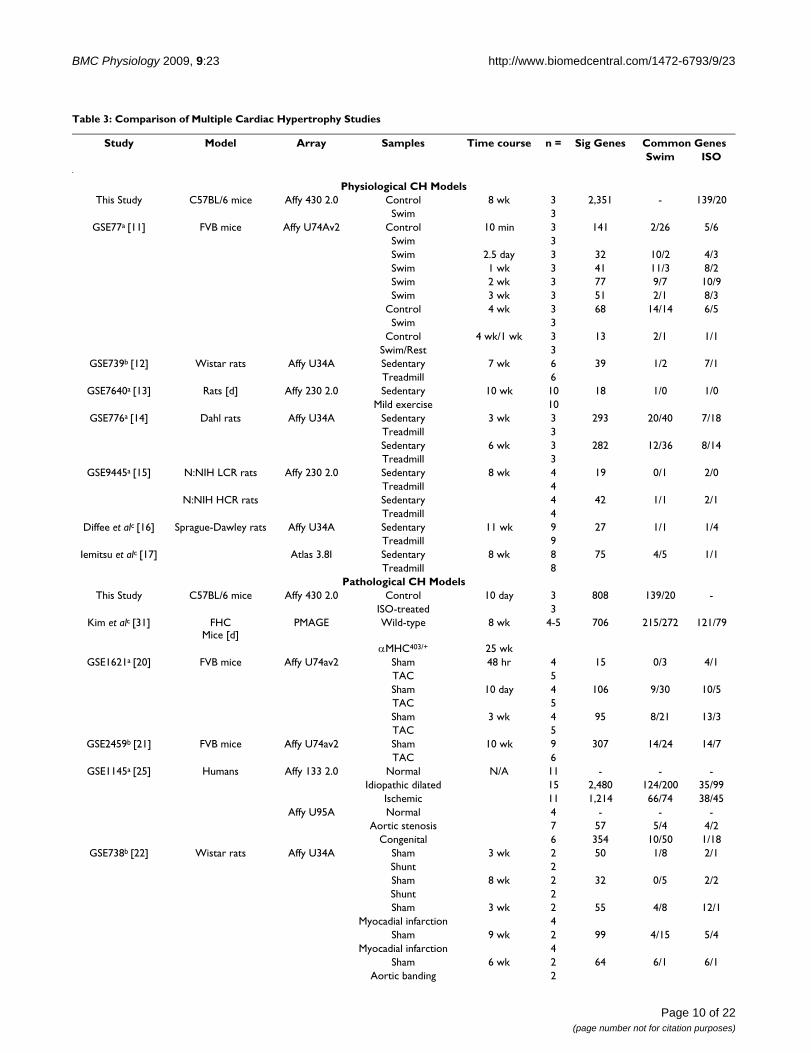
Comparison of physiological and pathological cardiac hypertrophy across various studies and modelsTo compare our results to previously published studies,we obtained all available data files from the GEO websitefor experiments previously conducted to measure tran-scriptional responses to exercise-induced cardiac hyper-trophy or experimentally-induced pathologicalhypertrophy. Exercise models included swimming miceand various rat strains trained on treadmills for varioustime intervals [11-17]. Experimentally-induced patholog-ical cardiac hypertrophy models causing significant car-diac dysfunction and varying degrees of cardiac failureand mortality included familial hypertrophic cardiomy-opathy (FHC) in mice (achieved via an R403Q missensemutation in one allele of the α-myosin heavy-chain gene,αMHC403/+ [18]), myocardial infarction in mice [19], aor-tic banding (i.e., transverse aortic constriction) [20-24] invarious strains of rats and mice, arteriovenous shunt,myocardial infarction, and hormone (angiotensin II and3,5-diidothyroproionic acid) treatments in rats [22], aswell as high salt diet in Dahl rats [14]. We also obtained
microarray data comparing "normal" human hearts (non-diseased samples obtained during autopsy) to heart sam-ples collected during heart transplant surgeries frompatients with end-stage heart failure (idiopathic, ischemic,aortic stenosis, and congenital) [25]. For Affymetrix datain which CEL files were available, data were RMA normal-ized, Student's t test was performed, and each group wasaveraged in order to obtain a fold-change value (usingGeneSifter software). This less stringent data analysisapproach was intended to make the results more compa-rable across microarray platforms and studies and mini-mize the level of false negatives. For data provided only intext form, data were assumed to be pre-normalized by theprevious researchers (per GEO submission requirements),and Student's t test and fold-change were calculateddirectly from the provided data. For two of the previousstudies [16,17], raw data were not publicly available; wetherefore used the gene list provided in the publications.All studies, including overall comparative results, arelisted in Table 3.
As expected, there was a great deal of variation in the totalnumbers of altered genes between the various studies,array platforms, disease models, strains, and time frames.It is perhaps worth noting, however, that our intentionwas not to highlight potential differences in experimentaltechnique between groups or compare the potential valueof one disease model over another. Rather, we hoped toidentify a set of genes that would represent those canoni-cal changes that are captured most frequently under vari-ous experimental conditions and thus might representconsistent genetic expression alterations that might beapplicable to the study of the human end-stage failingheart. We therefore grouped study types together and con-sidered the most profound alteration (i.e. largest fold-change in magnitude) as representative for that group.Groups were chosen based on model type and animal,while more detailed parameters (e.g., strain, time frame,experimental details) were not considered. This resultedin 14 distinct experimental groups with relevant cardiacexpression data: 2 exercise models (swimming mice andrats trained on treadmills), 8 pathological models (micewith aortic banding and myocardial infarction, αMHC403/
+ mice, rats with aortic banding, drug-induced cardiachypertrophy, myocardial infarction, arteriovenous shunt,and high salt diet), and 4 human diseases (idiopathic,ischemic, aortic stenosis, and congenital cardiac hypertro-phy).
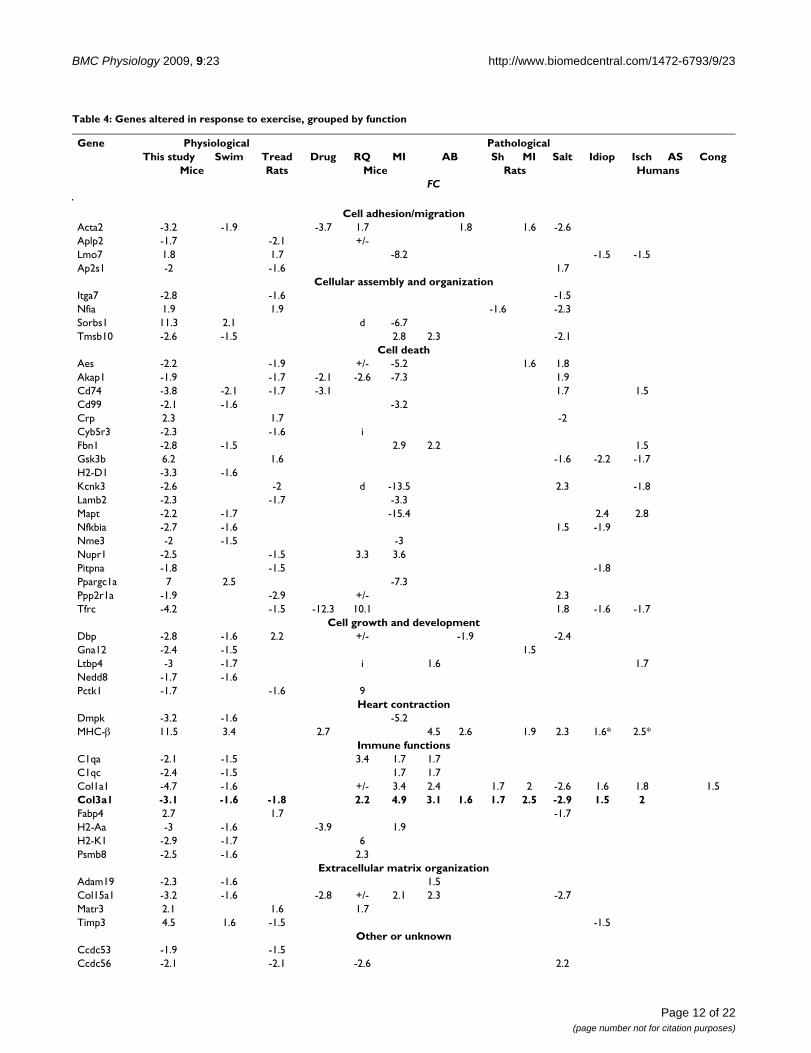
Based on our analyses and comparison methods, therewere 59 genes that were altered in response to exercise inour study and in swimming mice from other studies ortreadmill-exercised rats (Table 4). However, there wereonly two genes (Cd74 and Col3a1) that were altered in ourstudy and in both mice and rats irrespective of the model
Table 1: Verification of microarray data by real-time RT-PCR
Gene ID Gene Symbol Array Real-timeISO Swim ISO Swim
FC
NM_007707 SOCS3 5.9 ND 2.0 NDM65143 LOX* 7.5 ND 8.0 -2.5NM_133249 Ppargc1b -2.8 ND -1.9 NDAK018378 Adrb1 -1.7 ND -1.9 NDNM_007392 Acta2 -3.7 -3.2 -5.7 -6.5NM_010809 Mmp3 6.0 ND 3.3 NDBI78842 Timp4 5.4 3.6 4.9 10.6AK020831 Adamtsl2 2.0 ND 2.3 ND
Asterisk (*) indicates that a related gene (Loxl1, AF357006) was down-regulated 2.6-fold in exercised mice, compared to sedentary control animals. ND = no significant difference detected. FC = fold-change. Fold-change values shown are representative of 3 independent experiments.
Page 7 of 22(page number not for citation purposes)
BMC Physiology 2009, 9:23 http://www.biomedcentral.com/1472-6793/9/23
Page 8 of 22(page number not for citation purposes)
ISO-treatment an exercise induce differential transcriptional profilesFigure 5ISO-treatment an exercise induce differential transcriptional profiles. Hierarchical clustering of genes altered in mouse hearts in response to exercise (A) or ISO treatment (B). Bright red indicates the highest normalized signal values, bright green represents the lowest signal values, and black represents median signal values. The heat map was produced by clustering normalized signal values (exported from GeneSifter) using Cluster/Treeview software. Abbreviations used are as fol-lows: Swim = exercised mice, ISO = isoproterenol-treated mice and Con = sedentary control mice. Replicates samples are indicated by number (1 -3). Only subsets of each clustering result are shown, with gene symbols provided to the right of each set of array probes (i.e., each row represents one gene, and each column represents an individual experimental sample).
A B
BMC Physiology 2009, 9:23 http://www.biomedcentral.com/1472-6793/9/23
type or study. Col3a1 was of particular interest, because itwas down-regulated in response to exercise in mice (1.6,3.1-fold) and rats (1.8-fold) but up-regulated in mostpathological cardiac hypertrophy models, includingαMHC403/+ mice (2.2-fold), aortic binding in mice (3.1-fold) and rats (1.6-fold), arteriovenous shunt (1.7-fold),myocardial infarction (2.5-fold), and idiopathic andischemic cardiac hypertrophy in humans (1.5- and 2.0-fold, respectively). Interestingly, Col3a1 was down-regu-lated (2.9-fold) in Dahl rats fed a high salt diet, but onlyat the latest time point tested (15 wk). There were twoexercise-induced genes that differed in directionalitydepending upon which type of rodent or experimentalmodel was used. Timp3 was up-regulated in swimmingmice but down-regulated in exercised rats. Conversely, dbpwas up-regulated in rats and down-regulated in mice(Table 4). Interestingly, 8 genes, including dbp, that wererepresented by more than one "polony" (analogous to anarray probe set), were detected as up-regulated and down-regulated by PMAGE in αMHC403/+ mice, compared towild-type littermates (Table 4). This result could reflectthe greater sensitivity of PMAGE to detect transcripts
present at low abundance (<1 copy/cell), transcript iso-form differences, or detection of technique-specific arti-facts resulting from the use of fold-change as a filteringcriterion.
Consistent with molecular signalling events known tooccur under conditions of physiological cardiac hypertro-phy, there were three PI3K/AKT signalling pathway mole-cules (Gsk3b, Nfkbia, and Ppp2r1a) altered in exercisedmice and rats. Moreover, the PI3K/AKT was statisticallyover-represented in the 57 genes consistently alteredacross experimental models, based on Ingenuity pathwayanalysis (B-H p value 2.2 × 10⁻³). Over-represented cellu-lar processes included cell death (18 molecules, mainlydown-regulated, B-H p values 2.2 × 10⁻⁵ to 1.8 × 10⁻²), cel-lular assembly and organization (14 molecules, B-H p val-ues 3.8 × 10⁻⁵ to 1.8 × 10⁻²), molecular transport (14molecules, B-H p values 1.7 × 10⁻⁴ to 1.7 × 10⁻²), and cel-lular development (13 molecules, B-H p values 3.5 × 10⁻⁴
to 1.8 × 10⁻²). Immune response (10 molecules, B-H p val-ues 1.7 × 10⁻⁴ to 1.8 × 10⁻²) was the most significantlyover-represented physiological function.
Table 2: Genes with overlapping but opposite alteration in ISO-treated and exercise mouse hearts
Gene ID Gene Name Gene Symbol Function ISO SwimFC p FC p
BE133150 ESTs NA Unknown 2.0 0.002 -2.1 0.011BC019553 cDNA NA Unknown 2.6 0.002 -2.9 0.002BI180630 ESTs NA Unknown 2.0 0.007 -2.1 0.007BM234799 cDNA NA Actin cytoskeleton organization 1.7 0.009 -2.0 0.006BB283973 cDNA NA Unknown -3.1 0.010 2.4 0.020
AW537707 Actin, beta, cytoplasmic Actb Non-muscle cytoskeletal constituent -3.0 0.009 1.8 0.009NM_007398 Adenosine deaminase Ada Smooth muscle contraction; immune
response2.2 0.004 -1.9 0.005
AV229424 Collagen, type V, alpha 2 Col5a2 Extracellular matrix structural constituent 2.2 0.022 -2.2 0.005NM_010188 Fc receptor, IgG, low affinity III Fcgr3 Antigen processing and presentation via MHC
class I2.1 0.006 -1.6 0.003
BC004724 Fibronectin 1 Fn1 Acute-phase response; cell-matrix adhesion 2.3 0.020 -1.7 0.005AK012898 Glycine/arginine rich protein 1 Grrp1 Unknown 3.5 0.005 -2.3 0.005BB269715 Hypoxia inducible factor 1, alpha
subunitHif1a Angiogenesis; neural crest cell migration;
response to hypoxia-1.9 0.002 2.0 0.002
BE995678 Heat shock protein 90, beta (Grp94), member 1
Hsp90b1 Stress response -8.4 0.009 3.4 0.014
NM_030127 HtrA serine peptidase 3 Htra3 Regulation of cell growth 1.8 0.006 -2.2 0.006BC003209 Integrator complex subunit 3 Ints3 snRNA processing 2.2 0.006 -2.7 0.006
NM_008606 Matrix metallopeptidase 11 Mmp11 Collagen catabolism 2.3 0.013 -1.9 0.006NM_010929 Notch gene homolog 4 Notch4 Patterning of blood vessels; cell fate
determination2.0 0.005 -2.0 0.006
AK013448 Protein phosphatase 1, regulatory (inhibitor) subunit 14c
Ppp1r14c Signal transduction -2.8 0.002 2.2 0.003
BE137091 Regulatory solute carrier protein, family 1, member 1
Rsc1a1 Regulation of protein transport and modification
2.0 0.005 -1.8 0.006
NM_011581 Thrombospondin 2 Thbs2 Inhibits microvascular endothelial cell proliferation; cell adhesion; wound repair
2.2 0.002 -1.7 0.004
FC = fold-change. Dash ("-") before number indicates down-regulation, compared to appropriate controls. NA - not applicable, where a gene without a gene symbol was identified as altered in expression (i.e., cDNA, EST, or gene encoding a hypothetical protein). ISO and Swim = Control mice versus isoproeteronol-treated or exercised mice, respectively. Gene functions were obtained from Ingenuity pathway analysis software, supplemented with information obtained from the NCBI and Stanford SOURCE search databases.
Page 9 of 22(page number not for citation purposes)
BMC Physiology 2009, 9:23 http://www.biomedcentral.com/1472-6793/9/23
Table 3: Comparison of Multiple Cardiac Hypertrophy Studies
Study Model Array Samples Time course n = Sig Genes Common GenesSwim ISO
Physiological CH ModelsThis Study C57BL/6 mice Affy 430 2.0 Control 8 wk 3 2,351 - 139/20
Swim 3GSE77a [11] FVB mice Affy U74Av2 Control 10 min 3 141 2/26 5/6
Swim 3Swim 2.5 day 3 32 10/2 4/3Swim 1 wk 3 41 11/3 8/2Swim 2 wk 3 77 9/7 10/9Swim 3 wk 3 51 2/1 8/3
Control 4 wk 3 68 14/14 6/5Swim 3
Control 4 wk/1 wk 3 13 2/1 1/1Swim/Rest 3
GSE739b [12] Wistar rats Affy U34A Sedentary 7 wk 6 39 1/2 7/1Treadmill 6
GSE7640a [13] Rats [d] Affy 230 2.0 Sedentary 10 wk 10 18 1/0 1/0Mild exercise 10
GSE776a [14] Dahl rats Affy U34A Sedentary 3 wk 3 293 20/40 7/18Treadmill 3Sedentary 6 wk 3 282 12/36 8/14Treadmill 3
GSE9445a [15] N:NIH LCR rats Affy 230 2.0 Sedentary 8 wk 4 19 0/1 2/0Treadmill 4
N:NIH HCR rats Sedentary 4 42 1/1 2/1Treadmill 4
Diffee et alc [16] Sprague-Dawley rats Affy U34A Sedentary 11 wk 9 27 1/1 1/4Treadmill 9
Iemitsu et alc [17] Atlas 3.8I Sedentary 8 wk 8 75 4/5 1/1Treadmill 8
Pathological CH ModelsThis Study C57BL/6 mice Affy 430 2.0 Control 10 day 3 808 139/20 -
ISO-treated 3Kim et alc [31] FHC
Mice [d]PMAGE Wild-type 8 wk 4-5 706 215/272 121/79
αMHC403/+ 25 wkGSE1621a [20] FVB mice Affy U74av2 Sham 48 hr 4 15 0/3 4/1
TAC 5Sham 10 day 4 106 9/30 10/5TAC 5Sham 3 wk 4 95 8/21 13/3TAC 5
GSE2459b [21] FVB mice Affy U74av2 Sham 10 wk 9 307 14/24 14/7TAC 6
GSE1145a [25] Humans Affy 133 2.0 Normal N/A 11 - - -Idiopathic dilated 15 2,480 124/200 35/99
Ischemic 11 1,214 66/74 38/45Affy U95A Normal 4 - - -
Aortic stenosis 7 57 5/4 4/2Congenital 6 354 10/50 1/18
GSE738b [22] Wistar rats Affy U34A Sham 3 wk 2 50 1/8 2/1Shunt 2Sham 8 wk 2 32 0/5 2/2Shunt 2Sham 3 wk 2 55 4/8 12/1
Myocadial infarction 4Sham 9 wk 2 99 4/15 5/4
Myocadial infarction 4Sham 6 wk 2 64 6/1 6/1
Aortic banding 2
Page 10 of 22(page number not for citation purposes)
BMC Physiology 2009, 9:23 http://www.biomedcentral.com/1472-6793/9/23
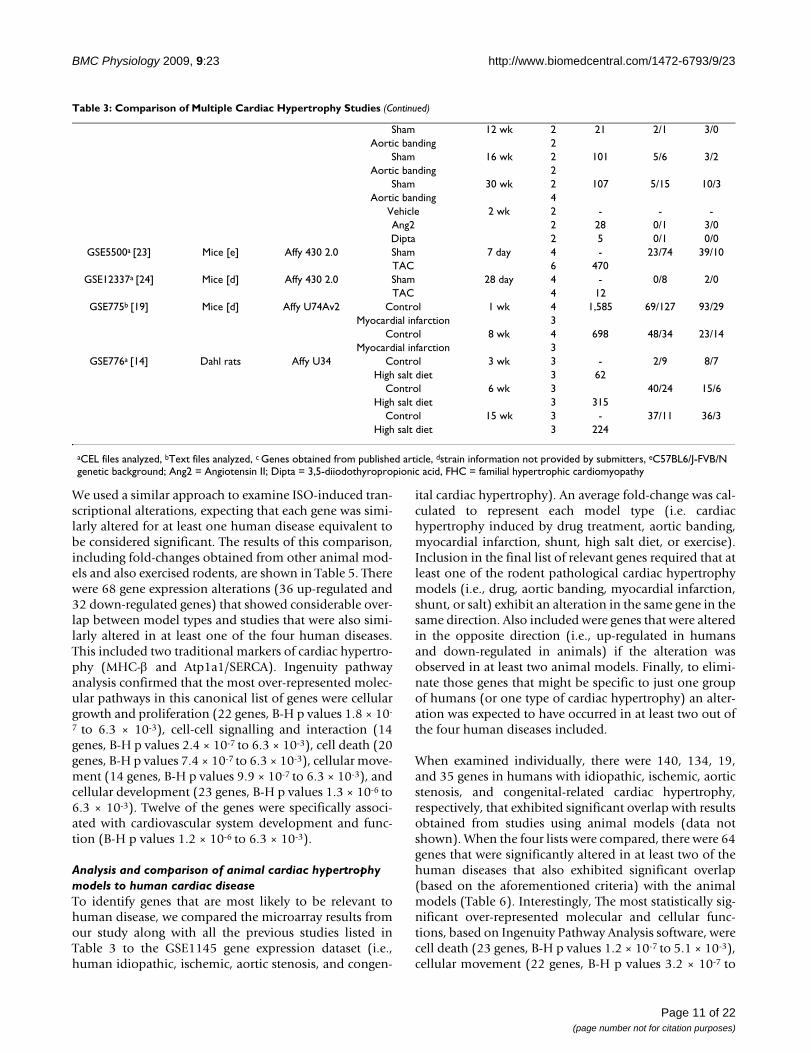
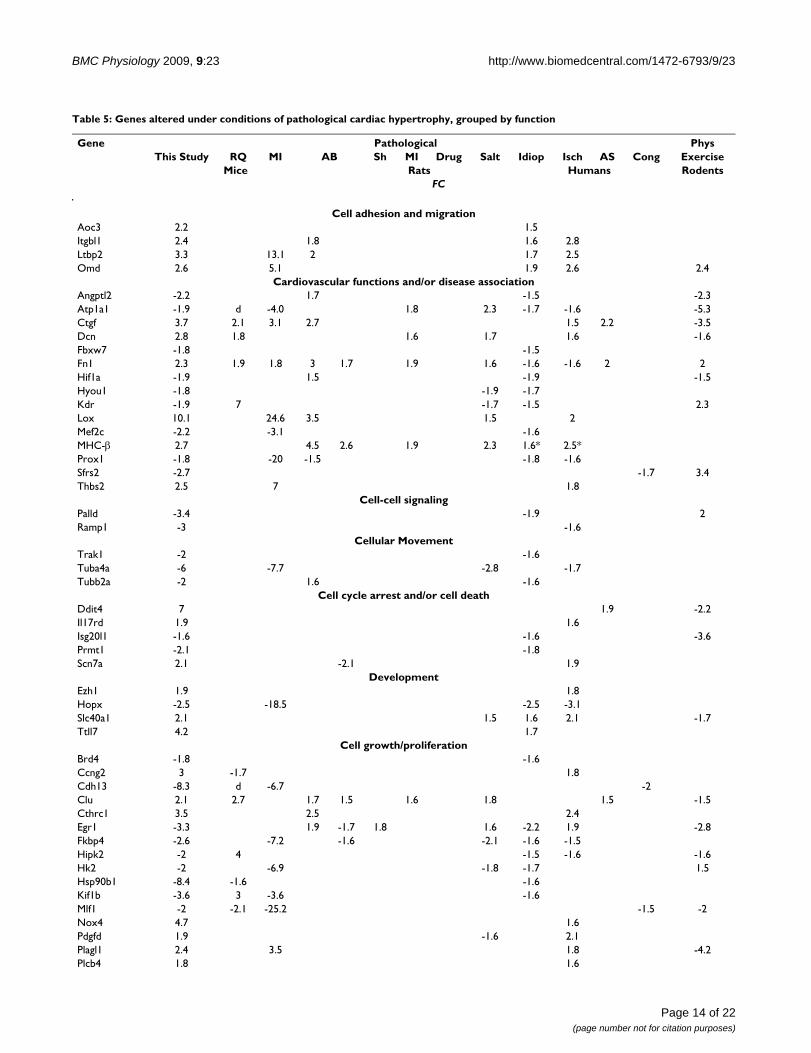
We used a similar approach to examine ISO-induced tran-scriptional alterations, expecting that each gene was simi-larly altered for at least one human disease equivalent tobe considered significant. The results of this comparison,including fold-changes obtained from other animal mod-els and also exercised rodents, are shown in Table 5. Therewere 68 gene expression alterations (36 up-regulated and32 down-regulated genes) that showed considerable over-lap between model types and studies that were also simi-larly altered in at least one of the four human diseases.This included two traditional markers of cardiac hypertro-phy (MHC-β and Atp1a1/SERCA). Ingenuity pathwayanalysis confirmed that the most over-represented molec-ular pathways in this canonical list of genes were cellulargrowth and proliferation (22 genes, B-H p values 1.8 × 10-
7 to 6.3 × 10⁻³), cell-cell signalling and interaction (14genes, B-H p values 2.4 × 10⁻⁷ to 6.3 × 10⁻³), cell death (20genes, B-H p values 7.4 × 10⁻⁷ to 6.3 × 10⁻³), cellular move-ment (14 genes, B-H p values 9.9 × 10⁻⁷ to 6.3 × 10⁻³), andcellular development (23 genes, B-H p values 1.3 × 10⁻⁶ to6.3 × 10-3). Twelve of the genes were specifically associ-ated with cardiovascular system development and func-tion (B-H p values 1.2 × 10⁻⁶ to 6.3 × 10⁻³).
Analysis and comparison of animal cardiac hypertrophy models to human cardiac diseaseTo identify genes that are most likely to be relevant tohuman disease, we compared the microarray results fromour study along with all the previous studies listed inTable 3 to the GSE1145 gene expression dataset (i.e.,human idiopathic, ischemic, aortic stenosis, and congen-
ital cardiac hypertrophy). An average fold-change was cal-culated to represent each model type (i.e. cardiachypertrophy induced by drug treatment, aortic banding,myocardial infarction, shunt, high salt diet, or exercise).Inclusion in the final list of relevant genes required that atleast one of the rodent pathological cardiac hypertrophymodels (i.e., drug, aortic banding, myocardial infarction,shunt, or salt) exhibit an alteration in the same gene in thesame direction. Also included were genes that were alteredin the opposite direction (i.e., up-regulated in humansand down-regulated in animals) if the alteration wasobserved in at least two animal models. Finally, to elimi-nate those genes that might be specific to just one groupof humans (or one type of cardiac hypertrophy) an alter-ation was expected to have occurred in at least two out ofthe four human diseases included.
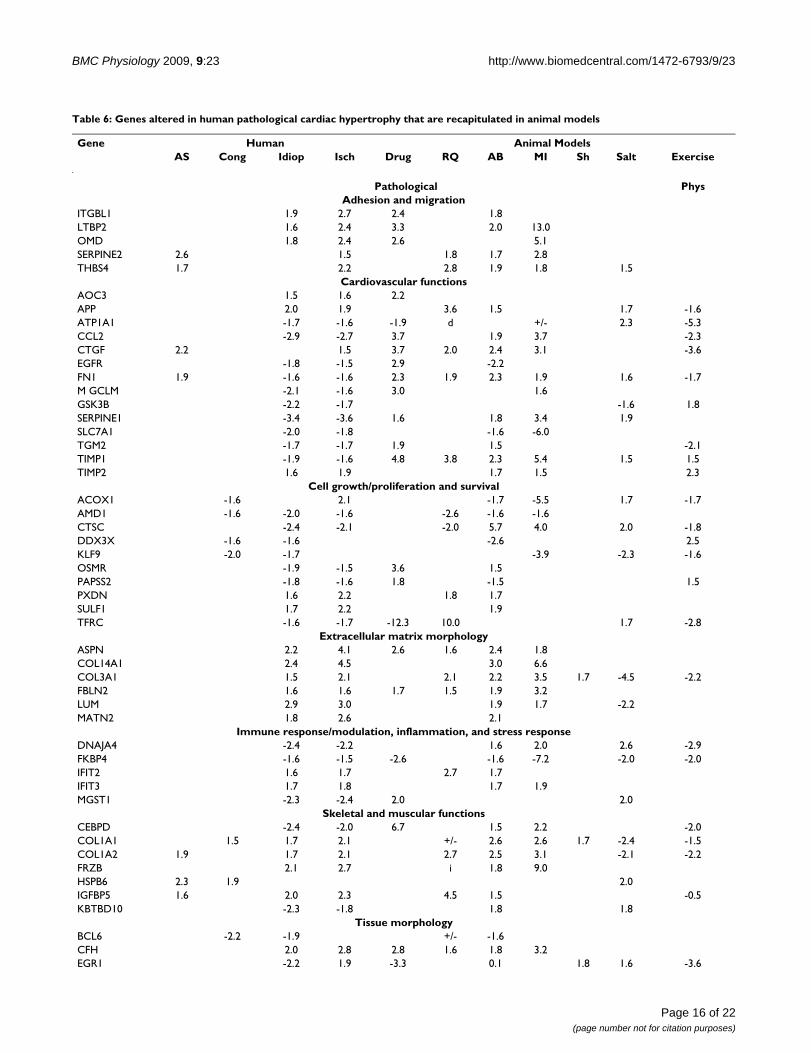
When examined individually, there were 140, 134, 19,and 35 genes in humans with idiopathic, ischemic, aorticstenosis, and congenital-related cardiac hypertrophy,respectively, that exhibited significant overlap with resultsobtained from studies using animal models (data notshown). When the four lists were compared, there were 64genes that were significantly altered in at least two of thehuman diseases that also exhibited significant overlap(based on the aforementioned criteria) with the animalmodels (Table 6). Interestingly, The most statistically sig-nificant over-represented molecular and cellular func-tions, based on Ingenuity Pathway Analysis software, werecell death (23 genes, B-H p values 1.2 × 10⁻⁷ to 5.1 × 10⁻³),cellular movement (22 genes, B-H p values 3.2 × 10⁻⁷ to
Sham 12 wk 2 21 2/1 3/0Aortic banding 2
Sham 16 wk 2 101 5/6 3/2Aortic banding 2
Sham 30 wk 2 107 5/15 10/3Aortic banding 4
Vehicle 2 wk 2 - - -Ang2 2 28 0/1 3/0Dipta 2 5 0/1 0/0
GSE5500a [23] Mice [e] Affy 430 2.0 Sham 7 day 4 - 23/74 39/10TAC 6 470
GSE12337a [24] Mice [d] Affy 430 2.0 Sham 28 day 4 - 0/8 2/0TAC 4 12
GSE775b [19] Mice [d] Affy U74Av2 Control 1 wk 4 1,585 69/127 93/29Myocardial infarction 3
Control 8 wk 4 698 48/34 23/14Myocardial infarction 3
GSE776a [14] Dahl rats Affy U34 Control 3 wk 3 - 2/9 8/7High salt diet 3 62
Control 6 wk 3 40/24 15/6High salt diet 3 315
Control 15 wk 3 - 37/11 36/3High salt diet 3 224
aCEL files analyzed, bText files analyzed, c Genes obtained from published article, dstrain information not provided by submitters, eC57BL6/J-FVB/N genetic background; Ang2 = Angiotensin II; Dipta = 3,5-diiodothyropropionic acid, FHC = familial hypertrophic cardiomyopathy
Table 3: Comparison of Multiple Cardiac Hypertrophy Studies (Continued)
Page 11 of 22(page number not for citation purposes)
BMC Physiology 2009, 9:23 http://www.biomedcentral.com/1472-6793/9/23
Table 4: Genes altered in response to exercise, grouped by function
Gene Physiological PathologicalThis study Swim Tread Drug RQ MI AB Sh MI Salt Idiop Isch AS Cong
Mice Rats Mice Rats HumansFC
Cell adhesion/migrationActa2 -3.2 -1.9 -3.7 1.7 1.8 1.6 -2.6Aplp2 -1.7 -2.1 +/-Lmo7 1.8 1.7 -8.2 -1.5 -1.5Ap2s1 -2 -1.6 1.7
Cellular assembly and organizationItga7 -2.8 -1.6 -1.5Nfia 1.9 1.9 -1.6 -2.3Sorbs1 11.3 2.1 d -6.7Tmsb10 -2.6 -1.5 2.8 2.3 -2.1
Cell deathAes -2.2 -1.9 +/- -5.2 1.6 1.8Akap1 -1.9 -1.7 -2.1 -2.6 -7.3 1.9Cd74 -3.8 -2.1 -1.7 -3.1 1.7 1.5Cd99 -2.1 -1.6 -3.2Crp 2.3 1.7 -2Cyb5r3 -2.3 -1.6 iFbn1 -2.8 -1.5 2.9 2.2 1.5Gsk3b 6.2 1.6 -1.6 -2.2 -1.7H2-D1 -3.3 -1.6Kcnk3 -2.6 -2 d -13.5 2.3 -1.8Lamb2 -2.3 -1.7 -3.3Mapt -2.2 -1.7 -15.4 2.4 2.8Nfkbia -2.7 -1.6 1.5 -1.9Nme3 -2 -1.5 -3Nupr1 -2.5 -1.5 3.3 3.6Pitpna -1.8 -1.5 -1.8Ppargc1a 7 2.5 -7.3Ppp2r1a -1.9 -2.9 +/- 2.3Tfrc -4.2 -1.5 -12.3 10.1 1.8 -1.6 -1.7
Cell growth and developmentDbp -2.8 -1.6 2.2 +/- -1.9 -2.4Gna12 -2.4 -1.5 1.5Ltbp4 -3 -1.7 i 1.6 1.7Nedd8 -1.7 -1.6Pctk1 -1.7 -1.6 9
Heart contractionDmpk -3.2 -1.6 -5.2MHC-β 11.5 3.4 2.7 4.5 2.6 1.9 2.3 1.6* 2.5*
Immune functionsC1qa -2.1 -1.5 3.4 1.7 1.7C1qc -2.4 -1.5 1.7 1.7Col1a1 -4.7 -1.6 +/- 3.4 2.4 1.7 2 -2.6 1.6 1.8 1.5Col3a1 -3.1 -1.6 -1.8 2.2 4.9 3.1 1.6 1.7 2.5 -2.9 1.5 2Fabp4 2.7 1.7 -1.7H2-Aa -3 -1.6 -3.9 1.9H2-K1 -2.9 -1.7 6Psmb8 -2.5 -1.6 2.3
Extracellular matrix organizationAdam19 -2.3 -1.6 1.5Col15a1 -3.2 -1.6 -2.8 +/- 2.1 2.3 -2.7Matr3 2.1 1.6 1.7Timp3 4.5 1.6 -1.5 -1.5
Other or unknownCcdc53 -1.9 -1.5Ccdc56 -2.1 -2.1 -2.6 2.2
Page 12 of 22(page number not for citation purposes)
BMC Physiology 2009, 9:23 http://www.biomedcentral.com/1472-6793/9/23
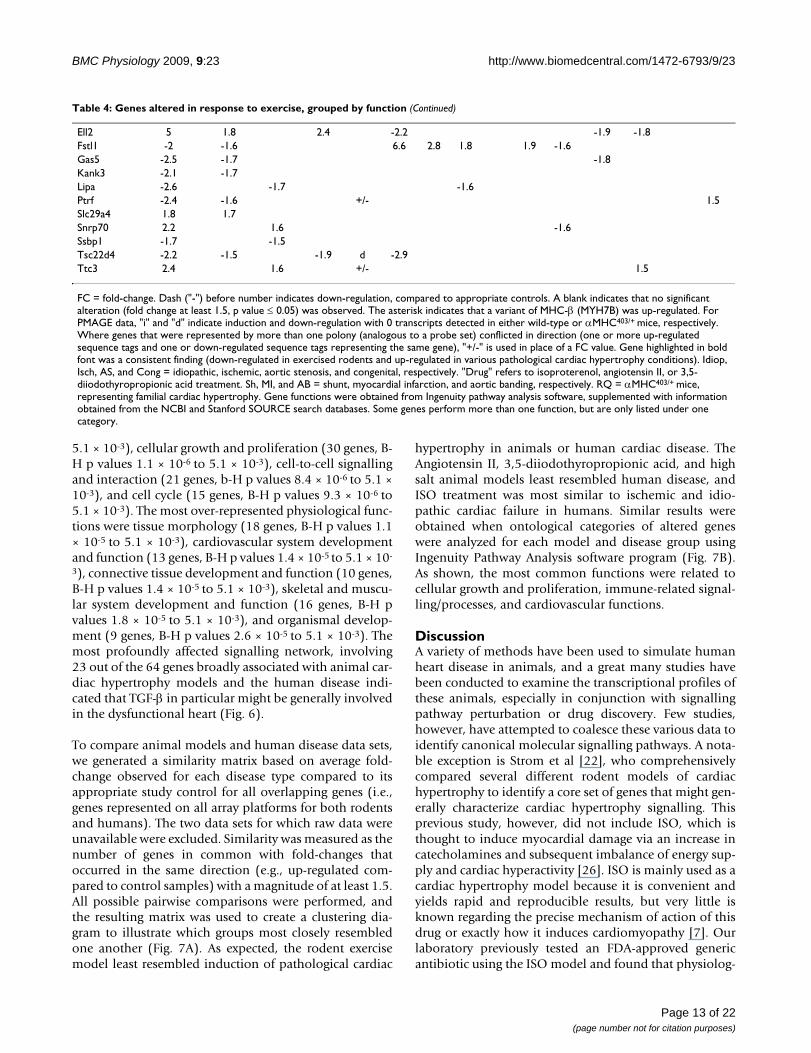
5.1 × 10⁻³), cellular growth and proliferation (30 genes, B-H p values 1.1 × 10⁻⁶ to 5.1 × 10⁻³), cell-to-cell signallingand interaction (21 genes, b-H p values 8.4 × 10⁻⁶ to 5.1 ×10⁻³), and cell cycle (15 genes, B-H p values 9.3 × 10⁻⁶ to5.1 × 10-3). The most over-represented physiological func-tions were tissue morphology (18 genes, B-H p values 1.1× 10⁻⁵ to 5.1 × 10⁻³), cardiovascular system developmentand function (13 genes, B-H p values 1.4 × 10⁻⁵ to 5.1 × 10-
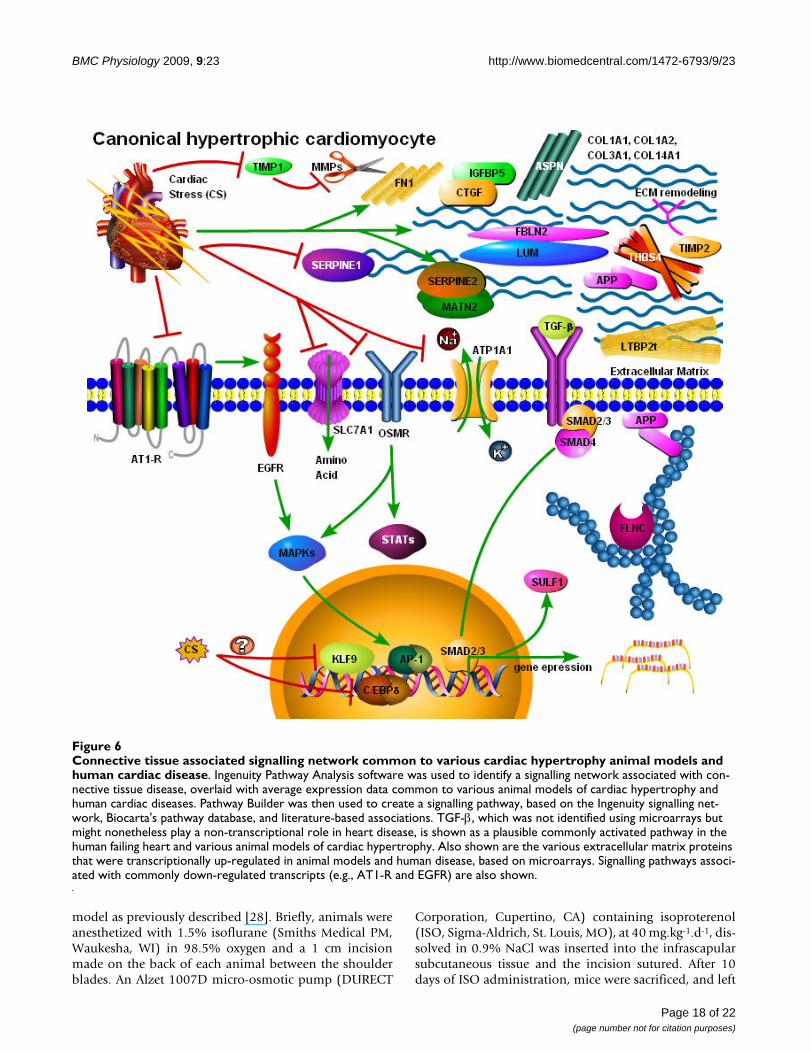
3), connective tissue development and function (10 genes,B-H p values 1.4 × 10⁻⁵ to 5.1 × 10⁻³), skeletal and muscu-lar system development and function (16 genes, B-H pvalues 1.8 × 10⁻⁵ to 5.1 × 10⁻³), and organismal develop-ment (9 genes, B-H p values 2.6 × 10⁻⁵ to 5.1 × 10⁻³). Themost profoundly affected signalling network, involving23 out of the 64 genes broadly associated with animal car-diac hypertrophy models and the human disease indi-cated that TGF-β in particular might be generally involvedin the dysfunctional heart (Fig. 6).
To compare animal models and human disease data sets,we generated a similarity matrix based on average fold-change observed for each disease type compared to itsappropriate study control for all overlapping genes (i.e.,genes represented on all array platforms for both rodentsand humans). The two data sets for which raw data wereunavailable were excluded. Similarity was measured as thenumber of genes in common with fold-changes thatoccurred in the same direction (e.g., up-regulated com-pared to control samples) with a magnitude of at least 1.5.All possible pairwise comparisons were performed, andthe resulting matrix was used to create a clustering dia-gram to illustrate which groups most closely resembledone another (Fig. 7A). As expected, the rodent exercisemodel least resembled induction of pathological cardiac
hypertrophy in animals or human cardiac disease. TheAngiotensin II, 3,5-diiodothyropropionic acid, and highsalt animal models least resembled human disease, andISO treatment was most similar to ischemic and idio-pathic cardiac failure in humans. Similar results wereobtained when ontological categories of altered geneswere analyzed for each model and disease group usingIngenuity Pathway Analysis software program (Fig. 7B).As shown, the most common functions were related tocellular growth and proliferation, immune-related signal-ling/processes, and cardiovascular functions.
DiscussionA variety of methods have been used to simulate humanheart disease in animals, and a great many studies havebeen conducted to examine the transcriptional profiles ofthese animals, especially in conjunction with signallingpathway perturbation or drug discovery. Few studies,however, have attempted to coalesce these various data toidentify canonical molecular signalling pathways. A nota-ble exception is Strom et al [22], who comprehensivelycompared several different rodent models of cardiachypertrophy to identify a core set of genes that might gen-erally characterize cardiac hypertrophy signalling. Thisprevious study, however, did not include ISO, which isthought to induce myocardial damage via an increase incatecholamines and subsequent imbalance of energy sup-ply and cardiac hyperactivity [26]. ISO is mainly used as acardiac hypertrophy model because it is convenient andyields rapid and reproducible results, but very little isknown regarding the precise mechanism of action of thisdrug or exactly how it induces cardiomyopathy [7]. Ourlaboratory previously tested an FDA-approved genericantibiotic using the ISO model and found that physiolog-
Ell2 5 1.8 2.4 -2.2 -1.9 -1.8Fstl1 -2 -1.6 6.6 2.8 1.8 1.9 -1.6Gas5 -2.5 -1.7 -1.8Kank3 -2.1 -1.7Lipa -2.6 -1.7 -1.6Ptrf -2.4 -1.6 +/- 1.5Slc29a4 1.8 1.7Snrp70 2.2 1.6 -1.6Ssbp1 -1.7 -1.5Tsc22d4 -2.2 -1.5 -1.9 d -2.9Ttc3 2.4 1.6 +/- 1.5
FC = fold-change. Dash ("-") before number indicates down-regulation, compared to appropriate controls. A blank indicates that no significant alteration (fold change at least 1.5, p value ≤ 0.05) was observed. The asterisk indicates that a variant of MHC-β (MYH7B) was up-regulated. For PMAGE data, "i" and "d" indicate induction and down-regulation with 0 transcripts detected in either wild-type or αMHC403/+ mice, respectively. Where genes that were represented by more than one polony (analogous to a probe set) conflicted in direction (one or more up-regulated sequence tags and one or down-regulated sequence tags representing the same gene), "+/-" is used in place of a FC value. Gene highlighted in bold font was a consistent finding (down-regulated in exercised rodents and up-regulated in various pathological cardiac hypertrophy conditions). Idiop, Isch, AS, and Cong = idiopathic, ischemic, aortic stenosis, and congenital, respectively. "Drug" refers to isoproterenol, angiotensin II, or 3,5-diiodothyropropionic acid treatment. Sh, MI, and AB = shunt, myocardial infarction, and aortic banding, respectively. RQ = αMHC403/+ mice, representing familial cardiac hypertrophy. Gene functions were obtained from Ingenuity pathway analysis software, supplemented with information obtained from the NCBI and Stanford SOURCE search databases. Some genes perform more than one function, but are only listed under one category.
Table 4: Genes altered in response to exercise, grouped by function (Continued)
Page 13 of 22(page number not for citation purposes)
BMC Physiology 2009, 9:23 http://www.biomedcentral.com/1472-6793/9/23
Table 5: Genes altered under conditions of pathological cardiac hypertrophy, grouped by function
Gene Pathological PhysThis Study RQ MI AB Sh MI Drug Salt Idiop Isch AS Cong Exercise
Mice Rats Humans RodentsFC
Cell adhesion and migrationAoc3 2.2 1.5Itgbl1 2.4 1.8 1.6 2.8Ltbp2 3.3 13.1 2 1.7 2.5Omd 2.6 5.1 1.9 2.6 2.4
Cardiovascular functions and/or disease associationAngptl2 -2.2 1.7 -1.5 -2.3Atp1a1 -1.9 d -4.0 1.8 2.3 -1.7 -1.6 -5.3Ctgf 3.7 2.1 3.1 2.7 1.5 2.2 -3.5Dcn 2.8 1.8 1.6 1.7 1.6 -1.6Fbxw7 -1.8 -1.5Fn1 2.3 1.9 1.8 3 1.7 1.9 1.6 -1.6 -1.6 2 2Hif1a -1.9 1.5 -1.9 -1.5Hyou1 -1.8 -1.9 -1.7Kdr -1.9 7 -1.7 -1.5 2.3Lox 10.1 24.6 3.5 1.5 2Mef2c -2.2 -3.1 -1.6MHC-β 2.7 4.5 2.6 1.9 2.3 1.6* 2.5*Prox1 -1.8 -20 -1.5 -1.8 -1.6Sfrs2 -2.7 -1.7 3.4Thbs2 2.5 7 1.8
Cell-cell signalingPalld -3.4 -1.9 2Ramp1 -3 -1.6
Cellular MovementTrak1 -2 -1.6Tuba4a -6 -7.7 -2.8 -1.7Tubb2a -2 1.6 -1.6
Cell cycle arrest and/or cell deathDdit4 7 1.9 -2.2Il17rd 1.9 1.6Isg20l1 -1.6 -1.6 -3.6Prmt1 -2.1 -1.8Scn7a 2.1 -2.1 1.9
DevelopmentEzh1 1.9 1.8Hopx -2.5 -18.5 -2.5 -3.1Slc40a1 2.1 1.5 1.6 2.1 -1.7Ttll7 4.2 1.7
Cell growth/proliferationBrd4 -1.8 -1.6Ccng2 3 -1.7 1.8Cdh13 -8.3 d -6.7 -2Clu 2.1 2.7 1.7 1.5 1.6 1.8 1.5 -1.5Cthrc1 3.5 2.5 2.4Egr1 -3.3 1.9 -1.7 1.8 1.6 -2.2 1.9 -2.8Fkbp4 -2.6 -7.2 -1.6 -2.1 -1.6 -1.5Hipk2 -2 4 -1.5 -1.6 -1.6Hk2 -2 -6.9 -1.8 -1.7 1.5Hsp90b1 -8.4 -1.6 -1.6Kif1b -3.6 3 -3.6 -1.6Mlf1 -2 -2.1 -25.2 -1.5 -2Nox4 4.7 1.6Pdgfd 1.9 -1.6 2.1Plagl1 2.4 3.5 1.8 -4.2Plcb4 1.8 1.6
Page 14 of 22(page number not for citation purposes)

BMC Physiology 2009, 9:23 http://www.biomedcentral.com/1472-6793/9/23
ical and microarray data supported the use of doxycyclineas an efficacious treatment for ISO-induced cardiac hyper-trophy [27]. These results were reproducible using trans-verse aortic banding and post-myocardial infarctionhypertrophic animal models [27]; however, it is nonethe-less important to identify the underlying molecular mech-anisms of ISO-induced hypertrophy and correlate thisanimal model with human cardiac disease.
The results of this study show that ISO induces transcrip-tional alterations in mouse hearts that differ drasticallyfrom those elicited by normal hypertrophy in response toexercise training (Additional File 1). Moreover, the differ-ential functions and pathways associated with geneexpression alterations elicited by the two types of treat-ments are consistent with what is known about molecularsignalling events that are specific to pathological versusphysiological cardiac hypertrophy. For instance, ISO treat-ment results in the alteration of several genes involved inacute phase and oxidative stress response signalling,which is associated with maladaptive cardiac remodeling[4,5]. Conversely, swimming-induced gene expressionalterations in mouse hearts were mainly those known tobe involved in normal increases in heart mass resultingfrom exercise (e.g., PI3K/AKT and ERK MAPK signallingpathways) [2].
Based on our comparisons of our genetic expressionresults and the results of others using a wide variety ofother animal models of cardiac hypertrophy, we concludethat the transcriptional profile of ISO-treated mice mostresembles gene expression alterations induced by thetransverse aortic banding model. However, the similarityis mainly limited to mice, with few overlapping genesdetected between ISO-treated mice and the various ratmodels. A more extensive study would be required tocompare mouse and rat models in order to conclusivelydetermine which best mimics human cardiac disease. Ourresults indicate that profound differences in gene expres-sion patterns exist between the two types of models thatwarrant further investigation.
Despite the expected variability between studies arisingfrom differences in animal disease models, strains, exper-imental variations, array platforms, and species-relateddifferences, our results indicate that among human car-diac diseases, ischemic-related cardiac hypertrophy mostclosely resembles ISO-treatment of mice (Fig. 7). The sim-ilarity of ISO-treatment to idiopathic heart disease sug-gests that the majority of idiopathic patients exhibitedischemia-associated cardiac hypertrophy and also impliesthat molecular signatures might be used to classify idio-pathic diseases. Alternatively, our findings may simply
Postn 4.1 3.1 5.8 7.1 4.8 3.9 2 2.8 -2.2Tfrc -12.3 10 1.8 -1.6 -1.7 -1.5Trp53inp1 4.3 1.5
Extracellular matrix morphologyAspn 2.6 1.6 3 2 1.8 2.6 4.5Cilp 3.8 5.4 2.8 1.9Fbln2 1.7 1.5 3.2 2.1 1.6 1.6 2.2Mfap5 3.1 1.5 3.8 2.9 1.8 -4.2
Other or unknownArrdc3 2.1 1.8Dhrs7 -1.6 -1.5Hs2st1 -2 1.8 -1.8Kcnt2 2.2 -1.9 1.6Klhl24 2.7 -3.1 1.6 -1.6Obfc2a -2.1 -1.8 -1.7Pcmtd2 2.1 -1.8 1.6 -3Reep1 -2.8 -3.9 -2.5 -1.7Rnase4 2 2.6 1.5 1.9Trmt5 2.4 i 1.5Tsfm -1.7 -3.6 -1.5Zbtb44 2 -1.6 1.6Zfp428 -2.2 1.5
FC = fold-change. Dash ("-") before number indicates down-regulation, compared to appropriate controls. A blank indicates that no significant alteration (fold change at least 1.5, p value ≤ 0.05) was observed. The asterisk indicates that a variant of MHC-β (MYH7B) was up-regulated. For PMAGE data, "i" and "d" indicate induction and down-regulation with 0 transcripts detected in either wild-type or αMHC403/+ mice, respectively. Idiop, Isch, AS, and Cong = idiopathic, ischemic, aortic stenosis, and congenital, respectively. "Drug" refers to angiotensin II treatment. (No gene alterations in common with ISO treatment were found for 3,5-diiodothyropropionic acid treated-rats.) Sh, MI, and AB = shunt, myocardial infarction, and aortic banding, respectively. RQ = αMHC403/+ mice, representing familial cardiac hypertrophy. Phys = physiological. Gene functions were obtained from Ingenuity pathway analysis software, supplemented with information obtained from the NCBI and Stanford SOURCE search databases. Some genes perform more than one function, but are only listed under one category.
Table 5: Genes altered under conditions of pathological cardiac hypertrophy, grouped by function (Continued)
Page 15 of 22(page number not for citation purposes)
BMC Physiology 2009, 9:23 http://www.biomedcentral.com/1472-6793/9/23
Table 6: Genes altered in human pathological cardiac hypertrophy that are recapitulated in animal models
Gene Human Animal ModelsAS Cong Idiop Isch Drug RQ AB MI Sh Salt Exercise
Pathological PhysAdhesion and migration
ITGBL1 1.9 2.7 2.4 1.8LTBP2 1.6 2.4 3.3 2.0 13.0OMD 1.8 2.4 2.6 5.1SERPINE2 2.6 1.5 1.8 1.7 2.8THBS4 1.7 2.2 2.8 1.9 1.8 1.5
Cardiovascular functionsAOC3 1.5 1.6 2.2APP 2.0 1.9 3.6 1.5 1.7 -1.6ATP1A1 -1.7 -1.6 -1.9 d +/- 2.3 -5.3CCL2 -2.9 -2.7 3.7 1.9 3.7 -2.3CTGF 2.2 1.5 3.7 2.0 2.4 3.1 -3.6EGFR -1.8 -1.5 2.9 -2.2FN1 1.9 -1.6 -1.6 2.3 1.9 2.3 1.9 1.6 -1.7M GCLM -2.1 -1.6 3.0 1.6GSK3B -2.2 -1.7 -1.6 1.8SERPINE1 -3.4 -3.6 1.6 1.8 3.4 1.9SLC7A1 -2.0 -1.8 -1.6 -6.0TGM2 -1.7 -1.7 1.9 1.5 -2.1TIMP1 -1.9 -1.6 4.8 3.8 2.3 5.4 1.5 1.5TIMP2 1.6 1.9 1.7 1.5 2.3
Cell growth/proliferation and survivalACOX1 -1.6 2.1 -1.7 -5.5 1.7 -1.7AMD1 -1.6 -2.0 -1.6 -2.6 -1.6 -1.6CTSC -2.4 -2.1 -2.0 5.7 4.0 2.0 -1.8DDX3X -1.6 -1.6 -2.6 2.5KLF9 -2.0 -1.7 -3.9 -2.3 -1.6OSMR -1.9 -1.5 3.6 1.5PAPSS2 -1.8 -1.6 1.8 -1.5 1.5PXDN 1.6 2.2 1.8 1.7SULF1 1.7 2.2 1.9TFRC -1.6 -1.7 -12.3 10.0 1.7 -2.8
Extracellular matrix morphologyASPN 2.2 4.1 2.6 1.6 2.4 1.8COL14A1 2.4 4.5 3.0 6.6COL3A1 1.5 2.1 2.1 2.2 3.5 1.7 -4.5 -2.2FBLN2 1.6 1.6 1.7 1.5 1.9 3.2LUM 2.9 3.0 1.9 1.7 -2.2MATN2 1.8 2.6 2.1
Immune response/modulation, inflammation, and stress responseDNAJA4 -2.4 -2.2 1.6 2.0 2.6 -2.9FKBP4 -1.6 -1.5 -2.6 -1.6 -7.2 -2.0 -2.0IFIT2 1.6 1.7 2.7 1.7IFIT3 1.7 1.8 1.7 1.9MGST1 -2.3 -2.4 2.0 2.0
Skeletal and muscular functionsCEBPD -2.4 -2.0 6.7 1.5 2.2 -2.0COL1A1 1.5 1.7 2.1 +/- 2.6 2.6 1.7 -2.4 -1.5COL1A2 1.9 1.7 2.1 2.7 2.5 3.1 -2.1 -2.2FRZB 2.1 2.7 i 1.8 9.0HSPB6 2.3 1.9 2.0IGFBP5 1.6 2.0 2.3 4.5 1.5 -0.5KBTBD10 -2.3 -1.8 1.8 1.8
Tissue morphologyBCL6 -2.2 -1.9 +/- -1.6CFH 2.0 2.8 2.8 1.6 1.8 3.2EGR1 -2.2 1.9 -3.3 0.1 1.8 1.6 -3.6
Page 16 of 22(page number not for citation purposes)
BMC Physiology 2009, 9:23 http://www.biomedcentral.com/1472-6793/9/23
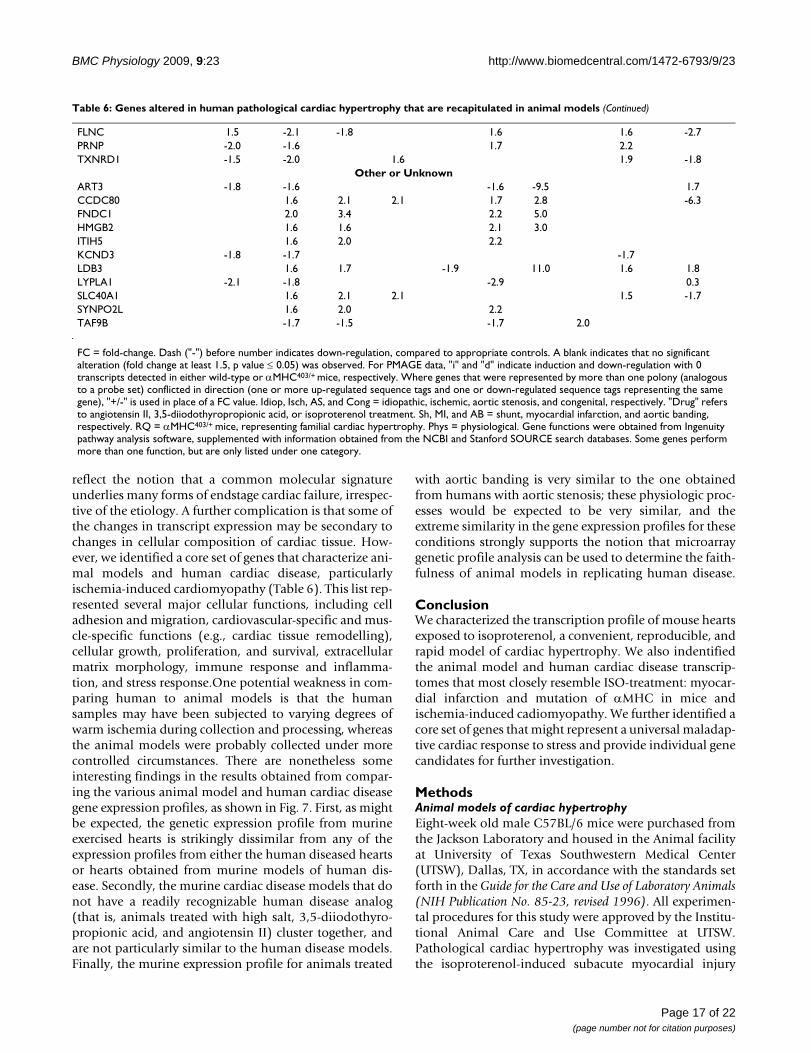
reflect the notion that a common molecular signatureunderlies many forms of endstage cardiac failure, irrespec-tive of the etiology. A further complication is that some ofthe changes in transcript expression may be secondary tochanges in cellular composition of cardiac tissue. How-ever, we identified a core set of genes that characterize ani-mal models and human cardiac disease, particularlyischemia-induced cardiomyopathy (Table 6). This list rep-resented several major cellular functions, including celladhesion and migration, cardiovascular-specific and mus-cle-specific functions (e.g., cardiac tissue remodelling),cellular growth, proliferation, and survival, extracellularmatrix morphology, immune response and inflamma-tion, and stress response.One potential weakness in com-paring human to animal models is that the humansamples may have been subjected to varying degrees ofwarm ischemia during collection and processing, whereasthe animal models were probably collected under morecontrolled circumstances. There are nonetheless someinteresting findings in the results obtained from compar-ing the various animal model and human cardiac diseasegene expression profiles, as shown in Fig. 7. First, as mightbe expected, the genetic expression profile from murineexercised hearts is strikingly dissimilar from any of theexpression profiles from either the human diseased heartsor hearts obtained from murine models of human dis-ease. Secondly, the murine cardiac disease models that donot have a readily recognizable human disease analog(that is, animals treated with high salt, 3,5-diiodothyro-propionic acid, and angiotensin II) cluster together, andare not particularly similar to the human disease models.Finally, the murine expression profile for animals treated
with aortic banding is very similar to the one obtainedfrom humans with aortic stenosis; these physiologic proc-esses would be expected to be very similar, and theextreme similarity in the gene expression profiles for theseconditions strongly supports the notion that microarraygenetic profile analysis can be used to determine the faith-fulness of animal models in replicating human disease.
ConclusionWe characterized the transcription profile of mouse heartsexposed to isoproterenol, a convenient, reproducible, andrapid model of cardiac hypertrophy. We also indentifiedthe animal model and human cardiac disease transcrip-tomes that most closely resemble ISO-treatment: myocar-dial infarction and mutation of αMHC in mice andischemia-induced cadiomyopathy. We further identified acore set of genes that might represent a universal maladap-tive cardiac response to stress and provide individual genecandidates for further investigation.
MethodsAnimal models of cardiac hypertrophyEight-week old male C57BL/6 mice were purchased fromthe Jackson Laboratory and housed in the Animal facilityat University of Texas Southwestern Medical Center(UTSW), Dallas, TX, in accordance with the standards setforth in the Guide for the Care and Use of Laboratory Animals(NIH Publication No. 85-23, revised 1996). All experimen-tal procedures for this study were approved by the Institu-tional Animal Care and Use Committee at UTSW.Pathological cardiac hypertrophy was investigated usingthe isoproterenol-induced subacute myocardial injury
FLNC 1.5 -2.1 -1.8 1.6 1.6 -2.7PRNP -2.0 -1.6 1.7 2.2TXNRD1 -1.5 -2.0 1.6 1.9 -1.8
Other or UnknownART3 -1.8 -1.6 -1.6 -9.5 1.7CCDC80 1.6 2.1 2.1 1.7 2.8 -6.3FNDC1 2.0 3.4 2.2 5.0HMGB2 1.6 1.6 2.1 3.0ITIH5 1.6 2.0 2.2KCND3 -1.8 -1.7 -1.7LDB3 1.6 1.7 -1.9 11.0 1.6 1.8LYPLA1 -2.1 -1.8 -2.9 0.3SLC40A1 1.6 2.1 2.1 1.5 -1.7SYNPO2L 1.6 2.0 2.2TAF9B -1.7 -1.5 -1.7 2.0
FC = fold-change. Dash ("-") before number indicates down-regulation, compared to appropriate controls. A blank indicates that no significant alteration (fold change at least 1.5, p value ≤ 0.05) was observed. For PMAGE data, "i" and "d" indicate induction and down-regulation with 0 transcripts detected in either wild-type or αMHC403/+ mice, respectively. Where genes that were represented by more than one polony (analogous to a probe set) conflicted in direction (one or more up-regulated sequence tags and one or down-regulated sequence tags representing the same gene), "+/-" is used in place of a FC value. Idiop, Isch, AS, and Cong = idiopathic, ischemic, aortic stenosis, and congenital, respectively. "Drug" refers to angiotensin II, 3,5-diiodothyropropionic acid, or isoproterenol treatment. Sh, MI, and AB = shunt, myocardial infarction, and aortic banding, respectively. RQ = αMHC403/+ mice, representing familial cardiac hypertrophy. Phys = physiological. Gene functions were obtained from Ingenuity pathway analysis software, supplemented with information obtained from the NCBI and Stanford SOURCE search databases. Some genes perform more than one function, but are only listed under one category.
Table 6: Genes altered in human pathological cardiac hypertrophy that are recapitulated in animal models (Continued)
Page 17 of 22(page number not for citation purposes)
BMC Physiology 2009, 9:23 http://www.biomedcentral.com/1472-6793/9/23
model as previously described [28]. Briefly, animals wereanesthetized with 1.5% isoflurane (Smiths Medical PM,Waukesha, WI) in 98.5% oxygen and a 1 cm incisionmade on the back of each animal between the shoulderblades. An Alzet 1007D micro-osmotic pump (DURECT
Corporation, Cupertino, CA) containing isoproterenol(ISO, Sigma-Aldrich, St. Louis, MO), at 40 mg.kg-1.d-1, dis-solved in 0.9% NaCl was inserted into the infrascapularsubcutaneous tissue and the incision sutured. After 10days of ISO administration, mice were sacrificed, and left
Connective tissue associated signalling network common to various cardiac hypertrophy animal models and human cardiac dis-easeFigure 6Connective tissue associated signalling network common to various cardiac hypertrophy animal models and human cardiac disease. Ingenuity Pathway Analysis software was used to identify a signalling network associated with con-nective tissue disease, overlaid with average expression data common to various animal models of cardiac hypertrophy and human cardiac diseases. Pathway Builder was then used to create a signalling pathway, based on the Ingenuity signalling net-work, Biocarta's pathway database, and literature-based associations. TGF-β, which was not identified using microarrays but might nonetheless play a non-transcriptional role in heart disease, is shown as a plausible commonly activated pathway in the human failing heart and various animal models of cardiac hypertrophy. Also shown are the various extracellular matrix proteins that were transcriptionally up-regulated in animal models and human disease, based on microarrays. Signalling pathways associ-ated with commonly down-regulated transcripts (e.g., AT1-R and EGFR) are also shown.
Page 18 of 22(page number not for citation purposes)

BMC Physiology 2009, 9:23 http://www.biomedcentral.com/1472-6793/9/23
Page 19 of 22(page number not for citation purposes)
Hierarchical cluster of a pairwise similarity matrix and ontological analysis to identify relatedness between animal models and human cardiac diseaseFigure 7Hierarchical cluster of a pairwise similarity matrix and ontological analysis to identify relatedness between ani-mal models and human cardiac disease. A similarity matrix was produced for each model or human disease type, with each pairwise comparison score calculated as the number of genes altered in the same direction (up-regulated or down-regu-lated at least 1.5-fold on average) compared to the appropriate study controls. The resulting scores were log transformed and Z scores calculated before performing hierarchical clustering using CLUSFAVOR 6.0 software (A). Bright red represents the highest pairwise similarity scores, black represents median values, and bright green represents the lowest pairwise similarity values. Each gene list was also analyzed using Ingenuity Pathway Analysis software and function categories for each animal model and human heart failure type compared (B). Functional categories shown were significantly over-represented (B-H mul-tiple hypothesis correction p value ≤ 0.05), and numbers represent the number of altered genes in that category.
Function ISO RQ AB MI Sh Ang2 Dipta Salt Isch Idiop AS Cong Disease
Cancer 120 19 36 90 17 18 12 3 124 38 40 25Hematological disease 91 4 10 39 7 14 11 - 16 5 5 Inflammatory response 64 12 4 74 3 17 6 - 41 - 6 26Immunological disease 38 4 9 42 10 9 4 - 21 - 5 3 Cardiovascular disease 22 4 11 104 7 15 7 8 23 8 9 5
Physiological System Development (D) and Function (F)
Hematological system D and F 81 14 6 68 8 20 12 - 30 28 10 - Tissue development 70 11 11 49 7 19 3 4 20 14 20 14Immune cell trafficking 66 9 2 58 - 15 8 - 20 21 5 -
Cardiovascular system D and F 52 18 15 59 4 14 8 13 23 - 22 12
Connective tissue D and F 51 4 12 38 7 11 5 4 23 10 15 4 Molecular and Cellular Functions
Cellular growth and proliferation 213 - 17 112 13 18 7 6 29 15 29 8 Cell death 185 - 8 53 12 18 9 2 82 25 29 12Cellular movement 147 22 8 101 5 16 5 2 68 14 22 8 Post-translational modification 57 2 - 29 1 1 - - 17 7 2 2 Cell-cell signaling/interaction 90 9 15 74 6 20 12 2 58 18 17 2 Overlap - 12% 16% 68% 11% 22% 11% 9% 48% 16% 19% 13%
A
B

BMC Physiology 2009, 9:23 http://www.biomedcentral.com/1472-6793/9/23
ventricles were collected and processed for subsequentassays.
Experimental physiological cardiac hypertrophy wasinduced via exercise, as previously described [29]. Briefly,mice were placed in buckets of pre-warmed water main-tained at ~30°C with low-watt heat lamps and allowed toswim for 90 minutes twice daily. At the beginning of theexperiment, mice were acclimated to the exercise routinegradually, beginning with 10 minutes twice daily andincreasing in increments of 10 minutes per day, until 90minutes was obtained. After 8 weeks of swimming, micewere sacrificed and heart samples (left ventricles unlessotherwise stated) collected and processed for each assay.Sedentary mice confined to cages served as negative con-trols.
HistologyHearts were excised from mice following euthanasia,grossly trimmed in frontal orientation, blotted free ofexcess blood and embedded in Tissue Freezing Medium(Triangle Biomedical Sciences, Durham, NC). Rapid freez-ing of embeds was achieved by partial immersion in liq-uid-nitrogen-supercooled isopentane prior to storage at -80°C. At a later time, embeds were equilibrated to -24°Cand sectioned on a Leica CM3000 cryostat (Wetzlar, Ger-many). Eight-micron slices were adhered to silanated slideglass (Superfrost Plus, Fisher Scientific, Pittsburg, PA) andair-dried. Resulting sections were stained with routinehematoxylin and eosin (H&E) for histopathological anal-ysis or with Masson trichrome to assess fibrosis. In orderto assess apoptosis, TUNEL (TdT-mediated dUTP nick endlabeling) assays were performed using the DeadEndFluorometric TUNEL System, as described by the manu-facturer (Promega Corporation, Madison, WI). Specimenswere photomicrographed in bright field on a LeicaDM2000 microscope (Wetzlar, Germany), equipped withan Optronics Microfire CCD camera (Goleta, CA). Imageacquisition was conducted using Optronics PictureFrame2.0 software (Goleta, CA) and morphometric analysis wasconducted using Image J 1.38w software (NIH, Bethesda,MD) for Macintosh computers.
MicroarraysMicroarray sample preparation and analysis was per-formed as previously described. Briefly, total RNA fromleft ventricles of experimental animals was isolated usingTRIzol Reagent (Invitrogen Corporation, Carlsbad, CA)per manufacturer's instructions and purified by phenol-chloroform extraction and ethanol precipitation. RNA (20μg) was further processed and hybridized to the Gene-Chip Mouse Genome 430 2.0 Array (Affymetrix, SantaClara, CA) by the Microarray Core Facility at University ofTexas Southwestern Medical Center per manufacturer'sinstructions. Data were analyzed using GeneSifter (VizX
Labs, Seattle, WA) and Spotfire DecisionSite 9.0 (Spotfire,Inc., Somerville, MA). Briefly, data were normalized usingrobust-multi average (RMA) method, and signals for eachgroup were averaged before performing Student's t testwith Benjamini and Hochberg correction and pairwisecomparisons for sedentary mice versus mice that receivedISO treatment or were exercised. Genes were considered asaltered if the folds-change was at least 1.5 and adjusted pvalue ≤ 0.05. Consistency was also expected, which wasassessed by performing all possible pairwise comparisonsof individual samples. A fold-change of at least 1.5 wasexpected for each replicate comparison (e.g., sedentarymouse 1 versus swimming mouse 3), and this alterationwas expected to be at least 50% greater than the fold-change derived from comparison of any two replicatesamples (e.g., sedentary mouse 1 versus sedentary mouse2). This effectively eliminated differences that might ariseas a result of natural biological variation between mice.Raw and processed data (a total of 9 arrays) were depos-ited in the Gene Expression Omnibus (GEO) online http://www.ncbi.nlm.nih.gov/geo database (AccessionGSE18801).
For comparison of our gene expression results to previousstudies, raw microarray data (CEL or text files) from miceor rats with pathological or physiological cardiac hyper-trophy induced by a variety of methods (details providedin Table 3), were downloaded from Gene ExpressionOmnibus http://www.ncbi.nlm.nih.gov/geo/. Geneexpression data from autopsied human hearts and failinghearts collected during heart transplant surgeries werealso obtained from Cardiogenomics PGA [19]. Raw datawere RMA normalized using GeneSifter (or assumed toalready be normalized if only text files were provided) andStudent's t test and pairwise comparisons subsequentlyperformed using the appropriate included controls foreach data set. A fold-change of 1.5 or greater and p value≤ 0.05 were considered as altered. The results from twoadditional studies [16,17] for which raw array data wereunavailable were also included, using the reported genelists provided in the publication or as supplementarymaterial. Likewise, supplementary pre-processed data(i.e., analyzed by original study researchers) from a studyusing a novel approach (polony multiplex analysis ofgene expression, or PMAGE), which is designed to achievea much higher level of sensitivity than traditional geneexpression microarrays, was included. PMAGE data werefiltered based on average fold-difference (= 1.5) in orderto make the data comparable to microarray-based results.However, only 10 potentially relevant genes wereexcluded due to this additional criterion.
To link our study results (i.e., gene expression profiles ofISO-treated and exercised mice) to results obtained fromthe various other animal and human studies, a perl script
Page 20 of 22(page number not for citation purposes)
BMC Physiology 2009, 9:23 http://www.biomedcentral.com/1472-6793/9/23
was written to match genes across the various lists byAccession number (for same species results) or gene sym-bol (for inter-species results comparisons). If neither theAccession number nor gene symbol matched perfectly,then the gene descriptions were compared and same iden-tify was considered if the names differed by nor more than25%. If the ISO or swim results contained more than onematch for a single data point in a published study, onlythe top three matches were recorded, with the best matchordered first. This perl script was later modified to com-pute averages for the multiple matches. This methodwould be expected to fail to indentify some homologousgenes in which there are name designation differencesbetween species (e.g., the mouse version of human IL-8 isreferred to as KC or GRO). However, our intention was togreatly minimize false positive and thus compare onlythose genes that were truly the same between the variousdata sets. To ensure that this was indeed the case, all finalgenes lists representing overlap between study results werealso manually examined and any genes that were compu-tationally misidentified subsequently removed.
Similarity matrixTo produce a similarity matrix, average fold change wascalculated for all animal model and human disease sam-ples, compared to its appropriate control after normaliza-tion (e.g. ischemic heart compared to non-diseasedautopsied heart). The two studies for which raw data wereunavailable were excluded (all samples listed in Table 3).Statistical tests were not applied, but an alteration wasonly considered if the magnitude of change was at least1.5-fold. A perl script was written to combine the resultingdata for the ~2,300 genes that were represented on allarrays using the official gene symbol as the criteria formatching the genes across platforms and species. Forgenes represented more than once on an array, the altera-tion with the highest magnitude was recorded. The fold-changes for the various similar sample sets (e.g., exercisedrodents) were averaged and a simple similarity scoringscheme applied based on the numbers of genes withsame-direction alteration (fold change at least 1.5)between each pairwise disease condition comparison.These scores were then log transformed and converted toZ scores and the resulting values clustered.
Hierarchical clusteringHierarchical clustering of genes was performed usingCluster/Treeview (Eisenlab, http://rana.lbl.gov/eisen/).For comparison for the two cardiac hypertrophy modelsused in this study (ISO-treated and swimming mice com-pared to sedentary controls), normalized signal valueswere used for clustering after Z score transformation. Thesimilarity matrix was clustered using normalized pairwisescores as described above using CLUSFAVOR 6.0 (BaylorCollege of Medicine, Houston, TX).
Real-time reverse transcriptase polymerase chain reaction (RT-PCR)Real-time reverse transcriptase (RT)-polymerase chainreaction (PCR) was performed in the iCycler iQ (Bio-Rad,Hercules, CA) using SYBR Green I dye (QIAGEN, Valen-cia, CA), as previously described [27]. Briefly, each 25-μlreaction contained 100 ng of RNA, 2.5 μl of primers(Quantitect Primer Assays; QIAGEN), 12.5 μlof SYBRGreen PCR master mix and 0.25 μl of reverse tran-scriptase. Negative controls containing water instead ofRNA were concomitantly run to confirm that the sampleswere not cross-contaminated. Targets were normalized toreactions performed using Quantitect GAPDH primers(QIAGEN), and fold change was determined using thecomparative threshold method [30].
Statistical AnalysisValues presented are expressed as mean ± S.E.M. All com-parisons between groups were performed using a one-tailed Student's t test or ANOVA. Differences were consid-ered statistically significant for p < 0.05.
Authors' contributionsCLG oversaw the project, carried out the microarray anal-ysis and subsequent interpretation of data, participated inthe mouse, histology, and real-time RT-PCR experiments,and drafted the manuscript. MAS aided in experimentaldesign, data interpretation, and manuscript preparationand also provided medical expertise. ME carried out theinitial animal experiments and participated in subsequentsample collection. LDO participated in microarray resultsinterpretation, experimental design, and sample process-ing. DAW performed animal surgeries, exercised mice,took animal readings, and collected animal samples. JLperformed histology, real-time RT-PCR, and cell areacounts. JFM assisted with histology, data interpretation,and manuscript preparation. LJM wrote and utilized com-puter scripts for analysis of previously published arraydata. TQP participated in animal experiments and tookanimal readings. NMK participated in the interpretationof experimental results and in editing of the manuscript.HRG participated in the design and coordination of thestudy and helped to draft the manuscript. All authors readand approved the final manuscript.
Additional material
Additional file 1Supplementary Table 1 (Gene expression alterations in mice after ISO-treatment or exercise via swimming). The file provided is an Excel format that includes gene IDs, gene names and symbols, biological func-tions, fold-changes, statistical values.Click here for file[http://www.biomedcentral.com/content/supplementary/1472-6793-9-23-S1.XLS]
Page 21 of 22(page number not for citation purposes)
BMC Physiology 2009, 9:23 http://www.biomedcentral.com/1472-6793/9/23
Publish with BioMed Central and every scientist can read your work free of charge
"BioMed Central will be the most significant development for disseminating the results of biomedical research in our lifetime."
Sir Paul Nurse, Cancer Research UK
Your research papers will be:
available free of charge to the entire biomedical community
peer reviewed and published immediately upon acceptance
cited in PubMed and archived on PubMed Central
yours — you keep the copyright
Submit your manuscript here:http://www.biomedcentral.com/info/publishing_adv.asp
BioMedcentral
AcknowledgementsThis work was funded by the P.O'B. Montgomery Distinguished Chair and the Hudson Foundation. Cristi L. Galindo received support from an NIH cardiology fellowship, Cardiology Department, University of Texas South-western Medical Center. John M. Shelton from the Department of Cardiol-ogy Molecular Pathology Core, University of Texas Southwestern Medical Center, Dallas TX, provided technical expertise for this project.
References1. Catalucci D, Latronico MV, Ellingsen O, Condorelli G: Physiological
myocardial hypertrophy: how and why? Front Biosci 2008,13:312-324.
2. McMullen JR, Jennings GL: Differences between pathological andphysiological cardiac hypertrophy: novel therapeutic strate-gies to treat heart failure. Clin Exp Pharmacol Physiol 2007,34(4):255-262.
3. Schocken DD, Arrieta MI, Leaverton PE, Ross EA: Prevalence andmortality rate of congestive heart failure in the UnitedStates. J Am Coll Cardiol 1992, 20(2):301-306.
4. Heineke J, Molkentin JD: Regulation of cardiac hypertrophy byintracellular signalling pathways. Nat Rev Mol Cell Biol 2006,7(8):589-600.
5. Barry SP, Davidson SM, Townsend PA: Molecular regulation ofcardiac hypertrophy. Int J Biochem Cell Biol 2008,40(10):2023-2039.
6. Hasenfuss G: Animal models of human cardiovascular disease,heart failure and hypertrophy. Cardiovasc Res 1998, 39(1):60-76.
7. Balakumar P, Singh AP, Singh M: Rodent models of heart failure.J Pharmacol Toxicol Methods 2007, 56(1):1-10.
8. Schwartz SM, Duffy JY, Pearl JM, Nelson DP: Cellular and molecu-lar aspects of myocardial dysfunction. Crit Care Med 2001,29(10 Suppl):S214-219.
9. Tan FL, Moravec CS, Li J, Apperson-Hansen C, McCarthy PM, YoungJB, Bond M: The gene expression fingerprint of human heartfailure. Proc Natl Acad Sci USA 2002, 99(17):11387-11392.
10. Huang X, Pan W, Grindle S, Han X, Chen Y, Park SJ, Miller LW, HallJ: A comparative study of discriminating human heart failureetiology using gene expression profiles. BMC Bioinformatics2005, 6:205.
11. Exercised induced hypertrophy [http://cardiogenomics.med.harvard.edu/groups/proj1/pages/swim_home.html]
12. Strom CC, Aplin M, Ploug T, Christoffersen TE, Langfort J, Viese M,Galbo H, Haunso S, Sheikh SP: Expression profiling reveals differ-ences in metabolic gene expression between exercise-induced cardiac effects and maladaptive cardiac hypertro-phy. Febs J 2005, 272(11):2684-2695.
13. Gene expression profile induced by moderate physical exer-cise in heart left ventricles in rat [http://www.ncbi.nlm.nih.gov/geo/query/acc.cgi?acc=GSE7640]
14. Kong SW, Bodyak N, Yue P, Liu Z, Brown J, Izumo S, Kang PM:Genetic expression profiles during physiological and patho-logical cardiac hypertrophy and heart failure in rats. PhysiolGenomics 2005, 21(1):34-42.
15. Bye A, Langaas M, Hoydal MA, Kemi OJ, Heinrich G, Koch LG, BrittonSL, Najjar SM, Ellingsen O, Wisloff U: Aerobic capacity-depend-ent differences in cardiac gene expression. Physiol Genomics2008, 33(1):100-109.
16. Diffee GM, Seversen EA, Stein TD, Johnson JA: Microarray expres-sion analysis of effects of exercise training: increase in atrialMLC-1 in rat ventricles. Am J Physiol Heart Circ Physiol 2003,284(3):H830-837.
17. Iemitsu M, Maeda S, Miyauchi T, Matsuda M, Tanaka H: Geneexpression profiling of exercise-induced cardiac hypertrophyin rats. Acta Physiol Scand 2005, 185(4):259-270.
18. Geisterfer-Lowrance AA, Christe M, Conner DA, Ingwall JS, SchoenFJ, Seidman CE, Seidman JG: A mouse model of familial hyper-trophic cardiomyopathy. Science 1996, 272(5262):731-734.
19. Genomics of Cardiovascular Development, Adaptation, andRemodeling. NHLBI Program for Genomic Applications,Harvard Medical School [http://www.cardiogenomics.org]
20. Zhao M, Chow A, Powers J, Fajardo G, Bernstein D: Microarrayanalysis of gene expression after transverse aortic constric-tion in mice. Physiol Genomics 2004, 19(1):93-105.
21. Mirotsou M, Dzau VJ, Pratt RE, Weinberg EO: Physiologicalgenomics of cardiac disease: quantitative relationshipsbetween gene expression and left ventricular hypertrophy.Physiol Genomics 2006, 27(1):86-94.
22. Strom CC, Kruhoffer M, Knudsen S, Stensgaard-Hansen F, JonassenTE, Orntoft TF, Haunso S, Sheikh SP: Identification of a core setof genes that signifies pathways underlying cardiac hypertro-phy. Comp Funct Genomics 2004, 5(6-7):459-470.
23. Bisping E, Ikeda S, Kong SW, Tarnavski O, Bodyak N, McMullen JR,Rajagopal S, Son JK, Ma Q, Springer Z, et al.: Gata4 is required formaintenance of postnatal cardiac function and protectionfrom pressure overload-induced heart failure. Proc Natl AcadSci USA 2006, 103(39):14471-14476.
24. Transcriptomic analysis of PPARalpha-dependent altera-tions during cardiac hypertrophy [http://www.ncbi.nlm.nih.gov/geo/query/acc.cgi?acc=GSE12337]
25. Changes in cardiac transcription profiles brought about byheart failure [http://cardiogenomics.med.harvard.edu/groups/proj1/pages/swim_home.html]
26. El-Demerdash E, Awad AS, Taha RM, El-Hady AM, Sayed-Ahmed MM:Probucol attenuates oxidative stress and energy decline inisoproterenol-induced heart failure in rat. Pharmacol Res 2005,51(4):311-318.
27. Errami M, Galindo CL, Tassa AT, Dimaio JM, Hill JA, Garner HR:Doxycycline attenuates isoproterenol- and transverse aorticbanding-induced cardiac hypertrophy in mice. J Pharmacol ExpTher 2008, 324(3):1196-1203.
28. Rona G, Chappel CI, Balazs T, Gaudry R: An infarct-like myocar-dial lesion and other toxic manifestations produced by iso-proterenol in the rat. AMA Arch Pathol 1959, 67(4):443-455.
29. Evangelista FS, Brum PC, Krieger JE: Duration-controlled swim-ming exercise training induces cardiac hypertrophy in mice.Braz J Med Biol Res 2003, 36(12):1751-1759.
30. Livak KJ, Schmittgen TD: Analysis of relative gene expressiondata using real-time quantitative PCR and the 2(-Delta DeltaC(T)) Method. Methods 2001, 25(4):402-408.
31. Kim JB, Porreca GJ, Song L, Greenway SC, Gorham JM, Church GM,Seidman CE, Seidman JG: Polony multiplex analysis of geneexpression (PMAGE) in mouse hypertrophic cardiomyopa-thy. Science 2007, 316(5830):1481-1484.
Page 22 of 22(page number not for citation purposes)
http://www.ncbi.nlm.nih.gov/entrez/query.fcgi?cmd=Retrieve&db=PubMed&dopt=Abstract&list_uids=1634664
http://www.ncbi.nlm.nih.gov/entrez/query.fcgi?cmd=Retrieve&db=PubMed&dopt=Abstract&list_uids=1634664
http://www.ncbi.nlm.nih.gov/entrez/query.fcgi?cmd=Retrieve&db=PubMed&dopt=Abstract&list_uids=1634664
http://www.ncbi.nlm.nih.gov/entrez/query.fcgi?cmd=Retrieve&db=PubMed&dopt=Abstract&list_uids=9764190
http://www.ncbi.nlm.nih.gov/entrez/query.fcgi?cmd=Retrieve&db=PubMed&dopt=Abstract&list_uids=9764190
http://www.ncbi.nlm.nih.gov/entrez/query.fcgi?cmd=Retrieve&db=PubMed&dopt=Abstract&list_uids=8614836
Related Documents