Transceiver Performance & Evolution of lab testing Rob Sherwood NCØB Change has occurred in jumps, sometimes better, but often worse for a time Sherwood Engineering

Transceiver Performance & Evolution of lab testing Rob Sherwood NC Ø B Change has occurred in jumps, sometimes better, but often worse for a time Sherwood.
Dec 17, 2015
Welcome message from author
This document is posted to help you gain knowledge. Please leave a comment to let me know what you think about it! Share it to your friends and learn new things together.
Transcript

Transceiver Performance &
Evolution of lab testing
Rob SherwoodNCØB
Change has occurred in jumps, sometimes better, but often worse for a time
Sherwood Engineering
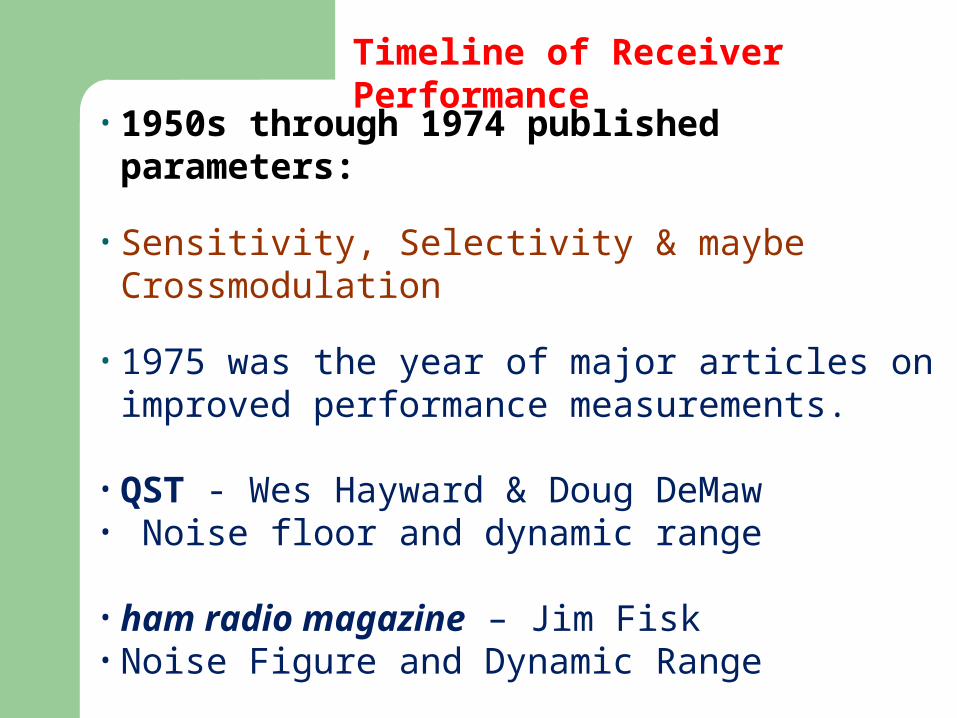
• 1950s through 1974 published parameters:
• Sensitivity, Selectivity & maybe Crossmodulation
• 1975 was the year of major articles on improved performance measurements.
• QST - Wes Hayward & Doug DeMaw• Noise floor and dynamic range
• ham radio magazine – Jim Fisk • Noise Figure and Dynamic Range
Timeline of Receiver Performance

1976 I started testing receivers – Why?
• Drake R-4C received a good review in QST, but
• The receiver was a total flop in 160 meter CW contests.
• i.e. failed Contest 101

What did this conflict imply?
A receiver is what it is. If the test = good
But on-air performance = poor
This implies the receiver isn’t being tested properly.
Testing has to approximate crowded conditions such as:
CQ Worldwide
ARRL DX
WPX
DXpedition with the whole world calling !

Is Noise Floor / Sensitivity the Issue ?
Collins 75A-4 -141 dBm 1954 Hilberling -141 dBm Flex 3000 -139 dBm Drake R-4C -138 dBm 1973 Elecraft K3 -138 dBm TS-990S -138 dBm TS-590S -137 dBm Flex 5000 -135 dBm FTdx-5000D -135 dBm Orion II -133 dBm T-T Eagle -132 dBm
Numbers with Preamp-1 ON

Low noise floor only useful in a quiet rural location
Urban noise level typically 20 dB worse

I am on the market for a new tranceiver and I live in a very noisy area. I am looking to buy the best possible receiver for the money
So the FTDX-5000D is out of my price range and I do not need all the bells and whistles.
I operate with a Solid State linear and because of the ALC overshoot, the TS-590S is ruled out.
Your comments would be very much appreciated.
Best Regards73Yves-Claude Arcand -- VE2AYX
What Yves needs is antenna directivity to reduce his noise
E-mail August 9, 2013
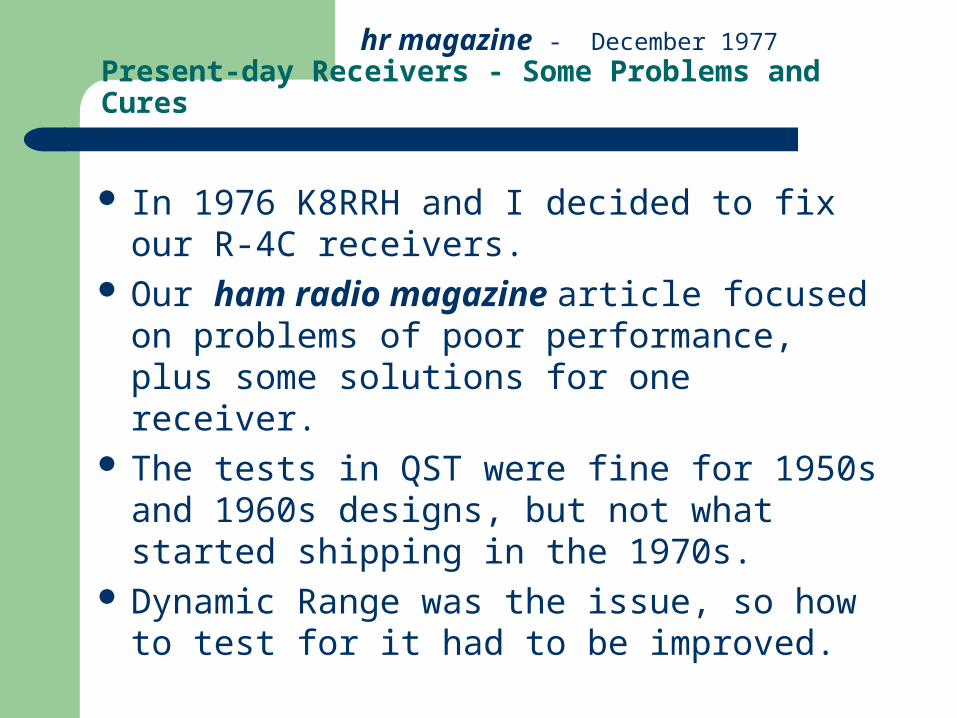
Present-day Receivers - Some Problems and Cures
In 1976 K8RRH and I decided to fix our R-4C receivers.
Our ham radio magazine article focused on problems of poor performance, plus some solutions for one receiver.
The tests in QST were fine for 1950s and 1960s designs, but not what started shipping in the 1970s.
Dynamic Range was the issue, so how to test for it had to be improved.
hr magazine - December 1977

What is Third-order Dynamic Range?
The range measured in dB of very strong signals to very weak signals the receiver can handle “At The Same Time” without causing internal spurious.
What is Close-in Dynamic Range vs.
Wide-Spaced Dynamic Range?
Close-in Dynamic very important in a CW pile-up
In an SSB contest/pile-up, transmitted splatter from a signal 3-kHz away is usually the limit, not the receiver.

Third Order IMD to Measure Dynamic Range
Signal Signal
IMD IMD
X kHz spacing
X kHz spacing X kHz spacing

What changed & how to measure properly?
Radios started having wide roofing filters with the real selectivity way down stream.
R-4C, any Up-Conversion radio such as: TR-7, IC-751a, FT-2000, TS-2000, IC-756 Up-Conversion is all we had for over 20
years from about 1979 to 2003 QST only tested third-order dynamic range
(DR3) at 20 kHz spacing for decades. The whole radio has to be tested, not just the
front end.

Wide & Close Dynamic Range
20 kHz Spacing 2 kHz Spacing
First IF Filter at 70.455 MHz
IMD 20 kHz Away
15 kHz Wide
First IF Filter at 70.455 MHz
IMD 2 kHz Away
15 kHz Wide
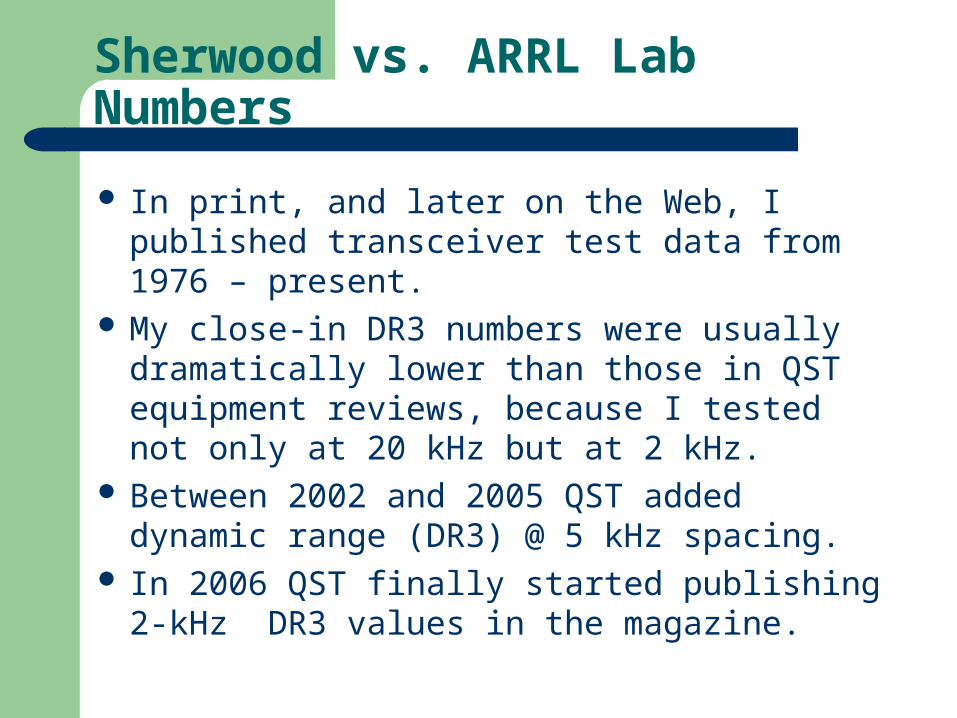
Sherwood vs. ARRL Lab Numbers
In print, and later on the Web, I published transceiver test data from 1976 – present.
My close-in DR3 numbers were usually dramatically lower than those in QST equipment reviews, because I tested not only at 20 kHz but at 2 kHz.
Between 2002 and 2005 QST added dynamic range (DR3) @ 5 kHz spacing.
In 2006 QST finally started publishing 2-kHz DR3 values in the magazine.
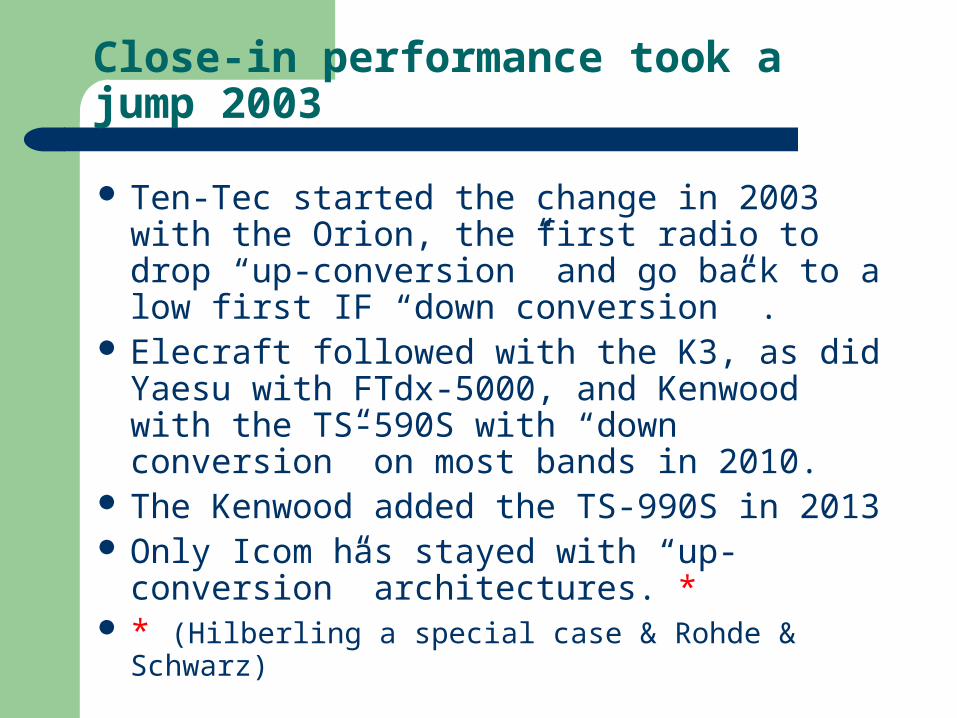
Close-in performance took a jump 2003
Ten-Tec started the change in 2003 with the Orion, the first radio to drop “up-conversion” and go back to a low first IF “down conversion” .
Elecraft followed with the K3, as did Yaesu with FTdx-5000, and Kenwood with the TS-590S with “down conversion” on most bands in 2010.
The Kenwood added the TS-990S in 2013 Only Icom has stayed with “up-conversion”
architectures. * * (Hilberling a special case & Rohde & Schwarz)

When are 2 Out of Pass Band Signals a Problem?
• If you know the close-in dynamic range of a radio, at what signal level will IMD start to be a problem?
• S Meter standard is S9 = 50 V, which is –73 dBm
• Assume a typical radio: 500 Hz CW filter Noise Floor of -128 dBm Preamp OFF
Dynamic Range Signal Level Causing IMD = Noise Floor55 dB S9 FT-757 (56 dB)60 dB S9 + 5 dB FT-2000 (61 dB)65 dB S9 + 10 dB IC-7000 (63 dB)70 dB Typical Up-conversion S9 + 15 dB 1000 MP / Mk V Field (68 / 69 dB)75 dB S9 + 20 dB 756 Pro II / III (75 dB)80 dB S9 + 25 dB Omni-VII / IC-7800 (80 dB)85 dB S9 + 30 dB TS-590S (88 dB)90 dB S9 + 35 dB Eagle & Flex 3K (90 dB)95 dB S9 + 40 dB Orion II, K3, Flex 5000A
100 dB S9 + 45 dB FTdx-5000, Hilberling PT-8000A

Dynamic Range of Top 10 Transceivers
Hilberling 105 dB FTdx-5000D 101 dB Flex 5000 96 dB Elecraft K3 95 dB Orion II 95 dB TT Argonaut 92 dB TT Eagle 90 dB Flex 3000 90 dB TS-590S 88 dB (Low Freq 1st IF mode) TS-990S 85 to 98 dB (17m, 30 meters) Collins75A-4 62 dB @ 5 kHz (for
comparison)
Close-in 2-kHz Test @ 500 Hz BW
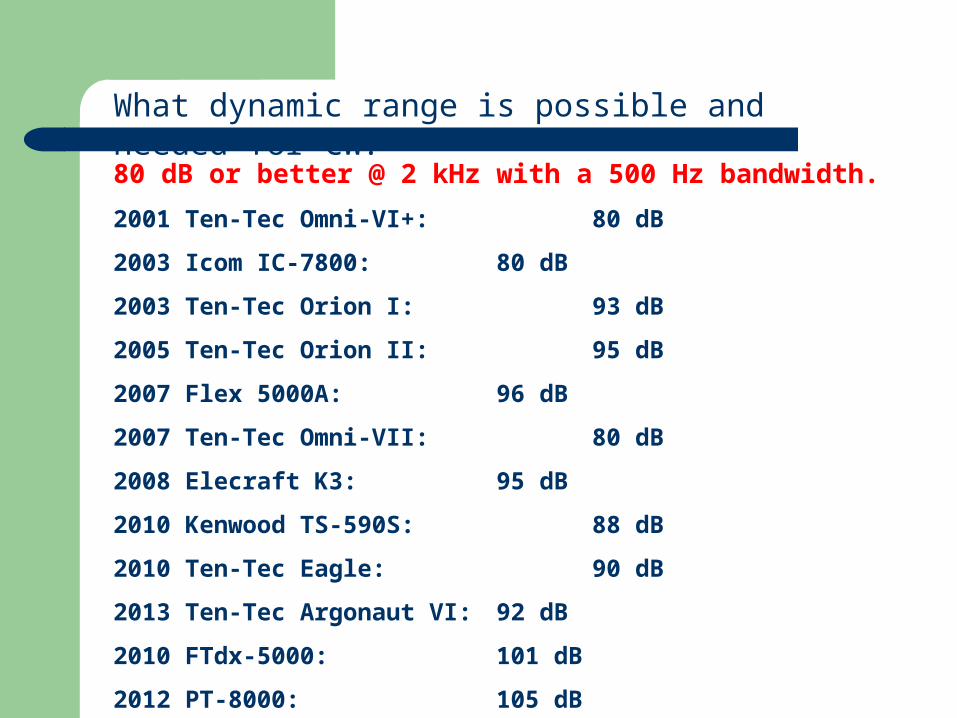
80 dB or better @ 2 kHz with a 500 Hz bandwidth.
2001 Ten-Tec Omni-VI+: 80 dB
2003 Icom IC-7800: 80 dB
2003 Ten-Tec Orion I: 93 dB
2005 Ten-Tec Orion II: 95 dB
2007 Flex 5000A: 96 dB
2007 Ten-Tec Omni-VII: 80 dB
2008 Elecraft K3: 95 dB
2010 Kenwood TS-590S: 88 dB
2010 Ten-Tec Eagle: 90 dB
2013 Ten-Tec Argonaut VI: 92 dB
2010 FTdx-5000: 101 dB
2012 PT-8000: 105 dB
What dynamic range is possible and needed for CW?
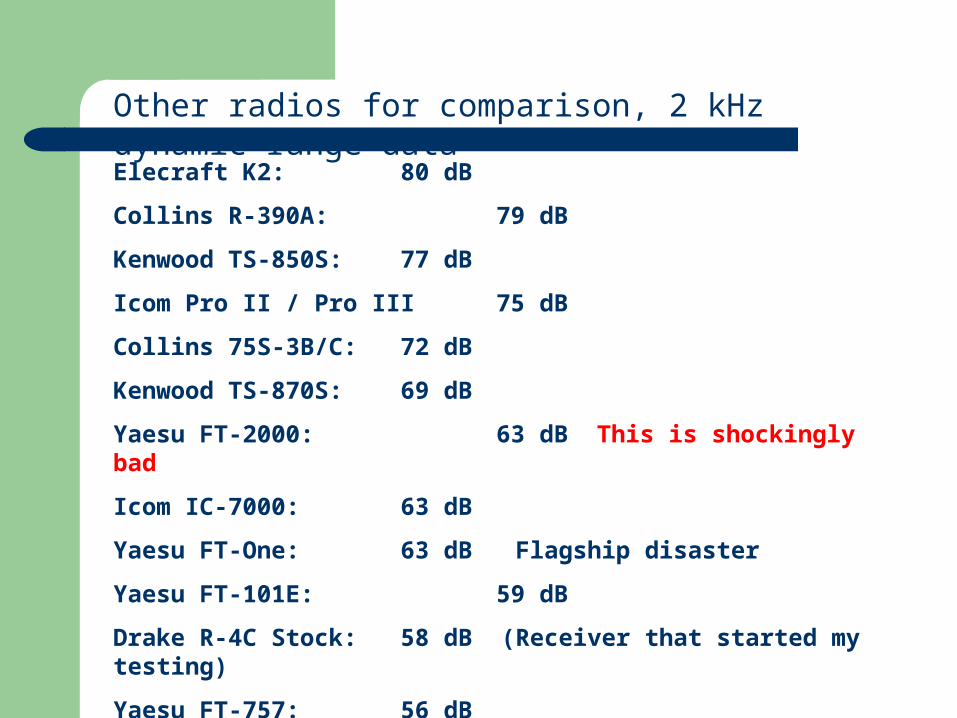
Elecraft K2: 80 dB
Collins R-390A: 79 dB
Kenwood TS-850S: 77 dB
Icom Pro II / Pro III 75 dB
Collins 75S-3B/C: 72 dB
Kenwood TS-870S: 69 dB
Yaesu FT-2000: 63 dB This is shockingly bad
Icom IC-7000: 63 dB
Yaesu FT-One: 63 dB Flagship disaster
Yaesu FT-101E: 59 dB
Drake R-4C Stock: 58 dB (Receiver that started my testing)
Yaesu FT-757: 56 dB
Yaesu VR-5000: 49 dB Worst radio I have ever tested !
Other radios for comparison, 2 kHz dynamic range data

Sherwood Lab in Denver

The first synthesizers mediocre
Synthesizers offered: Virtually no drift All bands and general coverage
On the down side: Poorer phase noise on receiver & transmit Band crystals and PTOs were gone, but with
them quiet LOs
Modern DDS has greatly improved phase noise

R-4C Phase noise Xtals vs. FS-4
Example of an early all band synthesizer
Offset Band Xtals FS-4 2.5 kHz -135 dBc/Hz -113 dBc/Hz 5.0 kHz -144 dBc/Hz -112 dBc/Hz 40 kHz > -150 dBc/Hz -144 dBc/Hz

Testing got complicated again
In 2006 the League and I were “on the same page” and published close-in 2-kHz dynamic range as either 3rd-order limited (DR3) or “phase noise limited”.
In 2007 the ARRL lab and my testing diverged again.
Now you had to decide what the numbers meant for your type of operating.

Strange ARRL DR3 Numbers
Many modern transceivers are phase noise limited, particularly close-in at 2 kHz.
The League wanted be able to measure the IMD buried in the phase noise, and came up with a new method a in 2007 using a spectrum analyzer with a 3-Hz or 1-Hz filter.
(QST – October 2007 - Sidebar)
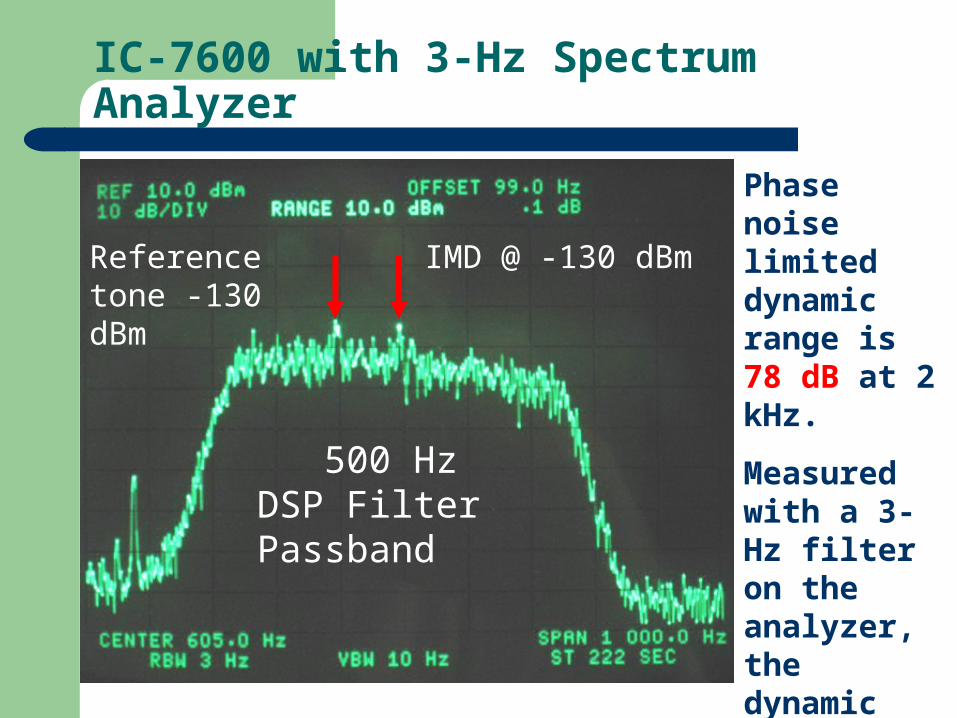
IC-7600 with 3-Hz Spectrum Analyzer
Phase noise limited dynamic range is 78 dB at 2 kHz.
Measured with a 3-Hz filter on the analyzer, the dynamic range is 87 dB at 2 kHz!
IMD @ -130 dBmReference tone -130 dBm
500 Hz DSP Filter Passband

ARRL / Sherwood Testing Compromise
From 1976s through 2006 the ARRL and I tested radios in a 500 Hz bandwidth. Worst case data was published whether a radio was third-order Intermod Dynamic Range Limited (DR3) or Phase Noise (reciprocal mixing) limited.
Between 2007 – 2011 the League virtually took the effect of synthesizer phase noise out of the picture by making dynamic range measurements with a spectrum analyzer and a 1 Hz filter bandwidth.
While this measurement is technically accurate, the data usually had little correlation to how the radio performed on the air. It also eliminated the incentive for the OEMs to improve their synthesizers.
In the Fall of 2011, with the help of Adam Farson, VA7OJ, the League agreed to emphasize Reciprocal Mixing Dynamic Range (RMDR).

New Graphic for RMDR, IC-9100 Review
QST April
2012 P. 54
From a practical stand point, the 77 dB value is the limit on the air, not the 87 dB value.

IC-9100 RMDR Table Data QST 4/2012
In a CW pile-up, the reciprocal mixing limitation is more of an issue (77 dB) than if the QRM was up or down the band 20 kHz (101 dB)
Bob clearly explains importance RMDR
Note how reciprocal mixing relates to the two-tone third order DR figures, especially at 5 and 2 kHz spacing. A single, strong adjacent signal 5 or 2 kHz from the desired signal with resulting reciprocal mixing has a greater impact on your ability to hear a desired weak signal than do two strong signals 5 and 10 kHz away (5 kHz spacing) or 2 and 4 kHz away (2 kHz spacing) with a resulting intermodulation distortion (IMD) product that covers up the desired signal. In many cases, reciprocal mixing dynamic range is the primary limiting factor of a receiver’s performance. -Bob Allison, WB1GCM, ARRL Laboratory Engineer

Elecraft KX3 December QST 2012
For some reason, the next HF transceiver review lost the RMDR graphic, but the reciprocal mixing data was published.
Third order dynamic range at 5 kHz, QST = 103 dB Note: Phase noise is 16 dB better than the third order dynamic range.This is the best phase noise ever published in QST for an amateur transceiver !
FTdx-3000 QST Review April 2013
Concerns: The RMDR Graphic is missing again. The table data is there, but not emphasized Third-Order Dyanmic Range with 1 Hz testing
method = 100 dB @ 2 kHz RMDR @ 2 kHz = 82 dB !
Not discussed in the review that RMDR is 18 dB worse than the third order value of 100 dB!
The 100 dB number is meaningless on the air.
How to sort the wheat from the chaff
The problem for the less technical amateur is how to sort out the data if one is considering advertised or ARRL lab values in making a purchasing choice.
Bob Allison (ARRL Lab Engineer) clearly stated that RMDR is often “the primary limiting factor in receiver performance”.
Since the RMDR graphic in QST was published only once in 2012, this data is easily overlooked.
Argonaut VI review in August 2013 QST didn’t even publish RMDR tabular data, let alone the graphic.
Testing the TS-990S
The wide-spaced DR3 of the TS-990S is 111 dB, highest I have ever measured!
However: Close-in, the RMDR value varies from 85 to
98, depending on band. If measured with a 1-Hz filter, the DR3 is up to
26 dB better than the real RMDR limited value. (The LO is significantly better at 5 & 10 kHz)

On SSB you would prefer DR3 = 75 dB, or more.
On CW you would prefer DR3 = 85 dB, or more.
This is most economically accomplished with low IF (5 to 9 MHz) selectable crystal roofing filters.
It is much more difficult to deliver 80 dB or higher DR3 with the more common Up-Conversion design.
There are trade-offs with a low IF design.
Transmitted bandwidth of the interfering signal is often the limit, not the receiver.
Just the Facts

There are many factors to consider
Today I have talked about dynamic range, particularly for CW ops.
There are many other factors that are important.
For my Contest University 2013 presentation see this link:
http://www.youtube.com/watch?v=SOf2OOGeGi8
This can be found with a Google search of:
rob sherwood contest university 2013 youtube
There are 10 presentations in all for your enjoyment.
I may be contacted at [email protected]

Sherwood Engineering
http://www.sherwood-engineering.com
http://www.NC0B.com
Related Documents