Citywide Affordable Housing Loan Committee San Francisco Mayor’s Office of Housing and Community Development Department of Homelessness and Supportive Housing Office of Community Investment and Infrastructure Controller’s Office of Public Finance Transbay Block 2 West $3,500,000 Predevelopment Loan Evaluation of Request for: Predevelopment Loan Loan Committee Date: February 19, 2021 Prepared By: Annie Wong Source of Funds Recommended: Transbay Jobs/Housing Linkage Fees NOFA/PROGRAM/RFP: OCII RFP issued June 22, 2020 FY 20/21 ROPS Line: 413 Total Previous City Funds Committed: None Applicant/Sponsor Name: Transbay 2 Senior LP/Chinatown Community Development Center (“CCDC”)

Welcome message from author
This document is posted to help you gain knowledge. Please leave a comment to let me know what you think about it! Share it to your friends and learn new things together.
Transcript

Citywide Affordable Housing Loan Committee San Francisco Mayor’s Office of Housing and Community Development
Department of Homelessness and Supportive Housing Office of Community Investment and Infrastructure
Controller’s Office of Public Finance
Transbay Block 2 West $3,500,000
Predevelopment Loan
Evaluation of Request for: Predevelopment Loan Loan Committee Date: February 19, 2021 Prepared By: Annie Wong
Source of Funds Recommended: Transbay Jobs/Housing Linkage Fees NOFA/PROGRAM/RFP: OCII RFP issued June 22, 2020 FY 20/21 ROPS Line: 413Total Previous City Funds Committed: None Applicant/Sponsor Name: Transbay 2 Senior LP/Chinatown
Community Development Center (“CCDC”)

Evaluation of Request for Predevelopment Financing February 19, 2021 Transbay Block 2 West Page 2 of 38
EXECUTIVE SUMMARY
Sponsor Information:
Project Name: Transbay Block 2 West Sponsor(s): CCDC
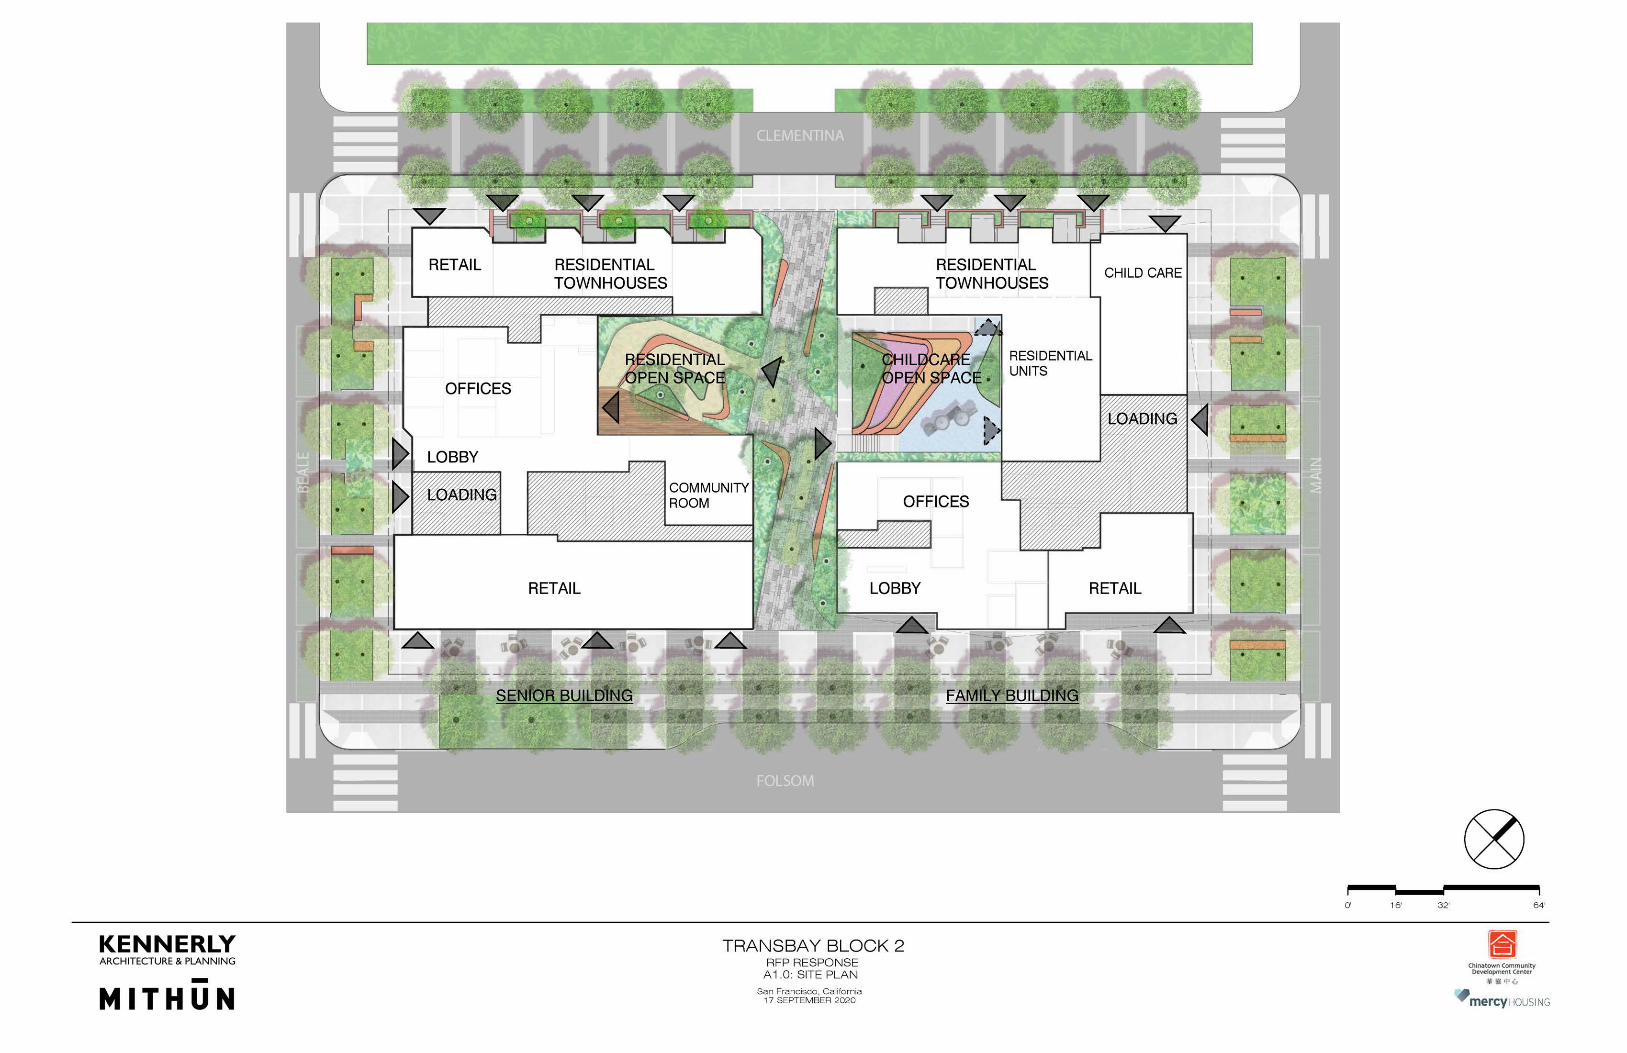
Project Address (w/ cross st): Western half Transbay Block 2 (bounded by Folsom Street to the south, Beale Street to the west, the future extension of Clementina Street to the north, and Main Street to the east)
Ultimate Borrower Entity: Transbay 2 Senior LP
Project Summary:
Chinatown Community Development Center (“CCDC” or the “Sponsor”), through Transbay 2 Senior LP, is requesting $3,500,000 in predevelopment financing for Transbay Block 2 West (“Block 2 West”). Block 2 West will be a 153-unit mixed-use affordable rental housing development serving low-income senior households, with approximately 20% of units set-aside to serve formerly homeless senior households, subsidized by the Local Operating Subsidy Program (“LOSP”).
Block 2 West will be comprised of 35 studio and 117 one-bedroom units, as well as one two-bedroom manager’s unit. Units will serve senior households at a wide range of income levels, with an average at or below 60% of Area Median Income as defined by the San Francisco Mayor’s Office of Housing and Community Development (“SF AMI” or “AMI”). In addition to residential units and resident serving amenities, the Block 2 West development includes ground floor retail (the residential and the retail together are the “Project”).
Block 2 West will be developed in coordination with Transbay Block 2 East (“Block 2 East”), a mixed-use affordable rental project serving low-income and formerly homeless families under development by Mercy Housing (“Mercy”). CCDC and Mercy will work closely to coordinate design and construction and maximize efficiencies to the extent feasible, including joint consultant selection, a single general contractor, shared site studies, and, if possible, concurrent construction.
The Project is expected to be financed with 4% Low Income Housing Tax Credits and will seek funding from the California Department of Housing and Community Development Infill Infrastructure Grant (“IIG”) program and Multifamily Housing Program (“MHP”), as well as the Federal Home Loan Bank Affordable Housing Program (“AHP”).
Project Description:
Construction Type: Type I Project Type: New Construction
Number of Stories: 9 Lot Size (acres and sf): 0.49 acres / 21,313 sf*
Number of Units: 153 Architect: Mithun
Total Residential Area: 81,521 sf General Contractor: TBD
Total Commercial Area: 4,320 sf Property Manager: CCDC
Total Building Area: 116,083 sf Supervisor and District: Sup. Haney - District 6
Land Owner: OCII
Total Development Cost (TDC): $96,818,138 Total Acquisition Cost: N/A
TDC/unit: $632,798 TDC less land cost/unit: $632,798
Loan Amount Requested: $3,500,000 Request Amount / unit: $22,876
HOME Funds? No Parking None
* Lot size reflects half of overall Transbay Block 2 site, exact lot dimensions between Blocks 2 East and West will be determined during predevelopment.

Evaluation of Request for Predevelopment Financing February 19, 2021 Transbay Block 2 West Page 3 of 38
PRINCIPAL DEVELOPMENT ISSUES
1. Coordination between 2 West and 2 East. Mercy and CCDC were selected as co-developers under a single RFP for Transbay Blocks 2 East and 2 West. Mercy will be the lead developer, however, each developer will take primary responsibility for their respective project (as the sole owner). See Section 1.2 for and Conditions 11.2.1 and 11.3.1. Key considerations include:
a. Cohesive design: the building and streetscape designs must be complementary and cohesive, especially the ground level experience. This will require extensive collaboration throughout predevelopment and construction;
b. Efficiency: the developers will work closely to identify and maximize efficiencies, which will include jointly selecting key consultants, using the same general contractor, and coordinating logistics, and, to the extent feasible, synchronizing construction timing; and
c. Schedule: Blocks 2 East and West currently assume a schedule with the same construction timelines. Concurrent construction would reduce hard costs, streamline logistics, and allow key streetscape elements to be delivered along with the mixed-use buildings. However, maintaining parallel schedules will be challenging due to the uncertainty in securing financing awards. The developers will coordinate project schedules and, if necessary, establish a plan for phased development.
2. Financing Competition. The Sponsor will seek funding from MHP and IIG, as well as a tax-exempt bond allocation from CDLAC. Financing programs are currently highly competitive and the bond program is expected to continue to be oversubscribed in the coming years. CDLAC regulations may change prior to the Project’s anticipated application date, but may continue to disadvantage larger scale, higher cost urban infill projects. The Sponsor will need to closely monitor financing program regulations and review program elements and costs throughout to optimize for maximum scoring. See Section 6.5 and Condition 11.3.8.
3. Income Levels. The preliminary AMI mix provides units at wide range of levels from 25% to 80% AMI. Early in predevelopment, the Sponsor will verify the demand for senior units at 80% AMI and will be challenged to balance cash flow to ensure long term operational strength with the need to serve seniors with limited fixed incomes. See Sections 4.7 and 7.2 and Condition 11.3.4.
4. Resident Age Limits. The OCII RFP anticipated a senior household age minimum of 62 years, however, a lower age limit would provide the Department of Homelessness and Supportive Housing (“HSH”) with greater flexibility in referring adult tenants to the Project through the Coordinated Entry System. The Sponsor will review financing and operational considerations, as well as fair housing implications, and recommend a minimum age limit. See Section 4.7 and Condition 11.3.3.
5. Retail. Successful retail is crucial to ground floor activation and meeting community needs and expectations. Mercy, through its affiliate Mercy Commercial California, will be responsible for developing a retail program for all of Transbay Block 2. Current restrictions due to COVID-19 and the related economic uncertainty will create a challenging environment in which to design, program, and secure interest in a new retail space. See Section 4.5 for further discussion and Condition 11.3.11.

Evaluation of Request for Predevelopment Financing February 19, 2021 Transbay Block 2 West Page 4 of 38
SOURCES AND USES SUMMARY
Predevelopment Sources Amount Terms Status OCII $3,500,000 3 years @ 3% deferred This Request Total $3,500,000
Predevelopment Uses Amount Per Unit Per SF Architecture & Engineering $2,351,818 $15,371 $20
Soft Costs $598,182 $3,909 $5 Developer Fee $550,000 $3,595 $5 Total $3,500,000 $22,875 $30
Permanent Sources Amount Terms Status
Tax Credit Equity $35,024,963 $0.90/credit, 4% credit rate Not Committed
OCII Loan $30,593,17555 years @ 0-3% interest, residual
receiptsNot Committed
AHP $1,200,000 55 years @ 0% Not Committed
HCD MHP $20,000,000 55 years @ .42%, residual receipts Not Committed
HCD IIG $7,000,000 Grant Not Committed GP Equity $3,000,000 Not Committed Total $96,818,138
Permanent Uses Amount Per Unit Per SF Acquisition $0 N/A N/AHard Costs $78,574,411 $513,558 $677 Soft Costs $13,043,727 $82,253 $112 Developer Fee $5,200,000 $33,987 $45 Total $96,818,138 $632,798 $834

Evaluation of Request for Predevelopment Financing February 19, 2021 Transbay Block 2 West Page 5 of 38
1. BACKGROUND 1.1. Project History Leading to This Request.
Blocks 2 East and West are part of the approximately 40-acre Transbay Redevelopment Project Area that was administered by the former San Francisco Redevelopment Agency (“SFRA”). Pursuant to state law, redevelopment agencies throughout the State of California were eliminated on February 1, 2012 (California Health and Safety Code Section 34161 et seq (the “Redevelopment Dissolution Law”)). OCII is the Successor Agency to SFRA and is responsible for implementing SFRA’s enforceable obligations. On April 15, 2013, the California Department of Finance determined “finally and conclusively” that the Transbay Implementation Agreement, Affordable Housing Program, and Tax Increment Sales Proceeds Pledge Agreement are enforceable obligations under Redevelopment Dissolution Law.
The Transbay Redevelopment Plan, established in 2005, is implemented through partnerships between OCII, the City, Transbay Joint Powers Authority (“TJPA”), Caltrans, and for-profit and non-profit developers. The Project Area is divided into two zones: Zone 1 is implemented by OCII and Zone 2 is implemented by the San Francisco Planning Department. When completed, the Transbay Redevelopment Area (including both Zone 1 and Zone 2) will include over 4,000 new residential units, a minimum of 35% of which will be affordable, office and retail space, over 9 acres of new parks, and significant transportation and streetscape improvements.
Within Zone 1, a total of 2,196 residential units have been completed (Blocks 1, 6, 7, 8, 9, and 11a), 721 of which are restricted for affordability. Additional housing units are planned on Blocks 2 East and West (the subject of this evaluation), Block 4, and Block 12. The planned affordable units on Blocks 2 East and West are essential to achieving 35% affordability in the Transbay Project Area.
Transbay Block 2, along with Blocks 3 and 4 and the future extensions of Clementina and Tehama Streets, was part of the lot formerly used as the Temporary Transbay Terminal. The Greyhound station building remains on the site but is currently unoccupied. Transbay Terminal operations relocated to the newly constructed Salesforce Transit Center in 2019.
OCII issued a Request for Proposals (“RFP”) seeking teams to develop, own, and operate mixed-use affordable rental family and senior housing units, including units set-aside for formerly homeless family and senior households at Transbay Blocks 2 East and 2 West in June 2020, with proposals due in September 2020. OCII received 5 proposals, all of which were deemed complete. An evaluation panel comprised of staff from OCII, Mayor’s Office of Housing and Community Development (“MOHCD”), the Department of Homelessness and Supportive Housing (“HSH”), and a member of the Transbay Citizens Advisory Committee (“CAC”) recommended selection of the development team led by Mercy and CCDC. Please see Sections 9 and 10 below for further discussion regarding threshold requirements and scoring.
Mercy and CCDC proposed that while they would collaborate on development of the site as a whole, with Mercy designated as the overall lead developer for Transbay Block 2, each would take the lead on securing financing for, and owning and operating one of the two residential projects. CCDC will own and operate the senior project on Block 2

Evaluation of Request for Predevelopment Financing February 19, 2021 Transbay Block 2 West Page 6 of 38
West and Mercy will own and operate the family project on Block 2 East. See below for further discussion on this relationship.
1.2. Borrower/Grantee Profile. (See Attachment B for Borrower Org Chart; See Attachment C for Developer Resumes and Attachment D for Asset Management Analysis)
The Borrower entity is Transbay 2 Senior LP. The managing general partner is CCDC Transbay 2 LLC, a subsidiary of CCDC.
CCDC has significant experience in the development and operation of affordable housing in San Francisco. CCDC’s portfolio includes 869 affordable senior units and 220 units of supportive housing. While Block 2 West will be CCDC’s first project in the Transbay Project Area, CCDC has worked on numerous OCII projects as well as on dense infill sites in nearby neighborhoods.
Kate Voshell at CCDC will be the Project Manager and will dedicate approximately 40% of her time to the Project. Abigail Brown will provide project assistance and will dedicate approximately 20% of her time to Block 2 West. Kate and Abigail will be supported by Kim Piechota (Housing Director), Kayne Doumani (Director of Property Management), and Allie Markowitz (Resident Services Manager).
CCDC will develop, own, and operate Block 2 West and will provide ongoing property management and resident services. However, CCDC will collaborate with Mercy, lead developer of Block 2 East, to ensure cohesive and complementary development of the Transbay Block 2 site as a whole. Pursuant to a Memorandum of Understanding between Mercy and CCDC dated September 20, 2020, Mercy will take the lead in providing the following services in support of Block 2 West:
Contract negotiation including predevelopment loan terms and ground leases; Consultants selection; Retail programming, commercial shell design, marketing, and leasing; and Lot split and streetscape improvement design.
Pursuant to Condition 11.2.1, Mercy and CCDC will enter into a joint development agreement to formalize the collaborative partnership and further clarify roles and responsibilities.
2. SITE (See Attachment E for Site map with amenities) Site Description
Zoning: Zoning for the site is form-based and is governed by the Transbay Redevelopment Plan, Transbay Development Controls and Design Guidelines, and the Transbay Design for Development. The DCDG establishes that Block 2 is split by a 25’ wide ground level pedestrian mews connecting Folsom Street and Clementina Street. On the western side (Block 2 West), the DCDG allows a height of up to 50’ on the northern portion of Block 2 West along Clementina, and up to 85’ mid-block along Beale Street and on the southern side along Folsom and Beale Street. The DCDG also requires a central open space courtyard.

Evaluation of Request for Predevelopment Financing February 19, 2021 Transbay Block 2 West Page 7 of 38
Maximum units allowed by current zoning (N/A if rehab):
The maximum number of units on the site is based on form-based zoning. The number of units is limited only by what can fit within the site’s height and bulk restrictions.
Number of units added or removed (rehab only, if applicable):
N/A
Seismic (if applicable): The site is within a Liquefaction Zone (per the California Geological Survey)
Soil type: According to the Transbay EIR, the site is located on the Bay side of the historic circa 1848 shoreline. Soils on the site may generally be characterized by the presence of soft and compressible bay mud under the superficial fill placed when the area was reclaimed in the late 1800s or early 1900s. The depth of the sediment varies throughout the site.
The Sponsor will assemble a consultant team and will perform further geotechnical analysis during predevelopment.
Environmental Review: CEQA clearance was obtained through the Environmental Impact Report (EIR) for the Transbay Redevelopment Plan (a program EIR). See Section 2.2 below for further discussion.
Adjacent uses (North): Currently a continuation of the Block 2 surface parking lot, previously used as the temporary Transbay Terminal, planned for an approximately 1-acre public park.
Adjacent uses (South): An approximately 650-unit mixed use condominium complex known as “Lumina”. Woodlands Market, a high-end grocery store is located at the ground floor.
Adjacent uses (East): Block 2 East, an approximately 101-unit affordable family rental project, under development concurrently with Block 2 West, will be located directly to the east within Transbay Block 2. To the east of Transbay Block 2, a 392-unit mixed-use, mixed-income condominium complex known as “Mira” is under construction and nearing completion.
Adjacent uses (West): A 479-unit mixed use apartment project, including 409 units in a tower (on the western side of the block) and 70 affordable units in a mid-rise and townhomes (on the eastern side of the block). The 70-unit affordable project is owned and operated by Mercy.
Neighborhood Amenities within 0.5 mile: Grocery: Woodlands Market is located directly across Folsom Street, Ferry Building Saturday Farmer’s Market (0.5 mile), Safeway (0.7 mile), Whole Foods (0.8 mile), Target (0.9 mile), Trader’s Joe’s (1 mile) Pharmacy: Walgreens (0.4 mile), CVS (0.7 mile), Target (0.9 mile) Library: Mission Bay Public Library (1.3 miles) Parks: planning is under way for an approximately 1-acre park on Block 3 directly to the north of the site, Salesforce Park (located on the roof of the Salesforce Transit Center) is one block from the site (0.2 mile), Rincon Park is 2 blocks from the site (0.2 mile)
Public Transportation within 0.5 mile: The site is located 1 block from the Salesforce Transit Center, a regional hub for 11 transit systems, including

Evaluation of Request for Predevelopment Financing February 19, 2021 Transbay Block 2 West Page 8 of 38
multiple Muni bus lines. In addition, the site is two blocks from the Muni Metro station at The Embarcadero and Folsom Street and 2 blocks from the Embarcadero BART station.
Article 34: Article 34 authority is needed and will be requested before the predevelopment loan is encumbered.
Article 38: Not exempt. The site is within the Air Pollutant Exposure Zone. The design will be subject to relevant guidelines and requirements.
Accessibility: Project will provide at least 15% of tax credit units with mobility features (California Building Code (“CBC”) 11B 809.2 through 11B 809.5) and at least 10% with communications features (CBC 11B 809.5). Adaptability requirements will be determined by the San Francisco Mayor’s Office on Disability.
Green Building: Per the RFP, the building must either achieve a Green Point Rating of 125 or above, or LEED Gold rating. The OCII design team will work with the Sponsor to ensure the Project meets one of these two thresholds.
Recycled Water: Not exempt. The project does fall within the boundaries of the designated recycled water use area, and therefore it will be required to comply with the City’s Recycled Water Ordinance. As such, the Sponsors will be required to install purple pipe to recycle grey water within the project.
Storm Water Management: Developments that disturb 5,000 square feet or more of the ground surface must comply with the Storm Water Design Guidelines and submit a Storm Water Control Plan to the SFPUC for review. The development team will meet with SFPUC during the predevelopment period.
2.1. Zoning. See above.
2.2. Local/Federal Environmental Review. In April 2004, the Redevelopment Agency Commission certified the Environmental Impact Report (EIR) for the Transbay Redevelopment Plan. In January 2005, the Agency Commission adopted findings under the California Environmental Quality Act (CEQA), a Statement of Overriding Considerations, and a Mitigation Monitoring and Reporting Program in connection with the adoption of the Redevelopment Plan. The Board of Supervisors, Planning Commission, and TJPA adopted similar findings.
The Agency Commission, Board of Supervisors, and TJPA subsequently adopted eight addenda to the Final EIR.
The proposed loan is an implementing action and within the scope of the project analyzed under the EIR and subsequent addenda. Unless the Sponsor seeks building height or bulk that are outside of that assumed under the EIR, no additional environmental review is required under CEQA.
The Sponsor will work with OCII staff and other public agencies to ensure that the mitigation monitoring measures for Block 2 West are appropriately documented and
Evaluation of Request for Predevelopment Financing February 19, 2021 Transbay Block 2 West Page 9 of 38
implemented. Also, the Sponsors will order an updated Phase I analysis and a Phase II analysis, as needed.
2.3. Environmental Issues.
Phase I/II Site Assessment Status and Results. As part of due diligence in acquiring the site from TJPA, OCII commissioned a Phase I report from AEW Engineering. The report is dated November 3, 2020. The report identified that soil classified as Federal Class I RCRA and California Class I Non-RCRA hazardous waste is on the site. The soil was capped by the existing temporary terminal asphalt and terminal building but will need to be addressed as part of the site’s development. The Sponsor will work with a consultant to determine whether an updated Phase I is needed.
The Sponsor will seek a Phase II report during predevelopment.
Potential/Known Hazards. Soil contaminants currently exist in the Project Area and are assumed to exist at the site. The Sponsor will engage consultants to provide testing and analysis.
2.4. Adjacent uses and neighborhood amenities. See table above. 2.5. Green Building. See table above.
3. COMMUNITY SUPPORT 3.1. Prior Outreach.
The Transbay Citizens Advisory Committee (“CAC”) is comprised of 11 members who represent neighboring residents, property owners, and Citywide interests. The CAC is charged with providing advice to OCII on all matters pertaining to the planning and implementation of the Transbay Redevelopment Project Area.
Staff presented the RFP to the CAC and to the OCII Commission in June 2020 prior to its issuance. A member of the CAC participated in the interview and evaluation panel for the developer team selection. Staff presented an update on the selection process and the recommended developer to the CAC on November 12, 2020 in advance of the anticipated upcoming OCII Commission action on the Predevelopment Loan Agreement and Exclusive Negotiations Agreement. At each meeting, the CAC members were supportive of this development.
3.2. Future Outreach. The Sponsor will return to the CAC to present the recommended concept design for Blocks 2 West and East and will return again to seek approval of the schematic design. Pursuant to Condition 11.3.15, the Sponsor will conduct further outreach to neighborhood groups as needed throughout predevelopment, in coordination with the sponsor of Block 2 East. Groups may include the East Cut Community Business District, neighboring homeowner associations, and others.
4. DEVELOPMENT PLAN 4.1.1. Site Control.
OCII currently holds and will continue to hold fee simple ownership of the site. The site was transferred from TJPA to OCII in January 2021, along with Transbay Blocks 3 and 4 and the parcels planned for the extensions of Clementina and Tehama Streets.

Evaluation of Request for Predevelopment Financing February 19, 2021 Transbay Block 2 West Page 10 of 38
Pursuant to the terms of a purchase agreement between TJPA and OCII in August 2020, Transbay Block 2 was transferred at no cost to OCII.
The Sponsor, in coordination with the sponsor of Block 2 East, will be responsible for pursuing a subdivision map to facilitate the Blocks 2 East and West projects. Per Condition 11.3.12, CCDC and Mercy will work together to determine appropriate boundaries for the two or more parcels to be created through the subdivision. Mercy will take the lead in preparing the subdivision map application and will oversee the mapping process.
4.1.2.Proposed Property Ownership Structure OCII will retain fee interest in the land and, at the close of construction financing, will enter into a long-term ground lease with the Sponsor. The Sponsor will own the improvements.
4.2. Proposed Design. The preliminary massing for Block 2 West features a nine story (85’) building anchoring the corner of Folsom and Beale, stepping down to approximately 50’ along Clementina Street. The building will have 153 units, with 117 one-bedrooms and 35 studios, plus one two-bedroom manager’s unit. To improve the efficiency of the floor plate without sacrificing quality or space, some bedrooms in the one-bedroom units may be “shared light”, meaning that they will not have a direct window to the outdoors. The Sponsor and design team will work with OCII to ensure that all units provide high quality living spaces.
As one of the final remaining sites in the Transbay project area, the urban design of Blocks 2 West and East is critical to creating a vibrant pedestrian realm. Units with townhome-style frontages and stoops are located along the planned extension of Clementina Street, while a café on the Beale-Clementina corner will serve residents as well as patrons of the planned park across the street. On the Folsom Street side, a continuous stretch of retail from Beale to the pedestrian mews furthers the Folsom “main street”.
The ground floor also contains the resident lobby and most of the management and services spaces, including a community room near the entrance that opens up out onto the courtyard. There is also a roof deck on the sixth floor overlooking the future park where residents can gather.
A partial basement will provide resident bicycle storage, building storage, utility functions, and trash storage. There will be no resident vehicular parking.
The Block 2 West design will be closely coordinated with the design of Block 2 East. The Sponsors and design teams will collaborate to submit a single schematic design package for OCII review and approval. Designs will feature complementary exterior features and materials for a cohesive look across the block. The design team envisions a masonry material for the façade that will contrast with the glassy towers across Folsom Street. A common landscape architect will work on both Blocks 2 West and East, ensuring consistency in the look and feel of the large “linear parks” on Beale and Main, the wide sidewalk on the Folsom Street frontage, the central pedestrian mews, and the townhome frontages on Clementina.
Estimated area square footages are as follows:

Evaluation of Request for Predevelopment Financing February 19, 2021 Transbay Block 2 West Page 11 of 38
Average Unit SF by type: Studio: 400 1 bedroom: 550
Residential SF: 81,521
Circulation SF: 17,208
Retail SF: 4,320
Common Area SF: 8,234
Maintenance/Utility SF: 4,800
Building Total SF: 116,083
4.3. Proposed Rehab Scope. N/A 4.4. Construction Supervisor/Construction Specialist’s Evaluation
OCII’s Construction Specialist has performed a preliminary analysis of the proposed massing concept and construction cost estimate for Block 2 West. The nine-story development includes 35 studio and 117 one-bedroom units serving low-income seniors. The proposed design takes advantage of the southwest corner of Folsom and Beale Streets while creating a sunlit courtyard facing the midblock pedestrian mews to the east. The northern façade, along Clementina Street, provides views to the planned Block 3 park. The midblock mews and streetscape improvements to Clementina, Beale, and Folsom will contribute to street level activation and link to similar improvements on surrounding Transbay blocks.
Design and construction efficiencies can be gained by simultaneously developing Blocks 2 West and East. To the extent feasible, these projects should maintain coordinated schedules (Condition 11.3.1).
Preliminary cost estimates are at approximately $834 per square foot, or $632,798 per unit, which are below the average for MOHCD projects with similar construction typologies and unit types currently in predevelopment. The cost is reasonable for Type I construction. OCII will work closely with the Sponsor and design team to identify strategies to maximize efficiencies and maintain costs as designs progress.
4.5. Commercial Space. Ground floor commercial on Transbay Block 2 is essential to meeting the overall Redevelopment Plan goal to develop Transbay as a vibrant and functional urban neighborhood. Existing Transbay residents have, through discussions at Transbay CAC meetings, affirmed the need and desire for neighborhood-serving commercial uses, particularly affordable grocery. In response to the RFP for Transbay Blocks 2 East and West, Mercy and CCDC proposed a retail plan intended to complement existing area businesses and provide spaces and uses that act as community connectors. The overall commercial plan for Block 2 provides 11,650 square feet of ground floor commercial. An affiliate of Mercy, Mercy Commercial California (“MCC”) will lead the planning, lease-up, and build-out of the commercial spaces on both 2 East and West.
During predevelopment, the Sponsor, in collaboration with Mercy and MCC, will prepare a commercial financing plan for OCII review and approval and will consider and recommend whether or not to establish separate parcels for the commercial spaces as part of the overall subdivision mapping process for the Transbay Block 2.
Evaluation of Request for Predevelopment Financing February 19, 2021 Transbay Block 2 West Page 12 of 38
The preliminary design for Block 2 West provides approximately 4,320 square feet of retail, including an approximately 620 square foot space at the corner of Beale Street and Clementina, and an approximately 3,700 square foot space on Folsom Street between Beale and the mid-block passage between Blocks 2 East and West.
The smaller single space’s use is envisioned as complementary to the planned park on Block 3 to the north, such as a café. The larger space may be divided into smaller retail bays.
MCC has identified the potential for partnerships with the San Francisco Bicycle Coalition for an office/community workshop space, and with small grocers through the San Francisco Neighborhood Business Alliance, a membership-based trade association founded by retailers in the Arab, Asian, and Black communities in the Bay Area. MCC and the Sponsor will continue collaboration with these organizations as well as other local organizations supporting entrepreneurs and small businesses to market the spaces and secure neighborhood-serving tenants (Condition 11.3.11). The Sponsor and Mercy will enter into an agreement (the joint development agreement or a separate agreement) to finalize MCC’s initial and ongoing role in the Block 2 West retail and leasing and will coordinate to ensure that the commercial design is in keeping with OCII/MOHCD standards (Conditions 11.2.1 and 11.3.11).
4.6. Service Space. Preliminary designs provide for ground floor service/property management offices, a lounge area, community room and adjacent outdoor open space courtyard. The type and amount of space seems adequate for the target population. Programming and design of the space will be refined during predevelopment and reviewed with service and property management providers as well as OCII housing and design staff.
4.7. Target Population Block 2 West will serve senior households at incomes ranging from 25% to 80% SF AMI. Approximately 20% of the units (30 units) will be set-aside for occupancy by formerly homeless senior households, referred to the Project by HSH through the Coordinated Entry program. Pursuant to Condition 11.3.6, the Sponsor will work with HSH to confirm that the number of permanent supportive units is appropriate and allows for an efficient case management ratio.
The OCII RFP for Transbay Block 2 anticipated that the senior component would serve households at age 62+, however, a lower age limit, such as 55+, would provide HSH with greater flexibility in referring adult tenants to the supportive units in the Project through the Coordinated Entry program. The Sponsor will review the operational impacts, fair housing compliance implications, as well as considerations for financing applications and will recommend a minimum resident age for OCII consideration and approval during early predevelopment (Condition 11.3.3).
In addition to reviewing age requirements, the Sponsor will review income limits to ensure all proposed income levels and rents are feasible for the anticipated population. Specifically, the Sponsor will review the demand for and marketability of the higher tier AMI levels. Pursuant to Condition 11.3.4, the Sponsor will provide recommended income tiers to OCII for review and approval during predevelopment.
While senior households are expected to be small, comprised of one- and two-person households, there may be a need to provide a limited number of larger two-bedroom

Evaluation of Request for Predevelopment Financing February 19, 2021 Transbay Block 2 West Page 13 of 38
units to accommodate seniors who require live-in health support, allowing residents to age in place. With this in mind, the Sponsor will review the design implications and financial feasibility of integrating two-bedroom units into the Project (Condition 11.3.5).
4.8. Marketing & Occupancy Preferences As previously noted, tenants in the 30 units serving formerly homeless senior households will be referred to the Project through the Coordinated Entry System. All remaining affordable units will be marketed and leased through OCII’s standard procedures, including early outreach to Certificate of Preference (“COP”) holders, broad marketing and outreach, and applications and a lottery through the MOHCD DAHLIA digital housing portal system. In addition, potential tenants will be prioritized in accordance with preferences.
As of April 19, 2019, the OCII Commission has authorized staff to apply the preferences in City Affordable Housing Programs, as amended from time to time, to affordable housing approved by OCII, to the extent that those preferences are consistent with redevelopment plans, enforceable obligations, and applicable law. The preferences applicable for the Project are:
1. COP holders 2. Displaced Tenant Preference Program for 20% of lottery units 3. Neighborhood Resident Housing Preference for 40% of the lottery units if
project does not include State funding sources, and 25% of the lottery units if project does include State funding sources (if such preference does not conflict with other financing sources)
4. San Francisco residents or workers 5. Members of the general public
The Sponsor will, as a condition of the anticipated gap loan, provide an early outreach and marketing plans that describe specific efforts to engage preference program participants, and clearly describe how the marketing is consistent with the Mayor’s Racial Equity statement and promote positive outcomes for African American San Franciscans.
Potential tenants, including those prioritized by preference, must meet the Sponsor’s established screening requirements for the Project, and final selection will lie with the Sponsor. Any authorized preference shall be permitted only to the extent that such preference: (a) does not have the purpose or effect of delaying or otherwise denying access to a housing development or unit based on race, color, ethnic origin, gender, religion, disability, age, sexual orientation, or other protected characteristic of any member of an applicant household; and (b) is not based on how long an applicant has resided or worked in the area. OCII will work with the Sponsor to resolve potential occupancy conflicts and determine marketing requirements and to ensure adherence to OCII occupancy preferences.
4.9. Relocation. N/A.
5. DEVELOPMENT TEAM

Evaluation of Request for Predevelopment Financing February 19, 2021 Transbay Block 2 West Page 14 of 38
Development Team Consultant Type Name SBE/LBE Outstanding
Procurement Issues Architect Mithun Architects N N
Landscape Architect TBD TBD TBDJV/other Architect TBD TBD TBD
General Contractor TBD TBD TBDOwner’s Rep/Construction
ManagerTBD TBD TBD
Property Manager CCDC N NServices Provider CCDC N N
Financial Consultant CHPC N NLegal Gubb & Barshay N N
5.1. Outstanding Procurement Issues. There are no outstanding procurement issues. Sponsor, in collaboration with the sponsor of Block 2 East, is working with OCII’s Contract Compliance team to issue an RFQ/P for design consultants and will endeavor to meet OCII’s goal that a minimum of 50% of professional services contracts are awarded to certified Small Business Enterprises (“SBEs”).
6. FINANCING PLAN (See Attachment G for Cost Comparison of City Investment in Other Housing Developments; See Attachment H and I for Sources and Uses) 6.1. Prior MOHCD/OCII Funding (this project and historical for the project):
There is no prior OCII funding. This predevelopment loan request will be the first sum of money extended to the project.
6.2. Disbursement Status. The proposed predevelopment loan is the only predevelopment source for the Project. No sums of money have yet been disbursed. Staff recommends that the Loan Committee approve payment of costs dating back to November 12, 2020, the date of the informational update staff provided to the Transbay CAC on the developer selection recommendation, so long as these previously incurred costs are deemed acceptable and correspond to the predevelopment budget attached herein.
6.3. Fulfillment of Loan Conditions. N/A.
6.4. Proposed Predevelopment Financing 6.4.1. Predevelopment Sources Evaluation Narrative The proposed predevelopment loan is the only predevelopment source for the Project.
6.4.2. Predevelopment Uses Evaluation The Sponsor is seeking a predevelopment loan of $3,500,000. The budget includes costs related to design through construction documents, survey and engineering sites studies, permit fees, legal fees, and a portion of the developer fee.

Evaluation of Request for Predevelopment Financing February 19, 2021 Transbay Block 2 West Page 15 of 38
6.4.3.
Predevelopment Budget
Underwriting Standard Meets Standard? (Y/N)
Notes
Acquisition Cost is based on appraisal
N/A Not applicable.
Architecture and Engineering Fees are within standards
Y A&E fee during predevelopment is $2,351,818
Bid Contingency is at least 5% of total hard costs
Y
Escalation amount is commensurate with time period until expected construction start, not to exceed 15%
N The Project is carrying a total of 15% in design, bid, and plan check contingencies, which is consistent with the MOHCD Underwriting Guidelines, but more than the amounts held in typical recent practice for projects of this scale (typical is a total of 8%). While escalation is not included in the hard cost estimate, it is assumed that these conservative contingency amounts would allow for escalation.
Construction Management Fees are within standards
Y
Developer Fee is within standards
Y See discussion on Developer Fee below.
Soft Cost Contingency is 10% per standards
Y
Financing Costs are reasonable Y
6.5. Potential Proposed Permanent Financing Permanent financing is being presented to demonstrate the project’s overall feasibility but not intended to be presented for Loan Committee approval at this time.
6.5.1. Permanent Sources Evaluation Narrative: OCII Loan: The current budget assumes an OCII subsidy of $30,593,175 or $199,955 per unit. The OCII subsidy will be used during predevelopment and construction and will be structured as a loan with up to 3% interest.
LIHTC Equity: The Sponsor is projecting LIHTC equity in the amount of $35,024,963 or $228,921 per unit. This assumes a fixed 4% credit rate. Pricing is assumed at $0.90 which may be conservative but is based on recent offers from tax credit investors on other San Francisco projects without project-based Section 8 contracts. Pursuant to Condition 11.3.14, the Sponsor will provide the debt/equity request for proposals for OCII review and will share responses and draft terms sheets.

Evaluation of Request for Predevelopment Financing February 19, 2021 Transbay Block 2 West Page 16 of 38
HCD MHP: The budget assumes a MHP award of $20,000,000, the maximum available under the program. CCDC has succeeded in securing MHP funding on other projects in the recent past though the program remains highly competitive. The program rewards deep affordability and supportive housing, thus preliminary analysis shows that the Project would be highly competitive and CCDC is optimistic about securing a maximum award.
HCD IIG: The budget assumes an IIG award of $7,000,000, the maximum available for the program. The funds would be used for site preparation, drainage, and streetscape work.
Construction Loan: The budget assumes as tax-exempt construction loan of $58,888,275 with an interest rate of 3.65% for 30 months. Pursuant to Condition 11.3.14, the Sponsor will provide the debt/equity request for proposals for OCII review and will share responses and draft terms sheets.
Permanent Loan: The budget assumes that the project will not support a permanent loan. While cash flow is significant in early years, the debt service coverage ratio would fall below standards in year 15 of operations and beyond. The Sponsors will re-analyze the potential for a permanent loan or otherwise utilize early year cash flow to support the project and reduce the OCII loan (Condition 11.3.9).
AHP: The budget assumes an AHP award of $1,200,000, the maximum available for the program. The funds would be used during construction. The Sponsors will work with OCII and MOHCD to analyze scoring for AHP funding early in predevelopment. The Sponsor anticipates an AHP award prior to seeking gap funds from OCII.
GP Capital Contribution: The GP estimates that it will make an equity contribution of $3,000,000 or $19,608 per unit to maximize tax credit equity. This amount is reflected in the developer fee shown below.
6.5.2. Permanent Uses Evaluation: Development Budget
Underwriting Standard Meets Standard?
(Y/N)
Notes
Hard Cost per unit are within standards Y
Hard costs are $513,558 / unit (includes contingencies). Costs will be monitored closely during the predevelopment period.
Construction Hard Cost Contingency is at least 5% (new construction) or 15% (rehab)
Y Hard cost contingency is 5%. Design, bid, and plan check contingencies total 15%.
Architecture and Engineering Fees are within standards Y A&E fee is $3,818,408, which is
approximately 5% of hard costs (excluding contingencies).
Construction Management Fees are within standards Y
The construction management fee of $150K is within the maximum allowable per MOHCD’s underwriting guidelines for a large project.
Developer Fee is within standards, see also disbursement chart below Y Total cash developer fee is $2.2M, which is
below the max. allowed under the MOHCD

Evaluation of Request for Predevelopment Financing February 19, 2021 Transbay Block 2 West Page 17 of 38
Developer Fee Policy (See further description below.)
Soft Cost Contingency is 10% per standards
Y Soft Cost Contingency is 10%.
Capitalized Operating Reserves are a minimum of 3 months
Y Capitalized Operating Reserve is equal to 3 months of expenses
Cash Developer Fee Disbursement Schedule
Payment Milestone % of Project Mgmt. Fee
Amount
At acquisition or closing of preconstruction financing 15% $165,000
During or at end of predevelopment 35% $385,000
At construction closing 20% $220,000
During construction/at construction completion 20% $220,000
Project close-out 10% $110,000
Total Project Management Fee 100% $1,100,000
At Risk Fee* $1,100,000
Total Cash Developer Fee $2,200,000
GP Equity $3,000,000
Total Developer Fee $5,200,000
* The at-risk fee is below the maximum allowable under the MOHCD Developer Fee Policy due to restrictions from other funding sources (the MOHCD policy would allow up to $2,730,000 in total cash fee, as well as commercial development fee). Should the funding sources change, the fee may be revised at consideration of gap financing to an amount up to the maximum allowed under the MOHCD policy. The at-risk fee will be held back from distribution to cover any cost overruns that exceed the contingency amounts held in the Sponsor’s budget, per the MOHCD Developer Fee Policy.
6.6. This Request/Phasing Narrative N/A
7. PROJECT OPERATIONS (See Attachments I and J for Operating Budget and Proforma) 7.1. Annual Operating Budget Since this is a predevelopment loan request, the annual operating budget is presented to demonstrate the project’s overall feasibility and is not presented for approval at this time. Please see Attachment J.
7.2. Income
Project income will include tenant rents as well as subsidy for LOSP units. In addition to LOSP, the Sponsor will monitor the potential for other rental or operating subsidies appropriate for seniors, such as the City’s Senior Operating Subsidy demonstration program (Condition 11.3.10). The preliminary cash flow assumes that commercial income and

Evaluation of Request for Predevelopment Financing February 19, 2021 Transbay Block 2 West Page 18 of 38
expenses will not flow through the residential project. This is subject to further analysis during the predevelopment period.
Unit Type No. of Units Max. AMI Rent (at Max.
AMI)* Rent/ Operating
Subsidy Studio 7
25% $560**
LOSP 1 bedroom 23 $641** Studio 11
30% $673
1 bedroom 13 $769 Studio 6
50% $1,121
1 bedroom 44 $1,281 Studio 8
60% $1,345
1 bedroom 25 $1,538 Studio 3
80% $1,793
1 bedroom 12 $2,050 1 bedroom 1 unrestricted n/a Mngr’s Unit Total Units 153 Average AMI: 36.7%
* Based on 2020 MOHCD rents ** Tenants in units subsidized by LOSP are assumed to pay $300 per month in rent, actual rent will be 30% of tenant income, pursuant to LOSP policies. The Sponsor will work with HSH during predevelopment to confirm tenant-paid rent assumptions.
7.3. Annual Operating Expenses Evaluation Operating Proforma
Underwriting Standard Meets Standard?
(Y/N)
Notes
Debt Service Coverage Ratio (DSCR) is between minimum 1.10:1 and maximum 1.15:1 at year 15
N At 1.91:1, the DSCR is above the maximum 1.15:1 in year 15. Pursuant to Condition 11.3.9, the Sponsor will analyze the potential for a permanent loan for the Project.
DSCR stays above 1.00:1 for entirety of projected 20-year cash flow
N The DSCR is above 1.00:1 for 19 years of projected cash flow but is at 0.79:1 at year 20. Pursuant to Condition 11.3.9, the Sponsor will need to ensure that the project maintains a 1.0:1 minimum DSCR for the full 20-year cash flow period.
Vacancy meets TCAC Standards Y Vacancy is 5% of tenant rents per TCAC and LOSP standards.
Annual Income Growth is increased at 2.5% per year Y
Income escalation factor is 2.5% for non-LOSP units and 1% for LOSP in compliance with OCII/MOHCD standards and LOSP guidelines.
Annual Operating Expenses are increased at 3.5% per year
Y Expenses escalation factor is 3.5%.
Base year operating expenses per unit are reasonable per comparables
Y Total base year operating expenses are $11,462 per unit per year (including reserves). This is reasonable and comparable to other recent projects.
Property Management Fee is at allowable HUD Maximum
Y Property Management Fee is $119,340 and will be set in accordance with the HUD schedule

Evaluation of Request for Predevelopment Financing February 19, 2021 Transbay Block 2 West Page 19 of 38
Property Management staffing level is reasonable per comparables
Y 1 FTE Property Manager 1 FTE Assistant Property Manager 1 FTE Administrative Assistant 3.5 FTE Desk Clerks (24/7 coverage) 2 FTE Janitors 1 FTE Janitor Tech 1 FTE Repair Staff This level of property management staffing is consistent with other buildings in the Sponsor’s portfolio. The staffing structure will be refined during predevelopment. The Sponsor will assess the need for 24/7 desk coverage and/or will explore the potential for shared after hours desk coverage for cost savings/efficiency (Condition 11.3.7).
Asset Management and Partnership Management Fees meet standards
Y Annual AM fee is $21,900 Annual PM Fee is $21,890 These amounts are consistent with MOHCD maximums for 2020.
Replacement Reserve Deposits meet or exceed TCAC minimum standards
Y Replacement Reserves are $500 per unit per year (based on comparable projects).
Limited Partnership Asset Management Fee (aka Investor Service Fee) meets standards
Y $5,000 per year with no escalation.
7.4. Capital Needs Assessment & Replacement Reserve Analysis N/A
8. SUPPORT SERVICES 8.1. Services Plan.
CCDC will provide both resident services for all senior households and supportive services for formerly homeless senior households. Anticipated staffing is as follows:
Position FTE Description
Intensive Case Manager (serving households in supportive units) 1.0
Focused primarily on supportive housing residents, provides ongoing psychological assessments, supportive counseling, and individualize wrap-around case management.
Resident Services Supervisor (support for households in both supportive and non-supportive units)
.5
Oversees, trains, and supports Case Manager and Resident Services Coordinator, and provides direct case management.
Resident Services Coordinator (serving all residents) 1.0
Provides informational, referral, and linkage services and coordinates educational workshops, health activities, and social/recreational activities.
Total FTE 2.5

Evaluation of Request for Predevelopment Financing February 19, 2021 Transbay Block 2 West Page 20 of 38
8.2. Service Budget. General resident services will be paid through the operating budget, while case management and supportive services for formerly homeless households will be funded through a separate contract with HSH. The overall anticipated services budget is as follows:
Position FTE Budget Amount Funding Source
Intensive Case Manager 1.0 $65,000 HSH
Resident Services Supervisor .5 $78,000 salary + 30% fringe HSH/Operating budget
Resident Services Coordinator 1.0 $54,080 salary + 30% fringe Operating budget
Total FTE 2.5 $197,080
The Sponsor will work with OCII and HSH to refine the services plan and budget during the predevelopment period (see Condition 11.3.6).
8.3. HSH Assessment of Service Plan and Budget.To be provided with the gap funding request. Mili Choudhury, Family Permanent Supportive Housing Manager at HSH, was a member of the selection panel for the RFP and will participate in planning for services and management. OCII staff will coordinate with HSH to identify the HSH staff representative from the adult supportive housing program for ongoing review of Block 2 West throughout predevelopment. A condition of this loan request is to work closely with OCII, HSH, and MOHCD to develop and appropriate supportive services plan and budget for this Project (Condition 11.3.6).
9. THRESHOLD ELIGIBILITY REQUIREMENTS The RFP defined minimum threshold requirements to be considered for selection. The Sponsors satisfied these requirements.
10. RANKING CRITERIA The Sponsor was selected, along with the Sponsor of Block 2 East, based on their submittal in response to an RFP as described in Section 1.1. The team led by Mercy and CCDC had the highest score of the five proposals received, with 90 out of 100 possible points. Scoring criteria was as follows:
Maximum Points Criteria 50 Proposed Development Concept 20 Proposed massing concept 15 Financial feasibility and level of OCII subsidy 10 Proposed services plan 5 Proposed marketing plan
50 Developer Team Experience and Capacity 10 Developer’s experience: comparable mixed-use projects 10 Developer’s experience: affordable housing financing; workload capacity

Evaluation of Request for Predevelopment Financing February 19, 2021 Transbay Block 2 West Page 21 of 38
10 Workforce and contracting action plan 10 Architect experience and capacity 5 Service provider experience and capacity 5 Property manager experience and capacity
100 Maximum Total Points
11. STAFF RECOMMENDATIONS 11.1. Proposed Loan/Grant Terms
Financial Description of Proposed Loan
Loan Amount: $3,500,000
Loan Term: 3 years or until rolled into permanent loan for the Project
Loan Maturity Date: 2024
Loan Repayment Type: Deferred
Loan Interest Rate: 3% (may be recast if necessary due to true debt analysis performed in preparation for the close of construction financing. Interest rate may be between 0% and 3%, with approval of the OCII Executive Director)
11.2. Recommended predevelopment disbursement conditions11.2.1 Subject to OCII approval, Mercy and CCDC will enter into a joint
development agreement that clearly defines the roles and responsibilities of Mercy and CCDC in the overall development of Transbay Block 2. The agreement will use as its basis the Term Sheet attached to the MOU dated September 10, 2020 between Mercy and CCDC and will clearly define Mercy’s role as lead developer, in close coordination with CCDC for the following matters: contract negotiations, including predevelopment loan terms, and ground leases; general contractor and consultants’ selection; retail programming, commercial shell design, marketing and leasing; lot split/subdivision mapping; streetscape and landscape design; respective liabilities for work performed under the agreement; and other matters to achieve cost efficiencies and cohesive development on Block 2.
11.3. Recommended conditions prior to gap financing 11.3.1 Sponsor will work closely with the sponsor of Block 2 East throughout
predevelopment and will:
a. ensure that the design teams for Blocks 2 East and West collaborate and submit a single combined schematic design package, which demonstrates cohesive design between Blocks 2 East and West, particularly for the ground floor and mid-block pedestrian mews; and
b. use the same general contractor or joint venture for construction and coordinate construction timing between Blocks 2 East and West, either by construction of both sites at the same time or phased development.

Evaluation of Request for Predevelopment Financing February 19, 2021 Transbay Block 2 West Page 22 of 38
11.3.2 Sponsor will cooperate with OCII and the sponsor of Block 2 East to competitively solicit a general contractor with the intent of creating a joint venture or similar partnership opportunity, to the extent practicable and economically feasible, between a general contractor and an OCII-recognized SBE contractor. Furthermore, Sponsor will require the general contractor to exercise good faith efforts to select subcontractors who are SBEs or are willing to create joint ventures or similar partnership opportunities with SBEs.
11.3.3 Prior to any application for Project financing, Sponsor will analyze financing application parameters and operations for senior housing and recommend, for OCII approval, an age limit for Project residents at age 55 or age 62.
11.3.4 Prior to any application for Project financing, Sponsor will review maximum income levels to confirm that they are appropriate for population to be served. Proposed income limits are subject to OCII review and approval.
11.3.5 Prior to schematic design submittal, the Sponsor will work with OCII to assess the physical and financial feasibility of integrating a limited number of two-bedroom units into the Project to accommodate the needs of seniors in need of larger units.
11.3.6 Sponsor will work with OCII, MOHCD, and HSH to:
a. finalize the number of permanent supportive units, ensuring consistency with best practice case management ratios;
b. coordinate with HSH to refine the services plan and budget; and
c. establish assumptions for tenant-paid rent for LOSP-supported units.
11.3.7 Sponsor will evaluate the need for 24-hour desk coverage for the Project and will explore the potential for shared after hours front desk coverage/security between Blocks 2 West and East to improve efficiency and reduce costs.
11.3.8 Sponsor will monitor available funding sources such as AHP, MHP and others, review regulations, and submit timely applications, as appropriate. If necessary, Sponsor will recommend strategies and program modifications for OCII approval to improve the Project’s likelihood of securing awards.
11.3.9 Sponsor will ensure that the DSCR remains over 1.0:1 for the first 20 years of operations and will further analyze the potential for permanent debt and/or alternative ways to utilize surplus cash to support the Project and reduce the OCII gap loan.
11.3.10 Sponsor will review local, state and federal rent and operating subsidy programs as appropriate for the target population, and will assess program viability and pursue funding applications.
11.3.11 Sponsor will retain the services of MCC for the design, marketing, and lease-up of the commercial spaces. MCC in coordination with Sponsor, will:
a. ensure that commercial spaces are designed in accordance with the specifications established in the MOHCD Commercial Space Underwriting Guidelines and incorporate best practices from Mercy’s San Francisco commercial experience;
b. provide a commercial financing plan for OCII review and approval; and

Evaluation of Request for Predevelopment Financing February 19, 2021 Transbay Block 2 West Page 23 of 38
c. conduct early outreach to local small business organizations, non-profit entrepreneur organizations, and other entities, groups and organizations. In addition, MCC and Sponsor will with the San Francisco Office of Economic and Workforce Development regarding the retail space and the availability of City’s small business, legacy business, and other programs to identify and assist potential local business tenants. .
11.3.12 Sponsor will coordinate with OCII and the sponsor of Block 2 East to establish project boundaries and secure a subdivision map for Transbay Block 2.
11.3.13 Prior to submittal of a site permit application and subdivision map application, Sponsor will collaborate with the sponsor of Block 2 West in recommending for OCII approval, a plan for the development of public or common use areas in Transbay Block 2, e.g. the mid-block pedestrian mews, that establishes the lot lines, allocation of development costs, a mechanism for ensuring public access, and responsibilities for construction and ongoing maintenance and security.
11.3.14 Sponsor will provide for OCII review any RFP for debt and equity providers before it is finalized and released.
11.3.15 Sponsor, in coordination with the sponsor of Block 2 East, will work collaboratively on a community outreach plan, will conduct ongoing outreach to the Transbay community to solicit input, address concerns, and educate community members on various aspects of the Project. Mercy will take the lead in obtaining OCII approval for the community outreach plan.

Evaluation of Request for Predevelopment Financing February 19, 2021 Transbay Block 2 West Page 24 of 38
12. LOAN COMMITTEE MODIFICATIONS

Evaluation of Request for Predevelopment Financing February 19, 2021 Transbay Block 2 West Page 25 of 38
LOAN COMMITTEE RECOMMENDATION
Approval indicates approval with modifications, when so determined by the Committee.
[ ] APPROVE. [ ] DISAPPROVE. [ ] TAKE NO ACTION.
________________________________________ Date: ___________________Eric D. Shaw, Director Mayor’s Office of Housing and Community Development
[ ] APPROVE. [ ] DISAPPROVE. [ ] TAKE NO ACTION.
________________________________________ Date: ___________________ Salvador Menjivar, Director of Housing Department of Homelessness and Supportive Housing
[ ] APPROVE. [ ] DISAPPROVE. [ ] TAKE NO ACTION.
________________________________________ Date: ___________________ Sally Oerth, Interim Executive Director Office of Community Investment and Infrastructure
[ ] APPROVE. [ ] DISAPPROVE. [ ] TAKE NO ACTION.
________________________________________ Date: ___________________ Anna Van Degna, Director Controller’s Office of Public Finance
Attachments: A. Project Milestones/Schedule B. Borrower Organizational Chart C. Developer Resumes D. Asset Management Analysis of Sponsor E. Site Map with Amenities
F. Elevations and Floor Plans G. Comparison of City Investment in Other Housing Developments H. Predevelopment Sources and Uses I. Permanent Sources and Uses J. First Year Operating Budget K. 20-Year Operating Pro Forma

1
Chavez, Rosanna (MYR)
From: Shaw, Eric (MYR)Sent: Friday, February 19, 2021 12:00 PMTo: Chavez, Rosanna (MYR)Subject: Predevelopment Financing Transbay West
I approve Eric D. Shaw Director Mayor's Office of Housing and Community Development City and County of San Francisco 1 South Van Ness Avenue, 5th Floor

1
Chavez, Rosanna (MYR)
From: Menjivar, Salvador (HOM)Sent: Friday, February 19, 2021 12:56 PMTo: Chavez, Rosanna (MYR)Cc: Shaw, Eric (MYR)Subject: Financing for Transbay Block 2 West
I approve the request for a predevelopment loan in the amount of $3,500,00 to develop Transbay Block 2 West. Best, salvador
Salvador Menjivar Director of Housing Pronouns: He/Him San Francisco Department of Homelessness and Supportive Housing [email protected] | 415‐308‐2843 Learn: hsh.sfgov.org | Follow: @SF_HSH | Like: @SanFranciscoHSH
CONFIDENTIALITY NOTICE: This e‐mail is intended for the recipient only. If you receive this e‐mail in error, notify the sender and destroy the e‐mail immediately. Disclosure of the Personal Health Information (PHI) contained herein may subject the discloser to civil or criminal penalties under state and federal privacy laws.

1
Chavez, Rosanna (MYR)
From: Oerth, Sally (CII)Sent: Friday, February 19, 2021 11:59 AMTo: Chavez, Rosanna (MYR)Cc: Shaw, Eric (MYR); Wong, Annie (CII)Subject: Predevelopment Financing Transbay Block 2W- 2.19.21 Loan Committee
I approve the Predevelopment Loan request for Transbay Block 2W, as presented at the 2.19.21 Loan Committee
Sally Oerth Interim Executive Director ––––––––––––––––––––––––––––––
One South Van Ness Avenue, 5th Floor San Francisco, CA 94103
415.749.2588 www.sfocii.org
–––––––––––––––––––––––––––––––––––

1
Chavez, Rosanna (MYR)
From: Katz, Bridget (CON)Sent: Friday, February 19, 2021 11:57 AMTo: Chavez, Rosanna (MYR)Cc: Shaw, Eric (MYR)Subject: Predevelopment Financing Transbay West
Approve Bridget Katz Development Finance Specialist, Office of Public Finance Controller's Office | City & County of San Francisco Office Phone: (415) 554‐6240 Cell Phone: (858) 442‐7059 E‐mail: [email protected]
Evaluation of Request for Predevelopment Financing February 19, 2021 Transbay Block 2 West Page 26 of 38
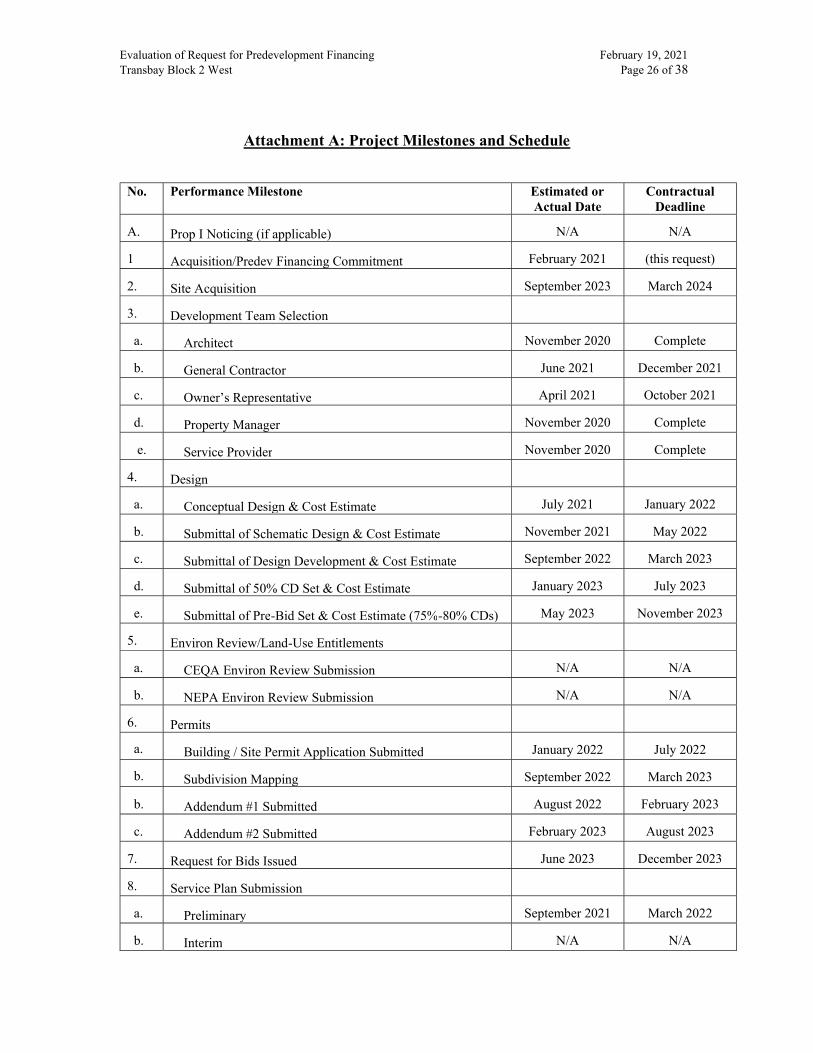
Attachment A: Project Milestones and Schedule
No. Performance Milestone Estimated or Actual Date
Contractual Deadline
A. Prop I Noticing (if applicable) N/A N/A
1 Acquisition/Predev Financing Commitment February 2021 (this request)
2. Site Acquisition September 2023 March 2024
3. Development Team Selection
a. Architect November 2020 Complete
b. General Contractor June 2021 December 2021
c. Owner’s Representative April 2021 October 2021
d. Property Manager November 2020 Complete
e. Service Provider November 2020 Complete
4. Design
a. Conceptual Design & Cost Estimate July 2021 January 2022
b. Submittal of Schematic Design & Cost Estimate November 2021 May 2022
c. Submittal of Design Development & Cost Estimate September 2022 March 2023
d. Submittal of 50% CD Set & Cost Estimate January 2023 July 2023
e. Submittal of Pre-Bid Set & Cost Estimate (75%-80% CDs) May 2023 November 2023
5. Environ Review/Land-Use Entitlements
a. CEQA Environ Review Submission N/A N/A
b. NEPA Environ Review Submission N/A N/A
6. Permits
a. Building / Site Permit Application Submitted January 2022 July 2022
b. Subdivision Mapping September 2022 March 2023
b. Addendum #1 Submitted August 2022 February 2023
c. Addendum #2 Submitted February 2023 August 2023
7. Request for Bids Issued June 2023 December 2023
8. Service Plan Submission
a. Preliminary September 2021 March 2022
b. Interim N/A N/A

Evaluation of Request for Predevelopment Financing February 19, 2021 Transbay Block 2 West Page 27 of 38
c. Final May 2023 November 2023
9. Additional City Financing
a. Predevelopment Financing Application #2 N/A N/A
b. Gap Financing Application February 2023 August 2023
10. Other Financing
a. IIG Application November 2021 November 2022
b. MHP Application March 2022 March 2023
c. Construction Financing RFP January 2023 July 2023
d. AHP Application March 2023 March 2024
e. CDLAC Application March 2023 September 2023
f. TCAC Application March 2023 September 2023
11. Closing
a. Construction Closing September 2023 March 2024
b. Permanent Financing Closing September 2023 March 2024
12. Construction
a. Notice to Proceed September 2023 March 2024
b. Temporary Certificate of Occupancy/Cert of Substantial Completion August 2025 February 2026
13. Marketing/Rent-up
a. Early Outreach Plan Submission October 2023 April 2024
b. Marketing Plan Submission August 2024 February 2025
c. Commence Marketing January 2025 July 2026
d. 95% Occupancy January 2026 July 2026
14. Cost Certification/8609 December 2026 June 2027
15. Close Out OCII Loan December 2026 June 2027

Evaluation of Request for Predevelopment Financing February 19, 2021 Transbay Block 2 West Page 28 of 38
Attachment B: Borrower Organizational Chart

Evaluation of Request for Predevelopment Financing February 19, 2021 Transbay Block 2 West Page 29 of 38
Attachment C: Developer Resumes
See attached resumes for Kim Piechota (Senior Manager) and Kate Voshell (Project Manager).

Kate VoshellProject Manager
EDUCATION Master of Public Administration—Sustainable Management Presidio Graduate School Master of Architecture University of California, Berkeley
RELATED AND PROFESSIONAL EXPERIENCE Project Manager Chinatown Community Development Center | San Francisco, CA (1/2020 – present)• Manages the development process
throughout all phases, from feasibility andacquisition; through design, entitlements, andfinancing; through construction and initialoccupancy, including:
• The refinance and rehabilitation of a 67-unitoccupied SRO building in the Tenderloin.
• The syndication and renovation of ascattered sites bundle of 4 CCDC-ownedproperties (410 units total).
• The renovation of a CCDC commercialspace into offices, including overseeing theincorporation of COVID exposure-reducingventilation strategies.
Business Consultant Goodwill of San Francisco, Marin, & San Mateo Counties | San Francisco, CA • Conducted business process analyses
of multiple departments, designed andimplemented efficiency and cost-savingprocesses
Project Architect Gelfand Partners Architects | San Francisco, CA • Acted as Project Architect for over 600
completed units of affordable housing, donewithin budget and under tight public fundingdeadlines.
• Responsible for the day-to-day managementof multi-family affordable housing projects fromthe programming stage through constructionadministration.
• Prepared reports and presentations to secureproject approvals from communities andpublic agencies
• Assisted clients in preparation of entitlementspaperwork in support of successful fundingrequests.
• Prepared preliminary construction budgets,and tracked costs throughout projects.
PROFESSIONAL CERTIFICATIONS & AFFILITATIONS Registered Architect—C30196 California Architects Board | Sacramento, CA

Kim PiechotaDirector of Housing Development
EDUCATION Master of City Planning University of California, Berkeley Bachelor of Sciences, Applied Behavioral Sciences (Community Development Emphasis) University of California, Davis
RELATED AND PROFESSIONAL EXPERIENCE Director of Housing Development Chinatown Community Development Center | San Francisco, CA (2/2020 – present)• Responsible for oversight of all affordable
housing developments.
• Supervisor of housing development staff.
• Site acquisition and negotiation.
• Devise housing strategy and budget fororganization.
• Participation on senior management team.
• Reporting to the Board.
• Represent Chinatown CDC in housingcoalitions, at community meetings, and infunder/government agency discussions.
Associate Director of Housing Development Chinatown Community Development Center | San Francisco, CA (8/2018 - 2/2020)• Assist department Director in overseeing
the Housing Development department andrepresenting CCDC externally, superviseProject Management staff, perform projectmanagement work as necessary.
Project Manager Chinatown Community Development Center | San Francisco, CA (5/2009 - 8/2018)• Veterans Commons, 76 units adaptive
re-use|150 Otis, San Francisco
• Broadway Sansome Apartments, 75 units newconstruction | 255 Broadway, San Francisco
• North Ping Yuen, 200 units occupiedrehabilitation (RAD)|838 Pacific, San Francisco
• Edwin M. Lee Apartments, 119 units newconstructions | 1150 3rd Street, San Francisco
Development Consultant Citizens Housing Corporation | San Francisco, CA (9/2003 - 3/2009)• Assisted staff in the development of
affordable housing projects.
• Managed two senior rental projects in theirfinal stages of development: a 114-unitservice-enriched development in the cityof San Bruno, and a 40-unit adaptive re-useproject in the Haight Ashbury neighborhoodof San Francisco.
Project Manager Citizens Housing Corporation | San Francisco, CA (5/1999 - 9/2002)• Projects included a 54-unit assisted living
facility in San Francisco, a 30-unit transitionalhousing project on Alameda Point Naval AirStation, a 50-unit development combiningsenior and family housing in Mill Valley, a40-unit senior development in San Franciscoinvolving historic preservation, and a98-unit special needs/transitional housingdevelopment in San Francisco.

Evaluation of Request for Predevelopment Financing February 19, 2021 Transbay Block 2 West Page 30 of 38
Attachment D: Asset Management Evaluation of Project Sponsor
Number of projects and average number of units/project currently in Sponsor’s asset management portfolio: 35 Projects, 85 average units per project
Sponsor’s current asset management staffing – job titles, FTEs, org chart and status of each: The Asset Management Department (AM) is comprised of 4.625 FTE:
Director of Asset Management Senior Asset Manager Asset Manager Asset Management Coordinator Asset Management Assistant (25 hours per week)
All positions are currently filled.
Description of scope and range of duties of Sponsor’s asset management team: AM monitors the financial and physical health of the portfolio. They produce financial projections for each building in order to monitor the long-term viability of the property. They commission capital needs analyses for each building every five years and monitor the process of completing all necessary repairs and replacements. They collaborate with the Housing Development Department to develop work-out plans for troubled properties. With the Property Management Department, they set rents at each building according to the requirements of the various programs and funding sources. They are the main point of contact between CCDC and the lenders, partners, and regulators of the portfolio. This includes all periodic reporting.
Description of Sponsor’s coordination between asset management and other functional teams, including property management, accounting, compliance, facilities management, etc. AM meets twice-monthly with the Housing Development, Property Management, and Fiscal departments to discuss cross-department topics and coordinate the organization’s approach to property and portfolio issues. The Director of AM also has regular individual meetings with other directors, including Housing Development, Property Management, and the Controller.
Sponsor’s budget for asset management team – shown as cost center for projects in SF: The 2021 budget for AM is $580,000.
# of projects expected to be in sponsor’s AM portfolio in 5 years and, if applicable, plans to augment staffing to manage growing portfolio: In the next five years, CCDC will add the following projects to the portfolio:
Casa Adelante/2060 Folsom (127 units) Treasure Island, with Sword to Plowshares (100 units) 730 Stanyan with TNDC (150+ units to be determined) Transbay Block 2 West (the subject of this evaluation) (approximately 153 units)
A number of other projects are under consideration and may be added to the portfolio. In addition, through the Small Sites program, CCDC expects to add 15 to 20 new properties totaling between 60 and 400 units.
AM is a relatively new department for CCDC and has worked for the past several years to develop and implement policies and procedures to improve quality and efficiency. CCDC expects to be able to add these projects without increasing staffing. The asset management activity that creates spikes in regular AM work flow is refinancing. If these should prove too great a strain on staffing, CCDC will engage consultants to perform that work.

Evaluation of Request for Predevelopment Financing February 19, 2021 Transbay Block 2 West Page 31 of 38
Attachment E: Site Map with amenities
Aerial image of Transbay Block 2 (southern portion of block formerly occupied by the Temporary Transbay Terminal
Block 2 East
Block 2 West

Evaluation of Request for Predevelopment Financing February 19, 2021 Transbay Block 2 West Page 32 of 38
Transbay Block 2 site location and amenities

Evaluation of Request for Predevelopment Financing February 19, 2021 Transbay Block 2 West Page 33 of 38
Attachment F: Elevations and Floor Plans

86
View from Folsom Street looking northwest
87

88

89

90

91

92

93

94

95

96

Evaluation of Request for Predevelopment Financing February 19, 2021 Transbay Block 2 West Page 34 of 38
Attachment G: Comparison of City Investment in Other Housing Developments

Updated 2/5/2021
Project Name Address Lot sq.ft Compl. Date # of Units # of BR1 Res.2 Non-Res. Total Acq. Cost3 Constr. Cost4 Soft Cost Total Dev. Cost w/land Local Subsidy5 Total Dev. Cost w/o
land Notes on Financing
Dr. George Davis Senior Comm. 1751 Carroll Ave 80,209 Jun-16 121 125 90,475 62,340 152,815 4,991,545$ 50,499,864$ 11,557,097$ 67,048,506$ 26,221,201$ 62,056,961$ 95 Laguna Senior 95 Lagnua 14,300 May-19 79 82 59,785 7,316 67,101 5,012,000$ 33,255,516$ 11,343,750$ 49,611,266$ 21,234,000$ 44,599,266$ 9% LIHTCEddy and Taylor Family Housing 222 Taylor 22,344 Jun-19 113 211 108,440 21,086 129,526 9,300,000$ 57,823,564$ 14,837,459$ 81,961,023$ 22,187,436$ 72,661,023$ 2 HCD Loans (MHP & TOD)Parcel O 455 Fell Street 37,428 Jun-19 108 165 82,117 31,128 113,245 -$ 58,274,173$ 9,994,087$ 66,648,743$ 17,309,250$ 66,648,743$ HCD AHSC Loan1296 Shotwell Senior 1296 Shotwell 11,667 Jan-20 94 94 66,153 - 66,153 831,098$ 46,018,314$ 7,922,792$ 54,772,204$ 27,812,014$ 53,941,106$ 4% LIHTC HOME AHF Completed Projects: Average: 33,190 103 135 81,394 30,468 105,768 5,033,661$ 49,174,286$ 11,131,037$ 64,008,348$ 22,952,780$ 59,981,420$
Project Name Address Lot sq.ft Compl. Date # of Units # of BR1 Res.2 Non-Res. Total Acq. Cost3 Constr. Cost4 Soft Cost Total Dev. Cost w/land Local Subsidy5 Total Dev. Cost w/o
land Notes on Financing
490 South Van Ness 490 S. Van Ness Avenue 14,250 Sep-20 81 121 51,639 28,985 80,624 18,500,000$ 43,647,993$ 13,393,811$ 75,541,804$ 28,892,030$ 57,041,804$ 1950 Mission Street 1950 Mission Street 36,590 Nov-20 157 262 113,432 48,142 161,574 9,775,000$ 85,644,853$ 15,171,496$ 110,591,349$ 44,945,740$ 100,816,349$ HCD AHSC Loan735 Davis Senior Housing 735 Davis 10,165 Nov-20 53 54 46,143 1,257 47,400 -$ 29,049,657$ 11,846,397$ 40,896,054$ 18,525,949$ 40,896,054$ 500 Turk Street (555 Larkin) 500 Turk Street 18,906 Dec-21 108 186 82,805 26,586 109,391 1,853,895$ 54,251,461$ 29,815,020$ 85,920,376$ 32,400,000$ 84,066,481$ HCD AHSC Loan1064 Mission Street 1064 Mission Street 50,844 Dec-21 258 258 152,519 5,391 157,910 1$ 106,427,164$ 37,557,505$ 143,984,670$ 46,638,404$ 143,984,669$ bond 4% credits AHP & NPLHMission Bay S. Block 9 410 China Basin Street 47,437 Jan-22 141 141 99,160 - 99,160 -$ 58,631,775$ 15,598,625$ 74,230,400$ 23,076,000$ 74,230,400$ HCD LoanCasa de la Mision 3001 24th Street 6,715 Apr-21 45 45 26,439 1,239 27,678 3,225,000$ 17,049,794$ 425,847$ 20,700,641$ 1,313,694$ 17,475,641$ 9% LIHTC & private donation681 Florida 681 Florida Street 19,000 Jun-22 130 199 126,830 9,250 136,080 125,091$ 69,184,293$ 20,545,793$ 89,855,177$ 33,826,507$ 89,730,086$ HCD MHP Loan53 Colton (Plumbers Union DA) 53 Colton 7,780 Dec-20 96 96 47,969 - 47,969 171,697$ 34,895,639$ 16,721,274$ 51,788,610$ 2,750,000$ 51,616,913$ 4% Fed & State; HCD MHP, AHP, $10M GM Cont.Under Construction: Average: 23,521 119 151 82,993 17,264 96,421 4,807,241$ 55,420,292$ 17,897,308$ 77,056,565 25,818,703 73,317,600
Project Name Address Lot sq.ft Start Date (anticipated) # of Units # of BR1 Res.2 Non-Res. Total Acq. Cost3 Constr. Cost4 Soft Cost Total Dev. Cost
w/land Local Subsidy Total Dev. Cost w/o land Notes on Financing
4840 Mission 4840 Mission 64,033 Mar-21 137 232 181,711 14,384 120,861 14,169,802$ 81,589,604$ 23,931,086$ 119,690,492$ 51,614,447$ 105,520,690$ HCD MHP Loan266 4th Steet 266 4th Street 8,400 Dec-21 70 99 60,515 1,580 62,095 133,100$ 49,982,213$ 13,943,417$ 64,058,730$ 15,629,817$ 63,925,630$ 4% Credits; AHSC, St. CreditsParcel U 78 Haight Street 5,583 Jun-21 63 63 44,327 3,349 47,676 24,643$ 33,982,932$ 18,703,273$ 52,710,848$ 22,289,234$ 52,686,205$ 9% Fed Credits & St. Credits600 7th Street (fmly. 801 Brannan) 600 7th Street 37,800 Apr-22 200 290 181,390 5,000 186,390 10,000$ 107,308,076$ 43,082,529$ 150,400,605$ 44,550,243$ 150,390,605$ Fed & St Credits; HCD IIG 180 Jones Street 180 Jones Street 4,853 Sep-21 70 70 36,116 3,304 39,420 100,000$ 36,262,793$ 17,576,236$ 53,939,029$ 15,200,000$ 53,839,029$ 4% LIHTC + MHP921 Howard 921 Howard Street 28,893 Apr-21 203 259 235,680 1,970 237,650 14,081,129$ 111,340,698$ 36,248,774$ 161,670,601$ 46,468,120$ 147,589,472$ CalHfa MIP/ 4% LIHTC4200 Geary 4200 Geary 16,738 Feb-22 98 98 83,109 2,442 85,551 10,500,000$ 60,847,004$ 19,645,140$ 90,992,144$ 35,251,638$ 80,492,144$ 4% Credits; HCD MHP. AHP, Private LoanLaguna Honda Senior 375 Laguna Honda Blvd Feb-24 200 204 212,000 13,000 225,000 15,000$ 97,750,000$ 20,222,441$ 117,987,441$ 47,272,441$ 117,972,441$ 4% Credits; IIG, HCD, AHPThe Kelsey 240 Van Ness 18,313 Jul-22 107 117 86,288 1,349 87,637 9,846 64,775,759 23,310,926 88,096,531 13,000,000 88,086,685 4% LIHTC , IIG, AHSC, Large Sponsor LoanIn Predevelopment Average: 23,077 128 159 124,571 5,153 121,364 4,338,169$ 71,537,676$ 24,073,758$ 99,949,603$ 32,363,993$ 95,611,434$
ALL PROJECTS Average: 26,596 116 149 96,319 17,628 107,851 4,726,357$ 58,710,751$ 17,700,701$ 80,338,172$ 27,045,159$ 76,303,484$
Transbay 2 West Senior Folsom bt Beale & Main 21,313 Jun-23 153 153 111,763 4,320 116,083 0 $78,574,411 $18,243,727 $96,818,138 $30,593,175 $96,818,138
Project Name Compl. Date Acq/unit Acq/BR Acq/lot sq.ft Const/unit Const/BR Const/sq.ft6 Soft/unit Soft/BR Soft/sq.ft6 Gross TDC/unit Gross TDC/BR Gross TDC/sq.ft6 Subsidy / unit Leveraging 7Dr. George Davis Senior Comm. Jun-16 41,252 39,932 62 417,354$ 403,999$ 330$ 95,513$ 92,457$ 76$ 554,120$ 536,388$ 439$ 216,704$ 60.9%95 Laguna Senior May-19 63,443 61,122 350 420,956$ 405,555$ 496$ 143,592$ 138,338$ 169$ 627,991$ 605,015$ 739$ 268,785$ 57.2%Eddy & Taylor Family Housing Jun-19 82,301 44,076 416 511,713$ 274,045$ 446$ 131,305$ 70,320$ 115$ 725,319$ 388,441$ 633$ 196,349$ 72.9%Parcel O Jun-19 - - - 539,576$ 353,177$ 515$ 92,538$ 60,570$ 211$ 617,118$ 403,932$ 589$ 160,271$ 74.0%1296 Shotwell Sr Jan-20 8,841 8,841 71 489,557$ 489,557$ 696$ 84,285$ 84,285$ 420$ 582,683$ 582,683$ 828$ 295,872$ 49.2%
Completed Projects: Average: 48,959 38,493 225 475,831$ 385,267$ 497$ 109,447$ 89,194$ 198$ 621,446$ 503,292$ 645$ 227,596$ 63%
Project Name Compl. Date Acq/unit Acq/BR Acq/lot sq.ft Const/unit Const/BR Const/sq.ft6 Soft/unit Soft/BR Soft/sq.ft6 Gross TDC/unit Gross TDC/BR Gross TDC/sq.ft6 Subsidy / unit Leveraging 7
490 South Van Ness Sep-20 228,395 152,893 1,298 538,864$ 360,727$ 541$ 165,356$ 110,693$ 166$ 932,615$ 624,312$ 937$ 356,692$ 61.8%1950 Mission Street Nov-20 62,261 37,309 267 545,509$ 326,889$ 530$ 96,634$ 57,906$ 94$ 704,403$ 422,104$ 684$ 286,279$ 59.4%735 Davis Senior Housing Nov-20 - - - 548,107$ 537,957$ 613$ 223,517$ 219,378$ 250$ 771,624$ 757,334$ 863$ 349,546$ 54.7%500 Turk Street (555 Larkin) Dec-21 17,166 9,967 98 502,328$ 291,675$ 496$ 276,065$ 160,296$ 273$ 795,559$ 461,938$ 785$ 300,000$ 62.3%1064 Mission Street Dec-21 0 0 0 412,508$ 412,508$ 674$ 145,572$ 145,572$ 238$ 558,080$ 558,080$ 912$ 180,769$ 67.6%Mission Bay S. Block 9 Jan-22 - - - 415,828$ 415,828$ 591$ 110,629$ 110,629$ 157$ 526,457$ 526,457$ 749$ 163,660$ 68.9%Casa de la Mision Apr-21 71,667 71,667 480 378,884$ 378,884$ 616$ 9,463$ 9,463$ 15$ 460,014$ 460,014$ 748$ 29,193$ 93.7%681 Florida Jun-22 962 629 7 532,187$ 347,660$ 508$ 158,045$ 103,245$ 151$ 691,194$ 451,534$ 660$ 260,204$ 62.4%53 Colton (Plumbers Union DA) Jun-22 1,789 1,789 22 363,496$ 363,496$ 727$ 174,180$ 174,180$ 349$ 539,465$ 539,465$ 1,080$ 28,646$ 94.7%
Under Construction: Average: 63,707 45,709 362 470,857$ 381,736$ 589$ 151,051$ 121,262$ 188$ 664,379$ 533,471$ 824$ 217,221$ 69%
Project Name Start Date (anticipated) Acq/unit Acq/BR Acq/lot sq.ft Const/unit Const/BR Const/sq.ft6 Soft/unit Soft/BR Soft/sq.ft6 Gross TDC/unit Gross TDC/BR Gross TDC/sq.ft6 Subsidy / unit Leveraging 7
4840 Mission Mar-21 103,429 61,077 221 595,545$ 351,679$ 675$ 174,679$ 103,151$ 198$ 873,653$ 515,907$ 990$ 376,748$ 56.9%266 4th Street at Folsom Dec-21 1,901 1,344 16 714,032$ 504,871$ 805$ 199,192$ 140,843$ 225$ 915,125$ 647,058$ 1,032$ 223,283$ 75.6%Parcel U Jun-21 391 391 4 539,412$ 539,412$ 713$ 296,877$ 296,877$ 392$ 836,680$ 836,680$ 1,106$ 353,797$ 57.7%600 7th Street Apr-22 50 34 0 536,540$ 370,028$ 576$ 215,413$ 148,560$ 231$ 752,003$ 518,623$ 807$ 222,751$ 70.4%180 Jones Street Sep-21 1,429 1,429 21 518,040$ 518,040$ 920$ 251,089$ 251,089$ 446$ 770,558$ 770,558$ 1,368$ 217,143$ 71.8%921 Howard Apr-21 69,365 54,367 487 548,476$ 429,887$ 469$ 178,565$ 139,957$ 153$ 796,407$ 624,211$ 680$ 228,907$ 71.3%4200 Geary Feb-22 107,143 107,143 627 620,888$ 620,888$ 711$ 200,461$ 200,461$ 230$ 928,491$ 928,491$ 1,064$ 359,711$ 61.3%Laguna Honda Senior Feb-24 75 74 488,750$ 479,167$ 434$ 101,112$ 99,130$ 90$ 589,937$ 578,370$ 524$ 236,362$ 59.9%The Kelsey Jul-22 92 84 1 605,381$ 553,639$ 739$ 217,859$ 199,239$ 266$ 823,332$ 752,962$ 1,005$ 121,495$ 85.2%
In Predevelopment Average: 31,542 25,105 172 574,118$ 485,290$ 671$ 203,916$ 175,478$ 248$ 809,576$ 685,873$ 953$ 260,022$ 68%
All Projects: AVERAGE 48,069 36,435 253 506,935$ 417,431$ 585$ 154,805$ 128,645$ 211$ 698,467$ 574,212$ 808$ 234,946$ 66.7%
Transbay 2 West Senior Jun-23 -$ -$ -$ 513,558$ 513,558$ 677$ 119,240$ 119,240$ 157$ 632,798$ 632,798$ 834$ 199,955$ 68.4%
0 items highlighted in yellow represent gaps in informatio 1 includes studios as 1BRs 2 Residential sq. ft. includes circulation, recreation (including on-grade and podium outdoor areas), office space and common areas; excludes day care centers, parking, and commercial (non-res 3 Acquisition includes cost of buying land/building including costs if City buys site; excludes demotion of existing buildi 4 Construction includes unit construction, site preparation/demolition (if applicable), site improvements, environmental remediation and hard cost contingency for Predev & During Construction. Completed projects include used Contingency and are escalated per ENR CCI d 5 All non-amortized local funds 6 Total square footage 7 Leveraging = subsidy/unit as % of TDC/uni 8 Land Costs do not include $6,150,000 in land costs MOHCD paid outside of the housing costs
Subsidy
Subsidy
Subsidy
Type IA, 18 stories, 3 parking spaces & retail (April 2020 SD estimate)
Type IIIA over Type I podium and basement, 6 stories, constrained site, efficiency studios
Type III over Type I, 7 stories, TI space, no parking, Urban Agriculture (Sept. 2020 SD Estimate)Type III over I, 7 stories
Type V over Type I Podium + retail + 39 spaces pkg + Health Clinic + POPO (8/27/20 50% CD)
Type I - 9 stories small very tight site (studios) (SD est. 5/29/20)
Type I , 8 stories over MUNI substation tunnel, structurally complex, small footprint
Comments
Type I, 7 stories over full basement, constrained site + childcare. (60% DD est. dated 10/2/20)Type I, 8 stories (SD pricing dated 11/20)
5 stories of Type III over 3 stories of Type I
Type IB - 8 story, extensive PG&E regional switch required
Building Square Footage Total Project Costs
Total Project Costs PROJECTS UNDER CONSTRUCTION Building Square Footage
Type IIIA over Type I podium - factory built
Type IIIA & V over Type I Podium (5-6 stories) - Senior
PROJECTS IN PREDEVELOPMENT
Type IA - 7 stories over partial basementType IA - 9 stories with significant (30% of sf) art and PDR spaces and Paseo Des Artes
Type I 8 stories on constrained site
Type V over Type I from approved eval dated 05/05/17
Comments
Type IB 9 stories, 8,400+/- PDR
Type IA 9 stories 1st PUC served Affordable Hsg. Including low-side metering, resilient seismic damper
Type IIIA factory builtType V over Type I podium
7 Story - 5 stories Type III over 2 stories Type IA + Community Services space (Open House)
Affordable Multifamily Housing New Construction Cost Comparison
PROJECTS COMPLETED Building Square Footage Total Project Costs
4 Type V over 2 Type IA. (bsmt pkg) & comml. Kitchen (significant non-res.)
Comments
Total Development Cost (Incl. Land)
PROJECTS UNDER CONSTRUCTION Acquisition Construction Soft Costs Total Development Cost (Incl. Land)
PROJECTS IN PREDEVELOPMENT Acquisition Construction Soft Costs
Total Development Cost (Incl. Land)Acquisition by Unit/Bed/SF Construction by Unit/Bed/SF Soft Costs By Unit/Bed/SFPROJECTS COMPLETED
2/5/2021

Evaluation of Request for Predevelopment Financing February 19, 2021 Transbay Block 2 West Page 35 of 38
Attachment H: Predevelopment Sources and Uses
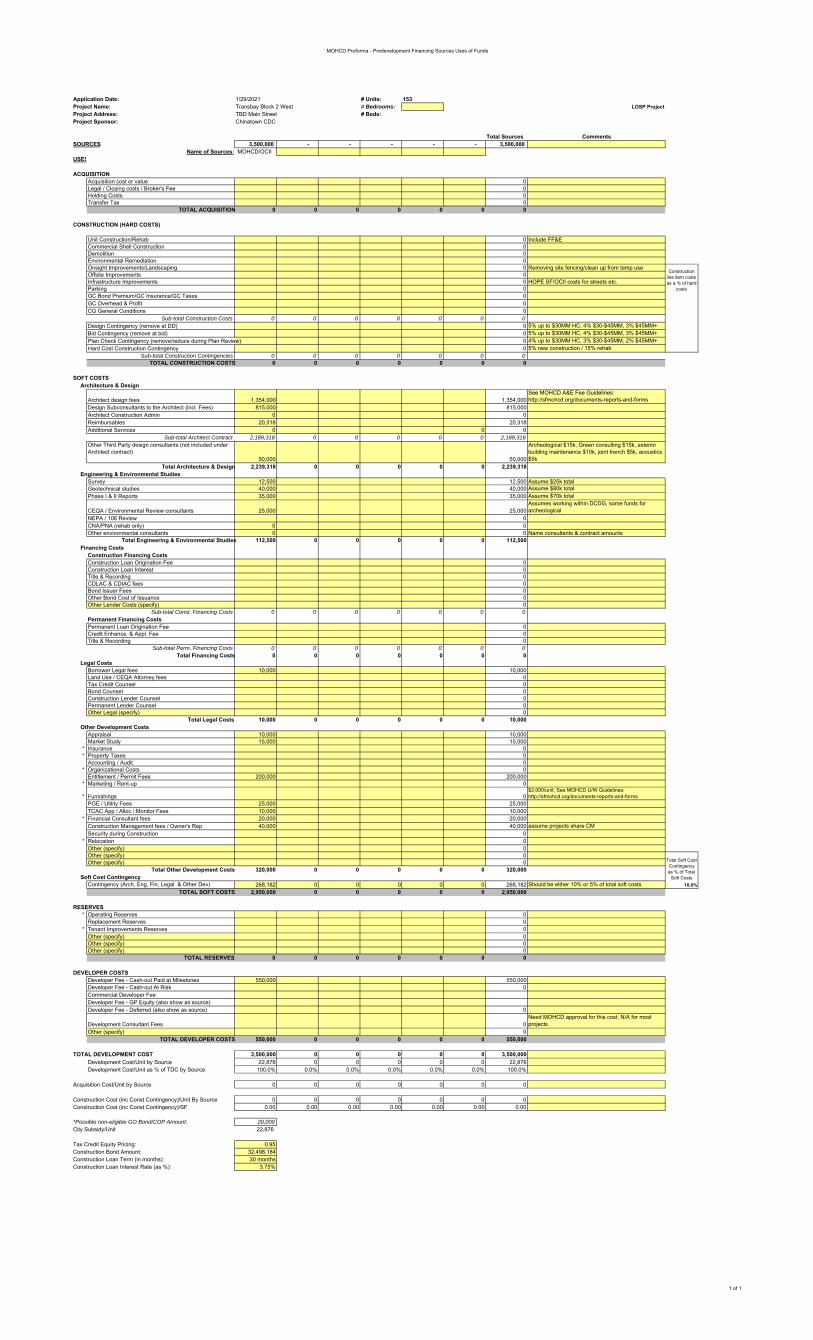
MOHCD Proforma - Predevelopment Financing Sources Uses of Funds
Application Date: 1/29/2021 # Units: 153Project Name: Transbay Block 2 West # Bedrooms: LOSP ProjectProject Address: TBD Main Street # Beds: Project Sponsor: Chinatown CDC
Total Sources CommentsSOURCES 3,500,000 - - - - - 3,500,000
Name of Sources: MOHCD/OCIIUSES
ACQUISITIONAcquisition cost or value 0Legal / Closing costs / Broker's Fee 0Holding Costs 0Transfer Tax 0
TOTAL ACQUISITION 0 0 0 0 0 0 0
CONSTRUCTION (HARD COSTS)
Unit Construction/Rehab 0 Include FF&ECommercial Shell Construction 0Demolition 0Environmental Remediation 0Onsight Improvements/Landscaping 0 Removing site fencing/clean up from temp useOffsite Improvements 0Infrastructure Improvements 0 HOPE SF/OCII costs for streets etc.Parking 0GC Bond Premium/GC Insurance/GC Taxes 0GC Overhead & Profit 0CG General Conditions 0
Sub-total Construction Costs 0 0 0 0 0 0 0Design Contingency (remove at DD) 0 5% up to $30MM HC, 4% $30-$45MM, 3% $45MM+Bid Contingency (remove at bid) 0 5% up to $30MM HC, 4% $30-$45MM, 3% $45MM+Plan Check Contingency (remove/reduce during Plan Review) 0 4% up to $30MM HC, 3% $30-$45MM, 2% $45MM+Hard Cost Construction Contingency 0 5% new construction / 15% rehab
Sub-total Construction Contingencies 0 0 0 0 0 0 0TOTAL CONSTRUCTION COSTS 0 0 0 0 0 0 0
SOFT COSTSArchitecture & Design
Architect design fees 1,354,000 1,354,000See MOHCD A&E Fee Guidelines: http://sfmohcd.org/documents-reports-and-forms
Design Subconsultants to the Architect (incl. Fees) 815,000 815,000Architect Construction Admin 0 0Reimbursables 20,318 20,318Additional Services 0 0 0
Sub-total Architect Contract 2,189,318 0 0 0 0 0 2,189,318Other Third Party design consultants (not included under Architect contract)
50,000 50,000
Archeological $15k, Green consulting $15k, exterior building maintenance $10k, joint trench $5k, acoustics $5k
Total Architecture & Design 2,239,318 0 0 0 0 0 2,239,318Engineering & Environmental Studies
Survey 12,500 12,500 Assume $25k totalGeotechnical studies 40,000 40,000 Assume $80k totalPhase I & II Reports 35,000 35,000 Assume $70k total
CEQA / Environmental Review consultants 25,000 25,000Assumes working within DCDG, some funds for archeological
NEPA / 106 Review 0CNA/PNA (rehab only) 0 0Other environmental consultants 0 0 Name consultants & contract amounts
Total Engineering & Environmental Studies 112,500 0 0 0 0 0 112,500Financing Costs
Construction Financing CostsConstruction Loan Origination Fee 0Construction Loan Interest 0Title & Recording 0CDLAC & CDIAC fees 0Bond Issuer Fees 0Other Bond Cost of Issuance 0Other Lender Costs (specify) 0
Sub-total Const. Financing Costs 0 0 0 0 0 0 0Permanent Financing CostsPermanent Loan Origination Fee 0Credit Enhance. & Appl. Fee 0Title & Recording 0
Sub-total Perm. Financing Costs 0 0 0 0 0 0 0Total Financing Costs 0 0 0 0 0 0 0
Legal CostsBorrower Legal fees 10,000 10,000Land Use / CEQA Attorney fees 0Tax Credit Counsel 0Bond Counsel 0Construction Lender Counsel 0Permanent Lender Counsel 0Other Legal (specify) 0
Total Legal Costs 10,000 0 0 0 0 0 10,000Other Development Costs
Appraisal 10,000 10,000Market Study 15,000 15,000
* Insurance 0* Property Taxes 0
Accounting / Audit 0* Organizational Costs 0
Entitlement / Permit Fees 200,000 200,000* Marketing / Rent-up 0
* Furnishings 0$2,000/unit; See MOHCD U/W Guidelines: http://sfmohcd.org/documents-reports-and-forms
PGE / Utility Fees 25,000 25,000TCAC App / Alloc / Monitor Fees 10,000 10,000
* Financial Consultant fees 20,000 20,000Construction Management fees / Owner's Rep 40,000 40,000 assume projects share CMSecurity during Construction 0
* Relocation 0Other (specify) 0Other (specify) 0Other (specify) 0
Total Other Development Costs 320,000 0 0 0 0 0 320,000Soft Cost Contingency
Contingency (Arch, Eng, Fin, Legal & Other Dev) 268,182 0 0 0 0 0 268,182 Should be either 10% or 5% of total soft costs. 10.0%TOTAL SOFT COSTS 2,950,000 0 0 0 0 0 2,950,000
RESERVES* Operating Reserves 0
Replacement Reserves 0* Tenant Improvements Reserves 0
Other (specify) 0Other (specify) 0Other (specify) 0
TOTAL RESERVES 0 0 0 0 0 0 0
DEVELOPER COSTSDeveloper Fee - Cash-out Paid at Milestones 550,000 550,000Developer Fee - Cash-out At Risk 0Commercial Developer FeeDeveloper Fee - GP Equity (also show as source)Developer Fee - Deferred (also show as source) 0
Development Consultant Fees 0Need MOHCD approval for this cost, N/A for most projects
Other (specify) 0TOTAL DEVELOPER COSTS 550,000 0 0 0 0 0 550,000
TOTAL DEVELOPMENT COST 3,500,000 0 0 0 0 0 3,500,000Development Cost/Unit by Source 22,876 0 0 0 0 0 22,876Development Cost/Unit as % of TDC by Source 100.0% 0.0% 0.0% 0.0% 0.0% 0.0% 100.0%
Acquisition Cost/Unit by Source 0 0 0 0 0 0 0
Construction Cost (inc Const Contingency)/Unit By Source 0 0 0 0 0 0 0Construction Cost (inc Const Contingency)/SF 0.00 0.00 0.00 0.00 0.00 0.00 0.00
*Possible non-eligible GO Bond/COP Amount: 20,000City Subsidy/Unit 22,876
Tax Credit Equity Pricing: 0.95Construction Bond Amount: 32,498,184Construction Loan Term (in months): 30 monthsConstruction Loan Interest Rate (as %): 3.75%
Construction line item costs as a % of hard
costs
Total Soft Cost Contingency as % of Total
Soft Costs
1 of 1

Evaluation of Request for Predevelopment Financing February 19, 2021 Transbay Block 2 West Page 36 of 38
Attachment I: Permanent Development Budget

MOHCD Proforma - Permanent Financing Sources Uses of Funds
Application Date: 1/29/2021 # Units: 153Project Name: Transbay Block 2 West # Bedrooms: 153 LOSP ProjectProject Address: TBD Main Street # Beds: Project Sponsor: Chinatown CDC
Total Sources Comments
SOURCES 30,593,175 - 20,000,000 1,200,000 3,000,000 35,024,963 7,000,000 96,818,138 Willing to add perm debt and higher AMIs if City deems appropriate.
Name of Sources: MOHCD/OCII HCD - MHP Loan
FHLB - AHP Loan GP Equity LP Equity
IIG - Sponsor Loan
USES
ACQUISITIONAcquisition cost or value 0Legal / Closing costs / Broker's Fee 0 0Holding Costs 0Transfer Tax 0
TOTAL ACQUISITION 0 0 0 0 0 0 0 0
CONSTRUCTION (HARD COSTS)
Unit Construction/Rehab 28,359,473 20,000,000 1,200,000 428,364 3,997,792 53,985,629 Include FF&ECommercial Shell Construction 2,699,183 2,699,183Demolition 300,000 300,000Environmental Remediation 0Onsight Improvements/Landscaping 2,500,000 2,500,000Offsite Improvements 502,208 502,208Infrastructure Improvements 0 incl in hard costParking 0GC Bond Premium/GC Insurance/GC Taxes 977,850 977,850 1.6%GC Overhead & Profit 2,120,845 2,120,845 3.5%CG General Conditions 3,511,068 3,511,068 5.9%
Sub-total Construction Costs 28,659,473 0 20,000,000 1,200,000 0 9,737,310 7,000,000 66,596,783Design Contingency (remove at DD) 2,994,407 2,994,407 5% up to $30MM HC, 4% $30-$45MM, 3% $45MM+ 5.0%Bid Contingency (remove at bid) 2,994,407 2,994,407 5% up to $30MM HC, 4% $30-$45MM, 3% $45MM+ 5.0%Plan Check Contingency (remove/reduce during Plan Revie 0 2,994,407 2,994,407 4% up to $30MM HC, 3% $30-$45MM, 2% $45MM+ 5.0%Hard Cost Construction Contingency 0 2,994,407 2,994,407 5% new construction / 15% rehab 5.0%
Sub-total Construction Contingencies 0 0 0 0 0 11,977,628 0 11,977,628TOTAL CONSTRUCTION COSTS 28,659,473 0 20,000,000 1,200,000 0 21,714,938 7,000,000 78,574,411
SOFT COSTSArchitecture & Design
Architect design fees 834,707 1,294,093 2,128,800See MOHCD A&E Fee Guidelines: http://sfmohcd.org/documents-reports-and-forms
Design Subconsultants to the Architect (incl. Fees) 573,045 573,745 1,146,790Architect Construction Admin 0Reimbursables 10,159 10,159 20,318Additional Services 0 0
Sub-total Architect Contract 1,417,911 0 0 0 0 1,877,997 0 3,295,908Other Third Party design consultants (not included under Architect contract) 175,000 225,000 400,000
Consultants not covered under architect contract; name consultant type and contract amount
Total Architecture & Design 1,592,911 0 0 0 0 2,102,997 0 3,695,908Engineering & Environmental Studies
Survey 12,500 12,500Geotechnical studies 50,000 50,000Phase I & II Reports 35,000 35,000CEQA / Environmental Review consultants 25,000 25,000NEPA / 106 Review 0 0CNA/PNA (rehab only) 0 0Other environmental consultants 0 0 Name consultants & contract amounts
Total Engineering & Environmental Studies 0 0 0 0 0 122,500 0 122,500Financing Costs
Construction Financing Costs
Construction Loan Origination Fee 450,000 450,000 Includes construction lender expenses and counselConstruction Loan Interest 2,149,422 2,149,422Title & Recording 100,000 100,000CDLAC & CDIAC fees 20,064 20,064Bond Issuer Fees 251,067 251,067Other Bond Cost of Issuance 40,000 40,000 80,000 Includes Trustee FeeCOI Contingency 15,000 15,000
Sub-total Const. Financing Costs 140,000 0 0 0 0 2,925,553 0 3,065,553Permanent Financing CostsPermanent Loan Origination Fee 0Credit Enhance. & Appl. Fee 0Title & Recording 0
Sub-total Perm. Financing Costs 0 0 0 0 0 0 0 0Total Financing Costs 140,000 0 0 0 0 2,925,553 0 3,065,553
Legal CostsBorrower Legal fees 67,250 67,250Land Use / CEQA Attorney fees 0Tax Credit Counsel 90,000 90,000 Includes Syndicator due diligenceBond Counsel 87,500 87,500Construction Lender Counsel 75,000 75,000Permanent Lender Counsel 0 Included aboveOCII Counsel & Financial Advisor 120,000 120,000
Total Legal Costs 0 0 0 0 0 439,750 0 439,750Other Development Costs
Appraisal 10,000 10,000Market Study 15,000 15,000
* Insurance 1,120,000 1,120,000* Property Taxes 0
Accounting / Audit 40,000 40,000* Organizational Costs 100,000 100,000 partnership and syndication legal
Entitlement / Permit Fees 1,264,111 1,264,111* Marketing / Rent-up 360,200 360,200
* Furnishings 267,700 267,700$2,000/unit; See MOHCD U/W Guidelines on: http://sfmohcd.org/documents-reports-and-forms
PGE / Utility Fees 400,000 400,000TCAC App / Alloc / Monitor Fees 104,447 104,447
* Financial Consultant fees 65,000 65,000Construction Management fees / Owner's Rep 150,000 150,000Security during Construction 100,000 100,000
* Relocation 0000
Total Other Development Costs 25,000 0 0 0 0 3,971,458 0 3,996,458Soft Cost Contingency
Contingency (Arch, Eng, Fin, Legal & Other Dev) 175,791 0 0 0 0 956,226 0 1,132,017 Should be either 10% or 5% of total soft costs. 10.0%TOTAL SOFT COSTS 1,933,702 0 0 0 0 10,518,484 0 12,452,186
RESERVES* Operating Reserves 415,541 415,541
Replacement Reserves 0* Tenant Improvements Reserves 176,000 176,000
Other (specify) 0Other (specify) 0Other (specify) 0
TOTAL RESERVES 0 0 0 0 0 591,541 0 591,541
DEVELOPER COSTSDeveloper Fee - Cash-out Paid at Milestones 1,100,000 1,100,000Developer Fee - Cash-out At Risk 1,100,000 1,100,000Commercial Developer Fee 0Developer Fee - GP Equity (also show as source) 3,000,000 3,000,000Developer Fee - Deferred (also show as source) 0
Development Consultant Fees 0Need MOHCD approval for this cost, N/A for most projects
Other (specify) 0TOTAL DEVELOPER COSTS 0 0 0 0 3,000,000 2,200,000 0 5,200,000
TOTAL DEVELOPMENT COST 30,593,175 0 20,000,000 1,200,000 3,000,000 35,024,963 7,000,000 96,818,138Development Cost/Unit by Source 199,955 0 130,719 7,843 19,608 228,921 45,752 632,798Development Cost/Unit as % of TDC by Source 31.6% 0.0% 20.7% 1.2% 3.1% 36.2% 7.2% 100.0%
Acquisition Cost/Unit by Source 0 0 0 0 0 0 0 0
Construction Cost (inc Const Contingency)/Unit By Source 187,317 0 130,719 7,843 0 141,928 45,752 513,558Construction Cost (inc Const Contingency)/SF 246.89 0.00 172.29 10.34 0.00 187.06 60.30 676.88
*Possible non-eligible GO Bond/COP Amount: 28,659,473City Subsidy/Unit 199,955
Tax Credit Equity Pricing: 0.900Construction Bond Amount: 58,888,275Construction Loan Term (in months): 30 monthsConstruction Loan Interest Rate (as %): 3.65%
Total Soft Cost Contingency as % of Total
Soft Costs
Construction line item costs as a % of hard
costs
1 of 1

Evaluation of Request for Predevelopment Financing February 19, 2021 Transbay Block 2 West Page 37 of 38
Attachment J: First Year Operating Budget

MOHCD Proforma - Year 1 Operating Budget
Application Date: 1/29/2021 LOSP UnitsNon-LOSP
Units Project Name:Total # Units: 153 30.4 123 Project Address:First Year of Operations (provide data assuming that Year 1 is a full year, i.e. 12 months of operations): 2025 Project Sponsor:
20% 80% Correct errors noted in Col N!INCOME LOSP non-LOSP Total Comments
108,000 1,776,564 1,884,5640 0 0
240,947 240,9470
0 0 00 0 00 00 0 0
1,989 7,956 9,9450 0 00 0 0
00 0
Gross Potential Income 350,936 1,784,520 2,135,4565,400 (88,828) (94,228)
0 0 00
EFFECTIVE GROSS INCOME 356,336 1,695,692 2,041,228 PUPA: 13,341
OPERATING EXPENSESManagement
23,868 95,472 119,3404,380 17,520 21,900
Sub-total Management Expenses 28,248 112,992 141,240 PUPA: 923Salaries/Benefits
38,659 154,636 193,29516,000 64,000 80,00028,598 114,391 142,989
0 00 0
Sub-total Salaries/Benefits 83,257 333,027 416,284 PUPA: 2,721Administration
1,020 4,080 5,1007,850 31,400 39,250
0 0 0500 2,000 2,500
2,142 8,568 10,7103,507 14,027 17,534
120 480 6002,938 11,750 14,688
Sub-total Administration Expenses 18,076 72,305 90,382 PUPA: 591Utilities
10,000 40,000 50,0008,000 32,000 40,000
0 015,000 60,000 75,000
Sub-total Utilities 33,000 132,000 165,000 PUPA: 1,078Taxes and Licenses
400 1,600 2,0007,906 31,623 39,5293,090 12,362 15,452
Sub-total Taxes and Licenses 11,396 45,585 56,981 PUPA: 372Insurance
24,000 96,000 120,0000 0
6,201 24,802 31,0030 0
Sub-total Insurance 30,201 120,802 151,003 PUPA: 987Maintenance & Repair
40,370 161,480 201,8504,070 16,279 20,349
11,592 46,368 57,96014,000 56,000 70,000
0 010,600 42,400 53,000
0 031,048 124,193 155,241
Sub-total Maintenance & Repair Expenses 111,680 446,720 558,400 PUPA: 3,650
0 82,875 82,8750
315,858 1,346,307 1,662,165 PUPA: 10,864
Reserves/Ground Lease Base Rent/Bond Fees3,000 12,000 15,000 Ground lease with MOHCD
0 015,300 61,200 76,500
0 00 00 0
0Sub-total Reserves/Ground Lease Base Rent/Bond Fees 18,300 73,200 91,500 PUPA: 598 Min DSCR: 1.09
Mortgage Rate: 5.00%
334,158 1,419,507 1,753,665 PUPA: 11,462 Term (Years): 30Supportable 1st Mortgage Pmt: 263,819
NET OPERATING INCOME (INCOME minus OP EXPENSES) 22,178 276,185 287,563 PUPA: 1,879 Supportable 1st Mortgage Amt: $4,095,389Proposed 1st Mortgage Amt: $35,024,963
DEBT SERVICE/MUST PAY PAYMENTS ("hard debt"/amortized loans)0 0 0
16,800 67,200 84,000 HCD - MHP Loan0 0 00 0 0
0TOTAL HARD DEBT SERVICE 16,800 67,200 84,000 PUPA: 549
CASH FLOW (NOI minus DEBT SERVICE) 5,378 208,985 203,563Commercial Only Cash Flow 0Allocation of Commercial Surplus to LOPS/non-LOSP (residual income) 0 0AVAILABLE CASH FLOW 5,378 208,985 203,563USES OF CASH FLOW BELOW (This row also shows DSCR.) 3.42USES THAT PRECEDE MOHCD DEBT SERVICE IN WATERFALL
0 04,378 17,512 21,8901,000 4,000 5,000
0 00 00 00 0 Def. Develop. Fee split: 0%
TOTAL PAYMENTS PRECEDING MOHCD 5,378 21,512 26,890 PUPA: 176
0 187,473 176,673Residual Receipts Calculation
Yes Project has MOHCD ground lease? YesNo
Max Deferred Developer Fee/Borrower % of Residual Receipts in Yr 1: 33%67%
Soft Debt Lenders with Residual Receipts Obligations (Select lender name/program from drop down) Total Principal AmtDistrib. of Soft
Debt Loans$29,184,178 59.16%
MOHCD/OCII - Ground Lease Value or Land Acq Cost $150,000 0.30%$20,000,000 40.54%
0.00%0.00%
MOHCD RESIDUAL RECEIPTS DEBT SERVICE70,033 70,03370,033 70,033
0 0
106,640
NON-MOHCD RESIDUAL RECEIPTS DEBT SERVICE47,749 67% of residual receipts, multiplied by 40.54% -- HCD - MHP Loan's pro rata share of all soft d
00
Total Non-MOHCD Residual Receipts Debt Service 47,749
REMAINDER (Should be zero unless there are distributions below) 58,891
58,8910
Final Balance (should be zero) 0
Other Salaries/BenefitsAdministrative Rent-Free Unit
Advertising and MarketingOffice ExpensesOffice Rent
Management FeeAsset Management Fee
Office SalariesManager's SalaryHealth Insurance and Other Benefits
7.65% of total payrolllocal fees
Interest Income - Project Operations
Other Commercial Income
Laundry and VendingTenant ChargesMiscellaneous Residential Income
Withdrawal from Capitalized Reserve (deposit to operating account)
Vacancy Loss - Residential - Tenant RentsVacancy Loss - Residential - Tenant Assistance PaymentsVacancy Loss - Commercial
LOSP/non-LOSP Allocation
Used $300/unit Tenant portion, per RFP.
Residential - Tenant RentsResidential - Tenant Assistance Payments (Non-LOSP)Residential - LOSP Tenant Assistance PaymentsCommercial SpaceResidential ParkingMiscellaneous Rent IncomeSupportive Services Income
100% of Borrower share of 33% of residual receipts
All MOHCD/OCII Loans payable from res. rects
HCD - MHP Loan
If applicable, MOHCD residual receipts amt due LESS amt proposed for loan repymt.
Provide additional comments here, if needed.
Enter/override amount of residual receipts proposed for loan repayment.
Willing to add perm debt/higher AMI units if necessaryProvide additional comments here, if needed.Provide additional comments here, if needed.
67% of residual receipts, multiplied by 59.46% -- MOHCD's pro rata share of all soft debt
Links from 'Commercial Op. Budget' Worksheet
1st Year to be set according to HUD schedule.
includes after hours front desk/security staffing
$9.50 PUPM
Links from 'New Proj - Rent & Unit Mix' WorksheetLinks from 'New Proj - Rent & Unit Mix' Worksheet
Master Lease to cover commercial expenses
Links from 'Utilities & Other Income' WorksheetAssuming separate HSH contract for LOSP Case MgmtLinks from 'Utilities & Other Income' WorksheetLinks from 'Utilities & Other Income' WorksheetLinks from 'Utilities & Other Income' WorksheetLinks from 'Utilities & Other Income' WorksheetLinks from 'Commercial Op. Budget' Worksheet
Vacancy loss is 5% of Tenant Rents.#DIV/0!Links from 'Commercial Op. Budget' Worksheet
Links from 'Utilities & Other Income' Worksheet
TOTAL OPERATING EXPENSES
TOTAL OPERATING EXPENSES (w/ Reserves/GL Base Rent/ Bond Fees)
REMAINING BALANCE AFTER MOHCD RESIDUAL RECEIPTS DEBT SERVICE
Links from 'Commercial Op. Budget' Worksheet
Links from 'Commercial Op. Budget' Worksheet
Provide additional comments here, if needed.
1.0 FTE RSC + fringe+10% supervision+15%admin, per HCD regs. Remaining-HSH
$500/unit/yr
Ground Lease Base Rent Bond Monitoring Fee Replacement Reserve DepositOperating Reserve DepositOther Required Reserve 1 Deposit
HVAC Repairs and MaintenanceVehicle and Maintenance Equipment Operation and RepairsMiscellaneous Operating and Maintenance Expenses
Supportive Services
Director's & Officers' Liability Insurance
Payroll
ContractsGarbage and Trash RemovalSecurity Payroll/Contract
Legal Expense - Property
Bad Debts
Electricity
Supplies
Audit ExpenseBookkeeping/Accounting Services
Miscellaneous
WaterGasSewer
Real Estate TaxesPayroll TaxesMiscellaneous Taxes, Licenses and Permits
Property and Liability InsuranceFidelity Bond InsuranceWorker's Compensation
Will Project Defer Developer Fee?
Commercial Expenses
Hard Debt - Fourth Lender Commercial Hard Debt Service
Deferred Developer Fee (Enter amt <= Max Fee from cell I130)
"Below-the-line" Asset Mgt fee (uncommon in new projects, see policy)Partnership Management Fee (see policy for limits)
Other Required Reserve 2 DepositRequired Reserve Deposit/s, Commercial
Hard Debt - First LenderHard Debt - Second Lender (HCD Program 0.42% pymt, or other 2nd LenHard Debt - Third Lender (Other HCD Program, or other 3rd Lender)
Investor Service Fee (aka "LP Asset Mgt Fee") (see policy for limits)Other PaymentsNon-amortizing Loan Pmnt - Lender 1 (select lender in comments field) Non-amortizing Loan Pmnt - Lender 2 (select lender in comments field)
Provide additional comments here, if needed.
Provide additional comments here, if needed.
Ground Lease Value
Transbay Block 2 WestTBD Main Street
Chinatown CDC
Other Distributions/Uses
Proposed MOHCD Residual Receipts Amount to Residual Ground Lease
HCD Residual Receipts Amount DueLender 4 Residual Receipts DueLender 5 Residual Receipts Due
Owner Distributions/Incentive Management Fee
Provide additional comments here, if needed.
HCD (soft debt loan) - Lender 3Other Soft Debt Lender - Lender 4 Other Soft Debt Lender - Lender 5
MOHCD Residual Receipts Amount DueProposed MOHCD Residual Receipts Amount to Loan Repayment
MOHCD/OCII - Soft Debt Loans
Does Project have a MOHCD Residual Receipt Obligation?
% of Residual Receipts available for distribution to soft debt lenders in
RESIDUAL RECEIPTS (CASH FLOW minus PAYMENTS PRECEDING MOHCD)
1 of 1

Evaluation of Request for Predevelopment Financing February 19, 2021 Transbay Block 2 West Page 38 of 38
Attachment K: 20-Year Operating Pro Forma

MOHCD Proforma - 20 Year Cash Flow Summary
Transbay Block 2 West Year 1 Year 2 Year 3
Total # Units: 2025 2026 2027153 30.4 123
20.00% 80.00%
INCOME% annual inc LOSP
% annual increase LOSP non-LOSP Total LOSP non-LOSP Total LOSP non-LOSP Total LOSP non-LOSP
Residential - Tenant Rents 1.0% 2.5% 108,000 1,776,564 1,884,564 109,080 1,820,978 1,930,058 110,171 1,866,503 1,976,673 111,273 1,913,165 Residential - Tenant Assistance Payments (Non-LOSP n/a n/a - - - - - - - - - - - Residential - LOSP Tenant Assistance Payments n/a n/a 240,947 - 240,947 256,348 - 256,348 266,703 - 266,703 277,447 - Commercial Space n/a 2.5% - - - - - - - - - - - Other Income - - - - - - - - - - -
Gross Potential Income 350,936 1,784,520 2,135,456 367,467 1,829,133 2,196,600 378,963 1,874,861 2,253,825 390,861 1,921,733 Vacancy Loss - Residential - Tenant Rents n/a n/a 5,400 (88,828) (94,228) (5,454) (91,049) (96,503) (5,509) (93,325) (98,834) (5,564) (95,658) Vacancy Loss - Residential - Tenant Assistance Payments n/a n/a - - - - - - - - - - - Vacancy Loss - Commercial n/a n/a - - - - - - - - - - -
EFFECTIVE GROSS INCOME 356,336 1,695,692 2,041,228 362,013 1,738,084 2,100,097 373,455 1,781,536 2,154,991 385,297 1,826,075
OPERATING EXPENSESManagement 3.5% 3.5% 28,248 112,992 141,240 29,237 116,947 146,183 30,260 121,040 151,300 31,319 125,276 Salaries/Benefits 3.5% 3.5% 83,257 333,027 416,284 86,171 344,683 430,854 89,187 356,747 445,934 92,308 369,233 Administration 3.5% 3.5% 18,076 72,305 90,382 18,709 74,836 93,545 19,364 77,455 96,819 20,042 80,166 Utilities 3.5% 3.5% 33,000 132,000 165,000 34,155 136,620 170,775 35,350 141,402 176,752 36,588 146,351 Taxes and Licenses 3.5% 3.5% 11,396 45,585 56,981 11,795 47,180 58,975 12,208 48,832 61,039 12,635 50,541 Insurance 3.5% 3.5% 30,201 120,802 151,003 31,258 125,030 156,288 32,352 129,407 161,758 33,484 133,936 Maintenance & Repair 3.5% 3.5% 111,680 446,720 558,400 115,589 462,355 577,944 119,634 478,538 598,172 123,822 495,286 Supportive Services 3.5% 3.5% - 82,875 82,875 - 85,776 85,776 - 88,778 88,778 - 91,885 Commercial Expenses - - - - - - - - - - -
TOTAL OPERATING EXPENSES 315,858 1,346,307 1,662,165 326,913 1,393,428 1,720,341 338,355 1,442,198 1,780,552 350,197 1,492,674 PUPA (w/o Reserves/GL Base Rent/Bond Fees) 10,864
Reserves/Ground Lease Base Rent/Bond FeesGround Lease Base Rent 3000 12000 15,000 3000 12000 15,000 3000 12000 15,000 3000 12000Bond Monitoring Fee 0 0 0 0 0 0 0 0 0 0 0Replacement Reserve Deposit 15300 61200 76,500 15300 61200 76,500 15300 61200 76,500 15300 61200Operating Reserve Deposit 0 0 0 0 0 0 0 0 0 0 0Other Required Reserve 1 Deposit 0 0 0 0 0 0 0 0 0 0 0Other Required Reserve 2 Deposit 0 0 0 0 0 0 0 0 0 0 0Required Reserve Deposit/s, Commercial 0 0 0 0 0 0 0 0 0 0 0Sub-total Reserves/Ground Lease Base Rent/Bond Fees 18,300 73,200 91,500 18,300 73,200 91,500 18,300 73,200 91,500 18,300 73,200
TOTAL OPERATING EXPENSES (w/ Reserves/GL Base Rent/ Bond Fees) 334,158 1,419,507 1,753,665 345,213 1,466,628 1,811,841 356,655 1,515,398 1,872,052 368,497 1,565,874 PUPA (w/ Reserves/GL Base Rent/Bond Fees) 11,462
NET OPERATING INCOME (INCOME minus OP EXPENSES) 22,178 276,185 287,563 16,800 271,457 288,257 16,800 266,139 282,939 16,800 260,200
DEBT SERVICE/MUST PAY PAYMENTS ("hard debt"/amortized loans)Hard Debt - First Lender - - - - - - - - - - - Hard Debt - Second Lender (HCD Program 0.42% pymt, or other 2nd Lender) 16,800 67,200 84,000 16,800 67,200 84,000 16,800 67,200 84,000 16,800 67,200 Hard Debt - Third Lender (Other HCD Program, or other 3rd Lender) - - - - - - - - - - - Hard Debt - Fourth Lender - - - - - - - - - - - Commercial Hard Debt Service - - - - - - - - - - -
TOTAL HARD DEBT SERVICE 16,800 67,200 84,000 16,800 67,200 84,000 16,800 67,200 84,000 16,800 67,200 CASH FLOW (NOI minus DEBT SERVICE) 5,378 208,985 203,563 (0) 204,257 204,257 - 198,939 198,939 (0) 193,000
USES OF CASH FLOW BELOW (This row also shows DSCR.) DSCR: 3.42 3.43 3.37USES THAT PRECEDE MOHCD DEBT SERVICE IN WATERFALLDeferred Developer Fee (Enter amt <= Max Fee from row 131) - - - - - - - - - - - "Below-the-line" Asset Mgt fee (uncommon in new projects, see policy 3.5% 3.5% - - - - - - - - - - - Partnership Management Fee (see policy for limits 3.5% 3.5% 4,378 17,512 21,890 - - - - - - - - Investor Service Fee (aka "LP Asset Mgt Fee") (see policy for limits 1,000 4,000 5,000 - - - - - - - - Other Payments - - - - - - - - - - - Non-amortizing Loan Pmnt - Lender 1 - - - - - - - - - - - Non-amortizing Loan Pmnt - Lender 2 - - - - - - - - - - -
TOTAL PAYMENTS PRECEDING MOHCD 5,378 21,512 26,890 - - - - - - - -
RESIDUAL RECEIPTS (CASH FLOW minus PAYMENTS PRECEDING MOHCD) - 187,473 176,673 (0) 204,257 204,257 - 198,939 198,939 (0) 193,000
Does Project have a MOHCD Residual Receipt Obligation? YesWill Project Defer Developer Fee? NoResidual Receipts split for all years. - Lender/Owne 67% / 33%
Dist. SoftMOHCD RESIDUAL RECEIPTS DEBT SERVICE Debt Loans
MOHCD Residual Receipts Amount Due 59.46% 70,033 80,967 78,859 Proposed MOHCD Residual Receipts Amount to Residual Ground Lease - - - Proposed MOHCD Residual Receipts Amount to Replacement Reserve - - -
REMAINING BALANCE AFTER MOHCD RESIDUAL RECEIPTS DEBT SERVICE 106,640 123,289 120,079
NON-MOHCD RESIDUAL RECEIPTS DEBT SERVICEHCD Residual Receipts Amount Due 40.54% 47,749 55,204 53,766 Lender 4 Residual Receipts Due 0.00% - - - Lender 5 Residual Receipts Due 0.00% - - - Total Non-MOHCD Residual Receipts Debt Service 47,749 55,204 53,766
REMAINDER (Should be zero unless there are distributions below 58,891 68,086 66,313 Owner Distributions/Incentive Management Fee 58,891 68,086 66,313 Other Distributions/Uses - - - Final Balance (should be zero) - - -
RR Running Balance 76,500 153,000 229,500 OR Running Balance - - -
Other Required Reserve 1 Running Balance - - - Other Required Reserve 2 Running Balance - - -
DEFERRED DEVELOPER FEE - RUNNING BALANCEDeveloper Fee Starting Balance - - - Deferred Developer Fee Earned in Year - - -
Developer Fee Remaining Balance - - -
Non-LOSP Units
LOSP Units
Year 1 Year 2 Year 3 Year 42026 2027 20282025
1 of 6

MOHCD Proforma - 20 Year Cash Flow Summary
Transbay Block 2 West
Total # Units:153 30.4 123
20.00% 80.00%
INCOME% annual inc LOSP
% annual increase
Residential - Tenant Rents 1.0% 2.5%Residential - Tenant Assistance Payments (Non-LOSP n/a n/aResidential - LOSP Tenant Assistance Payments n/a n/aCommercial Space n/a 2.5%Other Income
Gross Potential IncomeVacancy Loss - Residential - Tenant Rents n/a n/aVacancy Loss - Residential - Tenant Assistance Payments n/a n/aVacancy Loss - Commercial n/a n/a
EFFECTIVE GROSS INCOME
OPERATING EXPENSESManagement 3.5% 3.5%Salaries/Benefits 3.5% 3.5%Administration 3.5% 3.5%Utilities 3.5% 3.5%Taxes and Licenses 3.5% 3.5%Insurance 3.5% 3.5%Maintenance & Repair 3.5% 3.5%Supportive Services 3.5% 3.5%Commercial Expenses
TOTAL OPERATING EXPENSES PUPA (w/o Reserves/GL Base Rent/Bond Fees)
Reserves/Ground Lease Base Rent/Bond FeesGround Lease Base Rent Bond Monitoring Fee Replacement Reserve DepositOperating Reserve DepositOther Required Reserve 1 DepositOther Required Reserve 2 DepositRequired Reserve Deposit/s, CommercialSub-total Reserves/Ground Lease Base Rent/Bond Fees
TOTAL OPERATING EXPENSES (w/ Reserves/GL Base Rent/ Bond Fees)PUPA (w/ Reserves/GL Base Rent/Bond Fees)
NET OPERATING INCOME (INCOME minus OP EXPENSES)
DEBT SERVICE/MUST PAY PAYMENTS ("hard debt"/amortized loans)Hard Debt - First LenderHard Debt - Second Lender (HCD Program 0.42% pymt, or other 2nd Lender)Hard Debt - Third Lender (Other HCD Program, or other 3rd Lender)Hard Debt - Fourth Lender Commercial Hard Debt Service
TOTAL HARD DEBT SERVICECASH FLOW (NOI minus DEBT SERVICE)
USES OF CASH FLOW BELOW (This row also shows DSCR.) DSCR:USES THAT PRECEDE MOHCD DEBT SERVICE IN WATERFALLDeferred Developer Fee (Enter amt <= Max Fee from row 131)"Below-the-line" Asset Mgt fee (uncommon in new projects, see policy 3.5% 3.5%Partnership Management Fee (see policy for limits 3.5% 3.5%Investor Service Fee (aka "LP Asset Mgt Fee") (see policy for limitsOther PaymentsNon-amortizing Loan Pmnt - Lender 1Non-amortizing Loan Pmnt - Lender 2
TOTAL PAYMENTS PRECEDING MOHCD
RESIDUAL RECEIPTS (CASH FLOW minus PAYMENTS PRECEDING MOHCD)
Does Project have a MOHCD Residual Receipt Obligation? YesWill Project Defer Developer Fee? NoResidual Receipts split for all years. - Lender/Owne 67% / 33%
Dist. SoftMOHCD RESIDUAL RECEIPTS DEBT SERVICE Debt Loans
MOHCD Residual Receipts Amount Due 59.46%Proposed MOHCD Residual Receipts Amount to Residual Ground LeaseProposed MOHCD Residual Receipts Amount to Replacement Reserve
REMAINING BALANCE AFTER MOHCD RESIDUAL RECEIPTS DEBT SERVICE
NON-MOHCD RESIDUAL RECEIPTS DEBT SERVICEHCD Residual Receipts Amount Due 40.54%Lender 4 Residual Receipts Due 0.00%Lender 5 Residual Receipts Due 0.00%Total Non-MOHCD Residual Receipts Debt Service
REMAINDER (Should be zero unless there are distributions belowOwner Distributions/Incentive Management FeeOther Distributions/UsesFinal Balance (should be zero)
RR Running BalanceOR Running Balance
Other Required Reserve 1 Running BalanceOther Required Reserve 2 Running Balance
DEFERRED DEVELOPER FEE - RUNNING BALANCEDeveloper Fee Starting BalanceDeferred Developer Fee Earned in Year
Developer Fee Remaining Balance
Non-LOSP Units
LOSP Units
Year 4 Year 5 Year 6 Year 7
2028 2029 2030 2031
Total LOSP non-LOSP Total LOSP non-LOSP Total LOSP non-LOSP Total LOSP2,024,438 112,385 1,960,994 2,073,379 113,509 2,010,019 2,123,528 114,644 2,060,270 2,174,914 115,791
- - - - - - - - - - - 277,447 288,593 - 288,593 300,156 - 300,156 312,151 - 312,151 324,594
- - - - - - - - - - - - - - - - - - - - - -
2,312,594 403,174 1,969,776 2,372,950 415,916 2,019,021 2,434,936 429,102 2,069,496 2,498,598 442,749 (101,222) (5,619) (98,050) (103,669) (5,675) (100,501) (106,176) (5,732) (103,013) (108,746) (5,790)
- - - - - - - - - - - - - - - - - - - - - -
2,211,372 397,554 1,871,726 2,269,281 410,240 1,918,520 2,328,760 423,370 1,966,483 2,389,853 436,960
156,595 32,415 129,661 162,076 33,550 134,199 167,749 34,724 138,896 173,620 35,939 461,542 95,539 382,156 477,695 98,883 395,532 494,415 102,344 409,375 511,719 105,926 100,208 20,743 82,972 103,715 21,469 85,876 107,345 22,220 88,882 111,102 22,998 182,938 37,868 151,473 189,341 39,194 156,775 195,968 40,565 162,262 202,827 41,985 63,176 13,077 52,310 65,387 13,535 54,140 67,676 14,009 56,035 70,044 14,499
167,420 34,656 138,624 173,279 35,869 143,475 179,344 37,124 148,497 185,621 38,424 619,108 128,155 512,621 640,777 132,641 530,563 663,204 137,283 549,133 686,416 142,088 91,885 - 95,101 95,101 - 98,430 98,430 - 101,875 101,875 -
- - - - - - - - - - -
1,842,872 362,454 1,544,918 1,907,372 375,140 1,598,990 1,974,130 388,270 1,654,955 2,043,225 401,860
15,000 3000 12000 15,000 3000 12000 15,000 3000 12000 15,000 30000 0 0 0 0 0 0 0 0 0 0
76,500 15300 61200 76,500 15300 61200 76,500 15300 61200 76,500 153000 0 0 0 0 0 0 0 0 0 00 0 0 0 0 0 0 0 0 0 00 0 0 0 0 0 0 0 0 0 00 0 0 0 0 0 0 0 0 0 0
91,500 18,300 73,200 91,500 18,300 73,200 91,500 18,300 73,200 91,500 18,300
1,934,372 380,754 1,618,118 1,998,872 393,440 1,672,190 2,065,630 406,570 1,728,155 2,134,725 420,160
277,000 16,800 253,608 270,408 16,800 246,329 263,129 16,800 238,328 255,128 16,800
- - - - - - - - - - - 84,000 16,800 67,200 84,000 16,800 67,200 84,000 16,800 67,200 84,000 16,800
- - - - - - - - - - - - - - - - - - - - - - - - - - - - - - - - -
84,000 16,800 67,200 84,000 16,800 67,200 84,000 16,800 67,200 84,000 16,800 193,000 - 186,408 186,408 0 179,129 179,129 - 171,128 171,128 0
3.3 3.22 3.13 3.04
- - - - - - - - - - - - - - - - - - - - - - - - - - - - - - - - - - - - - - - - - - - - - - - - - - - - - - - - - - - - - - - - - - - - - - - - - - - - - - - - - - - - - - - -
193,000 - 186,408 186,408 0 179,129 179,129 - 171,128 171,128 0
76,505 73,892 71,007 67,835 - - - - - - - -
116,495 112,516 108,122 103,293
52,161 50,380 48,413 46,250 - - - - - - - -
52,161 50,380 48,413 46,250
64,333 62,136 59,710 57,043 64,333 62,136 59,710 57,043
- - - - - - - -
306,000 382,500 459,000 535,500 - - - - - - - - - - - -
- - - - - - - - - - - -
2031Year 5 Year 6 Year 72029 2030
2 of 6
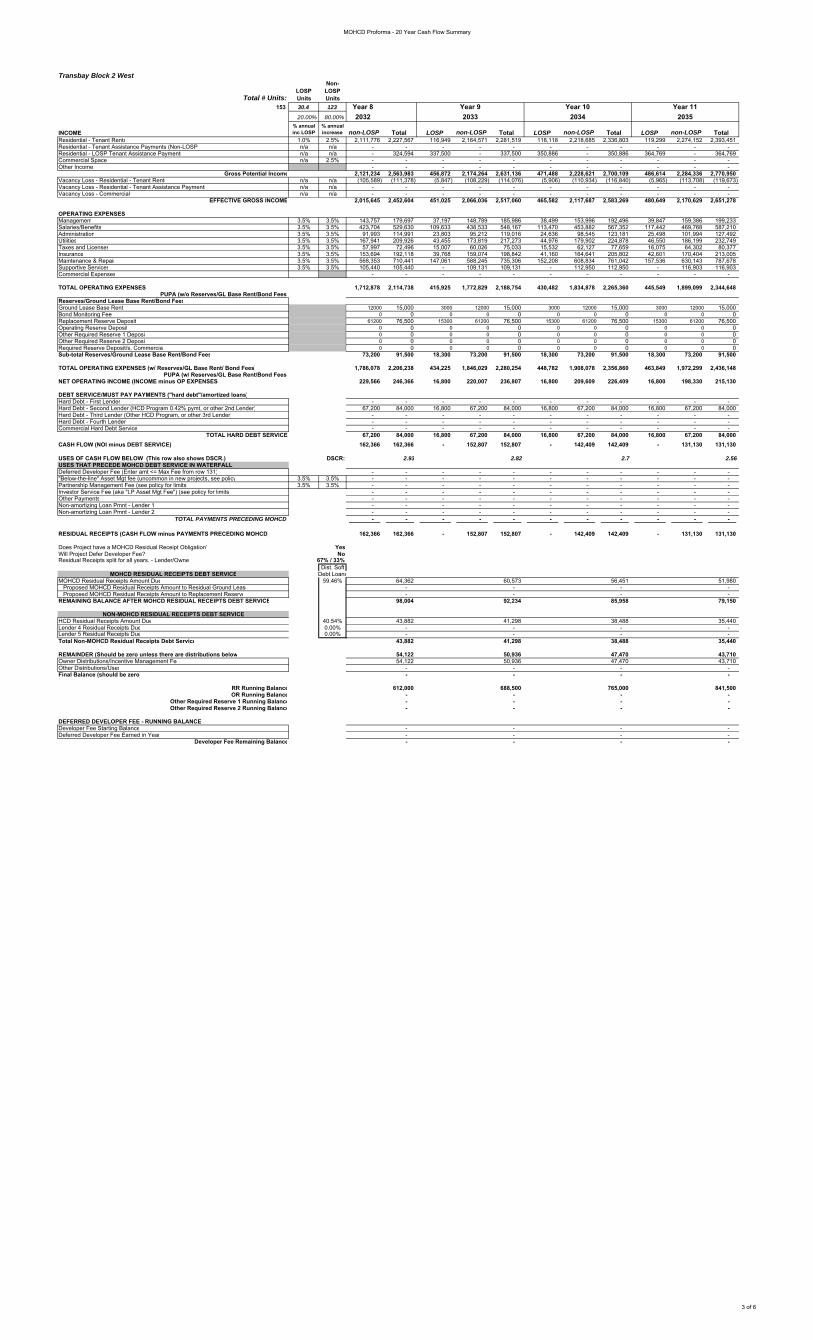
MOHCD Proforma - 20 Year Cash Flow Summary
Transbay Block 2 West
Total # Units:153 30.4 123
20.00% 80.00%
INCOME% annual inc LOSP
% annual increase
Residential - Tenant Rents 1.0% 2.5%Residential - Tenant Assistance Payments (Non-LOSP n/a n/aResidential - LOSP Tenant Assistance Payments n/a n/aCommercial Space n/a 2.5%Other Income
Gross Potential IncomeVacancy Loss - Residential - Tenant Rents n/a n/aVacancy Loss - Residential - Tenant Assistance Payments n/a n/aVacancy Loss - Commercial n/a n/a
EFFECTIVE GROSS INCOME
OPERATING EXPENSESManagement 3.5% 3.5%Salaries/Benefits 3.5% 3.5%Administration 3.5% 3.5%Utilities 3.5% 3.5%Taxes and Licenses 3.5% 3.5%Insurance 3.5% 3.5%Maintenance & Repair 3.5% 3.5%Supportive Services 3.5% 3.5%Commercial Expenses
TOTAL OPERATING EXPENSES PUPA (w/o Reserves/GL Base Rent/Bond Fees)
Reserves/Ground Lease Base Rent/Bond FeesGround Lease Base Rent Bond Monitoring Fee Replacement Reserve DepositOperating Reserve DepositOther Required Reserve 1 DepositOther Required Reserve 2 DepositRequired Reserve Deposit/s, CommercialSub-total Reserves/Ground Lease Base Rent/Bond Fees
TOTAL OPERATING EXPENSES (w/ Reserves/GL Base Rent/ Bond Fees)PUPA (w/ Reserves/GL Base Rent/Bond Fees)
NET OPERATING INCOME (INCOME minus OP EXPENSES)
DEBT SERVICE/MUST PAY PAYMENTS ("hard debt"/amortized loans)Hard Debt - First LenderHard Debt - Second Lender (HCD Program 0.42% pymt, or other 2nd Lender)Hard Debt - Third Lender (Other HCD Program, or other 3rd Lender)Hard Debt - Fourth Lender Commercial Hard Debt Service
TOTAL HARD DEBT SERVICECASH FLOW (NOI minus DEBT SERVICE)
USES OF CASH FLOW BELOW (This row also shows DSCR.) DSCR:USES THAT PRECEDE MOHCD DEBT SERVICE IN WATERFALLDeferred Developer Fee (Enter amt <= Max Fee from row 131)"Below-the-line" Asset Mgt fee (uncommon in new projects, see policy 3.5% 3.5%Partnership Management Fee (see policy for limits 3.5% 3.5%Investor Service Fee (aka "LP Asset Mgt Fee") (see policy for limitsOther PaymentsNon-amortizing Loan Pmnt - Lender 1Non-amortizing Loan Pmnt - Lender 2
TOTAL PAYMENTS PRECEDING MOHCD
RESIDUAL RECEIPTS (CASH FLOW minus PAYMENTS PRECEDING MOHCD)
Does Project have a MOHCD Residual Receipt Obligation? YesWill Project Defer Developer Fee? NoResidual Receipts split for all years. - Lender/Owne 67% / 33%
Dist. SoftMOHCD RESIDUAL RECEIPTS DEBT SERVICE Debt Loans
MOHCD Residual Receipts Amount Due 59.46%Proposed MOHCD Residual Receipts Amount to Residual Ground LeaseProposed MOHCD Residual Receipts Amount to Replacement Reserve
REMAINING BALANCE AFTER MOHCD RESIDUAL RECEIPTS DEBT SERVICE
NON-MOHCD RESIDUAL RECEIPTS DEBT SERVICEHCD Residual Receipts Amount Due 40.54%Lender 4 Residual Receipts Due 0.00%Lender 5 Residual Receipts Due 0.00%Total Non-MOHCD Residual Receipts Debt Service
REMAINDER (Should be zero unless there are distributions belowOwner Distributions/Incentive Management FeeOther Distributions/UsesFinal Balance (should be zero)
RR Running BalanceOR Running Balance
Other Required Reserve 1 Running BalanceOther Required Reserve 2 Running Balance
DEFERRED DEVELOPER FEE - RUNNING BALANCEDeveloper Fee Starting BalanceDeferred Developer Fee Earned in Year
Developer Fee Remaining Balance
Non-LOSP Units
LOSP Units
Year 8 Year 9 Year 10 Year 11
2032 2033 2034 2035
non-LOSP Total LOSP non-LOSP Total LOSP non-LOSP Total LOSP non-LOSP Total 2,111,776 2,227,567 116,949 2,164,571 2,281,519 118,118 2,218,685 2,336,803 119,299 2,274,152 2,393,451
- - - - - - - - - - - - 324,594 337,500 - 337,500 350,886 - 350,886 364,769 - 364,769 - - - - - - - - - - - - - - - - - - - - - -
2,121,234 2,563,983 456,872 2,174,264 2,631,136 471,488 2,228,621 2,700,109 486,614 2,284,336 2,770,950(105,589) (111,378) (5,847) (108,229) (114,076) (5,906) (110,934) (116,840) (5,965) (113,708) (119,673)
- - - - - - - - - - - - - - - - - - - - - -
2,015,645 2,452,604 451,025 2,066,036 2,517,060 465,582 2,117,687 2,583,269 480,649 2,170,629 2,651,278
143,757 179,697 37,197 148,789 185,986 38,499 153,996 192,496 39,847 159,386 199,233 423,704 529,630 109,633 438,533 548,167 113,470 453,882 567,352 117,442 469,768 587,210 91,993 114,991 23,803 95,212 119,016 24,636 98,545 123,181 25,498 101,994 127,492
167,941 209,926 43,455 173,819 217,273 44,976 179,902 224,878 46,550 186,199 232,749 57,997 72,496 15,007 60,026 75,033 15,532 62,127 77,659 16,075 64,302 80,377
153,694 192,118 39,768 159,074 198,842 41,160 164,641 205,802 42,601 170,404 213,005 568,353 710,441 147,061 588,245 735,306 152,208 608,834 761,042 157,536 630,143 787,678 105,440 105,440 - 109,131 109,131 - 112,950 112,950 - 116,903 116,903
- - - - - - - - - - -
1,712,878 2,114,738 415,925 1,772,829 2,188,754 430,482 1,834,878 2,265,360 445,549 1,899,099 2,344,648
12000 15,000 3000 12000 15,000 3000 12000 15,000 3000 12000 15,0000 0 0 0 0 0 0 0 0 0 0
61200 76,500 15300 61200 76,500 15300 61200 76,500 15300 61200 76,5000 0 0 0 0 0 0 0 0 0 00 0 0 0 0 0 0 0 0 0 00 0 0 0 0 0 0 0 0 0 00 0 0 0 0 0 0 0 0 0 0
73,200 91,500 18,300 73,200 91,500 18,300 73,200 91,500 18,300 73,200 91,500
1,786,078 2,206,238 434,225 1,846,029 2,280,254 448,782 1,908,078 2,356,860 463,849 1,972,299 2,436,148
229,566 246,366 16,800 220,007 236,807 16,800 209,609 226,409 16,800 198,330 215,130
- - - - - - - - - - - 67,200 84,000 16,800 67,200 84,000 16,800 67,200 84,000 16,800 67,200 84,000
- - - - - - - - - - - - - - - - - - - - - - - - - - - - - - - - -
67,200 84,000 16,800 67,200 84,000 16,800 67,200 84,000 16,800 67,200 84,000 162,366 162,366 - 152,807 152,807 - 142,409 142,409 - 131,130 131,130
2.93 2.82 2.7 2.56
- - - - - - - - - - - - - - - - - - - - - - - - - - - - - - - - - - - - - - - - - - - - - - - - - - - - - - - - - - - - - - - - - - - - - - - - - - - - - - - - - - - - - - - -
162,366 162,366 - 152,807 152,807 - 142,409 142,409 - 131,130 131,130
64,362 60,573 56,451 51,980 - - - - - - - -
98,004 92,234 85,958 79,150
43,882 41,298 38,488 35,440 - - - - - - - -
43,882 41,298 38,488 35,440
54,122 50,936 47,470 43,710 54,122 50,936 47,470 43,710
- - - - - - - -
612,000 688,500 765,000 841,500 - - - - - - - - - - - -
- - - - - - - - - - - -
2032 2033 2034Year 8 Year 9 Year 10 Year 11
2035
3 of 6

MOHCD Proforma - 20 Year Cash Flow Summary
Transbay Block 2 West
Total # Units:153 30.4 123
20.00% 80.00%
INCOME% annual inc LOSP
% annual increase
Residential - Tenant Rents 1.0% 2.5%Residential - Tenant Assistance Payments (Non-LOSP n/a n/aResidential - LOSP Tenant Assistance Payments n/a n/aCommercial Space n/a 2.5%Other Income
Gross Potential IncomeVacancy Loss - Residential - Tenant Rents n/a n/aVacancy Loss - Residential - Tenant Assistance Payments n/a n/aVacancy Loss - Commercial n/a n/a
EFFECTIVE GROSS INCOME
OPERATING EXPENSESManagement 3.5% 3.5%Salaries/Benefits 3.5% 3.5%Administration 3.5% 3.5%Utilities 3.5% 3.5%Taxes and Licenses 3.5% 3.5%Insurance 3.5% 3.5%Maintenance & Repair 3.5% 3.5%Supportive Services 3.5% 3.5%Commercial Expenses
TOTAL OPERATING EXPENSES PUPA (w/o Reserves/GL Base Rent/Bond Fees)
Reserves/Ground Lease Base Rent/Bond FeesGround Lease Base Rent Bond Monitoring Fee Replacement Reserve DepositOperating Reserve DepositOther Required Reserve 1 DepositOther Required Reserve 2 DepositRequired Reserve Deposit/s, CommercialSub-total Reserves/Ground Lease Base Rent/Bond Fees
TOTAL OPERATING EXPENSES (w/ Reserves/GL Base Rent/ Bond Fees)PUPA (w/ Reserves/GL Base Rent/Bond Fees)
NET OPERATING INCOME (INCOME minus OP EXPENSES)
DEBT SERVICE/MUST PAY PAYMENTS ("hard debt"/amortized loans)Hard Debt - First LenderHard Debt - Second Lender (HCD Program 0.42% pymt, or other 2nd Lender)Hard Debt - Third Lender (Other HCD Program, or other 3rd Lender)Hard Debt - Fourth Lender Commercial Hard Debt Service
TOTAL HARD DEBT SERVICECASH FLOW (NOI minus DEBT SERVICE)
USES OF CASH FLOW BELOW (This row also shows DSCR.) DSCR:USES THAT PRECEDE MOHCD DEBT SERVICE IN WATERFALLDeferred Developer Fee (Enter amt <= Max Fee from row 131)"Below-the-line" Asset Mgt fee (uncommon in new projects, see policy 3.5% 3.5%Partnership Management Fee (see policy for limits 3.5% 3.5%Investor Service Fee (aka "LP Asset Mgt Fee") (see policy for limitsOther PaymentsNon-amortizing Loan Pmnt - Lender 1Non-amortizing Loan Pmnt - Lender 2
TOTAL PAYMENTS PRECEDING MOHCD
RESIDUAL RECEIPTS (CASH FLOW minus PAYMENTS PRECEDING MOHCD)
Does Project have a MOHCD Residual Receipt Obligation? YesWill Project Defer Developer Fee? NoResidual Receipts split for all years. - Lender/Owne 67% / 33%
Dist. SoftMOHCD RESIDUAL RECEIPTS DEBT SERVICE Debt Loans
MOHCD Residual Receipts Amount Due 59.46%Proposed MOHCD Residual Receipts Amount to Residual Ground LeaseProposed MOHCD Residual Receipts Amount to Replacement Reserve
REMAINING BALANCE AFTER MOHCD RESIDUAL RECEIPTS DEBT SERVICE
NON-MOHCD RESIDUAL RECEIPTS DEBT SERVICEHCD Residual Receipts Amount Due 40.54%Lender 4 Residual Receipts Due 0.00%Lender 5 Residual Receipts Due 0.00%Total Non-MOHCD Residual Receipts Debt Service
REMAINDER (Should be zero unless there are distributions belowOwner Distributions/Incentive Management FeeOther Distributions/UsesFinal Balance (should be zero)
RR Running BalanceOR Running Balance
Other Required Reserve 1 Running BalanceOther Required Reserve 2 Running Balance
DEFERRED DEVELOPER FEE - RUNNING BALANCEDeveloper Fee Starting BalanceDeferred Developer Fee Earned in Year
Developer Fee Remaining Balance
Non-LOSP Units
LOSP Units
Year 12 Year 13 Year 14
2036 2037 2038
LOSP non-LOSP Total LOSP non-LOSP Total LOSP non-LOSP Total LOSP non-LOSP120,492 2,331,006 2,451,498 121,697 2,389,281 2,510,978 122,914 2,449,013 2,571,927 124,143 2,510,238
- - - - - - - - - - - 379,166 - 379,166 394,096 - 394,096 409,578 - 409,578 425,631 -
- - - - - - - - - - - - - - - - - - - - - -
502,268 2,341,445 2,843,713 518,468 2,399,981 2,918,449 535,234 2,459,981 2,995,214 552,585 2,521,480 (6,025) (116,550) (122,575) (6,085) (119,464) (125,549) (6,146) (122,451) (128,596) (6,207) (125,512)
- - - - - - - - - - - - - - - - - - - - - -
496,243 2,224,895 2,721,138 512,383 2,280,517 2,792,900 529,088 2,337,530 2,866,618 546,378 2,395,968
41,241 164,965 206,206 42,685 170,739 213,423 44,179 176,715 220,893 45,725 182,900 121,552 486,210 607,762 125,807 503,227 629,034 130,210 520,840 651,050 134,767 539,069 26,391 105,564 131,955 27,315 109,258 136,573 28,271 113,083 141,353 29,260 117,040 48,179 192,716 240,895 49,865 199,461 249,326 51,611 206,442 258,053 53,417 213,668 16,638 66,552 83,191 17,220 68,882 86,102 17,823 71,293 89,116 18,447 73,788 44,092 176,368 220,460 45,635 182,541 228,176 47,232 188,930 236,162 48,886 195,542
163,049 652,198 815,247 168,756 675,025 843,781 174,663 698,650 873,313 180,776 723,103 - 120,995 120,995 - 125,230 125,230 - 129,613 129,613 - 134,149 - - - - - - - - - - -
461,143 1,965,567 2,426,710 477,283 2,034,362 2,511,645 493,988 2,105,565 2,599,553 511,278 2,179,260
3000 12000 15,000 3000 12000 15,000 3000 12000 15,000 3000 120000 0 0 0 0 0 0 0 0 0 0
15300 61200 76,500 15300 61200 76,500 15300 61200 76,500 15300 612000 0 0 0 0 0 0 0 0 0 00 0 0 0 0 0 0 0 0 0 00 0 0 0 0 0 0 0 0 0 00 0 0 0 0 0 0 0 0 0 0
18,300 73,200 91,500 18,300 73,200 91,500 18,300 73,200 91,500 18,300 73,200
479,443 2,038,767 2,518,210 495,583 2,107,562 2,603,145 512,288 2,178,765 2,691,053 529,578 2,252,460
16,800 186,127 202,927 16,800 172,955 189,755 16,800 158,765 175,565 16,800 143,509
- - - - - - - - - - - 16,800 67,200 84,000 16,800 67,200 84,000 16,800 67,200 84,000 16,800 67,200
- - - - - - - - - - - - - - - - - - - - - - - - - - - - - - - - -
16,800 67,200 84,000 16,800 67,200 84,000 16,800 67,200 84,000 16,800 67,200 0 118,927 118,927 0 105,755 105,755 (0) 91,565 91,565 - 76,309
2.42 2.26 2.09
- - - - - - - - - - - - - - - - - - - - - - - - - - - - - - - - - - - - - - - - - - - - - - - - - - - - - - - - - - - - - - - - - - - - - - - - - - - - - - - - - - - - - - - -
0 118,927 118,927 0 105,755 105,755 (0) 91,565 91,565 - 76,309
47,143 41,921 36,297 - - - - - -
71,784 63,834 55,269
32,142 28,582 24,747 - - - - - -
32,142 28,582 24,747
39,642 35,252 30,522 39,642 35,252 30,522
- - - - - -
918,000 994,500 1,071,000 - - - - - - - - -
- - - - - - - - -
Year 12 Year 13 Year 14 Year 1520392036 2037 2038
4 of 6

MOHCD Proforma - 20 Year Cash Flow Summary
Transbay Block 2 West
Total # Units:153 30.4 123
20.00% 80.00%
INCOME% annual inc LOSP
% annual increase
Residential - Tenant Rents 1.0% 2.5%Residential - Tenant Assistance Payments (Non-LOSP n/a n/aResidential - LOSP Tenant Assistance Payments n/a n/aCommercial Space n/a 2.5%Other Income
Gross Potential IncomeVacancy Loss - Residential - Tenant Rents n/a n/aVacancy Loss - Residential - Tenant Assistance Payments n/a n/aVacancy Loss - Commercial n/a n/a
EFFECTIVE GROSS INCOME
OPERATING EXPENSESManagement 3.5% 3.5%Salaries/Benefits 3.5% 3.5%Administration 3.5% 3.5%Utilities 3.5% 3.5%Taxes and Licenses 3.5% 3.5%Insurance 3.5% 3.5%Maintenance & Repair 3.5% 3.5%Supportive Services 3.5% 3.5%Commercial Expenses
TOTAL OPERATING EXPENSES PUPA (w/o Reserves/GL Base Rent/Bond Fees)
Reserves/Ground Lease Base Rent/Bond FeesGround Lease Base Rent Bond Monitoring Fee Replacement Reserve DepositOperating Reserve DepositOther Required Reserve 1 DepositOther Required Reserve 2 DepositRequired Reserve Deposit/s, CommercialSub-total Reserves/Ground Lease Base Rent/Bond Fees
TOTAL OPERATING EXPENSES (w/ Reserves/GL Base Rent/ Bond Fees)PUPA (w/ Reserves/GL Base Rent/Bond Fees)
NET OPERATING INCOME (INCOME minus OP EXPENSES)
DEBT SERVICE/MUST PAY PAYMENTS ("hard debt"/amortized loans)Hard Debt - First LenderHard Debt - Second Lender (HCD Program 0.42% pymt, or other 2nd Lender)Hard Debt - Third Lender (Other HCD Program, or other 3rd Lender)Hard Debt - Fourth Lender Commercial Hard Debt Service
TOTAL HARD DEBT SERVICECASH FLOW (NOI minus DEBT SERVICE)
USES OF CASH FLOW BELOW (This row also shows DSCR.) DSCR:USES THAT PRECEDE MOHCD DEBT SERVICE IN WATERFALLDeferred Developer Fee (Enter amt <= Max Fee from row 131)"Below-the-line" Asset Mgt fee (uncommon in new projects, see policy 3.5% 3.5%Partnership Management Fee (see policy for limits 3.5% 3.5%Investor Service Fee (aka "LP Asset Mgt Fee") (see policy for limitsOther PaymentsNon-amortizing Loan Pmnt - Lender 1Non-amortizing Loan Pmnt - Lender 2
TOTAL PAYMENTS PRECEDING MOHCD
RESIDUAL RECEIPTS (CASH FLOW minus PAYMENTS PRECEDING MOHCD)
Does Project have a MOHCD Residual Receipt Obligation? YesWill Project Defer Developer Fee? NoResidual Receipts split for all years. - Lender/Owne 67% / 33%
Dist. SoftMOHCD RESIDUAL RECEIPTS DEBT SERVICE Debt Loans
MOHCD Residual Receipts Amount Due 59.46%Proposed MOHCD Residual Receipts Amount to Residual Ground LeaseProposed MOHCD Residual Receipts Amount to Replacement Reserve
REMAINING BALANCE AFTER MOHCD RESIDUAL RECEIPTS DEBT SERVICE
NON-MOHCD RESIDUAL RECEIPTS DEBT SERVICEHCD Residual Receipts Amount Due 40.54%Lender 4 Residual Receipts Due 0.00%Lender 5 Residual Receipts Due 0.00%Total Non-MOHCD Residual Receipts Debt Service
REMAINDER (Should be zero unless there are distributions belowOwner Distributions/Incentive Management FeeOther Distributions/UsesFinal Balance (should be zero)
RR Running BalanceOR Running Balance
Other Required Reserve 1 Running BalanceOther Required Reserve 2 Running Balance
DEFERRED DEVELOPER FEE - RUNNING BALANCEDeveloper Fee Starting BalanceDeferred Developer Fee Earned in Year
Developer Fee Remaining Balance
Non-LOSP Units
LOSP Units
Year 15 Year 16 Year 17 Year 18
2039 2040 2041 2042
Total LOSP non-LOSP Total LOSP non-LOSP Total LOSP non-LOSP Total LOSP2,634,382 125,385 2,572,994 2,698,379 126,638 2,637,319 2,763,958 127,905 2,703,252 2,831,157 129,184
- - - - - - - - - - - 425,631 442,276 - 442,276 459,534 - 459,534 477,426 - 477,426 495,976
- - - - - - - - - - - - - - - - - - - - - -
3,074,065 570,541 2,584,517 3,155,059 589,125 2,649,130 3,238,255 608,358 2,715,358 3,323,716 628,262 (131,719) (6,269) (128,650) (134,919) (6,332) (131,866) (138,198) (6,395) (135,163) (141,558) (6,459)
- - - - - - - - - - - - - - - - - - - - - -
2,942,346 564,272 2,455,867 3,020,140 582,793 2,517,264 3,100,057 601,963 2,580,196 3,182,158 621,803
228,624 47,325 189,301 236,626 48,982 195,927 244,908 50,696 202,784 253,480 52,470 673,837 139,484 557,937 697,421 144,366 577,465 721,831 149,419 597,676 747,095 154,649 146,301 30,284 121,137 151,421 31,344 125,377 156,721 32,441 129,765 162,206 33,577 267,085 55,287 221,146 276,433 57,222 228,886 286,108 59,224 236,897 296,121 61,297 92,235 19,093 76,370 95,463 19,761 79,043 98,804 20,452 81,810 102,262 21,168
244,428 50,597 202,386 252,983 52,367 209,470 261,837 54,200 216,801 271,001 56,097 903,879 187,103 748,412 935,515 193,652 774,606 968,258 200,429 801,717 1,002,147 207,444 134,149 - 138,845 138,845 - 143,704 143,704 - 148,734 148,734 -
- - - - - - - - - - -
2,690,537 529,172 2,255,534 2,784,706 547,693 2,334,477 2,882,171 566,863 2,416,184 2,983,047 586,703
15,000 3000 12000 15,000 3000 12000 15,000 3000 12000 15,000 30000 0 0 0 0 0 0 0 0 0 0
76,500 15300 61200 76,500 15300 61200 76,500 15300 61200 76,500 153000 0 0 0 0 0 0 0 0 0 00 0 0 0 0 0 0 0 0 0 00 0 0 0 0 0 0 0 0 0 00 0 0 0 0 0 0 0 0 0 0
91,500 18,300 73,200 91,500 18,300 73,200 91,500 18,300 73,200 91,500 18,300
2,782,037 547,472 2,328,734 2,876,206 565,993 2,407,677 2,973,671 585,163 2,489,384 3,074,547 605,003
160,309 16,800 127,134 143,934 16,800 109,587 126,387 16,800 90,812 107,612 16,800
- - - - - - - - - - - 84,000 16,800 67,200 84,000 16,800 67,200 84,000 16,800 67,200 84,000 16,800
- - - - - - - - - - - - - - - - - - - - - - - - - - - - - - - - -
84,000 16,800 67,200 84,000 16,800 67,200 84,000 16,800 67,200 84,000 16,800 76,309 - 59,934 59,934 - 42,387 42,387 - 23,612 23,612 -
1.91 1.71 1.5 1.28
- - - - - - - - - - - - - - - - - - - - - - - - - - - - - - - - - - - - - - - - - - - - - - - - - - - - - - - - - - - - - - - - - - - - - - - - - - - - - - - - - - - - - - - -
76,309 - 59,934 59,934 - 42,387 42,387 - 23,612 23,612 -
30,249 23,758 16,802 9,360 - - - - - - - -
46,060 36,176 25,585 14,252
20,624 16,198 11,456 6,381 - - - - - - - -
20,624 16,198 11,456 6,381
25,436 19,978 14,129 7,871 25,436 19,978 14,129 7,871
- - - - - - - -
1,147,500 1,224,000 1,300,500 1,377,000- - - - - - - - - - - -
- - - - - - - - - - - -
2040Year 16
2041 2042Year 18Year 17
5 of 6

MOHCD Proforma - 20 Year Cash Flow Summary
Transbay Block 2 West
Total # Units:153 30.4 123
20.00% 80.00%
INCOME% annual inc LOSP
% annual increase
Residential - Tenant Rents 1.0% 2.5%Residential - Tenant Assistance Payments (Non-LOSP n/a n/aResidential - LOSP Tenant Assistance Payments n/a n/aCommercial Space n/a 2.5%Other Income
Gross Potential IncomeVacancy Loss - Residential - Tenant Rents n/a n/aVacancy Loss - Residential - Tenant Assistance Payments n/a n/aVacancy Loss - Commercial n/a n/a
EFFECTIVE GROSS INCOME
OPERATING EXPENSESManagement 3.5% 3.5%Salaries/Benefits 3.5% 3.5%Administration 3.5% 3.5%Utilities 3.5% 3.5%Taxes and Licenses 3.5% 3.5%Insurance 3.5% 3.5%Maintenance & Repair 3.5% 3.5%Supportive Services 3.5% 3.5%Commercial Expenses
TOTAL OPERATING EXPENSES PUPA (w/o Reserves/GL Base Rent/Bond Fees)
Reserves/Ground Lease Base Rent/Bond FeesGround Lease Base Rent Bond Monitoring Fee Replacement Reserve DepositOperating Reserve DepositOther Required Reserve 1 DepositOther Required Reserve 2 DepositRequired Reserve Deposit/s, CommercialSub-total Reserves/Ground Lease Base Rent/Bond Fees
TOTAL OPERATING EXPENSES (w/ Reserves/GL Base Rent/ Bond Fees)PUPA (w/ Reserves/GL Base Rent/Bond Fees)
NET OPERATING INCOME (INCOME minus OP EXPENSES)
DEBT SERVICE/MUST PAY PAYMENTS ("hard debt"/amortized loans)Hard Debt - First LenderHard Debt - Second Lender (HCD Program 0.42% pymt, or other 2nd Lender)Hard Debt - Third Lender (Other HCD Program, or other 3rd Lender)Hard Debt - Fourth Lender Commercial Hard Debt Service
TOTAL HARD DEBT SERVICECASH FLOW (NOI minus DEBT SERVICE)
USES OF CASH FLOW BELOW (This row also shows DSCR.) DSCR:USES THAT PRECEDE MOHCD DEBT SERVICE IN WATERFALLDeferred Developer Fee (Enter amt <= Max Fee from row 131)"Below-the-line" Asset Mgt fee (uncommon in new projects, see policy 3.5% 3.5%Partnership Management Fee (see policy for limits 3.5% 3.5%Investor Service Fee (aka "LP Asset Mgt Fee") (see policy for limitsOther PaymentsNon-amortizing Loan Pmnt - Lender 1Non-amortizing Loan Pmnt - Lender 2
TOTAL PAYMENTS PRECEDING MOHCD
RESIDUAL RECEIPTS (CASH FLOW minus PAYMENTS PRECEDING MOHCD)
Does Project have a MOHCD Residual Receipt Obligation? YesWill Project Defer Developer Fee? NoResidual Receipts split for all years. - Lender/Owne 67% / 33%
Dist. SoftMOHCD RESIDUAL RECEIPTS DEBT SERVICE Debt Loans
MOHCD Residual Receipts Amount Due 59.46%Proposed MOHCD Residual Receipts Amount to Residual Ground LeaseProposed MOHCD Residual Receipts Amount to Replacement Reserve
REMAINING BALANCE AFTER MOHCD RESIDUAL RECEIPTS DEBT SERVICE
NON-MOHCD RESIDUAL RECEIPTS DEBT SERVICEHCD Residual Receipts Amount Due 40.54%Lender 4 Residual Receipts Due 0.00%Lender 5 Residual Receipts Due 0.00%Total Non-MOHCD Residual Receipts Debt Service
REMAINDER (Should be zero unless there are distributions belowOwner Distributions/Incentive Management FeeOther Distributions/UsesFinal Balance (should be zero)
RR Running BalanceOR Running Balance
Other Required Reserve 1 Running BalanceOther Required Reserve 2 Running Balance
DEFERRED DEVELOPER FEE - RUNNING BALANCEDeveloper Fee Starting BalanceDeferred Developer Fee Earned in Year
Developer Fee Remaining Balance
Non-LOSP Units
LOSP Units
Year 19 Year 20
2043 2044
non-LOSP Total LOSP non-LOSP Total 2,770,834 2,900,017 130,476 2,840,104 2,970,580
- - - - - - 495,976 515,206 - 515,206 - - - - - - - - - -
2,783,242 3,411,504 648,861 2,852,823 3,501,684(138,542) (145,001) (6,524) (142,005) (148,529)
- - - - - - - - - -
2,644,700 3,266,503 642,337 2,710,818 3,353,155
209,881 262,352 54,307 217,227 271,534 618,594 773,243 160,061 640,245 800,307 134,307 167,883 34,752 139,007 173,759 245,189 306,486 63,443 253,770 317,213 84,673 105,842 21,909 87,637 109,546
224,389 280,486 58,061 232,243 290,303 829,778 1,037,222 214,705 858,820 1,073,525153,939 153,939 - 159,327 159,327
- - - - -
2,500,750 3,087,453 607,237 2,588,277 3,195,514
12000 15,000 3000 12000 15,0000 0 0 0 0
61200 76,500 15300 61200 76,5000 0 0 0 00 0 0 0 00 0 0 0 00 0 0 0 0
73,200 91,500 18,300 73,200 91,500
2,573,950 3,178,953 625,537 2,661,477 3,287,014
70,750 87,550 16,800 49,341 66,141
- - - - - 67,200 84,000 16,800 67,200 84,000
- - - - - - - - - - - - - - -
67,200 84,000 16,800 67,200 84,000 3,550 3,550 0 (17,859) (17,859)
1.04 0.79
- - - - - - - - - - - - - - - - - - - - - - - - - - - - - - - - - - - - - - - -
3,550 3,550 0 (17,859) (17,859)
1,407 - - - - -
2,143 -
959 - - - - - 959 -
1,183 - 1,183 -
- - - -
1,453,500 1,530,000- - - - - -
- - - - - -
2043 2044Year 20Year 19
6 of 6
Related Documents