Business Address 1801 CALIFORNIA STREET STE 5200 DENVER CO 80202 720-482-8836 Mailing Address 1801 CALIFORNIA STREET STE 5200 DENVER CO 80202 SECURITIES AND EXCHANGE COMMISSION FORM N-CSRS Certified semi-annual shareholder report of registered management investment companies filed on Form N-CSR Filing Date: 2021-09-02 | Period of Report: 2021-06-30 SEC Accession No. 0001193125-21-263946 (HTML Version on secdatabase.com) FILER TRANSAMERICA ETF TRUST CIK:1673996| IRS No.: 000000000 | State of Incorp.:DE | Fiscal Year End: 1231 Type: N-CSRS | Act: 40 | File No.: 811-23237 | Film No.: 211231901 Copyright © 2021 www.secdatabase.com . All Rights Reserved. Please Consider the Environment Before Printing This Document

Welcome message from author
This document is posted to help you gain knowledge. Please leave a comment to let me know what you think about it! Share it to your friends and learn new things together.
Transcript

Business Address1801 CALIFORNIA STREETSTE 5200DENVER CO 80202720-482-8836
Mailing Address1801 CALIFORNIA STREETSTE 5200DENVER CO 80202
SECURITIES AND EXCHANGE COMMISSION
FORM N-CSRSCertified semi-annual shareholder report of registered management investment companies filed
on Form N-CSR
Filing Date: 2021-09-02 | Period of Report: 2021-06-30SEC Accession No. 0001193125-21-263946
(HTML Version on secdatabase.com)
FILERTRANSAMERICA ETF TRUSTCIK:1673996| IRS No.: 000000000 | State of Incorp.:DE | Fiscal Year End: 1231Type: N-CSRS | Act: 40 | File No.: 811-23237 | Film No.: 211231901
Copyright © 2021 www.secdatabase.com. All Rights Reserved.Please Consider the Environment Before Printing This Document

As filed with the Securities and Exchange Commission on September 2, 2021
SECURITIES AND EXCHANGE COMMISSIONWASHINGTON, D.C. 20549
FORM N-CSR
CERTIFIED SHAREHOLDER REPORT OF REGISTEREDMANAGEMENT INVESTMENT COMPANIES
Investment Company Act file number: 811-23237
TRANSAMERICA ETF TRUST(Exact Name of Registrant as Specified in Charter)
1801 California St., Suite 5200, Denver, CO 80202(Address of Principal Executive Offices) (Zip Code)
Registrant��s Telephone Number, including Area Code: 1-888-316-8077
Erin Nelson, Esq., 1801 California St., Suite 5200, Denver, CO 80202(Name and Address of Agent for Service)
Date of fiscal year end: December 31
Date of reporting period: June 30, 2021
Copyright © 2021 www.secdatabase.com. All Rights Reserved.Please Consider the Environment Before Printing This Document

Item 1: Report(s) to Shareholders.
The Semi-Annual Report is attached.
Copyright © 2021 www.secdatabase.com. All Rights Reserved.Please Consider the Environment Before Printing This Document
TRANSAMERICAETF TRUSTSEMI-ANNUALREPORT
JUNE 30, 2021
Copyright © 2021 www.secdatabase.com. All Rights Reserved.Please Consider the Environment Before Printing This Document

Customer Service: 1-888-316-80771801 California St., Suite 5200 Denver, CO 80202Distributor: Foreside Fund Services, LLC
www.deltashares.com
Copyright © 2021 www.secdatabase.com. All Rights Reserved.Please Consider the Environment Before Printing This Document

Table of Contents
Shareholder Letter 1Disclosure of Expenses 2Schedules of Investments Composition 3Schedules of Investments
DeltaShares® S&P 400 Managed Risk ETF 4DeltaShares® S&P 500 Managed Risk ETF 10DeltaShares® S&P 600 Managed Risk ETF 17DeltaShares® S&P EM 100 & Managed Risk ETF 25DeltaShares® S&P International Managed Risk ETF 29
Statements of Assets and Liabilities 42Statements of Operations 43Statements of Changes in Net Assets 44Financial Highlights 46Notes to Financial Statements 49Approval of Management and Subadvisory Agreements 60Liquidity Risk Management Program 63Proxy Voting Policies and Procedures and Quarterly Portfolio Holdings 64Notice of Privacy Policy 65
Authorized for distribution only when accompanied or preceded by a prospectus. Investors should carefully consider a Fund��sinvestment goals, risks, charges and expenses before investing. A prospectus contains this and other information; please readit carefully before investing.
Transamerica ETF Trust Semi-Annual Report 2021
Copyright © 2021 www.secdatabase.com. All Rights Reserved.Please Consider the Environment Before Printing This Document
Dear Shareholder,
On behalf of Transamerica DeltaShares®, we would like to thank you for your continued support and confidence in our products as welook forward to continuing to serve you and your financial professional in the future. We value the trust you have placed in us.
This semi-annual report provides you with information about the investments of your Fund(s). The Securities and Exchange Commissionrequires that notice of internet availability of annual and semi-annual reports, or paper copies of such reports if so requested, be providedto all shareholders. We believe this to be an important part of the investment process. This report provides detailed information aboutyour Fund(s) for the six-month period ended June 30, 2021.
We believe it is important to understand market conditions over the period to provide a context for reading this report. The period beganin January 2021 with COVID-19 case trends exceeding their highest levels ever; however, by springtime, COVID-19 vaccine distributionramped up considerably reaching widespread segments of the U.S. population. Active cases and fatalities declined rapidly as plans tore-open the economy soon dovetailed with expectations of economic growth, and stocks moved higher. Increasing economic activityduring the period drove the equity markets to record highs, and credit spreads narrowed to pre-pandemic levels. Longer-term interestrates also experienced a sharp increase as the 10-year U.S. Treasury yield finished the first quarter at 1.74%, over a full percentage pointhigher than its lowest rate of the previous year. Rising rates caused bonds to decline in value during the period. In addition, an old marketnemesis reappeared in the form of inflation as Consumer Price Index (�CPI�) readings surpassed 5% annually, representing priceincreases not seen in decades. With inflation now front and center on investors� minds, attention once again turned to the FederalReserve (�Fed�) in terms of future monetary policy.
Stocks were boosted during the period in large part by strength in corporate earnings as seen by the S&P 500® Index underlyingcompanies displaying substantial profit growth from last year, exceeding pre-pandemic measures. As earnings estimates continued torise through the first half of the year, so did share prices. As the year approached its midpoint, longer-term interest rates began to declinemeaningfully with the 10-year Treasury closing out the month of June at 1.45%, perhaps representing, in our view, not only the bondmarket�s interpretation that inflation could prove transitory, but also a less optimistic view on the broad economy.
The period concluded with most stock indexes at or near record levels and credit markets reflecting strong fundamentals. A spiriteddebate still ensued at period end as to whether recently rising inflation would ultimately prove to be transitory or more permanent innature. While the Fed has expressed its view that current inflation rates will likely prove transitory, as well as a willingness to let inflationrun above their long-term target of 2% for some degree of time, inflation trends and Fed policy, in our view, will almost certainly be amajor market focus looking forward.
For the six-month period ended June 30, 2021, the S&P 500® Index returned 15.25%, while the MSCI EAFE Index, representinginternational developed market equities, returned 9.17%. During the same period, the Bloomberg Barclays US Aggregate Bond Indexreturned -1.60%. Please keep in mind that it is important to maintain a diversified portfolio as investment returns have historically beendifficult to predict.
In addition to your active involvement in the investment process, we firmly believe that a financial professional is a key resource to helpyou build a complete picture of your current and future financial needs. Financial professionals are familiar with the market�s history,including long-term returns and volatility of various asset classes. With your financial professional, you can develop an investmentprogram that incorporates factors such as your goals, your investment timeline, and your risk tolerance.
Please contact your financial professional if you have any questions about the contents of this report, and thanks again for the confidenceyou have placed in us.
Sincerely,
Bloomberg Barclays US Aggregate Bond Index: Measures investment grade, U.S. dollar denominated, fixed-rate taxable bonds, includingTreasuries, government-related and corporate securities, as well as both mortgage- and asset-backed securities.
MSCI EAFE Index: A free float-adjusted market capitalization index that is designed to measure the equity market performance ofdeveloped markets, excluding the U.S. and Canada.
S&P 500® Index: A market-capitalization weighted index of 500 large U.S. companies with common stock listed on the New York StockExchange or NASDAQ Stock Market.
Marijn SmitPresident & Chief Executive OfficerTransamerica ETF Trust
Tom Wald, CFAChief Investment OfficerTransamerica ETF Trust
Copyright © 2021 www.secdatabase.com. All Rights Reserved.Please Consider the Environment Before Printing This Document

The COVID-19 pandemic has caused substantial market disruption and dislocation around the world including the U.S. During periods ofmarket disruption, which may trigger trading halts, the Fund�s exposure to the risks described elsewhere in the Prospectus will likelyincrease. As a result, whether or not the Fund invests in securities of issuers located in or with significant exposure to the countriesdirectly affected, the value and liquidity of the Fund�s investments may be negatively affected.
The views expressed in this report reflect those of Transamerica Asset Management only and may not necessarily represent the views ofTransamerica ETF Trust. These views are as of the date of this report and subject to change based upon market conditions. These viewsshould not be relied upon as investment advice and are not indicative of trading intent on behalf of Transamerica ETF Trust. Investinginvolves risk, including potential loss of principal. The performance data presented represents past performance and does not guaranteefuture results. Indexes are unmanaged and it is not possible to invest directly in an index.
Copyright © 2021 www.secdatabase.com. All Rights Reserved.Please Consider the Environment Before Printing This Document

Disclosure of Expenses(unaudited)
SHAREHOLDER EXPENSES
Fund shareholders may incur two types of costs: (i) transaction costs, including brokerage commissions on purchases and sales of fundshares; and (ii) ongoing costs, including management fees.
The following examples are intended to help you understand your ongoing costs (in dollars and cents) of investing in the Funds and tocompare these costs with the ongoing costs of investing in other funds.
The examples are based on an investment of $1,000 invested at January 1, 2021, and held for the entire six-month period until June 30,2021.
ACTUAL EXPENSES
The information in the table below provides information about actual account values and actual expenses. You may use the information inthese columns, together with the amount you invested, to estimate the expenses that you paid over the period. Simply divide youraccount value by $1,000 (for example, an $8,600 account value divided by $1,000 = $8.60), then multiply the result by the number in theappropriate column for your Fund titled �Expenses Paid During Period� to estimate the expenses you paid on your account during thisperiod.
HYPOTHETICAL EXAMPLE FOR COMPARISON PURPOSES
The information in the table below provides information about hypothetical account values and hypothetical expenses based on theFunds� actual expense ratios and assumed rates of return of 5% per year before expenses, which are not the Funds� actual returns. Thehypothetical account values and expenses may not be used to estimate the actual ending account balance or expenses you paid for theperiod. You may use this information to compare the ongoing costs of investing in your Fund versus other funds. To do so, compare this5% hypothetical example with the 5% hypothetical examples that appear in the shareholder reports of the other fund(s).
Please note that the expenses shown in the table are meant to highlight your ongoing costs only and do not reflect any transactionalcosts, such as brokerage commissions paid on purchases and sales of Fund shares. Therefore, the information under the heading�Hypothetical Expenses� is useful in comparing ongoing costs only and will not help you determine the relative total costs of owningdifferent funds. If any of these transaction costs were included, your costs would be higher. The expenses shown in the table do notreflect any fees that may be charged to you by brokers, financial intermediaries, or other financial institutions.
Actual Expenses Hypothetical Expenses (A)
Fund
BeginningAccount Value
January 1, 2021
EndingAccount ValueJune 30, 2021
Expenses PaidDuring Period (B)
EndingAccount ValueJune 30, 2021
Expenses PaidDuring Period (B)
Net AnnualizedExpense Ratio (C)
DeltaShares® S&P 400 Managed Risk ETF $ 1,000.00 $ 1,112.40 $ 2.36 $ 1,022.60 $ 2.26 0.45 %DeltaShares® S&P 500 Managed Risk ETF 1,000.00 1,142.20 1.86 1,023.10 1.76 0.35DeltaShares® S&P 600 Managed Risk ETF 1,000.00 1,115.50 2.36 1,022.60 2.26 0.45DeltaShares® S&P EM 100 & Managed Risk
ETF 1,000.00 1,057.00 3.06 1,021.80 3.01 0.60DeltaShares® S&P International Managed
Risk ETF 1,000.00 1,081.60 2.58 1,022.30 2.51 0.50
(A) 5% return per year before expenses.
(B) Expenses are calculated using each Fund�s net annualized expense ratios, as disclosed in the table, multiplied by the average account value for the period, multiplied bythe number of days in the period (181 days), and divided by the number of days in the year (365 days).
(C) Net annualized expense ratios, as disclosed in the table, do not include the expenses of the underlying investments in which the Funds invest. The total annual fundoperating expenses, as stated in the fee table of the Prospectus, may differ from the expense ratios disclosed in this report.
Transamerica ETF Trust Semi-Annual Report 2021Page 2
Copyright © 2021 www.secdatabase.com. All Rights Reserved.Please Consider the Environment Before Printing This Document

Schedules of Investments CompositionAt June 30, 2021(unaudited)
Transamerica ETF Trust Semi-Annual Report 2021Page 3
DeltaShares® S&P 400 Managed Risk ETF
Asset AllocationPercentage of Net
AssetsCommon Stocks 92.9 %Short-Term U.S. Government
Obligation 7.0Other Investment Company 0.4Short-Term Investment Company 0.1Net Other Assets (Liabilities) ^ (0.4 )Total 100.0 %
DeltaShares® S&P 500 ManagedRisk ETF
Asset AllocationPercentage of Net
AssetsCommon Stocks 99.8 %Short-Term Investment Company 0.2Other Investment Company 0.0 *Net Other Assets (Liabilities) ^ 0.0 *Total 100.0 %
DeltaShares® S&P 600 ManagedRisk ETF
Asset AllocationPercentage of Net
AssetsCommon Stocks 68.3 %U.S. Government Obligation 31.5Other Investment Company 1.2Short-Term Investment Company 0.3Warrant 0.0 *Net Other Assets (Liabilities) ^ (1.3 )Total 100.0 %
DeltaShares® S&P EM 100 & Managed Risk ETF
Asset AllocationPercentage of Net
AssetsCommon Stocks 98.4 %Other Investment Company 0.9Preferred Stocks 0.9Short-Term Investment Company 0.2Net Other Assets (Liabilities) ^ (0.4 )Total 100.0 %
DeltaShares® S&P International Managed Risk ETF
Asset AllocationPercentage of Net
AssetsCommon Stocks 98.6 %Other Investment Company 3.0Preferred Stocks 0.6Short-Term Investment Company 0.1Rights 0.0 *Net Other Assets (Liabilities) ^ (2.3 )Total 100.0 %
Current and future portfolio holdings are subject to change and risk.
* Percentage rounds to less than 0.1% or (0.1)%.
^ The Net Other Assets (Liabilities) category may include, but is notlimited to, reverse repurchase agreements, forward foreign currencycontracts, futures contracts, swap agreements, written options andswaptions, and cash collateral.
Copyright © 2021 www.secdatabase.com. All Rights Reserved.Please Consider the Environment Before Printing This Document
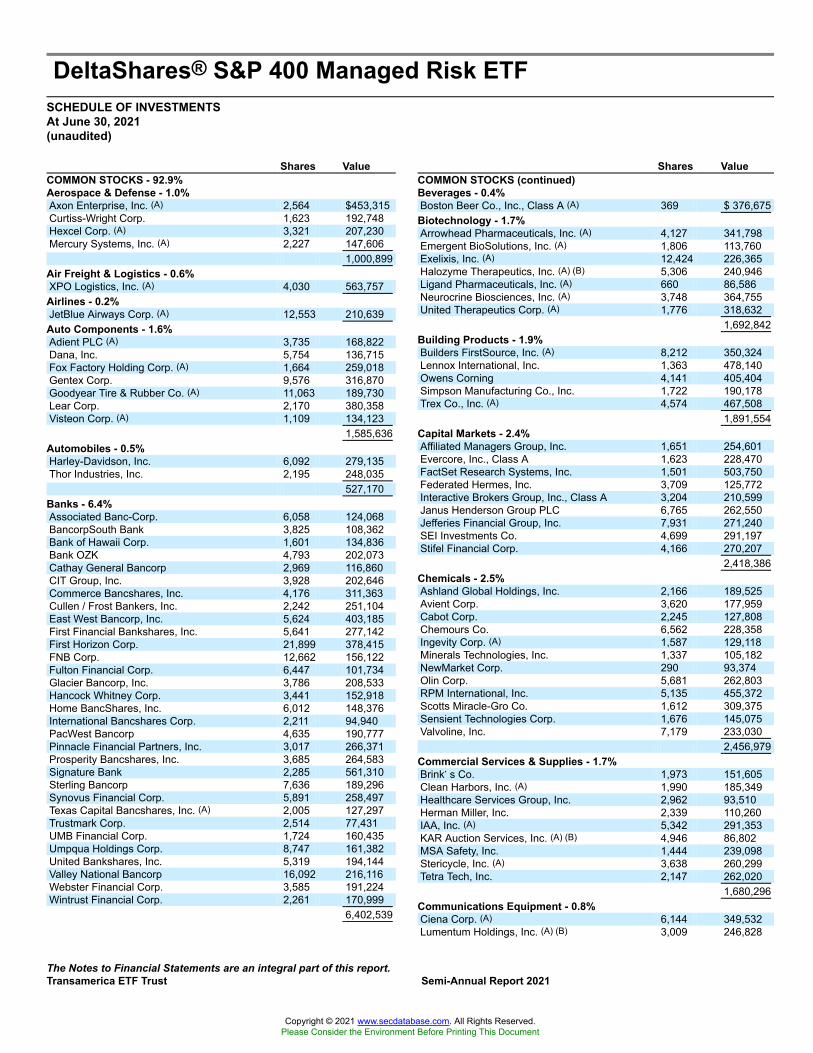
DeltaShares® S&P 400 Managed Risk ETFSCHEDULE OF INVESTMENTSAt June 30, 2021(unaudited)
The Notes to Financial Statements are an integral part of this report.Transamerica ETF Trust Semi-Annual Report 2021
Shares ValueCOMMON STOCKS - 92.9%Aerospace & Defense - 1.0%Axon Enterprise, Inc. (A) 2,564 $453,315Curtiss-Wright Corp. 1,623 192,748Hexcel Corp. (A) 3,321 207,230Mercury Systems, Inc. (A) 2,227 147,606
1,000,899Air Freight & Logistics - 0.6%XPO Logistics, Inc. (A) 4,030 563,757Airlines - 0.2%JetBlue Airways Corp. (A) 12,553 210,639Auto Components - 1.6%Adient PLC (A) 3,735 168,822Dana, Inc. 5,754 136,715Fox Factory Holding Corp. (A) 1,664 259,018Gentex Corp. 9,576 316,870Goodyear Tire & Rubber Co. (A) 11,063 189,730Lear Corp. 2,170 380,358Visteon Corp. (A) 1,109 134,123
1,585,636Automobiles - 0.5%Harley-Davidson, Inc. 6,092 279,135Thor Industries, Inc. 2,195 248,035
527,170Banks - 6.4%Associated Banc-Corp. 6,058 124,068BancorpSouth Bank 3,825 108,362Bank of Hawaii Corp. 1,601 134,836Bank OZK 4,793 202,073Cathay General Bancorp 2,969 116,860CIT Group, Inc. 3,928 202,646Commerce Bancshares, Inc. 4,176 311,363Cullen / Frost Bankers, Inc. 2,242 251,104East West Bancorp, Inc. 5,624 403,185First Financial Bankshares, Inc. 5,641 277,142First Horizon Corp. 21,899 378,415FNB Corp. 12,662 156,122Fulton Financial Corp. 6,447 101,734Glacier Bancorp, Inc. 3,786 208,533Hancock Whitney Corp. 3,441 152,918Home BancShares, Inc. 6,012 148,376International Bancshares Corp. 2,211 94,940PacWest Bancorp 4,635 190,777Pinnacle Financial Partners, Inc. 3,017 266,371Prosperity Bancshares, Inc. 3,685 264,583Signature Bank 2,285 561,310Sterling Bancorp 7,636 189,296Synovus Financial Corp. 5,891 258,497Texas Capital Bancshares, Inc. (A) 2,005 127,297Trustmark Corp. 2,514 77,431UMB Financial Corp. 1,724 160,435Umpqua Holdings Corp. 8,747 161,382United Bankshares, Inc. 5,319 194,144Valley National Bancorp 16,092 216,116Webster Financial Corp. 3,585 191,224Wintrust Financial Corp. 2,261 170,999
6,402,539
Shares ValueCOMMON STOCKS (continued)Beverages - 0.4%Boston Beer Co., Inc., Class A (A) 369 $ 376,675Biotechnology - 1.7%Arrowhead Pharmaceuticals, Inc. (A) 4,127 341,798Emergent BioSolutions, Inc. (A) 1,806 113,760Exelixis, Inc. (A) 12,424 226,365Halozyme Therapeutics, Inc. (A) (B) 5,306 240,946Ligand Pharmaceuticals, Inc. (A) 660 86,586Neurocrine Biosciences, Inc. (A) 3,748 364,755United Therapeutics Corp. (A) 1,776 318,632
1,692,842Building Products - 1.9%Builders FirstSource, Inc. (A) 8,212 350,324Lennox International, Inc. 1,363 478,140Owens Corning 4,141 405,404Simpson Manufacturing Co., Inc. 1,722 190,178Trex Co., Inc. (A) 4,574 467,508
1,891,554Capital Markets - 2.4%Affiliated Managers Group, Inc. 1,651 254,601Evercore, Inc., Class A 1,623 228,470FactSet Research Systems, Inc. 1,501 503,750Federated Hermes, Inc. 3,709 125,772Interactive Brokers Group, Inc., Class A 3,204 210,599Janus Henderson Group PLC 6,765 262,550Jefferies Financial Group, Inc. 7,931 271,240SEI Investments Co. 4,699 291,197Stifel Financial Corp. 4,166 270,207
2,418,386Chemicals - 2.5%Ashland Global Holdings, Inc. 2,166 189,525Avient Corp. 3,620 177,959Cabot Corp. 2,245 127,808Chemours Co. 6,562 228,358Ingevity Corp. (A) 1,587 129,118Minerals Technologies, Inc. 1,337 105,182NewMarket Corp. 290 93,374Olin Corp. 5,681 262,803RPM International, Inc. 5,135 455,372Scotts Miracle-Gro Co. 1,612 309,375Sensient Technologies Corp. 1,676 145,075Valvoline, Inc. 7,179 233,030
2,456,979Commercial Services & Supplies - 1.7%Brink�s Co. 1,973 151,605Clean Harbors, Inc. (A) 1,990 185,349Healthcare Services Group, Inc. 2,962 93,510Herman Miller, Inc. 2,339 110,260IAA, Inc. (A) 5,342 291,353KAR Auction Services, Inc. (A) (B) 4,946 86,802MSA Safety, Inc. 1,444 239,098Stericycle, Inc. (A) 3,638 260,299Tetra Tech, Inc. 2,147 262,020
1,680,296Communications Equipment - 0.8%Ciena Corp. (A) 6,144 349,532Lumentum Holdings, Inc. (A) (B) 3,009 246,828
Copyright © 2021 www.secdatabase.com. All Rights Reserved.Please Consider the Environment Before Printing This Document

Page 4
Copyright © 2021 www.secdatabase.com. All Rights Reserved.Please Consider the Environment Before Printing This Document

DeltaShares® S&P 400 Managed Risk ETFSCHEDULE OF INVESTMENTS (continued)At June 30, 2021(unaudited)
The Notes to Financial Statements are an integral part of this report.Transamerica ETF Trust Semi-Annual Report 2021
Page 5
Shares ValueCOMMON STOCKS (continued)Communications Equipment (continued)NetScout Systems, Inc. (A) 2,924 $ 83,451ViaSat, Inc. (A) 2,698 134,469
814,280Construction & Engineering - 1.3%AECOM (A) 5,804 367,509Dycom Industries, Inc. (A) 1,220 90,927EMCOR Group, Inc. 2,163 266,460Fluor Corp. (A) (B) 4,987 88,270MasTec, Inc. (A) 2,239 237,558Valmont Industries, Inc. 842 198,754
1,249,478Construction Materials - 0.2%Eagle Materials, Inc. 1,680 238,745Consumer Finance - 0.8%FirstCash, Inc. 1,627 124,368LendingTree, Inc. (A) 438 92,803Navient Corp. 7,117 137,572PROG Holdings, Inc. 2,670 128,507SLM Corp. 12,800 268,032
751,282Containers & Packaging - 0.8%AptarGroup, Inc. 2,605 366,888Greif, Inc., Class A 1,052 63,699Silgan Holdings, Inc. 3,108 128,982Sonoco Products Co. 3,989 266,864
826,433Diversified Consumer Services - 1.0%Adtalem Global Education, Inc. (A) 1,959 69,819Graham Holdings Co., Class B 160 101,424Grand Canyon Education, Inc. (A) 1,837 165,275H&R Block, Inc. 7,193 168,892Service Corp. International 6,666 357,231Strategic Education, Inc. 977 74,310WW International, Inc. (A) 1,902 68,738
1,005,689Diversified Telecommunication Services - 0.2%Iridium Communications, Inc. (A) (B) 4,657 186,233Electric Utilities - 1.0%ALLETE, Inc. 2,069 144,789Hawaiian Electric Industries, Inc. 4,329 183,030IDACORP, Inc. 2,003 195,293OGE Energy Corp. 7,936 267,046PNM Resources, Inc. 3,403 165,964
956,122Electrical Equipment - 1.6%Acuity Brands, Inc. 1,416 264,834EnerSys 1,698 165,946Hubbell, Inc. 2,153 402,266nVent Electric PLC 6,648 207,684Regal Beloit Corp. 1,611 215,085Sunrun, Inc. (A) (B) 6,387 356,267
1,612,082Electronic Equipment, Instruments & Components - 3.0%Arrow Electronics, Inc. (A) 2,940 334,660Avnet, Inc. 3,945 158,116
Shares ValueCOMMON STOCKS (continued)Electronic Equipment, Instruments & Components (continued)Belden, Inc. 1,774 $ 89,711Cognex Corp. 7,002 588,518Coherent, Inc. (A) 973 257,203II-VI, Inc. (A) (B) 4,158 301,829Jabil, Inc. 5,309 308,559Littelfuse, Inc. 973 247,911National Instruments Corp. 5,218 220,617SYNNEX Corp. 1,645 200,295Vishay Intertechnology, Inc. 5,261 118,636Vontier Corp. 6,692 218,025
3,044,080Energy Equipment & Services - 0.2%ChampionX Corp. (A) 7,423 190,400Entertainment - 0.2%Cinemark Holdings, Inc. (A) 4,313 94,670World Wrestling Entertainment, Inc., Class A (B) 1,794 103,855
198,525Equity Real Estate Investment Trusts - 8.6%American Campus Communities, Inc. 5,466 255,372Apartment Income Corp., REIT 6,217 294,872Brixmor Property Group, Inc. 11,773 269,484Camden Property Trust 3,873 513,831CoreSite Realty Corp. 1,704 229,358Corporate Office Properties Trust 4,453 124,639Cousins Properties, Inc. 5,893 216,745CyrusOne, Inc. 4,858 347,444Douglas Emmett, Inc. 6,539 219,841EastGroup Properties, Inc. 1,587 260,982EPR Properties (A) 2,964 156,144First Industrial Realty Trust, Inc. 5,119 267,365Healthcare Realty Trust, Inc. 5,616 169,603Highwoods Properties, Inc. 4,125 186,326Hudson Pacific Properties, Inc. 5,985 166,503JBG SMITH Properties 4,379 137,982Kilroy Realty Corp. 4,201 292,558Lamar Advertising Co., Class A 3,437 358,892Life Storage, Inc. 3,047 327,095Macerich Co. 6,632 121,034Medical Properties Trust, Inc. 23,320 468,732National Retail Properties, Inc. 6,961 326,332National Storage Affiliates Trust 2,733 138,180Omega Healthcare Investors, Inc. 9,331 338,622Park Hotels & Resorts, Inc. (A) 9,376 193,239Pebblebrook Hotel Trust 5,209 122,672Physicians Realty Trust 8,542 157,771PotlatchDeltic Corp. 2,658 141,273PS Business Parks, Inc. 797 118,020Rayonier, Inc. 5,512 198,046Rexford Industrial Realty, Inc. 5,315 302,689Sabra Health Care, Inc. 8,561 155,810SL Green Realty Corp. (B) 2,750 220,000Spirit Realty Capital, Inc. 4,558 218,055STORE Capital Corp. 9,652 333,091Urban Edge Properties 4,361 83,295Weingarten Realty Investors 4,756 152,525
8,584,422
Copyright © 2021 www.secdatabase.com. All Rights Reserved.Please Consider the Environment Before Printing This Document

DeltaShares® S&P 400 Managed Risk ETFSCHEDULE OF INVESTMENTS (continued)At June 30, 2021(unaudited)
The Notes to Financial Statements are an integral part of this report.Transamerica ETF Trust Semi-Annual Report 2021
Page 6
Shares ValueCOMMON STOCKS (continued)Food & Staples Retailing - 0.8%BJ�s Wholesale Club Holdings, Inc. (A) 5,437 $ 258,692Casey�s General Stores, Inc. 1,465 285,148Grocery Outlet Holding Corp. (A) (B) 3,453 119,681Sprouts Farmers Market, Inc. (A) 4,683 116,373
779,894Food Products - 1.7%Darling Ingredients, Inc. (A) 6,469 436,657Flowers Foods, Inc. 7,806 188,905Hain Celestial Group, Inc. (A) 3,242 130,069Ingredion, Inc. 2,655 240,278Lancaster Colony Corp. 775 149,970Pilgrim�s Pride Corp. (A) 1,932 42,852Post Holdings, Inc. (A) 2,346 254,471Sanderson Farms, Inc. 788 148,120Tootsie Roll Industries, Inc. (B) 698 23,669TreeHouse Foods, Inc. (A) 2,229 99,235
1,714,226Gas Utilities - 1.2%National Fuel Gas Co. 3,615 188,884New Jersey Resources Corp. 3,819 151,118ONE Gas, Inc. 2,111 156,467Southwest Gas Holdings, Inc. 2,299 152,171Spire, Inc. 2,049 148,081UGI Corp. 8,274 383,169
1,179,890Health Care Equipment & Supplies - 3.1%Envista Holdings Corp. (A) 6,374 275,420Globus Medical, Inc., Class A (A) 3,077 238,560Haemonetics Corp. (A) 2,020 134,613Hill-Rom Holdings, Inc. 2,635 299,310ICU Medical, Inc. (A) 782 160,936Integra LifeSciences Holdings Corp. (A) 2,816 192,164LivaNova PLC (A) 1,937 162,921Masimo Corp. (A) 2,006 486,355Neogen Corp. (A) 4,258 196,038NuVasive, Inc. (A) 2,048 138,813Penumbra, Inc. (A) 1,345 368,611Quidel Corp. (A) (B) 1,535 196,664STAAR Surgical Co. (A) 1,859 283,497
3,133,902Health Care Providers & Services - 2.8%Acadia Healthcare Co., Inc. (A) 3,558 223,264Amedisys, Inc. (A) 1,291 316,205Chemed Corp. 632 299,884Encompass Health Corp. 3,946 307,906HealthEquity, Inc. (A) 3,306 266,067LHC Group, Inc. (A) 1,255 251,326Molina Healthcare, Inc. (A) 2,315 585,834Patterson Cos., Inc. 3,448 104,785Progyny, Inc. (A) 1,474 86,966R1 RCM, Inc. (A) 5,480 121,875Tenet Healthcare Corp. (A) 4,234 283,636
2,847,748Hotels, Restaurants & Leisure - 2.6%Boyd Gaming Corp. (A) 3,199 196,706Choice Hotels International, Inc. 1,145 136,095
Shares ValueCOMMON STOCKS (continued)Hotels, Restaurants & Leisure (continued)Churchill Downs, Inc. 1,374 $ 272,409Cracker Barrel Old Country Store, Inc. 941 139,701Jack in the Box, Inc. 881 98,178Marriott Vacations Worldwide Corp. (A) 1,693 269,695Papa John�s International, Inc. 1,311 136,921Scientific Games Corp., Class A (A) 2,247 174,008Six Flags Entertainment Corp. (A) 3,013 130,402Texas Roadhouse, Inc. 2,599 250,024Travel & Leisure Co. 3,417 203,141Wendy�s Co. 7,021 164,432Wingstop, Inc. 1,179 185,846Wyndham Hotels & Resorts, Inc. 3,703 267,690
2,625,248Household Durables - 1.4%Helen of Troy Ltd. (A) 969 221,048KB Home 3,523 143,457Taylor Morrison Home Corp. (A) 5,113 135,085Tempur Sealy International, Inc. 7,262 284,598Toll Brothers, Inc. 4,451 257,312TopBuild Corp. (A) 1,311 259,290Tri Pointe Homes, Inc. (A) 4,695 100,614
1,401,404Household Products - 0.1%Energizer Holdings, Inc. 2,304 99,026Industrial Conglomerates - 0.4%Carlisle Cos., Inc. 2,069 395,965Insurance - 3.8%Alleghany Corp. (A) 552 368,223American Financial Group, Inc. 2,733 340,860Brighthouse Financial, Inc. (A) 3,401 154,882Brown & Brown, Inc. 9,274 492,820CNO Financial Group, Inc. 5,216 123,202First American Financial Corp. 4,351 271,285Hanover Insurance Group, Inc. 1,423 193,016Kemper Corp. 2,406 177,803Kinsale Capital Group, Inc. 850 140,054Mercury General Corp. 1,054 68,457Old Republic International Corp. 11,236 279,889Primerica, Inc. 1,564 239,511Reinsurance Group of America, Inc. 2,695 307,230RenaissanceRe Holdings Ltd. 1,968 292,878RLI Corp. 1,577 164,938Selective Insurance Group, Inc. 2,380 193,137
3,808,185Interactive Media & Services - 0.3%TripAdvisor, Inc. (A) 3,887 156,646Yelp, Inc. (A) 2,776 110,929
267,575IT Services - 1.6%Alliance Data Systems Corp. 1,971 205,358Concentrix Corp. (A) 1,651 265,481Genpact Ltd. 6,906 313,740LiveRamp Holdings, Inc. (A) 2,712 127,057MAXIMUS, Inc. 2,437 214,383Sabre Corp. (A) (B) 12,665 158,059
Copyright © 2021 www.secdatabase.com. All Rights Reserved.Please Consider the Environment Before Printing This Document

DeltaShares® S&P 400 Managed Risk ETFSCHEDULE OF INVESTMENTS (continued)At June 30, 2021(unaudited)
The Notes to Financial Statements are an integral part of this report.Transamerica ETF Trust Semi-Annual Report 2021
Shares ValueCOMMON STOCKS (continued)IT Services (continued)WEX, Inc. (A) 1,774 $ 343,979
1,628,057Leisure Products - 1.3%Brunswick Corp. 3,088 307,627Callaway Golf Co. 4,613 155,596Mattel, Inc. (A) 13,827 277,923Polaris, Inc. 2,282 312,543YETI Holdings, Inc. (A) 2,975 273,164
1,326,853Life Sciences Tools & Services - 2.1%Bio-Techne Corp. 1,542 694,301Medpace Holdings, Inc. (A) 1,098 193,940PRA Health Sciences, Inc. (A) 2,569 424,424Repligen Corp. (A) 2,024 404,031Syneos Health, Inc. (A) 4,014 359,213
2,075,909Machinery - 4.9%AGCO Corp. 2,450 319,431Colfax Corp. (A) 4,677 214,253Crane Co. 1,968 181,784Donaldson Co., Inc. 5,000 317,650Flowserve Corp. 5,166 208,293Graco, Inc. 6,717 508,477ITT, Inc. 3,413 312,597Kennametal, Inc. 3,314 119,039Lincoln Electric Holdings, Inc. 2,360 310,836Middleby Corp. (A) 2,206 382,212Nordson Corp. 2,143 470,410Oshkosh Corp. 2,720 339,021Terex Corp. 2,767 131,764Timken Co. 2,711 218,479Toro Co. 4,245 466,441Trinity Industries, Inc. 3,208 86,263Woodward, Inc. 2,324 285,573
4,872,523Marine - 0.1%Kirby Corp. (A) 2,383 144,505Media - 0.9%Cable One, Inc. 215 411,254John Wiley & Sons, Inc., Class A 1,726 103,871New York Times Co., Class A 5,758 250,761TEGNA, Inc. 8,753 164,206
930,092Metals & Mining - 2.1%Cleveland-Cliffs, Inc. (A) (B) 18,215 392,715Commercial Metals Co. 4,778 146,780Compass Minerals International, Inc. 1,348 79,883Reliance Steel & Aluminum Co. 2,526 381,173Royal Gold, Inc. 2,601 296,774Steel Dynamics, Inc. 7,955 474,118U.S. Steel Corp. 10,691 256,584Worthington Industries, Inc. 1,387 84,857
2,112,884Multi-Utilities - 0.5%Black Hills Corp. 2,493 163,616MDU Resources Group, Inc. 7,977 249,999
Shares ValueCOMMON STOCKS (continued)Multi-Utilities (continued)NorthWestern Corp. 2,009 $ 120,982
534,597Multiline Retail - 0.7%Kohl�s Corp. 6,194 341,351Nordstrom, Inc. (A) 4,316 157,836Ollie�s Bargain Outlet Holdings, Inc. (A) (B) 2,252 189,461
688,648Oil, Gas & Consumable Fuels - 1.7%Antero Midstream Corp. (B) 11,355 117,978Cimarex Energy Co. 4,077 295,379CNX Resources Corp. (A) 8,733 119,293EQT Corp. (A) 11,065 246,307Equitrans Midstream Corp. 16,118 137,164HollyFrontier Corp. 5,925 194,933Murphy Oil Corp. 5,754 133,953Targa Resources Corp. 9,065 402,939World Fuel Services Corp. 2,507 79,547
1,727,493Paper & Forest Products - 0.2%Louisiana-Pacific Corp. 4,054 244,416Personal Products - 0.2%Coty, Inc., Class A (A) 11,238 104,963Nu Skin Enterprises, Inc., Class A 1,984 112,393
217,356Pharmaceuticals - 0.6%Jazz Pharmaceuticals PLC (A) 2,383 423,316Nektar Therapeutics (A) 7,228 124,033
547,349Professional Services - 1.4%ASGN, Inc. (A) 2,109 204,425CACI International, Inc., Class A (A) 934 238,282FTI Consulting, Inc. (A) 1,357 185,380Insperity, Inc. 1,426 128,868KBR, Inc. 5,604 213,793ManpowerGroup, Inc. 2,162 257,083Science Applications International Corp. 2,298 201,603
1,429,434Real Estate Management & Development - 0.4%Jones Lang LaSalle, Inc. (A) 2,034 397,566Road & Rail - 0.9%Avis Budget Group, Inc. (A) 2,050 159,675Knight-Swift Transportation Holdings, Inc. 4,856 220,754Landstar System, Inc. 1,523 240,664Ryder System, Inc. 2,136 158,769Werner Enterprises, Inc. 2,262 100,704
880,566Semiconductors & Semiconductor Equipment - 3.8%Amkor Technology, Inc. 4,260 100,834Brooks Automation, Inc. 2,946 280,695Cirrus Logic, Inc. (A) 2,281 194,159CMC Materials, Inc. 1,160 174,858Cree, Inc. (A) (B) 4,578 448,324First Solar, Inc. (A) 3,372 305,200Lattice Semiconductor Corp. (A) 5,414 304,158MKS Instruments, Inc. 2,195 390,600
Copyright © 2021 www.secdatabase.com. All Rights Reserved.Please Consider the Environment Before Printing This Document

Page 7
Copyright © 2021 www.secdatabase.com. All Rights Reserved.Please Consider the Environment Before Printing This Document

DeltaShares® S&P 400 Managed Risk ETFSCHEDULE OF INVESTMENTS (continued)At June 30, 2021(unaudited)
FUTURES CONTRACTS:
Long Futures Contracts
DescriptionNumber ofContracts
ExpirationDate
NotionalAmount Value
UnrealizedAppreciation
UnrealizedDepreciation
S&P Midcap 400® E-Mini Index 1 09/17/2021 $ 272,566 $ 269,240 $ � $ (3,326 )
The Notes to Financial Statements are an integral part of this report.Transamerica ETF Trust Semi-Annual Report 2021
Shares ValueCOMMON STOCKS (continued)Semiconductors & Semiconductor Equipment (continued)Semtech Corp. (A) 2,574 $ 177,091Silicon Laboratories, Inc. (A) 1,774 271,865SolarEdge Technologies, Inc. (A) 2,061 569,599Synaptics, Inc. (A) 1,396 217,190Universal Display Corp. 1,701 378,183
3,812,756Software - 3.7%ACI Worldwide, Inc. (A) 4,684 173,964Aspen Technology, Inc. (A) 2,696 370,808Blackbaud, Inc. (A) 1,935 148,163CDK Global, Inc. 4,828 239,903Ceridian HCM Holding, Inc. (A) 5,207 499,455CommVault Systems, Inc. (A) 1,825 142,660Envestnet, Inc. (A) 2,158 163,706Fair Isaac Corp. (A) 1,141 573,558j2 Global, Inc. (A) 1,682 231,359Manhattan Associates, Inc. (A) 2,522 365,287Paylocity Holding Corp. (A) 1,490 284,292Qualys, Inc. (A) 1,335 134,421SailPoint Technologies Holdings, Inc. (A) 3,660 186,916Teradata Corp. (A) 4,345 217,120
3,731,612Specialty Retail - 3.0%American Eagle Outfitters, Inc. (B) 5,984 224,579AutoNation, Inc. (A) 2,138 202,704Dick�s Sporting Goods, Inc. (B) 2,598 260,294Five Below, Inc. (A) 2,220 429,059Foot Locker, Inc. 4,095 252,375Lithia Motors, Inc., Class A 1,180 405,495Murphy USA, Inc. 993 132,436RH (A) 667 452,893Urban Outfitters, Inc. (A) 2,726 112,366Williams-Sonoma, Inc. 3,021 482,303
2,954,504Technology Hardware, Storage & Peripherals - 0.4%NCR Corp. (A) 5,190 236,716Xerox Holdings Corp. 6,392 150,148
386,864Textiles, Apparel & Luxury Goods - 1.6%Capri Holdings Ltd. (A) 5,999 343,083Carter�s, Inc. 1,743 179,825Columbia Sportswear Co. 1,212 119,212Crocs, Inc. (A) 2,586 301,321Deckers Outdoor Corp. (A) 1,103 423,629Skechers USA, Inc., Class A (A) 5,319 265,046
1,632,116
Shares ValueCOMMON STOCKS (continued)Thrifts & Mortgage Finance - 0.7%Essent Group Ltd. 4,474 $ 201,106MGIC Investment Corp. 13,452 182,947New York Community Bancorp, Inc. 18,438 203,187Washington Federal, Inc. 2,871 91,241
678,481Trading Companies & Distributors - 0.8%GATX Corp. (B) 1,403 124,123MSC Industrial Direct Co., Inc.,Class A 1,863 167,167
Univar Solutions, Inc. (A) 6,723 163,907Watsco, Inc. 1,305 374,065
829,262Water Utilities - 0.4%Essential Utilities, Inc. 8,862 404,993Wireless Telecommunication Services - 0.1%Telephone & Data Systems, Inc. 3,949 89,484Total Common Stocks
(Cost $75,488,494) 92,996,526
Principal ValueSHORT-TERM U.S. GOVERNMENT OBLIGATION - 7.0%U.S. Treasury Bill0.04% (C), 09/30/2021 (D) $ 6,996,000 6,995,279
Total Short-Term U.S. Government Obligation(Cost $6,995,284) 6,995,279
Shares ValueSHORT-TERM INVESTMENT COMPANY - 0.1%Money Market Fund - 0.1%State Street Institutional TreasuryMoney Market Fund, 0.01% (C) 101,820 101,820
Total Short-Term Investment Company(Cost $101,820) 101,820
OTHER INVESTMENT COMPANY - 0.4%Securities Lending Collateral - 0.4%State Street Navigator SecuritiesLending Trust - GovernmentMoney Market Portfolio, 0.02% (C) 415,081 415,081
Total Other Investment Company(Cost $415,081) 415,081
Total Investments(Cost $83,000,679) 100,508,706
Net Other Assets (Liabilities)- (0.4)% (365,523 )
Net Assets - 100.0% $ 100,143,183
Copyright © 2021 www.secdatabase.com. All Rights Reserved.Please Consider the Environment Before Printing This Document

Page 8
Copyright © 2021 www.secdatabase.com. All Rights Reserved.Please Consider the Environment Before Printing This Document

DeltaShares® S&P 400 Managed Risk ETFSCHEDULE OF INVESTMENTS (continued)At June 30, 2021(unaudited)
INVESTMENT VALUATION:
Valuation Inputs (E)
Level 1 -Unadjusted
Quoted Prices
Level 2 -Other Significant
Observable Inputs
Level 3 -Significant
Unobservable Inputs ValueASSETSInvestmentsCommon Stocks $92,996,526 $ � $ � $92,996,526Short-Term U.S. Government Obligation � 6,995,279 � 6,995,279Short-Term Investment Company 101,820 � � 101,820Other Investment Company 415,081 � � 415,081Total Investments $93,513,427 $ 6,995,279 $ �� $100,508,706
LIABILITIESOther Financial InstrumentsFutures Contracts (F) $(3,326 ) $ � $ � $(3,326 )Total Other Financial Instruments $(3,326 ) $ �� $ �� $(3,326 )
FOOTNOTES TO SCHEDULE OF INVESTMENTS:
(A) Non-income producing securities.(B) All or a portion of the securities are on loan. The total value of all securities on loan is $3,549,310, collateralized by cash collateral of $415,081 and
non-cash collateral, such as U.S. government securities and irrevocable letters of credit, of $3,215,055. The amount of securities on loan indicatedmay not correspond with the securities on loan identified because securities with pending sales are in the process of recall from the brokers.
(C) Rates disclosed reflect the yields at June 30, 2021.(D) When-issued, delayed-delivery and/or forward commitment (including TBAs) security. Security to be settled and delivered after June 30, 2021.
Security may display a coupon rate of 0.00%, as the rate is to be determined at time of settlement.(E) There were no transfers in or out of Level 3 during the six-month period ended June 30, 2021. Please reference the Investment Valuation section of
the Notes to Financial Statements for more information regarding investment valuation and pricing inputs.(F) Derivative instruments are valued at unrealized appreciation (depreciation).
PORTFOLIO ABBREVIATION:
REIT Real Estate Investment Trust
The Notes to Financial Statements are an integral part of this report.Transamerica ETF Trust Semi-Annual Report 2021
Page 9
Copyright © 2021 www.secdatabase.com. All Rights Reserved.Please Consider the Environment Before Printing This Document

DeltaShares® S&P 500 Managed Risk ETFSCHEDULE OF INVESTMENTSAt June 30, 2021(unaudited)
The Notes to Financial Statements are an integral part of this report.Transamerica ETF Trust Semi-Annual Report 2021
Shares ValueCOMMON STOCKS - 99.8%Aerospace & Defense - 1.6%Boeing Co. (A) 6,221 $1,490,303General Dynamics Corp. 2,589 487,405Howmet Aerospace, Inc. (A) 4,423 152,461Huntington Ingalls Industries, Inc. 455 95,891L3 Harris Technologies, Inc. 2,320 501,468Lockheed Martin Corp. 2,767 1,046,894Northrop Grumman Corp. 1,694 615,650Raytheon Technologies Corp. 17,145 1,462,640Teledyne Technologies, Inc. (A) 525 219,886Textron, Inc. 2,553 175,570TransDigm Group, Inc. (A) 621 401,967
6,650,135Air Freight & Logistics - 0.7%CH Robinson Worldwide, Inc. 1,504 140,880Expeditors International of Washington, Inc. 1,912 242,059FedEx Corp. 2,762 823,988United Parcel Service, Inc., Class B 8,186 1,702,442
2,909,369Airlines - 0.3%Alaska Air Group, Inc. (A) 1,410 85,037American Airlines Group, Inc. (A) 7,257 153,921Delta Air Lines, Inc. (A) 7,238 313,116Southwest Airlines Co. (A) 6,691 355,225United Airlines Holdings, Inc. (A) 3,663 191,538
1,098,837Auto Components - 0.2%Aptiv PLC (A) 3,062 481,744BorgWarner, Inc. 2,713 131,689
613,433Automobiles - 1.8%Ford Motor Co. (A) 44,368 659,309General Motors Co. (A) 14,447 854,829Tesla, Inc. (A) 8,722 5,928,343
7,442,481Banks - 4.3%Bank of America Corp. 85,335 3,518,362Citigroup, Inc. 23,391 1,654,913Citizens Financial Group, Inc. 4,821 221,139Comerica, Inc. 1,579 112,646Fifth Third Bancorp 7,966 304,540First Republic Bank 1,990 372,468Huntington Bancshares, Inc. 16,698 238,281JPMorgan Chase & Co. 34,256 5,328,178KeyCorp 10,983 226,799M&T Bank Corp. 1,455 211,426People�s United Financial, Inc. 4,838 82,923PNC Financial Services Group, Inc. 4,809 917,365Regions Financial Corp. 10,878 219,518SVB Financial Group (A) 615 342,205Truist Financial Corp. 15,218 844,599US Bancorp 15,340 873,920Wells Fargo & Co. 46,777 2,118,531Zions Bancorp NA 1,855 98,055
17,685,868
Shares ValueCOMMON STOCKS (continued)Beverages - 1.4%Brown-Forman Corp., Class B 2,066 $ 154,826Coca-Cola Co. 43,913 2,376,132Constellation Brands, Inc., Class A 1,914 447,666Molson Coors Beverage Co., Class B (A) 2,131 114,413Monster Beverage Corp. (A) 4,188 382,574PepsiCo, Inc. 15,633 2,316,342
5,791,953Biotechnology - 1.8%AbbVie, Inc. 19,987 2,251,336Alexion Pharmaceuticals, Inc. (A) 2,502 459,642Amgen, Inc. 6,503 1,585,106Biogen, Inc. (A) 1,704 590,044Gilead Sciences, Inc. 14,192 977,261Incyte Corp. (A) 2,115 177,935Regeneron Pharmaceuticals, Inc. (A) 1,185 661,870Vertex Pharmaceuticals, Inc. (A) 2,930 590,776
7,293,970Building Products - 0.5%A.O. Smith Corp. 1,521 109,603Allegion PLC 1,018 141,807Carrier Global Corp. 9,244 449,259Fortune Brands Home & Security, Inc. 1,566 155,989Johnson Controls International PLC 8,111 556,658Masco Corp. 2,872 169,190Trane Technologies PLC 2,706 498,283
2,080,789Capital Markets - 3.0%Ameriprise Financial, Inc. 1,313 326,779Bank of New York Mellon Corp. 9,130 467,730BlackRock, Inc. 1,605 1,404,327Cboe Global Markets, Inc. 1,208 143,812Charles Schwab Corp. 16,972 1,235,731CME Group, Inc. 4,064 864,332Franklin Resources, Inc. 3,083 98,625Goldman Sachs Group, Inc. 3,849 1,460,811Intercontinental Exchange, Inc. 6,369 756,000Invesco Ltd. 4,281 114,431MarketAxess Holdings, Inc. 429 198,880Moody�s Corp. 1,822 660,238Morgan Stanley 16,843 1,544,335MSCI, Inc. 932 496,831Nasdaq, Inc. 1,301 228,716Northern Trust Corp. 2,356 272,401Raymond James Financial, Inc. 1,385 179,911S&P Global, Inc. 2,725 1,118,476State Street Corp. 3,935 323,772T. Rowe Price Group, Inc. 2,566 507,991
12,404,129Chemicals - 1.8%Air Products & Chemicals, Inc. 2,506 720,926Albemarle Corp. 1,322 222,704Celanese Corp. 1,275 193,290CF Industries Holdings, Inc. 2,428 124,921Corteva, Inc. 8,340 369,879Dow, Inc. 8,453 534,906DuPont de Nemours, Inc. 6,021 466,086Eastman Chemical Co. 1,544 180,262
Copyright © 2021 www.secdatabase.com. All Rights Reserved.Please Consider the Environment Before Printing This Document

Page 10
Copyright © 2021 www.secdatabase.com. All Rights Reserved.Please Consider the Environment Before Printing This Document

DeltaShares® S&P 500 Managed Risk ETFSCHEDULE OF INVESTMENTS (continued)At June 30, 2021(unaudited)
The Notes to Financial Statements are an integral part of this report.Transamerica ETF Trust Semi-Annual Report 2021
Shares ValueCOMMON STOCKS (continued)Chemicals (continued)Ecolab, Inc. 2,815 $ 579,805FMC Corp. 1,457 157,647International Flavors & Fragrances, Inc. 2,817 420,860Linde PLC 5,888 1,702,221LyondellBasell Industries NV, Class A 2,914 299,763Mosaic Co. 3,911 124,800PPG Industries, Inc. 2,682 455,323Sherwin-Williams Co. 2,708 737,795
7,291,188Commercial Services & Supplies - 0.4%Cintas Corp. 998 381,236Copart, Inc. (A) 2,356 310,592Republic Services, Inc. 2,383 262,154Rollins, Inc. 2,507 85,739Waste Management, Inc. 4,394 615,643
1,655,364Communications Equipment - 0.8%Arista Networks, Inc. (A) 622 225,357Cisco Systems, Inc. 47,688 2,527,464F5 Networks, Inc. (A) 675 125,996Juniper Networks, Inc. 3,707 101,386Motorola Solutions, Inc. 1,921 416,569
3,396,772Construction & Engineering - 0.0% (B)Quanta Services, Inc. 1,576 142,738Construction Materials - 0.1%Martin Marietta Materials, Inc. 707 248,730Vulcan Materials Co. 1,500 261,105
509,835Consumer Finance - 0.7%American Express Co. 7,363 1,216,589Capital One Financial Corp. 5,109 790,311Discover Financial Services 3,450 408,101Synchrony Financial 6,120 296,942
2,711,943Containers & Packaging - 0.3%Amcor PLC 17,446 199,931Avery Dennison Corp. 938 197,205Ball Corp. 3,713 300,827International Paper Co. 4,432 271,726Packaging Corp. of America 1,075 145,577Sealed Air Corp. 1,720 101,910WestRock Co. 3,012 160,299
1,377,475Distributors - 0.1%Genuine Parts Co. 1,634 206,652LKQ Corp. (A) 3,144 154,748Pool Corp. 454 208,231
569,631Diversified Financial Services - 1.5%Berkshire Hathaway, Inc., Class B (A) 21,447 5,960,550Diversified Telecommunication Services - 1.2%AT&T, Inc. 80,798 2,325,366Lumen Technologies, Inc. 11,256 152,969
Shares ValueCOMMON STOCKS (continued)Diversified Telecommunication Services (continued)Verizon Communications, Inc. 46,848 $ 2,624,894
5,103,229Electric Utilities - 1.6%Alliant Energy Corp. 2,830 157,801American Electric Power Co., Inc. 5,655 478,356Duke Energy Corp. 8,706 859,456Edison International 4,292 248,163Entergy Corp. 2,271 226,419Evergy, Inc. 2,593 156,695Eversource Energy 3,886 311,813Exelon Corp. 11,059 490,024FirstEnergy Corp. 6,154 228,990NextEra Energy, Inc. 22,196 1,626,523NRG Energy, Inc. 2,769 111,591Pinnacle West Capital Corp. 1,277 104,676PPL Corp. 8,708 243,563Southern Co. 11,980 724,910Xcel Energy, Inc. 6,090 401,209
6,370,189Electrical Equipment - 0.6%AMETEK, Inc. 2,612 348,702Eaton Corp. PLC 4,509 668,143Emerson Electric Co. 6,786 653,085Generac Holdings, Inc. (A) 713 296,002Rockwell Automation, Inc. 1,314 375,830
2,341,762Electronic Equipment, Instruments & Components - 0.6%Amphenol Corp., Class A 6,762 462,588CDW Corp. 1,586 276,995Corning, Inc. 8,768 358,611IPG Photonics Corp. (A) 405 85,362Keysight Technologies, Inc. (A) 2,084 321,790TE Connectivity Ltd. 3,736 505,145Trimble, Inc. (A) 2,840 232,397Zebra Technologies Corp., Class A (A) 606 320,871
2,563,759Energy Equipment & Services - 0.2%Baker Hughes Co. 8,230 188,220Halliburton Co. 10,067 232,749NOV, Inc. (A) 4,420 67,715Schlumberger NV 15,823 506,494
995,178Entertainment - 1.9%Activision Blizzard, Inc. 8,791 839,013Electronic Arts, Inc. 3,238 465,721Live Nation Entertainment, Inc. (A) 1,634 143,122Netflix, Inc. (A) 5,017 2,650,030Take-Two Interactive Software, Inc. (A) 1,310 231,896Walt Disney Co. (A) 20,561 3,614,007
7,943,789Equity Real Estate Investment Trusts - 2.5%Alexandria Real Estate Equities, Inc. 1,552 282,371American Tower Corp. 5,146 1,390,140AvalonBay Communities, Inc. 1,579 329,522Boston Properties, Inc. 1,607 184,146Crown Castle International Corp. 4,890 954,039
Copyright © 2021 www.secdatabase.com. All Rights Reserved.Please Consider the Environment Before Printing This Document

Page 11
Copyright © 2021 www.secdatabase.com. All Rights Reserved.Please Consider the Environment Before Printing This Document

DeltaShares® S&P 500 Managed Risk ETFSCHEDULE OF INVESTMENTS (continued)At June 30, 2021(unaudited)
The Notes to Financial Statements are an integral part of this report.Transamerica ETF Trust Semi-Annual Report 2021
Shares ValueCOMMON STOCKS (continued)Equity Real Estate Investment Trusts (continued)Digital Realty Trust, Inc. 3,185 $ 479,215Duke Realty Corp. 4,245 201,001Equinix, Inc. 1,013 813,034Equity Residential 3,893 299,761Essex Property Trust, Inc. 736 220,807Extra Space Storage, Inc. 1,512 247,696Federal Realty Investment Trust 802 93,970Healthpeak Properties, Inc. 6,098 203,002Host Hotels & Resorts, Inc. (A) 7,990 136,549Iron Mountain, Inc. (C) 3,267 138,259Kimco Realty Corp. 4,904 102,248Mid-America Apartment Communities, Inc. 1,296 218,272Prologis, Inc. 8,371 1,000,586Public Storage 1,723 518,089Realty Income Corp. 4,229 282,243Regency Centers Corp. 1,788 114,557SBA Communications Corp. 1,238 394,551Simon Property Group, Inc. 3,716 484,864UDR, Inc. 3,359 164,524Ventas, Inc. 4,247 242,504Vornado Realty Trust 1,777 82,933Welltower, Inc. 4,726 392,731Weyerhaeuser Co. 8,478 291,813
10,263,427Food & Staples Retailing - 1.3%Costco Wholesale Corp. 5,002 1,979,141Kroger Co. 8,568 328,240Sysco Corp. 5,790 450,173Walgreens Boots Alliance, Inc. 8,120 427,193Walmart, Inc. 15,539 2,191,310
5,376,057Food Products - 0.9%Archer-Daniels-Midland Co. 6,323 383,174Campbell Soup Co. 2,297 104,720Conagra Brands, Inc. 5,430 197,543General Mills, Inc. 6,903 420,600Hershey Co. 1,656 288,442Hormel Foods Corp. (C) 3,189 152,275J.M. Smucker Co. 1,241 160,796Kellogg Co. 2,851 183,405Kraft Heinz Co. 7,336 299,162Lamb Weston Holdings, Inc. 1,655 133,492McCormick & Co., Inc. 2,818 248,886Mondelez International, Inc., Class A 15,896 992,546Tyson Foods, Inc., Class A 3,335 245,990
3,811,031Gas Utilities - 0.0% (B)Atmos Energy Corp. 1,478 142,050Health Care Equipment & Supplies - 3.6%Abbott Laboratories 20,108 2,331,120ABIOMED, Inc. (A) 512 159,800Align Technology, Inc. (A) 816 498,576Baxter International, Inc. 5,690 458,045Becton Dickinson & Co. 3,290 800,095Boston Scientific Corp. (A) 16,080 687,581Cooper Cos., Inc. 557 220,722Danaher Corp. 7,183 1,927,630
Shares ValueCOMMON STOCKS (continued)Health Care Equipment & Supplies (continued)DENTSPLY SIRONA, Inc. 2,472 $ 156,379DexCom, Inc. (A) 1,094 467,138Edwards Lifesciences Corp. (A) 7,036 728,719Hologic, Inc. (A) 2,900 193,488IDEXX Laboratories, Inc. (A) 964 608,814Intuitive Surgical, Inc. (A) 1,341 1,233,237Medtronic PLC 15,224 1,889,755ResMed, Inc. 1,646 405,772STERIS PLC 1,105 227,962Stryker Corp. 3,708 963,079Teleflex, Inc. 529 212,547West Pharmaceutical Services, Inc. 837 300,567Zimmer Biomet Holdings, Inc. 2,360 379,535
14,850,561Health Care Providers & Services - 2.6%AmerisourceBergen Corp. 1,673 191,542Anthem, Inc. 2,770 1,057,586Cardinal Health, Inc. 3,283 187,426Centene Corp. (A) 6,593 480,828Cigna Corp. 3,883 920,543CVS Health Corp. 14,899 1,243,173DaVita, Inc. (A) 794 95,621HCA Healthcare, Inc. 2,975 615,052Henry Schein, Inc. (A) 1,592 118,110Humana, Inc. 1,459 645,928Laboratory Corp. of America Holdings (A) 1,105 304,814McKesson Corp. 1,791 342,511Quest Diagnostics, Inc. 1,477 194,920UnitedHealth Group, Inc. 10,678 4,275,898Universal Health Services, Inc., Class B 881 129,005
10,802,957Health Care Technology - 0.1%Cerner Corp. 3,410 266,526Hotels, Restaurants & Leisure - 2.0%Booking Holdings, Inc. (A) 464 1,015,274Caesars Entertainment, Inc. (A) 2,362 245,057Carnival Corp. (A) 9,033 238,110Chipotle Mexican Grill, Inc. (A) 317 491,458Darden Restaurants, Inc. 1,479 215,919Domino�s Pizza, Inc. 439 204,789Expedia Group, Inc. (A) 1,600 261,936Hilton Worldwide Holdings, Inc. (A) 3,151 380,074Las Vegas Sands Corp. (A) 3,716 195,796Marriott International, Inc., Class A (A) 3,023 412,700McDonald�s Corp. 8,443 1,950,248MGM Resorts International 4,608 196,531Norwegian Cruise Line Holdings Ltd. (A) 4,187 123,140Penn National Gaming, Inc. (A) (C) 1,681 128,580Royal Caribbean Cruises Ltd. (A) 2,479 211,409Starbucks Corp. 13,332 1,490,651Wynn Resorts Ltd. (A) 1,191 145,659Yum! Brands, Inc. 3,371 387,766
8,295,097Household Durables - 0.4%D.R. Horton, Inc. 3,711 335,363Garmin Ltd. 1,696 245,309Leggett & Platt, Inc. 1,507 78,078
Copyright © 2021 www.secdatabase.com. All Rights Reserved.Please Consider the Environment Before Printing This Document

Page 12
Copyright © 2021 www.secdatabase.com. All Rights Reserved.Please Consider the Environment Before Printing This Document

DeltaShares® S&P 500 Managed Risk ETFSCHEDULE OF INVESTMENTS (continued)At June 30, 2021(unaudited)
The Notes to Financial Statements are an integral part of this report.Transamerica ETF Trust Semi-Annual Report 2021
Shares ValueCOMMON STOCKS (continued)Household Durables (continued)Lennar Corp., Class A 3,119 $ 309,873Mohawk Industries, Inc. (A) 663 127,422Newell Brands, Inc. 4,282 117,626NVR, Inc. (A) 39 193,959PulteGroup, Inc. 2,994 163,383Whirlpool Corp. 709 154,576
1,725,589Household Products - 1.3%Church & Dwight Co., Inc. 2,775 236,485Clorox Co. 1,409 253,493Colgate-Palmolive Co. 9,573 778,764Kimberly-Clark Corp. 3,818 510,772Procter & Gamble Co. 27,704 3,738,101
5,517,615Independent Power & Renewable Electricity Producers - 0.1%AES Corp. 7,540 196,568Industrial Conglomerates - 1.2%3M Co. 6,558 1,302,616General Electric Co. 99,340 1,337,116Honeywell International, Inc. 7,859 1,723,872Roper Technologies, Inc. 1,191 560,008
4,923,612Insurance - 1.9%Aflac, Inc. 7,152 383,776Allstate Corp. 3,387 441,800American International Group, Inc. 9,711 462,244Aon PLC, Class A 2,552 609,316Arthur J Gallagher & Co. 2,319 324,846Assurant, Inc. 686 107,139Chubb Ltd. 5,089 808,846Cincinnati Financial Corp. 1,695 197,671Everest Re Group Ltd. 453 114,161Globe Life, Inc. 1,073 102,203Hartford Financial Services Group, Inc. 4,042 250,483Lincoln National Corp. 2,024 127,188Loews Corp. 2,533 138,428Marsh & McLennan Cos., Inc. 5,755 809,613MetLife, Inc. 8,420 503,937Principal Financial Group, Inc. 2,863 180,913Progressive Corp. 6,621 650,248Prudential Financial, Inc. 4,458 456,811Travelers Cos., Inc. 2,846 426,075Unum Group 2,311 65,632W.R. Berkley Corp. 1,585 117,972Willis Towers Watson PLC 1,458 335,369
7,614,671Interactive Media & Services - 6.4%Alphabet, Inc., Class A (A) 3,403 8,309,411Alphabet, Inc., Class C (A) 3,221 8,072,857Facebook, Inc., Class A (A) 27,113 9,427,461Twitter, Inc. (A) 9,031 621,423
26,431,152Internet & Direct Marketing Retail - 4.3%Amazon.com, Inc. (A) 4,850 16,684,776eBay, Inc. 7,323 514,148
Shares ValueCOMMON STOCKS (continued)Internet & Direct Marketing Retail (continued)Etsy, Inc. (A) 1,437 $ 295,792
17,494,716IT Services - 5.1%Accenture PLC, Class A 7,192 2,120,130Akamai Technologies, Inc. (A) 1,845 215,127Automatic Data Processing, Inc. 4,817 956,753Broadridge Financial Solutions, Inc. 1,315 212,412Cognizant Technology Solutions Corp., Class A 5,967 413,274DXC Technology Co. (A) 2,884 112,303Fidelity National Information Services, Inc. 7,018 994,240Fiserv, Inc. (A) 6,739 720,332FleetCor Technologies, Inc. (A) 942 241,208Gartner, Inc. (A) 973 235,661Global Payments, Inc. 3,340 626,384International Business Machines Corp. 10,111 1,482,171Jack Henry & Associates, Inc. 842 137,675Mastercard, Inc., Class A 9,900 3,614,391Paychex, Inc. 3,630 389,499PayPal Holdings, Inc. (A) 13,295 3,875,227VeriSign, Inc. (A) 1,121 255,240Visa, Inc., Class A 19,144 4,476,250Western Union Co. 4,632 106,397
21,184,674Leisure Products - 0.0% (B)Hasbro, Inc. 1,446 136,676Life Sciences Tools & Services - 1.3%Agilent Technologies, Inc. 3,434 507,580Bio-Rad Laboratories, Inc., Class A (A) 245 157,851Charles River Laboratories International, Inc. (A) 569 210,485Illumina, Inc. (A) 1,652 781,743IQVIA Holdings, Inc. (A) 2,168 525,350Mettler-Toledo International, Inc. (A) 265 367,115PerkinElmer, Inc. 1,269 195,946Thermo Fisher Scientific, Inc. 4,447 2,243,378Waters Corp. (A) 699 241,581
5,231,029Machinery - 1.7%Caterpillar, Inc. 6,199 1,349,088Cummins, Inc. 1,654 403,262Deere & Co. 3,531 1,245,419Dover Corp. 1,628 245,177Fortive Corp. 3,830 267,104IDEX Corp. 858 188,803Illinois Tool Works, Inc. 3,252 727,017Ingersoll Rand, Inc. (A) 4,226 206,271Otis Worldwide Corp. 4,565 373,280PACCAR, Inc. 3,928 350,574Parker-Hannifin Corp. 1,459 448,073Pentair PLC 1,882 127,016Snap-on, Inc. 612 136,739Stanley Black & Decker, Inc. 1,828 374,722Westinghouse Air Brake Technologies Corp. 2,009 165,341Xylem, Inc. 2,036 244,239
6,852,125Media - 1.3%Charter Communications, Inc., Class A (A) 1,558 1,124,019Comcast Corp., Class A 51,884 2,958,426
Copyright © 2021 www.secdatabase.com. All Rights Reserved.Please Consider the Environment Before Printing This Document

Page 13
Copyright © 2021 www.secdatabase.com. All Rights Reserved.Please Consider the Environment Before Printing This Document

DeltaShares® S&P 500 Managed Risk ETFSCHEDULE OF INVESTMENTS (continued)At June 30, 2021(unaudited)
The Notes to Financial Statements are an integral part of this report.Transamerica ETF Trust Semi-Annual Report 2021
Page 14
Shares ValueCOMMON STOCKS (continued)Media (continued)Discovery, Inc., Class A (A) (C) 1,910 $ 58,599Discovery, Inc., Class C (A) 3,400 98,532DISH Network Corp., Class A (A) 2,811 117,500Fox Corp., Class A 3,698 137,307Fox Corp., Class B 1,720 60,544Interpublic Group of Cos., Inc. 4,451 144,613News Corp., Class A 4,426 114,058News Corp., Class B 1,379 33,579Omnicom Group, Inc. 2,435 194,775ViacomCBS, Inc., Class B 6,853 309,755
5,351,707Metals & Mining - 0.4%Freeport-McMoRan, Inc. 16,585 615,469Newmont Corp. 9,066 574,603Nucor Corp. 3,386 324,819
1,514,891Multi-Utilities - 0.7%Ameren Corp. 2,892 231,476CenterPoint Energy, Inc. 6,568 161,047CMS Energy Corp. 3,275 193,487Consolidated Edison, Inc. 3,879 278,202Dominion Energy, Inc. 9,127 671,473DTE Energy Co. 2,192 284,083NiSource, Inc. 4,438 108,731Public Service Enterprise Group, Inc. 5,716 341,474Sempra Energy 3,566 472,424WEC Energy Group, Inc. 3,570 317,551
3,059,948Multiline Retail - 0.5%Dollar General Corp. 2,672 578,194Dollar Tree, Inc. (A) 2,624 261,088Target Corp. 5,598 1,353,261
2,192,543Oil, Gas & Consumable Fuels - 2.6%APA Corp. 4,276 92,490Cabot Oil & Gas Corp. 4,523 78,971Chevron Corp. 21,870 2,290,664ConocoPhillips 15,270 929,943Devon Energy Corp. 6,740 196,741Diamondback Energy, Inc. 2,047 192,193EOG Resources, Inc. 6,603 550,954Exxon Mobil Corp. 47,908 3,022,037Hess Corp. 3,108 271,390Kinder Morgan, Inc. 22,038 401,753Marathon Oil Corp. 8,918 121,463Marathon Petroleum Corp. 7,208 435,507Occidental Petroleum Corp. 9,506 297,253ONEOK, Inc. 5,041 280,481Phillips 66 4,954 425,152Pioneer Natural Resources Co. 2,621 425,965Valero Energy Corp. 4,626 361,198Williams Cos., Inc. 13,747 364,983
10,739,138Personal Products - 0.2%Estee Lauder Cos., Inc., Class A 2,623 834,324
Shares ValueCOMMON STOCKS (continued)Pharmaceuticals - 3.6%Bristol-Myers Squibb Co. 25,278 $ 1,689,076Catalent, Inc. (A) 1,929 208,563Eli Lilly & Co. 9,007 2,067,287Johnson & Johnson 29,798 4,908,923Merck & Co., Inc. 28,651 2,228,188Organon & Co. (A) 2,863 86,634Perrigo Co. PLC 1,510 69,234Pfizer, Inc. 63,343 2,480,512Viatris, Inc. 13,677 195,444Zoetis, Inc. 5,374 1,001,499
14,935,360Professional Services - 0.4%Equifax, Inc. 1,378 330,045IHS Markit Ltd. 4,241 477,791Jacobs Engineering Group, Inc. 1,472 196,394Leidos Holdings, Inc. 1,503 151,953Nielsen Holdings PLC 4,057 100,086Robert Half International, Inc. 1,277 113,615Verisk Analytics, Inc. 1,835 320,611
1,690,495Real Estate Management & Development - 0.1%CBRE Group, Inc., Class A (A) 3,797 325,517Road & Rail - 1.0%CSX Corp. 25,713 824,873JB Hunt Transport Services, Inc. 944 153,825Kansas City Southern 1,028 291,304Norfolk Southern Corp. 2,832 751,641Old Dominion Freight Line, Inc. 1,076 273,089Union Pacific Corp. 7,518 1,653,434
3,948,166Semiconductors & Semiconductor Equipment - 5.7%Advanced Micro Devices, Inc. (A) 13,750 1,291,537Analog Devices, Inc. 4,175 718,768Applied Materials, Inc. 10,385 1,478,824Broadcom, Inc. 4,621 2,203,478Enphase Energy, Inc. (A) 1,535 281,872Intel Corp. 45,693 2,565,205KLA Corp. 1,735 562,504Lam Research Corp. 1,613 1,049,579Maxim Integrated Products, Inc. 3,038 320,084Microchip Technology, Inc. 3,097 463,745Micron Technology, Inc. (A) 12,691 1,078,481Monolithic Power Systems, Inc. 486 181,497NVIDIA Corp. 7,051 5,641,505NXP Semiconductors NV 3,119 641,641Qorvo, Inc. (A) 1,275 249,454QUALCOMM, Inc. 12,763 1,824,215Skyworks Solutions, Inc. 1,869 358,381Teradyne, Inc. 1,882 252,113Texas Instruments, Inc. 10,452 2,009,920Xilinx, Inc. 2,782 402,388
23,575,191Software - 8.9%Adobe, Inc. (A) 5,408 3,167,141ANSYS, Inc. (A) 985 341,854Autodesk, Inc. (A) 2,491 727,123
Copyright © 2021 www.secdatabase.com. All Rights Reserved.Please Consider the Environment Before Printing This Document

DeltaShares® S&P 500 Managed Risk ETFSCHEDULE OF INVESTMENTS (continued)At June 30, 2021(unaudited)
FUTURES CONTRACTS:
Long Futures Contracts
DescriptionNumber ofContracts
ExpirationDate
NotionalAmount Value
UnrealizedAppreciation
UnrealizedDepreciation
S&P 500® E-Mini Index 3 09/17/2021 $ 635,292 $ 643,290 $ 7,998 $ �
The Notes to Financial Statements are an integral part of this report.Transamerica ETF Trust Semi-Annual Report 2021
Page 15
Shares ValueCOMMON STOCKS (continued)Software (continued)Cadence Design Systems, Inc. (A) 3,148 $ 430,709Citrix Systems, Inc. 1,407 164,999Fortinet, Inc. (A) 1,533 365,145Intuit, Inc. 3,094 1,516,586Microsoft Corp. 85,228 23,088,265NortonLifeLock, Inc. 6,561 178,591Oracle Corp. 20,558 1,600,235Paycom Software, Inc. (A) 556 202,089PTC, Inc. (A) 1,190 168,099salesforce.com, Inc. (A) 10,480 2,559,950ServiceNow, Inc. (A) 2,234 1,227,695Synopsys, Inc. (A) 1,726 476,014Tyler Technologies, Inc. (A) 460 208,090
36,422,585Specialty Retail - 2.2%Advance Auto Parts, Inc. 741 152,009AutoZone, Inc. (A) 246 367,086Best Buy Co., Inc. 2,524 290,210CarMax, Inc. (A) 1,847 238,540Gap, Inc. 2,351 79,111Home Depot, Inc. 12,032 3,836,885L Brands, Inc. 2,650 190,959Lowe�s Cos., Inc. 7,999 1,551,566O�Reilly Automotive, Inc. (A) 791 447,872Ross Stores, Inc. 4,036 500,464TJX Cos., Inc. 13,647 920,081Tractor Supply Co. 1,305 242,808Ulta Beauty, Inc. (A) 620 214,377
9,031,968Technology Hardware, Storage & Peripherals - 6.2%Apple, Inc. 177,507 24,311,359Hewlett Packard Enterprise Co. 14,778 215,463HP, Inc. 13,593 410,373NetApp, Inc. 2,520 206,186Seagate Technology Holdings PLC 2,253 198,106Western Digital Corp. (A) 3,468 246,818
25,588,305Textiles, Apparel & Luxury Goods - 0.7%Hanesbrands, Inc. (C) 3,950 73,746NIKE, Inc., Class B 14,429 2,229,136PVH Corp. (A) 808 86,933
Shares ValueCOMMON STOCKS (continued)Textiles, Apparel & Luxury Goods (continued)Ralph Lauren Corp. 546 $ 64,324Tapestry, Inc. (A) 3,154 137,136Under Armour, Inc., Class A (A) 2,134 45,134Under Armour, Inc., Class C (A) 2,223 41,281VF Corp. 3,640 298,626
2,976,316Tobacco - 0.7%Altria Group, Inc. 20,942 998,515Philip Morris International, Inc. 17,637 1,748,003
2,746,518Trading Companies & Distributors - 0.2%Fastenal Co. 6,501 338,052United Rentals, Inc. (A) 820 261,588WW Grainger, Inc. 495 216,810
816,450Water Utilities - 0.1%American Water Works Co., Inc. 2,052 316,275Wireless Telecommunication Services - 0.2%T-Mobile US, Inc. (A) 6,631 960,368Total Common Stocks
(Cost $322,015,922) 411,046,564
SHORT-TERM INVESTMENT COMPANY - 0.2%Money Market Fund - 0.2%State Street Institutional TreasuryMoney Market Fund, 0.01% (D) 616,716 616,716
Total Short-Term Investment Company(Cost $616,716) 616,716
OTHER INVESTMENT COMPANY - 0.0% (B)Securities Lending Collateral - 0.0% (B)State Street Navigator SecuritiesLending Trust - Government MoneyMarket Portfolio, 0.02% (D) 58,118 58,118
Total Other Investment Company(Cost $58,118) 58,118
Total Investments(Cost $322,690,756) 411,721,398
Net Other Assets (Liabilities) - 0.0% (B) 108,701
Net Assets - 100.0% $ 411,830,099
Copyright © 2021 www.secdatabase.com. All Rights Reserved.Please Consider the Environment Before Printing This Document

DeltaShares® S&P 500 Managed Risk ETFSCHEDULE OF INVESTMENTS (continued)At June 30, 2021(unaudited)
INVESTMENT VALUATION:
Valuation Inputs (E)
Level 1 -Unadjusted
Quoted Prices
Level 2 -Other Significant
Observable Inputs
Level 3 -Significant
Unobservable Inputs ValueASSETSInvestmentsCommon Stocks $411,046,564 $ � $ � $411,046,564Short-Term Investment Company 616,716 � � 616,716Other Investment Company 58,118 � � 58,118Total Investments $411,721,398 $ �� $ �� $411,721,398Other Financial InstrumentsFutures Contracts (F) $7,998 $ � $ � $7,998Total Other Financial Instruments $7,998 $ �� $ �� $7,998
FOOTNOTES TO SCHEDULE OF INVESTMENTS:
(A) Non-income producing securities.(B) Percentage rounds to less than 0.1% or (0.1)%.(C) All or a portion of the securities are on loan. The total value of all securities on loan is $229,098, collateralized by cash collateral of $58,118 and
non-cash collateral, such as U.S. government securities and irrevocable letters of credit, of $176,570. The amount of securities on loan indicated maynot correspond with the securities on loan identified because securities with pending sales are in the process of recall from the brokers.
(D) Rates disclosed reflect the yields at June 30, 2021.(E) There were no transfers in or out of Level 3 during the six-month period ended June 30, 2021. Please reference the Investment Valuation section of
the Notes to Financial Statements for more information regarding investment valuation and pricing inputs.(F) Derivative instruments are valued at unrealized appreciation (depreciation).
The Notes to Financial Statements are an integral part of this report.Transamerica ETF Trust Semi-Annual Report 2021
Page 16
Copyright © 2021 www.secdatabase.com. All Rights Reserved.Please Consider the Environment Before Printing This Document

DeltaShares® S&P 600 Managed Risk ETFSCHEDULE OF INVESTMENTSAt June 30, 2021(unaudited)
The Notes to Financial Statements are an integral part of this report.Transamerica ETF Trust Semi-Annual Report 2021
Shares ValueCOMMON STOCKS - 68.3%Aerospace & Defense - 0.8%AAR Corp. (A) 980 $37,975Aerojet Rocketdyne Holdings, Inc. 2,200 106,238AeroVironment, Inc. (A) 664 66,500Kaman Corp. 823 41,479Moog, Inc., Class A 865 72,712National Presto Industries, Inc. 154 15,654Park Aerospace Corp. 554 8,255Triumph Group, Inc. (A) 1,802 37,391
386,204Air Freight & Logistics - 0.5%Atlas Air Worldwide Holdings, Inc. (A) 815 55,510Echo Global Logistics, Inc. (A) 787 24,192Forward Air Corp. 808 72,518Hub Group, Inc., Class A (A) 997 65,782
218,002Airlines - 0.4%Allegiant Travel Co. (A) 431 83,614Hawaiian Holdings, Inc. (A) 1,510 36,799SkyWest, Inc. (A) 1,487 64,045
184,458Auto Components - 0.9%American Axle & Manufacturing Holdings, Inc. (A) 3,367 34,848Cooper-Standard Holdings, Inc. (A) 501 14,529Dorman Products, Inc. (A) 843 87,394Gentherm, Inc. (A) 979 69,558LCI Industries 745 97,908Motorcar Parts of America, Inc. (A) 563 12,634Patrick Industries, Inc. 661 48,253Standard Motor Products, Inc. 589 25,533
390,657Automobiles - 0.1%Winnebago Industries, Inc. 992 67,416Banks - 6.6%Allegiance Bancshares, Inc. 549 21,104Ameris Bancorp 2,061 104,348Banc of California, Inc. 1,319 23,135BancFirst Corp. 552 34,461Bancorp, Inc. (A) 1,506 34,653BankUnited, Inc. 2,755 117,611Banner Corp. 1,028 55,728Berkshire Hills Bancorp, Inc. 1,513 41,471Boston Private Financial Holdings, Inc. 2,436 35,931Brookline Bancorp, Inc. 2,311 34,549Cadence Bancorp 3,685 76,943Central Pacific Financial Corp. 835 21,760City Holding Co. 463 34,836Columbia Banking System, Inc. 2,119 81,709Community Bank System, Inc. 1,592 120,435Customers Bancorp, Inc. (A) 877 34,194CVB Financial Corp. 3,775 77,727Dime Community Bancshares, Inc. 1,045 35,133Eagle Bancorp, Inc. 944 52,940FB Financial Corp. 993 37,059First Bancorp 841 34,405First Bancorp 6,370 75,930First Commonwealth Financial Corp. 2,843 40,001
Shares ValueCOMMON STOCKS (continued)Banks (continued)First Financial Bancorp 2,873 $ 67,889First Hawaiian, Inc. 3,852 109,166First Midwest Bancorp, Inc. 3,378 66,986Great Western Bancorp, Inc. 1,628 53,382Hanmi Financial Corp. 906 17,268Heritage Financial Corp. 1,062 26,571Hilltop Holdings, Inc. 1,922 69,961Hope Bancorp, Inc. 3,649 51,743Independent Bank Corp. 977 73,764Independent Bank Group, Inc. 1,084 80,194Investors Bancorp, Inc. 6,658 94,943National Bank Holdings Corp., Class A 909 34,306NBT Bancorp, Inc. 1,284 46,185OFG Bancorp 1,526 33,755Old National Bancorp 4,897 86,236Pacific Premier Bancorp, Inc. 2,795 118,201Park National Corp. 421 49,434Preferred Bank 401 25,371Renasant Corp. 1,664 66,560S&T Bancorp, Inc. 1,162 36,371Seacoast Banking Corp. of Florida 1,633 55,767ServisFirst Bancshares, Inc. 1,391 94,560Simmons First National Corp., Class A 3,200 93,888Southside Bancshares, Inc. 914 34,942SVB Financial Group 56 30,904Tompkins Financial Corp. 356 27,611Triumph Bancorp, Inc. (A) 668 49,599United Community Banks, Inc. 2,563 82,042Veritex Holdings, Inc. 1,460 51,699Westamerica Bancorp 794 46,076
3,001,437Beverages - 0.4%Celsius Holdings, Inc. (A) 970 73,807Coca-Cola Consolidated, Inc. 137 55,092MGP Ingredients, Inc. (B) 389 26,312National Beverage Corp. 689 32,542
187,753Biotechnology - 1.0%Anika Therapeutics, Inc. (A) 426 18,442Coherus Biosciences, Inc. (A) 1,970 27,245Cytokinetics, Inc. (A) (B) 2,119 41,935Eagle Pharmaceuticals, Inc. (A) 345 14,766Enanta Pharmaceuticals, Inc. (A) 531 23,369Myriad Genetics, Inc. (A) 2,276 69,600Organogenesis Holdings, Inc. (A) 1,477 24,548REGENXBIO, Inc. (A) 1,030 40,015Spectrum Pharmaceuticals, Inc. (A) 4,771 17,891Vanda Pharmaceuticals, Inc. (A) 1,641 35,298Vericel Corp. (A) (B) 1,370 71,925Xencor, Inc. (A) 1,720 59,323
444,357Building Products - 1.3%AAON, Inc. 1,209 75,671American Woodmark Corp. (A) 503 41,090Apogee Enterprises, Inc. 761 30,996Gibraltar Industries, Inc. (A) 965 73,639Griffon Corp. 1,340 34,344
Copyright © 2021 www.secdatabase.com. All Rights Reserved.Please Consider the Environment Before Printing This Document

Page 17
Copyright © 2021 www.secdatabase.com. All Rights Reserved.Please Consider the Environment Before Printing This Document

DeltaShares® S&P 600 Managed Risk ETFSCHEDULE OF INVESTMENTS (continued)At June 30, 2021(unaudited)
The Notes to Financial Statements are an integral part of this report.Transamerica ETF Trust Semi-Annual Report 2021
Shares ValueCOMMON STOCKS (continued)Building Products (continued)Insteel Industries, Inc. 572 $ 18,390PGT Innovations, Inc. (A) 1,760 40,885Quanex Building Products Corp. 992 24,641Resideo Technologies, Inc. (A) 4,250 127,500UFP Industries, Inc. 1,827 135,819
602,975Capital Markets - 0.7%B Riley Financial, Inc. 522 39,411Blucora, Inc. (A) 1,431 24,771Brightsphere Investment Group, Inc. 1,759 41,214Donnelley Financial Solutions, Inc. (A) 880 29,040Greenhill & Co., Inc. 431 6,706Piper Sandler Cos. 427 55,322StoneX Group, Inc. (A) 493 29,910Virtus Investment Partners, Inc. 212 58,887WisdomTree Investments, Inc. (B) 3,315 20,553
305,814Chemicals - 1.8%AdvanSix, Inc. (A) 828 24,724American Vanguard Corp. 802 14,043Balchem Corp. 959 125,878Ferro Corp. (A) 2,441 52,652FutureFuel Corp. 762 7,315GCP Applied Technologies, Inc. (A) 1,430 33,262Hawkins, Inc. 560 18,340HB Fuller Co. 1,543 98,150Innospec, Inc. 728 65,964Koppers Holdings, Inc. (A) 627 20,283Kraton Corp. (A) 950 30,676Livent Corp. (A) (B) 4,700 90,992Quaker Chemical Corp. (B) 391 92,741Rayonier Advanced Materials, Inc. (A) 1,879 12,571Stepan Co. 632 76,011Tredegar Corp. 766 10,548Trinseo SA 1,144 68,457
842,607Commercial Services & Supplies - 1.4%ABM Industries, Inc. 1,983 87,946Brady Corp., Class A 1,434 80,361CoreCivic, Inc. (A) 3,554 37,210Deluxe Corp. 1,247 59,569Harsco Corp. (A) 2,338 47,742HNI Corp. 1,287 56,589Interface, Inc. 1,744 26,683Matthews International Corp., Class A 935 33,623Pitney Bowes, Inc. 5,185 45,473Team, Inc. (A) 912 6,111UniFirst Corp. 450 105,588US Ecology, Inc. (A) 931 34,931Viad Corp. (A) 605 30,159
651,985Communications Equipment - 0.8%ADTRAN, Inc. 1,430 29,529Applied Optoelectronics, Inc. (A) 731 6,192CalAmp Corp. (A) 1,042 13,254Comtech Telecommunications Corp. 769 18,579Digi International, Inc. (A) 1,005 20,211
Shares ValueCOMMON STOCKS (continued)Communications Equipment (continued)Extreme Networks, Inc. (A) 3,723 $ 41,549Harmonic, Inc. (A) 2,986 25,441NETGEAR, Inc. (A) 901 34,526Plantronics, Inc. (A) 1,125 46,946Viavi Solutions, Inc. (A) 6,755 119,293
355,520Construction & Engineering - 0.6%Arcosa, Inc. 1,423 83,587Comfort Systems USA, Inc. 1,071 84,384Granite Construction, Inc. 1,353 56,190Matrix Service Co. (A) 784 8,232MYR Group, Inc. (A) 498 45,278
277,671Construction Materials - 0.1%US Concrete, Inc. (A) 477 35,203Consumer Finance - 0.5%Encore Capital Group, Inc. (A) (B) 915 43,362Enova International, Inc. (A) 1,085 37,118EZCORP, Inc., Class A (A) 1,562 9,419Green Dot Corp., Class A (A) 1,607 75,288PRA Group, Inc. (A) 1,354 52,088World Acceptance Corp. (A) 117 18,748
236,023Containers & Packaging - 0.2%Myers Industries, Inc. 1,065 22,365O-I Glass, Inc. (A) 4,664 76,163
98,528Distributors - 0.1%Core-Mark Holding Co., Inc. 1,334 60,043Diversified Consumer Services - 0.1%American Public Education, Inc. (A) 552 15,644Perdoceo Education Corp. (A) 2,080 25,521Regis Corp. (A) (B) 719 6,730
47,895Diversified Telecommunication Services - 0.3%ATN International, Inc. 325 14,784Cincinnati Bell, Inc. (A) 1,504 23,192Cogent Communications Holdings, Inc. 1,250 96,112Consolidated Communications Holdings, Inc. (A) 2,173 19,101
153,189Electrical Equipment - 0.3%AZZ, Inc. 740 38,317Encore Wire Corp. 609 46,156Powell Industries, Inc. 263 8,140Vicor Corp. (A) 629 66,511
159,124Electronic Equipment, Instruments & Components - 2.7%Advanced Energy Industries, Inc. 1,136 128,039Arlo Technologies, Inc. (A) 2,400 16,248Badger Meter, Inc. 862 84,579Bel Fuse, Inc., Class B 301 4,334Benchmark Electronics, Inc. 1,059 30,139CTS Corp. 956 35,525Daktronics, Inc. (A) 1,089 7,177ePlus, Inc. (A) 399 34,589
Copyright © 2021 www.secdatabase.com. All Rights Reserved.Please Consider the Environment Before Printing This Document

Page 18
Copyright © 2021 www.secdatabase.com. All Rights Reserved.Please Consider the Environment Before Printing This Document

DeltaShares® S&P 600 Managed Risk ETFSCHEDULE OF INVESTMENTS (continued)At June 30, 2021(unaudited)
The Notes to Financial Statements are an integral part of this report.Transamerica ETF Trust Semi-Annual Report 2021
Page 19
Shares ValueCOMMON STOCKS (continued)Electronic Equipment, Instruments & Components (continued)Fabrinet (A) 1,089 $ 104,402FARO Technologies, Inc. (A) 536 41,685Insight Enterprises, Inc. (A) 1,044 104,411Itron, Inc. (A) 1,333 133,273Knowles Corp. (A) 2,741 54,107Methode Electronics, Inc. 1,137 55,952OSI Systems, Inc. (A) 495 50,312PC Connection, Inc. 325 15,038Plexus Corp. (A) 844 77,150Rogers Corp. (A) 553 111,042Sanmina Corp. (A) 1,922 74,881ScanSource, Inc. (A) 751 21,126TTM Technologies, Inc. (A) 2,944 42,099
1,226,108Energy Equipment & Services - 1.1%Archrock, Inc. 3,822 34,054Bristow Group, Inc. (A) 684 17,517Core Laboratories NV 1,369 53,323DMC Global, Inc. (A) 553 31,084Dril-Quip, Inc. (A) 1,047 35,420Helix Energy Solutions Group, Inc. (A) 4,186 23,902Helmerich & Payne, Inc. 3,187 103,992Nabors Industries Ltd. (A) 194 22,163Oceaneering International, Inc. (A) 2,946 45,869Oil States International, Inc. (A) 1,811 14,216Patterson-UTI Energy, Inc. 5,547 55,137ProPetro Holding Corp. (A) 2,417 22,140RPC, Inc. (A) 1,721 8,519US Silica Holdings, Inc. (A) 2,196 25,386
492,722Entertainment - 0.0% (C)Marcus Corp. (A) (B) 712 15,102Equity Real Estate Investment Trusts - 4.9%Acadia Realty Trust 2,549 55,976Agree Realty Corp. 2,007 141,474Alexander & Baldwin, Inc. 2,139 39,187American Assets Trust, Inc. 1,483 55,301Armada Hoffler Properties, Inc. 1,781 23,670Brandywine Realty Trust 5,048 69,208CareTrust, Inc. 2,860 66,438Centerspace 383 30,219Chatham Lodging Trust (A) 1,437 18,494Community Healthcare Trust, Inc. 677 32,130DiamondRock Hospitality Co. (A) 6,212 60,256Diversified Healthcare Trust 7,038 29,419Easterly Government Properties, Inc. 2,477 52,215Essential Properties Realty Trust, Inc. 3,472 93,883Four Corners Property Trust, Inc. 2,250 62,123Franklin Street Properties Corp. 2,854 15,012GEO Group, Inc. (B) 3,593 25,582Getty Realty Corp. 1,102 34,327Global Net Lease, Inc. 2,818 52,133Hersha Hospitality Trust (A) 1,086 11,685Independence Realty Trust, Inc. 3,019 55,036Industrial Logistics Properties Trust 1,928 50,398Innovative Industrial Properties, Inc. (B) 707 135,051iStar, Inc. (B) 2,163 44,839
Shares ValueCOMMON STOCKS (continued)Equity Real Estate Investment Trusts (continued)Kite Realty Group Trust 2,495 $ 54,915Lexington Realty Trust 8,201 98,002LTC Properties, Inc. 1,163 44,648Mack-Cali Realty Corp. 2,547 43,681NexPoint Residential Trust, Inc. 667 36,672Office Properties Income Trust 1,428 41,855Retail Opportunity Investments Corp. 3,508 61,951Retail Properties of America, Inc., Class A 6,343 72,627RPT Realty 2,397 31,113Safehold, Inc. (B) 426 33,441Saul Centers, Inc. 382 17,362Service Properties Trust 4,869 61,349SITE Centers Corp. 4,987 75,104Summit Hotel Properties, Inc. (A) 3,135 29,250Tanger Factory Outlet Centers, Inc. (B) 2,978 56,135Uniti Group, Inc. 6,896 73,029Universal Health Realty Income Trust 378 23,266Urstadt Biddle Properties, Inc., Class A 890 17,248Washington, REIT 2,498 57,454Whitestone, REIT 1,180 9,735Xenia Hotels & Resorts, Inc. (A) 3,362 62,970
2,255,863Food & Staples Retailing - 0.4%Andersons, Inc. 925 28,240Chefs� Warehouse, Inc. (A) 963 30,652PriceSmart, Inc. 690 62,797SpartanNash Co. 1,070 20,662United Natural Foods, Inc. (A) 1,663 61,498
203,849Food Products - 0.8%B&G Foods, Inc. (B) 1,914 62,779Cal-Maine Foods, Inc. 1,106 40,048Calavo Growers, Inc. 492 31,203Fresh Del Monte Produce, Inc. 899 29,559J&J Snack Foods Corp. 444 77,438John B Sanfilippo & Son, Inc. 263 23,294Seneca Foods Corp., Class A (A) 197 10,063Simply Good Foods Co. (A) 2,489 90,873
365,257Gas Utilities - 0.4%Chesapeake Utilities Corp. 517 62,211NorthWest Natural Holding Co. 905 47,531South Jersey Industries, Inc. 3,322 86,139
195,881Health Care Equipment & Supplies - 2.3%AngioDynamics, Inc. (A) 1,127 30,576Avanos Medical, Inc. (A) 1,420 51,645Cardiovascular Systems, Inc. (A) 1,187 50,626CONMED Corp. 859 118,052CryoLife, Inc. (A) 1,154 32,774Cutera, Inc. (A) (B) 525 25,741Glaukos Corp. (A) 1,368 116,047Heska Corp. (A) (B) 292 67,081Inogen, Inc. (A) 549 35,778Integer Holdings Corp. (A) 975 91,845Invacare Corp. (A) (B) 1,033 8,336
Copyright © 2021 www.secdatabase.com. All Rights Reserved.Please Consider the Environment Before Printing This Document

DeltaShares® S&P 600 Managed Risk ETFSCHEDULE OF INVESTMENTS (continued)At June 30, 2021(unaudited)
The Notes to Financial Statements are an integral part of this report.Transamerica ETF Trust Semi-Annual Report 2021
Shares ValueCOMMON STOCKS (continued)Health Care Equipment & Supplies (continued)Lantheus Holdings, Inc. (A) 1,995 $ 55,142LeMaitre Vascular, Inc. 506 30,876Meridian Bioscience, Inc. (A) 1,281 28,413Merit Medical Systems, Inc. (A) 1,455 94,080Mesa Laboratories, Inc. 144 39,048Natus Medical, Inc. (A) 1,006 26,136OraSure Technologies, Inc. (A) 2,126 21,558Orthofix Medical, Inc. (A) 579 23,224Surmodics, Inc. (A) 410 22,242Tactile Systems Technology, Inc. (A) 581 30,212Varex Imaging Corp. (A) 1,161 31,138Zynex, Inc. (A) (B) 577 8,961
1,039,531Health Care Providers & Services - 2.6%Addus HomeCare Corp. (A) 446 38,909AMN Healthcare Services, Inc. (A) 1,396 135,384Apollo Medical Holdings, Inc. (A) (B) 390 24,496Community Health Systems, Inc. (A) 3,669 56,649CorVel Corp. (A) 270 36,261Covetrus, Inc. (A) 2,945 79,515Cross Country Healthcare, Inc. (A) 1,035 17,088Ensign Group, Inc. 1,528 132,432Fulgent Genetics, Inc. (A) (B) 522 48,144Hanger, Inc. (A) 1,138 28,769Joint Corp. (A) 390 32,729Magellan Health, Inc. (A) 687 64,715MEDNAX, Inc. (A) 2,547 76,792ModivCare, Inc. (A) 359 61,055Owens & Minor, Inc. 2,221 94,015Pennant Group, Inc. (A) 752 30,757RadNet, Inc. (A) 1,293 43,561Select Medical Holdings Corp. 3,186 134,640Tivity Health, Inc. (A) 1,120 29,467US Physical Therapy, Inc. 381 44,147
1,209,525Health Care Technology - 0.9%Allscripts Healthcare Solutions, Inc. (A) 4,171 77,205Computer Programs & Systems, Inc. 378 12,561HealthStream, Inc. (A) 745 20,815NextGen Healthcare, Inc. (A) 1,643 27,257Omnicell, Inc. (A) 1,276 193,250Simulations Plus, Inc. (B) 451 24,765Tabula Rasa HealthCare, Inc. (A) (B) 667 33,350
389,203Hotels, Restaurants & Leisure - 1.3%BJ�s Restaurants, Inc. (A) 686 33,710Bloomin� Brands, Inc. (A) (B) 2,391 64,892Brinker International, Inc. (A) 1,352 83,621Cheesecake Factory, Inc. (A) 1,359 73,631Chuy�s Holdings, Inc. (A) 589 21,946Dave & Buster�s Entertainment, Inc. (A) 1,412 57,327Dine Brands Global, Inc. (A) 508 45,339El Pollo Loco Holdings, Inc. (A) 561 10,261Fiesta Restaurant Group, Inc. (A) 523 7,024Monarch Casino & Resort, Inc. (A) 383 25,343Red Robin Gourmet Burgers, Inc. (A) 463 15,330Ruth�s Hospitality Group, Inc. (A) 944 21,740
Shares ValueCOMMON STOCKS (continued)Hotels, Restaurants & Leisure (continued)Shake Shack, Inc., Class A (A) 1,074 $ 114,939
575,103Household Durables - 1.6%Cavco Industries, Inc. (A) 253 56,214Century Communities, Inc. 867 57,690Ethan Allen Interiors, Inc. 648 17,885Installed Building Products, Inc. 666 81,492iRobot Corp. (A) 829 77,420La-Z-Boy, Inc. 1,369 50,708LGI Homes, Inc. (A) 649 105,099M/I Homes, Inc. (A) 862 50,574MDC Holdings, Inc. 1,640 82,984Meritage Homes Corp. (A) 1,119 105,276Tupperware Brands Corp. (A) 1,467 34,841Universal Electronics, Inc. (A) 407 19,739
739,922Household Products - 0.4%Central Garden & Pet Co. (A) 287 15,191Central Garden & Pet Co., Class A (A) 1,173 56,656WD-40 Co. 405 103,797
175,644Industrial Conglomerates - 0.1%Raven Industries, Inc. 1,060 61,321Insurance - 1.9%Ambac Financial Group, Inc. (A) 1,366 21,392American Equity Investment Life Holding Co. 2,538 82,028AMERISAFE, Inc. 572 34,143Assured Guaranty Ltd. 2,228 105,785eHealth, Inc. (A) 772 45,085Employers Holdings, Inc. 842 36,038Genworth Financial, Inc., Class A (A) 14,972 58,391HCI Group, Inc. (B) 194 19,289Horace Mann Educators Corp. 1,225 45,839James River Group Holdings Ltd. 1,101 41,310Palomar Holdings, Inc. (A) 643 48,521ProAssurance Corp. 1,595 36,286Safety Insurance Group, Inc. 421 32,956Selectquote, Inc. (A) 1,302 25,077SiriusPoint Ltd. (A) 2,243 22,587Stewart Information Services Corp. 792 44,898Trupanion, Inc. (A) 993 114,294United Fire Group, Inc. 638 17,692United Insurance Holdings Corp. 613 3,494Universal Insurance Holdings, Inc. 839 11,645
846,750Interactive Media & Services - 0.1%QuinStreet, Inc. (A) 1,456 27,052Internet & Direct Marketing Retail - 0.5%Liquidity Services, Inc. (A) 799 20,335PetMed Express, Inc. (B) 598 19,046Shutterstock, Inc. 660 64,792Stamps.com, Inc. (A) 541 108,357
212,530IT Services - 1.0%BM Technologies, Inc. (A) 83 1,033CSG Systems International, Inc. 972 45,859
Copyright © 2021 www.secdatabase.com. All Rights Reserved.Please Consider the Environment Before Printing This Document

Page 20
Copyright © 2021 www.secdatabase.com. All Rights Reserved.Please Consider the Environment Before Printing This Document

DeltaShares® S&P 600 Managed Risk ETFSCHEDULE OF INVESTMENTS (continued)At June 30, 2021(unaudited)
The Notes to Financial Statements are an integral part of this report.Transamerica ETF Trust Semi-Annual Report 2021
Shares ValueCOMMON STOCKS (continued)IT Services (continued)EVERTEC, Inc. 1,769 $ 77,217ExlService Holdings, Inc. (A) 988 104,985Perficient, Inc. (A) 977 78,570Sykes Enterprises, Inc. (A) 1,175 63,097TTEC Holdings, Inc. 539 55,565Unisys Corp. (A) 1,980 50,114
476,440Leisure Products - 0.3%Sturm Ruger & Co., Inc. 519 46,700Vista Outdoor, Inc. (A) 1,705 78,907
125,607Life Sciences Tools & Services - 0.4%Luminex Corp. 1,299 47,803NeoGenomics, Inc. (A) (B) 3,485 157,418
205,221Machinery - 3.7%Alamo Group, Inc. 292 44,583Albany International Corp., Class A 906 80,870Astec Industries, Inc. 671 42,233Barnes Group, Inc. 1,376 70,520Chart Industries, Inc. (A) 1,052 153,929CIRCOR International, Inc. (A) 597 19,462Enerpac Tool Group Corp. 1,775 47,250EnPro Industries, Inc. 608 59,067ESCO Technologies, Inc. 769 72,140Federal Signal Corp. 1,788 71,931Franklin Electric Co., Inc. 1,139 91,826Greenbrier Cos., Inc. 970 42,273Hillenbrand, Inc. 2,224 98,034John Bean Technologies Corp. 938 133,777Lindsay Corp. 322 53,220Lydall, Inc. (A) 507 30,684Meritor, Inc. (A) 2,145 50,236Mueller Industries, Inc. 1,687 73,064Proto Labs, Inc. (A) 819 75,184SPX Corp. (A) 1,337 81,664SPX Flow, Inc. 1,247 81,354Standex International Corp. 361 34,262Tennant Co. 550 43,917Titan International, Inc. (A) 1,493 12,661Wabash National Corp. 1,532 24,512Watts Water Technologies, Inc., Class A 815 118,917
1,707,570Marine - 0.2%Matson, Inc. 1,284 82,176Media - 0.6%AMC Networks, Inc., Class A (A) 907 60,588EW Scripps Co., Class A 1,704 34,745Gannett Co., Inc. (A) 3,999 21,954Meredith Corp. (A) 1,200 52,128Scholastic Corp. 889 33,684TechTarget, Inc. (A) 698 54,088
257,187Metals & Mining - 1.0%Allegheny Technologies, Inc. (A) 3,758 78,354Arconic Corp. (A) 2,893 103,049
Shares ValueCOMMON STOCKS (continued)Metals & Mining (continued)Carpenter Technology Corp. 1,419 $ 57,072Century Aluminum Co. (A) 1,490 19,206Haynes International, Inc. 374 13,232Kaiser Aluminum Corp. 468 57,794Materion Corp. 602 45,361Olympic Steel, Inc. 269 7,906SunCoke Energy, Inc. 2,452 17,507TimkenSteel Corp. (A) (B) 1,135 16,060Warrior Met Coal, Inc. 1,519 26,127
441,668Mortgage Real Estate Investment Trusts - 1.0%Apollo Commercial Real Estate Finance, Inc. 3,801 60,626ARMOUR Residential, Inc. (B) 2,104 24,028Capstead Mortgage Corp. 2,862 17,573Ellington Financial, Inc. 1,292 24,742Granite Point Mortgage Trust, Inc. 1,628 24,013Invesco Mortgage Capital, Inc. (B) 8,392 32,729KKR Real Estate Finance Trust, Inc. 806 17,434New York Mortgage Trust, Inc. 11,204 50,082PennyMac Mortgage Investment Trust 2,893 60,926Ready Capital Corp. 1,704 27,042Redwood Trust, Inc. 3,338 40,290Two Harbors Investment Corp. (B) 8,081 61,092
440,577Multi-Utilities - 0.2%Avista Corp. 2,048 87,388Unitil Corp. 444 23,519
110,907Multiline Retail - 0.5%Big Lots, Inc. 944 62,313Macy�s, Inc. (A) 9,209 174,603
236,916Oil, Gas & Consumable Fuels - 2.1%Bonanza Creek Energy, Inc. 563 26,501Callon Petroleum Co. (A) 1,368 78,920Consol Energy, Inc. (A) 896 16,549Dorian LPG Ltd. (A) 802 11,324Green Plains, Inc. (A) 1,252 42,092Laredo Petroleum, Inc. (A) 285 26,445Matador Resources Co. 3,244 116,817Par Pacific Holdings, Inc. (A) 1,315 22,118PBF Energy, Inc., Class A (A) 2,841 43,467PDC Energy, Inc. 2,935 134,394Penn Virginia Corp. (A) (B) 452 10,672Range Resources Corp. (A) 7,668 128,516Renewable Energy Group, Inc. (A) 1,408 87,775REX American Resources Corp. (A) 156 14,068SM Energy Co. 3,237 79,727Southwestern Energy Co. (A) 19,199 108,858Talos Energy, Inc. (A) 941 14,717
962,960Paper & Forest Products - 0.4%Clearwater Paper Corp. (A) 493 14,282Domtar Corp. (A) 1,484 81,561Glatfelter Corp. 1,313 18,342Mercer International, Inc. 1,169 14,905
Copyright © 2021 www.secdatabase.com. All Rights Reserved.Please Consider the Environment Before Printing This Document

Page 21
Copyright © 2021 www.secdatabase.com. All Rights Reserved.Please Consider the Environment Before Printing This Document

DeltaShares® S&P 600 Managed Risk ETFSCHEDULE OF INVESTMENTS (continued)At June 30, 2021(unaudited)
The Notes to Financial Statements are an integral part of this report.Transamerica ETF Trust Semi-Annual Report 2021
Shares ValueCOMMON STOCKS (continued)Paper & Forest Products (continued)Neenah, Inc. 498 $ 24,985Schweitzer-Mauduit International, Inc. 928 37,473
191,548Personal Products - 0.6%Edgewell Personal Care Co. 1,607 70,547elf Beauty, Inc. (A) 1,144 31,048Inter Parfums, Inc. 523 37,656Medifast, Inc. 348 98,477USANA Health Sciences, Inc. (A) 341 34,929
272,657Pharmaceuticals - 0.9%Amphastar Pharmaceuticals, Inc. (A) 1,083 21,833ANI Pharmaceuticals, Inc. (A) 293 10,270Cara Therapeutics, Inc. (A) 1,272 18,152Collegium Pharmaceutical, Inc. (A) 1,042 24,633Corcept Therapeutics, Inc. (A) 3,100 68,200Endo International PLC (A) 6,892 32,255Innoviva, Inc. (A) 1,857 24,902Pacira BioSciences, Inc. (A) 1,300 78,884Phibro Animal Health Corp., Class A 600 17,328Prestige Consumer Healthcare, Inc. (A) 1,474 76,795Supernus Pharmaceuticals, Inc. (A) 1,566 48,217
421,469Professional Services - 0.9%Exponent, Inc. 1,539 137,294Forrester Research, Inc. (A) 328 15,023Heidrick & Struggles International, Inc. 577 25,705Kelly Services, Inc., Class A (A) 989 23,706Korn Ferry 1,596 115,790ManTech International Corp., Class A 811 70,184Resources Connection, Inc. 911 13,082TrueBlue, Inc. (A) 1,049 29,487
430,271Real Estate Management & Development - 0.3%Marcus & Millichap, Inc. (A) 713 27,714RE/MAX Holdings, Inc., Class A 558 18,598Realogy Holdings Corp. (A) (B) 3,439 62,659St. Joe Co. 921 41,086
150,057Road & Rail - 0.6%ArcBest Corp. 749 43,584Heartland Express, Inc. 1,441 24,685Marten Transport Ltd. 1,736 28,627Saia, Inc. (A) 778 162,983
259,879Semiconductors & Semiconductor Equipment - 2.3%Axcelis Technologies, Inc. (A) 992 40,097CEVA, Inc. (A) 673 31,833Cohu, Inc. (A) 1,431 52,646Diodes, Inc. (A) 1,252 99,872DSP Group, Inc. (A) 667 9,872FormFactor, Inc. (A) 2,294 83,639Ichor Holdings Ltd. (A) 829 44,600Kulicke & Soffa Industries, Inc. 1,834 112,241MaxLinear, Inc. (A) 2,026 86,085Onto Innovation, Inc. (A) 1,450 105,908
Shares ValueCOMMON STOCKS (continued)Semiconductors & Semiconductor Equipment (continued)PDF Solutions, Inc. (A) 873 $ 15,871Photronics, Inc. (A) 1,872 24,729Power Integrations, Inc. 1,792 147,052Rambus, Inc. (A) 3,324 78,812SMART Global Holdings, Inc. (A) 402 19,167Ultra Clean Holdings, Inc. (A) 1,293 69,460Veeco Instruments, Inc. (A) 1,482 35,627
1,057,511Software - 2.2%8x8, Inc. (A) 3,247 90,137Agilysys, Inc. (A) 607 34,520Alarm.com Holdings, Inc. (A) 1,338 113,329Bottomline Technologies de, Inc. (A) 1,162 43,087Ebix, Inc. 694 23,527InterDigital, Inc. 908 66,311LivePerson, Inc. (A) 1,895 119,840MicroStrategy, Inc., Class A (A) (B) 230 152,835Onespan, Inc. (A) 999 25,514Progress Software Corp. 1,299 60,079SPS Commerce, Inc. (A) 1,058 105,641Vonage Holdings Corp. (A) 6,981 100,596Xperi Holding Corp. 3,098 68,899
1,004,315Specialty Retail - 3.9%Aaron�s Co., Inc. 1,009 32,278Abercrombie & Fitch Co., Class A (A) 1,830 84,967America�s Car-Mart, Inc. (A) 183 25,935Asbury Automotive Group, Inc. (A) 572 98,024Barnes & Noble Education, Inc. (A) 941 6,785Bed Bath & Beyond, Inc. (A) 3,150 104,863Boot Barn Holdings, Inc. (A) 864 72,619Buckle, Inc. 853 42,437Caleres, Inc. 1,133 30,919Cato Corp., Class A 573 9,666Chico�s FAS, Inc. (A) 3,622 23,833Children�s Place, Inc. (A) 432 40,202Conn�s, Inc. (A) 573 14,611Designer Brands, Inc., Class A (A) 1,752 28,996GameStop Corp., Class A (A) 1,640 351,189Genesco, Inc. (A) 420 26,746Group 1 Automotive, Inc. 505 77,987Guess?, Inc. 1,132 29,885Haverty Furniture Cos., Inc. 501 21,423Hibbett, Inc. (A) 479 42,933Lumber Liquidators Holdings, Inc. (A) 857 18,083MarineMax, Inc. (A) 655 31,925Monro, Inc. 989 62,811ODP Corp. (A) 1,582 75,952Rent-A-Center, Inc. 1,764 93,615Sally Beauty Holdings, Inc. (A) 3,336 73,625Shoe Carnival, Inc. 256 18,327Signet Jewelers Ltd. (A) 1,546 124,901Sleep Number Corp. (A) 723 79,494Sonic Automotive, Inc., Class A 690 30,871Zumiez, Inc. (A) 624 30,570
1,806,472
Copyright © 2021 www.secdatabase.com. All Rights Reserved.Please Consider the Environment Before Printing This Document

Page 22
Copyright © 2021 www.secdatabase.com. All Rights Reserved.Please Consider the Environment Before Printing This Document

DeltaShares® S&P 600 Managed Risk ETFSCHEDULE OF INVESTMENTS (continued)At June 30, 2021(unaudited)
FUTURES CONTRACTS:
Long Futures Contracts
DescriptionNumber ofContracts
ExpirationDate
NotionalAmount Value
UnrealizedAppreciation
UnrealizedDepreciation
E-Mini Russell 2000® Index 1 09/17/2021 $ 116,197 $ 115,390 $ � $ (807 )
The Notes to Financial Statements are an integral part of this report.Transamerica ETF Trust Semi-Annual Report 2021
Page 23
Shares ValueCOMMON STOCKS (continued)Technology Hardware, Storage & Peripherals - 0.4%3D Systems Corp. (A) 3,694 $ 147,649Diebold Nixdorf, Inc. (A) 2,312 29,686
177,335Textiles, Apparel & Luxury Goods - 0.9%Fossil Group, Inc. (A) 1,400 19,992G-III Apparel Group Ltd. (A) 1,287 42,291Kontoor Brands, Inc. (B) 1,396 78,749Movado Group, Inc. 498 15,672Oxford Industries, Inc. 500 49,420Steven Madden Ltd. 2,274 99,510Unifi, Inc. (A) 442 10,767Vera Bradley, Inc. (A) 656 8,128Wolverine World Wide, Inc. 2,447 82,317
406,846Thrifts & Mortgage Finance - 1.5%Axos Financial, Inc. (A) 1,523 70,652Capitol Federal Financial, Inc. 3,813 44,917Flagstar Bancorp, Inc. 1,402 59,263HomeStreet, Inc. 631 25,707Meta Financial Group, Inc. 943 47,744Mr. Cooper Group, Inc. (A) 2,009 66,417NMI Holdings, Inc., Class A (A) 2,529 56,852Northfield Bancorp, Inc. 1,365 22,386Northwest Bancshares, Inc. 3,759 51,273Provident Financial Services, Inc. 2,143 49,053TrustCo Bank Corp. 570 19,597Walker & Dunlop, Inc. 874 91,228WSFS Financial Corp. 1,404 65,412
670,501Tobacco - 0.2%Universal Corp. 725 41,303Vector Group Ltd. 3,781 53,464
94,767Trading Companies & Distributors - 0.7%Applied Industrial Technologies, Inc. 1,147 104,446Boise Cascade Co. 1,162 67,803DXP Enterprises, Inc. (A) 521 17,349GMS, Inc. (A) 1,266 60,945NOW, Inc. (A) 3,256 30,900Veritiv Corp. (A) 360 22,111
303,554Water Utilities - 0.4%American States Water Co. 1,090 86,720California Water Service Group 1,502 83,421
170,141
Shares ValueCOMMON STOCKS (continued)Wireless Telecommunication Services - 0.2%Shenandoah Telecommunications Co. 1,475 $ 71,552Spok Holdings, Inc. 526 5,060
76,612Total Common Stocks
(Cost $23,742,092) 31,279,388
WARRANT - 0.0% (C)Energy Equipment & Services - 0.0% (C)Nabors Industries Ltd., (A)Exercise Price $8.80,Expiration Date 06/11/2026 78 780
Total Warrant(Cost $0) 780
Principal ValueU.S. GOVERNMENT OBLIGATION - 31.5%U.S. Treasury - 31.5%U.S. Treasury Note0.88%, 06/30/2026 $14,417,000 14,410,242
Total U.S. Government Obligation(Cost $14,418,126) 14,410,242
Shares ValueSHORT-TERM INVESTMENT COMPANY - 0.3%Money Market Fund - 0.3%State Street Institutional TreasuryMoney Market Fund, 0.01% (D) 113,923 113,923
Total Short-Term Investment Company(Cost $113,923) 113,923
OTHER INVESTMENT COMPANY - 1.2%Securities Lending Collateral - 1.2%State Street Navigator SecuritiesLending Trust - Government MoneyMarket Portfolio, 0.02% (D) 572,196 572,196
Total Other Investment Company(Cost $572,196) 572,196
Total Investments(Cost $38,846,337) 46,376,529
Net Other Assets (Liabilities) - (1.3)% (574,920 )
Net Assets - 100.0% $ 45,801,609
Copyright © 2021 www.secdatabase.com. All Rights Reserved.Please Consider the Environment Before Printing This Document
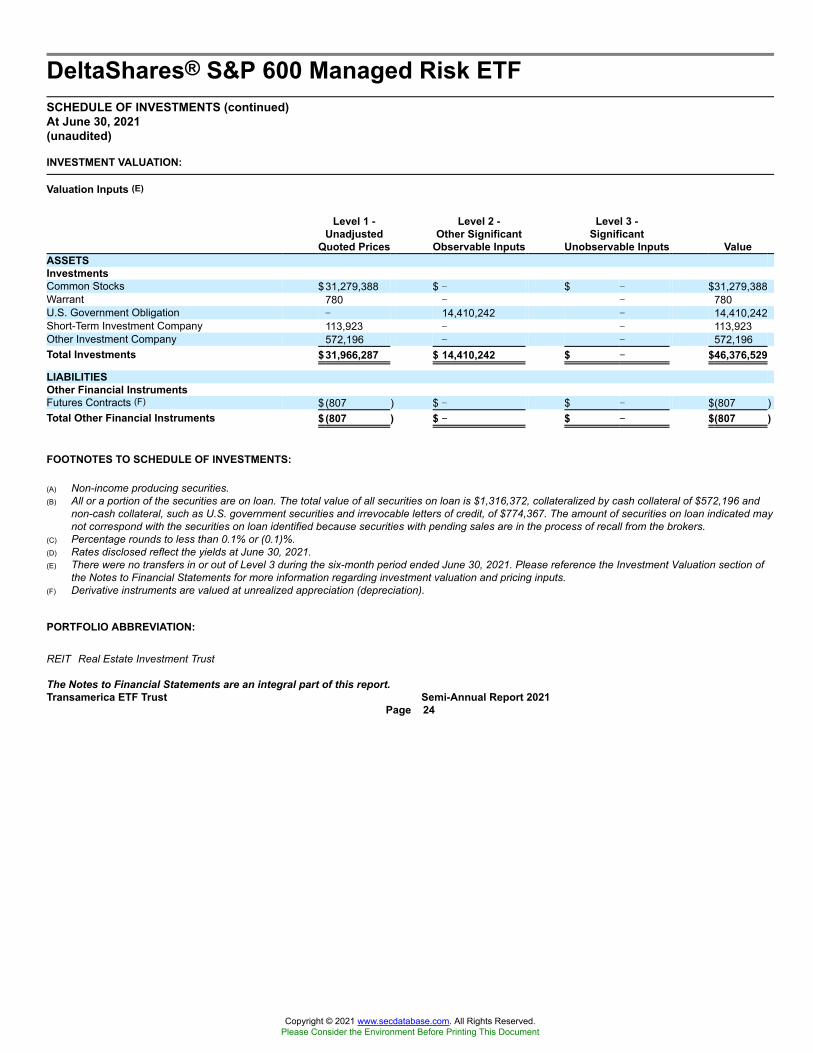
DeltaShares® S&P 600 Managed Risk ETFSCHEDULE OF INVESTMENTS (continued)At June 30, 2021(unaudited)
INVESTMENT VALUATION:
Valuation Inputs (E)
Level 1 -Unadjusted
Quoted Prices
Level 2 -Other Significant
Observable Inputs
Level 3 -Significant
Unobservable Inputs ValueASSETSInvestmentsCommon Stocks $31,279,388 $ � $ � $31,279,388Warrant 780 � � 780U.S. Government Obligation � 14,410,242 � 14,410,242Short-Term Investment Company 113,923 � � 113,923Other Investment Company 572,196 � � 572,196Total Investments $31,966,287 $ 14,410,242 $ �� $46,376,529
LIABILITIESOther Financial InstrumentsFutures Contracts (F) $(807 ) $ � $ � $(807 )Total Other Financial Instruments $(807 ) $ �� $ �� $(807 )
FOOTNOTES TO SCHEDULE OF INVESTMENTS:
(A) Non-income producing securities.(B) All or a portion of the securities are on loan. The total value of all securities on loan is $1,316,372, collateralized by cash collateral of $572,196 and
non-cash collateral, such as U.S. government securities and irrevocable letters of credit, of $774,367. The amount of securities on loan indicated maynot correspond with the securities on loan identified because securities with pending sales are in the process of recall from the brokers.
(C) Percentage rounds to less than 0.1% or (0.1)%.(D) Rates disclosed reflect the yields at June 30, 2021.(E) There were no transfers in or out of Level 3 during the six-month period ended June 30, 2021. Please reference the Investment Valuation section of
the Notes to Financial Statements for more information regarding investment valuation and pricing inputs.(F) Derivative instruments are valued at unrealized appreciation (depreciation).
PORTFOLIO ABBREVIATION:
REIT Real Estate Investment Trust
The Notes to Financial Statements are an integral part of this report.Transamerica ETF Trust Semi-Annual Report 2021
Page 24
Copyright © 2021 www.secdatabase.com. All Rights Reserved.Please Consider the Environment Before Printing This Document

DeltaShares® S&P EM 100 & Managed Risk ETFSCHEDULE OF INVESTMENTSAt June 30, 2021(unaudited)
The Notes to Financial Statements are an integral part of this report.Transamerica ETF Trust Semi-Annual Report 2021
Shares ValueCOMMON STOCKS - 98.4%Brazil - 6.1%Ambev SA, ADR 70,461 $242,386Banco Bradesco SA, ADR 78,022 400,253Itau Unibanco Holding SA, ADR 77,497 465,757Petroleo Brasileiro SA, ADR 36,732 433,805Petroleo Brasileiro SA, ADR (A) 29,756 363,916StoneCo Ltd., A Shares (B) 3,150 211,239Vale SA, ADR 54,933 1,253,021
3,370,377China - 40.5%Agricultural Bank of China Ltd., H Shares 452,000 157,150Alibaba Group Holding Ltd., ADR (B) 11,370 2,578,489ANTA Sports Products Ltd. 14,000 329,545Baidu, Inc., ADR (B) 4,360 889,004Bank of China Ltd., H Shares 1,230,000 441,896Bank of Communications Co. Ltd.,H Shares 342,000 229,883
BeiGene Ltd., ADR (B) 629 215,867Bilibili, Inc., ADR (B) 2,485 302,772BYD Co. Ltd., H Shares 12,000 358,802China Construction Bank Corp., H Shares 1,576,000 1,239,962China Life Insurance Co. Ltd., H Shares 119,000 235,982China Merchants Bank Co. Ltd., H Shares 60,000 511,856China Pacific Insurance Group Co. Ltd.,H Shares 44,400 139,789
China Petroleum & Chemical Corp.,H Shares 408,000 206,473
Industrial & Commercial Bank of China Ltd.,H Shares 1,194,000 701,100
JD.com, Inc., ADR (B) 14,352 1,145,433Kuaishou Technology (A) (B) (C) 13,600 341,145LI Ning Co. Ltd. 33,000 402,841Meituan, Class B (B) (C) 65,200 2,689,993NetEase, Inc., ADR 6,410 738,752New Oriental Education & TechnologyGroup, Inc., ADR (B) 23,948 196,134
NIO, Inc., ADR (B) 20,667 1,099,484Pinduoduo, Inc., ADR (B) 5,590 710,042Ping An Insurance Group Co. of China Ltd.,H Shares 88,000 861,773
Shenzhou International Group Holdings Ltd. 12,000 303,019Smoore International Holdings Ltd. (C) 27,000 149,675Sunac China Holdings Ltd. 40,000 137,268Sunny Optical Technology Group Co. Ltd. 11,400 360,239TAL Education Group, ADR (B) 6,389 161,194Tencent Holdings Ltd. 31,400 2,361,313Trip.Com Group Ltd., ADR (B) 7,303 258,964Vipshop Holdings Ltd., ADR (B) 6,183 124,155Wuxi Biologics Cayman, Inc. (B) (C) 52,000 952,838Yum China Holdings, Inc. 6,723 445,399ZTO Express Cayman, Inc., ADR 10,074 305,746
22,283,977Hong Kong - 1.6%China Mengniu Dairy Co. Ltd. (B) 44,000 266,011China Resources Land Ltd. 46,000 186,290Geely Automobile Holdings Ltd. 91,000 286,504Sino Biopharmaceutical Ltd. 165,500 162,392
901,197
Shares ValueCOMMON STOCKS (continued)India - 6.2%ICICI Bank Ltd., ADR (B) 40,901 $ 699,407Infosys Ltd., ADR 58,589 1,241,501Reliance Industries Ltd., GDR (C) 25,853 1,463,280
3,404,188Indonesia - 1.4%Bank Central Asia Tbk PT 177,400 368,564Bank Rakyat Indonesia Persero Tbk PT 848,200 230,477Telkom Indonesia Persero Tbk PT 760,400 165,190
764,231Kuwait - 0.6%National Bank of Kuwait SAKP 115,030 324,130Malaysia - 0.8%Malayan Banking Bhd. 104,000 203,165Public Bank Bhd. 242,100 239,680
442,845Mexico - 2.4%America Movil SAB de CV, Series L 379,246 285,713Fomento Economico Mexicano SAB de CV 29,724 250,998Grupo Financiero Banorte SAB de CV,Class O 39,197 253,485
Grupo Mexico SAB de CV, Series B 51,046 240,379Wal-Mart de Mexico SAB de CV 80,983 264,663
1,295,238Peru - 0.2%Credicorp Ltd. (B) 996 120,626Qatar - 0.6%Qatar National Bank QPSC 70,903 349,549Republic of Korea - 18.1%Celltrion, Inc. (B) 1,586 378,139Hyundai Mobis Co. Ltd. 1,064 275,885Hyundai Motor Co. 2,289 486,805Kakao Corp. 4,821 697,796KB Financial Group, Inc. 6,251 309,733Kia Corp. 4,279 340,451LG Chem Ltd. 756 570,617LG Corp. 1,912 174,026LG Electronics, Inc. 1,727 250,734LG Household & Health Care Ltd. 150 234,693NAVER Corp. 2,312 857,133NCSoft Corp. 256 186,405POSCO 1,283 396,469Samsung Biologics Co. Ltd. (B) (C) 265 197,900Samsung C&T Corp. 1,435 173,935Samsung Electronics Co. Ltd. 32,941 2,360,555Samsung SDI Co. Ltd. 880 545,434Shinhan Financial Group Co. Ltd. 8,262 297,862SK Hynix, Inc. 8,616 975,483SK Innovation Co. Ltd. (B) 843 221,202
9,931,257Republic of South Africa - 3.2%FirstRand Ltd. 85,225 319,860Naspers Ltd., N Shares 6,965 1,462,481
1,782,341Russian Federation - 6.3%Gazprom PJSC, ADR 96,543 735,851Lukoil PJSC, ADR 5,762 533,676
Copyright © 2021 www.secdatabase.com. All Rights Reserved.Please Consider the Environment Before Printing This Document

Page 25
Copyright © 2021 www.secdatabase.com. All Rights Reserved.Please Consider the Environment Before Printing This Document

DeltaShares® S&P EM 100 & Managed Risk ETFSCHEDULE OF INVESTMENTS (continued)At June 30, 2021(unaudited)
FUTURES CONTRACTS:
Long Futures Contracts
DescriptionNumber ofContracts
ExpirationDate
NotionalAmount Value
UnrealizedAppreciation
UnrealizedDepreciation
MSCI Emerging Markets Index 6 09/17/2021 $ 410,155 $ 409,440 $ � $ (715 )
INVESTMENTS BY INDUSTRY:
IndustryPercentage of
Total Investments ValueBanks 17.2 % $ 9,489,472Internet & Direct Marketing Retail 16.2 8,969,557Interactive Media & Services 10.0 5,506,792Oil, Gas & Consumable Fuels 9.5 5,223,984Semiconductors & Semiconductor Equipment 7.5 4,136,904Technology Hardware, Storage & Peripherals 4.9 2,706,100Automobiles 4.8 2,667,888Metals & Mining 4.0 2,217,520IT Services 2.6 1,452,740Insurance 2.2 1,237,544Entertainment 2.2 1,227,929Life Sciences Tools & Services 2.1 1,150,738
The Notes to Financial Statements are an integral part of this report.
Shares ValueCOMMON STOCKS (continued)Russian Federation (continued)MMC Norilsk Nickel PJSC, ADR 9,617 $ 327,651Novatek PJSC, GDR 1,554 340,792Rosneft Oil Co. PJSC, GDR 35,593 275,490Sberbank of Russia PJSC, ADR 43,154 716,572Tatneft PJSC, ADR 4,181 182,375Yandex NV, Class A (A) (B) 5,094 360,401
3,472,808Saudi Arabia - 3.7%Al Rajhi Bank 19,591 579,832Saudi Arabian Oil Co. (C) 31,985 299,347Saudi Basic Industries Corp. 14,393 467,435Saudi National Bank 21,590 331,587Saudi Telecom Co. 9,596 336,720
2,014,921Taiwan - 5.8%Taiwan Semiconductor Manufacturing Co.Ltd., ADR 23,404 2,812,225
United Microelectronics Corp., ADR (A) 36,952 349,1963,161,421
Thailand - 0.3%PTT PCL, NVDR 137,000 167,777United Arab Emirates - 0.6%First Abu Dhabi Bank PJSC 69,712 316,946Total Common Stocks
(Cost $42,930,753) 54,103,829
PREFERRED STOCKS - 0.9%Republic of Korea - 0.9%Hyundai Motor Co.,0.00% (D) 937 95,842
Shares Value
PREFERRED STOCKS (continued)Republic of Korea (continued)LG Chem Ltd.,2.69% (D) 123 $ 41,887
Samsung Electronics Co. Ltd.,0.00% (D) 5,280 345,545
Samsung SDI Co. Ltd.,0.00% (D) 23 8,935
Total Preferred Stocks(Cost $354,453) 492,209
SHORT-TERM INVESTMENT COMPANY - 0.2%Money Market Fund - 0.2%State Street Institutional Treasury MoneyMarket Fund, 0.01% (D) 91,210 91,210
Total Short-Term Investment Company(Cost $91,210) 91,210
OTHER INVESTMENT COMPANY - 0.9%Securities Lending Collateral - 0.9%State Street Navigator SecuritiesLending Trust - Government MoneyMarket Portfolio, 0.02% (D) 515,003 515,003
Total Other Investment Company(Cost $515,003) 515,003
Total Investments(Cost $43,891,419) 55,202,251
Net Other Assets (Liabilities) - (0.4)% (206,792 )
Net Assets - 100.0% $ 54,995,459
Copyright © 2021 www.secdatabase.com. All Rights Reserved.Please Consider the Environment Before Printing This Document

Transamerica ETF Trust Semi-Annual Report 2021Page 26
Copyright © 2021 www.secdatabase.com. All Rights Reserved.Please Consider the Environment Before Printing This Document

DeltaShares® S&P EM 100 & Managed Risk ETFSCHEDULE OF INVESTMENTS (continued)At June 30, 2021(unaudited)
INVESTMENTS BY INDUSTRY (continued):
IndustryPercentage of
Total Investments ValueChemicals 2.0 % $1,079,939Textiles, Apparel & Luxury Goods 1.9 1,035,405Electronic Equipment, Instruments &
Components 1.7 914,608Biotechnology 1.1 594,006Diversified Telecommunication Services 0.9 501,910Beverages 0.9 493,384Hotels, Restaurants & Leisure 0.8 445,399Diversified Consumer Services 0.6 357,328Industrial Conglomerates 0.6 347,961Real Estate Management & Development 0.6 323,558Diversified Financial Services 0.6 319,860Air Freight & Logistics 0.5 305,746Wireless Telecommunication Services 0.5 285,713Auto Components 0.5 275,885Food Products 0.5 266,011Food & Staples Retailing 0.5 264,663Household Durables 0.5 250,734Personal Products 0.4 234,693Pharmaceuticals 0.3 162,392Tobacco 0.3 149,675Money Market Fund 0.2 91,210Investments 99.1 54,687,248Short-Term Investments 0.9 515,003Total Investments 100.0 % $ 55,202,251
INVESTMENT VALUATION:
Valuation Inputs (E)
Level 1 -Unadjusted
Quoted Prices
Level 2 -Other Significant
Observable Inputs
Level 3 -Significant
Unobservable Inputs ValueASSETSInvestmentsCommon Stocks $23,720,603 $ 30,383,226 $ � $54,103,829Preferred Stocks � 492,209 � 492,209Short-Term Investment Company 91,210 � � 91,210Other Investment Company 515,003 � � 515,003Total Investments $24,326,816 $ 30,875,435 $ �� $55,202,251
LIABILITIESOther Financial InstrumentsFutures Contracts (F) $(715 ) $ � $ � $(715 )Total Other Financial Instruments $(715 ) $ �� $ �� $(715 )
FOOTNOTES TO SCHEDULE OF INVESTMENTS:
(A) All or a portion of the securities are on loan. The total value of all securities on loan is $1,037,685, collateralized by cash collateral of $515,003 andnon-cash collateral, such as U.S. government securities and irrevocable letters of credit, of $557,886. The amount of securities on loan indicated maynot correspond with the securities on loan identified because securities with pending sales are in the process of recall from the brokers.
(B) Non-income producing securities.(C) Securities are exempt from registration pursuant to Rule 144A of the Securities Act of 1933. Securities may be resold as transactions exempt from
registration, normally to qualified institutional buyers. At June 30, 2021, the total value of 144A securities is $6,094,178, representing 11.1% of theFund�s net assets.
The Notes to Financial Statements are an integral part of this report.
Copyright © 2021 www.secdatabase.com. All Rights Reserved.Please Consider the Environment Before Printing This Document

Transamerica ETF Trust Semi-Annual Report 2021Page 27
Copyright © 2021 www.secdatabase.com. All Rights Reserved.Please Consider the Environment Before Printing This Document

DeltaShares® S&P EM 100 & Managed Risk ETFSCHEDULE OF INVESTMENTS (continued)At June 30, 2021(unaudited)
FOOTNOTES TO SCHEDULE OF INVESTMENTS (continued):
(D) Rates disclosed reflect the yields at June 30, 2021.(E) There were no transfers in or out of Level 3 during the six-month period ended June 30, 2021. Please reference the Investment Valuation section of
the Notes to Financial Statements for more information regarding investment valuation and pricing inputs.(F) Derivative instruments are valued at unrealized appreciation (depreciation).
PORTFOLIO ABBREVIATIONS:
ADR American Depositary ReceiptGDR Global Depositary ReceiptNVDR Non-Voting Depository Receipt
The Notes to Financial Statements are an integral part of this report.Transamerica ETF Trust Semi-Annual Report 2021
Page 28
Copyright © 2021 www.secdatabase.com. All Rights Reserved.Please Consider the Environment Before Printing This Document

DeltaShares® S&P International Managed Risk ETFSCHEDULE OF INVESTMENTSAt June 30, 2021(unaudited)
The Notes to Financial Statements are an integral part of this report.Transamerica ETF Trust Semi-Annual Report 2021
Shares ValueCOMMON STOCKS - 98.6%Australia - 7.4%Afterpay Ltd. (A) 2,471 $219,218AGL Energy Ltd. 6,486 39,929Alumina Ltd. 24,468 30,218AMP Ltd. (B) 35,777 30,217Ampol Ltd. 2,481 52,544APA Group (B) 12,283 82,071Aristocrat Leisure Ltd. (B) 6,648 215,062ASX Ltd. (B) 2,015 117,557Atlas Arteria Ltd. 9,984 47,746Atlassian Corp. PLC, Class A (A) 1,408 361,659Aurizon Holdings Ltd. 19,163 53,518AusNet Services Ltd. (B) 19,391 25,476Australia & New Zealand Banking Group Ltd. 29,623 626,041Bendigo & Adelaide Bank Ltd. 5,689 44,803BHP Group Ltd. 30,668 1,118,276BHP Group PLC 21,988 646,994BlueScope Steel Ltd. 5,245 86,472Boral Ltd. (A) 10,642 58,723Brambles Ltd. 15,045 129,215CIMIC Group Ltd. (B) 745 11,063Cochlear Ltd. (B) 684 129,236Coles Group Ltd. 13,887 178,175Commonwealth Bank of Australia 18,469 1,384,758Computershare Ltd. 5,908 74,959Crown Resorts Ltd. (A) (B) 3,736 33,405CSL Ltd. 4,738 1,014,436Dexus, REIT 11,197 89,694Domino�s Pizza Enterprises Ltd. 658 59,531Endeavour Group Ltd. (A) (B) 13,197 62,319Evolution Mining Ltd. 17,788 60,095Fortescue Metals Group Ltd. 17,309 303,297Goodman Group, REIT 17,502 278,166GPT Group, REIT 20,057 73,783Harvey Norman Holdings Ltd. (B) 7,134 29,350Incitec Pivot Ltd. 20,219 36,127Insurance Australia Group Ltd. (B) 25,663 99,415Lendlease Corp. Ltd. 7,168 61,671Macquarie Group Ltd. 3,541 415,854Magellan Financial Group Ltd. (B) 1,492 60,330Medibank Pvt Ltd. 28,670 68,016Mirvac Group, REIT 40,992 89,862National Australia Bank Ltd. 34,340 675,972Newcrest Mining Ltd. 8,508 161,473Northern Star Resources Ltd. 12,112 88,930Oil Search Ltd. (B) 19,252 55,068Orica Ltd. (B) 4,236 42,233Origin Energy Ltd. 18,335 62,080Qantas Airways Ltd. (A) 9,621 33,659QBE Insurance Group Ltd. 15,357 124,401Ramsay Health Care Ltd. (B) 1,930 91,211REA Group Ltd. (B) 523 66,368Rio Tinto Ltd. 3,865 367,465Santos Ltd. 19,517 103,885Scentre Group, REIT 54,034 111,151SEEK Ltd. 3,675 91,433Seven Group Holdings Ltd. (B) 1,619 24,735Sonic Healthcare Ltd. 4,975 143,423South32 Ltd. 49,125 108,060
Shares ValueCOMMON STOCKS (continued)Australia (continued)Stockland, REIT 24,852 $ 86,945Suncorp Group Ltd. 13,356 111,400Sydney Airport (A) (B) 13,766 59,839Tabcorp Holdings Ltd. 23,128 89,942Telstra Corp. Ltd. 43,335 122,327TPG Telecom Ltd. 3,871 18,192Transurban Group (B) 28,505 304,524Treasury Wine Estates Ltd. 7,515 65,897Vicinity Centres, REIT (B) 40,283 46,725Washington H Soul Pattinson & Co. Ltd. (B) 1,296 32,818Wesfarmers Ltd. 11,804 523,736Westpac Banking Corp. 38,192 740,041WiseTech Global Ltd. 1,624 38,930Woodside Petroleum Ltd. 10,031 167,258Woolworths Group Ltd. 13,197 377,779Worley Ltd. 3,315 29,765
13,766,946Austria - 0.4%ams AG (A) 2,855 57,326Andritz AG (B) 747 41,972BAWAG Group AG (C) 724 38,534CA Immobilien Anlagen AG 731 30,471Erste Group Bank AG 3,087 113,268EVN AG 393 9,265Flughafen Wien AG (A) 96 3,330Immofinanz AG (A) 1,001 22,495Mayr Melnhof Karton AG 90 19,169Oesterreichische Post AG 331 17,605OMV AG 1,499 85,275Raiffeisen Bank International AG 1,404 31,802Strabag SE 149 6,388Telekom Austria AG (A) 1,453 12,406UNIQA Insurance Group AG 1,190 10,358Verbund AG 709 65,288Vienna Insurance Group AG WienerVersicherung Gruppe 373 10,240
voestalpine AG 1,152 46,914Wienerberger AG 1,199 46,212
668,318Belgium - 1.0%Ackermans & van Haaren NV 234 39,516Ageas SA 1,924 106,782Anheuser-Busch InBev SA 8,814 635,618Elia Group SA (B) 350 36,941Etablissements Franz Colruyt NV 652 36,464Galapagos NV (A) (B) 498 34,537Groupe Bruxelles Lambert SA 1,226 137,162KBC Group NV 3,514 267,955Proximus SADP 1,619 31,276Sofina SA 164 70,755Solvay SA 761 96,745Telenet Group Holding NV 497 18,707UCB SA 1,316 137,587Umicore SA 2,078 126,912Warehouses de Pauw CVA, REIT 1,420 54,224
1,831,181
Copyright © 2021 www.secdatabase.com. All Rights Reserved.Please Consider the Environment Before Printing This Document

Page 29
Copyright © 2021 www.secdatabase.com. All Rights Reserved.Please Consider the Environment Before Printing This Document

DeltaShares® S&P International Managed Risk ETFSCHEDULE OF INVESTMENTS (continued)At June 30, 2021(unaudited)
The Notes to Financial Statements are an integral part of this report.Transamerica ETF Trust Semi-Annual Report 2021
Shares ValueCOMMON STOCKS (continued)Chile - 0.0% (D)Antofagasta PLC 3,592 $ 71,232China - 0.2%China Evergrande New Energy Vehicle GroupLtd. (A) (B) 25,500 94,896
ENN Energy Holdings Ltd. 7,900 150,353Fosun International Ltd. 25,500 36,711
281,960Czech Republic - 0.0% (D)Avast PLC (C) 7,932 53,671Denmark - 2.3%AP Moller - Maersk A/S, Class A 33 91,676AP Moller - Maersk A/S, Class B 66 189,720Carlsberg A/S, Class B 1,034 192,766Chr Hansen Holding A/S 1,071 96,672Coloplast A/S, Class B 1,237 202,992Danske Bank A/S 7,091 124,788Demant A/S (A) 1,075 60,517DSV Panalpina A/S 2,075 483,959Genmab A/S (A) 683 279,494GN Store Nord A/S 1,438 125,625H. Lundbeck A/S 643 20,457Novo Nordisk A/S, Class B 16,977 1,422,477Novozymes A/S, B Shares 2,162 162,981Orsted A/S (C) 1,882 264,117ROCKWOOL International A/S, B Shares 73 35,542Tryg A/S 3,203 78,638Vestas Wind Systems A/S 10,513 410,424
4,242,845Finland - 1.3%Elisa OYJ 1,568 93,569Fortum OYJ 4,531 124,983Huhtamaki OYJ 998 47,282Kesko OYJ, B Shares (B) 2,843 105,023Kojamo OYJ 1,415 32,336Kone OYJ, Class B 4,199 342,596Metso Outotec OYJ 7,335 85,211Neste OYJ 4,484 274,600Nokia OYJ (A) 59,084 316,391Nordea Bank Abp 35,416 394,489Orion OYJ, Class B (B) 1,104 47,460Sampo OYJ, A Shares 5,250 241,319Stora Enso OYJ, R Shares 6,375 116,312UPM-Kymmene OYJ 5,556 210,185Wartsila OYJ Abp 5,051 74,965
2,506,721France - 9.5%Aeroports de Paris (A) (B) 278 36,215Air Liquide SA 4,932 863,643Airbus SE (A) 6,383 820,848Amundi SA (C) 633 55,813AXA SA 21,656 549,207BioMerieux 431 50,090BNP Paribas SA 11,970 750,502Bollore SA 9,508 50,965Bouygues SA 2,339 86,515Bureau Veritas SA (A) 3,014 95,362
Shares ValueCOMMON STOCKS (continued)France (continued)Capgemini SE (B) 1,669 $ 320,641Carrefour SA 6,043 118,855Christian Dior SE 38 30,599Cie de Saint-Gobain 5,545 365,221Cie Generale des Etablissements Michelin SCA 1,857 296,198Credit Agricole SA 13,360 187,177Danone SA 7,148 503,269Dassault Systemes SE 1,437 348,496Electricite de France SA 4,195 57,310Engie SA 18,507 253,581EssilorLuxottica SA 3,108 573,655Hermes International 363 528,847Kering SA 768 671,239L�Oreal SA 2,510 1,118,610Legrand SA 2,784 294,696LVMH Moet Hennessy Louis Vuitton SE 2,785 2,184,097Orange SA 21,323 243,134Pernod Ricard SA 2,099 465,979Safran SA 3,647 505,677Sanofi 11,944 1,251,566Sartorius Stedim Biotech 250 118,264Schneider Electric SE 5,608 882,392Societe Generale SA 8,262 243,576Sodexo SA (A) 875 81,664Teleperformance 611 248,026Thales SA 1,111 113,361TotalEnergies SE (B) 26,009 1,176,856Veolia Environnement SA 5,672 171,322Vinci SA 5,111 545,442Vivendi SE (B) 9,013 302,806Worldline SA (A) (C) 2,357 220,651
17,782,367Germany - 7.6%adidas AG 1,920 714,728Allianz SE 4,292 1,070,403Auto1 Group SE (A) (C) 498 21,881BASF SE 9,562 753,402Bayer AG 10,227 621,085Bayerische Motoren Werke AG 3,322 351,842Beiersdorf AG 1,023 123,441BioNTech SE, ADR (A) 101 22,612Continental AG (A) 1,124 165,259CureVac NV (A) (B) 155 11,389Daimler AG 8,687 775,734Delivery Hero SE (A) (C) 1,944 256,821Deutsche Bank AG (A) 21,516 280,317Deutsche Boerse AG 1,978 345,289Deutsche Post AG 10,190 693,157Deutsche Telekom AG 33,707 712,002Deutsche Wohnen SE 3,746 229,138E.ON SE 23,373 270,362Evonik Industries AG 1,989 66,706Fresenius Medical Care AG & Co. KGaA 2,104 174,759Fresenius SE & Co. KGaA 4,295 224,086Hannover Rueck SE 628 105,084HeidelbergCement AG 1,529 131,170Henkel AG & Co. KGaA 1,028 94,664Infineon Technologies AG 13,595 545,257
Copyright © 2021 www.secdatabase.com. All Rights Reserved.Please Consider the Environment Before Printing This Document

Page 30
Copyright © 2021 www.secdatabase.com. All Rights Reserved.Please Consider the Environment Before Printing This Document

DeltaShares® S&P International Managed Risk ETFSCHEDULE OF INVESTMENTS (continued)At June 30, 2021(unaudited)
The Notes to Financial Statements are an integral part of this report.
Shares ValueCOMMON STOCKS (continued)Germany (continued)Knorr-Bremse AG 688 $ 79,142Merck KGaA 1,345 257,917MTU Aero Engines AG 556 137,740Muenchener Rueckversicherungs-Gesellschaft AG 1,458 399,323
Puma SE 1,068 127,351RWE AG 7,040 255,138SAP SE 11,382 1,604,093Sartorius AG 8 4,008Siemens AG 8,406 1,332,015Siemens Healthineers AG (C) 2,936 179,940Symrise AG 1,339 186,581Talanx AG (A) 553 22,612TeamViewer AG (A) (C) 1,654 62,218Traton SE 521 16,521Uniper SE 1,029 37,902Volkswagen AG 307 100,775Vonovia SE 5,891 380,884Zalando SE (A) (C) 1,766 213,514
14,158,262Hong Kong - 2.9%AIA Group Ltd. 126,000 1,565,701Alibaba Health Information Technology Ltd.
(A) 44,000 97,566Bank of East Asia Ltd. 16,400 30,452BOC Hong Kong Holdings Ltd. 37,500 127,240Budweiser Brewing Co. APAC Ltd. (B) (C) 17,900 56,472Chow Tai Fook Jewellery Group Ltd. (B) 23,000 52,540CK Asset Holdings Ltd. 20,500 141,491CK Hutchison Holdings Ltd. 28,000 218,134CK Infrastructure Holdings Ltd. 6,500 38,753CLP Holdings Ltd. 17,000 168,121Galaxy Entertainment Group Ltd. (A) 22,000 176,066Hang Lung Properties Ltd. 19,000 46,143Hang Seng Bank Ltd. 7,600 151,788Henderson Land Development Co. Ltd. 14,000 66,342HK Electric Investments & HK ElectricInvestments Ltd. 24,000 24,322
HKT Trust & HKT Ltd. 38,000 51,770Hong Kong & China Gas Co. Ltd. 116,550 180,997Hong Kong Exchanges & Clearing Ltd. 12,400 738,969Hongkong Land Holdings Ltd. 12,100 57,596Jardine Matheson Holdings Ltd. 2,700 172,584Link, REIT (B) 21,700 210,270Melco Resorts & Entertainment Ltd.,ADR (A) 2,185 36,205
MTR Corp. Ltd. 16,000 89,108New World Development Co. Ltd. 15,000 77,937Power Assets Holdings Ltd. 14,000 85,902Sino Land Co. Ltd. 34,000 53,588Sun Hung Kai Properties Ltd. 16,000 238,377Swire Properties Ltd. 11,000 32,791Techtronic Industries Co. Ltd. 18,000 314,299Wharf Holdings Ltd. 16,000 60,985Wharf Real Estate Investment Co. Ltd. 18,000 104,650
5,467,159Ireland - 1.1%CRH PLC 8,173 411,926DCC PLC 1,055 86,251
Shares ValueCOMMON STOCKS (continued)Ireland (continued)Experian PLC 9,588 $ 369,015Flutter Entertainment PLC (A) 1,587 287,385ICON PLC (A) (B) 550 113,690James Hardie Industries PLC, CDI 4,625 157,187Kerry Group PLC, Class A 1,601 223,658Kingspan Group PLC 1,608 151,868Ryanair Holdings PLC, ADR (A) 1,174 127,039Smurfit Kappa Group PLC 2,697 146,326
2,074,345Israel - 0.9%Airport City Ltd. (A) 674 11,306Alony Hetz Properties & Investments Ltd. 1,528 21,289Amot Investments Ltd. 1,916 12,571Azrieli Group Ltd. 379 26,693Bank Hapoalim BM (A) 11,636 93,417Bank Leumi Le-Israel BM (A) 15,264 115,985Bezeq The Israeli Telecommunication Corp.Ltd. (A) 21,259 23,161
Check Point Software Technologies Ltd. (A) 1,113 129,253Compugen Ltd. (A) (B) 871 7,212CyberArk Software Ltd. (A) 414 53,932Elbit Systems Ltd. 258 33,413Electra Ltd. 20 11,349Energix-Renewable Energies Ltd. 2,313 8,880Enlight Renewable Energy Ltd. (A) 9,553 20,507Fattal Holdings 1998 Ltd. (A) 58 5,516First International Bank of Israel Ltd. (A) 543 17,397Fiverr International Ltd. (A) 179 43,406Formula Systems 1985 Ltd. 99 8,887Gav-Yam Lands Corp. Ltd. 1,557 14,913Harel Insurance Investments & FinancialServices Ltd. 1,202 11,915
ICL Group Ltd. 7,169 48,644Inmode Ltd. (A) 183 17,326Isracard Ltd. (A) 1 2Israel Corp. Ltd. (A) 42 12,730Israel Discount Bank Ltd., A Shares (A) 12,118 57,717JFrog Ltd. (A) 127 5,781Kornit Digital Ltd. (A) 480 59,678Matrix IT Ltd. 330 8,924Maytronics Ltd. 454 9,462Melisron Ltd. (A) 217 14,851Mivne Real Estate KD Ltd. 6,305 18,285Mizrahi Tefahot Bank Ltd. (A) 1,434 44,184Nano-X Imaging Ltd. (A) (B) 139 4,455Nice Ltd. (A) 657 160,535Nova Measuring Instruments Ltd. (A) 272 27,939OPC Energy Ltd. (A) 786 7,676Paz Oil Co. Ltd. 99 12,159Phoenix Holdings Ltd. 1,501 14,036Plus500 Ltd. 1,112 20,508Sapiens International Corp. NV 296 7,939Shapir Engineering & Industry Ltd. 1,476 11,256Shikun & Binui Ltd. (A) 2,368 15,319Shufersal Ltd. 2,110 16,797Strauss Group Ltd. 518 14,506Taro Pharmaceutical Industries Ltd. (A) 92 6,620Teva Pharmaceutical Industries Ltd., ADR (A) 11,341 112,276
Copyright © 2021 www.secdatabase.com. All Rights Reserved.Please Consider the Environment Before Printing This Document

Transamerica ETF Trust Semi-Annual Report 2021Page 31
Copyright © 2021 www.secdatabase.com. All Rights Reserved.Please Consider the Environment Before Printing This Document

DeltaShares® S&P International Managed Risk ETFSCHEDULE OF INVESTMENTS (continued)At June 30, 2021(unaudited)
The Notes to Financial Statements are an integral part of this report.Transamerica ETF Trust Semi-Annual Report 2021
Shares ValueCOMMON STOCKS (continued)Israel (continued)Tower Semiconductor Ltd. (A) 1,111 $ 32,807Wix.com Ltd. (A) 583 169,233ZIM Integrated Shipping Services Ltd. (A) 215 9,660
1,612,307Italy - 2.1%A2A SpA 16,307 33,340Amplifon SpA 872 43,060Assicurazioni Generali SpA 12,839 257,392Atlantia SpA (A) 5,244 94,962Banca Mediolanum SpA 2,547 24,780Davide Campari-Milano NV 4,353 58,307DiaSorin SpA 204 38,587Enel SpA 80,438 747,106Eni SpA 26,275 320,008Ferrari NV 1,332 274,854FinecoBank Banca Fineco SpA (A) 6,349 110,680Hera SpA 8,219 33,958Infrastrutture Wireless Italiane SpA (C) 3,399 38,342Intesa Sanpaolo SpA 182,052 502,929Leonardo SpA (A) 4,213 34,034Mediobanca Banca di Credito FinanziarioSpA (A) 7,667 89,559
Moncler SpA 2,194 148,462Nexi SpA (A) (C) 3,725 81,768Pirelli & C SpA (C) 4,581 26,598Poste Italiane SpA (C) 4,759 62,927Prada SpA 5,300 40,232Prysmian SpA 2,791 100,057Recordati Industria Chimica e FarmaceuticaSpA (B) 1,045 59,733
Snam SpA (B) 22,042 127,431Telecom Italia SpA 184,038 93,502Terna SpA 14,647 109,152UniCredit SpA 22,189 261,824UnipolSai Assicurazioni SpA (B) 4,713 13,682
3,827,266Japan - 25.7%ABC-Mart, Inc. 300 17,218Acom Co. Ltd. 4,800 20,932Activia Properties, Inc., REIT (B) 7 33,174Advance Residence Investment Corp., REIT 14 46,671Advantest Corp. 2,100 189,395Aeon Co. Ltd. 9,100 244,738Aeon Mall Co. Ltd. 1,000 15,416AGC, Inc. (B) 2,400 100,766Air Water, Inc. (B) 2,400 36,933Aisin Corp. 1,900 81,314Ajinomoto Co., Inc. 5,700 148,111Alfresa Holdings Corp. 2,200 32,884Alps Alpine Co. Ltd. 2,100 22,194Amada Co. Ltd. 3,700 37,437ANA Holdings, Inc. (A) 1,700 40,007Aozora Bank Ltd. (B) 1,200 26,867Asahi Group Holdings Ltd. (B) 5,000 233,850Asahi Intecc Co. Ltd. (B) 2,400 57,432Asahi Kasei Corp. 14,500 159,449Asics Corp. (B) 2,000 50,671Astellas Pharma, Inc. 19,400 338,132
Shares ValueCOMMON STOCKS (continued)Japan (continued)Azbil Corp. 1,400 $ 58,086Bandai Namco Holdings, Inc. 2,300 159,730Bank of Kyoto Ltd. 800 36,328Benefit One, Inc. 800 25,191Benesse Holdings, Inc. 800 19,915Bridgestone Corp. (B) 6,400 291,486Brother Industries Ltd. 2,700 53,932Calbee, Inc. 1,200 27,700Canon Marketing Japan, Inc. (B) 600 13,963Canon, Inc. (B) 11,100 251,323Capcom Co. Ltd. 1,700 49,779Casio Computer Co. Ltd. 2,400 40,155Central Japan Railway Co. 2,100 318,812Chiba Bank Ltd. 7,700 46,412Chubu Electric Power Co., Inc. 7,500 91,765Chugai Pharmaceutical Co. Ltd. (B) 6,600 261,764Chugoku Electric Power Co., Inc. (B) 3,400 31,062Coca-Cola Bottlers Japan Holdings, Inc. (B) 1,600 25,026COMSYS Holdings Corp. 1,300 36,017Concordia Financial Group Ltd. 12,600 46,204Cosmos Pharmaceutical Corp. 200 29,372Credit Saison Co. Ltd. 1,600 19,519CyberAgent, Inc. 4,300 92,400Dai Nippon Printing Co. Ltd. 2,900 61,376Dai-ichi Life Holdings, Inc. 11,900 218,079Daicel Corp. 3,000 24,705Daifuku Co. Ltd. 1,300 118,182Daiichi Sankyo Co. Ltd. 19,100 412,064Daikin Industries Ltd. 3,100 577,881Daito Trust Construction Co. Ltd. 700 76,628Daiwa House Industry Co. Ltd. 6,900 207,329Daiwa House Investment Corp., REIT 21 61,965Daiwa Office Investment Corp., REIT 3 20,894Daiwa Securities Group, Inc. 15,700 86,301DeNA Co. Ltd. 900 19,145Denso Corp. 5,400 368,741Dentsu Group, Inc. (B) 2,500 89,535DIC Corp. 900 22,745Disco Corp. 300 91,765Dowa Holdings Co. Ltd. 600 23,651East Japan Railway Co. 3,900 278,541Ebara Corp. 900 44,355Eisai Co. Ltd. 3,100 305,140Electric Power Development Co. Ltd., Class C 1,800 25,705ENEOS Holdings, Inc. 33,600 140,739Ezaki Glico Co. Ltd. 600 22,380Fancl Corp. 800 25,948FANUC Corp. 2,000 482,836Fast Retailing Co. Ltd. 700 527,444FP Corp. 500 18,583Fuji Electric Co. Ltd. 1,600 74,818Fuji Media Holdings, Inc. 500 5,559FUJIFILM Holdings Corp. 4,200 311,774Fujitsu Ltd. 1,900 356,068Fukuoka Financial Group, Inc. (B) 2,000 34,940GLP J-REIT 45 77,683GMO internet, Inc. (B) 700 19,110GMO Payment Gateway, Inc. 400 52,149
Copyright © 2021 www.secdatabase.com. All Rights Reserved.Please Consider the Environment Before Printing This Document

Page 32
Copyright © 2021 www.secdatabase.com. All Rights Reserved.Please Consider the Environment Before Printing This Document

DeltaShares® S&P International Managed Risk ETFSCHEDULE OF INVESTMENTS (continued)At June 30, 2021(unaudited)
The Notes to Financial Statements are an integral part of this report.Transamerica ETF Trust Semi-Annual Report 2021
Shares ValueCOMMON STOCKS (continued)Japan (continued)Goldwin, Inc. 400 $ 23,534GungHo Online Entertainment, Inc. 500 9,960Hachijuni Bank Ltd. 5,300 17,095Hakuhodo DY Holdings, Inc. (B) 3,200 49,705Hamamatsu Photonics KK 1,500 90,549Hankyu Hanshin Holdings, Inc. 2,600 80,232Harmonic Drive Systems, Inc. (B) 400 22,056Haseko Corp. 2,600 35,654Hikari Tsushin, Inc. (B) 200 35,156Hino Motors Ltd. 3,000 26,408Hirose Electric Co. Ltd. 300 43,923Hisamitsu Pharmaceutical Co., Inc. 900 44,355Hitachi Construction Machinery Co. Ltd. 1,100 33,647Hitachi Ltd. 10,100 578,846Hitachi Metals Ltd. (A) (B) 2,100 40,187Hitachi Transport System Ltd. 500 20,745Honda Motor Co. Ltd. 17,900 572,529Hoshizaki Corp. 600 51,032House Foods Group, Inc. 800 24,471Hoya Corp. 3,800 504,316Hulic Co. Ltd. (B) 5,200 58,564Ibiden Co. Ltd. 1,400 75,556Idemitsu Kosan Co. Ltd. 2,600 62,851IHI Corp. (A) 1,600 38,000Iida Group Holdings Co. Ltd. 1,900 48,959Industrial & Infrastructure Fund Investment Corp.,REIT 22 42,002
Inpex Corp. (B) 11,300 84,401Isetan Mitsukoshi Holdings Ltd. 4,100 28,592Isuzu Motors Ltd. 6,500 85,913Ito En Ltd. 700 41,562ITOCHU Corp. 14,700 423,822Itochu Techno-Solutions Corp. 1,000 30,994Izumi Co. Ltd. 500 18,831Japan Airlines Co. Ltd. (A) 1,500 32,449Japan Airport Terminal Co. Ltd. (A) (B) 900 40,463Japan Exchange Group, Inc. 5,600 124,624Japan Metropolitan Fund Investment Corp., REIT 73 79,189Japan Post Bank Co. Ltd. 4,200 35,306Japan Post Holdings Co. Ltd. 15,500 127,125Japan Post Insurance Co. Ltd. 2,100 38,863Japan Prime Realty Investment Corp., REIT (B) 10 39,193Japan Real Estate Investment Corp., REIT 14 86,152Japan Tobacco, Inc. (B) 11,500 217,432JCR Pharmaceuticals Co. Ltd. 700 23,588JFE Holdings, Inc. 6,000 70,331JGC Holdings Corp. 2,700 25,178JSR Corp. 2,200 66,601JTEKT Corp. 2,600 26,682Justsystems Corp. 300 17,677K�s Holdings Corp. 1,900 21,861Kagome Co. Ltd. (B) 900 23,767Kajima Corp. 5,200 65,919Kakaku.com, Inc. 1,400 42,319Kaken Pharmaceutical Co. Ltd. 400 17,155Kamigumi Co. Ltd. 1,100 22,329Kansai Electric Power Co., Inc. 8,600 82,095Kansai Paint Co. Ltd. 2,700 68,868
Shares ValueCOMMON STOCKS (continued)Japan (continued)Kao Corp. (B) 5,000 $ 307,911Kawasaki Heavy Industries Ltd. (A) 1,700 36,377KDDI Corp. 17,000 530,723Keihan Holdings Co. Ltd. (B) 1,100 33,300Keikyu Corp. (B) 2,900 35,482Keio Corp. 1,300 76,484Keisei Electric Railway Co. Ltd. 1,800 57,492Kenedix Office Investment Corp., REIT 4 28,219Kewpie Corp. 1,200 26,954Keyence Corp. 1,900 959,843Kikkoman Corp. 2,000 132,084Kinden Corp. 1,300 21,247Kintetsu Group Holdings Co. Ltd. (A) 2,000 70,277Kirin Holdings Co. Ltd. (B) 9,000 175,637Kobayashi Pharmaceutical Co. Ltd. (B) 600 51,302Kobe Bussan Co. Ltd. 1,300 40,995Koei Tecmo Holdings Co. Ltd. 650 31,742Koito Manufacturing Co. Ltd. 1,300 80,935Komatsu Ltd. 10,100 251,203Konami Holdings Corp. 1,000 60,095Kose Corp. (B) 400 62,997Kubota Corp. (B) 12,000 242,941Kuraray Co. Ltd. (B) 3,700 35,570Kurita Water Industries Ltd. 1,100 52,825Kyocera Corp. 3,700 228,954Kyowa Exeo Corp. 1,200 29,570Kyowa Kirin Co. Ltd. (B) 2,600 92,297Kyushu Electric Power Co., Inc. 4,900 37,747Kyushu Railway Co. (B) 1,600 36,126Lasertec Corp. 800 155,618Lawson, Inc. 500 23,155Lion Corp. (B) 3,100 52,565Lixil Corp. 3,000 77,656M3, Inc. 4,500 328,935Mabuchi Motor Co. Ltd. (B) 600 22,705Makita Corp. 2,900 136,652Marubeni Corp. 17,200 149,715Marui Group Co. Ltd. 2,300 43,269Maruichi Steel Tube Ltd. 800 18,805Matsumotokiyoshi Holdings Co. Ltd. 1,000 44,193Mazda Motor Corp. (A) 6,200 58,319McDonald�s Holdings Co. Japan Ltd. (B) 700 30,904Mebuki Financial Group, Inc. 12,300 25,932Medipal Holdings Corp. 2,200 42,061MEIJI Holdings Co. Ltd. 1,500 89,873Mercari, Inc. (A) (B) 1,100 58,474Minebea Mitsumi, Inc. 4,400 116,511MISUMI Group, Inc. 3,000 101,631Mitsubishi Chemical Holdings Corp. 14,700 123,637Mitsubishi Corp. 14,700 401,042Mitsubishi Electric Corp. 22,400 325,435Mitsubishi Estate Co. Ltd. 14,500 234,699Mitsubishi Gas Chemical Co., Inc. 2,200 46,700Mitsubishi HC Capital, Inc. 7,950 42,619Mitsubishi Heavy Industries Ltd. 3,500 103,086Mitsubishi Logistics Corp. 800 23,714Mitsubishi Materials Corp. 1,400 27,939Mitsubishi Motors Corp. (A) 7,100 19,959
Copyright © 2021 www.secdatabase.com. All Rights Reserved.Please Consider the Environment Before Printing This Document

Page 33
Copyright © 2021 www.secdatabase.com. All Rights Reserved.Please Consider the Environment Before Printing This Document

DeltaShares® S&P International Managed Risk ETFSCHEDULE OF INVESTMENTS (continued)At June 30, 2021(unaudited)
The Notes to Financial Statements are an integral part of this report.
Shares ValueCOMMON STOCKS (continued)Japan (continued)Mitsubishi UFJ Financial Group, Inc. 134,300 $ 726,132Mitsui & Co. Ltd. 16,700 376,235Mitsui Chemicals, Inc. 2,100 72,561Mitsui Fudosan Co. Ltd. 10,000 231,823Mitsui O.S.K. Lines Ltd. 1,300 62,546Miura Co. Ltd. 1,200 52,059Mizuho Financial Group, Inc. 26,400 377,602MonotaRO Co. Ltd. 2,600 61,609Morinaga & Co. Ltd. 500 15,992MS&AD Insurance Group Holdings, Inc. 5,000 144,517Murata Manufacturing Co. Ltd. 6,700 512,023Nabtesco Corp. (B) 1,300 49,194Nagoya Railroad Co. Ltd. (A) 2,000 37,229Nankai Electric Railway Co. Ltd. 1,200 25,656NEC Corp. 2,800 144,301NET One Systems Co. Ltd. 900 29,719Nexon Co. Ltd. 4,700 104,849NGK Insulators Ltd. 2,900 48,703NGK Spark Plug Co. Ltd. (B) 1,800 26,694NH Foods Ltd. 1,100 42,815Nichirei Corp. 1,400 36,819Nidec Corp. 5,700 661,208Nifco, Inc. 900 34,017Nihon M&A Center, Inc. (B) 3,000 77,872Nihon Unisys Ltd. 800 24,074Nikon Corp. 3,600 38,436Nintendo Co. Ltd. 1,200 698,658Nippo Corp. 500 14,258Nippon Building Fund, Inc., REIT (B) 17 106,145Nippon Express Co. Ltd. 900 68,601Nippon Paint Holdings Co. Ltd. (B) 15,100 205,161Nippon Prologis, Inc., REIT 27 85,994Nippon Sanso Holdings Corp. (B) 2,200 45,134Nippon Shinyaku Co. Ltd. 600 47,626Nippon Shokubai Co. Ltd. 400 19,245Nippon Steel Corp. 9,900 167,111Nippon Telegraph & Telephone Corp. 13,400 349,458Nippon Television Holdings, Inc. 500 5,798Nippon Yusen KK 1,800 91,305Nissan Chemical Corp. 1,500 73,520Nissan Motor Co. Ltd. (A) 25,000 124,178Nisshin Seifun Group, Inc. 2,700 39,531Nissin Foods Holdings Co. Ltd. 900 64,871Nitori Holdings Co. Ltd. 900 159,420Nitto Denko Corp. 1,600 119,506NOF Corp. 900 46,950NOK Corp. 1,300 16,140Nomura Holdings, Inc. 29,300 149,892Nomura Real Estate Holdings, Inc. 1,200 30,468Nomura Real Estate Master Fund, Inc.,REIT 49 78,628
Nomura Research Institute Ltd. 3,900 129,133NS Solutions Corp. 300 9,677NSK Ltd. 5,100 43,147NTT Data Corp. 6,700 104,614Obayashi Corp. 7,500 59,668OBIC Business Consultants Co. Ltd. 200 11,569OBIC Co. Ltd. 700 130,615Odakyu Electric Railway Co. Ltd. (B) 3,600 91,014
Shares ValueCOMMON STOCKS (continued)Japan (continued)Oji Holdings Corp. 10,600 $ 60,932Olympus Corp. 13,400 266,575Omron Corp. 2,100 166,691Ono Pharmaceutical Co. Ltd. 5,200 116,144Open House Co. Ltd. 800 37,625Oracle Corp. 300 22,975Oriental Land Co. Ltd. 2,300 328,039ORIX Corp. 13,400 226,311ORIX, Inc., REIT 29 55,863Osaka Gas Co. Ltd. 4,300 80,158Otsuka Corp. 1,100 57,780Otsuka Holdings Co. Ltd. (B) 5,800 240,748PALTAC Corp. 300 15,569Pan Pacific International Holdings Corp. (B) 6,300 130,893Panasonic Corp. 24,300 281,446Park24 Co. Ltd. (A) 1,200 21,818PeptiDream, Inc. (A) 1,000 49,103Persol Holdings Co. Ltd. 2,000 39,553Pigeon Corp. (B) 1,300 36,661Pola Orbis Holdings, Inc. (B) 900 23,791Rakuten Group, Inc. (B) 9,400 106,204Recruit Holdings Co. Ltd. 17,700 872,322Relo Group, Inc. 1,200 27,462Renesas Electronics Corp. (A) 14,400 155,819Resona Holdings, Inc. 24,800 95,455Ricoh Co. Ltd. 7,100 79,770Rinnai Corp. 400 38,093Rohm Co. Ltd. 900 83,278Rohto Pharmaceutical Co. Ltd. 1,200 32,273Ryohin Keikaku Co. Ltd. 2,700 56,681Sankyu, Inc. 600 26,029Santen Pharmaceutical Co. Ltd. 4,200 57,897SBI Holdings, Inc. 2,500 59,194Screen Holdings Co. Ltd. 500 49,464SCSK Corp. 500 29,822Secom Co. Ltd. 2,200 167,374Sega Sammy Holdings, Inc. 1,800 23,645Seibu Holdings, Inc. (A) (B) 2,800 32,846Seiko Epson Corp. 3,400 59,858Seino Holdings Co. Ltd. 1,800 23,094Sekisui Chemical Co. Ltd. 4,700 80,415Sekisui House Ltd. 6,800 139,596Sekisui House, Inc., REIT (B) 45 37,301Seria Co. Ltd. 500 18,448Seven & i Holdings Co. Ltd. 8,300 396,118Seven Bank Ltd. 7,600 16,160SG Holdings Co. Ltd. 5,300 139,102Sharp Corp. (B) 2,500 41,287Shimadzu Corp. 2,900 112,222Shimamura Co. Ltd. 300 28,813Shimano, Inc. (B) 900 213,668Shimizu Corp. 7,300 56,037Shin-Etsu Chemical Co. Ltd. 4,100 686,350Shinsei Bank Ltd. 1,700 22,316Shionogi & Co. Ltd. (B) 2,900 151,310Shiseido Co. Ltd. (B) 4,200 309,201Shizuoka Bank Ltd. (B) 5,900 45,663Showa Denko KK 1,600 47,572
Copyright © 2021 www.secdatabase.com. All Rights Reserved.Please Consider the Environment Before Printing This Document

Transamerica ETF Trust Semi-Annual Report 2021Page 34
Copyright © 2021 www.secdatabase.com. All Rights Reserved.Please Consider the Environment Before Printing This Document

DeltaShares® S&P International Managed Risk ETFSCHEDULE OF INVESTMENTS (continued)At June 30, 2021(unaudited)
The Notes to Financial Statements are an integral part of this report.Transamerica ETF Trust Semi-Annual Report 2021
Shares ValueCOMMON STOCKS (continued)Japan (continued)Skylark Holdings Co. Ltd. (A) (B) 2,300 $ 31,975SMC Corp. 700 414,046SoftBank Corp. 16,400 214,771SoftBank Group Corp. 13,100 917,673Sohgo Security Services Co. Ltd. 900 41,031Sojitz Corp. 11,500 34,710Sompo Holdings, Inc. 3,900 144,278Sony Group Corp. 13,100 1,276,480Sotetsu Holdings, Inc. 1,000 19,722Square Enix Holdings Co. Ltd. 900 44,680Stanley Electric Co. Ltd. 1,600 46,346Subaru Corp. 6,400 126,368Sugi Holdings Co. Ltd. 400 29,192Sumco Corp. (B) 2,600 63,835Sumitomo Chemical Co. Ltd. 17,200 91,277Sumitomo Corp. 12,400 166,242Sumitomo Dainippon Pharma Co. Ltd. 2,000 41,950Sumitomo Electric Industries Ltd. 8,300 122,567Sumitomo Heavy Industries Ltd. 1,300 35,841Sumitomo Metal Mining Co. Ltd. 2,800 109,109Sumitomo Mitsui Financial Group, Inc. (B) 14,300 493,459Sumitomo Mitsui Trust Holdings, Inc. 3,900 123,968Sumitomo Realty & Development Co. Ltd. 5,000 178,845Sumitomo Rubber Industries Ltd. (B) 1,900 26,243Sundrug Co. Ltd. 700 22,263Suntory Beverage & Food Ltd. (B) 1,300 48,959Suzuken Co. Ltd. (B) 800 23,462Suzuki Motor Corp. 5,100 216,011Sysmex Corp. 1,700 202,180T&D Holdings, Inc. 6,300 81,510Taiheiyo Cement Corp. 1,300 28,544Taisei Corp. 2,200 72,151Taisho Pharmaceutical Holdings Co. Ltd. 600 32,165Taiyo Yuden Co. Ltd. (B) 1,400 69,249Takara Bio, Inc. 500 13,357Takeda Pharmaceutical Co. Ltd. 16,400 549,523TBS Holdings, Inc. 400 6,148TDK Corp. 1,300 158,005Teijin Ltd. 2,100 32,033Terumo Corp. 7,500 304,217THK Co. Ltd. (B) 1,300 38,828TIS, Inc. 2,400 61,346Tobu Railway Co. Ltd. 2,200 56,928Toho Co. Ltd. 1,500 61,897Toho Gas Co. Ltd. 1,000 49,013Tohoku Electric Power Co., Inc. 5,200 40,760Tokai Carbon Co. Ltd. (B) 2,200 30,367Tokio Marine Holdings, Inc. 7,300 335,962Tokyo Century Corp. 600 32,273Tokyo Electric Power Co. Holdings, Inc. (A) 8,400 24,975Tokyo Electron Ltd. 1,600 693,107Tokyo Gas Co. Ltd. 4,000 75,574Tokyo Tatemono Co. Ltd. (B) 2,200 31,397Tokyu Corp. 5,900 80,322Tokyu Fudosan Holdings Corp. 6,300 37,917Toppan, Inc. 3,600 57,897Toray Industries, Inc. 17,000 113,206Toshiba Corp. (B) 4,400 190,486
Shares ValueCOMMON STOCKS (continued)Japan (continued)Tosoh Corp. 3,400 $ 58,694TOTO Ltd. 1,700 88,071Toyo Seikan Group Holdings Ltd. 1,700 23,235Toyo Suisan Kaisha Ltd. 1,100 42,369Toyoda Gosei Co. Ltd. 800 19,713Toyota Boshoku Corp. 900 18,626Toyota Industries Corp. 2,100 181,827Toyota Motor Corp. 26,500 2,318,362Toyota Tsusho Corp. 2,500 118,254Trend Micro, Inc. 1,500 78,656Tsumura & Co. 700 22,043Tsuruha Holdings, Inc. 400 46,527Ube Industries Ltd. 1,100 22,289Unicharm Corp. (B) 4,600 185,260United Urban Investment Corp., REIT 32 46,332USS Co. Ltd. 2,300 40,160Welcia Holdings Co. Ltd. (B) 1,100 35,976West Japan Railway Co. 2,000 114,136Workman Co. Ltd. 200 14,019Yakult Honsha Co. Ltd. 1,700 96,342Yamada Holdings Co. Ltd. 8,200 37,901Yamaha Corp. 1,700 92,360Yamaha Motor Co. Ltd. (B) 3,300 89,792Yamato Holdings Co. Ltd. 3,800 108,190Yamazaki Baking Co. Ltd. (B) 1,900 26,808Yaskawa Electric Corp. 2,800 136,985Yokogawa Electric Corp. 2,500 37,391Yokohama Rubber Co. Ltd. (B) 1,400 30,008Z Holdings Corp. 27,900 139,965Zenkoku Hosho Co. Ltd. 500 21,511Zensho Holdings Co. Ltd. 1,000 25,705Zeon Corp. 2,000 27,696ZOZO, Inc. 1,000 34,012
48,061,444Jordan - 0.0% (D)Hikma Pharmaceuticals PLC 1,672 56,497Luxembourg - 0.3%ArcelorMittal SA 7,233 221,731Ardagh Group SA 194 4,757Aroundtown SA 12,481 97,392Eurofins Scientific SE (A) 1,271 145,302Millicom International Cellular SA, SDR (A) 971 38,467RTL Group SA (A) 387 23,062SES SA 3,992 30,497Shurgard Self Storage SA 259 12,501Tenaris SA 4,916 53,588
627,297Macau - 0.1%Sands China Ltd. (A) 25,200 106,111Wynn Macau Ltd. (A) 15,200 23,918
130,029Mexico - 0.0% (D)Fresnillo PLC 1,918 20,444Netherlands - 5.0%Adyen NV (A) (B) (C) 317 774,605Akzo Nobel NV 1,984 245,165ASML Holding NV 4,367 3,000,613
Copyright © 2021 www.secdatabase.com. All Rights Reserved.Please Consider the Environment Before Printing This Document

Page 35
Copyright © 2021 www.secdatabase.com. All Rights Reserved.Please Consider the Environment Before Printing This Document

DeltaShares® S&P International Managed Risk ETFSCHEDULE OF INVESTMENTS (continued)At June 30, 2021(unaudited)
Shares ValueCOMMON STOCKS (continued)Netherlands (continued)EXOR NV 1,179 $ 94,461Heineken Holding NV (B) 1,049 105,679Heineken NV (B) 2,459 298,028ING Groep NV 40,643 536,932JDE Peet�s NV (A) (B) 731 26,527Koninklijke Ahold Delhaize NV 10,886 323,646Koninklijke DSM NV 1,820 339,723Koninklijke KPN NV 36,753 114,804Koninklijke Philips NV 9,484 470,015NN Group NV 3,309 156,102Prosus NV 4,397 430,032QIAGEN NV (A) 2,403 116,155Royal Dutch Shell PLC, A Shares 42,696 853,357Royal Dutch Shell PLC, B Shares 38,583 745,674Stellantis NV 23,061 452,720Wolters Kluwer NV 2,785 279,807
9,364,045New Zealand - 0.4%a2 Milk Co. Ltd. (A) (B) 7,739 34,825Auckland International Airport Ltd. (A) 12,571 63,860Chorus Ltd. 4,654 20,813Contact Energy Ltd. 8,080 46,748Fisher & Paykel Healthcare Corp. Ltd. 6,001 130,492Fletcher Building Ltd. 8,581 45,090Genesis Energy Ltd. 5,323 12,646Goodman Property Trust, REIT 11,442 18,429Infratil Ltd. 7,526 40,493Mercury NZ Ltd. 6,524 30,406Meridian Energy Ltd. 13,070 48,677Precinct Properties New Zealand Ltd. 12,750 14,254Ryman Healthcare Ltd. 4,320 39,634Spark New Zealand Ltd. 19,438 65,195Trustpower Ltd. 717 4,053Xero Ltd. (A) 1,263 129,998
745,613Norway - 0.9%Adevinta ASA, B Shares (A) 2,424 46,479Aker ASA, A Shares 248 18,301Aker BP ASA 1,125 35,874Austevoll Seafood ASA 929 11,530DnB ASA 9,200 200,567Elkem ASA (A) (C) 3,129 11,388Entra ASA (C) 1,744 39,885Equinor ASA 11,192 236,945Gjensidige Forsikring ASA 1,978 43,628Kahoot! ASA (A) 3,029 20,768Kongsberg Gruppen ASA 937 24,129Leroy Seafood Group ASA 2,915 25,569LINK Mobility Group Holding ASA (A) 2,663 9,730Mowi ASA 4,684 119,207NEL ASA (A) (B) 8,496 19,825Nordic Semiconductor ASA (A) 1,806 45,794Norsk Hydro ASA 14,216 90,762Norwegian Finans Holding ASA 1,750 19,716Orkla ASA 8,445 86,067Salmar ASA 566 37,570Scatec ASA (C) 1,224 32,431
Shares ValueCOMMON STOCKS (continued)Norway (continued)Schibsted ASA, B Shares 1,040 $ 43,339Schibsted ASA, Class A 805 38,879SpareBank 1 SR-Bank ASA 1,917 25,329Storebrand ASA 4,870 44,143Telenor ASA 6,702 113,008TGS ASA 1,221 15,573Tomra Systems ASA 1,217 67,177Veidekke ASA 1,138 15,235Yara International ASA 1,786 94,061
1,632,909Poland - 0.0% (D)Allegro.eu SA (A) (C) 2,237 38,558Portugal - 0.1%EDP - Energias de Portugal SA 28,899 153,193Galp Energia SGPS SA 4,737 51,412Jeronimo Martins SGPS SA 2,555 46,601Navigator Co. SA (B) 2,316 7,916NOS SGPS SA 2,574 9,023
268,145Singapore - 1.7%Ascendas, REIT 34,200 75,056BOC Aviation Ltd. (C) 2,200 18,555CapitaLand Integrated Commercial Trust,REIT 47,200 73,388
CapitaLand Ltd. 26,000 71,760City Developments Ltd. 4,800 26,032ComfortDelGro Corp. Ltd. 21,000 25,621DBS Group Holdings Ltd. 18,600 412,488Genting Singapore Ltd. 59,000 36,650Jardine Cycle & Carriage Ltd. 1,000 15,890Keppel Corp. Ltd. 15,000 61,040Keppel, REIT 20,300 17,820Mapletree Commercial Trust, REIT 22,800 36,637Mapletree Industrial Trust, REIT 20,200 42,528Mapletree Logistics Trust, REIT 30,300 46,210Olam International Ltd. (B) 7,300 8,689Oversea-Chinese Banking Corp. Ltd. 42,000 373,382SATS Ltd. (A) (B) 7,000 20,466Sea Ltd., ADR (A) 3,825 1,050,345Sembcorp Industries Ltd. 9,300 14,806Singapore Airlines Ltd. (A) (B) 13,600 49,070Singapore Exchange Ltd. 8,600 71,528Singapore Technologies Engineering Ltd. 15,600 44,913Singapore Telecommunications Ltd. 72,200 123,001Suntec, REIT 22,500 24,438United Overseas Bank Ltd. 16,000 307,335UOL Group Ltd. 4,900 26,611Venture Corp. Ltd. 2,800 40,015Wilmar International Ltd. 29,500 98,758
3,213,032Spain - 2.4%ACS Actividades de Construccion yServicios SA 2,814 75,386
Aena SME SA (A) (C) 765 125,468Amadeus IT Group SA (A) 4,690 329,930Banco Bilbao Vizcaya Argentaria SA (A) 69,416 430,371Banco Santander SA (A) 180,524 689,242CaixaBank SA (B) 45,314 139,396Cellnex Telecom SA (B) (C) 5,658 360,452
Copyright © 2021 www.secdatabase.com. All Rights Reserved.Please Consider the Environment Before Printing This Document

The Notes to Financial Statements are an integral part of this report.Transamerica ETF Trust Semi-Annual Report 2021
Page 36
Copyright © 2021 www.secdatabase.com. All Rights Reserved.Please Consider the Environment Before Printing This Document
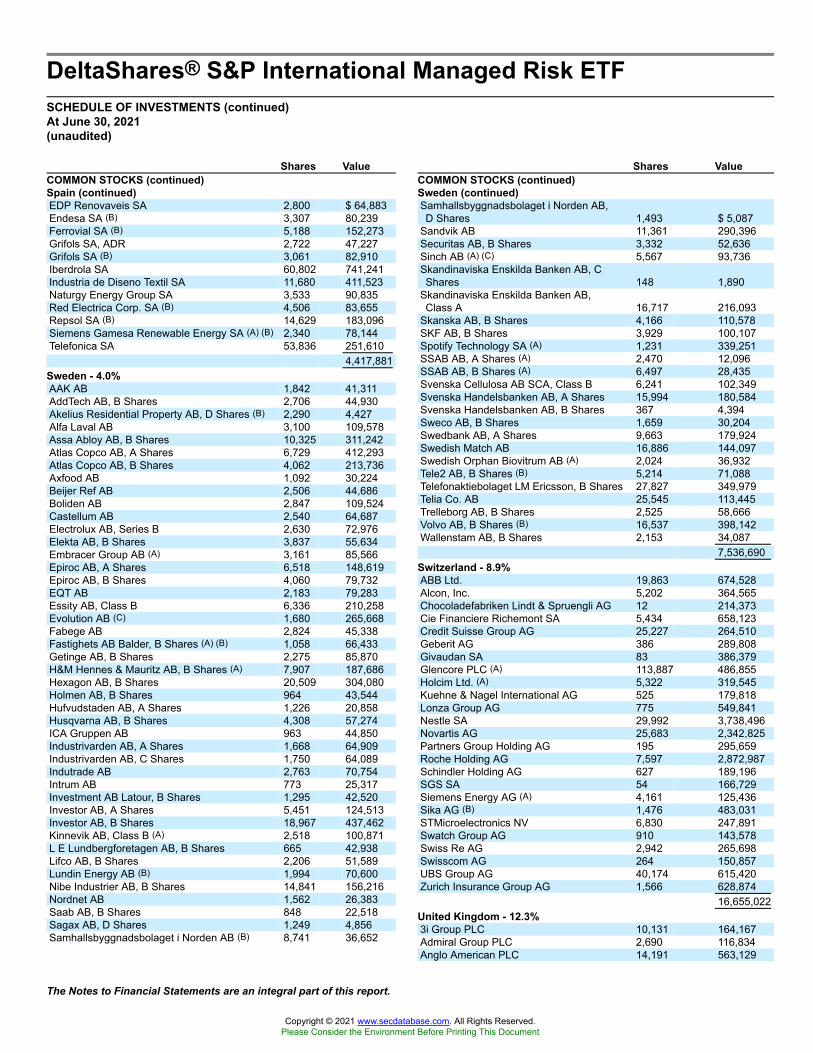
DeltaShares® S&P International Managed Risk ETFSCHEDULE OF INVESTMENTS (continued)At June 30, 2021(unaudited)
The Notes to Financial Statements are an integral part of this report.
Shares ValueCOMMON STOCKS (continued)Spain (continued)EDP Renovaveis SA 2,800 $ 64,883Endesa SA (B) 3,307 80,239Ferrovial SA (B) 5,188 152,273Grifols SA, ADR 2,722 47,227Grifols SA (B) 3,061 82,910Iberdrola SA 60,802 741,241Industria de Diseno Textil SA 11,680 411,523Naturgy Energy Group SA 3,533 90,835Red Electrica Corp. SA (B) 4,506 83,655Repsol SA (B) 14,629 183,096Siemens Gamesa Renewable Energy SA (A) (B) 2,340 78,144Telefonica SA 53,836 251,610
4,417,881Sweden - 4.0%AAK AB 1,842 41,311AddTech AB, B Shares 2,706 44,930Akelius Residential Property AB, D Shares (B) 2,290 4,427Alfa Laval AB 3,100 109,578Assa Abloy AB, B Shares 10,325 311,242Atlas Copco AB, A Shares 6,729 412,293Atlas Copco AB, B Shares 4,062 213,736Axfood AB 1,092 30,224Beijer Ref AB 2,506 44,686Boliden AB 2,847 109,524Castellum AB 2,540 64,687Electrolux AB, Series B 2,630 72,976Elekta AB, B Shares 3,837 55,634Embracer Group AB (A) 3,161 85,566Epiroc AB, A Shares 6,518 148,619Epiroc AB, B Shares 4,060 79,732EQT AB 2,183 79,283Essity AB, Class B 6,336 210,258Evolution AB (C) 1,680 265,668Fabege AB 2,824 45,338Fastighets AB Balder, B Shares (A) (B) 1,058 66,433Getinge AB, B Shares 2,275 85,870H&M Hennes & Mauritz AB, B Shares (A) 7,907 187,686Hexagon AB, B Shares 20,509 304,080Holmen AB, B Shares 964 43,544Hufvudstaden AB, A Shares 1,226 20,858Husqvarna AB, B Shares 4,308 57,274ICA Gruppen AB 963 44,850Industrivarden AB, A Shares 1,668 64,909Industrivarden AB, C Shares 1,750 64,089Indutrade AB 2,763 70,754Intrum AB 773 25,317Investment AB Latour, B Shares 1,295 42,520Investor AB, A Shares 5,451 124,513Investor AB, B Shares 18,967 437,462Kinnevik AB, Class B (A) 2,518 100,871L E Lundbergforetagen AB, B Shares 665 42,938Lifco AB, B Shares 2,206 51,589Lundin Energy AB (B) 1,994 70,600Nibe Industrier AB, B Shares 14,841 156,216Nordnet AB 1,562 26,383Saab AB, B Shares 848 22,518Sagax AB, D Shares 1,249 4,856Samhallsbyggnadsbolaget i Norden AB (B) 8,741 36,652
Shares ValueCOMMON STOCKS (continued)Sweden (continued)Samhallsbyggnadsbolaget i Norden AB,D Shares 1,493 $ 5,087
Sandvik AB 11,361 290,396Securitas AB, B Shares 3,332 52,636Sinch AB (A) (C) 5,567 93,736Skandinaviska Enskilda Banken AB, CShares 148 1,890
Skandinaviska Enskilda Banken AB,Class A 16,717 216,093
Skanska AB, B Shares 4,166 110,578SKF AB, B Shares 3,929 100,107Spotify Technology SA (A) 1,231 339,251SSAB AB, A Shares (A) 2,470 12,096SSAB AB, B Shares (A) 6,497 28,435Svenska Cellulosa AB SCA, Class B 6,241 102,349Svenska Handelsbanken AB, A Shares 15,994 180,584Svenska Handelsbanken AB, B Shares 367 4,394Sweco AB, B Shares 1,659 30,204Swedbank AB, A Shares 9,663 179,924Swedish Match AB 16,886 144,097Swedish Orphan Biovitrum AB (A) 2,024 36,932Tele2 AB, B Shares (B) 5,214 71,088Telefonaktiebolaget LM Ericsson, B Shares 27,827 349,979Telia Co. AB 25,545 113,445Trelleborg AB, B Shares 2,525 58,666Volvo AB, B Shares (B) 16,537 398,142Wallenstam AB, B Shares 2,153 34,087
7,536,690Switzerland - 8.9%ABB Ltd. 19,863 674,528Alcon, Inc. 5,202 364,565Chocoladefabriken Lindt & Spruengli AG 12 214,373Cie Financiere Richemont SA 5,434 658,123Credit Suisse Group AG 25,227 264,510Geberit AG 386 289,808Givaudan SA 83 386,379Glencore PLC (A) 113,887 486,855Holcim Ltd. (A) 5,322 319,545Kuehne & Nagel International AG 525 179,818Lonza Group AG 775 549,841Nestle SA 29,992 3,738,496Novartis AG 25,683 2,342,825Partners Group Holding AG 195 295,659Roche Holding AG 7,597 2,872,987Schindler Holding AG 627 189,196SGS SA 54 166,729Siemens Energy AG (A) 4,161 125,436Sika AG (B) 1,476 483,031STMicroelectronics NV 6,830 247,891Swatch Group AG 910 143,578Swiss Re AG 2,942 265,698Swisscom AG 264 150,857UBS Group AG 40,174 615,420Zurich Insurance Group AG 1,566 628,874
16,655,022United Kingdom - 12.3%3i Group PLC 10,131 164,167Admiral Group PLC 2,690 116,834Anglo American PLC 14,191 563,129
Copyright © 2021 www.secdatabase.com. All Rights Reserved.Please Consider the Environment Before Printing This Document

Transamerica ETF Trust Semi-Annual Report 2021Page 37
Copyright © 2021 www.secdatabase.com. All Rights Reserved.Please Consider the Environment Before Printing This Document

DeltaShares® S&P International Managed Risk ETFSCHEDULE OF INVESTMENTS (continued)At June 30, 2021(unaudited)
The Notes to Financial Statements are an integral part of this report.Transamerica ETF Trust Semi-Annual Report 2021
Shares ValueCOMMON STOCKS (continued)United Kingdom (continued)Ashtead Group PLC 4,678 $ 346,644Associated British Foods PLC 3,709 113,543AstraZeneca PLC 13,666 1,639,255Auto Trader Group PLC (A) (C) 10,088 88,271AVEVA Group PLC 1,254 64,235Aviva PLC 40,904 229,361B&M European Value Retail SA (B) 8,856 70,126BAE Systems PLC 33,571 242,086Barclays PLC 166,295 393,111Barratt Developments PLC 10,601 101,810Berkeley Group Holdings PLC 1,267 80,426BP PLC 209,259 910,605British American Tobacco PLC 23,784 919,980British Land Co. PLC, REIT 9,765 66,761BT Group PLC (A) 91,320 244,739Bunzl PLC 3,509 115,807Burberry Group PLC (A) 4,215 120,299CNH Industrial NV 10,369 171,230Coca-Cola Europacific Partners PLC 2,083 123,564Compass Group PLC (A) 18,587 390,804ConvaTec Group PLC (C) 16,772 55,746Croda International PLC 1,484 151,049Diageo PLC 24,271 1,160,445Direct Line Insurance Group PLC 14,084 55,451Dr. Martens PLC (A) 4,789 29,440DS Smith PLC 14,296 82,532Farfetch Ltd., Class A (A) 2,208 111,195Ferguson PLC 2,417 335,566GlaxoSmithKline PLC 52,148 1,022,534Halma PLC 3,952 146,970Hargreaves Lansdown PLC 2,864 62,868HSBC Holdings PLC 216,019 1,245,305Imperial Brands PLC 9,884 212,597Informa PLC (A) 15,648 108,431InterContinental Hotels Group PLC (A) 1,954 129,839Intertek Group PLC 1,680 128,342J Sainsbury PLC 18,161 68,191JD Sports Fashion PLC 5,155 65,445Johnson Matthey PLC 2,071 87,918Kingfisher PLC 21,980 110,678Land Securities Group PLC, REIT (B) 7,821 72,972Legal & General Group PLC 62,123 221,072Lloyds Banking Group PLC 738,666 476,439London Stock Exchange Group PLC 3,372 371,263M&G PLC 27,066 85,586Melrose Industries PLC 50,577 108,368Mondi PLC 5,055 132,751National Grid PLC 39,715 505,190Natwest Group PLC 55,167 154,860Next PLC (A) 1,384 150,201NMC Health PLC (A) (E) (F) (G) 1,067 0Ocado Group PLC (A) 6,314 174,711Pearson PLC 7,873 90,272Persimmon PLC 3,322 135,748Phoenix Group Holdings PLC 8,530 79,705Prudential PLC 27,230 516,668Reckitt Benckiser Group PLC 7,668 677,632RELX PLC 20,638 547,114
Shares ValueCOMMON STOCKS (continued)United Kingdom (continued)Rentokil Initial PLC 19,356 $ 132,360Rightmove PLC 9,115 81,772Rio Tinto PLC 11,243 923,978Rolls-Royce Holdings PLC (A) (B) 87,111 119,040Sage Group PLC 11,668 110,285Schroders PLC 1,294 62,798Segro PLC, REIT 12,480 188,697Severn Trent PLC 2,522 87,135Smith & Nephew PLC 9,212 198,842Smiths Group PLC 4,126 90,628Spirax-Sarco Engineering PLC 768 144,449SSE PLC 10,913 226,212St. James�s Place PLC 5,612 114,507Standard Chartered PLC 27,275 173,700Standard Life Aberdeen PLC 22,702 84,990Subsea 7 SA 2,374 22,804Taylor Wimpey PLC 37,957 83,347Tesco PLC 80,490 247,905THG PLC (A) 7,982 67,263Unilever PLC 27,372 1,599,681United Utilities Group PLC 7,099 95,559Vodafone Group PLC 278,996 467,668Weir Group PLC (A) 2,703 69,117Whitbread PLC (A) 2,097 90,441WM Morrison Supermarkets PLC 25,086 85,494WPP PLC 12,624 169,895
22,886,448United States - 0.1%Flex Ltd. (A) 5,109 91,298Uruguay - 0.0% (D)Globant SA (A) 396 86,795Total Common Stocks
(Cost $153,376,259) 184,176,727
PREFERRED STOCKS - 0.6%Germany - 0.6%Bayerische Motoren Werke AG,2.36% (H) 601 54,025
Henkel AG & Co. KGaA,2.13% (H) 1,855 195,874
Porsche Automobil Holding SE,2.41% (H) 1,594 170,810
Sartorius AG,0.17% (H) 355 184,817
Volkswagen AG,2.31% (H) 1,911 478,633
Total Preferred Stocks(Cost $792,560) 1,084,159
RIGHTS - 0.0% (D)Austria - 0.0%Buwog AG, (A) (E) (F) (G)Exercise Price EUR 29,Expiration Date 12/31/2099 152 0
Copyright © 2021 www.secdatabase.com. All Rights Reserved.Please Consider the Environment Before Printing This Document

Page 38
Copyright © 2021 www.secdatabase.com. All Rights Reserved.Please Consider the Environment Before Printing This Document

DeltaShares® S&P International Managed Risk ETFSCHEDULE OF INVESTMENTS (continued)At June 30, 2021(unaudited)
FUTURES CONTRACTS:
Long Futures Contracts
DescriptionNumber ofContracts
ExpirationDate
NotionalAmount Value
UnrealizedAppreciation
UnrealizedDepreciation
MSCI EAFE Index 12 09/17/2021 $ 1,414,701 $ 1,382,460 $ � $ (32,241 )
INVESTMENTS BY INDUSTRY:
IndustryPercentage of
Total Investments ValueBanks 8.1 % $ 15,557,775Pharmaceuticals 7.7 14,625,177Insurance 4.4 8,370,721Chemicals 3.4 6,568,859Automobiles 3.3 6,270,824Machinery 3.2 6,184,381Food Products 3.2 6,150,096Textiles, Apparel & Luxury Goods 3.2 6,044,855Metals & Mining 3.1 6,003,513Oil, Gas & Consumable Fuels 3.0 5,656,025Semiconductors & Semiconductor Equipment 2.8 5,439,908Capital Markets 2.4 4,647,516Health Care Equipment & Supplies 1.9 3,693,477Beverages 1.9 3,687,789Electrical Equipment 1.9 3,669,668Personal Products 1.9 3,655,155Electric Utilities 1.9 3,546,106IT Services 1.8 3,475,013Real Estate Management & Development 1.8 3,443,957Software 1.8 3,365,368Diversified Telecommunication Services 1.8 3,356,086Electronic Equipment, Instruments &
Components 1.6 3,131,012Industrial Conglomerates 1.6 3,002,472Entertainment 1.5 2,930,506Professional Services 1.5 2,849,333Food & Staples Retailing 1.4 2,663,826Trading Companies & Distributors 1.4 2,662,552Equity Real Estate Investment Trusts 1.4 2,643,415Household Durables 1.4 2,599,189Hotels, Restaurants & Leisure 1.3 2,444,830Wireless Telecommunication Services 1.2 2,240,390Building Products 1.1 2,154,271
Shares Value
RIGHTS (continued)Singapore - 0.0% (D)Olam International Ltd., (A)Exercise Price SGD 0.20,Expiration Date 07/19/2021 1,095 $ 285
Total Rights(Cost $0) 285
SHORT-TERM INVESTMENT COMPANY - 0.1%Money Market Fund - 0.1%State Street Institutional Treasury MoneyMarket Fund, 0.01% (H) 217,425 217,425
Total Short-Term Investment Company(Cost $217,425) 217,425
Shares Value
OTHER INVESTMENT COMPANY - 3.0%Securities Lending Collateral - 3.0%State Street Navigator SecuritiesLending Trust - Government MoneyMarket Portfolio, 0.02% (H) 5,568,549 $ 5,568,549
Total Other Investment Company(Cost $5,568,549) 5,568,549
Total Investments(Cost $159,954,793) 191,047,145
Net Other Assets (Liabilities) - (2.3)% (4,337,455 )
Net Assets - 100.0% $ 186,709,690
Copyright © 2021 www.secdatabase.com. All Rights Reserved.Please Consider the Environment Before Printing This Document

The Notes to Financial Statements are an integral part of this report.Transamerica ETF Trust Semi-Annual Report 2021
Page 39
Copyright © 2021 www.secdatabase.com. All Rights Reserved.Please Consider the Environment Before Printing This Document

DeltaShares® S&P International Managed Risk ETFSCHEDULE OF INVESTMENTS (continued)At June 30, 2021(unaudited)
INVESTMENTS BY INDUSTRY (continued):
IndustryPercentage of
Total Investments ValueAerospace & Defense 1.1 % $2,097,759Auto Components 1.0 1,859,394Specialty Retail 0.9 1,731,745Road & Rail 0.9 1,718,015Diversified Financial Services 0.9 1,678,782Biotechnology 0.8 1,591,997Multi-Utilities 0.8 1,577,626Internet & Direct Marketing Retail 0.8 1,534,190Tobacco 0.8 1,494,106Household Products 0.8 1,452,914Construction & Engineering 0.8 1,451,053Air Freight & Logistics 0.8 1,442,013Construction Materials 0.6 1,198,397Multiline Retail 0.6 1,070,127Life Sciences Tools & Services 0.6 1,050,464Health Care Providers & Services 0.5 909,476Transportation Infrastructure 0.4 842,916Gas Utilities 0.4 836,432Media 0.4 772,227Technology Hardware, Storage & Peripherals 0.4 756,657Commercial Services & Supplies 0.4 756,201Paper & Forest Products 0.4 673,989Communications Equipment 0.3 666,370Marine 0.3 624,725Interactive Media & Services 0.3 556,607Leisure Products 0.3 489,403Health Care Technology 0.2 426,501Containers & Packaging 0.2 341,884Airlines 0.1 282,224Independent Power & Renewable Electricity
Producers 0.1 246,661Money Market Fund 0.1 217,425Water Utilities 0.1 182,694Energy Equipment & Services 0.1 121,730Consumer Finance 0.0 (D) 40,453Distributors 0.0 (D) 31,459Diversified Consumer Services 0.0 (D) 19,915Investments 97.1 185,478,596Short-Term Investments 2.9 5,568,549Total Investments 100.0 % $ 191,047,145
INVESTMENT VALUATION:
Valuation Inputs (I)
Level 1 -Unadjusted
Quoted Prices
Level 2 -Other Significant
Observable Inputs
Level 3 -Significant
Unobservable Inputs (J) ValueASSETSInvestmentsCommon Stocks $ 3,145,858 $ 181,030,869 $ 0 $184,176,727Preferred Stocks � 1,084,159 � 1,084,159Rights � 285 0 285Short-Term Investment Company 217,425 � � 217,425Other Investment Company 5,568,549 � � 5,568,549Total Investments $ 8,931,832 $ 182,115,313 $ 0 $191,047,145
The Notes to Financial Statements are an integral part of this report.
Copyright © 2021 www.secdatabase.com. All Rights Reserved.Please Consider the Environment Before Printing This Document

Transamerica ETF Trust Semi-Annual Report 2021Page 40
Copyright © 2021 www.secdatabase.com. All Rights Reserved.Please Consider the Environment Before Printing This Document

DeltaShares® S&P International Managed Risk ETFSCHEDULE OF INVESTMENTS (continued)At June 30, 2021(unaudited)
INVESTMENT VALUATION (continued):
Valuation Inputs (continued) (I)
Level 1 -Unadjusted
Quoted Prices
Level 2 -Other Significant
Observable Inputs
Level 3 -Significant
Unobservable Inputs (J) ValueLIABILITIESOther Financial InstrumentsFutures Contracts (K) $ (32,241 ) $ � $ � $(32,241)Total Other Financial Instruments $ (32,241 ) $ �� $ �� $(32,241)
FOOTNOTES TO SCHEDULE OF INVESTMENTS:
(A) Non-income producing securities.(B) All or a portion of the securities are on loan. The total value of all securities on loan is $11,289,080, collateralized by cash collateral of $5,568,549
and non-cash collateral, such as U.S. government securities and irrevocable letters of credit, of $6,296,385. The amount of securities on loanindicated may not correspond with the securities on loan identified because securities with pending sales are in the process of recall from thebrokers.
(C) Securities are exempt from registration pursuant to Rule 144A of the Securities Act of 1933. Securities may be resold as transactions exempt fromregistration, normally to qualified institutional buyers. At June 30, 2021, the total value of 144A securities is $3,538,030, representing 1.9% of theFund�s net assets.
(D) Percentage rounds to less than 0.1% or (0.1)%.(E) Securities deemed worthless.(F) Securities are Level 3 of the fair value hierarchy.(G) Fair valued as determined in good faith in accordance with procedures established by the Board. At June 30, 2021, the total value of securities is $0,
representing 0.00% of the Fund�s net assets.(H) Rates disclosed reflect the yields at June 30, 2021.(I) There were no transfers in or out of Level 3 during the six-month period ended June 30, 2021. Please reference the Investment Valuation section of
the Notes to Financial Statements for more information regarding investment valuation and pricing inputs.(J) Level 3 securities were not considered significant to the Fund.(K) Derivative instruments are valued at unrealized appreciation (depreciation).
CURRENCY ABBREVIATIONS:
EUR EuroSGD Singapore Dollar
PORTFOLIO ABBREVIATIONS:
ADR American Depositary ReceiptCDI CHESS Depositary InterestsCVA Commanditaire Vennootschap op Aandelen (Dutch Certificate)EAFE Europe, Australasia and Far EastJ-REIT Japan-Real Estate Investment TrustREIT Real Estate Investment TrustSDR Swedish Depositary Receipt
The Notes to Financial Statements are an integral part of this report.Transamerica ETF Trust Semi-Annual Report 2021
Page 41
Copyright © 2021 www.secdatabase.com. All Rights Reserved.Please Consider the Environment Before Printing This Document

STATEMENTS OF ASSETS AND LIABILITIESAt June 30, 2021(unaudited)
DeltaShares®S&P 400
Managed Risk ETF
DeltaShares®S&P 500
Managed Risk ETF
DeltaShares®S&P 600
Managed Risk ETF
DeltaShares®S&P EM 100 &
ManagedRisk ETF
DeltaShares®S&P International
Managed RiskETF
Assets:Investments, at value (A) (B) $ 100,508,706 $ 411,721,398 $ 46,376,529 $55,202,251 $ 191,047,145Cash collateral pledged at broker for:
Futures contracts 13,500 33,000 6,500 25,758 85,536Foreign currency, at value (C) � � � 188,278 575,536Receivables and other assets:
Investments sold 6,995,644 2,180,069 14,419,513 � 1,152Net income from securities lending 306 1,766 467 272 5,273Dividends 72,587 239,589 27,838 113,925 246,588Interest 4 5 343 3 2Tax reclaims � � � 120 390,247Variation margin receivable on futures
contracts 3,766 24,409 2,043 9,374 13,091Total assets 107,594,513 414,200,236 60,833,233 55,539,981 192,364,570
Liabilities:Cash collateral received upon return of:
Securities on loan 415,081 58,118 572,196 515,003 5,568,549Payables and other liabilities:
Investments purchased � � 14,440,380 � �When-issued, delayed-delivery, forward
and TBA commitments purchased 6,995,284 � � � �Shares of beneficial interest redeemed � 2,182,845 � � �Investment management fees 40,965 129,174 19,048 29,519 86,331
Total liabilities 7,451,330 2,370,137 15,031,624 544,522 5,654,880Net assets $ 100,143,183 $ 411,830,099 $ 45,801,609 $54,995,459 $ 186,709,690
Net assets consist of:Paid-in capital $ 93,374,551 $ 321,075,535 $ 46,216,971 $45,472,846 $ 182,368,916Total distributable earnings (accumulated
losses) 6,768,632 90,754,564 (415,362 ) 9,522,613 4,340,774Net assets $ 100,143,183 $ 411,830,099 $ 45,801,609 $ 54,995,459 $ 186,709,690Shares outstanding 1,700,000 5,660,000 790,000 900,000 3,550,000Net asset value per share $ 58.91 $ 72.76 $ 57.98 $61.11 $ 52.59
(A) Investments, at cost $ 83,000,679 $ 322,690,756 $ 38,846,337 $43,891,419 $ 159,954,793(B) Securities on loan, at value $ 3,549,310 $ 229,098 $ 1,316,372 $1,037,685 $ 11,289,080(C) Foreign currency, at cost $ � $ � $ � $187,924 $ 578,517
The Notes to Financial Statements are an integral part of this report.Transamerica ETF Trust Semi-Annual Report 2021
Page 42
Copyright © 2021 www.secdatabase.com. All Rights Reserved.Please Consider the Environment Before Printing This Document
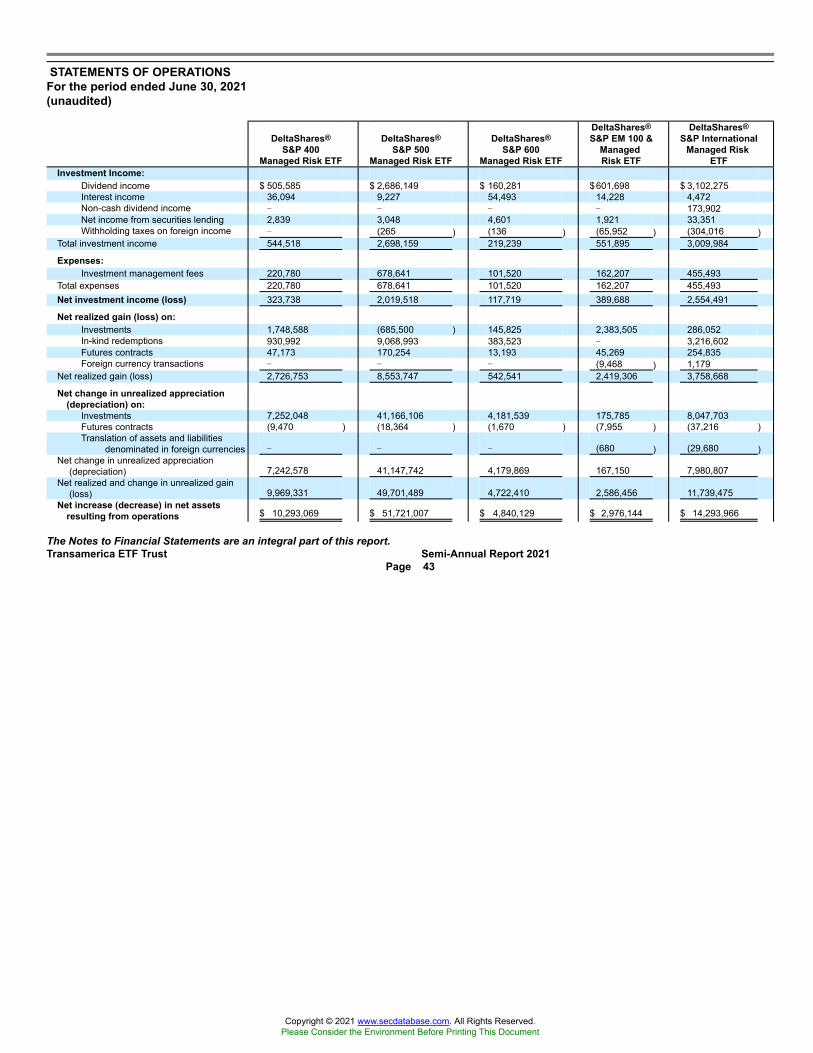
STATEMENTS OF OPERATIONSFor the period ended June 30, 2021(unaudited)
DeltaShares®S&P 400
Managed Risk ETF
DeltaShares®S&P 500
Managed Risk ETF
DeltaShares®S&P 600
Managed Risk ETF
DeltaShares®S&P EM 100 &
ManagedRisk ETF
DeltaShares®S&P International
Managed RiskETF
Investment Income:Dividend income $ 505,585 $ 2,686,149 $ 160,281 $601,698 $ 3,102,275Interest income 36,094 9,227 54,493 14,228 4,472Non-cash dividend income � � � � 173,902Net income from securities lending 2,839 3,048 4,601 1,921 33,351Withholding taxes on foreign income � (265 ) (136 ) (65,952 ) (304,016 )
Total investment income 544,518 2,698,159 219,239 551,895 3,009,984
Expenses:Investment management fees 220,780 678,641 101,520 162,207 455,493
Total expenses 220,780 678,641 101,520 162,207 455,493Net investment income (loss) 323,738 2,019,518 117,719 389,688 2,554,491
Net realized gain (loss) on:Investments 1,748,588 (685,500 ) 145,825 2,383,505 286,052In-kind redemptions 930,992 9,068,993 383,523 � 3,216,602Futures contracts 47,173 170,254 13,193 45,269 254,835Foreign currency transactions � � � (9,468 ) 1,179
Net realized gain (loss) 2,726,753 8,553,747 542,541 2,419,306 3,758,668
Net change in unrealized appreciation(depreciation) on:
Investments 7,252,048 41,166,106 4,181,539 175,785 8,047,703Futures contracts (9,470 ) (18,364 ) (1,670 ) (7,955 ) (37,216 )Translation of assets and liabilities
denominated in foreign currencies � � � (680 ) (29,680 )Net change in unrealized appreciation
(depreciation) 7,242,578 41,147,742 4,179,869 167,150 7,980,807Net realized and change in unrealized gain
(loss) 9,969,331 49,701,489 4,722,410 2,586,456 11,739,475Net increase (decrease) in net assets
resulting from operations $ 10,293,069 $ 51,721,007 $ 4,840,129 $ 2,976,144 $ 14,293,966
The Notes to Financial Statements are an integral part of this report.Transamerica ETF Trust Semi-Annual Report 2021
Page 43
Copyright © 2021 www.secdatabase.com. All Rights Reserved.Please Consider the Environment Before Printing This Document

STATEMENTS OF CHANGES IN NET ASSETSFor the periods and years ended:
DeltaShares® S&P 400Managed Risk ETF
DeltaShares® S&P 500Managed Risk ETF
DeltaShares® S&P 600Managed Risk ETF
June 30, 2021(unaudited)
December 31,2020
June 30, 2021(unaudited)
December 31,2020
June 30, 2021(unaudited)
December 31,2020
From operations:Net investment income (loss) $323,738 $390,659 $2,019,518 $3,314,233 $117,719 $103,415Net realized gain (loss) 2,726,753 (3,723,088 ) 8,553,747 29,165,440 542,541 (3,034,511 )Net change in unrealized appreciation (depreciation) 7,242,578 1,231,737 41,147,742 (16,660,483 ) 4,179,869 566,193
Net increase (decrease) in net assets resulting from operations 10,293,069 (2,100,692 ) 51,721,007 15,819,190 4,840,129 (2,364,903 )
Dividends and/or distributions to shareholders:Dividends and/or distributions to shareholders (261,003 ) (407,034 ) (2,010,004 ) (3,348,511 ) (110,001 ) (109,028 )
Net increase (decrease) in net assets resulting from dividends and/ordistributions to shareholders (261,003 ) (407,034 ) (2,010,004 ) (3,348,511 ) (110,001 ) (109,028 )
Capital share transactions:Proceeds from shares sold � 1,591,684 � 71,220,778 5,236,571 1,553,925Cost of shares redeemed (2,812,931 ) (3,924,593 ) (24,643,712 ) (125,014,760 ) (1,150,894 ) (3,801,091 )
Net increase (decrease) in net assets resulting from capital sharetransactions (2,812,931 ) (2,332,909 ) (24,643,712 ) (53,793,982 ) 4,085,677 (2,247,166 )
Net increase (decrease) in net assets 7,219,135 (4,840,635 ) 25,067,291 (41,323,303 ) 8,815,805 (4,721,097 )
Net assets:Beginning of period/year 92,924,048 97,764,683 386,762,808 428,086,111 36,985,804 41,706,901End of period/year $ 100,143,183 $ 92,924,048 $ 411,830,099 $ 386,762,808 $ 45,801,609 $ 36,985,804
Capital share transactions - shares:Shares issued � 30,000 � 1,200,000 100,000 30,000Shares redeemed (50,000 ) (80,000 ) (380,000 ) (2,110,000 ) (20,000 ) (70,000 )
Net increase (decrease) in shares outstanding (50,000 ) (50,000 ) (380,000 ) (910,000 ) 80,000 (40,000 )
The Notes to Financial Statements are an integral part of this report.Transamerica ETF Trust Semi-Annual Report 2021
Page 44
Copyright © 2021 www.secdatabase.com. All Rights Reserved.Please Consider the Environment Before Printing This Document

STATEMENTS OF CHANGES IN NET ASSETS (continued)For the periods and years ended:
DeltaShares® S&P EM 100 &Managed Risk ETF
DeltaShares® S&P InternationalManaged Risk ETF
June 30, 2021(unaudited)
December 31,2020
June 30, 2021(unaudited)
December 31,2020
From operations:Net investment income (loss) $389,688 $312,826 $2,554,491 $1,402,374Net realized gain (loss) 2,419,306 (1,676,930 ) 3,758,668 (17,903,976 )Net change in unrealized appreciation (depreciation) 167,150 7,462,241 7,980,807 8,107,345
Net increase (decrease) in net assets resulting from operations 2,976,144 6,098,137 14,293,966 (8,394,257 )
Dividends and/or distributions to shareholders:Dividends and/or distributions to shareholders (440,001 ) (421,586 ) (2,600,006 ) (1,169,430 )
Net increase (decrease) in net assets resulting from dividends and/or distributions toshareholders (440,001 ) (421,586 ) (2,600,006 ) (1,169,430 )
Capital share transactions:Proceeds from shares sold � � � 2,194,268Cost of shares redeemed � � (9,929,234 ) (7,445,558 )
Net increase (decrease) in net assets resulting from capital share transactions � � (9,929,234 ) (5,251,290 )Net increase (decrease) in net assets 2,536,143 5,676,551 1,764,726 (14,814,977 )
Net assets:Beginning of period/year 52,459,316 46,782,765 184,944,964 199,759,941End of period/year $ 54,995,459 $ 52,459,316 $ 186,709,690 $ 184,944,964
Capital share transactions - shares:Shares issued � � � 50,000Shares redeemed � � (200,000 ) (150,000 )
Net increase (decrease) in shares outstanding � � (200,000 ) (100,000 )
The Notes to Financial Statements are an integral part of this report.Transamerica ETF Trust Semi-Annual Report 2021
Page 45
Copyright © 2021 www.secdatabase.com. All Rights Reserved.Please Consider the Environment Before Printing This Document

FINANCIAL HIGHLIGHTS
For a share outstanding during the periodsand years indicated: DeltaShares® S&P 400 Managed Risk ETF
June 30, 2021(unaudited)
December 31,2020
December 31,2019
December 31,2018
December 31,2017 (A)
Net asset value, beginning ofperiod/year $ 53.10 $ 54.31 $ 48.30 $ 53.88 $ 50.00
Investment operations:Net investment income (loss) (B) 0.19 0.22 0.67 0.66 0.27Net realized and unrealized gain
(loss) 5.77 (1.20 ) 6.03 (5.58 ) 3.94Total investment operations 5.96 (0.98 ) 6.70 (4.92 ) 4.21
Dividends and/or distributions toshareholders:
Net investment income (0.15 ) (0.23 ) (0.69 ) (0.66 ) (0.27 )Net realized gains � � � � (0.06 )Total dividends and/or distributions to
shareholders (0.15 ) (0.23 ) (0.69 ) (0.66 ) (0.33 )Net asset value, end of period/year $ 58.91 $ 53.10 $ 54.31 $ 48.30 $ 53.88Total return 11.24 %(C) (1.77 )% 13.95 % (9.19 )% 8.42 %(C)
Ratio and supplemental data:Net assets end of period/year
(000�s) $ 100,143 $ 92,924 $ 97,765 $ 103,844 $ 131,994Expenses to average net assets 0.45 %(D)(E) 0.45 %(D) 0.45 %(D) 0.45 % 0.45 %(E)Net investment income (loss) to
average net assets 0.66 %(E) 0.44 % 1.30 % 1.23 % 1.25 %(E)Portfolio turnover rate (F) 135 %(C) 821 % 511 % 435 % 6 %(C)
(A) Commenced operations on July 31, 2017.(B) Calculated based on average number of shares outstanding.(C) Not annualized.(D) Does not include expenses of the underlying investments in which the Fund invests.(E) Annualized.(F) Excludes investment securities received or delivered as a result of processing in-kind issuances or redemptions of capital share transactions in creation units.
For a share outstanding during the periodsand years indicated: DeltaShares® S&P 500 Managed Risk ETF
June 30, 2021(unaudited)
December 31,2020
December 31,2019
December 31,2018
December 31,2017 (A)
Net asset value, beginning ofperiod/year $ 64.03 $ 61.60 $ 51.23 $ 54.10 $ 50.00
Investment operations:Net investment income (loss) (B) 0.35 0.50 0.94 0.91 0.36Net realized and unrealized gain
(loss) 8.73 2.44 10.41 (2.86 ) 4.09Total investment operations 9.08 2.94 11.35 (1.95 ) 4.45
Dividends and/or distributions toshareholders:
Net investment income (0.35 ) (0.51 ) (0.98 ) (0.91 ) (0.34 )Net realized gains � � � (0.01 ) (0.01 )Total dividends and/or distributions to
shareholders (0.35 ) (0.51 ) (0.98 ) (0.92 ) (0.35 )Net asset value, end of period/year $ 72.76 $ 64.03 $ 61.60 $ 51.23 $ 54.10Total return 14.22 %(C) 4.88 % 22.30 % (3.68 )% 8.94 %(C)
Ratio and supplemental data:Net assets end of period/year
(000�s) $ 411,830 $ 386,763 $ 428,086 $ 386,758 $ 419,310Expenses to average net assets 0.35 %(D)(E) 0.35 %(D) 0.35 %(D) 0.35 % 0.35 %(E)Net investment income (loss) to
average net assets 1.04 %(E) 0.84 % 1.66 % 1.65 % 1.64 %(E)Portfolio turnover rate (F) 35 %(C) 689 % 300 % 430 % 2 %(C)
(A) Commenced operations on July 31, 2017.(B) Calculated based on average number of shares outstanding.(C) Not annualized.(D) Does not include expenses of the underlying investments in which the Fund invests.(E) Annualized.(F) Excludes investment securities received or delivered as a result of processing in-kind issuances or redemptions of capital share transactions in creation units.
The Notes to Financial Statements are an integral part of this report.Transamerica ETF Trust Semi-Annual Report 2021
Page 46
Copyright © 2021 www.secdatabase.com. All Rights Reserved.Please Consider the Environment Before Printing This Document

FINANCIAL HIGHLIGHTS (continued)
For a share outstanding during the periodsand years indicated: DeltaShares® S&P 600 Managed Risk ETF
June 30, 2021(unaudited)
December 31,2020
December 31,2019
December 31,2018
December 31,2017 (A)
Net asset value, beginning ofperiod/year $ 52.09 $ 55.61 $ 50.34 $ 53.94 $ 50.00
Investment operations:Net investment income (loss) (B) 0.15 0.15 0.64 0.59 0.24Net realized and unrealized gain
(loss) 5.88 (3.51 ) 5.30 (3.52 ) 4.09Total investment operations 6.03 (3.36 ) 5.94 (2.93 ) 4.33
Dividends and/or distributions toshareholders:
Net investment income (0.14 ) (0.16 ) (0.67 ) (0.64 ) (0.24 )Net realized gains � � � (0.03 ) (0.15 )Total dividends and/or distributions to
shareholders (0.14 ) (0.16 ) (0.67 ) (0.67 ) (0.39 )Net asset value, end of period/year $ 57.98 $ 52.09 $ 55.61 $ 50.34 $ 53.94Total return 11.55 %(C) (6.02 )% 11.85 % (5.47 )% 8.65 %(C)
Ratio and supplemental data:Net assets end of period/year (000�s) $ 45,802 $ 36,986 $ 41,707 $ 40,274 $ 59,331Expenses to average net assets 0.45 %(D)(E) 0.45 %(D) 0.45 %(D) 0.45 % 0.45 %(E)Net investment income (loss) to
average net assets 0.52 %(E) 0.30 % 1.21 % 1.07 % 1.12 %(E)Portfolio turnover rate (F) 266 %(C) 894 % 584 % 448 % 21 %(C)
(A) Commenced operations on July 31, 2017.(B) Calculated based on average number of shares outstanding.(C) Not annualized.(D) Does not include expenses of the underlying investments in which the Fund invests.(E) Annualized.(F) Excludes investment securities received or delivered as a result of processing in-kind issuances or redemptions of capital share transactions in creation units.
For a share outstanding during the periods and year indicated: DeltaShares® S&P EM 100 & Managed Risk ETFJune 30, 2021(unaudited)
December 31,2020
December 31,2019 (A)
Net asset value, beginning of period/year $ 58.29 $ 51.98 $ 50.14
Investment operations:Net investment income (loss) (B) 0.43 0.35 1.18Net realized and unrealized gain (loss) 2.88 6.43 1.75Total investment operations 3.31 6.78 2.93
Dividends and/or distributions to shareholders:Net investment income (0.49 ) (0.47 ) (1.09 )Net asset value, end of period/year $ 61.11 $ 58.29 $ 51.98Total return 5.70 %(C) 13.20 % 5.85 %(C)
Ratio and supplemental data:Net assets end of period/year (000�s) $ 54,995 $ 52,459 $ 46,783Expenses to average net assets (D) 0.60 %(E) 0.60 % 0.60 %(E)Net investment income (loss) to average net assets 1.44 %(E) 0.70 % 3.10 %(E)Portfolio turnover rate 180 %(C) 647 % 274 %(C)(F)
(A) Commenced operations on March 20, 2019.(B) Calculated based on average number of shares outstanding.(C) Not annualized.(D) Does not include expenses of the underlying investments in which the Fund invests.(E) Annualized.(F) Excludes investment securities received or delivered as a result of processing in-kind issuances or redemptions of capital share transactions in creation units.
The Notes to Financial Statements are an integral part of this report.Transamerica ETF Trust Semi-Annual Report 2021
Page 47
Copyright © 2021 www.secdatabase.com. All Rights Reserved.Please Consider the Environment Before Printing This Document

FINANCIAL HIGHLIGHTS (continued)
For a share outstanding during the periodsand years indicated: DeltaShares® S&P International Managed Risk ETF
June 30, 2021(unaudited)
December 31,2020
December 31,2019
December 31,2018
December 31,2017 (A)
Net asset value, beginning ofperiod/year $ 49.32 $ 51.89 $ 44.93 $ 53.13 $ 50.00
Investment operations:Net investment income (loss) (B) 0.72 0.37 1.38 1.33 0.32Net realized and unrealized gain
(loss) 3.28 (2.63 ) 7.12 (8.15 ) 3.16Total investment operations 4.00 (2.26 ) 8.50 (6.82 ) 3.48
Dividends and/or distributions toshareholders:
Net investment income (0.73 ) (0.31 ) (1.54 ) (1.37 ) (0.34 )Net realized gains � � � (0.01 ) (0.01 )Total dividends and/or distributions to
shareholders (0.73 ) (0.31 ) (1.54 ) (1.38 ) (0.35 )Net asset value, end of period/year $ 52.59 $ 49.32 $ 51.89 $ 44.93 $ 53.13Total return 8.16 %(C) (4.25 )% 19.12 % (13.09 )% 6.97 %(C)
Ratio and supplemental data:Net assets end of period/year
(000�s) $ 186,710 $ 184,945 $ 199,760 $ 202,190 $ 244,408Expenses to average net assets 0.50 %(D)(E) 0.50 %(D) 0.50 %(D) 0.50 % 0.50 %(E)Net investment income (loss) to
average net assets 2.80 %(E) 0.81 % 2.85 % 2.60 % 1.47 %(E)Portfolio turnover rate (F) 25 %(C) 690 % 85 % 189 % 3 %(C)
(A) Commenced operations on July 31, 2017.(B) Calculated based on average number of shares outstanding.(C) Not annualized.(D) Does not include expenses of the underlying investments in which the Fund invests.(E) Annualized.(F) Excludes investment securities received or delivered as a result of processing in-kind issuances or redemptions of capital share transactions in creation units.
The Notes to Financial Statements are an integral part of this report.Transamerica ETF Trust Semi-Annual Report 2021
Page 48
Copyright © 2021 www.secdatabase.com. All Rights Reserved.Please Consider the Environment Before Printing This Document

NOTES TO FINANCIAL STATEMENTSAt June 30, 2021(unaudited)
1. ORGANIZATION
Transamerica ETF Trust (the �Trust�) is an open-end management investment company registered under the Investment Company Actof 1940, as amended (the �1940 Act�), and was organized as a Delaware statutory trust on May 5, 2016. The Trust applies investmentcompany accounting and reporting guidance. The funds covered by this report (each, a �Fund� and collectively, the �Funds�) are each aseries of the Trust and are as follows:
FundDeltaShares® S&P 400 Managed Risk ETF (�S&P 400 Managed Risk�)DeltaShares® S&P 500 Managed Risk ETF (�S&P 500 Managed Risk�)DeltaShares® S&P 600 Managed Risk ETF (�S&P 600 Managed Risk�)DeltaShares® S&P EM 100 & Managed Risk ETF (�S&P EM 100 & Managed Risk�)DeltaShares® S&P International Managed Risk ETF (�S&P International Managed Risk�)
Each Fund is classified as a �non-diversified� investment company under the 1940 Act.
The investment objective of each Fund is to seek to track the investment results, before fees and expenses, of the respective index listedbelow (each, an �Underlying Index�). Each Fund uses a �passive� or indexing approach to try to achieve its investment objective.
Fund Underlying IndexS&P 400 Managed Risk S&P 400® Managed Risk 2.0 IndexS&P 500 Managed Risk S&P 500® Managed Risk 2.0 IndexS&P 600 Managed Risk S&P 600® Managed Risk 2.0 IndexS&P EM 100 & Managed Risk S&P EM 100 Managed Risk 2.0 IndexS&P International Managed Risk S&P EPAC Ex. Korea LargeMidCap Managed Risk 2.0 Index
This report must be accompanied or preceded by each Fund�s current prospectus, which contains additional information about theFunds, including risks, as well as investment objectives and strategies.
Transamerica Asset Management, Inc. (�TAM�) serves as investment manager for the Funds pursuant to an investment managementagreement. TAM provides continuous and regular investment management services to the Funds. TAM supervises each Fund�sinvestments, conducts its investment program and provides supervisory, compliance and administrative services to the Funds.
TAM currently acts as a �manager of managers� and has hired Milliman Financial Risk Management LLC as the sub-adviser to furnishday-to-day investment advice and recommendations. TAM may, in the future, determine to provide all aspects of the day-to-daymanagement of a Fund without the use of a sub-adviser. When acting as a manager of managers, TAM provides investmentmanagement services that include, without limitation, the design and development of the Funds and their investment strategies and theongoing review and evaluation of those investment strategies including recommending changes in strategy where it believes appropriateor advisable; the selection of one or more sub-advisers for the Funds employing a combination of quantitative and qualitative screens,research, analysis and due diligence; negotiation of sub-advisory agreements and fees; oversight and monitoring of sub-advisers andrecommending changes to sub-advisers where it believes appropriate or advisable; recommending fund combinations and liquidationswhere it believes appropriate or advisable; selection and oversight of transition managers, as needed; regular supervision of the Funds�investments; regular review and evaluation of sub-adviser performance; daily monitoring of the sub-advisers� buying and selling ofsecurities for the Funds; regular review of holdings; ongoing trade oversight and analysis; regular monitoring to ensure adherence toinvestment process; regular calls and periodic on-site visits with sub-advisers; risk management oversight and analysis; oversight ofnegotiation of investment documentation and agreements; design, development, implementation and regular monitoring of the valuationprocess; periodic due diligence reviews of pricing vendors and vendor methodology; design, development, implementation and regularmonitoring of the compliance process; respond to regulatory inquiries and determine appropriate litigation strategy, as needed; review ofproxies voted by sub-advisers; oversight of preparation and review of materials for meetings of the Funds� Board of Trustees (the�Board�), participation in these meetings and preparation of regular communications with the Board; oversight of preparation and reviewof prospectuses, shareholder reports and other disclosure materials and regulatory filings for the Funds; oversight of other serviceproviders to the Funds, such as the custodian, the transfer agent, the Funds� independent accounting firm and legal counsel; workingwith the authorized participants for the ETFs, the index providers and the listing stock exchange; supervision of the performance ofrecordkeeping and shareholder relations functions for the Funds; and oversight of cash management services. TAM uses a variety ofquantitative and qualitative tools to carry out its investment management services. TAM, not the Funds, is responsible for paying thesub-adviser(s) for their services, and sub-advisory fees are TAM�s expense.
Transamerica ETF Trust Semi-Annual Report 2021Page 49
Copyright © 2021 www.secdatabase.com. All Rights Reserved.Please Consider the Environment Before Printing This Document

NOTES TO FINANCIAL STATEMENTS (continued)At June 30, 2021(unaudited)
1. ORGANIZATION (continued)
TAM�s investment management services also include the provision of supervisory and administrative services to the Funds. Theseservices include performing certain administrative services for the Funds and supervising and overseeing the administrative, clerical,recordkeeping and bookkeeping services provided to the Funds by State Street Bank and Trust Company (�State Street�), to whom TAMhas outsourced the provision of certain services as described below: to the extent agreed upon by TAM and the Funds from time to time,monitoring and verifying the custodian�s daily calculation of the Net Asset Values (�NAV�); shareholder relations functions; complianceservices; valuation services; assisting in due diligence and in the oversight and monitoring of certain activities of sub-advisers and certainaspects of Fund investments; assisting with Fund combinations and liquidations; oversight of the preparation and filing, and review, of allreturns and reports, in connection with federal, state and local taxes; oversight and review of regulatory reporting; supervising andcoordinating the Funds� custodian and dividend disbursing agent and monitoring their services to the Funds; assisting the Funds inpreparing reports to shareholders; acting as liaison with the Funds� independent public accountants and providing, upon request,analyses, fiscal year summaries and other audit related services; assisting in the preparation of agendas and supporting documents forand minutes of meetings of trustees and committees of trustees; assisting in the preparation of regular communications with the trustees;and providing personnel and office space, telephones and other office equipment as necessary in order for TAM to perform supervisoryand administrative services to the Funds.
2. SIGNIFICANT ACCOUNTING POLICIES
In preparing the Funds� financial statements in accordance with Generally Accepted Accounting Principles in the United States ofAmerica (�GAAP�), estimates or assumptions (which could differ from actual results) may be used that affect reported amounts anddisclosures. The following is a summary of significant accounting policies followed by the Funds.
Foreign currency denominated investments: The accounting records of the Funds are maintained in U.S. dollars. Securities and otherassets and liabilities denominated in foreign currencies are translated into U.S. dollars based on the closing exchange rate each day. Thecost of foreign securities purchased and any realized gains or losses are translated at the prevailing exchange rates in effect on the dateof the respective transaction. The Fund combines fluctuations from currency exchange rates and fluctuations in value when computingnet realized and unrealized gains or losses from investments.
Net foreign currency gains and losses resulting from changes in exchange rates include, foreign currency fluctuations between trade dateand settlement date of investment security transactions, gains and losses on forward foreign currency contracts, and the differencebetween the receivable amounts of interest and dividends recorded in the accounting records in U.S. dollars and the amounts actuallyreceived.
Foreign currency denominated assets may involve risks not typically associated with domestic transactions. These risks includerevaluation of currencies, adverse fluctuations in foreign currency values, and possible adverse political, social, and economicdevelopments, including those particular to a specific industry, country or region.
Security transactions and investment income: Security transactions are accounted for on the trade date. Security gains and lossesare calculated on the specific identification basis. Dividend income, if any, is recorded on the ex-dividend date or, in the case of foreignsecurities, as soon as the Funds are informed of the ex-dividend dates, net of foreign taxes. Non-cash dividends, if any, are recorded onthe ex-dividend date at fair value. Interest income, if any, is recorded on the accrual basis from settlement date, net of foreign taxes.Fixed income premiums and discounts are amortized and/or accreted over the lives of the respective securities.
Distributions to shareholders: Distributions are recorded on the ex-dividend date and are determined in accordance with federalincome tax regulations, which may differ from GAAP.
Foreign taxes: The Funds may be subject to taxes imposed by the countries in which they invest, with respect to their investments inissuers existing or operating in such countries. The Funds may also be subject to foreign taxes on income, gains on investments, orcurrency repatriation, a portion of which may be recoverable. The Funds accrue such taxes and recoveries as applicable when therelated income or capital gains are earned or unrealized, and based upon the current interpretation of tax rules and regulations that existin the markets in which the Funds invest. Some countries require governmental approval for the repatriation of investment income,capital, or the proceeds of sales earned by foreign investors. In addition, if there is deterioration in a country�s balance of payments or forother reasons, a country may impose temporary restrictions of foreign capital remittances abroad.
Indemnification: In the normal course of business, the Funds enter into contracts that contain a variety of representations that providegeneral indemnifications. The Funds� maximum exposure under these arrangements is unknown, as this would involve future claims thatmay be made against the Funds and/or their affiliates that have not yet occurred. However, based on experience, the Funds expect therisk of loss to be remote.
Transamerica ETF Trust Semi-Annual Report 2021Page 50
Copyright © 2021 www.secdatabase.com. All Rights Reserved.Please Consider the Environment Before Printing This Document

NOTES TO FINANCIAL STATEMENTS (continued)At June 30, 2021(unaudited)
3. INVESTMENT VALUATION
All investments in securities are recorded at their estimated fair value. The Funds value their investments at the official close of the NewYork Stock Exchange (�NYSE�) each day the NYSE is open for business.
The Funds utilize various methods to measure the fair value of their investments on a recurring basis. GAAP in the United States ofAmerica establishes a hierarchy that prioritizes inputs to valuation methods. The inputs or methodology used for valuing securities are notnecessarily an indication of the risk associated with investing in those securities. The three levels (�Levels�) of inputs of the fair valuehierarchy are defined as follows:
Level 1�Unadjusted quoted prices in active markets for identical securities.
Level 2�Inputs, other than quoted prices included in Level 1, which are observable, either directly or indirectly. These inputs may includequoted prices for the identical instrument on an inactive market, prices for similar instruments, interest rates, prepayment speeds, creditrisk, yield curves, default rates, and similar data.
Level 3�Unobservable inputs based on the best information available in the circumstances, to the extent observable inputs are notavailable, which may include the Funds� own assumptions used in determining the fair value of investments and derivative instruments.
The inputs used to measure fair value may fall into different Levels of the fair value hierarchy. In such cases, for disclosure purposes, theLevel in the fair value hierarchy that is assigned to the fair value measurement of a security is determined based on the lowest Levelinput that is significant to the fair value measurement in its entirety. Certain investments that are measured at fair value using NAV pershare, or its equivalent, using the �practical expedient� have not been classified in the fair value Levels. The hierarchy classification ofinputs used to value the Funds� investments at June 30, 2021, is disclosed within the Investment Valuation section of each Fund�sSchedule of Investments.
The availability of observable inputs can vary from security to security and is affected by a wide variety of factors, including, but notlimited to, the type of security, whether the security is new and not yet established in the marketplace, the liquidity of markets, and othercharacteristics particular to the security. To the extent that valuation is based on models or inputs that are less observable orunobservable in the market, the determination of fair value requires more judgment. Accordingly, the degree of judgment exercised indetermining fair value is generally greatest for instruments categorized in Level 3. Due to the inherent uncertainty of valuation, thedetermination of values may differ significantly from values that would have been realized had a ready market for investments existed,and the differences could be material.
Fair value measurements: Descriptions of the valuation techniques applied to the Funds� significant categories of assets and liabilitiesmeasured at fair value on a recurring basis are as follows:
Equity securities: Securities are stated at the last reported sales price or closing price on the day of valuation taken from the primaryexchange where the security is principally traded. To the extent these securities are actively traded and valuation adjustments are notapplied, they are categorized in Level 1 of the fair value hierarchy. Equities traded on inactive markets or valued by reference to similarinstruments are generally categorized in Level 2 or Level 3 if inputs are unobservable.
Foreign equity securities: Securities in which the primary trading market closes at the same time or after the NYSE, are valued based onquotations from the primary market in which they are traded and are categorized in Level 1. Because many foreign securities marketsand exchanges close prior to the close of the NYSE, closing prices for foreign securities in those markets or on those exchanges do notreflect the events that occur after that close. Certain foreign securities may be fair valued using a pricing service that considers thecorrelation of the trading patterns of the foreign security to the intraday trading in the U.S. markets for investments such as AmericanDepositary Receipts, financial futures, ETFs and the movement of the certain indices of securities based on a statistical analysis of theirhistorical relationship; such valuations generally are categorized in Level 2.
Rights: Rights may be priced intrinsically using a model that incorporates the subscription or strike price, the daily market price for theunderlying security, and a subscription ratio. If the inputs are unavailable, or if the subscription or strike price is higher than the marketprice, then the rights are priced at zero. Rights are generally categorized in Level 2 of the fair value hierarchy, or Level 3 if inputs areunobservable.
Warrants: Warrants may be priced intrinsically using a model that incorporates the subscription or strike price, the daily market price forthe underlying security, and a subscription ratio. If the inputs are unavailable, or if the subscription or strike price is higher than the marketprice, then the warrants are priced at zero. Warrants are generally categorized in Level 2 of the fair value hierarchy, or Level 3 if inputsare unobservable.
Transamerica ETF Trust Semi-Annual Report 2021Page 51
Copyright © 2021 www.secdatabase.com. All Rights Reserved.Please Consider the Environment Before Printing This Document

NOTES TO FINANCIAL STATEMENTS (continued)At June 30, 2021(unaudited)
3. INVESTMENT VALUATION (continued)
U.S. government obligations: U.S. government obligations are normally valued using a model that incorporates market observable datasuch as reported sales of similar securities, broker quotes, yields, bids, offers, and reference data. Certain securities are valued byprincipally using dealer quotations. U.S. government obligations generally are categorized in Level 2 of the fair value hierarchy, or Level 3if inputs are unobservable.
Short-term notes: The Fund normally values short-term government and U.S. government agency securities using a model thatincorporates market observable data such as reported sales of similar securities, broker quotes, yields, bids, offers and reference data.Certain securities are valued by principally using dealer quotations. Short-term government and U.S. government agency securitiesgenerally are categorized in Level 2 of the fair value hierarchy, or Level 3 if inputs are unobservable.
Investment companies: Certain investment companies are valued at the NAV as the practical expedient. These investment companiesare not included within the fair value hierarchy. Certain other investment companies are valued at the actively traded NAV and novaluation adjustments are applied. These investment companies are categorized in Level 1 of the fair value hierarchy.
Securities lending collateral: Securities lending collateral is invested in a money market fund which is valued at the actively traded NAVand no valuation adjustments are applied. Securities lending collateral is categorized in Level 1 of the fair value hierarchy.
Derivative instruments: Centrally cleared or listed derivatives that are actively traded are valued based on quoted prices from theexchange and are categorized in Level 1 of the fair value hierarchy. Over-the-counter (�OTC�) derivative contracts include forward, swap,swaption, and option contracts related to interest rates, foreign currencies, credit standing of reference entities, equity prices, orcommodity prices. Depending on the product and the terms of the transaction, the fair value of the OTC derivative products are modeledtaking into account the counterparties� creditworthiness and using a series of techniques, including simulation models. Many pricingmodels do not entail material subjectivity because the methodologies employed do not necessitate significant judgments and the pricinginputs are observed from actively quoted markets, as is the case of interest rate swap and option contracts. The majority of OTCderivative products valued by the Funds using pricing models fall into this category and are categorized within Level 2 of the fair valuehierarchy or Level 3 if inputs are unobservable.
4. SECURITIES AND OTHER INVESTMENTS
Real estate investment trusts (��REITs��): REITs are pooled investment vehicles which invest primarily in income producing real estate,or real estate related loans or interests. Distributions received by REITs are classified at management�s estimate of the dividend income,return of capital and capital gains. Estimates are based on information available at year-end, which includes the previous fiscal year�sclassification. The actual amounts of dividend income, return of capital, and capital gains are only determined by each REIT after thefiscal year end and may differ from the estimated amounts. Upon notification from the REITs, some of the distributions received may bere-classified and recorded as a return of capital or capital gains. There are certain additional risks involved in investing in REITs. Theseinclude, but are not limited to, economic conditions, changes in zoning laws, real estate values, property taxes, and interest rates.
REITs held at June 30, 2021, if any, are identified within the Schedule of Investments.
5. BORROWINGS AND OTHER FINANCING TRANSACTIONS
The Funds may engage in borrowing transactions as a means of raising cash to satisfy redemption requests, for other temporary oremergency purposes or, to the extent permitted by their investment policies, to raise additional cash to be invested in other securities orinstruments. When the Funds invest borrowing proceeds in other securities, the Funds will bear the risk that the market value of thesecurities in which such proceeds are invested goes down and is insufficient to repay the borrowed proceeds. The Funds may borrow ona secured or on an unsecured basis. If the Funds enter into a secured borrowing arrangement, a portion of the Funds� assets will beused as collateral. The 1940 Act requires the Funds to maintain asset coverage of at least 300% of the amount of their borrowings. Assetcoverage means the ratio that the value of the Funds� total assets, minus liabilities other than borrowings, bears to the aggregate amountof all borrowings. Although complying with this requirement has the effect of limiting the amount that the Funds may borrow, it does nototherwise mitigate the risks of entering into borrowing transactions.
Securities lending: The Funds may lend securities to qualified financial institutions, brokers and dealers. State Street serves assecurities lending agent to the Funds pursuant to a Securities Lending Agreement. Loans of securities are terminable at any time and theborrower, after notice, is required to return borrowed securities within the standard time period for settlement of securities transactions.The lending of securities exposes the Funds to risks such as: the borrowers may fail to return the loaned securities or may not be able toprovide additional collateral, the Funds may experience delays in recovery of the loaned securities or delays in access to
Transamerica ETF Trust Semi-Annual Report 2021Page 52
Copyright © 2021 www.secdatabase.com. All Rights Reserved.Please Consider the Environment Before Printing This Document

NOTES TO FINANCIAL STATEMENTS (continued)At June 30, 2021(unaudited)
5. BORROWINGS AND OTHER FINANCING TRANSACTIONS (continued)
collateral, or the Funds may experience losses related to the investment collateral. To minimize certain risks, loan counterparties pledgecash, securities issued or guaranteed by the U.S. Government and irrevocable letters of credit issued by banks as collateral. The initialcollateral received by the Funds is required to have a value of at least 102% of the current value of the loaned securities traded on U.S.exchanges, and a value of at least 105% for all other securities. Typically the lending agent is not permitted to sell, re-pledge or use cashand non-cash collateral it receives. The lending agent has agreed to indemnify the Funds in the case of default of any securitiesborrower.
Each Fund receives compensation for lending securities from interest or dividends earned on the cash, U.S. Government securities andirrevocable letters of credit held as collateral, less associated fees and expenses. Such income is reflected in Net income from securitieslending within the Statements of Operations. Cash collateral received is invested in the State Street Navigator Securities LendingTrust�Government Money Market Portfolio.
The value of loaned securities and related cash and non-cash collateral outstanding at June 30, 2021, if any, are shown on a gross basiswithin the Schedule of Investments.
The following table reflects a breakdown of transactions accounted for as secured borrowings, the gross obligation by the type, and theremaining contractual maturity of those transactions as of June 30, 2021.
Remaining Contractual Maturity of the AgreementsOvernight and
ContinuousLess Than
30 DaysBetween
30 & 90 DaysGreater Than
90 Days TotalS&P 400 Managed RiskSecurities Lending Transactions
Common Stocks $ 415,081 $ � $ � $ � $415,081Total Borrowings $ 415,081 $ �� $ �� $ �� $415,081
S&P 500 Managed RiskSecurities Lending Transactions
Common Stocks $ 58,118 $ � $ � $ � $58,118Total Borrowings $ 58,118 $ �� $ �� $ �� $58,118
S&P 600 Managed RiskSecurities Lending Transactions
Common Stocks $ 572,196 $ � $ � $ � $572,196Total Borrowings $ 572,196 $ �� $ �� $ �� $572,196
S&P EM 100 & Managed RiskSecurities Lending Transactions
Common Stocks $ 515,003 $ � $ � $ � $515,003Total Borrowings $ 515,003 $ �� $ �� $ �� $515,003
S&P International Managed RiskSecurities Lending Transactions
Common Stocks $ 5,568,549 $ � $ � $ � $5,568,549Total Borrowings $ 5,568,549 $ �� $ �� $ �� $ 5,568,549
6. RISK EXPOSURES AND THE USE OF DERIVATIVE INSTRUMENTS
Certain Funds� investment strategies allow the Funds to use various types of derivative contracts, including option contracts, swapagreements, futures contracts, and forward foreign currency contracts. Derivatives are investments whose value is primarily derived fromunderlying assets, indices or reference rates and may be transacted on an exchange or OTC.
Market Risk Factors: In pursuit of the Funds� investment strategies, the Funds may seek to use derivatives. The Funds� use ofderivatives may increase or decrease their exposure to the following market risks:
Transamerica ETF Trust Semi-Annual Report 2021Page 53
Copyright © 2021 www.secdatabase.com. All Rights Reserved.Please Consider the Environment Before Printing This Document

NOTES TO FINANCIAL STATEMENTS (continued)At June 30, 2021(unaudited)
6. RISK EXPOSURES AND THE USE OF DERIVATIVE INSTRUMENTS (continued)
Interest rate risk: Interest rate risk relates to the fluctuations in the value of fixed income securities due to changes in the prevailing levelsof market interest rates.
Foreign exchange rate risk: Foreign exchange rate risk relates to fluctuations in the value of an asset or liability due to changes in thecurrency exchange rates.
Equity risk: Equity risk relates to the change in value of equity securities as they relate to increases or decreases in the general market.
Credit risk: Credit risk relates to the ability of the issuer of a financial instrument to make further principal or interest payments on anobligation or commitment that it has to the Funds.
Commodity risk: Commodity risk relates to the change in value of commodities or commodity indices as they relate to increases ordecreases in the commodities market. Commodities are physical assets that have tangible properties. Examples of these types of assetsare crude oil, heating oil, metals, livestock, and agricultural products.
The Funds are also exposed to additional risks from investing in derivatives, such as liquidity and counterparty credit risk. Liquidity risk isthe risk that the Funds will be unable to sell or close out the derivative in the open market in a timely manner. Counterparty credit risk isthe risk that the counterparty will not be able to fulfill its obligations to the Funds. Investing in derivatives may also involve greater risksthan investing directly in the underlying assets, such as losses in excess of any initial investment and collateral received. In addition,there may be the risk that the change in value of the derivative contract does not correspond to the change in value of the underlyinginstrument.
The Funds� exposure to market risk factors and certain other associated risks are summarized by derivative type as follows:
Futures contracts: The Funds are subject to equity and commodity risk, interest rate risk, and foreign exchange rate risk in the normalcourse of pursuing their investment objectives. A Fund may use futures contracts to enhance the Fund�s ability to track its UnderlyingIndex. A futures contract represents a commitment for the future purchase or sale of an asset at a specified price on a specified date.Upon entering into such contracts, the Funds are required to deposit with the broker, either in cash or in securities, an initial margin in anamount equal to a certain percentage of the contract amount. Subsequent payments (variation margin) are paid or received by theFunds, depending on the daily fluctuations in the value of the contract, and are recorded for financial statement purposes as unrealizedgains or losses by the Funds. Upon entering into such contracts, the Funds bear the risk of equity and commodity prices, interest rates,or exchange rates moving unexpectedly, in which case, the Funds may not achieve the anticipated benefits of the futures contracts andmay realize losses. With futures, there is minimal counterparty credit risk to the Funds since futures are exchange-traded and theexchange�s clearinghouse, as counterparty to all exchange-traded futures, guarantees the futures against default. Futures contracts aregenerally entered into on a regulated futures exchange and cleared through a clearinghouse associated with the exchange.
Open futures contracts at June 30, 2021, if any, are listed within the Schedule of Investments. Variation margin, if applicable, is shown inVariation margin receivable or payable on futures contracts within the Statements of Assets and Liabilities.
The following is a summary of the location and each Fund�s fair values of derivative investments disclosed, if any, within the Statementsof Assets and Liabilities, categorized by primary market risk exposure as of June 30, 2021.
Asset Derivatives
Fund/LocationInterest Rate
Contracts
ForeignExchangeContracts
EquityContracts
CreditContracts
CommodityContracts Total
S&P 500 Managed RiskFutures contracts:
Total distributable earnings(accumulated losses) (A) (B) $ � $ � $ 7,998 $ � $ � $7,998
Total $ �� $ �� $ 7,998 $ �� $ �� $ 7,998
Transamerica ETF Trust Semi-Annual Report 2021Page 54
Copyright © 2021 www.secdatabase.com. All Rights Reserved.Please Consider the Environment Before Printing This Document

NOTES TO FINANCIAL STATEMENTS (continued)At June 30, 2021(unaudited)
6. RISK EXPOSURES AND THE USE OF DERIVATIVE INSTRUMENTS (continued)
Liability Derivatives
Fund/LocationInterest Rate
Contracts
ForeignExchangeContracts
EquityContracts
CreditContracts
CommodityContracts Total
S&P 400 Managed RiskFutures contracts:
Total distributable earnings(accumulated losses) (A) (B) $ � $ � $(3,326 ) $ � $ � $(3,326 )
Total $ �� $ �� $(3,326 ) $ �� $ �� $(3,326 )S&P 600 Managed RiskFutures contracts:
Total distributable earnings(accumulated losses) (A) (B) $ � $ � $(807 ) $ � $ � $(807 )
Total $ �� $ �� $(807 ) $ �� $ �� $(807 )S&P EM 100 & Managed RiskFutures contracts:
Total distributable earnings(accumulated losses) (A) (B) $ � $ � $(715 ) $ � $ � $(715 )
Total $ �� $ �� $(715 ) $ �� $ �� $(715 )S&P International Managed RiskFutures contracts:
Total distributable earnings(accumulated losses) (A) (B) $ � $ � $(32,241 ) $ � $ � $(32,241 )
Total $ �� $ �� $(32,241 ) $ �� $ �� $ (32,241)
(A) May include exchange-traded derivatives which are not subject to a master netting arrangement, or another similar arrangement.(B) Included within Unrealized Appreciation (Depreciation) on futures contracts as reported in the Schedule of Investments. Only current day�s variation
margin is reported within the Statements of Assets and Liabilities.
The following is a summary of the location and the effect of derivative investments, if any, within the Statements of Operations,categorized by primary market risk exposure as of June 30, 2021.
Realized Gain (Loss) on Derivative Instruments
Fund/LocationInterest Rate
Contracts
ForeignExchangeContracts
EquityContracts
CreditContracts
CommodityContracts Total
S&P 400 Managed RiskFutures contracts $ � $ � $47,173 $ � $ � $47,173Total $ �� $ �� $47,173 $�� $�� $47,173S&P 500 Managed RiskFutures contracts $ � $ � $170,254 $� $� $170,254Total $ �� $ �� $170,254 $�� $�� $ 170,254S&P 600 Managed RiskFutures contracts $ � $ � $13,193 $� $� $13,193Total $ �� $ �� $13,193 $�� $�� $13,193S&P EM 100 & Managed RiskFutures contracts $ � $ � $45,269 $� $� $45,269Total $ �� $ �� $45,269 $ �� $�� $45,269S&P International Managed RiskFutures contracts $ � $ � $254,835 $ � $ � $254,835Total $ �� $ �� $254,835 $�� $�� $ 254,835
Transamerica ETF Trust Semi-Annual Report 2021Page 55
Copyright © 2021 www.secdatabase.com. All Rights Reserved.Please Consider the Environment Before Printing This Document
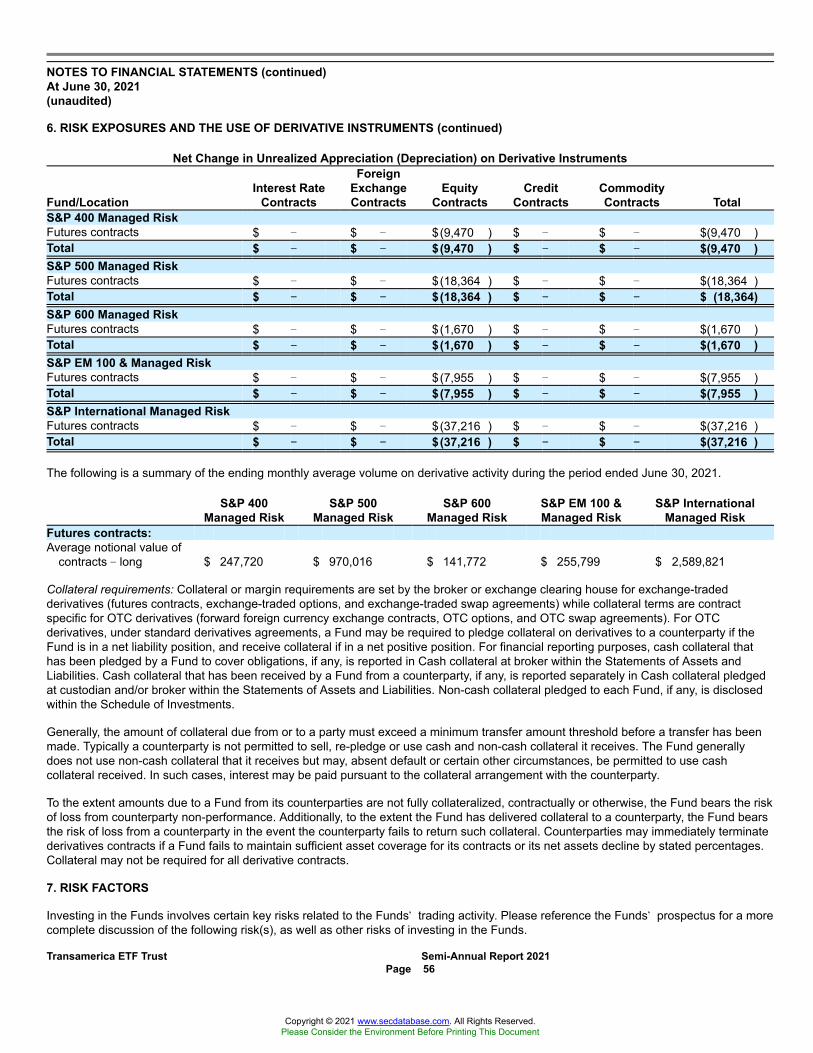
NOTES TO FINANCIAL STATEMENTS (continued)At June 30, 2021(unaudited)
6. RISK EXPOSURES AND THE USE OF DERIVATIVE INSTRUMENTS (continued)
Net Change in Unrealized Appreciation (Depreciation) on Derivative Instruments
Fund/LocationInterest Rate
Contracts
ForeignExchangeContracts
EquityContracts
CreditContracts
CommodityContracts Total
S&P 400 Managed RiskFutures contracts $ � $ � $(9,470 ) $ � $ � $(9,470 )Total $ �� $ �� $(9,470 ) $ �� $ �� $(9,470 )S&P 500 Managed RiskFutures contracts $ � $ � $(18,364 ) $ � $ � $(18,364 )Total $ �� $ �� $(18,364 ) $ �� $ �� $ (18,364)S&P 600 Managed RiskFutures contracts $ � $ � $(1,670 ) $ � $ � $(1,670 )Total $ �� $ �� $(1,670 ) $ �� $ �� $(1,670 )S&P EM 100 & Managed RiskFutures contracts $ � $ � $(7,955 ) $ � $ � $(7,955 )Total $ �� $ �� $(7,955 ) $ �� $ �� $(7,955 )S&P International Managed RiskFutures contracts $ � $ � $(37,216 ) $ � $ � $(37,216 )Total $ �� $ �� $(37,216 ) $ �� $ �� $(37,216 )
The following is a summary of the ending monthly average volume on derivative activity during the period ended June 30, 2021.
S&P 400Managed Risk
S&P 500Managed Risk
S&P 600Managed Risk
S&P EM 100 &Managed Risk
S&P InternationalManaged Risk
Futures contracts:Average notional value of
contracts � long $ 247,720 $ 970,016 $ 141,772 $ 255,799 $ 2,589,821
Collateral requirements: Collateral or margin requirements are set by the broker or exchange clearing house for exchange-tradedderivatives (futures contracts, exchange-traded options, and exchange-traded swap agreements) while collateral terms are contractspecific for OTC derivatives (forward foreign currency exchange contracts, OTC options, and OTC swap agreements). For OTCderivatives, under standard derivatives agreements, a Fund may be required to pledge collateral on derivatives to a counterparty if theFund is in a net liability position, and receive collateral if in a net positive position. For financial reporting purposes, cash collateral thathas been pledged by a Fund to cover obligations, if any, is reported in Cash collateral at broker within the Statements of Assets andLiabilities. Cash collateral that has been received by a Fund from a counterparty, if any, is reported separately in Cash collateral pledgedat custodian and/or broker within the Statements of Assets and Liabilities. Non-cash collateral pledged to each Fund, if any, is disclosedwithin the Schedule of Investments.
Generally, the amount of collateral due from or to a party must exceed a minimum transfer amount threshold before a transfer has beenmade. Typically a counterparty is not permitted to sell, re-pledge or use cash and non-cash collateral it receives. The Fund generallydoes not use non-cash collateral that it receives but may, absent default or certain other circumstances, be permitted to use cashcollateral received. In such cases, interest may be paid pursuant to the collateral arrangement with the counterparty.
To the extent amounts due to a Fund from its counterparties are not fully collateralized, contractually or otherwise, the Fund bears the riskof loss from counterparty non-performance. Additionally, to the extent the Fund has delivered collateral to a counterparty, the Fund bearsthe risk of loss from a counterparty in the event the counterparty fails to return such collateral. Counterparties may immediately terminatederivatives contracts if a Fund fails to maintain sufficient asset coverage for its contracts or its net assets decline by stated percentages.Collateral may not be required for all derivative contracts.
7. RISK FACTORS
Investing in the Funds involves certain key risks related to the Funds� trading activity. Please reference the Funds� prospectus for a morecomplete discussion of the following risk(s), as well as other risks of investing in the Funds.
Transamerica ETF Trust Semi-Annual Report 2021Page 56
Copyright © 2021 www.secdatabase.com. All Rights Reserved.Please Consider the Environment Before Printing This Document

NOTES TO FINANCIAL STATEMENTS (continued)At June 30, 2021(unaudited)
7. RISK FACTORS (continued)
Market risk: The market values of a Fund�s securities and other assets will fluctuate, sometimes sharply and unpredictably, due tochanges in general market conditions, overall economic trends or events, governmental actions or interventions, actions taken by theU.S. Federal Reserve or foreign central banks, political developments, investor sentiment, public health emergencies such as apandemic, and other factors that may or may not be related to the issuer of the security or other asset. The market prices of securitiesand other assets also may go down due to events or conditions that affect particular sectors, industries or issuers. Adverse marketconditions may be prolonged and may not have the same impact on all types of securities or other assets.
Economies and financial markets throughout the world are increasingly interconnected. Economic, financial or political events, tradingand tariff arrangements, public health events, terrorism, technology and data interruptions, natural disasters, and other circumstances inone or more countries or regions could be highly disruptive to, and have profound impacts on, global economies or markets. As a result,whether or not a Fund invests in securities of issuers located in or with significant exposure to the countries directly affected, the valueand liquidity of a Fund�s investments may go down.
The COVID-19 pandemic has caused substantial market disruption around the world, including the U.S. There have been periods ofextreme volatility, and periods where there have been no buyers for certain securities, including U.S. Treasury securities. Some sectors ofthe economy and individual issuers have experienced particularly large losses. The pandemic has reduced liquidity of particularinvestments and asset classes; resulted in significant disruptions to business operations, including business closures; strained healthcaresystems; disrupted supply chains, consumer demand and employee availability; and restricted travel. These conditions may continue foran extended period of time, or worsen. The pandemic may result in a sustained domestic or global economic downturn or recession.Developing or emerging market countries may be more adversely impacted. The ultimate economic fallout from the pandemic, and thelong-term impact on economies, markets, industries and individual issuers, are not known.
The U.S. government and the Federal Reserve, as well as certain foreign governments and central banks, have taken extraordinaryactions to support local and global economies and the financial markets in response to the COVID-19 pandemic. These actions haveresulted in significant expansion of public debt, including in the U.S. The long-term consequences of this level of public debt are notknown. In addition, certain interest rates have been reduced to very low levels. This and other government intervention into the economyand financial markets to address the pandemic may not work as intended, particularly if the efforts are perceived by investors as beingunlikely to achieve the desired results.
The COVID-19 pandemic could continue to adversely affect the value and liquidity of a Fund�s investments, impair a Fund�s ability tosatisfy redemption requests, and negatively impact a Fund�s performance.
Passive strategy/index risk: A Fund is managed with a passive investment strategy, attempting to track the performance of a rulesbased index of securities, regardless of the current or projected performance of the Underlying Index or of the actual securitiescomprising the Underlying Index. This differs from an actively-managed fund, which typically seeks to outperform a benchmark index. Asa result, a Fund�s performance may be less favorable than that of a portfolio managed using an active investment strategy. The structureand composition of the Underlying Index will affect the performance, volatility, and risk of the Underlying Index and, consequently, theperformance, volatility, and risk of a Fund.
Index tracking risk: While the sub-adviser seeks to track the performance of an Underlying Index (i.e., achieve a high degree ofcorrelation with the Underlying Index), a Fund�s return may not match the return of the Underlying Index. When utilizing either areplication or sampling strategy, a Fund incurs a number of operating expenses not applicable to the Underlying Index, and incurs costsin buying and selling securities and engaging in derivatives transactions. In addition, a Fund may not be fully invested at times, generallyas a result of cash flows into or out of a Fund. The sub-adviser may attempt to replicate the Underlying Index return through a samplingstrategy, which involves investing in fewer than all of the securities in the Underlying Index, or in some securities not included in theUnderlying Index, potentially increasing the risk of divergence between a Fund�s return and that of the Underlying Index. To the extent aFund employs a sampling strategy, an adverse development affecting an issuer of a security held by a Fund could result in a greaterdecline in NAV than would be the case if a Fund used a full replication strategy and held all of the securities in the Underlying Index. Inaddition, due to the potential for frequent rebalancing of the Underlying Index, there is greater risk that a Fund may not implement allchanges to a Fund�s portfolio necessary to track exactly the performance of the Underlying Index.
8. FEES AND OTHER AFFILIATED TRANSACTIONS
TAM, the Funds� investment manager, is directly owned by Transamerica Life Insurance Company (�TLIC�) and AUSA Holding, LLC(�AUSA�), both of which are indirect, wholly owned subsidiaries of Aegon NV. TLIC is owned by Commonwealth General Corporation(�Commonwealth�). Commonwealth and AUSA are wholly owned by Transamerica Corporation (DE). Transamerica Corporation (DE) iswholly owned by Aegon International B.V., which is wholly owned by Aegon NV, a Netherlands corporation, and a publicly tradedinternational insurance group.
Copyright © 2021 www.secdatabase.com. All Rights Reserved.Please Consider the Environment Before Printing This Document

Transamerica ETF Trust Semi-Annual Report 2021Page 57
Copyright © 2021 www.secdatabase.com. All Rights Reserved.Please Consider the Environment Before Printing This Document

NOTES TO FINANCIAL STATEMENTS (continued)At June 30, 2021(unaudited)
8. FEES AND OTHER AFFILIATED TRANSACTIONS (continued)
TAM is an affiliate of Aegon NV.
Certain officers and trustees of the Funds are also officers and/or trustees of TAM. No interested trustee who is deemed an interestedperson due to current or former service with TAM or an affiliate of TAM receives compensation from the Funds.
Investment management fees: TAM serves as the Funds� investment manager, performing administration as well as investmentadvisory services. TAM renders investment advisory, supervisory, and administration services under an investment managementagreement and each Fund pays a single management fee, which is reflected in Investment management fees within the Statements ofOperations.
Each Fund pays a management fee to TAM based on daily Average Net Assets (�ANA�) at the following rates:
Fund RateS&P 400 Managed Risk 0.45%S&P 500 Managed Risk 0.35S&P 600 Managed Risk 0.45S&P EM 100 & Managed Risk 0.60S&P International Managed Risk 0.50
From time to time, TAM may waive all or a portion of its management fee. TAM pays all expenses of each Fund other than the investmentmanagement fee, distribution fee pursuant to each Fund�s distribution and service plan, if any, brokerage expenses, taxes, interest,litigation expenses, fees and expenses related to securities lending services, external counsel fees, independent trustee expenses, costsof borrowing money, acquired fund fees and expenses and other extraordinary expenses.
Distribution and service fees: The Trust has a distribution plan (�Distribution Plan�) pursuant to Rule 12b-1 under the 1940 Act,however, the Distribution Plan has not yet been implemented. Under the Distribution Plan, payments at an annual rate of up to 0.25% ofeach Fund�s average daily net assets may be made for the sale and distribution of capital shares. The implementation of any suchpayments would be approved by the Board prior to implementation.
The Trust has entered into a distribution agreement with Foreside Fund Services, LLC as the Funds� distributor. The Distributor will notdistribute Fund shares in less than creation units, and does not maintain a secondary market in Fund shares. The Distributor may enterinto selected dealer agreements with other broker-dealers or other qualified financial institutions for the sale of creation units of Fundshares.
Brokerage commissions: The Funds incurred no brokerage commissions on security transactions placed with affiliates of theinvestment manager or sub-adviser(s) for the period ended June 30, 2021.
9. PURCHASES AND SALES OF SECURITIES
For the period ended June 30, 2021, the cost of securities purchased and proceeds from securities sold (excluding in-kind transactionsand short-term securities) are as follows:
Purchases of Securities Sales/Maturities of SecuritiesFund Long-Term U.S. Government Long-Term U.S. GovernmentS&P 400 Managed Risk $36,016,365 $ 84,186,539 $13,569,267 $ 113,929,074S&P 500 Managed Risk 112,189,989 23,234,425 74,164,714 61,649,625S&P 600 Managed Risk 10,146,236 105,593,648 4,571,858 108,647,871S&P EM 100 & Managed Risk 29,999,888 60,771,525 30,306,682 60,649,408S&P International Managed Risk 36,728,613 16,236,002 20,237,439 24,273,614
For the period ended June 30, 2021, the cost of in-kind purchases and proceeds from in-kind sales are as follows. Funds not listed in thesubsequent table do not have in-kind purchases or in-kind sales during the period.
Fund In-Kind Purchases In-Kind SalesS&P 400 Managed Risk $ � $2,122,775S&P 500 Managed Risk � 23,504,835S&P 600 Managed Risk 2,719,056 787,366S&P International Managed Risk � 9,142,378
Copyright © 2021 www.secdatabase.com. All Rights Reserved.Please Consider the Environment Before Printing This Document

Transamerica ETF Trust Semi-Annual Report 2021Page 58
Copyright © 2021 www.secdatabase.com. All Rights Reserved.Please Consider the Environment Before Printing This Document

NOTES TO FINANCIAL STATEMENTS (continued)At June 30, 2021(unaudited)
10. CAPITAL SHARE TRANSACTIONS
The Funds will issue or redeem capital shares to certain institutional investors (typically market makers or other broker-dealers) only inlarge blocks of capital shares (�Creation Units�). The S&P 400 Managed Risk, S&P 500 Managed Risk and S&P 600 Managed RiskFunds issue or redeem capital shares in blocks of 10,000 Creation Units. The S&P EM 100 & Managed Risk and S&P InternationalManaged Risk Funds issue and redeem capital shares in blocks of 50,000 Creation Units. Creation Unit transactions are typicallyconducted in exchange for the deposit or delivery of a designated portfolio of in-kind securities and/or cash. In-kind sales are reflected asin-kind redemptions within the Statements of Operations.
Individual capital shares may only be purchased and sold on a national securities exchange, electronic crossing networks and otheralternative trading systems through a broker-dealer at market prices. Because capital shares trade at market prices rather than at NAV,capital shares may trade at a price greater than NAV (premium) or less than NAV (discount). Transactions in capital shares for each Fundare disclosed in detail within the Statements of Changes in Net Assets.
11. FEDERAL INCOME TAXES AND DISTRIBUTIONS TO SHAREHOLDERS
The Funds have not made any provision for federal income or excise taxes due to their policy to distribute all of their taxable income andcapital gains to their shareholders and otherwise qualify as regulated investment companies under Subchapter M of the Internal RevenueCode. The Funds recognize the tax benefits of uncertain tax positions only where the position is �more likely than not� to be sustainedassuming examination by tax authorities. The Funds� tax returns remain subject to examination by the Internal Revenue Service andstate tax authorities three years from the date of filing for federal purposes and four years from the date of filing for state purposes.Management has evaluated the Funds� tax provisions taken for all open tax years, and has concluded that no provision for income tax isrequired in the Funds� financial statements. If applicable, the Funds recognize interest accrued related to unrecognized tax benefits inrelation to interest and penalties expense in Other within the Statements of Operations. The Funds identify their major tax jurisdictions asU.S. Federal, the state of Colorado, and foreign jurisdictions where the Funds make significant investments; however, the Funds are notaware of any tax positions for which it is reasonably possible that the total amounts of unrecognized tax benefits will change materially inthe next twelve months. Distributions are determined in accordance with income tax regulations, which may differ from GAAP.
As of June 30, 2021, the approximate cost for U.S. federal income tax purposes, and the aggregate gross/net unrealized appreciation(depreciation) in the value of investments (including securities sold short and derivatives, if any) are as follows:
Fund CostGross
AppreciationGross
(Depreciation)Net Appreciation
(Depreciation)S&P 400 Managed Risk $83,000,679 $18,094,520 $ (589,819 ) $ 17,504,701S&P 500 Managed Risk 322,690,756 89,688,326 (649,686 ) 89,038,640S&P 600 Managed Risk 38,846,337 7,746,308 (216,923 ) 7,529,385S&P EM 100 & Managed Risk 43,891,419 12,263,567 (953,450 ) 11,310,117S&P International Managed Risk 159,954,793 32,670,448 (1,610,337 ) 31,060,111
12. LEGAL PROCEEDINGS
On September 30, 2020, Transamerica Asset Management, Inc. (�TAM�), the investment manager of the funds, entered into a settlementwith the Securities and Exchange Commission (the �SEC�) relating to expense recaptures. The recaptures at issue, which TAM self-reported to the SEC, involved amounts previously voluntarily waived and/or reimbursed to four money market funds to prevent the fundsfrom experiencing a negative yield. In some cases recaptures under the voluntary yield waiver arrangements exceeded contractualexpense limits. The recaptured amounts were not reflected in the funds� prospectus fee tables. The funds involved were TransamericaGovernment Money Market, Transamerica BlackRock Government Money Market VP, Transamerica Partners Government Money Marketand Transamerica Partners Institutional Government Money Market. The two Transamerica Partners Government Money Market fundsreorganized into Transamerica Government Money Market in October of 2017.
Under the settlement order, TAM agreed to pay affected fund investors approximately $5.3 million in disgorgement and approximately$690,000 in prejudgment interest. These amounts represent expenses incurred above the applicable expense limit (plus interest). TAMwas also censured and ordered to cease and desist from committing or causing any violations of certain statutory provisions and SECrules. The settlement order imposes no civil penalty on TAM based upon TAM having self-reported the matter, the prompt remedial stepstaken by TAM, and TAM�s cooperation in the SEC staff�s investigation. The settlement order does not affect TAM�s ability to manage thefunds.
The foregoing is only a brief summary of the settlement order. A copy of the settlement order is available on the SEC�s website athttps://www.sec.gov.
The settlement had no impact on the Funds� financial statements.
Copyright © 2021 www.secdatabase.com. All Rights Reserved.Please Consider the Environment Before Printing This Document

Transamerica ETF Trust Semi-Annual Report 2021Page 59
Copyright © 2021 www.secdatabase.com. All Rights Reserved.Please Consider the Environment Before Printing This Document

Approval of the Management Agreement and Investment Subadvisory Agreement
On June 15, 2021, at a meeting of the Board of Trustees (the �Board� or �Trustees�) of Transamerica ETF Trust (�Trust�), includingthose Trustees who are not interested persons of the Trust (�Independent Trustees�), the Board considered (1) the continuedappointment of Transamerica Asset Management, Inc. (�TAM�) as investment manager of the DeltaShares S&P 400 Managed Risk ETF(�DMRM�), DeltaShares S&P 500 Managed Risk ETF (�DMRL�), DeltaShares S&P 600 Managed Risk ETF (�DMRS�), DeltaSharesS&P International Managed Risk ETF (�DMRI�) and DeltaShares S&P EM 100 & Managed Risk ETF (�DMRE�) (collectively, the�Funds�), pursuant to the renewal of the Management Agreement (�Management Agreement�) between TAM and the Trust with respectto the Funds, and (2) the continued appointment of Milliman Financial Risk Management LLC (�Subadviser�) as investment sub-adviserof the Funds, pursuant to the renewal of the Investment Subadvisory Agreement (�Subadvisory Agreement,� and together with theManagement Agreement, the �Agreements�) between the Subadviser and TAM with respect to the Funds. In preparation for itsdeliberations, the Board requested, and received in advance of the meeting, a written response from each of TAM and the Subadviser(collectively, the �Advisers�) to a due diligence questionnaire circulated on the Board�s behalf regarding the services it provides to theFunds. In addition, during its deliberations the Board received an oral presentation from TAM and the Subadviser and was assisted by theadvice of Fund counsel. The Independent Trustees were also assisted by the advice of Independent Trustee counsel with whom they metin executive session to discuss the renewal of the Agreements with respect to each Fund. The Board considered the Agreements foreach Fund and the engagement of TAM and the Subadviser separately.
The Trustees evaluated the information provided by the Advisers in connection with the Board�s consideration of the renewal of theAgreements in light of the legal advice furnished to them by counsel and their own business judgment. In this respect, the Boardconsidered, among other matters: (1) the nature, extent and quality of the services provided to the Funds by TAM and the Subadviserunder the Agreements, including, in light of the index-tracking objective of each Fund, information on the performance of each Fundrelative to its target index; (2) the costs of the services provided to the Funds by TAM and the Subadviser and the profitability of eachAdviser�s relationship with each Fund; (3) information concerning the management fee as well as the net expense ratio of each Fund,including a comparison of each Fund�s management fee and net expense ratio to those of a group of comparable exchange-traded funds(�ETFs�) identified by Broadridge Financial Solutions, Inc. (�Broadridge�) (each such group, a �peer group�); (4) the extent to whicheconomies of scale may be realized by each Fund as it grows to enable investors to share in the benefits of economies of scale; and(5) other benefits received by TAM (and its affiliates) and the Subadviser (and its affiliates) from their respective relationships with theFunds. In reviewing the information provided for the meeting, the Board recognized that the evaluation process with respect to TAM andthe Subadviser was an ongoing one and, in this regard, the Board considered information provided by TAM and the Subadviser atregularly scheduled meetings throughout the year.
The nature, extent and quality of the advisory services provided, including performance. The Board considered the nature, extentand quality of the services provided by TAM and the Subadviser under the Agreements. In this regard, the Board considered theinvestment objective and strategy of each Fund, including the unique and dynamic nature of each Fund�s target index. The Board notedthat each target index was designed to provide a type of risk-adjusted returns and, to do so, may allocate (and reallocate) weights amongmultiple asset classes, including equity and fixed income securities and cash, as frequently as daily, depending on market volatility. TheBoard reviewed the target indexes� performance relative to non-risk-adjusted indexes over various periods and noted that they generallyunderperformed traditional indexes in upward trending markets. However, the Board also reviewed the Funds� risk-reward profiles overvarious periods and observed that, as expected, each (target index and) Fund generally exhibited a lower risk profile than traditionalindex ETFs.
With respect to the Advisers� services, the Board considered, among other things, their oversight of the target indexes, including theirefforts to improve the target indexes by participating in the index provider�s public notice and comment process regarding the targetindexes� methodology. The Board also considered that, in order to track the target indexes, the Subadviser may be required to shift eachFund�s allocations among multiple asset classes as frequently as daily and to determine the most cost-effective manner in which toimplement portfolio changes, such as by trading securities, futures or swap contracts. In this regard, the Board observed that theSubadviser may be required to more actively manage the portfolio than if the Funds sought to track more passive indexes. The Boardconsidered the Subadviser�s broad experience implementing managed risk strategies and its strategic trading of derivatives on behalf ofthe Funds in order to equitize cash and manage the Funds� tax positions. The Board noted the experience, capability and integrity of theTAM and Subadviser personnel involved with the Funds and, in particular, the qualifications of the Subadviser�s portfolio managementteam. In addition, the Board considered the financial position of the Advisers in order to confirm their ability to continue to meet theirobligations to the Funds and provide a high level of services to the Funds under the Agreements. With respect to TAM, specifically, theBoard also considered TAM�s extensive oversight responsibilities with respect to the Funds, including of the Subadviser�s active tradingof each Fund�s portfolios, and of each Fund�s other service providers. The Board noted the varied and continuous nature of the raft ofservices provided by TAM to the Funds, including in the form of high quality fund administration, legal, compliance and Board reportingservices.
The Board considered the compliance and operational resources of TAM and the Subadviser. In this regard, the Board reviewed a writtenreport from the Trust�s chief compliance officer (�CCO�) setting forth her annual assessment of TAM�s and the Subadviser�s complianceprograms, which reflected the CCO�s conclusion that each of TAM and the Subadviser maintained a robust compliance
Transamerica ETF Trust Semi-Annual Report 2021Page 60
Copyright © 2021 www.secdatabase.com. All Rights Reserved.Please Consider the Environment Before Printing This Document

Approval of the Management Agreement and Investment Subadvisory Agreement (continued)
program with respect to the Funds. With respect to TAM�s compliance policies and procedures, the Board considered TAM�s recent andon-going implementation of various enhancements to its compliance program. In this regard, among other things, the Board noted theaddition and/or elevation of experienced personnel to TAM�s compliance staff and its employee training initiatives. The Board also notedTAM�s successful implementation of various rules and regulations under the federal securities laws during the past year, including theadoption of basket policies and procedures for the Funds. The Trustees also considered TAM�s operational infrastructure, including itsrisk management, technology and cybersecurity controls and systems. In this regard, the Trustees noted the effectiveness of theAdvisers� remote work environments in connection with the novel coronavirus pandemic, including their uninterrupted provisions ofservices to the Funds.
The Board considered the performance of each Fund in light of its investment objective of seeking to replicate the performance results ofits target index and in light of each target index being designed to provide a certain type of risk-adjusted returns. The Board noted theimpact of recent market conditions, including market volatility, on the Funds� performance. The Board reviewed the Funds� daily trackingdifferences and annualized tracking errors, including fair value adjusted tracking errors, as well as the Funds� daily tracking differencetolerance bands and maximum expected tracking error, including how the tolerance bands and maximum expected tracking error rangeswere established and how consistently the Funds operated within these established parameters. The Board also considered thepremiums and discounts and median bid-ask spreads at which the Funds traded during the calendar year 2020 and, separately, duringthe fourth quarter of 2020, noting that trading in the Funds� shares seemed to be trending toward smaller premiums and discounts andnarrower bid-ask spreads in the fourth quarter of 2020. On the basis of this and other information, the Board concluded that, under theAgreements, TAM and the Subadviser were providing an appropriate level of investment management services to the Funds and that theFunds could benefit from their continued management.
Management fees, subadvisory fees and net expense ratios. The Board considered the management fee and subadvisory fee as wellas the net expense ratio of each of the Funds, including information comparing the management fee and net expense ratio of each Fundto the management fees and net expense ratios of its Broadridge peer group. In connection with its consideration of the peer groupinformation provided by Broadridge, the Board received a presentation from Broadridge regarding its qualifications and experienceproviding peer group reviews to fund boards. In reviewing the management fee paid to TAM, the Board noted that the management fee isa �unitary� fee, meaning that TAM is responsible for paying all of the expenses of the Funds, including the subadvisory fee, out of themanagement fee (other than those expenses specifically excluded in the Management Agreement); accordingly, the Board observed thatthe management fee and the net expense ratio of each Fund is the same. In reviewing the peer group information, the Board observedthat the management fee and net expense ratio of each Fund are higher than the median of its peer group. In evaluating thereasonableness of such fees, the Board considered the complexity of the portfolio management services required by each Fund in orderto continuously track its target index, given the index�s managed risk nature and its frequent reallocation of weights among three assetclasses. In addition, the Board considered TAM�s explanation of the differences between each Fund and the ETFs in its peer group,including that most of the peer group funds do not track dynamic indexes with allocations to multiple asset classes. In this regard, theBoard factored in the largely passive nature of each Fund�s peer group constituents and the rationale for differences in managementfees among the peer group.
The Board considered that management fee rates paid by the Funds to TAM under the Management Agreement ranged from 0.35% ofaverage daily assets under management for DMRL to 0.60% for DMRE, with the management fee rates for DMRM, DMRS and DRMIbeing in between (at 0.45% for DMRM and DMRS and 0.50% for DMRI). The Board noted TAM�s representation that DMRI and DMRE,as a result of tracking foreign securities indexes, required more attention to trade and potentially fair value and warranted highermanagement fees. The Board also noted TAM�s representation that competitive considerations require it to accept a relatively lowermanagement fee for DMRL than is representative of the value of TAM�s services to the Fund.
The Board reviewed the portion of each Fund�s management fee retained by TAM and the portion paid by TAM to the Subadviser, notingthe different advisory fees retained by TAM for different Funds and the specific services provided by each of TAM and the Subadviser forthe portion of the management fee retained under the Agreements. The Board considered that the Subadviser is responsible for theday-to-day management of the Funds� portfolios, including responding to corporate actions and implementing representative samplingstrategies, as appropriate. In this regard, the Board noted that certain Funds track broader indexes, which have more corporate actionsand potential liquidity constraints, which may require more active management from the Subadviser.
The Board noted that TAM�s services to the Funds include, among others, oversight of the services provided by the Subadviser,custodian, transfer agent, independent accountant and legal counsel and supervision of the Funds� recordkeeping and shareholderrelations functions. In this regard, the Trustees considered that TAM provides supervisory, compliance and administrative services toeach Fund and must continuously devote resources to the Funds� investment, operational, enterprise, legal, regulatory and compliancefunctions. Further, the Board considered that TAM had made, and was continuing to make, significant commitments to the Funds�success, including by hiring investment, legal and compliance personnel with extensive experience in the ETF industry. The Board notedthat TAM�s commitment of resources to the Funds resulted in it assuming entrepreneurial risk, for which it may reasonably seek to becompensated.
Transamerica ETF Trust Semi-Annual Report 2021Page 61
Copyright © 2021 www.secdatabase.com. All Rights Reserved.Please Consider the Environment Before Printing This Document

Approval of the Management Agreement and Investment Subadvisory Agreement (continued)
With respect to TAM�s oversight of the Subadviser, in particular, the Board noted that TAM, as a �manager of managers,� selects,oversees and monitors the Subadviser, and negotiates a subadvisory fee rate for each Fund. In reviewing the fairness of each Fund�ssubadvisory fees, the Board observed that TAM pays the fees directly out of its management fee and, as a result, the subadvisory feesmaterially impact the profitability of the Funds� to TAM. Accordingly, the Board reasoned that TAM would have negotiated thesubadvisory fees on an arm�s length basis. The Board acknowledged that potential conflicts of interest, as posed by the broaderrelationship between TAM and its affiliates and the Subadviser and its affiliates, may have influenced the negotiation; however, the Boardobserved that each of TAM and the Subadviser have adopted policies and procedures that are designed to fully disclose and mitigate theimpact of such potential conflicts. On the basis of these and other considerations, the Board determined that the management fee ratepaid by each Fund to TAM, including as apportioned between TAM and the Subadviser under the Agreements, was reasonable in light ofthe services provided, and to be provided, and the risks borne, and to be borne, by TAM and the Subadviser, respectively.
The cost of advisory services provided and the level of profitability. The Board considered the profitability data provided by TAM andthe Subadviser. With respect to the profitability of the Funds to TAM, the Board reviewed aggregate and per Fund profitability data,including the management fees earned by TAM and the expenses paid by TAM out of such management fees, in each case on a perFund and aggregated basis. In this regard, the Board noted that the majority of the assets under management in the Funds had beeninvested by mutual funds advised by TAM and that TAM had implemented waivers with respect to a portion of such investments. Inaddition, the Board considered the nature and amount of direct and indirect expenses attributed to each Fund and, with respect to indirectexpenses, the Board considered that TAM�s parent company directed the allocation of certain overhead expenses to each Fund pursuantto an allocation methodology that had been reviewed by the parent company�s auditor. The Board observed that TAM�s continuedinvestment in internal ETF resources, including the hiring of experienced ETF legal, compliance and investment personnel, contributed tosuch expenses and benefitted the Funds but limited the profitability of the Funds, as a group, and of each Fund, individually, to TAM.
With respect to the profitability of the Funds to the Subadviser, the Board noted that each Fund appeared to be profitable. The Boardconsidered, however, that the Subadviser was paid directly by TAM out of TAM�s management fees and, therefore, TAM could beassumed to have negotiated a competitive subadvisory fee rate that would ensure that no Fund was unreasonably profitable to theSubadviser. Based on this information, the Board determined that the profitability of TAM and the Subadviser from their respectiverelationships with each Fund was not excessive.
Whether fee levels reflect economies of scale and the extent to which economies of scale would be realized as the Funds grow.The Board evaluated the extent to which the management fee payable under the Management Agreement reflects economies of scale orwill permit economies of scale to be realized in the future. In this regard, the Board considered TAM�s continued investment in its ETFbusiness, including its recent hiring of personnel with extensive ETF experience, noting that an adviser�s commitment of resources andreinvestment in its fund business represents one means of sharing economies of scale with fund shareholders. Based upon its review,the Board observed that, to the extent that the Funds could be deemed to be operating at economies of scale, TAM was effectivelysharing such economies with the Funds; however, in light of the Funds� direct and indirect expenses, the Board concluded that the Fundswere not currently enjoying economies of scale and that, as each Fund grows, the Board will have the opportunity to re-evaluate anyeconomies of scale.
Benefits to the Advisers and their affiliates from their relationship with the Funds. The Board considered other benefits derived byTAM and its affiliates and, separately, by the Subadviser and its affiliates from their respective relationships with the Funds. The Boardnoted that TAM would not realize soft dollar benefits from its relationships with the Funds, but that the Subadviser could engage in softdollar arrangements consistent with applicable law and �best execution� requirements and that under such circumstances, theSubadviser would derive some fall-out benefits from its relationship with the Funds. The Board also considered the benefits to TAM andthe Subadviser of investments in the Funds by such other funds that they, respectively, manage and subadvise. In light of certain partialwaivers of fees otherwise earned by TAM (and passed through to the Subadviser) in connection with the investment by other funds in theFunds, the Board concluded that, under the totality of the circumstances, the fall-out benefits enjoyed by TAM and the Subadviser inconnection with the Funds were not unreasonable.
Conclusion. The Board reviewed a memorandum from Independent Trustee counsel discussing the legal standards applicable to itsconsideration of the Agreements. The Board did not identify any single factor as being of paramount importance, and different Trusteesmay have given different weight to different factors. Based on its review, including consideration of each of the factors referenced above,and its consideration of information received throughout the year from TAM and the Subadviser, the Board determined, in the exercise ofits business judgment, that the advisory arrangements, as outlined in the Agreements, were fair and reasonable in light of the servicesperformed or to be performed, expenses incurred or to be incurred and such other matters as the Board considered relevant.
Transamerica ETF Trust Semi-Annual Report 2021Page 62
Copyright © 2021 www.secdatabase.com. All Rights Reserved.Please Consider the Environment Before Printing This Document

LIQUIDITY RISK MANAGEMENT PROGRAM
(unaudited)
The Securities and Exchange Commission adopted Rule 22e-4 under the Investment Company Act of 1940, as amended (the �LiquidityRule�) to promote effective liquidity risk management throughout the open-end investment company industry, thereby reducing the riskthat funds will be unable to meet their redemption obligations and mitigating dilution of the interests of fund shareholders.
The series of Transamerica ETF Trust (the �Trust�) (for purposes of this section only, the �Funds�), have adopted and implemented aliquidity risk management program pursuant to the Liquidity Rule (the �Program�). The Board of Trustees of the Trust (the �Board�) hasappointed Transamerica Asset Management, Inc. (�TAM�), the investment manager to the Funds, as the Program administrator for theFunds. TAM has established a Liquidity Risk Management Committee (the �Committee�) to manage the Program for the Funds, includingoversight of the liquidity risk management process, reporting to the Board, and reviewing the Program�s effectiveness.
The Board met on March 9, 2021 (the �Meeting�) to review the Program with respect to the Funds, pursuant to the Liquidity Rule. At theMeeting, the Committee provided the Board with a written report that addressed the operation of the Program during the 2020 GlobalPandemic and assessed the Program�s adequacy and effectiveness, including the operation of the Funds� Highly Liquid InvestmentMinimum (�HLIM�) as applicable, and material changes to the Program (the �Report�). The Report covered the period from January 1,2020 through December 31, 2020 (the �Program Reporting Period�).
The Report described the Program�s liquidity classification methodology. The Report noted that the Funds utilize analysis from a third-party liquidity metrics service, which takes into account a variety of factors including market, trading and other investment specificconsiderations. The Report also discussed the Committee�s methodology in establishing a Fund�s HLIM, as applicable, and theCommittee�s periodic review of each HLIM established. The Report noted one material change to the classification methodology duringthe Program Reporting Period. The Report reviewed the change and why the Committee believes the change is an enhancement to theprior method. The Report also noted that the Program includes provisions reasonably designed to comply with the 15% limit on illiquidinvestments.
The Report noted that the Program (a) complied with the key factors for consideration under the Liquidity Rule for monitoring theadequacy and effectiveness of the Program and (b) on a periodic basis assesses each Fund�s liquidity risk based on a variety of factorsincluding: (1) the Fund�s investment strategy and portfolio liquidity during normal and reasonably foreseeable stressed conditions,(2) cash flow projections during normal and reasonably foreseeable stressed conditions, (3) holdings of cash and cash equivalents,borrowings and other funding sources and (4) the effective operation of the arbitrage mechanism.
The Report concluded that the Program is operating effectively and is reasonably designed to assess and manage the Funds� liquidityrisk pursuant to the requirements of the Liquidity Rule.
Transamerica ETF Trust Semi-Annual Report 2021Page 63
Copyright © 2021 www.secdatabase.com. All Rights Reserved.Please Consider the Environment Before Printing This Document

PROXY VOTING POLICIES AND PROCEDURES AND QUARTERLY PORTFOLIO HOLDINGS
(unaudited)
A description of the Transamerica ETF Trust�s proxy voting policies and procedures is available in the Statement of AdditionalInformation of the Funds, available without charge upon request by calling 1-888-316-8077 (toll free) or on the Securities and ExchangeCommission�s (�SEC�) website at http://www.sec.gov.
In addition, the Funds are required to file Form N-PX, with their complete proxy voting records for the most recent 12 months endedJune 30th, no later than August 31st of each year. The Form is available without charge: (1) from the Funds, upon request by calling1-888-316-8077; and (2) on the SEC�s website at http://www.sec.gov.
Each fiscal quarter, the Funds will file with the SEC a complete schedule of their monthly portfolio holdings on Form N-PORT. The Funds�holdings as of the end of the third month of every fiscal quarter, as reported on Form N-PORT, will be publicly available on the SEC�swebsite at http://www.sec.gov within 60 days of the end of the fiscal quarter.
You may also visit the Trust�s website at www.deltashares.com for this and other information about the Funds and the Trust.
Important Notice Regarding Delivery of Shareholder Documents
Every year we provide shareholders informative materials such as the Transamerica ETF Trust�s Annual Report, the TransamericaETF Trust�s Prospectus, and other required documents that keep you informed regarding your Funds. To the extent provided by mail, theTrust will only send one piece per mailing address, a method that saves your Funds money by reducing mailing and printing costs. Wewill continue to do this unless you tell us not to. To elect to receive individual mailings, simply call a Transamerica Customer ServiceRepresentative toll free at 1-888-316-8077, 8 a.m. to 7 p.m. Eastern Time, Monday-Friday. Your request will take effect within 30 days.
Premium/Discount Information
Information about differences between the per share net asset value of each Fund and the closing price of shares of each Fund areavailable, without charge, at www.deltashares.com.
Transamerica ETF Trust Semi-Annual Report 2021Page 64
Copyright © 2021 www.secdatabase.com. All Rights Reserved.Please Consider the Environment Before Printing This Document

NOTICE OF PRIVACY POLICY
(unaudited)
Your privacy is very important to us. We want you to understand what information we collect and how we use it. We collect and use�nonpublic personal information� in connection with providing our customers with a broad range of financial products and services aseffectively and conveniently as possible. We treat nonpublic personal information in accordance with our Privacy Policy.
What Information We Collect and From Whom We Collect It
We may collect nonpublic personal information about you from the following sources:
� Information we receive from you on applications or other forms, such as your name, address, and account number;
� Information about your transactions with us, our affiliates, or others, such as your account balance and purchase/redemptionhistory; and
� Information we receive from non-affiliated third parties, including consumer reporting agencies.
What Information We Disclose and To Whom We Disclose It
We do not disclose any nonpublic personal information about current or former customers to anyone without their express consent,except as permitted by law. We may disclose the nonpublic personal information we collect, as described above, to persons orcompanies that perform services on our behalf and to other financial institutions with which we have joint marketing agreements. We willrequire these companies to protect the confidentiality of your nonpublic personal information and to use it only to perform the services forwhich we have hired them.
Our Security Procedures
We restrict access to your nonpublic personal information and only allow disclosures to persons and companies as permitted by law toassist in providing products or services to you. We maintain physical, electronic, and procedural safeguards to protect your nonpublicpersonal information and to safeguard the disposal of certain consumer information.
If you have any questions about our Privacy Policy, please call 1-888-316-8077 on any business day between 8 a.m. and 7 p.m. EasternTime.
Note: This Privacy Policy applies only to customers that have a direct relationship with us or our affiliates. If you own shares of ourfunds in the name of a third party such as a bank or broker-dealer, its privacy policy may apply to you instead of ours.
Transamerica ETF Trust Semi-Annual Report 2021Page 65
Copyright © 2021 www.secdatabase.com. All Rights Reserved.Please Consider the Environment Before Printing This Document

Customer Service: 1-888-316-80771801 California St., Suite 5200 Denver, CO 80202Distributor: Foreside Fund Services, LLC
www.deltashares.com
In an effort to reduce paper mailings and conserve natural resources, we encourage you to visit our website,www.transamerica.com, to set up an account and enroll in eDelivery.
The Transamerica ETF Trust is advised by Transamerica Asset Management, Inc. and distributed by Foreside FundServices, LLC., Member of FINRA
1693936 06/21
Copyright © 2021 www.secdatabase.com. All Rights Reserved.Please Consider the Environment Before Printing This Document

Item 2: Code of Ethics.
Not applicable for semi-annual reports.
Item 3: Audit Committee Financial Experts.
Not applicable for semi-annual reports.
Item 4: Principal Accountant Fees and Services.
Not applicable for semi-annual reports.
Item 5: Audit Committee of Listed Registrants.
Not applicable for semi-annual reports.
Item 6: Schedule of Investments.
(a) The schedules of investments and consolidated schedules of investments are included in the Semi-Annual Report toshareholders filed under Item 1 of this Form N-CSR.
(b) Not applicable.
Item 7: Disclosure of Proxy Voting Policies and Procedures for Closed-End Management Investment Companies.
Not applicable.
Item 8: Portfolio Managers of Closed-End Management Investment Companies.
Not applicable.
Item 9: Purchases of Equity Securities by Closed-End Management Investment Company and Affiliated Purchasers.
Not Applicable
Item 10: Submission of Matters to a Vote of Security Holders.
There have been no material changes to the procedures by which shareholders may recommend nominees to theRegistrant�s Board of Trustees that have been implemented since the Registrant last provided disclosure in response to therequirements of this Item.
Item 11: Controls and Procedures.
(a) The Registrant�s principal executive officer and principal financial officer evaluated the effectiveness of the Registrant�sdisclosure controls and procedures within 90 days of this filing and have concluded that the Registrant�s disclosurecontrols and procedures (as defined in Rule 30a-3(c) under the Investment Company Act of 1940, as amended (the �1940Act�)) are appropriately designed to ensure that information required to be disclosed by the Registrant in the reports that itfiles on Form N-CSR (a) is accumulated and communicated to Registrant�s management, including its principal executiveofficer and principal financial officer, to allow timely decisions regarding required disclosure, and (b) is recorded,processed, summarized and reported, within the time periods specified in the rules and forms adopted by the U.S.Securities and Exchange Commission.
(b) The Registrant�s principal executive officer and principal financial officer are aware of no change in the Registrant�sinternal control over financial reporting that occurred during the Registrant�s most recent fiscal half-year that hasmaterially affected, or is reasonably likely to materially affect, the Registrant�s internal control over financial reporting.
Copyright © 2021 www.secdatabase.com. All Rights Reserved.Please Consider the Environment Before Printing This Document

Item 12: Disclosure of Securities Lending Activities for Closed-End Management Investment Companies.
Not Applicable
Item 13: Exhibits.
(a)(1) Not applicable
(a)(2) Separate certifications for Registrant�s principal executive officer and principal financial officer, as required by Rule30a-2(a) under the 1940 Act, are attached.
(a)(3) Not Applicable.
(a)(4) Not applicable.
(b) A certification for Registrant�s principal executive officer and principal financial officer, as required by Rule 30a-2(b)under the 1940 Act, is attached. The certification furnished pursuant to this paragraph is not deemed to be �filed� forpurposes of Section 18 of the Securities Exchange Act of 1934, or otherwise subject to liability of that section. Suchcertification is not deemed to be incorporated by reference into any filing under the Securities Act of 1933 or theSecurities Exchange Act of 1934, except to the extent that the Registrant specifically incorporates it by reference.
Copyright © 2021 www.secdatabase.com. All Rights Reserved.Please Consider the Environment Before Printing This Document

SIGNATURES
Pursuant to the requirements of the Securities Exchange Act of 1934 and the Investment Company Act of 1940, the Registrant hasduly caused this report to be signed on its behalf by the undersigned, thereunto duly authorized.
Transamerica ETF Trust(Registrant)
By: /s/ Marijn P. SmitMarijn P. SmitPresident and Chief Executive Officer(Principal Executive Officer)
Date: September 2, 2021
Pursuant to the requirements of the Securities Exchange Act of 1934 and the Investment Company Act of 1940, this report hasbeen signed below by the following persons on behalf of the Registrant and in the capacities and on the dates indicated.
By: /s/ Marijn P. SmitMarijn P. SmitPresident and Chief Executive Officer(Principal Executive Officer)
Date: September 2, 2021
By: /s/ Vincent J. TonerVincent J. TonerVice President, Treasurer, Principal FinancialOfficer and Principal Accounting Officer
Date: September 2, 2021
Copyright © 2021 www.secdatabase.com. All Rights Reserved.Please Consider the Environment Before Printing This Document
EXHIBIT INDEX
Exhibit No. Description of Exhibit
13(a)(2) Section 302 N-CSR Certification of Principal Executive Officer and Principal Financial Officer
13(b) Section 906 N-CSR Certification of Principal Executive Officer and Principal Financial Officer
Copyright © 2021 www.secdatabase.com. All Rights Reserved.Please Consider the Environment Before Printing This Document

Exhibit 13(a)(2)Section 302 N-CSR Certifications of Principal Executive Officer and Principal Financial Officer
TRANSAMERICA ETF TRUST (THE �TRUST�)FOR THE PERIOD ENDED JUNE 30, 2021
FORM N-CSR CERTIFICATION PURSUANT TOSECTION 302 OF THE SARBANES-OXLEY ACT
I, Marijn P. Smit, certify that:
1. I have reviewed this report on Form N-CSR of Transamerica ETF Trust;
2. Based on my knowledge, this report does not contain any untrue statement of a material fact or omit to state a material factnecessary to make the statements made, in light of the circumstances under which such statements were made, notmisleading with respect to the period covered by this report;
3. Based on my knowledge, the financial statements, and other financial information included in this report, fairly present inall material respects the financial condition, results of operations, changes in net assets, and cash flows (if the financialstatements are required to include a statement of cash flows) of the Registrant as of, and for, the periods presented in thisreport;
4. The Registrant�s other certifying officer and I are responsible for establishing and maintaining disclosure controls andprocedures (as defined in rule 30a-3(c) under the Investment Company Act of 1940) and internal control over financialreporting (as defined in rule 30a-3(d) under the Investment Company Act of 1940) for the Registrant and have:
a. Designed such disclosure controls and procedures, or caused such disclosure controls and procedures to be designedunder our supervision, to ensure that material information relating to the Registrant, including its consolidatedsubsidiaries, is made known to us by others within those entities, particularly during the period in which this report isbeing prepared;
b. Designed such internal control over financial reporting, or caused such internal control over financial reporting to bedesigned under our supervision, to provide reasonable assurance regarding the reliability of financial reporting and thepreparation of financial statements for external purposes in accordance with generally accepted accounting principles;
c. Evaluated the effectiveness of the Registrant�s disclosure controls and procedures and presented in this report ourconclusions about the effectiveness of the disclosure controls and procedures, as of a date within 90 days prior to thefiling date of this report based on such evaluation; and
d. Disclosed in this report any change in the Registrant�s internal control over financial reporting that occurred duringthe second fiscal half-year of the period covered by this report that has materially affected, or is reasonably likely tomaterially affect, the Registrant�s internal control over financial reporting; and
5. The Registrant�s other certifying officer and I have disclosed to the Registrant�s auditors and the audit committee of theRegistrant�s Board of Trustees (or persons performing equivalent functions):
a. All significant deficiencies and material weaknesses in the design or operation of internal control over financialreporting which are reasonably likely to adversely affect the Registrant�s ability to record, process, summarize andreport financial information; and
b. Any fraud, whether or not material, that involves management or other employees who have a significant role in theRegistrant�s internal control over financial reporting.
Date: September 2, 2021 By: /s/ Marijn P. SmitMarijn P. Smit
Title: President and Chief Executive Officer(Principal Executive Officer)
Copyright © 2021 www.secdatabase.com. All Rights Reserved.Please Consider the Environment Before Printing This Document

I, Vincent J. Toner, certify that:
1. I have reviewed this report on Form N-CSR of Transamerica ETF Trust;
2. Based on my knowledge, this report does not contain any untrue statement of a material fact or omit to state a material factnecessary to make the statements made, in light of the circumstances under which such statements were made, notmisleading with respect to the period covered by this report;
3. Based on my knowledge, the financial statements, and other financial information included in this report, fairly present inall material respects the financial condition, results of operations, changes in net assets, and cash flows (if the financialstatements are required to include a statement of cash flows) of the Registrant as of, and for, the periods presented in thisreport;
4. The Registrant�s other certifying officer and I are responsible for establishing and maintaining disclosure controls andprocedures (as defined in rule 30a-3(c) under the Investment Company Act of 1940) and internal control over financialreporting (as defined in rule 30a-3(d) under the Investment Company Act of 1940) for the Registrant and have:
a. Designed such disclosure controls and procedures, or caused such disclosure controls and procedures to be designedunder our supervision, to ensure that material information relating to the Registrant, including its consolidatedsubsidiaries, is made known to us by others within those entities, particularly during the period in which this report isbeing prepared;
b. Designed such internal control over financial reporting, or caused such internal control over financial reporting to bedesigned under our supervision, to provide reasonable assurance regarding the reliability of financial reporting and thepreparation of financial statements for external purposes in accordance with generally accepted accounting principles;
c. Evaluated the effectiveness of the Registrant�s disclosure controls and procedures and presented in this report ourconclusions about the effectiveness of the disclosure controls and procedures, as of a date within 90 days prior to thefiling date of this report based on such evaluation; and
d. Disclosed in this report any change in the Registrant�s internal control over financial reporting that occurred duringthe second fiscal half-year of the period covered by this report that has materially affected, or is reasonably likely tomaterially affect, the Registrant�s internal control over financial reporting; and
5. The Registrant�s other certifying officer and I have disclosed to the Registrant�s auditors and the audit committee of theRegistrant�s Board of Trustees (or persons performing equivalent functions):
a. All significant deficiencies and material weaknesses in the design or operation of internal control over financialreporting which are reasonably likely to adversely affect the Registrant�s ability to record, process, summarize andreport financial information; and
b. Any fraud, whether or not material, that involves management or other employees who have a significant role in theRegistrant�s internal control over financial reporting.
Date: September 2, 2021 By: /s/ Vincent J. TonerVincent J. Toner
Title: Vice President, Treasurer, PrincipalFinancial Officer and PrincipalAccounting Officer
Copyright © 2021 www.secdatabase.com. All Rights Reserved.Please Consider the Environment Before Printing This Document

Exhibit 13(b)Section 906 N-CSR Certification of Principal Executive Officer and Principal Financial Officer
TRANSAMERICA ETF TRUSTFOR THE PERIOD ENDED JUNE 30, 2021
FORM N-CSR CERTIFICATION
CERTIFICATION PURSUANT TO18 U.S.C. SECTION 1350, AS ADOPTED PURSUANT TOSECTION 906 OF THE SARBANES-OXLEY ACT OF 2002
In connection with the Certified Shareholder Report of Transamerica ETF Trust (the �Trust�) on Form N-CSR for the period endedJune 30, 2021, as filed with the Securities and Exchange Commission on the date hereof (the �Report�), each of the undersigned herebycertifies that, to his or her knowledge:
(1) The Report fully complies with the requirements of Section 13(a) or 15(d) of the Securities Exchange Act of 1934;
(2) The information contained in the Report fairly presents, in all material respects, the financial condition and results ofoperations of the Fund.
/s/ Marijn P. Smit Date: September 2, 2021Marijn P. SmitPresident and Chief Executive Officer(Principal Executive Officer)
/s/ Vincent J. Toner Date: September 2, 2021Vincent J. TonerVice President, Treasurer, Principal FinancialOfficer and Principal Accounting Officer
A signed original of this written statement required by Section 906 of the Sarbanes-Oxley Act of 2002 has been provided to theRegistrant and will be retained by the Registrant and furnished to the Securities and Exchange Commission or its staff upon request.
Copyright © 2021 www.secdatabase.com. All Rights Reserved.Please Consider the Environment Before Printing This Document
Related Documents