1 TransAlta Renewables Inc. Investor Presentation January 2017

Welcome message from author
This document is posted to help you gain knowledge. Please leave a comment to let me know what you think about it! Share it to your friends and learn new things together.
Transcript

11
TransAlta Renewables Inc.
Investor Presentation
January 2017

22
This presentation may include forward-looking statements or information (collectively referred to herein as “forward-looking statements”) within the meaning of
applicable securities legislation. All forward-looking statements are based on TransAlta Renewables Inc.’s (“the Company”) beliefs as well as assumptions based
on information available at the time the assumptions were made and on management’s experience and perception of historical trends, current conditions, and
expected future developments, as well as other factors deemed appropriate in the circumstances. Forward-looking statements are not facts, but only predictions
and generally can be identified by the use of statements that include phrases such as “may”, “will”, “believe”, “expect”, “an ticipate”, “intend”, “plan”, “project”,
“foresee”, “potential”, “enable”, “continue”, or other comparable terminology. These statements are not guarantees of the Company’s future performance and are
subject to risks, uncertainties, and other important factors that could cause our actual performance to be materially different from that projected. In particular, this
presentation contains forward-looking statements pertaining to, without limitation, the following: dividend per share growth; comparable EBITDA for 2016;
comparable cash available for distribution for 2016; payout ratio; financing plans; the timing and costs associated with commissioning the South Hedland Power
Project and the expected EBITDA to be generated from South Hedland; the Company’s medium term priorities, including issuing long-term debt to repay credit
facilities and pursuing additional growth; anticipated $400 to $600 million of additional borrowing capability on existing assets; TransAlta Corporation maintaining
its position as the majority shareholder or sponsor; the continued alignment of interests between TransAlta Corporation and the Corporation; and the potential
drop-down of additional assets from TransAlta Corporation.
These forward-looking statements are not historical facts but reflect current expectations concerning future plans, actions and results. These statements are
subject to a number of risks and uncertainties that could cause actual plans, actions and results to differ materially from current expectations including, but not
limited to: changes in tax, environmental, and other laws and regulations; the regulatory and political environments in the jurisdictions in which we operate;
adverse regulatory developments, including unanticipated impacts on existing generation; environmental requirements and changes in, or liabilities under, these
requirements; changes in general economic conditions including interest rates; operational risks involving our facilities, including unplanned outages at such
facilities; disruptions in the transmission and distribution of electricity; the effects of weather; disruptions in the source of fuels, water, or wind required to operate
our facilities; competitive factors in the power industry; operational breakdowns, failures, or other disruptions; changes in economic and market conditions; and
other risks and uncertainties discussed in the Company's materials filed with the Canadian securities regulatory authorities from time to time and as also set forth
in the Company’s MD&A and 2016 Annual Information Form for the year ended December 31, 2015. Readers are cautioned not to place undue reliance on
these forward-looking statements, which reflect the Company's expectations only as of the date of this presentation. The purpose of the financial outlooks
contained herein is to give the reader information about management's current expectations and plans and readers are cautioned that such information may not
be appropriate for other purposes. The Company disclaims any intention or obligation to update or revise these forward-looking statements, whether as a result
of new information, future events or otherwise, except as required by law
The Company evaluates its performance and the performance of our business segments using a variety of measures. Certain of the financial measures
discussed in this presentation are not defined under International Financial Reporting Standards (IFRS) and, therefore, should not be considered in isolation or
as an alternative to IFRS measures when assessing the financial performance or liquidity of the Company. These non-IFRS measures may not be comparable to
similar measures presented by other issuers and should not be considered in isolation or as a substitute for measures prepared in accordance with IFRS. Refer
to the Company’s MD&A, which is available on the Company’s website or under the Company’s profile on www.sedar.com for further discussion of these Items,
including, where applicable, reconciliations to measures calculated in accordance with IFRS.
Unless otherwise specified, all dollar amounts are expressed in Canadian dollars.
Forward Looking Statements

33
Leading Power Energy Infrastructure Company
• Diversified asset base with 40 facilities spanning multiple regions
• Highly contracted portfolio – weighted average contract life of 15 years
• Prudent payout ratio of 80% to 85% of Comparable CAFD1
• Proven track record for growth
• Solid balance sheet
• Strong sponsorship from TransAlta Corporation
¹ Comparable cash available for distribution (Comparable CAFD) refers to the amount of cash generated from operations after deducting sustaining capital and distributions to non-
controlling interests, excluding the effects of timing and working capital on distributions from subsidiaries of TransAlta in which the Company holds an economic interest and less
principal repayments of amortizing debt.

44
TransAlta Renewables (TSX:RNW)
Enterprise Value1 $4.6 billion
Market Cap.2 $3.6 billion
2016 Comparable EBITDA (guidance) $365 - $390 million
2016 Comparable CAFD (guidance) $210 - $235 million
Dividend Yield 6.1%
Expected Near-Term Dividend Growth (once South Hedland is commissioned in 2017)
6% - 7%
TransAlta Corporation’s Ownership3 64%
¹ Does not include capital required to complete South Hedland Project2 Based on December 30, 2016 closing share price ($14.34) and including Class B shares3 Including Class B shares
Provides stable and consistent returns for investors through the ownership of
highly contracted power generation and other infrastructure assets

55
Our Platform
• Highly diversified portfolio including over 2,600 MW of generating capacity
Wind
1,248 MW
18 facilities
Hydro
112 MW
13 facilities
Gas Fired
575 MW
7 facilities
Gas Pipeline
270 KM
43% interest
North American Gas and Renewables Australian Gas
Gas Fired
506 MW
1 facility
Note: Segmented capacity reflects net capacity ownership interest

66
Highly diversified cash flows from 40 operating
sites in Canada, the US and Australia
Diversified Asset Platform and Customer Base
Significant Diversification1 High Quality Counterparties
1 Based on EBITDA contribution including the estimated contribution for a full year of operations
from the South Hedland Power Station
Wind Pipeline
Hydro Gas-FiredCanada U.S. Australia
Significant Diversification by Geography, Technology and Counterparty
77
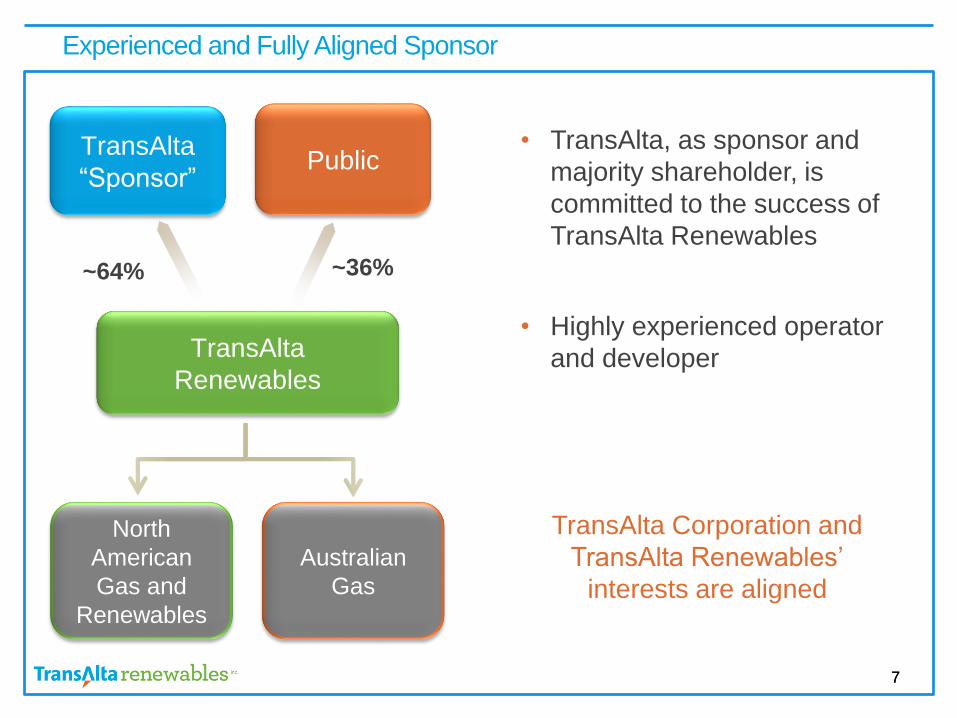
Experienced and Fully Aligned Sponsor
TransAlta Corporation and
TransAlta Renewables’
interests are aligned
• TransAlta, as sponsor and
majority shareholder, is
committed to the success of
TransAlta Renewables
• Highly experienced operator
and developerTransAlta
Renewables
TransAlta
“Sponsor”Public
~64% ~36%
North
American
Gas and
Renewables
Australian
Gas

88
Strong Performance Since IPO
• Delivered solid financial and operational performance
• Added ~$2.4 billion in new assets
• Significantly increased dividend and public float
• Added to the S&P/TSX Composite Index in March 2016
• Completed approximately $600 million of project level financing in 2015/16
99
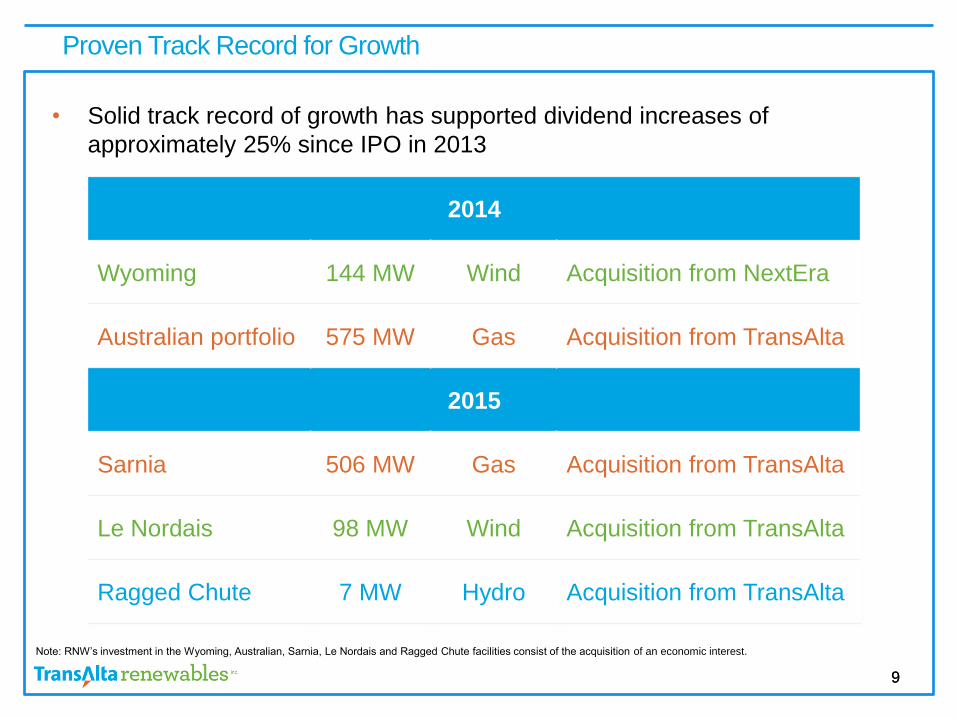
Proven Track Record for Growth
• Solid track record of growth has supported dividend increases of
approximately 25% since IPO in 2013
2014
Wyoming 144 MW Wind Acquisition from NextEra
Australian portfolio 575 MW Gas Acquisition from TransAlta
2015
Sarnia 506 MW Gas Acquisition from TransAlta
Le Nordais 98 MW Wind Acquisition from TransAlta
Ragged Chute 7 MW Hydro Acquisition from TransAlta
Note: RNW’s investment in the Wyoming, Australian, Sarnia, Le Nordais and Ragged Chute facilities consist of the acquisition of an economic interest.
1010
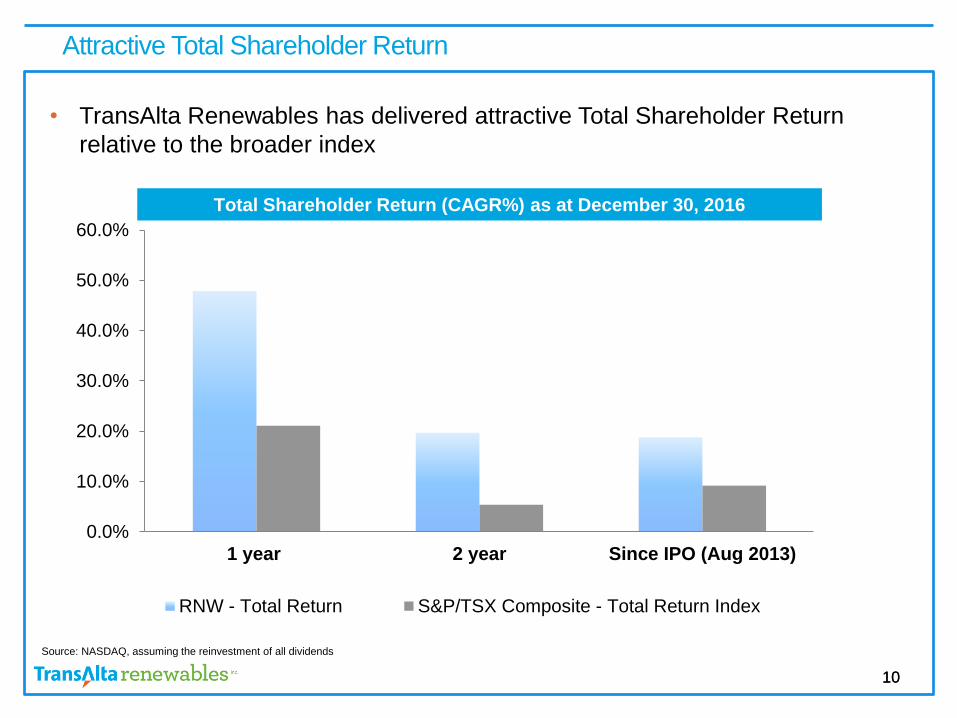
Attractive Total Shareholder Return
• TransAlta Renewables has delivered attractive Total Shareholder Return
relative to the broader index
Source: NASDAQ, assuming the reinvestment of all dividends
Total Shareholder Return (CAGR%) as at December 30, 2016
0.0%
10.0%
20.0%
30.0%
40.0%
50.0%
60.0%
1 year 2 year Since IPO (Aug 2013)
RNW - Total Return S&P/TSX Composite - Total Return Index

1111
Proven Track Record For Growth
$0.75 $0.77
$0.84 $0.88
$0.94
$0.00
$0.20
$0.40
$0.60
$0.80
$1.00
At IPO 2014 Actuals 2015 Actuals 2016 2017/2018
~9%Australian
Assets
~5%Three
Canadian
Projects
~6%-7%South
Hedland
2.7%
Wyoming
Wind
Accretive Acquisitions Have Driven Significant Dividend Growth
(Aug 2013)
Estimated Dividend per Share Growth
1212
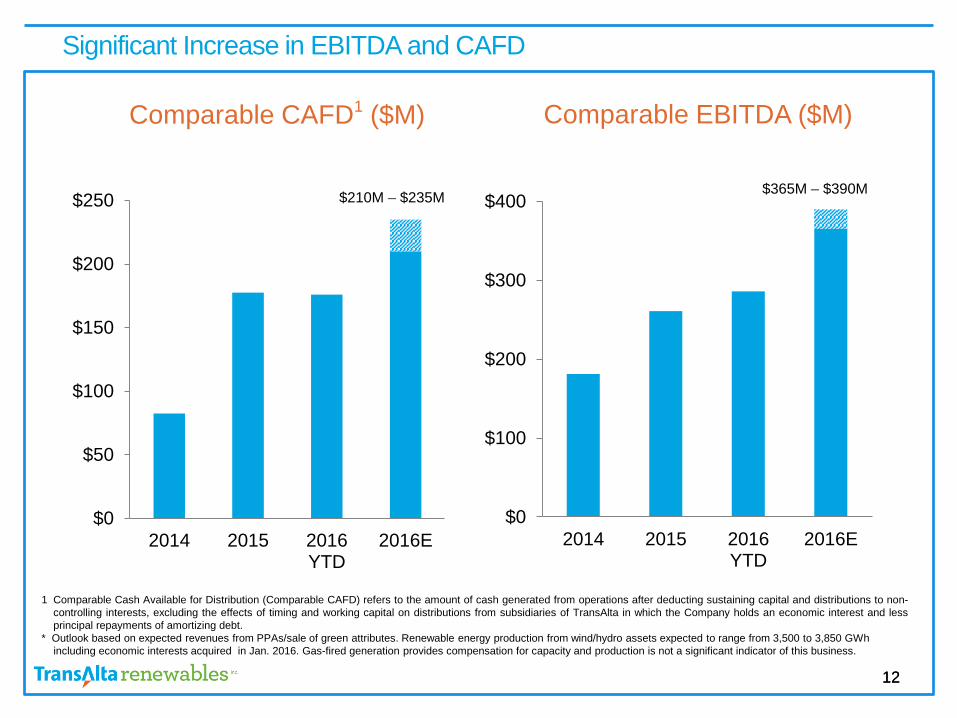
Significant Increase in EBITDA and CAFD
1 Comparable Cash Available for Distribution (Comparable CAFD) refers to the amount of cash generated from operations after deducting sustaining capital and distributions to non-
controlling interests, excluding the effects of timing and working capital on distributions from subsidiaries of TransAlta in which the Company holds an economic interest and less
principal repayments of amortizing debt.
* Outlook based on expected revenues from PPAs/sale of green attributes. Renewable energy production from wind/hydro assets expected to range from 3,500 to 3,850 GWh
including economic interests acquired in Jan. 2016. Gas-fired generation provides compensation for capacity and production is not a significant indicator of this business.
$0
$100
$200
$300
$400
2014 2015 2016YTD
2016E
Comparable EBITDA ($M)
$365M – $390M
$0
$50
$100
$150
$200
$250
2014 2015 2016YTD
2016E
Comparable CAFD1 ($M)
$210M – $235M
1313
Stable and Sustainable Cash Flows
• Cash flow diversification through number of assets, regions and counterparties
• Prudent payout ratio target of 80 – 85%
• Foreign exchange risk hedged
• Credit risk management through guarantees, letters of credit and wholesale
credit insurance programs
• TransAlta Corporation retains schedule and cost risks of South Hedland
greenfield project
• Future financing plans to align with long-term nature of assets

1414
South Hedland Power Station
150 MW Combined Cycle Gas Power Station in Western Australia
• Fully contracted until 2042 with strong counterparties including 75%
contracted with Horizon Power (AA+ rating)
• Commissioning expected in mid-2017
• Expected to generate ~$80 million of EBITDA on an annualized basis
1515
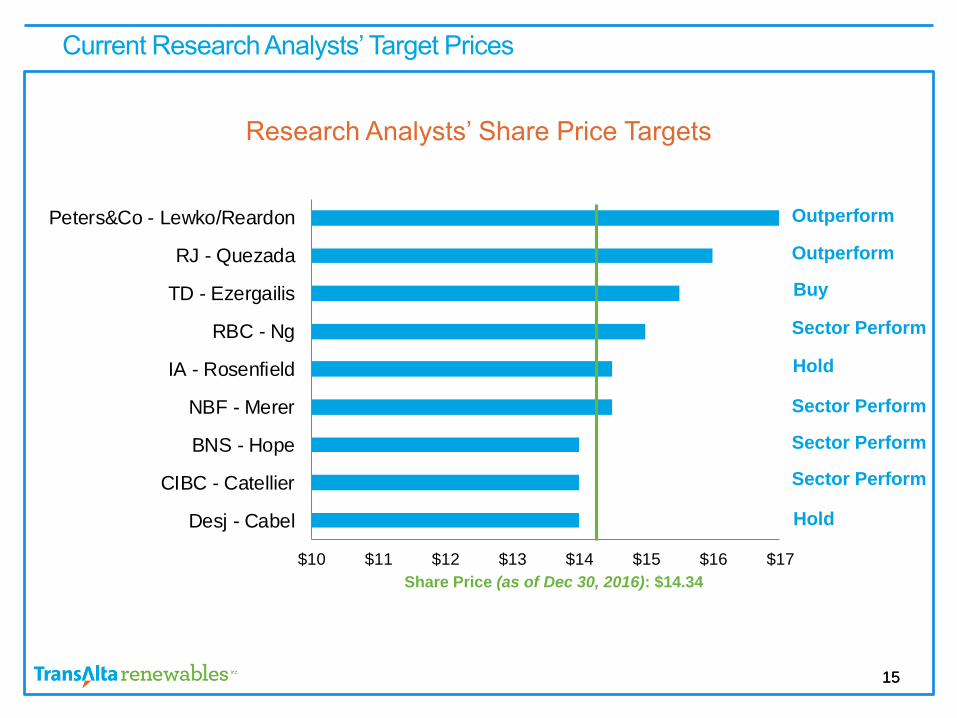
$10 $11 $12 $13 $14 $15 $16 $17
Desj - Cabel
CIBC - Catellier
BNS - Hope
NBF - Merer
IA - Rosenfield
RBC - Ng
TD - Ezergailis
RJ - Quezada
Peters&Co - Lewko/Reardon
Current Research Analysts’ Target Prices
Share Price (as of Dec 30, 2016): $14.34
Research Analysts’ Share Price Targets
Sector Perform
Outperform
Buy
Hold
Sector Perform
Sector Perform
Sector Perform
Hold
Outperform

1616
Attractive Dividend
Dividend Yield Comparison1
TransAlta Renewables Trading at an Attractive Dividend Yield
1 Based on the closing price as of December 30, 2016.2 Other companies include Algonquin Power, Brookfield Renewables, Enbridge Income Fund, Innergex, Northland Power, NRG Yield, NextEra Energy Partners, Pattern Energy.
Average
(~6.1%)
0% 1% 2% 3% 4% 5% 6% 7% 8% 9% 10%
Other Companies²

1717
Medium Term Priorities
• Issue long-term project debt to repay credit facilities (~$50M), fund the
remaining construction of South Hedland (~$300M), and refinance
upcoming maturities (~$200M)
• Completed $159 million of project level financing in June 2016
• Commission South Hedland on time, on budget
• Pursue additional growth through third party acquisitions/additional drop-
downs from TransAlta Corporation
• Continue to deliver solid operational results and pursue high returning
productivity improvements

1818
Significant Drop-Down Inventory
~1,300 MWs of Potential Drop-Down Candidates from TransAlta Corporation
Gas Fired
Generation
• ~400 MW in Alberta & Ontario including:
• 230 MW Poplar Creek facility in AB
• ~150 MW from 4 facilities through TA Cogen
Alberta Hydro• ~800 MW from 13 units in Alberta, representing
90% of Alberta’s hydro
Other
Renewables
• 20 MW wind facility in ON
• 50 MW wind facility in Minnesota
• 21 MW solar facilities in
Massachusetts

1919
Investment Highlights
• Scale and diversification
• High quality assets and proven technology
• Long-term contracted portfolio
• Attractive yield and strong balance sheet
• Long term alignment with TransAlta as a sponsor and majority shareholder
• Well positioned to grow with an anticipated $400 to $600 million of
additional borrowing capability on existing assets
Related Documents