Transactional Analysis for Effective Fraud Detection Doug Burton ACL Services Ltd.

Transactional Analysis for Effective Fraud Detection Doug Burton ACL Services Ltd.
Dec 24, 2015
Welcome message from author
This document is posted to help you gain knowledge. Please leave a comment to let me know what you think about it! Share it to your friends and learn new things together.
Transcript

Transactional Analysis for Effective Fraud Detection
Doug Burton
ACL Services Ltd.

ELMER IREYChief of the US Treasury Enforcement Branch and head of the IRS Special Intelligence Unit (formed in 1919 primarily to combat employee crime)
• Instrumental in convicting Al Capone of tax evasion
• Served as an ally and partner to law enforcement
• Americas first high profile Forensic Accountant
Today’s Objectives
The magnitude of fraud
Fraud detection and internal controls
The role of technology
Continuous monitoring for fraud
Occupational Fraud and Abuse
“The use of one’s occupation for personal enrichment through the deliberate misuse or misapplication of the employing organization’s resources or assets”
“Deception brought about by the willful misrepresentation of significant material facts, or silence when good faith requires expression, resulting in material damage to one who relies on those facts and has a reasonable right to do so”
“An intentional act which is concealed, resulting in a personal benefit to the perpetrator and resulting in harm to the organization”

What is Your Cost of Fraud?
U.S. organizations lose about $4,500 per employee annually as a result of occupational fraud and abuse*
How many employees do you have?
* Association of Certified Fraud Examiners, 2002 Report to the Nation on Occupational Fraud and Abuse
5,000 Employees
X $ 4,500
$ 2,250,000 Annual Cost of Fraud

U.S. organizations, on average, lose 6% of revenues to fraud.
This represents a potential loss of $600 billion to fraud annually within the U.S.
What is your annual gross revenue ?
* Association of Certified Fraud Examiners, 2002 Report to the Nation on Occupational Fraud and Abuse
$ 10,000,000 Annual Revenue X .06
$ 600,000 Annual Cost of Fraud
What is Your Cost of Fraud?
In addition to the direct cost of fraud, there are significant indirect costs:
Loss of consumer confidence = reduced revenues
Negative PR image = lower stock values
Low employee morale = lower productivity
Inability to retain and attract qualified staff
What is Your Cost of Fraud?
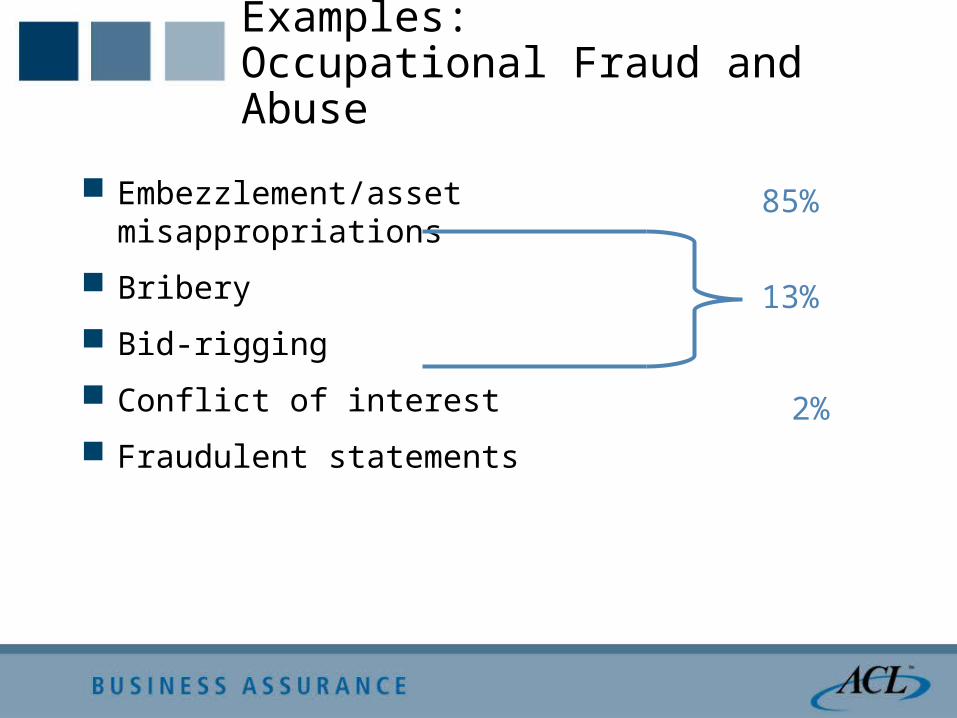
Examples: Occupational Fraud and Abuse
Embezzlement/asset misappropriations
Bribery
Bid-rigging
Conflict of interest
Fraudulent statements
85%
13%
2%

Other Statistics…
Most commonly detected through “tips”Next most common is by accident
Only 7% of fraudsters had prior fraud-related convictionsKnow your F.A.C.T.S.*
(“Fraud is Always Committed by Trusted Souls”)
Average fraud scheme lasts 18 monthsbefore detection
More stats: www.cfenet.com/media/statistics.asp
* Kate Head – University of South Florida

Fraud Detection and Internal Controls
“These (improper) payments occur for many reasons including insufficient oversight or monitoring, inadequate eligibility controls, and automated system deficiencies. However, one point is clear – the basic or root cause of improper payments can typically be traced to a lack of or breakdown in internal controls.”
GAO report on “Coordinated Approach Needed to Address the Government’s Improper Payments Problems” [August 2002]

Sarbanes-Oxley Requirements
Section 302 - Management certification to integrity of Internal Controls must address 4 key points:
Statement of management’s responsibility for establishing and maintaining adequate internal controls
Management’s assessment of the effectiveness of internal controls to include all fraud involving management and employees with significant roles in internal control
A statement identifying the framework used by management as a criteria for evaluating control effectiveness
A statement that the independent accountant has also issued an attested to management’s assessment of internal control.

Commonly Detected Frauds
Accounts payablePhantom vendors
PurchasingPurchase splitting
Kickbacks
Purchase cards Inappropriate, unauthorized purchases
Telecom Inappropriate use of telephone system

Data Analysis in Fraud Detection

Los Angeles Unified School District - Belmont Learning Center
ACL use resulted in the identification of fraud and abuse in excess of $70 millionFictitious vendors
Duplicate payments
Over-billing
No competitive bidding
Policy violations Exceeding purchasing limits
Improper coding
Data Analysis in Fraud Detection

The Traditional Role of the Auditor in Detecting Fraud
Typically a reactive role – tips
Based on examining selected samples of transactions
Testing of existing controlsACFE survey says 90% of managers place their
confidence in internal controls
Limited use of technology

The Traditional Role of the Auditor in Detecting Fraud
Typically a reactive role
The longer frauds go undetected, the larger the potential for loss and the smaller the chances of recovery
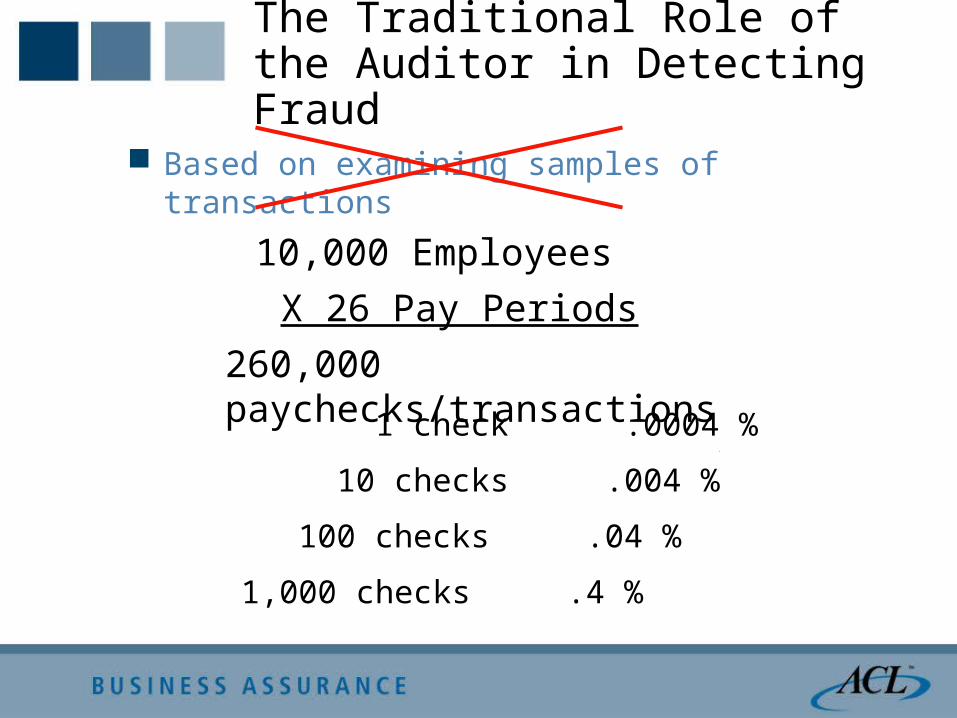
10,000 Employees
X 26 Pay Periods
260,000 paychecks/transactions 1 check .0004 %
10 checks .004 %
100 checks .04 %
1,000 checks .4 %
The Traditional Role of the Auditor in Detecting Fraud
Based on examining samples of transactions
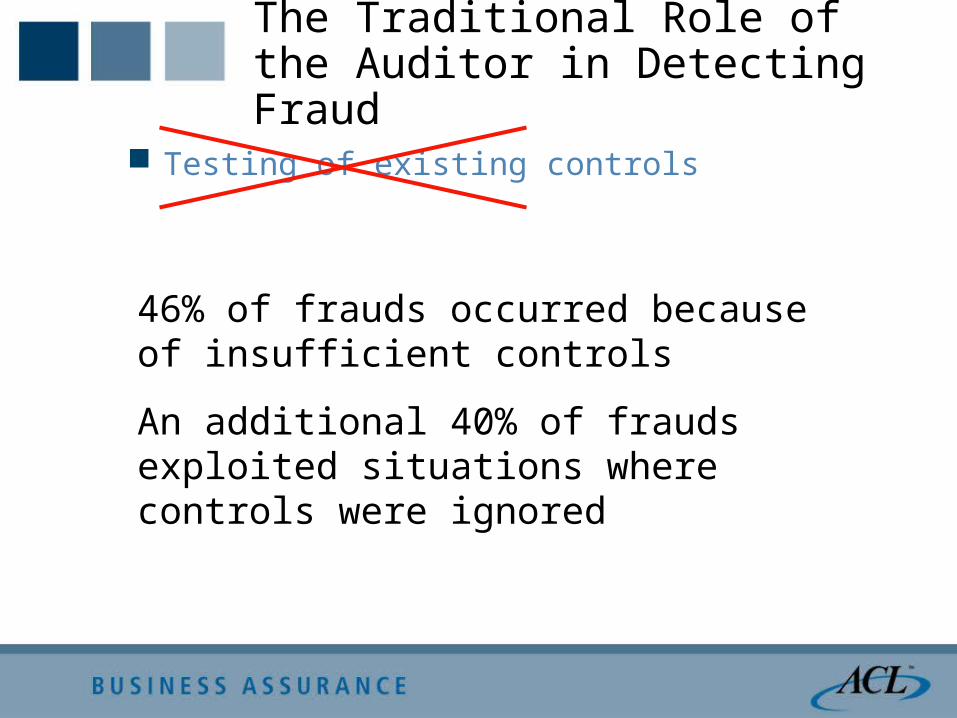
The Traditional Role of the Auditor in Detecting Fraud
Testing of existing controls
46% of frauds occurred because of insufficient controls
An additional 40% of frauds exploited situations where controls were ignored

The Traditional Role of the Auditor in Detecting Fraud
Limited use of technology
Both the AICPA and the ACFE specifically refer to the use of data analysis to assist in fraud detection

The Role of Technology in Fraud Detection and Investigation
Perform risk analysis
Look for indicators of fraud
Review 100% of transactions
Compare data within different databases and computer systems
Determine impact of fraud
Proactive tests
Continuous monitoring
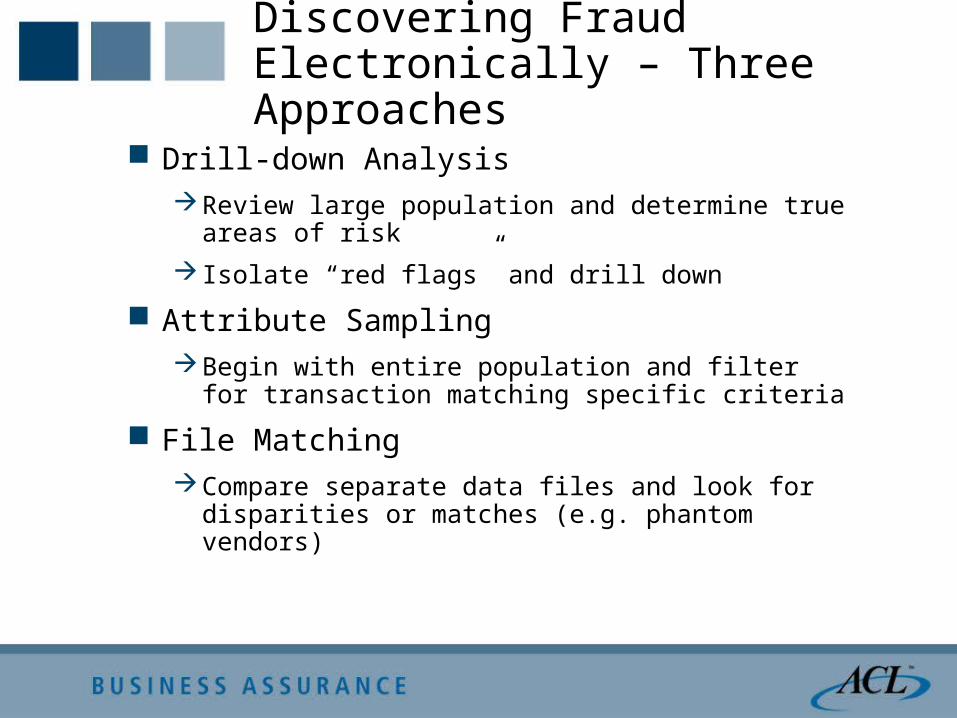
Discovering Fraud Electronically – Three Approaches
Drill-down AnalysisReview large population and determine true
areas of risk
Isolate “red flags” and drill down
Attribute SamplingBegin with entire population and filter for
transaction matching specific criteria
File MatchingCompare separate data files and look for
disparities or matches (e.g. phantom vendors)

Data analysis will provide: Indication of where to look
Indication of the depth and scope of the problem
Direct pointers to critical evidence
Proof
Findings
The Role of Technology in Fraud Detection and Investigation
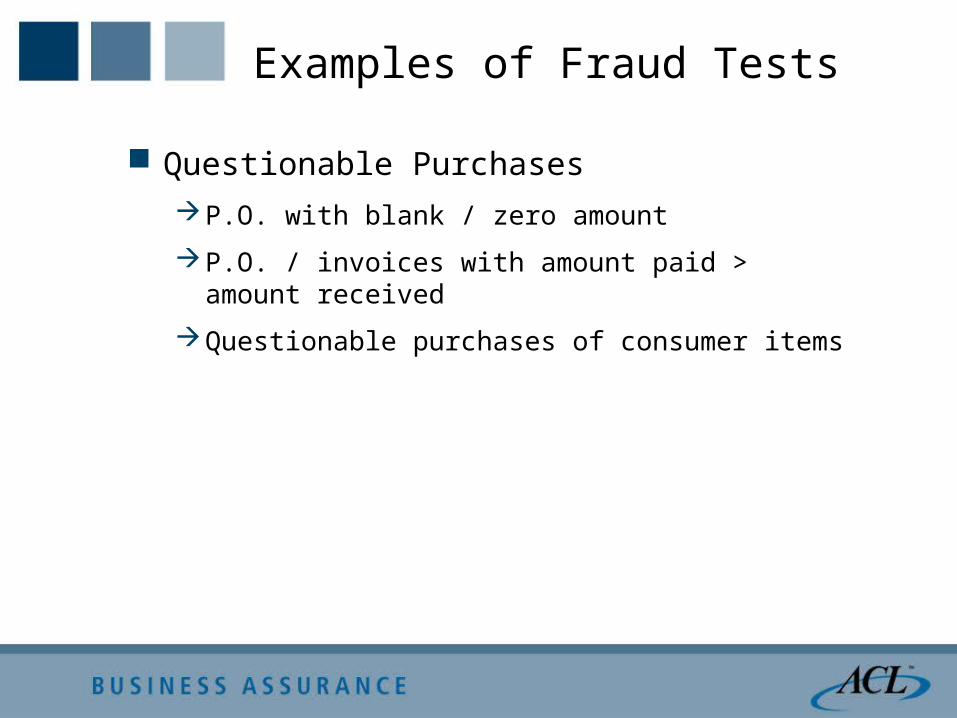
Examples of Fraud Tests
Questionable PurchasesP.O. with blank / zero amount
P.O. / invoices with amount paid > amount received
Questionable purchases of consumer items
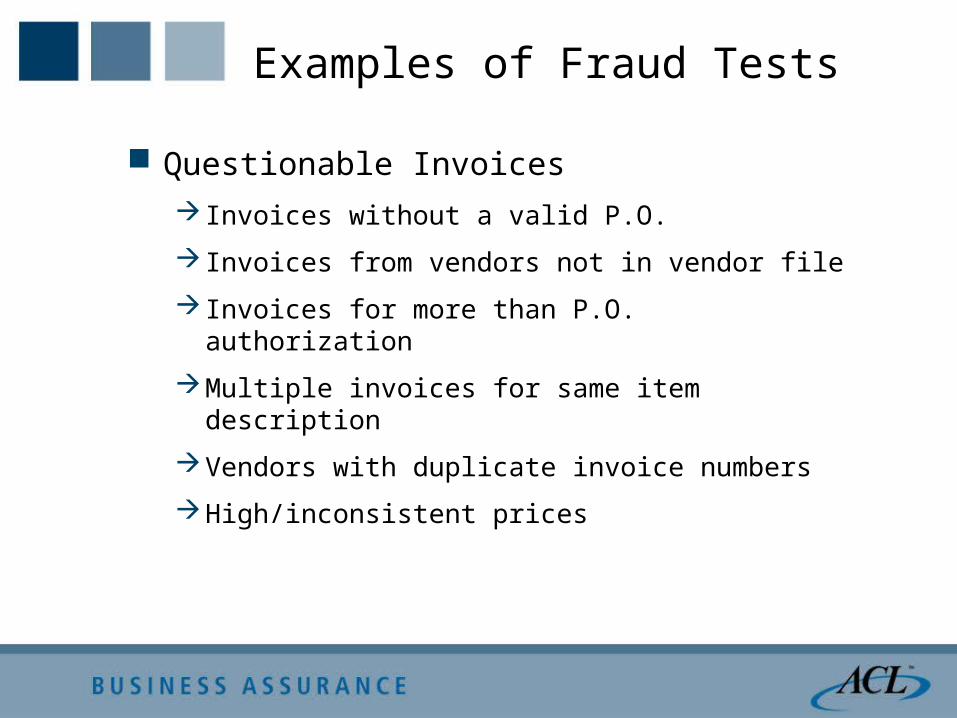
Examples of Fraud Tests
Questionable Invoices Invoices without a valid P.O.
Invoices from vendors not in vendor file
Invoices for more than P.O. authorization
Multiple invoices for same item description
Vendors with duplicate invoice numbers
High/inconsistent prices

Examples of Fraud Tests
Questionable Invoices Invoices for same amount on the same date
Multiple invoices for same P.O. and date
Sequential invoices
Invoices with no matching receiving report
New or non-approved vendors

Examples of Fraud Tests
“Phantom” and other vendor testsVendor/employee name match
Employee and vendor with same address orphone number
Vendor address is a mail drop
High number of returns by vendor
Payment without invoice
Missing inventory
Duplicate documents

Moderate to High Risk
Moderate Risk
High RiskModerate
RiskModerate to High Risk
Low RiskModerate
Risk
Low Risk
Assessing Risk
Measure $ Impact Based on Expected Occurrences
Probability of
Occurrence
Financial Impact
LOW HIGH
HIGH
Low RiskLOW
HIGH
MODERATE
MODERATE
MODERATE
Challenges to Effective Fraud Detection
Data sampling
Disparate data sources; complex IT systems
Ad hoc analysis

Issues With Sampling
Sampling is only effective with problemsthat are relatively consistent throughout a data population
Fraudulent transactions by nature do not occur randomly
Fraudulent transactions often fall “within bounds” for standard testing and therefore do not get flagged
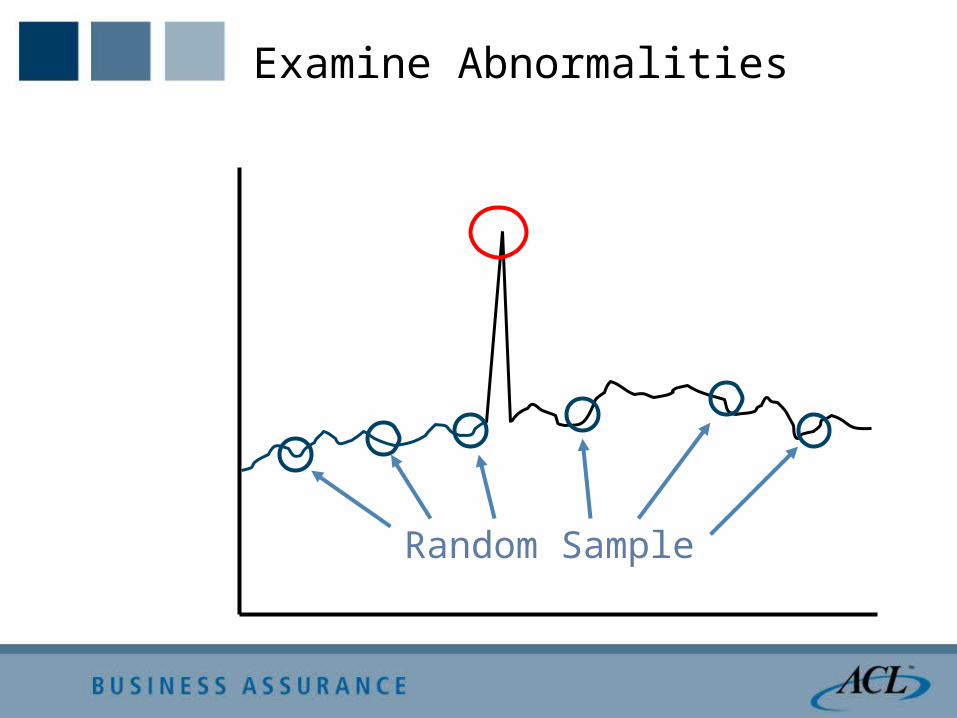
Examine Abnormalities
Random Sample
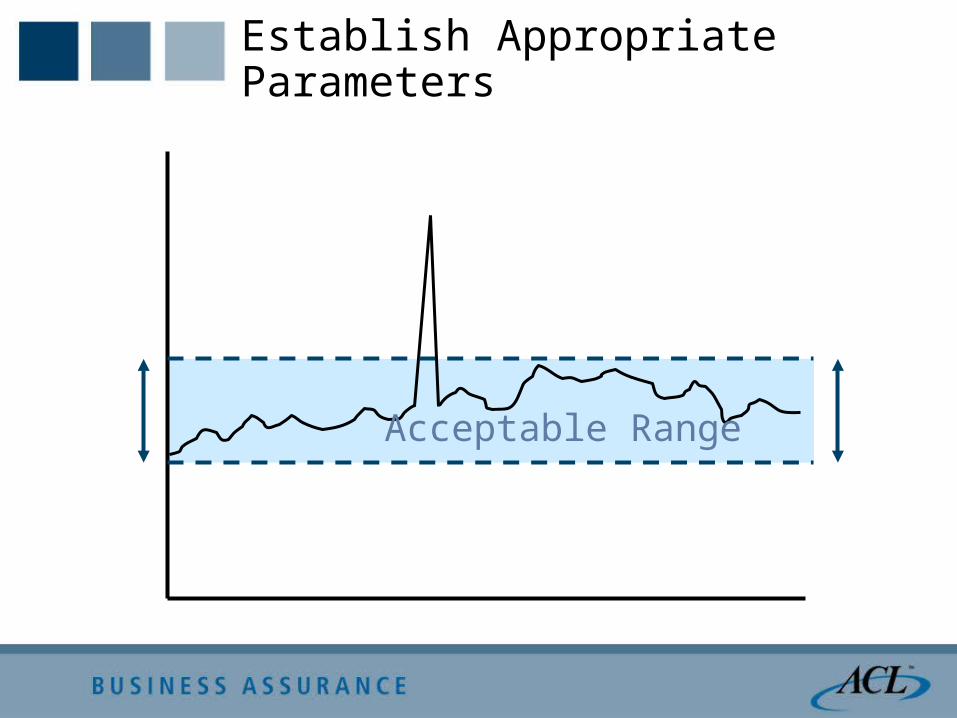
Establish Appropriate Parameters
Acceptable Range
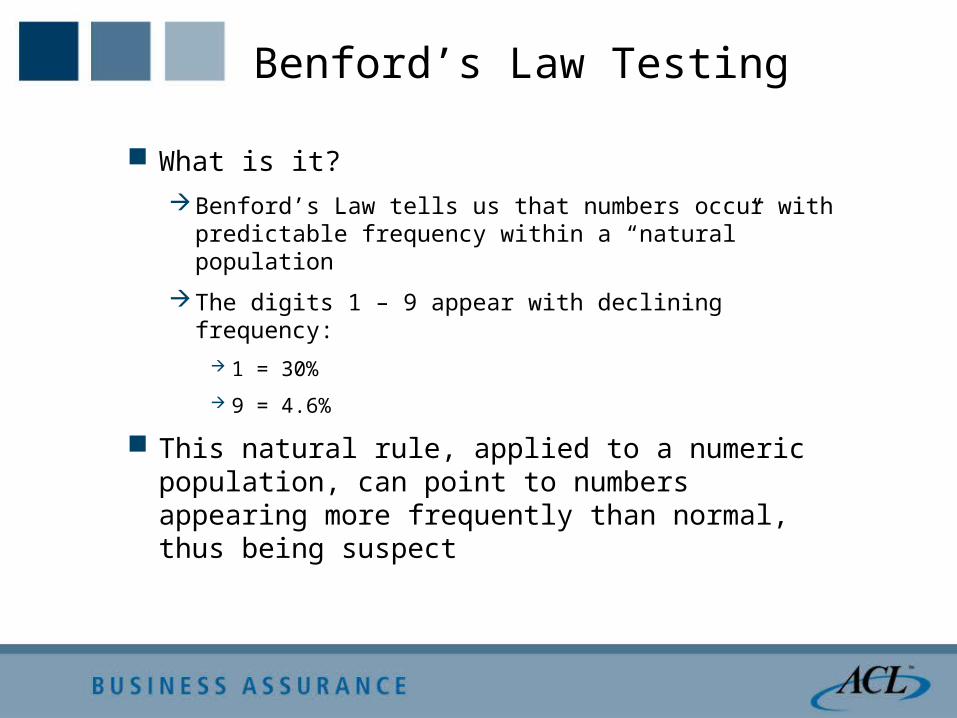
Benford’s Law Testing
What is it?Benford’s Law tells us that numbers occur with
predictable frequency within a “natural” population
The digits 1 – 9 appear with declining frequency: 1 = 30%
9 = 4.6%
This natural rule, applied to a numeric population, can point to numbers appearing more frequently than normal, thus being suspect
Benford’s Law - Example
Audit review of physician billings
Benford’s Law testing identified a “spike” in the number 3
Of these records, 22 percent were submitted by one doctor
Subsequent analysis revealed impossibly high daily billings
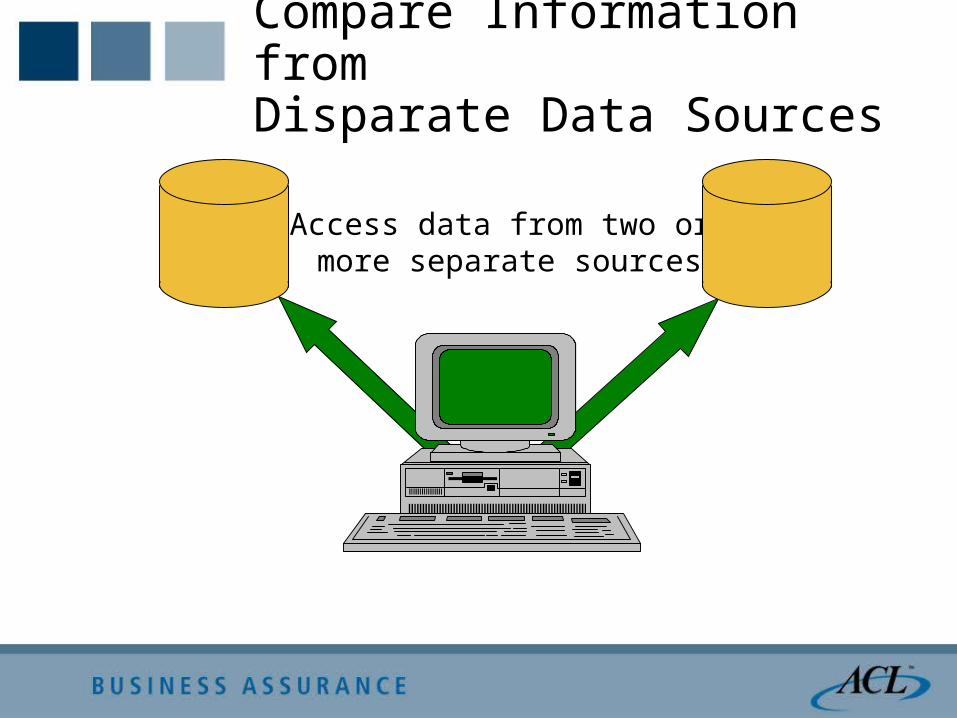
Access data from two or more separate sources
Compare Information from Disparate Data Sources

Convert/harmonizedata into comparable
structures
Access data from two or more separate sources
Compare Information from Disparate Data Sources

Convert/Harmonizedata into comparable
structures
Combine data intosingle or relatedfile for analysis
Access data from two or more separate sources
Compare Information from Disparate Data Sources
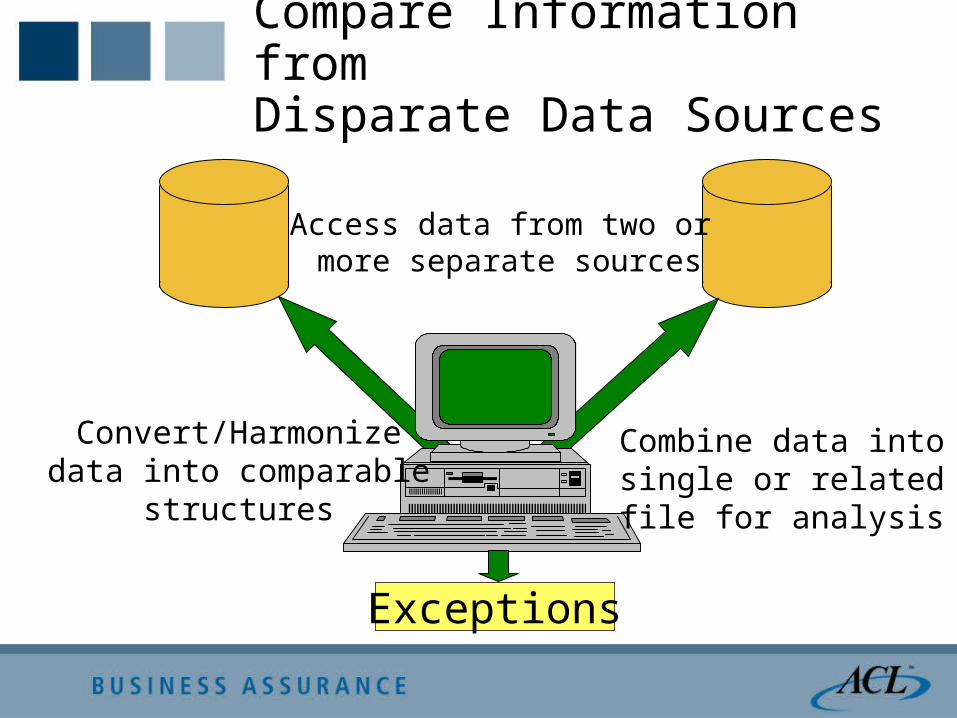
Exceptions
Convert/Harmonizedata into comparable
structures
Combine data intosingle or relatedfile for analysis
Access data from two or more separate sources
Compare Information from Disparate Data Sources
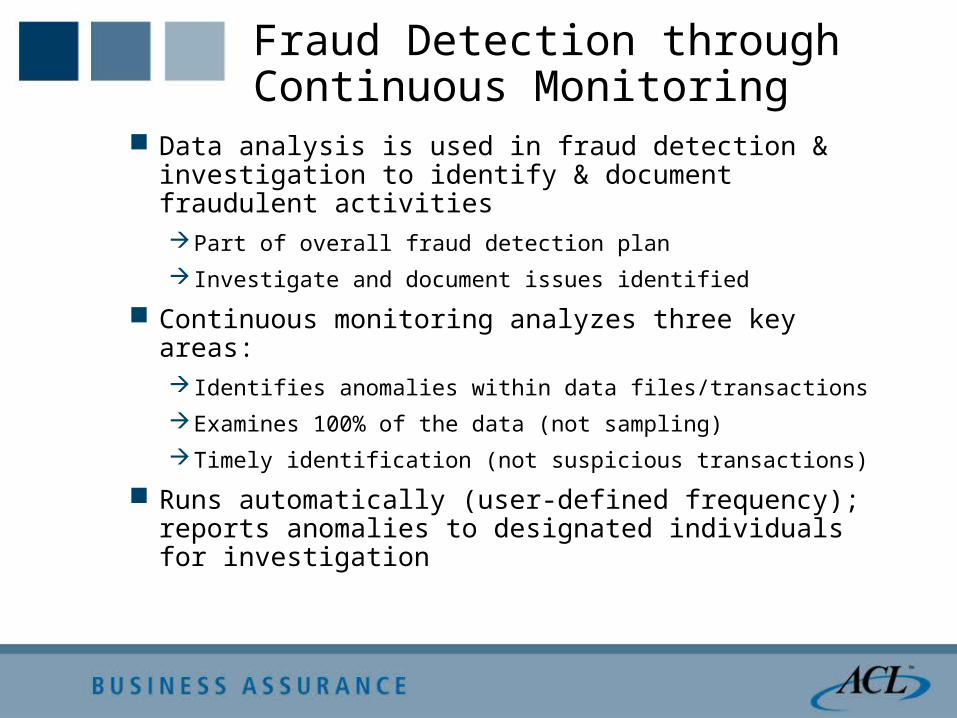
Fraud Detection throughContinuous Monitoring
Data analysis is used in fraud detection & investigation to identify & document fraudulent activitiesPart of overall fraud detection plan
Investigate and document issues identified
Continuous monitoring analyzes three key areas: Identifies anomalies within data files/transactions
Examines 100% of the data (not sampling)
Timely identification (not suspicious transactions)
Runs automatically (user-defined frequency); reports anomalies to designated individuals for investigation

Reporting Medium
Continuous Monitoring Process
Primary Transaction
Data
Other Sources:•Master Files•Related Data•Other References
Data OutputData Output
FRAUD TESTSFRAUD TESTSDATA
ANALYSIS
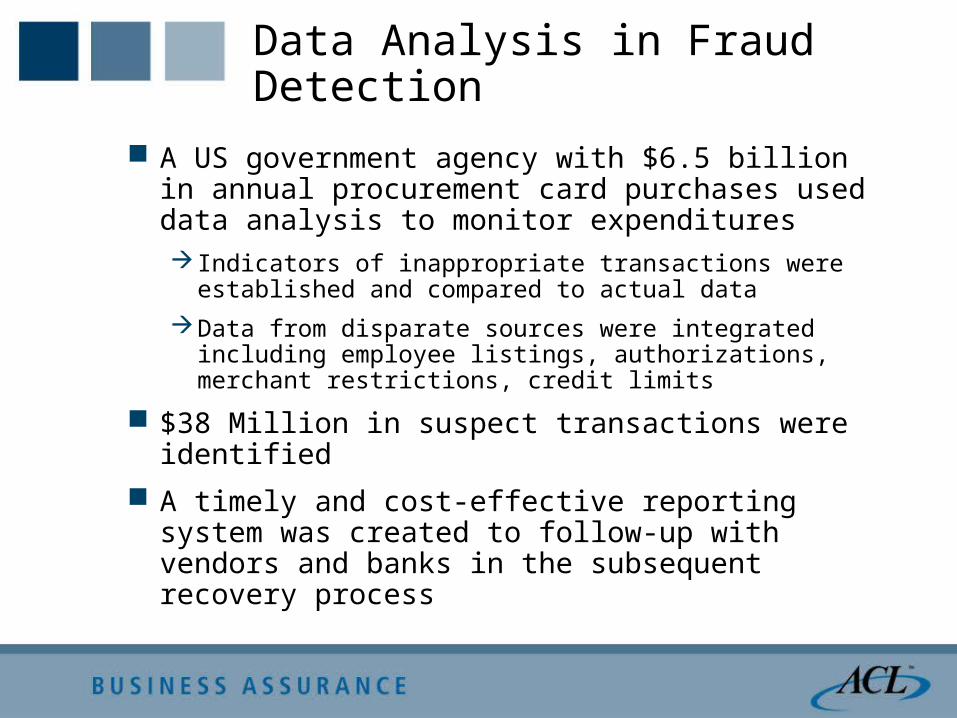
Data Analysis in Fraud Detection
A US government agency with $6.5 billion in annual procurement card purchases used data analysis to monitor expenditures Indicators of inappropriate transactions were
established and compared to actual data
Data from disparate sources were integrated including employee listings, authorizations, merchant restrictions, credit limits
$38 Million in suspect transactions were identified
A timely and cost-effective reporting system was created to follow-up with vendors and banks in the subsequent recovery process

Data Analysis in Fraud Detection
A large healthcare insurer was defrauded of more than $25 million in claimsA routine claims audit identified an abnormal
number of transactions of a certain value (through data analysis)
By implementing a continuous monitoring application, the organization may have identified the anomalies earlier in the process
Fraud exposure would have been reduced
Process improvements would have been identified

Benefits of Continuous Monitoring
Confirms/validates effectiveness of controls
Mitigates deficient control structures
Monitors data from disparate systems to provide holistic view of transactions
Provides independent assurance
Identifies further process improvement opportunities
Identifies suspicious transactions in a timely manner
Reduces waste, enhances recoveries

Status of Continuous Monitoring
Fastest growing area within audit and control community
Increasingly more common in organizations
Organizational challenges for widespread implementation:Technological barriers; difficulties of access to data
Assumption that effective application controls are in place
Perception that sampling is an effective control assessment methodology
Lack of detailed understanding of exactly what and how to test
Recommendation – seek expert advice

Implementation of a Fraud Detection Program
1. Build a profile of potential frauds which can then be tested
2. Analyze data to identify possible indicators of fraud
3. Implement continuous monitoring of high-risk business functions to automate the detection process
4. Investigate and drill down into patterns which emerge via data analysis/detection process

Thank you!
Related Documents