Transaction Costs and Institutional Performance in Market-Based Environmental Water Allocation Dustin Garrick and Bruce Aylward ABSTRACT. Policy reforms in the Columbia Basin spurred water rights reallocation for ecological re- covery. Transaction costs have caused implementa- tion to lag. This paper examines transaction costs and institutional performance in environmental water al- location. It evaluates spatial and temporal perfor- mance trends in watershed cases along three dimensions of adaptive efficiency: water recovery, transaction costs, and program budgets. Performance trends demonstrate intrastate variability and volatil- ity over time due to the importance of local institu- tional capacity, which is uneven within states. Higher levels of water recovery may coincide with moderate to high transaction costs and program budgets, par- ticularly during initial implementation efforts. This finding reflects investments in multilevel policy reform to strengthen enabling conditions and adapt to un- intended consequences. (JEL Q25, Q58) I. INTRODUCTION Competition for scarce and variable fresh- water resources has forced complex trade-offs between human and ecological needs. Envi- ronmental water requirements are often de- fined after freshwater diversions and uses exceed limits to ecological degradation. Insti- tutional reforms have sought to reallocate wa- ter rights from irrigation to environmental flows through court decisions, administrative rules, and market-oriented transactions (Neu- man, Squier, and Achterman 2006; Anderson and Leal 2001; Loomis et al. 2003; Garrick et al. 2009; Jones and Colby 2010). The precipitous decline of salmon runs in the Columbia Basin (668,000 km 2 ) in the Pa- cific Northwest region of the United States has been attributed in part to freshwater diver- sions. The Columbia Basin experiences spa- tial and temporal mismatches in water supply Land Economics • August 2012 • 88 (3): 536–560 ISSN 0023-7639; E-ISSN 1543-8325 2012 by the Board of Regents of the University of Wisconsin System and demand that contribute to chronic stream flow deficits in the late summer when the nat- ural low flow of the hydrograph coincides with peak irrigation diversions. Water rights institutions in the western United States allow irrigation diversions to dewater over-allocated streams during late summer fish migration and reproduction in the upper tributaries. Policy reforms in the Columbia Basin states have in- corporated environmental flows into the de- sign and implementation of water markets. The market-enabling policy reforms establish limits to freshwater use, tradable water rights, environmental flows as legitimate uses, and public and private financing to restore envi- ronmental flows through water transactions. The incorporation of environmental allo- cations into water markets and associated in- stitutional reforms has not been seamless, however, due to the prevalence of transaction costs—the resources required to define, trans- fer, and manage property rights and to solve collective action problems in natural resource allocation (McCann et al. 2005; Cole 2002). 1 Transaction costs stem from multiple inter- acting sources tied to resource characteristics and users, property rights institutions, and barriers to trade across districts and jurisdic- tions (Bauer 1997; Bjornlund 2004; McCann and Easter 2004; Coggan, Whitten, and Ben- nett 2010). This paper evaluates the effectiveness of market-oriented environmental water alloca- tion by measuring and explaining transaction costs of institutional reform and implementa- tion. Market-oriented environmental water al- 1 See Coase (1960) and Demsetz (1967) for earlier and narrower definitions of transaction costs. The authors are, respectively, researcher, School of Geography and the Environment, University of Ox- ford; and director, Ecosystem Economics, Bend, Oregon.

Welcome message from author
This document is posted to help you gain knowledge. Please leave a comment to let me know what you think about it! Share it to your friends and learn new things together.
Transcript

Transaction Costs and Institutional Performance inMarket-Based Environmental Water AllocationDustin Garrick and Bruce Aylward
ABSTRACT. Policy reforms in the Columbia Basinspurred water rights reallocation for ecological re-covery. Transaction costs have caused implementa-tion to lag. This paper examines transaction costs andinstitutional performance in environmental water al-location. It evaluates spatial and temporal perfor-mance trends in watershed cases along threedimensions of adaptive efficiency: water recovery,transaction costs, and program budgets. Performancetrends demonstrate intrastate variability and volatil-ity over time due to the importance of local institu-tional capacity, which is uneven within states. Higherlevels of water recovery may coincide with moderateto high transaction costs and program budgets, par-ticularly during initial implementation efforts. Thisfinding reflects investments in multilevel policy reformto strengthen enabling conditions and adapt to un-intended consequences. (JEL Q25, Q58)
I. INTRODUCTION
Competition for scarce and variable fresh-water resources has forced complex trade-offsbetween human and ecological needs. Envi-ronmental water requirements are often de-fined after freshwater diversions and usesexceed limits to ecological degradation. Insti-tutional reforms have sought to reallocate wa-ter rights from irrigation to environmentalflows through court decisions, administrativerules, and market-oriented transactions (Neu-man, Squier, and Achterman 2006; Andersonand Leal 2001; Loomis et al. 2003; Garrick etal. 2009; Jones and Colby 2010).
The precipitous decline of salmon runs inthe Columbia Basin (668,000 km2) in the Pa-cific Northwest region of the United States hasbeen attributed in part to freshwater diver-sions. The Columbia Basin experiences spa-tial and temporal mismatches in water supply
Land Economics • August 2012 • 88 (3): 536–560ISSN 0023-7639; E-ISSN 1543-8325� 2012 by the Board of Regents of theUniversity of Wisconsin System
and demand that contribute to chronic streamflow deficits in the late summer when the nat-ural low flow of the hydrograph coincideswith peak irrigation diversions. Water rightsinstitutions in the western United States allowirrigation diversions to dewater over-allocatedstreams during late summer fish migration andreproduction in the upper tributaries. Policyreforms in the Columbia Basin states have in-corporated environmental flows into the de-sign and implementation of water markets.The market-enabling policy reforms establishlimits to freshwater use, tradable water rights,environmental flows as legitimate uses, andpublic and private financing to restore envi-ronmental flows through water transactions.
The incorporation of environmental allo-cations into water markets and associated in-stitutional reforms has not been seamless,however, due to the prevalence of transactioncosts—the resources required to define, trans-fer, and manage property rights and to solvecollective action problems in natural resourceallocation (McCann et al. 2005; Cole 2002).1Transaction costs stem from multiple inter-acting sources tied to resource characteristicsand users, property rights institutions, andbarriers to trade across districts and jurisdic-tions (Bauer 1997; Bjornlund 2004; McCannand Easter 2004; Coggan, Whitten, and Ben-nett 2010).
This paper evaluates the effectiveness ofmarket-oriented environmental water alloca-tion by measuring and explaining transactioncosts of institutional reform and implementa-tion. Market-oriented environmental water al-
1 See Coase (1960) and Demsetz (1967) for earlier andnarrower definitions of transaction costs.
The authors are, respectively, researcher, School ofGeography and the Environment, University of Ox-ford; and director, Ecosystem Economics, Bend,Oregon.

88(3) Garrick and Aylward: Transaction Costs and Institutional Performance 537
location refers to voluntary (incentive-based)and compensated reallocation of existing con-sumptive water rights to enhance environ-mental flows. Environmental flows in theColumbia Basin principally involve non-consumptive, “instream” flow for salmonfisheries. Market-oriented allocation is an al-ternative to involuntary, uncompensated real-location through court decree or regulation.Implementation has lagged due to transactioncosts. Janet Neuman characterized the lag inimplementation by noting the experience ofthe Oregon Water Trust—the first nongovern-mental water trust to enter the water marketon behalf of the environment—whose “bankbalance of acquisition money remain[ed]quite healthy, as it ha[d] turned out to beharder than expected to spend the money”(Neuman 2004, 439–40). Existing economicanalysis of market-based environmental waterallocation has yet to address the conceptual,measurement, and analytical issues associatedwith transaction costs in institutional per-formance.
In the early 1990s environmental econo-mists began to measure transaction costs toexamine institutional barriers and perfor-mance trends in water markets across thewestern United States, Chile, and Australia(Colby 1990a; Thompson 1993; Howitt 1994;Hearne and Easter 1995; Easter, Rosegrant,and Dinar 1998; Challen 2000; Allen Con-sulting Group 2006). This research relied ona range of conceptual frameworks and meth-odological approaches, limiting the compar-ability of findings and insights into institu-tional performance. These studies measureddifferent types of costs at different stages ofthe policy cycle and across varying subsets ofmarket actors—buyers, sellers, administra-tors, and third parties (McCann et al. 2005).Empirical estimates of transaction costs haveyet to examine the use of water transactionsto restore environmental flows and relatedpublic goods, although Colby (1990b, 1118)cites high transaction costs as a constraint onwater-marketing activity to enhance instreamflows.
This paper fills this gap in the literature byexamining the relationship between transac-tion costs and institutional performance inmarket-oriented restoration of public goods
generated by environmental flows. It followsMcCann and Easter (2000) to examine the re-lationship between “public” transaction costsand institutional performance (see Mettepen-ningen, Beckman, and Egger 2011). Publictransaction costs refer to the costs incurred bya subset of the actors—principally govern-ment agencies and nonprofits. In the contextof overallocated freshwater ecosystems, pub-lic transaction costs include policy reform andimplementation expenditures by govern-mental and nonprofit actors to reallocate pri-vate water use rights into the public trust(Challen 2000). Government agencies andnonprofits have an increasing motivation toeconomize on transaction costs due to limitedand often decreasing budgets for fixed orgrowing policy objectives (Mettepenningen,Beckman, and Egger 2011).
The next section outlines the study moti-vation to investigate spatial and temporalpatterns in public transaction costs and insti-tutional performance within and across statejurisdictions. This section develops adaptiveefficiency—defined in terms of long-term ef-ficiency of economic performance—as anevaluative criterion. This discussion of adap-tive efficiency is based in the work of Doug-lass North (1990, 1994). The third sectiondescribes the data and methodology used tomeasure institutional performance in terms ofthree interacting performance variables: waterrecovery (water rights acquisitions),2 trans-action costs per unit of water recovered, andtotal program budgets for transaction-relatedexpenditures on policy reform and implemen-tation. The fourth section presents results anda discussion of spatial and temporal perfor-mance trends, and it explores the interactionsamong these performance indicators in termsof adaptive efficiency. The final section pro-vides concluding remarks by identifying les-sons for theory, methods, and policy abouttransaction costs and institutional perfor-mance in market-based environmental waterallocation.
2 Defined as net increases in flow rates through waterrights acquisitions to retire historic water uses and rededicatethe historically consumed water for ecological purposesinstream.

August 2012Land Economics538
II. INSTITUTIONAL PERFORMANCEAND TRANSACTION COSTS
Institutional Performance: DefiningEffectiveness
Institutional performance depends on thepolicy objectives and criteria for assessment.During the early period of implementation,the Columbia Basin Water Transactions Pro-gram (CBWTP) established three objectives(Hardner and Gullison 2007): (1) develop andtest market transactions for acquiring water,(2) increase water and streamflow in the trib-utaries of the Columbia Basin, and (3) restorehabitat for fisheries in streamflow-limitedreaches. A third-party evaluation of theCBWTP from 2003 to 2006 documented pro-gress on the first two objectives. The analysisdocumented a diverse portfolio of temporaryand permanent transactional tools and increas-ing water acquisitions (referred to here as wa-ter recovered for the environment); it did not,however, compare spatial and temporal trendsacross and within the states in the basin.
The third objective—habitat restoration—has proven inconclusive; it takes a longer timeto demonstrate progress on ecological out-comes, and this objective is affected by othercausally relevant limiting factors. Moreover,habitat restoration will require “sophisticatedcoordination with other organizations andgovernment agencies” (Hardner and Gullison2007, 2). As such, a definitive link betweentransactional outcomes and ecological im-pacts is premature at this stage and scale ofimplementation. Anecdotal evidence of habi-tat improvements exists in locations where bi-ologically rich tributaries have becomereconnected with the mainstem river. Effort isbeing devoted to institutionalize best practicesin compliance and effectiveness monitoringand to develop evaluation protocols to trackand test ecological outcomes.
Long-term institutional performance canbe assessed along multiple criteria associatedwith policy effectiveness. This study assessespolicy effectiveness in terms of adaptive ef-ficiency. Efficiency refers to the least cost pathto a policy objective based on the (full rangeof) costs per unit of benefit generated. Neo-classical efficiency is a function of the insti-tutional structure within which costs and
benefits are assessed; in other words, the in-stitutional constraints are often taken as given(Bromley 1982, 1989). Adaptive efficiency,on the other hand, reflects the institutional ca-pacity to achieve efficiency over the long term(North 1994). Adaptive efficiency is helpfulto understand long-term trajectories of insti-tutional economic performance in contexts ofentrenched path dependencies, complexity,uncertainty, and feedback between policy re-form and implementation (North 1990).
In the context of market-based environ-mental water allocation, the evaluative crite-rion of adaptive efficiency is defined in termsof a relationship between three performanceindicators over space and time: water recov-ery (net increase in flow rates through wateracquisitions), average transaction costs (im-plementation costs per unit of water recov-ered),3 and program budgets (total financingavailable to cover implementation costs ofgetting to the scale and to invest in strategiesthat reduce transaction costs over time).4Adaptive efficiency is reached in settings
3 It should be noted that implementation cost per unit ofwater is derived as an average cost (total transaction-relatedprogram budgets divided by the net present value of waterrecovered in CFS). Average transaction costs metrics areprevalent in water-market analysis for analytical and meth-odological reasons. Analytically, average costs indicate rela-tive costs across jurisdictions. For example, Colby’s 1990study reported results in terms of average transaction costsper acre foot at the state level. The second reason for theaverage transaction costs metric is methodological. Marginaltransaction costs would require estimates of transaction costsper unit of water per transaction rather than transaction costsper unit of water per subbasin. Transaction projects maytake several years to complete; as such accurate data ontransaction-level costs are unlikely. McCann et al. (2005,532) identify the trade-off between accuracy and precision,and the need to fit transaction costs metrics to the analyticalpurposes at hand, which in this case focused on a relativeindication of transaction costs across jurisdictions and overtime (subbasin and annual averages) rather than across trans-actions and quantity (marginal).
4 The size of the budget in early years will also reflectthe up-front costs of policy enactment to strengthen enablingconditions and adapt to unintended consequences. The over-all size of the budget will reflect the transaction costs ofgetting to scale that are defined by the level of unmet en-vironmental needs. It should be noted that determining en-vironmental needs is an iterative and dynamic process. Wehave further called the readers’ attention to a previous em-pirical study (Gangaharan 2000) making a related pointabout high transaction costs in early years in the develop-ment of pollution markets.

88(3) Garrick and Aylward: Transaction Costs and Institutional Performance 539
where market-based environmental water al-location generates (1) relatively high water-recovery levels at (2) low (or declining)transaction costs with (3) sufficient institu-tional capacity (in terms of program budgets)to cover the transaction costs needed to enactenabling reforms, get to scale, and adapt tounintended consequences.
Transaction Costs: Barriers toImplementation
The prevalence of high transaction costshas been cited as a significant barrier to im-plementation progress in market-oriented en-vironmental water allocation (Colby 1990b;Neuman 2004; Hardner and Gullison 2007).In the Columbia Basin, the first instream flowtransaction occurred seven years after en-abling legislation was enacted in Oregon.Other states in the basin encountered a similarimplementation lag, and transactional activityhas not increased as quickly as anticipated(see Neuman 2004). This lag stems in largepart from the high cost of collective action toestablish and manage institutions that addressexclusion, externalities, and free-riding chal-lenges in water allocation. For example, theevaluation of the CBWTP explicitly identifiedtransaction costs as one of the major chal-lenges for the program (Hardner and Gullison2007).
Conceptual and methodological advancesin transaction costs economics have been usedto evaluate environmental policy design andinstitutional performance. In the natural re-source allocation context, transaction costsare defined as the resources required to define,transfer, and manage property rights (McCannet al. 2005). This definition expands andbuilds on Coasian (Coase 1937, 1960) under-standing of transaction costs in natural re-source allocation. The Coasian definition oftransaction costs emphasizes the costs of ex-change comprised by search, bargaining, andmonitoring costs incurred during changes inthe initial assignment of rights to address ex-ternalities. McCann et al. (2005) highlight theimportance of transaction costs in environ-mental policy because property rights areincomplete and evolve for complex and con-tested natural resources (Barzel 1989; Libecap
1989). Cole (2002) traces the problem of hightransaction costs explicitly to two linked col-lective action challenges: the costs of exclu-sion and coordination. In short, institutionsand institutional change are costly, particu-larly in freshwater resource settings that havebeen overallocated to agricultural users.
Transaction costs also occur at multiplelevels (Williamson 1998) that include thecosts of (1) exchanging property rights, (2)changing the institutional framework govern-ing those exchanges, and (3) overcoming thelock-in costs of past institutional commit-ments (North 1990; Marshall 2005). Thesedistinctions have antecedents in the sportsanalogy developed in new institutional eco-nomics literature, which separates “playingthe game” from changing “the rules of thegame” (North 1990; Williamson 1998). A lessoften noted antecedent to this boundary issueappears in the common pool resource litera-ture that separates collective choice (decisionmaking) from operational-level rules and ac-tions (Ciriacy Wantrup and Bishop 1975; Os-trom 1990; Schlager and Blomquist 2008).The interaction between levels of transactioncosts is integral to institutional performancedynamics over space and time.
Past empirical research has been limitedprimarily to the transaction costs of exchangeborne by a subset of actors. Measurementmethods include surveys, financial expendi-ture data, econometric analysis about thevalue of information, or some combination ofthe three. In an early example in the westernUnited States, Colby (1990a, 1184) used asurvey to estimate “policy-induced transac-tion costs,” including “attorneys’ fees, engi-neering and hydrologic studies, court cases,and fees paid to state agencies . . . and spe-cifically exclud[ing] the price paid for the wa-ter rights and costs of implementing a transferonce it has been approved.” The findings re-lied on a sample of willing professionals.McCann et al. (2005) describe a range ofmethodological techniques for transactioncosts measurement in environmental policyanalysis. They suggest a combination of sur-vey and financial expenditures data to coun-teract the biases and weaknesses inherent ineither approach on its own.

August 2012Land Economics540
McCann et al. (2005) establish a frame-work and typology for transaction costs mea-surement that guides this study. Measurementrelies on boundaries to delimit what counts astransaction costs through all stages of policydesign and implementation and across all ac-tors. Empirical typologies include the type oftransaction costs, market actors, and timing tocapture the ex ante and ex post costs throughthe full policy cycle. The typology includesmultiple levels—policy enactment and imple-mentation—as well as subtypes within eachcategory. In the context of market-based en-vironmental water allocation, policy enact-ment costs include enabling reforms of waterrights institutions to define, transfer, and man-age water rights in a cap-and-trade system thatallows transactions for environmental flowrestoration purposes. Enactment costs also en-tail the development of nested institutions toorganize public and private efforts for plan-ning, water banking, and administrative ca-pacity at multiple scales. The subtypes ofimplementation costs include project-levelcosts of transaction prioritization and plan-ning, water rights due diligence, negotiationand price discovery, administrative fees andprocessing, conflict resolution, monitoringand enforcement, and financing (see also Sec-tion III).
In assessing transaction costs, an importantquestion is which transaction costs (the types,actors, etc.) are included in the analysis. Mostempirical work is partial in nature, in thatstudies “have focused on some subset of . . .costs, either regarding the type of cost or whobears them” (McCann et al. 2005, 533). Inmarkets for private goods, the transactioncosts of private actors—buyers, sellers, andthird parties—are of prime interest. In envi-ronmental markets for public goods (i.e., theuse of market mechanisms to preserve or en-hance public goods), transaction costs analy-ses often focus on public sector transactioncosts (McCann and Easter 2000; Mettepen-ningen, Beckman, and Egger 2011).
Mettepenningen, Beckman, and Egger(2011) explain the rationale for a focus onpublic sector transaction costs in the analysisof environmental policy effectiveness: (1) en-vironmental schemes may face declining bud-gets to reach fixed or intensifying policy
challenges, (2) accountability measures re-quire “value for money” in terms of policyoutputs per dollar expended in the programbudget, and, as a consequence, (3) transactioncosts influence trade-offs across competingpriorities for public investment. The publicand nonprofit organizations brokering trans-actions in the CBWTP confront an explicitmotive to economize on transaction costs asthe program faces periodic reauthorization.
The focus on public transaction costs isconsistent with the objective of evaluating in-stitutional performance and governance ar-rangements on the demand side of the publicgoods market for water. This analysis there-fore excludes private transaction costs facedby sellers. This decision is accompanied bytwo simplifying assumptions that should betested in future empirical research in a com-prehensive benefit-cost framework: (1) Themagnitude of transaction costs incurred bysellers in a public good market is expected tobe proportional to those incurred by public ac-tors; information and coordination costs areinfluenced by similar politics, institutional ar-rangements and local contexts. (2) Nonprofitconservation brokers and regulatory officialsserve as extension officers to incentivize andfacilitate participation by sellers, buildingtrust and capacity by underwriting the costs ofinformation and coordination faced by pro-spective sellers. Extension officers argue thatpublic transaction costs incurred to implementwater transactions partially serve to shift theburden from sellers to buyers and regulators(Lovrich and Siemann 2004; Neuman 2004).A full accounting of public and private trans-action costs and benefits is a promising areaof research based on the conceptual and meth-odological advances developed here for pub-lic sector transaction costs.
Research Gaps and Hypothesis
This paper investigates the relationship be-tween transaction costs and institutional per-formance by examining the spatial andtemporal patterns of performance in market-based environmental water allocation. Theseperformance trends are decomposed into threeinteracting performance variables: water re-covery levels, transaction costs per unit of wa-
88(3) Garrick and Aylward: Transaction Costs and Institutional Performance 541
ter, and program budgets. How do these threeperformance indicators interact to shape pros-pects for adaptive efficiency? The hypothesisis that performance will vary as much withinstates (where authority for water allocation isvested in the western United States) as acrossthem. This expectation is formed based on (1)the lock-in costs (path dependency) of historicwater users, uses, and biophysical character-istics of the system,5 and (2) localized driversof water rights reform and administration ca-pacity, which reflects the importance of localtime- and place-specific information and val-ues (Hayek 1945).
Previous research establishes the basis forthis working hypothesis about intrastate vari-ability in spatial and temporal performancetrends. Colby (1990a) examines the relation-ship between transaction costs and efficiencyin water allocation institutions. Her empiricalanalysis of “policy-induced” transaction costs(associated with administrative procedures)reveals that transaction costs are “higher inareas where water is more scarce and valu-able, transfers are more controversial, and theexternalities of water transfers are more likelyto be significant” (p. 1189). MacDonnell(1990) finds high degrees of intrastate varia-tion in transaction costs due to differences ininstitutional capacity to respond to scarcity,conflict, and externalities.
Ruml (2005) provides the basis for the hy-pothesis in his work on the Coase theorem inthe western United States system of prior ap-propriation (first in time, first in right). Hisanalysis suggests two different institutionalcontexts for water transactions in the westernUnited States: (1) an appropriative system un-der statutory rules and (2) irrigation districtlevel systems governed by water user rules.The former is prevalent at the state level,where water transactions can become trappedin a vicious cycle of ill-defined and insecureproperty rights with high transaction costs; the
5 It must be noted that although the physical character-istics vary at multiple scales, the region shares definingfeatures of its hydrology and hydrogeology, such as snow-melt-driven hydrology with peak runoff in the spring andthe natural low flow in the hydrograph. The presence orabsence of losing reaches and reservoir storage alter the hy-drogeologic character but in ways that are not expected tobe determinative for performance trends.
latter (district level) has fostered isolatedpockets of favorable water market conditionsgoverned by a “virtuous cycle” whereby waterrights are defined clearly and transferred withlow transaction costs. Carey, Sunding, andZilberman (2002) describe an example of thevirtuous cycle via the emergence of an en-abling framework within informal networksof “affiliated farms” in the Westlands WaterDistrict in California. In that case study, fixedtransaction costs are low enough to enabletrading for transactions of relatively smallvolumes.
In the context of market-based environ-mental water allocation, state-level waterrights reforms are a necessary condition.However, adaptive efficiency is expected todepend on additional reform and institutionalcapacity at the subbasin scale to access localtime- and place-specific access to informationand coordination (following Hayek 1945).This paper documents evidence for this thesisby elaborating and testing the transactioncosts evaluation framework to assess spatialand temporal performance trends within andacross state jurisdictions.
Research Setting
Water allocation in the Columbia Basin isgoverned under the western United Statesprior appropriation doctrine, which stipulatesthat the first to establish and maintain a ben-eficial use is the last to lose access during pe-riods of inadequate supplies. Ecosystems tendto receive the residual flows. The allocationsystem allows a chronic imbalance betweenlegal rights and claims (i.e., “paper water”)and physical availability (i.e., “wet water”).
Implementing organizations in the Colum-bia include nonprofit water trusts, basin orga-nizations, and public agencies that operate atmultiple scales. The Northwest Power andConservation Council (NPCC) has coordi-nated local recovery efforts along ecoregionalboundaries by defining subbasins—zones ofecological interactions. The Columbia Basin isparticularly well suited to test this hypothesisbecause four decades of watershed governancereforms ensure that field-level water rights ad-ministration and watershed planning alignclosely with ecoregional boundaries (NPCC

August 2012Land Economics542
2005). Subbasins are therefore the appropriatescale at which to analyze efforts to address theexternalities of overallocation incurred by eco-systems and existing water users.
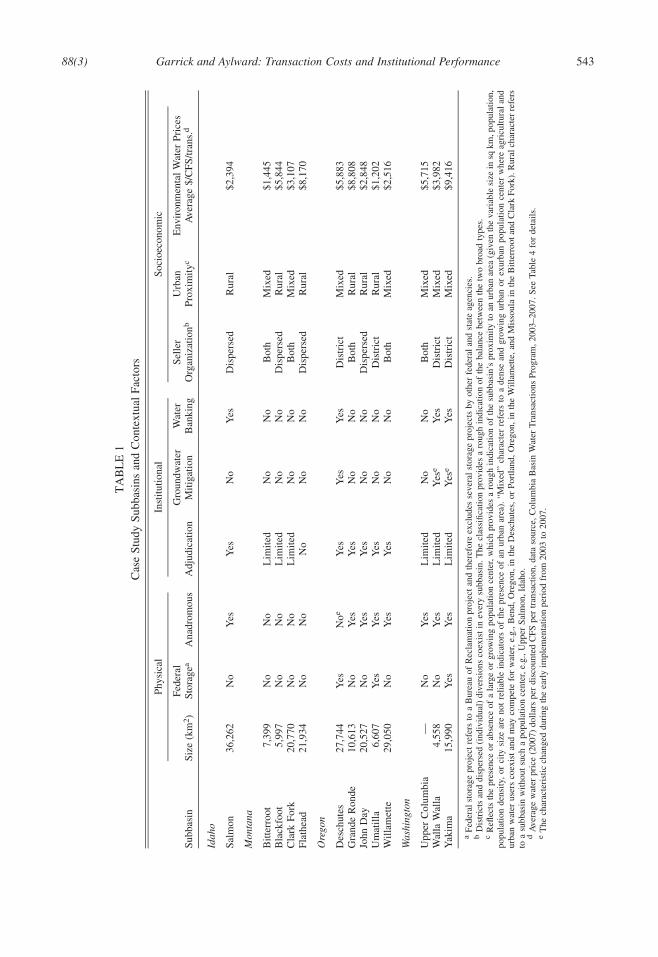
The Columbia Basin includes 62 sub-basins. Twelve subbasins and one ecoprov-ince (n = 13) comprise the study area and werechosen based on the need for and presence oftransactional activity to address low-flow lim-itations (Table 1). Subbasins were selected inthe study design because of significant unmetdemand, which led to their inclusion as pri-ority subbasins in the CBWTP. High levels ofunmet demand serve as a control for case se-lection, but the relative need (and hence mar-ginal ecological and economic benefits oftransactions) is assumed to be similar acrosssubbasins, particularly during the early stageof implementation.
These cases enable comparisons bothwithin and across state boundaries in areaswhere basic enabling conditions and initialimpediments to environmental water transac-tions had been addressed prior to the forma-tion of the CBWTP in 2002. The casesencompass subbasins in Idaho, Montana,Oregon, and Washington, the primary riparianstates on the U.S. side of the border.
A set of contextual factors is noteworthy(Table 1). These factors are not expected tohave a determinative impact on the directionor magnitude of any of the three performancevariables because high or low levels of per-formance are expected to be possible regard-less of the contextual feature. However, theseare factors associated with the physical, insti-tutional, and socioeconomic characteristics ofthe subbasins that can vary as much within thestates as across them and therefore favor amixture of local and state institutional capac-ity to achieve high levels of performance andadaptive efficiency as outlined in Section II.
The key physical characteristics includethe presence or absence of reservoir storagein the form of a federal storage project andassociated infrastructure, an environmentalflow target (or set of targets), and anadromous(migratory) or resident fisheries. The institu-tional characteristics include the presence orabsence of a water rights adjudication (a courtdecision to define water rights), a groundwatermitigation rule, and/or a water banking struc-
ture. Socioeconomic characteristics are de-fined by the presence of irrigation districts(and associated infrastructure) versus dis-persed users, the proximity to an urban center,and competition for water (as measured viaaverage price per unit of environmental wateracquired through the CBWTP).
The cases are all defined by the presenceof transactional activity and coordinated bythe CBWTP. With regard to water institutions,biophysical setting, and socioeconomic char-acteristics in the Columbia Basin, the follow-ing simplifying assumptions apply to thecases selected:
• Legal and institutional reforms all occur withinthe broader framework for water allocation un-der the prior appropriation doctrine.
• All subbasins have high levels of unmet eco-logical demand where instream flow has beenidentified as a limiting factor for fish recovery.Insufficient data and analysis exist to comparetransactions in terms of their marginal ecolog-ical benefits.6
• Sellers face roughly similar types and magni-tudes of transaction costs across the subbasins;the role of conservation brokers is to serve asextension agents conducting outreach with po-tential willing sellers to decrease the informa-tion costs of learning about new incentives andreallocation options.
III. DATA AND METHODOLOGY
Data
This study compiles data on three interact-ing performance indicators—water recovery,transaction costs, and institutional capacity(the latter simplified here as “program bud-gets” to capture a subset of institutional ca-pacity)—that together contribute to adaptiveefficiency. The transaction is the common unit
6 At this stage of implementation, although each unit ofwater recovered does not generate equal levels of ecologicaland economic benefits, the volume of unmet demand forenvironmental assets is high enough across the subbasinsselected for analysis that the initial acquisitions are at thehigh end of the demand curve. An assessment of marginalecological benefits has not been developed to translate flowincreases to differential levels of ecological impact.
88(3) Garrick and Aylward: Transaction Costs and Institutional Performance 543
TA
BL
E1
Cas
eSt
udy
Subb
asin
san
dC
onte
xtua
lFa
ctor
s
Phys
ical
Inst
itutio
nal
Soci
oeco
nom
ic
Subb
asin
Size
(km
2 )Fe
dera
lSt
orag
eaA
nadr
omou
sA
djud
icat
ion
Gro
undw
ater
Miti
gatio
nW
ater
Ban
king
Selle
rO
rgan
izat
ionb
Urb
anPr
oxim
ityc
Env
iron
men
tal
Wat
erPr
ices
Ave
rage
$/C
FS/tr
ans.
d
Idah
o
Salm
on36
,262
No
Yes
Yes
No
Yes
Dis
pers
edR
ural
$2,3
94
Mon
tana
Bitt
erro
ot7,
399
No
No
Lim
ited
No
No
Bot
hM
ixed
$1,4
45B
lack
foot
5,99
7N
oN
oL
imite
dN
oN
oD
ispe
rsed
Rur
al$5
,844
Cla
rkFo
rk20
,770
No
No
Lim
ited
No
No
Bot
hM
ixed
$3,1
07Fl
athe
ad21
,934
No
No
No
No
No
Dis
pers
edR
ural
$8,1
70
Ore
gon
Des
chut
es27
,744
Yes
Noe
Yes
Yes
Yes
Dis
tric
tM
ixed
$5,8
83G
rand
eR
onde
10,6
13N
oY
esY
esN
oN
oB
oth
Rur
al$8
,808
John
Day
20,5
27N
oY
esY
esN
oN
oD
ispe
rsed
Rur
al$2
,848
Um
atill
a6,
607
Yes
Yes
Yes
No
No
Dis
tric
tR
ural
$1,2
02W
illam
ette
29,0
50N
oY
esY
esN
oN
oB
oth
Mix
ed$2
,516
Was
hing
ton
Upp
erC
olum
bia
—N
oY
esL
imite
dN
oN
oB
oth
Mix
ed$5
,715
Wal
laW
alla
4,55
8N
oY
esL
imite
dY
ese
Yes
Dis
tric
tM
ixed
$3,9
82Y
akim
a15
,990
Yes
Yes
Lim
ited
Yes
eY
esD
istr
ict
Mix
ed$9
,416
aFe
dera
lsto
rage
proj
ectr
efer
sto
aB
urea
uof
Rec
lam
atio
npr
ojec
tan
dth
eref
ore
excl
udes
seve
ral
stor
age
proj
ects
byot
her
fede
rala
ndst
ate
agen
cies
.b
Dis
tric
tsan
ddi
sper
sed
(ind
ivid
ual)
dive
rsio
nsco
exis
tin
ever
ysu
bbas
in.T
hecl
assi
ficat
ion
prov
ides
aro
ugh
indi
catio
nof
the
bala
nce
betw
een
the
two
broa
dty
pes.
cR
eflec
tsth
epr
esen
ceor
abse
nce
ofa
larg
eor
grow
ing
popu
latio
nce
nter
,whi
chpr
ovid
esa
roug
hin
dica
tion
ofth
esu
bbas
in’s
prox
imity
toan
urba
nar
ea(g
iven
the
vari
able
size
insq
km,p
opul
atio
n,po
pula
tion
dens
ity,
orci
tysi
zear
eno
tre
liabl
ein
dica
tors
ofth
epr
esen
ceof
anur
ban
area
).“M
ixed
”ch
arac
ter
refe
rsto
ade
nse
and
grow
ing
urba
nor
exur
ban
popu
latio
nce
nter
whe
reag
ricu
ltura
land
urba
nw
ater
user
sco
exis
tan
dm
ayco
mpe
tefo
rw
ater
,e.g
.,B
end,
Ore
gon,
inth
eD
esch
utes
,or
Port
land
,Ore
gon,
inth
eW
illam
ette
,and
Mis
soul
ain
the
Bitt
erro
otan
dC
lark
Fork
).R
ural
char
acte
rre
fers
toa
subb
asin
with
out
such
apo
pula
tion
cent
er,e
.g.,
Upp
erSa
lmon
,Ida
ho.
dA
vera
gew
ater
pric
e(2
007)
dolla
rspe
rdi
scou
nted
CFS
per
tran
sact
ion,
data
sour
ce,C
olum
bia
Bas
inW
ater
Tra
nsac
tions
Prog
ram
,200
3–20
07.S
eeTa
ble
4fo
rde
tails
.e
The
char
acte
rist
icch
ange
ddu
ring
the
earl
yim
plem
enta
tion
peri
odfr
om20
03to
2007
.

August 2012Land Economics544
of analysis. The subbasin is the spatial scale,and the temporal scale is aggregated both an-nually and over the full five-year period ofanalysis. The study period encompasses earlyimplementation ending with the CBWTPthird-party assessment in 2007 (Hardner andGullison 2007), which coincided with theglobal financial crisis and precipitated severalrecommendations and changes in program de-sign, including increased focus on ecologicaland cost-effectiveness monitoring. Water re-covery is defined as the increased rate of in-stream flow (cubic feet per second) generatedthrough transactional activity to acquire orlease water rights.7 Transaction costs are as-sessed using financial and survey data aboutexpenditures related to transaction design andimplementation activity. Program budgets in-clude financial expenditures for transactiondesign and implementation activity; the pro-gram budgets expressly exclude the cost ofwater and expenditures for unrelated programactivities. The original dataset on transactions,transaction costs, and program budgets wasscrutinized to limit error and ensure validity.A verification process involved expert con-sultation with practitioners to review datasources and collection techniques, includingconfirmation of survey responses used to ac-count and allocate transaction costs and pro-gram budgets. Documentation of metadata(i.e., data about the data) enables replicationand longitudinal analysis.
Transactions (Water Recovery)
The transactions data were compiled fromstate administrative agencies for 880 trans-actions in Idaho, Montana, Oregon, andWashington between 2003 and 2007.8 Thetransactions data are the basis for water re-covery (acquisition) metrics and the averagetransaction costs per unit of water recovered.
7 The absence of comprehensive, systematic, and high-resolution flow targets makes it impossible to use metricsbased on water recovered as a proportion of estimated flowneeds. As noted in Section II, initial assessments of ecolog-ical impact are inconclusive due to a lack of established flowneeds (which itself is a key part of the policy enactment andplanning transaction costs) and the role of other limitingfactors causally linked to ecological conditions.
8 Of the 880 transactions, 673 occurred in the ColumbiaBasin study area of the four states.
The absence of consistent standards and reg-istries for transactional activity rendered qual-ity control paramount. The transactions datafrom administrative agency records werecross-referenced against independent data-bases maintained by nonprofit organizations.The transactions data characterized 10 attrib-utes of each transaction, including price(when available), quantity, location (sub-basin), and contract term.9
This dataset relies directly on state admin-istrative records rather than third-party re-porting of transactions data.10 Two limitationsof the water recovery transactions data de-serve scrutiny for comparative analysis of in-stitutional performance. First, it is necessary,yet still premature, to translate water recov-ered into ecological outcomes to capture thedifferential ecological benefits and nonlinear-ities (i.e., thresholds) in the relationship be-tween water recovery and ecological andeconomic values. For example, higher ecolog-ical benefits could justify disproportionallyhigh transaction costs both within and acrosssubbasins. This linkage becomes important aswater recovery levels reach thresholds forecological functions and dependent goods andservices. In this phase of analysis, it is onlypossible to document water recovery levelsand report in Section IV on the subset of casesthat have established comprehensive water re-
9 Official requests were made for transaction data for allavailable attributes, including priority for the followingcommon elements across data sources: (1) start year; (2) endyear; (3) state; (4) subbasin; (5) in/out Columbia; (6) con-servation broker/program; (7) seller type and/or projectname; (8) contract type (permanent, lease, irrigation effi-ciency, donations, forbearance agreement); (9) quantity,maximum CFS instream, and total volume (in acre-feet); and(10) price, if available
10 The Water Strategist dataset (reported by the Strate-con Inc. in a subscription service that was modified recently)has been the standard source for academic studies of westernUnited States water markets (Basta and Colby 2010, Breweret al. 2011). Those authors acknowledge that there are po-tential deficits in the transactions data. Environmental watertransactions information is a potential weakness of the WaterStrategist dataset. For example, a thorough transactions da-taset coded and compiled from the Water Strategist byBrewer et al. (2008) indicated that Oregon had 77 transac-tions of all types (agricultural, intersectoral, and environ-mental) from 1987 to 2005. By contrast, the primary dataderived from administrative records in this study yields over100 environmental water transactions in Oregon in 2004alone.

88(3) Garrick and Aylward: Transaction Costs and Institutional Performance 545
covery targets at the stream-reach scale. How-ever, this is an element of the framework thatwill be tabbed for future research as part of acomprehensive, long-range and integratedcost-benefit assessment.
Second, price data is limited for environ-mental transactions.11 This deficiency ispartly a function of the unique valuationmethods used to establish market-based pricesfor water rights transacted for environmentalrecovery purposes, especially in the absenceof active water markets. In the ColumbiaBasin, agricultural-to-environmental transac-tions occur while the wider water market foragricultural transactions and/or agricultural-to-urban transactions is still nascent and thin.As a result, water costs do not appear to bethe primary limiting factor on transactionalactivity yet, as programs had substantial ac-quisition budgets that remained unspent dueto prohibitive transaction costs (Neuman2004; Hardner and Gullison 2007).12
Transaction Costs
Transaction costs metrics relied on a mix-ture of primary financial expenditures dataand structured questionnaires for auditing andaccounting purposes (see below and Figures1 and 2). The sources for transaction costsdata included an audit of transaction-relatedexpenditures from financial records on the de-mand and regulatory actors of the market:nonprofit and water resource agency conser-vation brokers and water resource regulatoryagencies. For the nonprofits, Internal RevenueService files supplied total expenses and suf-
11 Price data for 191 transactions from 2003-2007 is re-ported by the Columbia Basin Water Transactions Database.The price data are summarized for the full reporting periodat the subbasin level as an average price (in 2007 dollars)per (discounted) CFS per transaction. The water cost resultsindicate that transaction costs are not correlated with averagewater prices, because some subbasins include high transac-tion costs and water prices (Upper Columbia, Washington)while others have low transaction costs but relatively highwater prices (Yakima, Washington).
12 Comments from an anonymous reviewer highlightother potential circumstances in which water costs are a pri-mary limiting factor and deserve close attention as part ofan integrated cost-benefit analysis: (a) fear that governmentintervention in the water market through environmental wa-ter purchases will cause speculation in water prices and (b)limited ecological benefit at the going market prices.
ficient accounting details to distinguish thecosts paid for water from the costs associatedwith transaction-related program expendi-tures. The files were supplied annually undertax disclosure requirements for nonprofit or-ganizations. For the latter (administrativeagencies), managers estimated program bud-gets associated with implementation effortsacross the full suite of program design andimplementation tasks, including transactionplanning, permitting, and monitoring andenforcement.
Program Budgets
The implementation budget is a subbasin-scale aggregation of the financing sources as-sociated with the principal implementingbodies—nonprofit and state water resourceagency actors—for their transaction-relatedactivity (excluding water costs). Transaction-related expenditures refer to transaction im-plementation and explicit single-purposeinvestments in policy design and planning toreduce average transaction costs over timeand with scale. As such, this budget is only asubset of total institutional capacity andserves as a proxy for the capacity to covertransaction costs and invest in institutional re-forms capable of lowering transaction costsover time. This program budget metric cap-tures the overall size of the budget for thesepolicy enactment and implementation func-tions; it further enables an assessment of thepresence, absence, and relative level of con-tributions from the nonprofit and agency ac-tors to understand the degree of public (stateagency) and private (nonprofit) capacity forimplementation in a given subbasin (see Sec-tion IV).
Measurement
Performance Variables
The quantity of water in market transac-tions is traditionally reported as a volume inacre feet.13 The quantity of water for environ-
13 An acre foot is approximately 325,000 gallons and isthe unit of measure necessary to inundate one acre with afoot of water. This unit was established for irrigation wateruses based on crop water requirements.

August 2012Land Economics546
FIGURE 1Transaction Costs Accounting Scheme: Conservation Broker
mental water transactions is more appropri-ately reported as a diversion rate, or flow, incubic feet per second (CFS). Environmentalwater transactions vary in duration from a per-manent transfer to a brief portion of an indi-vidual irrigation season. The maximum flowrate14 (water quantity) recovered by eachtransaction is discounted into a net presentvalue of CFS over the full term of the contract(in years), following the methodology appliedfor acre feet transferred (Brewer et al., 2008)and utilizing a 5.5% discount rate. A sensitiv-ity analysis of varying discount rate levelsdemonstrates that higher discount rates penal-ize subbasins with relatively higher propor-tion of permanent or long-term transactions asa percentage of total transactional activity(Section IV includes a breakdown of perma-
14 The flow rate of a diversion may vary over the season.Maximum flow rate was available for all transactions; how-ever, sensitivity analysis was conducted for the subset oftransactions for which average flow rate and total volume(acre feet) were available to ensure that maximum flow rateis a robust indicator of environmental water recovery.
nent transactions as a proportion of total trans-actional activity).
Transaction costs were measured in athree-staged process through scoping inter-views, collection of financial expendituredata, and a brief structured questionnaire (Fig-ures 1 and 2; Tables 2 and 3) for auditing andaccounting purposes. The questionnaire wastailored to nonprofit conservation brokers,state water resource agencies, and field-levelwater resource managers (“watermasters”)employed by either state agencies or waterusers associations. The period of analysis en-compasses a five-year time frame from 2003to 2007. The type and distribution of transac-tion costs included the activity on the demandand regulatory side of the market for environ-mental flows: the costs incurred by conserva-tion brokers and water resource regulatoryagencies for both the state and local field-levelstaff involved in implementation. In the firststage, scoping interviews with practitionersidentified the types of information, coordina-tion, and enforcement costs through the full

88(3) Garrick and Aylward: Transaction Costs and Institutional Performance 547
FIGURE 2Transaction Costs Accounting Scheme: Agency Acquisition Program
TABLE 2Step-by-Step Summary of Transaction Costs Accounting
Nonprofits Agencies
1. Internal Revenue Service 990 Forms were gathered.2. Form 1, response 17 indicates total expenses.3. Form 2, statement of other expenses indicates all water
costs.4. Water costs are subtracted from total costs.5. Questionnaire is used to determine proportion of
nonwater costs that is transaction related.6. Questionnaire is then used to assess the proportion of
transaction-related, nonwater costs allocated to eachpriority watershed.
7. Questionnaire is used to assess the proportion oftransaction-related, nonwater costs that is allocated toeach function in the project cycle.
1. Program budgets were estimated annually for theplanning and permitting functions of the instream watertransactions programs.
2. Program budgets were allocated at the subbasin scalebased on the proportion of statewide transactionalactivity occurring in the subbasin.a
3. Watermaster questionnaires were used to determine thepercentage of their full-time equivalency dedicated toinstream transactions.
4. Subbasin agency costs compiled the watermasterstaffing and funding levels with the planning/permittingbudgets.
Data, methodology, and results were verified by programstaff.
Data, methodology, and results were verified byheadquarters staff.
a The agency contributions included permitting costs and field-level administration. For the permitting component, the intrastate allocationof state-level costs was based on the proportion of transactions occurring within the basin, as noted in note 15. This allocation methodologyand the results they generated were verified by agency headquarters.
August 2012Land Economics548
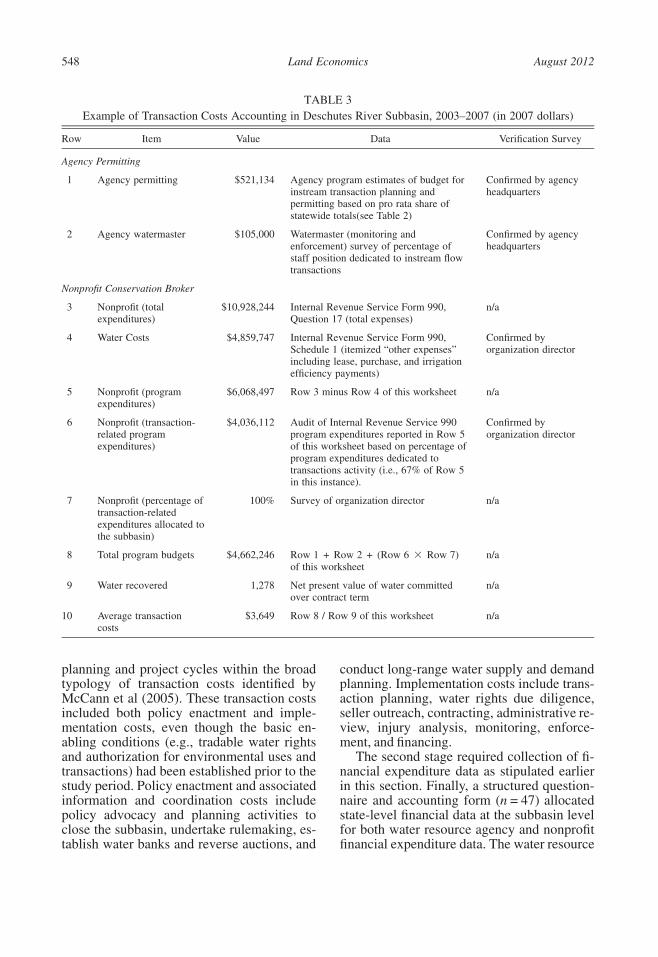
TABLE 3Example of Transaction Costs Accounting in Deschutes River Subbasin, 2003–2007 (in 2007 dollars)
Row Item Value Data Verification Survey
Agency Permitting
1 Agency permitting $521,134 Agency program estimates of budget forinstream transaction planning andpermitting based on pro rata share ofstatewide totals(see Table 2)
Confirmed by agencyheadquarters
2 Agency watermaster $105,000 Watermaster (monitoring andenforcement) survey of percentage ofstaff position dedicated to instream flowtransactions
Confirmed by agencyheadquarters
Nonprofit Conservation Broker
3 Nonprofit (totalexpenditures)
$10,928,244 Internal Revenue Service Form 990,Question 17 (total expenses)
n/a
4 Water Costs $4,859,747 Internal Revenue Service Form 990,Schedule 1 (itemized “other expenses”including lease, purchase, and irrigationefficiency payments)
Confirmed byorganization director
5 Nonprofit (programexpenditures)
$6,068,497 Row 3 minus Row 4 of this worksheet n/a
6 Nonprofit (transaction-related programexpenditures)
$4,036,112 Audit of Internal Revenue Service 990program expenditures reported in Row 5of this worksheet based on percentage ofprogram expenditures dedicated totransactions activity (i.e., 67% of Row 5in this instance).
Confirmed byorganization director
7 Nonprofit (percentage oftransaction-relatedexpenditures allocated tothe subbasin)
100% Survey of organization director n/a
8 Total program budgets $4,662,246 Row 1 + Row 2 + (Row 6 × Row 7)of this worksheet
n/a
9 Water recovered 1,278 Net present value of water committedover contract term
n/a
10 Average transactioncosts
$3,649 Row 8 / Row 9 of this worksheet n/a
planning and project cycles within the broadtypology of transaction costs identified byMcCann et al (2005). These transaction costsincluded both policy enactment and imple-mentation costs, even though the basic en-abling conditions (e.g., tradable water rightsand authorization for environmental uses andtransactions) had been established prior to thestudy period. Policy enactment and associatedinformation and coordination costs includepolicy advocacy and planning activities toclose the subbasin, undertake rulemaking, es-tablish water banks and reverse auctions, and
conduct long-range water supply and demandplanning. Implementation costs include trans-action planning, water rights due diligence,seller outreach, contracting, administrative re-view, injury analysis, monitoring, enforce-ment, and financing.
The second stage required collection of fi-nancial expenditure data as stipulated earlierin this section. Finally, a structured question-naire and accounting form (n = 47) allocatedstate-level financial data at the subbasin levelfor both water resource agency and nonprofitfinancial expenditure data. The water resource

88(3) Garrick and Aylward: Transaction Costs and Institutional Performance 549
agency contributions included environmentalwater transaction planning, permitting costs,and field-level administration (includingmonitoring and enforcement). For the permit-ting component, the allocation of state-levelfinancial expenditures was on a pro rata basiswithin the states based on the proportion oftransactions occurring within the subbasin(Table 2). The data, allocation methodology,and results were confirmed by agency head-quarters. The pro rata allocation of the per-mitting component of state water resourceagency expenditures is based on the agencies’experience that permitting includes a set offixed costs and administratively mandatedprocedural time lines that will not vary sub-stantially across subbasins or transactionseven though the level of clarity about waterrights adjudication may differ within a state.15
The field-level administration component wasexpected to vary within states, however, andwas assessed through a subbasin-level ques-tionnaire of watermasters. Finally, the non-profit conservation brokers were asked toallocate state-level data at the subbasin levelusing several points of reference, such as theratio of subbasin-level program staff to totalstatewide staffing levels.
The total program budgets for transaction-related expenditures by subbasin were dividedby the water recovered within that subbasin todevelop average transaction costs per cubicfoot per second (CFS). Totals and averages by
15 The intrastate allocation rule for the permitting com-ponent of agency transaction costs divided statewide per-mitting expenditure estimates at the subbasin level accordingto the subbasin’s proportion of statewide transactions. Thisrule implies agency permitting transaction costs are a func-tion of transactional activity and therefore that the averagepermitting transaction costs will not vary within states. An-ecdotal evidence of permitting processing time in terms ofdays from application date to decision (using incompletedata for lease agreements) confirms this expectation. Pro-cessing times were roughly equal across the subbasins forcompleted transactions, suggesting that the implementedtransactions were only those that could be completed in areasonable time according to administratively defined pro-cedural time lines for both buyer and seller. There is evi-dence that intrastate distribution in statewide permittingeffort could deviate from proportional allocation in futureyears after “low-hanging fruit”—transactions selected be-cause of their likely approval or straightforward circum-stances—give way to more complex and permanent projects,which is already happening in Oregon.
subbasin were calculated both annually andfor the full five-year study period to capturespatial and temporal trends. Tables 2 and 3and Figures 1 and 2 document step by step thedata, methods, and transaction costs account-ing scheme.
The overall program budget for the five-year period comprises the third indicator,which aggregates the financial data on trans-action costs from conservation brokers andregulatory agencies in each subbasin. Thisperformance indicator reveals the capacity tofinance transaction costs and the degree ofparticipation from the nonprofit and govern-ment agency sectors. Institutional capacity re-fers here only to the subset of total capacityrepresented by the program budgets for thedemand side and regulatory functions of mar-kets for environmental flows. Program bud-gets specifically capture the financial data forthe conservation brokers and regulatory agen-cies. These budgets include only the trans-action-related expenditures. The survey andverification procedures included an audit offinancial expenditures to capture only pro-gram activities associated with the typologyof policy reform and implementation costsstipulated above.
IV. RESULTS AND DISCUSSION
The results confirm intrastate variation inspatial and temporal performance trends. Per-formance varied almost as much within statesas across them as measured using the quantiledistribution of the results. Figure 316 and Ta-ble 4 (spatial) and Figures 4 and 5 (temporal)summarize the findings for the study periodby subbasin. The analysis aggregates results
16 Classification of subbasins as high versus low waterrecovery and transaction costs is based on quantile levels forspatial trends (see rank in Table 4). Subbasins with middlequantiles were placed in higher or lower levels by cross-referencing the temporal patterns to detect increasing (high)or decreasing (low) water recovery and transaction costs lev-els. Program budgets were classified as (potentially) suffi-cient to achieve increasing returns when temporal trendsdemonstrated increasing water recovery at stable or decreas-ing average transaction costs over time. The John Day wasexcluded from the composite map because it is in the middlequantile for each performance variable and reached peakperformance in the middle of the study period in 2005 (waterrecovery increase and transaction costs decrease).

August 2012Land Economics550
FIGURE 3Spatial Patterns of Institutional Performance, 2003–2007
for the three performance variables over thefive-year period to depict the cross-case quan-tile17 distribution of results for water recovery(net present value of CFS by subbasin), trans-
17 The reader should refer to the rank (1 = highest,13 = lowest) for each performance variable (Table 4) to de-rive the quantile level: high, medium high, medium, mediumlow, low. An additional set of maps is available for eachperformance variable to depict this quantile distributionfrom darker (higher) to lighter (lower) values.
action costs per unit of water recovered, andprogram budgets of transaction-related ex-penditures. Each quantile represents a 20thpercentile interval. The temporal trends de-compose results into annual totals (water re-covery levels and program budgets) andaverages (transaction costs per unit of waterrecovered). The results demonstrate that (1)performance varies as much within as acrossstates and (2) relatively high volumes of water
88(3) Garrick and Aylward: Transaction Costs and Institutional Performance 551
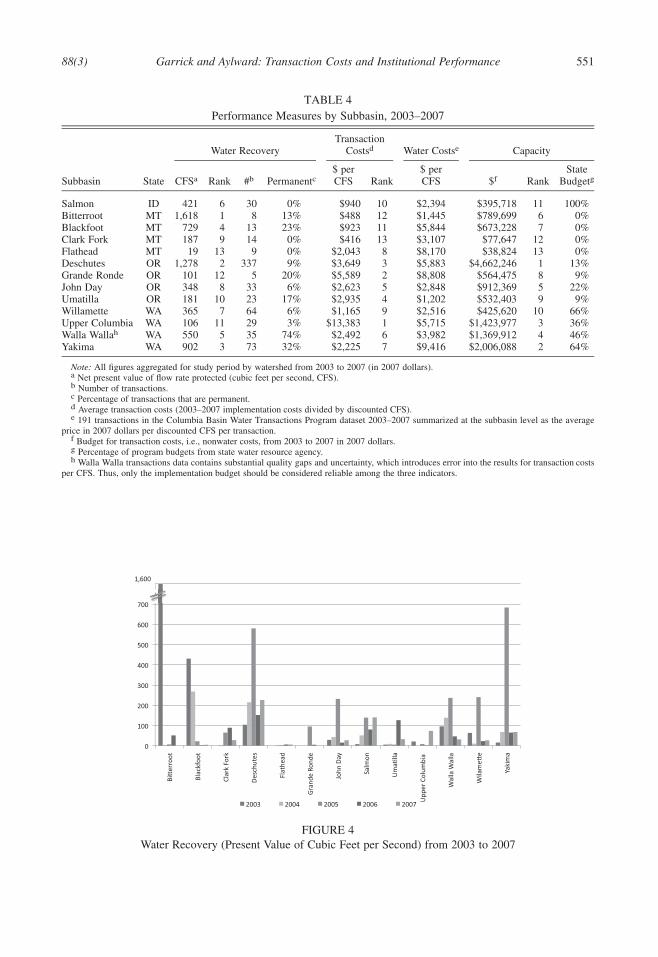
TABLE 4Performance Measures by Subbasin, 2003–2007
Water RecoveryTransaction
Costsd Water Costse Capacity
Subbasin State CFSa Rank #b Permanentc$ perCFS Rank
$ perCFS $f Rank
StateBudgetg
Salmon ID 421 6 30 0% $940 10 $2,394 $395,718 11 100%Bitterroot MT 1,618 1 8 13% $488 12 $1,445 $789,699 6 0%Blackfoot MT 729 4 13 23% $923 11 $5,844 $673,228 7 0%Clark Fork MT 187 9 14 0% $416 13 $3,107 $77,647 12 0%Flathead MT 19 13 9 0% $2,043 8 $8,170 $38,824 13 0%Deschutes OR 1,278 2 337 9% $3,649 3 $5,883 $4,662,246 1 13%Grande Ronde OR 101 12 5 20% $5,589 2 $8,808 $564,475 8 9%John Day OR 348 8 33 6% $2,623 5 $2,848 $912,369 5 22%Umatilla OR 181 10 23 17% $2,935 4 $1,202 $532,403 9 9%Willamette WA 365 7 64 6% $1,165 9 $2,516 $425,620 10 66%Upper Columbia WA 106 11 29 3% $13,383 1 $5,715 $1,423,977 3 36%Walla Wallah WA 550 5 35 74% $2,492 6 $3,982 $1,369,912 4 46%Yakima WA 902 3 73 32% $2,225 7 $9,416 $2,006,088 2 64%
Note: All figures aggregated for study period by watershed from 2003 to 2007 (in 2007 dollars).a Net present value of flow rate protected (cubic feet per second, CFS).b Number of transactions.c Percentage of transactions that are permanent.d Average transaction costs (2003–2007 implementation costs divided by discounted CFS).e 191 transactions in the Columbia Basin Water Transactions Program dataset 2003–2007 summarized at the subbasin level as the average
price in 2007 dollars per discounted CFS per transaction.f Budget for transaction costs, i.e., nonwater costs, from 2003 to 2007 in 2007 dollars.g Percentage of program budgets from state water resource agency.h Walla Walla transactions data contains substantial quality gaps and uncertainty, which introduces error into the results for transaction costs
per CFS. Thus, only the implementation budget should be considered reliable among the three indicators.
FIGURE 4Water Recovery (Present Value of Cubic Feet per Second) from 2003 to 2007

August 2012Land Economics552
FIGURE 5Transaction Costs (Dollars per Cubic Foot per Second) from 2003 to 2007
recovery do not always coincide with rela-tively low transaction costs, particularly in theearly years of implementation. The longer-range performance trajectory is illustrated bydecomposing the five-year trends into annuallevels and tracking trends over time. The lon-gitudinal analysis distinguishes cases that im-prove performance over time and increasereturns to scale from those that encounter bar-riers in terms of declining water recovery and/or increasing transaction costs over time(Figure 3).
Spatial Trends: Intrastate Variability
Water Recovery
Water recovery levels range from 19 to1,618 CFS (in present value terms) for thefive-year period with substantial intrastatevariation. Intrastate performance trends in wa-ter recovery levels confirm the expectationthat performance would vary as much withinstates as across them. Subbasins in three ofthe four states appear in the upper two quan-tiles (Deschutes, Oregon; Yakima, Washing-ton; and Bitterroot and Blackfoot, Montana);each of these three states also has a case inthe lower quantiles (Grande Ronde, Oregon;Upper Columbia, Washington; and Flatheadand Clark Fork, Montana).
Oregon subbasins demonstrate the range ofrecovery levels from relatively higher waterrecovery levels in the Deschutes to lower lev-els in the Umatilla and Grande Ronde, wherepolitical resistance in the latter has engen-dered administrative protests and threats ofcourt challenges (described by Pilz [2006]).Washington reached high water recovery lev-els in the Yakima, reflecting a pulse of trans-actional activity for drought response in 2005(Figure 5). Recovery levels were relativelylow in the Upper Columbia despite high eco-logical priorities associated with salmon fish-eries in the ecoprovince’s Methow andOkanogan tributaries. The Upper Columbiaconfronted institutional barriers associatedwith poorly defined water rights and, untilmore recently, local resistance to environmen-tal water allocation. Idaho’s only case, theSalmon, achieved the local water recovery tar-get of 35 CFS. The state government-runIdaho Water Transactions Program focused ona tributary (the Lemhi) of the Salmon priori-tized by state law and relied on temporarycontracts to build toward longer-term agree-ments (see Table 4 for the percentage of per-manent transactions). Finally, the Montanacases include both the highest and lowest wa-ter recovery levels—the Bitterroot and Flat-head Rivers, respectively. The Montana cases

88(3) Garrick and Aylward: Transaction Costs and Institutional Performance 553
demonstrate a bias toward transactional activ-ity in the earlier years of the study period,partly due to a longstanding negotiation inthe Bitterroot on Painted Rocks reservoir thatculminated in 2004 and skewed the initial pe-riod of results in that subbasin. Institutionalbarriers constrained additional progress inMontana during the period of analysis. Thelack of comprehensive adjudication or stream-lined administrative rules delayed the processof converting forbearance agreements intoformal administrative transfers enforceableagainst upstream/downstream junior appro-priators.
Aggregate water recovery levels are not theonly relevant metric of transactional activityand may obscure key performance attributesacross and within states. The number and av-erage size of transactions are also important.The Montana experience in the Bitterroot re-flects a relatively high average level of waterrecovered per transaction (the influence of asmall group of large-volume transactions),while the Deschutes has achieved not onlyhigh water-recovery levels but also high num-bers of transactions with relatively low aver-age volumes, including permanent deals. Theability to decrease average transaction size isa sign of maturing markets where banking andother market clearinghouse functions de-crease fixed transaction costs that impedesmaller-sized deals (Carey, Sunding, and Zil-berman 2002; Ruml 2005).
Water recovery levels can be benchmarkedagainst environmental flow targets to derivethe percentage of the target attained as a proxyfor ecological outcomes. The ability to reachflow targets is partly a function of the scale atwhich targets are established (creek vs. streamvs. subbasin) and the objective of such targets(fish passage, spawning habitat, and/or rearinghabitat). For example, the Salmon subbasin ofIdaho achieved a flow target derived for a lo-calized environmental flow target of 35 CFSon the Lemhi River. Thus, relative to the othersubbasins, the Salmon achieved only moder-ate levels (i.e., middle quantile) of water re-covery yet reached flow targets at localizedscales through a portfolio of water transac-tions fitted to the hydroecological context andlegal priorities. Meanwhile the Deschutesachieved the second-highest level of water re-
covery (and highest quantile), although res-toration efforts on the middle Deschutes wereone-third the target of 250 CFS established forthe upper portion of the subbasin. As targetsare reached, effectiveness monitoring is be-coming prevalent to examine the sufficiencyof these target flows in terms of water qualityand other ecological parameters that drivehealthy fish habitat.
Transaction Costs
Transaction costs at the subbasin levelranged from $416 to $13,383 per discountedCFS (median: $2,225; also see Tables 2 and3 for illustration of accounting scheme).18 Theresults indicate a similar pattern of spatial het-erogeneity within states, albeit with strongerinterstate variation than with the water recov-ery trends. For example, subbasins in Wash-ington appear in the upper three quantiles,while the subbasins in Montana appear in thelower three. Spatial trends partly reflect thepresence or absence of enabling legal andpolicy conditions, particularly (1) a court ad-judication to define water rights comprehen-sively (including groundwater-surface waterinteractions) at the state and/or subbasin lev-els and (2) water planning to establish envi-ronmental water requirements at multiplescales. The absence of completed adjudica-tions can lead to relatively high transactioncosts (exemplified in Washington by the Up-per Columbia and other cases with partial oroutdated adjudications in Washington) or tem-porary strategies to implement transactionsdespite incomplete water rights adjudications(e.g., Montana). For example, initial transac-tions in Montana had relatively low transac-tion costs despite limited progress towardcourt adjudication for the state’s ColumbiaBasin subbasins.
Intrastate variation remains pronounced inboth the Washington and Oregon cases, thestates with arguably the most advanced mar-kets for environmental flows (Neuman,
18 Converting the cost per CFS to a cost per acre foot(reported for other water market analysis) requires assump-tions about the duration of the contract. If the CFS reallo-cated instream were diverted for a standard irrigation season(180 days), one CFS would be approximately 360 acre feet.

August 2012Land Economics554
Squier, and Achterman 2006). Oregon exhib-its substantial intrastate variation with its fivecases ranking from second to ninth highest intransaction costs (Table 4). Washington in-cludes the ecoprovince with the highest trans-action costs (Upper Columbia) of all cases andthe sixth- and seventh-ranked cases, with rela-tively more moderate levels in the Yakima andWalla Walla (albeit with substantial interan-nual variability, as described below). Finally,the relatively low transaction costs in Mon-tana and Idaho stem in part from dependenceon a single actor for implementation, the pri-vate nonprofits and the state, respectively.Montana lacks agency contributions (Table 4)because most transactions during the studyperiod proceeded outside of the formal ad-ministrative procedures through forbearanceagreements. Idaho’s program is run wholly bythe state agency and lacks nonprofit contri-butions.
Program Budgets
The final performance variable is a subsetof institutional capacity: the combined pro-gram budgets for conservation brokers andregulatory agencies aggregated at the subba-sin level. These budgets for transaction-re-lated expenditures (but excluding water costs)serve as a proxy for capacity to implementtransactions and invest in policy reform strat-egies to reduce transaction costs. Programbudgets varied both within and across states.In Washington cases, program budgets wererelatively high; Idaho and Montana exhibitedmoderate to low levels of program budgetswith substantial intrastate variation in Mon-tana (Figure 3). In Oregon, intrastate differ-ences in program budgets were pronouncedand varied from the high of Deschutes (rankedfirst) to the low of the Willamette (rankedtenth). Reviewing the program budgets inconjunction with the other two performancevariables, the greatest surprise is the coinci-dence of water recovery levels (second high-est) and transaction costs (third highest) in theDeschutes case, which highlights the impor-tance of ongoing policy reform activities tostrengthen enabling conditions (see the dis-cussion of the performance variables below).This alignment of outcomes became possible
because the Deschutes ranked highest inprogram budgets to cover the costs, whichdemonstrates the importance of examiningperformance variables in combination.
Temporal Trends: Performance Trajectoriesover Time
Ongoing investments in the transactioncosts of policy reform underpin a dynamic re-lationship between transaction costs and in-stitutional performance over time and hencethe need for longitudinal assessment of per-formance trends and trajectories. The trans-action costs measured here conflate: (1) thecosts incurred to implement water transac-tions (transaction costs of implementation)and (2) strategic expenditures to invest in thetransaction costs of policy reform to reduceimpediments and achieve increasing returnsto scale (e.g., through water banks and ad-ministrative capacity). Conservation brokersreported that 5% to 10% of their transaction-related program budget was dedicated to pol-icy reform strategies to reduce transactioncosts; however, the absolute levels (and, byextension, impact) of policy reform invest-ments were much higher in the Deschutesgiven the size of the program budget.
Temporal performance trends exhibit threedifferent patterns. First, the Deschutes caseexemplifies the cases with improving perfor-mance over time; these cases invest in thetransaction costs of institutional reform to en-able market-based reallocation for environ-mental flows at declining transaction costsand sufficient scale. Two other temporal per-formance trajectories include cases that were(1) responsive to drought or (2) experiencedenduring institutional barriers after initial im-plementation experience. The Washingtoncases are prominent examples of the drought-response trajectory whereby water recoveryspiked and transaction costs declined duringthe 2005 drought year (declining from$20,950/CFS in 2003 to $645/CFS in the2005 drought year, before increasing to al-most $7,000/CFS in 2007), but residual insti-tutional barriers tied to the lack of a waterrights adjudication hindered implementationprogress in nondrought years. Some of theMontana cases reflect the persistence of in-

88(3) Garrick and Aylward: Transaction Costs and Institutional Performance 555
stitutional barriers that limit potential forimproved performance over time without re-investment in market-enabling policy reform.
Temporal performance trends in selectedcases within Montana and Oregon are indic-ative of relatively low and high adaptiveefficiency, respectively. The Bitterroot andBlackfoot achieved high water recovery levelsand low transaction costs for the full studyperiod. However, the temporal trends indicatedeclining water recovery levels and increas-ing transaction costs. Initial transactions usedforbearance agreements that avoided admin-istrative scrutiny and worked around thelimitations of the prevailing institutionalframework. Implementation efforts in westernMontana shifted from a public agency (i.e.,similar to the Idaho government-run program)to private nonprofits after legislation passedin 1995 enabled private leasing of instreamwater rights. As a result, staffing levels dedi-cated to environmental water transactionswere lower in Montana than the other statesduring the study period. However, the stateagency in Montana has proven important forsustaining high levels of performance, and ini-tial transactional activity underscored theneed for regulatory clarity and administrativeoversight. The limited amount of state agencyinvolvement partly explains the declining wa-ter recovery levels over time.19
In Oregon, several of the cases mirror theMontana experience, with the majority of wa-ter recovery occurring in the first two or threeyears of the five-year term before “hitting thewall” under prevailing institutional arrange-ments. The Deschutes Basin is a notableand illustrative exception. The Deschutesachieved the second-highest water recoverylevels (and the highest number of transactionsby an order of magnitude) but also the third-highest transaction costs per unit of water re-covered. The Deschutes had the highestprogram budget ($4.7 million) to cover trans-action costs, invest in institutional reforms(water planning and banking) aimed at de-creasing transaction costs over time, and gen-erate sufficient financing to get to scale. Thus,
19 The Montana results underestimate transaction costsbecause state agency program budgets were not available.
the apparent contradiction of relatively highwater recovery and high transaction costs isexplained by the commitment of the Deschu-tes River Conservancy to invest in the costsof implementing transactions while simulta-neously bearing the costs of investing in (1)communications, basin-level planning, andpolicy forums to garner public support; (2)collaborative relationships with local irriga-tion districts; and (3) novel institutional water-banking mechanisms and partnerships. Forexample, stakeholders developed and imple-mented a new regulatory program for ex-changing existing, senior surface water rightsfor new groundwater rights, representing amajor policy reform that basin stakeholdersworked through with the state during thestudy period. Tracking of trends over the five-year period shows a stable-to-decreasing an-nual trend in transaction costs per unit ofrecovered water in the Deschutes. Comparedwith the volatility in other subbasins, this re-flects the pay-off in performance from contin-ued investment in institutional reform andmultilevel governance.
Discussion: Interactions of PerformanceVariables
The combinations of high water recoveryand high transaction costs in the Deschutesand of high water recovery and low transac-tion costs in Montana are illustrative. Con-sider the three performance variables in termsof the combinations compatible with adaptiveefficiency. As Table 5 illustrates, transactioncosts can be relatively high or low so long asinstitutional capacity is sufficiently high tocover and decrease the costs over time. Thus,high transaction costs are not automatically anegative for long-range effectiveness. TheDeschutes illustrates that relatively high trans-action costs may be necessary during earlyperiods of implementation to decrease trans-action costs over time and reach water recov-ery thresholds for fish recovery.
Table 5 displays the eight logically possiblecombinations of outcomes, and commentsabout their feasibility and their implicationsfor adaptive efficiency. The neoclassical effi-ciency criterion identifies a standard for botha relatively high (high recovery, low transac-

August 2012Land Economics556
TABLE 5Combinations of Performance Variables
WaterRecovery
TransCosts Program Budgets Cases
High Low Sufficient EfficiencySalmon, IDa; Willamette, ORa; Yakima, WA
High High Sufficient Potential for long-run efficiencyDeschutes, OR
High Low Insufficient Persistence of institutional barriersBitterroot and Blackfoot, MTa
High High Insufficient Implausible due to difficulty of achievingrelatively high water recovery when averagetransaction costs are relatively high and programbudgets relatively low
Low High Potentially sufficient Persistence of institutional barriers withincreasing recovery at declining costs per unit ofwaterUpper Columbia, WA
Low Low Insufficient Persistence of institutional barriersClark and Flathead, MT
Low High Insufficient InefficientUmatilla, OR; Grande Ronde, OR
Low Low Potentially sufficient Path dependencyWalla Walla, WAa
a The Bitterroot, Blackfoot, Salmon, Willamette, and Walla Walla cases have intermediate values (i.e., middlequantiles) for one performance variable. For example, the Salmon, Idaho, case has intermediate/low levels ofprogram budgets (capacity) within the second-lowest quantile. The John Day was excluded as it exists in themiddle quantile for all three variables. Cases with “potentially sufficient” levels reflect instances with moderateto relatively high program budgets and evidence of increasing returns (increased levels of water recovery withstable or decreasing transaction costs). The Walla Walla results should be treated with caution due data qualitygaps noted in Table 4.
tion costs, high budgets) and relatively low(the opposite) performance combination. Ifassessed over the longer term in terms ofadaptive efficiency, two other combinationsare relevant for both high (high recovery, hightransaction costs, and sufficiently high capac-ity to cover the costs) and low values (the op-posite, where recovery is low despite lowtransaction costs because of insufficient pro-gram budget capacity.
Table 5 also shows how the cases could besorted in this scheme to gauge trajectories ofperformance over time. First, the high-perfor-mance combination of high water recovery,low transaction costs, and sufficient programbudgets appears to hold in the Willamette,Yakima, and Salmon cases (at least whenconsidering the full five-year study period).Efficiency in these cases depends on prior in-vestments in the policy reform costs of insti-
tutional change. These prior investments inpolicy reform may cause transaction costs tobe relatively high prior to the study periodand/or borne by actors who are outside of thestudy scope but involved in water rights re-forms that have spillover benefits for market-based environmental reallocation. Second, thelonger-range concept of adaptive efficiencyholds in the Deschutes, where high water re-covery is combined with relatively high trans-action costs and also with the program bud-gets to cover and decrease those costs overtime.
Other cases with high water recovery(Rows 3 and 4 in Table 5) show less evidenceof adaptive efficiency due to insufficient pro-gram budgets and therefore limited invest-ment in the transaction costs of institutionalreform. The Montana cases show high waterrecovery and low transaction costs but rela-

88(3) Garrick and Aylward: Transaction Costs and Institutional Performance 557
tively low levels of program budgets. As aconsequence, institutional barriers persist andmake it unlikely that the cases will improveperformance over time unless prohibitiveimplementation transaction costs motivate ef-forts to invest in the policy enactment trans-action costs of institutional reform. The finalcombination of performance trends with highwater recovery, high transaction costs, andlow program budgets is implausible, and thus,no such cases were found in this study sample.
The cases with low levels of water recov-ery are also informative. Without sufficientprogram budgets to address barriers to imple-mentation and to foster market-enabling insti-tutional change, the cases are likely to betrapped in a low-performance equilibrium.Therefore, even cases with initially low levelsof water recovery during the five-year studyperiod can be differentiated to gauge perfor-mance trajectories over time. The key differ-ence is marked by those cases with highprogram budgets to cover the costs of gettingto scale and to invest in institutional changesthat will decrease transaction costs over time.The Walla Walla and Upper Columbia ofWashington reflect such cases. In the UpperColumbia, for example, the initial years of im-plementation were marked by low water re-covery and high transaction costs. However,the subbasin invested in relatively high pro-gram budgets, which contributed to increasingwater recovery and decreasing transactioncosts over time (as evidenced by the annualtrend data in Figures 4 and 5). The Montanacases and the Umatilla and Grande Ronde ofNortheastern Oregon, in contrast, fall into thelow-performance trap due to inadequate in-vestments in the transaction costs of institu-tional reform; however, this trend has shiftedsince 2008, when Montana actors became in-volved in rulemaking to address institutionalbarriers.
Discussion: Performance Trends andInstitutional Change
How do performance trends relate to insti-tutional change? The relationship betweenwater rights adjudication and performance of-fers insight into this question. Oregon andIdaho are fully adjudicated in the subbasins
within the study area through processes thatentailed costly court decisions. Adjudicationsin Montana and Washington remain incom-plete, although costly investments in adjudi-cations have occurred in pockets within thesestates, such as the Yakima in Washington. Thepresence of adjudication is expected to con-tribute to relatively high levels of perfor-mance as evidenced by the Deschutes andSalmon examples. The absence of adjudica-tion is expected to pose challenges due to in-complete property rights, which helps explainthe experience in the Upper Columbia ofWashington.
Two sets of outliers are instructive: (1)those without adjudication but with high lev-els of performance across the three measuresand (2) those with adjudication but with lowlevels of performance. The cases in the formercategory (e.g., Bitterroot) and latter category(e.g., Grande Ronde) illustrate two essentialpoints. The Montana cases (in the first cate-gory) recovered high levels of water despitethe absence of water rights reform. After theinitial deals, the Bitterroot and Blackfoot sub-basins exhausted the potential for deals withlow transaction costs within the prevailing in-stitutional setting and found it difficult tobuild on early success to get to scale. Theseimplementation challenges prompted effortsin 2008 to develop new rules and administra-tive pathways for environmental leasing to re-duce barriers to trade. Thus, an adjudicationand/or reinvestment in the transaction costs ofpolicy reform may prove necessary to achieveadaptive efficiency.
The Grande Ronde and Umatilla (in thesecond category) lack water recovery despitehigh levels of water rights reform (i.e., via thepresence of adjudication). These cases dem-onstrate that adjudication may prove neces-sary but insufficient for long-run efficiencyunless such water rights reform is coupledwith governance reforms by subbasin actorsto cooperate in strengthening enabling con-ditions (e.g., water banking and reverseauctions and addressing unintended conse-quences of water transactions on a range ofstakeholders). The Grande Ronde, for exam-ple, involved a permanent transaction thatproceeded without consultation with thebroader basinwide community (Neuman

August 2012Land Economics558
2004; Pilz 2006). The transaction triggered aprotest from upstream and downstream waterusers that led to a costly, six-year conflict res-olution process in administrative courts; irri-gators rallied against the transaction andorganized political resistance that threatenedto unravel Oregon’s legal and regulatoryframework for water transactions (Neuman2004). The Grande Ronde case demonstratesthe benefit of linking water rights reformswith basin governance efforts that promote lo-cal decision making over water allocation andconservation planning buttressed by comple-mentary higher-level mandates (e.g., state wa-ter planning, federal Endangered Species Act)to reinforce local initiatives. By contrast, inthe Deschutes and Upper Salmon cases, waterrights and multilevel basin governance con-ditions combined to improve performanceover time.
V. CONCLUSIONS
This paper examined transaction costs andinstitutional performance in market-based en-vironmental water allocation. It developedand tested a transaction costs framework toevaluate market-based environmental waterallocation. Performance—water recovery,transaction costs, and institutional capacity(program budgets)—varied as much withinstates as across states. Five chief lessonsemerged. First, institutional responses to pub-lic goods failures in water allocation arecostly; the transaction costs involve importantinteractions between the policy reform andimplementation costs, which are therefore dif-ficult to separate in accounting frameworks.Second, context matters but is not determi-native; differences in context (e.g., physicalcharacteristics, institutions, socioeconomicaspects) favor nested governance arrange-ments comprised of field, state, and federalinstitutions that are likely to vary as muchwithin states as across them. Third, clearmethodological categories and typologies areneeded to define and assess transaction costsand institutional performance through allstages of policy design and implementation.The methodological issues include definingwhich set of actors are incorporated, particu-larly to account for and explain the public
transaction costs required to deliver water-re-lated public goods at socially desired levelsthrough market-based mechanisms. Fourth,performance varies spatially within states aswell as across them. The performance trendssuggest that high levels of water recovery de-pend upon adequate financing for investmentsin policy reform to reduce transaction costsover time and achieve increasing returns toscale. Such investments explain why perfor-mance varies within states in response to on-going state- and watershed-level policyreforms, such as water banking and water al-location planning in the Deschutes andSalmon examples. These conditions enhancethe likelihood of achieving adaptive effi-ciency. In the environmental water context,adaptive efficiency was defined as sufficientlevels of water recovery at low and/or declin-ing transaction costs, with adequate institu-tional capacity (program budgets) to get toscale. Finally, temporal performance trendswithin cases also demonstrate the importanceof reinvesting in the transaction costs of pol-icy reform, especially during early periods ofimplementation when initial water recoveryefforts either require relatively high transac-tion costs or are only able to proceed at lowtransactions costs because implementation ef-forts target transactions that are not affectedby persistent institutional barriers, such as thelack of an adjudication or administrative rules.Future research should incorporate publictransaction costs and institutional perfor-mance into a comprehensive and longitudinalassessment of benefits and costs. Such assess-ment will evaluate institutional design andtrack the factors contributing to effective mar-ket-based water policy.
Acknowledgments
The authors gratefully acknowledge the expertiseand time invested by the participants in the study.Practitioners provided the input needed to adapt thekey concepts and methods in transaction costs anal-ysis for the complex context of environmental watertransactions. The list of practitioners whose input fu-eled this research is too long to elaborate here; specialthanks to the primary contacts at the nonprofits (Des-chutes River Conservancy, Oregon Water Trust [TheFreshwater Trust], Montana Water Trust [Clark ForkCoalition], Trout Unlimited–Montana Water Project,

88(3) Garrick and Aylward: Transaction Costs and Institutional Performance 559
Walla Walla Watershed Alliance, Washington RiversConservancy [TU-Washington Water Project], andWashington Water Trust) and agencies (Idaho De-partment of Water Resources, Montana Departmentof Natural Resources and Conservation, Oregon Wa-ter Resources Department, and Washington Depart-ment of Ecology) in the Columbia Basin WaterTransactions Program who participated in threephases of scoping, data collection, and verification.Jimmy Mack provided valuable mapping assistance.The authors also thank Henning Bjornlund, Jeff Con-nor, Laura McCann, Stuart Whitten, and three anon-ymous reviewers for their review of earlier versionsof the manuscript. All errors and omissions remainthe sole responsibility of the authors.
References
Allen Consulting Group. 2006. Transaction Costs ofWater Markets and Environmental Policy Instru-ments. Final Report to the Productivity Commis-sion. Melbourne, Australia: Allen ConsultingGroup.
Anderson, Terry L., and Donald R. Leal. 2001. FreeMarket Environmentalism. Rev. ed. New York:Palgrave Macmillan.
Barzel, Yoram. 1989. Economic Analysis of PropertyRights. New York: Cambridge University Press.
Basta, Elizabeth, and Bonnie G. Colby. 2010. “WaterMarket Trends: Transactions, Quantities, andPrices.” Appraisal Journal Winter: 50–69.
Bauer, Carl J. 1997. “Bringing Water Markets Downto Earth: The Political Economy of Water Rightsin Chile, 1976–1995.” World Development. 25 (5):639–56.
——. 2004. Siren Song: Chilean Water Law as aModel for International Reform. Washington, DC:Resources for the Future Press.
Bjornlund, Henning. 2004. “What Impedes WaterMarkets?” Water 31 (7): 47–51.
Brewer, Jedidiah, Alan Kerr, Robert Glennon, andGary D. Libecap. 2008. “Water Markets in theWest: Prices, Trading, and Contractual Forms.”Economic Inquiry 46 (2): 91–112.
Bromley, Daniel W. 1982. “Land and Water Prob-lems: An Institutional Perspective.” AmericanJournal Agricultural Economics 64 (5): 834–44.
——. 1989. Economic Interests and Institutions. NewYork: Blackwell Publications.
Carey, Janice, David L. Sunding, and David Zilber-man. 2002. “Transaction Costs and TradingBehavior in an Immature Water Market.” Environ-ment, Development, and Economics 7 (4): 733–50.
Challen, Ray. 2000. Institutions, Transaction Costs,and Environmental Policy. Cheltenham, UK: Ed-ward Elgar.
Ciriacy Wantrup, S. V., and Richard C. Bishop. 1975.“ ‘Common Property’ as a Concept in Natural Re-sources Policy.” Natural Resources Journal 15(4): 713–27.
Coase, Ronald H. 1937. “The Nature of the Firm.”Economica 4 (16): 386–405.
———. 1960. “The Problem of Social Cost.” Journalof Law and Economics 3 (October): 1–44.
Coggan, Anthea, Stuart M. Whitten, and Jeffrey Ben-nett. 2010. “Influences of Transaction Costs in En-vironmental Policy.” Ecological Economics 69(9): 1777–84.
Colby, Bonnie G. 1990a. “Transactions Costs and Ef-ficiency in Western Water Allocation.” AmericanJournal of Agricultural Economics 72 (5): 1184–92.
——. 1990b. “Enhancing Instream Flow Benefits inan Era of Water Marketing.” Water Resources Re-search 26 (6): 1113–20.
Cole, Daniel H. 2002. Pollution and Property: Com-paring Ownership Institutions for EnvironmentalProtection. Cambridge: Cambridge UniversityPress.
Demsetz, Harold. 1967. “Toward a Theory of Prop-erty Rights.” American Economic Review 57 (2):347.
Easter, William K., Mark W. Rosegrant, and ArielDinar, eds. 1998. Markets for Water: Potentialand Performance. Boston: Kluwer AcademicPublisher.
Gangaharan, Lata. 2000. “Transaction Costs in Pol-lution Markets: An Empirical Study.” Land Eco-nomics 76 (4): 601–14.
Garrick, D., M. Siebentritt, B. Aylward, C. J. Bauer,and A. Purkey. 2009. “Water Markets and Fresh-water Ecosystem Services: Policy Reform and Im-plementation in the Columbia and Murray DarlingBasins.” Ecological Economics 69 (2): 366–79.
Hardner, Jared, and R. E. Gullison. 2007. IndependentExternal Evaluation of the Columbia Basin WaterTransactions Program (2003–2006). Amherst,NH: Hardner and Gullison Consulting.
Hayek, Friedrich A. 1945. “The Use of Knowledgein Society.” American Economic Review 35 (4):519–30.
Hearne, Robert R., and K. William Easter. 1995. Wa-ter Allocation and Water Markets: An Analysis ofGains-from-Trade in Chile. Technical Paper 315.Washington, DC: World Bank.
Howitt, Richard E. 1994. “Empirical Analysis of Wa-ter Market Institutions: The 1991 California WaterMarket.” Resource and Energy Economics 16 (4):357–71.
Jones, Lana, and Bonnie Colby. 2010. “Weather, Cli-mate, and Environmental Water Transactions.”Weather, Climate, and Society 2 (3): 210–23.

August 2012Land Economics560
Libecap, Gary D. 1989. Contracting for PropertyRights. New York: Cambridge University Press.
Loomis, John B., Katherine Quattlebaum, Thomas C.Brown, and Susan J. Alexander. 2003. “ExpandingInstitutional Arrangements for Acquiring Waterfor Environmental Purposes: Transactions Evi-dence for the Western United States.” Interna-tional Journal of Water Resources Development19 (1): 21–28.
Lovrich, Nicholas P., and Dan Siemann. 2004. Of Wa-ter and Trust: A Review of the Washington WaterAcquisition Program. Seattle: Policy ConsensusCenter, Washington State University and Univer-sity of Washington.
MacDonnell, Lawrence J. 1990. The Water TransferProcess as a Management Option for MeetingChanging Water Demands. Boulder: Natural Re-sources Law Center, University of Colorado.
Marshall, Graham. 2005. Economics for Collabora-tive Environmental Management: Regeneratingthe Commons. London: Earthscan.
McCann, Laura, Bonnie Colby, K. William Easter,Alexander Kasterine, and K. V. Kuperan. 2005.“Transaction Cost Measurement for EvaluatingEnvironmental Policies.” Ecological Economics52 (4): 527–42.
McCann, Laura, and K. William Easter. 2000. “Esti-mates of Public Sector Transaction Costs in NRCSPrograms.” Journal of Agricultural and AppliedEconomics 32 (3): 555–63.
McCann, Laura, and K. William Easter. 2004. “AFramework for Estimating the Transaction Costsof Alternative Mechanisms for Water Exchangeand Allocation.” Water Resources Research 40:W09S09.
Mettepenningen, E., V. Beckman, and J. Egger. 2011.“Public Transaction Costs of Agri-environmental
Schemes and their Determinants—AnalyzingStakeholders’ Involvement and Perceptions.” Eco-logical Economics 70 (4): 641–50.
Neuman, Janet C. 2004. “The Good, the Bad and theUgly: The First Ten Years of the Oregon WaterTrust.” Nebraska Law Review 83 (2): 432–84.
Neuman, Janet C., Anne Squier, and Gail Achterman.2006. “Sometimes a Great Notion: Oregon’s In-stream Flow Experiments.” Environmental Law 36(4): 1125–55.
North, Douglass C. 1990. Institutions, InstitutionalChange and Economic Performance. New York:Cambridge University Press.
———. 1994. “Economic Performance throughTime.” American Economic Review 84 (3): 359–68.
Northwest Power and Conservation Council (NPCC).2005. Deschutes Subbasin Plan. Portland, OR:Columbia River Basin Fish and Wildlife Program.
Ostrom, Elinor. 1990. Governing the Commons: TheEvolution of Institutions for Collective Action.Cambridge: Cambridge University Press.
Pilz, Robert D. 2006. “At the Confluence: Oregon’sInstream Water Rights in Theory and Practice.”Environmental Law Journal 36 (4).
Ruml, C. Carter. 2005. “The Coase Theorem andWestern U.S. Appropriative Water Rights.” Nat-ural Resources Journal 45 (1): 169–200.
Schlager, Edella, and William Blomquist. 2008. Em-bracing Watershed Politics. Boulder: UniversityPress of Colorado.
Thompson, Barton H., Jr. 1993. “Institutional Per-spectives on Water Policy and Markets.” Califor-nia Law Review 81 (3): 671–764.
Williamson, Oliver E. 1998. “Transaction Cost Eco-nomics: How It Works; Where It Is Headed.” DeEconomist 146 (3): 23–58.
Related Documents