Submitted 24 March 2015 Accepted 5 May 2015 Published 21 May 2015 Corresponding author Katr´ ın Halld ´ orsd ´ ottir, [email protected] Academic editor Abhishek Kumar Additional Information and Declarations can be found on page 24 DOI 10.7717/peerj.976 Copyright 2015 Halld ´ orsd ´ ottir and ´ Arnason Distributed under Creative Commons CC-BY 4.0 OPEN ACCESS Trans-species polymorphism at antimicrobial innate immunity cathelicidin genes of Atlantic cod and related species Katr´ ın Halld ´ orsd ´ ottir and Einar ´ Arnason Institute of Life and Environmental Sciences, University of Iceland, Reykjav´ ık, Iceland ABSTRACT Natural selection, the most important force in evolution, comes in three forms. Negative purifying selection removes deleterious variation and maintains adaptations. Positive directional selection fixes beneficial variants, producing new adaptations. Balancing selection maintains variation in a population. Important mechanisms of balancing selection include heterozygote advantage, frequency- dependent advantage of rarity, and local and fluctuating episodic selection. A rare pathogen gains an advantage because host defenses are predominantly effective against prevalent types. Similarly, a rare immune variant gives its host an advantage because the prevalent pathogens cannot escape the host’s apostatic defense. Due to the stochastic nature of evolution, neutral variation may accumulate on genealogical branches, but trans-species polymorphisms are rare under neutrality and are strong evidence for balancing selection. Balanced polymorphism maintains diversity at the major histocompatibility complex (MHC) in vertebrates. The Atlantic cod is missing genes for both MHC-II and CD4, vital parts of the adaptive immune system. Never- theless, cod are healthy in their ecological niche, maintaining large populations that support major commercial fisheries. Innate immunity is of interest from an evolu- tionary perspective, particularly in taxa lacking adaptive immunity. Here, we analyze extensive amino acid and nucleotide polymorphisms of the cathelicidin gene family in Atlantic cod and closely related taxa. There are three major clusters, Cath1, Cath2, and Cath3, that we consider to be paralogous genes. There is extensive nucleotide and amino acid allelic variation between and within clusters. The major feature of the results is that the variation clusters by alleles and not by species in phylogenetic trees and discriminant analysis of principal components. Variation within the three groups shows trans-species polymorphism that is older than speciation and that is suggestive of balancing selection maintaining the variation. Using Bayesian and likelihood methods positive and negative selection is evident at sites in the conserved part of the genes and, to a larger extent, in the active part which also shows episodic diversifying selection, further supporting the argument for balancing selection. Subjects Aquaculture, Fisheries and Fish Science, Evolutionary Studies, Genetics, Marine Biology, Immunology Keywords Atlantic cod, Innate immunity, Cathelicidin, Balancing selection, Trans-species polymorphism, Gadids How to cite this article Halld ´ orsd ´ ottir and ´ Arnason (2015), Trans-species polymorphism at antimicrobial innate immunity cathelicidin genes of Atlantic cod and related species. PeerJ 3:e976; DOI 10.7717/peerj.976

Welcome message from author
This document is posted to help you gain knowledge. Please leave a comment to let me know what you think about it! Share it to your friends and learn new things together.
Transcript
Submitted 24 March 2015Accepted 5 May 2015Published 21 May 2015
Corresponding authorKatrın Halldorsdottir,[email protected]
Academic editorAbhishek Kumar
Additional Information andDeclarations can be found onpage 24
DOI 10.7717/peerj.976
Copyright2015 Halldorsdottir and Arnason
Distributed underCreative Commons CC-BY 4.0
OPEN ACCESS
Trans-species polymorphism atantimicrobial innate immunitycathelicidin genes of Atlantic cod andrelated speciesKatrın Halldorsdottir and Einar Arnason
Institute of Life and Environmental Sciences, University of Iceland, Reykjavık, Iceland
ABSTRACTNatural selection, the most important force in evolution, comes in three forms.Negative purifying selection removes deleterious variation and maintainsadaptations. Positive directional selection fixes beneficial variants, producing newadaptations. Balancing selection maintains variation in a population. Importantmechanisms of balancing selection include heterozygote advantage, frequency-dependent advantage of rarity, and local and fluctuating episodic selection. A rarepathogen gains an advantage because host defenses are predominantly effectiveagainst prevalent types. Similarly, a rare immune variant gives its host an advantagebecause the prevalent pathogens cannot escape the host’s apostatic defense. Due tothe stochastic nature of evolution, neutral variation may accumulate on genealogicalbranches, but trans-species polymorphisms are rare under neutrality and are strongevidence for balancing selection. Balanced polymorphism maintains diversity at themajor histocompatibility complex (MHC) in vertebrates. The Atlantic cod is missinggenes for both MHC-II and CD4, vital parts of the adaptive immune system. Never-theless, cod are healthy in their ecological niche, maintaining large populations thatsupport major commercial fisheries. Innate immunity is of interest from an evolu-tionary perspective, particularly in taxa lacking adaptive immunity. Here, we analyzeextensive amino acid and nucleotide polymorphisms of the cathelicidin gene familyin Atlantic cod and closely related taxa. There are three major clusters, Cath1, Cath2,and Cath3, that we consider to be paralogous genes. There is extensive nucleotideand amino acid allelic variation between and within clusters. The major feature of theresults is that the variation clusters by alleles and not by species in phylogenetic treesand discriminant analysis of principal components. Variation within the three groupsshows trans-species polymorphism that is older than speciation and that is suggestiveof balancing selection maintaining the variation. Using Bayesian and likelihoodmethods positive and negative selection is evident at sites in the conserved part of thegenes and, to a larger extent, in the active part which also shows episodic diversifyingselection, further supporting the argument for balancing selection.
Subjects Aquaculture, Fisheries and Fish Science, Evolutionary Studies, Genetics, MarineBiology, ImmunologyKeywords Atlantic cod, Innate immunity, Cathelicidin, Balancing selection, Trans-speciespolymorphism, Gadids
How to cite this article Halldorsdottir and Arnason (2015), Trans-species polymorphism at antimicrobial innate immunity cathelicidingenes of Atlantic cod and related species. PeerJ 3:e976; DOI 10.7717/peerj.976
INTRODUCTIONVertebrates fight microbial infections using both innate immunity and adaptive responses.
MHC molecules, cell surface molecules with broad (MHC-I) and specialized (MHC-II)
pathogen recognition features (Murphy, Travers & Walport, 2007), show trans-species
polymorphisms, variation indicative of adaptive balancing selection. For example, certain
MHC-II alleles of humans are more closely related to certain alleles of chimpanzee than
to other human alleles (Fan et al., 1989; Nei & Hughes, 1991). An ancient balanced
polymorphism will generate long genealogical branches. Neutral variation will accumulate
at sites close to the balanced polymorphic sites (Charlesworth, 2006). However, depending
on recombination, the size of the genomic region can be quite short, making trans-species
polymorphism hard to detect. Obvious and pervasive trans-species polymorphism,
in contrast, is most likely due either to multiple sites under balancing selection or to
suppression of recombination or to both (Wiuf et al., 2004). The models that have been
proposed for detecting balancing selection in molecular data frequently assume that there
is a single site under balancing selection. The silent and non-coding polymorphisms
surrounding that site are taken as a signature of selection (Gao, Przeworski & Sella,
2015; Leffler et al., 2013). With the wealth of genomic data currently being generated,
it is evident that many selective effects are related to immune defenses (Nielsen et al.,
2007; Quintana-Murci & Clark, 2013; Teixeira et al., 2014; Osborne et al., 2013). Our
understanding of balancing selection will be much improved by these new data, and
important insights will be gained from genetic data without embarking on functional
studies (Charlesworth, 2006).
Unique among vertebrates, the Atlantic cod (Gadus morhua) genome reveals the
evolutionary loss of MHC-II and CD4, major parts of the adaptive immune system
(probably they also are lost in other gadids, Star et al., 2011). Yet cod are healthy, playing a
major ecological role in the North Atlantic, and are capable of sustaining large commercial
fisheries. However, the way in which cod compensate for the lack of an adaptive immune
response is unknown (Pilstrom, Warr & Stromberg, 2005; Magnadottir, 2010; Star & Jentoft,
2012). Host and parasite/pathogen interactions are very interesting in evolutionary terms.
Pathogens set selective pressures on hosts and the response of the host is crucial for its own
survival as well as the survival of the parasite. The innate immune system is at the forefront
of this battle. It is of special interest to investigate evolution and variation of the innate
immunity genes responsible for host defense.
Various families of antimicrobial peptides are an essential part of innate immunity. The
cathelicidin family, first described in various mammals (Zanetti, Gennaro & Romeo, 1995),
has been extensively studied in many organisms, e.g., primates (Zelezetsky et al., 2006) and
fish (Maier et al., 2008; Kapralova et al., 2013). Important tools, such as Clnp-/- knockout
mice, are available for functional studies (see e.g., Zhang et al., 2012). The number of
genes coding for this protein varies among species. For example, there is a single gene in
human (Gudmundsson et al., 1996) whereas there are ten in pig (Dawson et al., 2013). The
protein is characterized by an N-terminus, a signal sequence, a conserved cathelin-like
domain (exons 1, 2 and 3) and a C-terminal domain with antimicrobial activity (exon
Halldorsdottir and Arnason (2015), PeerJ, DOI 10.7717/peerj.976 2/30
4). The N-terminus of the protein has certain conserved features that characterize all
cathelicidins, i.e., four cysteine residues forming two disulfide bridges (Tomasinsig &
Zanetti, 2005) (Fig. S1). This evolutionarily conserved part is, nevertheless, targeted by
positive selection (Zhu, 2008) (Fig. S1). The C-terminus is highly variable within multigene
families and among species, most likely due to diversifying balancing selection (Tomasinsig
& Zanetti, 2005). Many innate immune molecules have been described in Atlantic cod,
e.g., piscidin (Fernandes, Ruangsri & Kiron, 2010), beta-defensin (Ruangsri et al., 2013) and
the expanded toll-like receptor family (Sundaram et al., 2012), showing novel forms and
patterns indicating importance of antimicrobial peptides and their genes for the immunity
of these fish.
Several hypotheses have been proposed for the selective maintenance of high diversity
at the MHC-II loci in vertebrates. These hypotheses include the heterozygote advantage
hypothesis, the frequency-dependent rare-allele advantage hypothesis, and the fluctuating
selection hypothesis under which the intensity of selective pressure can vary in accordance
with the stimulus from pathogens. Thus, pathogen-driven episodic selection may vary in
different environments and at different time periods (Clarke, 1962; Spurgin & Richardson,
2010; Sommer, 2005). However, the molecular signatures behind such balancing selection
can be hard to detect and distinguish from other types of selection (Quintana-Murci &
Clark, 2013).
Another example of unusually high polymorphism are the disease resistance R genes
in Arabidopsis (Bakker et al., 2006). The mechanism behind extremely high gene copy
number has been explained by the advantage of fixed heterozygosity based on duplicated
genes each carrying different variants. This would give the advantage of overdominance
without incurring any segregation load. In another study on R genes in the Arabidopsis,
Shen et al. (2006) showed the effect of balancing selection in evolution of presence/absence
polymorphism. In their study the R genes show different allele frequencies reflecting
frequency-dependent selection at different stages of the evolutionary process.
Most genome-wide studies, scanning for variation, show high-frequency polymor-
phisms in genes related to immunity (Nielsen et al., 2007; Leffler et al., 2013). In this study,
we examine the Cathelicidin family of innate immunity genes in Atlantic cod in individuals
from throughout the distributional range (Fig. 1), and in closely related species. We report
large variation within and among species. We report a distinctive data set discovered when
we attempted to amplify a particular Cathelicidin gene with a pair of primers designed
from Atlantic cod sequences. Our initial aim was to study population variation at the
single codCath1 locus previously described (Maier et al., 2008) and also found in the
Atlantic cod genome sequence (Star et al., 2011). With only a single pair of primers we
found extreme variation in 97 clones from 27 individuals. The amount and patterns of
variation both within and among species cannot be explained as single locus variation.
We discuss paralogous variation and the orthologous variation within paralogs in terms of
trans-species polymorphism.
Halldorsdottir and Arnason (2015), PeerJ, DOI 10.7717/peerj.976 3/30
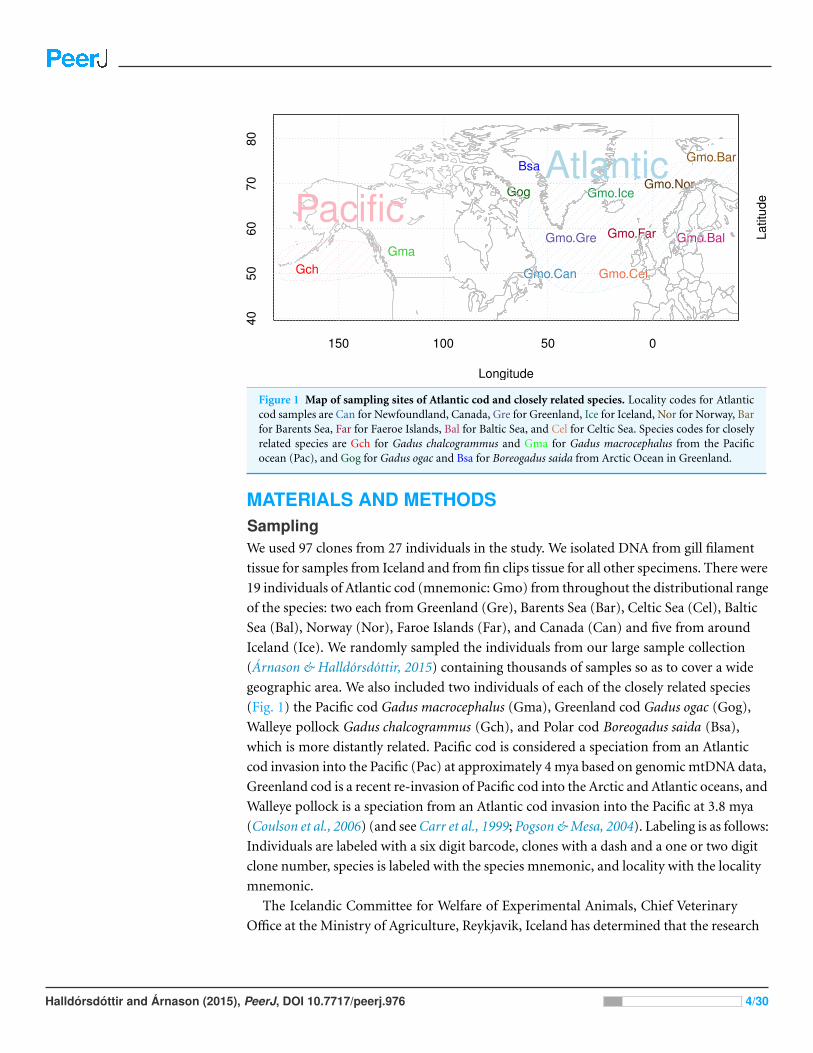
Figure 1 Map of sampling sites of Atlantic cod and closely related species. Locality codes for Atlanticcod samples are Can for Newfoundland, Canada, Gre for Greenland, Ice for Iceland, Nor for Norway, Barfor Barents Sea, Far for Faeroe Islands, Bal for Baltic Sea, and Cel for Celtic Sea. Species codes for closelyrelated species are Gch for Gadus chalcogrammus and Gma for Gadus macrocephalus from the Pacificocean (Pac), and Gog for Gadus ogac and Bsa for Boreogadus saida from Arctic Ocean in Greenland.
MATERIALS AND METHODSSamplingWe used 97 clones from 27 individuals in the study. We isolated DNA from gill filament
tissue for samples from Iceland and from fin clips tissue for all other specimens. There were
19 individuals of Atlantic cod (mnemonic: Gmo) from throughout the distributional range
of the species: two each from Greenland (Gre), Barents Sea (Bar), Celtic Sea (Cel), Baltic
Sea (Bal), Norway (Nor), Faroe Islands (Far), and Canada (Can) and five from around
Iceland (Ice). We randomly sampled the individuals from our large sample collection
(Arnason & Halldorsdottir, 2015) containing thousands of samples so as to cover a wide
geographic area. We also included two individuals of each of the closely related species
(Fig. 1) the Pacific cod Gadus macrocephalus (Gma), Greenland cod Gadus ogac (Gog),
Walleye pollock Gadus chalcogrammus (Gch), and Polar cod Boreogadus saida (Bsa),
which is more distantly related. Pacific cod is considered a speciation from an Atlantic
cod invasion into the Pacific (Pac) at approximately 4 mya based on genomic mtDNA data,
Greenland cod is a recent re-invasion of Pacific cod into the Arctic and Atlantic oceans, and
Walleye pollock is a speciation from an Atlantic cod invasion into the Pacific at 3.8 mya
(Coulson et al., 2006) (and see Carr et al., 1999; Pogson & Mesa, 2004). Labeling is as follows:
Individuals are labeled with a six digit barcode, clones with a dash and a one or two digit
clone number, species is labeled with the species mnemonic, and locality with the locality
mnemonic.
The Icelandic Committee for Welfare of Experimental Animals, Chief Veterinary
Office at the Ministry of Agriculture, Reykjavik, Iceland has determined that the research
Halldorsdottir and Arnason (2015), PeerJ, DOI 10.7717/peerj.976 4/30
conducted here is not subject to the laws concerning the Welfare of Experimental Animals.
(The Icelandic Law on Animal Protection, Law 15/1994, last updated with Law 157/2012.)
DNA was isolated from tissue taken from dead fish on board research vessels. Fish were
collected during the yearly surveys of the Icelandic Marine Research Institute. All research
plans and sampling of fish, including the ones for the current project, have been evaluated
and approved by the Marine Research Institute Board of Directors. The Board comprises
the Director General, Deputy Directors for Science and Finance and heads of the Marine
Environment Section, the Marine Resources Section, and the Fisheries Advisory Section.
Samples were also obtained from dead fish from marine research institutes in Norway,
the Netherlands, Canada and the US that were similarly approved by the respective ethics
boards. The samples from the US used in this study have been described in Cunningham
et al. (2009) and the samples from Norway in Arnason & Palsson (1996). The samples
from Canada consisted of DNA isolated from the samples described in Pogson (2001).
The samples from the Netherlands were obtained from the Beam-Trawl-Survey (http:
//www.wageningenur.nl/en/Expertise-Services/Research-Institutes/imares/Weblogs/
Beam-Trawl-Survey.htm) of the Institute for Marine Resources & Ecosystem Studies
(IMARES), Wageningen University, the Netherlands, which is approved by the IMARES
Animal Care Committee and IMARES Board of Directors.
Molecular analysisWe extracted genomic DNA using a Chelex/proteinase K extraction method (Walsh,
Metzger & Higuchi, 1991). PCR was performed using Long PCR Enzyme Mix (Thermo
Scientific/Fermentas #K0181) according to the manufacturer’s two-step cycling protocol.
The PCR program was as follow: initial denaturation step of 3 min at 94 ◦C; 10 cycles of
20 s denaturation at 94 ◦C, 30 s annealing at 60 ◦C and 1.5 min extension at 68 ◦C. The
annealing temperature was reduced by 2 ◦C in next two cycles and 1 ◦C in the following
cycle, reaching annealing temperature of 55 ◦C. Additional 22 cycles were run under this
condition with a 7 min final extension. Total 35 cycles.
The primers used for PCR were CodCathF1: 5′-TGTTCAGCACAAAGCCAAACT-3′
from Maier et al. (2008) and CodCathR4: 5′-GAGACAGGCTCAAGCCAATG-3′ a new
reverse primer made for this study. The CodCathR4 primer was designed using Primer3
(Untergasser et al., 2012) and 3′ UTR part of GenBank sequence with accession number
EU707291.1 as template.
Universal M13F and M13R primers were used for sequencing, using the BigDye® Termi-
nator v3.1 Cycle Sequencing Kit (Applied Biosystems) according to the manufacturer’s
protocols for plasmid sequencing except that we used 1/16 of the manufacturer’s
recommended amount.
The PCR amplification fragments were gel extracted and cloned with PCR® 4-TOPO
vector (InvitrogenTM) and Sanger sequenced using an AB-3500xL Genetic Analyser
(Applied Biosystems) (Halldorsdottir & Arnason, 2009). All sequences were analyzed using
the Phred/Phrap/Consed software suite (Ewing et al., 1998; Ewing & Green, 1998; Gordon,
Abajian & Green, 1998) and had top-quality Phred score values (>30). Our initial goal
Halldorsdottir and Arnason (2015), PeerJ, DOI 10.7717/peerj.976 5/30
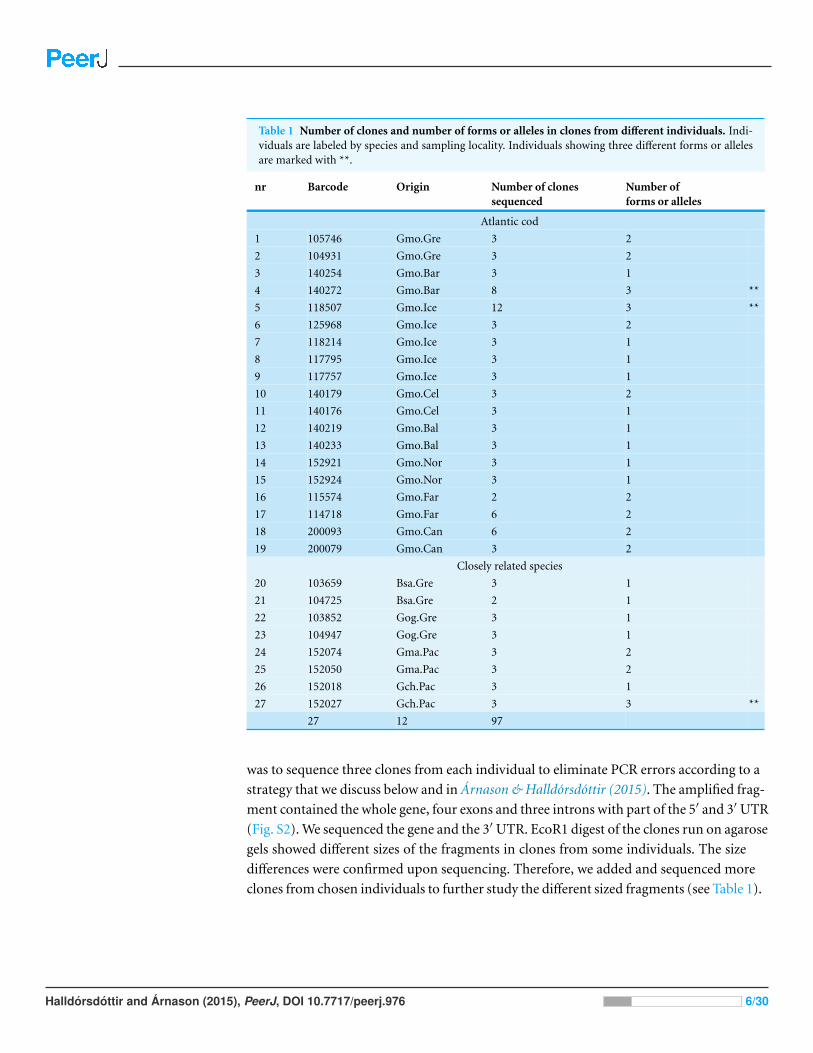
Table 1 Number of clones and number of forms or alleles in clones from different individuals. Indi-viduals are labeled by species and sampling locality. Individuals showing three different forms or allelesare marked with **.
nr Barcode Origin Number of clonessequenced
Number offorms or alleles
Atlantic cod
1 105746 Gmo.Gre 3 2
2 104931 Gmo.Gre 3 2
3 140254 Gmo.Bar 3 1
4 140272 Gmo.Bar 8 3 **
5 118507 Gmo.Ice 12 3 **
6 125968 Gmo.Ice 3 2
7 118214 Gmo.Ice 3 1
8 117795 Gmo.Ice 3 1
9 117757 Gmo.Ice 3 1
10 140179 Gmo.Cel 3 2
11 140176 Gmo.Cel 3 1
12 140219 Gmo.Bal 3 1
13 140233 Gmo.Bal 3 1
14 152921 Gmo.Nor 3 1
15 152924 Gmo.Nor 3 1
16 115574 Gmo.Far 2 2
17 114718 Gmo.Far 6 2
18 200093 Gmo.Can 6 2
19 200079 Gmo.Can 3 2
Closely related species
20 103659 Bsa.Gre 3 1
21 104725 Bsa.Gre 2 1
22 103852 Gog.Gre 3 1
23 104947 Gog.Gre 3 1
24 152074 Gma.Pac 3 2
25 152050 Gma.Pac 3 2
26 152018 Gch.Pac 3 1
27 152027 Gch.Pac 3 3 **
27 12 97
was to sequence three clones from each individual to eliminate PCR errors according to a
strategy that we discuss below and in Arnason & Halldorsdottir (2015). The amplified frag-
ment contained the whole gene, four exons and three introns with part of the 5′ and 3′ UTR
(Fig. S2). We sequenced the gene and the 3′ UTR. EcoR1 digest of the clones run on agarose
gels showed different sizes of the fragments in clones from some individuals. The size
differences were confirmed upon sequencing. Therefore, we added and sequenced more
clones from chosen individuals to further study the different sized fragments (see Table 1).
Halldorsdottir and Arnason (2015), PeerJ, DOI 10.7717/peerj.976 6/30
Data analysisErrors occur during PCR amplification and inevitably will be found, mostly as singletons,
in the sequences of the cloned DNA. To remove this source of variation from the data
we initially had planned to use the strategy of Arnason & Halldorsdottir (2015) to get a
consensus sequence for each individual from its three clones. However, the results showed
that sequences of clones from some individuals were very different from each other, too
divergent to be variation due to PCR errors. In some instances they belonged on the amino
acid level to already described paralogous genes (Maier et al., 2008). Therefore, we revised
the strategy for eliminating PCR errors by screening out singleton sites as follows. The
three clones from each of the 27 individuals yielded 81 clones and, as already stated, we
added extra clones for some individuals for a total of 97 clones. Singleton sites among the
various clones from each individual that belonged to a certain cluster were considered PCR
errors and not counted if that site was not found variable in clones from another individual
(or other individuals). However, a singleton variant among the clones of an individual was
considered a real SNP and was retained if that site was similarly variable in clones from
other individuals (see Halldorsdottir & Arnason, 2009, for estimation of errors in replicate
PCR reactions). If a single clone from a particular individual represented a different cluster
(paralogous gene) from the rest of the clones from that individual, then that clone was
included in the analysis. If the same form was present in all clones from an individual only
one sequence was included in the analysis (a consensus sequence for that individual). Using
this strategy we had 43 clones. Each singleton site in the data of the 43 clones analyzed here
was considered a real variant because it was found in more than one clone in the original
data of 97 clones. The 43 clones analyzed here contain a single representative clone from
each individual for either each allele or each gene. We also present an analysis of the 97
clones for comparison. New sequences generated in this study have GenBank accession
numbers KJ831349–KJ831391.
EST sequences from the Canadian Atlantic Cod Genomics and Broodstock Develop-
ment project (Bowman et al., 2011) were used in the analysis for comparison on the protein
level. These were GenBank Accession numbers EY975127.1 (based on mRNA from a Gadus
morhua spleen SSH library enriched for genes up-regulated by formalin-killed atypical
Aeromonas salmonicida), FG312333.1 (based on Gadus morhua blood library injected
with polyriboinosinic polyribocytidylic acid and formalin-killed Aeromonas salmonicida),
and ES786338.1 (Gadus morhua spleen SSH library enriched for genes up-regulated by
polyriboinosinic polyribocytidylic acid). We also used GW862872.1 (based on mRNA
from thymus from a Norwegian coastal cod, already charcaterized as cod Cathelicidin 2 in
Maier et al., 2008) and EU707291.1 (complete cds from mRNA isolated from a wild cought
cod from Iceland, previously characterized as cod Cathelicidin 1, codcath1 in Maier et al.,
2008). Finally, we also included the complete gene sequence from GeneScaffold 2759 from
the North East Arctic Atlantic cod genome sequence (Star et al., 2011) available on the
Ensembl browser (Flicek et al., 2014).
Phylogenetic maximum likelihood trees were built using Muscle (Edgar, 2004) aligned
sequences with a branch support of 100 bootstrap replicates using phyML (Guindon &
Halldorsdottir and Arnason (2015), PeerJ, DOI 10.7717/peerj.976 7/30
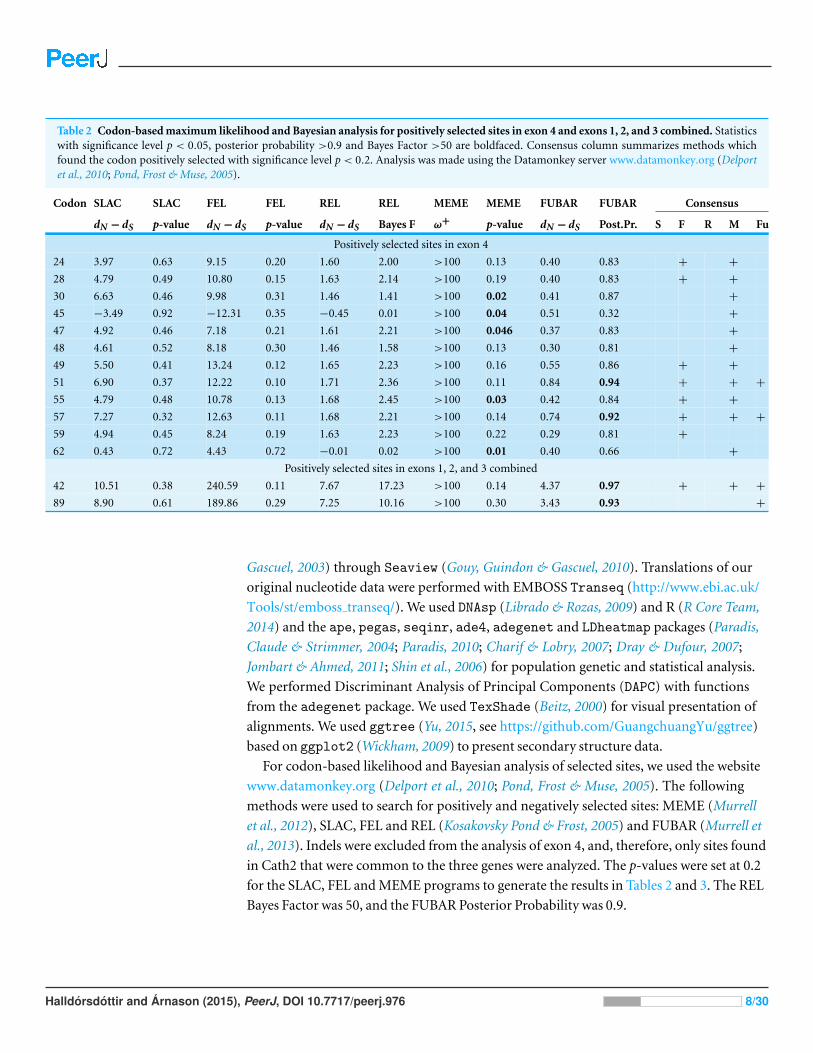
Table 2 Codon-based maximum likelihood and Bayesian analysis for positively selected sites in exon 4 and exons 1, 2, and 3 combined. Statisticswith significance level p < 0.05, posterior probability >0.9 and Bayes Factor >50 are boldfaced. Consensus column summarizes methods whichfound the codon positively selected with significance level p < 0.2. Analysis was made using the Datamonkey server www.datamonkey.org (Delportet al., 2010; Pond, Frost & Muse, 2005).
Codon SLAC SLAC FEL FEL REL REL MEME MEME FUBAR FUBAR Consensus
dN − dS p-value dN − dS p-value dN − dS Bayes F ω+ p-value dN − dS Post.Pr. S F R M Fu
Positively selected sites in exon 4
24 3.97 0.63 9.15 0.20 1.60 2.00 >100 0.13 0.40 0.83 + +
28 4.79 0.49 10.80 0.15 1.63 2.14 >100 0.19 0.40 0.83 + +
30 6.63 0.46 9.98 0.31 1.46 1.41 >100 0.02 0.41 0.87 +
45 −3.49 0.92 −12.31 0.35 −0.45 0.01 >100 0.04 0.51 0.32 +
47 4.92 0.46 7.18 0.21 1.61 2.21 >100 0.046 0.37 0.83 +
48 4.61 0.52 8.18 0.30 1.46 1.58 >100 0.13 0.30 0.81 +
49 5.50 0.41 13.24 0.12 1.65 2.23 >100 0.16 0.55 0.86 + +
51 6.90 0.37 12.22 0.10 1.71 2.36 >100 0.11 0.84 0.94 + + +
55 4.79 0.48 10.78 0.13 1.68 2.45 >100 0.03 0.42 0.84 + +
57 7.27 0.32 12.63 0.11 1.68 2.21 >100 0.14 0.74 0.92 + + +
59 4.94 0.45 8.24 0.19 1.63 2.23 >100 0.22 0.29 0.81 +
62 0.43 0.72 4.43 0.72 −0.01 0.02 >100 0.01 0.40 0.66 +
Positively selected sites in exons 1, 2, and 3 combined
42 10.51 0.38 240.59 0.11 7.67 17.23 >100 0.14 4.37 0.97 + + +
89 8.90 0.61 189.86 0.29 7.25 10.16 >100 0.30 3.43 0.93 +
Gascuel, 2003) through Seaview (Gouy, Guindon & Gascuel, 2010). Translations of our
original nucleotide data were performed with EMBOSS Transeq (http://www.ebi.ac.uk/
Tools/st/emboss transeq/). We used DNAsp (Librado & Rozas, 2009) and R (R Core Team,
2014) and the ape, pegas, seqinr, ade4, adegenet and LDheatmap packages (Paradis,
Claude & Strimmer, 2004; Paradis, 2010; Charif & Lobry, 2007; Dray & Dufour, 2007;
Jombart & Ahmed, 2011; Shin et al., 2006) for population genetic and statistical analysis.
We performed Discriminant Analysis of Principal Components (DAPC) with functions
from the adegenet package. We used TexShade (Beitz, 2000) for visual presentation of
alignments. We used ggtree (Yu, 2015, see https://github.com/GuangchuangYu/ggtree)
based on ggplot2 (Wickham, 2009) to present secondary structure data.
For codon-based likelihood and Bayesian analysis of selected sites, we used the website
www.datamonkey.org (Delport et al., 2010; Pond, Frost & Muse, 2005). The following
methods were used to search for positively and negatively selected sites: MEME (Murrell
et al., 2012), SLAC, FEL and REL (Kosakovsky Pond & Frost, 2005) and FUBAR (Murrell et
al., 2013). Indels were excluded from the analysis of exon 4, and, therefore, only sites found
in Cath2 that were common to the three genes were analyzed. The p-values were set at 0.2
for the SLAC, FEL and MEME programs to generate the results in Tables 2 and 3. The REL
Bayes Factor was 50, and the FUBAR Posterior Probability was 0.9.
Halldorsdottir and Arnason (2015), PeerJ, DOI 10.7717/peerj.976 8/30
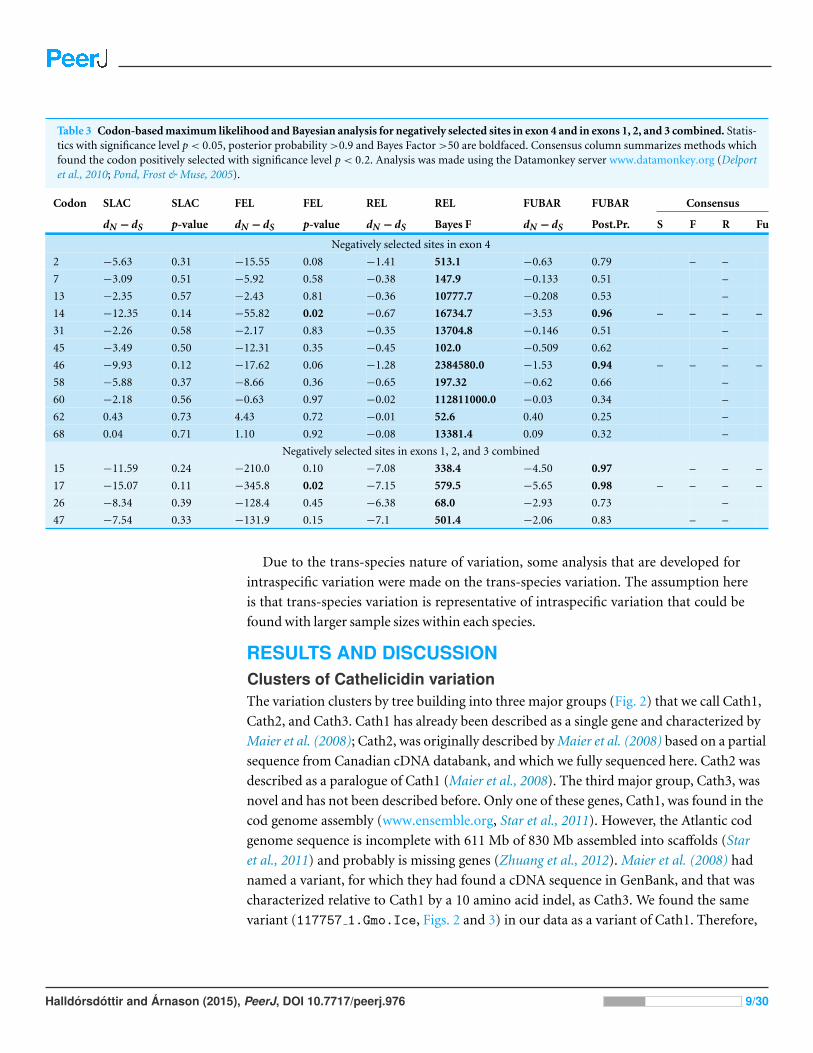
Table 3 Codon-based maximum likelihood and Bayesian analysis for negatively selected sites in exon 4 and in exons 1, 2, and 3 combined. Statis-tics with significance level p < 0.05, posterior probability >0.9 and Bayes Factor >50 are boldfaced. Consensus column summarizes methods whichfound the codon positively selected with significance level p < 0.2. Analysis was made using the Datamonkey server www.datamonkey.org (Delportet al., 2010; Pond, Frost & Muse, 2005).
Codon SLAC SLAC FEL FEL REL REL FUBAR FUBAR Consensus
dN − dS p-value dN − dS p-value dN − dS Bayes F dN − dS Post.Pr. S F R Fu
Negatively selected sites in exon 4
2 −5.63 0.31 −15.55 0.08 −1.41 513.1 −0.63 0.79 – –
7 −3.09 0.51 −5.92 0.58 −0.38 147.9 −0.133 0.51 –
13 −2.35 0.57 −2.43 0.81 −0.36 10777.7 −0.208 0.53 –
14 −12.35 0.14 −55.82 0.02 −0.67 16734.7 −3.53 0.96 – – – –
31 −2.26 0.58 −2.17 0.83 −0.35 13704.8 −0.146 0.51 –
45 −3.49 0.50 −12.31 0.35 −0.45 102.0 −0.509 0.62 –
46 −9.93 0.12 −17.62 0.06 −1.28 2384580.0 −1.53 0.94 – – – –
58 −5.88 0.37 −8.66 0.36 −0.65 197.32 −0.62 0.66 –
60 −2.18 0.56 −0.63 0.97 −0.02 112811000.0 −0.03 0.34 –
62 0.43 0.73 4.43 0.72 −0.01 52.6 0.40 0.25 –
68 0.04 0.71 1.10 0.92 −0.08 13381.4 0.09 0.32 –
Negatively selected sites in exons 1, 2, and 3 combined
15 −11.59 0.24 −210.0 0.10 −7.08 338.4 −4.50 0.97 – – –
17 −15.07 0.11 −345.8 0.02 −7.15 579.5 −5.65 0.98 – – – –
26 −8.34 0.39 −128.4 0.45 −6.38 68.0 −2.93 0.73 –
47 −7.54 0.33 −131.9 0.15 −7.1 501.4 −2.06 0.83 – –
Due to the trans-species nature of variation, some analysis that are developed for
intraspecific variation were made on the trans-species variation. The assumption here
is that trans-species variation is representative of intraspecific variation that could be
found with larger sample sizes within each species.
RESULTS AND DISCUSSIONClusters of Cathelicidin variationThe variation clusters by tree building into three major groups (Fig. 2) that we call Cath1,
Cath2, and Cath3. Cath1 has already been described as a single gene and characterized by
Maier et al. (2008); Cath2, was originally described by Maier et al. (2008) based on a partial
sequence from Canadian cDNA databank, and which we fully sequenced here. Cath2 was
described as a paralogue of Cath1 (Maier et al., 2008). The third major group, Cath3, was
novel and has not been described before. Only one of these genes, Cath1, was found in the
cod genome assembly (www.ensemble.org, Star et al., 2011). However, the Atlantic cod
genome sequence is incomplete with 611 Mb of 830 Mb assembled into scaffolds (Star
et al., 2011) and probably is missing genes (Zhuang et al., 2012). Maier et al. (2008) had
named a variant, for which they had found a cDNA sequence in GenBank, and that was
characterized relative to Cath1 by a 10 amino acid indel, as Cath3. We found the same
variant (117757 1.Gmo.Ice, Figs. 2 and 3) in our data as a variant of Cath1. Therefore,
Halldorsdottir and Arnason (2015), PeerJ, DOI 10.7717/peerj.976 9/30
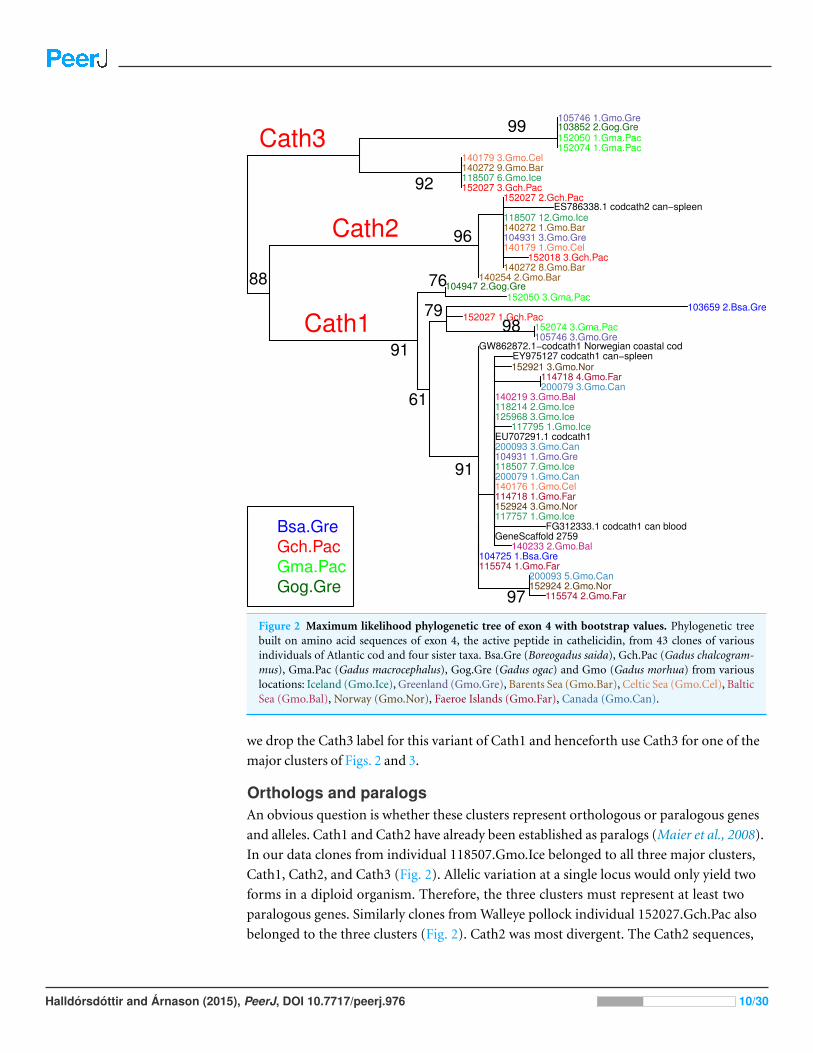
Figure 2 Maximum likelihood phylogenetic tree of exon 4 with bootstrap values. Phylogenetic treebuilt on amino acid sequences of exon 4, the active peptide in cathelicidin, from 43 clones of variousindividuals of Atlantic cod and four sister taxa. Bsa.Gre (Boreogadus saida), Gch.Pac (Gadus chalcogram-mus), Gma.Pac (Gadus macrocephalus), Gog.Gre (Gadus ogac) and Gmo (Gadus morhua) from variouslocations: Iceland (Gmo.Ice), Greenland (Gmo.Gre), Barents Sea (Gmo.Bar), Celtic Sea (Gmo.Cel), BalticSea (Gmo.Bal), Norway (Gmo.Nor), Faeroe Islands (Gmo.Far), Canada (Gmo.Can).
we drop the Cath3 label for this variant of Cath1 and henceforth use Cath3 for one of the
major clusters of Figs. 2 and 3.
Orthologs and paralogsAn obvious question is whether these clusters represent orthologous or paralogous genes
and alleles. Cath1 and Cath2 have already been established as paralogs (Maier et al., 2008).
In our data clones from individual 118507.Gmo.Ice belonged to all three major clusters,
Cath1, Cath2, and Cath3 (Fig. 2). Allelic variation at a single locus would only yield two
forms in a diploid organism. Therefore, the three clusters must represent at least two
paralogous genes. Similarly clones from Walleye pollock individual 152027.Gch.Pac also
belonged to the three clusters (Fig. 2). Cath2 was most divergent. The Cath2 sequences,
Halldorsdottir and Arnason (2015), PeerJ, DOI 10.7717/peerj.976 10/30
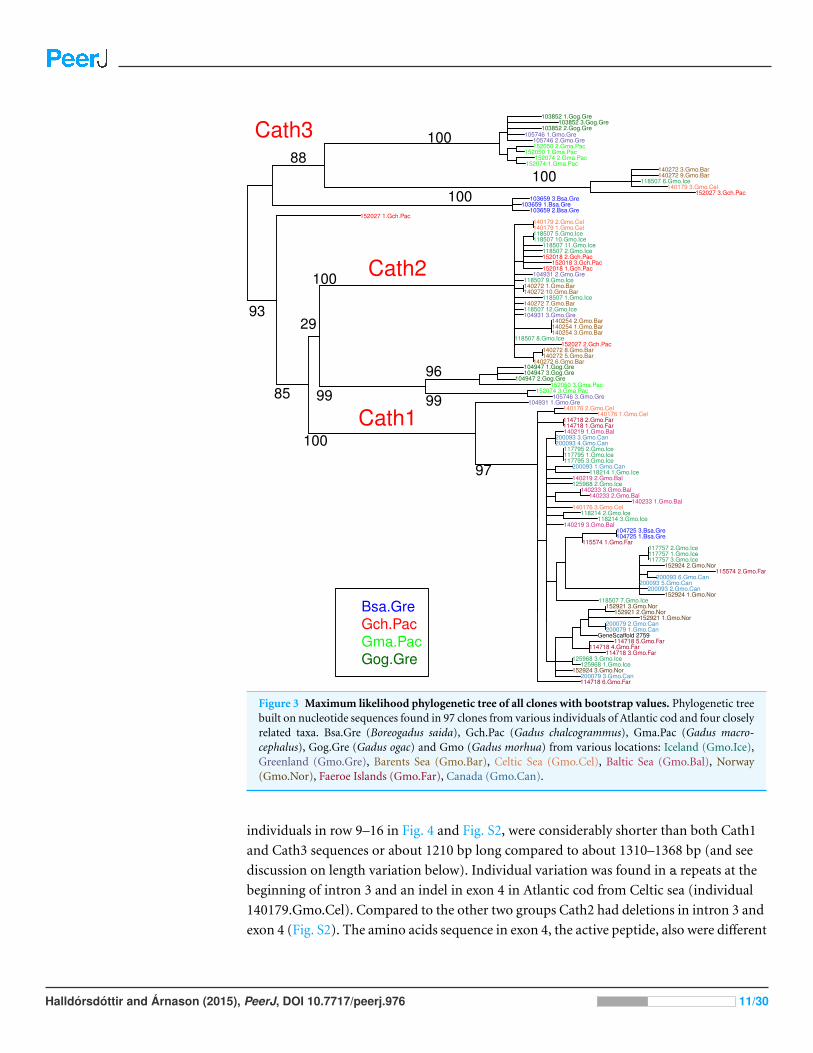
Figure 3 Maximum likelihood phylogenetic tree of all clones with bootstrap values. Phylogenetic treebuilt on nucleotide sequences found in 97 clones from various individuals of Atlantic cod and four closelyrelated taxa. Bsa.Gre (Boreogadus saida), Gch.Pac (Gadus chalcogrammus), Gma.Pac (Gadus macro-cephalus), Gog.Gre (Gadus ogac) and Gmo (Gadus morhua) from various locations: Iceland (Gmo.Ice),Greenland (Gmo.Gre), Barents Sea (Gmo.Bar), Celtic Sea (Gmo.Cel), Baltic Sea (Gmo.Bal), Norway(Gmo.Nor), Faeroe Islands (Gmo.Far), Canada (Gmo.Can).
individuals in row 9–16 in Fig. 4 and Fig. S2, were considerably shorter than both Cath1
and Cath3 sequences or about 1210 bp long compared to about 1310–1368 bp (and see
discussion on length variation below). Individual variation was found in a repeats at the
beginning of intron 3 and an indel in exon 4 in Atlantic cod from Celtic sea (individual
140179.Gmo.Cel). Compared to the other two groups Cath2 had deletions in intron 3 and
exon 4 (Fig. S2). The amino acids sequence in exon 4, the active peptide, also were different
Halldorsdottir and Arnason (2015), PeerJ, DOI 10.7717/peerj.976 11/30
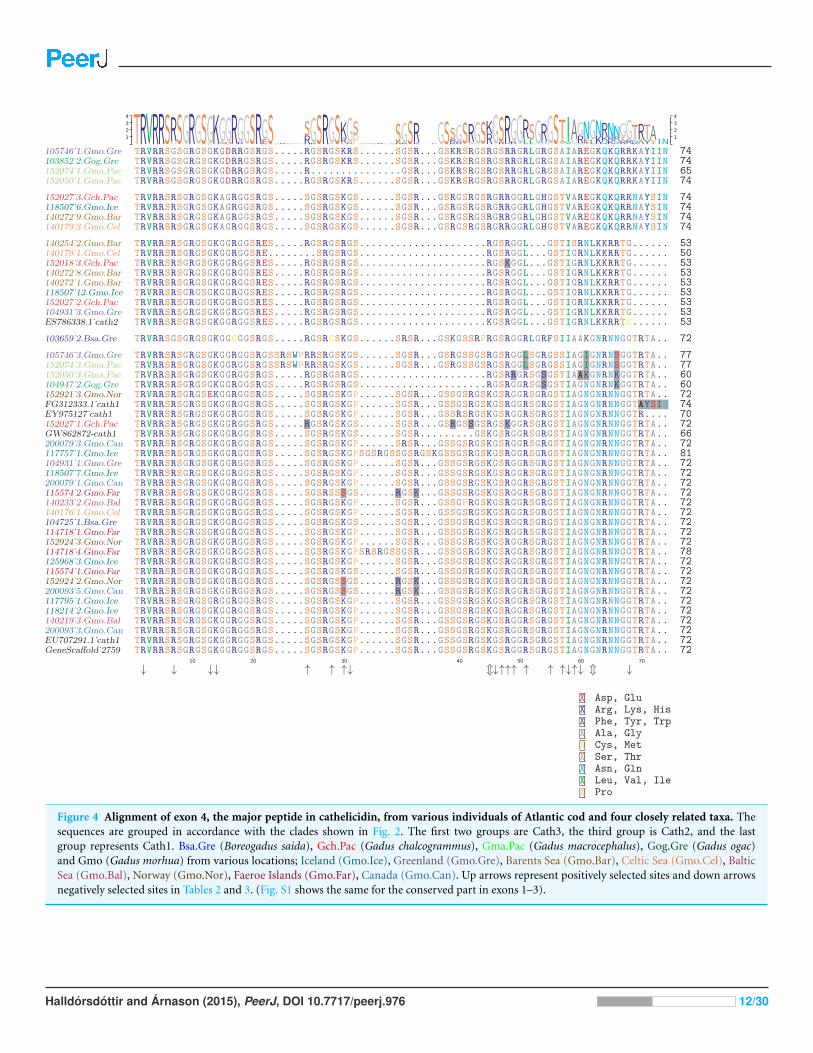
Figure 4 Alignment of exon 4, the major peptide in cathelicidin, from various individuals of Atlantic cod and four closely related taxa. Thesequences are grouped in accordance with the clades shown in Fig. 2. The first two groups are Cath3, the third group is Cath2, and the lastgroup represents Cath1. Bsa.Gre (Boreogadus saida), Gch.Pac (Gadus chalcogrammus), Gma.Pac (Gadus macrocephalus), Gog.Gre (Gadus ogac)and Gmo (Gadus morhua) from various locations; Iceland (Gmo.Ice), Greenland (Gmo.Gre), Barents Sea (Gmo.Bar), Celtic Sea (Gmo.Cel), BalticSea (Gmo.Bal), Norway (Gmo.Nor), Faeroe Islands (Gmo.Far), Canada (Gmo.Can). Up arrows represent positively selected sites and down arrowsnegatively selected sites in Tables 2 and 3. (Fig. S1 shows the same for the conserved part in exons 1–3).
Halldorsdottir and Arnason (2015), PeerJ, DOI 10.7717/peerj.976 12/30
from the two other groups (Fig. 4). Thus, we consider Cath2 to be paralogous to the other
clusters in accordance with Maier et al. (2008).
Furthermore, clones from individual 140272.Gmo.Bar belonged to both Cath2 and
Cath3 (Fig. 2). Two Cath2 clones from this individual that differed by several sites,
probably representing allelic variation at Cath2. This is further support that the Cath2
and Cath3 clusters represent paralogous genes. Clones from individual 140179.Gmo.Cel
belonged to Cath2 and Cath3 (Fig. 2). The two Cath2 clones were identical and differed
from the Cath2 of individual 140272 by several sites and an indel that is indicative of the
variation among clones within the Cath2 cluster.
Clones from individual 104931.Gmo.Gre belonged to Cath1 and Cath2. There was only
singleton variation, probably PCR error, between the two Cath2 clones. The Cath1 clone
had very similar amino acid sequence to Cath1 clones from other individuals (Fig. 2) yet it
differed somewhat at the nucleotide level (Fig. 3).
Clones from Pacific cod individual 152074.Gma.Pac belonged to both Cath1 and Cath3.
If Cath1 and Cath3 are orthologous it would imply deeply divergent alleles at that locus.
Similarly, clones from Pacific cod individual 152050.Gma.Pac belonged to both Cath1
and Cath3. The Cath3 clones (clones 1 and 2; Fig. 3) had identical amino acid sequence
to clones from three other individuals: Greenland cod 103852.Gog.Gre, Atlantic cod
105746.Gmo.Gre and the other Pacific cod already mentioned 152074.Gma.Pac. At the
nucleotide level the two Cath3 clones of 152050.Gma.Pac differed from each other by a few
singleton sites that were probably due to PCR errors. It clustered with the other Pacific cod
clones showing similar singleton variation at the nucleotide level (Fig. 3 and Fig. S2).
The sequences for different groups/alleles were of different sizes. The Cath3 cluster
showed two subgroups or clades (A and B) that had some length differences. The first
four clones in the alignment (Fig. 4 and alignment of the whole sequence in Fig. S2) are
1322 bp long except the clones of individual 152074.Gma.Pac which were 1237 bp long
because of an indel in intron 3 and exon 4. The second subgroup or clade of Cath3 (the
next four sequences in Fig. 4) were 1321, 1281, 1281 and 1276 bp long respectively due
to length variation in intron 3 (Fig. S2). The Cath1 sequences, which constitute the rest
of the sequences in Fig. 4, were from 1318 to 1368 bp long. Some variation was found
in intron 3 (Fig. S2). For example, individual 152027.Gch.Pac had a long insertion but
individuals 104947.Gog.Gre and 152050.Gma.Pac had deletions. Some minor variations
were found in other individuals in intron 3, e.g., a repeats at the beginning of the intron.
Individuals 104947.Gog.Gre and 152050.Gma.Pac had deletions in exon 4 but individuals
114718.Gmo.Far, 117757.Gmo.Ice, 105746.Gmo.Gre and 152074.Gma.Pac had insertions.
The three clusters probably represent functional genes. The cDNA sequences that we
included are based on expressed sequences and they belonged to the Cath1 and Cath2
clusters. There were no signs of lack of function for Cath3.
From these considerations, we consider Cath2 to be a paralog of the Cath1 and Cath3
clusters. Based on the tree, the overall divergence between Cath1 and Cath3 was similar
to the divergence of Cath2 from both Cath1 and Cath3 (Fig. 2). However, the sequence
similarity is much higher between Cath1 and Cath3 than between Cath1 or Cath3 on one
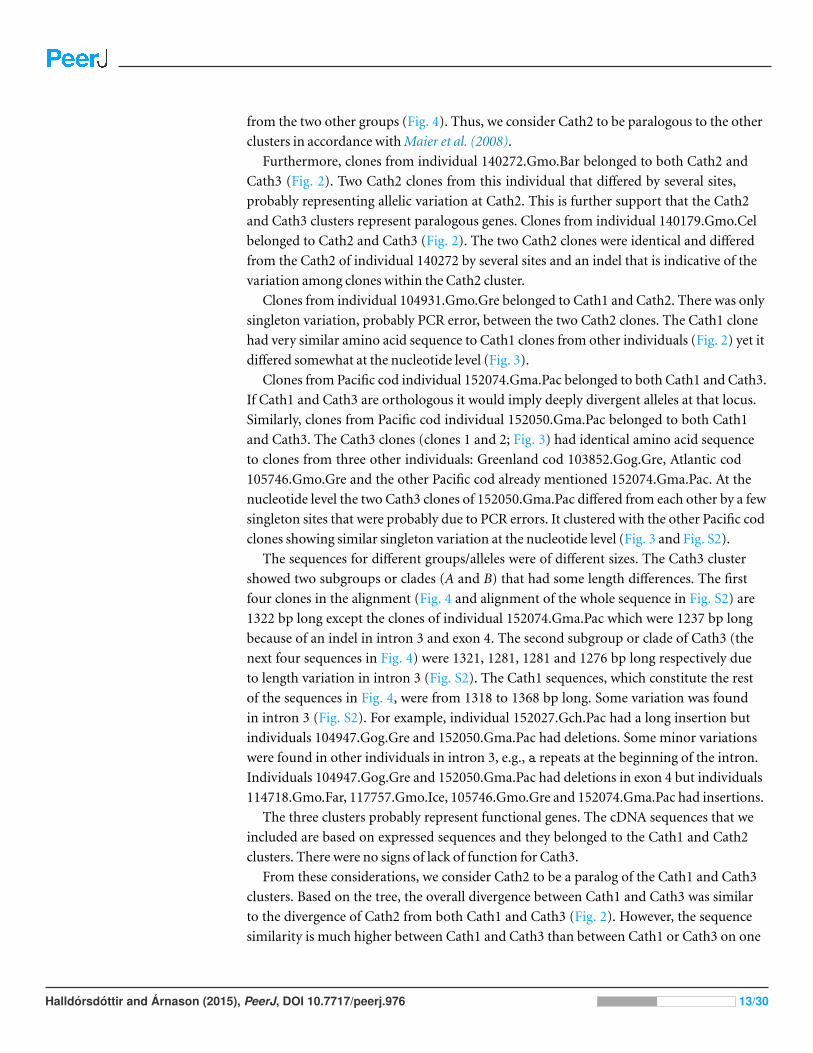
Halldorsdottir and Arnason (2015), PeerJ, DOI 10.7717/peerj.976 13/30
hand and Cath2 on the other, both at the nucleotide and amino acid levels (Fig. 4, Figs.
S1 and S2). Cath1 and Cath3 probably are paralogs although we do not have conclusive
evidence for that deduction. However, if they are orthologs it will strengthen our main
hypothesis of trans-species level of variation. Furthermore, one could argue that the two
Cath3 clades represented paralogous genes. If that were the case, it would also strengthen
our hypothesis of trans-species polymorphism because variation within both (A and B)
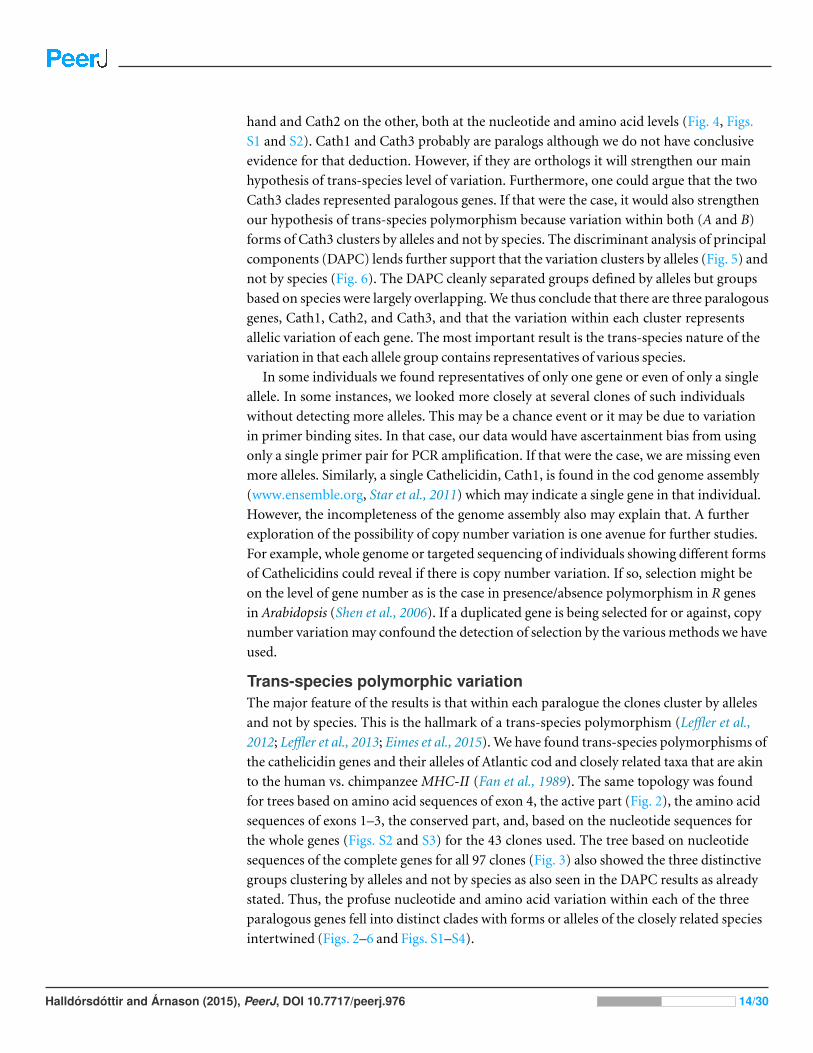
forms of Cath3 clusters by alleles and not by species. The discriminant analysis of principal
components (DAPC) lends further support that the variation clusters by alleles (Fig. 5) and
not by species (Fig. 6). The DAPC cleanly separated groups defined by alleles but groups
based on species were largely overlapping. We thus conclude that there are three paralogous
genes, Cath1, Cath2, and Cath3, and that the variation within each cluster represents
allelic variation of each gene. The most important result is the trans-species nature of the
variation in that each allele group contains representatives of various species.
In some individuals we found representatives of only one gene or even of only a single
allele. In some instances, we looked more closely at several clones of such individuals
without detecting more alleles. This may be a chance event or it may be due to variation
in primer binding sites. In that case, our data would have ascertainment bias from using
only a single primer pair for PCR amplification. If that were the case, we are missing even
more alleles. Similarly, a single Cathelicidin, Cath1, is found in the cod genome assembly
(www.ensemble.org, Star et al., 2011) which may indicate a single gene in that individual.
However, the incompleteness of the genome assembly also may explain that. A further
exploration of the possibility of copy number variation is one avenue for further studies.
For example, whole genome or targeted sequencing of individuals showing different forms
of Cathelicidins could reveal if there is copy number variation. If so, selection might be
on the level of gene number as is the case in presence/absence polymorphism in R genes
in Arabidopsis (Shen et al., 2006). If a duplicated gene is being selected for or against, copy
number variation may confound the detection of selection by the various methods we have
used.
Trans-species polymorphic variationThe major feature of the results is that within each paralogue the clones cluster by alleles
and not by species. This is the hallmark of a trans-species polymorphism (Leffler et al.,
2012; Leffler et al., 2013; Eimes et al., 2015). We have found trans-species polymorphisms of
the cathelicidin genes and their alleles of Atlantic cod and closely related taxa that are akin
to the human vs. chimpanzee MHC-II (Fan et al., 1989). The same topology was found
for trees based on amino acid sequences of exon 4, the active part (Fig. 2), the amino acid
sequences of exons 1–3, the conserved part, and, based on the nucleotide sequences for
the whole genes (Figs. S2 and S3) for the 43 clones used. The tree based on nucleotide
sequences of the complete genes for all 97 clones (Fig. 3) also showed the three distinctive
groups clustering by alleles and not by species as also seen in the DAPC results as already
stated. Thus, the profuse nucleotide and amino acid variation within each of the three
paralogous genes fell into distinct clades with forms or alleles of the closely related species
intertwined (Figs. 2–6 and Figs. S1–S4).
Halldorsdottir and Arnason (2015), PeerJ, DOI 10.7717/peerj.976 14/30
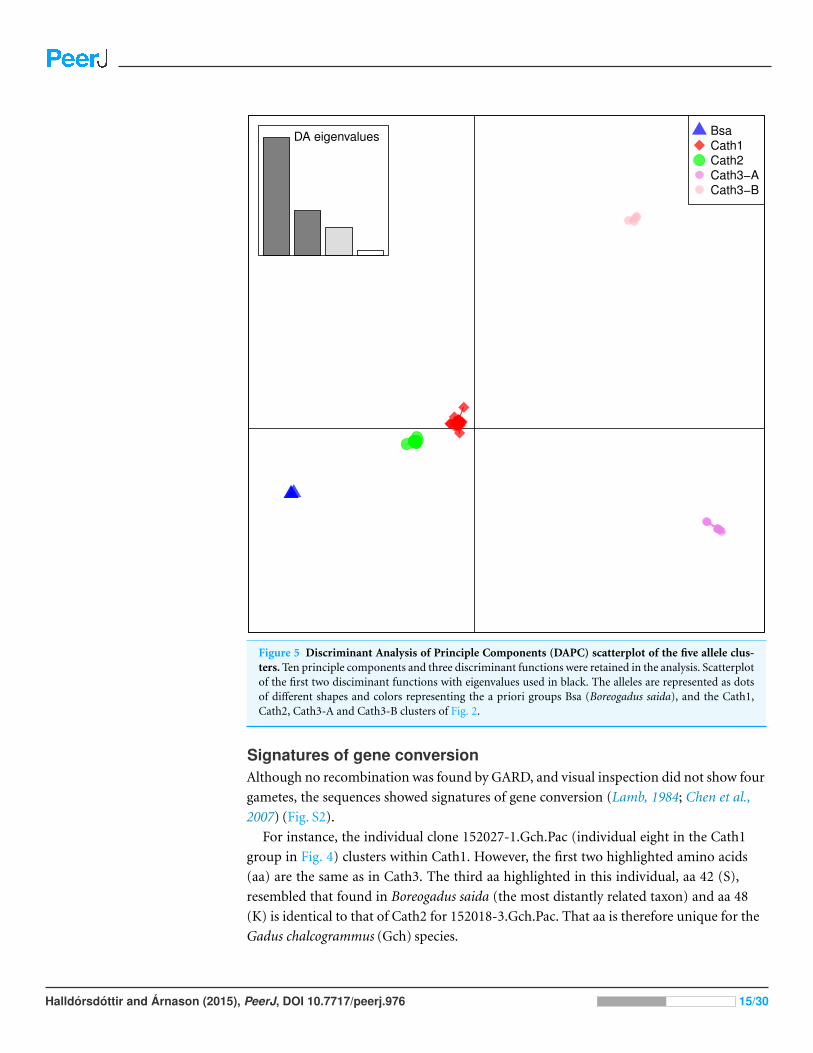
Figure 5 Discriminant Analysis of Principle Components (DAPC) scatterplot of the five allele clus-ters. Ten principle components and three discriminant functions were retained in the analysis. Scatterplotof the first two disciminant functions with eigenvalues used in black. The alleles are represented as dotsof different shapes and colors representing the a priori groups Bsa (Boreogadus saida), and the Cath1,Cath2, Cath3-A and Cath3-B clusters of Fig. 2.
Signatures of gene conversionAlthough no recombination was found by GARD, and visual inspection did not show four
gametes, the sequences showed signatures of gene conversion (Lamb, 1984; Chen et al.,
2007) (Fig. S2).
For instance, the individual clone 152027-1.Gch.Pac (individual eight in the Cath1
group in Fig. 4) clusters within Cath1. However, the first two highlighted amino acids
(aa) are the same as in Cath3. The third aa highlighted in this individual, aa 42 (S),
resembled that found in Boreogadus saida (the most distantly related taxon) and aa 48
(K) is identical to that of Cath2 for 152018-3.Gch.Pac. That aa is therefore unique for the
Gadus chalcogrammus (Gch) species.
Halldorsdottir and Arnason (2015), PeerJ, DOI 10.7717/peerj.976 15/30
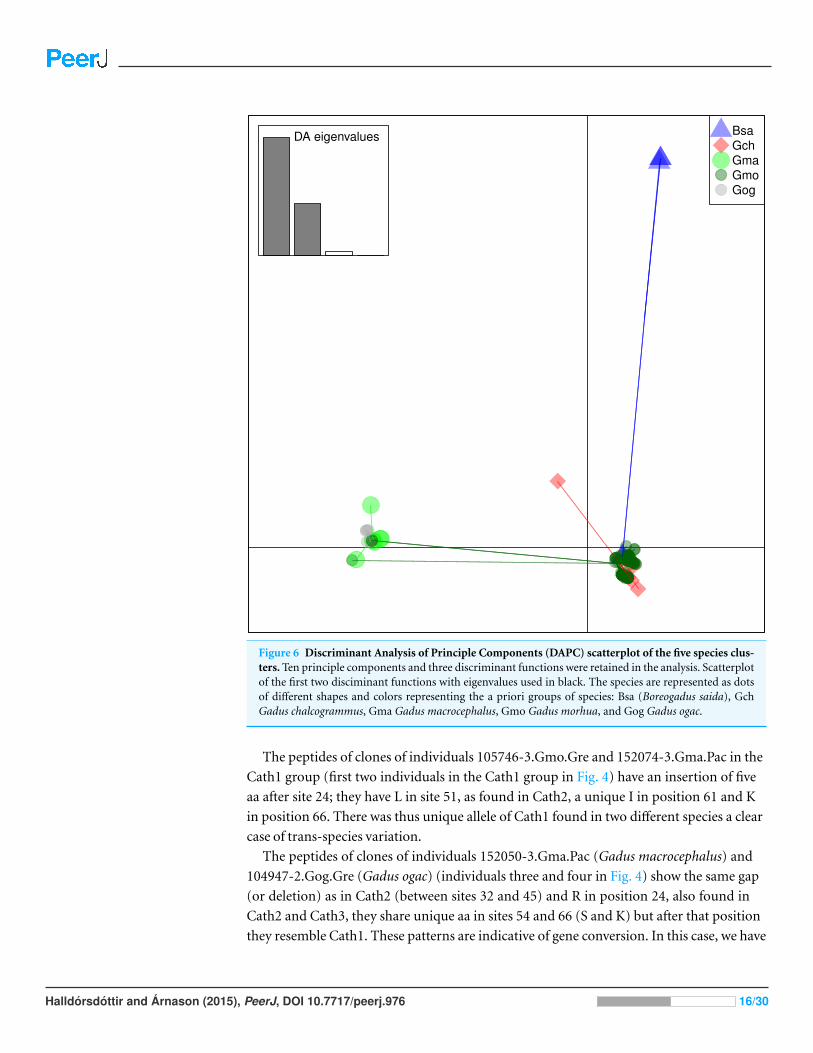
Figure 6 Discriminant Analysis of Principle Components (DAPC) scatterplot of the five species clus-ters. Ten principle components and three discriminant functions were retained in the analysis. Scatterplotof the first two disciminant functions with eigenvalues used in black. The species are represented as dotsof different shapes and colors representing the a priori groups of species: Bsa (Boreogadus saida), GchGadus chalcogrammus, Gma Gadus macrocephalus, Gmo Gadus morhua, and Gog Gadus ogac.
The peptides of clones of individuals 105746-3.Gmo.Gre and 152074-3.Gma.Pac in the
Cath1 group (first two individuals in the Cath1 group in Fig. 4) have an insertion of five
aa after site 24; they have L in site 51, as found in Cath2, a unique I in position 61 and K
in position 66. There was thus unique allele of Cath1 found in two different species a clear
case of trans-species variation.
The peptides of clones of individuals 152050-3.Gma.Pac (Gadus macrocephalus) and
104947-2.Gog.Gre (Gadus ogac) (individuals three and four in Fig. 4) show the same gap
(or deletion) as in Cath2 (between sites 32 and 45) and R in position 24, also found in
Cath2 and Cath3, they share unique aa in sites 54 and 66 (S and K) but after that position
they resemble Cath1. These patterns are indicative of gene conversion. In this case, we have
Halldorsdottir and Arnason (2015), PeerJ, DOI 10.7717/peerj.976 16/30
two alleles in Cath1 that are found in different species. These alleles are more closely related
to each other than to other alleles from the same species, i.e., again a trans-species level of
variation.
The aa sequence AYSIN at the C-terminus of the peptide is characteristic of the second
of the two alleles of Cath3 (B) in our data (individual four to eight in the alignment in
Fig. 4; the other allele (A) was characterized by the similar sequence AYIIN). However, this
aa sequence also is found in the EST sequence FG312333.1 from Canada (individual six in
Cath1 group in Fig. 4), which is clearly a Cath1 sequence elsewhere. This again is indicative
of gene conversion and an indication of trans-species level of variation.
The peptide of individual 117757-1.Gmo.Ice (individual 11 in Cath1 group in Fig. 4)
has the nine aa insertion that previously had been described as a paralogous gene Cath3
(Maier et al., 2008). According to our data it is an allelic variant of Cath1. Therefore,
we drop the Cath3 label for this variant and reserve that for the major cluster (Fig. 2).
Interestingly a shorter insertion of six aa (similar but not identical) was also found in
individual 114718-4.Gmo.Far, an Atlantic cod from the Faeroe Islands.
Population genetic statisticsWe estimated the nucleotide diversity π , the scaled mutation rate θ and Tajima’s D in a
sliding window of 100 bp over the genes coding for Cath1 and Cath3, noncoding regions
and both synonymous and non-synonymous sites in coding regions. For Cath1, θ was
higher than π , giving a negative D over the whole gene (Figs. S5 and S6) with a high
peak in exon 4 implying either purifying selection or demographic population expansion.
Negative Tajima’s D can also indicate a selective sweep of positive selection and at several
sites D < −2 was statistically significant. In contrast, for Cath3, π was generally larger than
θ , giving a positive D for almost all sites, with high and significant peaks (D > 2) in exon 4
(Figs. S7 and S8). This implies balancing selection or demographic population subdivision
and bottlenecks. There also was much variation in non-coding regions, predominantly in
introns. Intronic variation in the distinct clusters were in linkage disequilibrium with the
non-synonymous variation found in exon 4 (Fig. 4 and Fig. S2).
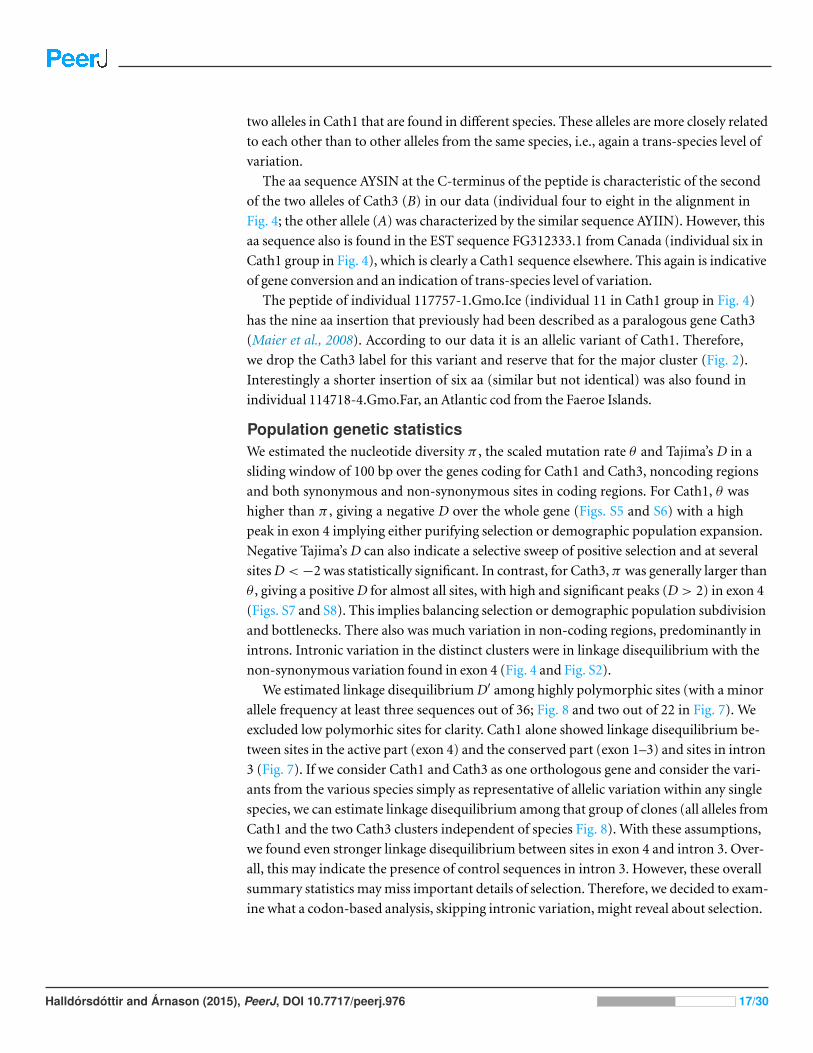
We estimated linkage disequilibrium D′ among highly polymorphic sites (with a minor
allele frequency at least three sequences out of 36; Fig. 8 and two out of 22 in Fig. 7). We
excluded low polymorhic sites for clarity. Cath1 alone showed linkage disequilibrium be-
tween sites in the active part (exon 4) and the conserved part (exon 1–3) and sites in intron
3 (Fig. 7). If we consider Cath1 and Cath3 as one orthologous gene and consider the vari-
ants from the various species simply as representative of allelic variation within any single
species, we can estimate linkage disequilibrium among that group of clones (all alleles from
Cath1 and the two Cath3 clusters independent of species Fig. 8). With these assumptions,
we found even stronger linkage disequilibrium between sites in exon 4 and intron 3. Over-
all, this may indicate the presence of control sequences in intron 3. However, these overall
summary statistics may miss important details of selection. Therefore, we decided to exam-
ine what a codon-based analysis, skipping intronic variation, might reveal about selection.
Halldorsdottir and Arnason (2015), PeerJ, DOI 10.7717/peerj.976 17/30
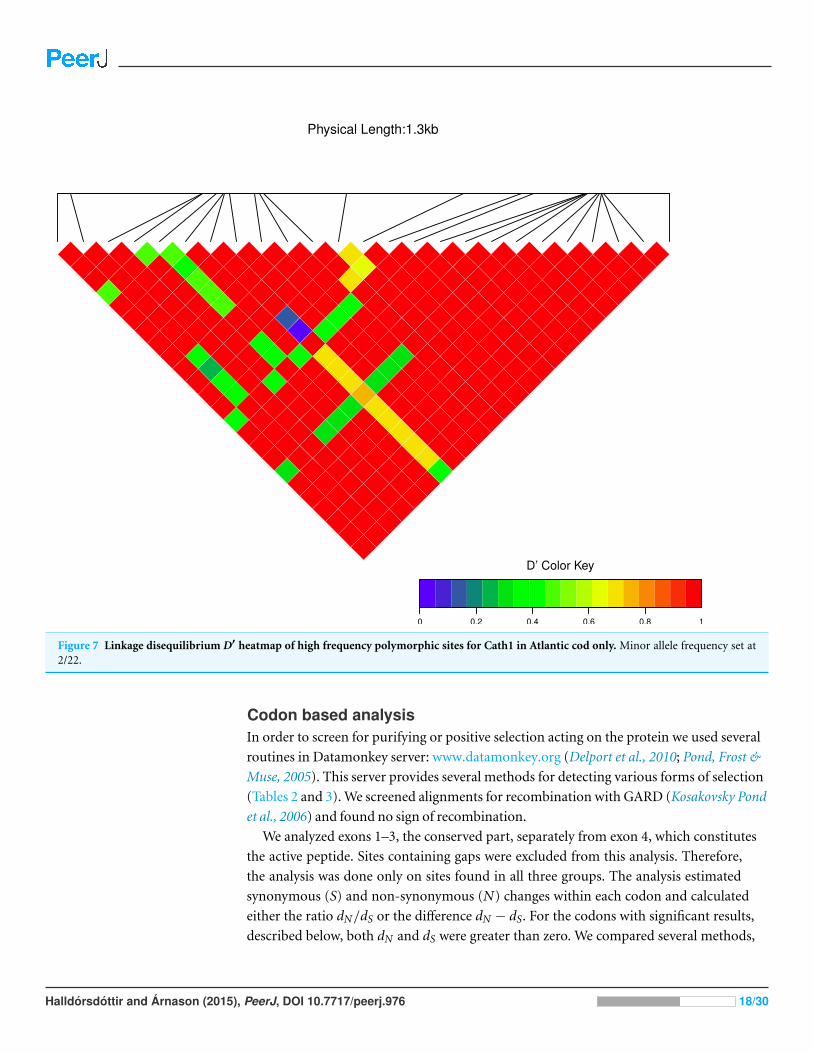
Figure 7 Linkage disequilibrium D′ heatmap of high frequency polymorphic sites for Cath1 in Atlantic cod only. Minor allele frequency set at2/22.
Codon based analysisIn order to screen for purifying or positive selection acting on the protein we used several
routines in Datamonkey server: www.datamonkey.org (Delport et al., 2010; Pond, Frost &
Muse, 2005). This server provides several methods for detecting various forms of selection
(Tables 2 and 3). We screened alignments for recombination with GARD (Kosakovsky Pond
et al., 2006) and found no sign of recombination.
We analyzed exons 1–3, the conserved part, separately from exon 4, which constitutes
the active peptide. Sites containing gaps were excluded from this analysis. Therefore,
the analysis was done only on sites found in all three groups. The analysis estimated
synonymous (S) and non-synonymous (N) changes within each codon and calculated
either the ratio dN/dS or the difference dN − dS. For the codons with significant results,
described below, both dN and dS were greater than zero. We compared several methods,
Halldorsdottir and Arnason (2015), PeerJ, DOI 10.7717/peerj.976 18/30
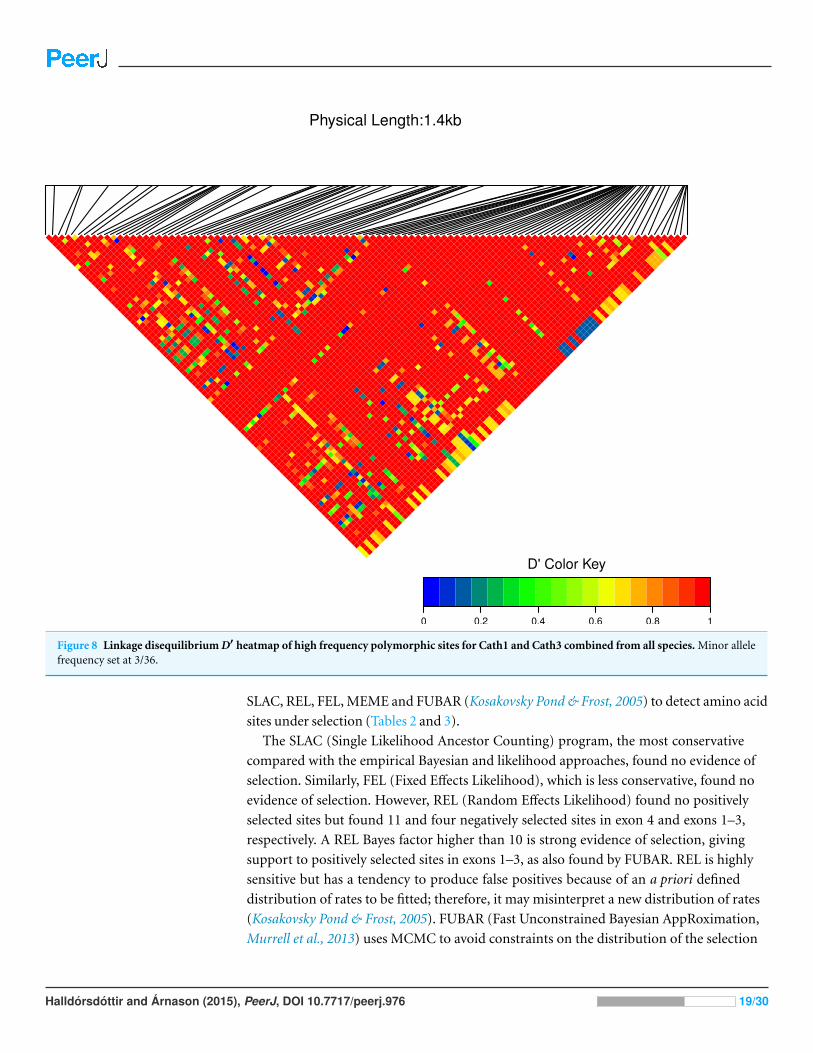
Figure 8 Linkage disequilibrium D′ heatmap of high frequency polymorphic sites for Cath1 and Cath3 combined from all species. Minor allelefrequency set at 3/36.
SLAC, REL, FEL, MEME and FUBAR (Kosakovsky Pond & Frost, 2005) to detect amino acid
sites under selection (Tables 2 and 3).
The SLAC (Single Likelihood Ancestor Counting) program, the most conservative
compared with the empirical Bayesian and likelihood approaches, found no evidence of
selection. Similarly, FEL (Fixed Effects Likelihood), which is less conservative, found no
evidence of selection. However, REL (Random Effects Likelihood) found no positively
selected sites but found 11 and four negatively selected sites in exon 4 and exons 1–3,
respectively. A REL Bayes factor higher than 10 is strong evidence of selection, giving
support to positively selected sites in exons 1–3, as also found by FUBAR. REL is highly
sensitive but has a tendency to produce false positives because of an a priori defined
distribution of rates to be fitted; therefore, it may misinterpret a new distribution of rates
(Kosakovsky Pond & Frost, 2005). FUBAR (Fast Unconstrained Bayesian AppRoximation,
Murrell et al., 2013) uses MCMC to avoid constraints on the distribution of the selection
Halldorsdottir and Arnason (2015), PeerJ, DOI 10.7717/peerj.976 19/30
parameter. For FUBAR we consider a posterior probability of 0.95 as a stringent cutoff,
0.90 as a strong cutoff, and 0.80 as a suggestive cutoff. FUBAR found two positively and
two negatively selected sites both in exon 4 and in exons 1–3 using the strong cutoff. Ten of
twelve sites (Table 2) have posterior probabilities (for ω = β/α > 1 at a site) higher than the
suggestive cutoff 0.8 (more than six-fold higher than the expected number of false positives
of 1.6 with CI [0–4]). MEME (Mixed Effects Model of Evolution Murrell et al., 2012) might
be the most appropriate method for our data because this method detects selection varying
across lineages and identifies episodic and pervasive positive selection. MEME detected
five sites with p ≤ 0.05 indicative of selection (Table 2). It is noteworthy that sites that are
significant by one method (MEME) are not significant by another method (FUBAR) (sites
51 and 57 and the other way around for site 45). MEME can identify diversifying evolution
in a subset of branches, where more restricted methods identify only purifying selection.
Examples of this situation are sites 45 and 62 (Fig. 4 and Table 2), positively selected with
p < 0.05 by MEME but negatively selected by REL.
Overall, the results of the exploratory codon-based analysis are in line with the results
of the summary statistics (π and Tajima’s D) indicating positive and balancing selection
mainly in exon 4, the active part. Both results add support for the inference of balancing
selection based on the trans-species nature of the within paralogs variation.
Secondary structure predictionsGiven the support for diversifying selection it is worthwhile to ask if predictions of protein
structure of the active peptide would add support for the role of selection. We used the
RaptorX protein structure server (http://raptorx.uchicago.edu/, Kallberg et al., 2012) to
predict secondary structure of exon 4, the active peptide. This program can give some
predictions of structure without the use of close homologs in the protein structure
databases. Because of how diverse the peptides are, it is difficult to use more accurate
programs like pymol which rely on close homology of the predicted and template proteins
from protein structure databases.
The results of the analysis showed that most sequences were predicted as rod-like
linear Glycine rich structures. In all three groups there were sequences which predicted
α helical structures and among Cath3 sequences there also were predictions of beta-hairpin
structures (Fig. 9). The sequence variation of the Glycine, Serine, and Arginine rich part of
the peptide (Fig. 4) may be responsible for these differences in predicted structure.
The exact impact on the protein structure, of mutations between the highly different
alleles, will not be described here. However, robust prediction of the secondary structures
for the mature antimicrobial peptide part of the gene, show variation that may indicate
different biological function of the proteins of these alleles to a variety of microbes (Fig. 9)
(Tomasinsig & Zanetti, 2005; Zhu & Gao, 2009). The predicted peptides described here are
highly cationic. Their size ranges from 50 to 81 amino acid residues. The more positively
charged the peptides, the stronger they bind to bacterial membranes (Bals & Wilson, 2003).
Most of the peptides have linear secondary structure which presumably prevent α-helical
conformation as is known for Proline rich peptides (Tomasinsig & Zanetti, 2005).
Halldorsdottir and Arnason (2015), PeerJ, DOI 10.7717/peerj.976 20/30
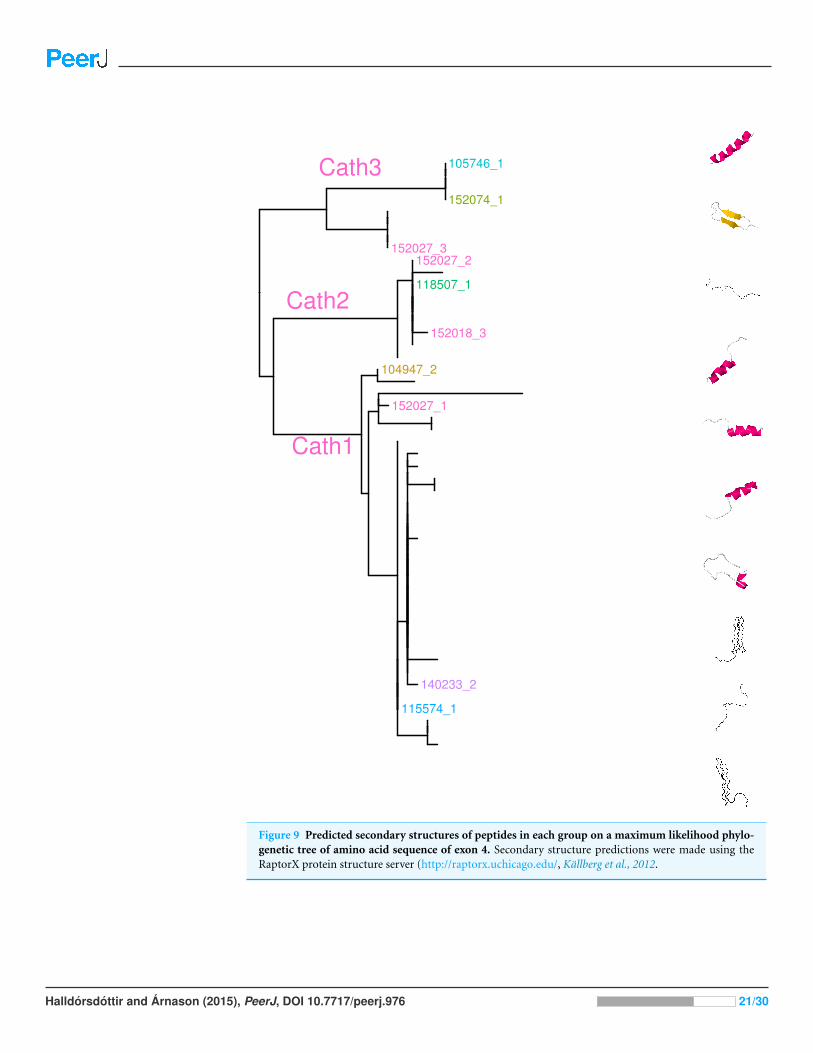
Figure 9 Predicted secondary structures of peptides in each group on a maximum likelihood phylo-genetic tree of amino acid sequence of exon 4. Secondary structure predictions were made using theRaptorX protein structure server (http://raptorx.uchicago.edu/, Kallberg et al., 2012.
Halldorsdottir and Arnason (2015), PeerJ, DOI 10.7717/peerj.976 21/30
In mammals there is at least one cathelicidin peptide with α-helical conformation.
This peptide folds into an amphipathic helical structure in connection with biological
membranes (Tomasinsig & Zanetti, 2005). The first Cathelicidin identified in fish was
from the Atlantic hagfish, Mysine glutinosa, with the mature peptide showing α-helical
conformation (Uzzell et al., 2003). Few or any other Cathelicidins in fish have so far been
shown to adopt α-helical conformation. In our data, we have prediction of peptides in all
three groups i.e., Cath1, Cath2 and Cath3, which adopt this α-helical structure. Broekman
et al. (2011a) made developmental expression studies with antibody from the mature
peptide of Cathelicidin 1 in Atlantic cod. They show that the peptide has broad activity
against different stimuli (Broekman et al., 2011b). Interestingly, the antibody they use
was raised against the 14 amino acids which do not differentiate the three groups that we
describe here (Broekman et al., 2011b). Therefore, it will be of interest to test whether the
different forms described here have different activities and whether that could explain the
broad activity they found. These future studies of the activity of the different peptides, will
also be very interesting in the context of the rising interest in fish antimicrobial peptides
in clinical dermatology (Rakers et al., 2013) and therapeutic antimicrobials (Masso-Silva &
Diamond, 2014).
Spatial population differentiationThere has been a long-standing debate about the possible population differentiation
of Atlantic cod (Jonsdottir et al., 1999; Arnason, 2004; Eirıksson & Arnason, 2013). The
genes behind primary defense against pathogens, like cathelicidin, are presumably under
strong selection. It is expected that such loci will show pattern of geographic subdivision
in contrast to loci with genome wide effect which relay demographic effects. However,
there is no particular geographic structure evident among localities by visual inspection.
For example, three individuals of Atlantic cod from Faroes, Norway and Canada show
one of the alleles found in Cath1 (three aa highlighted in individuals 115574-2.Gmo.Far
152924-2.Gmo.Nor 200093-5.Gmo.Can in Fig. 4). In general the different specific variants
were widely dispersed as expected of allelic variation of an ancient polymorphism.
Balancing selectionThe shared polymorphism within paralogs found in our data, e.g., between Atlantic
cod and Walleye pollock, suggests long-lasting maintenance by balancing selection. A
trans-species polymorphism is in general a most important indication of balancing
selection (Charlesworth, 2006). With an approximately five-year generation time and an
effective population size (Ne) of approximately 10.000 in Atlantic cod (Arnason, 2004),
the approximately 4 mya divergence time between the species (Coulson et al., 2006) is
20Ne, or five times higher than the average 4Ne fixation time for neutral variation (Clark,
1997). Such long-lasting trans-species polymorphism is often thought to be indicative
of balancing selection (Hughes, 2002; Sommer, 2005). These considerations are based on
the time scale of the Kingman coalescent (Kingman, 1982). The faster time scales of the
multiple-merger coalescent, which are more appropriate for the high fecundity Atlantic
Halldorsdottir and Arnason (2015), PeerJ, DOI 10.7717/peerj.976 22/30
cod (Birkner, Blath & Eldon, 2013; Arnason & Halldorsdottir, 2015), would make this even
more significant.
We show that the polymorphism is older than speciation given that divergent alleles
of different paralogous genes can be found in different species. The balancing selection
hypothesis is a plausible explanation because a scenario of concerted evolution between
paralogous genes would otherwise be expected (Liao, 1999).
CONCLUSIONTrans-species polymorphism is in general strong evidence for balancing selection. We
found a highly variable polymorphism at antimicrobial Cathelicidin loci with trans-species
level of variation that suggests maintenance by some form of balancing selection. Given the
functional role of the cathelicidin peptides and the diverse structures predicted the system
may play an important role in a host/pathogen arms race. This may imply that negative
frequency dependent and possibly episodic selection may be responsible for the balancing
selection.
Further experiments are needed to test the activity of various cathelicidin peptides
against a variety of microbes to both elucidate the mechanisms of selection (Nielsen et al.,
2007; Quintana-Murci & Clark, 2013) and to better understand the expression of the var-
ious genes in relation to microbial infection. Further intra- and interspecific experiments
are also needed to find out if there are more paralogous genes in the genome (c.f. pigs
Dawson et al., 2013) and to establish their paralogous and orthologous relationships. This
should include population genetics studies using stringent experimental protocols to avoid
PCR and cloning artifacts (c.f. Lenz & Becker, 2008).
Using a phylogenetic analysis Star & Jentoft (2012) show an expansion of MHC-I and
various Toll like receptor genes coinciding with the loss of MHC-II (Star et al., 2011).
Atlantic cod may thus compensate evolutionary for the loss of MHC-II. Our results
imply evolutionary forces shaping variable innate immunity under selection pressure from
contacts between hosts and microbes (Barreiro & Quintana-Murci, 2010; Quintana-Murci
& Clark, 2013) in a manner similar to what is known for the MHC-II genes conferring
adaptive immunity in other vertebrates. Such an extensive polymorphism of antimicrobial
peptides has not been previously described in fish. Here, dynamic natural selection at
hotspots of individual primary defenses may indicate the added importance of innate
immunity when adaptive immunity is lacking.
ACKNOWLEDGEMENTSWe thank Jarle Mork (Norwegian University of Science and Technology), Kristjan
Kristjansson (Marine Research Institute in Reykjavik), Grant Pogson (University of
California at Santa Cruz), Remment ter Hofstede (Institute for Marine Resources and
Ecosystem Studies in the Netherlands), and Michael Canino (National Oceanic and
Atmospheric Administration) for help in securing some of the samples. We thank Valerie
H. Maier and Arnar Palsson for their valuable comments on the manuscript. We thank RC
Lewontin for office space and encouragement and stimulating environment and discusion
while writing the manuscript.
Halldorsdottir and Arnason (2015), PeerJ, DOI 10.7717/peerj.976 23/30
ADDITIONAL INFORMATION AND DECLARATIONS
FundingFunding was provided by Icelandic Science Foundation grant of excellence (nr. 40303011),
a University of Iceland Research Fund grant, a Svala Arnadottir private foundation grant to
Einar Arnason and a doctoral grant from the University of Iceland Research Fund to Katrın
Halldorsdottir. The funders had no role in study design, data collection and analysis,
decision to publish, or preparation of the manuscript.
Grant DisclosuresThe following grant information was disclosed by the authors:
Icelandic Science Foundation grant of excellence: 40303011.
University of Iceland Research Fund.
Svala Arnadottir private foundation.
Competing InterestsThe authors declare there are no competing interests.
Author Contributions• Katrın Halldorsdottir and Einar Arnason conceived and designed the experiments,
performed the experiments, analyzed the data, contributed reagents/materials/analysis
tools, wrote the paper, prepared figures and/or tables, reviewed drafts of the paper.
Animal EthicsThe following information was supplied relating to ethical approvals (i.e., approving body
and any reference numbers):
The Icelandic Committee for Welfare of Experimental Animals, Chief Veterinary
Office at the Ministry of Agriculture, Reykjavik, Iceland has determined that the research
conducted here is not subject to the laws concerning the Welfare of Experimental Animals.
(The Icelandic Law on Animal Protection, Law 15/1994, last updated with Law 157/2012.)
DNA was isolated from tissue taken from dead fish on board research vessels. Fish were
collected during the yearly surveys of the Icelandic Marine Research Institute. All research
plans and sampling of fish, including the ones for the current project, have been evaluated
and approved by the Marine Research Institute Board of Directors. The Board comprises
the Director General, Deputy Directors for Science and Finance and heads of the Marine
Environment Section, the Marine Resources Section, and the Fisheries Advisory Section.
Samples were also obtained from dead fish from marine research institutes in Norway,
the Netherlands, Canada and the US that were similarly approved by the respective ethics
boards. The samples from the US used in this study have been described in Cunningham
et al. (2009) and the samples from Norway in Arnason & Palsson (1996). The samples
from Canada consisted of DNA isolated from the samples described in Pogson (2001).
The samples from the Netherlands were obtained from the Beam-Trawl-Survey (http:
//www.wageningenur.nl/en/Expertise-Services/Research-Institutes/imares/Weblogs/
Halldorsdottir and Arnason (2015), PeerJ, DOI 10.7717/peerj.976 24/30
Beam-Trawl-Survey.htm) of the Institute for Marine Resources & Ecosystem Studies
(IMARES), Wageningen University, the Netherlands, which is approved by the IMARES
Animal Care Committee and IMARES Board of Directors.
DNA DepositionThe following information was supplied regarding the deposition of DNA sequences:
New sequences generated in this study have GenBank accession numbers
KJ831349–KJ831391.
Supplemental InformationSupplemental information for this article can be found online at http://dx.doi.org/
10.7717/peerj.976#supplemental-information.
REFERENCESArnason E. 2004. Mitochondrial cytochrome b DNA variation in the high fecundity
Atlantic cod: Trans-Atlantic clines and shallow gene-genealogy. Genetics 166:1871–1885DOI 10.1534/genetics.166.4.1871.
Arnason E, Halldorsdottir K. 2015. Nucleotide variation and balancing selection at theCkma gene in Atlantic cod: analysis with multiple merger coalescent models. PeerJ 3:e786DOI 10.7717/peerj.786.
Arnason E, Palsson S. 1996. Mitochondrial cytochrome b DNA sequence variation of Atlantic cod,Gadus morhua, from Norway. Molecular Ecology 5:715–724DOI 10.1111/j.1365-294X.1996.tb00368.x.
Bakker EG, Toomajian C, Kreitman M, Bergelson J. 2006. A genome-wide surveyof R gene polymorphisms in Arabidopsis. The Plant Cell Online 18(8):1803–1818DOI 10.1105/tpc.106.042614.
Bals R, Wilson JM. 2003. Cathelicidins—a family of multifunctional antimicrobial peptides.Cellular and Molecular Life Sciences 60(4):711–720 DOI 10.1007/s00018-003-2186-9.
Barreiro LB, Quintana-Murci L. 2010. From evolutionary genetics to human immunology:how selection shapes host defence genes. Nature Review Genetics 11(01):17–30DOI 10.1038/nrg2698.
Beitz E. 2000. TEX shade: shading and labeling multiple sequence alignments using LATEX2ϵ .Bioinformatics 16:135–139 DOI 10.1093/bioinformatics/16.2.135.
Birkner M, Blath J, Eldon B. 2013. Statistical properties of the site-frequency spectrum associatedwith Λ-coalescents. Genetics 195:1037–1053 DOI 10.1534/genetics.113.156612.
Bowman S, Hubert S, Higgins B, Stone C, Kimball J, Borza T, Bussey JT, Simpson G, Kozera C,Curtis BA, Hall JR, Hori TS, Feng CY, Rise M, Booman M, Gamperl AK, Trippel E,Symonds J, Johnson SC, Rise ML. 2011. An integrated approach to gene discovery andmarker development in Atlantic cod (Gadus morhua). Marine Biotechnology 13(2):242–255DOI 10.1007/s10126-010-9285-z.
Broekman DC, Frei DM, Gylfason GA, Steinarsson A, Jornvall H, Agerberth B, Gudmunds-son GH, Maier VH. 2011a. Cod cathelicidin: isolation of the mature peptide, cleavage sitecharacterisation and developmental expression. Developmental & Comparative Immunology35(3):296–303 DOI 10.1016/j.dci.2010.10.002.
Halldorsdottir and Arnason (2015), PeerJ, DOI 10.7717/peerj.976 25/30
Broekman DC, Zenz A, Gudmundsdottir BK, Lohner K, Maier VH, Gudmundsson GH. 2011b.Functional characterization of codCath, the mature cathelicidin antimicrobial peptide fromAtlantic cod (Gadus morhua). Peptides 32(10):2044–2051 DOI 10.1016/j.peptides.2011.09.012.
Carr SM, Kivlichan DS, Pepin P, Crutcher DC. 1999. Molecular systematics of Gadid fishes:implications for the biogeographic origins of Pacific species. Canadian Journal of Zoology77(1):19–26 DOI 10.1139/z98-194.
Charif D, Lobry J. 2007. SeqinR 1.0-2: a contributed package to the R project for statisticalcomputing devoted to biological sequences retrieval and analysis. In: Bastolla U, Porto M,Roman H, Vendruscolo M, eds. Structural approaches to sequence evolution: molecules, networks,populations, Biological and medical physics, biomedical engineering. New York: Springer Verlag,207–232.
Charlesworth D. 2006. Balancing selection and its effects on sequences in nearby genome regions.PLoS Genetics 2(4):e64 DOI 10.1371/journal.pgen.0020064.
Chen J-M, Cooper DN, Chuzhanova N, Ferec C, Patrinos GP. 2007. Gene conversion:mechanisms, evolution and human disease. Nature Review Genetics 8:762–775DOI 10.1038/nrg2193.
Clark AG. 1997. Neutral behavior of shared polymorphism. Proceedings of the National Academy ofSciences of the United States of America 94(15):7730–7734 DOI 10.1073/pnas.94.15.7730.
Clarke B. 1962. Balanced polymorphism and the diversity of sympatric species. In: Nichols D, ed.Taxonomy and geography. Oxford: Systematics Association, 47–70.
Coulson MW, Marshall HD, Pepin P, Carr SM. 2006. Mitochondrial genomics of gadine fishes:implications for taxonomy and biogeographic origins from whole-genome data sets. Genome49:1115–1130 DOI 10.1139/g06-083.
Cunningham KM, Canino MF, Spies IB, Hauser L. 2009. Genetic isolation by distance andlocalized fjord population structure in Pacific cod (Gadus macrocephalus): limited effectivedispersal in the northeastern Pacific Ocean. Canadian Journal of Fisheries and Aquatic Science66:153–166 DOI 10.1139/F08-199.
Dawson H, Loveland J, Pascal G, Gilbert J, Uenishi H, Mann K, Sang Y, Zhang J,Carvalho-Silva D, Hunt T, Hardy M, Hu Z, Zhao S-H, Anselmo A, Shinkai H, Chen C,Badaoui B, Berman D, Amid C, Kay M, Lloyd D, Snow C, Morozumi T, Cheng RP-Y,Bystrom M, Kapetanovic R, Schwartz J, Kataria R, Astley M, Fritz E, Steward C, Thomas M,Wilming L, Toki D, Archibald A, Bed’Hom B, Beraldi D, Huang T-H, Ait-Ali T, Blecha F,Botti S, Freeman T, Giuffra E, Hume D, Lunney J, Murtaugh M, Reecy J, Harrow J,Rogel-Gaillard C, Tuggle C. 2013. Structural and functional annotation of the porcineimmunome. BMC Genomics 14(1):332 DOI 10.1186/1471-2164-14-332.
Delport W, Poon AFY, Frost SDW, Kosakovsky Pond SL. 2010. Datamonkey 2010: a suiteof phylogenetic analysis tools for evolutionary biology. Bioinformatics 26(19):2455–2457DOI 10.1093/bioinformatics/btq429.
Dray S, Dufour A. 2007. The ade4 package: implementing the duality diagram for ecologists.Journal of Statistical Software 22:1–20.
Edgar RC. 2004. MUSCLE: multiple sequence alignment with high accuracy and high throughput.Nucleic Acids Research 32(5):1792–1797 DOI 10.1093/nar/gkh340.
Eimes J, Townsend A, Sepil I, Nishiumi I, Satta Y. 2015. Patterns of evolution of MHCclass II genes of crows (Corvus) suggest trans-species polymorphism. PeerJ 3:e853DOI 10.7717/peerj.853.
Halldorsdottir and Arnason (2015), PeerJ, DOI 10.7717/peerj.976 26/30
Eirıksson GM, Arnason E. 2013. Spatial and temporal microsatellite variation in spawningAtlantic cod, Gadus morhua, around Iceland. Canadian Journal of Fisheries and Aquattic Sciences70(8):1151–1158 DOI 10.1139/cjfas-2012-0494.
Ewing B, Green P. 1998. Basecalling of automated sequencer traces using phred. II. Errorprobabilities. Genome Research 8:186–194 DOI 10.1101/gr.8.3.175.
Ewing B, Hillier L, Wendl M, Green P. 1998. Base-calling of automated sequencer traces usingphred. I. Accuracy assessment. Genome Research 8:175–185 DOI 10.1101/gr.8.3.175.
Fan W, Kasahara M, Gutknecht J, Klein D, Mayer WE, Jonker M, Klein J. 1989. Shared class IIMHC polymorphisms between humans and chimpanzees. Human Immunology 26(2):107–121DOI 10.1016/0198-8859(89)90096-7.
Fernandes JMO, Ruangsri J, Kiron V. 2010. Atlantic cod piscidin and its diversification throughpositive selection. PLoS ONE 5(3):e9501 DOI 10.1371/journal.pone.0009501.
Flicek P, Amode MR, Barrell D, Beal K, Billis K, Brent S, Carvalho-Silva D, Clapham P,Coates G, Fitzgerald S, Gil L, Giron CG, Gordon L, Hourlier T, Hunt S, Johnson N,Juettemann T, Kahari AK, Keenan S, Kulesha E, Martin FJ, Maurel T, McLaren WM,Murphy DN, Nag R, Overduin B, Pignatelli M, Pritchard B, Pritchard E, Riat HS, Ruffier M,Sheppard D, Taylor K, Thormann A, Trevanion SJ, Vullo A, Wilder SP, Wilson M, Zadissa A,Aken BL, Birney E, Cunningham F, Harrow J, Herrero J, Hubbard TJ, Kinsella R, Muffato M,Parker A, Spudich G, Yates A, Zerbino DR, Searle SM. 2014. Ensembl 2014. Nucleic AcidsResearch 42(D1):D749–D755 DOI 10.1093/nar/gkt1196.
Gao Z, Przeworski M, Sella G. 2015. Footprints of ancient-balanced polymorphisms in geneticvariation data from closely related species. Evolution 69(2):431–446 DOI 10.1111/evo.12567.
Gordon D, Abajian C, Green P. 1998. Consed: a graphical tool for sequence finishing. GenomeResearch 8:195–202 DOI 10.1101/gr.8.3.195.
Gouy M, Guindon S, Gascuel O. 2010. SeaView version 4: a multiplatform graphical user interfacefor sequence alignment and phylogenetic tree building. Molecular Biology and Evolution27(2):221–224 DOI 10.1093/molbev/msp259.
Gudmundsson GA, Agerberth B, Odeberg J, Bergman T, Olsson B, Salcedo R. 1996. Thehuman gene FALL39 and processing of the cathelin precursor to the antibacterialpeptide LL-37 in granulocytes. European Journal of Biochemistry 238:325–332DOI 10.1111/j.1432-1033.1996.0325z.x.
Guindon S, Gascuel O. 2003. A simple, fast and accurate algorithm to estimate large phylogeniesby maximum likelihood. Systematic Biology 52:696–704 DOI 10.1080/10635150390235520.
Halldorsdottir K, Arnason E. 2009. Multiple linked β and α globin genes in Atlanticcod: a PCR based strategy of genomic exploration. Marine Genomics 2:169–181DOI 10.1016/j.margen.2009.10.001.
Hughes AL. 2002. Natural selection and the diversification of vertebrate immune effectors.Immunological Reviews 190(1):161–168 DOI 10.1034/j.1600-065X.2002.19012.x.
Jombart T, Ahmed I. 2011. Adegenet 1.3-1: new tools for the analysis of genome-wide SNP data.Bioinformatics 27:3070–3071 DOI 10.1093/bioinformatics/btr521.
Jonsdottir O, Imsland A, Danıelsdottir A, Thorsteinsson V, Nævdal G. 1999. Geneticdifferentiation among Atlantic cod in south and south-east Icelandic waters: synaptophysin(SypI) and haemoglobin (HbI) variation. Journal of Fish Biology 54:1259–1274DOI 10.1111/j.1095-8649.1999.tb02053.x.
Kallberg M, Wang H, Wang S, Peng J, Wang Z, Lu H, Xu J. 2012. Template-based proteinstructure modeling using the raptorx web server. Nature Protocols 7:1511–1522DOI 10.1038/nprot.2012.085.
Halldorsdottir and Arnason (2015), PeerJ, DOI 10.7717/peerj.976 27/30
Kapralova KH, Gudbrandsson J, Reynisdottir S, Santos CB, Baltanas VC, Maier VH,Snorrason SS, Palsson A. 2013. Differentiation at the MHCIIα and Cath2 loci in sympatricSalvelinus alpinus resource morphs in lake Thingvallavatn. PLoS ONE 8(7):e69402DOI 10.1371/journal.pone.0069402.
Kingman JFC. 1982. The coalescent. Stochastic Processes and their Applications 13:235–248DOI 10.1016/0304-4149(82)90011-4.
Kosakovsky Pond SL, Frost SDW. 2005. Not so different after all: a comparison of methods fordetecting amino acid sites under selection. Molecular Biology and Evolution 22(5):1208–1222DOI 10.1093/molbev/msi105.
Kosakovsky Pond SL, Posada D, Gravenor MB, Woelk CH, Frost SDW. 2006. Automatedphylogenetic detection of recombination using a genetic algorithm. Molecular Biology andEvolution 23(10):1891–1901 DOI 10.1093/molbev/msl051.
Lamb BC. 1984. The properties of meiotic gene conversion important in its effects on evolution.Heredity 53:113–138 DOI 10.1038/hdy.1984.68.
Leffler EM, Bullaughey K, Matute DR, Meyer WK, Segurel L, Venkat A, Andolfatto P,Przeworski M. 2012. Revisiting an old riddle: What determines genetic diversity levels withinspecies? PLoS Biology 10(9):e1001388 DOI 10.1371/journal.pbio.1001388.
Leffler EM, Gao Z, Pfeifer S, Segurel L, Auton A, Venn O, Bowden R, Bontrop R, Wall JD,Sella G, Donnelly P, McVean G, Przeworski M. 2013. Multiple instances of ancientbalancing selection shared between humans and chimpanzees. Science 339(6127):1578–1582DOI 10.1126/science.1234070.
Lenz TL, Becker S. 2008. Simple approach to reduce {PCR} artefact formation leads to reliablegenotyping of {MHC} and other highly polymorphic loci—implications for evolutionaryanalysis. Gene 427(1–2):117–123 DOI 10.1016/j.gene.2008.09.013.
Liao D. 1999. Concerted evolution: molecular mechanism and biological implications. AmericanJournal of Human Genetics 64(1):24–30 DOI 10.1086/302221.
Librado P, Rozas J. 2009. DnaSP v5: a software for comprehensive analysis of DNA polymorphismdata. Bioinformatics 25(11):1451–1452 DOI 10.1093/bioinformatics/btp187.
Magnadottir B. 2010. Immunological control of fish diseases. Marine Biotechnology 12(4):361–379DOI 10.1007/s10126-010-9279-x.
Maier VH, Dorn KV, Gudmundsdottir BK, Gudmundsson GH. 2008. Characterisationof cathelicidin gene family members in divergent fish species. Molecular Immunology45(14):3723–3730 DOI 10.1016/j.molimm.2008.06.002.
Masso-Silva JA, Diamond G. 2014. Antimicrobial peptides from fish. Pharmaceuticals7(3):265–310 DOI 10.3390/ph7030265.
Murphy K, Travers P, Walport M. 2007. Janeway’s immunobiology. 7th edition. New York: GarlandScience.
Murrell B, Moola S, Mabona A, Weighill T, Sheward D, Kosakovsky Pond SL, Scheffler K. 2013.FUBAR: a fast, unconstrained Bayesian approximation for inferring selection. Molecular Biologyand Evolution 30(5):1196–1205 DOI 10.1093/molbev/mst030.
Murrell B, Wertheim JO, Moola S, Weighill T, Scheffler K, Kosakovsky Pond SL. 2012. Detectingindividual sites subject to episodic diversifying selection. PLoS Genetics 8(7):e1002764DOI 10.1371/journal.pgen.1002764.
Nei M, Hughes AL. 1991. Polymorphism and evolution of the major histocompatibility complesloci in mammals. In: Selander R, Clark A, Whittam T, eds. Evolution at the molecular level.Sunderland: Sinauer Associates, Inc., 222–247, chapter 11.
Halldorsdottir and Arnason (2015), PeerJ, DOI 10.7717/peerj.976 28/30
Nielsen R, Hellmann I, Hubisz M, Bustamante C, Clark AG. 2007. Recent and ongoing selectionin the human genome. Nature Review Genetics 8:857–868 DOI 10.1038/nrg2187.
Osborne A, Zavodna M, Chilvers B, Robertson B, Negro S, Kennedy M, Gemmell N. 2013.Extensive variation at MHC DRB in the New Zealand sea lion (Phocarctos hookeri) providesevidence for balancing selection. Heredity 111:44–56 DOI 10.1038/hdy.2013.18.
Paradis E. 2010. Pegas: an R package for population genetics with an integrated–modularapproach. Bioinformatics 26:419–420 DOI 10.1093/bioinformatics/btp696.
Paradis E, Claude J, Strimmer K. 2004. APE: analyses of phylogenetics and evolution in Rlanguage. Bioinformatics 20:289–290 DOI 10.1093/bioinformatics/btg412.
Pilstrom L, Warr GW, Stromberg S. 2005. Why is the antibody response of Atlanticcod so poor? The search for a genetic explanation. Fish Science 71:961–971DOI 10.1111/j.1444-2906.2005.01052.x.
Pogson GH. 2001. Nucleotide polymorphism and natural selection at the Pantophysin (Pan I)locus in the Atlantic cod, Gadus morhua (L.). Genetics 157:317–330.
Pogson GH, Mesa KA. 2004. Positive Darwinian selection at the Pantophysin (Pan I) locus inmarine gadid fishes. Molecular Biology and Evolution 21(1):65–75 DOI 10.1093/molbev/msg237.
Pond SLK, Frost SDW, Muse SV. 2005. HyPhy: hypothesis testing using phylogenies.Bioinformatics 21(5):676–679 DOI 10.1093/bioinformatics/bti079.
Quintana-Murci L, Clark AG. 2013. Population genetic tools for dissecting innate immunity inhumans. Nature Review Immunology 13:280–293 DOI 10.1038/nri3421.
R Core Team. 2014. R: a language and environment for statistical computing. Vienna: R Foundationfor Statistical Computing.
Rakers S, Niklasson L, Steinhagen D, Kruse C, Schauber J, Sundell K, Paus R. 2013.Antimicrobial peptides (AMPs) from fish epidermis: perspectives for investigative dermatology.Journal of Investigative Dermatology 133:1140–1149 DOI 10.1038/jid.2012.503.
Ruangsri J, Kitani Y, Kiron V, Lokesh J, Brinchmann MF, Karlsen BO, Fernandes JMO. 2013. Anovel beta-defensin antimicrobial peptide in Atlantic cod with stimulatory effect on phagocyticactivity. PLoS ONE 8(4):e62302 DOI 10.1371/journal.pone.0062302.
Shen J, Araki H, Chen L, Chen J-Q, Tian D. 2006. Unique evolutionary mechanism in R-genesunder the presence/absence polymorphism in Arabidopsis thaliana. Genetics 172(2):1243–1250DOI 10.1534/genetics.105.047290.
Shin J-H, Blay S, McNeney B, Graham J. 2006. LDheatmap: an R function for graphical display ofpairwise linkage disequilibria between single nucleotide polymorphisms. Journal of StatisticalSoftware 16:1–9 Code Snippet 3.
Sommer S. 2005. The importance of immune gene variability (MHC) in evolutionary ecology andconservation. Frontiers in Zoology 2(1):16 DOI 10.1186/1742-9994-2-16.
Spurgin LG, Richardson DS. 2010. How pathogens drive genetic diversity: MHC,mechanisms and misunderstandings. Proceedings of the Royal Society, B 277(1684):979–988DOI 10.1098/rspb.2009.2084.
Star B, Jentoft S. 2012. Why does the immune system of Atlantic cod lack MHC II? BioEssays34(8):648–651 DOI 10.1002/bies.201200005.
Star B, Nederbragt AJ, Jentoft S, Grimholt U, Malmstrom M, Gregers TF, Rounge TB, Paulsen J,Solbakken MH, Sharma A, Wetten OF, Lanzen A, Winer R, Knight J, Vogel J-H, Aken B,Andersen Ø, Lagesen K, Tooming-Klunderud A, Edvardsen RB, Tina KG, Espelund M,Nepal C, Previti C, Karlsen BO, Moum T, Skage M, Berg PR, Gjoen T, Kuhl H, Thorsen J,
Halldorsdottir and Arnason (2015), PeerJ, DOI 10.7717/peerj.976 29/30
Malde K, Reinhardt R, Du L, Johansen SD, Searle S, Lien S, Nilsen F, Jonassen I, Omholt SW,Stenseth NC, Jakobsen KS. 2011. The genome sequence of Atlantic cod reveals a uniqueimmune system. Nature 477:207–210 DOI 10.1038/nature10342.
Sundaram A, Kiron V, Dopazo J, Fernandes J. 2012. Diversification of the expandedteleost-specific toll-like receptor family in Atlantic cod, Gadus morhua. BMC EvolutionaryBiology 12(1):256 DOI 10.1186/1471-2148-12-256.
Teixeira JC, de Filippo C, Weihmann A, Meneu JR, Racimo F, Dannemann M, Nickel B,Fischer A, Halbwax M, Andre C, Atencia R, Meyer M, Parra G, Paabo S, Andres AM. 2014.Long-term balancing selection in LAD1 maintains a missense trans-species polymorphism inhumans, chimpanzees and bonobos. bioRxiv Preprint. Available at http://biorxiv.org/content/biorxiv/early/2014/06/27/006684.full.pdf.
Tomasinsig L, Zanetti M. 2005. The cathelicidins—structure, function and evolution. CurrentProtein and Peptide Science 6:23–34 DOI 10.2174/1389203053027520.
Untergasser A, Cutcutache I, Koressaar T, Ye J, Faircloth BC, Remm M, Rozen SG. 2012.Primer3–new capabilities and interfaces. Nucleic Acids Research 40(15): e115–e115DOI 10.1093/nar/gks596.
Uzzell T, Stolzenberg ED, Shinnar AE, Zasloff M. 2003. Hagfish intestinal antimicrobial peptidesare ancient cathelicidins. Peptides 24(11):1655–1667 DOI 10.1016/j.peptides.2003.08.024.
Walsh PS, Metzger DA, Higuchi R. 1991. Chelex 100 as a medium for simple extraction of DNAfor PCR-based typing from forensic material. BioTechniques 10:506–513.
Wickham H. 2009. ggplot2: elegant graphics for data analysis. New York: Springer.
Wiuf C, Zhao K, Innan H, Nordborg M. 2004. The probability and chromosomal extent oftrans-specific polymorphism. Genetics 168(4):2363–2372 DOI 10.1534/genetics.104.029488.
Yu G. 2015. ggtree: an r package for versatile annotation and visualization of phylogenetic tree.Available at http://github.com/GuangchuangYu/ggtree (accessed 16 April 2015).
Zanetti M, Gennaro R, Romeo D. 1995. Cathelicidins: a novel protein family with a commonproregion and a variable C-terminal antimicrobial domain. FEBS Letters 374(1):1–5DOI 10.1016/0014-5793(95)01050-O.
Zelezetsky I, Pontillo A, Puzzi L, Antcheva N, Segat L, Pacor S, Crovella S, Tossi A. 2006.Evolution of the primate cathelicidin: Correlation between structural variationsand antimicrobial activity. Journal of Biological Chemistry 281(29):19861–19871DOI 10.1074/jbc.M511108200.
Zhang L, Yu J, Wong CCM, Ling TKW, Li ZJ, Chan KM, Ren SX, Shen J, Chan RLY, Lee CC,Li MSM, Cheng ASL, To KF, Gallo RL, Sung JJY, Wu WKK, Cho CH. 2012. Cathelicidinprotects against Helicobacter pylori colonization and the associated gastritis in mice. GeneTherapy 20(7):751–760 DOI 10.1038/gt.2012.92.
Zhu S. 2008. Positive selection targeting the cathelin-like domain of the antimicrobial cathelicidinfamily. Cellular and Molecular Life Sciences 65(7–8):1285–1294DOI 10.1007/s00018-008-8070-x.
Zhu S, Gao B. 2009. A fossil antibacterial peptide gives clues to structural diversityof cathelicidin-derived host defense peptides. The FASEB Journal 23(1):13–20DOI 10.1096/fj.08-114579.
Zhuang X, Yang C, Fevolden S-E, Cheng C-H. 2012. Protein genes in repetitivesequence–antifreeze glycoproteins in Atlantic cod genome. BMC Genomics13(1):293 DOI 10.1186/1471-2164-13-293.
Halldorsdottir and Arnason (2015), PeerJ, DOI 10.7717/peerj.976 30/30
Related Documents