Citation: Pipoyan, D.; Beglaryan, M.; Stepanyan, S.; Merendino, N. Trans-Fatty Acids in Fast-Food and Intake Assessment for Yerevan’s Population, Armenia. Foods 2022, 11, 1294. https://doi.org/10.3390/ foods11091294 Academic Editors: Rubén Domínguez and Francesco Visioli Received: 15 March 2022 Accepted: 26 April 2022 Published: 29 April 2022 Publisher’s Note: MDPI stays neutral with regard to jurisdictional claims in published maps and institutional affil- iations. Copyright: © 2022 by the authors. Licensee MDPI, Basel, Switzerland. This article is an open access article distributed under the terms and conditions of the Creative Commons Attribution (CC BY) license (https:// creativecommons.org/licenses/by/ 4.0/). foods Article Trans-Fatty Acids in Fast-Food and Intake Assessment for Yerevan’s Population, Armenia Davit Pipoyan 1 , Meline Beglaryan 1 , Seda Stepanyan 1 and Nicolò Merendino 2, * 1 Center for Ecological-Noosphere Studies of NAS RA, Abovyan 68, Yerevan 0025, Armenia; [email protected] (D.P.); [email protected] (M.B.); [email protected] (S.S.) 2 Department of Ecological and Biological Sciences (DEB), Tuscia University, Largo dell’Università snc, 01100 Viterbo, Italy * Correspondence: [email protected]; Tel.: +39-076-135-7133 Abstract: There are stringent regulations applicable for trans-fatty acid (TFA) limitations from food supply across the world. However, in Armenia, there is a scarcity of data on TFA content in food products and their consumption levels. Considering that fast-food is among the major contributors to TFA intake, this study aims to assess the dietary exposure of TFAs through the consumption of fast-food in Yerevan, Armenia. Eleven types of fast-food were included in the study. The Food Frequency Questionnaire (FFQ) was used to evaluate daily fast-food consumption. TFA contents in samples were determined using gas chromatography-mass spectrometry. Mean daily fast-food consumption values ranged from 14.68 g/day to 76.09 g/day, with popcorn as the lowest and pastry as the highest consumed food. The study results indicate that the aggregate average daily intake (DI) of TFA is 0.303 g/day. Even though TFA DI values do not exceed the WHO limit of 1%, they substantially contribute to daily TFA intake and may exceed the limit when combined with other foods. Hence, it is recommended to carry out continuous monitoring of TFA content in the food supply to ensure consumer health protection. Keywords: daily intake; fast-food; gas chromatography-mass spectrometry; risk; trans-fatty acid 1. Introduction The increased consumption of fast-food has become a significant public concern worldwide since fast-foods are typically rich in trans-fatty acids (TFAs) which are associated with various health diseases [1,2]. Trans-fatty acids are unsaturated fatty acids containing at least one double bond in their trans configuration. TFAs may occur naturally or as a result of various chemical processes. TFAs in diet may derive from the main two sources: naturally occurring TFAs and industrially produced TFAs. The naturally occurring TFAs are produced by the bacterial transformation of unsaturated fatty acids in the rumen of animals like cattle and goats. The industrial TFAs are produced by the industrial hydrogenation, deodorization of unsaturated vegetable/fish oils, and heating and frying of oils at high temperatures. The industrial TFAs contain trans isomers of oleic acid (C18:1 cis-9), the major one being elaidic acid (C18:1 trans-9). The ruminant TFA in milk and meat consists mainly of vaccenic acid (C18:1 trans-11) and conjugated linoleic acid (CLA or 9-cis, 11-trans-C18:2). Based on some risk markers, the ruminant TFAs are less harmful than the industrial TFAs (e.g., for HDL) or present a neutral effect (e.g., for TG, glycemia, insulin resistance, blood pressure) [3,4]. Most commercial foods contain TFAs, produced as a result of industrial hydrogenation. This process improves food’s texture, plasticity, and increases its stability for long shelf life [5]. Many comprehensive studies confirm the presence of trans-fatty acids in industrially produced foods, particularly in various fast-food items [6,7]. In recent decades, fast-food consumption has increased worldwide [8,9]. As a conse- quence of the increased intake of fast-food, the dietary intake of TFAs has been increasing Foods 2022, 11, 1294. https://doi.org/10.3390/foods11091294 https://www.mdpi.com/journal/foods

Welcome message from author
This document is posted to help you gain knowledge. Please leave a comment to let me know what you think about it! Share it to your friends and learn new things together.
Transcript
Citation: Pipoyan, D.; Beglaryan, M.;
Stepanyan, S.; Merendino, N.
Trans-Fatty Acids in Fast-Food and
Intake Assessment for Yerevan’s
Population, Armenia. Foods 2022, 11,
1294. https://doi.org/10.3390/
foods11091294
Academic Editors: Rubén
Domínguez and Francesco Visioli
Received: 15 March 2022
Accepted: 26 April 2022
Published: 29 April 2022
Publisher’s Note: MDPI stays neutral
with regard to jurisdictional claims in
published maps and institutional affil-
iations.
Copyright: © 2022 by the authors.
Licensee MDPI, Basel, Switzerland.
This article is an open access article
distributed under the terms and
conditions of the Creative Commons
Attribution (CC BY) license (https://
creativecommons.org/licenses/by/
4.0/).
foods
Article
Trans-Fatty Acids in Fast-Food and Intake Assessment forYerevan’s Population, ArmeniaDavit Pipoyan 1, Meline Beglaryan 1 , Seda Stepanyan 1 and Nicolò Merendino 2,*
1 Center for Ecological-Noosphere Studies of NAS RA, Abovyan 68, Yerevan 0025, Armenia;[email protected] (D.P.); [email protected] (M.B.); [email protected] (S.S.)
2 Department of Ecological and Biological Sciences (DEB), Tuscia University, Largo dell’Università snc,01100 Viterbo, Italy
* Correspondence: [email protected]; Tel.: +39-076-135-7133
Abstract: There are stringent regulations applicable for trans-fatty acid (TFA) limitations from foodsupply across the world. However, in Armenia, there is a scarcity of data on TFA content in foodproducts and their consumption levels. Considering that fast-food is among the major contributorsto TFA intake, this study aims to assess the dietary exposure of TFAs through the consumption offast-food in Yerevan, Armenia. Eleven types of fast-food were included in the study. The FoodFrequency Questionnaire (FFQ) was used to evaluate daily fast-food consumption. TFA contentsin samples were determined using gas chromatography-mass spectrometry. Mean daily fast-foodconsumption values ranged from 14.68 g/day to 76.09 g/day, with popcorn as the lowest and pastryas the highest consumed food. The study results indicate that the aggregate average daily intake(DI) of TFA is 0.303 g/day. Even though TFA DI values do not exceed the WHO limit of 1%, theysubstantially contribute to daily TFA intake and may exceed the limit when combined with otherfoods. Hence, it is recommended to carry out continuous monitoring of TFA content in the foodsupply to ensure consumer health protection.
Keywords: daily intake; fast-food; gas chromatography-mass spectrometry; risk; trans-fatty acid
1. Introduction
The increased consumption of fast-food has become a significant public concernworldwide since fast-foods are typically rich in trans-fatty acids (TFAs) which are associatedwith various health diseases [1,2]. Trans-fatty acids are unsaturated fatty acids containingat least one double bond in their trans configuration. TFAs may occur naturally or as aresult of various chemical processes. TFAs in diet may derive from the main two sources:naturally occurring TFAs and industrially produced TFAs. The naturally occurring TFAs areproduced by the bacterial transformation of unsaturated fatty acids in the rumen of animalslike cattle and goats. The industrial TFAs are produced by the industrial hydrogenation,deodorization of unsaturated vegetable/fish oils, and heating and frying of oils at hightemperatures. The industrial TFAs contain trans isomers of oleic acid (C18:1 cis-9), the majorone being elaidic acid (C18:1 trans-9). The ruminant TFA in milk and meat consists mainlyof vaccenic acid (C18:1 trans-11) and conjugated linoleic acid (CLA or 9-cis, 11-trans-C18:2).Based on some risk markers, the ruminant TFAs are less harmful than the industrial TFAs(e.g., for HDL) or present a neutral effect (e.g., for TG, glycemia, insulin resistance, bloodpressure) [3,4].
Most commercial foods contain TFAs, produced as a result of industrial hydrogenation.This process improves food’s texture, plasticity, and increases its stability for long shelflife [5]. Many comprehensive studies confirm the presence of trans-fatty acids in industriallyproduced foods, particularly in various fast-food items [6,7].
In recent decades, fast-food consumption has increased worldwide [8,9]. As a conse-quence of the increased intake of fast-food, the dietary intake of TFAs has been increasing
Foods 2022, 11, 1294. https://doi.org/10.3390/foods11091294 https://www.mdpi.com/journal/foods
Foods 2022, 11, 1294 2 of 10
in many countries [10,11]. A high TFA intake raises significant health concerns and con-tributes to increased morbidity and mortality. There is consistent evidence of industrialtrans-fatty acids’ adverse health effects, particularly on the levels of low-density lipoproteincholesterol in the blood, coronary heart disease, cancer, infertility, obesity, Alzheimer’sdisease, allergy, and type 2 diabetes [12–16]. Moreover, the consumption of industrialTFAs increases the risk of atherosclerosis, apoptosis, and inflammation [17]. Accordingto Stender and Dyerberg, there is a positive relationship between trans-fatty acid intakeand the incidence of breast and large intestine cancer [18]. High intakes of TFAs have beenreported to be an independent risk factor for cardiovascular diseases [19,20]. According tothe European Cardiovascular Disease (CVD) Statistics, trans-fat consumption significantlyincreases the CVD risk, which is the main cause of death for Europeans under the ageof 65 [21]. World Health Organization (WHO) reports that a 2% increase in energy fromtrans-fats leads to a 25% increase in the risk of death from CVD. It is noteworthy thataccording to the WHO report, every year more than half a million deaths of people fromcardiovascular disease can be attributed to the intake of TFAs [16,22].
To control TFA levels in food and to protect health and save lives, throughout the years,various approaches have been implemented to reduce TFA amounts in foods. Limitationson the content of industrialized TFA have been made in several countries, such as Denmark,Austria, Switzerland, Iceland, Norway, Hungary, Sweden, Latvia, and Georgia. Others(e.g., USA, Brazil) imposed mandatory labeling. Year by year the latest national andinternational recommendations suggest that dietary intakes of TFA should be as low aspossible [3]. According to European Food Safety Authority’s (EFSA) opinion, in EuropeanUnion, foods intended for consumer use shall have to contain less than 2 g of industrialTFAs per 100 g of fat. Commission Regulation (EU) 2019/649 states that the trans-fatother than trans-fat naturally occurring in the fat of animal origin must be a maximum2 g per 100 g of fat in food intended for the final consumer and food intended for supplyto retail [23]. In several countries, such as UK and France, the TFA limit is also set at2% of overall energy [3,24]. In May 2018, WHO introduced an action package to supportgovernments to eliminate industrially produced TFA from the global food supply by 2023.The action package recommends that the average intake of trans-fats should be less than1% of total energy. Moreover, WHO called for a replacement of TFA with healthier oils andfats, to be achieved through policy and regulation, while establishing monitoring systemsand creating awareness among policymakers, industry, and the public [22].
Regulatory requirements that limit TFA in oils and fats came into effect in EurasianEconomic Union (EAEU) member countries, including Armenia [25]. Compared to theEU, the legal limits on trans-fat in EAEU seem to be less stringent. The EAEU was thefirst trade bloc globally to restrict TFA, with a 20% TFA limit in specific fat products thatcame into effect in January 2015. However, from January 2018, according to the recentchanges in the Technical Regulation of the Customs Union (TR CU 024/2011) [25], thelimit for “trans-isomers of fatty acids” changed from 20% to 2% of the product’s total fatcontent. Currently, it is mandatory to indicate the amount of the product’s fat contenton the package. It is important to note that there are no labeling requirements for otherproducts rather than fats and oils in EAEU, which is a fundamental difference compared tothe EU regulations. Moreover, studies still need to be carried out to show if TFA needs tobe regulated in other food products as well that use fat and oil as their raw materials.
Like most countries, Armenia is severely affected by high non-communicable diseases(NCDs) prevalence. Over 90% of all deaths are attributable to NCDs [26]. Fast-food is amajor driver of high NCDs, and in recent years, the number of fast-food restaurants andselling points increased in the country. Hence, it is particularly important to study andassess the health risks of TFAs among Armenians and to carry out appropriate preventivemeasures. In this study fast-food is defined as “processed food that can be prepared easilyand is served as a quick meal on the premises or is taken away”. It is noteworthy that thereare no reports or studies about fast-food consumption patterns in Armenia. Moreover, riskassessment of trans-fatty acids through consumption of fast-food has never been carried

Foods 2022, 11, 1294 3 of 10
out in Armenia before. Hence, for the first time, the present study aims to investigatefast-food consumption patterns in Yerevan, Armenia, and assess the dietary exposure oftrans-fatty acids.
2. Materials and Methods2.1. Food Sampling
Fast-food sampling was done in 2020 following WHO’s protocol [27]. All the fast-foodsamples were randomly collected from 4 major grocery stores and street vendors in Yerevan.The number of the collected individual samples (8 sub-samples per product) covered themain markets in Yerevan. Before analysis, the individual samples were pooled to createrepresentative composite samples for each type of fast-food. The composite samples wereground and homogenized thoroughly. Overall, eleven types of fast-food were includedin the study: fried chicken, shawarma, pizza, hot-dog and burger, pie, khachapuri, fries,chips, popcorn, pastry, and pancake/doughnut.
2.2. Analysis of TFAs
The ISO 12966-4:2015 standard was used for the determination of trans-fatty acidsin the selected food items (g/100 g of product) using the gas chromatography (GC)method [28]. This method is developed for the determination of fatty acid methyl es-ters (FAMEs) derived by transesterification or esterification from fats, oils, and fatty acidsby capillary gas chromatography. The tests were performed by a laboratory of Standard Di-alog LLC which has an international accreditation according to ISO 17025. The preparationof the methyl esters of fatty acids was done using methods specified in ISO 12966-2:2017standard [29]. The analysis of prepared methyl esters performed by GC and clear sepa-ration of 37 component mix and method requirements for selectivity of the column werereached. The “CP-Sil 88 for FAME 100 m × 0.25 mm × 0.2 µm 5 inch” column (model:CP7489I5, manufactured by: Agilent Technologies, Santa Clara, CA, USA) was used. Forthe quantification of the fatty acids, in grams per 100 g, the Supelco 37 Component FAMEMix certified reference material (TraceCERT®, Sigma-Aldrich Chemie GmbH, Darmstadt,Germany) was used. Shimadzu 2010 GC system injection volume was 1 µL.
Quality assurance standard procedures were carried out to ensure the reliability of theresults. The determination of TFA content in samples was performed with three replications.The total content of TFAs was reported as a sum of the detected isomers.
2.3. Food Consumption Data Collection
The Food Frequency Questionnaire (FFQ) was used for investigating dietary con-sumption patterns of fast-food among the Yerevan population. The questionnaire wasdeveloped based on the data from the 24-h recall (24HR) which is described in detail inPipoyan et al., 2020 [30]. This does not require ethical approval from an ethics commit-tee, as it did not include the collection of identifiers (e.g., name, surname, etc.) from theinterviewed population.
FFQ surveys were carried out in the fall of 2019. Data was collected verbally and inperson by well-trained interviewers. In total, 423 respondents aged from 18 to 65 took partin the survey. This sample size exceeds the recommendation of 260 adults (18–64 years)made by EFSA [31].
FFQ fast-food list was developed based on the most consumed fast-foods cited in thelast 24 hr. The final list included eleven types of food items. The questions in the surveyincluded information about the consumption frequency, portion size, and food source. Dataregarding gender (43.7% women and 56.3% men), education level (90% received highereducation), and income level (66% refused to answer this question) were collected. Duringthe process of conducting surveys, equal distribution of population among Yerevan cityadministrative districts and age groups was taken into consideration.
The consumption frequency response options for the FFQ food list were: “never”,“once per month”, “2–3 times per month”, “once per week”, “2–4 times per week”, “every
Foods 2022, 11, 1294 4 of 10
day”, “other” (more/less frequent). According to the type of fast-food, several portion sizeswere determined to record food consumption: grams, units, pieces, handfuls, servings,boxes, cups, bags, and candy bars. To aid the reporting process, detailed instructionswere given by interviewers and when needed, pictorial depictions of serving measures(i.e., different sized boxes, bags, and cups) were presented to the respondents.
2.4. Data Analysis
Data were analyzed by SPSS software (SPSS Inc., version 22.0, New York, NY, USA). De-scriptive statistics were calculated. Since fast-food consumption values were non-normallydistributed, the K-means cluster analysis method was applied. This method was shownto be effective especially for the analysis of dietary patterns in a large population usingFFQs [32]. The optimal number of clusters was determined experimentally, through 10 iter-ations. For each iteration, the sum of squared deviations was identified using the ANOVAtable. To calculate the daily fast-food consumption, the daily frequency of consumption ofeach food was multiplied by the portion size of that food.
2.5. Daily Intake of TFA
Daily intake (DI) of TFA (g/day) was calculated through the following equation:
DI = C × IR, (1)
where C is the mean content of TFA in all the studied fast-food products (g in 100 g), andIR is the daily consumption of fast-food (g/day).
The individual TFA intake was calculated as the percentage of total energy using thefollowing formula [33]:
E% =DI × 9
DE× 100 (2)
where E% is the individual TFA intake as the percentage of total energy, DI is the individualTFA intake per day (g/day), and DE is the individual total dietary energy intake (kcal).The energy transfer index of TFA was 9 kcal/g. The amount of dietary energy receivedfrom food consumption is approximately 2047 kcal/capita/day [34].
3. Results and Discussion3.1. TFA Content in Fast-Food
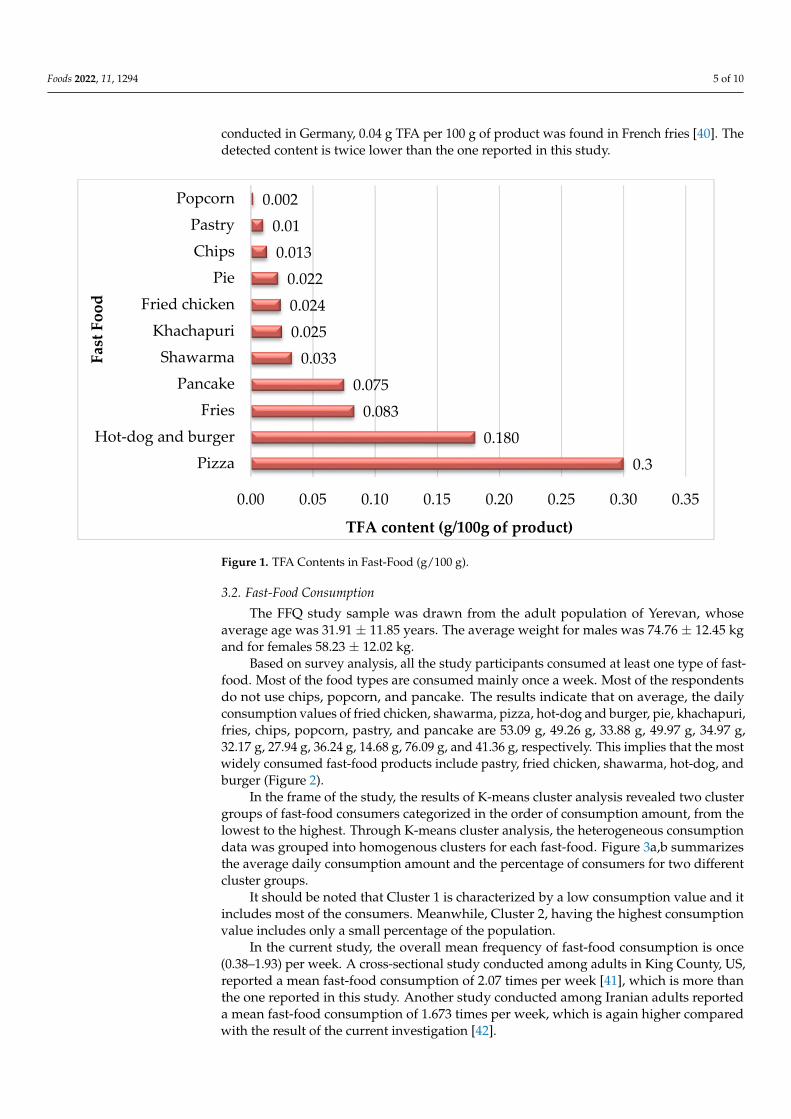
The study results indicate that the total TFA contents in fast-food samples range from0.002 to 0.3 g (g/100 g). Among the studied fast-foods, pizza, hot-dog and burger, fries,and pancake had the highest TFA content, while popcorn, pastry, and chips had the lowestTFA content (Figure 1). Currently, there is no regulation regarding TFA content in fast-foodin Armenia.
The results of the current study are consistent with other investigations. A study con-ducted in 2017 reported data on Spanish fast-food (French fries), showing low TFA contentsthat ranged from 0.04 to 0.11 g TFA/100 g product. On the other hand, in this study, the TFAcontent detected in fries was 0.083 g/100 g. Stender reported the TFA content in prepack-aged biscuits/cakes/wafers purchased from the three largest supermarkets in Armenia [35].According to the results, there were 99 different packages of biscuits/cakes/wafers withmore than 2% trans-fat per 100 g fat in Armenia. In the frame of the investigation on TFAsin Polish pastry, a big diversity (0.02 to 3.49 g per 100 g of product) of total TFA contentwas found [36]. The research results on bakery products (cookies, biscuits, wafers) fromthe Slovenian market showed high variability in TFA content with a mean of 1.91 g per100 g of product [37]. A relatively small mean content (0.008 g per 100 g of product) ofTFA was reported for confectionery and pastries studied in Spain [38]. In 2008, the FoodSafety Authority of Ireland commissioned a study of the TFA content of fast-foods collectedfrom 12 Irish restaurants. A high of 0.6 g TFA per 100 g of product was recorded in burgerproducts. Lower levels ranging from 0.2–0.5 g TFA per 100 g of product were found indifferent fast-food products, including pizza, fries, and sandwiches [39]. Overall, the levelsof TFA in fast-foods are higher than the ones reported in this study. According to a study
Foods 2022, 11, 1294 5 of 10
conducted in Germany, 0.04 g TFA per 100 g of product was found in French fries [40]. Thedetected content is twice lower than the one reported in this study.
Foods 2022, 11, x FOR PEER REVIEW 5 of 10
Figure 1. TFA Contents in Fast-Food (g/100 g).
The results of the current study are consistent with other investigations. A study con-ducted in 2017 reported data on Spanish fast-food (French fries), showing low TFA con-tents that ranged from 0.04 to 0.11 g TFA/100 g product. On the other hand, in this study, the TFA content detected in fries was 0.083 g/100 g. Stender reported the TFA content in prepackaged biscuits/cakes/wafers purchased from the three largest supermarkets in Ar-menia [35]. According to the results, there were 99 different packages of biscuits/cakes/wa-fers with more than 2% trans-fat per 100 g fat in Armenia. In the frame of the investigation on TFAs in Polish pastry, a big diversity (0.02 to 3.49 g per 100 g of product) of total TFA content was found [36]. The research results on bakery products (cookies, biscuits, wafers) from the Slovenian market showed high variability in TFA content with a mean of 1.91 g per 100 g of product [37]. A relatively small mean content (0.008 g per 100 g of product) of TFA was reported for confectionery and pastries studied in Spain [38]. In 2008, the Food Safety Authority of Ireland commissioned a study of the TFA content of fast-foods col-lected from 12 Irish restaurants. A high of 0.6 g TFA per 100 g of product was recorded in burger products. Lower levels ranging from 0.2–0.5 g TFA per 100 g of product were found in different fast-food products, including pizza, fries, and sandwiches [39]. Overall, the levels of TFA in fast-foods are higher than the ones reported in this study. According to a study conducted in Germany, 0.04 g TFA per 100 g of product was found in French fries [40]. The detected content is twice lower than the one reported in this study.
3.2. Fast-food Consumption The FFQ study sample was drawn from the adult population of Yerevan, whose av-
erage age was 31.91 ± 11.85 years. The average weight for males was 74.76 ± 12.45 kg and for females 58.23 ± 12.02 kg.
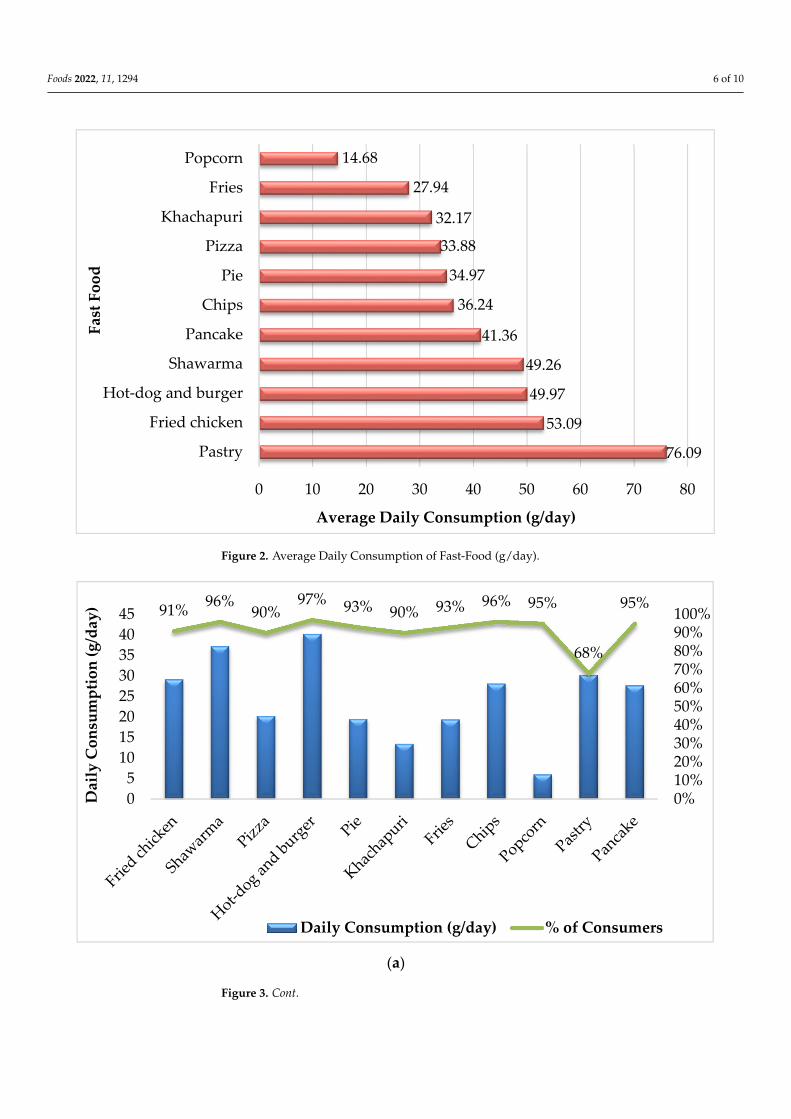
Based on survey analysis, all the study participants consumed at least one type of fast-food. Most of the food types are consumed mainly once a week. Most of the respond-ents do not use chips, popcorn, and pancake. The results indicate that on average, the daily consumption values of fried chicken, shawarma, pizza, hot-dog and burger, pie, khachapuri, fries, chips, popcorn, pastry, and pancake are 53.09 g, 49.26 g, 33.88 g, 49.97 g, 34.97 g, 32.17 g, 27.94 g, 36.24 g, 14.68 g, 76.09 g, and 41.36 g, respectively. This implies that the most widely consumed fast-food products include pastry, fried chicken, shawarma, hot-dog, and burger (Figure 2).
0.3
0.180
0.083
0.075
0.033
0.025
0.024
0.022
0.013
0.01
0.002
0.00 0.05 0.10 0.15 0.20 0.25 0.30 0.35
Pizza
Hot-dog and burger
Fries
Pancake
Shawarma
Khachapuri
Fried chicken
Pie
Chips
Pastry
Popcorn
TFA content (g/100g of product)
Fast
Foo
d
Figure 1. TFA Contents in Fast-Food (g/100 g).
3.2. Fast-Food Consumption
The FFQ study sample was drawn from the adult population of Yerevan, whoseaverage age was 31.91 ± 11.85 years. The average weight for males was 74.76 ± 12.45 kgand for females 58.23 ± 12.02 kg.
Based on survey analysis, all the study participants consumed at least one type of fast-food. Most of the food types are consumed mainly once a week. Most of the respondentsdo not use chips, popcorn, and pancake. The results indicate that on average, the dailyconsumption values of fried chicken, shawarma, pizza, hot-dog and burger, pie, khachapuri,fries, chips, popcorn, pastry, and pancake are 53.09 g, 49.26 g, 33.88 g, 49.97 g, 34.97 g,32.17 g, 27.94 g, 36.24 g, 14.68 g, 76.09 g, and 41.36 g, respectively. This implies that the mostwidely consumed fast-food products include pastry, fried chicken, shawarma, hot-dog, andburger (Figure 2).
In the frame of the study, the results of K-means cluster analysis revealed two clustergroups of fast-food consumers categorized in the order of consumption amount, from thelowest to the highest. Through K-means cluster analysis, the heterogeneous consumptiondata was grouped into homogenous clusters for each fast-food. Figure 3a,b summarizesthe average daily consumption amount and the percentage of consumers for two differentcluster groups.
It should be noted that Cluster 1 is characterized by a low consumption value and itincludes most of the consumers. Meanwhile, Cluster 2, having the highest consumptionvalue includes only a small percentage of the population.
In the current study, the overall mean frequency of fast-food consumption is once(0.38–1.93) per week. A cross-sectional study conducted among adults in King County, US,reported a mean fast-food consumption of 2.07 times per week [41], which is more thanthe one reported in this study. Another study conducted among Iranian adults reporteda mean fast-food consumption of 1.673 times per week, which is again higher comparedwith the result of the current investigation [42].
Foods 2022, 11, 1294 6 of 10Foods 2022, 11, x FOR PEER REVIEW 6 of 10
Figure 2. Average Daily Consumption of Fast-Food (g/day).
In the frame of the study, the results of K-means cluster analysis revealed two cluster groups of fast-food consumers categorized in the order of consumption amount, from the lowest to the highest. Through K-means cluster analysis, the heterogeneous consumption data was grouped into homogenous clusters for each fast-food. Figure 3a,b summarizes the average daily consumption amount and the percentage of consumers for two different cluster groups.
(a)
76.09
53.09
49.97
49.26
41.36
36.24
34.97
33.88
32.17
27.94
14.68
Pastry
Fried chicken
Hot-dog and burger
Shawarma
Pancake
Chips
Pie
Pizza
Khachapuri
Fries
Popcorn
0 10 20 30 40 50 60 70 80
Fast
Foo
d
Average Daily Consumption (g/day)
91% 96%90%
97% 93% 90% 93% 96% 95%
68%
95%
0%10%20%30%40%50%60%70%80%90%100%
05
1015202530354045
Dai
ly C
onsu
mpt
ion
(g/d
ay)
Daily Consumption (g/day) % of Consumers
Figure 2. Average Daily Consumption of Fast-Food (g/day).
Foods 2022, 11, x FOR PEER REVIEW 6 of 10
Figure 2. Average Daily Consumption of Fast-Food (g/day).
In the frame of the study, the results of K-means cluster analysis revealed two cluster groups of fast-food consumers categorized in the order of consumption amount, from the lowest to the highest. Through K-means cluster analysis, the heterogeneous consumption data was grouped into homogenous clusters for each fast-food. Figure 3a,b summarizes the average daily consumption amount and the percentage of consumers for two different cluster groups.
(a)
76.09
53.09
49.97
49.26
41.36
36.24
34.97
33.88
32.17
27.94
14.68
Pastry
Fried chicken
Hot-dog and burger
Shawarma
Pancake
Chips
Pie
Pizza
Khachapuri
Fries
Popcorn
0 10 20 30 40 50 60 70 80
Fast
Foo
d
Average Daily Consumption (g/day)
91% 96%90%
97% 93% 90% 93% 96% 95%
68%
95%
0%10%20%30%40%50%60%70%80%90%100%
05
1015202530354045
Dai
ly C
onsu
mpt
ion
(g/d
ay)
Daily Consumption (g/day) % of Consumers
Figure 3. Cont.
Foods 2022, 11, 1294 7 of 10Foods 2022, 11, x FOR PEER REVIEW 7 of 10
(b)
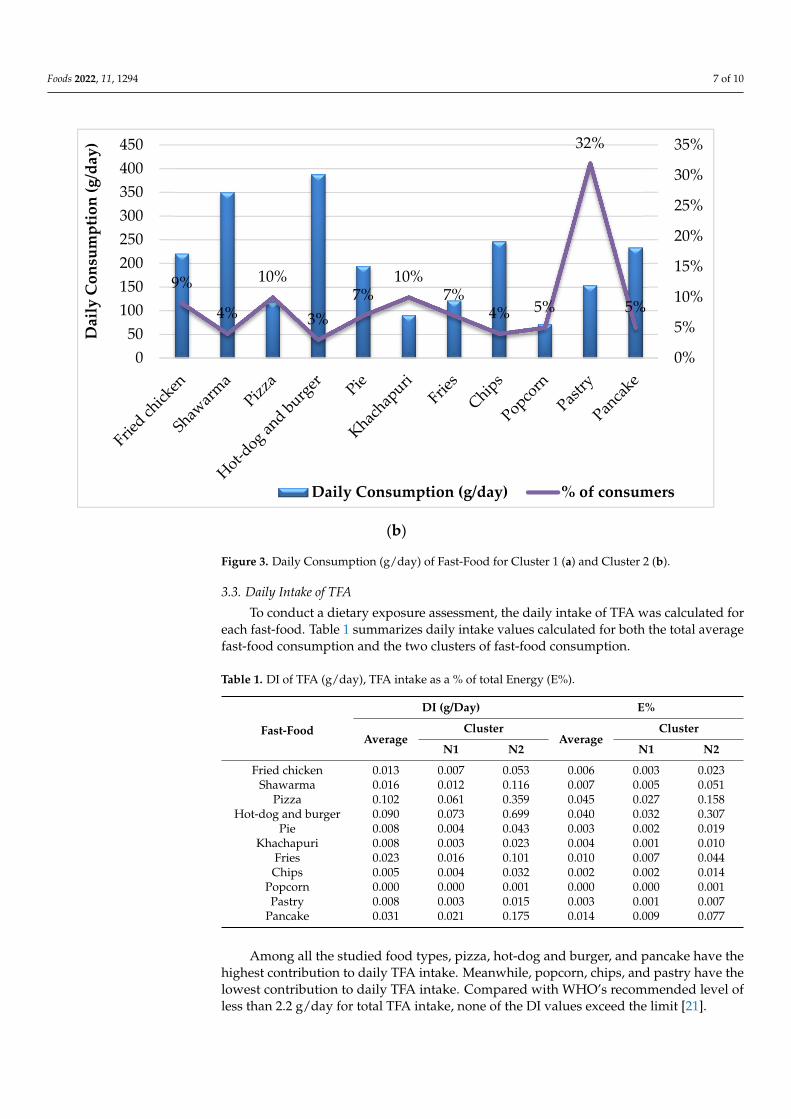
Figure 3. Daily Consumption (g/day) of Fast-Food for Cluster 1 (a) and Cluster 2 (b).
It should be noted that Cluster 1 is characterized by a low consumption value and it includes most of the consumers. Meanwhile, Cluster 2, having the highest consumption value includes only a small percentage of the population.
In the current study, the overall mean frequency of fast-food consumption is once (0.38–1.93) per week. A cross-sectional study conducted among adults in King County, US, reported a mean fast-food consumption of 2.07 times per week [41], which is more than the one reported in this study. Another study conducted among Iranian adults re-ported a mean fast-food consumption of 1.673 times per week, which is again higher com-pared with the result of the current investigation [42].
3.3. Daily Intake of TFA To conduct a dietary exposure assessment, the daily intake of TFA was calculated for
each fast-food. Table 1 summarizes daily intake values calculated for both the total aver-age fast-food consumption and the two clusters of fast-food consumption.
Table 1. DI of TFA (g/day), TFA intake as a % of total Energy (E%).
Fast-Food DI (g/Day) E%
Average Cluster
Average Cluster
N1 N2 N1 N2 Fried chicken 0.013 0.007 0.053 0.006 0.003 0.023
Shawarma 0.016 0.012 0.116 0.007 0.005 0.051 Pizza 0.102 0.061 0.359 0.045 0.027 0.158
Hot-dog and burger
0.090 0.073 0.699 0.040 0.032 0.307
Pie 0.008 0.004 0.043 0.003 0.002 0.019 Khachapuri 0.008 0.003 0.023 0.004 0.001 0.010
Fries 0.023 0.016 0.101 0.010 0.007 0.044 Chips 0.005 0.004 0.032 0.002 0.002 0.014
Popcorn 0.000 0.000 0.001 0.000 0.000 0.001
9%
4%
10%
3%7%
10%7%
4% 5%
32%
5%
0%
5%
10%
15%
20%
25%
30%
35%
050
100150200250300350400450
Dai
ly C
onsu
mpt
ion
(g/d
ay)
Daily Consumption (g/day) % of consumers
Figure 3. Daily Consumption (g/day) of Fast-Food for Cluster 1 (a) and Cluster 2 (b).
3.3. Daily Intake of TFA
To conduct a dietary exposure assessment, the daily intake of TFA was calculated foreach fast-food. Table 1 summarizes daily intake values calculated for both the total averagefast-food consumption and the two clusters of fast-food consumption.
Table 1. DI of TFA (g/day), TFA intake as a % of total Energy (E%).
Fast-Food
DI (g/Day) E%
AverageCluster
AverageCluster
N1 N2 N1 N2
Fried chicken 0.013 0.007 0.053 0.006 0.003 0.023Shawarma 0.016 0.012 0.116 0.007 0.005 0.051
Pizza 0.102 0.061 0.359 0.045 0.027 0.158Hot-dog and burger 0.090 0.073 0.699 0.040 0.032 0.307
Pie 0.008 0.004 0.043 0.003 0.002 0.019Khachapuri 0.008 0.003 0.023 0.004 0.001 0.010
Fries 0.023 0.016 0.101 0.010 0.007 0.044Chips 0.005 0.004 0.032 0.002 0.002 0.014
Popcorn 0.000 0.000 0.001 0.000 0.000 0.001Pastry 0.008 0.003 0.015 0.003 0.001 0.007
Pancake 0.031 0.021 0.175 0.014 0.009 0.077
Among all the studied food types, pizza, hot-dog and burger, and pancake have thehighest contribution to daily TFA intake. Meanwhile, popcorn, chips, and pastry have thelowest contribution to daily TFA intake. Compared with WHO’s recommended level ofless than 2.2 g/day for total TFA intake, none of the DI values exceed the limit [21].
Foods 2022, 11, 1294 8 of 10
DI values of TFA have been represented as a percentage of total energy intake. TFAintake through fried chicken, shawarma, pizza, hot-dog and burger, pie, khachapuri, fries,chips, popcorn, pastry, and pancake consumption accounts for 0.006%, 0.007%, 0.045%,0.040%, 0.003%, 0.004%, 0.010%, 0.002%, 0.0001%, and 0.003% of the total energy intake,respectively (Table 1). Compared with WHO’s recommended level of 1% of total energyintake, these values do not exceed the limit and are not indicative of a major healthconcern [21].
Although the separate consumption of the studied food items does not warrant anyconcerns, their cumulative intake may be somewhat worrisome. Based on a statisticalanalysis of FFQ data, it was found that 7% of the respondents consume all eleven typesof fast-food regularly. In the case of cumulative intake, the average DI of TFA is equal to0.303 g/day, which is approximately 7 times lower than the WHO recommended level of2.2 g/day. A similar pattern is present when representing TFA intake as a percentage oftotal energy. In the case of average fast-food consumption, TFA intake accounts for 0.134%of total energy intake, which is far below the level (less than 1% of total energy intake) setby WHO.
4. Conclusions
This was the first study towards the assessment of the total TFA daily intake throughfast-food consumption among Yerevan’s adult population. In general, low levels of TFAwere recorded in the investigated fast-food items, ranging from 0.002 to 0.3 g of TFA per100 g of the product. Mean daily fast-food consumption values ranged from 14.68 g/dayto 76.09 g/day, with popcorn as the lowest and pastry as the highest consumed food. Thestudy results highlighted that the aggregate average daily intake (DI) of TFA (0.303 g/day)did not exceed the WHO limit of 1%. However, it was found that the consumption offast-food alone can already contribute to the daily TFA intake of consumers.
The key findings of this study can serve as a basis for developing programs to reducetrans-fats to less than 1% of total energy intake and replace trans-fats with polyunsaturatedfats. Considering the adverse health effects related to fast-food consumption, dietaryadvice and policy actions could be aimed at decreasing the consumption of these foods.Besides that, educating the population about limiting the consumption of foods that containindustrially produced trans-fats would be a crucial step to promoting a healthier diet.
National policies should be directed towards reducing incentives for the food industryto continue the production of TFA-rich foods. Taking into consideration the fact thatTFA can also be present in other food types, it is crucial to have proper and continuousmonitoring of TFA contents. Moreover, studies shall be conducted to investigate theadverse health effects of the aggregate TFA intake through the consumption of variousfood products.
Author Contributions: D.P.: Conceptualization, Project administration, Methodology. M.B.: Inves-tigation, Writing—review and editing. S.S.: Writing, Formal analysis, Software. N.M.: Supervi-sion, Writing—review and editing. All authors have read and agreed to the published version ofthe manuscript.
Funding: The work was supported by the Science Committee of RA, in the frames of the researchproject № 20TTCG-4A001 on “Strengthening scientific and methodological capacity for assessingfood security and nutrients”. Laboratory analyses were carried out within the frame of the researchproject № 19YR-4A037 funded by the Science Committee of RA.
Data Availability Statement: Data is contained within the article.
Conflicts of Interest: The authors declare no conflict of interest.

Foods 2022, 11, 1294 9 of 10
References1. Dias, F.D.S.L.; Passos, M.E.A.; Carmo, M.D.G.T.D.; Lopes, M.L.M.; Mesquita, V.L.V. Fatty acid profile of biscuits and salty snacks
consumed by Brazilian college students. Food Chem. 2015, 171, 351–355. [CrossRef] [PubMed]2. Jia, P.; Luo, M.; Li, Y.; Zheng, J.S.; Xiao, Q.; Luo, J. Fast-food restaurant, unhealthy eating, and childhood obesity: A systematic
review and meta-analysis. Obes. Rev. 2019, 22, e12944. [CrossRef] [PubMed]3. EFSA. Scientific and technical assistance on trans fatty acids. EFSA Support. Publ. 2018, 15, 1433E.4. Verneque, B.J.F.; Machado, A.M.; Silva, L.D.A.; Lopes, A.C.S.; Duarte, C.K. Ruminant and industrial trans-fatty acids consumption
and cardiometabolic risk markers: A systematic review. Crit. Rev. Food Sci. Nutr. 2020, 62, 2050–2060. [CrossRef]5. Pipoyan, D.; Stepanyan, S.; Stepanyan, S.; Beglaryan, M.; Costantini, L.; Molinari, R.; Merendino, N. The Effect of Trans Fatty
Acids on Human Health: Regulation and Consumption Patterns. Foods 2021, 10, 2452. [CrossRef]6. Stender, S.; Dyerberg, J.; Bysted, A.; Leth, T.; Astrup, A. A trans world journey. Atheroscler. Suppl. 2006, 7, 47–52. [CrossRef]7. Stender, S.; Dyerberg, J.; Astrup, A. Fast food: Unfriendly and unhealthy. Int. J. Obes. 2007, 31, 887–890. [CrossRef]8. Beal, T.; Morris, S.S.; Tumilowicz, A. Global patterns of adolescent fruit, vegetable, carbonated soft drink, and fast-food con-
sumption: A meta-analysis of global school-based student health surveys. Food Nutr. Bull. 2019, 40, 444–459. [CrossRef]9. Majabadi, H.A.; Solhi, M.; Montazeri, A.; Shojaeizadeh, D.; Nejat, S.; Farahani, F.K.; Djazayeri, A. Factors Influencing Fast-Food
Consumption Among Adolescents in Tehran: A Qualitative Study. Iran. Red Crescent Med. J. 2016, 18, e23890. [CrossRef]10. Li, L.; Sun, N.; Zhang, L.; Xu, G.; Liu, J.; Hu, J.; Zhang, Z.; Lou, J.; Deng, H.; Shen, Z.; et al. Fast food consumption among young
adolescents aged 12–15 years in 54 low- and middle-income countries. Glob. Health Action 2020, 13, 1795438. [CrossRef]11. Gebauer, S.K.; Psota, T.L.; Kris-Etherton, P.M. The Diversity of Health Effects of Individual trans Fatty Acid Isomers. Lipids 2007,
42, 787–799. [CrossRef]12. Delgado, G.E.; Kleber, M.E. Trans Fatty Acids and Mortality. In The Molecular Nutrition of Fats; Academic Press: Cambridge, MA,
USA, 2019; p. 335.13. Hoenselaar, R. Saturated fat and cardiovascular disease: The discrepancy between the scientific literature and dietary advice.
Nutrition 2012, 28, 118–123. [CrossRef] [PubMed]14. Hutchinson, J.; Rippin, H.; Jewell, J.; Breda, J.; E Cade, J. Comparison of high and low trans-fatty acid consumers: Analyses of UK
National Diet and Nutrition Surveys before and after product reformulation. Public Health Nutr. 2017, 21, 465–479. [CrossRef][PubMed]
15. Makarewicz-Wujec, M.; Dworakowska, A.; Kozłowska-Wojciechowska, M. Replacement of saturated and trans-fatty acids in thediet v. CVD risk in the light of the most recent studies. Public Health Nutr. 2018, 21, 2291–2300. [CrossRef] [PubMed]
16. Wang, Q.; Afshin, A.; Yakoob, M.Y.; Singh, G.M.; Rehm, C.D.; Khatibzadeh, S.; Micha, R.; Shi, P.; Mozaffarian, D.; Ezzati, M.; et al.Impact of Nonoptimal Intakes of Saturated, Polyunsaturated, and Trans Fat on Global Burdens of Coronary Heart Disease. J. Am.Heart Assoc. 2016, 5, 002891. [CrossRef]
17. Qiu, B.; Wang, Q.; Liu, W.; Xu, T.-C.; Liu, L.-N.; Zong, A.-Z.; Jia, M.; Li, J.; Du, F.-L. Biological effects of trans fatty acids and theirpossible roles in the lipid rafts in apoptosis regulation. Cell Biol. Int. 2018, 42, 904–912. [CrossRef]
18. Stender, S.; Dyerberg, J.; Hølmer, G.; Ovesen, L.; Sandström, B. The Influence of Trans Fatty Acids on Health: A Report from theDanish Nutrition Council. Clin. Sci. 1995, 88, 375–392. [CrossRef]
19. Zupanic, N.; Hribar, M.; Hristov, H.; Lavriša, Ž.; Kušar, A.; Gregoric, M.; Blaznik, U.; Seljak, B.K.; Golja, P.; Vidrih, R.; et al. DietaryIntake of trans Fatty Acids in the Slovenian Population. Nutritients 2021, 13, 207. [CrossRef]
20. Kušar, A.; Hribar, M.; Lavriša, Ž.; Zupanic, N.; Kupirovic, U.P.; Hristov, H.; Abramovic, H.; Vidrih, R.; Zlatic, E.; Kokalj, D.; et al.Assessment of trans-fatty acid content in a sample of foods from the Slovenian food supply using a sales-weighting approach.Public Health Nutr. 2020, 24, 12–21. [CrossRef]
21. Wilkins, E.; Wilson, L.; Wickramasinghe, K.; Bhatnagar, P.; Leal, J.; Luengo-Fernandez, R.; Burns, R.; Rayner, M.; Townsend, N.European Cardiovascular Disease Statistics 2017; European Heart Network: Brussels, Belgium, 2017.
22. WHO. Replace Trans Fat. An Action Package to Eliminate Industrially Produced Trans-Fatty Acids. 2018b. WHO/NMH/NHD/18.4. Avail-able online: https://www.who.int/docs/default-source/documents/replace-transfats/replace-action-package.pdf (accessed on14 March 2022).
23. EU. Commission Regulation (EU) 2019/649 of 24 April 2019 Amending Annex III to Regulation (EC) No 1925/2006 of theEuropean Parliament and of the Council as Regards Trans Fat, Other than Trans Fat Naturally Occurring in Fat of Animal Origin.Available online: https://eur-lex.europa.eu/legal-content/EN/TXT/?uri=CELEX%3A32019R0649 (accessed on 14 March 2022).
24. Wu, J.H.; Downs, S.; Catterall, E. Levels of Trans Fats in the Food Supply and Consumption in Australia: An Expert Com-Mentary RapidReview. Brokered by the Sax Institute for the Heart Foundation of Australia; Sax Institute: Sydney, Australia, 2017. Available online:www.saxinstitute.org.au (accessed on 14 March 2022)..
25. TR CU 024/2011. Technical Regulation of the Customs Union (TR CU 024/2011) on Oil and Fat Products; The Eurasian Customs Union:Moscow, Russia, 2011.
26. WHO. Prevention and Control of Noncommunicable Diseases in Armenia. The Case for Investment. Available online: https://www.euro.who.int/__data/assets/pdf_file/0017/401273/BizzCase-ARM-web.pdf (accessed on 14 March 2022).
27. WHO. Protocol for Measuring Trans Fatty Acids in Foods. 2018. Available online: https://www.who.int/docs/default-source/documents/replace-transfats/a-food-analysis-lab-protocol.pdf?sfvrsn=b27e4111_2 (accessed on 14 March 2022).
Foods 2022, 11, 1294 10 of 10
28. ISO. ISO 12966-4:2015, Animal and Vegetable Fats and Oils—Gas Chromatography of Fatty Acid Methyl Esters—Part 4: Determination byCapillary Gas Chromatography.; ISO: Geneva, Switzerland, 2015.
29. ISO. ISO 12966-2:2017, Animal and Vegetable Fats and Oils—Gas Chromatography of Fatty Acid Methyl Esters—Part 2: Preparation ofMethyl Esters of Fatty Acids; ISO: Geneva, Switzerland, 2017.
30. Pipoyan, D.; Hovhannisyan, A.; Beglaryan, M.; Stepanyan, S.; Mantovani, A. Corrigendum to “Risk assessment of dietaryexposure to potentially toxic trace elements in emerging countries: A pilot study on intake via flour-based products in Yerevan,Armenia”. Food Chem. Toxicol. 2021, 156, 112525. [CrossRef]
31. EFSA. Guidance on the EU Menu methodology. EFSA J. 2014, 12, 3944.32. Ares, G. Cluster analysis: Application in food science and technology. In Mathematical and Statistical Methods in Food Science and
Technology; John Wiley & Sons: Hoboken, NJ, USA, 2014; pp. 103–120.33. Liu, A.D.; Li, J.W.; Liu, Z.P.; Zhou, P.P.; Mao, W.F.; Li, N.; Zhang, L. Trans Fatty Acid Levels in Foods and Intakes among
Population Aged 3 Years and above in Beijing and Guangzhou Cities, China. Biomed. Environ. Sci. 2015, 28, 477–485. [CrossRef][PubMed]
34. SC. Statistical Committee of the Republic of Armenia. Food Utilization. 2020. Available online: https://www.armstat.am/file/article/f_sec_1_2020_6.pdf (accessed on 14 March 2022).
35. Stender, S. Industrially produced trans-fat in popular foods in 15 countries of the former Soviet Union from 2015 to 2016: A marketbasket investigation. BMJ Open 2019, 9, e023184. [CrossRef] [PubMed]
36. Zbikowska, A.; Onacik-Gur, S.; Kowalska, M.; Rutkowska, J. Trans Fatty Acids in Polish Pastry. J. Food Prot. 2019, 82, 1028–1033.[CrossRef]
37. Mencin, M.; Abramovic, H.; Zlatic, E.; Demšar, L.; Piskernik, S.; Schreiner, M.; Žmitek, K.; Kušar, A.; Pravst, I.; Vidrih, R. Contentof trans-fatty acid isomers in bakery products on the Slovenian market. LWT 2021, 143, 111095. [CrossRef]
38. Pérez-Farinós, N.; Saavedra, M.; Ángeles, D.R.; Villalba, C.V.; de Dios, T.R. Trans-fatty acid content of food products in Spain in2015. Gac. Sanit. 2016, 30, 379–382. [CrossRef]
39. FSAI. Food Safety Authority of Ireland. Trans Fatty Acid Survey of Fast Foods in Ireland; FSAI: Dublin, Ireland, 2008.40. Astiasarán, I.; Abella, E.; Gatta, G.; Ansorena, D. Margarines and Fast-Food French Fries: Low Content of trans Fatty Acids.
Nutritients 2017, 9, 662. [CrossRef]41. Seguin, R.A.; Aggarwal, A.; Vermeylen, F.; Drewnowski, A. Consumption Frequency of Foods Away from Home Linked with
Higher Body Mass Index and Lower Fruit and Vegetable Intake among Adults: A Cross-Sectional Study. J. Environ. Public Health2016, 2016, 1–12. [CrossRef]
42. Rezaei, S.M.A. Frequency and attitudes to fast food consumption in Yasuj, Southwestern Iran. Int. J. Nutr. Sci. 2017, 2, 92–96.
Related Documents