ORIGINAL ARTICLE Trans Fatty Acid Intakes and Food Sources in the U.S. Population: NHANES 1999–2002 Penny M. Kris-Etherton • Michael Lefevre • Ronald P. Mensink • Barbara Petersen • Jennifer Fleming • Brent D. Flickinger Received: 16 November 2011 / Accepted: 19 July 2012 / Published online: 18 August 2012 Ó The Author(s) 2012. This article is published with open access at Springerlink.com Abstract Because of efforts to decrease trans fatty acids (TFA) in the food supply, intake should be assessed in the population to establish a baseline TFA intake. The 1999–2002 National Health and Nutrition Examination Survey (NHANES) was used to identify a benchmark for TFA intake. TFA was estimated by mean, median, and quintile of intake, TFA intake data were weighted using the NHANES 4-year sample weights. The main outcome measures included TFA intake in grams per day and percentage of energy in the top 25 food sources of TFA. Data are reported for 16,669 individuals C3 years of age. Median TFA intake was 2.3 % of calories (5 g/day) with 0.9–4.5 % of energy (1.5–13.1 g/day) over different quin- tiles of intake. Mean TFA intake was 2.5 % of energy (6.1 g/day). The range of TFA intake in the fifth quintile was very large, i.e., 3.5–12.5 % of energy or 8.8–92.4 g/ day. Increasing quintiles of TFA intake were associated with increases in total fat (26.7–37.6 % of energy), satu- rated fat (7.6–10.5 % of energy), and calories (for those [ 20 years of age: 2,416–2,583 for men and 1,679–1,886 for women). Major food sources of dietary TFA were cakes, cookies, pies, and pastries. Based on current dietary guidance to consume as little industrial TFA as possible, much progress is needed to attain this goal, including food industry efforts to remove TFA from the food supply and educating the public about making healthy food choices. Keywords Trans fatty acid intake Á Industrial trans fatty acid intake Á Fatty acid intake Á Quintiles of trans fatty acid intake Á Food sources of trans fatty acids Á NHANES 1999–2002 Abbreviations CSFII Continuing Survey of Food Intakes by Individuals FARE Foods Analysis and Residue Evaluation Program FDA U.S. Food and Drug Administration MUFA Monounsaturated fatty acids NHANES National Health and Nutrition Examination Survey SFA Saturated fatty acids TFA Trans fatty acids USDA U.S. Department of Agriculture For the ILSI North America Technical Committee on Dietary Lipids. P. M. Kris-Etherton (&) Á J. Fleming Department of Nutritional Sciences, 319 Chandlee Laboratory, The Pennsylvania State University, University Park, PA 16802, USA e-mail: [email protected] J. Fleming e-mail: [email protected] M. Lefevre Department of Nutrition, Dietetics and Food Science, Utah State University, 9815 Old Main Hill, Logan, UT 84322-9815, USA e-mail: [email protected] R. P. Mensink Department of Human Biology, Nutrition and Toxicology Research Institute Maastricht, Maastricht University, P.O. Box 616, 6200 MD Maastricht, The Netherlands e-mail: [email protected] B. Petersen Exponent, Inc., 1150 Connecticut Ave NW, Suite 1100, Washington, DC 20036, USA e-mail: [email protected] B. D. Flickinger Archer Daniels Midland Company, Randall Research Center, 1001 N. Brush College Rd., Decatur, IL 62521, USA e-mail: fl[email protected] 123 Lipids (2012) 47:931–940 DOI 10.1007/s11745-012-3704-z

Welcome message from author
This document is posted to help you gain knowledge. Please leave a comment to let me know what you think about it! Share it to your friends and learn new things together.
Transcript
ORIGINAL ARTICLE
Trans Fatty Acid Intakes and Food Sources in the U.S. Population:NHANES 1999–2002
Penny M. Kris-Etherton • Michael Lefevre •
Ronald P. Mensink • Barbara Petersen •
Jennifer Fleming • Brent D. Flickinger
Received: 16 November 2011 / Accepted: 19 July 2012 / Published online: 18 August 2012
� The Author(s) 2012. This article is published with open access at Springerlink.com
Abstract Because of efforts to decrease trans fatty acids
(TFA) in the food supply, intake should be assessed in the
population to establish a baseline TFA intake. The
1999–2002 National Health and Nutrition Examination
Survey (NHANES) was used to identify a benchmark for
TFA intake. TFA was estimated by mean, median, and
quintile of intake, TFA intake data were weighted using the
NHANES 4-year sample weights. The main outcome
measures included TFA intake in grams per day and
percentage of energy in the top 25 food sources of TFA.
Data are reported for 16,669 individuals C3 years of age.
Median TFA intake was 2.3 % of calories (5 g/day) with
0.9–4.5 % of energy (1.5–13.1 g/day) over different quin-
tiles of intake. Mean TFA intake was 2.5 % of energy
(6.1 g/day). The range of TFA intake in the fifth quintile
was very large, i.e., 3.5–12.5 % of energy or 8.8–92.4 g/
day. Increasing quintiles of TFA intake were associated
with increases in total fat (26.7–37.6 % of energy), satu-
rated fat (7.6–10.5 % of energy), and calories (for those
[20 years of age: 2,416–2,583 for men and 1,679–1,886
for women). Major food sources of dietary TFA were
cakes, cookies, pies, and pastries. Based on current dietary
guidance to consume as little industrial TFA as possible,
much progress is needed to attain this goal, including food
industry efforts to remove TFA from the food supply and
educating the public about making healthy food choices.
Keywords Trans fatty acid intake � Industrial trans fatty
acid intake � Fatty acid intake � Quintiles of trans fatty acid
intake � Food sources of trans fatty acids � NHANES
1999–2002
Abbreviations
CSFII Continuing Survey of Food Intakes by
Individuals
FARE Foods Analysis and Residue Evaluation
Program
FDA U.S. Food and Drug Administration
MUFA Monounsaturated fatty acids
NHANES National Health and Nutrition Examination
Survey
SFA Saturated fatty acids
TFA Trans fatty acids
USDA U.S. Department of Agriculture
For the ILSI North America Technical Committee on Dietary Lipids.
P. M. Kris-Etherton (&) � J. Fleming
Department of Nutritional Sciences, 319 Chandlee Laboratory,
The Pennsylvania State University, University Park,
PA 16802, USA
e-mail: [email protected]
J. Fleming
e-mail: [email protected]
M. Lefevre
Department of Nutrition, Dietetics and Food Science, Utah State
University, 9815 Old Main Hill, Logan, UT 84322-9815, USA
e-mail: [email protected]
R. P. Mensink
Department of Human Biology, Nutrition and Toxicology
Research Institute Maastricht, Maastricht University,
P.O. Box 616, 6200 MD Maastricht, The Netherlands
e-mail: [email protected]
B. Petersen
Exponent, Inc., 1150 Connecticut Ave NW, Suite 1100,
Washington, DC 20036, USA
e-mail: [email protected]
B. D. Flickinger
Archer Daniels Midland Company, Randall Research Center,
1001 N. Brush College Rd., Decatur, IL 62521, USA
e-mail: [email protected]
123
Lipids (2012) 47:931–940
DOI 10.1007/s11745-012-3704-z
Introduction
Dietary recommendations have been made in the United
States and globally to decrease trans fatty acids (TFA)
produced by partial hydrogenation of vegetable oils [1, 2].
These recommendations are based on numerous studies
demonstrating many adverse health effects of TFA [3].
Multiple strategies have been invoked in the United States
to decrease dietary TFA, including nutrition labeling of
TFA on the Nutrition Facts Panel (law passed in 2003;
enacted in 2006), as well as passage of legislation ban-
ning or restricting use of fats and oils containing TFA in
some states and cities [4, 5]. In 2009, legislation to limit
TFA in the food supply was enacted in 1 state and pro-
posed in 13 states and the District of Columbia [6]. Based
on the success of this approach in New York, it seems
that legislative strategies may be an effective strategy for
decreasing TFA in foods [7]. Mozaffarian and Stampfer
[7] estimated that a 1 % reduction in TFA intake could
prevent 72,000 cardiovascular disease-related deaths per
year. The U.S. Food and Drug Administration (FDA)
have also suggested that the removal of TFA from just
3 % of breads and cakes and 15 % of cookies and
crackers would save up to US $59 billion in health care
costs over the next 20 years [8]. Consequently, the food
industry is actively lowering TFA in the food supply by
developing new fats and oils and modifying existing ones
[9, 10].
The last comprehensive analysis of TFA intake was
published by Allison et al. [11] in 1999, using 1989–1991
data collected from the U.S. Department of Agriculture’s
(USDA) Continuing Survey of Food Intakes by Individuals
(CSFII). At that time, the average TFA intake in the United
States was 2.6 % of calories, or 5.3 g/day [11]. Since the
work by Allison et al. was published, many food products
have had TFA removed and/or reduced appreciably [5, 12].
Much of this has happened as the result of legislation
(announced on January 9, 2003) mandating TFA labeling
on the Nutrition Facts Panel by January 1, 2006. Clearly,
there is a need to evaluate the effects of this announcement
and legislation on current TFA intake, and this needs to be
done in the context of the most current TFA intake prior to
the FDA’s announcement. Consequently, it is important to
benchmark current TFA intake against intake that is more
recent than the 1989–1991 data to evaluate the impact of
legislation enacted to decrease TFA intake.
The purpose of this study was to assess TFA intake in
different population groups in the United States using more
recent intake data from the 1999–2002 National Health and
Nutrition Examination Survey (NHANES) just prior to the
time that legislation was passed for TFA to be listed on the
Nutrition Facts Panel. We also evaluated food sources of
TFA in different population groups. A better understanding
of the major food sources of TFA would be helpful for
ongoing efforts to markedly lower TFA in the food supply.
Materials and Methods
Estimation of TFA Intake During 1999–2002
To estimate dietary intake of TFA, we used 1999–2002
NHANES consumption data as well as the Foods Analysis
and Residue Evaluation Program (FARE) software
(v.7.997; Exponent, Washington, DC). FARE is proprietary
data processing software that was developed to facilitate
the mining of the thousands of individual intake records in
the NHANES database. A more detailed description of the
analysis done by using the FARE program is described by
DiRienzo et al. [13]. FARE is used by the FDA, the USDA,
the California Office of Environmental Health Hazard
Assessment, and the Health Canada Pest Management
Regulatory Agency to derive estimates of food, nutrient,
and contaminant intakes based on NHANES and CSFII
consumption data.
Dietary assessment in NHANES 1999–2002 was con-
ducted using two 24-h dietary recalls, one in person and a
second one by telephone [14]. The TFA content of foods
was derived from the NHANES dataset. The NHANES
used the Trans Fatty Acid Database (laboratory analyses
completed between 1990 and 1993) that was released in
1995 as ‘‘Special table 1: Fat and fatty acid content of
selected foods containing trans fatty acids.’’ This is refer-
red to as the USDA Nutrient Database for Standard Ref-
erence (Release 15) which was used to map the trans fat
content of analyzed foods to the foods reported in the
1999–2002 NHANES. Total dietary TFA intakes were
calculated by multiplying the amount of food consumed by
the concentration of TFA in that food, and were expressed
as a percentage of individual energy intakes per day. The
TFA intake data were weighted using the NHANES 4-year
sample weights as a means to ensure that the results are
representative of the US population (aged C3 years). Two
separate analyses were required to determine the quintile
cutoff points for grams per day as well as percentage of
energy. The quintiles for the analyses expressed as grams
per person per day were calculated based upon grams per
day of TFA intake. A second set of population quintile
groups was calculated for the percentage of energy analy-
ses based upon the per capita TFA intake expressed as a
percentage of energy. The values provided within each
quintile are the mean nutrient intakes of that quintile of the
population. The inter-quintile ranges of TFA intake from
the total diet for each quintile are provided. The un-
weighted sample sizes are not exactly the same for each
quintile; however, the quintiles are balanced after applying
932 Lipids (2012) 47:931–940
123
the statistical weights. Populations were defined by age and
gender according to the criteria used by Allison et al. [11]
so that results could be compared.
Estimation of Food Sources of TFA
Twenty-five food categories were established based on pre-
established food groupings in NHANES (e.g., grains and
salty snacks, milk and milk products, etc.) and then further
sub-divided to allow identification of categories of foods as
eaten (e.g., ready-to-eat breakfast cereals) or that were
mentioned in previous studies to be contributors to TFA
intakes. The amount of TFA in food (g/100 g) was derived
from NHANES recipes as described above.
Results
The mean, median, 90th percentile, and quintiles of TFA
intake, as well as other fatty acids, total fat (in grams per
day), and energy in the U.S. population (aged C3 years),
are reported for 16,669 subjects (Table 1; Fig. 1) as well as
percentages of energy (Table 2). It is apparent that males
aged 12–19 years have the highest mean TFA intake
expressed as grams per day compared with the other pop-
ulations for each quintile. When expressed as a percentage
of energy, the intake of TFA was similar in all population
groups. Subjects were stratified on the basis of total TFA
intake as grams per day or percentage of energy, thereby
explaining why the number of subjects differs within a
quintile between tables for all population groups. The
median TFA intake between 1999 and 2002 was 2.3 % of
calories (5 g/day) with a range of 0.9–4.5 % of energy
(1.5–13.1 g/day) over the different quintiles of intake. The
mean TFA intake was 2.5 % of energy (6.1 g/day). There
was a remarkable range of TFA intake in the top quintile
(3.5–12.5 % of energy, or 8.8–92.4 g/day). Increasing
quintiles of TFA intake were associated with increases in
total fat (range, 26.7–37.6 % of energy), saturated fat
(range, 7.6–10.5 % of energy), as well as calories (for men
and women aged [20 years: 2,416–2,583 for men and
1,679–1,886 for women). Interestingly, intakes of cis-
monounsaturated fatty acid (MUFA) and linoleic acid
(both as grams per day and percentage of energy) also
increased with increasing TFA intake. Notably, from the
first to the fifth quintile, energy intakes increased approx-
imately twofold in each cohort, whereas TFA increased
5- to 8-fold across the quintiles for all cohorts. On a per-
centage-of-energy basis, TFA increased about 4.5- to
5-fold across the quintiles for all cohorts. This suggests that
food choices varied and dietary patterns differed across the
TFA quintiles. Likewise, as a percentage of energy, TFA
intake also increased concomitant with increases in
percentage of energy from total fat, saturated fatty acids
(SFA), MUFA, and polyunsaturated fatty acids, with the
increases in TFA being proportionally greater. Specifically,
TFA increased 4- to 5-fold across quintiles of TFA intake,
whereas energy intake increased from 7 to 17 %. Trends
for TFA intakes were similar for all population groups
studied (Tables 1, 2), with median TFA intake ranging
from 2.1 to 2.5 % of calories (4.4–6.6 g/day). The mean
TFA intake ranged from 2.3 to 2.7 % of calories
(5.0–7.8 g/day). Intakes of TFA (as a percentage of calo-
ries), as well as SFA, oleic acid, linoleic acid, and alpha-
linolenic acid, were similar among the different cohorts
studied (Fig. 2).
The top 25 food categories that accounted for 79 % of
TFA intake in the United States were identified on the basis
of gram quantity of TFA consumed (Fig. 3). In our anal-
ysis, the major source of dietary TFA in the total popula-
tion aged C3 years was cakes, cookies, pies, and pastries
(Fig. 3), accounting for approximately 19 % of total TFA
intake. Importantly, this food source of TFA was approx-
imately 2-fold higher than the next three leading sources,
which include yeast breads, French fries (commercial), and
grain mixtures/ethnic mixed dishes. The fifth highest con-
tributor was tortilla chips (accounting for 5.5 % of total
TFA). Stick margarine provided 2.9 % of total TFA, and
was ranked eighth in TFA intake. The 10 major food
sources of TFA across the different population cohorts
were very similar (Table 3).
A comparison of the above data with the 1989–1991
CSFII data [11] showed that the mean and median values
were similar across cohorts, whereas TFA intake at the
90th percentile was higher (Table 4) in our analysis. In
terms of the percentage of calories from TFA in
1989–1991, all cohorts in the 90th percentile of TFA intake
consumed approximately 3.2 % of calories. In contrast,
using the 1999–2002 NHANES data, TFA intake was
4.1–4.7 % of calories in similar cohorts. These results
clearly indicate that consumption of TFA food sources
increased considerably between 1991 and 2002 in indi-
viduals in the 90th percentile of TFA intake.
Discussion
The mean TFA intake in children and adults in the United
States between 1999 and 2002 was 5.0–7.8 g/day
(2.3–2.7 % of energy). In all cohorts, the range in TFA
intake from the first quintile (1.3–2.0 g/day) to the fifth
quintile (9.6–16.5 g/day) varied by approximately 5- to
8-fold. On a percentage-of-calories basis, TFA consump-
tion ranged from 0.8–1.2 % (quintile 1) to 4.4–5.0 % of
calories (quintile 5). For all population groups, there was
remarkable variation in the range of TFA intake on a
Lipids (2012) 47:931–940 933
123
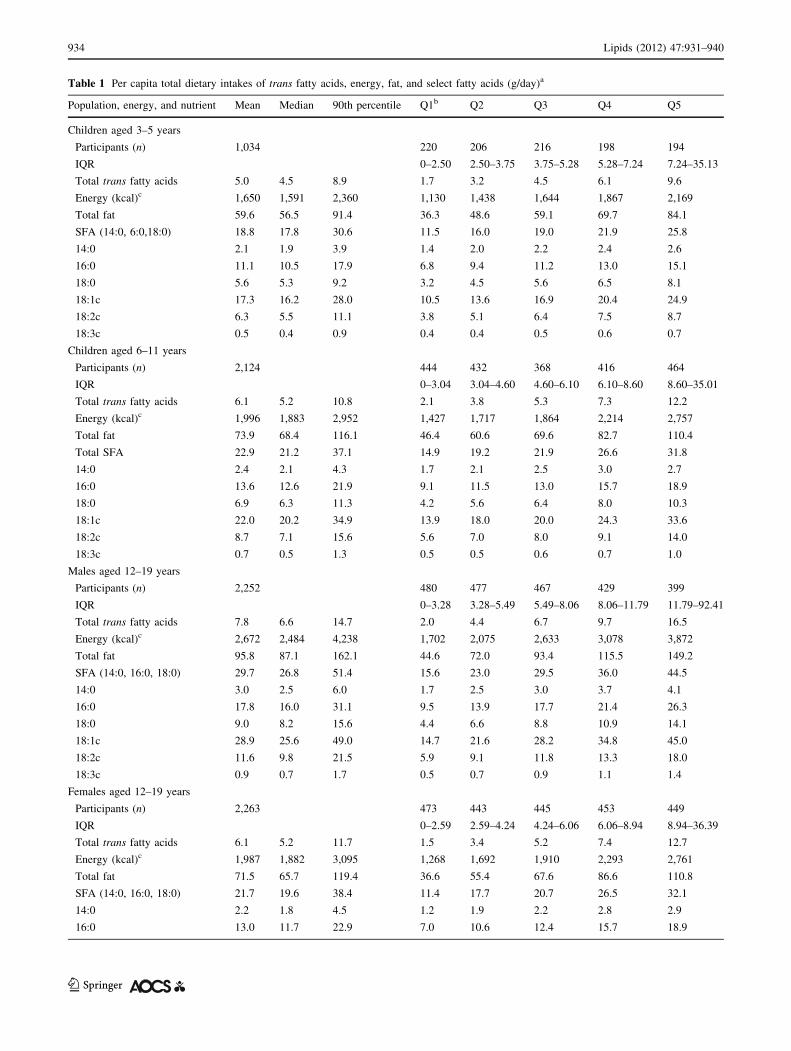
Table 1 Per capita total dietary intakes of trans fatty acids, energy, fat, and select fatty acids (g/day)a
Population, energy, and nutrient Mean Median 90th percentile Q1b Q2 Q3 Q4 Q5
Children aged 3–5 years
Participants (n) 1,034 220 206 216 198 194
IQR 0–2.50 2.50–3.75 3.75–5.28 5.28–7.24 7.24–35.13
Total trans fatty acids 5.0 4.5 8.9 1.7 3.2 4.5 6.1 9.6
Energy (kcal)c 1,650 1,591 2,360 1,130 1,438 1,644 1,867 2,169
Total fat 59.6 56.5 91.4 36.3 48.6 59.1 69.7 84.1
SFA (14:0, 6:0,18:0) 18.8 17.8 30.6 11.5 16.0 19.0 21.9 25.8
14:0 2.1 1.9 3.9 1.4 2.0 2.2 2.4 2.6
16:0 11.1 10.5 17.9 6.8 9.4 11.2 13.0 15.1
18:0 5.6 5.3 9.2 3.2 4.5 5.6 6.5 8.1
18:1c 17.3 16.2 28.0 10.5 13.6 16.9 20.4 24.9
18:2c 6.3 5.5 11.1 3.8 5.1 6.4 7.5 8.7
18:3c 0.5 0.4 0.9 0.4 0.4 0.5 0.6 0.7
Children aged 6–11 years
Participants (n) 2,124 444 432 368 416 464
IQR 0–3.04 3.04–4.60 4.60–6.10 6.10–8.60 8.60–35.01
Total trans fatty acids 6.1 5.2 10.8 2.1 3.8 5.3 7.3 12.2
Energy (kcal)c 1,996 1,883 2,952 1,427 1,717 1,864 2,214 2,757
Total fat 73.9 68.4 116.1 46.4 60.6 69.6 82.7 110.4
Total SFA 22.9 21.2 37.1 14.9 19.2 21.9 26.6 31.8
14:0 2.4 2.1 4.3 1.7 2.1 2.5 3.0 2.7
16:0 13.6 12.6 21.9 9.1 11.5 13.0 15.7 18.9
18:0 6.9 6.3 11.3 4.2 5.6 6.4 8.0 10.3
18:1c 22.0 20.2 34.9 13.9 18.0 20.0 24.3 33.6
18:2c 8.7 7.1 15.6 5.6 7.0 8.0 9.1 14.0
18:3c 0.7 0.5 1.3 0.5 0.5 0.6 0.7 1.0
Males aged 12–19 years
Participants (n) 2,252 480 477 467 429 399
IQR 0–3.28 3.28–5.49 5.49–8.06 8.06–11.79 11.79–92.41
Total trans fatty acids 7.8 6.6 14.7 2.0 4.4 6.7 9.7 16.5
Energy (kcal)c 2,672 2,484 4,238 1,702 2,075 2,633 3,078 3,872
Total fat 95.8 87.1 162.1 44.6 72.0 93.4 115.5 149.2
SFA (14:0, 16:0, 18:0) 29.7 26.8 51.4 15.6 23.0 29.5 36.0 44.5
14:0 3.0 2.5 6.0 1.7 2.5 3.0 3.7 4.1
16:0 17.8 16.0 31.1 9.5 13.9 17.7 21.4 26.3
18:0 9.0 8.2 15.6 4.4 6.6 8.8 10.9 14.1
18:1c 28.9 25.6 49.0 14.7 21.6 28.2 34.8 45.0
18:2c 11.6 9.8 21.5 5.9 9.1 11.8 13.3 18.0
18:3c 0.9 0.7 1.7 0.5 0.7 0.9 1.1 1.4
Females aged 12–19 years
Participants (n) 2,263 473 443 445 453 449
IQR 0–2.59 2.59–4.24 4.24–6.06 6.06–8.94 8.94–36.39
Total trans fatty acids 6.1 5.2 11.7 1.5 3.4 5.2 7.4 12.7
Energy (kcal)c 1,987 1,882 3,095 1,268 1,692 1,910 2,293 2,761
Total fat 71.5 65.7 119.4 36.6 55.4 67.6 86.6 110.8
SFA (14:0, 16:0, 18:0) 21.7 19.6 38.4 11.4 17.7 20.7 26.5 32.1
14:0 2.2 1.8 4.5 1.2 1.9 2.2 2.8 2.9
16:0 13.0 11.7 22.9 7.0 10.6 12.4 15.7 18.9
934 Lipids (2012) 47:931–940
123

Fig. 1 Dietary TFA (g/day) in
all demographic groups by
quintile of intake
Table 1 continued
Population, energy, and nutrient Mean Median 90th percentile Q1b Q2 Q3 Q4 Q5
18:0 6.6 6.0 11.6 3.2 5.1 6.1 8.0 10.2
18:1c 21.1 19.2 35.5 11.1 16.2 19.8 25.1 33.0
18:2c 9.3 7.5 18.4 5.3 7.1 8.8 11.0 14.2
18:3c 0.8 0.6 1.5 0.5 0.6 0.8 0.8 1.1
Males aged C20 years
Participants (n) 4,236 967 963 878 753 675
IQR 0–2.75 2.75–4.64 4.64–7.01 7.01–10.20 10.20–59.78
Total trans fatty acids 6.8 5.6 13.1 1.7 3.7 5.7 8.3 14.7
Energy (kcal)c 2,596 2,440 3,959 1,772 2,178 2,505 2,874 3,647
Total fat 95.8 86.7 161.4 51.6 74.1 91.5 109.2 152.6
SFA (14:0, 16:0, 18:0) 28.0 25.0 50.0 14.4 21.8 27.6 32.2 44.2
14:0 2.6 2.1 5.3 1.3 2.1 2.7 3.0 3.9
16:0 16.9 15.0 29.8 8.9 13.2 16.6 19.4 26.3
18:0 8.5 7.5 15.1 4.1 6.4 8.3 9.8 14.0
18:1c 28.8 25.9 49.9 15.6 21.9 27.5 32.9 45.8
18:2c 12.3 10.2 23.4 6.7 9.2 11.5 14.4 19.4
18:3c 1.1 0.8 2.2 0.7 0.8 1.0 1.2 1.6
Females aged C20 years
Participants (n) 4,760 1,039 1,007 953 873 888
IQR 0–2.15 2.15–3.62 3.62–5.25 5.25–7.56 7.56–35.0
Total trans fatty acids 5.2 4.4 9.8 1.3 2.9 4.4 6.3 10.9
Energy (kcal)c 1,838 1,736 2,830 1,243 1,590 1,768 2,010 2,579
Total fat 68.4 61.8 116.2 37.8 53.8 65.6 78.3 106.4
SFA (14:0, 16:0, 18:0) 19.5 17.4 34.6 10.3 15.7 18.9 22.6 30.0
14:0 1.9 1.5 3.8 1.0 1.6 1.8 2.2 2.6
16:0 11.7 10.5 20.9 6.3 9.5 11.4 13.5 17.9
18:0 5.9 5.3 10.4 2.9 4.6 5.7 6.8 9.6
18:1c 20.1 18.0 34.8 11.0 15.5 19.2 22.8 31.7
18:2c 9.4 7.7 18.0 5.3 7.1 9.1 10.8 14.6
18:3c 0.8 0.6 1.7 0.5 0.7 0.8 0.9 1.2
a Per capita estimates are based on food consumption data for all individuals who responded during the one NHANES survey day. This analysis
includes all foods in the diet. Conducted in FARE version 7.997b Quintiles calculated based upon per capita total trans fatty acid consumption. Number of participants indicates the unweighted sample size,
interquintile range (IQR) indicates cutoff values of trans fat intake, and mean intake values are reported within each quintilec Energy units are kcal/day
Lipids (2012) 47:931–940 935
123
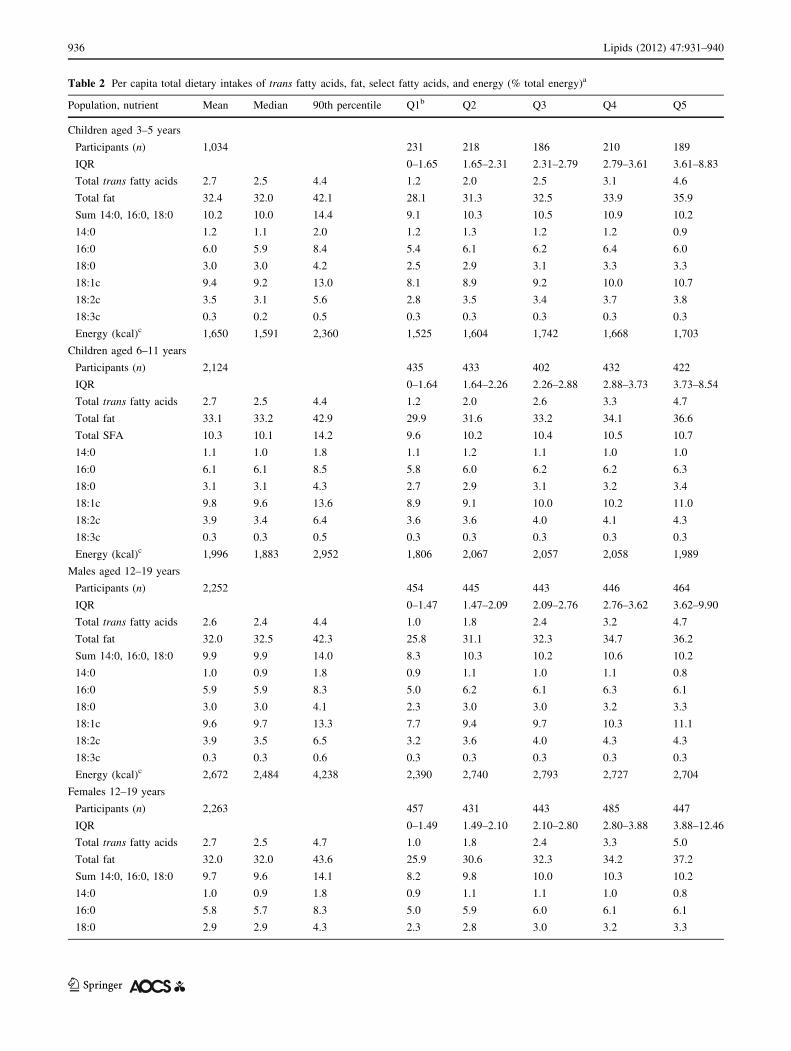
Table 2 Per capita total dietary intakes of trans fatty acids, fat, select fatty acids, and energy (% total energy)a
Population, nutrient Mean Median 90th percentile Q1b Q2 Q3 Q4 Q5
Children aged 3–5 years
Participants (n) 1,034 231 218 186 210 189
IQR 0–1.65 1.65–2.31 2.31–2.79 2.79–3.61 3.61–8.83
Total trans fatty acids 2.7 2.5 4.4 1.2 2.0 2.5 3.1 4.6
Total fat 32.4 32.0 42.1 28.1 31.3 32.5 33.9 35.9
Sum 14:0, 16:0, 18:0 10.2 10.0 14.4 9.1 10.3 10.5 10.9 10.2
14:0 1.2 1.1 2.0 1.2 1.3 1.2 1.2 0.9
16:0 6.0 5.9 8.4 5.4 6.1 6.2 6.4 6.0
18:0 3.0 3.0 4.2 2.5 2.9 3.1 3.3 3.3
18:1c 9.4 9.2 13.0 8.1 8.9 9.2 10.0 10.7
18:2c 3.5 3.1 5.6 2.8 3.5 3.4 3.7 3.8
18:3c 0.3 0.2 0.5 0.3 0.3 0.3 0.3 0.3
Energy (kcal)c 1,650 1,591 2,360 1,525 1,604 1,742 1,668 1,703
Children aged 6–11 years
Participants (n) 2,124 435 433 402 432 422
IQR 0–1.64 1.64–2.26 2.26–2.88 2.88–3.73 3.73–8.54
Total trans fatty acids 2.7 2.5 4.4 1.2 2.0 2.6 3.3 4.7
Total fat 33.1 33.2 42.9 29.9 31.6 33.2 34.1 36.6
Total SFA 10.3 10.1 14.2 9.6 10.2 10.4 10.5 10.7
14:0 1.1 1.0 1.8 1.1 1.2 1.1 1.0 1.0
16:0 6.1 6.1 8.5 5.8 6.0 6.2 6.2 6.3
18:0 3.1 3.1 4.3 2.7 2.9 3.1 3.2 3.4
18:1c 9.8 9.6 13.6 8.9 9.1 10.0 10.2 11.0
18:2c 3.9 3.4 6.4 3.6 3.6 4.0 4.1 4.3
18:3c 0.3 0.3 0.5 0.3 0.3 0.3 0.3 0.3
Energy (kcal)c 1,996 1,883 2,952 1,806 2,067 2,057 2,058 1,989
Males aged 12–19 years
Participants (n) 2,252 454 445 443 446 464
IQR 0–1.47 1.47–2.09 2.09–2.76 2.76–3.62 3.62–9.90
Total trans fatty acids 2.6 2.4 4.4 1.0 1.8 2.4 3.2 4.7
Total fat 32.0 32.5 42.3 25.8 31.1 32.3 34.7 36.2
Sum 14:0, 16:0, 18:0 9.9 9.9 14.0 8.3 10.3 10.2 10.6 10.2
14:0 1.0 0.9 1.8 0.9 1.1 1.0 1.1 0.8
16:0 5.9 5.9 8.3 5.0 6.2 6.1 6.3 6.1
18:0 3.0 3.0 4.1 2.3 3.0 3.0 3.2 3.3
18:1c 9.6 9.7 13.3 7.7 9.4 9.7 10.3 11.1
18:2c 3.9 3.5 6.5 3.2 3.6 4.0 4.3 4.3
18:3c 0.3 0.3 0.6 0.3 0.3 0.3 0.3 0.3
Energy (kcal)c 2,672 2,484 4,238 2,390 2,740 2,793 2,727 2,704
Females 12–19 years
Participants (n) 2,263 457 431 443 485 447
IQR 0–1.49 1.49–2.10 2.10–2.80 2.80–3.88 3.88–12.46
Total trans fatty acids 2.7 2.5 4.7 1.0 1.8 2.4 3.3 5.0
Total fat 32.0 32.0 43.6 25.9 30.6 32.3 34.2 37.2
Sum 14:0, 16:0, 18:0 9.7 9.6 14.1 8.2 9.8 10.0 10.3 10.2
14:0 1.0 0.9 1.8 0.9 1.1 1.1 1.0 0.8
16:0 5.8 5.7 8.3 5.0 5.9 6.0 6.1 6.1
18:0 2.9 2.9 4.3 2.3 2.8 3.0 3.2 3.3
936 Lipids (2012) 47:931–940
123

grams-per-day basis, as well as a percentage-of-energy
basis in quintile 5. Variation was greatest in males aged
12–19 years, with intake that varied from 12 to 92 g/day in
quintile 5. Collectively, these data illustrate that some
individuals consume large quantities of TFA (in quintile 5),
whereas there are others who eat little TFA (in quintile 1).
Interestingly, as TFA intakes increased across quintiles,
energy, total fat, and SFA intakes also increased in all
populations. However, there were important differences in
the magnitude of increases for each of these dietary con-
stituents. Although there were noticeable increases in total
fat and SFA intake across quintiles, as well as somewhat
modest increases in energy intake across quintiles (spe-
cifically for the fatty acid data presented as percentages of
energy in Table 2), the proportional increase in TFA was
dramatically greater.
Collectively, our results indicate a change in dietary
patterns across quintiles. Specifically, TFA-containing
foods were either added to the diet or substituted for non-
TFA-containing foods. Given that the proportional increase
in dietary TFA was greater than the increase in energy, it
seems that substitution of TFA-containing foods was more
common. Thus, a high TFA intake reflects a different
dietary pattern compared with a lower TFA intake. In fact,
Table 2 continued
Population, nutrient Mean Median 90th percentile Q1b Q2 Q3 Q4 Q5
18:1c 9.5 9.4 13.3 7.7 9.0 9.3 10.2 11.2
18:2c 4.2 3.6 7.0 3.7 4.0 4.1 4.5 4.7
18:3c 0.3 0.3 0.6 0.3 0.3 0.3 0.3 0.4
Energy (kcal)c 1,987 1,882 3,095 1,746 1,952 2,099 2,095 2,045
Males aged C20 years
Participants (n) 4,236 837 918 864 825 792
IQR 0–1.21 1.21–1.82 1.82–2.46 2.46–3.37 3.37–10.51
Total trans fatty acids 2.3 2.1 4.1 0.8 1.5 2.1 2.9 4.4
Total fat 32.8 32.7 45.0 26.2 31.31 33.19 35.1 38.1
Sum 14:0, 16:0, 18:0 9.5 9.5 14.1 7.3 9.4 10.0 10.3 10.6
14:0 0.9 0.8 1.6 0.7 0.9 1.0 0.9 0.8
16:0 5.8 5.8 8.4 4.5 5.7 6.0 6.2 6.3
18:0 2.9 2.9 4.3 2.1 2.8 3.0 3.2 3.5
18:1c 9.9 9.7 14.3 7.9 9.5 10.0 10.6 11.6
18:2c 4.3 3.7 7.2 3.5 3.9 4.2 4.5 5.1
18:3c 0.4 0.3 0.7 0.3 0.4 0.4 0.4 0.4
Energy (kcal)c 2,596 2,440 3,959 2,416 2,605 2,603 2,772 2,583
Females aged C20 years
Participants (n) 4,760 962 1,013 968 926 891
IQR 0–1.31 1.31–1.98 1.98–2.66 2.66–3.52 3.52–10.00
Total trans fatty acids 2.5 2.3 4.3 0.9 1.7 2.3 3.0 4.5
Total fat 33.0 33.0 45.5 26.6 31.8 33.2 35.4 38.2
Sum 14:0, 16:0, 18:0 9.4 9.2 14.1 7.3 9.3 9.8 10.2 10.4
14:0 0.9 0.8 1.7 0.7 1.0 1.0 1.0 0.8
16:0 5.7 5.5 8.4 4.5 5.6 5.9 6.1 6.2
18:0 2.8 2.8 4.2 2.1 2.7 2.9 3.1 3.4
18:1c 9.7 9.6 14.1 7.7 9.2 9.8 10.4 11.5
18:2c 4.6 4.0 8.2 3.6 4.3 4.5 5.1 5.3
18:3c 0.4 0.3 0.8 0.4 0.4 0.4 0.4 0.4
Energy (kcal)c 1,838 1,736 2,830 1,679 1,816 1,893 1,918 1,886
a Per capita estimates are based on food consumption data for all individuals who responded during the one NHANES survey day, whether they
reported eating the food(s) or ingredient(s) of interest. Percentage of energy for total fat and the individual fatty acids should be determined per
individual and grouped within quintiles based on trans intake as %en. Conducted in FARE version 7.99b Quintiles calculated based upon % energy from total trans fatty acid consumption. Interquintile range (IQR) indicates cutoff values of trans fat
intake, and mean intake values are reported within each quintilec Energy units are kcal/day. The values for each quintile are the mean kcal/day consumed by the participants who consumed the amount trans fat
as a % of energy listed in the interquintile range
Lipids (2012) 47:931–940 937
123

starting with quintile 2, it appears that the dietary patterns
are shifting because of increases in the proportions of TFA,
SFA, and total fat (as a percentage of energy) relative to the
increase in energy intake. However, although all popula-
tion groups showed similar changes in fatty acids and
energy across quintiles, it can be concluded that dietary
patterns within a quintile are likely comparable among the
different population groups.
It is telling that the results of this study show that the
population evaluated in 1999–2002 consumed similar
amounts of TFA compared to the U.S. population surveyed
in 1989–1991 [11]. In fact, the mean and median TFA
intakes are similar in both studies. However, what is striking
between the two studies is the increase in TFA intake in the
90th percentile. As Table 4 shows, there were approxi-
mately 20 and 27 % higher TFA intakes in men and women,
respectively, in the 1999–2002 database versus the earlier
survey. Collectively, this finding suggests that there is a
relatively large cohort of individuals in the population who
have made changes in their diet in a manner that is incon-
gruent with current dietary recommendations. It is important
to appreciate that the large gap between the 99.9th and 100th
percentiles of TFA intake (34 vs. 92 g/day) most likely
represents only a very small group of high-TFA consumers,
which would be expected to slightly skew the results for this
cohort. Nonetheless, these findings indicate that there are
individuals who follow extreme dietary practices, putting
them at high risk for chronic disease and malnutrition.
Fig. 2 Fatty acid intake (% of
calories) by demographic group.
SFA saturated fatty acid, LAlinoleic acid, ALA alpha-
linolenic acid, TFA trans fatty
acid
Fig. 3 Contribution of 25 food
categories to dietary TFA. The
Y axis represents the percentage
of total TFA contributed by the
respective food category
938 Lipids (2012) 47:931–940
123
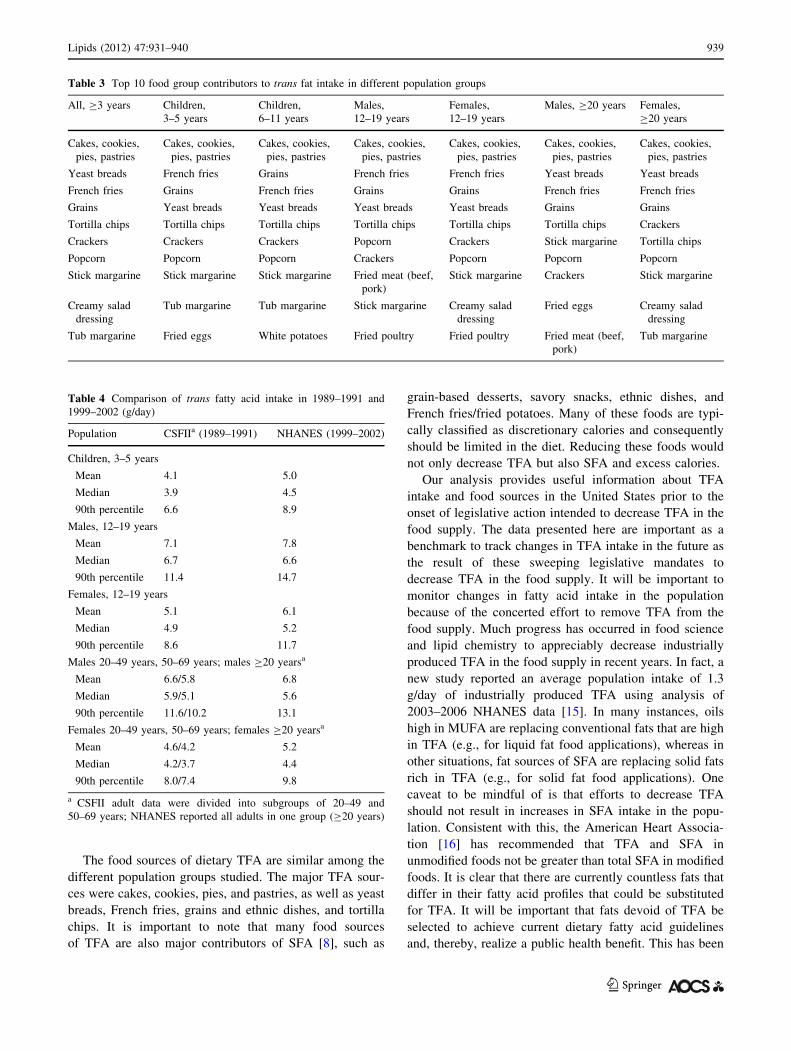
The food sources of dietary TFA are similar among the
different population groups studied. The major TFA sour-
ces were cakes, cookies, pies, and pastries, as well as yeast
breads, French fries, grains and ethnic dishes, and tortilla
chips. It is important to note that many food sources
of TFA are also major contributors of SFA [8], such as
grain-based desserts, savory snacks, ethnic dishes, and
French fries/fried potatoes. Many of these foods are typi-
cally classified as discretionary calories and consequently
should be limited in the diet. Reducing these foods would
not only decrease TFA but also SFA and excess calories.
Our analysis provides useful information about TFA
intake and food sources in the United States prior to the
onset of legislative action intended to decrease TFA in the
food supply. The data presented here are important as a
benchmark to track changes in TFA intake in the future as
the result of these sweeping legislative mandates to
decrease TFA in the food supply. It will be important to
monitor changes in fatty acid intake in the population
because of the concerted effort to remove TFA from the
food supply. Much progress has occurred in food science
and lipid chemistry to appreciably decrease industrially
produced TFA in the food supply in recent years. In fact, a
new study reported an average population intake of 1.3
g/day of industrially produced TFA using analysis of
2003–2006 NHANES data [15]. In many instances, oils
high in MUFA are replacing conventional fats that are high
in TFA (e.g., for liquid fat food applications), whereas in
other situations, fat sources of SFA are replacing solid fats
rich in TFA (e.g., for solid fat food applications). One
caveat to be mindful of is that efforts to decrease TFA
should not result in increases in SFA intake in the popu-
lation. Consistent with this, the American Heart Associa-
tion [16] has recommended that TFA and SFA in
unmodified foods not be greater than total SFA in modified
foods. It is clear that there are currently countless fats that
differ in their fatty acid profiles that could be substituted
for TFA. It will be important that fats devoid of TFA be
selected to achieve current dietary fatty acid guidelines
and, thereby, realize a public health benefit. This has been
Table 3 Top 10 food group contributors to trans fat intake in different population groups
All, C3 years Children,
3–5 years
Children,
6–11 years
Males,
12–19 years
Females,
12–19 years
Males, C20 years Females,
C20 years
Cakes, cookies,
pies, pastries
Cakes, cookies,
pies, pastries
Cakes, cookies,
pies, pastries
Cakes, cookies,
pies, pastries
Cakes, cookies,
pies, pastries
Cakes, cookies,
pies, pastries
Cakes, cookies,
pies, pastries
Yeast breads French fries Grains French fries French fries Yeast breads Yeast breads
French fries Grains French fries Grains Grains French fries French fries
Grains Yeast breads Yeast breads Yeast breads Yeast breads Grains Grains
Tortilla chips Tortilla chips Tortilla chips Tortilla chips Tortilla chips Tortilla chips Crackers
Crackers Crackers Crackers Popcorn Crackers Stick margarine Tortilla chips
Popcorn Popcorn Popcorn Crackers Popcorn Popcorn Popcorn
Stick margarine Stick margarine Stick margarine Fried meat (beef,
pork)
Stick margarine Crackers Stick margarine
Creamy salad
dressing
Tub margarine Tub margarine Stick margarine Creamy salad
dressing
Fried eggs Creamy salad
dressing
Tub margarine Fried eggs White potatoes Fried poultry Fried poultry Fried meat (beef,
pork)
Tub margarine
Table 4 Comparison of trans fatty acid intake in 1989–1991 and
1999–2002 (g/day)
Population CSFIIa (1989–1991) NHANES (1999–2002)
Children, 3–5 years
Mean 4.1 5.0
Median 3.9 4.5
90th percentile 6.6 8.9
Males, 12–19 years
Mean 7.1 7.8
Median 6.7 6.6
90th percentile 11.4 14.7
Females, 12–19 years
Mean 5.1 6.1
Median 4.9 5.2
90th percentile 8.6 11.7
Males 20–49 years, 50–69 years; males C20 yearsa
Mean 6.6/5.8 6.8
Median 5.9/5.1 5.6
90th percentile 11.6/10.2 13.1
Females 20–49 years, 50–69 years; females C20 yearsa
Mean 4.6/4.2 5.2
Median 4.2/3.7 4.4
90th percentile 8.0/7.4 9.8
a CSFII adult data were divided into subgroups of 20–49 and
50–69 years; NHANES reported all adults in one group (C20 years)
Lipids (2012) 47:931–940 939
123
reported in a recent modeling exercise by Lefevre et al.
[17]. The last point that must be emphasized is to
acknowledge that many of the foods that deliver industri-
ally produced TFA are ‘‘extras in the diet,’’ and even if
they are modified to have a fatty acid profile that is con-
sistent with current dietary recommendations, their intake
should be limited within the context of a healthy diet that
meets current food-based and nutrient recommendations.
Limiting intake of these fatty acid-modified foods will also
help control calories, which is a pressing societal need.
A limitation of this study is that the analysis of TFA
intake was based on NHANES 1999–2002 data. The TFA
data were derived from the 1995 Trans Fatty Acid Data-
base and the USDA Nutrient Database for Standard Ref-
erence (Release 15). Consequently, changes that were
made in foods in the marketplace (with respect to TFA
content) between 1993 (when the TFA analyses of foods
were completed) and 1999–2002 are not reflected in this
analysis. This is a well-recognized limitation of the avail-
able nutrient databases and underscores the importance of
continuously updating them. Another potential limitation is
the use of two 24-h recalls. According to Allison et al. [11],
3 days of intake data provide a better assessment of usual
intake. Moreover, the present study only evaluated indus-
trial TFA and not other sources of TFA, which could have
important health implications [18]. Despite these limita-
tions, however, this study provides useful information
about TFA intake in the population and important food
sources prior to collective efforts by the food industry to
decrease TFA in the food supply.
In summary, in all population groups studied, TFA intake
between 1999 and 2002 was 5.0–7.8 g/day (2.3–2.7 % of
energy). Much of the TFA consumed was derived from
energy-dense and nutrient-poor foods such as cakes, cook-
ies, pies, pastries, and savory snacks (i.e., chips). Strikingly,
there was a population, albeit small, with an extremely high
intake of TFA (males aged 12–19 years in the fifth quintile,
who consumed 11.8–92.4 g/day) as well as SFA (and also
energy). Obviously, this reflects very poor dietary practices.
In fact, as TFA intake increased in the population groups
studied, there was a trend toward poorer dietary practices.
Ongoing nutrition intervention efforts must be directed at
decreasing TFA and also promoting healthy dietary patterns.
Acknowledgments This research was funded by ILSI North
America.
Conflict of interest Penny Kris-Etherton, Michael Lefevre and
Ronald Mensink received financial support from ILSI North America
for disseminating the research findings.
Open Access This article is distributed under the terms of the
Creative Commons Attribution License which permits any use, dis-
tribution, and reproduction in any medium, provided the original
author(s) and the source are credited.
References
1. U.S. Department of Agriculture, U.S. Department of Health and
Human Services (2010) Dietary guidelines for Americans, 2010.
http://www.cnpp.usda.gov/DGAs2010-PolicyDocument.htm.
Accessed 28 July 2011
2. Food and Agriculture Organization of the United Nations (2010)
Fats and fatty acids in human nutrition: report of an expert con-
sultation. http://foris.fao.org/preview/25553-0ece4cb94ac52f9a25af
77ca5cfba7a8c.pdf. Accessed 28 July 2011
3. Mozaffarian D, Katan MB, Ascherio A, Stampfer MJ, Willett
WC (2006) Trans fatty acids and cardiovascular disease. N Engl J
Med 354:1601–1613
4. Micha R, Mozaffarian D (2008) Trans fatty acids: effects on
cardiometabolic health and implications for policy. Prostaglan-
dins Leukot Essent Fatty Acids 79:147–152
5. Remig V, Franklin B, Margolis S, Kostas G, Nece T, Street JC
(2010) Trans fats in America: a review of their use, consumption,
health implications, and regulation. J Am Diet Assoc 110:585–592
6. National Conference of State Legislatures (2009) Trans fat and
menu labeling legislation. http://www.ncsl.org/programs/health/
transfatmenulabelingbills.htm. Accessed 24 Jan 2011
7. Mozaffarian D, Stampfer MJ (2010) Removing industrial transfat from foods. BMJ 340:c1826
8. U.S. Department of Agriculture (June 15, 2010) Report of the
dietary guidelines Advisory Committee on the Dietary Guide-
lines for Americans, 2010. http://www.cnpp.usda.gov/DGAs2010-
DGACReport.htm. Accessed 24 Jan 2011
9. Tarrago-Trani MT, Phillips KM, Lemar LE, Holden JM (2006)
New and existing oils and fats used in products with reduced
trans-fatty acid content. J Am Diet Assoc 106:867–880
10. Crupkin M, Zambelli A (2008) Detrimental impact of trans fats
on human health: Stearic acid-rich fats as possible substitutes.
Comp Rev Food Sci Food Safety 7:271–279
11. Allison DB, Egan SK, Barraj LM, Caughman C, Infante M,
Heimbach JT (1999) Estimated intakes of trans fatty and other
fatty acids in the US population. J Am Diet Assoc 99:166–174
12. Eckel RH, Borra S, Lichtenstein AH, Yin-Piazza SY, Trans Fat
Conference Planning Group (2007) Understanding the complex-
ity of trans fatty acid reduction in the American diet: American
Heart Association Trans Fat Conference 2006: report of the Trans
Fat Conference Planning Group. Circulation 115:2231–2246
13. DiRienzo MA, Astwood JD, Petersen BJ, Smith KM (2006)
Effect of substitution of low linolenic acid soybean oil for
hydrogenated soybean oil on fatty acid intake. Lipids 41:149–157
14. Wright JD, Borrud LG, McDowell MA, Wan C-Y, Radimer K,
Johnson CL (2007) Nutrition assessment in the National Health
and Nutrition Examination Survey 1999–2002. J Am Diet Assoc
107:822–829
15. Doell D, Folmer D, Lee H, Honigfort M, Carberry S (2012)
Updated estimate of trans fat intake by the US population. Food
Addit Contam Part A Chem Anal Control Expo Risk Assess
29:861–874
16. American Heart Association (2008) Trans fat policy position
statement. http://www.heart.org/idc/groups/heart-public/@wcm/
@adv/documents/downloadable/ucm_301697.pdf. Accessed 2 Nov
2011
17. Lefevre M, Mensink RP, Kris-Etherton PM, Peterson B, Smith K,
Flickinger BD (2012) Estimated cardiovascular disease risk
reduction with alternatives to soybean oil containing trans fatty
acids. Lipids (in press)
18. Brouwer IA, Wanders AJ, Katan MB (2010) Effect of animal and
industrial trans fatty acids on HDL and LDL cholesterol levels in
humans—a quantitative review. PLoS One 5:e9434
940 Lipids (2012) 47:931–940
123
Related Documents