Training U.S.A.’s Next Generation Geostationary Weather Satellites GOES-R Data and Applications Amanda M. Terborg - Satellite Meteorologist NOAA AWC Michael Folmer – Satellite Liaison NOAA WPC/OPC/SAB/TAFB Andrea Schumcher – Satellite Liaison NOAA NHC William Line – Satellite Liaison NOAA SPC

Welcome message from author
This document is posted to help you gain knowledge. Please leave a comment to let me know what you think about it! Share it to your friends and learn new things together.
Transcript

Training U.S.A.’s Next Generation Geostationary Weather Satellites
GOES-R Data and Applications Amanda M. Terborg - Satellite Meteorologist NOAA AWC Michael Folmer – Satellite Liaison NOAA WPC/OPC/SAB/TAFB Andrea Schumcher – Satellite Liaison NOAA NHC William Line – Satellite Liaison NOAA SPC


Cloud Top Heights • Provides an estimate of the cloud tops • Can be used to identify convection and other types of cloud environments • Color scheme can be adjust to identify high or low cloud tops

Cloud Top Heights

Hurricane Intensity Estimates (HIE)
• Proxy for the GOES-R version of Advanced Dvorak Technique (ADT)
• Uses MSG SEVIRI and H8 AHI IR window channel
• Objective intensity estimates
9
Evaluation Summary:
Quicker refresh, faster identification of developing eye
Tendency towards overestimating vmax (compared to ADT), especially after peak
Testing in operational data stream
http://tropic.ssec.wisc.edu/real-time/adt/adt.html http://tropic.ssec.wisc.edu/real-time/adt/goesrAHI/adt-AHI.html
Presenter
Presentation Notes
Himawari version available:
Derived Stability Indicies • GOES-R derived CAPE, LI, Cloud Type, and Total Precipitable Water • Uses the GFS to fill in gaps where clouds prohibit indices from being derived from satellite only • Was used as a diagnostic tool in the pre-storm mesoscale discussion
GOES-R derived stability indices; CAPE (top left), Cloud Type (top right), Lifted Index (bottom left), and Total Precipitable Water (bottom right) used at the Hazardous Weather Testbed in Norman, OK
http://hwt.nssl.noaa.gov/ewp/internal/2016/Training/LAP2016/player.html
Presenter
Presentation Notes
The LAPS data showed increasing instability in the Sterling, VA area with CAPE values reaching 1000 J/kg, LI values reaching -5, and TPW in excess of 1.0”. Additionally, skies are mostly clear as noted in the Cloud Type parameter.

GOES-R Rainfall Rate Example • Two-day loop of GOES-R rainfall
rates (from current GOES) for Hurricane Sandy passing through the western Caribbean
• The new algorithm takes advantage of the additional GOES WV and IR channels, leading to improved skill, especially for warm-rain clouds.
• The finer spatial resolution of the ABI will enable the algorithm to more accurately capture the most intense rainfall which occurs at very small spatial scales.
11 Slide courtesy of S. Caufman

Total Precipitable Water • Layers derived from Total Precipitable Water
Layered PW four panel in AWIPS-2… layered PW (top left), 700-300mb PW (top right), 900mb PW (bottom left), and 900-700mb PW (bottom right) The low to mid level of the PW values show a well defined gradient for convective focus with the Layered PW depicting the tightest portion of the gradient in the dry line region
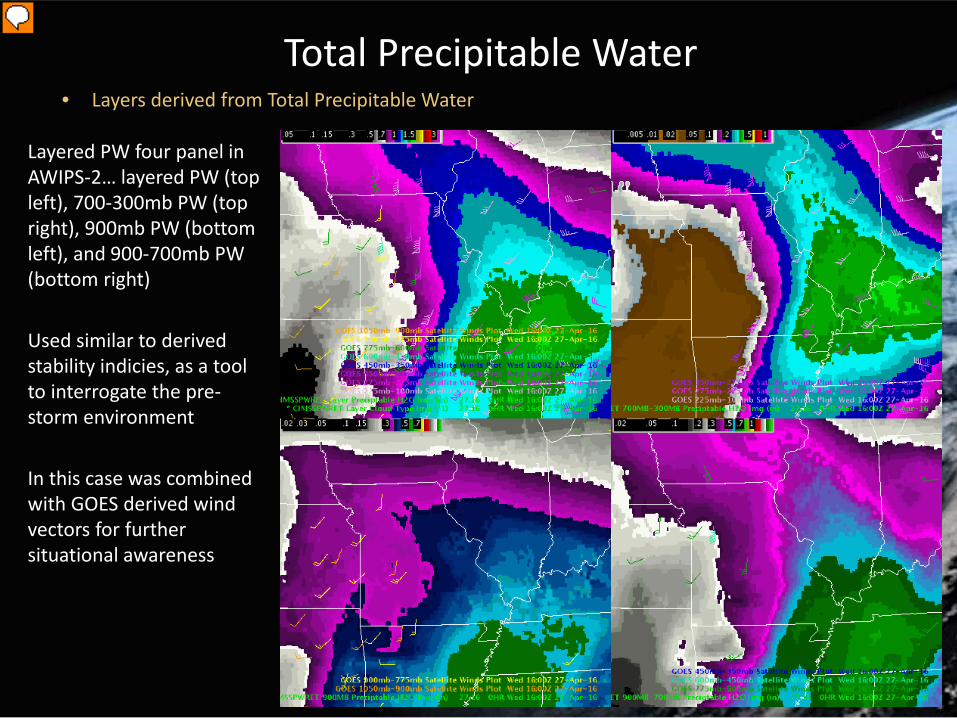
Total Precipitable Water • Layers derived from Total Precipitable Water
Layered PW four panel in
AWIPS-2… layered PW (top left), 700-300mb PW (top right), 900mb PW (bottom left), and 900-700mb PW (bottom right) Used similar to derived stability indicies, as a tool to interrogate the pre-storm environment In this case was combined with GOES derived wind vectors for further situational awareness
Presenter
Presentation Notes
Preciptiable water, when aligned with the low level wind field, confirmed positive moisture advection moving up the Mississippi River towards St. Louis. This would confirm concerns from SPC which issued a Tornado Watch extending into Western Illinois when conditions were still fairly stable at the time of the watch issuance. Also, earlier SPC helicities while low earlier had picked up by 19Z, and this low level shear can be confirmed easily in the 925 and 850mb layer plots by 19Z.
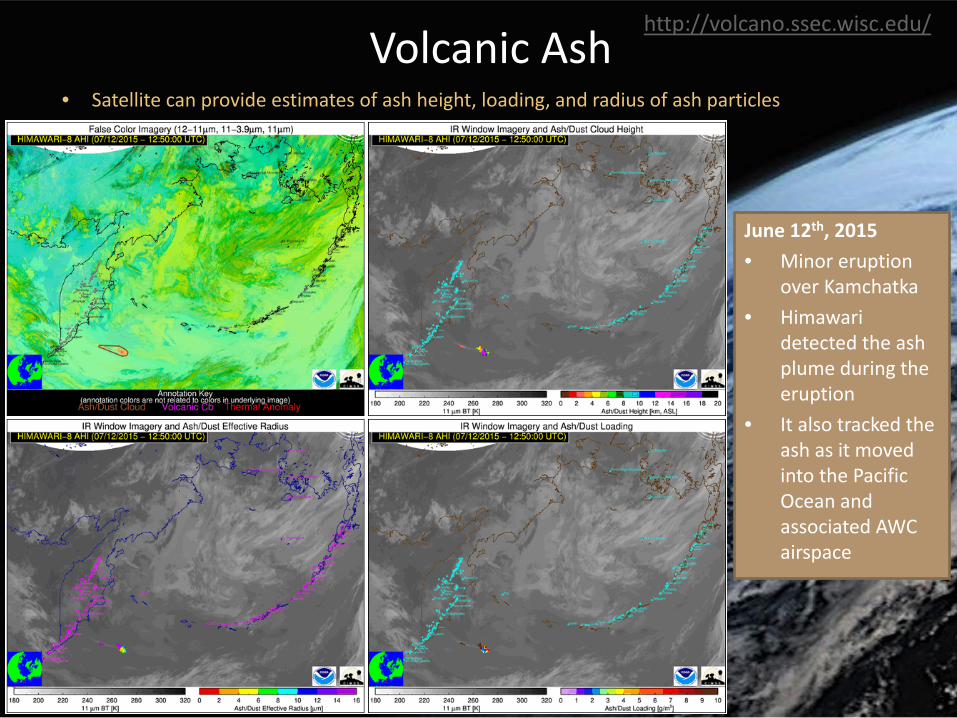
Volcanic Ash
• Satellite can provide estimates of ash height, loading, and radius of ash particles
June 12th, 2015 • Minor eruption
over Kamchatka • Himawari
detected the ash plume during the eruption
• It also tracked the ash as it moved into the Pacific Ocean and associated AWC airspace
http://volcano.ssec.wisc.edu/

GLM User Readiness South Carolina Historic Flooding
IR and 15-min Lightning Density - 10/03/15
16 Courtesy of MPS Slide courtesy of S. Caufman
Presenter
Presentation Notes
During the extreme heavy rainfall event that swamped North and South Carolinas, the Weather Prediction Center found the Global Lightning Dataset (GLD360) Lightning Density product (which is a proxy for the GLM) to be very useful in identifying areas of strong thunderstorms offshore that were moving towards the South Carolina coast. By monitoring the intensity of lightning, the forecaster could relate this to heavier rainfall moving over all ready saturated ground and therefore prompted the continuation of flood warnings. CURRENT SATELLITE IMAGERY AND LIGHTNING DATA SHOWS A PERSISTENT AREA OF CONVECTIVE REGENERATION JUST OFFSHORE OF CHARLESTON SC WITH AN INCREASE IN LIGHTNING ACTIVITY ACROSS THIS REGION. THE 07Z RAPID REFRESH (RAP) OBJECTIVE ANALYSIS INDICATED THIS CONTINUAL REGENERATION PROCESS IS OCCURRING IN THE PRESENCE OF MUCAPES ABOVE 3000 J/KG WITH 500 TO 1000 J/KG VALUES EXTENDING ALONG THE MOISTURE PLUME INTO UPSTATE SC. HOURLY RAINFALL RATES IN THE 1 TO 2 INCH RANGE ARE LIKELY ALONG THE COAST WITH SLIGHTLY LOWER RATES FARTHER INLAND WHERE THE INSTABILITY DECREASES. ~Rubin-Oster

Intense Offshore MCS in OPC Offshore Zones on 06/22/16

Pseudo Geostationary Lightning Mapper • Provides total lightning in the Lightning Mapper Array network areas across the U.S. • Is a first glimpse into the capabilities of the GLM on GOES-R • Has an 8km resolution with a 2-minut refresh rate
Gridded Psuedo Geostationary Lightning data from the Huntsville LMA in and around the Atlanta area as storms developed in late August of 2015

Super Rapid Scan Operations (SRSO) Cloud and Moisture Imagery
Flash flooding situational awareness
Overlaying lightning on visible imagery from G14
Reveals cloud patterns associated with persistent convective development along the coast

Cloud and Moisture Imagery
• Baseline product • 1-minute visible imagery • Proxy for increased
temporal resolution of GOES-R
20
Evaluation Summary:
First thought primary use would be outreach
Found useful for center-fixing disturbances and weak TCs, especially near sunrise
Still concern about creating longer loops needed to view mesoscale evolution
Suggested 2-3 minute resolution more than sufficient
Super Rapid Scan Operations (SRSO)

Super Rapid Scan Operations (SRSO) Cloud and Moisture Imagery
Turbulence situational awareness
Overlaying PIREP reports on visible imagery
Reveals turbulence cloud patterns, i.e. waves, not visible in the current temporal refresh

Super Rapid Scan Operations (SRSO) Cloud and Moisture Imagery
Convective situational awareness
Overlaying visible and IR 1-minute imagery from GOES-14
Additional situational awareness on the convective cloud environment

WV Imagery (6.9 μm) and turbulence forecasting
- AWC forecasters use Richardson
number, Divergence Tendency, and other model parameters to identify areas of possible clear air turbulence
- They also use WV imagery to identify features that can cause CAT, such as jets and breaking ridges
- Simulated satellite imagery from the WRF was explored as an underlay for the above mentioned model parameters to better pinpoint potential SIGMET areas (blue box)
Cloud and Moisture Imagery Simulated WV imagery from ABI

Cloud and Moisture Imagery Dec 13 06Z Himawari WV LL
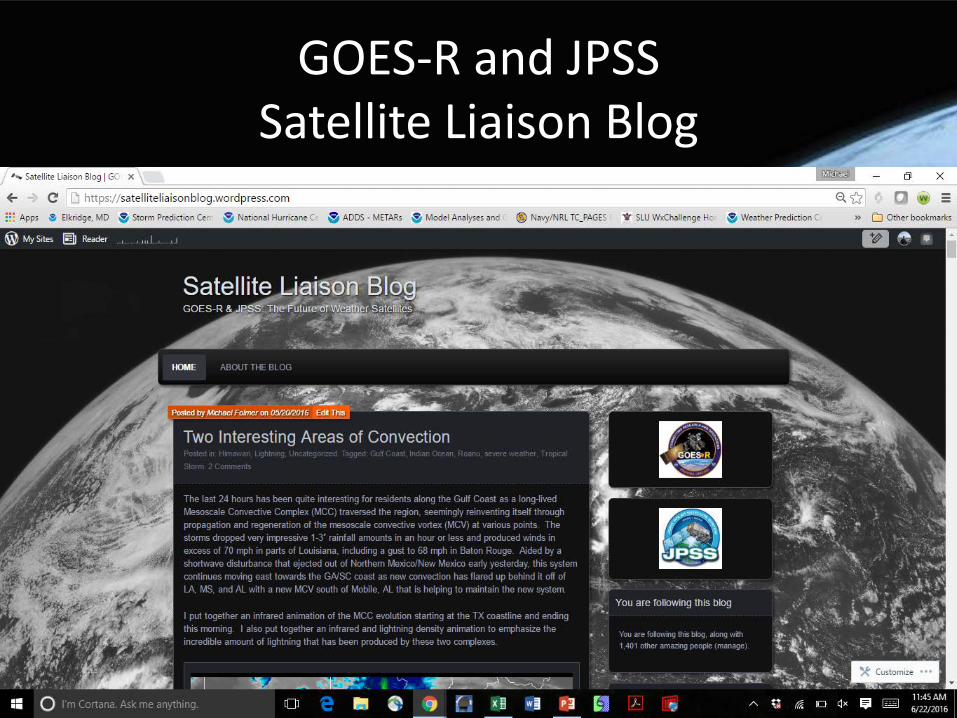
GOES-R and JPSS Satellite Liaison Blog

Comments? Concerns? Thoughts?
Questions? [email protected] [email protected] [email protected] [email protected]
Related Documents


![a,1 a arXiv:1112.1565v3 [gr-qc] 16 Aug 2013 · Geostationary 1 (GEO1), Geostationary 2 (GEO2) , and Geostationary 3 (GEO3). We note that the GEO1 configuration has a reduced sensitivity](https://static.cupdf.com/doc/110x72/5fbcdae52bef8c590a7980a3/a1-a-arxiv11121565v3-gr-qc-16-aug-2013-geostationary-1-geo1-geostationary.jpg)