Module 4 Monitoring, Data and Indicators Authors: Jaap van Woerden (UNEP/GRID-Geneva) Carissa Wieler (IISD) Edgar Gutierrez-Espeleta (University of Costa Rica) Richard Grosshans (IISD) Ahmed Abdelrehim (CEDARE) Purna Chandra Lall Rajbhandari (UNEP - RRC.AP /AIT)

Welcome message from author
This document is posted to help you gain knowledge. Please leave a comment to let me know what you think about it! Share it to your friends and learn new things together.
Transcript
Module 4Monitoring, Data and Indicators Authors:Jaap van Woerden (UNEP/GRID-Geneva)Carissa Wieler (IISD)Edgar Gutierrez-Espeleta (University of Costa Rica) Richard Grosshans (IISD)Ahmed Abdelrehim (CEDARE)Purna Chandra Lall Rajbhandari (UNEP - RRC.AP /AIT)
Localization:Asma Abulhussain (Arabian Gulf University)

p van Woerden (UNEP/GRID-Geneva)
Carissa Wieler (IISD)
Edgar Gutierrez-Espeleta (University of Costa Rica)
Richard Grosshans (IISD)
Ahmed Abdelrehim (CEDARE)
Purna Chandra Lall Rajbhandari (UNEP - RRC.AP /AIT)
Editorial Support:Mona Radwan, UNEPMayar Sabet, CEDARETarek Abdel Monem, CEDAREYusuf Emad, CEDARE
Translation Team:Yasmine ZakiRajia El Bialy
Monitoring, data and indicators Module 4
Table of ContentsList of Acronyms iii
Overview 1
Course Materials 3
1. Introduction and learning objectives 3
2. Developing data for integrated environmental assessment 3 2.1 Importance of process 6
3. Information systems 8 3.1 Data 83.1.1 Types of data 8 3.1.2 Qualitative data 8 3.2 Monitoring and data collection of environmental trends and conditions 22 3.3 Data compilation 24 3.4 GEO Data Portal 26
4. Indicators and indices 31 4.1 Indicators 31 4.2 Indices 44
5. Data analysis 52 5.1 Non-spatial analysis 52 5.2 Spatial analysis 58
References 65
Appendix A: Continuation of GEO Core Indicator Matrix 68
IEA Training Manual ii
Monitoring, data and indicators Module 4
List of AcronymsAFEAS Alternative Fluorocarbons Environmental Acceptability Study AQI Air Quality Index ASTER Advanced Spaceborne Thermal Emission and Reflection Radiometer BOD Biological Oxygen Demand CDIAC Carbon Dioxide Information Analysis Center CEDARE Centre for Environment and Development for Arab Region and Europe CEOS Committee on Earth Observation Satellites CFC Chlorofluorocarbon CIDCM SFTF Center for International Development and Conflict Management (CIDCM)
State Failure Task Force (SFTF) CIESIN ENTRI Center for International Earth Science Information Network –
Environmental Treaties and Resource Indicators CITES Convention on International Trade in Endangered Species of Wild Flora
and Fauna CLRTAP Convention on Long-range Transboundary Air Pollution CRED Center for Research on the Epidemiology of Disasters CRU Climate Research Unit, School of Environmental Sciences, United Kingdom DALYs Disability-Adjusted Life Years DEIA Division of Environmental Information and Assessment DO Dissolved Oxygen DPSIR Drivers – Pressure – State – Impacts – Responses DSR Driving – State – Response EC-JRC European Commission Joint Research Centre EDGAR Electronic Data Gathering, Analysis, and Retrieval system, USGS EEA European Environmental Agency EEZ Exclusive Economic Zone EIONET European Environment and Observation Network UN EIP UN Economic Impact of Peacekeeping EM-DAT Emergency Disasters Data Base, OFDA and CRED ERS European Remote Sensing Satellites FAO Food and Agriculture Organization of the United Nations FRA Global Forest Resources Assessment, FAO G3OS The Three Global Observing Systems (GCOS, GOOS, GTOS) GCOS Global Climate Observing System GDP Gross Domestic Product GEIA Global Emissions Inventory Activity GEM Gender Empowerment Measure GEMS-Water Global Environment Monitoring Systems – Water GEMStat Global Environmental Monitoring Systems – Global Water Quality Database GEO Global Environment Outlook GEO DWG GEO Data Working Group GEOSS Global Earth Observation System of Systems GDI Gender-related Development Index
IEA Training Manual iii
Monitoring, data and indicators Module 4GGIS Global Groundwater Information System GIS Global Information System GLASOD Global Assessment of Human Induced Soil Degradation GMET General Multilingual Environmental Thesaurus GNP Gross National Product GOOS Global Ocean Observing System GRDC Global Runoff Data Centre GTOS Global Terrestrial Observing System HCFC Hydrochlorofluorocarbon HDI Human Development Index HPI Human Poverty Index ICLARM International Center for Living Aquatic Resources Management IEA Integrated Environmental Assessment IFA International Fertilizer Industry Association IGBP International Geosphere-Biosphere Programme IGOS Integrated Global Observing Strategy IGRAC International Groundwater Resources Assessment Centre ILAC Latin America and Caribbean Initiative for Sustainable Development ILO International Labour Organization IMO International Maritime Organization IMS Institute of Mathematical Sciences IISD International Institute for Sustainable Development IPCC Intergovernmental Panel on Climate Change IRS Indian Remote Sensing Satellite ISRIC International Soil and Reference Information Centre IUCN International Union for the Conservation of Nature and Natural Resources –
The World Conservation Union LME Large Marine Ecosystem MA Millennium Ecosystem Assessment MEA Multilateral Environmental Agreement NAFTA North American Free Trade Agreement NOAA National Atmospheric and Oceanic Administration NOx Nitrogen Oxides ODA Official Development Assistance and Aid OECD Organisation for Economic Co-operation and Development OFDA Office of US Foreign Disaster Assistance PCB Polychlorinated Biphenyl PM Particulate Matter PPP Purchasing Power Parity RCMRD Regional Center for Mapping of Resources for Development RIVM Rijksinstituut voor Volksgezondheid en Milieu (National Institute for Public
Health and the Environment, Netherlands) RS Remote Sensing SEEA System of Integrated Environmental and Economic Accounting SoE State of the Environment
IEA Training Manual iv
Monitoring, data and indicators Module 4SOFO State of the World’s Forests SO2 Sulphur dioxide TDS Total Dissolved Solids TSS Total Suspended Solids UBC University of British Columbia UN COMTRADE United Nations Commodity Trade Statistics Database UN CSD UN Commission on Sustainable Development UN DSD UN Division for Sustainable Development UN MDG UN Millennium Development Goals UNDP UN Development Programme UNEP UN Environment Programme UNEP/GRID UNEP Global Resource Information Database UNEP GPA UNEP Global Programme of Action UNEP RRC.AP UNEP Regional Resource Centre for Asia and the Pacific UNESCO UN Educational, Scientific and Cultural Organization UNESCWA UN Economic and Social Commission for Western Asia ,UNFCCC UN Framework Convention on Climate Change UNH University of New Hampshire UN-ISDR UN International Strategy for Disaster Reduction UN-OCHA UN Office for the Coordination of Humanitarian Affairs UNOOSA UN Office for Outer Space Affairs UNSD UN Statistics Division USGS United States Geological Survey USGS EDC USGS Earth Resources Observation Systems (EROS) Data Center (EDC) USGS GLCC USGS Global Land Cover Characterization UV-B Ultraviolet radiation-B WCMC World Conservation Monitoring Centre WHO World Health Organization
IEA Training Manual v
OverviewA steady increase in reporting on environmental trends and performance during the past decade reflects a broad societal need for strengthening the evidence base for policymaking. We also see a growth in systems for collecting and analysing data about the environment and human well-being at local, national, sub-regional, regional and global levels. Interest in fine tuning monitoring and data collection systems to reflect the real needs of society and decision-makers is now part of the mainstream.
At some point during the process of developing your integrated environmental assessment (IEA), you will need to collect, process and analyze data. As you begin, you will need to know essentials about data collection including selecting the most appropriate and reliable types and sources of data and how to collect, store and analyze your data. This module addresses these issues, with particular focus on statistics and spatial data collection, analysis and the use of tools such as the GEO Data Portal and regional data portals to support IEA.
With data in hand, the next step will be to convert the data into a meaningful form that can be used during decision making processes. Indicators and indices help us package data into a form that speaks to a relevant policy issue. You will learn the basic building blocks of indicators and indices, including frameworks, selection criteria, and elements of a participatory indicator selection process. The module outlines these elements, and includes examples of indicators, including the GEO core indicator set.
Once you have developed indicators, you will need to derive meaning from them. What trends, correlations, or spatial relationships are revealed through the data? To answer these questions, you will need familiarity with various non-spatial and spatial analysis techniques.
A common theme running through this module is the importance of participatory processes. Understanding which stakeholders and experts need to be involved in the process, and when and how is essential because what we choose to measure reflects our values. A participatory process also provides an opportunity for change, as society seeks to improve what gets measured.
A second theme is the importance of reliable data and well-chosen indicators. This is critical to the process, because poor information can lead to poor decisions. At the same time, information needs to speak to the intended audience in a relevant way; otherwise, the most well-developed indicators could have limited impact.
Through a series of presentations, examples and exercises, this module will provide you with a number of tools and techniques necessary to complete the data collection and indicator development aspects for an IEA.
1IEA Training Manual
Monitoring, data and indicators Module 4
Notes............................................................................................................................................................................................................................................................................................................................................................................................................................................................................................................................................................................................................................................................................................................................................................................................................................................................................................................................................................................................................................................................................................................................................................................................................................................................................................................................................................................................................................................................................................................................................................................................................................................................................................................................................................................................................................................................................................................................................................................................................................................................................................................................................................................................................................................................................................................................................................................................................................................................................................................................................................................................................................................................................................................................................................................................................................................................................................................................................................................................................................................................................................................................................................................................................................................................................................................................................................................................................................................................................................................................................................................................................................................................................................................................................................................................................................................................................................................................................................................................................................................................................................................................................................................................................................................................................................................................................................................................................................................................................................................................................................................................................................................................................................................................................................................................................................................................................................................................................................................................................................................................................................................................................................................................................................................................................................................................................................................................................................................................................................................................................................................................................................................................................................................................................................................................................................................................................................................................................................................................................................................................................................................................................................................................................................................................................................................................................................................................................................................................................................................................................................................................................................................................................................................................................................................................................................................................................................................................................................................................................................................................................................................................................................................................................................................................................................................................................................................................................................................................................................................................................................................................................................................................................................................................................................................................................................................................................................................................................................................................................................................................................................................................................................................................................................................................................................................................................................................................................................................................................................................................................................................................................................................................................................................................................................................................................................................................................................................................................................................................................................................................................................................................................................................................................................................................................................................................................................................................................................................................................................................................................................................................................................................................................................................................................................................................................................................................................................................................................................................................................................................................................................................................................................................................................................................................................................................................................................................................................................................................................................................................................................................................................................................................................................................................................................................................................................................................................................................................................................................................................................................................................................................................................................................................................................................................................................................................................................................................................................................................................................................................................................................................................................................................................................................................................................................................................................................................................................................................................................................................................................................................................................................................................................................................................................................................................................................................................................................................................................................................................................................................................................................................................................................................................................................................................................................................................................................................
IEA Training Manual 2
Monitoring, data and indicators Module 4
Course Materials
1. Introduction and learning objectives Relevant and accessible information based on sound knowledge and facts is a cornerstone of integrated environmental assessment. Without a strong evidence base government, civil society and the public at large are not in a position to make informed decisions that take essential environmental and human well-being issues into account.
By the time you begin to develop data and indicators, you will likely have gone through the processes of planning the IEA, identifying lines of responsibility, clarifying key issues and identifying target audiences. Data development is an integral part of the implementation of integrated environmental assessment.
This training module is a practical guide to information tools, with emphasis on monitoring, data and indicators. Key concepts, techniques, benefits and constraints are explored in areas of monitoring, data collections, indicator and indices and analysis, through readings, exercises and examples.
At the end of this course you will:
understand the roles and uses of data, indicators and indices in integrated environmental assessment;
know how to develop strategies for collecting and validating data; understand how indicators and indices are developed and used; be able to analyze indicators and indices based on outcomes; and be able to communicate and present statistical and map-based data visually.
2. Developing data for integrated environmental assessment Knowledge gained from data is fundamental to our understanding of environmental issues, as well as for communicating information to policy-makers and other groups in society. In the context of management, what gets measured gets addressed. The flow of data in the IEA process as a means to influence decision making is shown in Figure 1. Given that data have an important role in decision making, it is critical that the data and indicators you use and develop are reliable and scientifically sound, relevant to your audiences and easily understood.
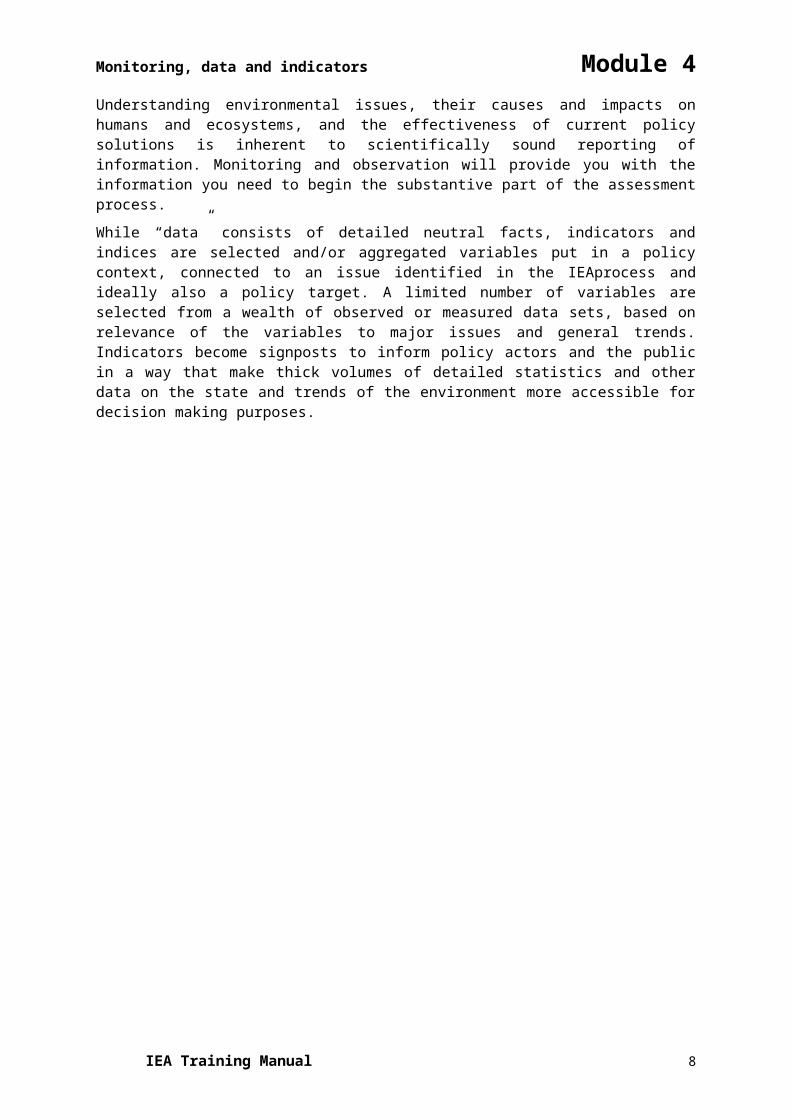
Understanding environmental issues, their causes and impacts on humans and ecosystems, and the effectiveness of current policy solutions is inherent to scientifically sound reporting of information. Monitoring and observation will provide you with the information you need to begin the substantive part of the assessment process.
While “data” consists of detailed neutral facts, indicators and indices are selected and/or aggregated variables put in a policy context, connected to an issue identified in the IEAprocess and ideally also a policy target. A limited number of variables are selected from a wealth of observed or measured data sets, based on relevance of the variables to major issues and general trends. Indicators become signposts to inform policy actors and the public in a way that make thick volumes of detailed statistics and other data on the state and trends of the environment more accessible for decision making purposes.
IEA Training Manual 3
Monitoring, data and indicators Module 4
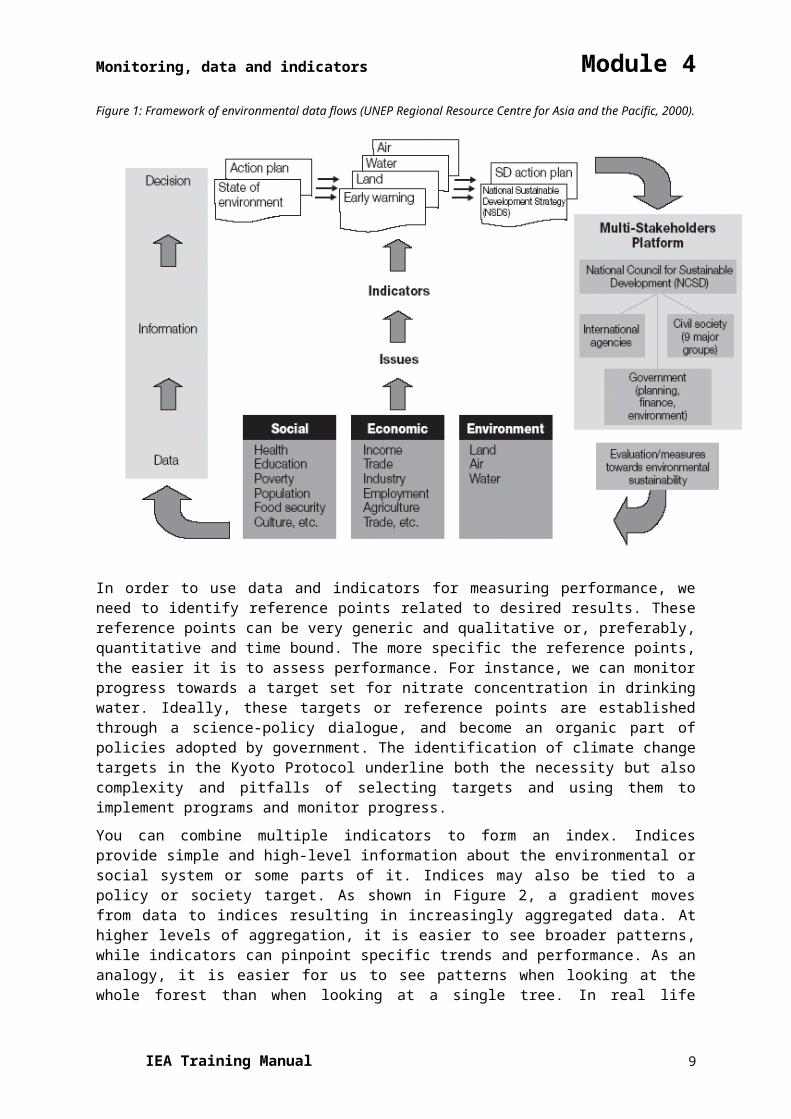
Figure 1: Framework of environmental data flows (UNEP Regional Resource Centre for Asia and the Pacific, 2000).
In order to use data and indicators for measuring performance, we need to identify reference points related to desired results. These reference points can be very generic and qualitative or, preferably, quantitative and time bound. The more specific the reference points, the easier it is to assess performance. For instance, we can monitor progress towards a target set for nitrate concentration in drinking water. Ideally, these targets or reference points are established through a science-policy dialogue, and become an organic part of policies adopted by government. The identification of climate change targets in the Kyoto Protocol underline both the necessity but also complexity and pitfalls of selecting targets and using them to implement programs and monitor progress.
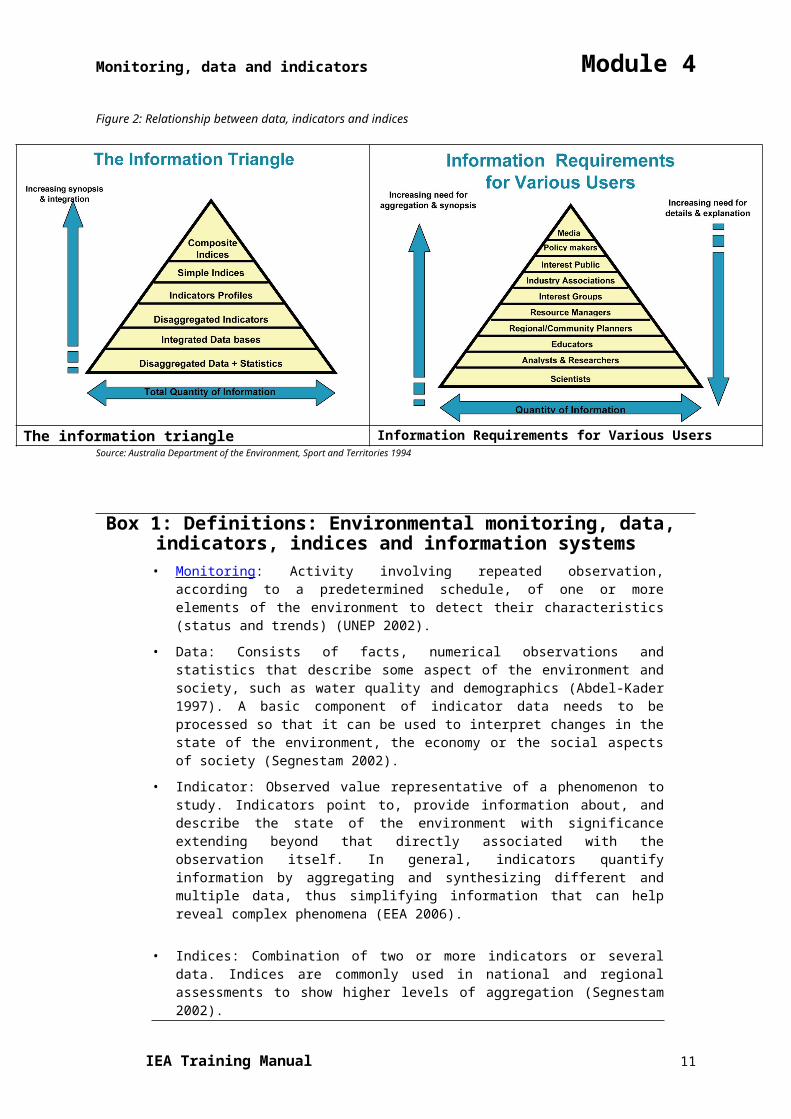
You can combine multiple indicators to form an index. Indices provide simple and high-level information about the environmental or social system or some parts of it. Indices may also be tied to a policy or society target. As shown in Figure 2, a gradient moves from data to indices resulting in increasingly aggregated data. At higher levels of aggregation, it is easier to see broader patterns, while indicators can pinpoint specific trends and performance. As an analogy, it is easier for us to see patterns when looking at the whole forest than when looking at a single tree. In real life indicators and indices are often used side by side and can form an integrated information system.
IEA Training Manual 4
Monitoring, data and indicators Module 4
Figure 2: Relationship between data, indicators and indices
The information triangle Information Requirements for Various UsersSource: Australia Department of the Environment, Sport and Territories 1994
Box 1: Definitions: Environmental monitoring, data, indicators, indices and information systems
• Monitoring: Activity involving repeated observation, according to a predetermined schedule, of one or more elements of the environment to detect their characteristics (status and trends) (UNEP 2002).
• Data: Consists of facts, numerical observations and statistics that describe some aspect of the environment and society, such as water quality and demographics (Abdel-Kader 1997). A basic component of indicator data needs to be processed so that it can be used to interpret changes in the state of the environment, the economy or the social aspects of society (Segnestam 2002).
• Indicator: Observed value representative of a phenomenon to study. Indicators point to, provide information about, and describe the state of the environment with significance extending beyond that directly associated with the observation itself. In general, indicators quantify information by aggregating and synthesizing different and multiple data, thus simplifying information that can help reveal complex phenomena (EEA 2006).
• Indices: Combination of two or more indicators or several data. Indices are commonly used in national and regional assessments to show higher levels of aggregation (Segnestam 2002).
• Information systems: Any coordinated assemblage of persons, devices and institutions used for communicating or exchanging knowledge or data, such as by simple verbal communication, or by completely computerized methods of storing, searching and retrieving information (GMET-MHD 2006?).
IEA Training Manual 5

Monitoring, data and indicators Module 4
2.1 Importance of process While data, indicators and indices have value in and of themselves, this value can be significantly strengthened by the process you use to develop them. A participatory approach can be used when developing an IEA in general, and its data and indicator components in particular. Involving experts and stakeholders in identifying issues, and developing and interpreting data or indicators not only strengthens their relevance, legitimacy and comprehensibility, but also the likelihood of their actual use in decision making.
The process of identifying issues for an IEA is discussed in Module 2. Briefly, a larger number of issues may come up during a stakeholder process. You might find it useful to use a set of criteria to narrow down the issues, using criteria such as the following:
Urgency and immediate impact Irreversibility Effects on human health Effects on economic productivity Number of people affected Loss of aesthetic values Impacts on cultural and historical heritages
Similar to the process of identifying and selecting key issues, obtaining and analysing data, developing indicators and indices involves making decisions about what to measure and include. Due to constraints in resources, not everything that we want to measure or analyze can be included in the assessment process. It is also inefficient to have so much information that the resulting analysis is too complex for anyone to use effectively. A participatory approach may help you narrow down the list of indicators by ensuring that the the ones selected are relevant, reliable and understandable. A participatory approach also engages people in the process, which can lead to shared responsibility for the state of our environment and society, leading to greater possibility for change. As outlined in Module 2, when developing a participatory approach, it is useful for us to consider who needs to be involved, and when and how to include them. Experts, stakeholders and policy-makers are general categories of critical actors in the process.
Box 2: Attributes of stakeholders and expertsStakeholders are individuals or groups that include governmental, non-governmental institutions, communities, universities and research institutions, development agencies and banks, donors and the business community. Stakeholders are presumed to have an interest in or have the potential to be impacted by a project, and therefore have a stake that may be direct or indirect at the household, community, local, regional, national or international levels (adapted from FAO 1998).
Stakeholders bring an understanding of what is relevant to society, and offer the “bigger picture” view of what is important. By including stakeholders in the information development process, it is easier to gain both buy in for the project as well as greater stewardship over the natural and social environment. Stakeholders may also benefit the process by bringing local knowledge and data (Meadows 1998).
Experts are scientists, researches and specialists who have technical or scientific expertise in aspects of the project. Experts bring an indepth understanding of issues, what can be measured, where to find and how to analyze the data. They bring credibility to the assessment process by ensuring the data are robust ansd meet technical criteria for a sound assessment (Meadows 1998).
IEA Training Manual 6
Monitoring, data and indicators Module 4
Besides thinking about participation, within the context of collecting data and developing indicators and indices, you may find it useful to identify the following:
1. What are the most appropriate levels of participation for each group or individual? Participatory involvement can range from one-way communication to two-way consultation and collaboration. The stronger the stake a group or individual has in a project, the more important it becomes to ensure there is two-way communication. Two-way communication can range from asking for, and listening to, feedback on selected issues and indicators, to more direct involvement in the monitoring, data/indicator/index selection or development process.
2. What are the most relevant stages of the process for including stakeholders? The data and indicator development process can be driven by both experts and non-experts, depending on the stage in the process. For example, non-experts are helpful when deciding what issues to address and why, while experts are helpful when deciding how to collect the data and process them. These roles may be combined.
3. What are the most efficient and effective mechanisms to include various people in the process, given available resources?
– To inform the broader public about indicators, for example, you may set up a website early on, launch or partner with a radio programme or develop a newspaper insert or column.
– To ask for feedback from a large group of stakeholders on their views about the indicators that have been selected, you could set up a phone number people can call or a website with an online discussion forum. In either case, you need to make sure there is sufficient capacity to respond to requests and properly process feedback.
– To consult or collaborate on selecting indicators with people who have a more direct stake in the project, you could organize focus group workshops or person-to-person interviews. If you established a core stakeholder group earlier in the IEA, you may want to go back to and use the same group to help with indicators.
4. How will input from those consulted be used and reported? Once input has been collected, you will need a process for letting stakeholders know how you have incorporated their input. You could do this e.g., through the IEA website if there is one, a thank-you letter that includes results in an attachment, or one-on-one telephone calls if you have the capacity and a smaller number of participants. You could also present results of your report via focus group workshops.
DISCUSSION QUESTIONS 1. In pairs, reflect on a participatory assessment process that you led or were involved in that
had successful elements. Use the following questions to help focus your discussion.
– Why was using a participatory approach in the project important? – When in the project was a participatory approach used? – What were the main techniques? – What parts of the process worked well? – What were some of the challenges? How were these challenges overcome?
2. In plenary, ask people what they noticed or learned from their conversations. Then, ask them to describe features of the project that worked well.
IEA Training Manual 7

Monitoring, data and indicators Module 4
3. Information systems You have seen that data, indicators and indices form an interlinked information system. While these elements are all related, developing them involves specific tasks. This section will provide an overview of some of the key conceptual issues and methods in developing data for use in indicators and indices.
The section reviews the types of data, including quantitative and qualitative data, and also looks at the specific issues related to spatial and non-spatial data. The section also considers what is involved in monitoring, construction and use of databases to store and analyze data. One of the prominent examples reviewed at the end of the section is the GEO Data Portal, a global database maintained by UNEP that is used in the production of global and sub-global GEO assessments.
3.1 Data Data provide you with useful information that can be processed into a more readily accessible form for use by policy-makers and the public. Data can be linked to important societal issues when placed in the context of a relevant issue. For example:
data on the number of patients with respiratory disease can provide information on the impact of air pollution;
the number of cars in urban centres can help provide estimates on the magnitude of air quality problems;
data on the quantity or quality of natural habitat can help assess, among others, the availability of species for traditional resource users such as trappers or hunters; and
the composition of solid waste can clearly indicate some emerging issues, such as the problems associated with electronic waste in China and India.
3.1.1 Types of data
Environmental monitoring typically involves “hard” science, although there are also an increasing number of examples of non-expert (community, youth) involvement. Quantitative indicators and data, usually based on statistics or remote sensing and presented numerically in tables, graphs and maps, serve as the main foundation of environmental assessment and subsequent decision making by policy-makers, civil society and the public at large. Quantitative data is often complemented by qualitative data to capture attributes that cannot be easily measured.
3.1.2 Qualitative data
Besides the growing number of initiatives focused on quantitative measurement, there is also increasing interest in keeping track of qualitative ecological and socio-economic attributes that help provide a more holistic picture. Not everything can, or needs to be, quantitatively measured, so quantitative data alone could miss critical elements. Looking only at quantitative data and nothing else could lead to someone believing that the problem is understood in great detail, which may not always be true. There is a growing sense that environmental assessments could be strengthened by drawing on a wider range of information types and sources, and might be at their best when numerical, technical “hard” data are combined with socially-derived information that more relate to the practical “real-world” dimension of the environment.
IEA Training Manual 8
Monitoring, data and indicators Module 4
Although socially-derived, experience-based information can be turned into quantitative, empirical data and scientifically scrutinized, it is usually gathered using qualitative methods and sources. This can be done, for example, through methods such as:
field observation;
interviews with people who live in and have direct experience with local environments; and
narrative, descriptive, oral histories and interpretive sources on issues such as how much water each household uses a day, how many bicycles or cars there are per household and who gets to use them, how people cope with changing environmental conditions, as well as opinions on environmental policy priorities, disaggregated by race, gender, age or ethnicity.
Qualitative information can complement numerical data and physical indicators by:
broadening the scope of environmental inquiry to include people’s experiences, perspectives and perceptions;
making use of critical environmental information long before it shows up on the scientific or public radar;
integration of certain indigenous or other groups into formal environmental discussions and decision making; and
acknowledgement of the fact that human responses to environmental conditions are often based on perception rather than externally-validated facts.
Working with qualitative information poses many challenges in terms of validation, verification, reliability and comparability. For example, individual narratives or small-scale observational field notes can produce highly idiosyncratic and unreliable information. Local and subjective knowledge may not be comprehensive, reliable or correct. People’s perceptions and memories can be distorted, and interviewers’ interpretations of what is said can be skewed.
It is very challenging to integrate qualitative and quantitative information into a holistic view of the state of the environment. Scale problems often mean that scientific assessments and experiential “bottom-up” information are not really examining the same environmental area or problem. Furthermore, it can be difficult to reach across the multiple variations in the form and presentation of information: scientific information often can be presented in a series of data tables, while qualitative information may require long narratives and nuanced interpretation.
Addressing these issues and figuring out how to integrate “hard” quantitative data and “soft” qualitative information in a science-based assessment is increasingly challenging when it is recognized that both approaches can complement each other and together enrich assessment results. A growing number of case studies point to the successful combination of technical-scientific and social science approaches to environmental assessment. Several governmental and inter-governmental agencies are developing capacity for integrating these approaches. In the end, the goal may not be to “integrate” these apparently different forms of environmental information, but rather to make use of their complementarity. Side by side, these different kinds of environmental data and information can offer a broader field of vision than either does alone.
IEA Training Manual 9
Monitoring, data and indicators Module 4
DISCUSSION QUESTION The following discussion question is intended to identify potential sources of qualitative data, as well as explore other aspects of collecting this type of data.
Scenario: Part of your assessment includes a segment on water quality. In addition to using available water quality measurements from monitoring stations, you have decided to incorporate qualitative data into your research because you would like to have a better understanding of local perceptions and experiences related to water quality for the region in which you are working. What might you ask community members in order to understand their perceptions about water quality? Consider different segments of the community, such as local, indigenous community members, non-profit groups, local policy-makers, children, youth and the elderly.
Materials needed: Worksheet listing including blank spaces for adding others.
Alternative questions:
What has been your experience with collecting and using qualitative data? What practices or approaches have worked well? How did you use this data in your assessment? What are some of the challenges in collecting, using and presenting qualitative data?
3.1.3 Quantitative data
Quantitative data provide “raw material” for indicator and index development1. They are the primary, raw output of monitoring and observation systems, surveys and other forms of data collection, and normally require analysis to be meaningful to the wider audience.
Characteristics of quantitative data may include:
generally have geographic locations (coordinates); are often large in volume (databases, reports, etc.); come from a variety of often heterogeneous sources; have variability of resolution (details) and scales that sometimes hamper their
compilation and integration; have a high degree of complexity; are needed at varying temporal frequency (e.g., hourly, daily, monthly, yearly),
depending on the phenomena or subject under consideration; are available in varying forms and formats; and more and more available in digital or electronic versions.
Generically, data are categorized as bibliographical materials (including descriptive texts and reports), statistical tables, maps and remotely sensed data (World Bank, 1992) but they can come in many forms such as:
maps; remotely sensed data such as satellite imagery, aerial photographs, or other forms of
visual data; computer data files; hard copies of reports and documents; bibliographies;
1 In general, for data is understood a representation of facts, concepts, or instructions in a formalized manner suitable for communication, interpretation and processing by human or automated means (Rosenberg, 1987).
IEA Training Manual 10
Monitoring, data and indicators Module 4
videos and films; graphs and charts; tables; computer animated images; and
drawings.
All assessment processes ultimately depend on data, but very few have the mandate, resources and capacity to collect primary data, so they rely on monitoring and data collection efforts by others. Therefore, compiling data for assessment usually requires that you obtain data from other sources, usually many different ones, both in terms of statistical (non-spatial) and spatial data.
Non-Spatial Data Non-spatial data are collected for one particular point and result in a single number. Often, multiple data points for the same parameter are averaged so that a single value is obtained to represent a collection of spatial units. Because non-spatial data are tied to a single point, there is no further resolution for those data—the information cannot be further broken down. This is unlike spatial data, which have resolution that allows you to move from detailed to broad information using the same data. While non-spatial data do not have spatial resolution, they can have temporal resolution if they are collected continuously over a period of time from a specific geographical point.
You can obtain non-spatial data from statistical sources or isolated research. Statistical sources use the same methodology for multiple data, so that they can be statistically compared and averaged. Isolated research, while valuable, often does not provide the breadth you will need for analysis at broader levels.
Spatial Data Spatial data, also referred to as geospatial data or geographic information, can most simply be defined as information that describes the distribution of phenomena and artifacts upon the surface of the earth. It is information that identifies the location and shape of, and relationships among, geographic features and boundaries, usually stored as coordinates and topology (i.e., the way in which geographical elements are related and linked to each other).
Spatial data are often displayed as layers of data one on top of the other, similar to a giant sandwich, where each layer is a related set of spatial data. Anything that has a geographic location on the Earth can be displayed as spatial data, including country statistics.
Spatial data have become a major resource in environmental analysis and reporting, and present a very immediate and visual message regarding environmental issues and management.
Examples of “layers” you might use are: Layers of spatial data
aerial photography satellite imagery country boundaries local administrative boundaries streets cities utilities protected natural areas habitat regions lakes and rivers elevation contours climate data
IEA Training Manual 11
Monitoring, data and indicators Module 4
soil layer data wildlife populations
(National Geographic Society, 2006)
You can also link additional non-spatial data, in the form of databases of information, to these spatial data layers by their common coordinates, and analyze and present them alongside spatial data layers. Climate data from different provinces or states in a country for example, could be linked to a provincial or state boundary layer, analyzed and displayed in a spatial form, and produced as maps.
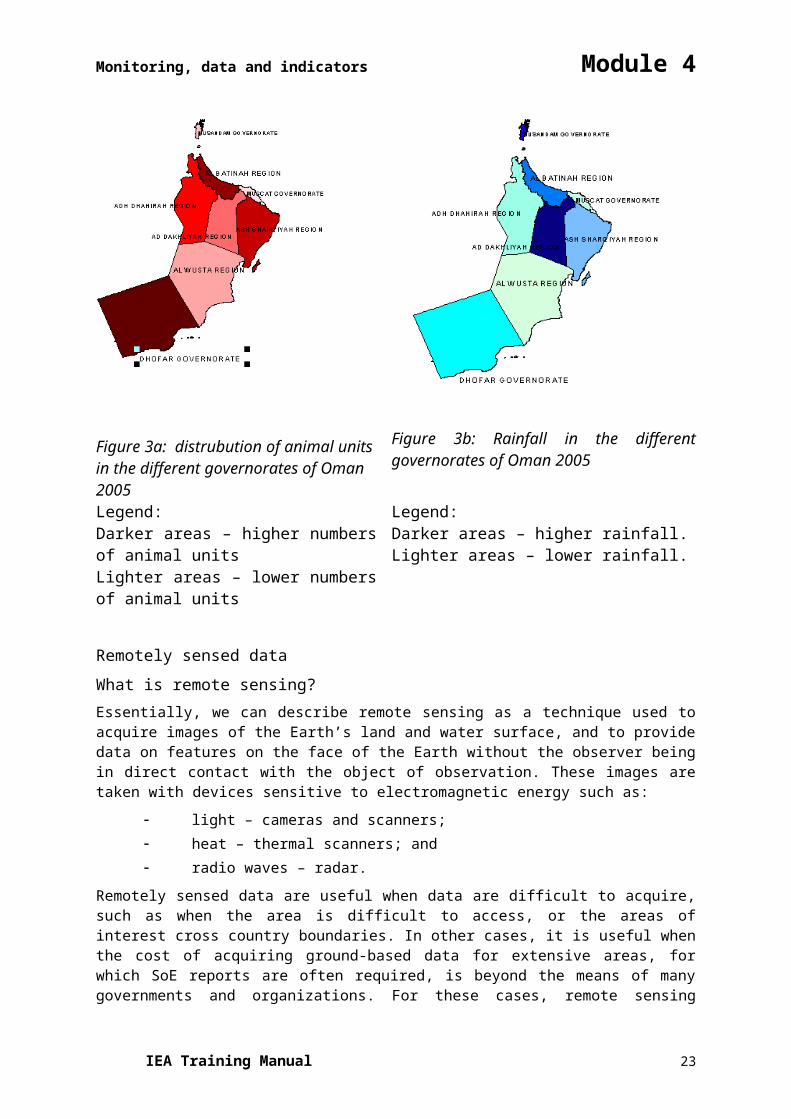
EXAMPLE: Consider the following map (Figure 3), which provid spatial information that help in studying the degree of desertification in the different parts of Saltanat Oman. A simple form of analysis using non-spatial data would be to overlay statistical information about the number of cattle, Goate, sheep and camels located within the boundaries of the map. You could then determine if there is a correlation between animal density and desertification. As shown in this made up example, Dhofar Community has a highest animal unite2 in Oman, and thus more potential grazing pressure than other Communities. At the same time the rainfall recorded in the two metrological stations in Dhofar are 63mm in Salala, and 4.4 in Tamreat. (http://www.moneoman.gov.om/stat_book/2006/fscommand/english/index.htm). So you can begin to associate grazing pressure and rainfall with desertification. While correlation does not show cause and effect, it does indicate a possible relationship between the two variables. (Read more about grazin in Oman).
Figure 3a: distrubution of animal units in the different governorates of Oman 2005
Figure 3b: Rainfall in the different governorates of Oman 2005
Legend: Legend:
2 Animal Units: A unit of measure used to compare different types of animals. Animal units are calculated by multiplying the number of animals by an equivalency factor. This factor helps equalize the potential for environmental impacts from animals as different as cattle, Goat, sheep and camel. For example, the factor for one dairy cow is 1, while one sheep has a factor of 0.2. That means that 500 sheep would be equivalent to 100 cows, with both groups having 100 animal units.
IEA Training Manual 12
Monitoring, data and indicators Module 4
Darker areas – higher numbers of animal unitsLighter areas – lower numbers of animal units
Darker areas – higher rainfall.Lighter areas – lower rainfall.
Remotely sensed data
What is remote sensing? Essentially, we can describe remote sensing as a technique used to acquire images of the Earth’s land and water surface, and to provide data on features on the face of the Earth without the observer being in direct contact with the object of observation. These images are taken with devices sensitive to electromagnetic energy such as:
light – cameras and scanners; heat – thermal scanners; and radio waves – radar.
Remotely sensed data are useful when data are difficult to acquire, such as when the area is difficult to access, or the areas of interest cross country boundaries. In other cases, it is useful when the cost of acquiring ground-based data for extensive areas, for which SoE reports are often required, is beyond the means of many governments and organizations. For these cases, remote sensing provides a partial solution for data acquisition for SoE reporting. But even for areas where conventional methods have been used to acquire data, remote sensing still provides many added advantages.
How is remote sensing useful for IEA? Remote sensing is particularly useful for environmental monitoring and reporting because it provides a unique overhead or “bird’s-eye” perspective from which to observe large areas or regions. Because of this, it can be used for management and planning in large local areas, and for monitoring the progress of ongoing projects. In many cases, these data collection can offer proof of progress towards success of projects that are a result of policy decisions designed to improve the state of the environment. Such data may be essential for further investments.
Another benefit of remotely sensed data is that they are often available on a repetitive basis. This type of time series data is extensively used to monitor changes in the environment over long periods (examples in Box 3). This is particularly important for SoE reporting in very rapidly changing environments.
Box 3: Remotely sensed data • Provide a unique perspective from which to observe large regions.
• Sensors can measure energy at wavelengths which are beyond the range of human vision (ultraviolet, infrared, microwave).
• Monitoring is possible from nearly anywhere on earth.
• Remotely sensed images provide good “pictures” for convincing the public and decision makers to participate in discussions on issues of importance that may not be part of their daily life.
• Used to monitor long-term changes. • Readily integrated into GIS.
IEA Training Manual 13

Monitoring, data and indicators Module 4
Types of remotely sensed data
Satellite imagery Satellite imagery is digital information obtained from sensors carried in satellites, and includes data both in the visible and non-visible portions of the electromagnetic spectrum (i.e., optical, thermal, radar). Satellite imagery is available from several sources from around the world (i.e.,IKONOS, IRS Landsat, SPOT, MODIS, Quickbird, WorldView, Geoeve, Envisat, ERS, , Radarsat, NOAA, ASTER), and from numerous companies that process and distribute satellite data products.
Landsat, one of the longest running sources of commercial satellite imagery (Landsat 4, 5 and 7 in particular), refers to a series of US-owned satellites put into orbit around the Earth to acquire images and collect environmental data about the Earth’s surface. These satellites have been collecting images of the Earth’s surface for more than 30 years and have acquired millions of images. These images provide a unique resource for people who work in agriculture, geology, forestry, regional planning, education, mapping and global change research.
One of the benefits of satellite imagery is the ability to capture multispectral images (i.e., images in two or more spectral bands, such as visible , infrared and thermal). This allows complex image processing and analysis in many different ways. Satellite imagery is also provided in a standardized spatial format, so integrating these data with socio-economic data for integrated environmental assessment becomes much easier. Nevertheless, problems of organizations and governments using different formats still exist over large areas, and across national boundaries.
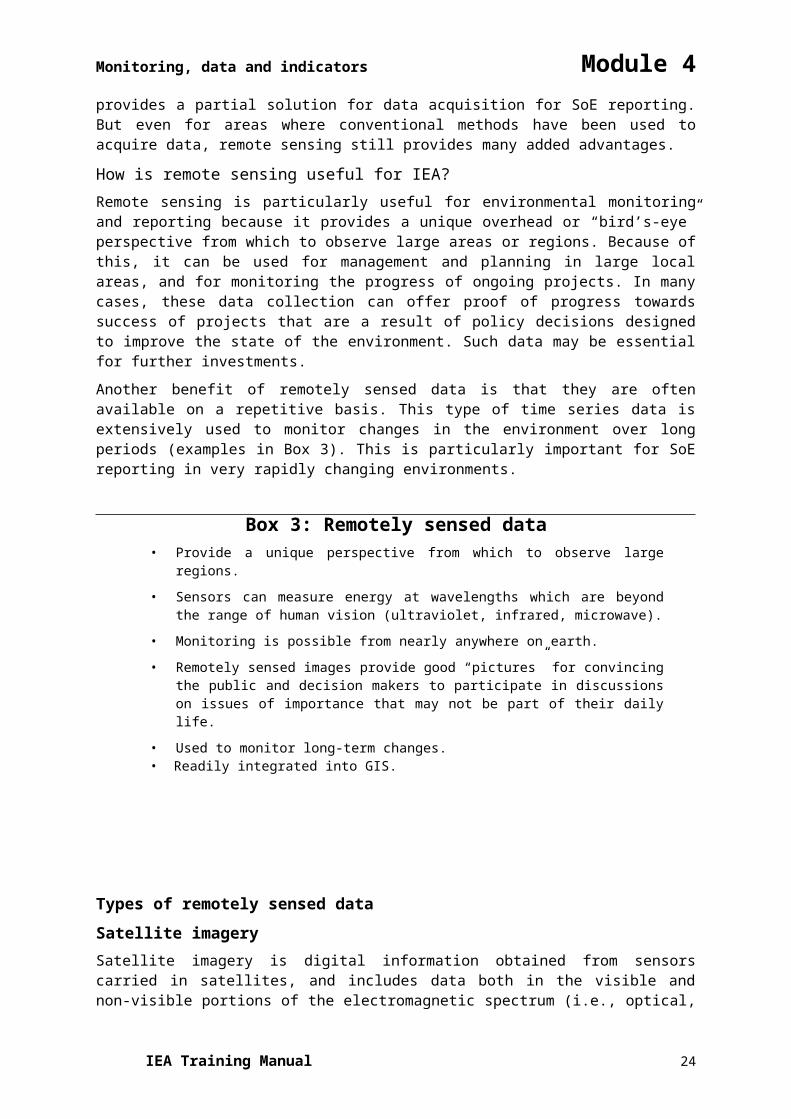
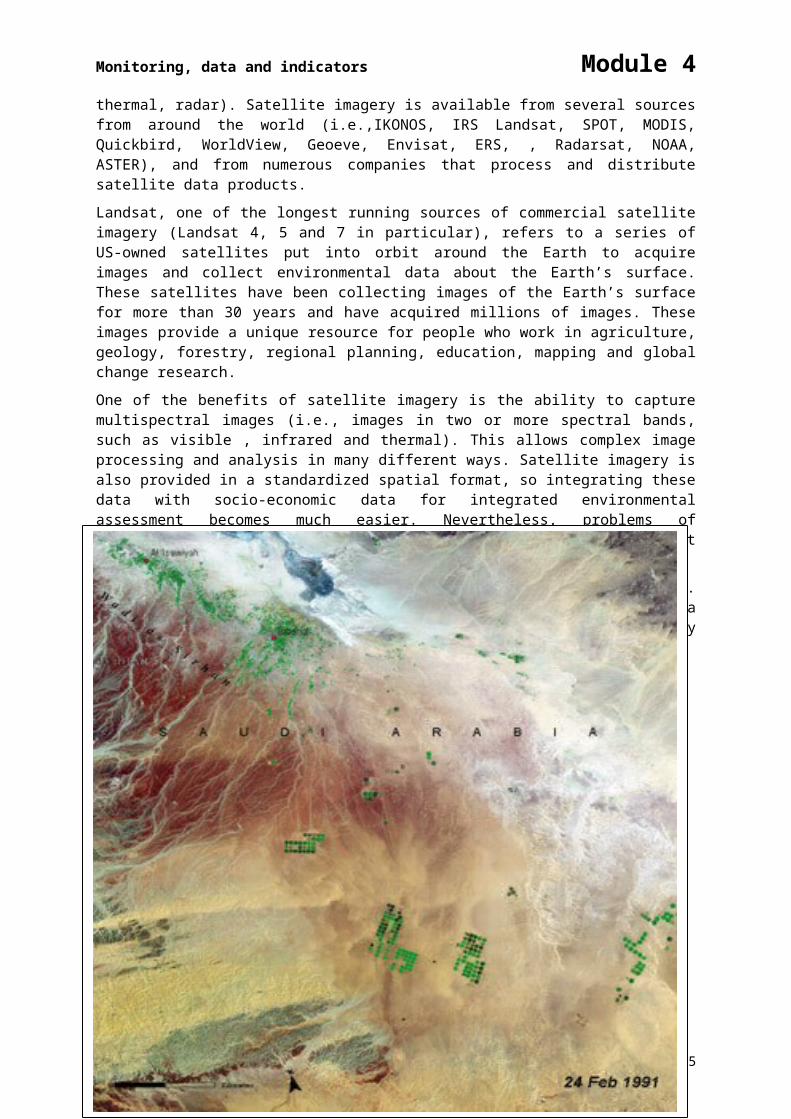
Figure 4 : The following images are an example of satellite imagery. The images show the Greening of Al’ Isawiyah desert , Saudi Arabia 1991, 2000 and 2004 (Source: UNEP, 2005. One planet, Many people. ,Atlas of our changing environment).
IEA Training Manual 14

Monitoring, data and indicators Module 4
IEA Training Manual 15

Monitoring, data and indicators Module 4
Figure 5: The following images are an example of satellite imagery from MODIS. They illustrate the Zobeir Desert chain on the Red Sea west of Yemen in 2007 . One of the images exhibits the same area in December 2011 showing a new volcanic activity and the emergence of a new desert .
This image shows a number of deserts belonging to “the Zobeir Chain” on the Red Sea west of Yemen (October 24, 2007)
IEA Training Manual 16
Monitoring, data and indicators Module 4
The above image shows a volcanic activity and the emergence of a new desert belonging to the Zobeir chain on the Red Sea west of Yemen. The image was captured on December 23rd, 2011.
:\http://earthobservatory.nasa.gov
Figure 6: The following are Landsat images that have been captured in 1984, 2000 and 2005 showing the changes that have taken place in Toshka Spillway in Egypt. This spillway was used to reclaim vast areas of the western desert in the country.
IEA Training Manual 17
Monitoring, data and indicators Module 4
IEA Training Manual 18
Monitoring, data and indicators Module 4
Source: UNEP, 2005 .Our planet, Many people, Atlas of our changing Environment
Aerial photography Aerial photography consists of images taken of the Earth’s surface from a camera on an airplane flying at a relatively low altitude. Depending on their purpose, aerial photographs are taken in black and white, colour, and/or infrared. For example, simple planning or navigation may only require black and white photography, while vegetation studies require infrared in order to distinguish among landforms based on infrared heat signals. Similar to remote sensing, aerial photography provides a unique overhead view of an area, and can be used to acquire data on local areas without the observer being in direct contact.
Aerial photography has several benefits over satellite imagery; one is that it provides a much higher resolution of an area, allowing you to get a very close-up and detailed picture of a fairly small feature on the Earth’s surface. With the necessary corrections for distortion and processing, aerial photographs are powerful tools for studying the earth’s environment. Typical applications of aerial photographs include land-use surveys and habitat analysis. For example, they are often used by cartographers and planners to take detailed measurements for the preparation of maps, and by trained interpreters to determine land-use and environmental conditions and changes.
Some of the down sides to aerial photography over satellite imagery, however, are that they only take a picture of a relatively small area, regular images taken of the same area are uncommon and laborious, and acquiring aerial photography for an area is much more expensive than obtaining satellite imagery.
DISCUSSION QUESTIONS: Spatial data in environmental reporting
Option 1. Discussion
IEA Training Manual 19
Monitoring, data and indicators Module 4
Working in small groups, discuss how you have personally used spatial data, as well as data combinations including spatial data, in your profession, or how you have seen it used.
For Example: You may have at some point used a satellite image of your country as a base layer with an overlay showing regional boundaries. You may have then linked data, such as a climate database, to the map to show average precipitation for each region across the country.
Provide examples of any environmental monitoring or reporting you may have done, and whether or not spatial data were used for this reporting.
Choose someone in your group to record aspects of the stories collected, including what worked and what could be different. Photo Source: US Geological Service
Option 2. Questions to discuss: What are the benefits of spatial data?
Identify an environmental problem or concern. What kind of spatial data could you use to help understand and communicate the issues involved?
What are some of the challenges you might encounter when using spatial data?
Spatial data and the Internet The Internet has become a major source of data used for assessment and reporting. There is an unprecedented amount of free environmental and socio-economic data on the Internet, and more and more websites also allow the exploration of the data through online mapping and/or statistical analysis (see Box 4 for some current examples of available sources). In addition, there are many online data and map services available that are fairly simple to use with most Internet browser programs, and this has become a very effective way to communicate images, maps and other types of datasets to potential users without the need to acquire and run specialized computer software. The GEO Data Portal http://geodata.grid.unep.ch/ (Hyperlinked_files_M4\GEO Data Portal - The Environmental Database (search map graph download).mht), described later in this module in detail, has been specifically developed to provide the most important global, regional and national data from authoritative international sources to the assessment community, while offering at the same time various possibilities to look at the data online by means of maps, graphs and tables.
IEA Training Manual 20
Monitoring, data and indicators Module 4
3.2 Monitoring and data collection of environmental trends and conditions Monitoring provides you with tangible information on a regular basis over an extended period of time about past and present conditions of the environment. In addition to environmental information, monitoring systems also collect social and economic information that is relevant for understanding environmental issues. A monitoring system may be developed for a number of objectives, such as:
assess the quality of the environmental situation, and enhance public awareness;
determine compliance with national or international standards; assess population exposure to pollution, and the impact on human health; identify threats to natural ecosystems, and develop early warning systems; identify sources of pollution and estimate pollutant loads; evaluate the effectiveness of pollution control measures; provide inputs for environmental management, traffic management and land-
use planning; support the development of policies, determination of environmental priorities,
and other managerial decisions; and support the development and validation of managerial tools (e.g., database
models, expert systems and geographic information systems).
Source: ADB 2002
Monitoring and observation takes place at various levels, including community, regional, sub-regional, national, global and outer space. It is usually not feasible to set up a dedicated monitoring system specifically for an IEA. Establishing and maintaining monitoring systems is costly and requires long-term planning. It is important that monitoring systems have a stable institutional base and carry out their activities according to proper technical and scientific standards. Monitoring systems, however, need to also evolve over time to address new environmental issues and make use of new technical capabilities. IEAs as an important “customer” for monitoring systems can play an important role by pointing out problems with data sets from the user point of view that may need to be addressed over time. This may mean that rather than ignoring issues where data is problematic IEA could rather point these out and bring it to the attention of the public and decision-makers, which may be the first step towards addressing them.
At the national level, data are usually collected by the central bureau of statistics or equivalent office, and/or by certain ministries (e.g., environment, land, water, agriculture) who run networks of measurement stations and undertake statistical surveys. Public organizations at state/provincial levels are typically also involved in data collection, as are municipal governments. The advantage of using data from government sources is that monitoring is likely to be more systematic and ongoing. Another important source includes data from scientific projects by academic and research organizations. However, project-based data are often limited to the lifespan of a project. There may be similar constraints when dealing with data produced by non-government organizations with uncertain funding. At the same time, increasing interest in community-based monitoring indicates that grass-roots civil society initiatives may be a new source of data to count on in the longer future, particularly if technology becomes more affordable.
Data from international, national and regional monitoring systems are often compiled in databases. National monitoring systems are sometimes able to draw on data from both the regional or ecosystem level and international sources, such as statistical compilations of data from UN or other international agencies. International satellite observation systems provide valuable information as well. At the same time, international organizations often use data collected at national—and sometimes regional—levels to compile global databases. Thus, in practice the data collection and dissemination flows can be quite complicated. Over the years, several global observation and data compilation programmes have been initiated to harmonize, support and improve basic data collection efforts, and make them useful and
IEA Training Manual 21
Monitoring, data and indicators Module 4
available for the users, including scientists, governments, civil society and the public at large. (See Box 4.) With regard to international efforts to harmonize satellite-based monitoring the Global Earth Observation System of Systems (GEOSS) stands out as a prominent initiative.
Despite the considerable investment in monitoring at all levels and explosive progress in the technical and information management aspects, data availability and quality is a persistent problem for IEAs. This holds true for issues such as renewable energy, waste disposal and processing, land and coastal degradation, water consumption or deforestation. The challenge for IEAs is that data are needed for a wide range of environmental and socio-economic issues versus just a narrow issue; that data is often needed for different spatial units; and, that the assessment requires time series. When limited to those environmental indicators for which there are sound, regular, country statistics available, one arrives at a small set of broad indicators, such as those contained in the Millennium Development Goals under Goal 7: Ensure environmental sustainability (http://www.un.org/millenniumgoals/) MDG ; MDG_Arabic, MDG _ the Arab Region 2007: A Youth Lens , MDGs in the Arab Region 2007
Box 4: Examples of data compilations and monitoring systems
National-regional data sources
the Abu Dhabi Global Environmental Data Initiative (AGEDI), http://www.agedi.ae/default.aspx
Environmental Profile of Jordan 2006
Desk Study on the Environment in Iraq , Environment in Iraq, Oman STATISTICAL YEAR BOOK 2006 The GEO West Asia Data Portal : http://www.hafeet.uaeu.ac.ae/geoportal-2/UN-ESCWA Statistics: United Nations Economic and Social Commission for Western Asia (ESCWA)
(http://www.escwa.org.lb/information/publications.asp , COMPENDIUM OF ENVIRONMENT STATISTICS IN THE ESCWA REGION
AOAD: Arab Organization for Agricultural Development http://www.aoad.org/aas2/index.htm
CEDARE: The Center for Environment and Development for the Arab Region and Europe (CEDARE). http://portal.cedare.int/
International data collecting sources • OECD has developed solid environmental data collection systems. OECD Environmental
Data Compendium and Environmental Indicators reports are published in book format every two years.
• UN Regional Commissions are collecting environmental data from countries at the regional level, sometimes in cooperation with UNEP.
• UN Statistical Division collects country data in cooperation with UNEP and coordinates with similar surveying by OECD and Eurostat, into account data collection activities by other organizations such as FAO, UNFCCC and GEMS-Water. (http://unstats.un.org/unsd/default.htm)
Some major multilateral environmental agreements that have prompted data reporting:
IEA Training Manual 22
Monitoring, data and indicators Module 4• Ozone depleting substances (Vienna Convention and Montreal Protocol, http://ozone.unep.org/) • Greenhouse gas emissions (UNFCCC, http://unfccc.int) • Hazardous waste movements (Basel Convention, http://www.basel.int/) • Long-range transboundary air pollution (CLTRAP, http://www.unece.org/env/lrtap) Global Environmental Observation coordination – in-situ and satellite remote sensing • Global Observation Systems include land, oceans and climate (GTOS, GOOS, GCOS, together labelled G3OS, see http://www.gosic.org/), guided through an Integrated Global Observing Strategy (IGOS) and supported by the IGOS Partnership (http://www.igospartners.org/). Global Earth Observation initiatives • Committee on Earth Observation Satellites (CEOS, http://www.ceos.org/) • United Nations Office of Outer Space Affairs (UNOOSA, http://www.unoosa.org/) • Global Earth Observation System of Systems (GEOSS, http://www.epa.gov/geoss/)
3.3 Data compilation Collection of high-quality data is an essential part of the IEA. You can approach initial decisions about what data to collect and how to collect it in a couple of different ways. You may begin by conducting a survey of available data prior to scoping thematic issues for the assessment. Availability of data then becomes a criterion for selecting data and developing indicators around priority issues. Alternatively, you may use a more targeted approach, where priority issues and indicators are identified first, followed by data collection. In this case, if data are not already available, you have four options: (1) exclude the indicator from your list; (2) define a proxy indicator (and indicator that measures your issue only indirectly) for which data is available; (3) include the indicator as a theoretical measurement tool, but point out that data is not available; or if you have time and resources collect primary data, keeping in mind that in this case time series data will not be available.
Once you have decided on the approach you will use for data collection, you will need to further develop a plan that includes elements of developing research methods, defining the type of data needed, and prioritizing which data must be collected. You will also need to specify data sources, and have a clear sense of the quality of the data. The steps involved in obtaining data and building a database go hand in hand with developing an assessment report (Figure 6).
Figure 6: Links between database and report development in OECD countries (as quoted in UNEP/DEIA 1996)
IEA Training Manual 23
Monitoring, data and indicators Module 4
Quality of data and precision of measurement are important considerations during data collection. “Perfect” data are not always necessary or possible, but data quality must be sufficient to satisfy the IEA’s objectives. Imperfect approximations (proxies) might be used in case no direct data can be obtained. Well-known examples of this are the use of CO2 emissions to show long-term climate change risk, or of protected areas to indicate biodiversity. Although different opinions exist as to whether it is better to have poor data rather than no data at all, the general notion is that IEA is to be based on the best available, scientifically sound data from widely recognized sources.
Once the basic data are selected and collected, usually you will need to compile and store them in a dedicated database, which might be also made available on the Internet. A database is an organized collection of data that is used to bring together all information about the state and trends in the environment, and may also include information about environmental policy, references to other data sources and to current research. It is important to ensure the database has continuity, and is kept up to date by linking it to monitoring systems, so that data generated through monitoring are fed into the database. The environmental database can also be used to regularly publish printed documents, such as environmental data compendia and indicator reports, to inform policy-makers and the public, and to provide a snapshot overview of the state of the environment. In many countries, building such a database is, or can be, a collaborative effort of various agencies, such as a central bureau of statistics, environmental and related ministries (e.g., agriculture, water), as well as research organizations and non-governmental organizations.
It may be useful to have the database already agreed and available by the time data collection is starting so that data sets can be added one by one as they are identified. You may also find that the database needs adjusting after you loaded the first data sets, particularly if you want to build in a wider range of functions, like multiple search, display and analytic functions available through the internet.
A database typically includes metadata, which are the background information about a data set itself. They include facts, such as the source of the data, the scale at which they were collected, the year they were collected, the projection if there is one, and any other information that you need to know before you can interpret the meaning of the data and use them in your analysis or report. An example of metadata can be found in the GEO Portal, as demonstrated in Exercise 1. Metadata for indicators is further discussed in Section 4.1 on Methodology Sheets for indicators. Spatial data have additional metadata requirements that are also described in the GEO Data Portal.
Box 5: System for integrated environmental and economic accounting
The System of Integrated Environmental and Economic Accounting (SEEA) is an integrated framework for economic and environmental data. It was developed by the United Nations as a satellite database to the System of National Accounts (SNA) for the purpose of enabling environmental data to be incorporated into economic decision making. It brings together economic and environmental information in a common framework to measure the contribution of the environment to the economy and the impact of the economy on the environment. It provides policy-makers with indicators and descriptive statistics to monitor these interactions, as well as a database for strategic planning and policy analysis to identify more sustainable paths of development. The data contained within the database can also be used to derive national-level indicators (UN Statistics Division 2003 and Hardi, P. 2000).
The SEEA system consists of four main categories of accounts:
• Flow accounts for pollution, energy and materials, providing information at the industry level about the use of energy and materials as inputs to production, and the generation of pollutants and solid waste.
• Environmental protection and resource management expenditure accounts, identifying expenditures incurred by industry, government and households to protect the environment
IEA Training Manual 24
Monitoring, data and indicators Module 4
or to manage natural resources. They take those elements of the existing SNA that are relevant to the good management of the environment and show how the environment-related transactions can be made more explicit.
• Natural resource asset accounts, recording stocks and changes in stocks of natural resources such as land, fish, forest, water and minerals.
• Valuation of non-market flows and environmentally-adjusted aggregates, presenting non-market valuation techniques and their applicability in answering specific policy questions. It discusses the calculation of several macroeconomic aggregates, adjusted for depletion and degradation costs, and their advantages and disadvantages. It also considers adjustments concerning the so-called defensive expenditures.
Box SEEA in ESCWA region
Environmental accounting environment concerns into exonomix accounting and helps policy makers to monitor progress towards achievement of sustainable development. The United Nations Statistics Division (UNSD) had developed in 2003 the System of integrated Environmental and Economic Accounting (SEEA), a satellite system that can be integrated inot the National Accounts and which provides a systematic framework for the organization of the information on natural resources to study the interaction between the economy and the environment. In particular, the UNSD has been working since 2006 on the revision of the SEEA and the development of methodologies for water accounts (SEEAW) and for energy accounts.
ESCWA countries have increasingly realized that integration of economic and environmental issue is a key point in formulating effective sustainable development policies, and this was supported by a recommendation by the ESCWA Statistical Committee in its sixth meeting in 2004, inviting ESCWA countries to incorporate water accounts in their national accounts. Therefore, ESCWA had planned in its work programme of 2006-2007, activities to build capacity of member countries in environment statistics and environmental accounting and had organized this expert group meeting in collaboration with the UNSD and UNEP.
The United Nations Economic and Social Commission for Western Asia (ESCWA), is organizing an expert group meeting on the production of statistics on natural resources and environment, jointly with the United Nations Statistics Division (UNSD) and the United Nations Environment Programme (UNEP-ROWA), in Cairo, Egypt , during the period 5-6 June 2007 . The purpose of the Expert Group Meeting is (a) to provide an overview on the state of production of statistics and accounts on natural resources in the ESCWA region with particular focus on water resources; (b) to present the framework and the methodologies of the SEEAW, (c) to discuss the requirements for the advancement of the implementation of the SEEAW in ESCWA countries and (d) to set the recommendations according regional priorities to implement the SEEAW. See also Economic information and the SEEAW hybird account ; SEEAW_Indicators.
3.4 GEO Data Portal In order to filter relevant national data from authoritative, primary international data sources and harmonized databases, as well as to provide aggregated data at sub-regional, regional and global levels, UNEP has developed a dedicated reference database for GEO and sub-global IEA reporting: the GEO Data Portal.
The GEO Data Portal has matured into a reference data system, and has become the authoritative source of a broad collection of harmonized environmental and socioeconomic data sets used by UNEP and its partners in the GEO reporting process and other integrated environment assessments. It also allows basic data analysis and creation of maps and graphics. Its online database currently holds more than 450 variables that can be analyzed and displayed as maps, graphs or tables. The data sets can also be downloaded in a variety of formats, supporting further analysis and processing by the user. The GEO Data Portal covers a broad range of environmental themes such as climate, disasters, forests and freshwater, as well as categories in the socio-economic domain, including education, health, economy,
IEA Training Manual 25
Monitoring, data and indicators Module 4
population and environmental policies. The online Data Portal has been designed as an easy and light system that can run on most platforms and does not need very extensive Internet bandwidth. Although primarily targeting the GEO user community (UNEP offices, GEO Collaborating Centres and contributors), extensive use of the portal is also made by other (UN) agencies, universities, schools, civil society and the general public around the world.
The data providers include many primary data collection agencies among the UN system and other key partners, including FAO, UNEP, UNESCO, UN Statistical Division, WHO, World Bank and OECD. Although nearly all data sets are in the public domain and freely accessible to all, due to copyright reasons, a small portion of the data can only be downloaded by the GEO user community of UNEP offices and the network of GEO Collaborating Centres and contributors. The statistical data variables are available not just for all countries of the world, but also for UNEP’s GEO regions and sub-regions, and the world as a whole. In certain cases, the aggregated figures cannot be given due to lack of underlying data at the country level. To the extent possible, the data cover the period since 1970, and are constantly being kept up-to-date. Apart from statistical data sets, a good selection of geo-spatial data (maps) is also available in standard formats used by the remote sensing community, usually at global and regional scales. New data are added on the basis of needs stemming from UNEP’s GEO reporting, and based on priorities discussed in the GEO Data Working Group (DWG) and reflected in the GEO Data/Indicator matrix, as well as through consultations and arrangements with UN agencies and other authoritative data providers.
The global GEO Data Portal is being supplemented by regional versions, starting in Latin America and Africa, and to follow in Asia and Pacific and West Asian regions. The Global GEO Data Portal is available on the Internet at http://geodata.grid.unep.ch/ and on CD-ROM. The website provides the most recent updates and further information on other associated tools, such as an e-Learning module for the Portal and a User Guide (http://www.grid.unep.ch/wsis/).
Although the GEO Data Portal is open to everyone and provides data for all countries of the world, for national-level environmental reporting authoritative data sources are more likely found within the country itself from the government (environmental and other ministries, bureau of statistics), research organizations, NGOs and other sources. Therefore, when using the portal you should also plan on cross-referencing with national databases.
EXERCISE 1: GEO Data Portal
The following exercise is intended to give you practice using the GEO Data Portal. There are two themes for this exercise, Population Indicators and Making Globalization Visible. For the first part of the exercise, choose a theme and work with a partner on the exercise. For the second part, do the exercise on your own. Use the handouts provided with this activity to follow the steps.
1. Population indicators: A global view Geodemography is one of the most commonly used themes for mapping in geography, mainly because population data are often readily available and lend themselves quite well to mapping, particularly at the global level. Mapping geodemography allows us to go beyond basic population numbers to the population indicators that give us a more complex picture of the population dynamics of a place, such as birth rate, death rate, total fertility rate, and infant mortality rate. This exercise gets you started comparing population indicators at a global scale.
Step 1. At your computer, launch your browser and go to the GEO Data Portal at http://geodata.grid.unep.ch/.
First, let’s focus on the fertility rate data. The fertility rate is a relatively useful indicator of forthcoming changes in population density for a country.
Step 2. Under “search the GEO Database,” enter the word “fertility,” and click “Search.” You should now see a set of available database options relevant to “fertility.”
IEA Training Manual 26
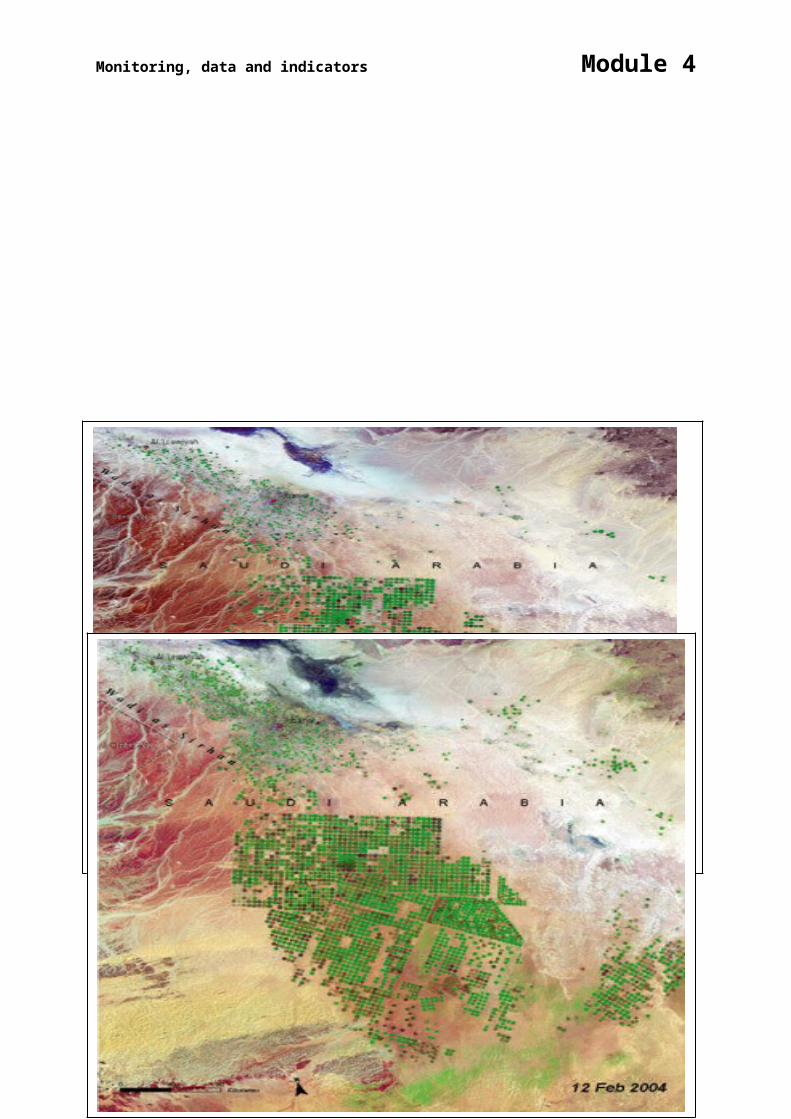
Monitoring, data and indicators Module 4
Step 3. In this list, choose the top data option, fertility at the national level, by clicking on the radio button and then clicking “continue.”
Step 4. From the year selections, check the box labelled “Select All” next to the list of available years, and then click “continue.”
You should now be looking at a list of available output options for the data, as shown on the right. The GEO Data Portal offers data to view in a map, chart or table, as well as to download for use in statistical or mapping packages.
First, let’s find out what type of data we have by looking at the metadata.
Step 5. Under “Show Metadata,” click “display as...Metadata.”
Question 1: Read the “Abstract” and “Purpose” sections of the metadata. How is fertility rate defined for this data set?
Question 2: How were the data for fertility rate collected and measured?
Question 3: Why is fertility rate considered a more useful population indicator than birth rate?
Step 6. When you’re finished browsing the metadata, click the orange “go back” link on the right to return to the display options page.
Step 7. Under “Draw Map,” click on the image of the map. This will open up a separate window with a world map showing estimated fertility rate for the years 2045–50.
The fertility rate map shows a century of estimated data for each country. How are regional patterns of fertility estimated to change over this period of time?
Step 8. Explore the different estimates by clicking on the “General” tab in the red Theme box below the map, selecting another time period from the “Selected Year” drop-down menu, and clicking “update map.”
Question 4: Choose four different time periods from the drop-down menu, and analyze what you see. What regional patterns do you find for fertility rate?
Question 5: Based on these patterns, which countries or regions might you predict to have a decreasing population density?
Hint: By selecting the “Identify” tool icon to the left of the map, and then clicking the map with your cursor, you can get data for individual countries.
Step 9. Next, go back and explore the global data for Infant Mortality Rate. Click on the orange “new search” link to the right of the map. This should take you back to GEO Data Portal home page. In the box, type “infant mortality” and click “Search.”
Step 10. From “select a dataset,” choose “Infant Mortality Rate — National,” click “continue,” again choose all years of the data, and click “continue.”
Step 11. Draw your map as in Step 7.
Question 6: Using the options in the “General” tab again, browse the estimated infant mortality data between 1950 and 2050. What regional patterns do you see?
Question 7: Reflect on what you have learned in class about infant mortality rate as a population indicator. If you could look at these two data sets, infant mortality and fertility rate, simultaneously, how would you expect them to correlate? In other words, for a country with a high fertility rate, would you expect infant mortality to be high or low? Explain your reasoning.
2. Making globalization visible
IEA Training Manual 27
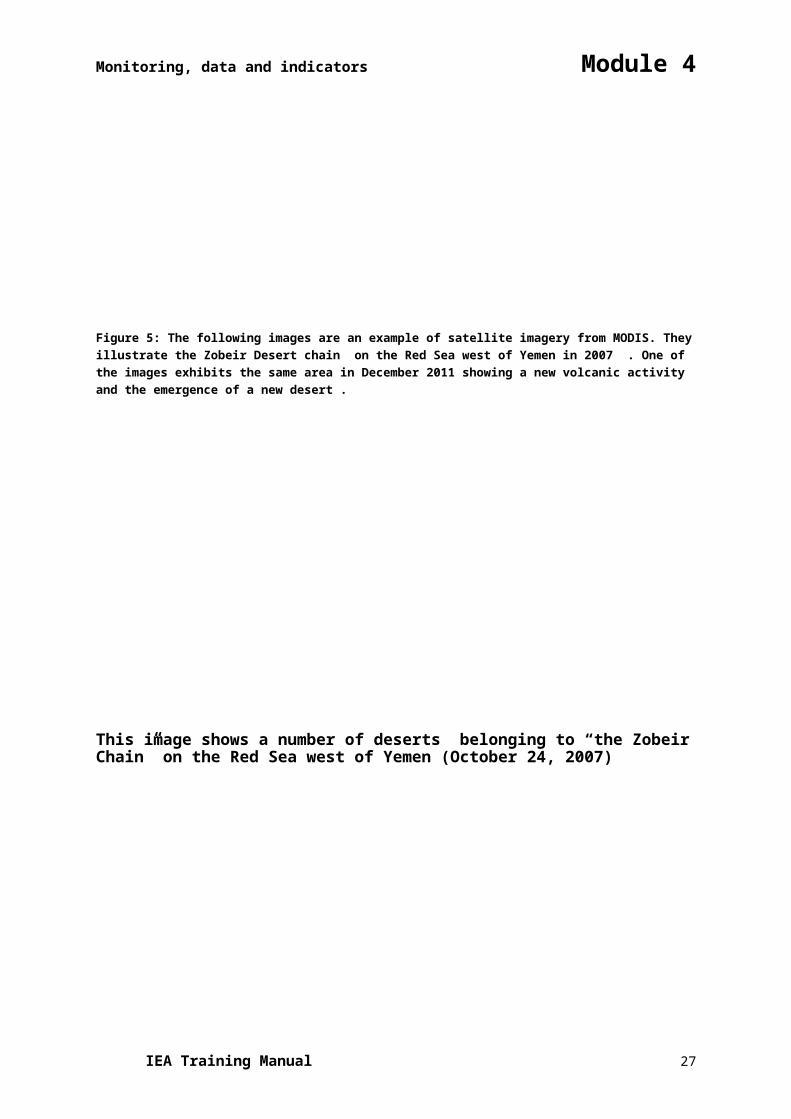
Monitoring, data and indicators Module 4
Globalization is a complex concept to grasp, much less measure or monitor. Most people agree that it is a combination of specific process-like and structural shifts in economics, culture and governance at the global level. These patterns include a shift from industrial to service economies, and from national to global markets, an increasing spread of popular culture, rising consumerism and often a widening gap between the rich and poor.
Question 1: What other kinds of economic and cultural patterns are indicators of globalization?
Question 2: What kinds of activities are indicative of political and cultural resistance to globalizing forces?
Based on these patterns of globalizing forces and resistance to those forces, do you think it is possible to make a “map of globalization”? What would it look like?
It is one thing to consider globalization as a series of case studies, with separate issues, indicators and effects. But, it is far more difficult to achieve an integrated awareness of globalization, a whole picture of globalization in our head. If we cannot look at it as a whole, how can we monitor it as a whole?
In this exercise, we will experiment with online mapping to see if the kinds of datasets available to us are useful for illustrating the complex idea of globalization. We will use the GEO Data Portal and try to explore its capabilities to grasp of the notion of globalization.
Step 1. Launch your browser and go to the “GEO Data Portal” at http://geodata.grid.unep.ch/.
Step 2. For the search term, type in “trade” and click “search.”
Step 3. In the resulting list, select “Trade – Percent of GDP” for the national level, and click “continue.”
Step 4. Select “1970” for the year, and click “continue.”
Question 3: Based on what you know about regional globalization patterns, what type of data display for “Trade – Percent of GDP” do you expect to see?
Step 5. Test your hypothesis by clicking on “Draw Map” from your list of options.
Question 4: Which countries or regions show the highest proportion of GDP in trade for 1970? Which countries show lower proportions?
Step 6. Now click the “Trend Analysis” tab in the red “Theme” box, and check the “Calculate difference” option. Choose to look at the difference between 1970 and 1980, and display the difference “in percent.” Click “update map” to see your results.
Question 5: Is GDP in trade increasing or decreasing? For which regions or countries?
Question 6: Redraw the trend analysis map for 1980 to 1999, and compare the results. Does the visual pattern fit your hypothesis from Question 3? Why or why not?
Question 7: How does the “No data” category affect the different views of the choropleth map? (A choropleth map uses shading, colouring or a symbol to show the geographical distribution of the information.) How does it affect your perception of the global balance of trade?
Question 8: Explore and evaluate the generalization, scale and projection, and data classification of this interactive map. In what ways does each factor limit your interpretation of globalization trends?
Step 7. Print a copy of the map that you made, and copy and paste it into a Word document.
3-Using the histogram A histogram shows the distribution of data values for one continuous variable. Rather than showing each individual variable along a single axis, as you saw with line graphs in
IEA Training Manual 28
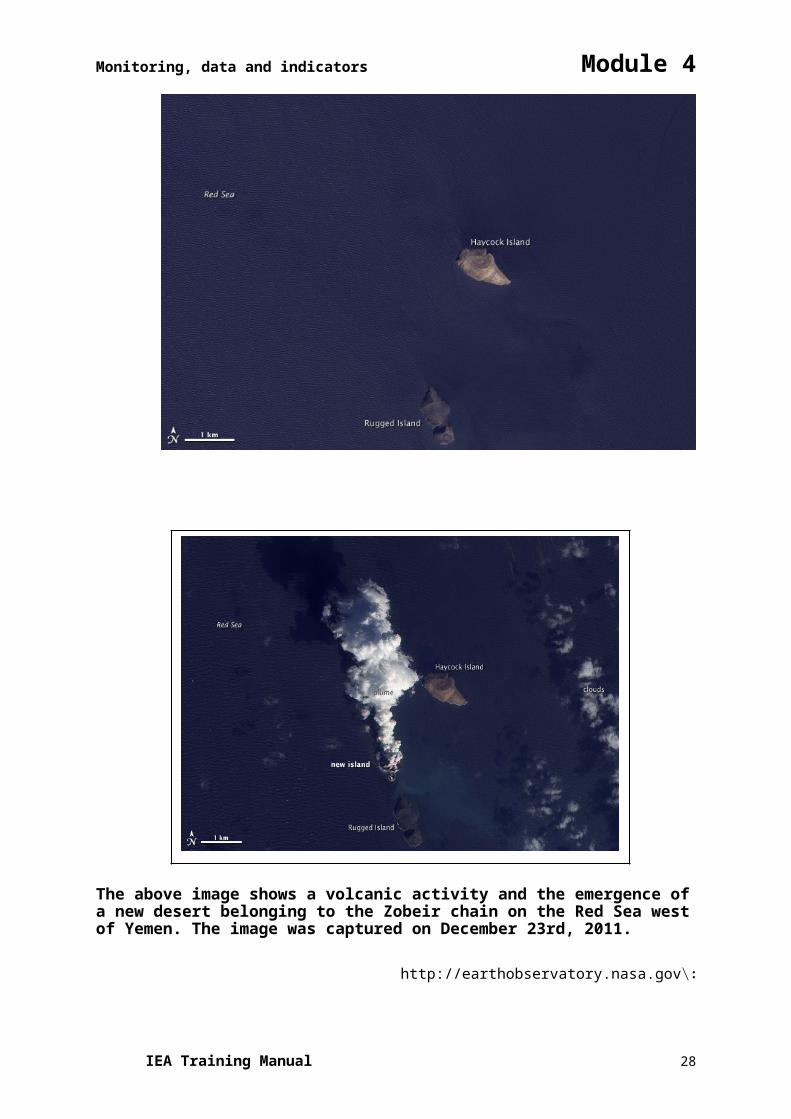
Monitoring, data and indicators Module 4
Exercise 1, a histogram divides the data into data classes, and then plots the frequency of occurrences of those data classes relative to the variable as a whole.
Step 8. Click the “Table” tab above the map. This should take you to a table showing the 1970 GDP trade values by country.
Step 9. Click “Histogram” to get a pop-up window showing a histogram display of the tabular data. Print the histogram pop-up using the print options on your computer, then close the pop-up.
Step 10. Click the “redefine years” option to the right of the table, set the year to 1980, choose “Draw Map,” choose “Table” again, select “Histogram,” and print a new histogram for the 1980 data.
Step 11. Finally, repeat step 10 to make a histogram for the most recent year available. You should now have three histograms showing change in “Trade – Percent in GDP” over time.
Question 9: Compare your three histograms. How is the proportion of GDP in trade changing? Does this support the concept of globalization? Explain why you think the histograms do, or do not, reflect globalization trends.
Question 10: Do the histograms assist with your visual picture of GDP in trade? Why or why not?
Guide to GEO Data Portal – CD-ROM and e-learning.
Run the e-Learning for Sustainable Development CD-ROM, using the GEO Data Portal. For the video demonstration and exercises, see also http://www.grid.unep.ch/wsis/ <CD-ROM to be provided with Training Manual>
IEA Training Manual 29
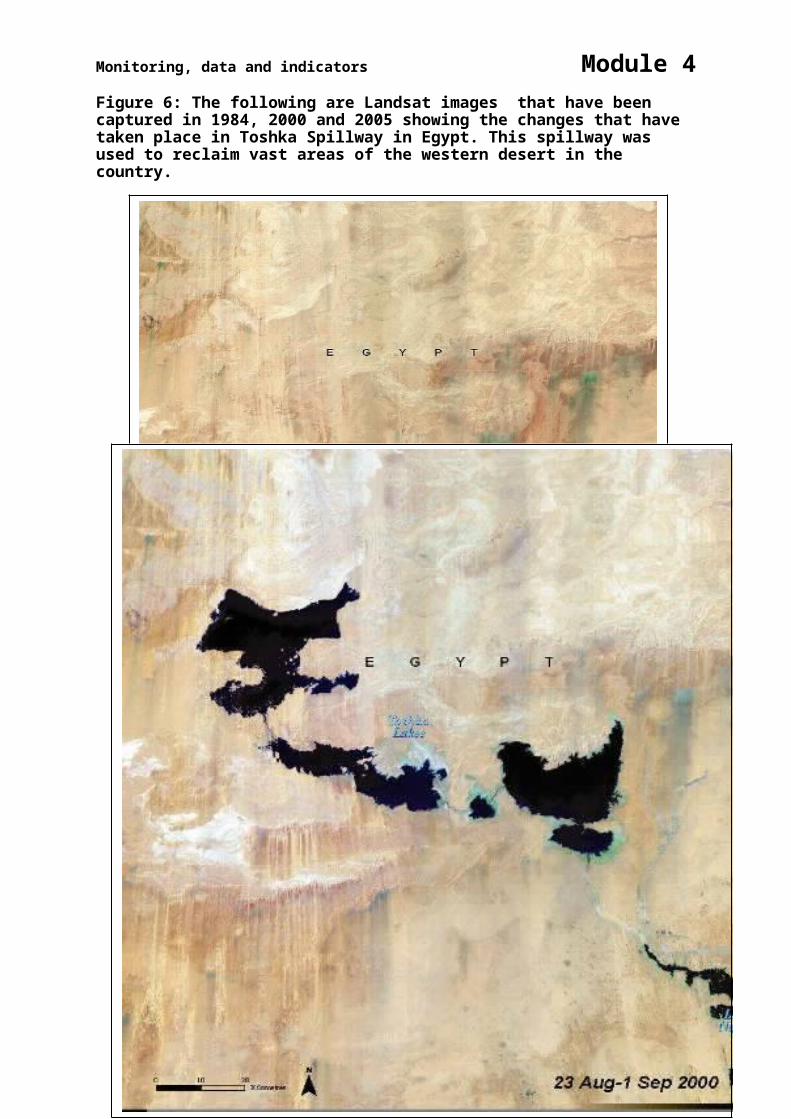
Monitoring, data and indicators Module 4
4. Indicators and indices You have become familiar with considerations and processes involved in collecting and developing data for use as indicators and indices. The next step in the process is to package the data into a form that can be more easily interpreted from a policy relevance perspective. The following section will provide you with an overview of conceptual and methodological considerations associated with developing and using indicators and indices.
The section reviews the process of selecting indicators, including criteria for good indicators, participatory processes and indicator frameworks. Examples of core sets of indicators from UNEP and UN CSD are also provided. The section also includes a review of indices, including a range of examples of indices, from the well-known GDP and Human Development Index <http://hdr.undp.org/reports/view_reports.cfm?type=1> to the more recently released Environmental Performance Index (2006) <http://www.yale.edu/epi/>
4.1 Indicators Indicators are what make data relevant for society and for policy making. They help us make decisions or plans because they help us understand what is happening in the world around us. As a society, we tend to choose measures that reflect our values. On the other hand, the information we receive also shapes what we value.
Indicators have an important role in both informing and assessing policy (UNEP 1994). The World Bank (1997) stated that, “The development of useful environmental indicators requires not only an understanding of concepts and definitions, but also a thorough knowledge of policy needs. In fact, the key determinant of a good indicator is the link from measurement of environmental conditions to practical policy options.” Practical policy options imply a relationship between environmental and societal affairs. As any decision has a price, whether it is environmental or social, a policy’s impact ultimately depends on the priority of the decision-maker as influenced by the perceived priorities of that person’s constituents. Thus, the integration of policy areas must provide a solid platform for supporting the path toward sustainable development (Gutierrez-Espeleta 1998).
The value of indicators in policy making can be summarized as:
Providing feedback on system behaviour and policy performance; Improving chances of successful adaptation; Ensuring movement toward common goals; Improving implementation; and Increasing accountability.
Selecting good indicators Because indicators influence decision making, it is important that the measures we use are proper ones. Poor indicators provide inaccurate and misleading information about what is being measured. An example of a poor indicator might be a measure that reflects change over a very long time scale when decision makers require knowledge about change over in a short time scale. In order to know the impact of fertilizer on land quality, it would be insufficient to measure and present just the soil organic matter, which changes on a decade long time scale. Inaccurate indicators could lead to policy actions that are over or under-reactive.
One of the challenges of selecting good indicators is that it may be easier to choose indicators based on ease of measurement or data availability, rather than what needs to be measured. As mentioned previously, filling data gaps can be a resource intensive process, which means that options in terms of indicator selection may be limited. Notwithstanding, it is still valuable for you to select indicators that have the best possible fit with the IEA process.
Part of the process of selecting good indicators is weighing them against a set of indicator criteria. Selecting indicators can be a balancing act, with trade-offs among such factors as ensuring they are
IEA Training Manual 30
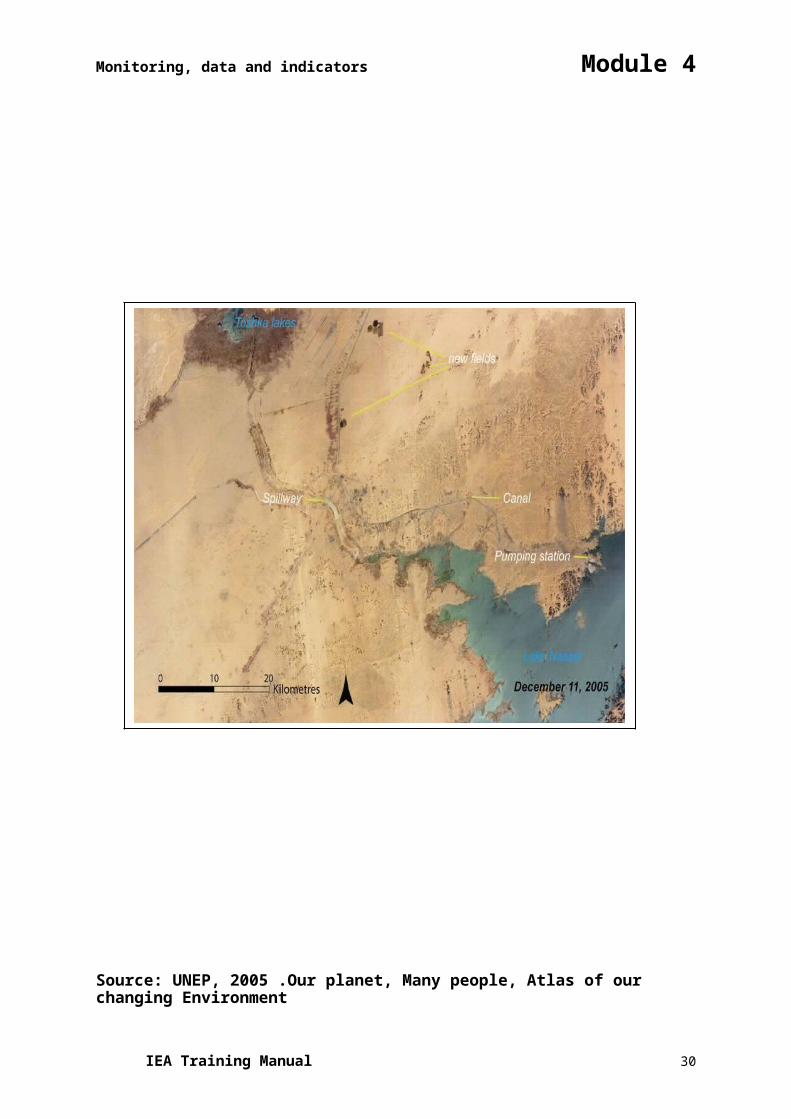
Monitoring, data and indicators Module 4
relevant to society and policy-makers, scientifically sound and accurate, and easy to interpret with a reasonable degree of accuracy and precision.
The following criteria, drawn from the World Bank (1997) and OECD (1993) are commonly cited as useful in the indicator selection process.
Indicators should:
be developed within an accepted conceptual framework;
be clearly defined, easy to understand and interpret, and able to show trends over time;
be scientifically credible and based on high-quality data;
be policy relevant;
be relevant to users, politically acceptable and a basis for action;
be responsive to changes in the environment and related human activities;
provide a basis for international comparison by providing a threshold or reference value;
be subject to aggregation (from household to community, from community to nation);
be objective (be independent of the data collector);
have reasonable data requirements (either data that are available or data that can be collected periodically at low cost); and
be limited in number.
An important consideration is selecting the appropriate number of indicators. Too many indicators may create “noise” that is difficult to interpret, while too few indicators limit the scope of understanding. Selecting indicators based on a select set of priority issues is an increasingly common way of limiting the number of indicators.
Participatory process Because indicators are intended to help inform decisions that affect society, indicators better serve society when they reflect the diverse perspectives held by multiple stakeholders, such as citizens and citizen groups, private and public sectors, and policy-makers. As shown in the following figure, participatory processes occur across the spectrum of indicator development, from an initial identification of broadly-held values and issues that inform indicator selection, to more focused tasks of setting indicator targets and criteria for performance.
An additional step not shown in Figure 5 is the process of communicating indicator results with stakeholders, and understanding how they interpret the results in relation to values and their world-views. Developing an effective participatory approach requires careful planning so that the people who need to be involved are involved in an appropriate way, taking into account available resources (See Section 2). The Priority Environmental Indicators in West Asia, Arab Africa Regions
IEA Training Manual 31
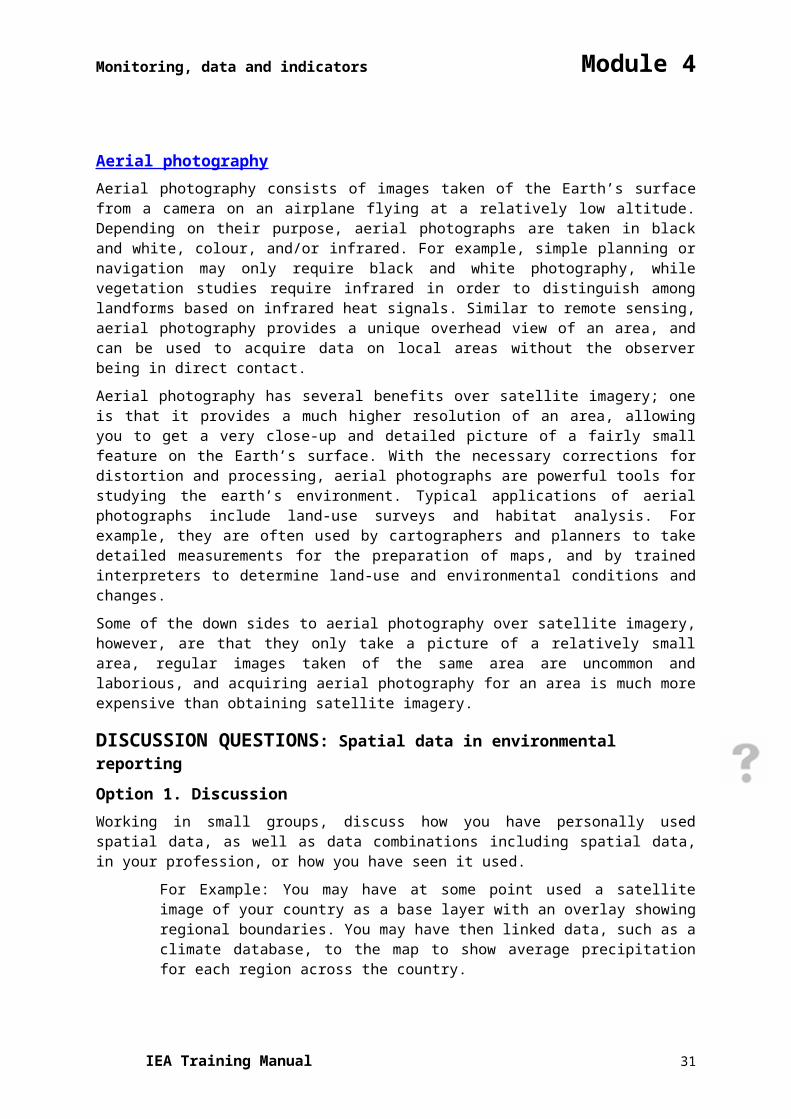
Monitoring, data and indicators Module 4
Figure 7: Linking values, issues, indicators and performance criteria in a participatory process (Pintér, Zahedi and Cressman 2000).
Indicator frameworks Indicators are developed based on priority issues. The orientation of indicators to issues as well as relationships among indicators (such as cause and effect relationships) is often structured using conceptual frameworks. In an IEA and in GEO, the conceptual framework is the Drivers – Pressure – State – Impacts – Responses (DPSIR) framework, which shows relationships between human activity and ecosystem well-being, as introduced in detail in Modules 1 and 5. The DPSIR framework used in GEO-4 is shown in Figure 6. The DPSIR framework is a variant of the Pressure – State – Response (PSR) framework originally developed by Rapport and Friend (1979) for Statistics Canada and also adopted by the OECD. Variations on the DPSIR framework include Driving-State-Response (DSR), which was originally used by the UN Division for Sustainable Development (UN-DSD), and the Pressure-State-Response framework used by Statistics Canada and the OECD.
IEA Training Manual 32
Monitoring, data and indicators Module 4Figure 8: DPSIR framework for GEO-4
Source: DEWA 2006
The UNEP Human – Environment Interaction analytical approach: – built on the Drivers, Pressures, State and trends, Impacts and Responses (DPSIR) framework. It is multi-scalable and indicates generic cause and effect relations within and among:
• DRIVERS: The drivers are sometimes referred to as indirect or underlying drivers or driving forces and refer to fundamental processes in society, which drives activities having a direct impact on the environment;
• PRESSURES: The pressure is sometimes referred to as direct drivers as in the MA framework. It includes in this case the social and economic sectors of society (also sometimes considered as Drivers). Human interventions may be directed towards causing a desired environmental change and may be subject to feedbacks in terms of environmental change, or could be an intentional or un-intentional by-products of other human activities (i.e., pollution);
• STATE: Environmental state also includes trends, often referred to as environmental change, which could be both naturally and human induced. One form of change, such as climate change, (referred to as a direct driver in the MA framework) may lead to other forms of change such as biodiversity loss (a secondary effect of climate gas emissions);
• IMPACTS: Environmental change may positively or negatively influence human well-being (as reflected in international goals and targets) through changes in environmental services and environmental stress. Vulnerability to change varies between groups of people depending on their geographic, economic and social location, exposure to change and capacity to mitigate or adapt to change Human well-being, vulnerability and coping capacity is dependent on access to social and economic goods and services and exposure to social and economic stress; and
• RESPONSES: Responses (interventions in the MA Framework) consist of elements among the drivers, pressures and impacts which may be used for managing society in order to alter the human – environment interactions. Drivers, pressures and impacts that can be altered
IEA Training Manual 33
Monitoring, data and indicators Module 4
by a decision-maker at a given scale is referred to as endogenous factors, while those that can’t are referred to as exogenous factors.
The following is an example of how the DPSIR framework can be used to tell a story about an issue, such as the “state” of urban air quality.
Figure 9: Example of DPSIR framework for urban air quality
Another type of framework is based on capital accounting. This framework focuses on changes in in physical, natural, human or social capital. The goal of this model, which is in use by the World Bank, is to ensure that “future generations receive as much or more capital per capita than the current generation” (World Bank 1997).
Types of capital include:
Physical capital – buildings, structures, machinery and equipment, and urban land etc.;
Natural capital – renewable and non-renewable natural resources;
Human capital – e.g., return on investment in education; and
Social capital – norms and social relations, social cohesion.
Capital accounts first must be tracked and may also be reported in physical units. Using physical measures helps reduce ambiguities, but it leads to indicators being reported in different units, thus assessing overall progress and comparison between different jurisdictions is often difficult. As an optional subsequent step, some or all forms of capital may be converted into a monetary equivalent. This may help with aggregation, but economic valuation methods related to non-market goods and services is wrought with challenges, particularly when one intends to apply it consistently across a wide range of social and ecological issues, over large geographic areas, and regularly over time (Hardi and Muyatwa 2000).
Further methodological aspects on economic valuation are discussed in Module5.
IEA Training Manual 34
Monitoring, data and indicators Module 4
Flow of indicator development Indicator development often begins with a conceptual framework, followed by the selection of indicators based on criteria of suitability. Indicator development is often an iterative process, where a large number of environmental or sustainable development issues are narrowed down in successive rounds of dialogue with stakeholders and experts to a few high-level measures.
Figure 10 provides an example of the process used for indicator development in South Africa. The main steps are further described below.
Figure 10: Example of an indicator development process from South Africa
Source: Palmer Development Group 2004
Step 1 involved identifying a framework to guide the selection of indicators. The framework was based on a review of environmental and local government legislation, and consultation with stakeholders. It was built around core environmental mandates for local government, and if a core mandate was not present, then around the role of provincial and national government.
Step 2 involved drafting a set of indicators based on a set of criteria for indicator selection. The draft set of indicators was reviewed by local, provincial and national government, to ensure that the new indicators would have as consistent a format and language as pre-existing indicators. A workshop was then held to obtain feedback from stakeholders.
Step 3 involved further categorizing the indicators. Because municipalities and provinces across South Africa manage areas with different characteristics, and with different levels of resources, capacities, knowledge and available data, further categories were needed to reflect these differences. The indicator categories were then placed within the indicator framework.
Towards the end of the project, a workshop was held with stakeholders for three purposes: to finalize the draft set of indicators, to categorize the indicators into proposed sets, and to discuss issues related to the use of indicators by government. The workshop resulted in a draft set of categorized indicators and a number of recommendations from stakeholders directed towards the government department responsible for indicator reporting.
Core indicator sets
IEA Training Manual 35
Monitoring, data and indicators Module 4
Once indicators have been identified, you can further reduce them into core and peripheral sets of indicators. Core or headline indicators provide clear and straightforward information to decision-makers and civil society on trends and progress for specific issues. Few in number (<30), core indicators are sometimes clustered around themes, parameters or dimensions to assist with understanding more complex situations. They do not, however, provide a comprehensive picture of the situation, including detailed relationships among different aspects being measured. More detailed, supporting indicators may be included in a peripheral set to provide a higher level of detail. Several “core data/indicator” sets have been developed, mainly differing by geographic scope (i.e., country, region, global). Examples are WEHABC Priority Environmental Indicators in West Asia, Arab Africa Regions, the OECD Key Indicator Set, the EEA Core Data Set, the EU Structural Indicators, the GEO Core Data Matrix and the UN CSD Theme Indicator Framework. There are several other global core sets of environmental and sustainable development indicators, but the common aspect among all of those initiatives is that they attempt to model reality according to a previous agreement among stakeholders.
Core sets of indicators can also be defined at the regional level, such as the Latin America and Caribbean Initiative for Sustainable Development (ILAC)2. This Initiative has six themes, 26 goals and 32 indicators, and is still under revision by national focal points. Others regions also have core sets of indicators such as OECD countries, and NAFTA countries, among others (ILAC 2006). Among national initiatives the headline indicator system of the UK may serve as a useful example, particularly because of attempts to establish direct links between indicators and the country’s sustainable development strategy. Linking indicators to mainstream policy mechanisms and instruments, such as strategies, integrated development plans or budget processes helps realize the potential of indicators as pivotal decision-making, learning and information tools.
EXAMPLE: GEO core indicator set
As shown in the GEO Core Indicator Data Matrix, the GEO Core Indicator Set is based on a series of theme areas that reflect global issues and trends for selected environmental issues. These theme areas include:
Land; Forests; Biodiversity; Fresh water; Atmosphere; Coastal and marine areas; Disasters; Urban areas; Socio-economic; and Geography.
2 Approved in November 2003 by the Forum of Ministers of Environment of Latin America and Caribbean.
Each year, the list is updated with new indicators, based on the rise and fall of the importance of global issues. Amidst efforts to ensure data are collected using environmental monitoring, surveying and remote sensing, there remain many data gaps. Some examples of these gaps include waste disposal and management, land degradation and urban air pollution (UNEP 2006). Table 1 describes broad themes, issues and provides detailed information about data variables, lead indicators and lead sources for the data. The first section of the framework is shown in the text below, and the remainder of the framework is provided in Appendix A.
Table 1: GEO core indicator data matrix
IEA Training Manual 36
Monitoring, data and indicators Module 4
Theme Issue Potential data variables Proposed key and lead
indicators
Units Current primary (lead) data
source(s), used in GEO Data
Portal
Land Soil erosion - Water erosion (000 tonne/ha)
- Wind erosion (000 tonne/ha)
- Average annual soil erosion
rate
0 nne/ha - UNEP/FAO/ISRIC: GLASOD
Desertification - Area affected by desertification
(000 ha and %) of rain-fed
croplands, irrigated land, forest
and woodlands
- Livestock levels per km2 in
dryand area
- Population living below
poverty line in dryland areas
- Total land affected by
desertification
- Population living below
poverty line in dryland areas
0 , % million,
%
- UNEP/FAO/ISRIC: GLASOD
Land
salinization
- Areas affected by salinization
and waterlogging (000 ha and
change)
- Total area affected by
salinization
0 , % p/y - UNEP/FAO/ISRIC: GLASOD
Forests Forest loss,
forest
resources
management
- Forest management fractions
(% protected)
- Forest change/domestication by
sector (to agric., urban)
- Forest area change (open,
closed, natural forests)
- Deforestation rate (open,
closed, natural forests)
- Reforestation, natural and total,
% success
- Production and trade of forestry
products (wood, paper)
- Intensity of forest use
(harvest/growth)
- Area of forest and woodland
- Proportion of land area
covered by forest
- Exports of forestry products
(%)
- Protected forest area
- Regeneration/afforestation
area
% p/y total, per capita,
%, p/y % p/y % p/y
000 ha, % p/y
- FAO: FRA/SOFO
- FAO: FAOSTAT
- UNSD: UN COMTRADE
database
Degradation of
forest quality
- Volume distribution by major
tree species group within each
- Share of affected forests % of total forest area - FAO: FRA/SOFO
IEA Training Manual 37
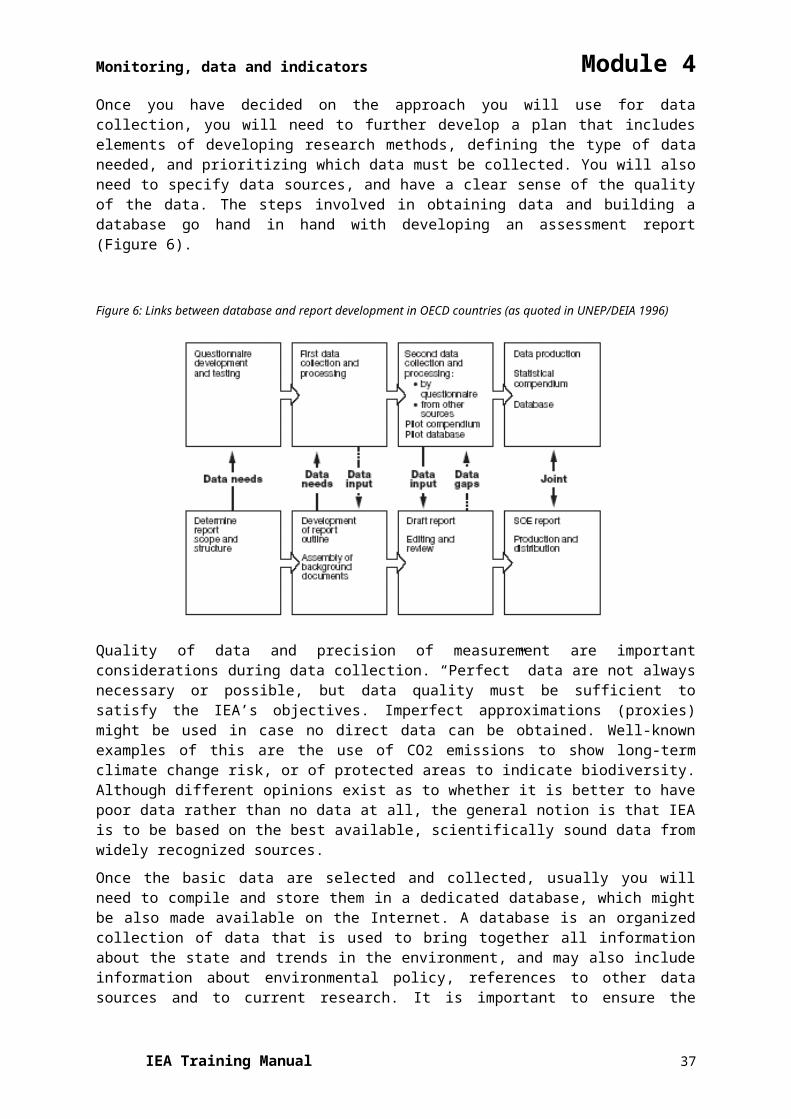
Monitoring, data and indicators Module 4
biome (ha per biome)
- Share of
distributed/deteriorated forests in
total forest area
Biodiversity Loss of species - No. of species known (number)
and threatened species (%) for
vascular plants, mammals, birds,
amphibians, reptiles, freshwater
fishes
- Number of threatened species,
animals and plants
- Threatened animal and plant
species as % of described
species
- Red List Index for birds
No. % - IUCN: Red List of Threatened
Species
Loss of habitat - Recorded wildlife habitat by
ecosystem, for forests (dry,
moist, all forest), wetlands,
mangroves, grassland/savannah,
deserts/scrubland
- Total areas of
wetlands/marshes
- Total mangeove area
- Change in arable land area
0 - Ramsar list
- WWF: Lakes and Wetlands
database, Global ecoregions
- IUCN/WCMC: Protected Areas
Database
- USGS/EDC: Olson World
Ecosys.
- FAO: FAOSTAT
IEA Training Manual 38
Monitoring, data and indicators Module 4
EXAMPLE: UN-DSD Indicator Framework
In 1995, the UN Commission on Sustainable Development (then part of the UN Division for Sustainable Development) approved a work programme on indicators of sustainable development, in response to Chapter 40 of Agenda 21. The work programme included a list of approximately 130 indicators organized in the DSR framework. These, along with their corresponding methodology sheets, were published by the United Nations in 1996 in what became widely known as the first ‘Blue Book’. The indicators were tested in a number of volunteering countries. As a result, the number of sustainable development indicators in the core set was reduced to 58, and the DSR framework was replaced by a thematic framework, organized along the four “pillars” (social, environmental, economic, institutional) of sustainable development. The results were published in the second Blue Book in by UN-DSD in 2001.
In 2005, UN-DSD began a second review of its indicators, which was completed in late 2006 and resulted in a further streamlined and updated set of indicators (UN Department of Economic and Social Affairs, Division for Sustainable Development. 2006). Agreement has been reached to reduce the core set further, to retain the thematic approach, and to divide indicators among the four pillars, since it masks relationships among the issues. For the most up to date listing of the indicators, consult UN-DSD website: http://www.un.org/esa/sustdev/natlinfo/indicators/isd.htm.
Table 2: CSD Theme indicator framework from the UN Division for Sustainable Development, 3nd Edition (2007)
Theme Sub-theme Indicator Core indicator
Poverty Income poverty Percent of Population Living Below National Poverty Line Yes
Proportion of population below International Poverty Line ($1 and/or $2)
Income inequality Ratio of share in national income of highest to lowest quintile Yes
Sanitation Proportion of population using improved sanitation facilities, Yesurban and rural
Drinking water Proportion of population using improved water source, urban Yesand rural
Access to energy Share of households with access to electricity or commercial Yesenergy
Percentage of population using solid fuels for cooking
Living conditions Proportion of urban population living in slums Yes
Governance Good governance Percentage of population having paid bribes Yes
Crime Number of recorded violent crimes and homicides per Yes100,000 population
Health Mortality Mortality rate under 5 years old Yes
Life expectancy at birth Yes
Healthy life years expectancy
Health care Percent of population with access to primary health care Yesdelivery facilities
Immunization against infectious childhood diseases Yes
Contraceptive prevalence rate
Nutritional status Nutritional status of children Yes
Theme Sub-theme Indicator Core indicator
Health status Prevalence of tobacco use
IEA Training Manual 39
Monitoring, data and indicators Module 4and risks Suicide rate
Morbidity of major diseases such as HIV/AIDS, malaria, Yestubercolosis
Morbidity of major childhood diseases such as diarrhea, pneumonia, malaria*
Education Education level Gross intake into last year of primary education, by sex Yes
Net enrolment rate in primary education Yes
Adult secondary (tertiary) schooling attainment level, by sex Yes
Life long learning
Literacy Adult literacy rate, by sex Yes
Demographics Population Population growth rate Yes
Total fertility rate
Dependency ratio Yes
Tourism Ratio of local residents to tourists in major tourist regions and destinations
Natural Vulnerability to Percentage of population living in hazard prone areas, by Yeshazards natural hazards type of natural hazard
Disaster Economic and Human Loss Due to Natural Disasters, as preparedness percentage of population and of GDPand response
Atmosphere Climate change Emissions of greenhouse gases
CO2 emissions, total and by sector Yes
Ozone layer Consumption of ozone depleting substances Yesdepletion
Air quality Ambient concentration of air pollutants in urban areas Yes
Land Land use and Land use change
status Land degradation
Desertification Land affected by desertification
Agriculture Arable and permanent cropland area Yes
Efficiency of fertilizer use
Use of agricultural pesticides
Organic farming as percentage of total farming
Forests Forest Area as a percent of land area Yes
Percent of forests damaged by defoliation
Area under sustainable forest management
Oceans, Coastal zone Algae concentration in coastal waters *
seas and Percentage of total population living in coastal areas Yes
coasts Bathing water quality
Fisheries Proportion of fish stocks within safe biological limits Yes
Theme Sub-theme Indicator Core indicator
Marine Proportion of marine area protected, total and by ecological Yesenvironment region
Marine trophic index
Area of coral reefs
Freshwater Water quantity Proportion of total water resources used Yes
IEA Training Manual 40
Monitoring, data and indicators Module 4Water use intensity by industry Yes
Water quality BOD in water bodies
Concentration of faecal coliform in freshwater Yes
Waste water treatment
Biodiversity Ecosystem Proportion of terrestrial area protected, total and by Yesecological region
Management effectiveness of protected areas
Area of selected key ecosystems
Fragmentation of habitat
Species Abundance of selected key species
Proportion of species threatened by extinction Yes
Invasive species
Economic Macroeconomic GDP per capita Yes
development performance Investment share in GDP Yes
Savings rate
Adjusted net savings rate
Inflation
Sustainable Debt to GNI ratio Yespublic finance
Employment Labor productivity and unit labor costs Yes
Employment-population ratio, by sex Yes
Employment status, by sex
Share of women in wage employment in the nonagricultural Yessector
Information and Internet users per 100 population Yes
communication Fixed telephone lines per 100 population
technologies Mobile cellular telephone subscribers per 100 population
Research and R&D expenditure as percentage of GDPdevelopment
Tourism Tourism contribution to GDP Yes
Global Trade Current account deficit as percentage of GDP Yes
economic Share of imports from developing countries and from LDCs
partnership Average tariff barriers imposed on exports from developing countries and LDCs
IEA Training Manual 41
Monitoring, data and indicators Module 4
Theme Sub-theme Indicator Core indicator
External Total Official Development Assistance (ODA) given or Yesfinancing received as a percentage of GNI
FDI inflows and outflows as percentage of GNI
Remittances as percentage of GNI
Consumption Material Material intensity of the economy Yesand consumption
production Domestic material consumption
patterns Energy use Annual energy consumption per capita, total and by main Yesuser category
Share of renewable energy sources in total energy supply
Intensity of energy use, total and by sector Yes
Waste Generation of waste
generation and Generation of hazardous waste Yes
management Management of radioactive waste
Waste treatment and disposal Yes
Transportation Car share of inland passenger transportation Yes
Road share of inland freight transport
Energy intensity of transport
EXERCISE 2: Identifying indicators and data sets Let’s consider a fictional country that will be called “GEOland.” You are part of the team charged with setting up the first IEA reporting process for this country.
Step 1. As a group, develop a list of short themes required to develop the assessment report. Prioritize the themes according what might be most relevant for GEOland at this time. Form smaller groups, and assign each group a theme.
Step 2. In sub-groups, prepare a list of issues related to the theme of your group.
Step 3. Set up a table to help you organize your thoughts, such as in the following example.
Theme Sub-theme Indicator Core indicator
Step 4. Identify indicators that correspond to each issue. Begin by brainstorming a larger list, and then narrow down your list using the indicator criteria listed in Section 4.1. Indicate whether the indicator is a driver, pressure, state, impact or response in the DPSIR framework.
Step 5. Identify the data you will need for the indicator. There are a number of data sources you may wish to consult.
COMPENDIUM OF ENVIRONMENT STATISTICS IN THE ESCWA REGION
OECD’s “Selected Environmental Data” document at http://www.oecd.org/dataoecd/11/15/24111692.PDF
GEO Data Portal.
FAO Statistical databases (FAOSTAT, Aquastat, Fishstat, Terrastat).
IEA Training Manual 42
Monitoring, data and indicators Module 4
Others listed in the database section of this report.
Materials: A sample of the question completed to help orient participants and trainers.
Methodology sheets As discussed in Section 3.3, metadata—or data on data—consists of background information needed when analyzing data and indicators. Similar to the databases provided through the GEO Portal, methodology sheets outline the metadata for indicators. The type of information varies, and typically includes the definitions, concepts, categories or types of indicators, measurement units and methods, and data sources. An abbreviated sample is shown in Table 3.
Table 3: Sample methodology sheet
Definition of indicator Proportion of population with access to a sanitary facility in the dwelling or immediate vicinity.
Type of indicator State
Underlying Definitions Sanitary Facility: A sanitary facility is a unit for disposal of human excretes which and Concepts includes feces from contact with people, animals, crops and water sources.
Suitable facilities range from simple but protected put latrines to full toilets with sewage. All facilities, to be effective, must be correctly constructed and properly maintained.
Population: this includes the urban and rural population served by connections to public facilities (pits, pour-flush latrines, septic fields).
Unit of Measurement %
Measurement methods May be calculated as: # people with improved disposal facilities available (X 100)/ total population
Data needed to The number of people with access to improved sanitary facilities and total compile indicator population.
Data sources Routinely collected at national and sub-national levels in most countries using census and surveys. In order to arrive at more robust estimates of sanitation coverage, two main state source types are required. First, administrative or infrastructure data which report on new and existing facilities. Second, population-based data derived from some from of national household survey.
References WHO, 2000. Development of Indicators for Monitoring Progress Towards Health for All by the Year 2000, Geneva, WHO, 1981, p.81.
4.2 Indices An index consists of multiple indicators combined into a composite or aggregated unit. In the course of your IEA you have the option of using some accepted aggregate indices, develop new ones or choose to focus only on discrete indicators. While the development of indices is a complex task, indices have the potential to attract decision maker and media attention. In choosing your strategy you need to consider not only the needs of your target audience, but also you capacity to effectively work with aggregates.
Indices make it easier for you to interpret complex information on a wide range of topics. Indices are often used to assess and compare performance against benchmarks or among performers, as this is easier than comparing several discrete trends. They are best used as a starting point for discussion and attracting public interest on an issue. You may also use them as a tool to inform policy, in which case it is paramount that the index is both well constructed and accurately interpreted (Nardo 2005).
There are several potential drawbacks of indices. If poorly developed and communicated, indices can relay misleading information or be misinterpreted, leading to inappropriate policy decisions. Also, because the scope of an index is broad, it may miss specific issues that would otherwise be revealed using discrete indicators. Finally, because an index is ideally based on the best available data and indicators, issues that do not have associated data may not be included in the policy making process.
IEA Training Manual 43
Monitoring, data and indicators Module 4
The selection of indicators for use in the index involves the use of a series of criteria to ensure that appropriate indicators are selected. Select indicators that fit within the overall framework of the index, lend themselves to aggregation, are based on high quality data, and preferably do not highly correlate to each other, as this would amplify the effect of certain indicators within the overall index.
The construction of indices is similar to creating a mathematical model. Indicator data are standardized using statistical tools, such as converting values to a scale of 0–100, so that all indicators can be added together. Indicators are then weighted and combined into a single index. Because the development of an index involves several steps that can result in variations in the final outcome, credibility is greater when the methodology used is transparent and well documented.
A key step in the process of combining indicators into an index involves assigning relative weights to individual indicators. Indicators with a higher weighting more strongly influence the outcome of the index than those with a lower weighting. The decision about how to assign weights can be based on various factors including societal values and indicator relevance to policy, as well as more objective factors, such as the robustness of the data.
If weighting is being determined by societal values and policy relevance, you will need to consult with experts, representatives of the public and politicians to better understand diverse perspectives on the issues. You can ask participants in your assessment process to rank various indicators based on perceived importance, and assign a monetary value to the issues they think are important, or choose indicators using a process of comparison (decision support). As this is very subjective, the weighting could be subject to scrutiny or perceived relevance over time as societal values change.
If weighting is determined using more objective measures, one approach to consider is to base weighting on quality and amount of data. A downside of this approach is that indicators containing lower quality or a smaller amount of data are penalized, even if the indicator reflects an important and relevant issue.
Indicators may also be weighted equally, as this avoids some of the challenges presented in this discussion. This approach could be supported by consultations and statistical tools that show minimal differences among the indicators selected.
To more fully comprehend the message relayed by an index, it is useful to disaggregate the index into component indicators and categories. This gives you a more detailed analysis into specific patterns or to answer questions of decision-makers working in a more detailed context (Nardo 2005).
EXAMPLE: Well-known indices
Gross Domestic Product Gross Domestic Product (GDP) is a well-known index measuring the size of a country’s economy. A common approach to measuring GDP is to add together consumer expenditures, business investments in capital, government expenditures on goods and services and net exports (GDP = C+I+G+NX). While GDP is frequently used as a proxy for standard of living, it is not a true measure of standard of living because only economic activity is shown. A country may have high exports, for example, but a low standard of living because of other factors. Also, a major nuclear accident, natural disaster or marine oil spill will raise the GDP. There are also difficulties when comparing GDP among countries, as different calculations may be used.
Human Development Index The key dimensions of the UN Human Development Index (HDI) are longevity, knowledge and standard of living. For longevity, life expectancy is used to generate a sub-index. Adult literacy and combined primary, secondary and tertiary enrolment ratio are used to generate educational attainment or knowledge sub-index. Adjusted income is used to create the standard of living sub-index. These three sub-indices are arithmetically combined to produce the HDI. More than 170 countries are ranked by this index. HDI also has helped UNDP to generate a family of related indices, such as the Human
IEA Training Manual 44
Monitoring, data and indicators Module 4
Poverty Index (HPI), Gender Related Development Index (GDI), and Gender Empowerment Measure (GEM).
Figure 11 provides a snapshot from the Human Development Index (UNDP 2005).
Figure 11: Human Development Index (UNDP 2005) and HumanDevelopment Index - 2011
Combined gross
enrolment ratio
Human Life Adult for primary, GDP perdevelopment expectancy literacy rate secondary GDP per capitaindex (HDI) at birth (% ages 15 and tertiary capita Life (PPP US$)
value (years) and above) schools (%) (PPP US$) expectancy Education GDP rank minusHDI rank 2003 2003 2003 2002/03 2003 index index index HDI rank
High human development
1 Norway 0.963 79.4 – 101 37,670 0.91 0.99 0.99 2
2 Iceland 0.956 80.7 – 96 31,243 0.93 0.98 0.96 4
3 Australia 0.955 0.83 – 116 29,632 0.92 0.99 0.95 7
4 Luxembourg 0.949 78.5 – 88 62,298 0.89 0.95 1.00 -3
5 Canada 0.949 80.0 – 94 30,677 0.92 0.97 0.96 2
6 Sweden 0.949 80.2 – 114 26,750 0.92 0.99 0.93 14
7 Switzerland 0.947 80.5 – 90 30,552 0.93 0.96 0.96 1
8 Ireland 0.946 77.7 – 93 37,738 0.88 0.97 0.99 -6
9 Belgium 0.945 78.9 – 114 28,335 0.90 0.99 0.94 3
10 United States 0.944 77.4 – 93 37,562 0.87 0.97 0.99 -6
Expected Human Life Average years of average GNI per
Development expectancy schooling years GNI per capita Non incomeIndex (HDI) at birth (years) of schooling capita rank minus related
value (years) (years) (PPP US$ for 2005)HDI rank HDI-value HDI rank 2011 2011 2011a 2011a 2011 2011 2011
High human development
1 Norway 0.943 81.1 12.6 17.3 47,557 6 0.975
2 Australia 0.929 81.9 12 18 34,431 16 0.979
3 The Netherlands 0.91 80.7 11.6b 16.8 36,402 9 0.944
4 United States 0.91 78.5 12.4 16 43,017 6 0.931
5 New Zealand 0.908 80.7 12.5 18 23,737 30 0.978
6 Canada 0.908 81 12.1b 16 35,166 10 0.944
7 Ireland 0.908 80.6 11.6 18 29,322 19 0.959
8 Liechtenstein 0.905 79.6 10.3c 14.7 83,717d -6 0.877
9 Germany 0.905 80.4 12.2b 15.9 34,854 8 0.94
10 Sweden 0.904 81.4 11.7b 15.7 35,837 4 0.936
11 Switzerland 0.903 82.3 11.0b 15.6 39,924 0 0.926
12 Japan 0.901 83.4 11.6b 15.1 32,295 11 0.94
13 Hong Kong 0.898 82.8 10 15.7 44,805 -4 0.91
14 Iceland 0.898 81.8 10.4 18 29,354 11 0.943
IEA Training Manual 45
Monitoring, data and indicators Module 4
15 Korea 0.897 80.6 11.6b 16.9 28,230 12 0.945
16 Denmark 0.895 78.8 11.4b 16.9 34,347 3 0.926
Environmental Performance Index The Environmental Performance Index, released in 2006 by The Yale Center for Environmental Policy and Law, measures policy performance towards two goals: reducing environmental stresses on human health and promoting ecosystem vitality and sound natural resource management. Sixteen indicators express six categories of commonly agreed-upon policy categories: Environmental Health, Air Quality, Water Resources, Productive Natural Resources, Biodiversity and Habitat, and Sustainable Energy (Yale Center for Environmental Policy and Law et al., 2006). The index framework is shown in Figure 12.
Figure 12: Environmental Performance Index framework (Yale Center for Environmental Policy and Law et al., 2006)
IEA Training Manual 46
Monitoring, data and indicators Module 4
Indicator performance is measured using a “proximity-to-target” approach, based on a core set of environmental outcomes linked to policy goals. Countries are also ranked and compared on an issue-by-issue basis. Criteria for indicator selection include relevance, performance orientation, transparency and data quality. The indicators were selected based on a review of environmental policy literature, expert judgment and policy dialogue in the context of the Millennium Development Goals. The targets, which are the same for all countries, were based on international agreements, international standards, national authorities or prevailing consensus among scientists (Yale Center for Environmental Policy and Law, et al., 2006). Indicator weighting occurs using statistical analysis.
EXERCISE 3: Calculating a model Air Quality Index for countries
In principle, a single air quality indicator would combine ambient concentrations of various air pollutants, most notably various sulphur oxides (SOx), nitrogen oxides (NOx), non-methane volatile organic compounds (NMVOC), certain heavy metals (like lead), and particulate matter (PM) of various sizes (i.e., PM10 for particles of 2.5–10 micrometers and PM2.5 for 0–2.45 micrometers). For
IEA Training Manual 47
Monitoring, data and indicators Module 4
many areas, data on the levels of these compounds are not available, or at least not easily found. While a comprehensive global monitoring programme on air quality does not exist, for various large cities in the world at least some figures are known, although the data are not always comparable and often lack regular updating. The OECD reports regularly on urban air pollution for some 40–50 cities in member countries, and in Europe the EEA does similar reporting, but other than that the data are rather dispersed, not always up-to-date, not easily available outside the city, country or region, or do not exist. For more detalis on Air Quality Index (AQI) for Kuwait see page 36 of the link.
Kuwait Air Quality Index (KAQI) The Kuwait Air Quality Index (KAQI) is a simple and easy way for presenting to the public the status
of air quality around the 13 air quality monitoring stations in Kuwait. The purpose of the KAQI is to help you understand what local air quality means to your health. The KAQI tells you how clean or unhealthy your air is, and what associated health effects might be a concern.
Think of the KAQI as a scale that measures from 0 to 500. A value of 100 corresponds to the Kuwaiti
National Ambient Air Quality Standard for the pollutant, which is the level the Environment Public Authority in Kuwait (KEPA) has set to protect public health. The higher the KAQI value, the greater the level of air pollution and the greater the health concern. To make it easier to understand, the KAQI is divided into five levels of health concern of different colors:
The KAQI is calculated for five major air pollutants regulated by the List of Executive Orders
(210/2001) of the National Environment Law No 21 for which the Environment Public
IEA Training Manual 48
Monitoring, data and indicators Module 4
Authority of Kuwait has established national air ambient quality standards to protect public health:
1. Sulphur Dioxide (SO2)2. Nitrogen Dioxide (NO2)3. Ground-Level Ozone (O3)4. Carbon Monoxide (CO)5. Particulate Matter-10 microns (PM-10)
When the KAQI value of any of the above pollutants goes above 100, then the air quality is considered to be unhealthy—at first for certain sensitive groups of people, then for everyone as KAQI values increase.
Source:
http://www.beatona.net/CMS/index.php?option=com_content&view=article&id=61&Itemid=84&menuid=&lang=en
In cases where direct measurements are not available for deriving or constructing an indicator, one can try to find approximate or indirect variables (proxies), which are not prefect but are still considered good enough for the intended purpose. In case of air quality, instead of air concentrations, emissions are often used, deals with the apparent sources of air pollution and for which data are usually better available. But even then, proxies are sometimes used, such as SO2 for SOx, NO2 for NOx, and PM10 for all small particulates. In addition, various emissions (e.g., from road transport) are not measured directly, but estimated on the basis of underlying activities in the economy (e.g., for transport the number of cars in a country, the type of engines they use, etc.).
For the purpose of this exercise—how to construct an indicator from data variables—we will derive a virtual air quality index (AQI) for a country and use Kenya as an example. However, you are invited to do this exercise for another country, or other area like a city, of your choice.
Kenya’s virtual AQI will be derived by combining emissions of SO2, NOx and NMVOC using a hypothetical formula created for this exercise. Data for other substances, like PM10 or PM2.5 emissions are not available. Many countries report CO2 and other GHG emissions to UNFCCC as required of participating developed countries under the UN Framework Convention on Climate Change (UNFCCC) and the Kyoto Protocol. Other emissions are often reported to UNFCCC, but still many data gaps persist making it very difficult to show comprehensive time-series. Various emission estimations for countries, regions and the world as a whole are provided by several agencies, including the Carbon Dioxide Information and Analysis Center in the United States (CDIAC), the International Energy Agency in Paris (IEA) and the Environment Assessment Agency in Netherlands, formerly part of RIVM (RIVM/MNP).
Here we will try to calculate a simple, virtual AQI for Kenya for the year 1995, using data from RIVM/MNP and CDIAC through the GEO Data Portal.
1. Log on to GEO Data Portal web site. In the search box, type “SO2.” Choose the national “Emissions of SO2 – Total (RIVM/MNP)” option, and press continue. Select the data for the year 1995, and press continue. Fill out the following table.
Answers:
IEA Training Manual 49
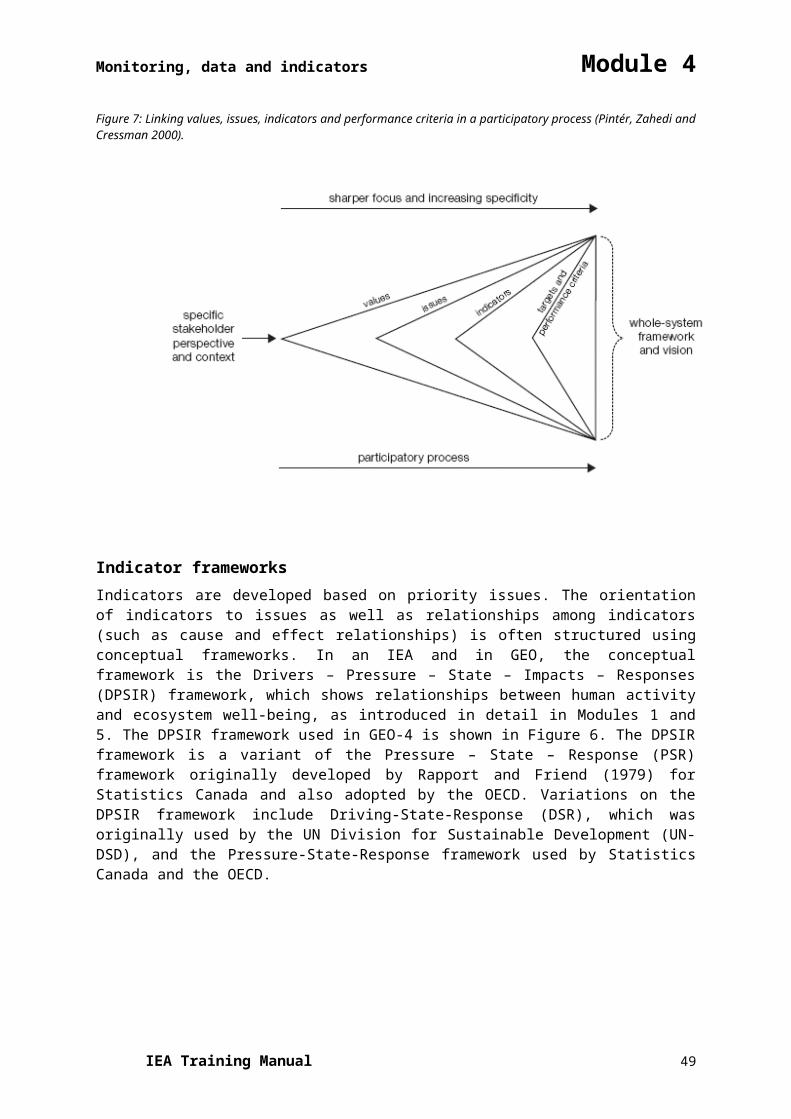
Monitoring, data and indicators Module 4
2. Repeat this query for the compounds of NOx and NMVOC Answers:
3. Summarize Kenya Air Emission Indicators
4. Using this data, complete the following formula to elaborate Kenya’s Air Quality Index (AQI):
Answers:
5. Similarly , repeat the AQI calculation for the countries of West Asia or North Africa and create a bar graph and a map to visualize the differences. Try to rank West Asian or North African countries among all countries of the world.
6. Using the US EPA’s AIRNow air quality index, http://airnow.gov/index.cfm?action=aqibasics.aqi AIRNow
what can you say about air quality in each of WA country?
IEA Training Manual 50
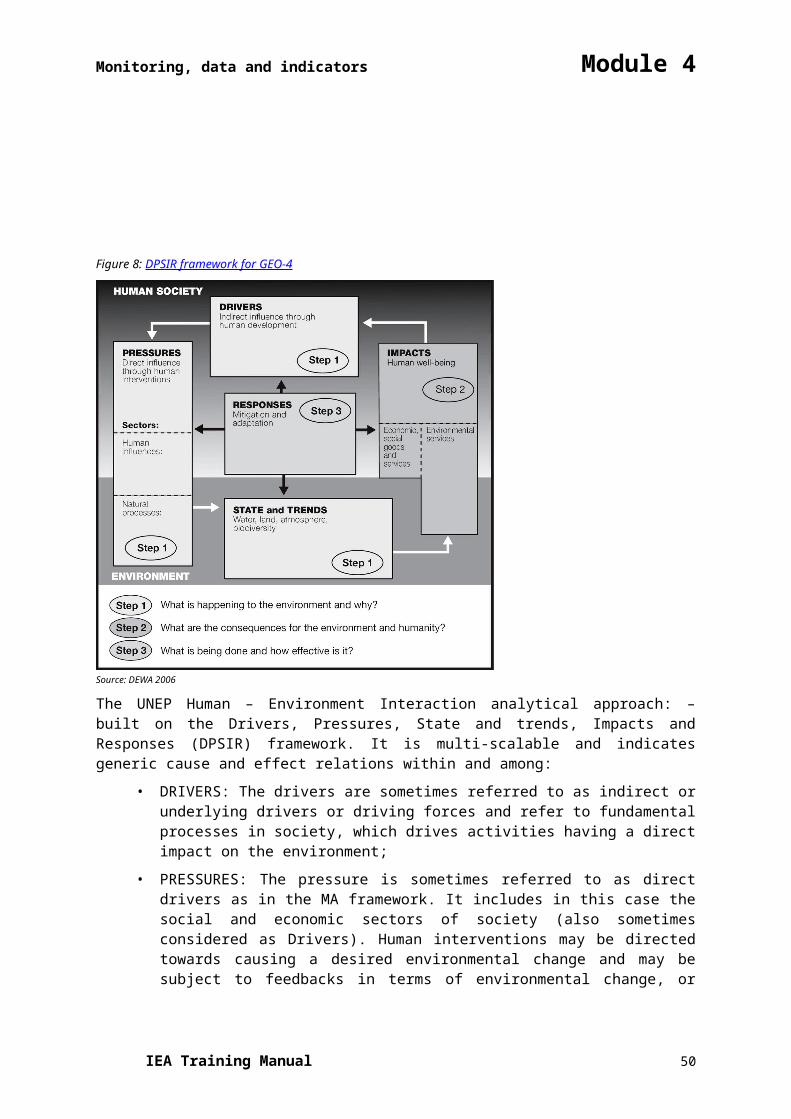
Monitoring, data and indicators Module 4
0 200 400 600 800 1000 1200 1400
Bahrain
Kuw ait
Oman
Qatar
Saudi Arabia
United Arab Emirates
Yemen
Iraq
Jordan
Lebanon
Palestinian Territory, Occupied
Syrian Arab Republic
1990 1995 2000
The purpose of the AQI is to help understand what local air quality could mean for public health. To make it easier to understand, the AQI is divided into six categories:
Each category corresponds to a different level of health concern. The six levels of health concern and what they mean are:
Good: The AQI value for your community is between 0 and 50. Air quality is considered satisfactory, and air pollution poses little or no risk.
Moderate: The AQI for your community is between 51 and 100. Air quality is acceptable; however, for some pollutants there may be a moderate health concern for a very small number of people. For example, people who are unusually sensitive to ozone may experience respiratory symptoms.
Unhealthy for Sensitive Groups: When AQI values are between 101 and 150, members of sensitive groups may experience health effects, because they are likely to be affected at lower pollution levels than the general public. For example, people with lung disease are at greater risk from exposure to ozone, while people with either lung disease or heart disease are at greater risk from exposure to particulate pollution. The general public is not likely to be affected when the AQI is in this range.
Unhealthy: Nearly everyone will begin to experience health effects when AQI values are between 151 and 200. Members of sensitive groups may experience more serious health effects.
Very Unhealthy: AQI values between 201 and 300 trigger a health alert, meaning everyone may experience more serious health effects.
Hazardous: AQI values over 300 trigger health warnings of emergency conditions. The entire population is more likely to be affected.
IEA Training Manual 51
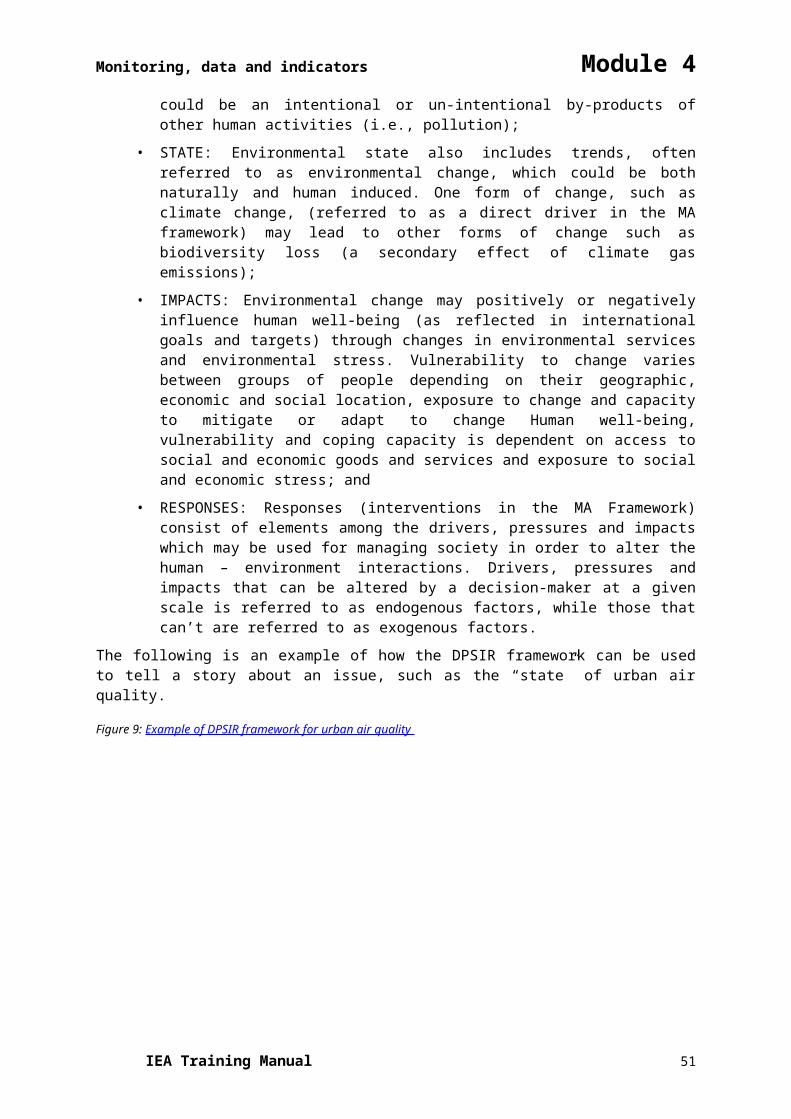
Monitoring, data and indicators Module 4
5. Data analysis To this point, you have walked through the process of obtaining data and developing indicators and indices. The importance of all of this work now culminates as we review the process of how to analyze the information you have obtained and packaged. The following section will review aspects of non-spatial and spatial analysis of data. You may wish to refer to Module 7 for further information about physical product outcomes as it considers in a more in-depth presentation and communication of the IEA report.
Non-spatial analysis includes performance evaluation, along with trend, correlation and graphical analysis. Also included is the presentation of indicators using symbols. This is followed by a review of spatial analysis using GIS.
5.1 Non-spatial analysis
Performance evaluation Indicators become especially useful when they can be interpreted in the context of performance. Distance to a specified target is a common way of measuring performance. These measures also promote accountability to policy-makers, particularly when policies are linked to environmental performance. The latter is of increasing interest, as seen by the release of the Environmental Performance Index in 2006.
Baselines, thresholds and targets are ways of measuring changes in the system compared with previous states or future desired states. Baselines allow us to monitor either positive or negative changes in a system, based on the initial state of the system. It is important that baseline information is present at the beginning of a project to monitor changes over time. Thresholds allow us to monitor activities that may result in negative activities; the AQI discussed above has a threshold of 151, beyond which most people will experience health impacts. Thresholds can act as our “alarm systems,” enabling us to take preventative action. Targets indicate goals for performance, and enable us to monitor positive progress towards the goal. Targets are often used for projects when sustainable development or improving the system is a goal (Segnestam 2002).
A limitation of performance targets is lack of scientific information that tells us what the actual target should be. In place of empirical data, targets are sometimes determined by consensus based on best available knowledge, which means the chosen targets may or may not be the most appropriate ones for the system. Nevertheless, targets developed in this way can be useful mechanisms for mobilizing strategic action at the policy level. Globally, performance indicators are used to assist countries or regions in monitoring their compliance with globally agreed-upon goals and targets. A well-known example is the Millennium Development Goals, defined by the UN General Assembly in 2000.
Trend analysis Trend analysis is instrumental in understanding how the data are functioning over time, sometimes against targets, baselines and/or thresholds. Various possibilities exist to present the trends, which can easily lead to different interpretations and conclusions. For example, the presentation of an indicator as absolute value, percentage or index can make an important difference. If we look at the global supply of renewable energy when displaying the trend in terms of totals (kilotons of oil equivalents, Figure 13) or shares (%, Figure 14), then we see little change: the supply of total biofuels goes up a little bit, but most others are more or less stable. In fact, the shares hardly change at all. The message from these graphs simply be “renewable energy has not shown significant changes since 1990,” which from an environmental point of view is rather disappointing.
However, when we show an indexed change with 1990 set at 100 (Figure 15), we can clearly depict the increase in the supply of wind and solar energy. Thus, the message now could be “renewable energy has shown a substantial increase since 1990, in particular for the supply of wind and solar energy”—which is much more positive message from an environmental perspective.
IEA Training Manual 52
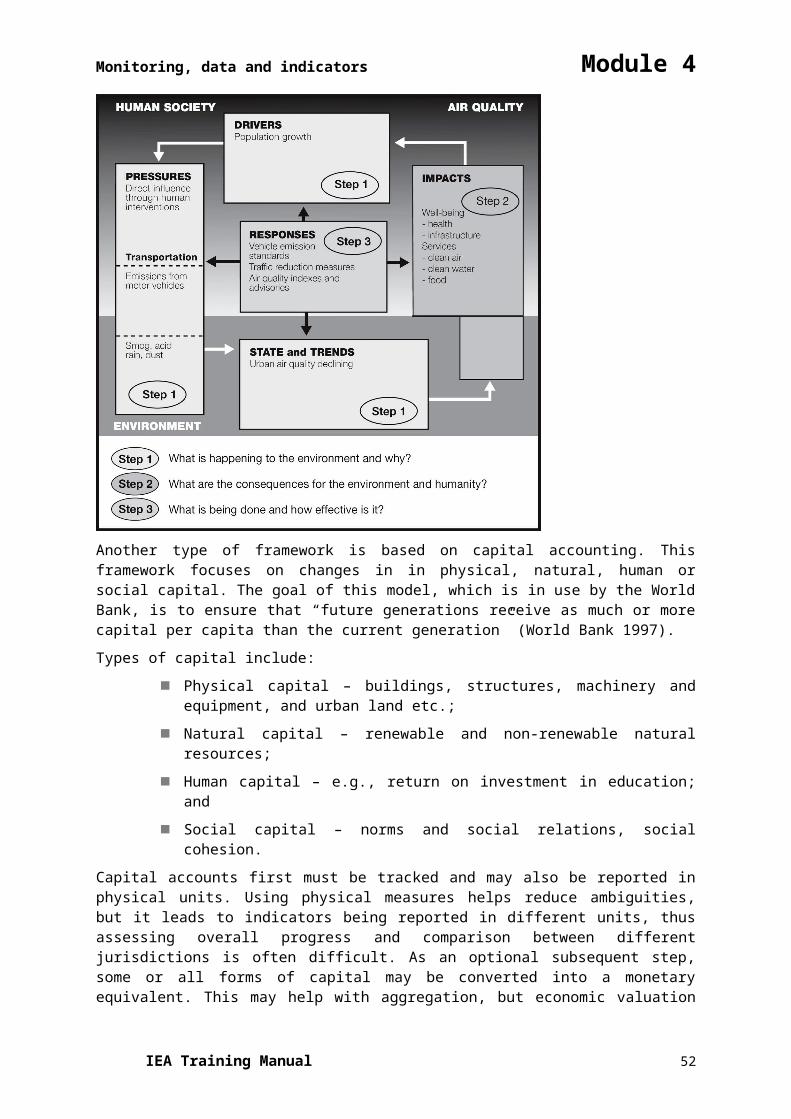
Monitoring, data and indicators Module 4Figure 13: Renewable energy supply, total (UNEP Global Environmental Outlook, 2006)
Figure 14: Renewable energy supply, % (UNEP Global Environmental Outlook, 2006)
IEA Training Manual 53
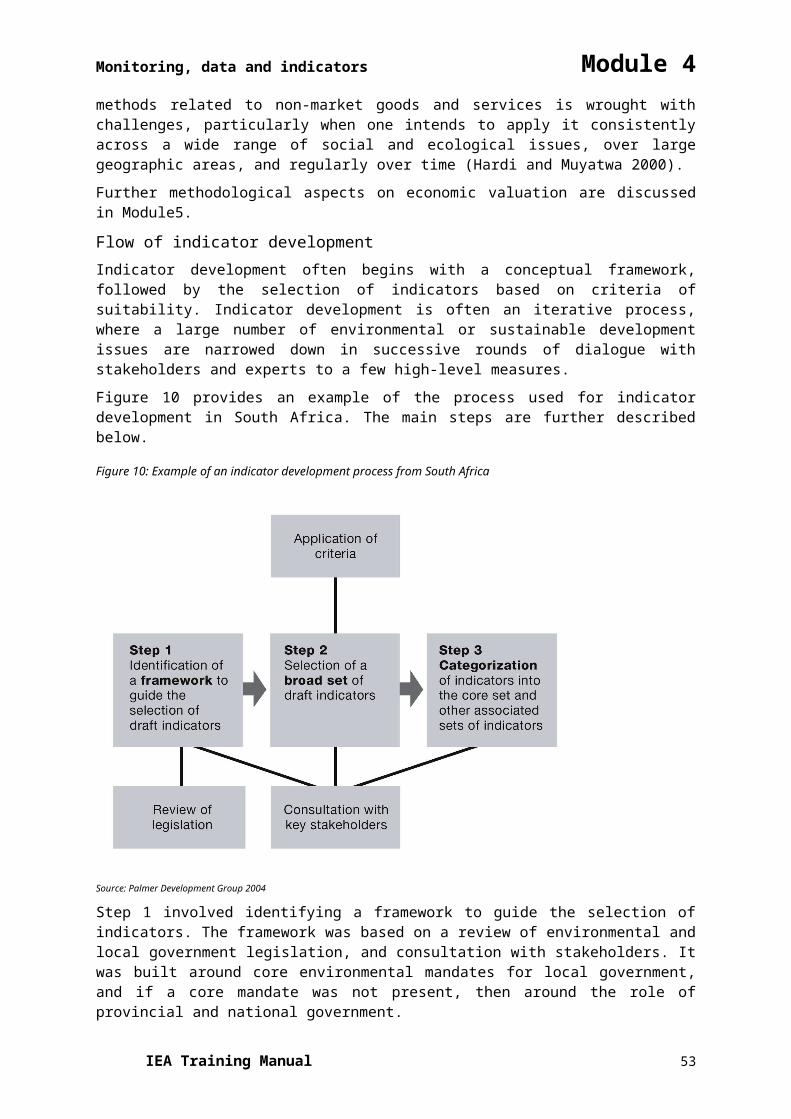
Monitoring, data and indicators Module 4
Figure 15: Renewable energy supply, index (UNEP Global Environmental Outlook, 2006)
Another example is the use of appropriate scales on the X and Y-axis. For example, the following two fictive graphs created for this Module (Figures 16 and 17) can give quite different impressions. At a glance, one could easily say that Figure 16 does not show a trend at all, while Figure 17 presents a stable situation. However, they are derived from the very same data and only differ in the Y-axis scale.Figure 16: Graph Showing Erratic Pattern
Figure 17: Graph Showing Stable Pattern
IEA Training Manual 54
Monitoring, data and indicators Module 4
Correlation analysis Correlation analysis assists us in understanding the degree to which variables are related to one another, but does not show cause and effect. Correlated data are presented on a graph, with one variable on the Y-axis and the other on the X-axis. A positive correlation is shown when the scatterplot moves in an upward direction, from lower left to upper right. When variables are negatively correlated, the scatterplot line will run from the upper left to the lower right. The closer the correlation coefficient is to +1 or -1, the stronger the relationship between the two variables, and the straighter the line on the graph.
EXAMPLE – Correlation analysis and the Environmental Performance Index
There appears to be a statistically significant correlation between the Environmental Performance Index and GDP per capita (Figure 18). This indicates that countries that are more developed tend also to have higher environmental performance, from a policy perspective. While the trend shows that wealthier countries tend to have better performance, there is much variation in environmental performance scores among groups of countries located at both ends of the diagram. This indicates that among wealthy countries, the wealthier countries do not necessarily have better environmental performance, and likewise environmental performance varies among poor countries.
Figure 18a: Relationship of EPI and GDP per capita (Source: Yale Center for Environmental Law and Policy et al., 2006), 18b : Relationship of EPI and GDP per capita for some Arab countries.
Algeria
Egypt
Jordan
Mauritania
Sudan
Lebanon Om
an
Saudi A
rabia
Syria Tunisia
United Arab Em.
Yemen
20
30
40
50
60
70
80
0 5000 10000 15000 20000 25000 30000
GDP per capita
Envi
ronm
enta
l Per
form
ance
Inde
x
Presenting indicators using symbols In addition to presenting indicators in graphical form, you can also use symbols (Figure-19) to depict the status of indicators. Symbols communicate complex information in ways that are easily and quickly understood. Changes in the value of the indicator may be shown using up and down arrows, and an indication of whether the change is favourable or unfavourable may be shown using, for example, a happy/frown face or green and blue colours.
IEA Training Manual 55
Monitoring, data and indicators Module 4Figure 19: Some indicators from State of the Environment Abu Dhabi, 2006.
EXAMPLE:
DISCUSSION QUESTION Consider the pros and cons of different approaches to presenting indicators to different
audiences.
Who are the different audiences that would see the indicators?
What information needs does each audience have?
What are some ways you can provide the technical information needed while at the same time making the indicators visually captivating?
IEA Training Manual 56
Marine
Marine
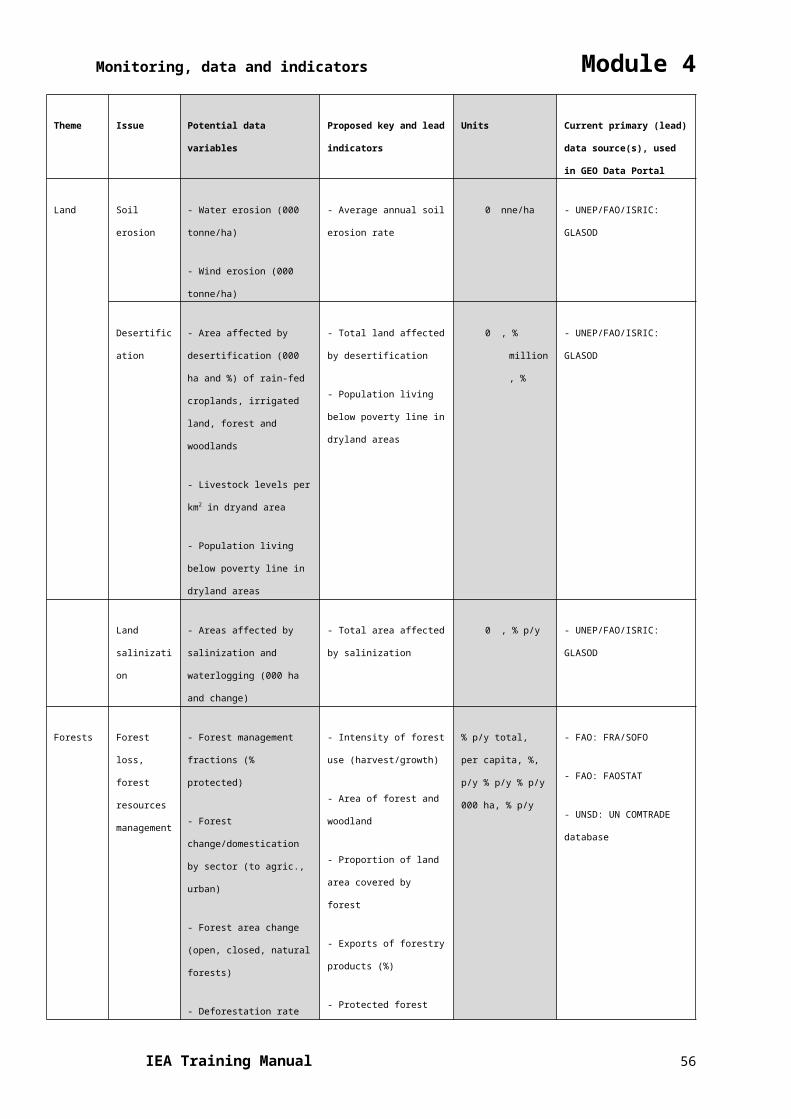
Monitoring, data and indicators Module 4
5.2 Spatial analysis
Using Geographic Information Systems (GIS) for IEA Spatial analysis is the process of modelling, examining and interpreting spatial data and any associated databases. Spatial analysis is a powerful and useful tool for interpreting and understanding geographic areas, evaluating suitability and capability of natural areas, or for estimating and predicting impacts of human development. An example of a spatial analysis you might perform is to overlay several layers of data to show the proximity of different features, such as human encroachment into natural wetland or forest areas, and to identify changes in the boundaries of natural areas over time. Spatial analysis is typically done using various types of computer software, one of which is a GIS.
Mastering the use of spatial analysis tools and methods typically involves years of study and practice, and often is a career choice. It is assumed that participants in this training program are more high level users of the results of spatial information who have or have access to staff with specialist knowledge. However, it is also assumed that reviewing some typical uses of spatial information in IEA would be of benefit. This is neither comprehensive nor in-depth, but provides a starting point for more detailed exploration of the required methods and capacities.
Geographic Information Systems Geographic Information Systems are database management systems for handling geographic data. Each geographic feature in a GIS has a location on the earth, and a known relation to everything else around it. These GIS systems can manage data on everything from roads, buildings and utilities, to land use, habitat, and natural areas. Data associated with every feature include its geographic position and related properties. For example, information about a river or waterway may include its water storage capacity, flow rate, nutrient status and depth.
Not only can you use a GIS to store data, but it is also a useful tool for manipulating and analysing data, particularly to examine spatial relationships among landscape features, and in monitoring long-term changes. For example, using GIS you can easily calculate the area of forested lands within 100 m of a particular road, and identify with point locations where critical or protected areas may be. You could also utilize maps for change detection analysis (determining loss of natural habitats from one time period to the next) that can be used to influence government policies and programmes (Boxes 7 to 10).
GIS is not only a storage and analysis tool, but it is a very powerful visual and universal language. GIS systems are clearly of great value to environmental managers. They exist as standalone data management systems, and can perform analysis of complex data. Simulations and models can be presented in a GIS to help predict potential impacts and future changes under current management programmes or environmental conditions.
IEA Training Manual 57
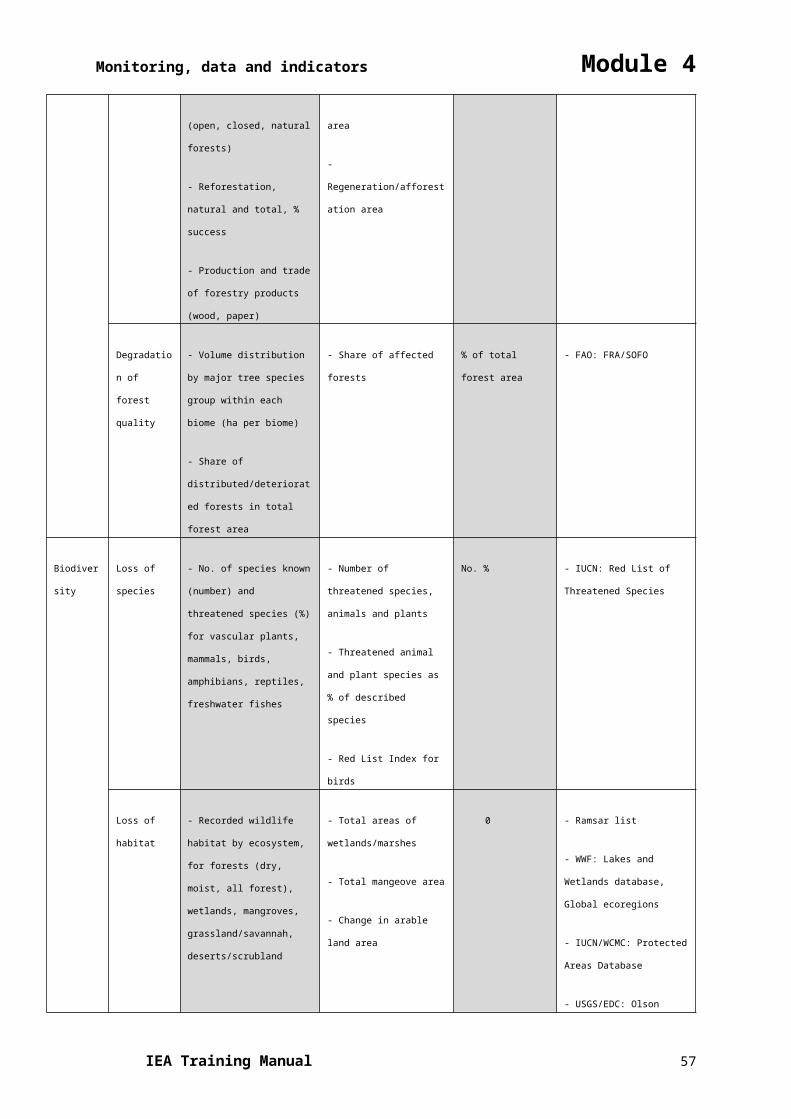
Monitoring, data and indicators Module 4
Box 6: Assessment of rangeland degradation and development of a strategy for rehabilitation
This study used satellite data from different sensor systems to analyze and explain the causes, processes, and impacts of desertification in a Steppe grazing area in Syria, with the aim of supporting the formulation of a strategy for rehabilitating desertified areas. Through the mapping of parameters such as barley fields, eolian sand distribution, and drainage patterns from Thematic Mapper (TM) data, it was identified barley cultivation as one major reason for increased sand erosion or its downhill deposition. With regard to the degradation of natural vegetation covers, the study discriminate between climate-triggered and human-induced vegetation degradation by analyzing the natural response pattern of vegetation to rainfall. For the monitoring of vegetation covers, composited 10-day interval 8-km Advanced Very High Resolution Radiometer (AVHRR) Normalized Difference Vegetation Index (NDVI) data from 1981 to 1996 were used. A consistently changing response of vegetation to rainfall over this time period, expressed in the residuals of the NDVImax/Rainfall linear regression calculations, is interpreted as nonclimate or human driven, where correlations between residuals and the time of their occurrence produce correlation coefficients >|0.6|. Pixels showing a negative temporal trend in residuals coincide with areas that are most heavily used by humans. Heavily used areas were located through detecting nomadic campsites from Indian Remote Sensing Satellite (IRS)-1C data. By combining campsite distribution with census data, such as flock size, average annual offtake, and grazing habits, grazing pressures were assessed and put them in relation to the natural resources. This information provided the basis for the definition of protected areas or rehabilitation plots, and for elaborating measures to support the Steppe dwellers.
Source: Geerken, R. and Ilaiwi, M., 2004. Assessment of rangeland degradation and development of a strategy for rehabilitation. Remote Sensing of Environment,Volume 90, Issue 4, 2004, pp 490-504.
IEA Training Manual 58
Monitoring, data and indicators Module 4
Box 7: . Impact of Climate Change Vulnerability Assessment – Case of Bahrain
In order to assess the impact of SLR on coastal zone resources, Geographical information systems (GIS) and remote sensing (RS) techniques were used to quantitatively assess the extent and impact of SLR on coastal zones of Bahrain islands. Basic data sets include building a digital elevation model (DEM) and producing a classified satellite imagery (captured in 1995). SLR scenarios were created assuming different values, starting from 20 cm sea-level rise to 100 cm (the worst scenario). Vulnerable areas by sectors and land use classes were calculated mathematically by overlaying the classified image over the DEM image. The calculated percentage provides an indication of the degree of vulnerability of a specific sector to the SLR and the future impacts that might be experienced.
The study shows that some of the coastal areas in Bahrain will be inundated by seawater. This will bear significant socio-economic and ecological implications since infrastructure and economic activities are concentrated at the coastal zones. Under the modest conservative SLR scenario (20cm SLR), nearly 5% of the total area of Bahrain will be in danger of inundation. Whereas approximately 7% and 10% of the total area of the country will be inundated due to 50 and 100 cm SLR respectively.
IEA Training Manual 59
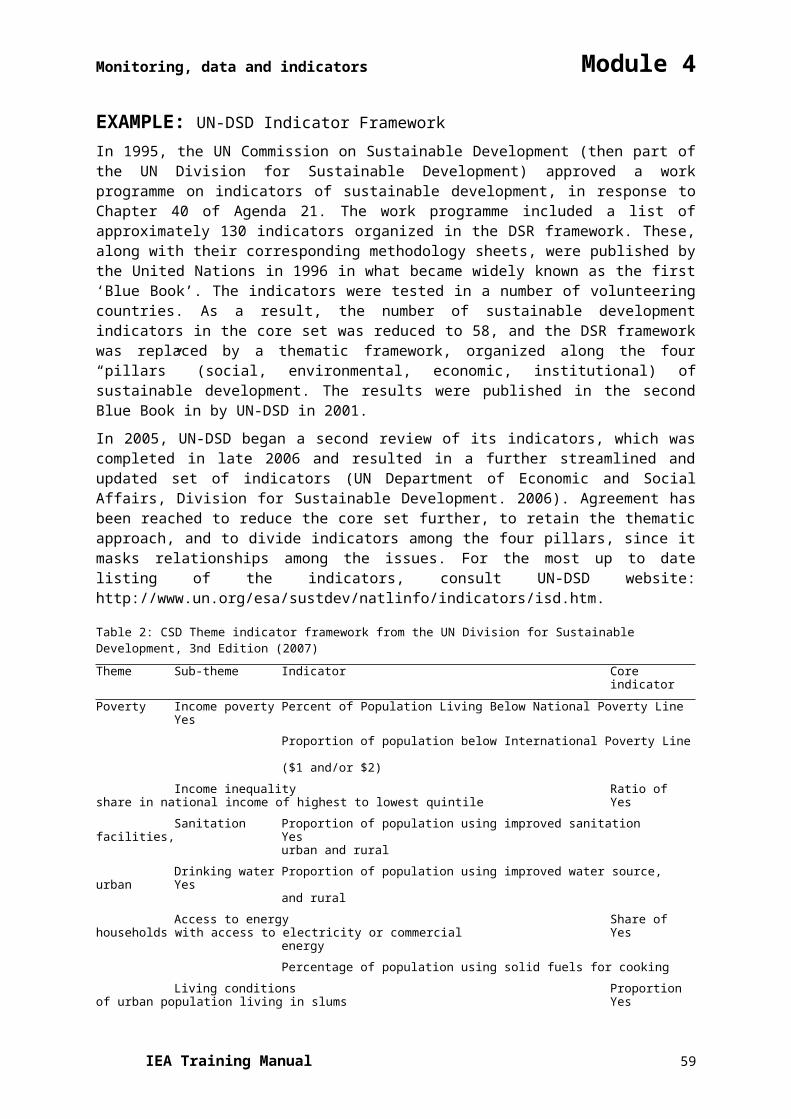
Monitoring, data and indicators Module 4
Al-Jenied, S. and Abido, M. 2004. Impact of Climate Change Vulnerability Assessment. General Commission for the Protection of Marine Environment and Wildlife. Kingdom of Bahrain. 46p.
The Nile Delta in 2002 . The image shows the area with a sea level rise of 0.5 m and 1m.
Source: UNEP 2002, Environment Outlook for the Arab Region (EOAR) Report, 2010
IEA Training Manual 60
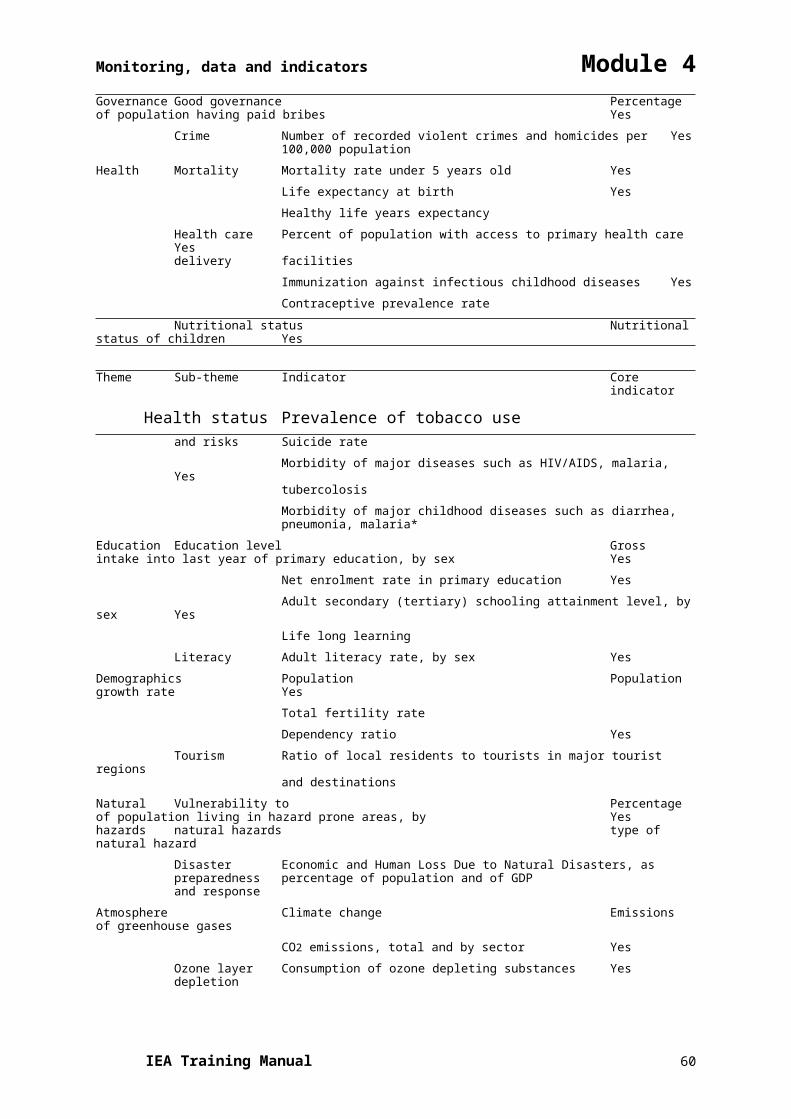
Monitoring, data and indicators Module 4
Box 8. UNEP project to help manage and restore the Iraqi Marshlands
Iraqi Marshlands Observation System (IMOS)
The Mesopotamian marshlands, the largest wetland ecosystem in West Asia, now cover only seven per cent of their original area due to mismanagement over the past three decades. The marshlands, which are reputed to be the site of the Garden of Eden, are an important sanctuary for migratory birds, sustain freshwater fisheries and are an essential nutrient source for fisheries in the Sea Area of the Regional Organization for the Protection of the Marine Environment (ROPME). In the early 1970s, the marshlands covered more than 20 000 km2 but by 2000, over 90 per cent had dried out, largely transformed into a vast and barren landscape of desert and salt flats. A third of the remaining 1084 km2 of marshland, the transboundary Al-Hawizeh/Al-Azim marsh, which straddles the Iran-Iraq border, dried out between 2000 and early 2003.
However, signs of an environmental turnaround in the marshlands started to emerge almost immediately after the end of the war in May 2003, as the arid land was re-flooded for the first time in a decade. Formerly dry areas have been inundated as floodgates were opened, embankments and dykes breached, and dams emptied upstream, assisted by the heavy rainfall.
Since May 2003, rapid and significant changes have been occurring in the Iraqi Marshlands. After over a decade of desiccation and decline, almost 58% of the original marshlands has now been inundated. This re-flooding process continues unabated.
The Iraqi Marshlands Observation System (IMOS) is aimed to monitor the extent and distribution of re-flooding developments and the associated changes in vegetation cover during this critical phase is part of the data collection and analysis component of the UNEP “Support for Environmental Management of the Iraqi Marshlands” project implemented by the International Environmental Technology Centre (DTIE/IETC) and funded by the Government of Japan through the UN Development Group Iraq Trust Fund. The IMOS has been designed, coordinated and implemented by UNEP’s Post Conflict Branch (PCoB) in collaboration with DEWA/GRID-Europe, and in consultation with DTIE/IETC.
http://imos.grid.unep.ch/ GEOYEAR Book, 2003 , 2004. http://www.unep.org/Geo/yearbook/yb2003/046.htm
GEOYEAR Book. 2004. http://www.unep.org/Geo/yearbook/yb2004/057.htm
IEA Training Manual 61
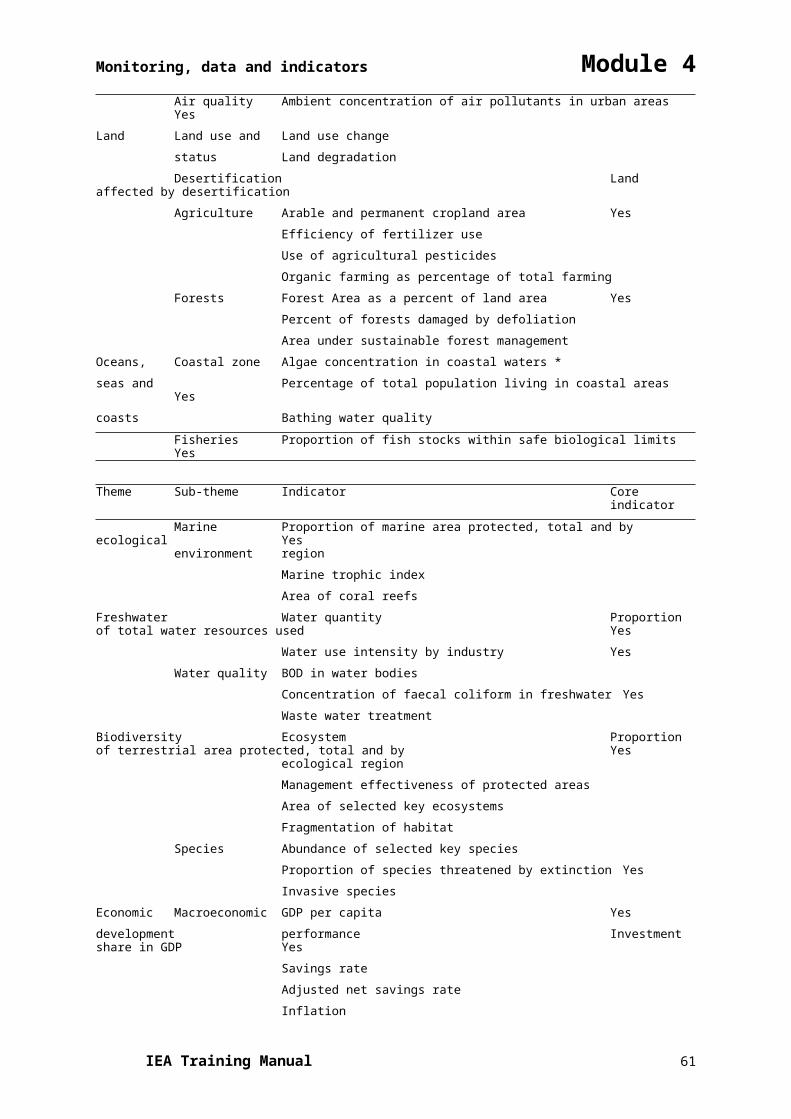
Monitoring, data and indicators Module 4
A satellite image available from various sources showing degradation of wetlands in Egypt from 1987 till 1993
Source: Environment Outlook for the Arab Region (EOAR) Report, 2010Environment Outlook for the Arab Region (EOAR) Report, 2010
Box 9: Oil Spill Along the Lebanese Coast
In the summer of 2006, military conflict between Lebanon and Israel led to an oil spill along the coast of Lebanon. Between July 13 and 15, 2006, damage to the Jiyyeh Power Station released thousands of tons of oil along the coast of Lebanon. The spill was expected to affect fishing and tourism industries, as well as local wildlife. Because cleanup efforts could not safely begin until the hostilities ended, the oil slick continued to spread in the Mediterranean Sea in early August 2006.
The Advanced Spaceborne Thermal Emission and Reflection Radiometer (ASTER) on NASA’s Terra satellite took this picture of the region on August 10, 2006. In this image, the oil slick appears as a slightly darker shade of blue on the ocean surface, and it is easier to see in the enlarged area around Beirut at lower right. The slick spreads from the power plant at the southern end of the image to well north of the city of Beirut. The oil initially moved away from the coast, but some officials feared that it might return to the shoreline. The intensely urbanized area of Beirut appears in shades of gray, with straight lines and sharp angles marking the city’s features. In contrast, patches of green appear along Lebanon’s rough terrain to the east.
IEA Training Manual 62
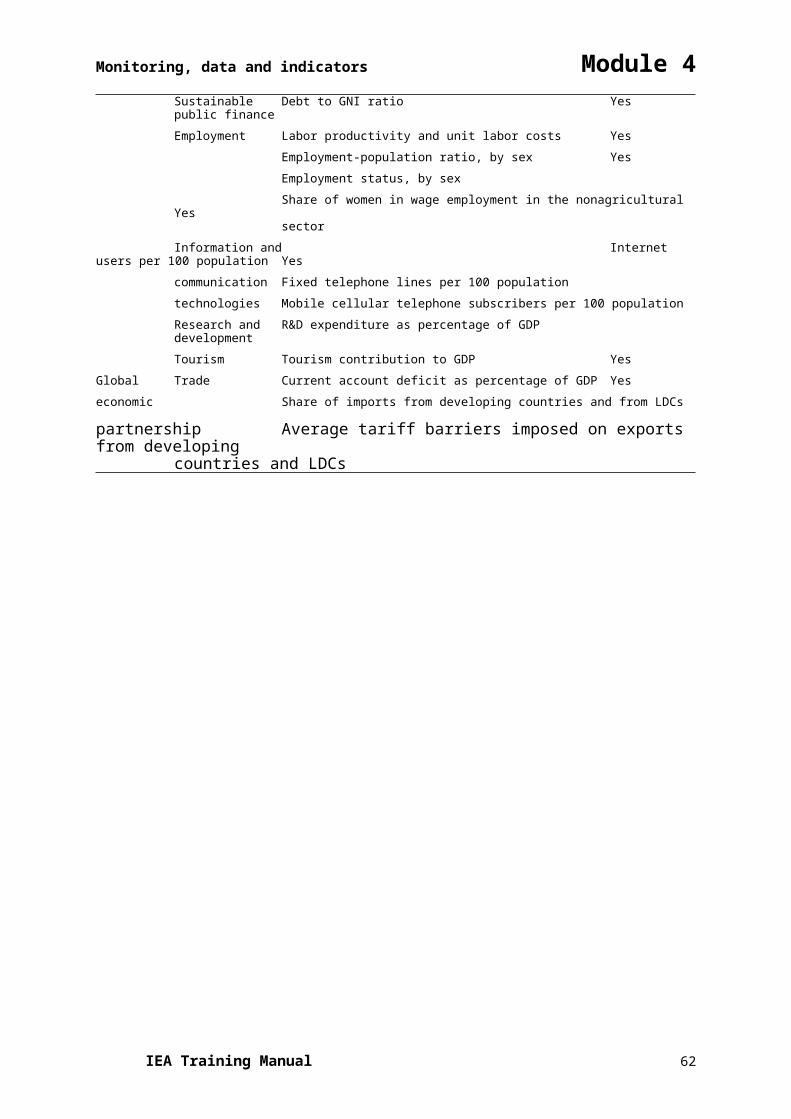
Monitoring, data and indicators Module 4
Pollution from an oil slick on the Lebanese Coast , August 17-22, 2006Source: http://earthobservatory.nasa.gov/IOTD/view.php?id=6845
EXERCISE 4: Using GIS in IEA reporting
In small groups, discuss the following questions.
Using the maps provided, what can you tell about changes that may have occurred in the Dubai coastal area between 1973, 1990 and 2006?
Give examples of other spatial data layers (Iraq) that could be overlaid and integrated for further analysis.
References
IEA Training Manual 63
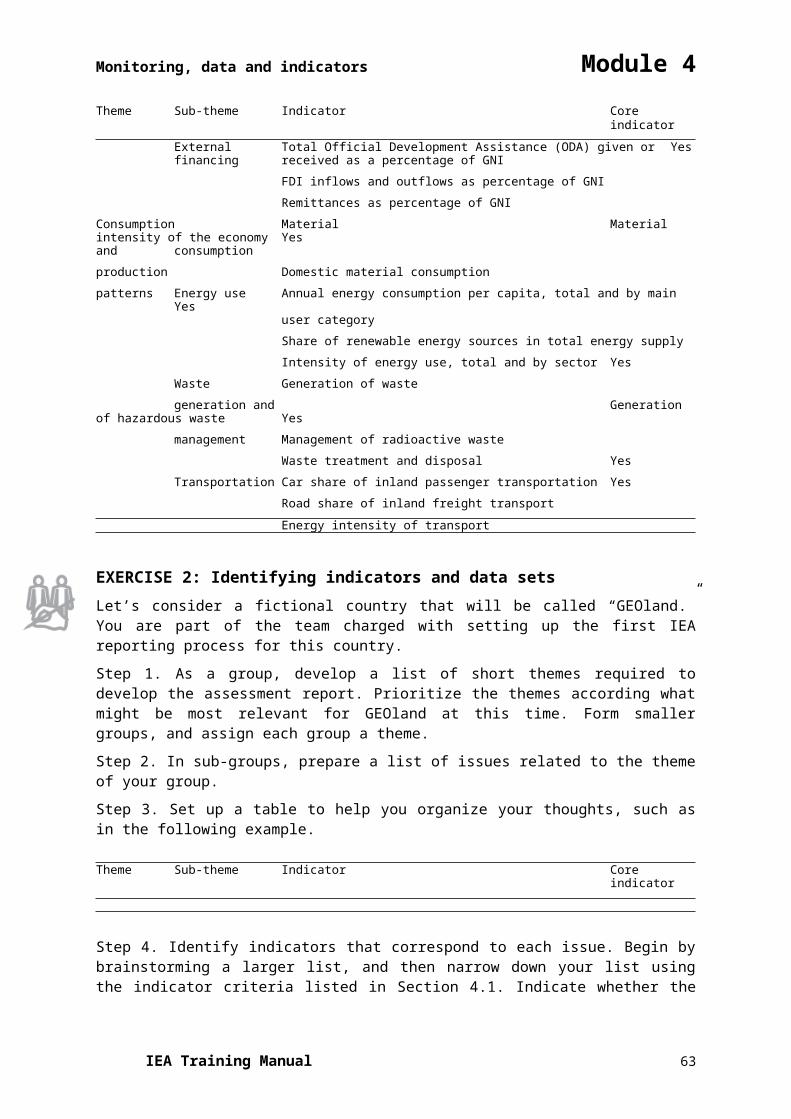
Monitoring, data and indicators Module 4
Abdel-Kader, Adel F. (1998). Introducing Environmental Information Systems. Presented at Regional workshop on Environmental Information Systems, Manama, Bahrain, 11–14 May 1998.
Asian Development Bank (ADB) (2002). “Handbook of Environment Statistics.” http://www.adb.org/documents/handbooks/environment/default.asp [cited 30 March 2006].
Australia Department of the Environment, Sport and Territories (1994). “State of the Environment Reporting: Framework for Australia.” Commonwealth of Australia. http://www.deh.gov.au/soe/publications/framework1.html [cited 3 August 2006].
Caspian Environment Programme (2003). “Caspian Desertification.” http://www.caspianenvironment.org/cd/menu2.htm [cited 30 March 2006].
DEFRA. 2006. Sustainable Development Indicators in Your Pocket. London, UK: Department for Environment, Food and Rural Affairs. < http://www.sustainable-development.gov.uk/progress/dataresources/documents/sdiyp2006_a6.pdf> [cited 1 April, 2007]
(DEFRA) Department for Environment, Food and Rural Affairs, 2006b. UK Government Sustainable Development Framework indicators. London, UK: Department for Environment, Food and Rural Affairs. http://www.sustainabledevelopment.gov.uk/progress/national/framework.htm [cited 3 April 2007]
European Environment Agency (2006). “EEA multilingual environmental glossary.” http://glossary.eea.eu.int/EEAGlossary/I/indicator [cited 30 March 2006].
Food and Agriculture Organization (FAO) and Danish International Development Agency (DANIDA) (1999). “Guidelines for the Routine Collection of Capture Fishery Data.” FAO/DANIDA Expert Consultation, Bangkok, Thailand, 18-30 May 1998. FAO Fisheries Technical Paper 382. http://www.fao.org/documents/show_cdr.asp?url_file=/DOCREP/003/X2465E/x2465e00.htm [cited 30 March 2006]
Grosshans, R., Wrubleski, D. and Goldsborough, L., (2004). Changes in the Emergent Plant Community of Netley-Libau Marsh Between 1979 and 2001. Occasional Publication No. 4, Delta Marsh Field Station, University of Manitoba. http://www.umanitoba.ca/delta_marsh/pubs/04/op4.pdf [cited 30 March 2006].
Gutiérrez-Espeleta, E. (1998). Designing Environmental Indicators for Decision Makers. Invited Paper. Proceedings. Joint Conference of the International Association of Survey Statisticians and the International Association for Official Statistics. National Institute of Statistics, Geography and Informatics. Aguascalientes, México.
Hardi, P. and Muyatwa, P. (2000). “Review Paper on Selected Capital-Based Sustainable Development Indicator Frameworks.” National Round Table on the Environment and the Economy. http://www.nrteetrnee.ca/eng/programs/current_programs/SDIndicators/Program_Research/Abstract_IISD_Capita l-Based_E.htm [cited 30 March 2006].
Iniciativa Latinoamericana y Caribeña (ILAC) (2006) “GEO Portal de Datos para América Latina y el Caribe.” http://www.geodatos.org/ [cited 30 March 2006].
Meadows, D. (1998). Indicators and Information Systems for Sustainable Development. A Report to the Balaton Group, September 1998. The Sustainability Institute, Hartland.
Nardo, M., Saisana, M., Saltelli, A. Tarantola, S., Hoffman, A. and Giovannini, E. (2005). “Handbook on Constructing Composite Indicators: Methodology and User Guide.” OECD Statistics Working Paper. STD/DOC(2005)3. http://www.oecd.org/std/research [cited 30 march 2006].
National Geographic Society. (2006) “GIS Day – Resources and Support” http://www.gisday.com/support/index.html [cited 3 March 2007].
Organization for Economic Co-operation and Development (1993). “Core Set of Indicators For Environmental Performance Reviews” Environment Monographs N° 83. http://www.virtualcentre.org/en/dec/toolbox/Refer/EnvIndi.htm [cited 30 March 2006].
IEA Training Manual 64
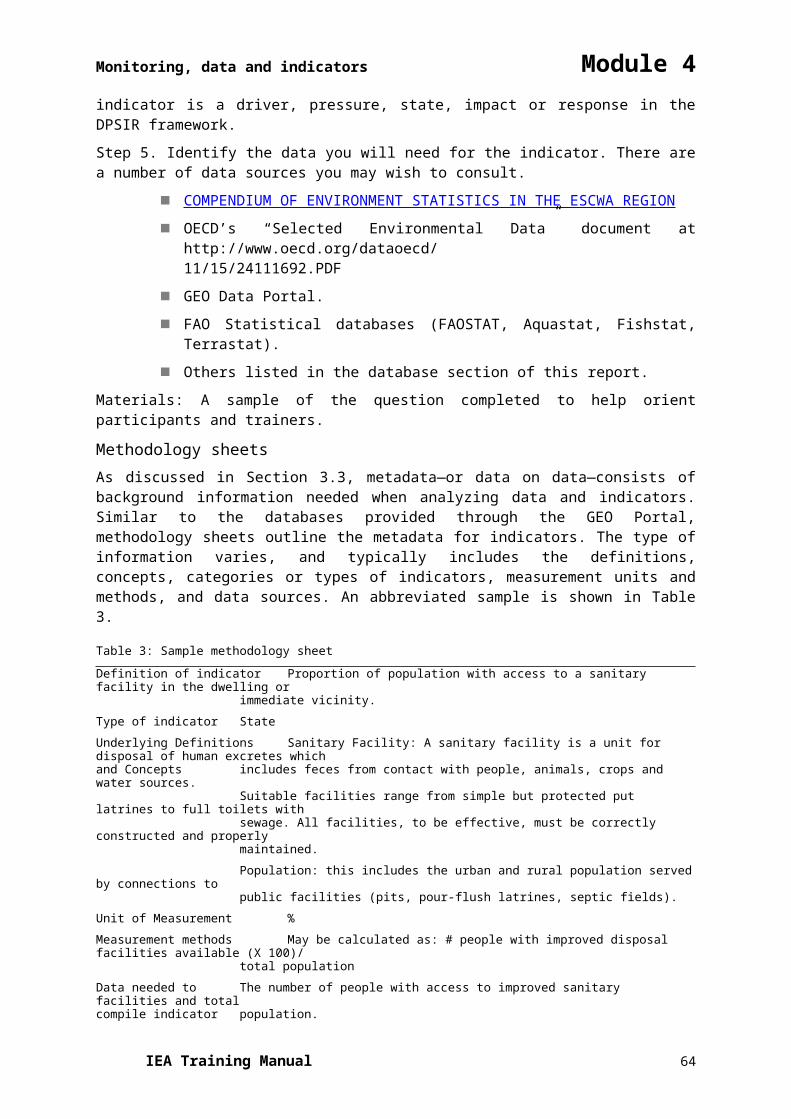
Monitoring, data and indicators Module 4
Palmer Development Group (2004). “Development of A Core Set Of Environmental Performance Indicators, Final Report and Set of Indicators.” Department Of Environmental Affairs and Tourism, South Africa. http://www.environment.gov.za/soer/indicator/docs/local_level/EPI%20Final%20Report.pdf [cited 30 March 2006]
Pintér, L., K. Zahedi and D. Cressman. (2000) “Capacity building for integrated environmental assessment and reporting. Training manual.” Second edition. Winnipeg: IISD for UNEP.
Rapport, D. and A. Friend. (1979) “Towards a comprehensive framework for environmental statistics: a stress-response approach,” Statistics Canada Catalogue 11-510 (Minister of Supply and Services Canada, Ottawa).
Rosenberg, J.M. (1987). Dictionary of Computers, Information Processing, and Telecommunications. 2nd edition. John Wiley, New York.
Segnestam, L. (2002). “Indicators of Environment and Sustainable Development: Theories and Practical Experience.” Environmental Economics Series, Paper No. 89. http://siteresources.worldbank.org/INTEEI/9362171115801208804/20486265/IndicatorsofEnvironmentandSustainableDevelopment2003.pdf [cited 30 March 2006].
UK Sustainable Development (2006). “UK Government Sustainable Development Framework indicators.” http://www.sustainable-development.gov.uk/progress/framework/index.htm [cited 30 March 2006].
UN Department of Economic and Social Affairs, Division for Sustainable Development (2001). “Indicators of sustainable Development: Guidelines and methodologies.” http://www.un.org/esa/sustdev/natlinfo/indicators/indisd/indisd-mg2001.pdf [cited 27 June 2006].
UN Department of Economic and Social Affairs, Division for Sustainable Development (2005). “Indicators of Sustainable Development: CSD Theme Indicator Framework.” http://www.un.org/esa/sustdev/natlinfo/indicators/isdms2001/table_4.htm [cited 30 March 2006].
UN Division for Sustainable Development (2001). “CSD Theme Indicator Framework.” (Second Blue Book.) http://www.un.org/esa/sustdev/natlinfo/indicators/isdms2001/table_4.htm (cited 13 August 2006).
UN Development Programme (2005). “Human Development Report 2005. International cooperation at a crossroads: Aid, trade and security in an unequal world. http://hdr.undp.org/reports/global/2005/ [cited 30 March 2006].
UN Department of Economic and Social Affairs, Division for Sustainable Development. (2006) Third, Revised CSD Indicators of Sustainable Development – Fact Sheet. New York: UN DESA, Division for Sustainable Development. <http://www.un.org/esa/sustdev/natlinfo/indicators/factSheet.pdf > [Cited 1 April, 2007]
UNEP (2006). “GEO Indicators.” GEO Yearbook 2006. http://www.unep.org/geo/yearbook/yb2006/076.asp [cited 6 April 2006].
UNEP (1994). Environmental Data Report 1993–94. United Nations Environment Programme. Oxford.
UNEP/DEIA, Rump, P.C. (1996). State of the Environment Reporting: Source Book of Methods and Approaches. UNEP/DEIA/TR.96-1, UNEP, Nairobi.
UNEP Division of Early Warning and Assessment (2006). “DPSIR Adapted Framework.” GEO 4 – Drafts. http://dewa03.unep.org/geo/tiki-index.php [cited 30 March 2006].
UNEP Division of Early Warning and Assessment (2006). “Integrated Environmental Assessment and Reporting In Africa: A Training Manual Draft.” UNEP, Nairobi. http://www.unep.org/dewa/africa/docs/en/IEA_training_manual.pdf [cited 30 March 2006].
IEA Training Manual 65
Monitoring, data and indicators Module 4
UNEP Economics and Trade Programme (2002). “UNEP Environmental Impact Assessment Training Resource Manual, Second Edition.” http://www.unep.ch/etu/publications/EIAMan_2edition_toc.htm [cited 30 March 2006].
UNEP Global Environment Outlook. “GEO Data Portal.” http://geodata.grid.unep.ch/ [cited 30 March 2006].
UNEP Global Environment Outlook.(2006) “GEO Data Portal – UNEP/GEO Core Indicators” http://geodata.grid.unep.ch/extras/indicators.php [cited 3 March 2007].
(UNEP RRC.AP) UNEP Regional Resource Centre for Asia and the Pacific (2000) Environmental Indicators. http://www.rrcap.unep.org/projects/envIndicators.cfm [cited 3 April 2007]
UN Statistics Division (2003). “Integrated Environmental and Economic Accounting 2003. http://unstats.un.org/unsd/envAccounting/seea.htm [cited 30 March 2006].
Yale Center for Environmental Law and Policy (YCELP) and Center for International Earth Science Information Network (CIESIN) Columbia University, with the World Economic Forum, and Joint Research Centre (JRC) of the European Commission (2006). Pilot 2006 Environmental Performance Index. http://sedac.ciesin.columbia.edu/es/epi/ [cited: 30 March 2006].
World Bank (1992). Environmental Assessment Sourcebook. Washington.
World Bank (1997). “Expanding the Measure of Wealth Indicators of Environmentally Sustainable Development.” Environmentally Sustainable Development Studies and Monographs Series, No. 17. Washington. http://wwwwds.worldbank.org/servlet/WDS_IBank_Servlet?pcont=details&eid=000009265_397111315094 9 [cited 20 March 2006].
IEA Training Manual 66
Monitoring, data and indicators Module 4
Appendix A: Continuation of GEO Core Indicator Matrix Theme Issue Potential data variables Proposed key and
lead indicators
1 2 3 4
Biodiversity Wildlife • Trade in flora and fauna (birds, reptiles, • Net trade in wildlife and (continued trade plants, mammals, butterflies, ornamental fish) captive-bred.species
from Table 1) Overfishing • Total inland, fresh water and marine fish • Total and per capita catch, production, consumption and trade marine fish catch
• Total fish catch in inland waters (incl. aquaculture)
Protected • National, international and local parks and • Total protected areas areas protected areas: Biosphere reserves (terr. (number, size) and %
and marine), Wetlands of international of total landimportance, World heritage sites • Marine protected areas
in LMEs
Freshwater Freshwater • Annual internal renewable water resources • Annual internal renewable resources • Annual river flows from/to other countries, water resource per
by basin capita• Annual freshwater use by sector (domestic, • Annual freshwater use
industry, agric., following ISIC classes) per capita• Annual groundwater recharge • Population with • Annual groundwater withdrawals by sector water stress
Water • River pH, concentrations of oxygen (DO, • BOD level of most quality BOD), coliforms, particulates (TSS, TDS), important rivers
nitrates (NO3, NH4, NP), phosphor (PO4), • Nitrates level of most metals (HMs), pesticides important rivers
• Fish biodiversity (reserves, specie no.) • Coliform count per • Groundwater pH, concentrations of nitrates, 100 ml)
TDS (salinity), iron, chlorides, sulphates • Pesticides concentrations • Waste Water Treatment: % served, public in most important rivers
expenditures
Atmosphere Climate • Anthropogenic emission of GHG (CO2, CH4, • GHG, NOx, SO2 change N2O, also HFCs, PFCs, SF6), total and by emissions total and
sector (transport, industry, agric., livestock, per capitafossil fuels) • GHG, NOx, SO2
• Emissions of precursors (NOx, CO, NMVOC, emissions per $USCH4), total and by sector • Global mean
• Emissions of acidifying gases (NH3, NOx, temperature riseSO2), total and by sector • Global mean
• Atmospheric concentration of GHG, CO, concentration of CO2, SO2, NOx, NH3, PM, Pb, VOC, O3 SO2 NOx, PM10
• Glacier retreat • Fossil fuel • Annual change of temp., precip. consumption share• Fossil fuel supply (% and intensity) • Renewable energy• Rainwater pH for selected areas supply index• Expenditures on air pollution abatement
and control
IEA Training Manual 67
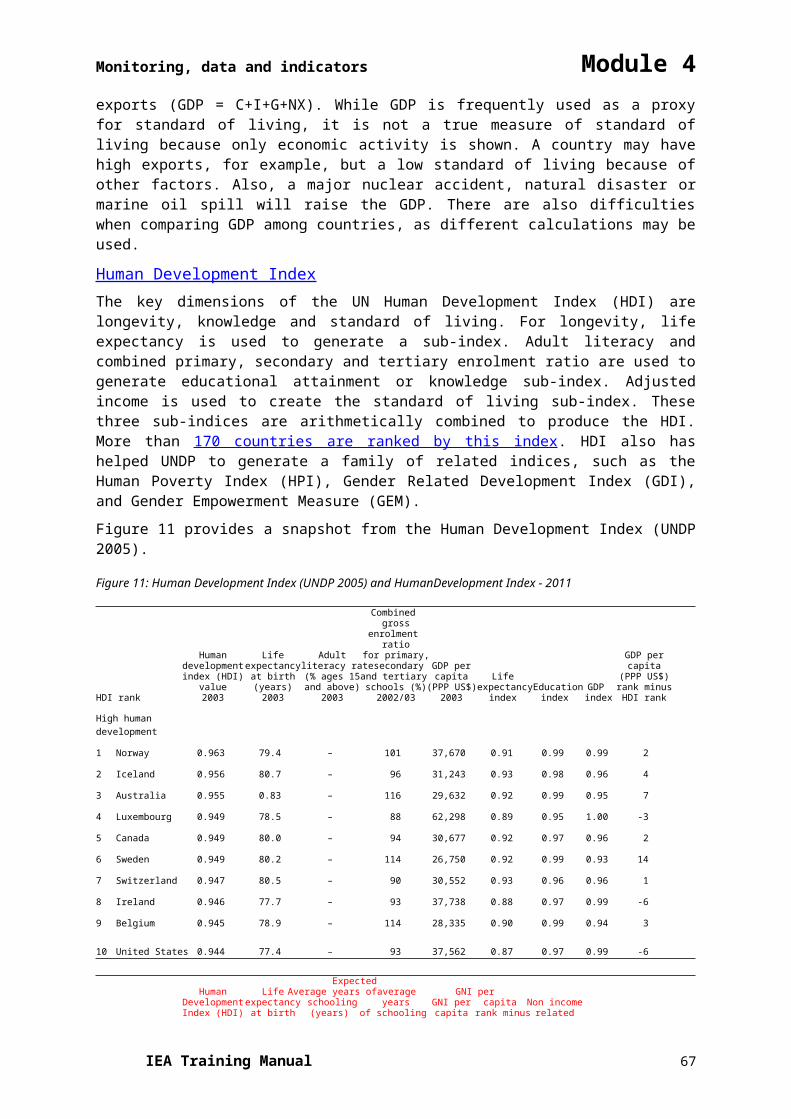
Monitoring, data and indicators Module 4
Theme Issue Potential data variables Proposed key andlead indicators
1 2 3 4
Stratospheric • Production, consumption, import and • Total ODS productionozone export of CFCs, Halons, HCFCs, Methyls, by compounddepletion CCl4, MeBr • Total CFC, HCFC and
• Atmospheric ODS concentration over MeBr consumptionselected cities (parts per trillion)
• Ozone levels/total ozone column over selected cities (Dobson units)
• Ground level UV-B radiation over selected cities
Coastal and Coastal and • Average annual sediment load • Average annual sediment marine areas Marine • Average annual untreated waste disposal load
pollution by sector (dom. ind. and agric. – fertilizers, • Average annual untreated pesticides/insecticides) waste disposal by
• Discharge of oil into coastal waters sector (dom./ind./agric., (000 tonne) fertilizers, pesticides/
• Concentrations of HMs (Hg, Pb, Cd, Cu, insecticides)Fe, Mn, Ni, Co) • % of urban population
• Concentration of PCBs living in coastal areas• Industrial activities in coastal region • Area of Exclusive • Share of pollution caused by sector Economic Zone (EEZ)
(domestic, industrial, urban, coastal, transport, refineries)
• Coastal population (growth, urban share)• Tourist arrival in coastal marine areas
(million/year)• Number of hotels/resorts in coastal
areas (000)
Disasters Natural • Occurrences, financial damage and • Total number of disasters casualties (people affected, homeless, natural disasters p/y
injured, killed) related to floods, droughts, • Number of people killed cyclones, earthquakes, landslides, volcanic by natural disasters, eruptions, forest fires per mln
• Economic loss due to natural disasters
Human- • Occurrences, financial damage and • Total number of induced casualties (people affected, homeless, techn. accidents p/ydisasters injured, killed) related to transport and • Total number of
industrial accidents people affected by technological accidents
• Economic loss due to techn. accidents
Urban areas Urbanization • Urban population, total, growth rate • Average annual urban • Number of cities with over 750 000 population growth rate
population
Urban air • Concentration of pollutants in cities • Concentration of lead, pollution PM, SO2, NOx in major
cities of the world
IEA Training Manual 68
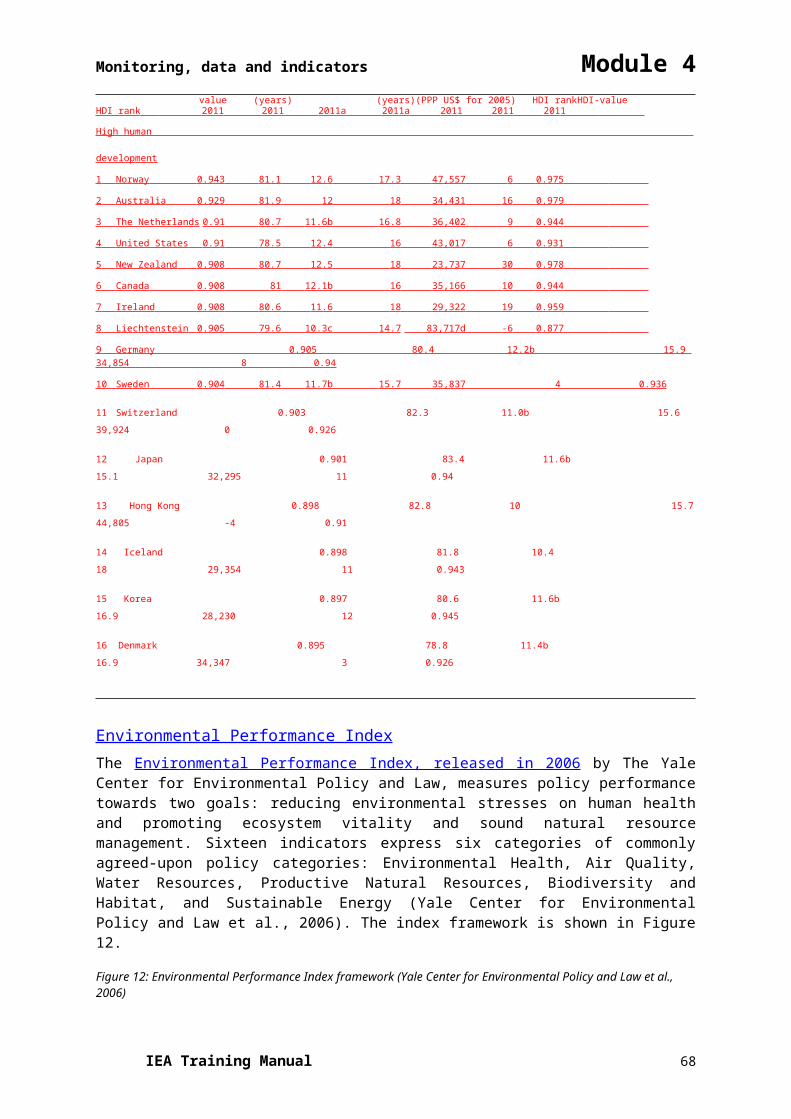
Monitoring, data and indicators Module 4
Theme Issue Potential data variables Proposed key andlead indicators
1 2 3 4
Waste • Waste generation and disposal methods • Municipal waste management by sector: municipal, industrial, agricultural, production per capita
hazardous (solids)• Industrial waste
generated per US$• Hazardous waste
production per US$• Movement of hazardous
wastes• Waste management
fractions• Exposure to HMs, toxic
chemicals• Share of recycled waste
Socio- Population • Population, total and growth rate • Average annual economic and social • Total fertility rate population growth rate(incl. health) • Adult literacy (%) by sex • Population density
• Education enrolment, net and gross (primary, changesecondary, tertiary), by sex
• Education expenditures (prim., sec., tert.)• Labour force total (% population), by sector
(agric., ind., serv.) and by sex• Telephones (main lines and cellular per
100 people)• Daily newspapers (copies per 100 people)• Radios (number per 100 people)• Televisions (number per 100 people)• Computers (number per 100 people)• Internet connections (number per 10 000
people)
Economy • Real GDP, total and per capita, annual • GDP per capita• Power Purchasing Parity (PPP) • PPP per capita• Number of people in absolute poverty, • Value added as % of
rural and urban GDP by sector: • Merchandise exports (value), total and by agriculture, industry,
sector: manufacturing, fuels/minerals/ servicesmetals, services
• Merchandise imports (value), total, food, fuels• Trade (% of GDP)• Terms of trade (1995=100)• Inflation, consumer prices (annual %)• Unemployment rate (%)• Total external debt total and % of GNP• Total debt service (as % of exports of
goods and services)• Foreign direct investment, net inflows
(% of GDP)• Official Development Assistance and Aid
(ODA)
IEA Training Manual 69
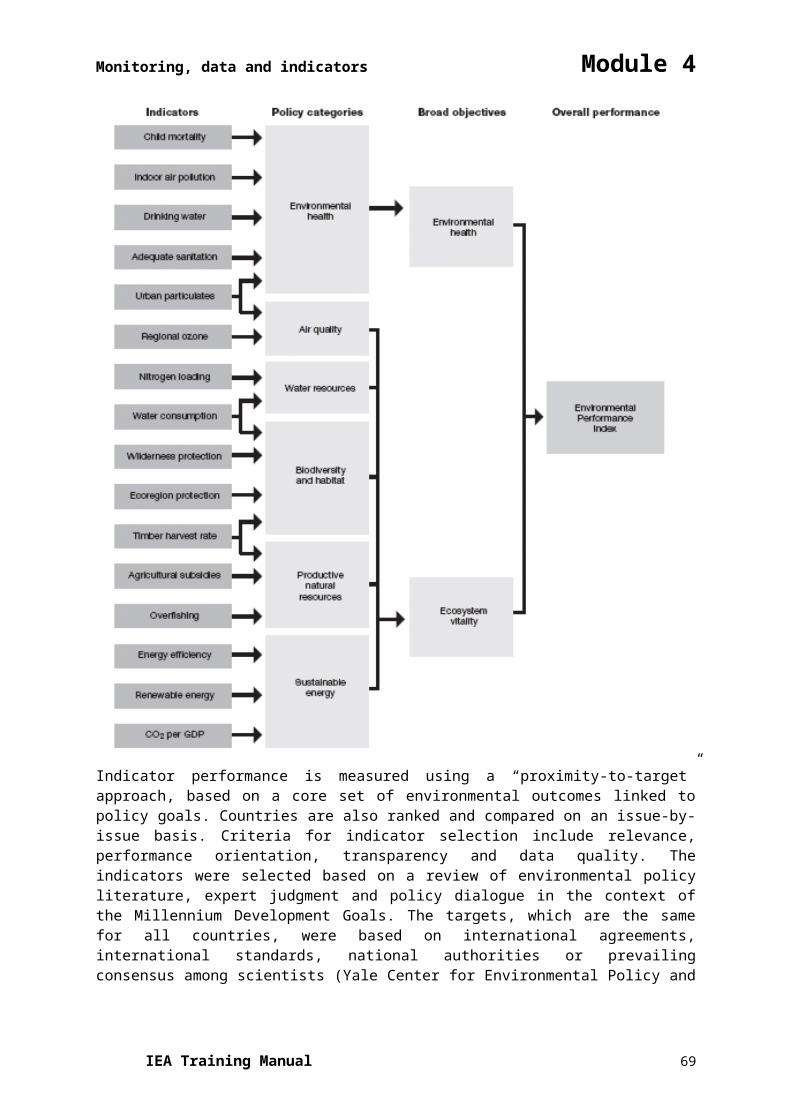
Monitoring, data and indicators Module 4
Theme Issue Potential data variables Proposed key andlead indicators
1 2 3 4Consumption • Total commercial energy production, by • Total commercial and sector: fossil fuels, hydro, nuclear, energy productionproduction geothermal, biomass, solar, wind • Commercial energy
• Total commercial energy use, total and consumption per capitaper capita • Energy use per unit
• Energy efficiency and intensity GDP• Traditional fuel use (% of total energy
consumption)• Energy imports, net (% of energy
consumption)• Renewable energy use (%)• Total electricity generation by sector:
thermal, hydro, nuclear, non-hydro, renewables
• Total electricity consumption• % population with access to electricity• Value added by sector: agric., ind., manuf.,
services• Distribution of GDP by demand sector:
government consumption, private consumption, gross domestic investment, gross domestic saving
• Defence expenditures (% of GDP)
Transport • Motor vehicles in use (per 000 people), • Road traffic intensity by type of engine per unit of GDP
• Total length of motor ways (000 km)• Density of motor ways (km/10 000 km2)• Road traffic intensity per unit of GDP
(vehicle km/US$)• Number of departures and arrivals (airports)• Energy consumption by road transport
(% share of total consumption)
Agriculture • Agricultural production index • Use of nitrogen on and • Food production index agric. landlivestock • Pesticide consumption (tonnes) • Use of phosphate on
• Fertilizer use (000 kg) agric. land• Livestock units (000 head) • Use of pesticides on
agric. land• Agricultural production
value added
IEA Training Manual 70
Monitoring, data and indicators Module 4
Theme Issue Potential data variables Proposed key andlead indicators
1 2 3 4
Human • Population below poverty line, urban and • % of total population health and rural, by sex access to safe drinking well-being • % pop with access to safe drinking water, water
urban and rural • % of total population • % pop with access to sanitation services, access to sanitation
urban and rural services• No. of people per physician, per hospital bed • No. of people per • No. of people with access to health services physician (000)• Government expenditures on health services • Infant mortality rate • Calories supply, total and from animal food (per 1000 births)• Available calories as % of requirement • Caloric intake per capita• Malnutrition in children under five years • % of GDP spent for • Average life expectancy, by sex health services• Crude death rate • Mortality caused by • Infant mortality rate respiratory infection• Mortality incidence, by disease (malaria, • Mortality caused by
respiratory infections, AIDS, etc.) communicable diseases• Burden of disease (DALYs) • Disability-Adjusted Life • % pop affected by noise Years (DALYs)• % pop in noise-prone areas• Level of noise in urbanized cities
Governance • Environmental institutions, policies in place • Number of parties to • Environmental conventions signed major environmental • No. of conflicts, state failures agreements (MEAs)
• Number of organizations certified by ISO14001 environmental management standard
• Number of countries with national councils for sustainable development
• Responses to international environmental reporting and data collections
Geography Support • Admin. boundaries (countries, regions, data sets LMEs, EEZ)
• Infrastructure (roads, rivers, lakes)• Watershed boundaries• Cities (location, area)• Population density (time series)• Land cover and vegetation (time series)• Soil units and characteristics• Elevation and slopes
IEA Training Manual 71
Related Documents