Training in metabolomics research. II. Processing and statistical analysis of metabolomics data, metabolite identification, pathway analysis, applications of metabolomics and its future Stephen Barnes, University of Alabama at Birmingham H. Paul Benton, Scripps Research Institute Krista Casazza, University of Alabama at Birmingham Sara Cooper, Hudson Alpha Institute Xiangqin Cui, University of Alabama at Birmingham Xiuxia Du, The University of North Carolina Jeffrey Engler, University of Alabama at Birmingham Janusz H. Kabarowski, University of Alabama at Birmingham Shuzhao Li, Emory University Wimal Pathmasiri, RTI International Only first 10 authors above; see publication for full author list. Journal Title: Journal of Mass Spectrometry Volume: Volume 51, Number 8 Publisher: Wiley | 2016-08-01, Pages 535-548 Type of Work: Article | Post-print: After Peer Review Publisher DOI: 10.1002/jms.3780 Permanent URL: https://pid.emory.edu/ark:/25593/s4v8r Final published version: http://dx.doi.org/10.1002/jms.3780 Copyright information: Copyright © 2016 John Wiley & Sons, Ltd. Accessed January 30, 2022 5:42 PM EST

Welcome message from author
This document is posted to help you gain knowledge. Please leave a comment to let me know what you think about it! Share it to your friends and learn new things together.
Transcript

Training in metabolomics research. II. Processingand statistical analysis of metabolomics data,metabolite identification, pathway analysis,applications of metabolomics and its futureStephen Barnes, University of Alabama at BirminghamH. Paul Benton, Scripps Research InstituteKrista Casazza, University of Alabama at BirminghamSara Cooper, Hudson Alpha InstituteXiangqin Cui, University of Alabama at BirminghamXiuxia Du, The University of North CarolinaJeffrey Engler, University of Alabama at BirminghamJanusz H. Kabarowski, University of Alabama at BirminghamShuzhao Li, Emory UniversityWimal Pathmasiri, RTI International
Only first 10 authors above; see publication for full author list.
Journal Title: Journal of Mass SpectrometryVolume: Volume 51, Number 8Publisher: Wiley | 2016-08-01, Pages 535-548Type of Work: Article | Post-print: After Peer ReviewPublisher DOI: 10.1002/jms.3780Permanent URL: https://pid.emory.edu/ark:/25593/s4v8r
Final published version: http://dx.doi.org/10.1002/jms.3780
Copyright information:Copyright © 2016 John Wiley & Sons, Ltd.
Accessed January 30, 2022 5:42 PM EST

Training in metabolomics research. II. Processing and statistical analysis of metabolomics data, metabolite identification, pathway analysis, applications of metabolomics and its future
Stephen Barnes1,4,6,*, H. Paul Benton10, Krista Casazza3, Sara Cooper7, Xiangqin Cui5, Xiuxia Du8, Jeffrey Engler1, Janusz H. Kabarowski2, Shuzhao Li9, Wimal Pathmasiri11, Jeevan K. Prasain4,6, Matthew B. Renfrow1, and Hemant K. Tiwari5
1Department of Biochemistry and Molecular Genetics, University of Alabama at Birmingham, Birmingham, AL 35294
2Department of Microbiology, University of Alabama at Birmingham, Birmingham, AL 35294
3Department of Pediatrics, University of Alabama at Birmingham, Birmingham, AL 35294
4Department of Pharmacology and Toxicology, University of Alabama at Birmingham, Birmingham, AL 35294
5School of Medicine; Section on Statistical Genetics, School of Public Health, University of Alabama at Birmingham, Birmingham, AL 35294
6Targeted Metabolomics and Proteomics Laboratory, University of Alabama at Birmingham, Birmingham, AL 35294
7HudsonAlpha, Huntsville, AL 35806
8Department of Bioinformatics and Genomics, University of North Carolina at Charlotte, NC 28223
9Department of Medicine, Emory University, Atlanta, GA 30322
10Scripps Research Institute, La Jolla, CA 92307
11RTI International, Research Triangle Park, NC 27709
Abstract
Metabolomics, a systems biology discipline representing analysis of known and unknown
pathways of metabolism, has grown tremendously over the past 20 years. Because of its
comprehensive nature, metabolomics requires careful consideration of the question(s) being asked,
the scale needed to answer the question(s), collection and storage of the sample specimens,
methods for extraction of the metabolites from biological matrices, the analytical method(s) to be
employed and the quality control of the analyses, how collected data are correlated, the statistical
methods to determine metabolites undergoing significant change, putative identification of
metabolites, and the use of stable isotopes to aid in verifying metabolite identity and establishing
*Author for Correspondence: Stephen Barnes, PhD, Department of Pharmacology and Toxicology, MCLM 452, University of Alabama at Birmingham, 1918 University Boulevard, Birmingham, AL 35294, Tel #: 205 934-7117; Fax #: 205 934-6944; [email protected].
HHS Public AccessAuthor manuscriptJ Mass Spectrom. Author manuscript; available in PMC 2017 September 05.
Published in final edited form as:J Mass Spectrom. 2016 August ; 51(8): 535–548. doi:10.1002/jms.3780.
Author M
anuscriptA
uthor Manuscript
Author M
anuscriptA
uthor Manuscript

pathway connections and fluxes. This second part of a comprehensive description of the methods
of metabolomics focuses on data analysis, emerging methods in metabolomics and the future of
this discipline.
Introduction
This is the second part of a summary of a training workshop on metabolomics published in
the previous issue of the Journal of Mass Spectrometry1. The workshop, supported by a R25
grant from the NIH Common Fund Program in Metabolomics, has been held each summer at
the University of Alabama in Birmingham since 2013. It is focused on the analysis of
metabolomics data collected using NMR and MS platforms as well as other applications of
metabolomics, the future of metabolomics, and other training opportunities for interested
investigators.
1. Data Analysis
a. 1H-NMR
Derivation of metabolomics data from NMR spectra is the use of chemometric analysis2, 3.
After spectral pre-processing during which the added internal standard, e.g., DSS, is
assigned to 0 ppm, the NMR spectra are “binned” using a defined interval (e.g., 0.4 ppm)
(Fig. 1). This can be achieved using a number of different commercially software platforms
including ACD[1] (www.acdlabs.com), Chenomx (www.chenomx.com) and MestreNova
(http://mestrelab.com/). NMR spectra also contain several elements which may need to be
removed prior to statistical analysis. These come from the protons in water, urea (in the case
of urine), protons resonances of noise regions upfield to the DSS peak and those that are
downfield from most metabolites (Fig. 1). Another issue can be the pH of the sample,
particularly in urine. NMR peak alignment tools4, 5 are helpful to overcome issues with pH
based chemical shift variation. By adding imidazole, the chemical shift of its protons allows
the adjustment of other proton resonances susceptible to pH enabling identification using pH
sensitive NMR libraries such as Chenomx. Another way is to use a buffer solution to control
pH.
Untargeted NMR metabolomics analysis is typically performed in a high throughput manner
by binning NMR data. Resulting “bin” data can be used as the input for principal component
analysis (PCA) and partial least squares discriminant analysis (PLS-DA) or orthogonal
partial least squares discriminant analysis (OPLS-DA) to determine the extent of differences
between experimental groups and to identify the metabolic features that are important for
distinguishing the study groups. The NMR data are mean centered and scaled (unit variance
or Pareto) prior to multivariate data analysis.
A particular advantage of NMR metabolomics is that it is quantitative. The summed area of
the peaks associated with each metabolite is representative of its concentration when
referenced to an internal standard like DSS. Chenomx software can be used to pre-process
1ACD has a free academic version
Barnes et al. Page 2
J Mass Spectrom. Author manuscript; available in PMC 2017 September 05.
Author M
anuscriptA
uthor Manuscript
Author M
anuscriptA
uthor Manuscript

and profile NMR spectra to identify and quantify metabolites. Metabolite concentrations can
then be used for parametric statistics.
b. LC-MS and GC-MS
The goal of data pre-processing is to extract information about metabolite ions from raw
mass spectrometry data. The raw data consists of a series of mass spectra each of which is
acquired at a specific time and thus has a scan acquisition time (i.e., retention time)
associated with it. Together with the mass-to-charge ratio and relative abundance of each
mass-to-charge ratio, the raw data are three-dimensional.
Data pre-processing mostly occurs in two-dimensional spaces. The first two-dimensional
space is the mass-to-charge ratio and relative abundance for each particular retention time,
i.e., processing occurs at the spectrum level. The second is the retention time and relative
abundance for a particular mass-to-charge ratio or all of the mass-to-charge ratios. The
relationship between the retention time and the summation of relative abundance values for
all of the mass-to-charge ratios gives rise to the total ion chromatogram (TIC). The
relationship between the retention time and relative abundance values for a particular mass-
to-charge ratio gives rise to the extracted ion chromatogram (EIC).
The data processing workflow consists of a sequence of steps as depicted in Figure 2.
Centroiding concerns converting spectral data in profile mode to centroid mode by
determining the most likely mass values detected in each spectrum. The subsequent steps
about features start from detecting all of the chromatographic peak features in each EIC.
For mass analyzers with unit mass measurement accuracy, an EIC can be easily obtained by
extracting each unit mass and its relative abundance value over time. For mass analyzers
with high mass measurement accuracy, there are two approaches. The first approach is
through mass binning. Basically, the mass axis is divided into equal bins and all of the mass-
to-charge ratios that fall into one mass bin and their corresponding relative abundance values
give rise to an EIC. The advantage of this approach is that the algorithm is easy to
implement and all of the EICs in a dataset can be rapidly built. The disadvantage is that both
EIC splitting and merging can happen. Splitting occurs when a binning boundary separates
mass-to-charge ratios that belong to the same mass into two different bins. Merging occurs
when mass-to-charge ratios that belong to two different masses are sandwiched between two
adjacent binning boundaries. There are methods to avoid these issues by combining adjacent
bins (n, n+1) to check for peaks. This method, matchedFilter, was used in the widely used
software tool, XCMS6.
A second, more sophisticated approach to building EICs is to automatically determine the
binning boundaries. Toward this end, XCMS now uses an intelligent binning algorithm
(centWave) to find areas of interest7. These areas are found by a tracking algorithm that
looks for a smooth slope with a small amount of m/z drift. Once this pass is made over the
single LC/MS spectrum, a second algorithm is used to integrate the peak. A series of
wavelets are fitted to the peak until the best wavelet is found. If no wavelet was fitted
successfully, then the area is not a peak. Some areas contain co-eluting peaks and the
wavelets are able to pull these peaks apart. This approach overcomes the disadvantages of
Barnes et al. Page 3
J Mass Spectrom. Author manuscript; available in PMC 2017 September 05.
Author M
anuscriptA
uthor Manuscript
Author M
anuscriptA
uthor Manuscript

the aforementioned binning at the cost of calculation time. However, with ever increasing
computing powers, this is not a big issue any more.
i. LC-MS data pre-processing—With all of the EICs built, feature detection determines
all of the chromatographic peak features. A feature is defined as an ion with a unique
combination of m/z and retention time values. In an EIC, there could be one or more
chromatographic peak features. Since these peak features could be of different widths,
wavelet transform has been used as a robust method for this purpose.
Among all of the peak features, a high percentage of them are produced by random noise
and contaminants and need to be filtered out. A few criteria can be used for filtering,
including the signal-to-noise ratio of each peak feature, the width, the shape, and total area
underneath a feature. This is achieved in the step of feature filtering. Subsequently, all of the
remaining peak features in a data file are grouped based on their chromatographic peak
shape. Peaks that are similar in terms of the shape are most likely related to a single
metabolite. These peaks in the same group could be isotopes, adducts, neutral-losses and the
molecular ions8. What would eventually determine the identity of the molecule that has
produced this group of ions is the molecular ion.
For each feature group, each feature is assigned a most likely ion type (isotope, adduct,
neutral-loss, or molecular ion) in the feature annotation step.
So far, each processing step including mass recalibration, centroiding, feature detection,
feature filtering, feature grouping, and feature annotation have been carried out for each data
file. With all of the features that have been annotated for each data file, features are aligned
across data files. The purpose of this step is to correct retention time shift that has occurred
in the course of analyzing many biological samples on the analytical platforms.
Many retention time correction methods are used in existing software. A warping-based
approach by modeling the global retention time shift over time finds similar peak shapes to
warp the spectra to a median spectrum. Another is to find anchors, features that do not have
a large drift in time. These anchors can then be used to align the LC-MS spectra in a non-
linear fashion. A third is to determine features that correspond to the same metabolite across
data files. The criteria for this determination include similarity in terms of isotopic profile,
mass, and retention time. The latter approach is computationally more challenging and more
time consuming, but more accurate.
Software(s) to perform the aforementioned is(are) provided by individual instrument
manufacturers. However, there are extremely useful community providers of this type of
software. A very powerful software for analysis of metabolomics data is XCMS6. It can be
used on an investigator’s computer at the command line level using R. Alternatively,
investigators can upload their data to an online version of XCMS (https://
xcmsonline.scripps.edu)9. Depending on the instrument generating their data, it may be
necessary to convert the data into .mzML, .mzXML or .NetCDF format10. Once loaded, an
investigator selects the individual datasets to be compared, adjusts certain parameters based
on the nature of the GC-MS or LC-MS instrumentation (acceptable peak widths, mass
Barnes et al. Page 4
J Mass Spectrom. Author manuscript; available in PMC 2017 September 05.
Author M
anuscriptA
uthor Manuscript
Author M
anuscriptA
uthor Manuscript

accuracy, etc.), and submits a job for the Scripps server to process. Once ready, the
investigator reviews the results online. These come in graphical form (color-coded total ion
current chromatograms with and without retention time warping, Cloud plots (Fig. 3)
identifying ions that are increased (green) or decreased (red) superimposed on the mean total
ion chromatogram (in gray), and multidimensional statistical plots11. Furthermore, a more
interactive form of XCMSonline has become available12. The data can also be exported and
after arranging into files containing m/z values of the ions and their intensities, can be
analyzed by other statistical programs that are freely available on the internet. One of these
is MetaboAnalyst (www.metaboanalyst.ca). Metabolites can also be compared across
different datasets using metaXCMS13.
A second publicly available program that in addition is excellent for data presentation is
Mzmine14 – it can be downloaded at http://mzmine.github.io/ and works on both Macs and
PCs. Once loaded, the user has the option of working at the command line and thereby
writing programs to optimize use of Mzmine, or using a graphical user interface to utilize
pre-programmed software functions. The file formats that can be used with Mzmine
are .CDF and .mzXML. Once loaded, a useful way of looking at the MS data is to plot the
intensities of either selected ion masses or ranges of ions masses for user-defined times. To
assist in the identification of significant peaks, the ions can be displayed in a 3D-plot (Fig.
4A). In this example, the urine was from a subject who had been treated with gemcitabine.
By selecting m/z 264.08 with a 5 ppm mass window, an ion chromatogram revealed that
gemcitabine eluted at 15.2 min (Fig. 4B). Mzmine has filtering functions for the raw data
including carrying out alignment across multiple samples. There are other programs that can
be used in this context and recently they have been evaluated comparatively15.
ii. GC-MS data pre-processing—A major difference between pre-processing LC-MS
and GC-MS data is that the latter must include a deconvolution step for constructing a
“pure” spectrum for each metabolite measured by the mass analyzer. This is because GC-
MS analytical platforms usually use electron ionization that causes fragmentation of
molecules at the ionization source. As a result, what the mass analyzers produce are
fragmentation spectra, similar to the MS/MS spectra that are produced on LC-MS platforms.
Since different metabolites could elute from the gas chromatography column at the same
time (co-elution) when separation is not perfect, the same GC-MS spectrum could contain
fragments from different metabolites and deconvolution is needed to separate them into their
individual spectra.
For this purpose, AMDIS (Automated Mass Spectral Deconvolution and Identification) was
developed and has been widely used (http://chemdata.nist.gov/mass-spc/amdis/downloads/).
c. Statistical Analysis
With the quantitative information of metabolite ions (peak area or peak height) determined
at the data pre-processing stage, statistical algorithms are applied to identify those ions that
are significantly altered between control and experimental groups. Before statistical analysis
can begin, it is necessary to remove from the file of integrated peak areas those from the
dead volume before any of the sample reaches the mass spectrometry detector and those
Barnes et al. Page 5
J Mass Spectrom. Author manuscript; available in PMC 2017 September 05.
Author M
anuscriptA
uthor Manuscript
Author M
anuscriptA
uthor Manuscript

eluting during column washing and re-equilibration. Selective removal of NMR peaks may
also be carried out as noted above.
The fully processed data are then uploaded to MetaboAnalyst16 (www.metaboanalyst.ca).
Data are organized into individual Excel files in the .csv format. The first column of each
file is the list of m/z values or the list of 1H-NMR chemical shifts. The second column is the
corresponding peak area for each m/z value or NMR chemical shift. The files are organized
in folders into the two groups being compared. Note that the names of each file and of the
folders must not include spaces. The two folders are combined into a .zip file and uploaded
to MetaboAnalyst (which will check for any errors and if none report on the total number of
metabolites to be analyzed). MetaboAnalyst also checks for missing values and allows for
selection of interquartile range (preferred). Next, it is important to apply a normalization
function. Commonly this is a weighted correction to the collected data. This could very
simply be due to differences in the amount of sample taken. For example, in a study
involving collected plasma, all the samples except two had 100 µL of plasma available. The
volumes of the other two samples were 75 µL and 90 µL. The peak areas of the latter two
sample dataset values were therefore increased by 100/75 and 100/90, respectively. As noted
earlier, it is important to have internal standard(s) added to the samples being processed. A
further correction to peak areas is then to normalize to the mean area of the standard across
all samples divided by the area of the standard in individual samples.
While the above approach works for plasma and serum, fluids such as urine, follicular fluid
and bronchoaveolar lavage are subject to dilution that it is a function of either how much an
animal or human subject has drunk prior to collection (urine), or how much fluid
(physiological saline) was flushed into a cavity to recover follicular fluid and
bronchoaveolar lavage. In these cases, other correcting factors can be employed. For urine,
the creatinine concentration has been widely used to do this correction although in cases of
kidney dysfunction it is not appropriate. For follicular fluid and bronchoaveolar lavage with
unknown dilutions caused by the lavage fluid, normalization by dividing by the total ion
current (TIC) is a reasonable approach. The assumption here is that the greater majority of
the observed signals are unchanged and therefore the sum of the observed ions is an
effective normalizing factor.
The next consideration for the dataset is to apply the interquartile range (IQR). If all the data
are ranked and divided into four equal parts, the IQR represents the middle 50% of all the
data points. If the data are not normally distributed, then log transformation may be applied
although this creates problems since it cannot handle zero values. Finally, to reduce the
contribution of the most intense ions in the dataset, the data can be mean centered (i.e., the
mean value for a metabolite is subtracted from each metabolite ion value) and then the
variance is scaled by the square root of the standard deviation. The data are now ready for
univariate and/or multivariate analysis16.
Many different normalization functions have been developed and are suitable to different
problems including both dilution and batch effects16, 17. Median fold change normalization
has the ability to reduce dilution effects without altering the biological effect. This method
Barnes et al. Page 6
J Mass Spectrom. Author manuscript; available in PMC 2017 September 05.
Author M
anuscriptA
uthor Manuscript
Author M
anuscriptA
uthor Manuscript

was tested with log transformations of LC-MS data and showed to improve overall analysis
with multivariate statistics by increasing the statistical agreement with these methods.
i. Univariate analysis—A serious problem encountered in applying statistical analysis to
all –omics data is that the number of samples (n = 3–6 for cells, n = 8–15 for an animal
study, n = 30–100 for a controlled clinical study and n = 100–1,000 for an epidemiological
study) is smaller than the number of observed variables. Taking a univariate approach, a
Student’s t-test comparing the amount of a single metabolite ion in a control group with
another in a treatment group and selecting significant metabolites based on p-values is
fraught with problems due to the multiple testing issue. The Bonferroni correction19,
dividing the normally acceptable p-value for significance for comparison of a variable
between two groups (p<0.05) by the number of observed metabolite ions (m) is very harsh
and may result in the loss of real metabolite differences. Using fold-change as a
discriminator, as was widely used in the early days of transcriptomics20, is no longer
regarded as acceptable. However, the use of a Volcano plot (Fig. 5) that combines fold
change and pairwise significance is widely accepted21. In this, fold-change is plotted as the
logarithm to the base two on the horizontal axis and the negative logarithm of the p-value on
the vertical axis. The investigator may select a reasonable fold-change, say 1.5, and p-value,
say p<0.01 (log10 P = 2). In the plot, metabolites appearing in the upper left and right
quadrants are considered candidates for metabolites which are significantly changed. The
false discovery rate (FDR) correction of the p value (resulting in a q value) is becoming a
widely accepted alternative to the Bonferroni correction22, 23. This method is a less
stringent, multiple testing correction that results in fewer features/metabolites as false
negatives. There are many variations of the FDR approach and their variability in output has
been systematically evaluated24.
ii. Multivariate analysis—The data may also be analyzed using multivariate analysis. The
two major methods currently used in the field are principal components analysis (PCA) and
partial least squares discriminant analysis (PLS-DA). PCA is a data reduction technique that
allows high dimensional datasets (such as those in metabolomics) to be reduced to a few
major principal components. By plotting the scores (the weighted sum of the contribution of
each metabolite to a principal component) of these components (normally principal
components with eigen values greater than 1), users may find that a class of observations
(samples) are distinct from one another (Fig. 6A). Using the loadings plot features that are
contributing to this separation, metabolite ions can be selected and further analyzed to
identify if they are biologically relevant metabolites. It should be noted that as PCA does not
use any data classification to find the principal components, it is a non-supervised method.
The other major method, PLS-DA, is a supervised method. This method uses a binary class
group (Y) to explain the variables in the data matrix (X). Much like PCA, PLS-DA scores
plots can be viewed with different projections in the scores and loadings plots (Fig. 7).
Simca (http://www.umetrics.com/products/simca), a well-used multivariate software analysis
suite, and MetaboAnalyst16 output the variable importance in projection (VIP) score. This
score can be used along with a contribution score to find the most predictive features for the
class.
Barnes et al. Page 7
J Mass Spectrom. Author manuscript; available in PMC 2017 September 05.
Author M
anuscriptA
uthor Manuscript
Author M
anuscriptA
uthor Manuscript

By selecting those metabolites that appear to be significant in both univariate and
multivariate analysis, there is an increased chance that they can be validated in separate
experiments. It is necessary then to look at selected ion chromatograms for these metabolite
m/z values to eliminate any metabolites that have irregular peak shapes. Also, it is also
worth filtering the results to isolate for further analysis those peaks that had sufficient
intensity to trigger collection of MS/MS data.
d. Confirming metabolite data
Even a metabolite ion that is strongly related to the phenotype being studied and has shown
to be significantly different by univariate and/or multivariate analysis must be confirmed by
independent LC-MS analysis. Typically, the mass transitions between the precursor ions
(MS1) and their product ion(s) formed by MS/MS (that were collected in untargeted
metabolomics analysis) are used to generate a multiple reaction monitoring assay. Ideally,
this assay is carried out on sets of biological samples held back from the untargeted
metabolomics analysis so as to provide an independent assessment of the significance of the
metabolites.
i. Identifying metabolite ions—Once statistical analysis has generated a list of
potentially changed metabolite ions, their m/z values can be matched against public
metabolite databases such as METLIN (https://metlin.scripps.edu/index.php), the Human
Metabolite Database (http://www.hmdb.ca), and the Lipidmaps database (http://
www.lipidmaps/org). These databases contain MS and MS/MS information. A disadvantage
that investigators frequently encounter is that the databases contain different sets of
metabolites and when metabolites are in common, the databases use different alphanumeric
IDs. In addition, there are proprietary databases as part of workstations (MassHunter)
associated with commercial instruments (Agilent), as well as those in comprehensive
metabolomics analysis services such as Metabolon (http://www.metabolon.com). The Fiehn
lab provides a tool for interconversion of metabolite IDs (http://cts.fiehnlab.ucdavis.edu).
Although it interconverts IDs from a very long list of databases, at the present time it is not
possible to convert METLIN IDs to other formats. It is also common that investigators do
not find their feature in a database either because the feature is not a metabolite, the feature
is an adduct and is not being searched correctly in the database, or the metabolite is not in
the databases yet.
For GC-MS data, the Fiehn lab (http://metabolomics.ucdavis.edu) and the NIST databases
(http://www.nist.gov/srd/nist1a.cfm) provide extensive searching capabilities.
Besides the biochemical databases, there are others that are more comprehensive,
encompassing all known chemicals. One of these is Chemspider (http://chemspider.com). By
entering the monoisotopic mass (note, not the mass of the ion, but the molecular weight of
the unionized molecule) under intrinsic properties, all records with that mass can be
downloaded. For instance, the isoflavone genistein with empirical formula C15H10O5 has a
monoisotopic mass of 270.053 Da. If the mass window is limited to ± 0.01 Da, there are
3,316 records in Chemspider, although not all the compounds retrieved have the formula
C15H10O5. Narrowing the mass window ten-fold to ± 0.001 Da reduces the number of
Barnes et al. Page 8
J Mass Spectrom. Author manuscript; available in PMC 2017 September 05.
Author M
anuscriptA
uthor Manuscript
Author M
anuscriptA
uthor Manuscript

records to 319; however, every one of them has the empirical formula C15H10O5. Therefore,
no matter how powerful a mass spectrometer may be at determining exact mass[2], it is
likely that there are multiple other (isobaric) compounds at that mass.
A comprehensive analysis of an unknown metabolite in terms of its LC or GC retention
time, isotope distribution, accurate mass, and fragment ion patterns in MS/MS helps to
identify its structure.
Exact mass does have an advantage in that it may allow the investigator to determine the
empirical formula of a metabolite. Because the mass defects for each element (except
carbon) are non-zero, observed masses do not form a continuum of masses. Metabolites that
are fully saturated with hydrogen have the highest, positive mass defect. For instance, the
monoisotopic ion of palmitate [M-H]− molecular ion is m/z 255.233 with its 31 hydrogens
each contributing 0.00783 Da to the mass defect. On the other hand, the monoisotopic mass
of the [M-H]− ion of 5-methylthio-D-ribose-1-phosphate (empirical formula C6H12O7PS) is
259.004. The small mass defect for this metabolite occurs because the negative mass defects
of seven oxygen atoms (each −0.00509 Da), phosphorus (−0.02624 Da) and sulfur
(−0.02793 Da) offset the positive mass defect of the 12 hydrogen atoms.
Of course, chromatographic retention time is an additional, independent parameter to be
used in confirming or denying metabolite identity. Indeed, investigators use (at least) two
different LC methods to ensure identity. Usually, this involves different stationary phases
(e.g., reverse-phase versus hydrophilic interaction liquid chromatography) or mobile phases
with different pHs, e.g., 0.1% formic acid (pH 2) and 10 mM ammonium acetate (pH 7).
Where the metabolite has a chiral center (and thereby the R- and S-isomers otherwise
behave identically), a chiral stationary phase may have to be employed. Ion mobility mass
spectrometry is a powerful approach for the study of metabolites25 and has recently been
applied to the separation of isomeric, isobaric lipid metabolites26.
ii. Interpreting MS/MS data—While identifying metabolite ions may eventually be
computer-driven, at the present time less than 20% of the observed ions (at exact masses)
have putative identities. Of those that have an ascribed chemical identity, only an even
smaller number have associated MS/MS spectra. A complication in interpreting MS/MS
spectra is that the product ions and their ratios that are observed are in part due to the mass
spectrometer being used and the conditions for collision-induced dissociation. MS/MS
spectra in the METLIN database are recorded at increasing potential gradients (0, 10, 20 and
40 V) giving successively greater extents of ion dissociation. In real time LC-MS analysis,
many systems use a rolling potential during analysis of a selected peak since it cannot be
predicted a priori what the optimum potential is for dissociation of an unknown precursor
ion. This thereby leads to a MS/MS spectrum that is an average.
As such, interpreting MS/MS spectra may involve not only comparison to MS/MS spectra of
precursor ions of the same m/z as the metabolite, but also to other precursor ions with
2Exact mass is correct in the sense that a compound has an exact mass. However, experimental measurement of the mass of an ion always has error. The most accurate mass spectrometers used in metabolomics can measure mass with an error of ~100 ppb, i.e., to the 5th decimal place.
Barnes et al. Page 9
J Mass Spectrom. Author manuscript; available in PMC 2017 September 05.
Author M
anuscriptA
uthor Manuscript
Author M
anuscriptA
uthor Manuscript

different m/z values where the product ions are nonetheless the same. This suggests that
metabolite and the known compound are structurally similar27, 28.
Direct comparisons between product ions of standards and unknowns can provide important
structural information of unknown biological products. For example, 3’-chlorodaidzein was
identified when differentiated HL-60 cells were incubated with the isoflavone daidzein (7,4’-
dihydroxyisoflavone). Its identification was based on comparison between the product ion
mass spectra of the standard and the biological product (Fig. 8A, B). The presence of the
m/z 35 ion together with the loss of 36 Da (HCl) indicated that daidzein had been
chlorinated29, 30. Isomers such as C- and O-glucosides of flavonoids can be distinguished by
their MS/MS fragmentation patterns31. For example, the carbon-carbon link in the C-
glucoside of daidzein (puerarin) is relatively stronger than the ether linked O-glucoside
(daidzin). For daidzin, ions break easily at the weakest point and the entire sugar moiety in
daidzein 7-O-β-D -glucoside is lost (−162 Da) (Fig. 8C). In contrast, for the C-glucoside
puerarin, the glucose moiety is retained and ions representing losses of water are prominent
(Fig. 8D).
Interpreting MS/MS data is also very useful in studying metabolic transformation. For
example, the loss of glucuronic acid (176 Da) can be used for the characterization of β-
glucuronide metabolites observed in serum/plasma, urine and other biofluids32. Similarly,
GSH conjugates upon MS/MS produce characteristic product ions m/z 306, 272, 254, 210,
179, 160 and 143 in the negative ion mode33.
Other methods used to discern the identity of a metabolite are similar to compound
identification in natural products chemistry. These methods begin with preparative
chromatography to isolate the metabolite in increasingly more purified forms. This allows
both chemical derivatization to identify the number and nature of reactive groups and
chemical or enzymatic hydrolysis to examine the conjugate nature of the metabolite. If very
pure forms of the metabolite can be obtained, other spectroscopic methods can be brought
into the analysis. These include infra-red analysis as well as NMR. If enough of the
metabolite is isolated, NMR is particularly valuable since pulse sequence methods can be
used to determine the protons attached to individual carbon atoms, and those protons that are
interacting and the distances between them. This information is critical to differentiate
between compounds based on GC-MS or LC-MS information.
iii. Use of isotopes in metabolite analysis—Isotopic labeling of precursors to identify
metabolites in a pathway has had a history of more than 80 years. It began with deuterated
water and moved onto the use of 3H and 14C radiolabeled forms of metabolite precursors. To
enable studies in humans, emphasis has been placed on the use of stable isotopes
(2H, 13C, 15N and 18O). By starting with uniformly 13C-labelled glucose, all the metabolites
that constitute primary and secondary pathways of its metabolism can be discerned by
following the increased 13C-intensities of the metabolites. Both NMR and mass
spectroscopic methods are widely used in stable isotope resolved metabolomics analysis.
An interesting development to these methods is IROA (isotope ratio outlier analysis, http://
www.iroa.com)34. In this method two forms of 13C-labeled glucose are incubated with the
Barnes et al. Page 10
J Mass Spectrom. Author manuscript; available in PMC 2017 September 05.
Author M
anuscriptA
uthor Manuscript
Author M
anuscriptA
uthor Manuscript

system under test. The first form is 95% 13C/5% 12C-glucose (experimental condition) and
the other is 5% 13C/95% 12C-glucose (control condition). When extracts of each are mixed,
ions representing metabolites have a U-shaped isotope profile - the extremes are all 12C-
labeled and all 13C-labeled forms of the metabolite. Usefully, the difference in mass between
the all 12C-labeled and all 13C-labeled forms of the metabolite represents the number of
carbon atoms it has (Fig. 9). This can be very valuable in limiting the number of empirical
formulae that are consistent with the observed m/z of the metabolite. A similar approach
(HiTIME, High-Resolution Twin-Ion Metabolite Extraction) has been described for the
metabolites of acetaminophen35.
As a final step, it’s typical to chemically synthesize the new metabolite, either to verify that
it is identical to the biological metabolite, or to use it in an isotopically labeled form for
pathway analysis or absolute quantitation by isotope dilution mass spectrometry analysis.
The NIH Common Fund Metabolomics Program has issued contracts to RTI International
and SRI International for metabolite synthesis. Interested investigators may nominate
compounds for synthesis or request existing compounds at http://
www.metabolomicsworkbench.org/standards/nominatecompounds.cgi.
2. Pathway analysis
Metabolomics has two principal goals: to identify (1) a useful biomarker or panel of
biomarkers that accurately predict a particular phenotype, and/or (2) the metabolic
pathway(s) and hence the underlying proteins and/or genes that lead to the phenotype.
Whereas biomarkers, once validated, allow immediate implementation, knowledge of
pathways may allow targeting of an enzyme activity, a transporter of a metabolite, or a
transcription factor regulating a metabolic process. Many of the biochemical pathways were
established in the early days of biomedical research once isotopically labeled forms of
metabolite precursors became available. Databases of these pathways and more recently
described pathways are available in publicly accessible and searchable sites such as KEGG
(Kyoto Encyclopedia of Genes and Genomes - http://www.genome.jp/kegg/), MetaCyc
(http://metacyc.org), BioCyc (http://biocyc.org) and Metscape (http://metscape.ncibi.org/)
which is a plug-in for Cytoscape (http://cytoscape.org). GeneGo (https://portal.genego.com/)
and Ingenuity pathway analysis (http://www.ingenuity.com/products/ipa) are examples of
commercial pathway analysis software tools.
A novel approach to connecting metabolites is Mummichog (http://mummichog.org). It
started as a pathway and network analysis tool for untargeted metabolomics36. Mummichog
assumes that statistical testing at feature level, even without metabolite annotation, can select
a subset of m/z features that carry biological meanings, which can be potentially projected
onto metabolic networks as enriched patterns (Fig. 10). Such patterns can be quantified by
over-representation statistics, in combination with network topologies. The null distribution
is estimated by resampling all m/z features, and multiple matches between m/z and
metabolites are taken into account. Both conventional pathways and unbiased network
analysis are accommodated in this framework. Thus, Mummichog can quickly generate
high-quality hypotheses from untargeted data, so that researchers can focus their resources
Barnes et al. Page 11
J Mass Spectrom. Author manuscript; available in PMC 2017 September 05.
Author M
anuscriptA
uthor Manuscript
Author M
anuscriptA
uthor Manuscript

on prioritized pathways and biological context. This approach can be successfully applied to
mechanistic experiments37 and population-based studies38.
A deeper appreciation of the role of the microbiome that has also occurred in recent years
has led to the realization that metabolism crosses genomic boundaries. Because the human is
now described as a superorganism39, a combination of human eukaryotic cells and the
prokaryotes inhabiting the gastrointestinal tract in vast numbers and those in other crevices,
this must be taken into effect when considering metabolites and the metabolic pathways they
are associated with. In addition, metabolites arise from the foods we eat, often another
discrete set of genomes.
For example (Fig. 11), the isoflavone daidzein is found in the soybean mostly as its 6”-O-
malonyl-7-β-D-glucoside40. Traditional preparation of soy foods either by hot water
extraction (to make soy milk and tofu) largely leads to hydrolysis of the malonate group to
yield the 7-β-D-glucoside of daidzein41. Fermentation of soy to make miso, soy paste or
tempeh causes hydrolysis all the way to daidzein as well as to the introduction of hydroxyl
groups. Many American soy foods are based on the protein fraction of soy once the oil, but
not the isoflavones, has been removed by extraction. Processing of the protein fraction using
heat causes decarboxylation of the malonyl group to form 6”-O-acetyl-7-β-D-glucoside of
daidzein41. Note that these steps do not represent metabolism, but instead a chemical
(processing) pathway. Once in the gastrointestinal tract, daidzein, as for other isoflavones42,
is easily absorbed into the intestinal cells. The 7-β-D-glucoside of daidzein which may enter
the intestinal cell via the glucose transporters undergoes hydrolysis catalyzed by lactase
phloridzin hydrolase43. In the intestinal cell, daidzein is mostly converted to its β-
glucuronide42 or sulfate ester. These phase II metabolites enter the bloodstream and are
swept towards the liver where they undergo hepatobiliary transport from the portal vein into
the bile. The β-glucuronide, 6”-O-malonyl-7-β-D-glucoside and 6”-O-acetyl-7-β-D-
glucoside of daidzein are not substrates of lactase phloridzin hydrolase and therefore enter
the microorganism-rich colon. The bacteria there hydrolyze each of these conjugates to
daidzein which undergoes reductive metabolism to form dihydrodaidzein, O-
desmethylangolensin and equol (4,7–dihydroxyflavan). Whereas daidzein has no chiral
carbon atoms, its metabolites have a C3 asymmetric carbon. It has been shown that the
naturally occurring form of daidzein is its S-isomer44 which binds to estrogen receptor with
a KD of 1 nM, similar to 17β-estradiol (the R-isomer, made chemically, is a weak agonist).
These metabolites are absorbed from the colon, return to the liver via the inferior mesenteric
drainage and are glucuronidated and re-enter the bile. This set of metabolic steps between
the daidzein in soy foods and S-equol therefore crosses three different types of genomes
(Fig. 11) and at this time is not represented in pathway databases.
3. Fluxomics analysis
The concentrations of metabolites, even when measured accurately and precisely, give no
sense of the dynamic nature of metabolism or the origins of the carbon atoms (and when
appropriate nitrogen atoms) in a metabolite. The concentrations and turnover of metabolites
sitting at the junctions of metabolic pathways such as pyruvate, acetyl CoA, alpha-
ketoglutarate, glutamate and glutamine may reveal the underlying features of disease45. To
Barnes et al. Page 12
J Mass Spectrom. Author manuscript; available in PMC 2017 September 05.
Author M
anuscriptA
uthor Manuscript
Author M
anuscriptA
uthor Manuscript

pursue this area of metabolomics it is necessary to combine both high performance GC-MS
or LC-MS and NMR46–50. LC-MS is used to determine the concentrations of each
metabolite and 13C-NMR allows the identification of which carbon atoms are 13C-labeled
and to what extent.
4. Imaging-MS
Although much of the reported information in metabolomics concerns biofluids, there is a
growing interest in the location of metabolites in tissues. Although secondary ion mass
spectrometry (SIMS) has been used to examine intracellular metabolites51, two main
approaches are currently being used: rapid evaporative ionization mass spectrometry
(REIMS) that exploits analysis of the sprays created by the surgeon’s cauterizing knife52–54,
and imaging of frozen tissue sections using direct electrospray ionization (DESI)55–57 or
MALDI-imaging MS58, 59. In the latter case it is necessary to deposit the MALDI matrix by
vacuum sublimation in order to prevent shifting of the metabolites and to ensure optimum
matrix deposition. This limits the available matrices to those that undergo sublimation.
Using 2,5-dihydrobenzoic acid (DHB) as a matrix applied to frozen tissue sections by
vacuum sublimation, the major lipids that are altered quantitatively in normal processes such
as ageing or in disease processes can be viewed spatially. This information helps to establish
mechanism and suggests possible physiological consequences of those lipid changes. An
example from our group60 is shown in Figure 12. Several ether-linked phospholipids were
found to be increased early after ischemia-reperfusion kidney injury in mice using MS/
MSALL lipidomics. One of these was imaged using 2,5-DHB matrix coated kidney
cryosections in positive mode to show that it was located primarily to regions of the kidney
rich in proximal tubules. In MALDI imaging, TOF58 and TOF/TOF analyzers are most
frequently used59, 61, although higher mass resolution can be obtained with FT-ICR
analyzers62. Whereas SIMS using heavy ion bombardment can provide subcellular spatial
resolution (50 nm), the spatial resolution using MALDI is limited to the width of the beam
(5–25 µm).
5. Further training opportunities
Besides the UAB Metabolomics workshop, there are several metabolomics symposia and
associated short workshops at institutions sponsored by the NIH Common Fund Program in
Metabolomics (RTI International, University of Florida, University of Michigan and the
Mayo Clinic), as well as advanced workshops at UC-Davis (advanced data processing) and
the University of Kentucky (fluxomics and stable isotopes). There are many international
workshops and a calendar of these is presented monthly in MetaboNews (http://
www.metabonews.ca/archive.html). There are a growing number of workshops given in
conjunction with meetings of National Societies. The Metabolomics Society (http://
metabolomicssociety.org) has annual international meetings and has developed a subgroup
for young investigators.
Barnes et al. Page 13
J Mass Spectrom. Author manuscript; available in PMC 2017 September 05.
Author M
anuscriptA
uthor Manuscript
Author M
anuscriptA
uthor Manuscript

6. The future of metabolomics
Standardization of methodology and advancement in technology will enable the use of
simpler systems to more easily extract, measure, and quantify the metabolome. As
untargeted approaches reveal relevant metabolites for a system, more focused, targeted
assays can then be used to validate these studies. As an example, a recent study used the
available isotopically labeled metabolite standards to measure quantitatively more than 100
metabolites at a time using triple quadrupole MRM-MS63, 64. It should be expected that in
the future commercial companies will develop kits for the quantitative analysis of specific
classes of metabolites in which every metabolite to be measured can be added to the
extraction solvent in a stable, isotopically-labeled form. This isotope dilution approach will
allow the collection of quantitatively reliable metabolite data that could be compared across
different investigator groups, enhancing the value of these data and permitting their
integration with other –Omics data.
With analyzers that allow 200 mass transitions to be monitored per second, analysis with
peaks that are 10 s wide are currently available. With faster switching between transitions
and more sensitive detection of metabolite ions, further improvements will occur. How many
product ions are needed to successfully discriminate between metabolites has been
approached bioinformatically65. However, since it will take many product ions to do this,
this redundancy noticeably increases the number of mass transitions to monitor and hence
consumes time. Q-TOF mass spectrometers provide an alternative avenue for improvement
since they can also be used to carry out MRM analysis with the advantage that they collect
all the product ions of a selected precursor ion at one time and with much greater accuracy
than a quadrupole detector63.
With very fast analyzers like the TOFs, it is also possible to generate massively parallel
separations, such as those possible with capillary electrophoresis. In addition, high-
resolution chromatography using a combination of open-tubular and packed on chips
operating in nanofluidics is emerging as a future device66.
In the future, software for processing metabolomics data and identifying metabolites may
move into the Cloud. The advantage of doing this is that the high current, upfront expense of
standalone software (>$35,000) and computer hardware adequate to run the programs (>
$5,000) can be avoided. Although use of the software may require a subscription service, it
would allow users to (a) work with the latest version of the software, (b) employ as many
virtual computers as needed for the job in hand and (c) integrate this form of –omics data
with data from all the other –omics. Of course, legal and proprietary issues may limit this
approach. At this time, individual institutions may interpret Health Insurance Portability and
Accountability Act (HIPAA) regulations regarding patient privacy to prevent the use of the
Cloud for data processing/data storage. For similar reasons companies may not wish to put
sensitive information in the Cloud. On the other hand, NIH and other federal agencies
demand that data obtained with public funds be placed in databases accessible to interested
parties. The value of putting the software in the Cloud will be to encourage all investigators
to take part in a community development of the software. Another advantage of going to the
Cloud is that it would allow the combination of metabolomics data with genomics,
Barnes et al. Page 14
J Mass Spectrom. Author manuscript; available in PMC 2017 September 05.
Author M
anuscriptA
uthor Manuscript
Author M
anuscriptA
uthor Manuscript

transcriptomics and proteomics data. Until recently, inconsistencies in formatting between
the data domains made this impossible on the large scale. However, SCIEX is developing a
OneOmics capability with the Illumina in the Amazon Cloud (http://sciex.com/solutions/
life-science-research/multi-omics-bioinformatics). This should allow the integration of the
massive amounts of –Omics data and greatly facilitate discovery of the underlying bases of
diseases as well as the aging process.
All of these developments would be similar to the transition that occurred from refrigerator-
sized computers with 8k of memory in the 1960s to 50 years later with hand-carried, smart
phones with 64 GB of memory. However, to do so will require continuing investment in
physics and the rest of science and a demonstrated value of measuring the metabolome.
Finally, integration of data from the metabolomics, genomics and transcriptomics domains is
a long sought-after goal of the investments in biomedical research and will certainly support
the implementation of personalized (and accurate) medicine.
Acknowledgments
Funds for the National Workshop in Metabolomics came from NIH grant R25 GM103798-03. The workshop also received support from the UAB Office of the Vice-President for Research and Economic Development, the UAB School of Medicine and College of Arts and Science, the UAB Comprehensive Cancer Center (P30 CA13148), the UAB Comprehensive Diabetes Center, the UAB Diabetes Research Center (P60 DK079626), the UAB Center for Free Radical Biology, and the UAB-UCSD O’Brien Center for Acute Kidney Disease (P30 DK079337), and the Departments of Chemistry and Pharmacology and Toxicology. We are also grateful for unrestricted support from Metabolon, Sciex and Waters. Acknowledgements are also given to Dr. N. Rama Krishna for the use of the Central Alabama NMR facility and to staff who assisted in the running of the workshop (UAB: Jennifer Spears, Lynn Waddell, Mikako Kawai, D. Ray Moore II, Landon Wilson, Ali Arabshahi, and Ronald Shin; RTI International, Rodney Snyder) and student trainees, Haley Albright, Kelly Walters and Sean Wilkinson. We are indebted to faculty who have also previously contributed to the development of the workshop: Dr. Kathleen Stringer (University of Michigan), Dr. Dean P. Jones (Emory University), Dr. Grier P. Page (RTI International), Dr. Olga Ilkayeva (Duke University), Dr. Nikolaos Psychogios (Shire Pharmaceuticals) and Dr. Natalie Serkova (University of Colorado-Denver) and to faculty in receipt of NIH Administrative Supplements (Dr. Lalita Shevde-Sumant, R01 CA138850 and Dr. Adam Wende R00 HL111322). Finally, the workshop has been enhanced by several plenary speakers: Dr. Stanley Hazen (Cleveland Clinic), Dr. Keith Baggerly (MD-Anderson), Dr. Richard Caprioli (Vanderbilt University), Dr. Arthur Edison (University of Florida) and Dr. David Wishart (University of Alberta), as well as speakers from several companies: Brigitte Simons and Jeremiah Tipton (SCIEX), Tom Beaty and John Shockcor (Waters) and Edward Karoly and Rob Mohney (Metabolon).
References
1. Barnes S, Benton HP, Casazza K, Cooper S, Cui X, Du X, Engler J, Kabarowski JH, Li S, Pathmasiri W, Prasain JK, Renfrow MB, Tiwari HK. Training in metabolomics research. I. Designing the experiment, collecting and extracting samples and generating metabolomics data. J Mass Spec. 2016 xx, yyy.
2. Eriksson L, Antti H, Gottfries J, Holmes E, Johansson E, Lindgren F, Long I, Lundstedt T, Trygg J, Wold S. Using chemometrics for navigating in the large data sets of genomics, proteomics, and metabonomics (gpm). Anal Bioanal Chem. 2004; 380:419. [PubMed: 15448969]
3. Trygg T, Holmes E, Lundstedt T. Chemometrics in metabonomics. J Proteome Res. 2007; 6:469. [PubMed: 17269704]
4. Savorani F, Tomasi G, Engelsen SB. icoshift: A versatile tool for the rapid alignment of 1D NMR spectra. J Magn Reson. 2010; 202:190. [PubMed: 20004603]
5. Veselkov KA, Lindon JC, Ebbels TMD, Crockford D, Volynkin VV, Holmes E, Davies DB, Nicholson JK. Recursive segment-wise peak alignment of biological 1H NMR spectra for improved metabolic biomarker recovery. Anal Chem. 2009; 81:56. [PubMed: 19049366]
Barnes et al. Page 15
J Mass Spectrom. Author manuscript; available in PMC 2017 September 05.
Author M
anuscriptA
uthor Manuscript
Author M
anuscriptA
uthor Manuscript

6. Smith C, Want EJ, O'Maille G, Abagyan R, Siuzdak GE. XCMS: Processing mass spectrometry data for metabolite profiling using nonlinear peak alignment, matching, and identification. Anal Chem. 2006; 78:779. [PubMed: 16448051]
7. Tautenhahn R, Böttcher C, Neumann S. Highly sensitive feature detection for high resolution LC/MS. BMC Bioinformatics. 2008; 28:504.
8. Nordström A, O'Maille G, Qin C, Siuzdak G. Nonlinear data alignment for UPLC-MS and HPLC-MS based metabolomics: quantitative analysis of endogenous and exogenous metabolites in human serum. Anal Chem. 2006; 78:3289. [PubMed: 16689529]
9. Tautenhahn R, Patti GJ, Rinehart D, Siuzdak G. XCMS Online: a web-based platform to process untargeted metabolomic data. Anal Chem. 2012; 84:5035. [PubMed: 22533540]
10. Martens L, Chambers M, Sturm M, Kessner D, Levander F, Shofstahl J, Tang WH, Römpp A, Neumann S, Pizarro AD, Montecchi-Palazzi L, Tasman N, Coleman M, Reisinger F, Souda P, Hermjakob H, Binz PA, Deutsch EW. mzML--a community standard for mass spectrometry data. Mol Cell Proteomics. 2011; 10:R110.000133.
11. Patti GJ, Tautenhahn R, Rinehart D, Cho K, Shriver LP, Manchester M, Nikolskiy I, Johnson CH, Mahieu NG, Siuzdak G. A view from above: cloud plots to visualize global metabolomic data. Anal Chem. 2013; 85:798. [PubMed: 23206250]
12. Gowda H, Ivanisevic J, Johnson CH, Kurczy ME, Benton HP, Rinehart D, Nguyen T, Ray J, Kuehl J, Arevalo B, Westenskow PD, Wang J, Arkin AP, Deutschbauer AM, Patti GJ, Siuzdak G. Interactive XCMS Online: simplifying advanced metabolomic data processing and subsequent statistical analyses. Anal Chem. 2014; 86:6931. [PubMed: 24934772]
13. Tautenhahn R, Patti GJ, Kalisiak E, Miyamoto T, Schmidt M, Lo FY, McBee J, Baliga NS, Siuzdak G. metaXCMS: second-order analysis of untargeted metabolomics data. Anal Chem. 2011; 83:696. [PubMed: 21174458]
14. Pluskal T, Castillo S, Villar-Briones A, Oresic M. MZmine 2: modular framework for processing, visualizing, and analyzing mass spectrometry-based molecular profile data. BMC Bioinformatics. 2010; 11:395. [PubMed: 20650010]
15. Niu W, Knight E, Xia Q, McGarvey BD. Comparative evaluation of eight software programs for alignment of gas chromatography-mass spectrometry chromatograms in metabolomics experiments. J Chromatogr A. 2014; 1374:199. [PubMed: 25435458]
16. Xia J, Sinelnikov IV, Han B, Wishart DS. MetaboAnalyst 3.0-making metabolomics more meaningful. Nucleic Acids Res. 2015; 43:W251. [PubMed: 25897128]
17. Veselkov KA, Vingara LK, Masson P, Robinette SL, Want E, Li JV, Barton RH, Boursier-Neyret C, Walther B, Ebbels TM, Pelczer I, Holmes E, Lindon JC, Nicholson JK. Optimized preprocessing of ultra-performance liquid chromatography/mass spectrometry urinary metabolic profiles for improved information recovery. Anal Chem. 2011; 83:5864. [PubMed: 21526840]
18. Fernández-Albert F, Llorach R, Garcia-Aloy M, Ziyatdinov A, Andres-Lacueva C, Perera A. Intensity drift removal in LC/MS metabolomics by common variance compensation. Bioinformatics. 2014; 30:2899. [PubMed: 24990606]
19. Bonferroni CE. Teoria statistica delle classi e calcolo delle probabilità. Pubblicazioni del R Istituto Superiore di Scienze Economiche e Commerciali di Firenze. 1936; 8:3.
20. Schena M, Shalon D, Heller R, Chai A, Brown PO, Davis RW. Parallel human genome analysis: microarray-based expression monitoring of 1000 genes. Proc Natl Acad Sci USA. 1996; 93:10614. [PubMed: 8855227]
21. Jin W, Riley RM, Wolfinger RD, White KP, Passador-Gurgel G, Gibson G. The contributions of sex, genotype and age to transcriptional variance in Drosophila melanogaster. Nat Genet. 2001; 29:389. [PubMed: 11726925]
22. Benjamini Y, Drai D, Elmer G, Kafkafi N, Golani I. Controlling the false discovery rate in behavior genetics research. Behav Brain Res. 2001; 125:279. [PubMed: 11682119]
23. Storey JD. A direct approach to false discovery rates. J Royal Stat Soc: Series B (Stat Meth). 2002; 64:479.
24. Gadbury GL, Xiang Q, Yang L, Barnes S, Page GP, Allison DB. Evaluating statistical methods using plasmode data sets in the age of massive public databases: an illustration using false discovery rates. PLoS Genet. 2008; 4:e1000098. [PubMed: 18566659]
Barnes et al. Page 16
J Mass Spectrom. Author manuscript; available in PMC 2017 September 05.
Author M
anuscriptA
uthor Manuscript
Author M
anuscriptA
uthor Manuscript

25. Kaplan K, Dwivedi P, Davidson S, Yang Q, Tso P, Siems W, Hill HH Jr. Monitoring dynamic changes in lymph metabolome of fasting and fed rats by electrospray ionization-ion mobility mass spectrometry (ESI-IMMS). Anal Chem. 2009; 81:7944. [PubMed: 19788315]
26. Damen CW, Isaac G, Langridge J, Hankemeier T, Vreeken RJ. Enhanced lipid isomer separation in human plasma using reversed-phase UPLC with ion-mobility/high-resolution MS detection. J Lipid Res. 2014; 55:1772. [PubMed: 24891331]
27. Gerlich MI, Neumann S. MetFusion: integration of compound identification strategies. J Mass Spectrom. 2013; 48:291. [PubMed: 23494783]
28. Allen F, Pon A A, Wilson M, Greiner R, Wishart DS. CFM-ID: a web server for annotation, spectrum prediction and metabolite identification from tandem mass spectra. Nucleic Acids Res. 2014; 42:W94. [PubMed: 24895432]
29. Prasain JK, Patel RP, Kirk M, Wilson LS, Botting N, Darley-Usmar VM, Barnes S. Mass spectrometric methods for the analysis of chlorinated and nitrated isoflavonoids: a novel class of biological metabolites. J Mass Spectrom. 2003; 38:764. [PubMed: 12898656]
30. Boersma BJ, D'Alessandro T, Benton MR, Kirk M, Wilson LS, Prasain JK, Botting NP, Barnes S, Darley-Usmar VM, Patel RP. Neutrophil myeloperoxidase chlorinates and nitrates soy isoflavones and enhances their antioxidant properties. Free Radic Biol Med. 2003; 35:1417. [PubMed: 14642389]
31. Prasain JK, Jones K, Kirk M, Wilson LS, Smith-Johnson M, Weaver C, Barnes S. Profiling and quantification of isoflavonoids in kudzu dietary supplements by high-performance liquid chromatography and electrospray ionization tandem mass spectrometry. J Agric Food Chem. 2003; 51:4213. [PubMed: 12848487]
32. Draper WM, Brown FR, Bethem R, Miille MJ. Thermospray mass spectrometry and tandem mass spectrometry of polar, urinary metabolites and metabolic conjugates. Biomed Environ Mass Spectrom. 1989; 18:767. [PubMed: 2790262]
33. Zhu X, Hayashi M, Subramanian R. Enhanced detection and characterization of glutathione-trapped reactive metabolites by pseudo-MS(3) transition using a linear ion trap mass spectrometer. Chem Res Toxicol. 2012; 25:1839. [PubMed: 22920186]
34. Edison AS, Clendinen CS, Ajredini R, Beecher C, Ponce FV, Stupp GS. Metabolomics and Natural-Products Strategies to Study Chemical Ecology in Nematodes. Integr Comp Biol. 2015; 55:478. [PubMed: 26141866]
35. Leeming MG, Isaac AP, Pope BJ, Cranswick N, Wright CE, Ziogas J, O'Hair RA, Donald WA. High-resolution twin-ion metabolite extraction (HiTIME) mass spectrometry: nontargeted detection of unknown drug metabolites by isotope labeling, liquid chromatography mass spectrometry, and automated high-performance computing. Anal Chem. 2015; 87:4104. [PubMed: 25818563]
36. Li S, Park Y, Duraisingham S, Strobel FH, Khan N, Soltow QA, Jones DP, Pulendran B. Predicting network activity from high throughput metabolomics. PLoS Comput Biol. 2013; 9:e1003123. [PubMed: 23861661]
37. Xu X, Araki K, Li S, Han JH, Ye L, Tan WG, Konieczny BT, Bruinsma MW, Martinez J, Pearce EL, Green DR, Jones DP, Virgin HW, Ahmed R. Autophagy is essential for effector CD8 T cell survival and memory formation. Nature Immunol. 2014; 15:1152. [PubMed: 25362489]
38. Hoffman JM, Soltow QA, Li S, Sidik A, Jones DP, Promislow DE. Effects of age, sex, and genotype on high-sensitivity metabolomic profiles in the fruit fly, Drosophila melanogaster. Aging Cell. 2014; 13:596. [PubMed: 24636523]
39. Sleator RD. The human superorganism - of microbes and men. Med Hypotheses. 2010; 74:214. [PubMed: 19836146]
40. Barnes S, Kirk M, Coward L. Isoflavones and their conjugates in soy foods: extraction conditions and analysis by HPLC-mass spectrometry. J Agric Food Chem. 1994; 42:2466.
41. Barnes S. The biochemistry, chemistry and physiology of the isoflavones in soybeans and their food products. Lymph Res Biol. 2010; 8:89.
42. Sfakianos J, Coward L, Kirk M, Barnes S. Intestinal uptake and biliary excretion of the isoflavone genistein in the rat. J Nutr. 1997; 127:1260. [PubMed: 9202077]
Barnes et al. Page 17
J Mass Spectrom. Author manuscript; available in PMC 2017 September 05.
Author M
anuscriptA
uthor Manuscript
Author M
anuscriptA
uthor Manuscript

43. Day AJ, Cañada FJ, Díaz JC, Kroon PA, Mclauchlan R, Faulds CB, Plumb GW, Morgan MR, Williamson G. Dietary flavonoid and isoflavone glycosides are hydrolysed by the lactase site of lactase phlorizin hydrolase. FEBS Lett. 2000; 468:166. [PubMed: 10692580]
44. Setchell KD, Clerici C, Lephart ED, Cole SJ, Heenan C, Castellani D, Wolfe BE, Nechemias-Zimmer L, Brown NM, Lund TD, Handa RJ, Heubi JE. S-equol, a potent ligand for estrogen receptor beta, is the exclusive enantiomeric form of the soy isoflavone metabolite produced by human intestinal bacterial flora. Am J Clin Nutr. 2005; 81:1072. [PubMed: 15883431]
45. Le A, Lane AN, Hamaker M, Bose S, Gouw A, Barbi J, Tsukamoto T, Rojas CJ, Slusher BS, Zhang H, Zimmerman LJ, Liebler DC, Slebos RJ, Lorkiewicz PK, Higashi RM, Fan TW, Dang CV. Glucose-independent glutamine metabolism via TCA cycling for proliferation and survival in B cells. Cell Metab. 2012; 15:110. [PubMed: 22225880]
46. Lane AN, Fan TW, Higashi RM. Isotopomer-based metabolomic analysis by NMR and mass spectrometry. Methods Cell Biol. 2008; 84:541. [PubMed: 17964943]
47. Fan TW, Lane AN, Higashi RM, Farag MA, Gao H, Bousamra M, Miller DM. Altered regulation of metabolic pathways in human lung cancer discerned by (13)C stable isotope-resolved metabolomics (SIRM). Mol Cancer. 2009; 8:41. [PubMed: 19558692]
48. Liu W, Le A, Hancock C, Lane AN, Dang CV, Fan TW, Phang JM. Reprogramming of proline and glutamine metabolism contributes to the proliferative and metabolic responses regulated by oncogenic transcription factor c-MYC. Proc Natl Acad Sci USA. 2012; 109:8983. [PubMed: 22615405]
49. Yang Y, Lane AN, Ricketts CJ, Sourbier C, Wei MH, Shuch B, Pike L, Wu M, Rouault TA, Boros LG, Fan TW, Linehan WM. Metabolic reprogramming for producing energy and reducing power in fumarate hydratase null cells from hereditary leiomyomatosis renal cell carcinoma. PLoS One. 2013; 8:e72179. [PubMed: 23967283]
50. Sellers K, Fox MP, Bousamra M II, Slone SP, Higashi RM, Miller DM, Wang Y, Yan J, Yuneva MO, Deshpande R, Lane AN, Fan TW. Pyruvate carboxylase is critical for non-small-cell lung cancer proliferation. J Clin Invest. 2015; 125:687. [PubMed: 25607840]
51. McDonnell LA, Heeren RMA, de Lange RPJ, Fletcher IW. Higher sensitivity secondary ion mass spectrometry of biological molecules for high resolution, chemically specific imaging. J Am Soc Mass Spectrom. 2006; 17:1195. [PubMed: 16769220]
52. Guenther S, Schäfer KC, Balog J, Dénes J, Majoros T, Albrecht K, Tóth M, Spengler B, Takáts Z. Electrospray post-ionization mass spectrometry of electrosurgical aerosols. J Am Soc Mass Spectrom. 2011; 22:2082. [PubMed: 21952773]
53. Balog J, Sasi-Szabó L, Kinross J, Lewis MR, Muirhead LJ, Veselkov K, Mirnezami R, Dezső B, Damjanovich L, Darzi A, Nicholson JK, Takáts Z. Intraoperative tissue identification using rapid evaporative ionization mass spectrometry. Sci Transl Med. 2013; 5:194ra93.
54. Golf O, Strittmatter N, Karancsi T, Pringle SD, Speller AV, Mroz A, Kinross JM, Abbassi-Ghadi N, Jones EA, Takats Z. Rapid evaporative ionization mass spectrometry imaging platform for direct mapping from bulk tissue and bacterial growth media. Anal Chem. 2015; 87:2527. [PubMed: 25671656]
55. Wiseman JM, Ifa DR, Zhu Y, Kissinger CB, Manicke NE, Kissinger PT, Cooks RG. Desorption electrospray ionization mass spectrometry: Imaging drugs and metabolites in tissues. Proc Natl Acad Sci USA. 2008; 105:18120. [PubMed: 18697929]
56. Guenther S, Muirhead LJ, Speller AV, Golf O, Strittmatter N, Ramakrishnan R, Goldin RD, Jones E, Veselkov K, Nicholson J, Darzi A, Takats Z. Spatially resolved metabolic phenotyping of breast cancer by desorption electrospray ionization mass spectrometry. Cancer Res. 2015; 75:1828. [PubMed: 25691458]
57. Gerbig S, Golf O, Balog J, Denes J, Baranyai Z, Zarand A, Raso E, Timar J, Takats Z. Analysis of colorectal adenocarcinoma tissue by desorption electrospray ionization mass spectrometric imaging. Anal Bioanal Chem. 2012; 403:2315. [PubMed: 22447214]
58. Khatib-Shahidi S, Andersson M, Herman JL, Gillespie TA, Caprioli RM. Direct molecular analysis of whole-body animal tissue sections by imaging MALDI mass spectrometry. Anal Chem. 2006; 78:6448. [PubMed: 16970320]
Barnes et al. Page 18
J Mass Spectrom. Author manuscript; available in PMC 2017 September 05.
Author M
anuscriptA
uthor Manuscript
Author M
anuscriptA
uthor Manuscript
59. Stoyanovsky DA, Sparvero LJ, Amoscato AA, He RR, Watkins S, Pitt BR, Bayir H, Kagan VE. Improved spatial resolution of matrix-assisted laser desorption/ionization imaging of lipids in the brain by alkylated derivatives of 2,5-dihydroxybenzoic acid. Rapid Commun Mass Spectrom. 2014; 28:403. [PubMed: 24497278]
60. Rao S, Walters KB, Wilson L, Chen B, Bolisetty S, Graves D, Barnes S, Agarwal A, Kabarowski JH. Early lipid changes in acute kidney injury using SWATH lipidomics coupled with MALDI tissue imaging. Am J Physiol Renal Physiol. 2016 Feb 24. ajprenal.00100.2016. doi: 10.1152/ajprenal.00100.2016. [Epub ahead of print].
61. Anderson DM, Ablonczy Z, Koutalos Y, Spraggins J, Crouch RK, Caprioli RM, Schey KL. High resolution MALDI imaging mass spectrometry of retinal tissue lipids. J Am Soc Mass Spectrom. 2014; 25:1394. [PubMed: 24819461]
62. Buck A, Ly A, Balluff B, Sun N, Gorzolka K, Feuchtinger A, Janssen KP, Kuppen PJ, van de Velde CJ, Weirich G, Erlmeier F, Langer R, Aubele M, Zitzelsberger H, Aichler M, Walch A. High-resolution MALDI-FT-ICR MS imaging for the analysis of metabolites from formalin-fixed, paraffin-embedded clinical tissue samples. J Pathol. 2015; 237:123. [PubMed: 25965788]
63. Thompson DK, Sloane R, Bain JR, Stevens RD, Newgard CB, Pieper CF, Kraus VB. Daily variation of serum acylcarnitines and amino acids. Metabolomics. 2012; 8:556. [PubMed: 25067934]
64. Layman CA, Araujo MS, Boucek R, Hammerschlag-Peyer CM, Harrison E, Jud ZR, Matich P, Rosenblatt AE, Vaudo J, Yeager LA, Post DM, Bearhop S. Applying stable isotopes to examine food web structure: an overview of analytical tools. Biological Reviews. 2012; 87:545. [PubMed: 22051097]
65. Nikolskiy I, Siuzdak G, Patti GJ. Discriminating precursors of common fragments for large-scale metabolite profiling by triple quadrupole mass spectrometry. Bioinformatics. 2015; 31:2017. [PubMed: 25691443]
66. Desmet G, Callewaert M, Ottevaere H, De Malsche W. Merging open-tubular and packed bed liquid chromatography. Anal Chem. 2015; 87:7382. [PubMed: 26075679]
Barnes et al. Page 19
J Mass Spectrom. Author manuscript; available in PMC 2017 September 05.
Author M
anuscriptA
uthor Manuscript
Author M
anuscriptA
uthor Manuscript

Figure 1. Aligned, multiple NMR spectra with regions marked that can be deleted prior to NMR binningThe spectra are divided into regular small regions (0.04 ppm) called bins. As noted on this
figure, NMR resonances with downfield chemical shifts (> 9 ppm, noise), urea resonances
(5.4–6 ppm), the suppressed water resonance (4.8–5 ppm) and resonances in the upfield
region (<0.4 ppm, noise and DSS) are removed from the dataset prior to binning. Binned
NMR data are usually normalized to the total integral of each of the spectrum.
Barnes et al. Page 20
J Mass Spectrom. Author manuscript; available in PMC 2017 September 05.
Author M
anuscriptA
uthor Manuscript
Author M
anuscriptA
uthor Manuscript

Figure 2. Workflow for pre-processing LC-MS and GC-MS dataThe collected data are first centroided to obtain the best estimates of the masses of the ions.
This is followed by detection of features (i.e., peaks) and their grouping and alignment
between different samples. This allows the areas of the aligned peaks to be compared
statistically.
Barnes et al. Page 21
J Mass Spectrom. Author manuscript; available in PMC 2017 September 05.
Author M
anuscriptA
uthor Manuscript
Author M
anuscriptA
uthor Manuscript

Figure 3. A Cloud plot used to visualize LC-MS dataThis plot is generated by XCMSonline (https://xcmsonline.scripps.edu). The two gray traces
are the overlaid total ion chromatograms from all the samples being analyzed. Ions
considered to be statistically different using fold change >1.5 (up or down) and p<0.01 are
marked as circles coded for up-regulated (green) or down-regulated (red). The size of the
circles represents the absolute value of the log2(fold change) and the depth of the color the
−log(p-value). The online analysis also includes an interactive form of the plot where
clicking on each dot with a mouse reveals a box containing the m/z value, retention time, p-
value, fold change, maximum intensity and where known, the identity of the ion.
Barnes et al. Page 22
J Mass Spectrom. Author manuscript; available in PMC 2017 September 05.
Author M
anuscriptA
uthor Manuscript
Author M
anuscriptA
uthor Manuscript

Figure 4. Presentation of LC-MS data using MzmineUntargeted LC-MS/MS data were converted to .mzXML format and analyzed by Mzmine.
In A, the data are shown as a 3D-presentation. In B, an ion chromatogram was generated
based on a selected mass of m/z 264.080.
Barnes et al. Page 23
J Mass Spectrom. Author manuscript; available in PMC 2017 September 05.
Author M
anuscriptA
uthor Manuscript
Author M
anuscriptA
uthor Manuscript

Figure 5. Univariate Analysis Volcano plotThe negative logarithm of the p-value for each metabolite is plotted against the logarithm to
the base 2 of the fold change.
Barnes et al. Page 24
J Mass Spectrom. Author manuscript; available in PMC 2017 September 05.
Author M
anuscriptA
uthor Manuscript
Author M
anuscriptA
uthor Manuscript

Figure 6. Principal components analysis (PCA)PCA analysis allows for the separation of the variation between samples to be separate into
several principal components. It does not use group information to do this. The contribution
of each metabolite in a sample to a principal component allows reduction of 1,000 or more
factors into a single number representing that component. (A) By plotting these numbers for
a sample in 2D-PCA or 3D-PCA formats and then color coding the point with the group
they are derived from, allows the investigator to determine if there is a group separation. In
the example in this figure the 95% confidence for each group is also marked. (B) The
loadings plot provides information on which ions are contributing the most to the
separations between the groups.
Barnes et al. Page 25
J Mass Spectrom. Author manuscript; available in PMC 2017 September 05.
Author M
anuscriptA
uthor Manuscript
Author M
anuscriptA
uthor Manuscript

Figure 7. Partial Least Squares-Discriminant Analysis (PLS-DA)This form of analysis, unlike PCA analysis, is a supervised method. It, too, breaks down the
total variation into factors that are single numbers representing the contribution of each
metabolite to the factor. These, as before for PCA analysis, can be examined as 2D- or 3D-
plots (A) and loading plots (B).
Barnes et al. Page 26
J Mass Spectrom. Author manuscript; available in PMC 2017 September 05.
Author M
anuscriptA
uthor Manuscript
Author M
anuscriptA
uthor Manuscript
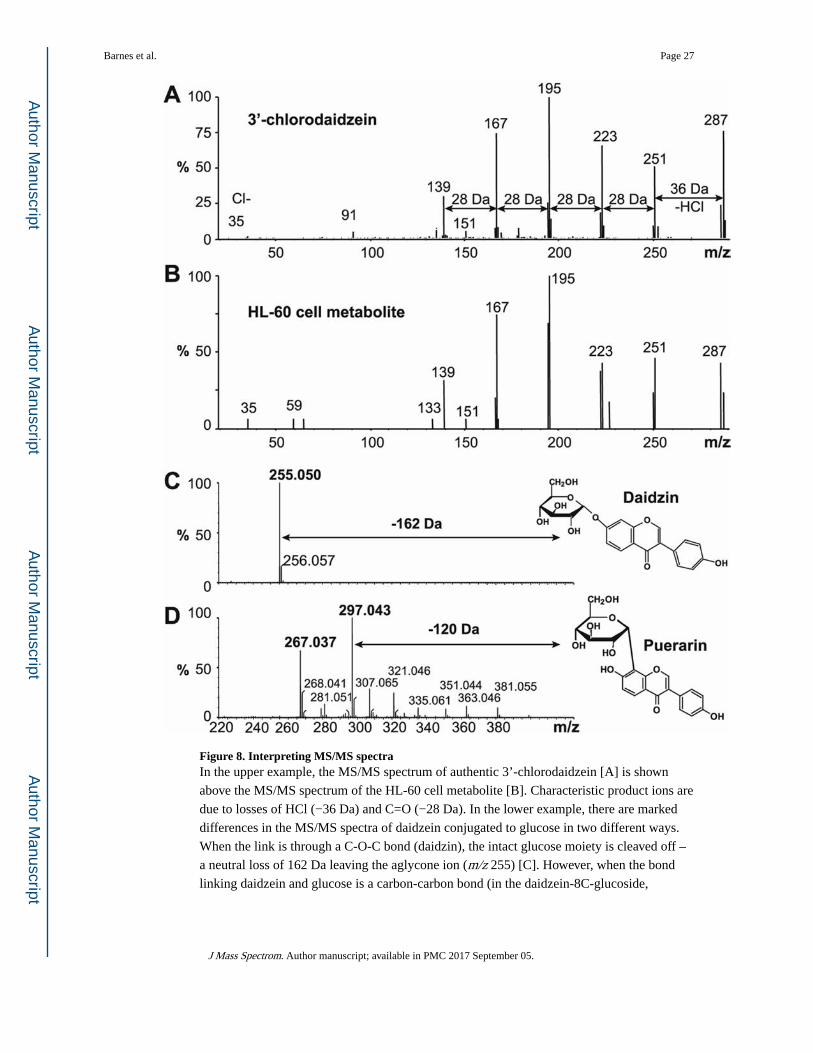
Figure 8. Interpreting MS/MS spectraIn the upper example, the MS/MS spectrum of authentic 3’-chlorodaidzein [A] is shown
above the MS/MS spectrum of the HL-60 cell metabolite [B]. Characteristic product ions are
due to losses of HCl (−36 Da) and C=O (−28 Da). In the lower example, there are marked
differences in the MS/MS spectra of daidzein conjugated to glucose in two different ways.
When the link is through a C-O-C bond (daidzin), the intact glucose moiety is cleaved off –
a neutral loss of 162 Da leaving the aglycone ion (m/z 255) [C]. However, when the bond
linking daidzein and glucose is a carbon-carbon bond (in the daidzein-8C-glucoside,
Barnes et al. Page 27
J Mass Spectrom. Author manuscript; available in PMC 2017 September 05.
Author M
anuscriptA
uthor Manuscript
Author M
anuscriptA
uthor Manuscript

puerarin), the glucose moiety is retained and the observed ions are due to water losses and
other rearrangements of the glucose moiety [D].
Barnes et al. Page 28
J Mass Spectrom. Author manuscript; available in PMC 2017 September 05.
Author M
anuscriptA
uthor Manuscript
Author M
anuscriptA
uthor Manuscript

Figure 9. Isotope ratio Outlier Analysis (IROA)The IROA approach uses two sets of distinct randomized substrates, labeled with 95% 13C
and 5% 13C, to individually label cellular metabolomes with and without stressors. Pooled
cells are processed and MS analysis reveals U-shaped mirrored isotopologue pairs of
metabolites. The width of the U in Da (distance between the monoisotopic 12C and 13C ion
pairs) gives the number of carbon atoms in the metabolite. (Permission provided by IROA
Technologies).
Barnes et al. Page 29
J Mass Spectrom. Author manuscript; available in PMC 2017 September 05.
Author M
anuscriptA
uthor Manuscript
Author M
anuscriptA
uthor Manuscript

Figure 10. Mummichog analysis of LC-MS and GC-MS data to discover metabolite networks and pathway associationsThis analysis is a selectable item (Connections) on the XCMSonline website, or it can be run
in the command line mode after first downloading the Mummichog software. The latter is
helpful when metabolomics data require normalization, mean centering and scaling prior to
statistical analysis. The user creates a .txt file of all the metabolites, their m/z values, their t-
test values and their p-values (A). This file is used to determine networks of connected
reactions (B). After statistical modeling (C) to estimate random association with
metabolomic pathways, pathways and networks that are enriched by the significantly
different ions are identified (D).
Barnes et al. Page 30
J Mass Spectrom. Author manuscript; available in PMC 2017 September 05.
Author M
anuscriptA
uthor Manuscript
Author M
anuscriptA
uthor Manuscript

Figure 11. Complex pathways of metabolism of the isoflavone daidzein across several biological domainsIsoflavones are synthesized in the soybean and converted to their β-glucosides which in turn
are esterified with malonic acid and stored in vacuoles in the soybean seed. Harvested
soybeans are soaked in water (to remove protease inhibitors) and ground and treated with
hot boiling water to extract the proteins therein thereby forming soy milk. Soy milk is
coagulated (not shown) to form tofu. This treatment causes hydrolysis of the malonate ester
group and yields the β-glucoside, 7β-D-glucosyldaidzein. When this form of daidzein is
consumed (in tofu or soymilk), it is enzymatically hydrolyzed by a physiologic enzyme in
the small intestine to unconjugated daidzein. The latter is absorbed into the enterocyte where
it mostly undergoes β-glucuronidation before entering the blood stream. In contrast,
soybeans in many countries such as the USA are a rich source of polyunsaturated oil. Once
the soybeans have been defatted they can be converted into protein products. In order to
inactivate residual enzymes in the defatted soybean, they are subjected to toasting, a dry
heating process. This causes decarboxylation of the malonate ester forming an acetate ester
of 7β-D-glucosyldaidzein. This isoflavone conjugate when eaten is not a substrate for the
physiologic enzyme and instead makes its way to the large bowel where hydrolysis is caused
by colonic bacteria.
Barnes et al. Page 31
J Mass Spectrom. Author manuscript; available in PMC 2017 September 05.
Author M
anuscriptA
uthor Manuscript
Author M
anuscriptA
uthor Manuscript

Figure 12. Imaging mass spectrometry of early kidney injuryEarly (6 h) increases in renal levels of an ether-linked phosphatidylcholine (PC O-38:1) with
ischemia reperfusion (IR) kidney injury (identified using SWATH lipidomics) are
predominantly localized to proximal tubules. (A) MALDI-IMS spectra from control and IR
kidneys. Arrow denotes ion at m/z 824.7 consistent with sodiated ([M+Na+]) PC O-38:1. (B)
Positive ion mode MALDI-IMS images of 2,5-DHB coated coronal kidney cryosections
from control and IR mice showing the distribution of m/z 824.7 sodiated PC O-38:1. Lotus
tetragonolobus lectin staining of proximal tubules in coronal kidney sections adjacent to
those in (A) shown alongside demonstrate that PC O-38:1 is most abundant in proximal
tubular areas. (C) Positive mode MS/MS analysis on 2,5-DHB coated kidney cryosections of
m/z 824.7 [M+Na+] ion showing a m/z 184.1 fragment indicative of the PC headgroup in PC
O-38:1.
Barnes et al. Page 32
J Mass Spectrom. Author manuscript; available in PMC 2017 September 05.
Author M
anuscriptA
uthor Manuscript
Author M
anuscriptA
uthor Manuscript
Related Documents