Minnesota State University, Mankato Minnesota State University, Mankato Cornerstone: A Collection of Scholarly Cornerstone: A Collection of Scholarly and Creative Works for Minnesota and Creative Works for Minnesota State University, Mankato State University, Mankato All Graduate Theses, Dissertations, and Other Capstone Projects Graduate Theses, Dissertations, and Other Capstone Projects 2016 Training Coping Techniques to Reduce Statistics Anxiety Training Coping Techniques to Reduce Statistics Anxiety Brittany Prothe Minnesota State University Mankato Follow this and additional works at: https://cornerstone.lib.mnsu.edu/etds Part of the Industrial and Organizational Psychology Commons Recommended Citation Recommended Citation Prothe, B. (2016). Training Coping Techniques to Reduce Statistics Anxiety [Master’s thesis, Minnesota State University, Mankato]. Cornerstone: A Collection of Scholarly and Creative Works for Minnesota State University, Mankato. https://cornerstone.lib.mnsu.edu/etds/584/ This Thesis is brought to you for free and open access by the Graduate Theses, Dissertations, and Other Capstone Projects at Cornerstone: A Collection of Scholarly and Creative Works for Minnesota State University, Mankato. It has been accepted for inclusion in All Graduate Theses, Dissertations, and Other Capstone Projects by an authorized administrator of Cornerstone: A Collection of Scholarly and Creative Works for Minnesota State University, Mankato.

Welcome message from author
This document is posted to help you gain knowledge. Please leave a comment to let me know what you think about it! Share it to your friends and learn new things together.
Transcript

Minnesota State University, Mankato Minnesota State University, Mankato
Cornerstone: A Collection of Scholarly Cornerstone: A Collection of Scholarly
and Creative Works for Minnesota and Creative Works for Minnesota
State University, Mankato State University, Mankato
All Graduate Theses, Dissertations, and Other Capstone Projects
Graduate Theses, Dissertations, and Other Capstone Projects
2016
Training Coping Techniques to Reduce Statistics Anxiety Training Coping Techniques to Reduce Statistics Anxiety
Brittany Prothe Minnesota State University Mankato
Follow this and additional works at: https://cornerstone.lib.mnsu.edu/etds
Part of the Industrial and Organizational Psychology Commons
Recommended Citation Recommended Citation Prothe, B. (2016). Training Coping Techniques to Reduce Statistics Anxiety [Master’s thesis, Minnesota State University, Mankato]. Cornerstone: A Collection of Scholarly and Creative Works for Minnesota State University, Mankato. https://cornerstone.lib.mnsu.edu/etds/584/
This Thesis is brought to you for free and open access by the Graduate Theses, Dissertations, and Other Capstone Projects at Cornerstone: A Collection of Scholarly and Creative Works for Minnesota State University, Mankato. It has been accepted for inclusion in All Graduate Theses, Dissertations, and Other Capstone Projects by an authorized administrator of Cornerstone: A Collection of Scholarly and Creative Works for Minnesota State University, Mankato.

Training Coping Techniques to Reduce Statistics Anxiety
By
Brittany Prothe
A Thesis Submitted in Partial Fulfillment of the
Requirements for the Degree of
Master of Arts
In
Industrial/Organizational Psychology
Minnesota State University, Mankato
Mankato, Minnesota
May 2016

March 17th, 2016 Training Coping Techniques to Reduce Statistics Anxiety
Brittany Prothe This thesis has been examined and approved by the following members of the student’s committee.
________________________________ Andrea Lassiter, Ph. D.
Advisor
________________________________ Lisa Perez, Ph. D.
Committee Member
________________________________ Jeffrey Ford, M. A.
Committee Member

Running head: TRAINING COPING TO REDUCE STATISTICS ANXIETY 1
Training Coping Techniques to Reduce Statistics Anxiety
By: Brittany Prothe
Minnesota State University, Mankato

TRAINING COPING TO REDUCE STATISTICS ANXIETY 2
Abstract
Undergraduate students in introduction to statistics courses have been shown to have
difficulties and anxiety related to the course. This study examines how coping training
might reduce the statistics anxiety associated with these courses using a sample of
students currently enrolled in the course. Results indicate that individual differences
such as negative affect, trait anxiety, disengaged coping strategies and cognitive ability
are related to statistics anxiety. The specific coping training used in this study was
unable to reduce statistics anxiety; however, other methods for reducing statistics
anxiety are suggested and directions for future research are provided.

TRAINING COPING TO REDUCE STATISTICS ANXIETY 3
Training Coping Techniques to Improve Statistics Self-Efficacy
Many undergraduate psychology programs across the country have recognized
statistics as one of the essential aspects of the psychology degree, with most schools
requiring at least an introductory to statistics course as part of the core curriculum. A
1981 study by Bartz found 72% of psychology majors at four-year universities requiring
one course in statistics. Even as curricula changed, it was still reported years later that
most psychology programs valued statistics as a requirement (Zanakis & Valenzi, 1997).
However, many students have anxiety tied to taking a statistics course, even going as far
as to report statistics as the most challenging and least pleasant of the courses that they
have to take (Berk & Nanda, 1998). The purpose of this research is to examine whether a
training intervention can make this core course less stressful for undergraduate
psychology students.
Instructors need to know how to help students reduce negative attitudes and
alleviate anxiety they experience when taking a statistics course. Providing students with
strategies to handle these stressors can increase their performance and retention of this
valuable course. Previous research has focused on finding the variables that have a
relationship with statistics anxiety (Gal & Ginsburg, 1994: Zanakis & Valenzi, 1997).
Because of the relatively new nature of this area of research, there has not been a
significant amount of research in resolving the issues associated with statistics anxiety.
The purpose of the present study is to support the previous research by examining
relationships between statistics anxiety and statistics self-efficacy, as well as exploring
some trait-based individual differences that may influence statistics anxiety. In addition,
the study is hoping to find that training will moderate the effect of trait-based individual

TRAINING COPING TO REDUCE STATISTICS ANXIETY 4
differences on statistics anxiety, thus leading to better statistics self-efficacy. Specifically,
it is believed that training on coping skills and the resources available to the students will
lead to more engaged coping that allows students to become more active in resolving the
stressors associated with a statistics course.
General Anxiety and Statistics Anxiety
All students enter school with a personal level of trait anxiety. Trait anxiety is the
amount of anxiety that a person experiences on a day to day basis. Anxiety is an abstract
concept that has not been exactly defined by the scientific community. One definition
involves a reaction to a perception of threat and diffusion of the arousal that is associated
with that threat (Epstein, 1972). Individuals with high levels of trait anxiety tend to
perform the same on low-difficulty tasks but have a hard time handling the stress of a
high-difficulty task as related to their less anxious peers (Fitzgerald, 1997). Therefore,
when related to school, students who have higher trait anxiety have significantly different
levels of learning in high-difficulty situations as compared to their peers. Those with high
anxiety experience difficulties in all stages of processing problems (Tobias, 1979).
As stated before, students often report that statistics is one of the most difficult
and the least enjoyable of the courses they are required to take (Berk & Nanda, 1998). In
part because of these student perceptions, and perhaps because of its challenging nature,
statistics courses are high-difficulty tasks for some psychology undergraduates. This can
contribute to the reduction of processing ability. Statistics anxiety is a state form of
anxiety defined as the “feeling of anxiety encountered when taking a statistics course, or
doing statistical analyses: that is, gathering, processing, and interpreting" (Crusie, Cash &
Bolton, 1985). A large number of students report that they experience statistics anxiety,
TRAINING COPING TO REDUCE STATISTICS ANXIETY 5
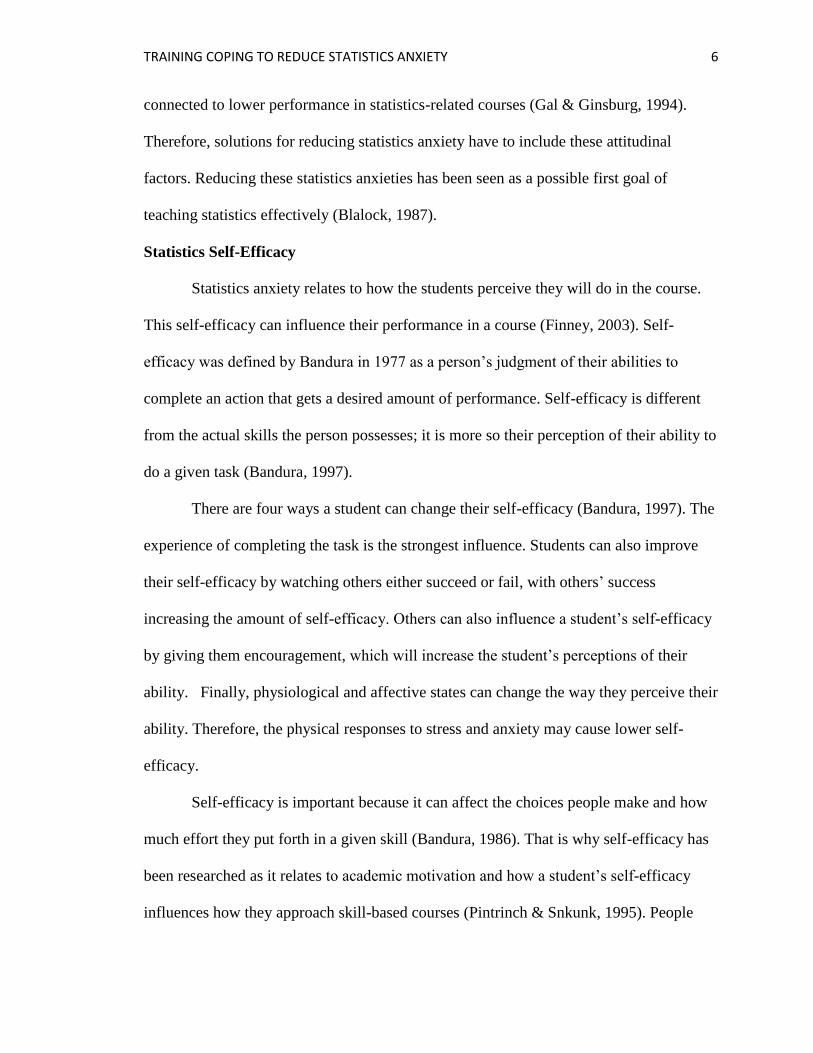
with 30% of students reporting that they had a large amount of statistics anxiety and 41%
of students reporting they had at least some degree of statistics anxiety (Zeidner, 1991).
There are many aspects of statistics anxiety, but the six main components as
defined by Cruise et al. (1985) are: worth of statistics, interpretation anxiety, test and
course anxiety, computational self-concept, fear of asking for help, and statistics teachers.
Worth of statistics is when the student thinks what they are learning will not have any
relevance to their life and, therefore, is worthless to them. Interpretation anxiety is the
stress associated with being given results to a statistics analysis and being required to
explain or make decisions based on the results. Test and course anxiety is the stress
associated with the homework and exams in a statistics course. Computational self-
concept is when a student doubts their ability to do statistics because they believe it is too
math-focused, or that they do not possess the skills required to learn statistics. Fear of
asking for help is the fear of going to others when the student does not understand the
material. The fear of statistics teachers is the anxiety associated with going to the teacher
when they have a question or need assistance because they think the teacher will judge
them or that the teacher cannot relate to the struggles they are having in the course. One
or more of these components can lead to high levels of statistics anxiety and the negative
outcomes associated with it.
These negative outcomes from statistics anxiety have been shown to be correlated
with higher drop rates for statistics and lower exam scores in the course (Zanakis &
Valenzi, 1997). However, these issues may not be caused by the lack of ability to learn
statistics, but rather the combination of multiple factors. The attitudinal factors of
negative emotions related to statistics and trait anxiety have also been shown to be
TRAINING COPING TO REDUCE STATISTICS ANXIETY 6
connected to lower performance in statistics-related courses (Gal & Ginsburg, 1994).
Therefore, solutions for reducing statistics anxiety have to include these attitudinal
factors. Reducing these statistics anxieties has been seen as a possible first goal of
teaching statistics effectively (Blalock, 1987).
Statistics Self-Efficacy
Statistics anxiety relates to how the students perceive they will do in the course.
This self-efficacy can influence their performance in a course (Finney, 2003). Self-
efficacy was defined by Bandura in 1977 as a person’s judgment of their abilities to
complete an action that gets a desired amount of performance. Self-efficacy is different
from the actual skills the person possesses; it is more so their perception of their ability to
do a given task (Bandura, 1997).
There are four ways a student can change their self-efficacy (Bandura, 1997). The
experience of completing the task is the strongest influence. Students can also improve
their self-efficacy by watching others either succeed or fail, with others’ success
increasing the amount of self-efficacy. Others can also influence a student’s self-efficacy
by giving them encouragement, which will increase the student’s perceptions of their
ability. Finally, physiological and affective states can change the way they perceive their
ability. Therefore, the physical responses to stress and anxiety may cause lower self-
efficacy.
Self-efficacy is important because it can affect the choices people make and how
much effort they put forth in a given skill (Bandura, 1986). That is why self-efficacy has
been researched as it relates to academic motivation and how a student’s self-efficacy
influences how they approach skill-based courses (Pintrinch & Snkunk, 1995). People

TRAINING COPING TO REDUCE STATISTICS ANXIETY 7
who have higher self-efficacy are more likely to put more effort into completing the skill.
However, students who have lower self-efficacy are more likely to dwell on the problems
and imagine they are bigger than they are (Beck, 1979). These students also tend to avoid
engaging in the skills they perceive themselves to be bad at, and will give up sooner than
their peers that have higher self-efficacy (Bandura, 1986).
Studying self-efficacy is important because it has been found to be a strong
predictor of both past and future performance (Lazarus & Launier, 1978). A study by
Finney (2003) looked at comparing a self-efficacy scale for statistics and a math problem
test to predict performance in the class. Self-efficacy was found to be significantly related
to class performance, with a correlation of r = 0.4–0.5. More importantly, the self-
efficacy scale was found to be more related to class performance than the math problems.
Therefore, this study will be using self-efficacy as a proxy for student performance.
Negative Affect
Students commonly enter a course with an opinion of the course before the
teacher even starts the first lecture. If this opinion is negative, it can be hard to change,
and can affect their performance. Research has shown that students who have negative
emotions towards school have a tendency to exhibit lower performance in school
(Gumora & Arsenio, 2002). Thus, with a high negative affect in a course, students can
exhibit low levels of motivation, which further leads to lower performance. Lower
performance in school can include having a lower GPA, being perceived by peers and
teachers as less academically competent, and having a more general negative mood
(Gumora & Arsenio, 2002).
TRAINING COPING TO REDUCE STATISTICS ANXIETY 8
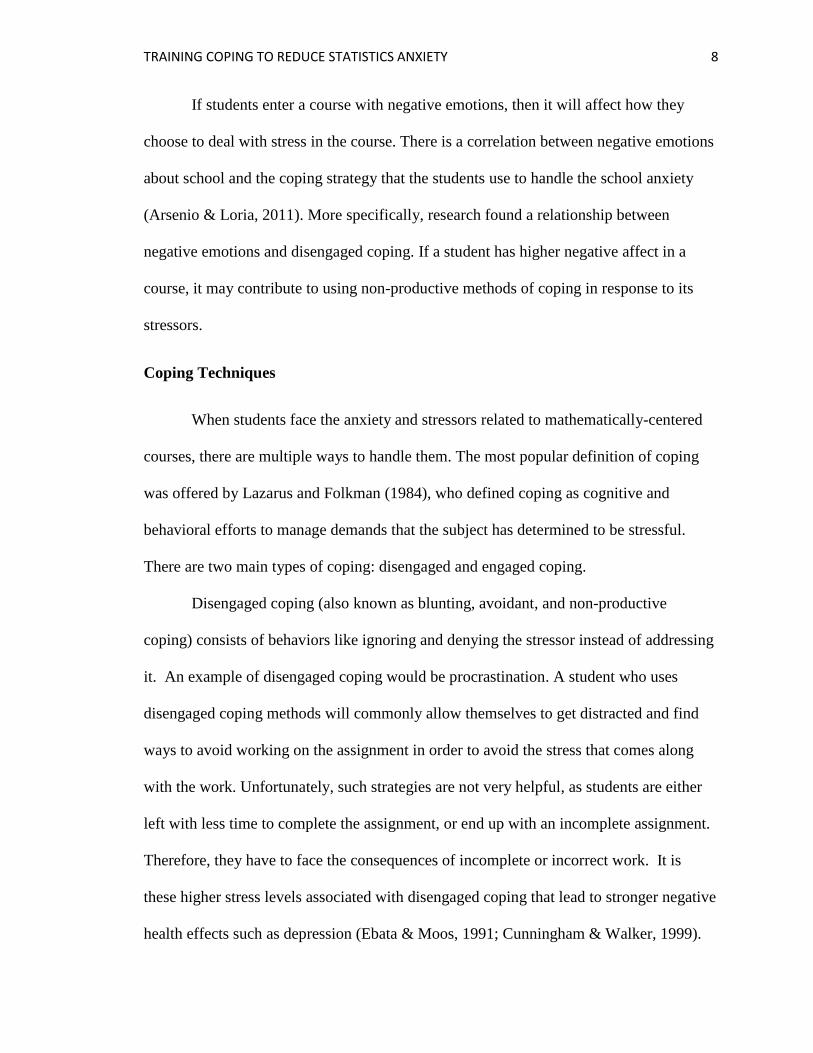
If students enter a course with negative emotions, then it will affect how they
choose to deal with stress in the course. There is a correlation between negative emotions
about school and the coping strategy that the students use to handle the school anxiety
(Arsenio & Loria, 2011). More specifically, research found a relationship between
negative emotions and disengaged coping. If a student has higher negative affect in a
course, it may contribute to using non-productive methods of coping in response to its
stressors.
Coping Techniques
When students face the anxiety and stressors related to mathematically-centered
courses, there are multiple ways to handle them. The most popular definition of coping
was offered by Lazarus and Folkman (1984), who defined coping as cognitive and
behavioral efforts to manage demands that the subject has determined to be stressful.
There are two main types of coping: disengaged and engaged coping.
Disengaged coping (also known as blunting, avoidant, and non-productive
coping) consists of behaviors like ignoring and denying the stressor instead of addressing
it. An example of disengaged coping would be procrastination. A student who uses
disengaged coping methods will commonly allow themselves to get distracted and find
ways to avoid working on the assignment in order to avoid the stress that comes along
with the work. Unfortunately, such strategies are not very helpful, as students are either
left with less time to complete the assignment, or end up with an incomplete assignment.
Therefore, they have to face the consequences of incomplete or incorrect work. It is
these higher stress levels associated with disengaged coping that lead to stronger negative
health effects such as depression (Ebata & Moos, 1991; Cunningham & Walker, 1999).

TRAINING COPING TO REDUCE STATISTICS ANXIETY 9
Engaged coping (also known as monitoring, and active or productive coping)
consists of strategies that actively work to resolve the stressor. Active engagement of
coping strategies can improve performance in a course because of the nature of the
various strategies. Cognitive decision-making is one of the engaged coping strategies
where the person thinks about the stressor and comes up with choices for how the
problem may be solved (Compas et al., 2001). In the classroom environment, this would
consist of setting aside extra time to do homework, study, or find what learning strategies
would be best for them to help study. Another engaged coping strategy is direct problem
solving which consists of changing the person or their surroundings to help resolve the
stressors. Problem-focused support is another engaged strategy which consists of using
other people for help in finding solutions to the problem. In a statistics course, this would
be going to the professor, classmates, or tutors to get assistance with stressors. These
strategies are associated with positive health outcomes (Frydenberg & Lewis, 1999).
The choice of coping strategies has been shown to relate directly to classroom
performance. Disengaged coping consists mostly of ignoring and denying the problem,
and those behaviors lead to procrastination and incomplete assignments. With these
behaviors, the students who choose to use disengaged coping have been shown to have a
lower GPA (Arsenio & Loria, 2011). Students who use engaged coping, and have much
more effective solutions to their stressors, make active plans and get help from others
when they need it. Students who choose to use this constructive coping have been shown
to have a higher GPA (Arsenio & Loria, 2011). It can be speculated that teachers should
be able to influence the type of coping method that the students use, which may improve
students’ grades in the course.

TRAINING COPING TO REDUCE STATISTICS ANXIETY 10
Training To Reduce Statistics Anxiety
Because of the relatively recent nature of statistics-related anxiety research, very
few studies have examined factors that may moderate the effect of individual differences
on statistics anxiety. However, there has been research on integrating coping training into
the curriculum as a way to prevent the negative effect of stressors on other courses (Elias,
1991). Integrating engaged coping provides a way to reduce the overall risk of anxiety in
the population of students (Rosenman, 1998). Integrating the training into the course is
more effective than pulling out high-risk students and training them, because it helps all
students to some extent, and identifying and training high-risk students can be difficult in
the college setting. Therefore, an effective method of training might be to incorporate
coping resources into the existing structure of the course (Reiss & Price, 1996).
For the content of such training, teachers have used The Best of Coping:
Developing Coping Skills Program (BOC) (Frydenberg & Brandon, 2002). This program
is made up of ten parts, each intended on being a separate session for the students to
attend. The first part identifies what coping is and how other people respond to it. This
relates to the research on statistics anxiety which suggests that one way of reducing
anxiety is acknowledging that statistics can be stressful and that the students are not the
only ones who experience this anxiety (Tobias, 1991).
The second part of the training program introduces the connection between how
we evaluate a situation and the feelings we have about the situation. The third part
identifies what ways would not be effective in dealing with the stressors they are
experiencing. Portions four and five relate to how to work with others and how to listen
to the advice of others, as well as who and where to ask for help. The sixth and seventh

TRAINING COPING TO REDUCE STATISTICS ANXIETY 11
portions emphasize problem-solving and making decisions. Portions eight and nine are
referring to setting goals, and finding ways to achieve those goals. The final portion
examines how students can effectively manage their time to find opportunities to execute
the strategies learned in the previous parts.
The current study will be taking the different pieces of BOC training and
incorporating them into one training module. This training will be presented to students
through their learning management system to integrate the training into the course.
Current Study and Hypotheses
Figure 1: Proposed Model of Training of Coping on Statistics Self-Efficacy
The current study will examine the influence of individual differences on statistics
anxiety that were discovered in previous research. The individual difference variables that
the study is interested in are: negative affect, trait anxiety, coping strategies, and cognitive
ability. In addition, the study will explore training coping strategies as a method for
weakening the effect of these individual differences on statistics anxiety (see Figure 1).
Negative Affect
Trait Anxiety
Coping Strategy
Cognitive Ability
Individual Differences
Statistics Anxiety
Statistics Self-Efficacy
Training

TRAINING COPING TO REDUCE STATISTICS ANXIETY 12
Hypothesis
The hypotheses drawn from the proposed model that will be tested in this study are as
follows:
H1: Individual difference variables will be related to the amount of statistics anxiety
reported by the student.
H1a – Negative affect will be positively related to statistics anxiety.
H1b – Trait anxiety will be positively related to statistics anxiety.
H1c – Disengaged coping strategies will be positively related to statistics anxiety.
H1d - Cognitive ability will be negatively related to statistics anxiety.
H2: Statistics anxiety will be negatively related to self-efficacy on a pre- and post-
test.
H3: Training will reduce the statistics anxiety reported by the student.
H4: Training will weaken the relationship between the relevant individual differences
and statistics anxiety.
Methodology
Participants
145 participants were recruited from students enrolled in the fall and spring
semesters of an introduction to statistics course in a Midwestern public university.
Students’ ages ranged from 18 to 35 (𝑀𝑎𝑔𝑒 = 20.37) with students from all years of
college; 26 freshmen (17.9%), 51 sophomores (35.2%), 51 juniors (35.2%), and 17
seniors (11.7%). Students received extra credit for their participation in the study in the
class from which they were recruited. The amount of extra credit was determined by the
instructor of the course, based on guidelines provided by the researcher.

TRAINING COPING TO REDUCE STATISTICS ANXIETY 13
Procedure
At the beginning of the study, both the course instructor and researcher informed
students about the opportunity to be involved in the study. For the fall semester, students
were recruited at the midterm of the semester and completed the study during the last
week of classes. The students in the spring semester were recruited at the beginning of
the semester and completed the study at the midterm of the semester.
Immediately after recruitment, students were provided a link to the first part of the
study; the pretest measures. The pretest was presented to the participants using the
Qualtrics platform, which was provided to the students using a link in the course’s
learning management system (LMS). The survey contained measures of demographic
information, cognitive ability, statistics self-efficacy, negative affect, general and
statistics anxiety, and a coping inventory. More detailed descriptions of these measures
are included in the following section. Students were given two weeks to complete the
pretest survey.
Following the pretest, the students were provided the coping training intervention.
This training was developed using an online learning software and distributed through the
courses’ LMS. The training was developed using the BOC program (Frydenberg &
Brandon, 2002) and modified for online facilitation. After the training, participants
answered questions to see if the students completed the training, as a manipulation check.
A modification was made for the spring semester that combined the pretest and the
coping training, so they were completed at the same time to reduce attrition.
After six weeks, participants were notified and given access to the posttest.
Similar to the pretest, the survey was also presented using the Qualtrics platform and

TRAINING COPING TO REDUCE STATISTICS ANXIETY 14
delivered through the courses’ LMS. The survey contained measures of statistics self-
efficacy, statistics anxiety, and a coping inventory.
Measures
Demographic Information. Participants were asked to provide demographic
information such as age, ethnicity and academic year. Students were also asked to
provide the number of college-level math courses they had taken prior to the statistics
course. Additionally, to match the participant's data throughout the different portions of
the study, the student’s university ID was collected.
Cognitive Ability. To determine whether a change in statistics self-efficacy is
related to the independent variable of the coping training, a proxy measure of cognitive
ability was used. To measure cognitive ability, GPA was collected by self-report. GPA
has been shown in previous studies to be a predictor of success in an introductory
statistics course (Benson, 1989).
Statistics Self-Efficacy. Self-efficacy in the statistics class was measured with a
self-reported level of confidence using the Current Statistics Self-Efficacy (CSSE)
measure developed by Finney and Schraw (2003). This scale was presented in both the
pre- and posttests to determine the relative change in self-efficacy between the two
periods of testing. The measure consists of 14 items with responses on a 6 point Likert
scale (1 = No confidence at all, 6 = Complete confidence) in which participants report the
amount of confidence that they have in completing specific statistics-related tasks.
Previous research has found the internal consistency reliability of the CSSE to be α= 0.91
(Finney & Schraw, 2003).

TRAINING COPING TO REDUCE STATISTICS ANXIETY 15
Negative Affect. Negative affect was measured using portions of the Positive
Affect and Negative Affect Schedule (PANAS) as developed by Watson and Clark
(1998). It was developed to explore individual differences in emotional states and traits
across years and cultures. It consists of 20 words relating to feelings and emotions: 10 for
positive affect and 10 for negative affect. Participants respond on a 5-point Likert scale (1
= very slightly or not at all, 2 = a little, 3 = moderately, 4 = quite a bit, 5 = extremely)
indicating the extent they had felt the emotion in a period determined by the researcher.
For this study, only the ten items related to negative affect were used. This measure also
framed the questions using a present moment mindset, asking the participants “the extent
you feel this way right now, that is, at the present moment” to get a state-based measure
of negative affect. Previous research has found the moment negative affect scale to have
an internal consistency reliability of α = .85. (Watson & Clark, 1998)
Trait Anxiety. Trait anxiety was measured using the State Trait Anxiety
Inventory (STAI) developed by Spielberger (1983). The test was developed as a 40-item
test with 20 for both the state and trait anxiety scales. For this study, only the 20
questions that relate to trait anxiety were used. The STAI is presented as a 4-point Likert
scale (1 = not at all, 2 = somewhat, 3 = moderately so, 4 = very much so) that asks the
participant to indicate how they generally feel. Previous research has found the internal
consistency reliability of the STAI to be α= 0.86 in students (Spielberger, 1983).
Statistics Anxiety. To test student anxiety as it relates to working on statistics,
the Statistical Anxiety Scale (SAS) was used as developed by Vigil-Colet et al. (2008). It
was based on the longer Statistical Anxiety Rating Scale (STARS), created by Cruise and
Wilkens (1980), but was created to be a statistics-related anxiety test that was short

TRAINING COPING TO REDUCE STATISTICS ANXIETY 16
enough to be used easily in a classroom setting. Although the test was developed in
Spain, a study by Chiesi et al. (2011) has shown that the measure has cross-country
validity. Previous research has found the internal consistency reliability of the SAS to be
α= 0.91 (Vigil-Colet et al., 2008). The scale consists of 24 items divided into three
subscales of examination anxiety (α=0.87), asking for help anxiety (α=0.92) and
interpretation anxiety (α=0.82).
Coping Strategies. The effect of coping will be measured by the COPE
developed by Carver et al. (1989). For this study, the shortened version of this measure
will be used, as modified by Carver (1997). The brief COPE has 14 subscales included,
with two questions on each scale. The religion and substance use scales were removed
because of their irrelevance to the current topic. In previous research by Carver (1997),
the internal reliability of most subscales was over an alpha of 0.6 with the scales of
venting (α=0.50) and denial (α=0.54) being below the threshold. The items are presented
on a 4-point Likert scale (1=I haven't been doing this at all to 4= I've been doing this a
lot) (Carter, 1989).
Results
Data Cleanup
Before analyzing the results of the hypotheses, some issues with the data should
be discussed. Although 145 participants were involved with at least one portion of the
study only 80 participants completed all three parts of the study (i.e., pretest, training, and
posttest). In order to have the proper statistical power and a large enough sample size,
analyses used pairwise deletion. Therefore, when the participants had all responses
relevant to the analysis, they were included. Also, to account for the students completing

TRAINING COPING TO REDUCE STATISTICS ANXIETY 17
the survey in different semesters and different times in the semester a variable was
created to covary the effect of the semester. Scales were created by averaging the items
on the scales and subscales; refer to Table 1 for scale internal reliabilities. In addition, the
internal reliabilities for the statistics anxiety subscales were: α=0.90 for examination
anxiety, α=0.94 for asking for help anxiety, and α=0.86 for interpretation anxiety. Nine
items in the STAI were written in a positive tone; these items were reverse-coded to
match the other items.
Individual Differences
Means, standard deviations, and correlations among the individual differences
variables are included in Table 1. The first hypothesis and the sub-hypotheses that follow
were associated with the relationship between the relevant individual differences and
statistics anxiety. For the analysis of this hypothesis, data from the pretest was used. The
use of the pretest data is to see how these individual differences relate to statistics anxiety
without an intervention.
Table 1
Means, Standard Deviations, and Correlations Between Individual Difference Variables
Variable N Mean SD 1 2 3 4 5
1. Negative Affect 144 2.07 0.63 (0.82)
2. Trait Anxiety 140 2.35 0.55 0.60** (0.92)
3. Disengaged Coping
Strategies 141 1.98 0.55 0.56** 0.49** (0.86)
4. Cognitive Ability 141 3.21 0.51 -0.17 -0.11 -0.12 --
5. Statistics Anxiety (pre) 143 2.72 0.73 .49** 0.55** 0.47** -0.20* (0.94)
*Significant at p < 0.05 level **Significant at p < 0.01 level
Hypothesis 1a stated that negative affect should have a positive relationship with
statistics anxiety, where higher levels of negative affect are associated with higher levels

TRAINING COPING TO REDUCE STATISTICS ANXIETY 18
of statistics anxiety. As shown in Table 1, there is a positive correlation that is significant
between the two variables, r(140) = 0.49, p < 0.01. When analyzing the correlations with
the subscales of statistics anxiety, negative affect was found to be significantly related to
all subscales. Results indicate a correlation of r(141) = 0.39, p < 0.01 with exam anxiety,
r(142) = 0.35, p < 0.01 with asking for help anxiety, and r(141) = 0.46, p < 0.01 with
interpretation anxiety. Hypothesis 1a was supported.
Hypothesis 1b stated that trait anxiety was expected to have a positive relationship
with statistics anxiety. As shown in Table 1, there is a positive correlation that is
statistically significant between the two variables; r(137) = 0.55, p < 0.01. When
analyzing the correlations with the subscales of statistics anxiety, trait anxiety was found
to be significantly related to all subscales. There was a correlation of r(137) = 0.46, p <
0.01 with exam anxiety, r(138) = 0.43, p < 0.01 with asking for help anxiety, and r(138)
= 0.46, p < 0.01 with interpretation anxiety. Hypothesis 1b was supported.
Hypothesis 1c stated that disengaged coping strategies were expected to have a
positive relationship with statistics anxiety. As shown in Table 1, there is a positive
correlation that is significant between disengaged coping and statistics anxiety; r(137) =
0.47, p < 0.01. When analyzing the correlations with the subscales of statistics anxiety,
disengaged coping strategies were found to be significantly related to all subscales. There
was a correlation of r(138) = 0.34, p < 0.01 with exam anxiety, r(139) = 0.36, p < 0.01
with asking for help anxiety, and r(138) = 0.47, p < 0.01 with interpretation anxiety.
Hypothesis 1c was supported.
Hypothesis 1d stated that cognitive ability, measured with GPA, would have a
negative relationship with statistics anxiety. As shown in Table 1, there is a negative

TRAINING COPING TO REDUCE STATISTICS ANXIETY 19
correlation that is significant between the two variables; r(137) = -0.20, p < 0.05, such
that lower GPA is associated with higher statistics anxiety. When analyzing the
correlations with the subscales of statistics anxiety, cognitive ability was found to be
significantly related to only the subscale of asking for help anxiety; r(139) = -0.26, p <
0.01. Hypothesis 1d was partially supported.
To determine how much of the variance in statistics anxiety is accounted for by
these individual differences, a multiple regression was conducted. It was found that the
model significantly predicted the outcome of statistics anxiety (F(4,127) = 19.32, p <
.001, 𝑅2 = 0.38). The analysis shows that the traits that significantly predicted were trait
anxiety (Beta = 0.345, t(130) = 3.81, p < .01) and disengaged coping strategies
(Beta=0.190, t(130) = 2.21, p < .05). The individual differences of negative affect (Beta =
0.158, t(130) = 1.64, ns) and GPA (Beta = -0.124, t(130)= -1.75, ns) were not significant
predictors of statistics anxiety.
Table 2
Results of a Multiple Regression of Individual Differences on Statistics Anxiety
Variable t p β F df p 𝑅2
Individual Differences on
Statistics Anxiety
19.32 4, 127 0.00 0.38
Negative Affect 1.64 0.104 0.158
Trait Anxiety 3.81 0.000 0.345
Disengaged Coping Strategies 2.21 0.029 0.190
Cognitive Ability -1.75 0.083 -0.124

TRAINING COPING TO REDUCE STATISTICS ANXIETY 20
Self-Efficacy
The second hypothesis pertained to whether statistics anxiety is negatively related
to students’ self-efficacy. Based on the results from the pretest of the study, statistics
anxiety was not statistically significantly related to self-efficacy; r(143) = -0.14, p > 0.05.
The hypothesis was not supported.
Training Effectiveness
The third hypothesis tested whether a training intervention would be related to a
reduction in statistics anxiety. A paired-samples t-test was conducted to see whether there
was a change in statistics anxiety from pretest to posttest. There was a not a statistically
significant difference in statistics anxiety from the pretest (M = 2.72, SD = 0.73) to the
posttest (M = 2.86, SD = 0.80) conditions; t(75) = -1.76, ns. This hypothesis was not
supported.
The fourth hypothesis sought to examine whether training weakens the
relationship between the individual difference variables described above and statistics
anxiety. The results from Hypothesis 1 indicate the individual difference variables are all
significantly related to statistics anxiety prior to the training intervention. To test if the
training was effective at weakening the influence of the individual differences,
correlations were conducted at the posttest, after the completion of the training.
Negative affect was still related to statistics anxiety; r(75) = 0.32, p < 0.01, and all
of the statistics anxiety subscales, as shown in Table 3. Trait anxiety was still positively
related to statistics anxiety; r(72) = 0.321, p < 0.01. In addition, it was still correlated to
all of the statistics anxiety subscales. Disengaged coping strategies were still positively
related to statistics anxiety; r(76) = 0.472, p < 0.01, and were still correlated to all the
TRAINING COPING TO REDUCE STATISTICS ANXIETY 21
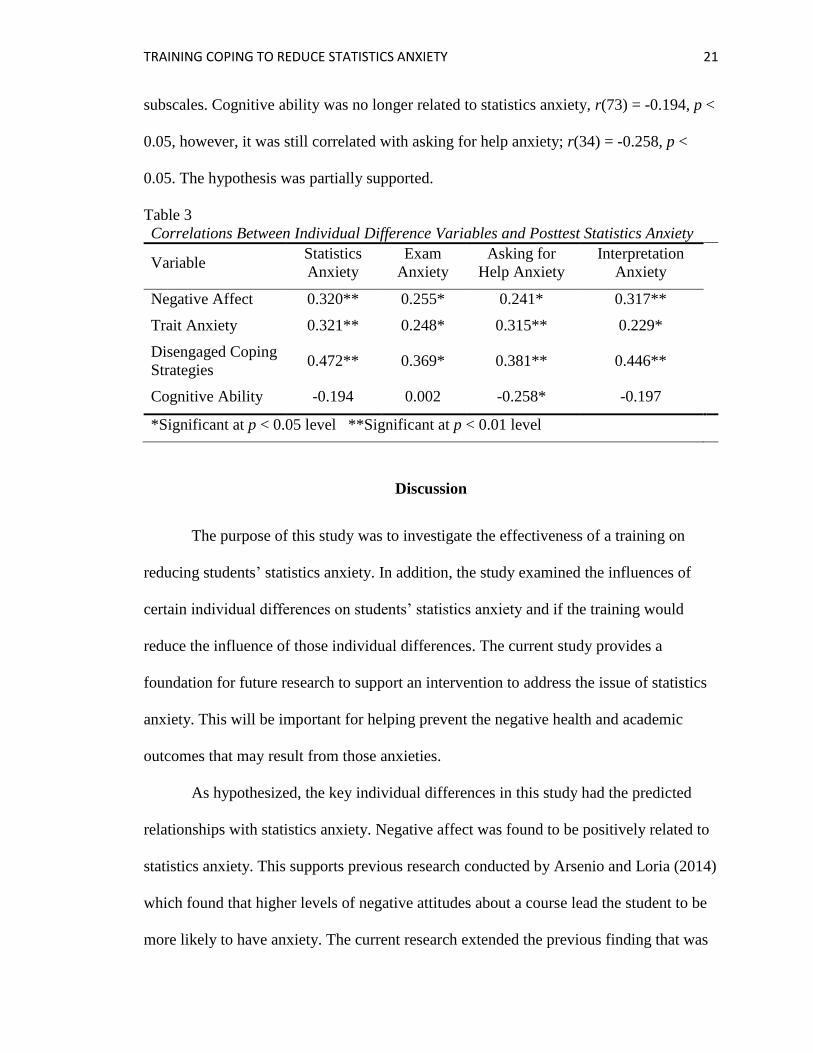
subscales. Cognitive ability was no longer related to statistics anxiety, r(73) = -0.194, p <
0.05, however, it was still correlated with asking for help anxiety; r(34) = -0.258, p <
0.05. The hypothesis was partially supported.
Table 3
Correlations Between Individual Difference Variables and Posttest Statistics Anxiety
Variable Statistics
Anxiety
Exam
Anxiety
Asking for
Help Anxiety
Interpretation
Anxiety
Negative Affect 0.320** 0.255* 0.241* 0.317**
Trait Anxiety 0.321** 0.248* 0.315** 0.229*
Disengaged Coping
Strategies 0.472** 0.369* 0.381** 0.446**
Cognitive Ability -0.194 0.002 -0.258* -0.197
*Significant at p < 0.05 level **Significant at p < 0.01 level
Discussion
The purpose of this study was to investigate the effectiveness of a training on
reducing students’ statistics anxiety. In addition, the study examined the influences of
certain individual differences on students’ statistics anxiety and if the training would
reduce the influence of those individual differences. The current study provides a
foundation for future research to support an intervention to address the issue of statistics
anxiety. This will be important for helping prevent the negative health and academic
outcomes that may result from those anxieties.
As hypothesized, the key individual differences in this study had the predicted
relationships with statistics anxiety. Negative affect was found to be positively related to
statistics anxiety. This supports previous research conducted by Arsenio and Loria (2014)
which found that higher levels of negative attitudes about a course lead the student to be
more likely to have anxiety. The current research extended the previous finding that was

TRAINING COPING TO REDUCE STATISTICS ANXIETY 22
previously found with academic stress and showing that it extends to the specific concept
of statistics anxiety. Because of the lack of research on interventions in this area, future
research on how to effect students’ perceptions of a course would be beneficial to help
guide professors to make necessary changes.
Findings indicated a positive relationship between trait anxiety and statistics
anxiety. Students who have higher trait anxiety are predisposed to have larger stress
responses to general stressors. Therefore, when the students who have an elevated general
stress response are confronted with the stress associated with a statistics course, they are
more likely to have a higher stress response compared to their peers with lower trait
anxiety. The results indicated by the current research supports previous research
conducted by Baloglu (2001) that found that trait anxiety was related to all aspects of
statistics anxiety, excluding interpretation anxiety. The current study found both the
correlation with statistics anxiety in general but also all of the subscales of this form of
anxiety. While trait anxiety and statistics anxiety are separate concepts, it is informative
to understand their correlation. The knowledge of the correlation can be used as a way to
help students identify if they are at risk for developing statistics anxiety and get access to
resources before it even develops.
Previous research by Arsenio and Loria (2011) and Compas et al. (2001) had
found that disengaged coping strategies were associated with academic anxiety. The
current study supported the previous research and extended this relationship to the
specific form of anxiety related to statistics. The study did not, however, find a
relationship between engaged coping strategies and a reduction of statistics anxiety. This
could be due to the students not effectively using the engaged coping strategies without

TRAINING COPING TO REDUCE STATISTICS ANXIETY 23
training. Given the relationship between disengaged coping strategies and statistics
anxiety, it would be beneficial to teach strategies to reduce the frequency with which
students use these strategies to handle their stressors.
Contrary to previous research by Arsenio and Loria (2014), the current study
found that cognitive ability was negatively related to statistics anxiety. Arsenio and Loria
had hypothesized this relationship, but did not find it with their study. Students who have
higher cognitive ability are less likely to develop or have severe levels of statistics
anxiety. The cause of this relationship could be due to having previously developed
engaged coping strategies that also contribute to a higher GPA.
An additional aim of the current research was to connect statistics anxiety to a
performance outcome and to determine whether reducing this anxiety would lead to an
increase in performance. The present study used statistics self-efficacy as a proxy for
performance because previous research has shown it is more effective at predicting
course performance than a mathematical problem quiz (Finney, 2003). The results
showed that there was not a statistically significant relationship between the two
variables. These results do not support previous research that statistics anxiety is related
to performance (Gal & Ginsburg, 1994; Zanakis & Valenzi, 1997). A potential reason for
this lack of relationship could be due to self-efficacy not being the proper proxy for
performance when evaluating the relationship with statistics anxiety.
The main purpose of this study was determine whether a training intervention
would lead to a reduction in statistics anxiety. There was no change in statistics anxiety
from the pretest to the posttest. This could be due to the posttest being conducted during
exam weeks; finals in the fall and midterms in the spring, thus leading student’s exam
TRAINING COPING TO REDUCE STATISTICS ANXIETY 24
anxiety to be higher than it would be on a non-exam week. The study was conducted only
during half of the semester; therefore, a larger change may have been possible if the study
had extended to the entirety of the semester. Future research that uses a longer period for
change and takes posttest measures on a non-exam week should be conducted to
potentially find a statistically significant change in statistics anxiety.
The current study was interested in evaluating the effectiveness of the coping
training used as an intervention of statistics anxiety. The training used was developed
using the BOC training, which has been shown to be effective in academic settings
(Frydenberg & Brandon, 2002). The training was adapted to be used in an online college
setting. The study found that a change in statistics anxiety occurred from time one to time
two. In addition, the correlation between negative affect and cognitive ability was no
longer present after the training. Unfortunately, because of a lack of control group, any
changes from pretest to the posttest cannot be fully attributed to the training.
Professors have multiple options for helping to assist with students’ anxieties in
statistics courses. Previous research has shown that just making students aware that
statistics anxiety is common in students might be a first step to reducing it (Tobias,
1991). Because of the relationship between students’ statistics anxiety and individual
differences, interventions can be put in place to reduce these effects. For example,
professors may benefit from monitoring classroom negative affect in students and
changing teaching strategies to ones who have been shown to improve impressions about
a course. A training similar to the one presented in the current study may be provided to
help reduce the frequency with which students use disengaged coping methods. In
addition, using cognitive ability as a predictor for students who might be at risk of high

TRAINING COPING TO REDUCE STATISTICS ANXIETY 25
levels of statistics anxiety will allow the instructor to identify students who might need
additional help.
A weakness in the design of the study is the absence of a control group. It was not
practical to add a randomly-assigned control group using the methodology we used to
recruit participants and collect data. Due to the presentation of the training materials
integrated into the course LMS, it was not possible to randomly assign the training
intervention to individual students in each course. One consideration was to apply the
control to different classrooms and have different course sections act as the control and
intervention conditions. Therefore, a student would be assigned to one of the conditions
based on the course section they enrolled in. However, any change in statistics anxiety
between the groups may be due to teaching differences, rather than the training
intervention provided. Due to this lack of a control group, it was not possible to test a
moderation effect of the training on the individual differences. Future research should
work to examine similar training interventions conducted with a control group in order to
determine whether anxiety can be reduced with a training intervention.
Another limitation of this study is the small sample size. This was due to multiple
factors, including attrition across the portions of the study and the population of potential
subjects during the time period, consisting of only nine medium-sized classes. Only 80
participants completed all three portions of the study. If a larger sample size was
obtained, it is possible that the effects of the training would be statistically significant.
Despite its limitations, this study is important for setting a foundation for finding
solutions to a prominent problem in the undergraduate psychology coursework. One of its
strengths is that it presents evidence that providing a coping training intervention has the

TRAINING COPING TO REDUCE STATISTICS ANXIETY 26
potential to reduce the effect of the individual differences on statistics anxiety. In
addition, the study found that the correlation between certain individual factors and
academic anxiety, negative affect, and trait anxiety, extend to statistics anxiety.
Future research can expand on this foundation by using larger sample sizes and a
control group for comparison to establish a causal relationship In addition, future
research can further validate the coping training intervention and also find additional
methods of reducing statistics anxiety. All of this information will provide instructors
with tools to help students cope with statistics anxiety.

TRAINING COPING TO REDUCE STATISTICS ANXIETY 27
References
Arsenio, W. F., & Loria, S. (2014). Coping with negative emotions: Connections with
adolescents’ academic performance and stress. The Journal of Genetic
Psychology: Research and Theory on Human Development, 175(1), 76-90.
Baloglu, M. (2001). An application of structural equation modeling techniques in the
prediction of statistics anxiety among college students (Order No. AAI3007268).
Bandura, A. (1977). Self-efficacy: Toward a unifying theory of behavioral change.
Psychological Review. 84, 191-215.
Bandura, A. (1986). Social Foundations of Thought & Action: A Social Cognitive Theory.
Engelwood Cliffs: Prentice-Hall, Inc.
Bandura, A. (1997). Self-Efficacy: The Exercise of Control. New York: W. H. Freeman
and Company.
Bartz, A. E. (1981). The statistics course as a departmental offering and major
requirement. Teaching of Psychology, 8, 106.
Beck, A. T. (1979). Cognitive therapy and the emotional disorders. Penguin.
Beins, B. (1985). Teaching the relevance of statistics through consumer-oriented
research. Teaching of Statistics, 12, 168-169.
Benson, J. (1989). Structural components of statistical test anxiety in adults: An
exploratory model. Journal of Experimental Education, 57(3), 247-261.
Berk, R. A., & Nanda, J. P. (1998). Effects of jocular instructional methods on attitudes,
anxiety, and achievement in statistics courses. International Journal of Humor
Research, 11(4), 383-409.
TRAINING COPING TO REDUCE STATISTICS ANXIETY 28
Blalock, H. M. (1987). Some general goals in teaching statistics. Teaching Sociology, 15,
164-172.
Carver, C. S., Scheier, M. F., & Weintraub, J. K. (1989). Assessing coping strategies: A
theoretically based approach. Journal of Personality and Social Psychology, 56,
267-283.
Carver, C. S. (1997). You want to measure coping but your protocol’s too long: Consider
the Brief COPE. International Journal of Behavioral Medicine, 4, 92-100.
Compas, B. E., Connor- Smith, J, Saltzman, H., Thomsen, A. H., & Wadsworth, M. E.
(2001). Coping with stress during childhood and adolescence: Problems, progress,
and potential. Psychological Bulletin, 127, 87-127.
Chiesi, F., Primi, C., & Carmona, J. (2011). Measuring statistics anxiety: Cross-country
validity of the statistical anxiety scale (SAS). Journal of Psychoeducational
Assessment, 29(6), 559-569.
Cruise, R. J., Cash, R. W., & Bolton, D. L. (1985). Development and validation of an
instrument to measure statistical anxiety. Proceedings of the American Statistical
Association.
Cruise, R.J., & Wilkens, E.M. (1980). STARS: Statistical Anxiety Rating Scale.
Unpublished manuscript, Andrew University, Berrien Springs, MI.
Cunningham, E. G., & Walker, G. A. (1999). Screening for at-risk youth: Predicting
adolescent depression from coping styles. Australian Journal of Guidance &
Counseling, 9(l), 37-47.
Ebata, A.T., & Moos, R.H. (1991). Coping and adjustment in distressed and healthy
adolescents. Journal of Applied Developmental Psychology, 12, 33-54.

TRAINING COPING TO REDUCE STATISTICS ANXIETY 29
Elias, M. J. (1991). A multilevel action-research perspective on stress-related
interventions. In M. E. Colten, & S. Gore (Eds.), Adolescent stress: Causes and
consequences (pp. 261–279). New York: Walter de Gruyter.
Epstein, S. (1972). The nature of anxiety with emphasis upon its relationships to
expectancies. In C. D. Spielberger (Ed.), Anxiety: Current trends in theory and
research: Vol. 2. (pp. 291-337). New York: Academic.
Finney, S. J., & Schraw, G. (2003). Self-efficacy beliefs in college statistics courses.
Contemporary Educational Psychology, 28(2), 161-186.
Fitzgerald, S. M. (1997). The relationship between anxiety and statistics achievement: a
meta-analysis. Unpublished doctoral dissertation, University of Toledo.
Frydenberg, E., & Brandon, C. M. (2002). The best of coping. Melbourne: Oz Child.
Frydenberg, E., & Lewis, R. (1999). Things don't get better just because you're older: A
case for facilitating reflection. British Journal of Educational Psychology, 69(1),
81-94.
Gal, I., & Ginsburg, L. (1994). The role of beliefs and attitudes in learning statistics:
Towards an assessment framework. Journal of Statistics Education, 2(2), 1-
54,[Online].
Gumora, G., & Arsenio, W. F. (2002). Emotionality, emotion regulation, and school
performance in middle school children. Journal of School Psychology, 40(5), 395-
413.
Lazarus, R.S., & Folkman, S. (1984). Stress, appraisal, and coping. New York: Springer.

TRAINING COPING TO REDUCE STATISTICS ANXIETY 30
Lazarus, R. S., & Launier, R. (1978). Stress-related transactions between person and
environment. In Perspectives in interactional psychology (pp. 287-327). Springer
US.
Pintrich, P. R., & Schunk, D. H. (1995). Motivation in education. NJ: Prentice Hall.
Reiss, D., & Price, R. H. (1996). National research agenda for prevention research: The
National Institute of Mental Health report. American Psychologist, 51, 1109–1115.
Rosenman, S. J. (1998). Preventing suicide: what will work and what will not. Medical
Journal of Australia, 169, 100–102.
Spielberger, C. D., Gorsuch, R. L., Lushene, R., Vagg, P. R., & Jacobs, G. A. (1983).
Manual for the State-Trait Anxiety Inventory. Palo Alto, CA: Consulting
Psychologists Press.
Tobias, S. (1979). Anxiety research in educational psychology. Journal of Educational
Psychology, 71, 573-582.
Tobias, S. (1991). What’s wrong with the process? Change, 24(3), 13-19.
Vigil-Colet, A., Lorenzo-Seva, U., & Condon, L. (2008). Development and validation of
the statistical anxiety scale. Psicothema, 20(1), 174-180.
Watson, D., Clark, L. A., & Tellegen, A. (1988). Development and validation of brief
measures of positive and negative affect: The PANAS scales. Journal of
Personality and Social Psychology, 54(6), 1063-1070.
Widmer, C. C., & Chavez, A. (1986). Helping students overcome statistics anxiety.
Educational Horizons, 64(2), 69-72.
Zanakis, S. H., & Valenzi, E. R. (1997). Student anxiety and attitudes in business
statistics. Journal of Education for Business, 73(1), 10-16.

TRAINING COPING TO REDUCE STATISTICS ANXIETY 31
Zeidner, M. (1991). Statistics and mathematics anxiety in social science students: some
interesting parallels. British Journal of Educational Psychology, 61, 319-328.

TRAINING COPING TO REDUCE STATISTICS ANXIETY 32
Appendix A -Demographics
Will only be used to assign extra credit and match scores: Student ID _______________
Section ID _________________
Age ______________
Year in College
Freshman
Sophomore
Junior
Senior
GPA __________________
Ethnicity
White
Hispanic or Latino
Black or African American
Native American or American Indian
Asian/Pacific Islander
Other
Number of college math classes taken previously ____________
How would you rate your comfort with stats
Poor
Fair
Good
Very Good
Excellent

TRAINING COPING TO REDUCE STATISTICS ANXIETY 33
Appendix B - PANAS
This scale consists of a number of words that describe different feelings and emotions.
Read each item and then mark the appropriate answer in the space next to that word.
Indicate to what extent you feel in general, that is, on the average. Use the following scale
to record your answers.
Very
slightly or
not at all
A little Moderately Quite a bit Extremely
Distressed 1 2 3 4 5
Afraid 1 2 3 4 5
Irritable 1 2 3 4 5
Ashamed 1 2 3 4 5
Nervous 1 2 3 4 5
Upset 1 2 3 4 5
Strong 1 2 3 4 5
Guilty 1 2 3 4 5
Scared 1 2 3 4 5
Hostile 1 2 3 4 5

TRAINING COPING TO REDUCE STATISTICS ANXIETY 34
Appendix C - SAS
Please rate the following activities in terms of how anxious they make you feel.
No
Anxiety
Considerable
anxiety
Studying for an exam in a statistics
course 1 2 3 4 5
Interpreting the meaning of a table in a
journal article 1 2 3 4 5
Going to ask my statistics teacher for
individual help with material I am having
difficulty understanding
1 2 3 4 5
Realizing the day before an exam that I
cannot do some problems that I thought
were going to be easy.
1 2 3 4 5
Asking a tutor to explain a topic that I
have not understood at all. 1 2 3 4 5
Reading a journal article that includes
some statistical analyses 1 2 3 4 5
Asking a teacher how to use a probability
table 1 2 3 4 5
Trying to understand a mathematical
demonstration 1 2 3 4 5
Doing the final exam for a statistics
course 1 2 3 4 5
Reading an advertisement for an
automobile which includes figures on gas
mileages, compliances with populations
regulations, etc.
1 2 3 4 5
Walking into the classroom to take a
statistics test 1 2 3 4 5
Asking the teacher about how to do an
exercise 1 2 3 4 5
Getting to the day before an exam
without having time to study 1 2 3 4 5
Waking up in the morning the day of a
statistics test 1 2 3 4 5
Realizing, just before you go into the
exam, that you have not prepared for a
particular exercise.
1 2 3 4 5
Copying a mathematical problem from
the board while the teacher is explaining
it.
1 2 3 4 5

TRAINING COPING TO REDUCE STATISTICS ANXIETY 35
Asking your teacher for help in
understanding an assignment. 1 2 3 4 5
Trying to understand the odds in a
lottery. 1 2 3 4 5
Seeing a classmate carefully studying the
results table of a problem he has solved. 1 2 3 4 5
Going to a statistics exam without having
had enough time to study. 1 2 3 4 5
Asking a teacher for help when trying to
interpret a results table 1 2 3 4 5
Trying to understand the statistical
analyses described in the abstract of a
journal article.
1 2 3 4 5
Going to office hours to ask questions 1 2 3 4 5
Asking a tutor to tell me how to do an
exercise. 1 2 3 4 5

TRAINING COPING TO REDUCE STATISTICS ANXIETY 36
Appendix D - Brief COPE
Each item says something about a particular way of coping. I want to know to what
extent you've been doing what the item says. How much or how frequently. Don't
answer on the basis of whether it seems to be working or not—just whether or not you're
doing it. Use these response choices. Try to rate each item separately in your mind from
the others. Make your answers as true FOR YOU as you can.
I haven’t
been
doing this
at all
I’ve been
doing
this a
little bit
I’ve been
doing this
a medium
amount
I’ve
been
doing
this a lot
I've been turning to work or other activities to
take my mind off things. 1 2 3 4
I've been concentrating my efforts on doing
something about the situation I'm in. 1 2 3 4
I've been saying to myself "this isn't real". 1 2 3 4
I've been getting emotional support from
others. 1 2 3 4
I've been giving up trying to deal with it. 1 2 3 4
I've been taking action to try to make the
situation better. 1 2 3 4
I've been refusing to believe that it has
happened 1 2 3 4
I've been saying things to let my unpleasant
feelings escape. 1 2 3 4
I’ve been getting help and advice from other
people. 1 2 3 4
I've been trying to see it in a different light, to
make it seem more positive. 1 2 3 4
I’ve been criticizing myself. 1 2 3 4
I've been trying to come up with a strategy
about what to do. 1 2 3 4
I've been getting comfort and understanding
from someone. 1 2 3 4

TRAINING COPING TO REDUCE STATISTICS ANXIETY 37
I've been giving up the attempt to cope. 1 2 3 4
I've been looking for something good in what
is happening. 1 2 3 4
I've been making jokes about it. 1 2 3 4
I've been doing something to think about it
less, such as going to movies, watching TV,
reading, daydreaming, sleeping, or shopping.
1 2 3 4
I've been accepting the reality of the fact that it
has happened. 1 2 3 4
I've been expressing my negative feelings. 1 2 3 4
I've been learning to live with it. 1 2 3 4
I've been thinking hard about what steps to
take. 1 2 3 4
I’ve been blaming myself for things that
happened. 1 2 3 4
I've been making fun of the situation. 1 2 3 4

TRAINING COPING TO REDUCE STATISTICS ANXIETY 38
Appendix E - STAI
A number of statements which people have used to describe themselves are given below.
Read each statement and then circle the appropriate number to the right of the statement
to indicate how you generally feel. There are no right and wrong answers. DO not spend
too much time on any one statements but give the answer that seems to describe how you
generally feel.
Almost
Never
Sometimes Often Almost
Always
I feel pleasant 1 2 3 4
I feel nervous and restless 1 2 3 4
I feel satisfied with myself 1 2 3 4
I wish I could be as happy as others seem to be 1 2 3 4
I feel like a failure 1 2 3 4
I feel rested 1 2 3 4
I am “calm, cool and collected” 1 2 3 4
I feel that difficulties are piling up so that I cannot
overcome them 1 2 3 4
I worry too much over something that really doesn’t
matter 1 2 3 4
I am happy 1 2 3 4
I have disturbing thoughts 1 2 3 4
I lack self-confidence 1 2 3 4
I feel secure 1 2 3 4
I make decisions easily 1 2 3 4
I feel inadequate 1 2 3 4
I am content 1 2 3 4
Some unimportant thought runs through my mind
and bothers me 1 2 3 4

TRAINING COPING TO REDUCE STATISTICS ANXIETY 39
I take disappoints so keenly that I can’t put them out
of my mind 1 2 3 4
I am a steady person 1 2 3 4
I get in a state of tension or turmoil as I think over
my recent concerns and interests 1 2 3 4

TRAINING COPING TO REDUCE STATISTICS ANXIETY 40
Appendix F - CSSE
Please rate your confidence in your current ability to successfully complete the following
tasks. The item scale has 6 possible responses: (1) = no confidence at all, (2) = a little
confidence, (3) = a fair amount of confidence, (4) = much confidence, (5) = very much
confidence, (6) = complete confidence. For each task, please mark the one response that
represents your confidence in your current ability to successfully complete each task.
No
confidence
at all
A little
confidence
A fair
amount of
confidence
Much
confidence
Very
much
confidence
Complete
confidence
Identify the scale
of measurement
for a variable.
1 2 3 4 5 6
Interpret the
probability value
(p-value) from a
statistical
procedure.
1 2 3 4 5 6
Identify if a
distribution is
skewed when
given the values
of three measures
of central
tendency.
1 2 3 4 5 6
Select the correct
statistical
procedure to be
used to answer a
research
question.
1 2 3 4 5 6
Interpret the
results of a
statistical
procedure in
terms of the
research
question.
1 2 3 4 5 6
Identify the
factors that
influence power.
1 2 3 4 5 6
Explain what the
value of the
standard
deviation means
in terms of the
1 2 3 4 5 6

TRAINING COPING TO REDUCE STATISTICS ANXIETY 41
variable being
measured.
Distinguish
between a Type I
error and a Type
II error in
hypothesis testing
1 2 3 4 5 6
Explain what the
numeric value of
the standard error
is measuring.
1 2 3 4 5 6
Distinguish
between the
objectives of
descriptive versus
inferential
statistical
procedures.
1 2 3 4 5 6
Distinguish
between the
information given
by the three
measures of
central tendency.
1 2 3 4 5 6
Distinguish
between a
population
parameter and a
sample statistic.
1 2 3 4 5 6
Identify when the
mean, median
and mode should
be used as a
measure of
central tendency.
1 2 3 4 5 6
Explain the
difference
between a
sampling
distribution and a
population
distribution.
1 2 3 4 5 6
Related Documents