TRAI Audit Wireless Report for Assam Circle EAST ZONE Prepared by: ` Submitted to: QE March- 2016

Welcome message from author
This document is posted to help you gain knowledge. Please leave a comment to let me know what you think about it! Share it to your friends and learn new things together.
Transcript
TRAI Audit Wireless
Report for Assam
Circle
EAST ZONE
Prepared by:
`
Submitted to:
QE March- 2016
TRAI Audit Wireless Report-Assam Circle JFM Quarter-2016
1
1 TABLE OF CONTENTS
2 Introduction .................................................................................................................................................. 7
2.1 About TRAI .......................................................................................................................................... 7
2.2 Objectives ............................................................................................................................................ 7
2.3 Coverage ............................................................................................................................................... 8
2.4 Framework used .................................................................................................................................. 8
2.4.1 PMR Reports ................................................................................................................................... 9
2.4.2 Live Calling .................................................................................................................................... 22
2.4.3 Voice Drive Test – 2G & 3G .......................................................................................................... 25
2.4.4 Wireless Data Drive Test – 2G & 3G ........................................................................................... 28
2.5 Operators Covered 2G and 3G ......................................................................................................... 32
2.6 Colour Codes to read the report ...................................................................................................... 32
3 Executive Summary-2G .............................................................................................................................. 33
3.1 PMR Data – 3 Months- Consolidated for 2G .................................................................................. 33
3.1.1 PMR Data - January for 2G .......................................................................................................... 35
3.1.2 PMR Data – February for 2G ........................................................................................................ 35
3.1.3 PMR Data - March for 2G ............................................................................................................ 36
3.2 3 Day Data – Consolidated for 2G ................................................................................................... 37
3.2.1 3 Day Data - January for 2G ......................................................................................................... 39
3.2.2 3 Day Data – February for 2G ...................................................................................................... 39
3.2.3 3 Day Data - March for 2G ........................................................................................................... 40
3.3 PMR Data – 3 Months- Consolidated for 3G ................................................................................... 41
3.3.1 PMR Data - January for 3G ........................................................................................................... 43
3.3.2 PMR Data – February for 3G ........................................................................................................ 43
3.3.3 PMR Data - March for 3G............................................................................................................. 43
3.4 3 Day Data – Consolidated for 3G.................................................................................................... 44
3.4.1 3 Day Data - January for 3G ......................................................................................................... 45
3.4.2 3 Day Data – February for 3G....................................................................................................... 45
3.4.3 3 Day Data - March for 3G ........................................................................................................... 45
3.5 Wireless data PMR & 3 Day Live – Consolidated for 2G ............................................................... 46
TRAI Audit Wireless Report-Assam Circle JFM Quarter-2016
2
3.6 Wireless data PMR & 3 Day Live – Consolidated for 3G ............................................................... 47
3.7 Live Calling Data - Consolidated ..................................................................................................... 48
3.8 Billing and customer care - Consolidated ...................................................................................... 49
3.9 Inter Operator Call Assessment - Consolidated ............................................................................ 50
3.10 PMR Comparison with IMRB and Operators data 2G.................................................................... 51
3.11 PMR Comparison with IMRB and Operators data 3G .................................................................... 51
4 Critical Findings.......................................................................................................................................... 52
5 Parameter Description & Detailed Findings - Comparison Between PMR Data, 3 Day Live Data and Live Calling Data for 2G ..................................................................................................................................... 54
5.1 BTS Accumulated Downtime ........................................................................................................... 54
5.1.1 Parameter Description ................................................................................................................. 54
5.1.2 Key Findings - Consolidated ........................................................................................................ 55
5.2 Worst Affected BTS due to downtime ............................................................................................ 59
5.2.1 Parameter Description ................................................................................................................. 59
5.2.2 Key Findings – Consolidated ....................................................................................................... 60
5.3 Call Set Up Success Rate................................................................................................................... 64
5.3.1 Parameter Description ................................................................................................................. 64
5.3.2 Key Findings - Consolidated ........................................................................................................ 65
5.4 Network Channel Congestion- Paging Channel /TCH Congestion/POI .................................... 68
5.4.1 Parameter Description ................................................................................................................. 68
5.4.2 Key Findings - SDCCH/Paging Channel Congestion (Consolidated) ..................................... 69
5.4.3 Key Findings – TCH Congestion (Consolidated)....................................................................... 72
5.4.4 Key Findings – POI Congestion (Consolidated) – Average of 3 months ................................. 74
5.5 Call Drop Rate ................................................................................................................................... 78
5.5.1 Parameter Description ................................................................................................................. 78
5.5.2 Key Findings - Consolidated ........................................................................................................ 79
5.6 Cells having greater than 3% TCH drop .......................................................................................... 81
5.6.1 Parameter Description .................................................................................................................. 81
5.6.2 Key Findings - Consolidated ........................................................................................................ 82
5.7 Voice Quality ..................................................................................................................................... 84
5.7.1 Parameter Description ................................................................................................................. 84
TRAI Audit Wireless Report-Assam Circle JFM Quarter-2016
3
5.7.2 Key Findings .................................................................................................................................. 85
6 Parameter Description & Detailed Findings - Comparison Between PMR Data, 3 Day Live Data and Live Calling Data for 3G ..................................................................................................................................... 87
6.1 Node Bs downtime ............................................................................................................................ 87
6.1.1 Parameter Description ................................................................................................................. 87
6.1.2 Key Findings - Consolidated ........................................................................................................ 88
6.2 Worst affected Node Bs due to downtime ...................................................................................... 91
6.2.1 Parameter Description .................................................................................................................. 91
6.2.2 Key Findings – Consolidated ....................................................................................................... 92
6.3 Call Set Up Success Rate................................................................................................................... 95
6.3.1 Parameter Description ................................................................................................................. 95
6.3.2 Key Findings - Consolidated ........................................................................................................ 96
6.4 Network Channel Congestion- RRC Congestion/ Circuit Switched RAB Congestion ............... 99
6.4.1 Parameter Description ................................................................................................................. 99
6.4.2 Key Findings - RRC Congestion (Consolidated) ....................................................................... 101
6.4.3 Key Findings – Circuit Switched RAB Congestion (Consolidated) ........................................ 103
6.4.4 Key Findings – POI Congestion (Consolidated) – Average of 3 months ................................ 105
6.5 Circuit Switched Voice Drop Rate ................................................................................................. 109
6.5.1 Parameter Description ............................................................................................................... 109
6.5.2 Key Findings - Consolidated ....................................................................................................... 110
6.6 Worst affected cells having more than 3% Circuit Switched Voice Drop Rate .......................... 112
6.6.1 Parameter Description ................................................................................................................. 112
6.6.2 Key Findings - Consolidated ........................................................................................................ 113
6.7 Circuit Switch Voice Quality ........................................................................................................... 115
6.7.1 Parameter Description ................................................................................................................. 115
6.7.2 Key Findings ................................................................................................................................. 116
7 Parameter Description & Detailed Findings - Wireless Data Services (2G & 3G) ............................... 118
7.1 Service Activation /Provisioning for 2G & 3G ............................................................................... 118
7.1.1 Parameter Description ................................................................................................................ 118
7.1.2 Key Findings ................................................................................................................................. 119
7.2 PDP Context Activation Success Rate for 2G & 3G ....................................................................... 120
TRAI Audit Wireless Report-Assam Circle JFM Quarter-2016
4
7.2.1 Parameter Description ................................................................................................................ 120
7.2.2 Key Findings .................................................................................................................................. 121
7.3 Drop rate for 2G & 3G ...................................................................................................................... 122
7.3.1 Parameter Description ................................................................................................................ 122
7.3.2 Key Findings ................................................................................................................................. 123
8 Parameter Description and Detailed Findings – Non-Network Parameters ....................................... 124
8.1 Metering and billing credibility ...................................................................................................... 124
8.1.1 Parameter Description ................................................................................................................ 124
8.1.2 Key Findings – Metering and billing credibility (Postpaid) .................................................... 126
8.1.3 Key Findings - Metering and billing credibility (Prepaid) ...................................................... 127
8.2 Resolution of Billing/ Charging Complaints ................................................................................. 128
8.2.1 Parameter Description ................................................................................................................ 128
8.2.2 Key Findings - within 4 weeks .................................................................................................... 130
8.2.3 Key Findings within 6 weeks ...................................................................................................... 130
8.3 Period of Applying Credit/Wavier .................................................................................................. 131
8.3.1 Parameter Description ................................................................................................................. 131
8.3.2 Key Findings ................................................................................................................................. 132
8.4 Call Centre Performance-IVR ......................................................................................................... 133
8.4.1 Parameter Description ................................................................................................................ 133
8.4.2 Key Findings ................................................................................................................................. 134
8.5 Call Centre Performance-Voice to Voice ....................................................................................... 135
8.5.1 Parameter Description ................................................................................................................ 135
8.5.2 Key Findings ................................................................................................................................. 136
8.6 Termination/Closure of Service ...................................................................................................... 138
8.6.1 Parameter Description ................................................................................................................ 138
8.6.2 Key Findings ................................................................................................................................. 139
8.7 Refund of Deposits After closure ....................................................................................................140
8.7.1 Parameter Description ................................................................................................................140
8.7.2 Key Findings ................................................................................................................................. 141
9 Detailed Findings - Drive Test Data ........................................................................................................ 142
TRAI Audit Wireless Report-Assam Circle JFM Quarter-2016
5
9.1 Operator Assisted Drive Test - voice ............................................................................................. 142
9.1.1 TEZPUR SSA ................................................................................................................................. 143
9.1.2 DIBRUGARH SSA ........................................................................................................................ 150
9.1.3 BONGAIGAON SSA .................................................................................................................... 157
10 Annexure – Consolidated-2G ...................................................................................................................164
10.1 Network Availability ........................................................................................................................164
10.2 Connection Establishment (Accessibility) .................................................................................... 165
10.3 Connection Maintenance (Retainability) ..................................................................................... 166
10.4 Voice quality ..................................................................................................................................... 167
10.5 POI Congestion ............................................................................................................................... 168
10.6 Additional Network Related parameters ...................................................................................... 169
11 Annexure – Consolidated-3G ................................................................................................................... 170
11.1 Network Availability ........................................................................................................................ 170
11.2 Connection Establishment (Accessibility) ..................................................................................... 171
11.3 Connection Maintenance (Retainability) ...................................................................................... 172
11.4 Voice quality ..................................................................................................................................... 173
11.5 POI Congestion ................................................................................................................................ 174
11.6 Additional Network Related parameters ....................................................................................... 175
12 Annexure – Customer Services ................................................................................................................. 176
12.1 Metering and billing credibility ...................................................................................................... 176
12.2 Customer Care ................................................................................................................................. 180
12.3 Termination / closure of service ..................................................................................................... 182
12.4 Time taken for refund of deposits after closure ............................................................................ 182
12.5 Live Calling Results for Resolution of Service Requests .............................................................. 183
12.6 Live Calling Results for Level 1 Services ......................................................................................... 183
12.7 Level 1 Service calls made ................................................................................................................184
13 Counter Details ......................................................................................................................................... 196
13.1.1 Ericsson ................................................................................................................................... 198
13.1.2 NSN (Nokia Siemens Networks) ........................................................................................... 200
13.2 Block Schematic Diagrams .............................................................................................................. 201
TRAI Audit Wireless Report-Assam Circle JFM Quarter-2016
6
13.2.1 Ericsson .................................................................................................................................... 201
13.2.2 NSN (Nokia Siemens Networks) ........................................................................................... 202
14 Annexure – January -2G ........................................................................................................................... 203
15 Annexure – February-2G .......................................................................................................................... 208
16 Annexure – March-2G ............................................................................................................................... 213
17 Annexure – January -3G ............................................................................................................................ 218
18 Annexure – February-3G .......................................................................................................................... 223
19 Annexure – March-3G .............................................................................................................................. 228
20 Abbreviations ............................................................................................................................................ 233
TRAI Audit Wireless Report-Assam Circle JFM Quarter-2016
7
2 INTRODUCTION
2.1 ABOUT TRAI
TRAI's mission is to create and nurture conditions for growth of telecommunications in the country in a
manner and at a pace that will enable India to play a leading role in the emerging global information
society. One of the main objectives of TRAI is to provide a fair and transparent policy environment
which promotes a level playing field and facilitates fair competition.
In pursuance of above objective, TRAI has been issuing regulations, order and directives to deal with
the issues or complaints raised by the operators as well as the consumers. These regulations, order and
directives have helped to nurture the growth of multi operator multi service - an open competitive
market from a government owned monopoly. Also, the directions, orders and regulations issued cover a
wide range of subjects including tariff, interconnection and quality of service as well as governance of
the Authority.
TRAI initiated a regulation - The Standard of Quality of Service of Basic Telephone Service (Wireline)
and Cellular Mobile Telephone Service regulations, 2009 (7 of 2009) dated December 20, 2009 and
Quality of Service of Broadband Service Regulations, 2006 (11 of 2006) dated October 6, 2006 that
provide the benchmarks for the parameters on customer perception of service to be achieved by service
provider.
In order to assess the above regulations, TRAI has commissioned a third party agency to conduct the
audit of the service providers and check the performance of the operators on the various benchmarks
set by Telecom Regulatory Authority of India (TRAI).
2.2 OBJECTIVES
The primary objective of the Audit module is to-
Audit and Assess the Quality of Services being rendered by Basic (Wireline), Cellular Mobile
(Wireless), and Broadband service against the parameters notified by TRAI. (The parameters of
Quality of Services (QoS) have been specified by in the respective regulations published by
TRAI).
This report covers the audit results of the audit conducted for Cellular Mobile (Wireless)
services in Assam circle.
TRAI Audit Wireless Report-Assam Circle JFM Quarter-2016
8
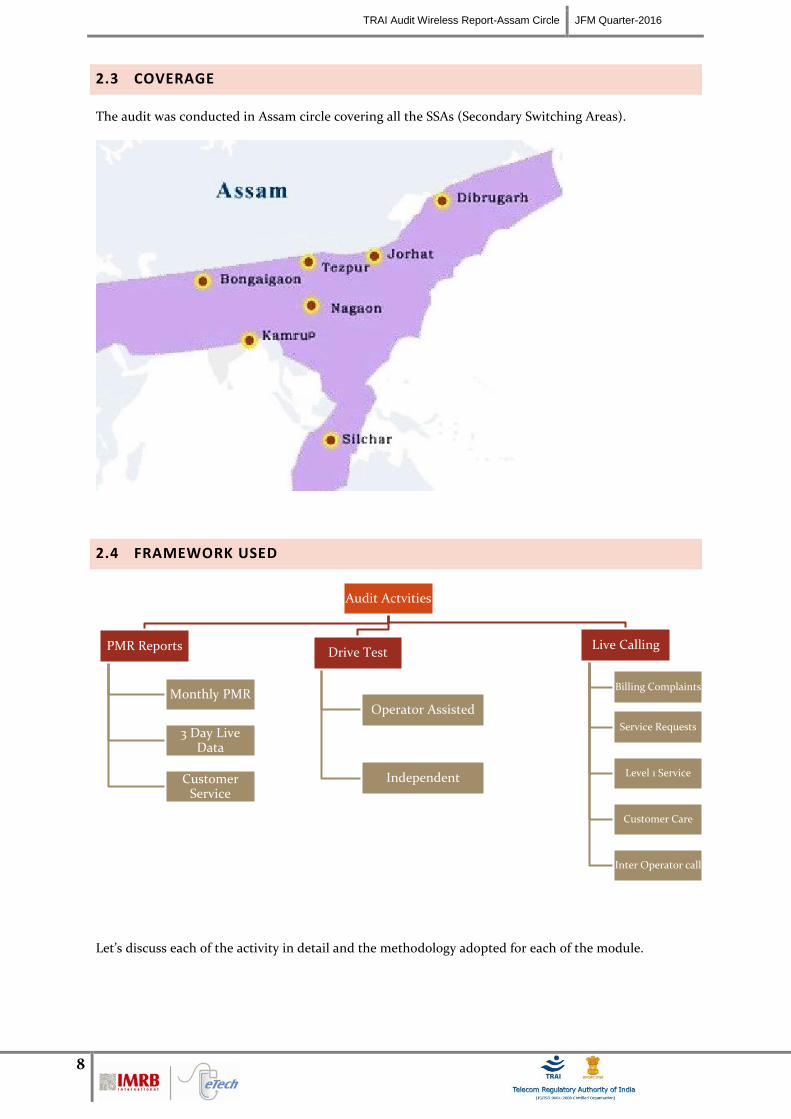
2.3 COVERAGE
The audit was conducted in Assam circle covering all the SSAs (Secondary Switching Areas).
2.4 FRAMEWORK USED
Let’s discuss each of the activity in detail and the methodology adopted for each of the module.
Audit Actvities
PMR Reports
Monthly PMR
3 Day Live Data
Customer Service
Drive Test
Operator Assisted
Independent
Live Calling
Billing Complaints
Service Requests
Level 1 Service
Customer Care
Inter Operator call
TRAI Audit Wireless Report-Assam Circle JFM Quarter-2016
9
2.4.1 PMR REPORTS
2.4.1.1 SIGNIFICANCE AND METHODOLOGY
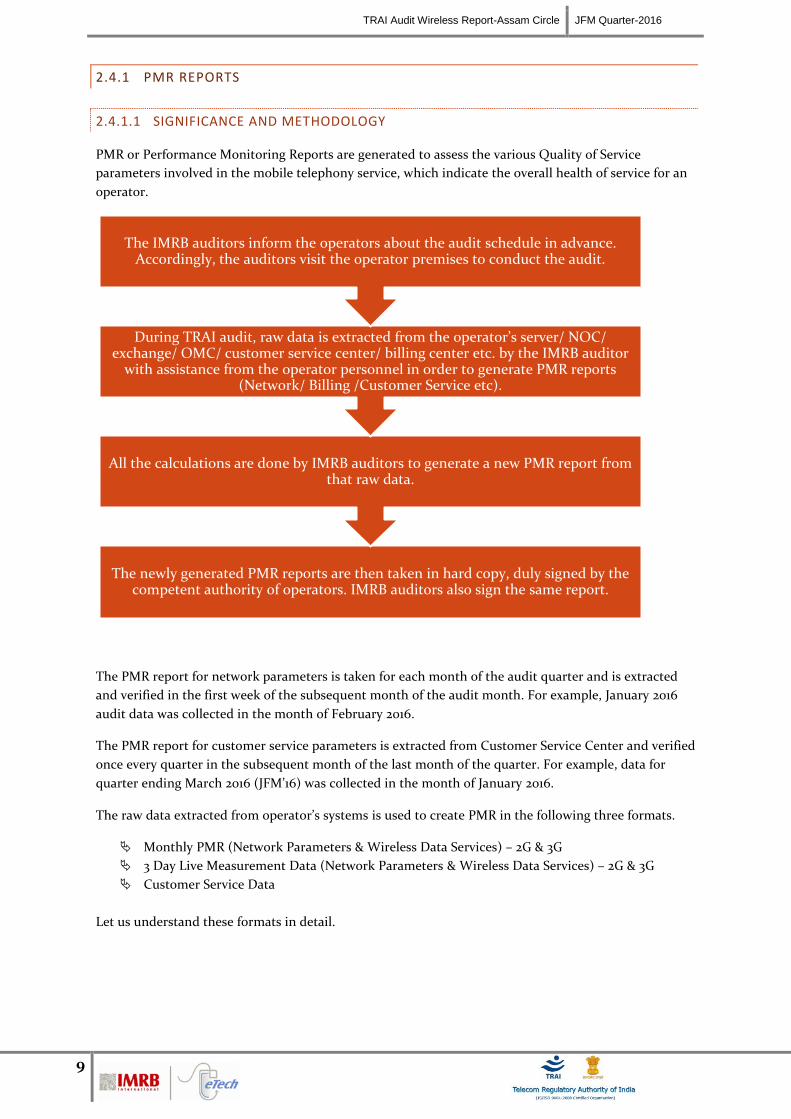
PMR or Performance Monitoring Reports are generated to assess the various Quality of Service
parameters involved in the mobile telephony service, which indicate the overall health of service for an
operator.
The PMR report for network parameters is taken for each month of the audit quarter and is extracted
and verified in the first week of the subsequent month of the audit month. For example, January 2016
audit data was collected in the month of February 2016.
The PMR report for customer service parameters is extracted from Customer Service Center and verified
once every quarter in the subsequent month of the last month of the quarter. For example, data for
quarter ending March 2016 (JFM’16) was collected in the month of January 2016.
The raw data extracted from operator’s systems is used to create PMR in the following three formats.
Monthly PMR (Network Parameters & Wireless Data Services) – 2G & 3G
3 Day Live Measurement Data (Network Parameters & Wireless Data Services) – 2G & 3G
Customer Service Data
Let us understand these formats in detail.
The newly generated PMR reports are then taken in hard copy, duly signed by the competent authority of operators. IMRB auditors also sign the same report.
All the calculations are done by IMRB auditors to generate a new PMR report from that raw data.
During TRAI audit, raw data is extracted from the operator’s server/ NOC/ exchange/ OMC/ customer service center/ billing center etc. by the IMRB auditor
with assistance from the operator personnel in order to generate PMR reports (Network/ Billing /Customer Service etc).
The IMRB auditors inform the operators about the audit schedule in advance. Accordingly, the auditors visit the operator premises to conduct the audit.

TRAI Audit Wireless Report-Assam Circle JFM Quarter-2016
10
2.4.1.2 MONTHLY PMR 2G
This involved calculation of the various 2G Quality of Service network parameters through monthly
Performance Monitoring Reports (PMR). The PMR reports were generated from the data extracted from
operator’s systems by the IMRB representative with the assistance of the operator at the operator’s
premises for the month of January, February and March 2016. The performance of operators on various
parameters was assessed against the benchmarks. Parameters include-
All the parameters have been described in detail along with key findings of the parameters in section 5
of the report. The benchmark values for each parameter have been given in the table below.
• BTS accumulated downtime
• Worst affected BTS due to downtime
Network Availability
• Call Set Up success Rate (CSSR)
Connection Establishment (Accessibility)
• SDCCH/Paging Channel Congestion
• TCH Congestion
• Point of Interconnection
Network Congestion Parameters
• Call Drop rate
• Worst affected cells having more than 3% TCH drop
Connection Maintenance
• % Connections with good voice quality
Voice Quality
TRAI Audit Wireless Report-Assam Circle JFM Quarter-2016
11
2.4.1.3 AUDIT PARAMETERS – NETWORK 2G
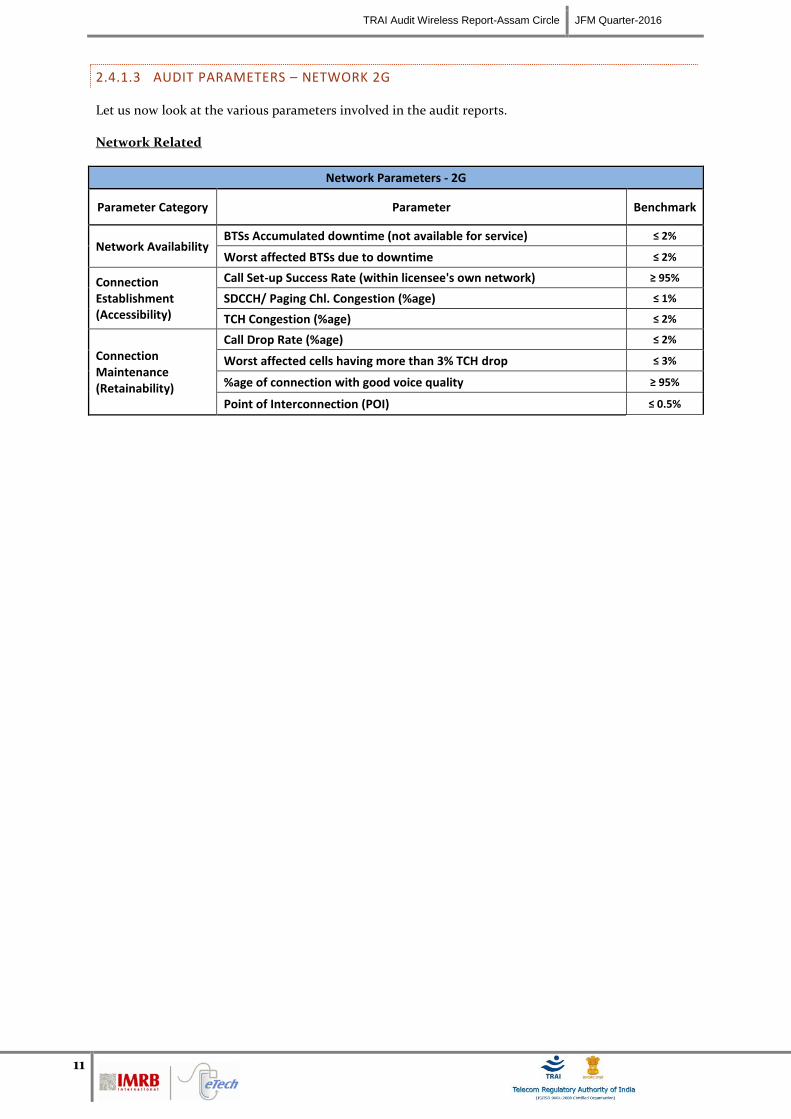
Let us now look at the various parameters involved in the audit reports.
Network Related
Network Parameters - 2G
Parameter Category Parameter Benchmark
Network Availability BTSs Accumulated downtime (not available for service) ≤ 2%
Worst affected BTSs due to downtime ≤ 2%
Connection Establishment (Accessibility)
Call Set-up Success Rate (within licensee's own network) ≥ 95%
SDCCH/ Paging Chl. Congestion (%age) ≤ 1%
TCH Congestion (%age) ≤ 2%
Connection Maintenance (Retainability)
Call Drop Rate (%age) ≤ 2%
Worst affected cells having more than 3% TCH drop ≤ 3%
%age of connection with good voice quality ≥ 95%
Point of Interconnection (POI) ≤ 0.5%
TRAI Audit Wireless Report-Assam Circle JFM Quarter-2016
12
2.4.1.4 MONTHLY PMR 3G
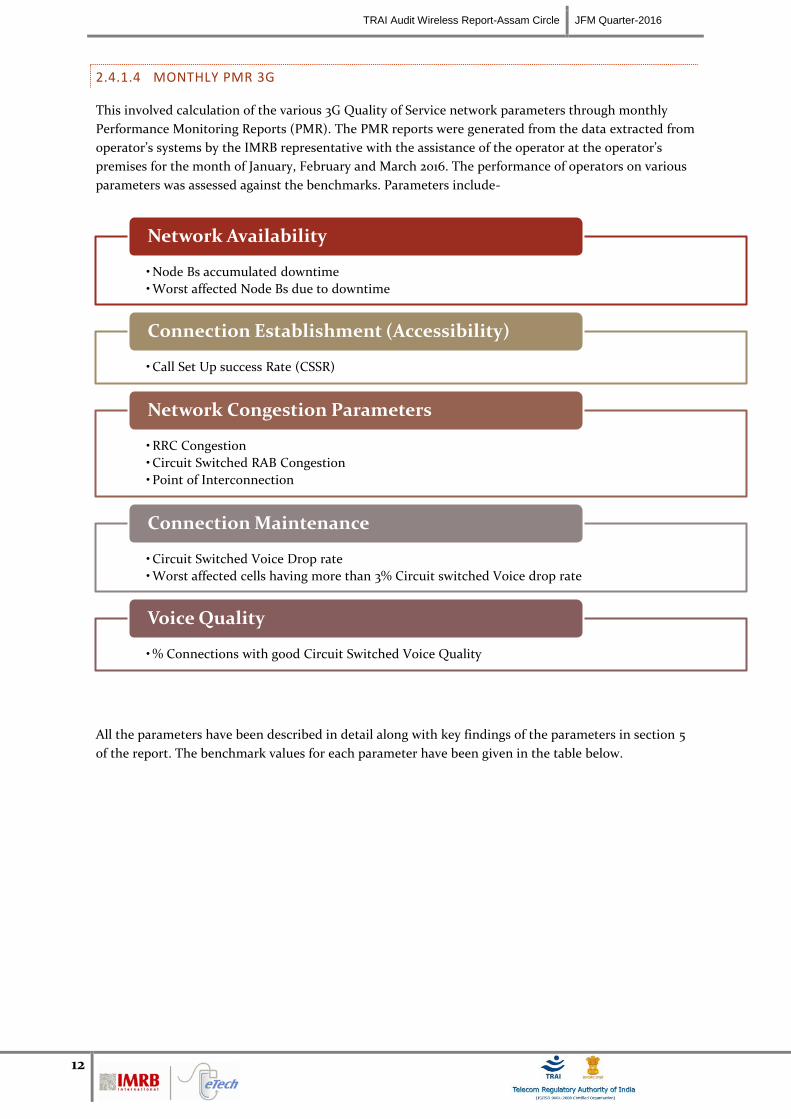
This involved calculation of the various 3G Quality of Service network parameters through monthly
Performance Monitoring Reports (PMR). The PMR reports were generated from the data extracted from
operator’s systems by the IMRB representative with the assistance of the operator at the operator’s
premises for the month of January, February and March 2016. The performance of operators on various
parameters was assessed against the benchmarks. Parameters include-
All the parameters have been described in detail along with key findings of the parameters in section 5
of the report. The benchmark values for each parameter have been given in the table below.
• Node Bs accumulated downtime
• Worst affected Node Bs due to downtime
Network Availability
• Call Set Up success Rate (CSSR)
Connection Establishment (Accessibility)
• RRC Congestion
• Circuit Switched RAB Congestion
• Point of Interconnection
Network Congestion Parameters
• Circuit Switched Voice Drop rate
• Worst affected cells having more than 3% Circuit switched Voice drop rate
Connection Maintenance
• % Connections with good Circuit Switched Voice Quality
Voice Quality
TRAI Audit Wireless Report-Assam Circle JFM Quarter-2016
13
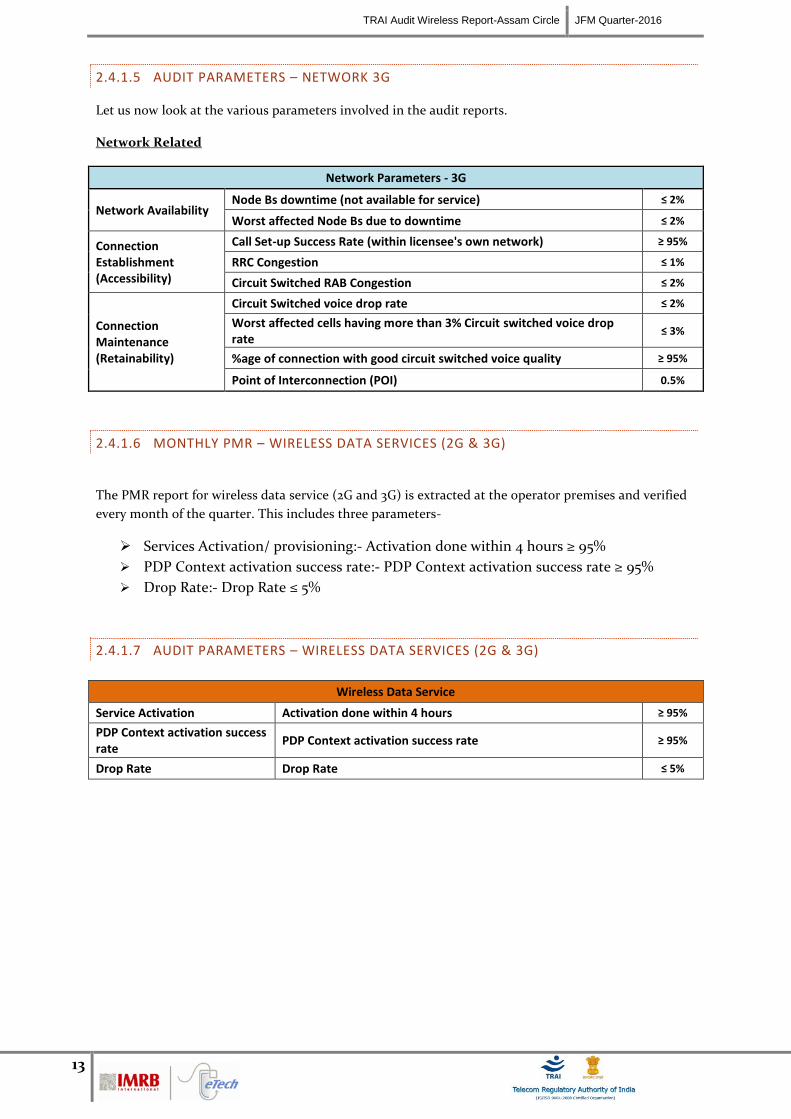
2.4.1.5 AUDIT PARAMETERS – NETWORK 3G
Let us now look at the various parameters involved in the audit reports.
Network Related
Network Parameters - 3G
Network Availability Node Bs downtime (not available for service) ≤ 2%
Worst affected Node Bs due to downtime ≤ 2%
Connection Establishment (Accessibility)
Call Set-up Success Rate (within licensee's own network) ≥ 95%
RRC Congestion ≤ 1%
Circuit Switched RAB Congestion ≤ 2%
Connection Maintenance (Retainability)
Circuit Switched voice drop rate ≤ 2%
Worst affected cells having more than 3% Circuit switched voice drop rate
≤ 3%
%age of connection with good circuit switched voice quality ≥ 95%
Point of Interconnection (POI) 0.5%
2.4.1.6 MONTHLY PMR – WIRELESS DATA SERVICES (2G & 3G)
The PMR report for wireless data service (2G and 3G) is extracted at the operator premises and verified
every month of the quarter. This includes three parameters-
Services Activation/ provisioning:- Activation done within 4 hours ≥ 95%
PDP Context activation success rate:- PDP Context activation success rate ≥ 95%
Drop Rate:- Drop Rate ≤ 5%
2.4.1.7 AUDIT PARAMETERS – WIRELESS DATA SERVICES (2G & 3G)
Wireless Data Service
Service Activation Activation done within 4 hours ≥ 95%
PDP Context activation success rate
PDP Context activation success rate ≥ 95%
Drop Rate Drop Rate ≤ 5%
TRAI Audit Wireless Report-Assam Circle JFM Quarter-2016
14
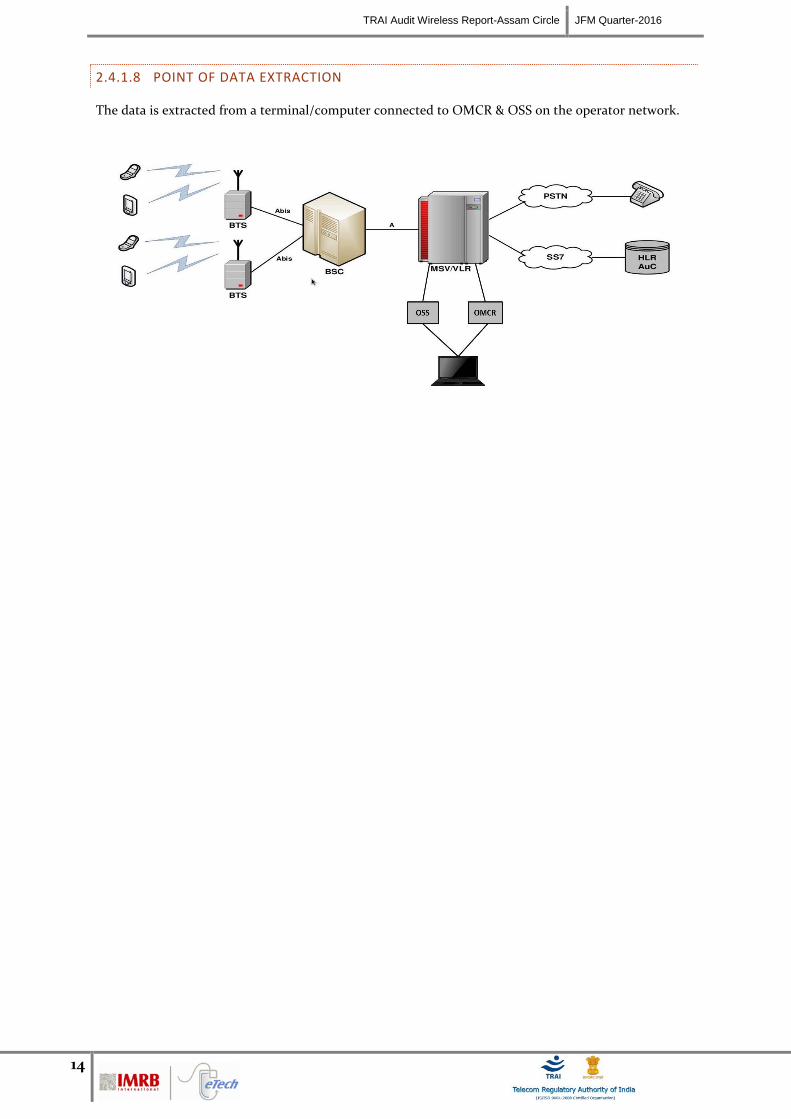
2.4.1.8 POINT OF DATA EXTRACTION
The data is extracted from a terminal/computer connected to OMCR & OSS on the operator network.
TRAI Audit Wireless Report-Assam Circle JFM Quarter-2016
15
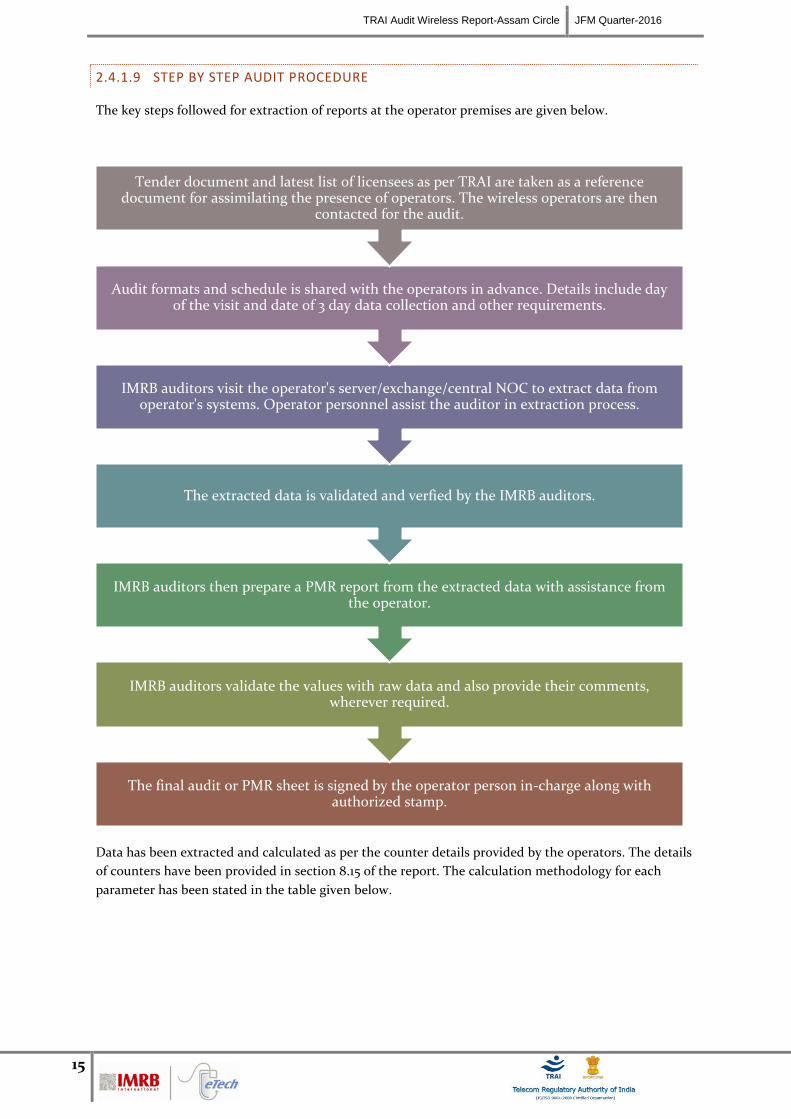
2.4.1.9 STEP BY STEP AUDIT PROCEDURE
The key steps followed for extraction of reports at the operator premises are given below.
Data has been extracted and calculated as per the counter details provided by the operators. The details
of counters have been provided in section 8.15 of the report. The calculation methodology for each
parameter has been stated in the table given below.
The final audit or PMR sheet is signed by the operator person in-charge along with authorized stamp.
IMRB auditors validate the values with raw data and also provide their comments, wherever required.
IMRB auditors then prepare a PMR report from the extracted data with assistance from the operator.
The extracted data is validated and verfied by the IMRB auditors.
IMRB auditors visit the operator's server/exchange/central NOC to extract data from operator's systems. Operator personnel assist the auditor in extraction process.
Audit formats and schedule is shared with the operators in advance. Details include day of the visit and date of 3 day data collection and other requirements.
Tender document and latest list of licensees as per TRAI are taken as a reference document for assimilating the presence of operators. The wireless operators are then
contacted for the audit.
TRAI Audit Wireless Report-Assam Circle JFM Quarter-2016
16
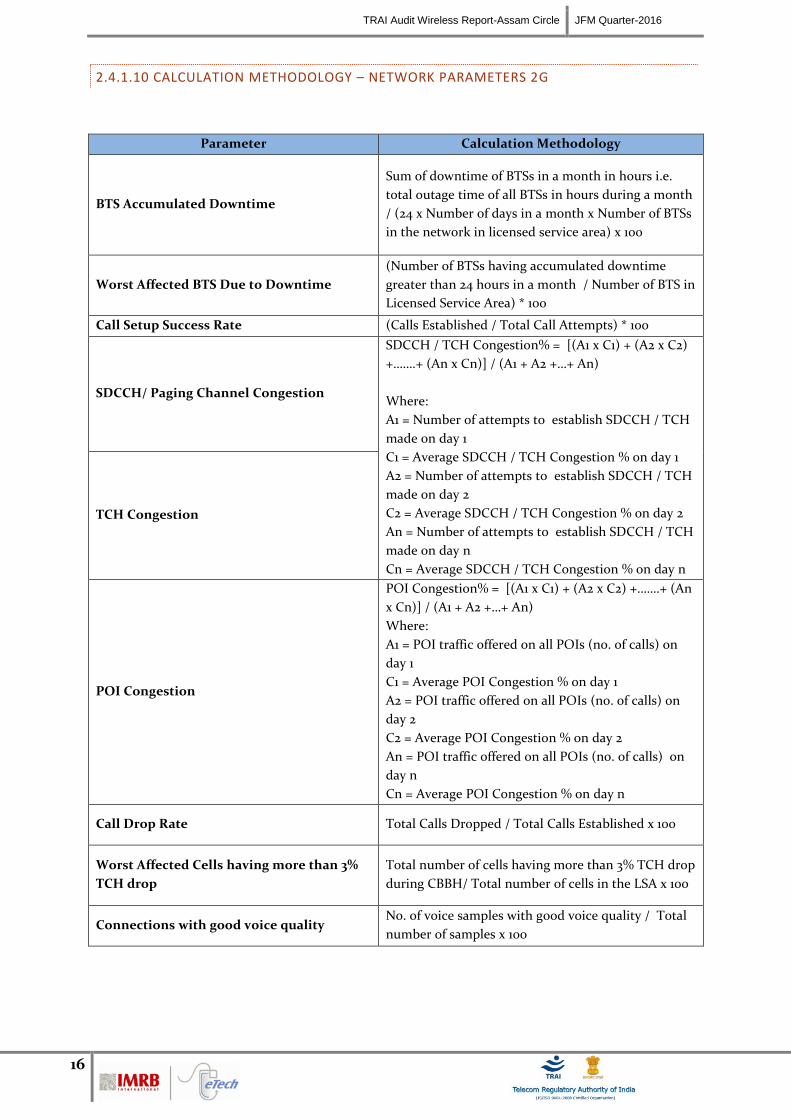
2.4.1.10 CALCULATION METHODOLOGY – NETWORK PARAMETERS 2G
Parameter Calculation Methodology
BTS Accumulated Downtime
Sum of downtime of BTSs in a month in hours i.e.
total outage time of all BTSs in hours during a month
/ (24 x Number of days in a month x Number of BTSs
in the network in licensed service area) x 100
Worst Affected BTS Due to Downtime
(Number of BTSs having accumulated downtime
greater than 24 hours in a month / Number of BTS in
Licensed Service Area) * 100
Call Setup Success Rate (Calls Established / Total Call Attempts) * 100
SDCCH/ Paging Channel Congestion
SDCCH / TCH Congestion% = [(A1 x C1) + (A2 x C2)
+…….+ (An x Cn)] / (A1 + A2 +…+ An)
Where:
A1 = Number of attempts to establish SDCCH / TCH
made on day 1
C1 = Average SDCCH / TCH Congestion % on day 1
A2 = Number of attempts to establish SDCCH / TCH
made on day 2
C2 = Average SDCCH / TCH Congestion % on day 2
An = Number of attempts to establish SDCCH / TCH
made on day n
Cn = Average SDCCH / TCH Congestion % on day n
TCH Congestion
POI Congestion
POI Congestion% = [(A1 x C1) + (A2 x C2) +…….+ (An
x Cn)] / (A1 + A2 +…+ An)
Where:
A1 = POI traffic offered on all POIs (no. of calls) on
day 1
C1 = Average POI Congestion % on day 1
A2 = POI traffic offered on all POIs (no. of calls) on
day 2
C2 = Average POI Congestion % on day 2
An = POI traffic offered on all POIs (no. of calls) on
day n
Cn = Average POI Congestion % on day n
Call Drop Rate Total Calls Dropped / Total Calls Established x 100
Worst Affected Cells having more than 3%
TCH drop
Total number of cells having more than 3% TCH drop
during CBBH/ Total number of cells in the LSA x 100
Connections with good voice quality No. of voice samples with good voice quality / Total
number of samples x 100
TRAI Audit Wireless Report-Assam Circle JFM Quarter-2016
17
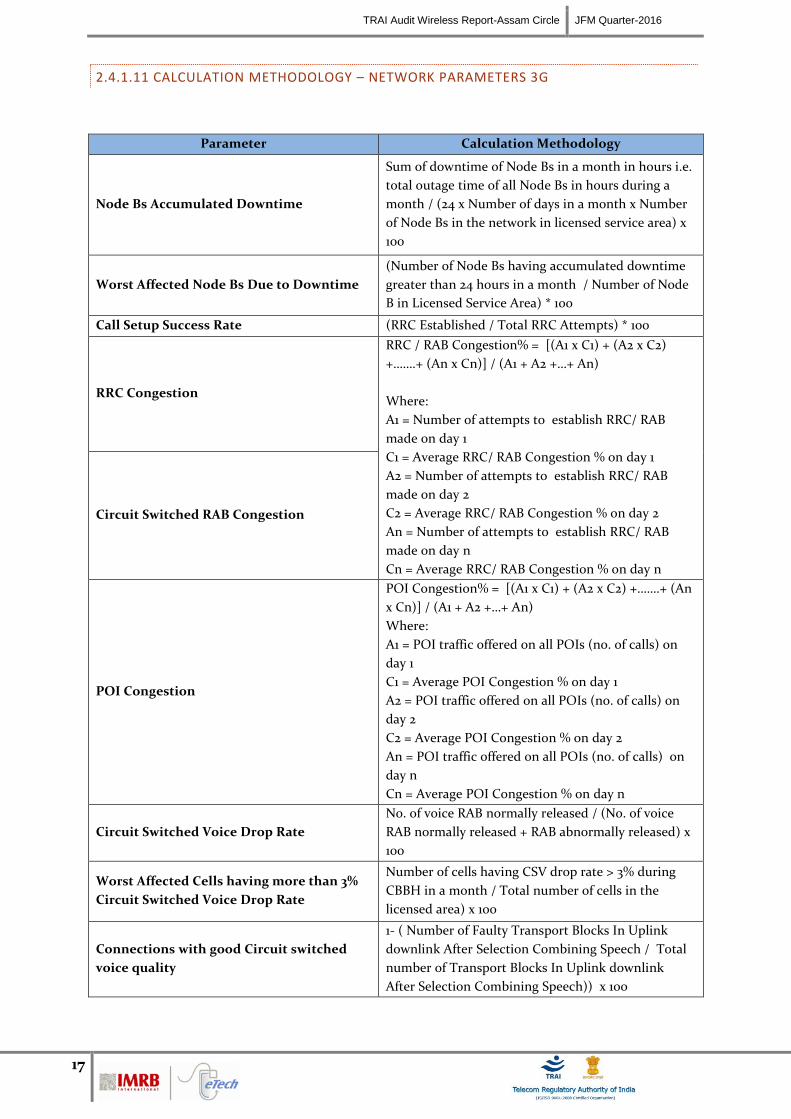
2.4.1.11 CALCULATION METHODOLOGY – NETWORK PARAMETERS 3G
Parameter Calculation Methodology
Node Bs Accumulated Downtime
Sum of downtime of Node Bs in a month in hours i.e.
total outage time of all Node Bs in hours during a
month / (24 x Number of days in a month x Number
of Node Bs in the network in licensed service area) x
100
Worst Affected Node Bs Due to Downtime
(Number of Node Bs having accumulated downtime
greater than 24 hours in a month / Number of Node
B in Licensed Service Area) * 100
Call Setup Success Rate (RRC Established / Total RRC Attempts) * 100
RRC Congestion
RRC / RAB Congestion% = [(A1 x C1) + (A2 x C2)
+…….+ (An x Cn)] / (A1 + A2 +…+ An)
Where:
A1 = Number of attempts to establish RRC/ RAB
made on day 1
C1 = Average RRC/ RAB Congestion % on day 1
A2 = Number of attempts to establish RRC/ RAB
made on day 2
C2 = Average RRC/ RAB Congestion % on day 2
An = Number of attempts to establish RRC/ RAB
made on day n
Cn = Average RRC/ RAB Congestion % on day n
Circuit Switched RAB Congestion
POI Congestion
POI Congestion% = [(A1 x C1) + (A2 x C2) +…….+ (An
x Cn)] / (A1 + A2 +…+ An)
Where:
A1 = POI traffic offered on all POIs (no. of calls) on
day 1
C1 = Average POI Congestion % on day 1
A2 = POI traffic offered on all POIs (no. of calls) on
day 2
C2 = Average POI Congestion % on day 2
An = POI traffic offered on all POIs (no. of calls) on
day n
Cn = Average POI Congestion % on day n
Circuit Switched Voice Drop Rate
No. of voice RAB normally released / (No. of voice
RAB normally released + RAB abnormally released) x
100
Worst Affected Cells having more than 3%
Circuit Switched Voice Drop Rate
Number of cells having CSV drop rate > 3% during
CBBH in a month / Total number of cells in the
licensed area) x 100
Connections with good Circuit switched
voice quality
1- ( Number of Faulty Transport Blocks In Uplink
downlink After Selection Combining Speech / Total
number of Transport Blocks In Uplink downlink
After Selection Combining Speech)) x 100
TRAI Audit Wireless Report-Assam Circle JFM Quarter-2016
18
2.4.1.12 3 DAY LIVE DATA
The main purpose of 3 day live measurement is to evaluate the network parameters on intraday basis.
While the monthly PMR report provides an overall view of the performance of QoS parameters, the 3
day live data helps looking at intraday performance on the network parameters discussed earlier. All the
calculations are done on the basis of that raw data of 3 days.
The 3 day live data provides a sample of 9 days in a quarter (3 days each month of a quarter) with hourly
performance, which enables the auditor to identify and validate intraday issues for an operator on the
Q0S network parameters. For example, network congestion being faced by an operator during
busy/peak hours.
Network related parameters were evaluated for a period of 3 days in each month. 3 day live audit was
conducted for 3 consecutive weekdays for each month. The data was extracted from each operator’s
server/ NOC etc. at the end of the 3rd
day. The extracted data is then used to create a report (similar to
PMR report) to assess the various QoS parameters.
The 3 day live measurement was conducted for network parameters (2G & 3G) and wireless data
services (2G & 3G).
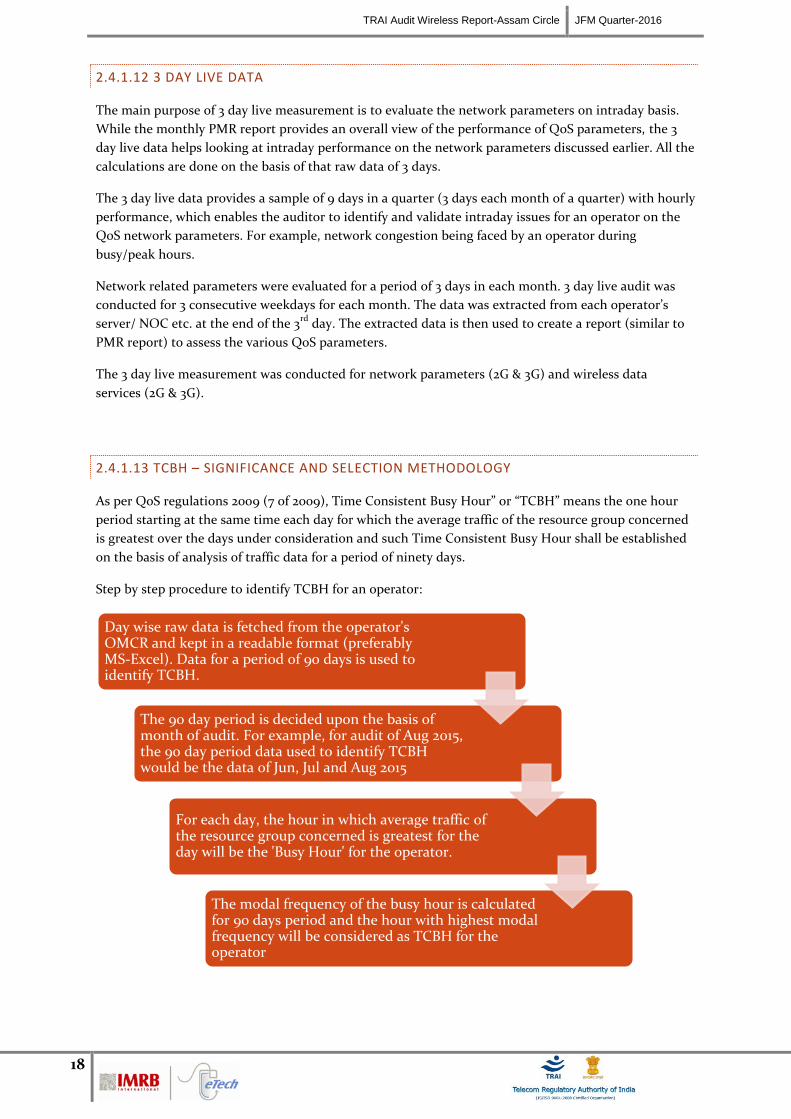
2.4.1.13 TCBH – SIGNIFICANCE AND SELECTION METHODOLOGY
As per QoS regulations 2009 (7 of 2009), Time Consistent Busy Hour” or “TCBH” means the one hour
period starting at the same time each day for which the average traffic of the resource group concerned
is greatest over the days under consideration and such Time Consistent Busy Hour shall be established
on the basis of analysis of traffic data for a period of ninety days.
Step by step procedure to identify TCBH for an operator:
Day wise raw data is fetched from the operator's OMCR and kept in a readable format (preferably MS-Excel). Data for a period of 90 days is used to identify TCBH.
The 90 day period is decided upon the basis of month of audit. For example, for audit of Aug 2015, the 90 day period data used to identify TCBH would be the data of Jun, Jul and Aug 2015
For each day, the hour in which average traffic of the resource group concerned is greatest for the day will be the 'Busy Hour' for the operator.
The modal frequency of the busy hour is calculated for 90 days period and the hour with highest modal frequency will be considered as TCBH for the operator
TRAI Audit Wireless Report-Assam Circle JFM Quarter-2016
19
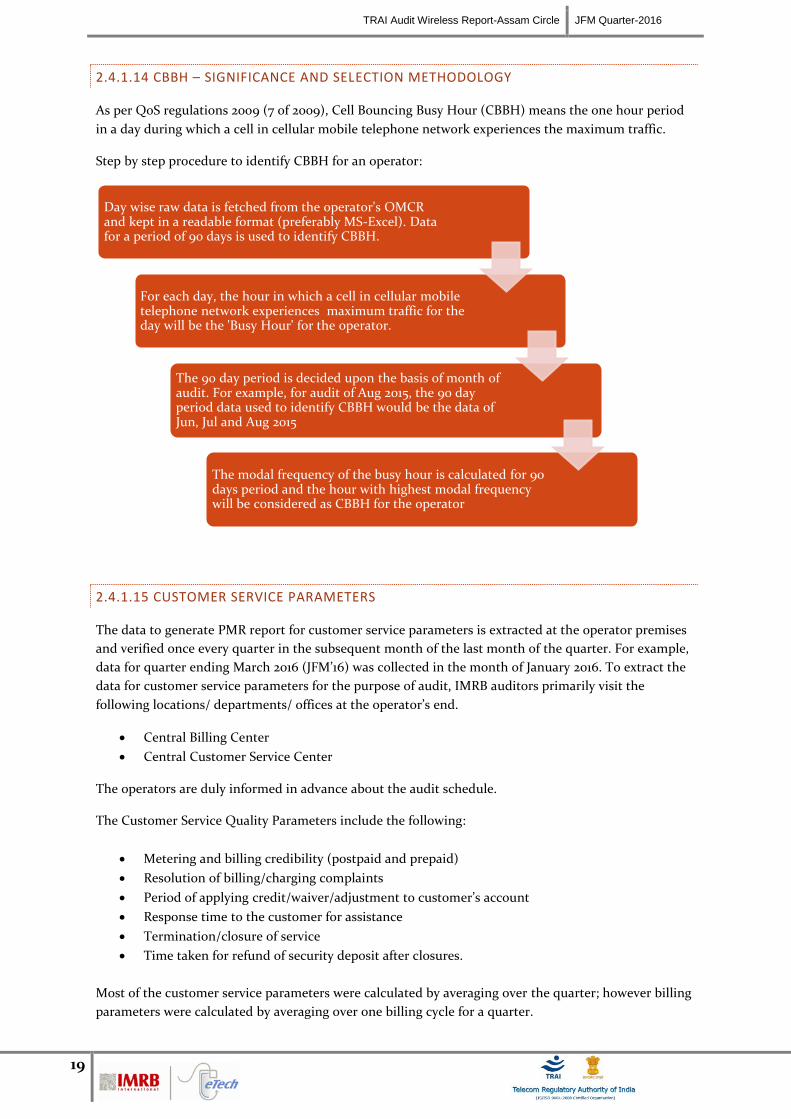
2.4.1.14 CBBH – SIGNIFICANCE AND SELECTION METHODOLOGY
As per QoS regulations 2009 (7 of 2009), Cell Bouncing Busy Hour (CBBH) means the one hour period
in a day during which a cell in cellular mobile telephone network experiences the maximum traffic.
Step by step procedure to identify CBBH for an operator:
2.4.1.15 CUSTOMER SERVICE PARAMETERS
The data to generate PMR report for customer service parameters is extracted at the operator premises
and verified once every quarter in the subsequent month of the last month of the quarter. For example,
data for quarter ending March 2016 (JFM’16) was collected in the month of January 2016. To extract the
data for customer service parameters for the purpose of audit, IMRB auditors primarily visit the
following locations/ departments/ offices at the operator’s end.
Central Billing Center
Central Customer Service Center
The operators are duly informed in advance about the audit schedule.
The Customer Service Quality Parameters include the following:
Metering and billing credibility (postpaid and prepaid)
Resolution of billing/charging complaints
Period of applying credit/waiver/adjustment to customer’s account
Response time to the customer for assistance
Termination/closure of service
Time taken for refund of security deposit after closures.
Most of the customer service parameters were calculated by averaging over the quarter; however billing
parameters were calculated by averaging over one billing cycle for a quarter.
Day wise raw data is fetched from the operator's OMCR and kept in a readable format (preferably MS-Excel). Data for a period of 90 days is used to identify CBBH.
For each day, the hour in which a cell in cellular mobile telephone network experiences maximum traffic for the day will be the 'Busy Hour' for the operator.
The 90 day period is decided upon the basis of month of audit. For example, for audit of Aug 2015, the 90 day period data used to identify CBBH would be the data of Jun, Jul and Aug 2015
The modal frequency of the busy hour is calculated for 90 days period and the hour with highest modal frequency will be considered as CBBH for the operator
TRAI Audit Wireless Report-Assam Circle JFM Quarter-2016
20
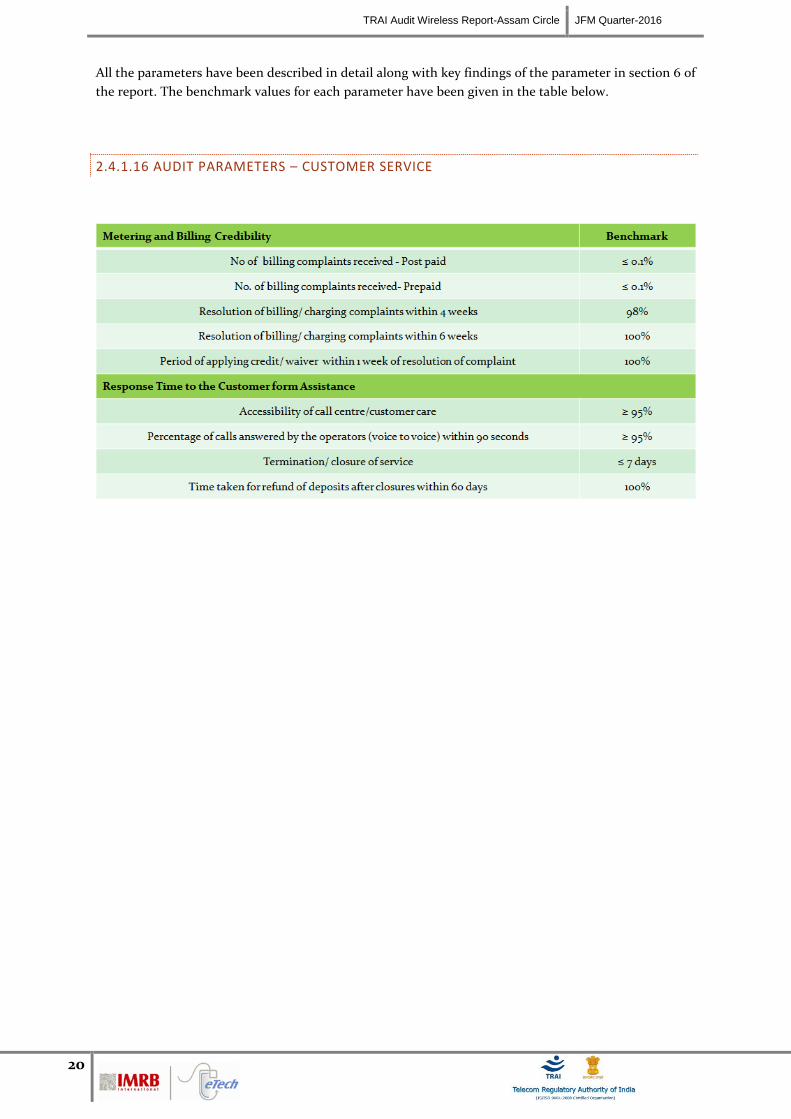
All the parameters have been described in detail along with key findings of the parameter in section 6 of
the report. The benchmark values for each parameter have been given in the table below.
2.4.1.16 AUDIT PARAMETERS – CUSTOMER SERVICE
TRAI Audit Wireless Report-Assam Circle JFM Quarter-2016
21
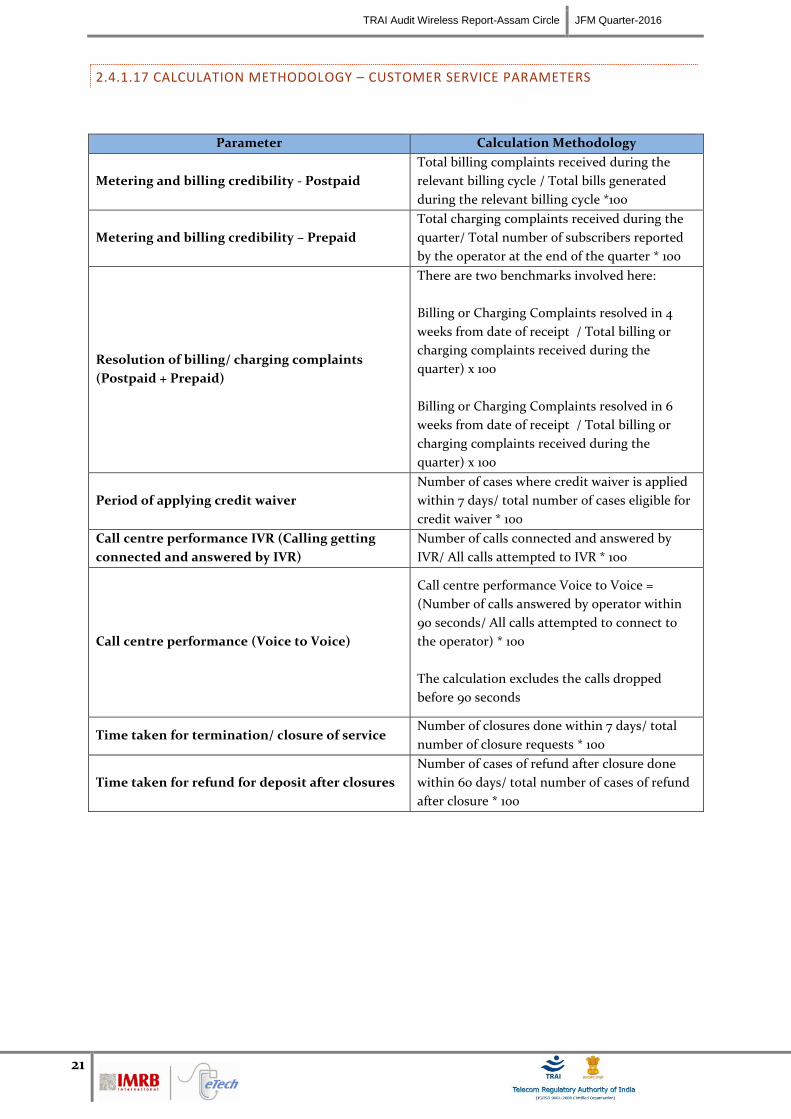
2.4.1.17 CALCULATION METHODOLOGY – CUSTOMER SERVICE PARAMETERS
Parameter Calculation Methodology
Metering and billing credibility - Postpaid
Total billing complaints received during the
relevant billing cycle / Total bills generated
during the relevant billing cycle *100
Metering and billing credibility – Prepaid
Total charging complaints received during the
quarter/ Total number of subscribers reported
by the operator at the end of the quarter * 100
Resolution of billing/ charging complaints
(Postpaid + Prepaid)
There are two benchmarks involved here:
Billing or Charging Complaints resolved in 4
weeks from date of receipt / Total billing or
charging complaints received during the
quarter) x 100
Billing or Charging Complaints resolved in 6
weeks from date of receipt / Total billing or
charging complaints received during the
quarter) x 100
Period of applying credit waiver
Number of cases where credit waiver is applied
within 7 days/ total number of cases eligible for
credit waiver * 100
Call centre performance IVR (Calling getting
connected and answered by IVR)
Number of calls connected and answered by
IVR/ All calls attempted to IVR * 100
Call centre performance (Voice to Voice)
Call centre performance Voice to Voice =
(Number of calls answered by operator within
90 seconds/ All calls attempted to connect to
the operator) * 100
The calculation excludes the calls dropped
before 90 seconds
Time taken for termination/ closure of service Number of closures done within 7 days/ total
number of closure requests * 100
Time taken for refund for deposit after closures
Number of cases of refund after closure done
within 60 days/ total number of cases of refund
after closure * 100
TRAI Audit Wireless Report-Assam Circle JFM Quarter-2016
22
2.4.2 LIVE CALLING
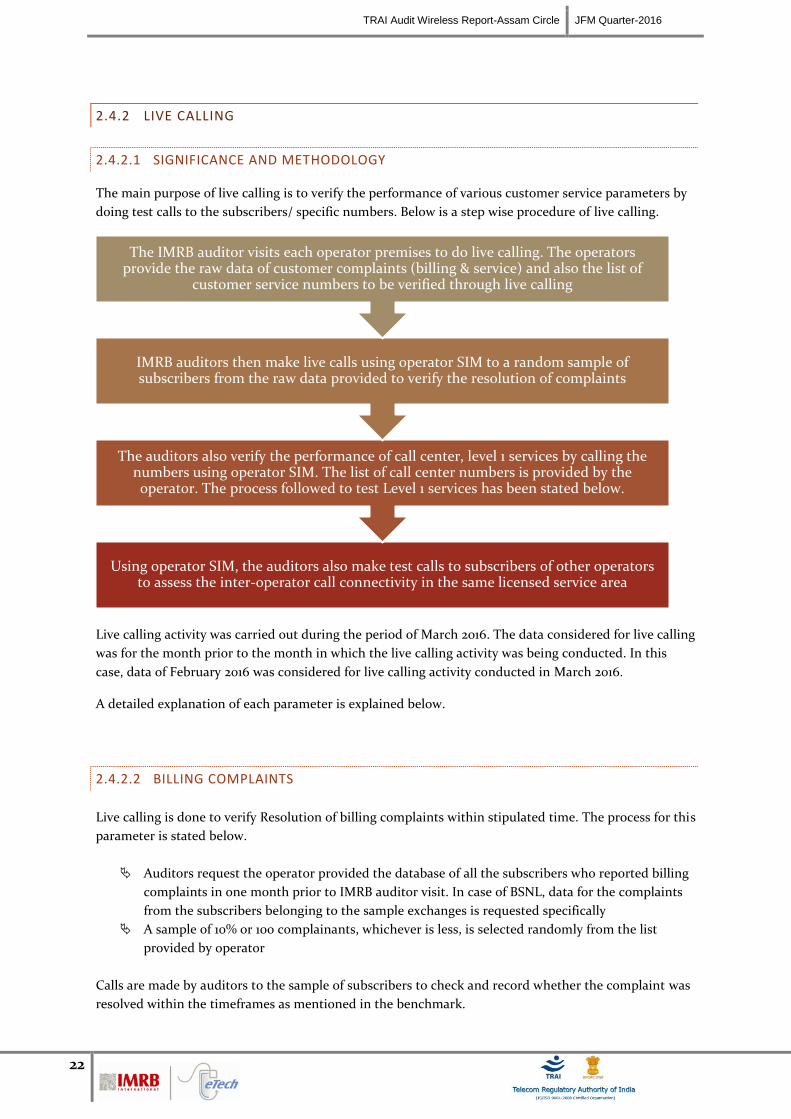
2.4.2.1 SIGNIFICANCE AND METHODOLOGY
The main purpose of live calling is to verify the performance of various customer service parameters by
doing test calls to the subscribers/ specific numbers. Below is a step wise procedure of live calling.
Live calling activity was carried out during the period of March 2016. The data considered for live calling
was for the month prior to the month in which the live calling activity was being conducted. In this
case, data of February 2016 was considered for live calling activity conducted in March 2016.
A detailed explanation of each parameter is explained below.
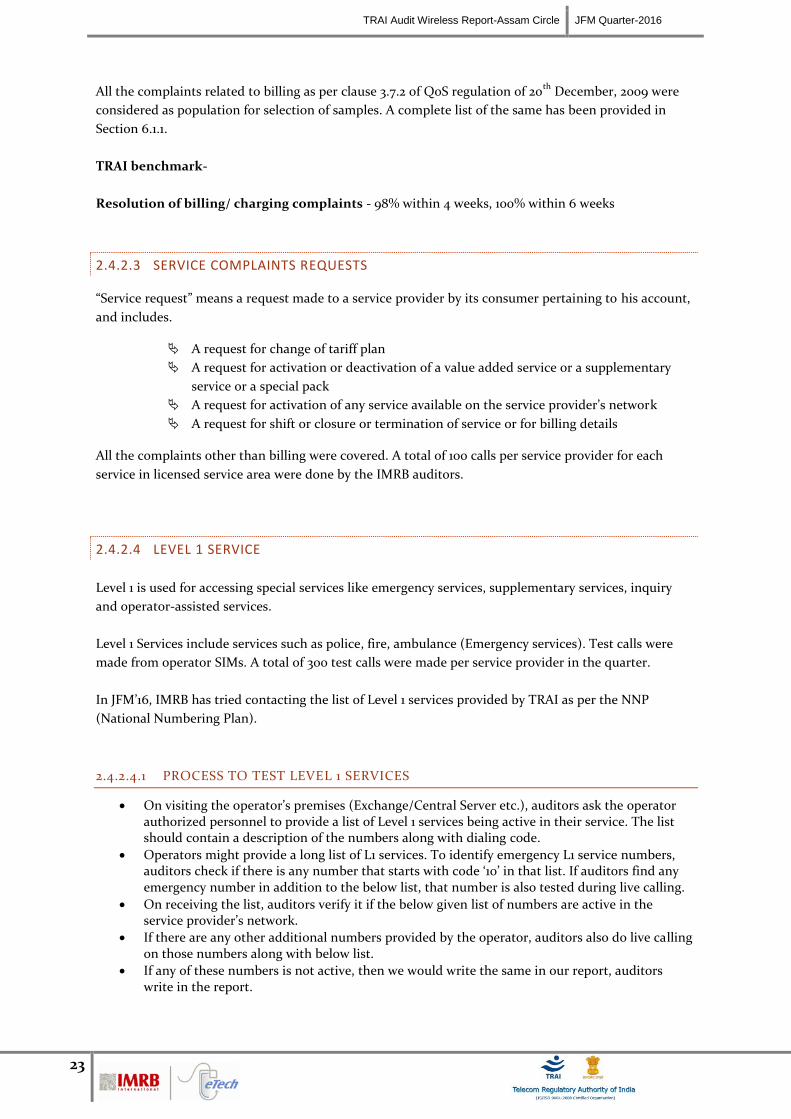
2.4.2.2 BILLING COMPLAINTS
Live calling is done to verify Resolution of billing complaints within stipulated time. The process for this
parameter is stated below.
Auditors request the operator provided the database of all the subscribers who reported billing
complaints in one month prior to IMRB auditor visit. In case of BSNL, data for the complaints
from the subscribers belonging to the sample exchanges is requested specifically
A sample of 10% or 100 complainants, whichever is less, is selected randomly from the list
provided by operator
Calls are made by auditors to the sample of subscribers to check and record whether the complaint was
resolved within the timeframes as mentioned in the benchmark.
Using operator SIM, the auditors also make test calls to subscribers of other operators to assess the inter-operator call connectivity in the same licensed service area
The auditors also verify the performance of call center, level 1 services by calling the numbers using operator SIM. The list of call center numbers is provided by the operator. The process followed to test Level 1 services has been stated below.
IMRB auditors then make live calls using operator SIM to a random sample of subscribers from the raw data provided to verify the resolution of complaints
The IMRB auditor visits each operator premises to do live calling. The operators provide the raw data of customer complaints (billing & service) and also the list of
customer service numbers to be verified through live calling
TRAI Audit Wireless Report-Assam Circle JFM Quarter-2016
23
All the complaints related to billing as per clause 3.7.2 of QoS regulation of 20th
December, 2009 were
considered as population for selection of samples. A complete list of the same has been provided in
Section 6.1.1.
TRAI benchmark-
Resolution of billing/ charging complaints - 98% within 4 weeks, 100% within 6 weeks
2.4.2.3 SERVICE COMPLAINTS REQUESTS
“Service request” means a request made to a service provider by its consumer pertaining to his account,
and includes.
A request for change of tariff plan
A request for activation or deactivation of a value added service or a supplementary
service or a special pack
A request for activation of any service available on the service provider’s network
A request for shift or closure or termination of service or for billing details
All the complaints other than billing were covered. A total of 100 calls per service provider for each
service in licensed service area were done by the IMRB auditors.
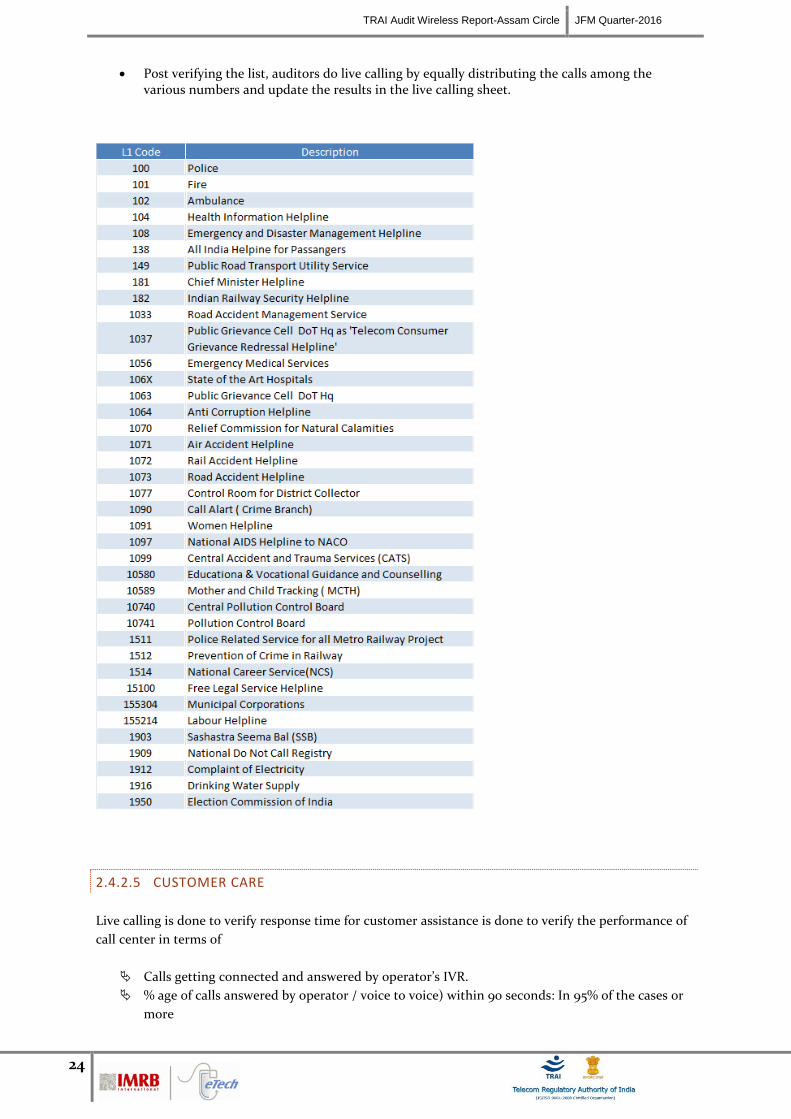
2.4.2.4 LEVEL 1 SERVICE
Level 1 is used for accessing special services like emergency services, supplementary services, inquiry
and operator-assisted services.
Level 1 Services include services such as police, fire, ambulance (Emergency services). Test calls were
made from operator SIMs. A total of 300 test calls were made per service provider in the quarter.
In JFM’16, IMRB has tried contacting the list of Level 1 services provided by TRAI as per the NNP
(National Numbering Plan).
2.4.2.4.1 PROCESS TO TEST LEVEL 1 SERVICES
On visiting the operator’s premises (Exchange/Central Server etc.), auditors ask the operator authorized personnel to provide a list of Level 1 services being active in their service. The list should contain a description of the numbers along with dialing code.
Operators might provide a long list of L1 services. To identify emergency L1 service numbers, auditors check if there is any number that starts with code ‘10’ in that list. If auditors find any emergency number in addition to the below list, that number is also tested during live calling.
On receiving the list, auditors verify it if the below given list of numbers are active in the service provider’s network.
If there are any other additional numbers provided by the operator, auditors also do live calling on those numbers along with below list.
If any of these numbers is not active, then we would write the same in our report, auditors write in the report.
TRAI Audit Wireless Report-Assam Circle JFM Quarter-2016
24
Post verifying the list, auditors do live calling by equally distributing the calls among the various numbers and update the results in the live calling sheet.
2.4.2.5 CUSTOMER CARE
Live calling is done to verify response time for customer assistance is done to verify the performance of
call center in terms of
Calls getting connected and answered by operator’s IVR.
% age of calls answered by operator / voice to voice) within 90 seconds: In 95% of the cases or
more
TRAI Audit Wireless Report-Assam Circle JFM Quarter-2016
25
The process for this parameter is stated below.
Overall sample size is 100 calls per service provider per circle at different points of time, evenly
distributed across the selected exchanges – 50 calls between 1100 HRS to 1400 HRS and 50 calls
between 1600 HRS to 1900 HRS.
Time to answer the call by the operator was assessed from the time interviewer pressed the
requisite button for being assisted by the operator.
All the supplementary services that have any kind of human intervention are to be covered
here. It also includes the IVR assisted services.
2.4.2.6 INTER OPERATOR CALL ASSESEMENT
A total of 100 calls per service provider to all the other service providers in a licensed service area were
done for the purpose of audit.
2.4.3 VOICE DRIVE TEST – 2G & 3G
2.4.3.1 SIGNIFICANCE AND METHODOLOGY
Drive test, as the name suggests, is conducted to measure the performance of an operator in a moving
vehicle in a specified network coverage area.
The main purpose of the drive test is to check the health of the mobile network of various operators in
the area in terms of coverage (signal strength), voice quality, call drop rate, call set up success rate etc.
To assess the indoor coverage, the test is also conducted at two static indoor locations in each SSA, such
as Malls, office buildings, shopping complexes, government buildings etc.
IMRB conducted two types of drive tests as mentioned below.
Operator Assisted Drive Test
Independent Drive Test (No IDT conducted in this quarter)
The main difference between the two is that in the operator assisted, operators participate in the drive
test along with their hardware, software, phones etc. while in the independent drive test IMRB conducts
the drive test on solitary basis and uses its own hardware. Operators generally do not have any
knowledge of the drive test being conducted.
A detailed explanation of the two methodologies has been provided below.
2.4.3.2 OPERATOR ASSISTED DRIVE TEST – VOICE 2G & 3G
SSAs are selected according to the total no. of SSAs on that region and audited as per TRAI instructions;
it depends on the total no. of drive on that circle. The drive tests were conducted for all operators in the
circle, for both 2G and 3G voice services. As per TRAI instructions, the 2G drive was done in 2G only
mode, while 3G drive test was conducted in dual mode (3G on priority).
TRAI Audit Wireless Report-Assam Circle JFM Quarter-2016
26
As per the new directive given by TRAI headquarters, drive test in the quarter were conducted at a SSA
level. SSAs have been defined in two categories by TRAI as per the criticality of the SSA.
1. Normal SSA
2. Difficult SSA
During the drive test in normal SSA, the methodology adopted for the drive test is:
3 consecutive days were selected for drive test in selected SSA. SSAs were defined as per BSNL
and SSA list was finalized by regional TRAI office.
On an average, a minimum of 80 kilometers was covered each day, covering a minimum
distance of 250kms in 3 days.
Route map was designed in such a way that all the major roads, highways and all the important
towns and villages were covered as part of audit.
Special emphasis was given to those areas where the number of complaints received were on
the higher side, if provided by TRAI.
The route is defined in a way that we cover maximum area in the SSA and try to cover
maximum villages and cities within the SSA. The route is designed such that there is no overlap
of roads (if possible).
The route was classified as-
o With In city
o Major Roads
o Highways
o Shopping complex/ Mall
o Office Complex/ Government Building
There were no fixed calls which we need to do for within city, major roads and highways, but a
minimum of 30 calls in each route, i.e., within city, major roads and highways on each day. For
indoors, 20 calls each for shopping and office complex each day preferably in relatively bigger
city.
The drive test covered selected cities and adjoining towns/rural areas where the service
provider has commenced service, including congested areas and indoor sites.
The drive test of each mobile network was conducted between 10 am and 8 pm on weekdays.
The Vehicle used in the drive tests was equipped with the test tool that automatically generates
calls on the mobile telephone networks.
The speed of the vehicle was kept at around 30-50 km/hr.
The holding period of each test call was 120 seconds.
A test call was generated 10 seconds after the previous test call is completed. For 3G, the gap
between two calls was 30 seconds.
Height of the antenna was kept uniform in case of all service providers.
In drive test for difficult SSAs, the methodology adopted for the drive test is:-
Drive test was conducted for 6 consecutive days in selected SSAs; SSAs are defined as per BSNL
and SSA list was finalized by regional TRAI office.
On an average, a minimum of 80 kilometers was covered each day, covering a minimum
distance of 500kms in 6 days.
Rest of the activities for drive test in difficult SSAs are same as drive test for normal SSAs.
TRAI Audit Wireless Report-Assam Circle JFM Quarter-2016
27
2.4.3.3 INDEPENDENT DRIVE TEST – 2G & 3G
The number of independent drive tests to be conducted and their locations are decided basis TRAI
recommendation.
A minimum of 80 kilometers was traversed during the independent drive test in a SSA on each
day. The SSAs were defined as per BSNL and SSA list was finalized by regional TRAI office.
Route map was designed in such a way that all the major roads, highways and all the important
towns and villages were covered as part of audit.
Special emphasis was given to those areas where the number of complaints received were on
the higher side, if provided by TRAI.
The route is defined in a way that we cover maximum area in the SSA and try to cover
maximum villages and cities within the SSA. The route is designed such that there is no overlap
of roads (if possible).
The route was classified as-
o With In city
o Major Roads
o Highways
o Shopping complex/ Mall
o Office Complex/ Government Building
There were no fixed calls which we need to do for within city, major roads and highways, but a
minimum of 30 calls in each route, i.e., within city, major roads and highways on each day. For
indoors, 20 calls each for shopping and office complex each day preferably in relatively bigger
city.
The drive test covered selected cities and adjoining towns/rural areas where the service
provider has commenced service, including congested areas and indoor sites.
The drive test of each mobile network was conducted between 10 am and 8 pm on weekdays.
The Vehicle used in the drive tests was equipped with the test tool that automatically generates
calls on the mobile telephone networks.
The speed of the vehicle was kept at around 30-50 km/hr.
The holding period of each test call was 120 seconds.
A test call was generated 10 seconds after the previous test call is completed. For 3G, the gap
between two calls was 30 seconds.
Height of the antenna was kept uniform in case of all service providers.
2.4.3.4 PARAMETERS EVALUATED DURING VOICE DRIVE TEST – 2G & 3G
The parameters which were captured during the drive test include. Below are the parameters which are
captured for the GSM and CDMA operators.
Coverage-Signal strength (GSM)
Total calls made (A)
Number of calls with signal strength between 0 to -75 dBm
Number of calls with signal strength between 0 to -85 dBm
Number of calls with signal strength between 0 to -95 dBm
Coverage-Signal strength (CDMA)
Total Ec/Io BINS (A)
Total Ec/Io BINS with less than –15 (B)
Low Interference = [1 - (B/A)] x 100
Voice quality (GSM)
TRAI Audit Wireless Report-Assam Circle JFM Quarter-2016
28
Total Rx Qual Samples– A
Rx Qual samples with 0-5 value – B
%age samples with good voice quality = B/A x 100
Voice quality (CDMA)
Total FER BINs (forward FER) – A
FER BINs with 0-2 value (forward FER) – B
FER BINs with 0-4 value (forward FER) – C
%age samples with FER bins having 0-2 value (forward FER) = B/A x 100
%age samples with FER bins having 0-4 value (forward FER) = C/A x 100
No. of FER samples with value > 4 = [A-C]
Call setup success rate
Total number of call attempts – A
Total Calls successfully established – B
Call success rate (%age) = (B/A) x 100
Blocked calls
100% - Call Set up Rate
Call drop rate
Total Calls successfully established – A
Total calls dropped after being established – B
Call Drop Rate (%age) = (B/A) x 100
2.4.4 WIRELESS DATA DRIVE TEST – 2G & 3G
The data drive test is conducted at stationary places called hotspots in a SSA for all the days the voice
drive test is conducted in the same SSA.
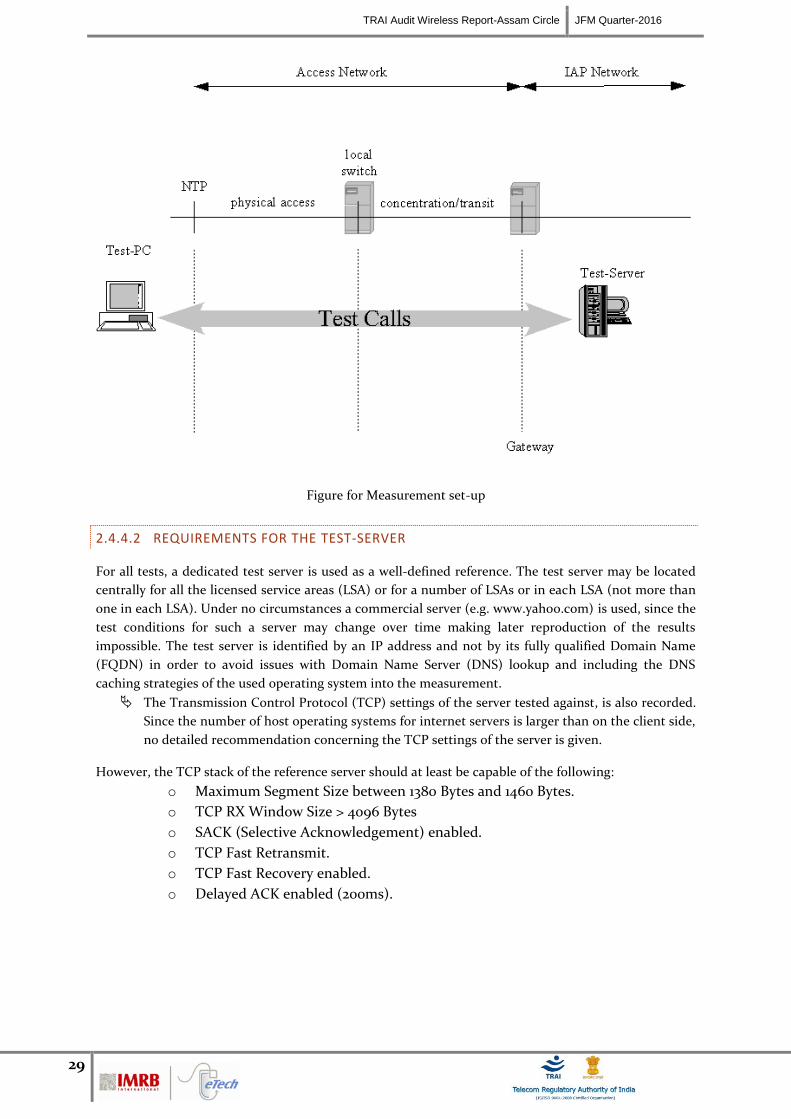
2.4.4.1 METHODOLOGY
The measurement setup is used to conduct test calls for measuring successful data transmission
download and upload attempts, minimum download speed, average throughput and latency is given in
figure given below.
The basic measurement set-up consists of a Test-Device and a Test-Server with specified software and
hardware. Test calls are established between the Test-Device and Test-Server and measurements are
made for the respective QoS parameters. These parameters are measured in a stationary mode. Service
Activation/Provisioning, PDP Context Activation Success Rate and Drop rate are reported from the
actual network counters/database.
To assess the quality of the connection between an end user and an Internet Service Provider
(ISP), ideally the Test-Server is placed as near as possible to the gateway providing the
interconnection between access network and ISP network. The location of the test-server is as
near as possible to the gateway providing the interconnection between access network and ISP
network implies that the measurements will not reflect the influence in the QoS of the ISP
network, between that gateway and the gateway interconnecting with the Internet.
TRAI Audit Wireless Report-Assam Circle JFM Quarter-2016
29
Figure for Measurement set-up
2.4.4.2 REQUIREMENTS FOR THE TEST-SERVER
For all tests, a dedicated test server is used as a well-defined reference. The test server may be located
centrally for all the licensed service areas (LSA) or for a number of LSAs or in each LSA (not more than
one in each LSA). Under no circumstances a commercial server (e.g. www.yahoo.com) is used, since the
test conditions for such a server may change over time making later reproduction of the results
impossible. The test server is identified by an IP address and not by its fully qualified Domain Name
(FQDN) in order to avoid issues with Domain Name Server (DNS) lookup and including the DNS
caching strategies of the used operating system into the measurement.
The Transmission Control Protocol (TCP) settings of the server tested against, is also recorded.
Since the number of host operating systems for internet servers is larger than on the client side,
no detailed recommendation concerning the TCP settings of the server is given.
However, the TCP stack of the reference server should at least be capable of the following:
o Maximum Segment Size between 1380 Bytes and 1460 Bytes.
o TCP RX Window Size > 4096 Bytes
o SACK (Selective Acknowledgement) enabled.
o TCP Fast Retransmit.
o TCP Fast Recovery enabled.
o Delayed ACK enabled (200ms).
TRAI Audit Wireless Report-Assam Circle JFM Quarter-2016
30
2.4.4.3 TEST FILES
The test file consist of incompressible data i.e. a data file that is already compressed, e.g. like a zip or jpg
file. The test file has at least twice the size (in Kbit) of the theoretically maximum data transmission rate
per second (in Kbit/s) of the Internet access under consideration.
2.4.4.4 REPRESENTATIVENESS OR NUMBER OF TEST CALLS
The choice of adequate test calls, i.e. geographical locations of origin and destination of calls as
well as traffic variations, is a crucial point with respect to the comparability and validation of
the statistics are calculated for the measured parameters. For each parameter, it is ensured that
the samples are aggregated over all classes of customers for fairness in reflecting the QoS
actually perceived by the user and the statistics are preserved to substantiate the same.
The necessary number of samples (test calls) are 1067 for each of the category “A” and “Metro”
licensed service area (LSA), 600 for each of the category “B” LSA and 384 for each of the
category “C” LSA for all the parameters.
2.4.4.5 PARAMETERS EVALUATED DURING DATA DRIVE TEST AT HOTSPOTS
2.4.4.5.1 SUCCESSFUL DATA TRANSMISSIONS DOWNLOAD ATTEMPTS
The successful data download attempts is defined as the ratio of successful data downloads to the total
number of data download attempts in a specified time period. A data transmission is successful if a test
file is downloaded completely and with no errors.
Measurement:
The percentage that is the sum total of successful data downloads, divided by the sum total of all
attempts to download a test file is provided. The statistics are calculated from test calls made according
to the measurement set-up and taking into account the representativeness requirements. The successful
data download is measured by downloading a test file. An attempt to transmit the test file is considered
unsuccessful if it takes longer than 60 seconds.
Successful data transmission download attempts =
Total Successful download attempts ×100
Total download attempts
TRAI Audit Wireless Report-Assam Circle JFM Quarter-2016
31
2.4.4.5.2 SUCCESSFUL DATA TRANSMISSION UPLOAD ATTEMPTS
The successful data upload attempts is defined as the ratio of successful data uploads to the total
number of data upload attempts in a specified time period. A data upload is successful if a test file is
uploaded completely and with no errors.
Measurement:
The percentage that is the sum total of successful data uploads, divided by the sum total of all attempts
to upload a test file should be provided. The statistics are calculated from test calls made according to
the measurement set-up and taking into account the representativeness requirements. The successful
data upload is measured by uploading a test file. An attempt to transmit the test file is considered
unsuccessful if it takes longer than 60 seconds.
Successful data transmission upload attempts = Total Successful upload attempts ×100
Total upload attempts
2.4.4.5.3 MINIMUM DOWNLOAD SPEED
The download speed is defined as the data transmission rate that is achieved for downloading a test file from a test server to a test device.
Measurement: The minimum download speed is calculated from test calls made according to the measurement set-up. Test calls are to be made to weigh the results according to the patterns of real traffic. Minimum download speed is the average of the lower 10% of all such test calls. Minimum download speed (average of lower 10% of all test calls) = Download speed (A1+A2+A3+A4+A5+A6) ×100 6 Note- A1, A2, A3, A4 A5 & A6 are download speeds at 6 hotspots
2.4.4.5.4 AVERAGE THROUGHPUT FOR PACKET DATA
It is defined as the rate at which packets are transmitted in a network. In a mobile network the download speed varies depending on the number of users in a particular location. Even though a service provider may be advertising certain speed, the actual speed may vary as per the number of users in the network and there could be customer dissatisfaction on account of relatively slow speed. Hence, there is a need to prescribe an average throughput to protect the interest of consumers. The service providers need to constantly upgrade their network to meet average throughput benchmark.
The throughput is defined as the data transmission rate that is achieved for downloading a test
file from a test server to a test device.
The service provider will advertise the throughput being offered to its customers as per their
category or plan and it should be meted out as per their commitment.
Measurement: The average throughput for packet data should be calculated from all the test calls made according to the measurement setup.
TRAI Audit Wireless Report-Assam Circle JFM Quarter-2016
32
Test calls are made to weigh the results according to the patterns of real traffic. Average throughput is calculated as the average of all such test calls.
Average Throughput for Packet data = Average of download attempts in Kbit/ average download time in secs
2.4.4.5.5 LATENCY
Latency is the amount of time taken by a packet to reach the receiving endpoint after being transmitted from the sending point. This time period is termed the "end-to-end delay" occurring along the transmission path. Latency generally refers to network conditions, such as congestion, that may affect the overall time required for transit.
Measurement: Latency is measured with the test server for ping connected directly to the server on the same Intranet domain. Latency (Percentage of successful pinged) = Total number of successful ping ×100 Total number of ping sent to the Test Server
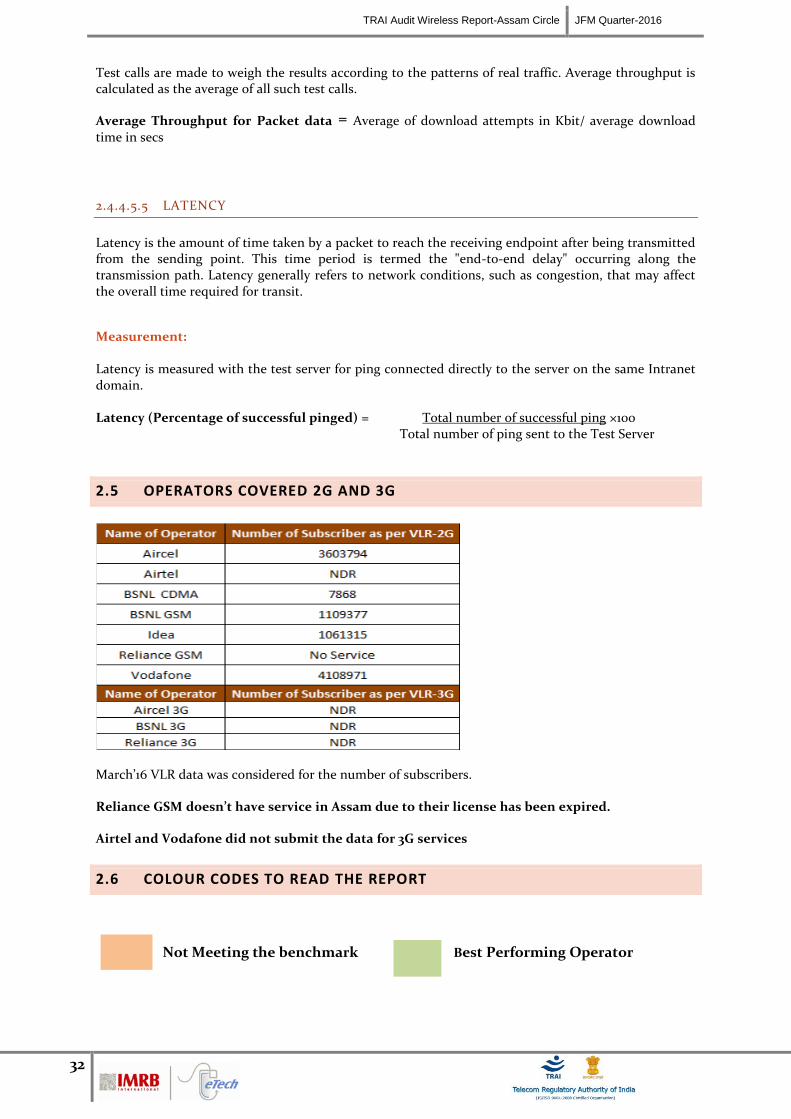
2.5 OPERATORS COVERED 2G AND 3G
March’16 VLR data was considered for the number of subscribers.
Reliance GSM doesn’t have service in Assam due to their license has been expired.
Airtel and Vodafone did not submit the data for 3G services
2.6 COLOUR CODES TO READ THE REPORT
Not Meeting the benchmark Best Performing Operator
TRAI Audit Wireless Report-Assam Circle JFM Quarter-2016
33
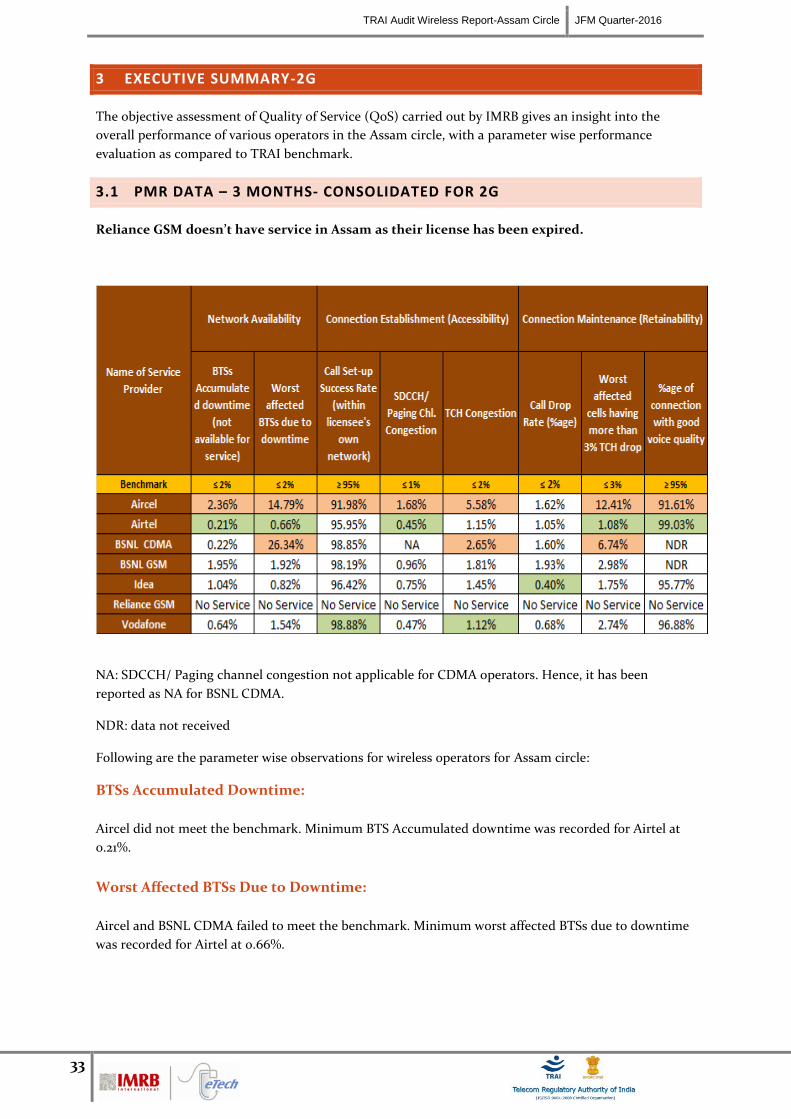
3 EXECUTIVE SUMMARY-2G
The objective assessment of Quality of Service (QoS) carried out by IMRB gives an insight into the
overall performance of various operators in the Assam circle, with a parameter wise performance
evaluation as compared to TRAI benchmark.
3.1 PMR DATA – 3 MONTHS- CONSOLIDATED FOR 2G
Reliance GSM doesn’t have service in Assam as their license has been expired.
NA: SDCCH/ Paging channel congestion not applicable for CDMA operators. Hence, it has been
reported as NA for BSNL CDMA.
NDR: data not received
Following are the parameter wise observations for wireless operators for Assam circle:
BTSs Accumulated Downtime:
Aircel did not meet the benchmark. Minimum BTS Accumulated downtime was recorded for Airtel at
0.21%.
Worst Affected BTSs Due to Downtime:
Aircel and BSNL CDMA failed to meet the benchmark. Minimum worst affected BTSs due to downtime
was recorded for Airtel at 0.66%.
TRAI Audit Wireless Report-Assam Circle JFM Quarter-2016
34
Call Set-up Success Rate (CSSR):
Aircel failed to meet the benchmark for CSSR. The maximum CSSR was observed for Vodafone with
98.88%.
Excluding Airtel, all other operators were found to be calculating the parameter as per the norm
specified by TRAI, as given in parameter description section. Airtel is using a formula that has not been
specified by TRAI or the counter definitions provided by their network service provider (Ericsson).
However, this report presents the appropriate CSSR value for Airtel, which was calculated by using the
proper counter details (provided in section 8.15.1) by the IMRB auditor during audit.
SDCCH/ Paging Chl. Congestion:
Aircel and BSNL CDMA failed to meet the benchmark on SDCCH / Paging Channel Congestion. Airtel
recorded the best SDCCH / Paging Channel Congestion at 0.45%.
TCH Congestion:
Aircel and BSNL CDMA failed to meet the benchmark for TCH congestion, while Vodafone performed
the best on TCH congestion at 1.12%.
The calculation methodology (given in parameter description section) followed by the operators was
found to be in complete accordance with what has been specified by TRAI.
Call Drop Rate:
All operators met the benchmark for the parameter. Minimum call drop rate was recorded for Idea at
0.40%.
Worst Affected Cells Having More than 3% TCH Drop:
Aircel and BSNL CDMA failed to meet the benchmark. Best performance was recorded for Airtel at
1.08%.
Voice Quality
Aircel failed to meet the benchmark. Best performance was recorded for Airtel at 99.03%.
All the service providers were measuring this parameter as per the TRAI guidelines that have been
stated in parameter description section.
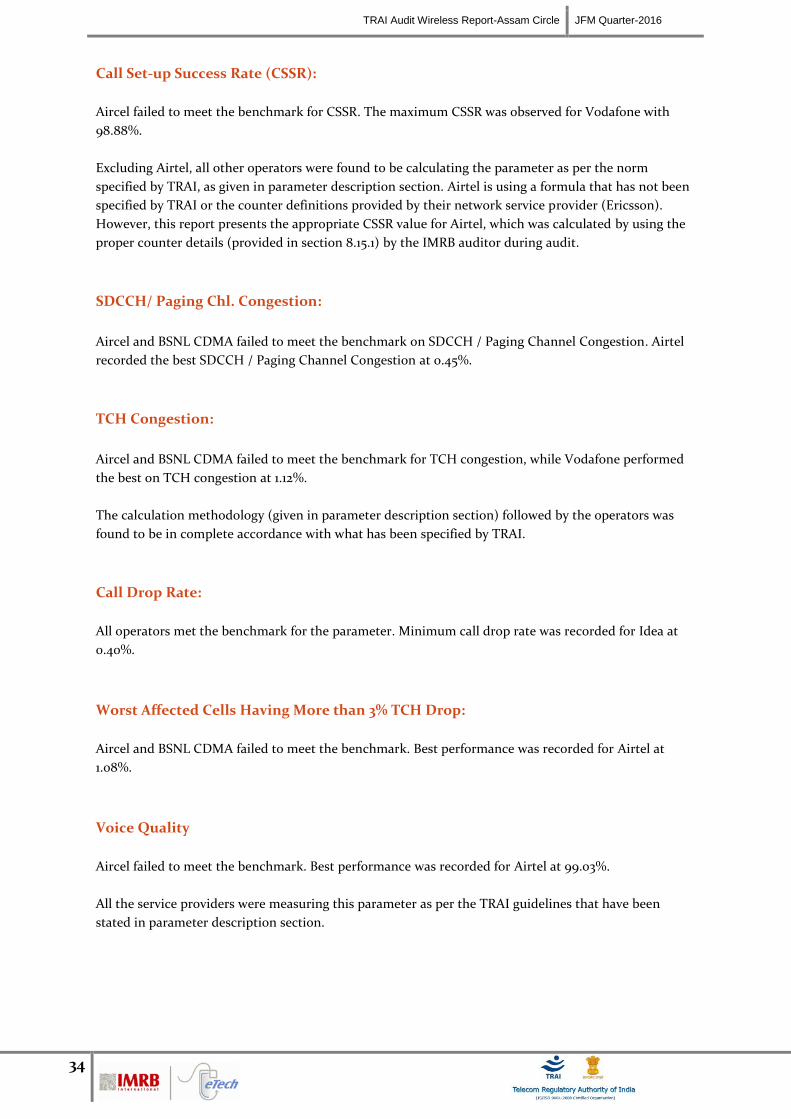
Below are the month wise summary tables for each network parameter basis PMR data.
3.1.1 PMR DATA - JANUARY FOR 2G
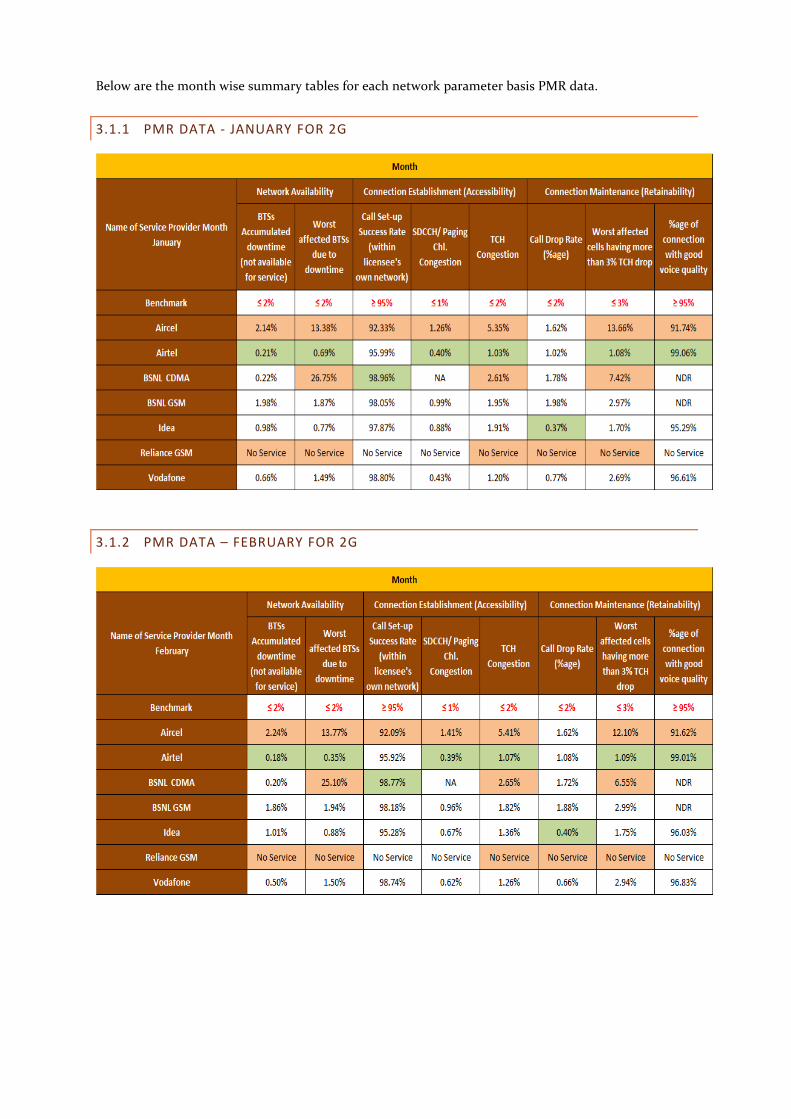
3.1.2 PMR DATA – FEBRUARY FOR 2G
TRAI Audit Wireless Report-Assam Circle JFM Quarter-2016
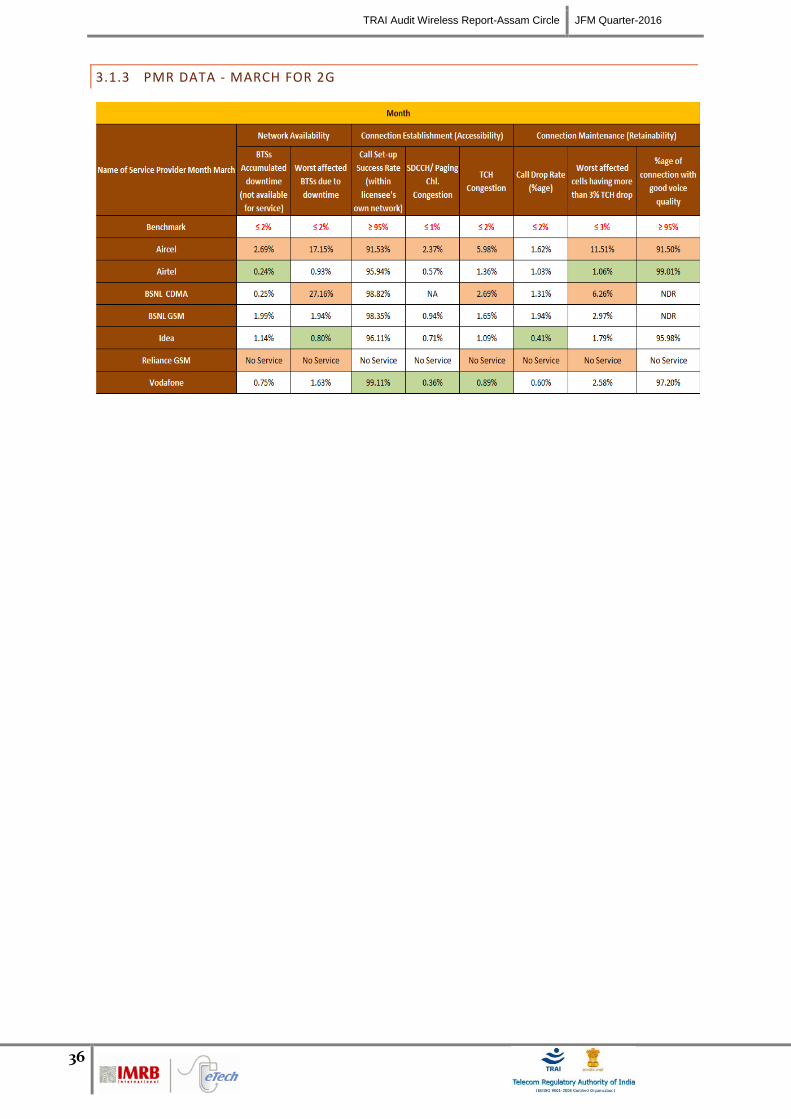
36
3.1.3 PMR DATA - MARCH FOR 2G
TRAI Audit Wireless Report-Assam Circle JFM Quarter-2016
37
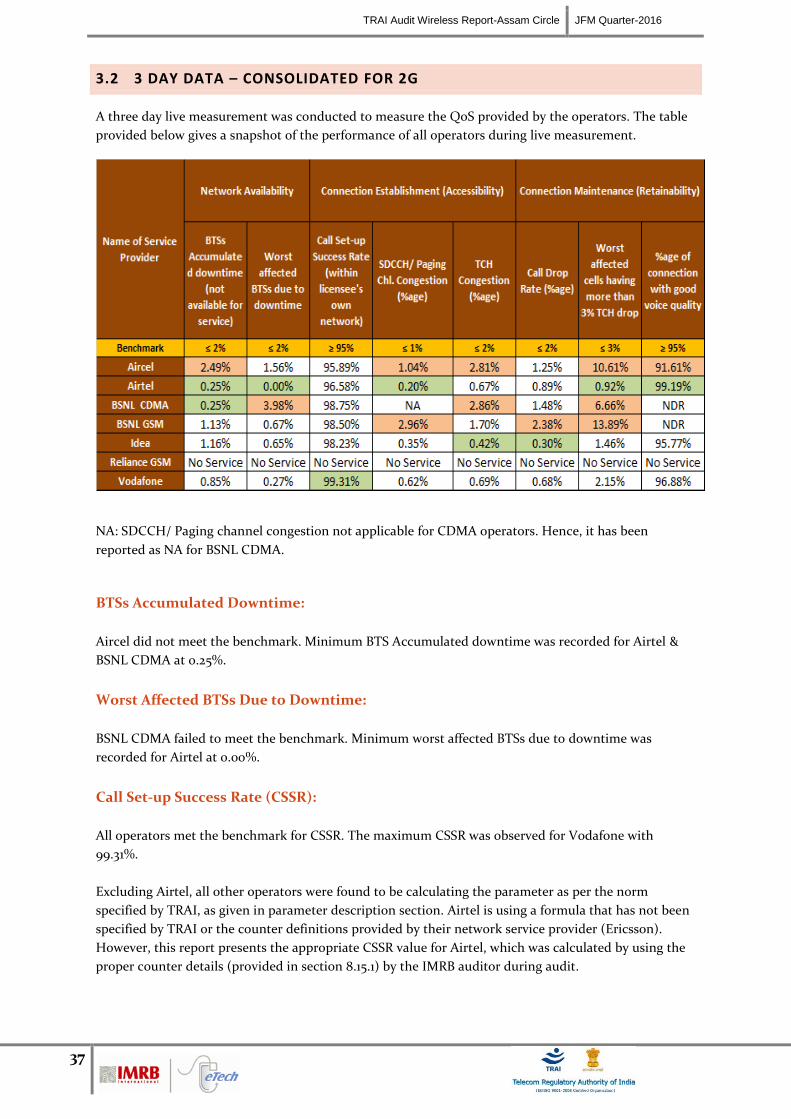
3.2 3 DAY DATA – CONSOLIDATED FOR 2G
A three day live measurement was conducted to measure the QoS provided by the operators. The table
provided below gives a snapshot of the performance of all operators during live measurement.
NA: SDCCH/ Paging channel congestion not applicable for CDMA operators. Hence, it has been
reported as NA for BSNL CDMA.
BTSs Accumulated Downtime:
Aircel did not meet the benchmark. Minimum BTS Accumulated downtime was recorded for Airtel &
BSNL CDMA at 0.25%.
Worst Affected BTSs Due to Downtime:
BSNL CDMA failed to meet the benchmark. Minimum worst affected BTSs due to downtime was
recorded for Airtel at 0.00%.
Call Set-up Success Rate (CSSR):
All operators met the benchmark for CSSR. The maximum CSSR was observed for Vodafone with
99.31%.
Excluding Airtel, all other operators were found to be calculating the parameter as per the norm
specified by TRAI, as given in parameter description section. Airtel is using a formula that has not been
specified by TRAI or the counter definitions provided by their network service provider (Ericsson).
However, this report presents the appropriate CSSR value for Airtel, which was calculated by using the
proper counter details (provided in section 8.15.1) by the IMRB auditor during audit.
TRAI Audit Wireless Report-Assam Circle JFM Quarter-2016
38
SDCCH/ Paging Chl. Congestion:
Aircel and BSNL GSM failed to meet the benchmark for SDCCH / Paging Channel Congestion. Airtel
recorded the best SDCCH / Paging Channel Congestion at 0.20%.
TCH Congestion:
Aircel and BSNL CDMA failed to meet the benchmark for TCH congestion, while Idea performed the
best on TCH congestion at 0.42%.
The calculation methodology (given in parameter description section) followed by the operators was
found to be in complete accordance with what has been specified by TRAI.
Call Drop Rate:
BSNL GSM failed to meet the benchmark for the parameter. Minimum call drop rate was recorded for
Idea at 0.30%.
Worst Affected Cells Having More than 3% TCH Drop:
Aircel, BSNL CDMA & GSM failed to meet the benchmark. Best performance was recorded for Airtel at
0.92%.
Voice Quality
Aircel failed to meet the benchmark. Best performance was recorded for Airtel at 99.20%.
All the service providers were measuring this parameter as per the TRAI guidelines that have been
stated in parameter description section.
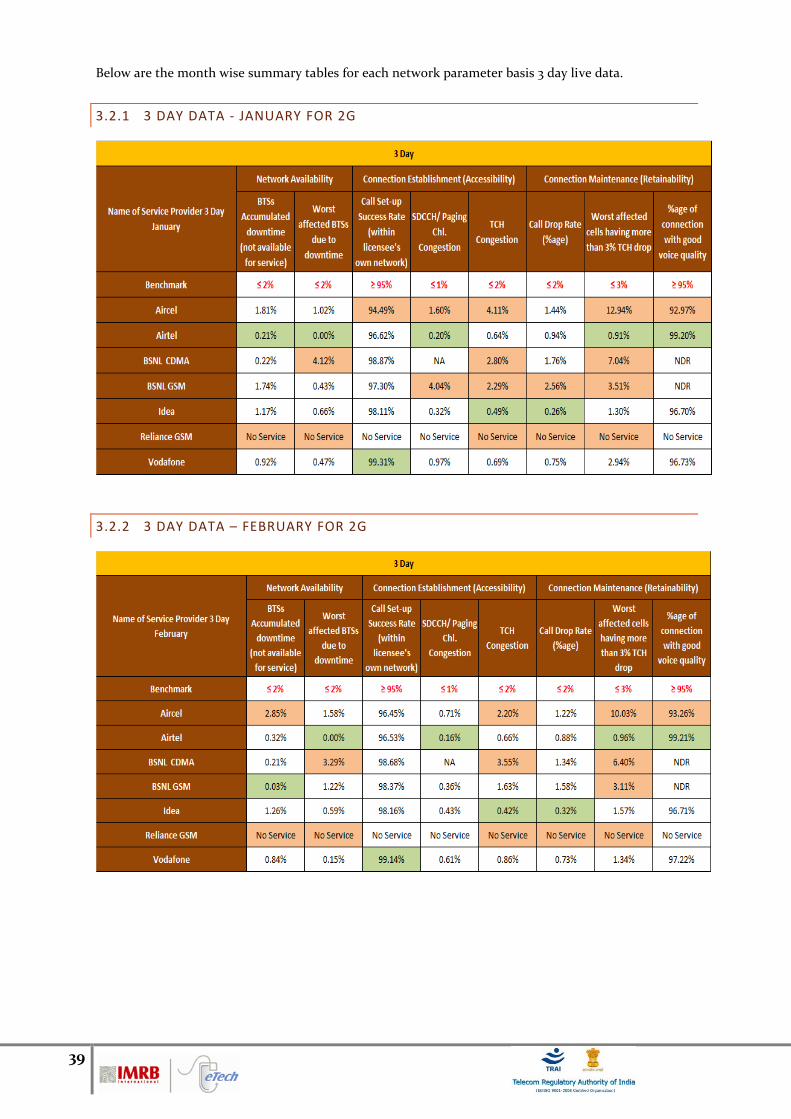
39
Below are the month wise summary tables for each network parameter basis 3 day live data.
3.2.1 3 DAY DATA - JANUARY FOR 2G
3.2.2 3 DAY DATA – FEBRUARY FOR 2G
TRAI Audit Wireless Report-Assam Circle JFM Quarter-2016
40
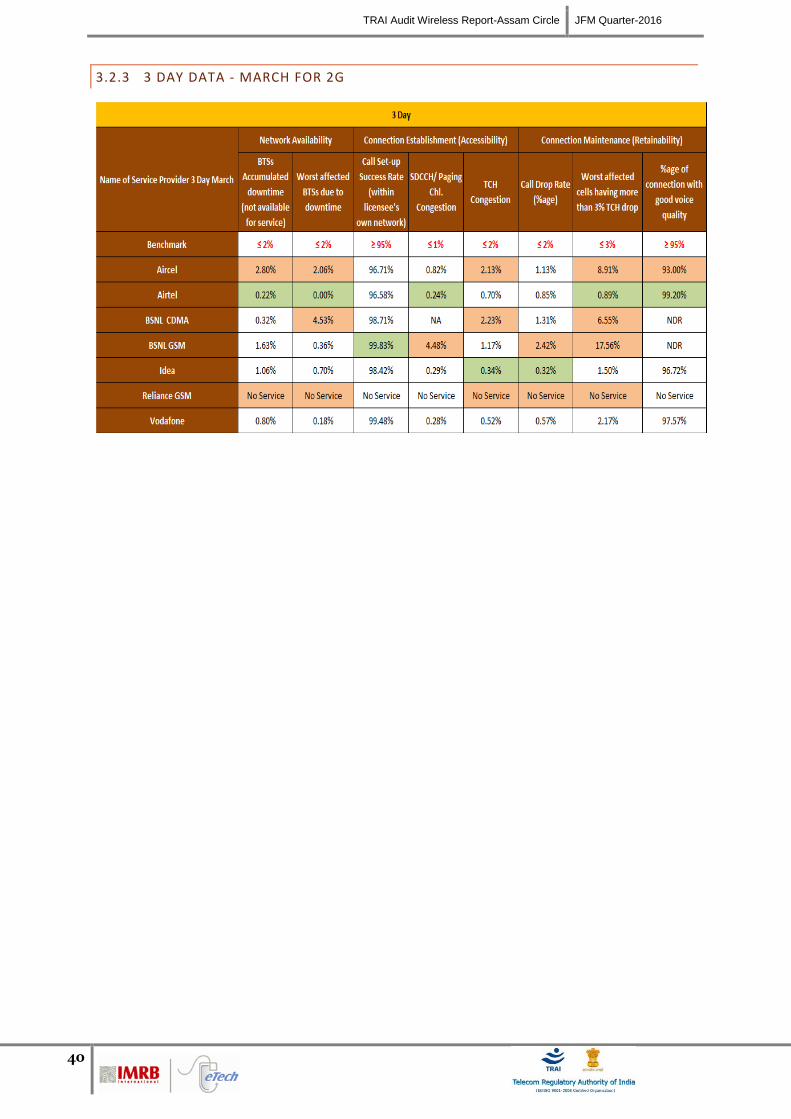
3.2.3 3 DAY DATA - MARCH FOR 2G
TRAI Audit Wireless Report-Assam Circle JFM Quarter-2016
41
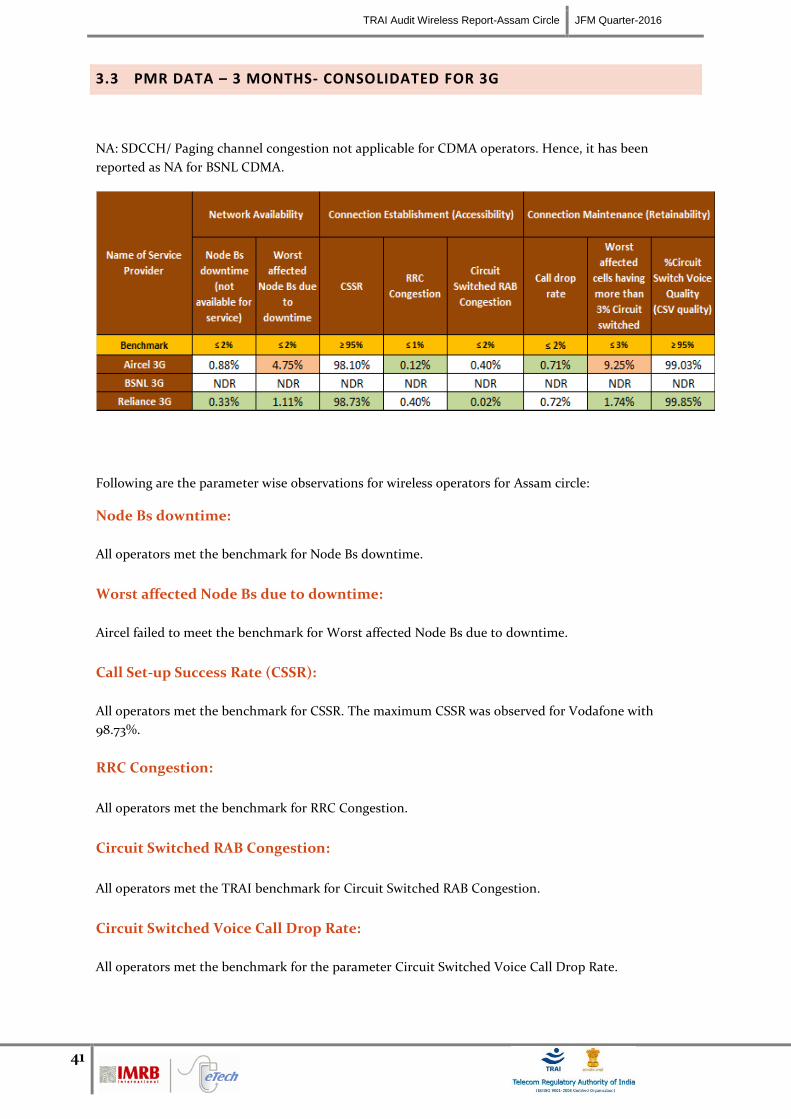
3.3 PMR DATA – 3 MONTHS- CONSOLIDATED FOR 3G
NA: SDCCH/ Paging channel congestion not applicable for CDMA operators. Hence, it has been
reported as NA for BSNL CDMA.
Following are the parameter wise observations for wireless operators for Assam circle:
Node Bs downtime:
All operators met the benchmark for Node Bs downtime.
Worst affected Node Bs due to downtime:
Aircel failed to meet the benchmark for Worst affected Node Bs due to downtime.
Call Set-up Success Rate (CSSR):
All operators met the benchmark for CSSR. The maximum CSSR was observed for Vodafone with
98.73%.
RRC Congestion:
All operators met the benchmark for RRC Congestion.
Circuit Switched RAB Congestion:
All operators met the TRAI benchmark for Circuit Switched RAB Congestion.
Circuit Switched Voice Call Drop Rate:
All operators met the benchmark for the parameter Circuit Switched Voice Call Drop Rate.
TRAI Audit Wireless Report-Assam Circle JFM Quarter-2016
42
Worst affected cells having more than 3% Circuit switched voice drop rate:
Aircel failed to meet the benchmark for worst affected cells having more than 3% Circuit switched voice
drop rate.
Circuit Switch Voice Quality:
All operators met the benchmark for the parameter Circuit Switch Voice Quality.
All the service providers were measuring this parameter as per the TRAI guidelines that have been
stated in parameter description section.
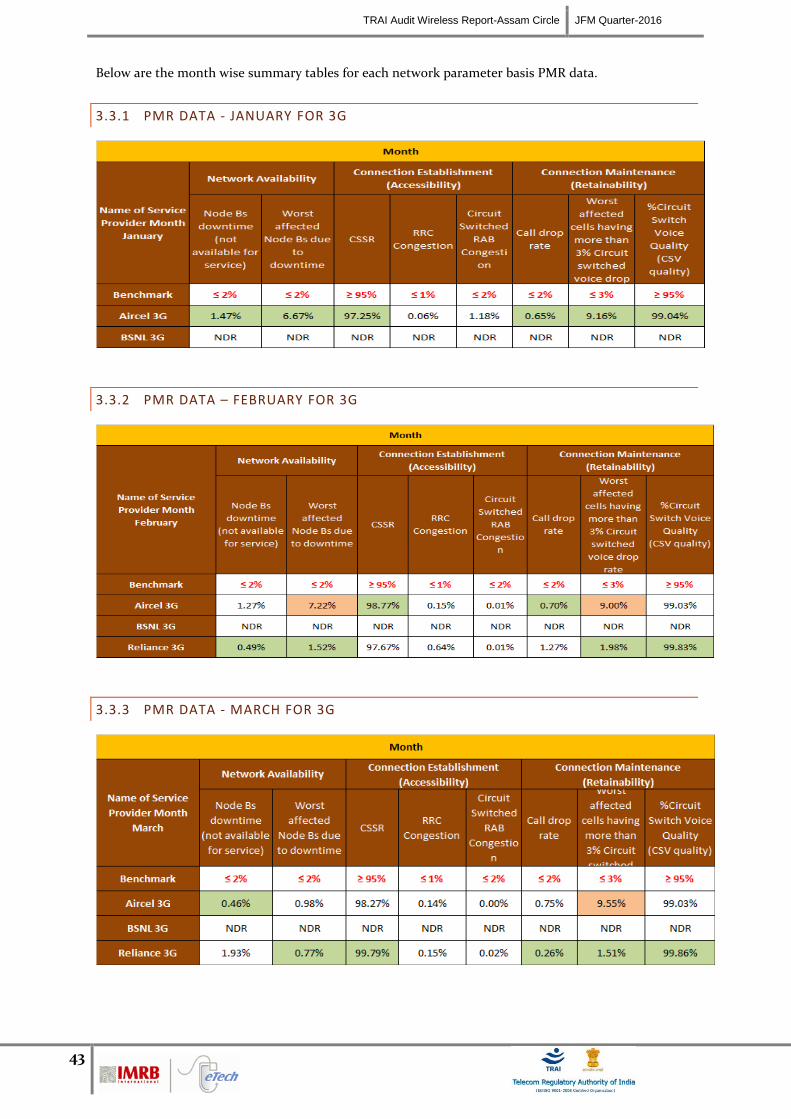
TRAI Audit Wireless Report-Assam Circle JFM Quarter-2016
43
Below are the month wise summary tables for each network parameter basis PMR data.
3.3.1 PMR DATA - JANUARY FOR 3G
3.3.2 PMR DATA – FEBRUARY FOR 3G
3.3.3 PMR DATA - MARCH FOR 3G
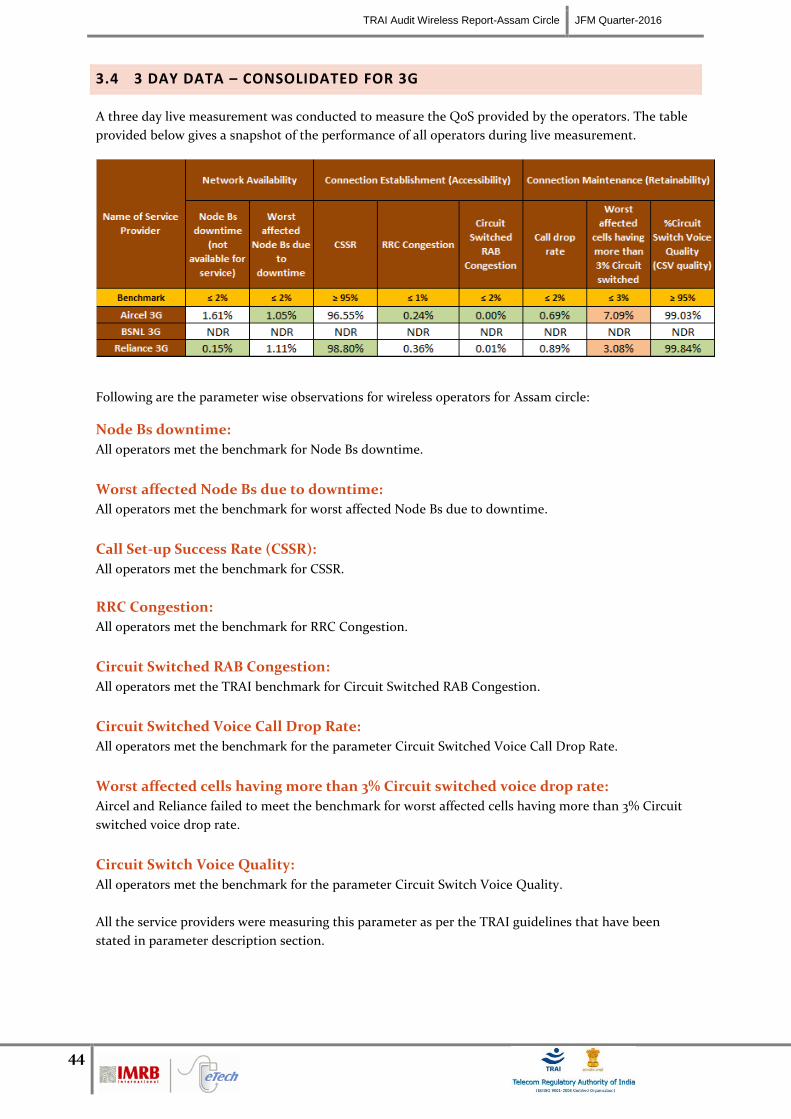
TRAI Audit Wireless Report-Assam Circle JFM Quarter-2016
44
3.4 3 DAY DATA – CONSOLIDATED FOR 3G
A three day live measurement was conducted to measure the QoS provided by the operators. The table
provided below gives a snapshot of the performance of all operators during live measurement.
Following are the parameter wise observations for wireless operators for Assam circle:
Node Bs downtime:
All operators met the benchmark for Node Bs downtime.
Worst affected Node Bs due to downtime:
All operators met the benchmark for worst affected Node Bs due to downtime.
Call Set-up Success Rate (CSSR):
All operators met the benchmark for CSSR.
RRC Congestion:
All operators met the benchmark for RRC Congestion.
Circuit Switched RAB Congestion:
All operators met the TRAI benchmark for Circuit Switched RAB Congestion.
Circuit Switched Voice Call Drop Rate:
All operators met the benchmark for the parameter Circuit Switched Voice Call Drop Rate.
Worst affected cells having more than 3% Circuit switched voice drop rate:
Aircel and Reliance failed to meet the benchmark for worst affected cells having more than 3% Circuit
switched voice drop rate.
Circuit Switch Voice Quality:
All operators met the benchmark for the parameter Circuit Switch Voice Quality.
All the service providers were measuring this parameter as per the TRAI guidelines that have been
stated in parameter description section.
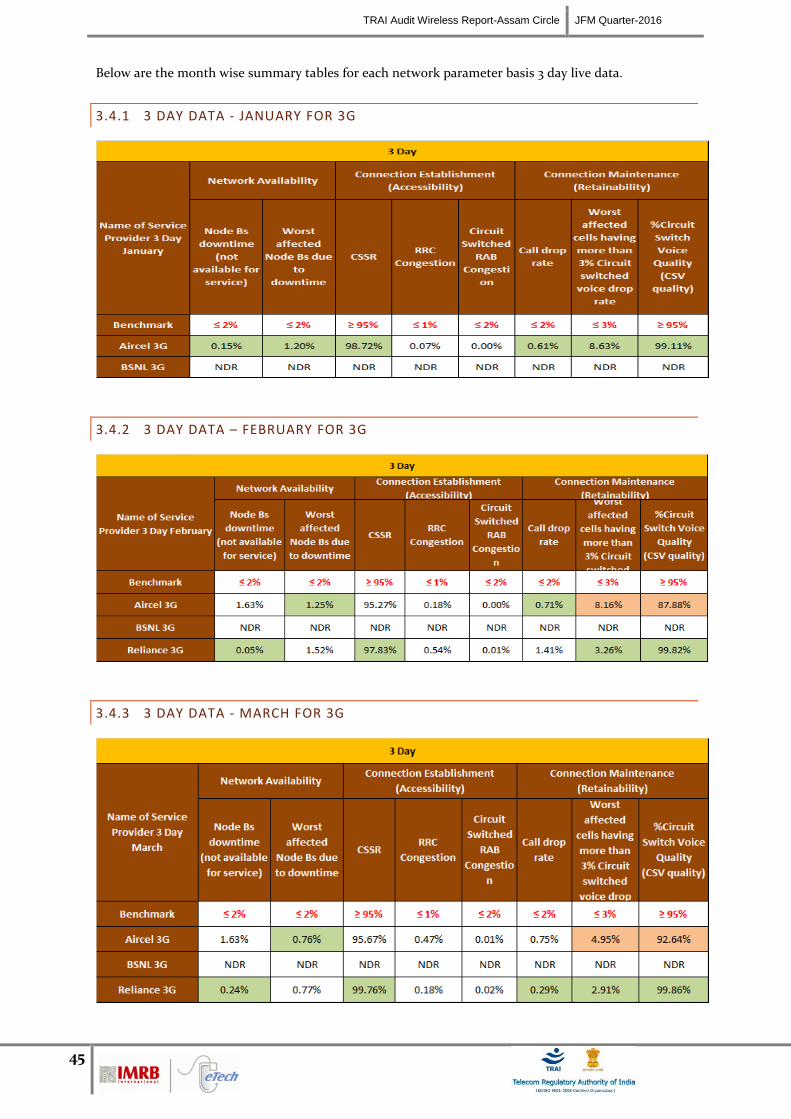
TRAI Audit Wireless Report-Assam Circle JFM Quarter-2016
45
Below are the month wise summary tables for each network parameter basis 3 day live data.
3.4.1 3 DAY DATA - JANUARY FOR 3G
3.4.2 3 DAY DATA – FEBRUARY FOR 3G
3.4.3 3 DAY DATA - MARCH FOR 3G
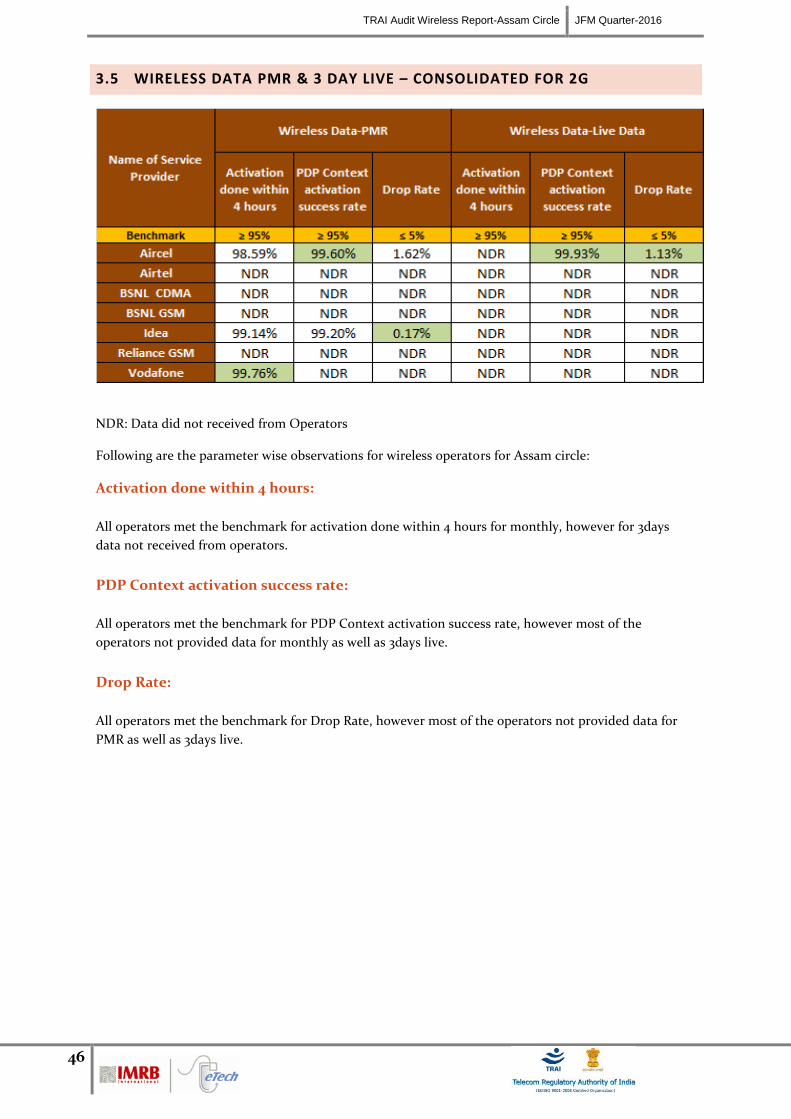
TRAI Audit Wireless Report-Assam Circle JFM Quarter-2016
46
3.5 WIRELESS DATA PMR & 3 DAY LIVE – CONSOLIDATED FOR 2G
NDR: Data did not received from Operators
Following are the parameter wise observations for wireless operators for Assam circle:
Activation done within 4 hours:
All operators met the benchmark for activation done within 4 hours for monthly, however for 3days
data not received from operators.
PDP Context activation success rate:
All operators met the benchmark for PDP Context activation success rate, however most of the
operators not provided data for monthly as well as 3days live.
Drop Rate:
All operators met the benchmark for Drop Rate, however most of the operators not provided data for
PMR as well as 3days live.
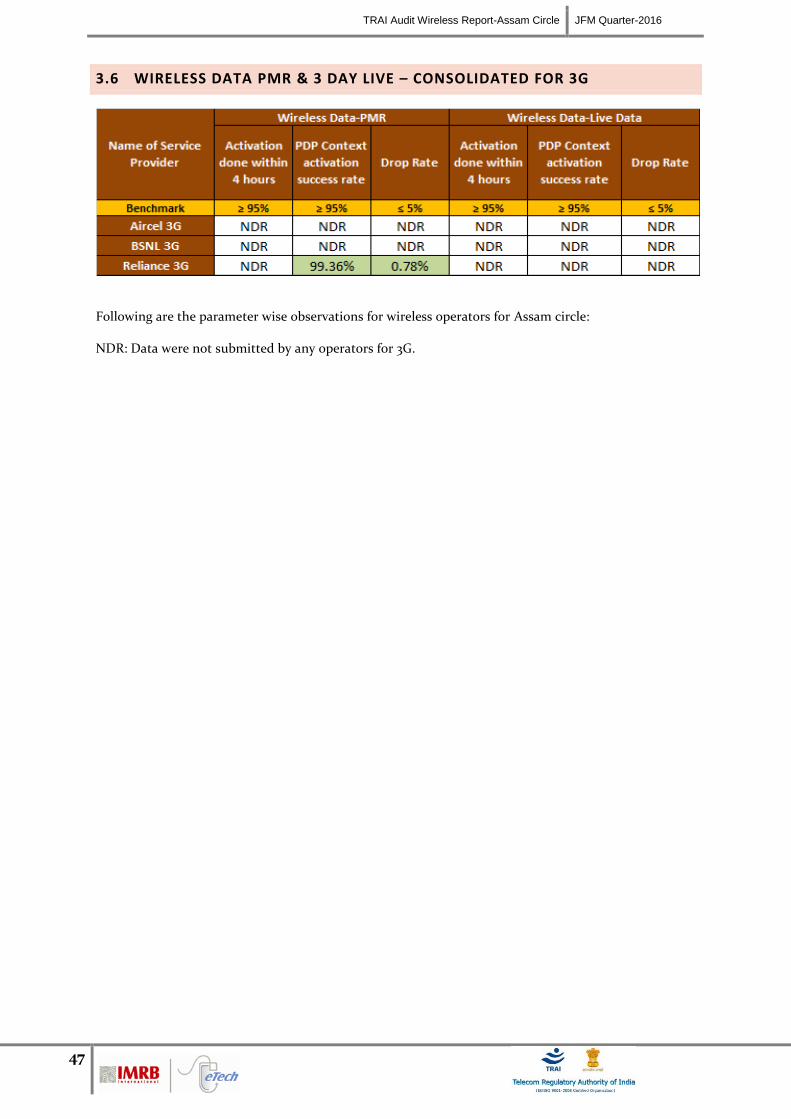
TRAI Audit Wireless Report-Assam Circle JFM Quarter-2016
47
3.6 WIRELESS DATA PMR & 3 DAY LIVE – CONSOLIDATED FOR 3G
Following are the parameter wise observations for wireless operators for Assam circle:
NDR: Data were not submitted by any operators for 3G.
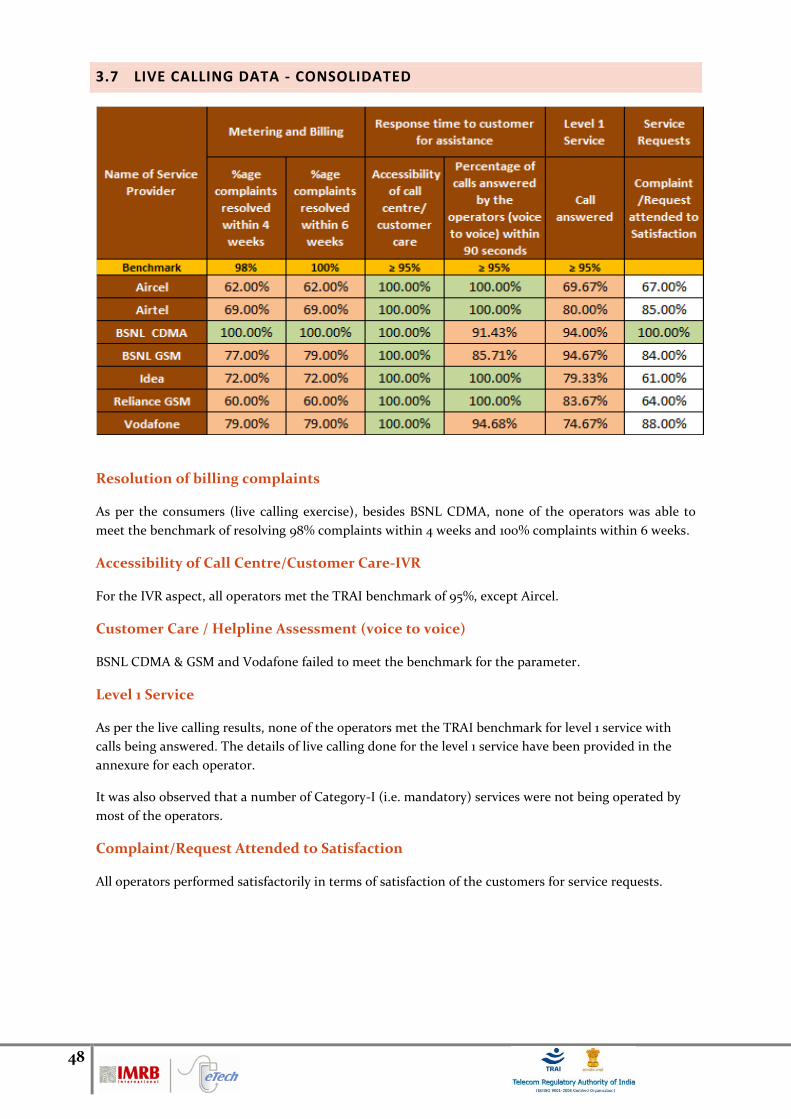
48
3.7 LIVE CALLING DATA - CONSOLIDATED
Resolution of billing complaints
As per the consumers (live calling exercise), besides BSNL CDMA, none of the operators was able to
meet the benchmark of resolving 98% complaints within 4 weeks and 100% complaints within 6 weeks.
Accessibility of Call Centre/Customer Care-IVR
For the IVR aspect, all operators met the TRAI benchmark of 95%, except Aircel.
Customer Care / Helpline Assessment (voice to voice)
BSNL CDMA & GSM and Vodafone failed to meet the benchmark for the parameter.
Level 1 Service
As per the live calling results, none of the operators met the TRAI benchmark for level 1 service with
calls being answered. The details of live calling done for the level 1 service have been provided in the
annexure for each operator.
It was also observed that a number of Category-I (i.e. mandatory) services were not being operated by
most of the operators.
Complaint/Request Attended to Satisfaction
All operators performed satisfactorily in terms of satisfaction of the customers for service requests.
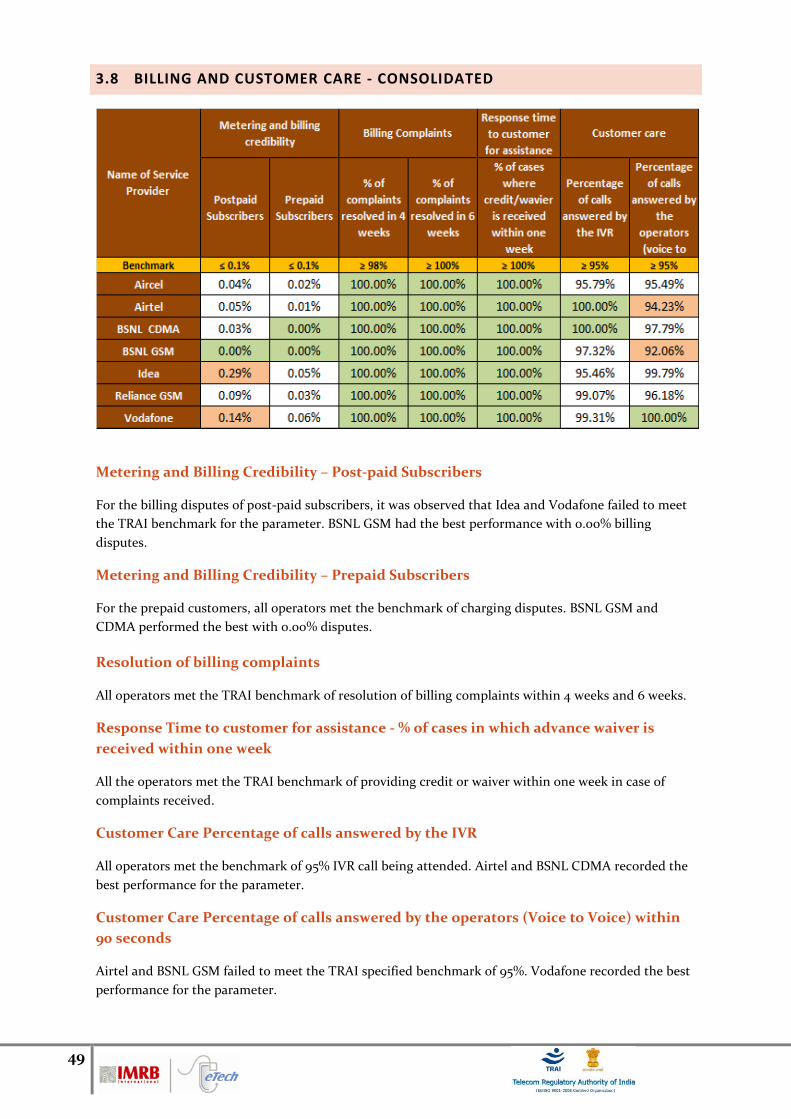
49
3.8 BILLING AND CUSTOMER CARE - CONSOLIDATED
Metering and Billing Credibility – Post-paid Subscribers
For the billing disputes of post-paid subscribers, it was observed that Idea and Vodafone failed to meet
the TRAI benchmark for the parameter. BSNL GSM had the best performance with 0.00% billing
disputes.
Metering and Billing Credibility – Prepaid Subscribers
For the prepaid customers, all operators met the benchmark of charging disputes. BSNL GSM and
CDMA performed the best with 0.00% disputes.
Resolution of billing complaints
All operators met the TRAI benchmark of resolution of billing complaints within 4 weeks and 6 weeks.
Response Time to customer for assistance - % of cases in which advance waiver is
received within one week
All the operators met the TRAI benchmark of providing credit or waiver within one week in case of
complaints received.
Customer Care Percentage of calls answered by the IVR
All operators met the benchmark of 95% IVR call being attended. Airtel and BSNL CDMA recorded the
best performance for the parameter.
Customer Care Percentage of calls answered by the operators (Voice to Voice) within
90 seconds
Airtel and BSNL GSM failed to meet the TRAI specified benchmark of 95%. Vodafone recorded the best
performance for the parameter.
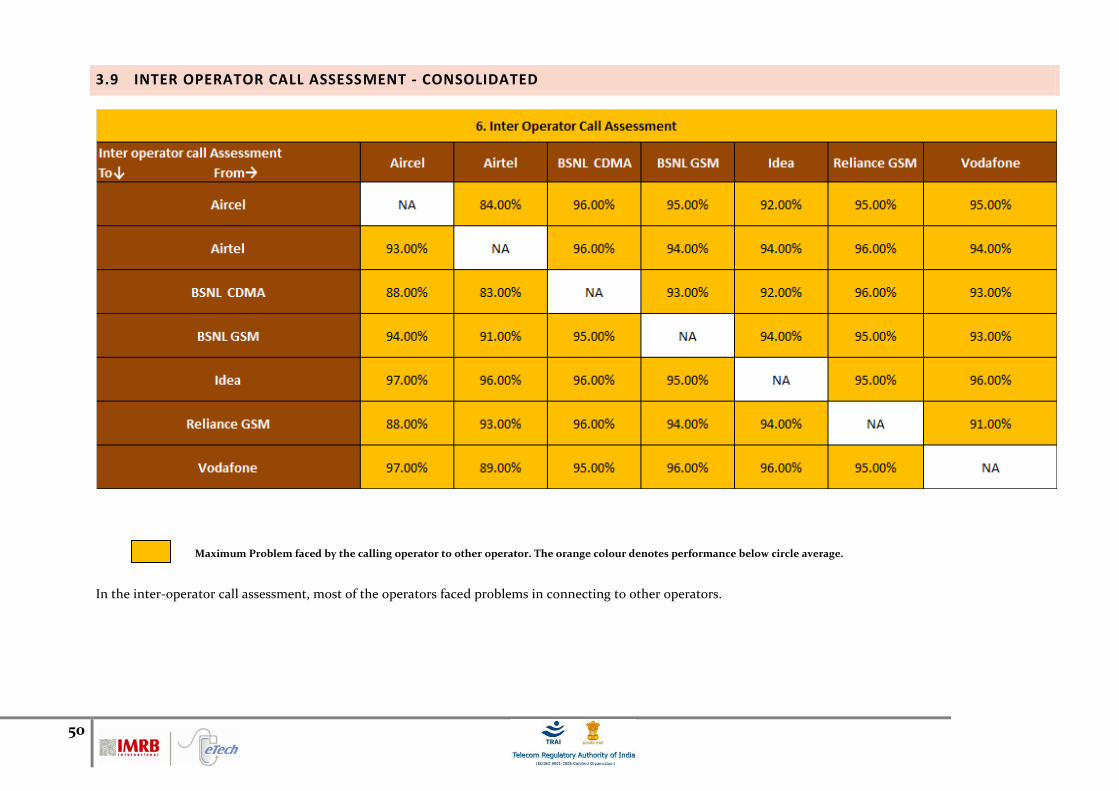
50
3.9 INTER OPERATOR CALL ASSESSMENT - CONSOLIDATED
In the inter-operator call assessment, most of the operators faced problems in connecting to other operators.
Maximum Problem faced by the calling operator to other operator. The orange colour denotes performance below circle average.
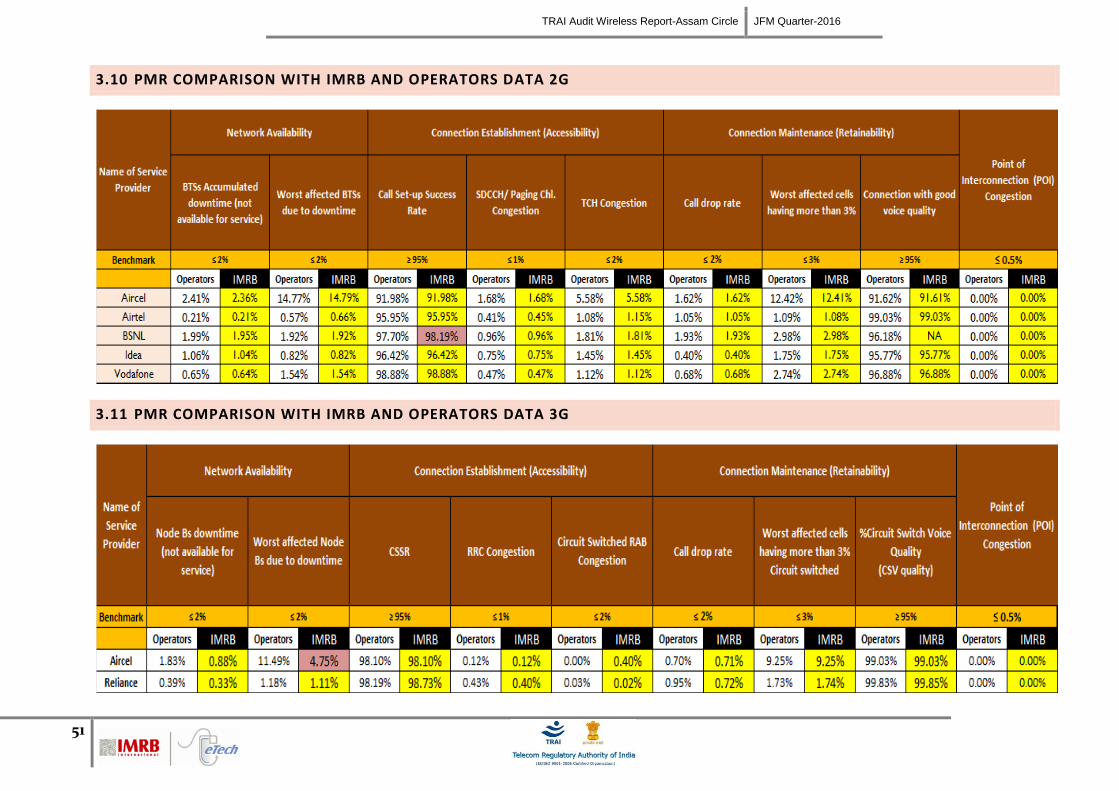
TRAI Audit Wireless Report-Assam Circle JFM Quarter-2016
51
3.10 PMR COMPARISON WITH IMRB AND OPERATORS DATA 2G
3.11 PMR COMPARISON WITH IMRB AND OPERATORS DATA 3G
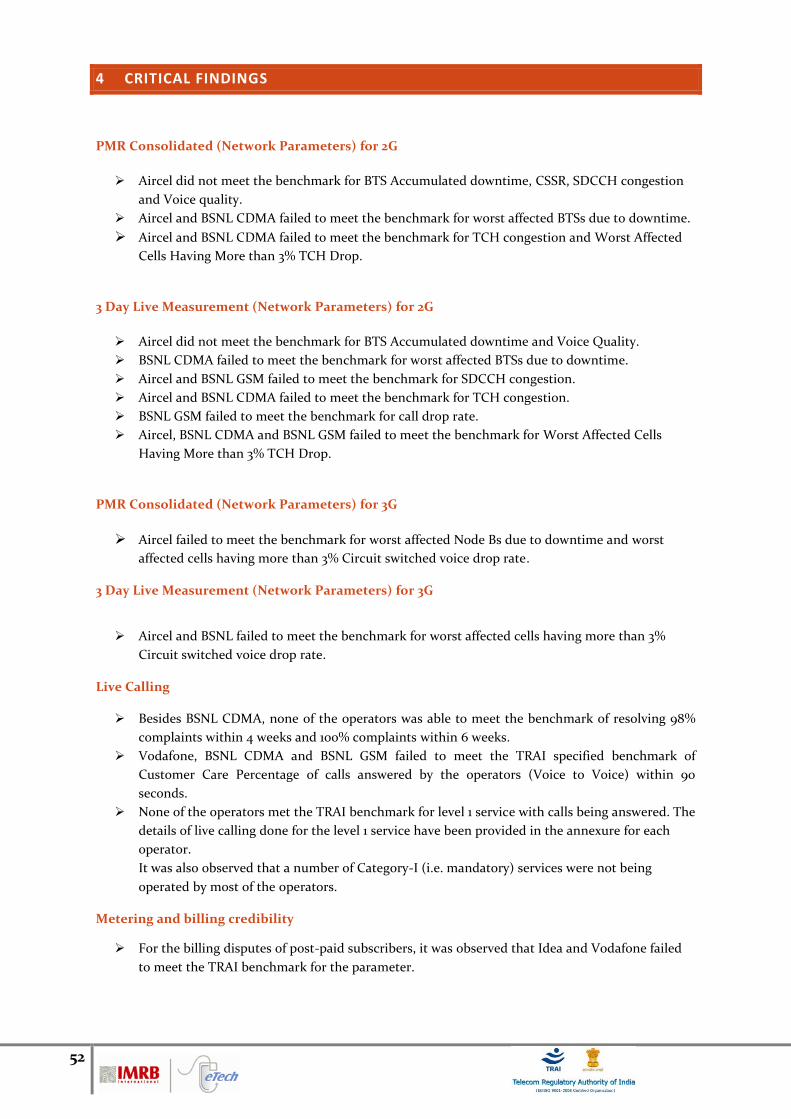
52
4 CRITICAL FINDINGS
PMR Consolidated (Network Parameters) for 2G
Aircel did not meet the benchmark for BTS Accumulated downtime, CSSR, SDCCH congestion
and Voice quality.
Aircel and BSNL CDMA failed to meet the benchmark for worst affected BTSs due to downtime.
Aircel and BSNL CDMA failed to meet the benchmark for TCH congestion and Worst Affected
Cells Having More than 3% TCH Drop.
3 Day Live Measurement (Network Parameters) for 2G
Aircel did not meet the benchmark for BTS Accumulated downtime and Voice Quality.
BSNL CDMA failed to meet the benchmark for worst affected BTSs due to downtime.
Aircel and BSNL GSM failed to meet the benchmark for SDCCH congestion.
Aircel and BSNL CDMA failed to meet the benchmark for TCH congestion.
BSNL GSM failed to meet the benchmark for call drop rate.
Aircel, BSNL CDMA and BSNL GSM failed to meet the benchmark for Worst Affected Cells
Having More than 3% TCH Drop.
PMR Consolidated (Network Parameters) for 3G
Aircel failed to meet the benchmark for worst affected Node Bs due to downtime and worst
affected cells having more than 3% Circuit switched voice drop rate.
3 Day Live Measurement (Network Parameters) for 3G
Aircel and BSNL failed to meet the benchmark for worst affected cells having more than 3%
Circuit switched voice drop rate.
Live Calling
Besides BSNL CDMA, none of the operators was able to meet the benchmark of resolving 98%
complaints within 4 weeks and 100% complaints within 6 weeks.
Vodafone, BSNL CDMA and BSNL GSM failed to meet the TRAI specified benchmark of
Customer Care Percentage of calls answered by the operators (Voice to Voice) within 90
seconds.
None of the operators met the TRAI benchmark for level 1 service with calls being answered. The
details of live calling done for the level 1 service have been provided in the annexure for each
operator.
It was also observed that a number of Category-I (i.e. mandatory) services were not being
operated by most of the operators.
Metering and billing credibility
For the billing disputes of post-paid subscribers, it was observed that Idea and Vodafone failed
to meet the TRAI benchmark for the parameter.
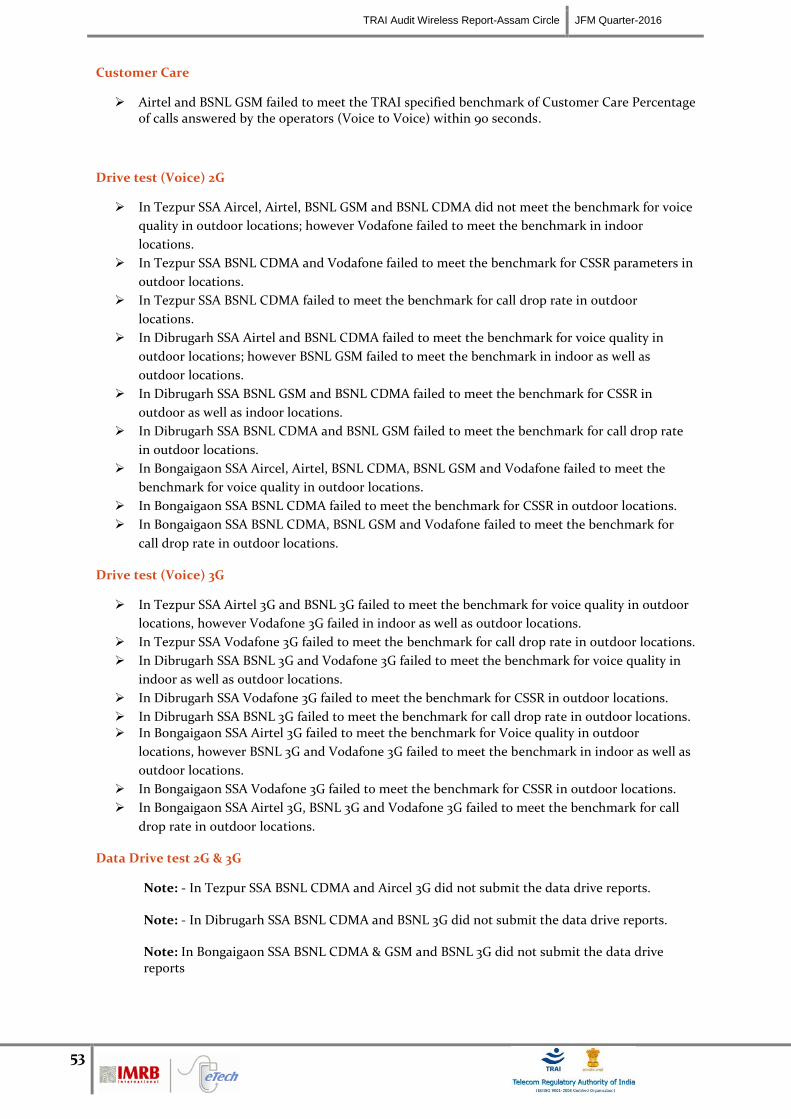
TRAI Audit Wireless Report-Assam Circle JFM Quarter-2016
53
Customer Care
Airtel and BSNL GSM failed to meet the TRAI specified benchmark of Customer Care Percentage of calls answered by the operators (Voice to Voice) within 90 seconds.
Drive test (Voice) 2G
In Tezpur SSA Aircel, Airtel, BSNL GSM and BSNL CDMA did not meet the benchmark for voice
quality in outdoor locations; however Vodafone failed to meet the benchmark in indoor
locations.
In Tezpur SSA BSNL CDMA and Vodafone failed to meet the benchmark for CSSR parameters in
outdoor locations.
In Tezpur SSA BSNL CDMA failed to meet the benchmark for call drop rate in outdoor
locations.
In Dibrugarh SSA Airtel and BSNL CDMA failed to meet the benchmark for voice quality in
outdoor locations; however BSNL GSM failed to meet the benchmark in indoor as well as
outdoor locations.
In Dibrugarh SSA BSNL GSM and BSNL CDMA failed to meet the benchmark for CSSR in
outdoor as well as indoor locations.
In Dibrugarh SSA BSNL CDMA and BSNL GSM failed to meet the benchmark for call drop rate
in outdoor locations.
In Bongaigaon SSA Aircel, Airtel, BSNL CDMA, BSNL GSM and Vodafone failed to meet the
benchmark for voice quality in outdoor locations.
In Bongaigaon SSA BSNL CDMA failed to meet the benchmark for CSSR in outdoor locations.
In Bongaigaon SSA BSNL CDMA, BSNL GSM and Vodafone failed to meet the benchmark for
call drop rate in outdoor locations.
Drive test (Voice) 3G
In Tezpur SSA Airtel 3G and BSNL 3G failed to meet the benchmark for voice quality in outdoor
locations, however Vodafone 3G failed in indoor as well as outdoor locations.
In Tezpur SSA Vodafone 3G failed to meet the benchmark for call drop rate in outdoor locations.
In Dibrugarh SSA BSNL 3G and Vodafone 3G failed to meet the benchmark for voice quality in
indoor as well as outdoor locations.
In Dibrugarh SSA Vodafone 3G failed to meet the benchmark for CSSR in outdoor locations.
In Dibrugarh SSA BSNL 3G failed to meet the benchmark for call drop rate in outdoor locations. In Bongaigaon SSA Airtel 3G failed to meet the benchmark for Voice quality in outdoor
locations, however BSNL 3G and Vodafone 3G failed to meet the benchmark in indoor as well as
outdoor locations.
In Bongaigaon SSA Vodafone 3G failed to meet the benchmark for CSSR in outdoor locations.
In Bongaigaon SSA Airtel 3G, BSNL 3G and Vodafone 3G failed to meet the benchmark for call
drop rate in outdoor locations.
Data Drive test 2G & 3G
Note: - In Tezpur SSA BSNL CDMA and Aircel 3G did not submit the data drive reports.
Note: - In Dibrugarh SSA BSNL CDMA and BSNL 3G did not submit the data drive reports.
Note: In Bongaigaon SSA BSNL CDMA & GSM and BSNL 3G did not submit the data drive reports
54
5 PARAMETER DESCRIPTION & DETAILED FINDINGS - COMPARISON BETWEEN PMR DATA, 3 DAY LIVE DATA AND LIVE CALLING
DATA FOR 2G
5.1 BTS ACCUMULATED DOWNTIME
5.1.1 PARAMETER DESCRIPTION
The parameter of network availability would be measured from following sub-parameters
1. BTSs Accumulated downtime (not available for service)
2. Worst affected BTSs due to downtime
1. Definition - BTSs (Base Transceiver Station) accumulated downtime (not available for service) shall basically measure the downtime of the BTSs,
including its transmission links/circuits during the period of a month, but excludes all planned service downtime for any maintenance or software up
gradation. For measuring the performance against the benchmark for this parameter the downtime of each BTS lasting more than 1 hour at a time in a day
during the period of a month were considered.
2. Computation Methodology –
BTS accumulated downtime (not available for service) = Sum of downtime of BTSs in a month in hours i.e. total outage time of all BTSs in hours
during a month / (24 x Number of days in a month x Number of BTSs in the network in licensed service area) x 100
3. TRAI Benchmark –
a. BTSs Accumulated downtime (not available for service) ≤ 2%
4. Audit Procedure –
The fault alarm details at the OMC (MSC) for the network outages (due to own network elements and infrastructure service provider end
outages) was audited
All the BTS in service area were considered. Planned outages due to network up gradation, routine maintenance were not considered.
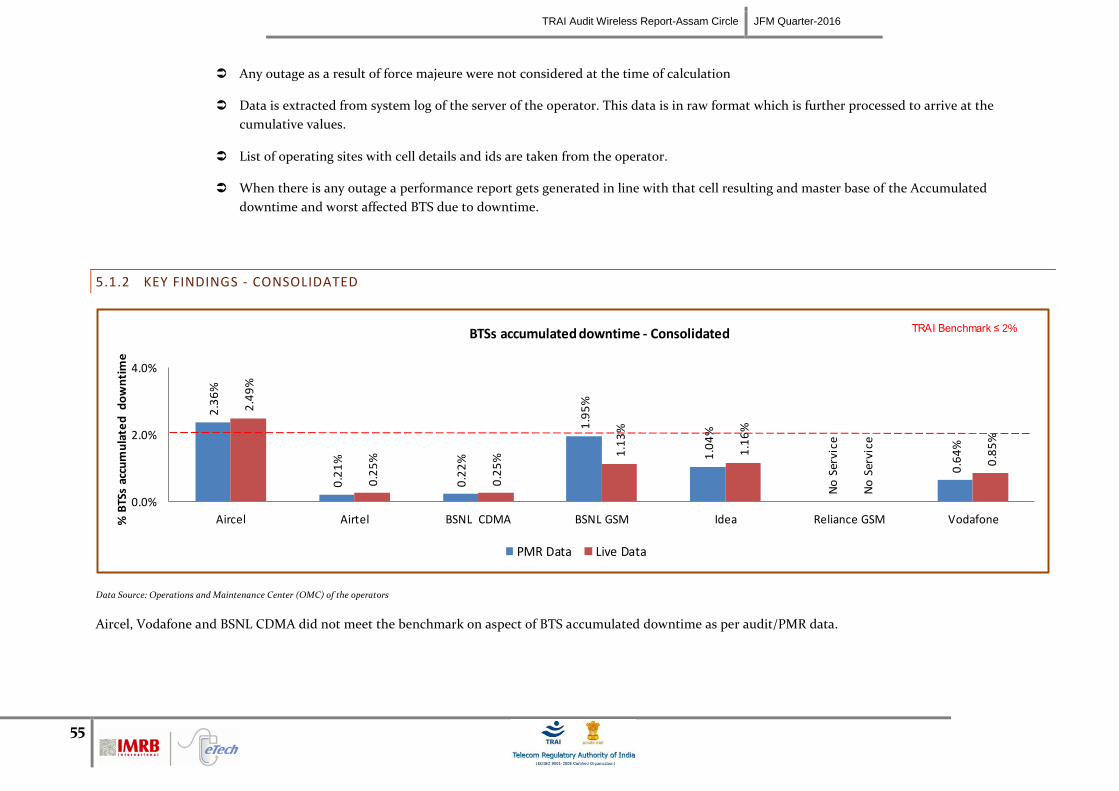
TRAI Audit Wireless Report-Assam Circle JFM Quarter-2016
55
Any outage as a result of force majeure were not considered at the time of calculation
Data is extracted from system log of the server of the operator. This data is in raw format which is further processed to arrive at the
cumulative values.
List of operating sites with cell details and ids are taken from the operator.
When there is any outage a performance report gets generated in line with that cell resulting and master base of the Accumulated
downtime and worst affected BTS due to downtime.
5.1.2 KEY FINDINGS - CONSOLIDATED
2.3
6%
0.2
1%
0.2
2%
1.9
5%
1.0
4%
No
Ser
vice
0.6
4%
2.4
9%
0.2
5%
0.2
5% 1
.13
%
1.1
6%
No
Ser
vice
0.8
5%
0.0%
2.0%
4.0%
Aircel Airtel BSNL CDMA BSNL GSM Idea Reliance GSM Vodafone% B
TSs
accu
mu
late
d d
ow
nti
me
BTSs accumulated downtime - Consolidated
PMR Data Live Data
TRAI Benchmark ≤ 2%
Data Source: Operations and Maintenance Center (OMC) of the operators
Aircel, Vodafone and BSNL CDMA did not meet the benchmark on aspect of BTS accumulated downtime as per audit/PMR data.
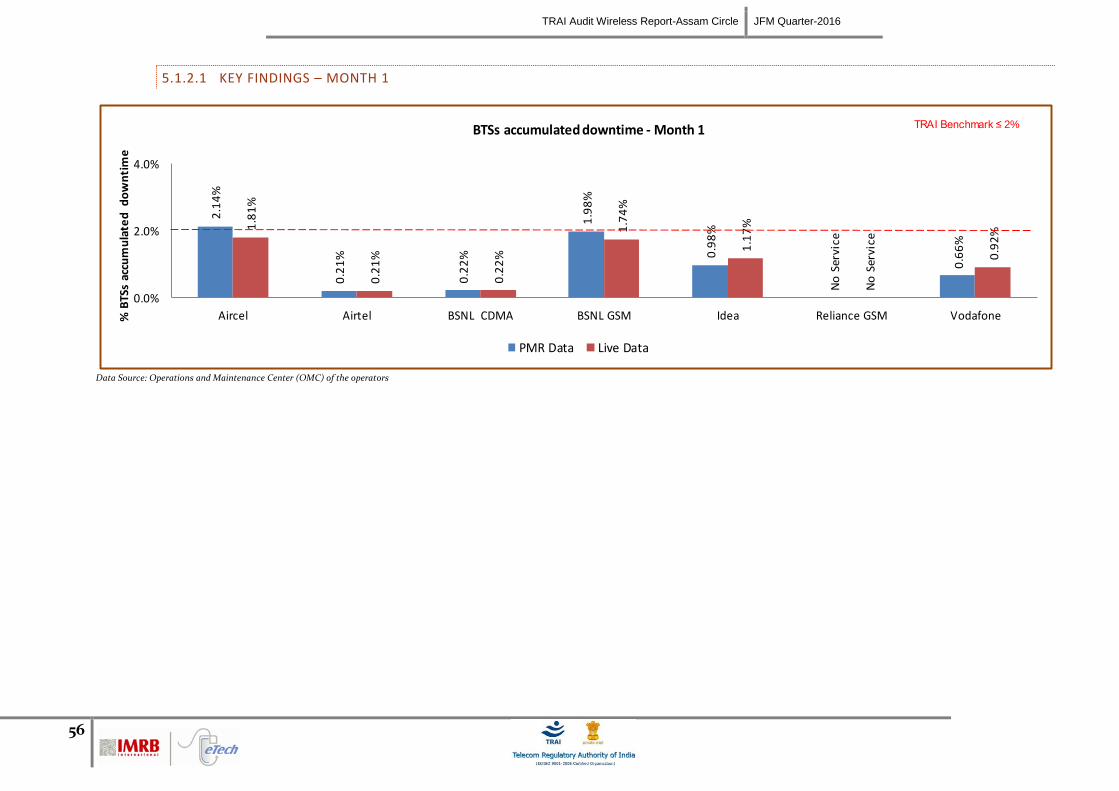
TRAI Audit Wireless Report-Assam Circle JFM Quarter-2016
56
5.1.2.1 KEY FINDINGS – MONTH 1
2.1
4%
0.2
1%
0.2
2%
1.9
8%
0.9
8%
No
Ser
vice
0.6
6%
1.8
1%
0.2
1%
0.2
2%
1.7
4%
1.1
7%
No
Ser
vice
0.9
2%
0.0%
2.0%
4.0%
Aircel Airtel BSNL CDMA BSNL GSM Idea Reliance GSM Vodafone% B
TSs
accu
mu
late
d d
ow
nti
me
BTSs accumulated downtime - Month 1
PMR Data Live Data
TRAI Benchmark ≤ 2%
Data Source: Operations and Maintenance Center (OMC) of the operators
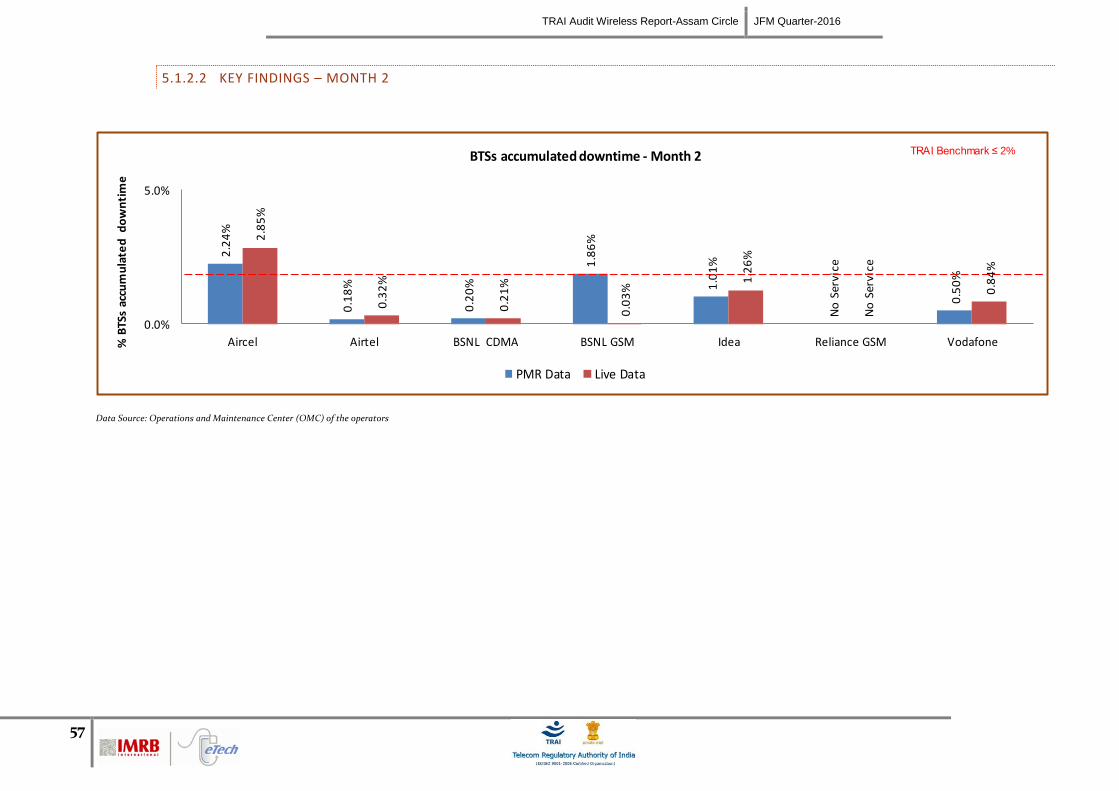
TRAI Audit Wireless Report-Assam Circle JFM Quarter-2016
57
5.1.2.2 KEY FINDINGS – MONTH 2
2.2
4%
0.1
8%
0.2
0%
1.8
6%
1.0
1%
No
Ser
vice
0.5
0%
2.8
5%
0.3
2%
0.2
1%
0.0
3%
1.2
6%
No
Ser
vice
0.8
4%
0.0%
5.0%
Aircel Airtel BSNL CDMA BSNL GSM Idea Reliance GSM Vodafone% B
TSs
accu
mu
late
d d
ow
nti
me
BTSs accumulated downtime - Month 2
PMR Data Live Data
TRAI Benchmark ≤ 2%
Data Source: Operations and Maintenance Center (OMC) of the operators
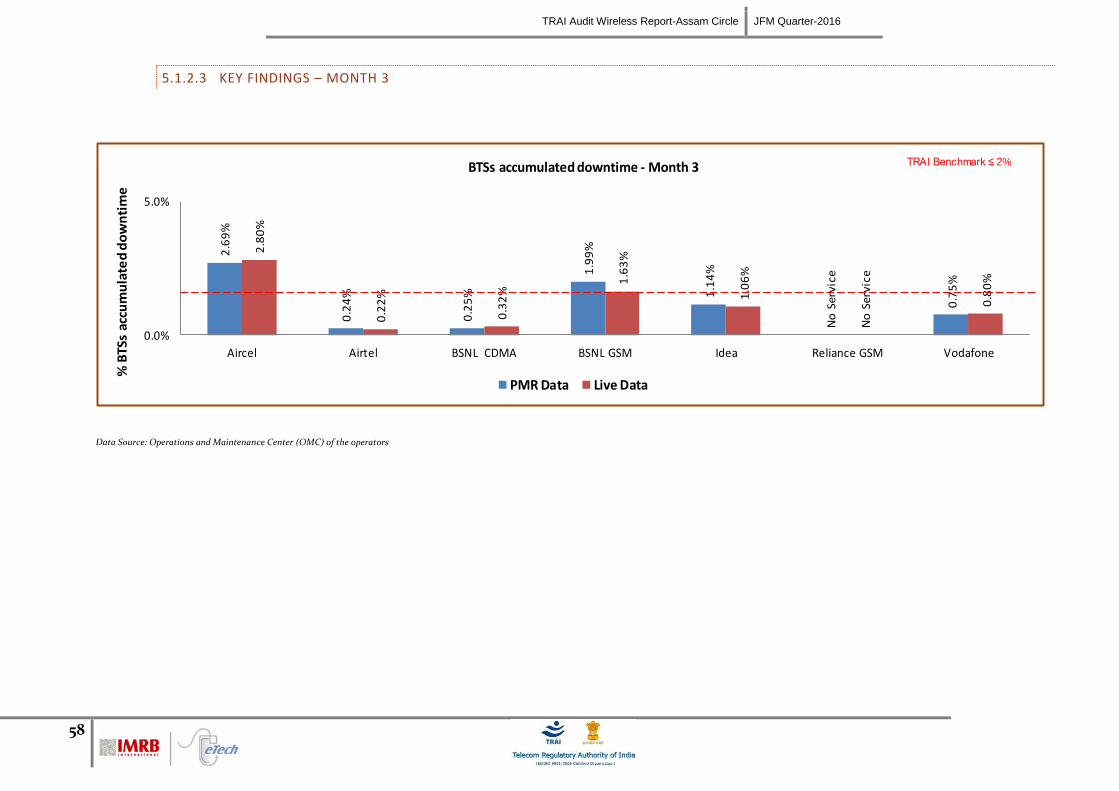
TRAI Audit Wireless Report-Assam Circle JFM Quarter-2016
58
5.1.2.3 KEY FINDINGS – MONTH 3
2.6
9%
0.2
4%
0.2
5%
1.9
9%
1.1
4%
No
Ser
vice
0.7
5%
2.8
0%
0.2
2%
0.3
2%
1.6
3%
1.0
6%
No
Ser
vice
0.8
0%
0.0%
5.0%
Aircel Airtel BSNL CDMA BSNL GSM Idea Reliance GSM Vodafone
% B
TSs
accu
mu
late
d d
ow
nti
me
BTSs accumulated downtime - Month 3
PMR Data Live Data
TRAI Benchmark ≤ 2%
Data Source: Operations and Maintenance Center (OMC) of the operators
TRAI Audit Wireless Report-Assam Circle JFM Quarter-2016
59
5.2 WORST AFFECTED BTS DUE TO DOWNTIME
5.2.1 PARAMETER DESCRIPTION
Definition – Worst Affected BTS due to downtime shall basically measure percentage of BTS having downtime greater than 24 hours in a month. Planned
outages were not considered as part while computing.
For measuring the parameter “Percentage of worst affected BTSs due to downtime" the downtime of each BTS lasting for more than 1 hour at a time in a day
during the period of a month was considered.
Computation Methodology –
Worst affected BTSs due to downtime = (Number of BTSs having accumulated downtime greater than 24 hours in a month / Number of BTS in
Licensed Service Area) * 100
TRAI Benchmark –
a. Worst affected BTSs due to downtime ≤ 2%
Audit Procedure –
i. The fault alarm details at the OMC (MSC) for the network outages (due to own network elements and infrastructure service provider end
outages) was audited
ii. All the BTS in service area were considered. Planned outages due to network up gradation, routine maintenance were not considered.
iii. Data is extracted from system log of the server of the operator. This data is in raw format which is further processed to arrive at the
cumulative values.
iv. Any outage as a result of force majeure was not considered at the time of calculation.
v. List of operating sites with cell details and ids are taken from the operator.
vi. All the BTS having down time greater than 24 hours is assessed and values of BTS accumulated downtime is computed in accordance.
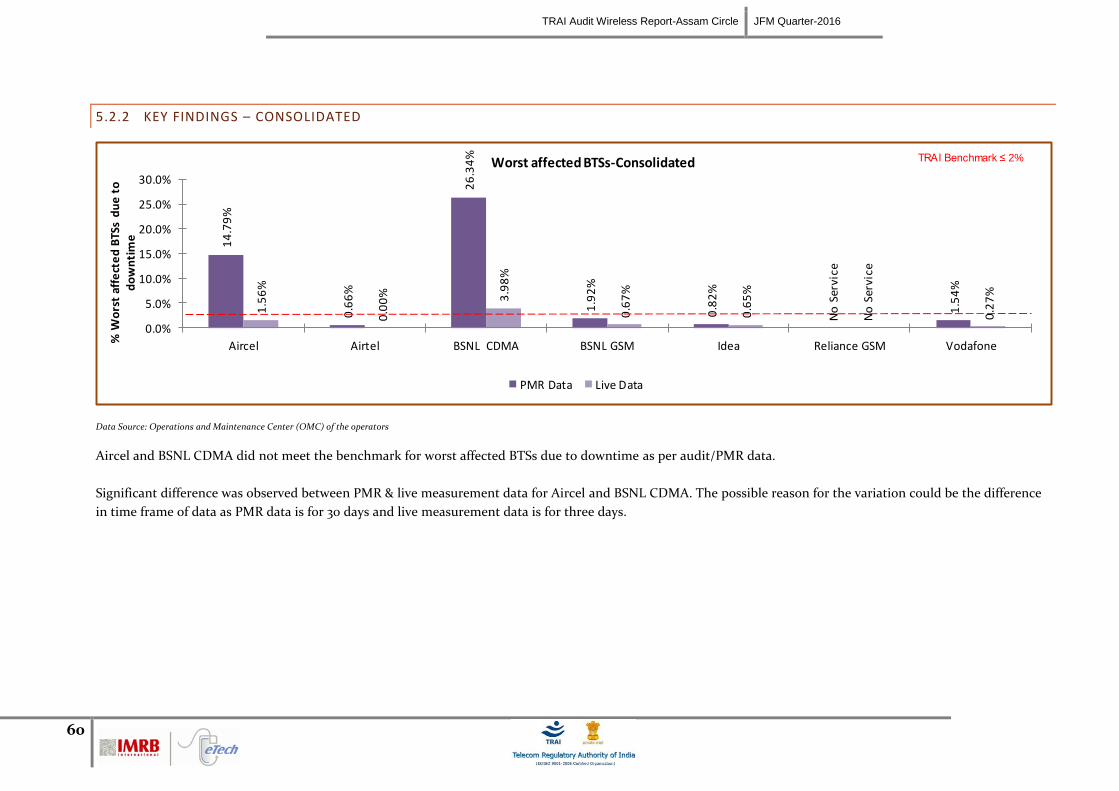
TRAI Audit Wireless Report-Assam Circle JFM Quarter-2016
60
5.2.2 KEY FINDINGS – CONSOLIDATED
14
.79
%
0.6
6%
26
.34
%
1.9
2%
0.8
2%
No
Ser
vice
1.5
4%
1.5
6%
0.0
0% 3.9
8%
0.6
7%
0.6
5%
No
Ser
vice
0.2
7%
0.0%
5.0%
10.0%
15.0%
20.0%
25.0%
30.0%
Aircel Airtel BSNL CDMA BSNL GSM Idea Reliance GSM Vodafone
% W
ors
t af
fect
ed
BTS
s d
ue
to
d
ow
nti
me
Worst affected BTSs-Consolidated
PMR Data Live Data
TRAI Benchmark ≤ 2%
Data Source: Operations and Maintenance Center (OMC) of the operators
Aircel and BSNL CDMA did not meet the benchmark for worst affected BTSs due to downtime as per audit/PMR data.
Significant difference was observed between PMR & live measurement data for Aircel and BSNL CDMA. The possible reason for the variation could be the difference
in time frame of data as PMR data is for 30 days and live measurement data is for three days.
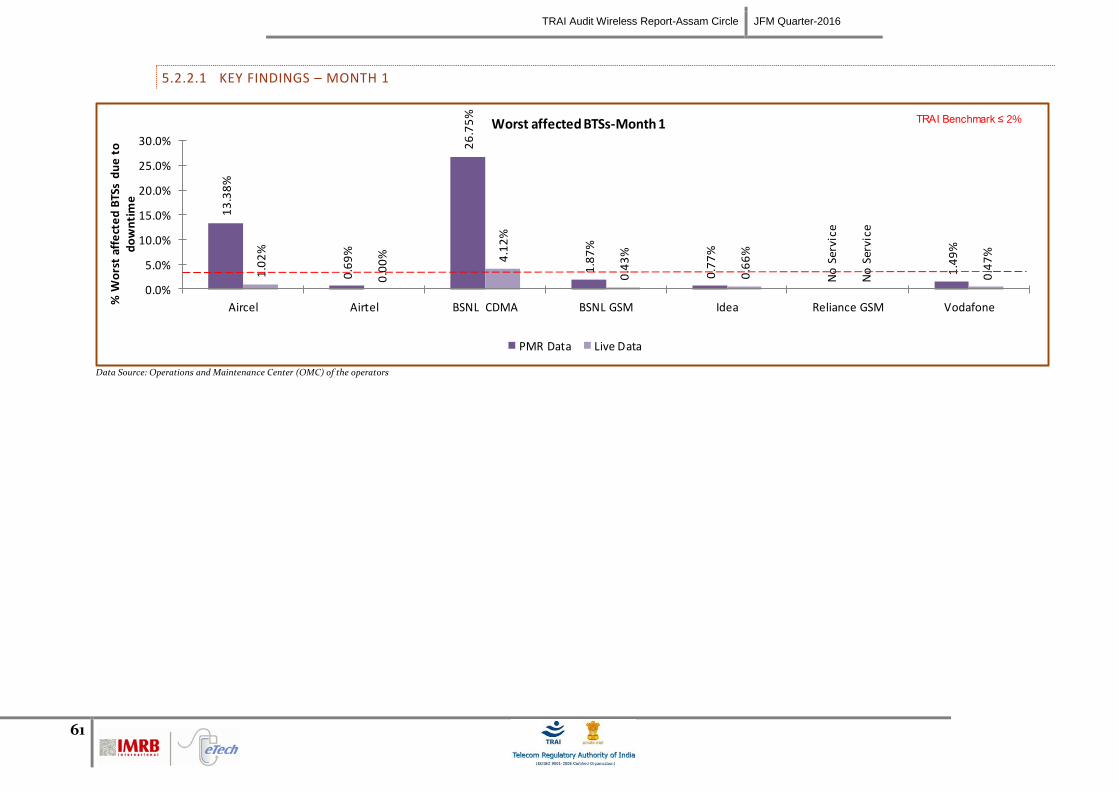
TRAI Audit Wireless Report-Assam Circle JFM Quarter-2016
61
5.2.2.1 KEY FINDINGS – MONTH 1
13
.38
%
0.6
9%
26
.75
%
1.8
7%
0.7
7%
No
Ser
vice
1.4
9%
1.0
2%
0.0
0% 4.1
2%
0.4
3%
0.6
6%
No
Ser
vice
0.4
7%
0.0%
5.0%
10.0%
15.0%
20.0%
25.0%
30.0%
Aircel Airtel BSNL CDMA BSNL GSM Idea Reliance GSM Vodafone
% W
ors
t af
fect
ed
BTS
s d
ue
to
d
ow
nti
me
Worst affected BTSs-Month 1
PMR Data Live Data
TRAI Benchmark ≤ 2%
Data Source: Operations and Maintenance Center (OMC) of the operators
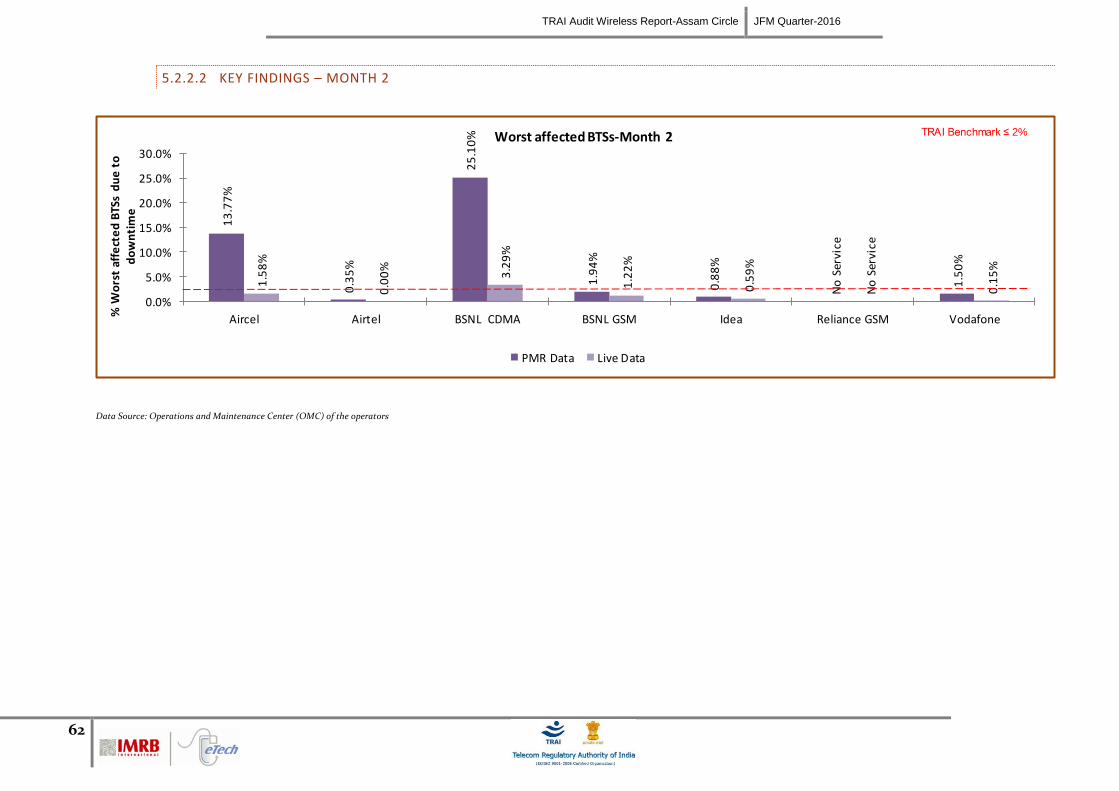
TRAI Audit Wireless Report-Assam Circle JFM Quarter-2016
62
5.2.2.2 KEY FINDINGS – MONTH 2
13
.77
%
0.3
5%
25
.10
%
1.9
4%
0.8
8%
No
Ser
vice
1.5
0%
1.5
8%
0.0
0%
3.2
9%
1.2
2%
0.5
9%
No
Ser
vice
0.1
5%
0.0%
5.0%
10.0%
15.0%
20.0%
25.0%
30.0%
Aircel Airtel BSNL CDMA BSNL GSM Idea Reliance GSM Vodafone
% W
ors
t af
fect
ed
BTS
s d
ue
to
d
ow
nti
me
Worst affected BTSs-Month 2
PMR Data Live Data
TRAI Benchmark ≤ 2%
Data Source: Operations and Maintenance Center (OMC) of the operators

TRAI Audit Wireless Report-Assam Circle JFM Quarter-2016
63
5.2.2.3 KEY FINDINGS – MONTH 3
17
.15
%
0.9
3%
27
.16
%
1.9
4%
0.8
0%
No
Ser
vice
1.6
3%
2.0
6%
0.0
0% 4.5
3%
0.3
6%
0.7
0%
No
Ser
vice
0.1
8%
0.0%
5.0%
10.0%
15.0%
20.0%
25.0%
30.0%
Aircel Airtel BSNL CDMA BSNL GSM Idea Reliance GSM Vodafone
% W
ors
t af
fect
ed
BTS
s d
ue
to
d
ow
nti
me
Worst affected BTSs-Month 3
PMR Data Live Data
TRAI Benchmark ≤ 2%
Data Source: Operations and Maintenance Center (OMC) of the operators
TRAI Audit Wireless Report-Assam Circle JFM Quarter-2016
64
5.3 CALL SET UP SUCCESS RATE
5.3.1 PARAMETER DESCRIPTION
1. Definition: The ratio of successful calls established to total calls is known as Call Set-Up Success Rate (CSSR).
2. Computation Methodology-
(Calls Established / Total Call Attempts) * 100
Call Established means the following events have happened in call setup:-
call attempt is made
the TCH is allocated
the call is routed to the outward path of the concerned MSC
3. TRAI Benchmark ≥ 95%
4. Audit Procedure –
The cell-wise data generated through counters/ MMC available in the switch for traffic measurements
CSSR calculation should be measured using OMC generated data only
Measurement should be only in Time Consistent Busy Hour (CBBH) period for all days of the week
Counter data is extracted from the NOC of the operators.
Total calls established include all calls established excluding Signaling blocking, TCH Drop and TCH blocking.
The numerator and denominator values are derived from adding the counter values from the MSC.
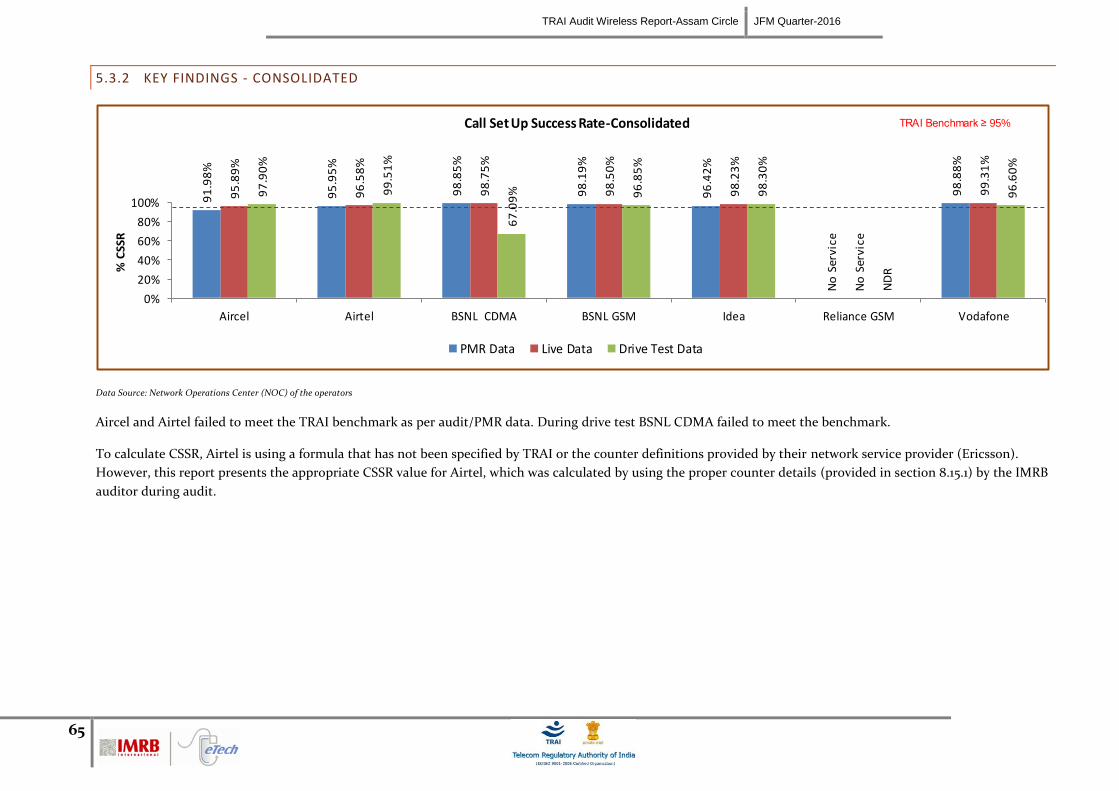
TRAI Audit Wireless Report-Assam Circle JFM Quarter-2016
65
5.3.2 KEY FINDINGS - CONSOLIDATED
91
.98
%
95
.95
%
98
.85
%
98
.19
%
96
.42
%
No
Ser
vice
98
.88
%
95
.89
%
96
.58
%
98
.75
%
98
.50
%
98
.23
%
No
Ser
vice
99
.31
%
97
.90
%
99
.51
%
67
.09
% 96
.85
%
98
.30
%
ND
R
96
.60
%
0%
20%
40%
60%
80%
100%
Aircel Airtel BSNL CDMA BSNL GSM Idea Reliance GSM Vodafone
% C
SSR
Call Set Up Success Rate-Consolidated
PMR Data Live Data Drive Test Data
TRAI Benchmark ≥ 95%
Data Source: Network Operations Center (NOC) of the operators
Aircel and Airtel failed to meet the TRAI benchmark as per audit/PMR data. During drive test BSNL CDMA failed to meet the benchmark.
To calculate CSSR, Airtel is using a formula that has not been specified by TRAI or the counter definitions provided by their network service provider (Ericsson).
However, this report presents the appropriate CSSR value for Airtel, which was calculated by using the proper counter details (provided in section 8.15.1) by the IMRB
auditor during audit.
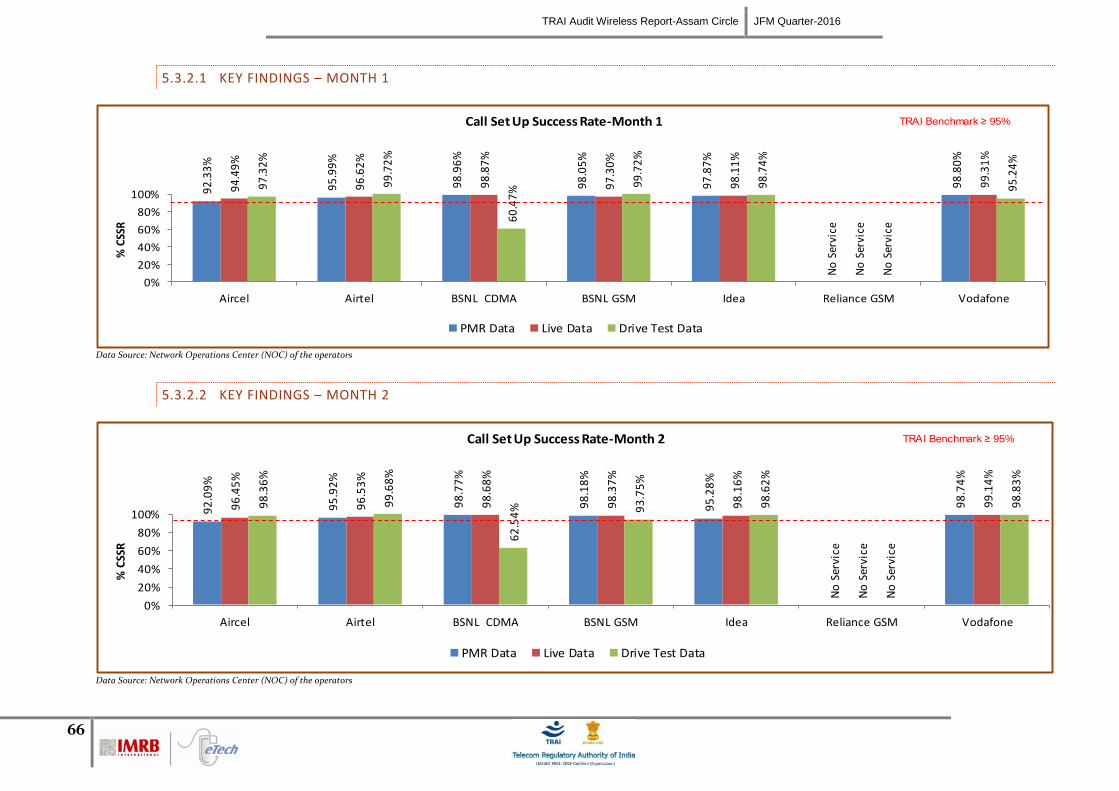
TRAI Audit Wireless Report-Assam Circle JFM Quarter-2016
66
5.3.2.1 KEY FINDINGS – MONTH 1
92
.33
%
95
.99
%
98
.96
%
98
.05
%
97
.87
%
No
Ser
vice
98
.80
%
94
.49
%
96
.62
%
98
.87
%
97
.30
%
98
.11
%
No
Ser
vice
99
.31
%
97
.32
%
99
.72
%
60
.47
% 99
.72
%
98
.74
%
No
Ser
vice
95
.24
%
0%
20%
40%
60%
80%
100%
Aircel Airtel BSNL CDMA BSNL GSM Idea Reliance GSM Vodafone
% C
SSR
Call Set Up Success Rate-Month 1
PMR Data Live Data Drive Test Data
TRAI Benchmark ≥ 95%
Data Source: Network Operations Center (NOC) of the operators
5.3.2.2 KEY FINDINGS – MONTH 2
92
.09
%
95
.92
%
98
.77
%
98
.18
%
95
.28
%
No
Ser
vice
98
.74
%
96
.45
%
96
.53
%
98
.68
%
98
.37
%
98
.16
%
No
Ser
vice
99
.14
%
98
.36
%
99
.68
%
62
.54
% 93
.75
%
98
.62
%
No
Ser
vice
98
.83
%
0%
20%
40%
60%
80%
100%
Aircel Airtel BSNL CDMA BSNL GSM Idea Reliance GSM Vodafone
% C
SSR
Call Set Up Success Rate-Month 2
PMR Data Live Data Drive Test Data
TRAI Benchmark ≥ 95%
Data Source: Network Operations Center (NOC) of the operators
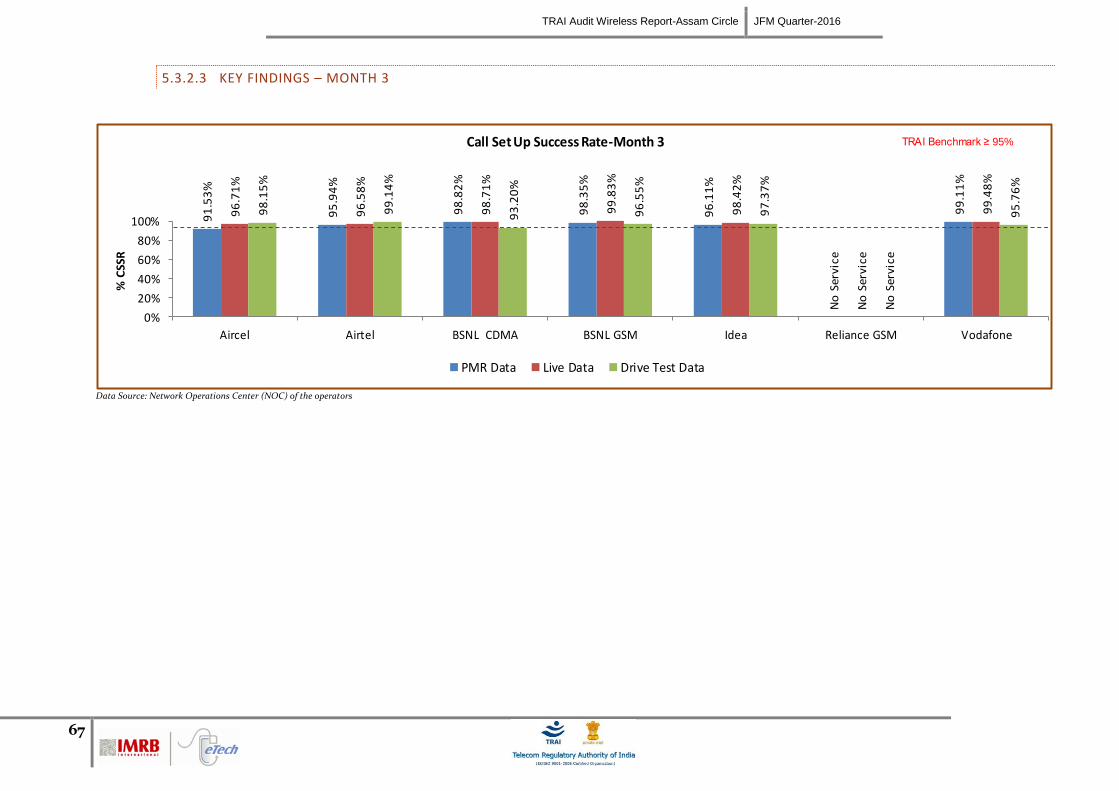
TRAI Audit Wireless Report-Assam Circle JFM Quarter-2016
67
5.3.2.3 KEY FINDINGS – MONTH 3
91
.53
%
95
.94
%
98
.82
%
98
.35
%
96
.11
%
No
Ser
vice
99
.11
%
96
.71
%
96
.58
%
98
.71
%
99
.83
%
98
.42
%
No
Ser
vice
99
.48
%
98
.15
%
99
.14
%
93
.20
%
96
.55
%
97
.37
%
No
Ser
vice
95
.76
%
0%
20%
40%
60%
80%
100%
Aircel Airtel BSNL CDMA BSNL GSM Idea Reliance GSM Vodafone
% C
SSR
Call Set Up Success Rate-Month 3
PMR Data Live Data Drive Test Data
TRAI Benchmark ≥ 95%
Data Source: Network Operations Center (NOC) of the operators
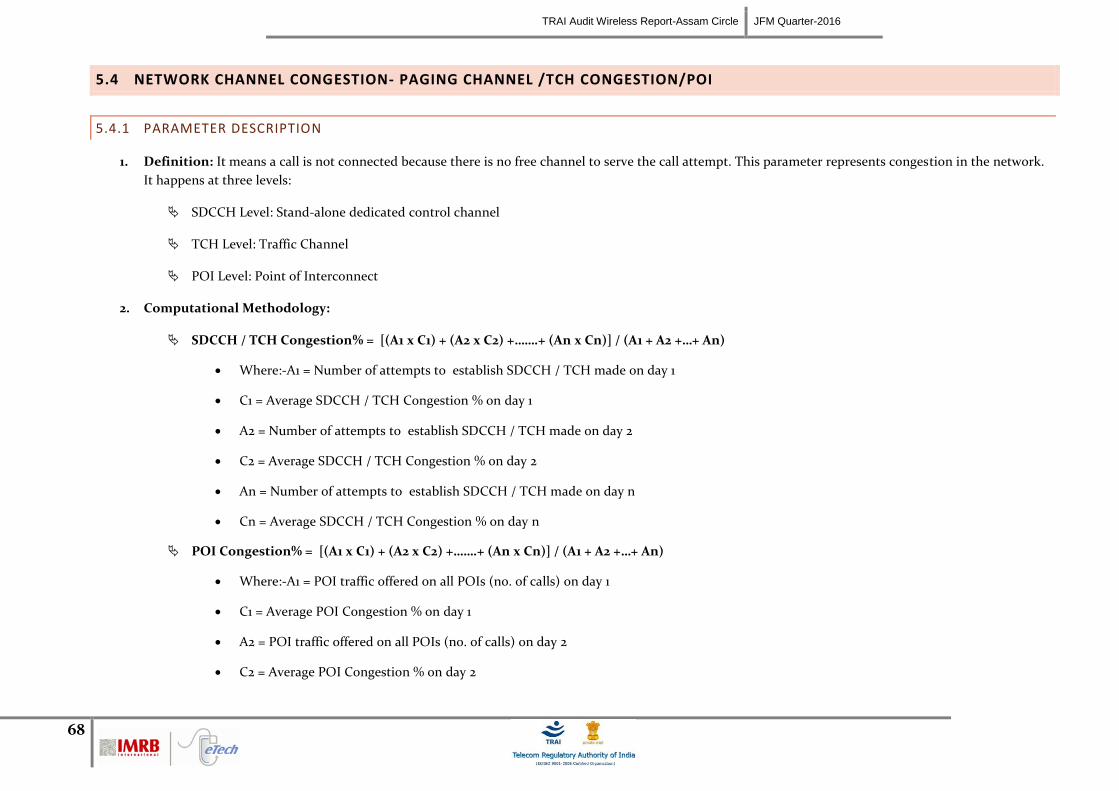
TRAI Audit Wireless Report-Assam Circle JFM Quarter-2016
68
5.4 NETWORK CHANNEL CONGESTION- PAGING CHANNEL /TCH CONGESTION/POI
5.4.1 PARAMETER DESCRIPTION
1. Definition: It means a call is not connected because there is no free channel to serve the call attempt. This parameter represents congestion in the network.
It happens at three levels:
SDCCH Level: Stand-alone dedicated control channel
TCH Level: Traffic Channel
POI Level: Point of Interconnect
2. Computational Methodology:
SDCCH / TCH Congestion% = [(A1 x C1) + (A2 x C2) +…….+ (An x Cn)] / (A1 + A2 +…+ An)
Where:-A1 = Number of attempts to establish SDCCH / TCH made on day 1
C1 = Average SDCCH / TCH Congestion % on day 1
A2 = Number of attempts to establish SDCCH / TCH made on day 2
C2 = Average SDCCH / TCH Congestion % on day 2
An = Number of attempts to establish SDCCH / TCH made on day n
Cn = Average SDCCH / TCH Congestion % on day n
POI Congestion% = [(A1 x C1) + (A2 x C2) +…….+ (An x Cn)] / (A1 + A2 +…+ An)
Where:-A1 = POI traffic offered on all POIs (no. of calls) on day 1
C1 = Average POI Congestion % on day 1
A2 = POI traffic offered on all POIs (no. of calls) on day 2
C2 = Average POI Congestion % on day 2
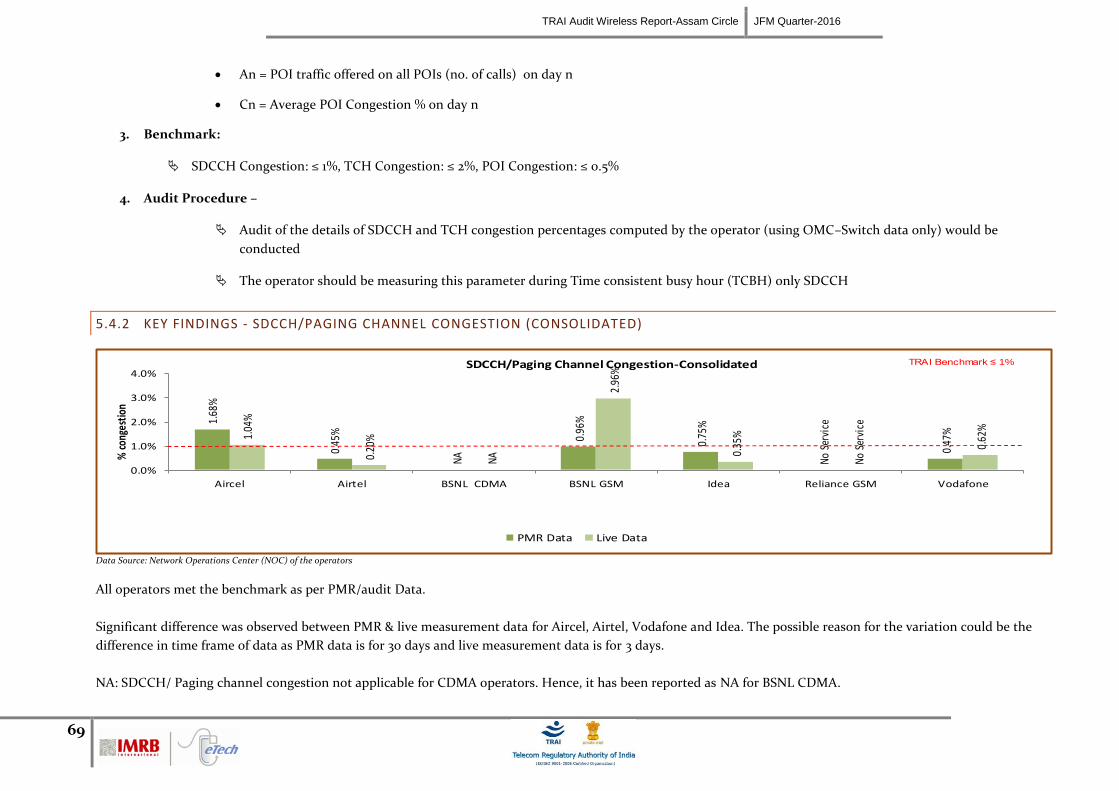
TRAI Audit Wireless Report-Assam Circle JFM Quarter-2016
69
An = POI traffic offered on all POIs (no. of calls) on day n
Cn = Average POI Congestion % on day n
3. Benchmark:
SDCCH Congestion: ≤ 1%, TCH Congestion: ≤ 2%, POI Congestion: ≤ 0.5%
4. Audit Procedure –
Audit of the details of SDCCH and TCH congestion percentages computed by the operator (using OMC–Switch data only) would be
conducted
The operator should be measuring this parameter during Time consistent busy hour (TCBH) only SDCCH
5.4.2 KEY FINDINGS - SDCCH/PAGING CHANNEL CONGESTION (CONSOLIDATED)
1.68
%
0.45
%
NA
0.96
%
0.75
%
No S
ervi
ce
0.47
%1.04
%
0.20
%
NA
2.96
%
0.35
%
No S
ervi
ce
0.62
%
0.0%
1.0%
2.0%
3.0%
4.0%
Aircel Airtel BSNL CDMA BSNL GSM Idea Reliance GSM Vodafone
% c
onge
stio
n
SDCCH/Paging Channel Congestion-Consolidated
PMR Data Live Data
TRAI Benchmark ≤ 1%
Data Source: Network Operations Center (NOC) of the operators
All operators met the benchmark as per PMR/audit Data.
Significant difference was observed between PMR & live measurement data for Aircel, Airtel, Vodafone and Idea. The possible reason for the variation could be the
difference in time frame of data as PMR data is for 30 days and live measurement data is for 3 days.
NA: SDCCH/ Paging channel congestion not applicable for CDMA operators. Hence, it has been reported as NA for BSNL CDMA.
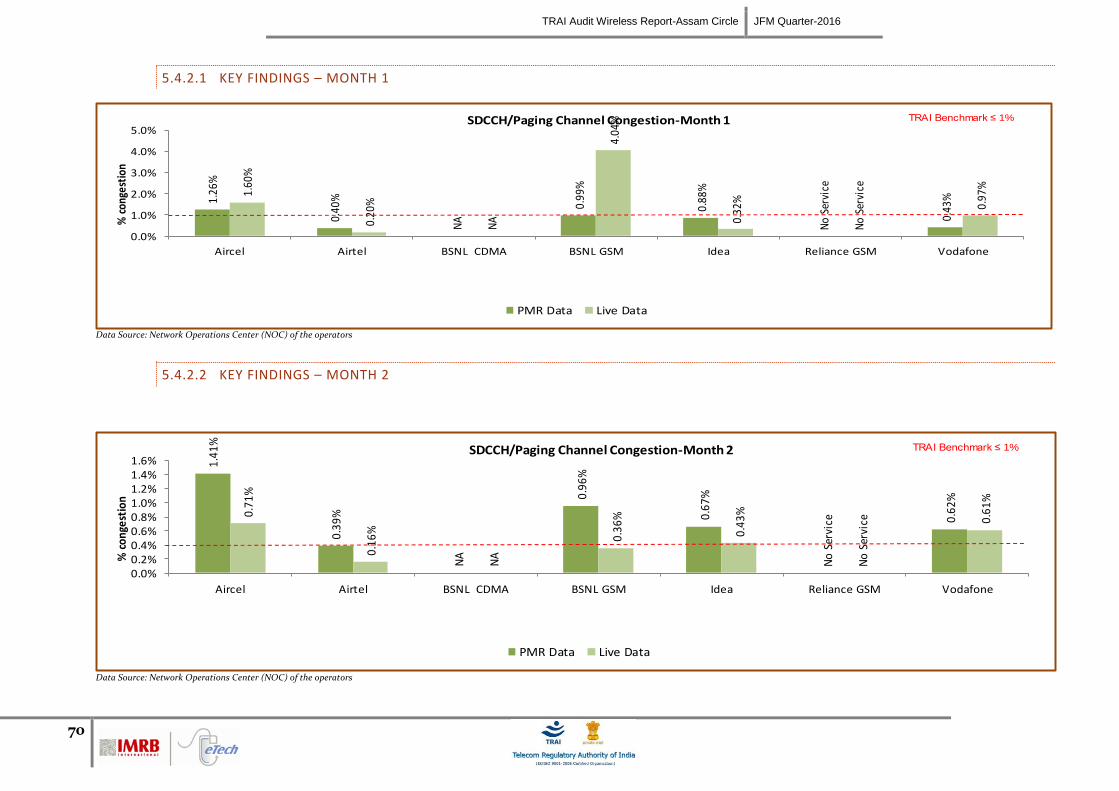
TRAI Audit Wireless Report-Assam Circle JFM Quarter-2016
70
5.4.2.1 KEY FINDINGS – MONTH 1
1.26
%
0.40
%
NA
0.99
%
0.88
%
No
Serv
ice
0.43
%1.60
%
0.20
%
NA
4.04
%
0.32
%
No
Serv
ice
0.97
%
0.0%
1.0%
2.0%
3.0%
4.0%
5.0%
Aircel Airtel BSNL CDMA BSNL GSM Idea Reliance GSM Vodafone
% c
onge
stio
n SDCCH/Paging Channel Congestion-Month 1
PMR Data Live Data
TRAI Benchmark ≤ 1%
Data Source: Network Operations Center (NOC) of the operators
5.4.2.2 KEY FINDINGS – MONTH 2
1.41
%
0.39
%
NA
0.96
%
0.67
%
No
Serv
ice 0.
62%
0.71
%
0.16
%
NA
0.36
%
0.43
%
No
Serv
ice 0.
61%
0.0%0.2%0.4%0.6%0.8%1.0%1.2%1.4%1.6%
Aircel Airtel BSNL CDMA BSNL GSM Idea Reliance GSM Vodafone
% c
onge
stio
n
SDCCH/Paging Channel Congestion-Month 2
PMR Data Live Data
TRAI Benchmark ≤ 1%
Data Source: Network Operations Center (NOC) of the operators
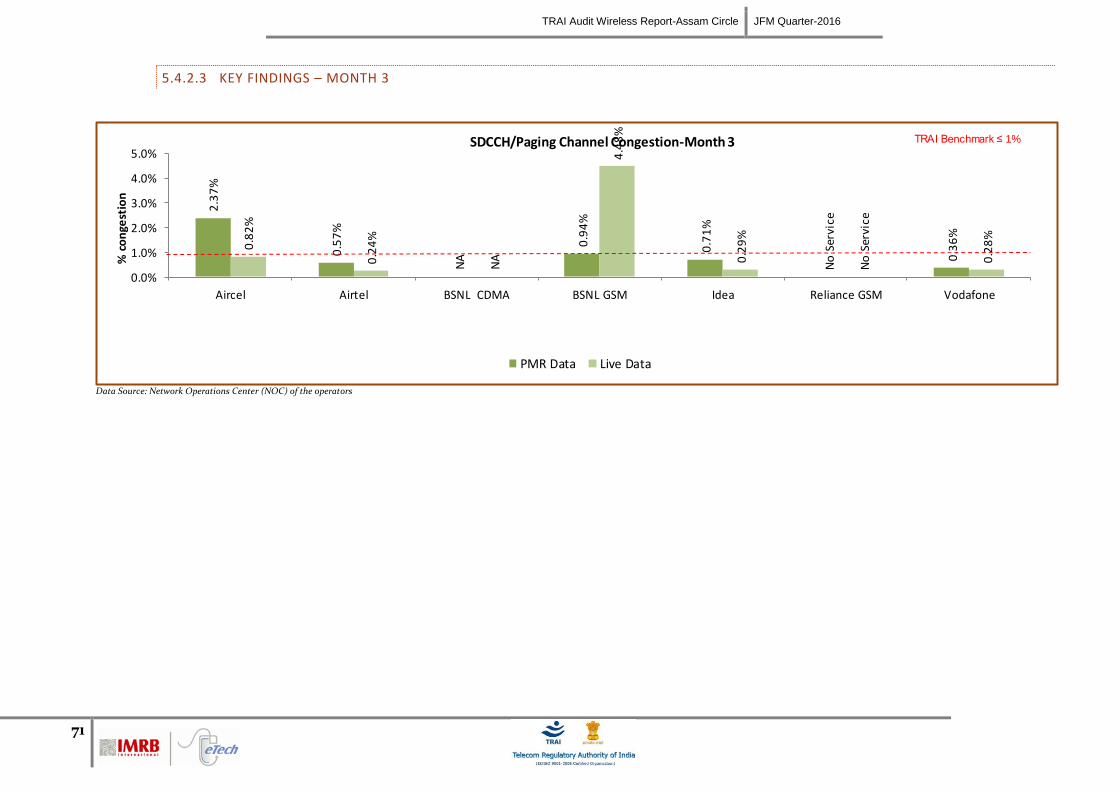
TRAI Audit Wireless Report-Assam Circle JFM Quarter-2016
71
5.4.2.3 KEY FINDINGS – MONTH 3
2.3
7%
0.5
7%
NA
0.9
4%
0.7
1%
No
Ser
vice
0.3
6%
0.8
2%
0.2
4%
NA
4.4
8%
0.2
9%
No
Ser
vice
0.2
8%
0.0%
1.0%
2.0%
3.0%
4.0%
5.0%
Aircel Airtel BSNL CDMA BSNL GSM Idea Reliance GSM Vodafone
% c
on
gest
ion
SDCCH/Paging Channel Congestion-Month 3
PMR Data Live Data
TRAI Benchmark ≤ 1%
Data Source: Network Operations Center (NOC) of the operators
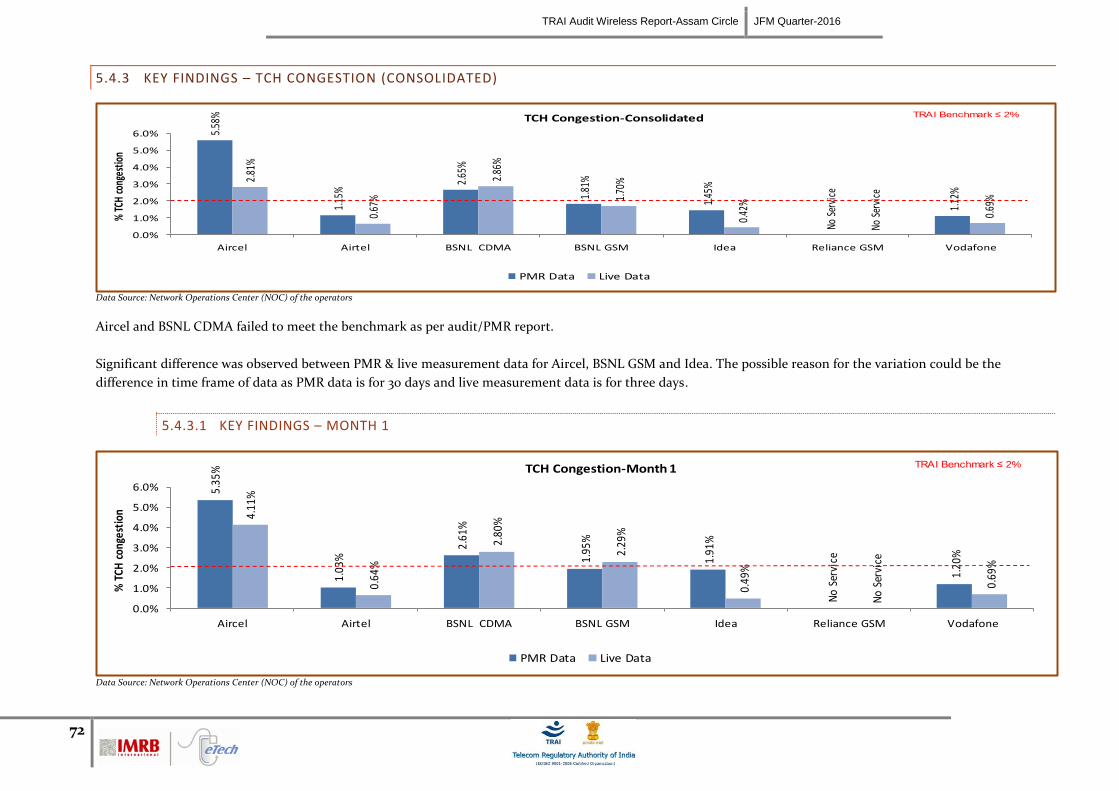
TRAI Audit Wireless Report-Assam Circle JFM Quarter-2016
72
5.4.3 KEY FINDINGS – TCH CONGESTION (CONSOLIDATED)
5.58
%
1.15
%
2.65
%
1.81
%
1.45
%
No S
ervi
ce
1.12
%
2.81
%
0.67
%
2.86
%
1.70
%
0.42
%
No S
ervi
ce
0.69
%
0.0%
1.0%
2.0%
3.0%
4.0%
5.0%
6.0%
Aircel Airtel BSNL CDMA BSNL GSM Idea Reliance GSM Vodafone
% T
CH c
onge
stio
n TCH Congestion-Consolidated
PMR Data Live Data
TRAI Benchmark ≤ 2%
Data Source: Network Operations Center (NOC) of the operators
Aircel and BSNL CDMA failed to meet the benchmark as per audit/PMR report.
Significant difference was observed between PMR & live measurement data for Aircel, BSNL GSM and Idea. The possible reason for the variation could be the
difference in time frame of data as PMR data is for 30 days and live measurement data is for three days.
5.4.3.1 KEY FINDINGS – MONTH 1
5.35
%
1.03
%
2.61
%
1.95
%
1.91
%
No
Serv
ice
1.20
%
4.11
%
0.64
%
2.80
%
2.29
%
0.49
%
No
Serv
ice
0.69
%
0.0%
1.0%
2.0%
3.0%
4.0%
5.0%
6.0%
Aircel Airtel BSNL CDMA BSNL GSM Idea Reliance GSM Vodafone
% T
CH c
onge
stio
n
TCH Congestion-Month 1
PMR Data Live Data
TRAI Benchmark ≤ 2%
Data Source: Network Operations Center (NOC) of the operators
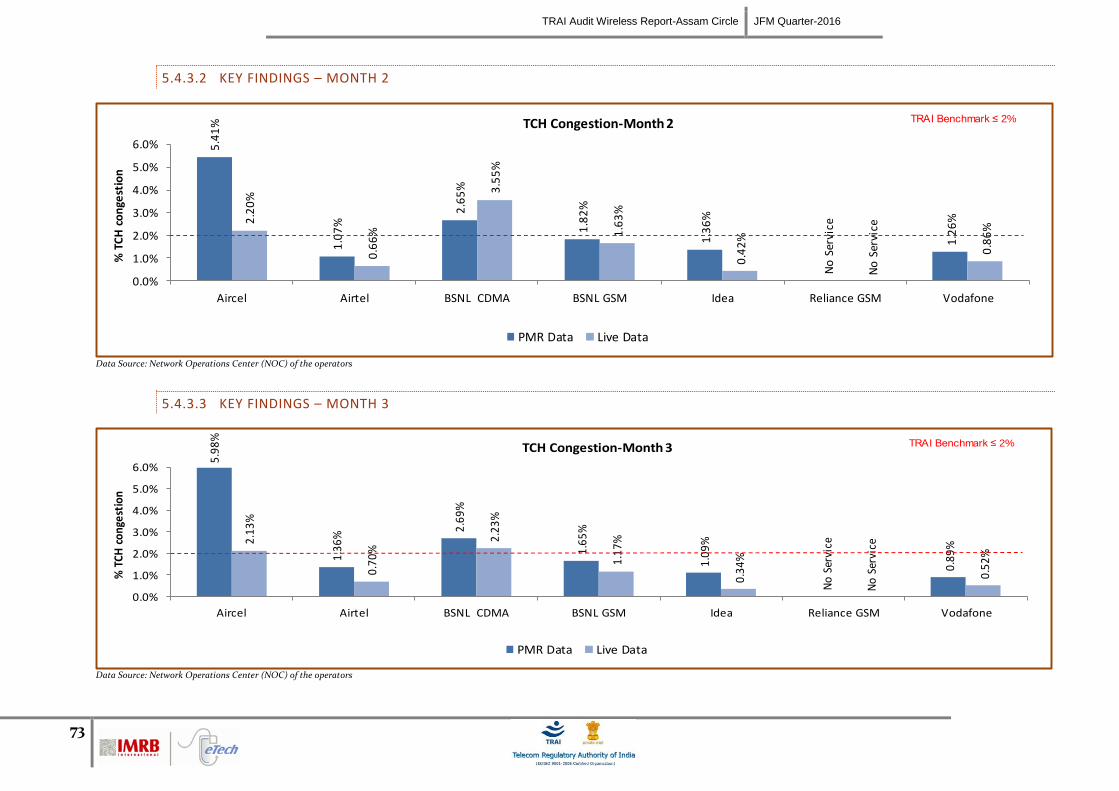
TRAI Audit Wireless Report-Assam Circle JFM Quarter-2016
73
5.4.3.2 KEY FINDINGS – MONTH 2
5.4
1%
1.0
7%
2.6
5%
1.8
2%
1.3
6%
No
Ser
vice
1.2
6%2.2
0%
0.6
6%
3.5
5%
1.6
3%
0.4
2%
No
Ser
vice
0.8
6%
0.0%
1.0%
2.0%
3.0%
4.0%
5.0%
6.0%
Aircel Airtel BSNL CDMA BSNL GSM Idea Reliance GSM Vodafone
% T
CH
co
nge
stio
n
TCH Congestion-Month 2
PMR Data Live Data
TRAI Benchmark ≤ 2%
Data Source: Network Operations Center (NOC) of the operators
5.4.3.3 KEY FINDINGS – MONTH 3
5.9
8%
1.3
6%
2.6
9%
1.6
5%
1.0
9%
No
Ser
vice
0.8
9%2
.13
%
0.7
0%
2.2
3%
1.1
7%
0.3
4%
No
Ser
vice
0.5
2%
0.0%
1.0%
2.0%
3.0%
4.0%
5.0%
6.0%
Aircel Airtel BSNL CDMA BSNL GSM Idea Reliance GSM Vodafone
% T
CH
co
nge
stio
n
TCH Congestion-Month 3
PMR Data Live Data
TRAI Benchmark ≤ 2%
Data Source: Network Operations Center (NOC) of the operators
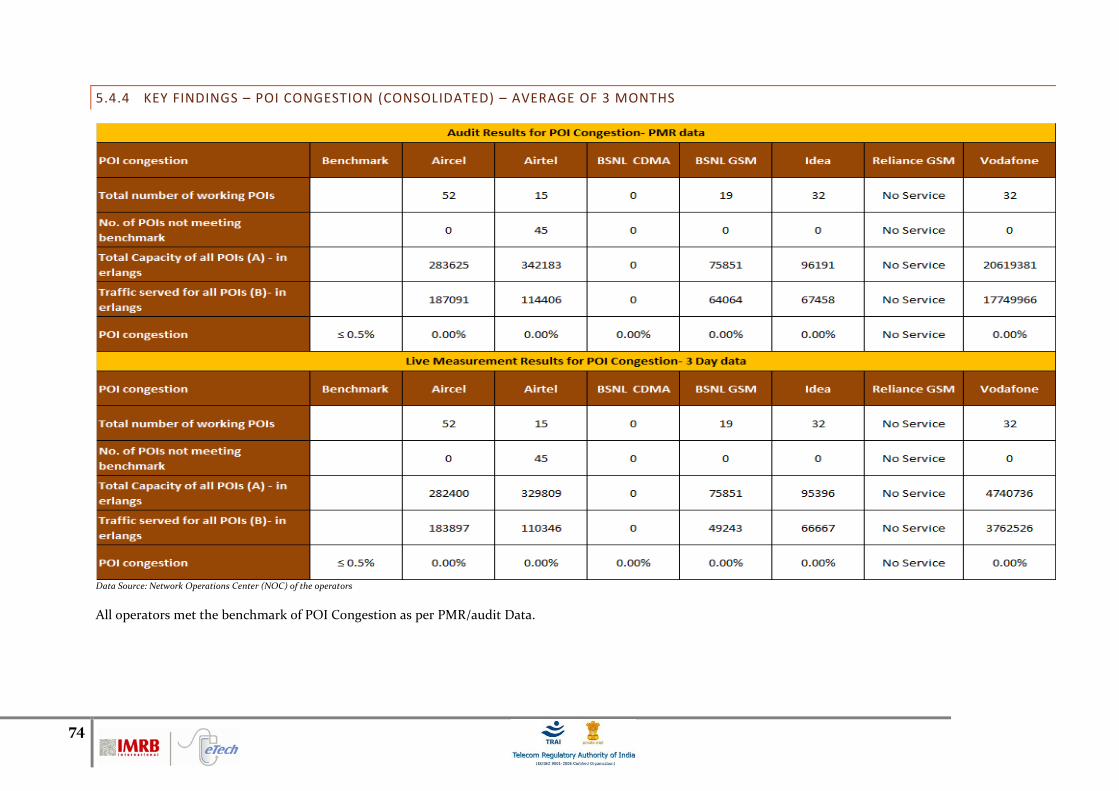
74
5.4.4 KEY FINDINGS – POI CONGESTION (CONSOLIDATED) – AVERAGE OF 3 MONTHS
Data Source: Network Operations Center (NOC) of the operators
All operators met the benchmark of POI Congestion as per PMR/audit Data.
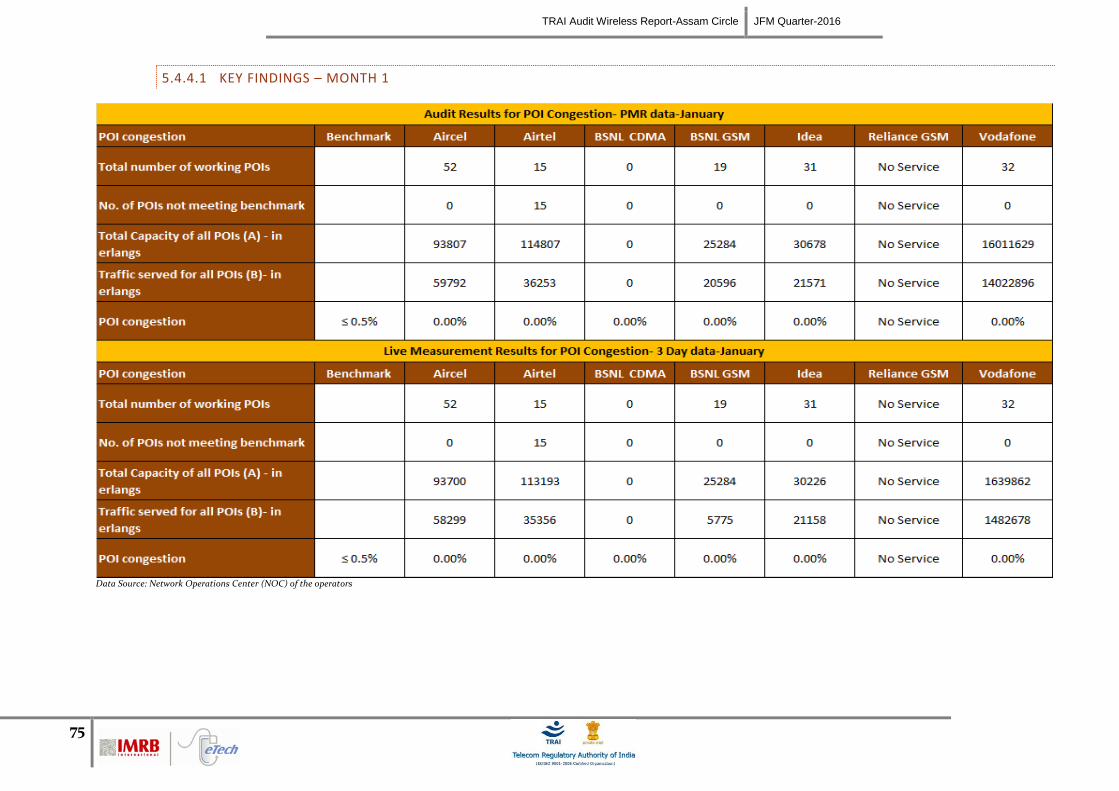
TRAI Audit Wireless Report-Assam Circle JFM Quarter-2016
75
5.4.4.1 KEY FINDINGS – MONTH 1
Data Source: Network Operations Center (NOC) of the operators
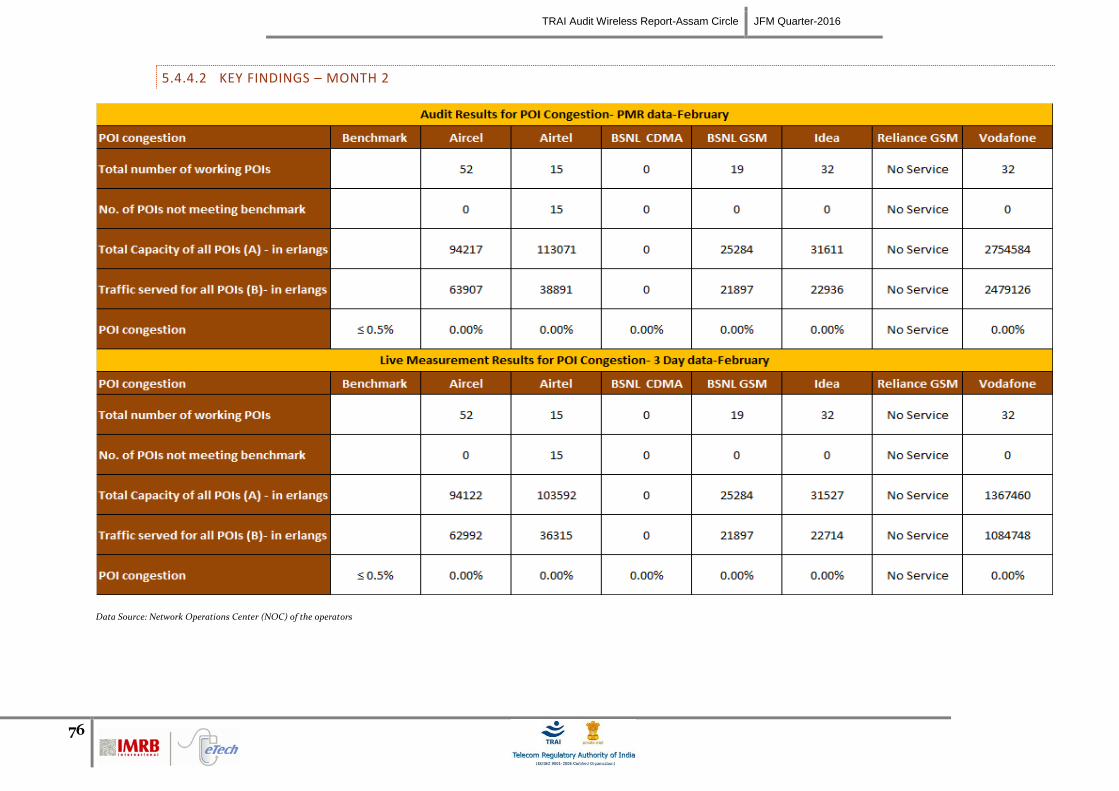
TRAI Audit Wireless Report-Assam Circle JFM Quarter-2016
76
5.4.4.2 KEY FINDINGS – MONTH 2
Data Source: Network Operations Center (NOC) of the operators
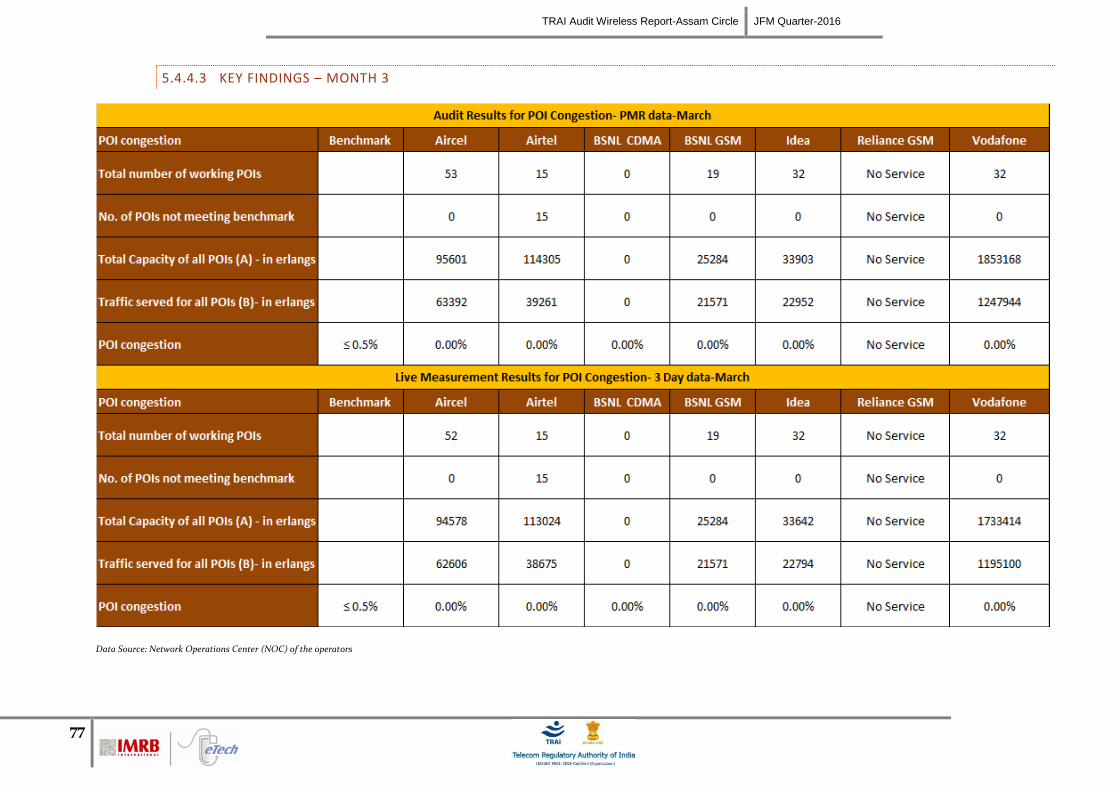
TRAI Audit Wireless Report-Assam Circle JFM Quarter-2016
77
5.4.4.3 KEY FINDINGS – MONTH 3
Data Source: Network Operations Center (NOC) of the operators
78
5.5 CALL DROP RATE
5.5.1 PARAMETER DESCRIPTION
1. Definition - The dropped call rate is the ratio of successfully originated calls that were found to drop to the total number of successfully originated calls that
were correctly released.
Total calls dropped = All calls ceasing unnaturally i.e. due to handover or due to radio loss
Total calls established = All calls that have TCH allocation during busy hour
2. Computational Methodology: (Total Calls Dropped / Total Calls Established) x 100
3. TRAI Benchmark –
Call drop rate ≤ 2%
4. Audit Procedure –
Audit of traffic data of the relevant quarter kept in OMC-R at MSCs and used for arriving at CDR was used
The operator should only be considering those calls which are dropped during Time consistent busy hour (TCBH) for all days of the relevant quarter.
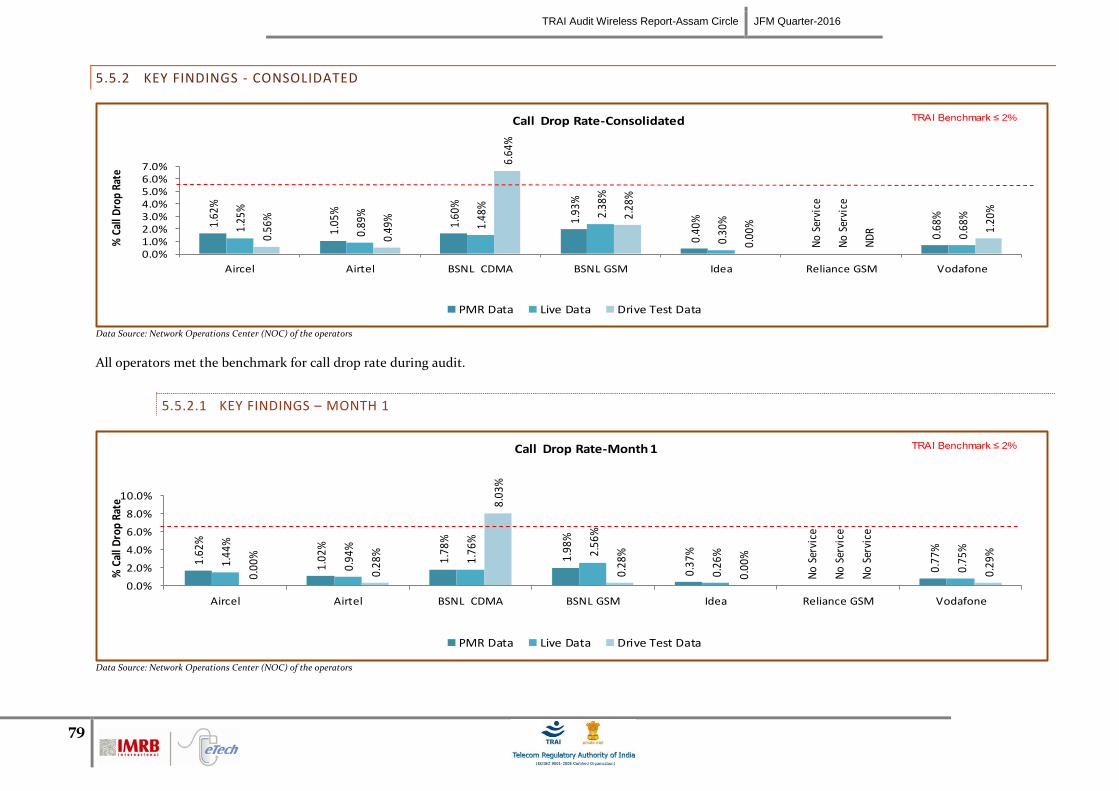
TRAI Audit Wireless Report-Assam Circle JFM Quarter-2016
79
5.5.2 KEY FINDINGS - CONSOLIDATED
1.62
%
1.05
%
1.60
%
1.93
%
0.40
%
No
Serv
ice
0.68
%
1.25
%
0.89
%
1.48
%
2.38
%
0.30
%
No
Serv
ice
0.68
%
0.56
%
0.49
%
6.64
%
2.28
%
0.00
%
ND
R 1.20
%
0.0%1.0%2.0%3.0%4.0%5.0%6.0%7.0%
Aircel Airtel BSNL CDMA BSNL GSM Idea Reliance GSM Vodafone
% C
all D
rop
Rate
Call Drop Rate-Consolidated
PMR Data Live Data Drive Test Data
TRAI Benchmark ≤ 2%
Data Source: Network Operations Center (NOC) of the operators
All operators met the benchmark for call drop rate during audit.
5.5.2.1 KEY FINDINGS – MONTH 1
1.62
%
1.02
%
1.78
%
1.98
%
0.37
%
No
Serv
ice
0.77
%
1.44
%
0.94
%
1.76
%
2.56
%
0.26
%
No
Serv
ice
0.75
%
0.00
%
0.28
%
8.03
%
0.28
%
0.00
%
No
Serv
ice
0.29
%
0.0%
2.0%
4.0%
6.0%
8.0%
10.0%
Aircel Airtel BSNL CDMA BSNL GSM Idea Reliance GSM Vodafone
% C
all D
rop
Rate
Call Drop Rate-Month 1
PMR Data Live Data Drive Test Data
TRAI Benchmark ≤ 2%
Data Source: Network Operations Center (NOC) of the operators
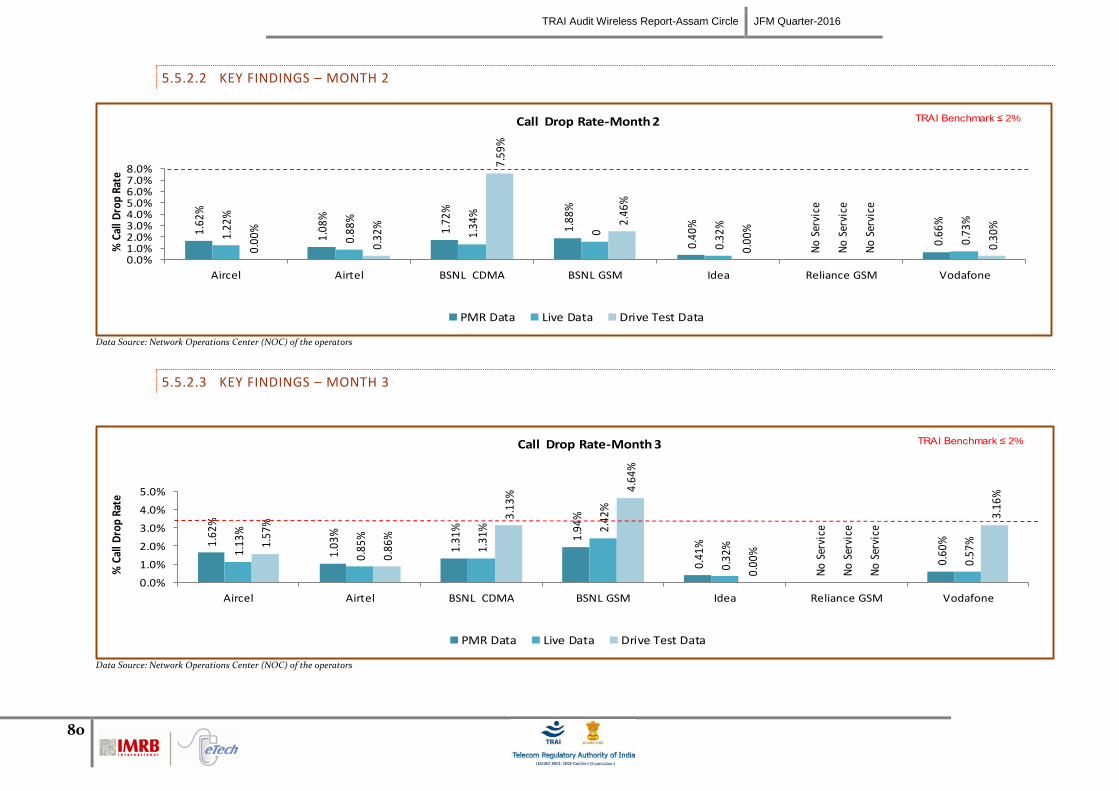
TRAI Audit Wireless Report-Assam Circle JFM Quarter-2016
80
5.5.2.2 KEY FINDINGS – MONTH 2
1.62
%
1.08
%
1.72
%
1.88
%
0.40
%
No
Serv
ice
0.66
%
1.22
%
0.88
%
1.34
%
0
0.32
%
No
Serv
ice
0.73
%
0.00
%
0.32
%
7.59
%
2.46
%
0.00
%
No
Serv
ice
0.30
%
0.0%1.0%2.0%3.0%4.0%5.0%6.0%7.0%8.0%
Aircel Airtel BSNL CDMA BSNL GSM Idea Reliance GSM Vodafone
% C
all D
rop
Rate
Call Drop Rate-Month 2
PMR Data Live Data Drive Test Data
TRAI Benchmark ≤ 2%
Data Source: Network Operations Center (NOC) of the operators
5.5.2.3 KEY FINDINGS – MONTH 3
1.62
%
1.03
%
1.31
%
1.94
%
0.41
%
No
Serv
ice
0.60
%
1.13
%
0.85
%
1.31
% 2.42
%
0.32
%
No
Serv
ice
0.57
%1.57
%
0.86
%
3.13
%
4.64
%
0.00
%
No
Serv
ice
3.16
%
0.0%
1.0%
2.0%
3.0%
4.0%
5.0%
Aircel Airtel BSNL CDMA BSNL GSM Idea Reliance GSM Vodafone
% C
all D
rop
Rate
Call Drop Rate-Month 3
PMR Data Live Data Drive Test Data
TRAI Benchmark ≤ 2%
Data Source: Network Operations Center (NOC) of the operators
TRAI Audit Wireless Report-Assam Circle JFM Quarter-2016
81
5.6 CELLS HAVING GREATER THAN 3% TCH DROP
5.6.1 PARAMETER DESCRIPTION
1. Definition- Worst Affected Cells having more than 3% TCH drop shall measure the ratio of total number of cells in the network to the ratio of cells
having more than 3% TCH drop.
2. Computational Methodology: (Total number of cells having more than 3% TCH drop during CBBH/ Total number of cells in the network) x 100
3. TRAI Benchmark –
Worst affected cells having more than 3% TCH drop rate ≤ 3%
4. Audit Procedure –
Audit of traffic data of the relevant quarter kept in OMC-R at MSCs and used for arriving at CDR would be conducted.
The operator should only be considering those calls which are dropped during Cell Bouncing Busy hour (CBBH) for all days of the relevant quarter.
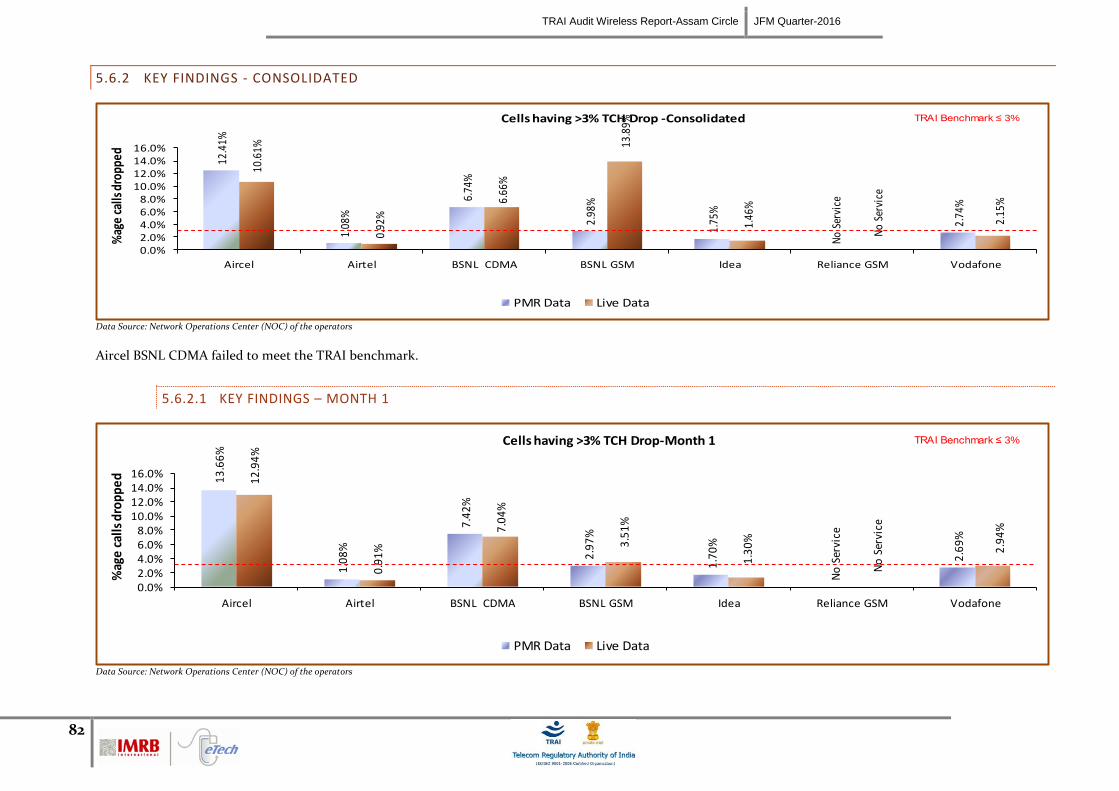
TRAI Audit Wireless Report-Assam Circle JFM Quarter-2016
82
5.6.2 KEY FINDINGS - CONSOLIDATED
12.4
1%
1.08
%
6.74
%
2.98
%
1.75
%
No
Serv
ice
2.74
%
10.6
1%
0.92
%
6.66
%
13.8
9%
1.46
%
No
Serv
ice
2.15
%
0.0%2.0%4.0%6.0%8.0%
10.0%12.0%14.0%16.0%
Aircel Airtel BSNL CDMA BSNL GSM Idea Reliance GSM Vodafone
%ag
e ca
lls d
ropp
edCells having >3% TCH Drop -Consolidated
PMR Data Live Data
TRAI Benchmark ≤ 3%
Data Source: Network Operations Center (NOC) of the operators
Aircel BSNL CDMA failed to meet the TRAI benchmark.
5.6.2.1 KEY FINDINGS – MONTH 1
13
.66
%
1.0
8%
7.4
2%
2.9
7%
1.7
0%
No
Ser
vice
2.6
9%
12
.94
%
0.9
1%
7.0
4%
3.5
1%
1.3
0%
No
Ser
vice
2.9
4%
0.0%2.0%4.0%6.0%8.0%
10.0%12.0%14.0%16.0%
Aircel Airtel BSNL CDMA BSNL GSM Idea Reliance GSM Vodafone
%ag
e c
alls
dro
pped
Cells having >3% TCH Drop-Month 1
PMR Data Live Data
TRAI Benchmark ≤ 3%
Data Source: Network Operations Center (NOC) of the operators
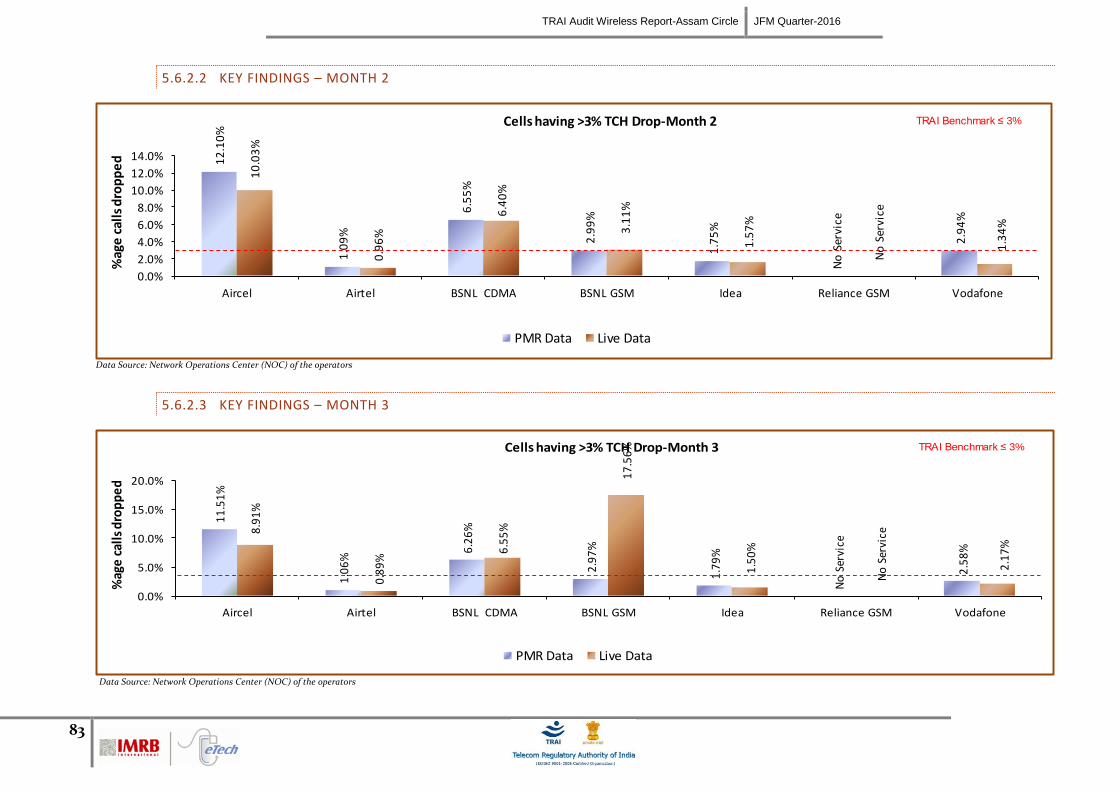
TRAI Audit Wireless Report-Assam Circle JFM Quarter-2016
83
5.6.2.2 KEY FINDINGS – MONTH 2
12
.10
%
1.0
9%
6.5
5%
2.9
9%
1.7
5%
No
Ser
vice
2.9
4%
10
.03
%
0.9
6%
6.4
0%
3.1
1%
1.5
7%
No
Ser
vice
1.3
4%
0.0%
2.0%
4.0%
6.0%
8.0%
10.0%
12.0%
14.0%
Aircel Airtel BSNL CDMA BSNL GSM Idea Reliance GSM Vodafone
%ag
e c
alls
dro
pp
ed
Cells having >3% TCH Drop-Month 2
PMR Data Live Data
TRAI Benchmark ≤ 3%
Data Source: Network Operations Center (NOC) of the operators
5.6.2.3 KEY FINDINGS – MONTH 3
11
.51
%
1.0
6%
6.2
6%
2.9
7%
1.7
9%
No
Ser
vice
2.5
8%
8.9
1%
0.8
9%
6.5
5%
17
.56
%
1.5
0%
No
Ser
vice
2.1
7%
0.0%
5.0%
10.0%
15.0%
20.0%
Aircel Airtel BSNL CDMA BSNL GSM Idea Reliance GSM Vodafone
%ag
e c
alls
dro
pp
ed
Cells having >3% TCH Drop-Month 3
PMR Data Live Data
TRAI Benchmark ≤ 3%
Data Source: Network Operations Center (NOC) of the operators
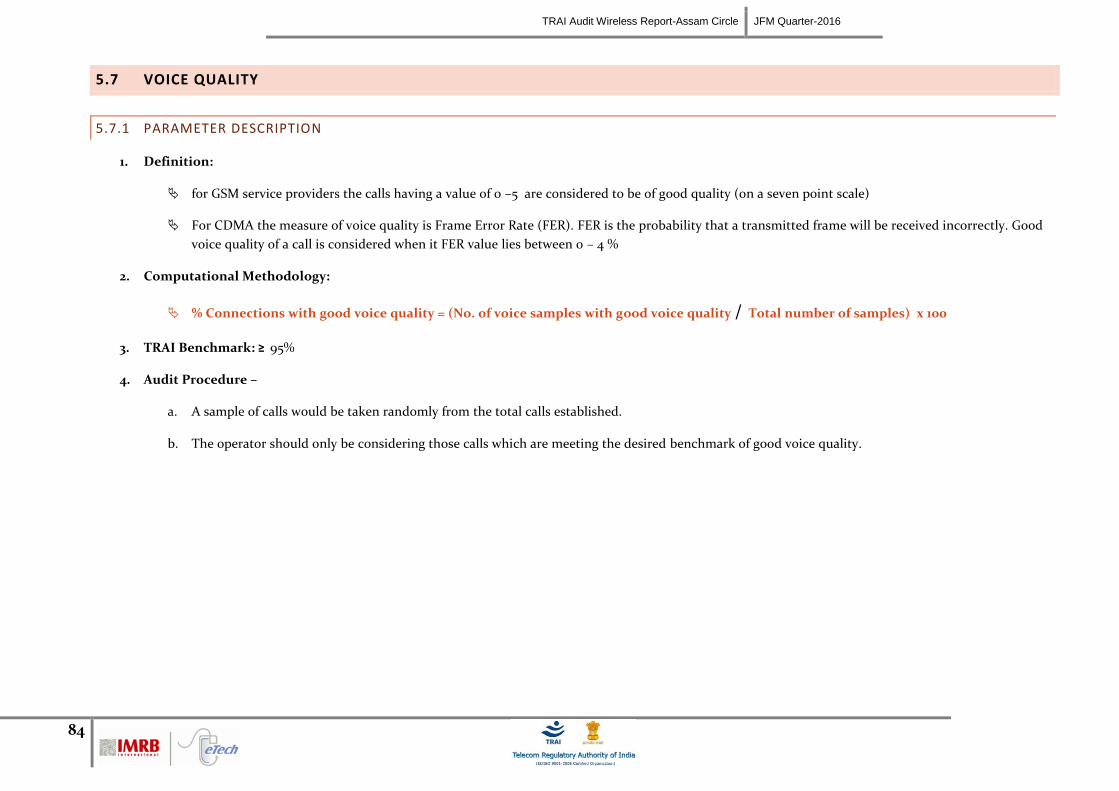
TRAI Audit Wireless Report-Assam Circle JFM Quarter-2016
84
5.7 VOICE QUALITY
5.7.1 PARAMETER DESCRIPTION
1. Definition:
for GSM service providers the calls having a value of 0 –5 are considered to be of good quality (on a seven point scale)
For CDMA the measure of voice quality is Frame Error Rate (FER). FER is the probability that a transmitted frame will be received incorrectly. Good
voice quality of a call is considered when it FER value lies between 0 – 4 %
2. Computational Methodology:
% Connections with good voice quality = (No. of voice samples with good voice quality / Total number of samples) x 100
3. TRAI Benchmark: ≥ 95%
4. Audit Procedure –
a. A sample of calls would be taken randomly from the total calls established.
b. The operator should only be considering those calls which are meeting the desired benchmark of good voice quality.
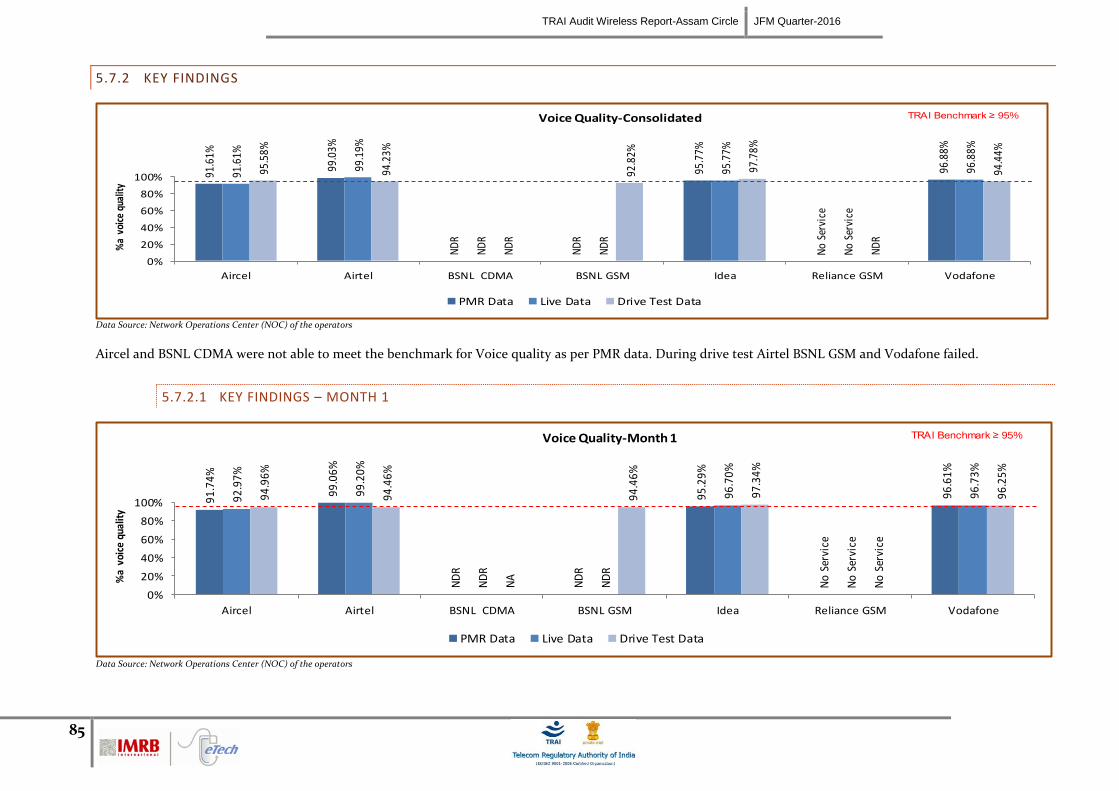
TRAI Audit Wireless Report-Assam Circle JFM Quarter-2016
85
5.7.2 KEY FINDINGS
91.6
1%
99.0
3%
ND
R
ND
R
95.7
7%
No
Serv
ice
96.8
8%
91.6
1%
99.1
9%
ND
R
ND
R
95.7
7%
No
Serv
ice
96.8
8%
95.5
8%
94.2
3%
ND
R
92.8
2%
97.7
8%
ND
R
94.4
4%
0%
20%
40%
60%
80%
100%
Aircel Airtel BSNL CDMA BSNL GSM Idea Reliance GSM Vodafone
%a
voi
ce q
ualit
yVoice Quality-Consolidated
PMR Data Live Data Drive Test Data
TRAI Benchmark ≥ 95%
Data Source: Network Operations Center (NOC) of the operators
Aircel and BSNL CDMA were not able to meet the benchmark for Voice quality as per PMR data. During drive test Airtel BSNL GSM and Vodafone failed.
5.7.2.1 KEY FINDINGS – MONTH 1
91.7
4%
99.0
6%
ND
R
ND
R
95.2
9%
No
Serv
ice
96.6
1%
92.9
7%
99.2
0%
ND
R
ND
R
96.7
0%
No
Serv
ice
96.7
3%
94.9
6%
94.4
6%
NA
94.4
6%
97.3
4%
No
Serv
ice
96.2
5%
0%
20%
40%
60%
80%
100%
Aircel Airtel BSNL CDMA BSNL GSM Idea Reliance GSM Vodafone
%a
voi
ce q
ualit
y
Voice Quality-Month 1
PMR Data Live Data Drive Test Data
TRAI Benchmark ≥ 95%
Data Source: Network Operations Center (NOC) of the operators
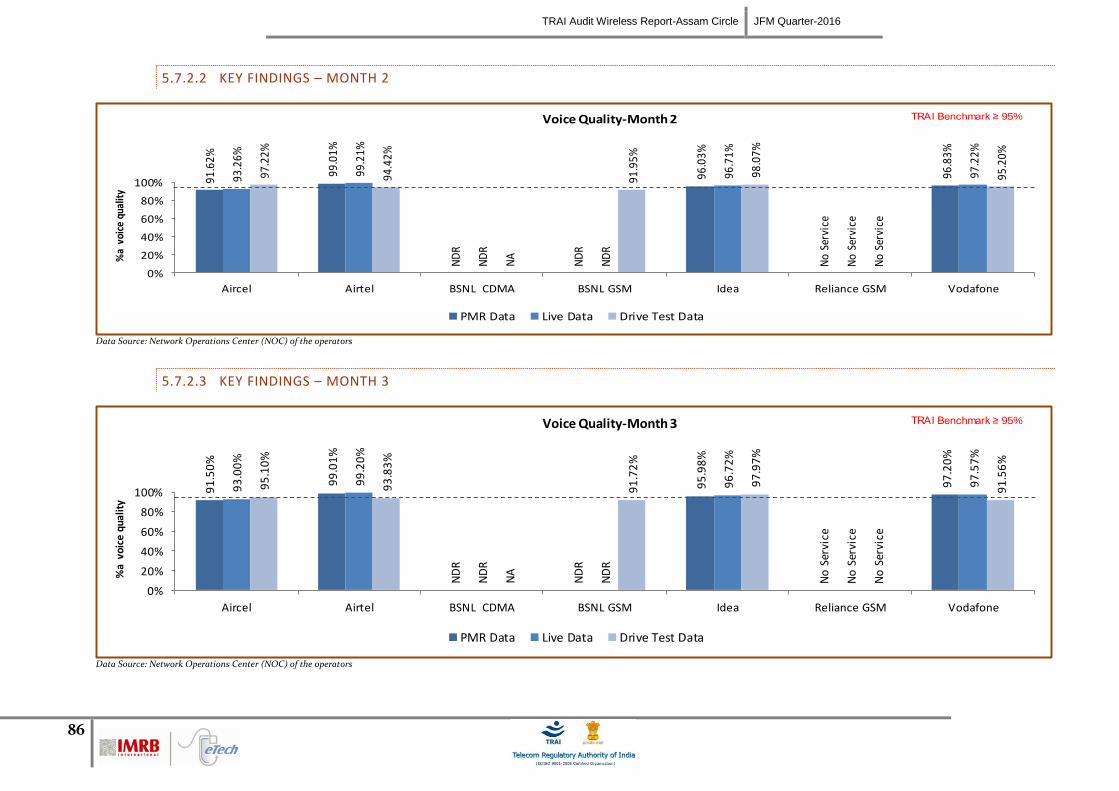
TRAI Audit Wireless Report-Assam Circle JFM Quarter-2016
86
5.7.2.2 KEY FINDINGS – MONTH 2
91.6
2%
99.0
1%
ND
R
ND
R
96.0
3%
No
Serv
ice
96.8
3%
93.2
6%
99.2
1%
ND
R
ND
R
96.7
1%
No
Serv
ice
97.2
2%
97.2
2%
94.4
2%
NA
91.9
5%
98.0
7%
No
Serv
ice
95.2
0%
0%
20%
40%
60%
80%
100%
Aircel Airtel BSNL CDMA BSNL GSM Idea Reliance GSM Vodafone
%a
voi
ce q
ualit
yVoice Quality-Month 2
PMR Data Live Data Drive Test Data
TRAI Benchmark ≥ 95%
Data Source: Network Operations Center (NOC) of the operators
5.7.2.3 KEY FINDINGS – MONTH 3
91
.50
%
99
.01
%
ND
R
ND
R
95
.98
%
No
Ser
vice
97
.20
%
93
.00
%
99
.20
%
ND
R
ND
R
96
.72
%
No
Ser
vice
97
.57
%
95
.10
%
93
.83
%
NA
91
.72
%
97
.97
%
No
Ser
vice
91
.56
%
0%
20%
40%
60%
80%
100%
Aircel Airtel BSNL CDMA BSNL GSM Idea Reliance GSM Vodafone
%a
voi
ce q
ualit
y
Voice Quality-Month 3
PMR Data Live Data Drive Test Data
TRAI Benchmark ≥ 95%
Data Source: Network Operations Center (NOC) of the operators
TRAI Audit Wireless Report-Assam Circle JFM Quarter-2016
87
6 PARAMETER DESCRIPTION & DETAILED FINDINGS - COMPARISON BETWEEN PMR DATA, 3 DAY LIVE DATA AND LIVE CALLING
DATA FOR 3G
6.1 NODE BS DOWNTIME
6.1.1 PARAMETER DESCRIPTION
The parameter of network availability would be measured from following sub-parameters
1. Node Bs downtime (not available for service)
2. Worst affected Node Bs due to downtime
Definition - Node Bs downtime (not available for service): In the case of 3G networks, instead of BTS the nomenclature is Node B. The
measurement methodology for the parameter Node B Accumulated downtime (not available for service) will be similar to the existing
parameter for BTSs Accumulated downtime (not available for service).
Data Extraction/collection methodology - Data extraction to be done from appropriate counters. Auditors should be aware of counter
details and definitions for each operator.
Source of Data: Network Operation Center (NOC) or a Central Server
Computation Methodology –
Node Bs downtime (not available for service) = Sum of downtime of Node Bs in a month in hours i.e. total outage time of all Node
Bs in hours during a month / (24 x Number of days in a month x Number of Node Bs in the network in licensed service area) x 100
3. TRAI Benchmark –
a. Node Bs downtime (not available for service) ≤ 2%
4. Audit Procedure –
The fault alarm details at the OMC (MSC) for the network outages (due to own network elements and infrastructure service provider end outages)
was audited
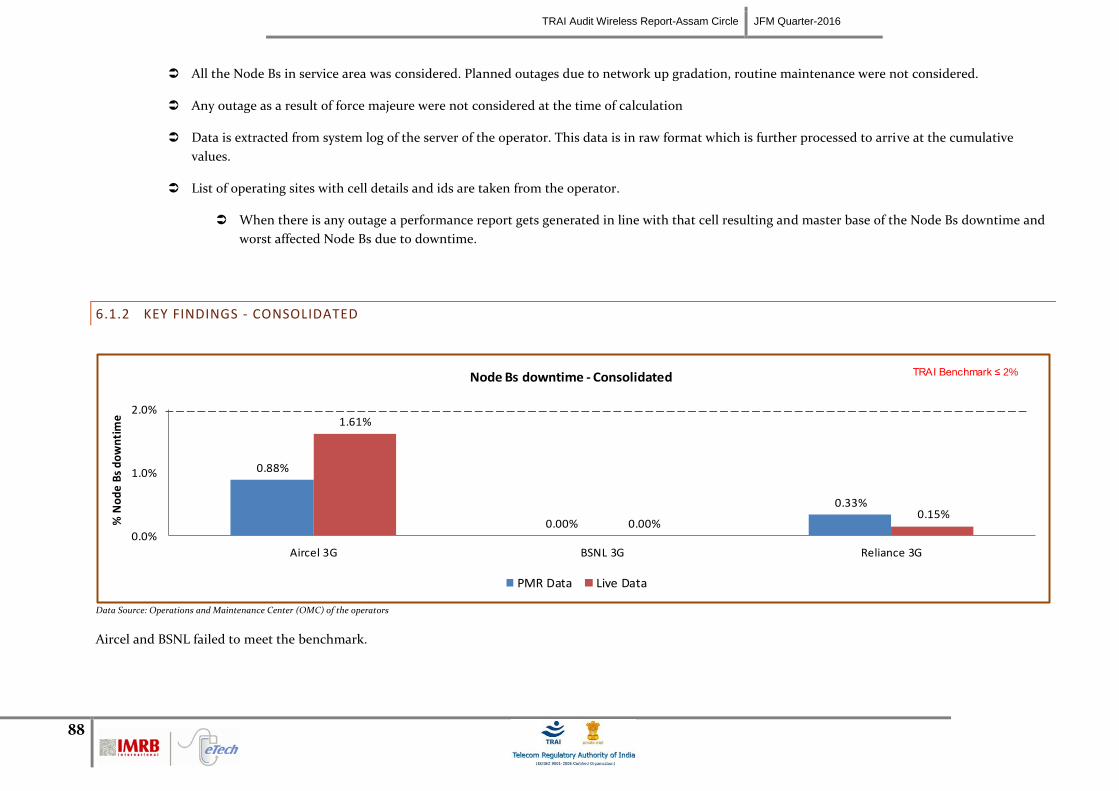
TRAI Audit Wireless Report-Assam Circle JFM Quarter-2016
88
All the Node Bs in service area was considered. Planned outages due to network up gradation, routine maintenance were not considered.
Any outage as a result of force majeure were not considered at the time of calculation
Data is extracted from system log of the server of the operator. This data is in raw format which is further processed to arrive at the cumulative
values.
List of operating sites with cell details and ids are taken from the operator.
When there is any outage a performance report gets generated in line with that cell resulting and master base of the Node Bs downtime and
worst affected Node Bs due to downtime.
6.1.2 KEY FINDINGS - CONSOLIDATED
0.88%
0.00%
0.33%
1.61%
0.00%0.15%
0.0%
1.0%
2.0%
Aircel 3G BSNL 3G Reliance 3G
% N
od
e B
s d
ow
nti
me
Node Bs downtime - Consolidated
PMR Data Live Data
TRAI Benchmark ≤ 2%
Data Source: Operations and Maintenance Center (OMC) of the operators
Aircel and BSNL failed to meet the benchmark.
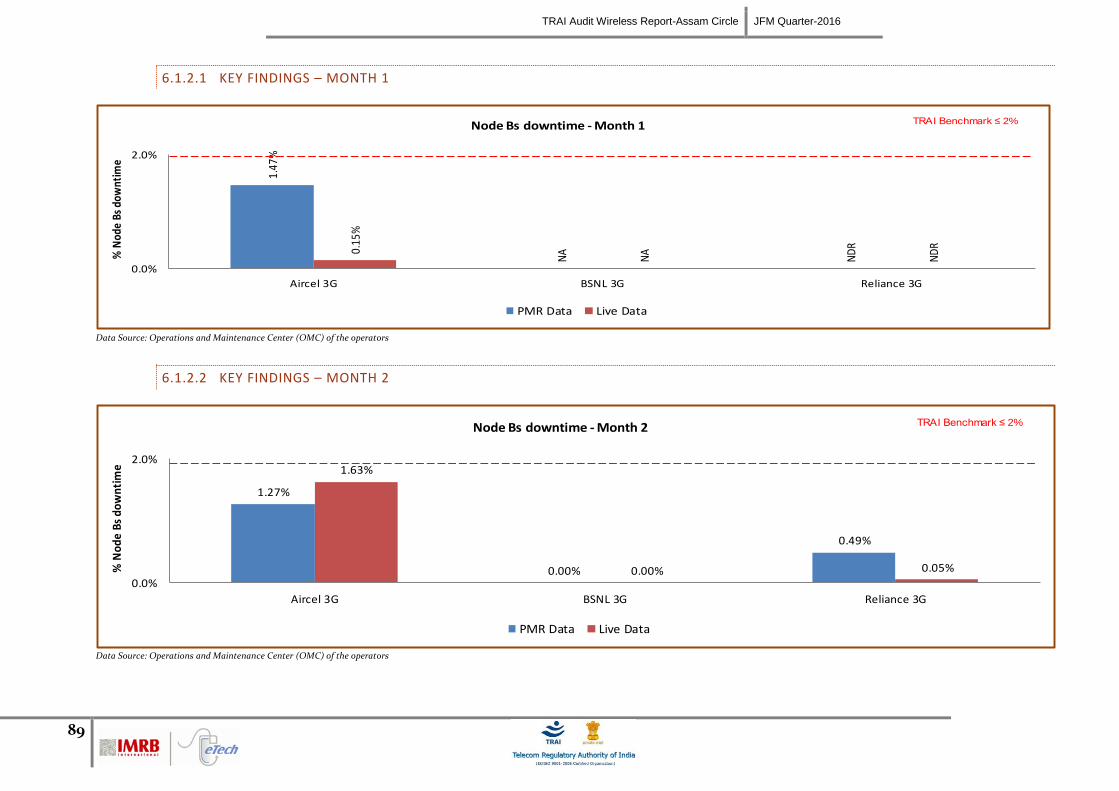
TRAI Audit Wireless Report-Assam Circle JFM Quarter-2016
89
6.1.2.1 KEY FINDINGS – MONTH 1
1.47
%
NA
ND
R0.15
%
NA
ND
R
0.0%
2.0%
Aircel 3G BSNL 3G Reliance 3G
% N
ode
Bs d
ownt
ime
Node Bs downtime - Month 1
PMR Data Live Data
TRAI Benchmark ≤ 2%
Data Source: Operations and Maintenance Center (OMC) of the operators
6.1.2.2 KEY FINDINGS – MONTH 2
1.27%
0.00%
0.49%
1.63%
0.00% 0.05%
0.0%
2.0%
Aircel 3G BSNL 3G Reliance 3G
% N
od
e B
s d
ow
nti
me
Node Bs downtime - Month 2
PMR Data Live Data
TRAI Benchmark ≤ 2%
Data Source: Operations and Maintenance Center (OMC) of the operators
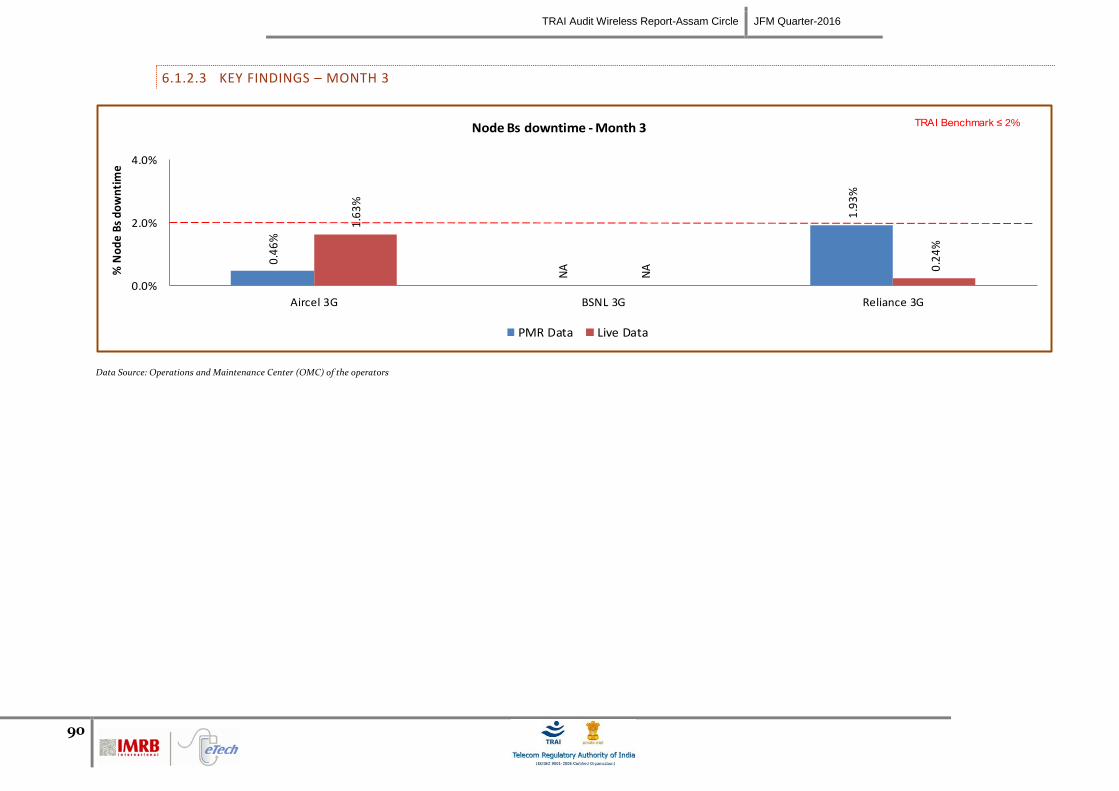
TRAI Audit Wireless Report-Assam Circle JFM Quarter-2016
90
6.1.2.3 KEY FINDINGS – MONTH 3
0.4
6%
NA
1.9
3%
1.6
3%
NA 0
.24
%
0.0%
2.0%
4.0%
Aircel 3G BSNL 3G Reliance 3G
% N
od
e B
s d
ow
nti
me
Node Bs downtime - Month 3
PMR Data Live Data
TRAI Benchmark ≤ 2%
Data Source: Operations and Maintenance Center (OMC) of the operators
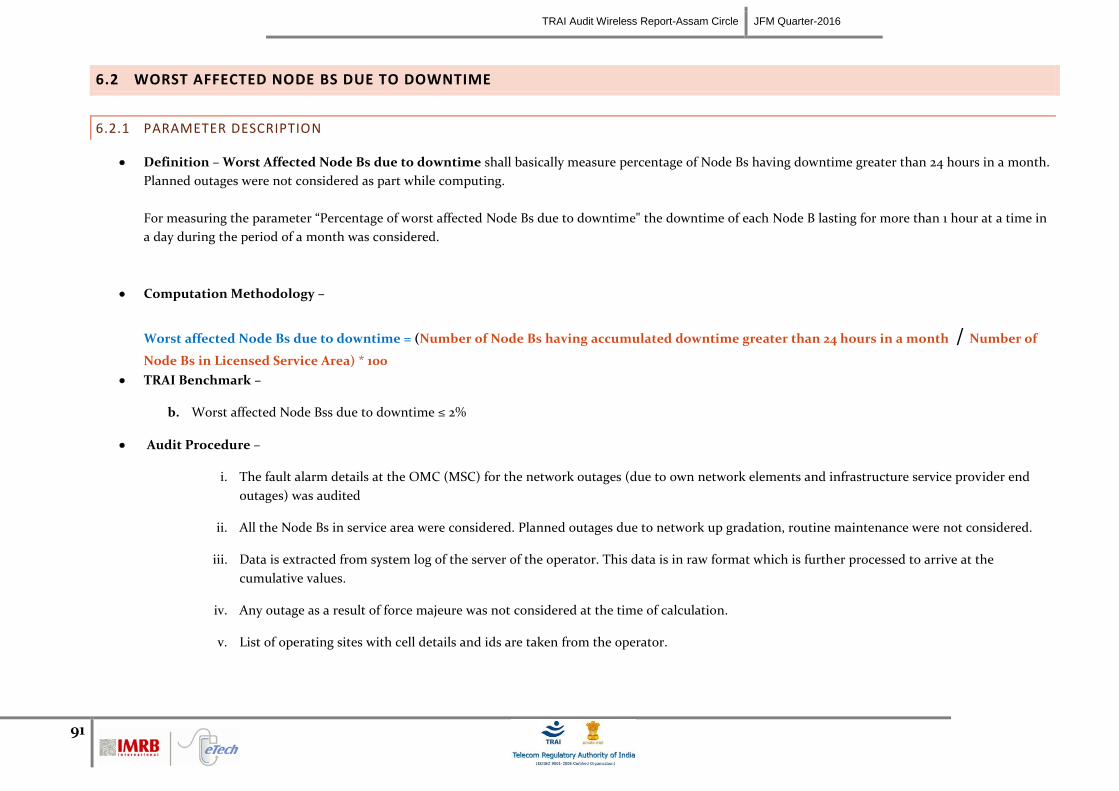
TRAI Audit Wireless Report-Assam Circle JFM Quarter-2016
91
6.2 WORST AFFECTED NODE BS DUE TO DOWNTIME
6.2.1 PARAMETER DESCRIPTION
Definition – Worst Affected Node Bs due to downtime shall basically measure percentage of Node Bs having downtime greater than 24 hours in a month.
Planned outages were not considered as part while computing.
For measuring the parameter “Percentage of worst affected Node Bs due to downtime" the downtime of each Node B lasting for more than 1 hour at a time in
a day during the period of a month was considered.
Computation Methodology –
Worst affected Node Bs due to downtime = (Number of Node Bs having accumulated downtime greater than 24 hours in a month / Number of
Node Bs in Licensed Service Area) * 100
TRAI Benchmark –
b. Worst affected Node Bss due to downtime ≤ 2%
Audit Procedure –
i. The fault alarm details at the OMC (MSC) for the network outages (due to own network elements and infrastructure service provider end
outages) was audited
ii. All the Node Bs in service area were considered. Planned outages due to network up gradation, routine maintenance were not considered.
iii. Data is extracted from system log of the server of the operator. This data is in raw format which is further processed to arrive at the
cumulative values.
iv. Any outage as a result of force majeure was not considered at the time of calculation.
v. List of operating sites with cell details and ids are taken from the operator.
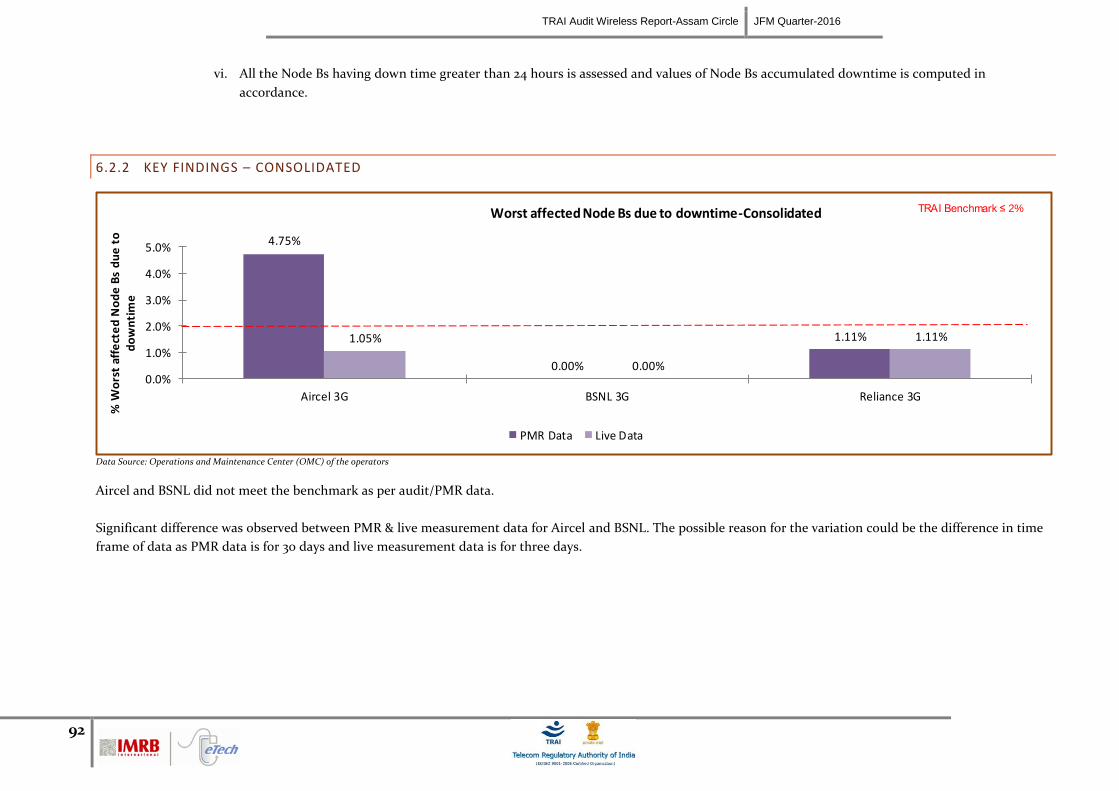
TRAI Audit Wireless Report-Assam Circle JFM Quarter-2016
92
vi. All the Node Bs having down time greater than 24 hours is assessed and values of Node Bs accumulated downtime is computed in
accordance.
6.2.2 KEY FINDINGS – CONSOLIDATED
4.75%
0.00%
1.11%1.05%
0.00%
1.11%
0.0%
1.0%
2.0%
3.0%
4.0%
5.0%
Aircel 3G BSNL 3G Reliance 3G
% W
ors
t af
fect
ed
No
de
Bs
du
e t
o
do
wn
tim
e
Worst affected Node Bs due to downtime-Consolidated
PMR Data Live Data
TRAI Benchmark ≤ 2%
Data Source: Operations and Maintenance Center (OMC) of the operators
Aircel and BSNL did not meet the benchmark as per audit/PMR data.
Significant difference was observed between PMR & live measurement data for Aircel and BSNL. The possible reason for the variation could be the difference in time
frame of data as PMR data is for 30 days and live measurement data is for three days.
TRAI Audit Wireless Report-Assam Circle JFM Quarter-2016
93
6.2.2.1 KEY FINDINGS – MONTH 1
6.67
%
NA
ND
R1.20
%
NA
ND
R
0.0%
1.0%
2.0%
3.0%
4.0%
5.0%
6.0%
7.0%
8.0%
Aircel 3G BSNL 3G Reliance 3G
% W
orst
aff
ecte
d N
ode
Bs d
ue t
o do
wnt
ime
Worst affected Node Bs due to downtime-Month 1
PMR Data Live Data
TRAI Benchmark ≤ 2%
Data Source: Operations and Maintenance Center (OMC) of the operators
6.2.2.2 KEY FINDINGS – MONTH 2
7.22%
0.00%
1.52%1.25%
0.00%
1.52%
0.0%
1.0%
2.0%
3.0%
4.0%
5.0%
6.0%
7.0%
8.0%
Aircel 3G BSNL 3G Reliance 3G
% W
ors
t af
fect
ed
No
de
Bs
du
e t
o
do
wn
tim
e
Worst affected Node Bs due to downtime-Month 2
PMR Data Live Data
TRAI Benchmark ≤ 2%
Data Source: Operations and Maintenance Center (OMC) of the operators
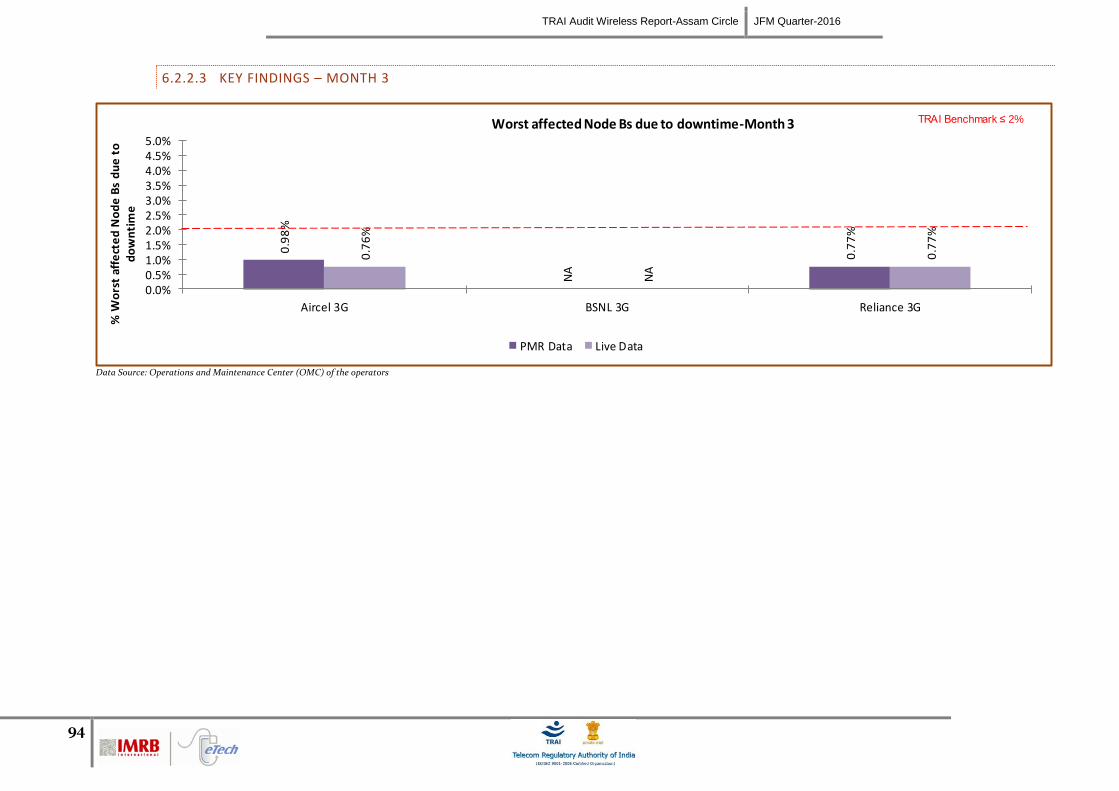
TRAI Audit Wireless Report-Assam Circle JFM Quarter-2016
94
6.2.2.3 KEY FINDINGS – MONTH 3
0.9
8%
NA
0.7
7%
0.7
6%
NA
0.7
7%
0.0%0.5%1.0%1.5%2.0%2.5%3.0%3.5%4.0%4.5%5.0%
Aircel 3G BSNL 3G Reliance 3G
% W
ors
t af
fect
ed
No
de
Bs
du
e t
o
do
wn
tim
eWorst affected Node Bs due to downtime-Month 3
PMR Data Live Data
TRAI Benchmark ≤ 2%
Data Source: Operations and Maintenance Center (OMC) of the operators
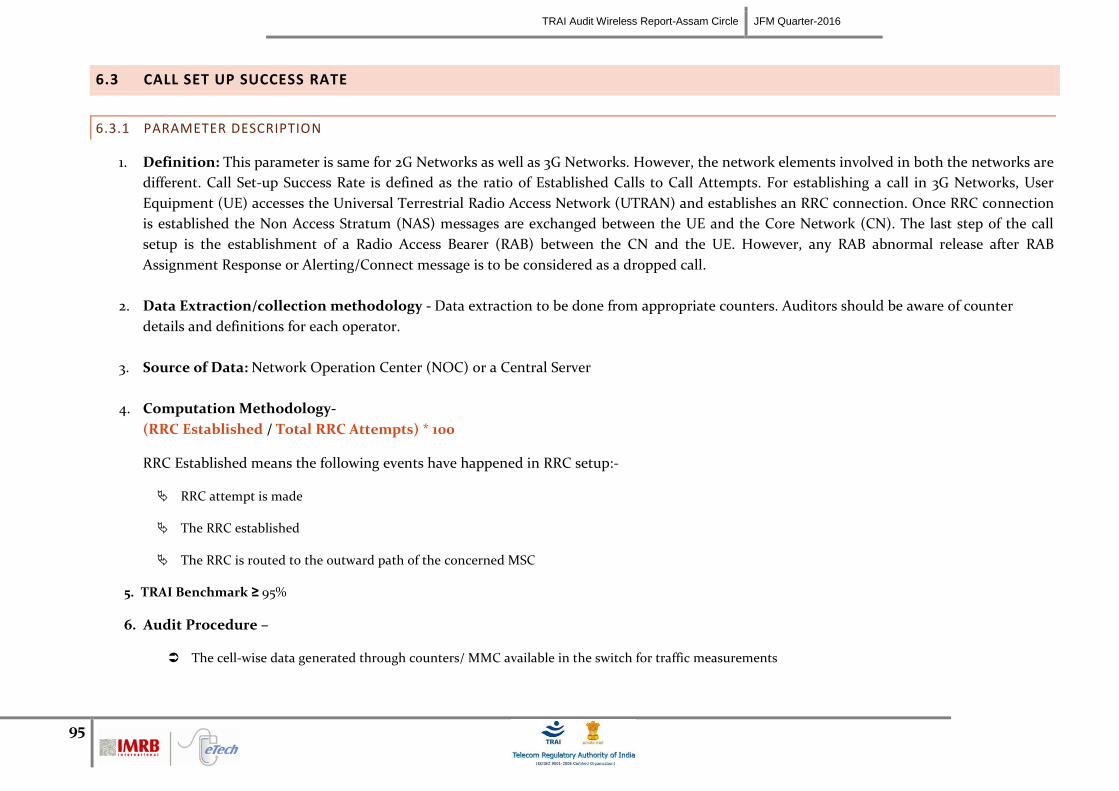
TRAI Audit Wireless Report-Assam Circle JFM Quarter-2016
95
6.3 CALL SET UP SUCCESS RATE
6.3.1 PARAMETER DESCRIPTION
1. Definition: This parameter is same for 2G Networks as well as 3G Networks. However, the network elements involved in both the networks are
different. Call Set-up Success Rate is defined as the ratio of Established Calls to Call Attempts. For establishing a call in 3G Networks, User
Equipment (UE) accesses the Universal Terrestrial Radio Access Network (UTRAN) and establishes an RRC connection. Once RRC connection
is established the Non Access Stratum (NAS) messages are exchanged between the UE and the Core Network (CN). The last step of the call
setup is the establishment of a Radio Access Bearer (RAB) between the CN and the UE. However, any RAB abnormal release after RAB
Assignment Response or Alerting/Connect message is to be considered as a dropped call.
2. Data Extraction/collection methodology - Data extraction to be done from appropriate counters. Auditors should be aware of counter
details and definitions for each operator.
3. Source of Data: Network Operation Center (NOC) or a Central Server
4. Computation Methodology-
(RRC Established / Total RRC Attempts) * 100
RRC Established means the following events have happened in RRC setup:-
RRC attempt is made
The RRC established
The RRC is routed to the outward path of the concerned MSC
5. TRAI Benchmark ≥ 95%
6. Audit Procedure –
The cell-wise data generated through counters/ MMC available in the switch for traffic measurements
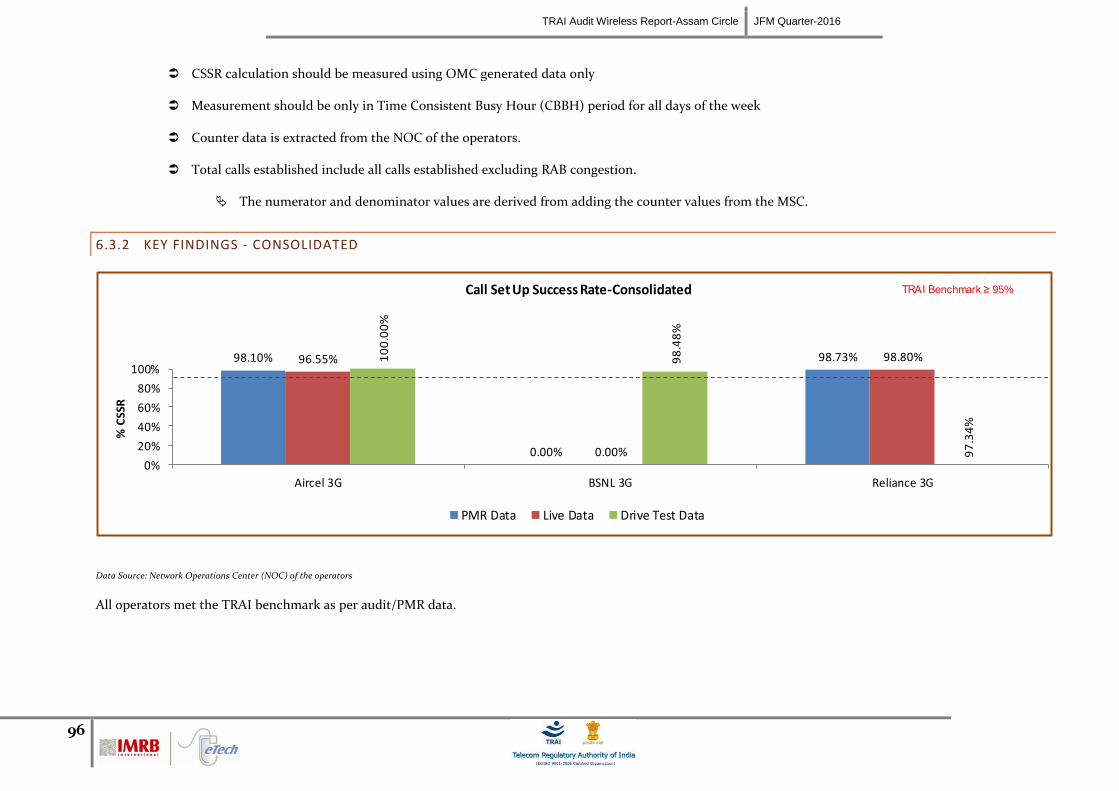
TRAI Audit Wireless Report-Assam Circle JFM Quarter-2016
96
CSSR calculation should be measured using OMC generated data only
Measurement should be only in Time Consistent Busy Hour (CBBH) period for all days of the week
Counter data is extracted from the NOC of the operators.
Total calls established include all calls established excluding RAB congestion.
The numerator and denominator values are derived from adding the counter values from the MSC.
6.3.2 KEY FINDINGS - CONSOLIDATED
98.10%
0.00%
98.73%96.55%
0.00%
98.80%10
0.0
0%
98
.48
%
97
.34
%
0%
20%
40%
60%
80%
100%
Aircel 3G BSNL 3G Reliance 3G
% C
SSR
Call Set Up Success Rate-Consolidated
PMR Data Live Data Drive Test Data
TRAI Benchmark ≥ 95%
Data Source: Network Operations Center (NOC) of the operators
All operators met the TRAI benchmark as per audit/PMR data.
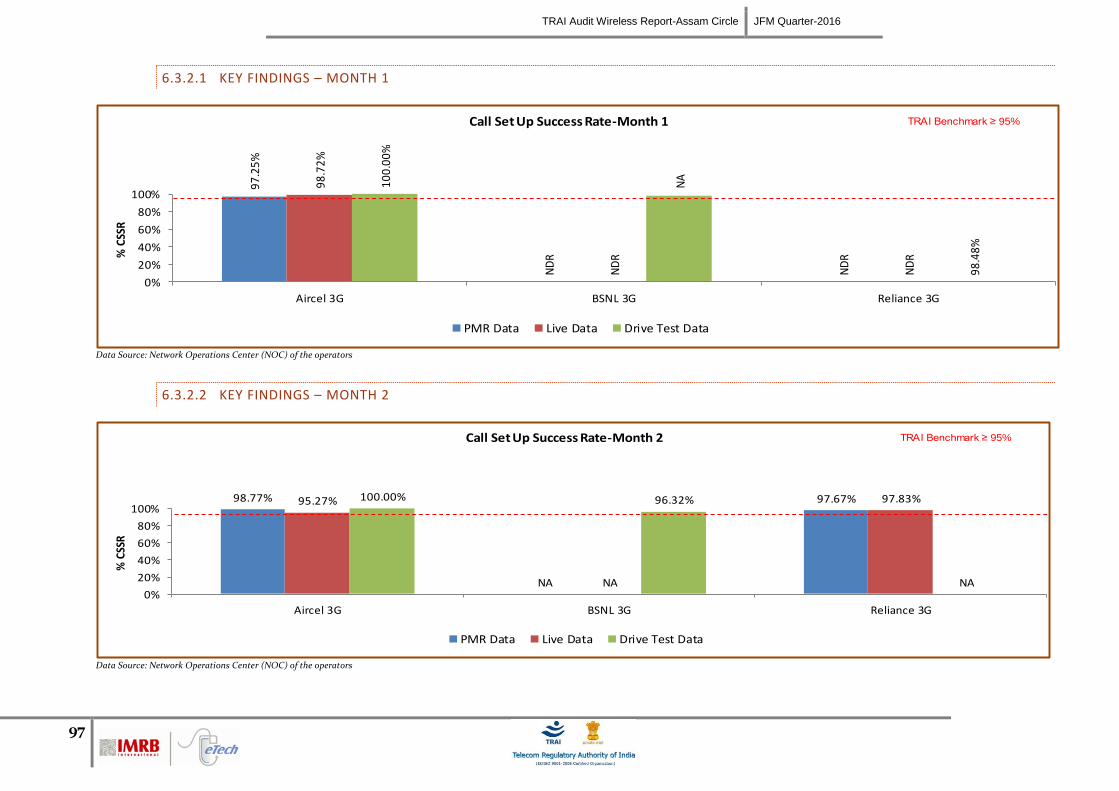
TRAI Audit Wireless Report-Assam Circle JFM Quarter-2016
97
6.3.2.1 KEY FINDINGS – MONTH 1
97
.25
%
ND
R
ND
R
98
.72
%
ND
R
ND
R
10
0.0
0%
NA
98
.48
%
0%
20%
40%
60%
80%
100%
Aircel 3G BSNL 3G Reliance 3G
% C
SSR
Call Set Up Success Rate-Month 1
PMR Data Live Data Drive Test Data
TRAI Benchmark ≥ 95%
Data Source: Network Operations Center (NOC) of the operators
6.3.2.2 KEY FINDINGS – MONTH 2
98.77%
NA
97.67%95.27%
NA
97.83%100.00% 96.32%
NA0%
20%
40%
60%
80%
100%
Aircel 3G BSNL 3G Reliance 3G
% C
SSR
Call Set Up Success Rate-Month 2
PMR Data Live Data Drive Test Data
TRAI Benchmark ≥ 95%
Data Source: Network Operations Center (NOC) of the operators
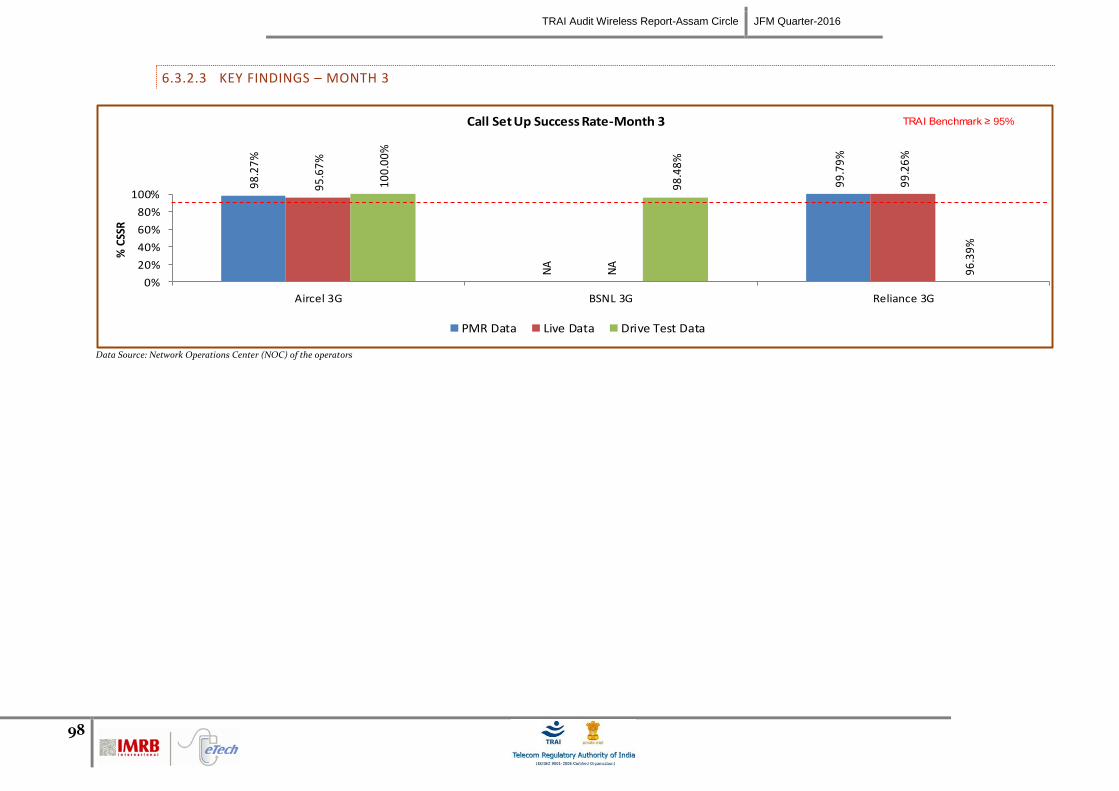
TRAI Audit Wireless Report-Assam Circle JFM Quarter-2016
98
6.3.2.3 KEY FINDINGS – MONTH 3
98
.27
%
NA
99
.79
%
95
.67
%
NA
99
.26
%
10
0.0
0%
98
.48
%
96
.39
%
0%
20%
40%
60%
80%
100%
Aircel 3G BSNL 3G Reliance 3G
% C
SSR
Call Set Up Success Rate-Month 3
PMR Data Live Data Drive Test Data
TRAI Benchmark ≥ 95%
Data Source: Network Operations Center (NOC) of the operators
TRAI Audit Wireless Report-Assam Circle JFM Quarter-2016
99
6.4 NETWORK CHANNEL CONGESTION- RRC CONGESTION/ CIRCUIT SWITCHED RAB CONGESTION
6.4.1 PARAMETER DESCRIPTION
1. Definition (RRC Congestion): This parameter has been amended to include RRC Congestion in 3G Networks.
2. Definition (Circuit Switched RAB congestion): Circuit Switched RAB congestion is similar to Traffic Channel Congestion. Therefore, the
existing parameter has been amended to include RAB congestion in 3G Networks.
3. Point of Interconnection (POI) Congestion: This parameter denotes congestion at the outgoing traffic between two networks and is
equally applicable for 2G networks and 3G networks.
RRC Level: Stand-alone dedicated control channel
RAB Level: Traffic Channel
POI Level: Point of Interconnect
4. Data Extraction/collection methodology - Data extraction to be done from appropriate counters. Auditors should be aware of counter
details and definitions for each operator.
5. Source of Data: Network Operation Center (NOC) or a Central Server
6. Computational Methodology:
RRC / RAB Congestion% = [(A1 x C1) + (A2 x C2) +…….+ (An x Cn)] / (A1 + A2 +…+ An)
Where:-A1 = Number of attempts to establish RRC/ RAB made on day 1
C1 = Average RRC / RAB Congestion % on day 1
A2 = Number of attempts to establish RRC / RAB made on day 2
C2 = Average RRC / RAB Congestion % on day 2
An = Number of attempts to establish RRC / RAB made on day n
Cn = Average RRC / RAB Congestion % on day n
TRAI Audit Wireless Report-Assam Circle JFM Quarter-2016
100
POI Congestion% = [(A1 x C1) + (A2 x C2) +…….+ (An x Cn)] / (A1 + A2 +…+ An)
Where:-A1 = POI traffic offered on all POIs (no. of calls) on day 1
C1 = Average POI Congestion % on day 1
A2 = POI traffic offered on all POIs (no. of calls) on day 2
C2 = Average POI Congestion % on day 2
An = POI traffic offered on all POIs (no. of calls) on day n
Cn = Average POI Congestion % on day n
7. Benchmark:
RRC Congestion: ≤ 1%, RAB Congestion: ≤ 2%, POI Congestion: ≤ 0.5%
8. Audit Procedure –
Audit of the details of RRC and RAB congestion percentages computed by the operator (using OMC–Switch data only) would be conducted
The operator should be measuring this parameter during Time consistent busy hour (TCBH) only RRC
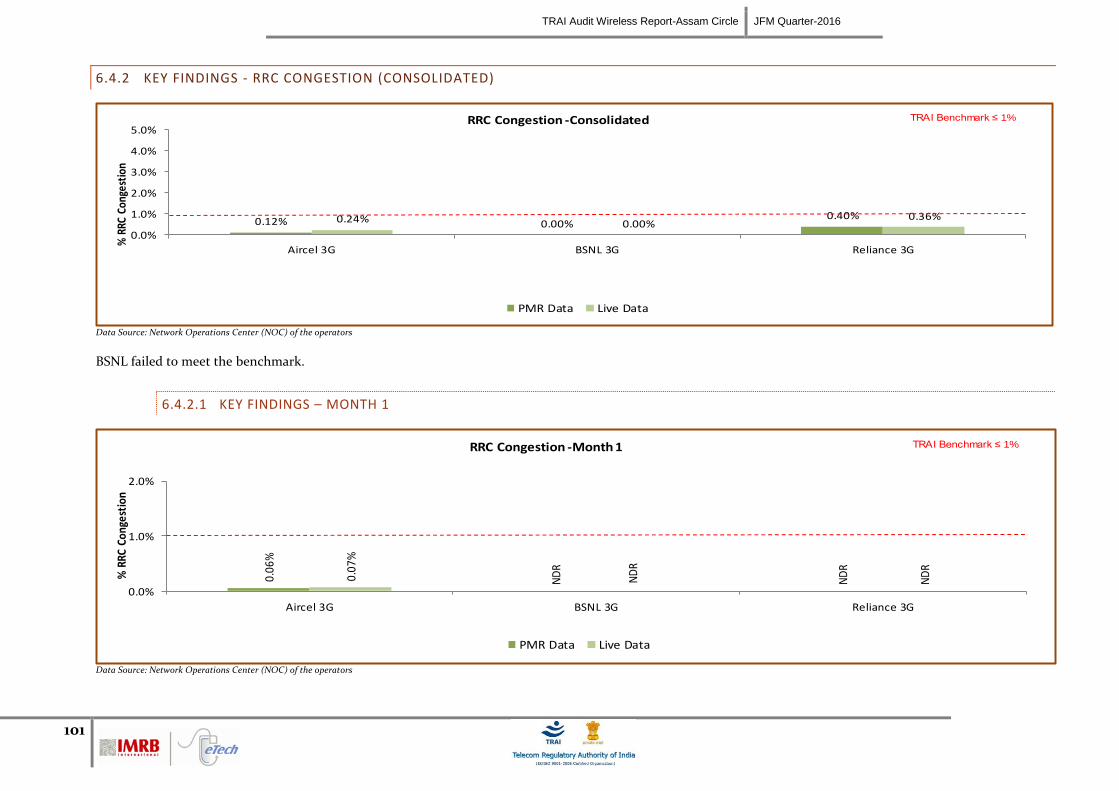
TRAI Audit Wireless Report-Assam Circle JFM Quarter-2016
101
6.4.2 KEY FINDINGS - RRC CONGESTION (CONSOLIDATED)
0.12% 0.00%0.40%0.24% 0.00%
0.36%
0.0%
1.0%
2.0%
3.0%
4.0%
5.0%
Aircel 3G BSNL 3G Reliance 3G
% R
RC C
onge
stio
n RRC Congestion -Consolidated
PMR Data Live Data
TRAI Benchmark ≤ 1%
Data Source: Network Operations Center (NOC) of the operators
BSNL failed to meet the benchmark.
6.4.2.1 KEY FINDINGS – MONTH 1
0.06
%
ND
R
ND
R
0.07
%
ND
R
ND
R
0.0%
1.0%
2.0%
Aircel 3G BSNL 3G Reliance 3G
% R
RC C
onge
stio
n
RRC Congestion -Month 1
PMR Data Live Data
TRAI Benchmark ≤ 1%
Data Source: Network Operations Center (NOC) of the operators
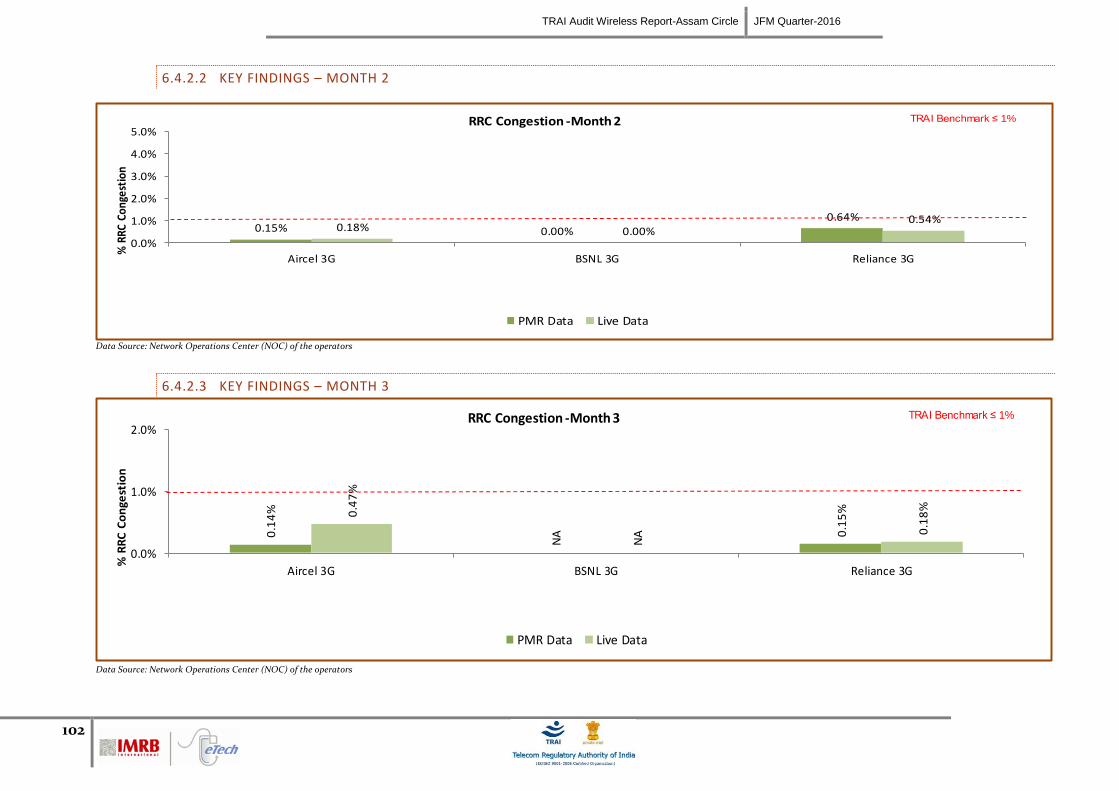
TRAI Audit Wireless Report-Assam Circle JFM Quarter-2016
102
6.4.2.2 KEY FINDINGS – MONTH 2
0.15% 0.00%0.64%
0.18% 0.00%0.54%
0.0%
1.0%
2.0%
3.0%
4.0%
5.0%
Aircel 3G BSNL 3G Reliance 3G
% R
RC C
onge
stio
n RRC Congestion -Month 2
PMR Data Live Data
TRAI Benchmark ≤ 1%
Data Source: Network Operations Center (NOC) of the operators
6.4.2.3 KEY FINDINGS – MONTH 3
0.1
4%
NA 0
.15
%0.4
7%
NA 0
.18
%
0.0%
1.0%
2.0%
Aircel 3G BSNL 3G Reliance 3G
% R
RC
Co
nge
stio
n
RRC Congestion -Month 3
PMR Data Live Data
TRAI Benchmark ≤ 1%
Data Source: Network Operations Center (NOC) of the operators
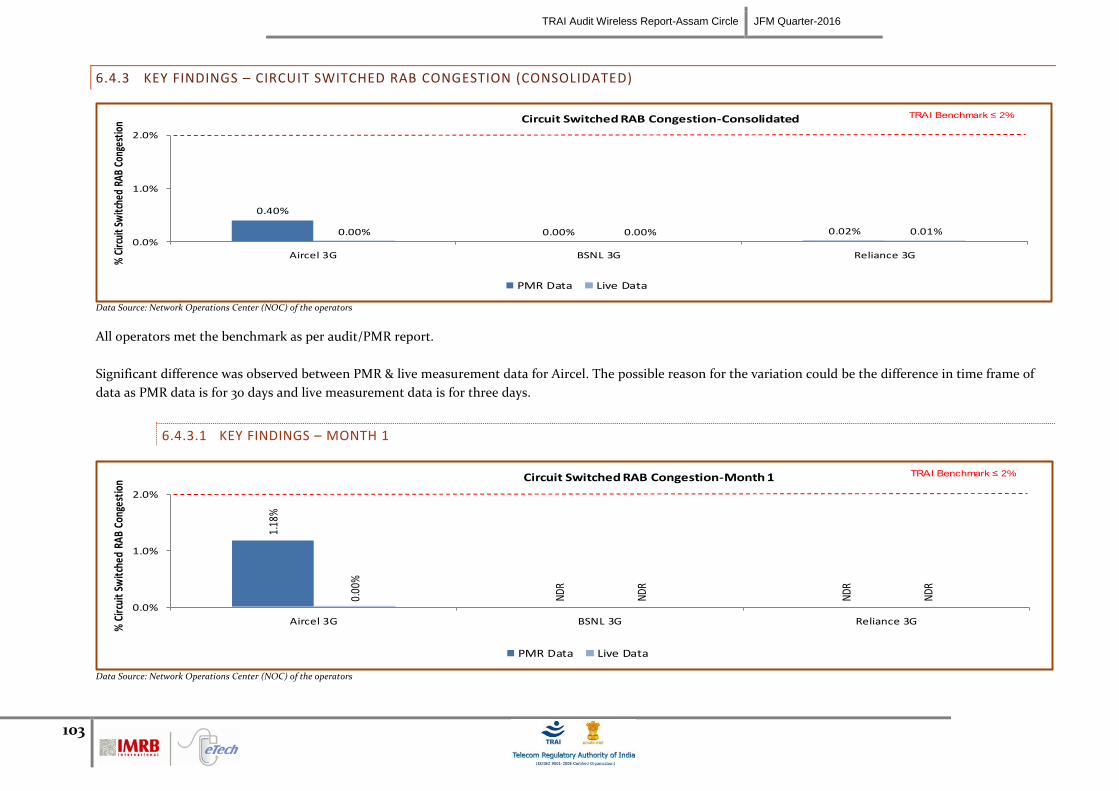
TRAI Audit Wireless Report-Assam Circle JFM Quarter-2016
103
6.4.3 KEY FINDINGS – CIRCUIT SWITCHED RAB CONGESTION (CONSOLIDATED)
0.40%
0.00% 0.02%0.00% 0.00% 0.01%0.0%
1.0%
2.0%
Aircel 3G BSNL 3G Reliance 3G
% C
ircui
t Sw
itche
d RA
B Co
nges
tion Circuit Switched RAB Congestion-Consolidated
PMR Data Live Data
TRAI Benchmark ≤ 2%
Data Source: Network Operations Center (NOC) of the operators
All operators met the benchmark as per audit/PMR report.
Significant difference was observed between PMR & live measurement data for Aircel. The possible reason for the variation could be the difference in time frame of
data as PMR data is for 30 days and live measurement data is for three days.
6.4.3.1 KEY FINDINGS – MONTH 1
1.18
%
NDR
NDR
0.00
%
NDR
NDR
0.0%
1.0%
2.0%
Aircel 3G BSNL 3G Reliance 3G
% C
ircui
t Sw
itche
d RA
B Co
nges
tion Circuit Switched RAB Congestion-Month 1
PMR Data Live Data
TRAI Benchmark ≤ 2%
Data Source: Network Operations Center (NOC) of the operators
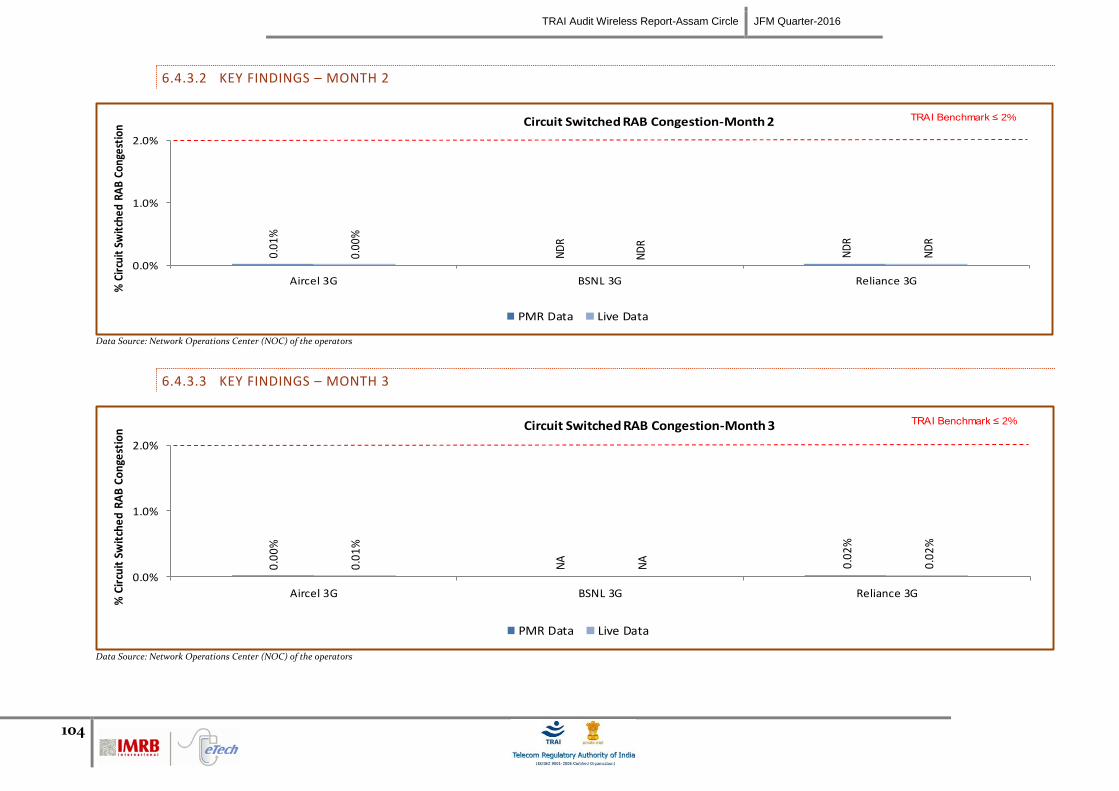
TRAI Audit Wireless Report-Assam Circle JFM Quarter-2016
104
6.4.3.2 KEY FINDINGS – MONTH 2
0.01
%
ND
R
ND
R
0.00
%
ND
R
ND
R
0.0%
1.0%
2.0%
Aircel 3G BSNL 3G Reliance 3G
% C
ircu
it S
wit
ched
RA
B Co
nges
tion
Circuit Switched RAB Congestion-Month 2
PMR Data Live Data
TRAI Benchmark ≤ 2%
Data Source: Network Operations Center (NOC) of the operators
6.4.3.3 KEY FINDINGS – MONTH 3
0.0
0%
NA
0.0
2%
0.0
1%
NA
0.0
2%
0.0%
1.0%
2.0%
Aircel 3G BSNL 3G Reliance 3G
% C
ircu
it S
wit
che
d R
AB
Co
nge
stio
n Circuit Switched RAB Congestion-Month 3
PMR Data Live Data
TRAI Benchmark ≤ 2%
Data Source: Network Operations Center (NOC) of the operators
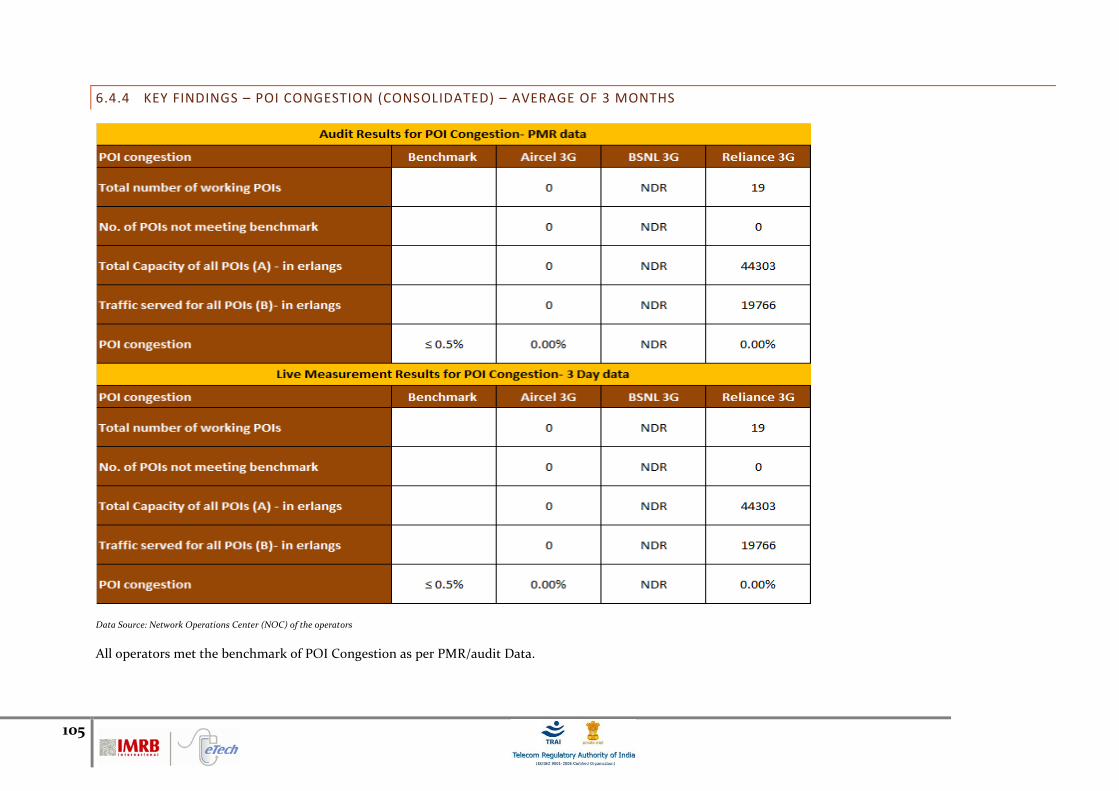
105
6.4.4 KEY FINDINGS – POI CONGESTION (CONSOLIDATED) – AVERAGE OF 3 MONTHS
Data Source: Network Operations Center (NOC) of the operators
All operators met the benchmark of POI Congestion as per PMR/audit Data.
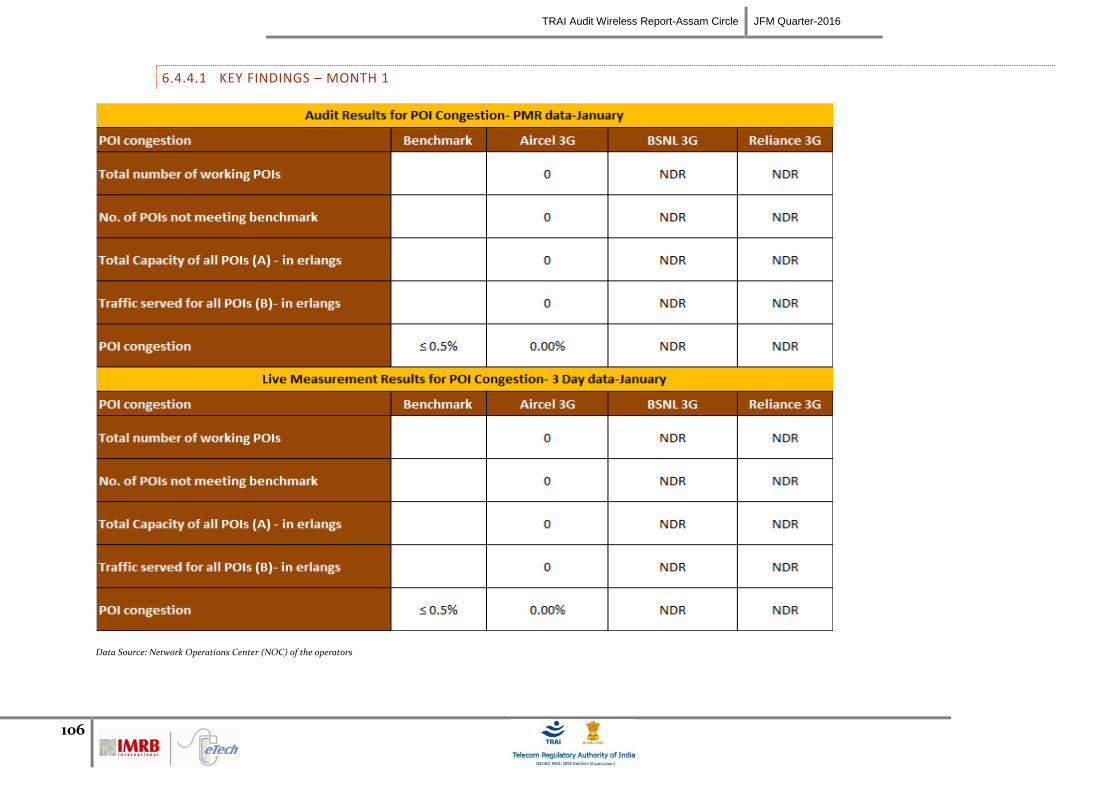
TRAI Audit Wireless Report-Assam Circle JFM Quarter-2016
106
6.4.4.1 KEY FINDINGS – MONTH 1
Data Source: Network Operations Center (NOC) of the operators
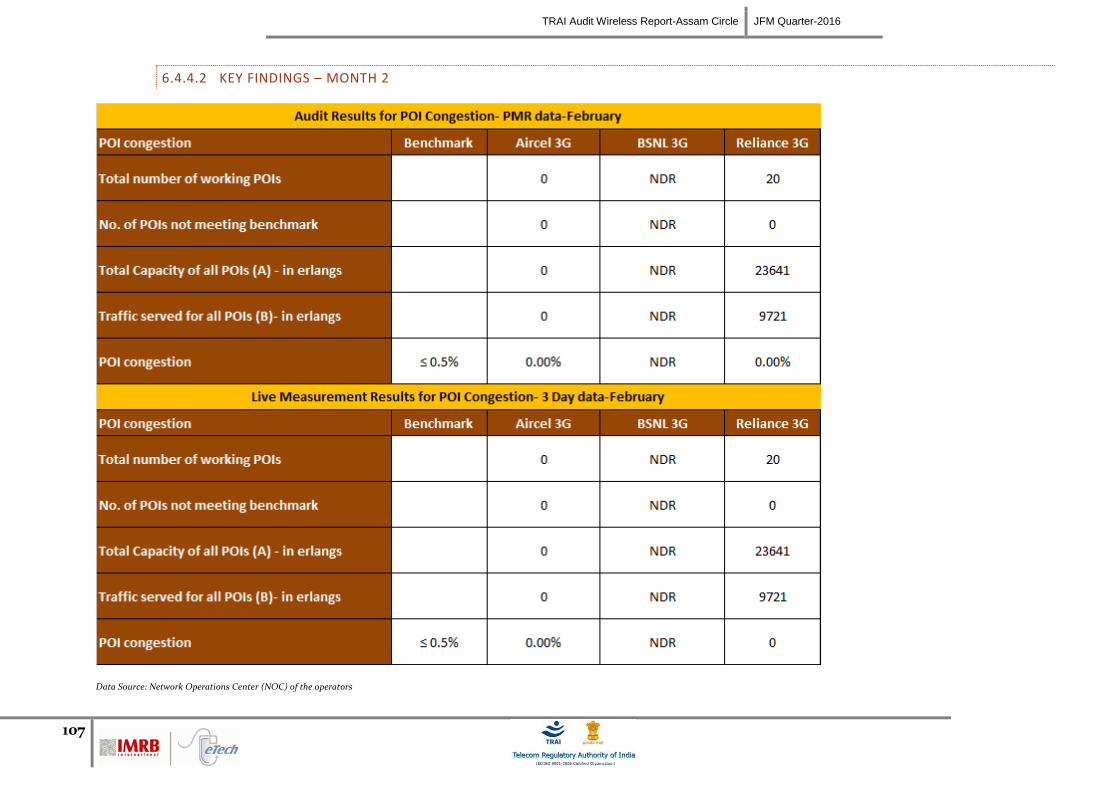
TRAI Audit Wireless Report-Assam Circle JFM Quarter-2016
107
6.4.4.2 KEY FINDINGS – MONTH 2
Data Source: Network Operations Center (NOC) of the operators
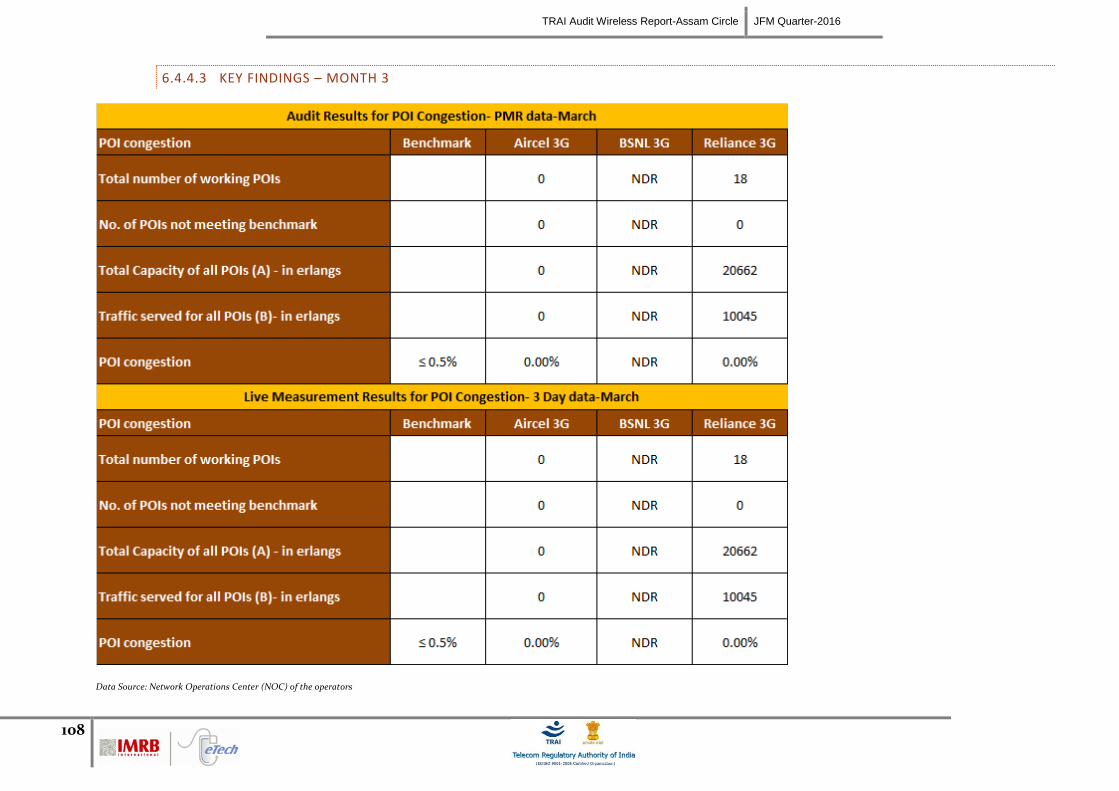
TRAI Audit Wireless Report-Assam Circle JFM Quarter-2016
108
6.4.4.3 KEY FINDINGS – MONTH 3
Data Source: Network Operations Center (NOC) of the operators
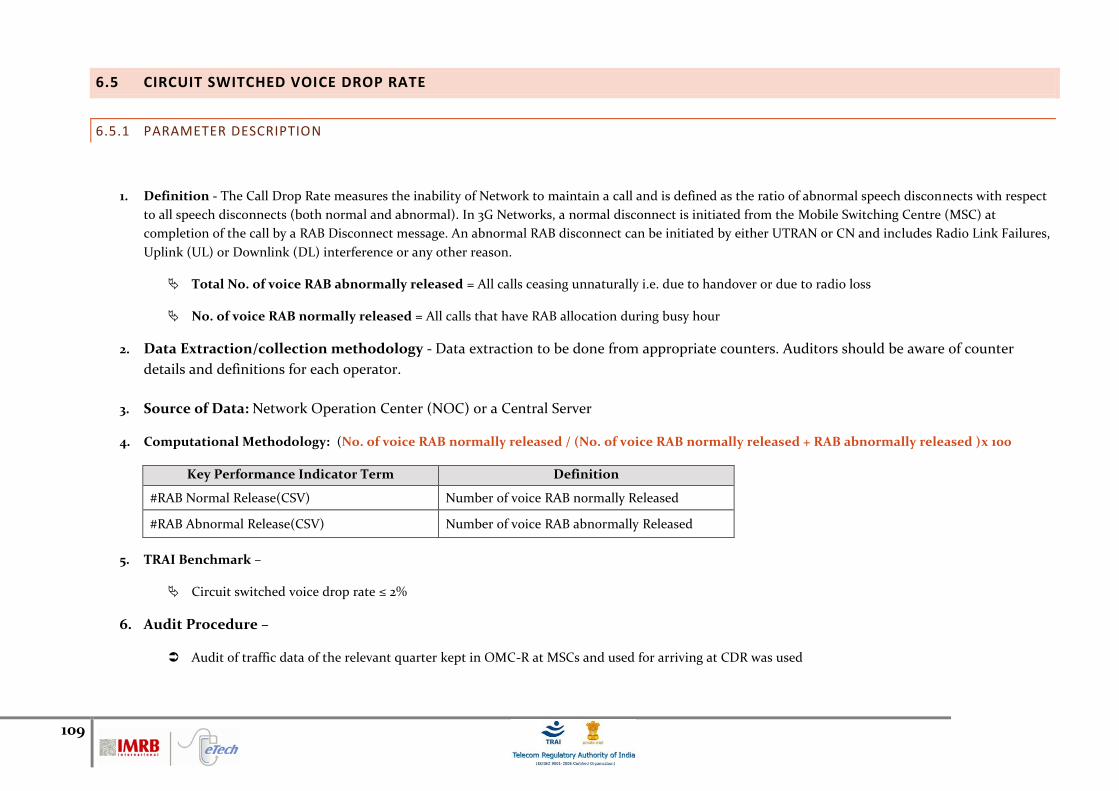
109
6.5 CIRCUIT SWITCHED VOICE DROP RATE
6.5.1 PARAMETER DESCRIPTION
1. Definition - The Call Drop Rate measures the inability of Network to maintain a call and is defined as the ratio of abnormal speech disconnects with respect
to all speech disconnects (both normal and abnormal). In 3G Networks, a normal disconnect is initiated from the Mobile Switching Centre (MSC) at
completion of the call by a RAB Disconnect message. An abnormal RAB disconnect can be initiated by either UTRAN or CN and includes Radio Link Failures,
Uplink (UL) or Downlink (DL) interference or any other reason.
Total No. of voice RAB abnormally released = All calls ceasing unnaturally i.e. due to handover or due to radio loss
No. of voice RAB normally released = All calls that have RAB allocation during busy hour
2. Data Extraction/collection methodology - Data extraction to be done from appropriate counters. Auditors should be aware of counter
details and definitions for each operator.
3. Source of Data: Network Operation Center (NOC) or a Central Server
4. Computational Methodology: (No. of voice RAB normally released / (No. of voice RAB normally released + RAB abnormally released )x 100
Key Performance Indicator Term Definition
#RAB Normal Release(CSV) Number of voice RAB normally Released
#RAB Abnormal Release(CSV) Number of voice RAB abnormally Released
5. TRAI Benchmark –
Circuit switched voice drop rate ≤ 2%
6. Audit Procedure –
Audit of traffic data of the relevant quarter kept in OMC-R at MSCs and used for arriving at CDR was used
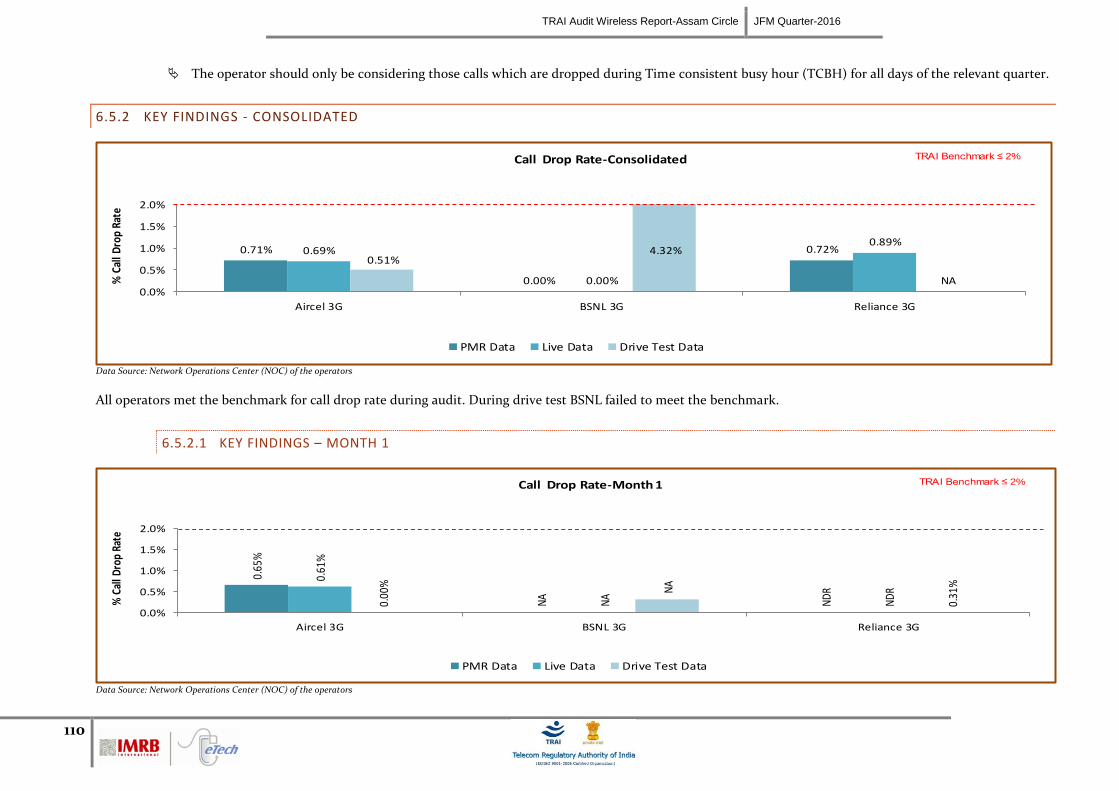
TRAI Audit Wireless Report-Assam Circle JFM Quarter-2016
110
The operator should only be considering those calls which are dropped during Time consistent busy hour (TCBH) for all days of the relevant quarter.
6.5.2 KEY FINDINGS - CONSOLIDATED
0.71%
0.00%
0.72%0.69%
0.00%
0.89%
0.51%4.32%
NA0.0%
0.5%
1.0%
1.5%
2.0%
Aircel 3G BSNL 3G Reliance 3G
% C
all D
rop
Rate
Call Drop Rate-Consolidated
PMR Data Live Data Drive Test Data
TRAI Benchmark ≤ 2%
Data Source: Network Operations Center (NOC) of the operators
All operators met the benchmark for call drop rate during audit. During drive test BSNL failed to meet the benchmark.
6.5.2.1 KEY FINDINGS – MONTH 1
0.65
%
NA
ND
R
0.61
%
NA
ND
R
0.00
% NA
0.31
%
0.0%
0.5%
1.0%
1.5%
2.0%
Aircel 3G BSNL 3G Reliance 3G
% C
all D
rop
Rate
Call Drop Rate-Month 1
PMR Data Live Data Drive Test Data
TRAI Benchmark ≤ 2%
Data Source: Network Operations Center (NOC) of the operators
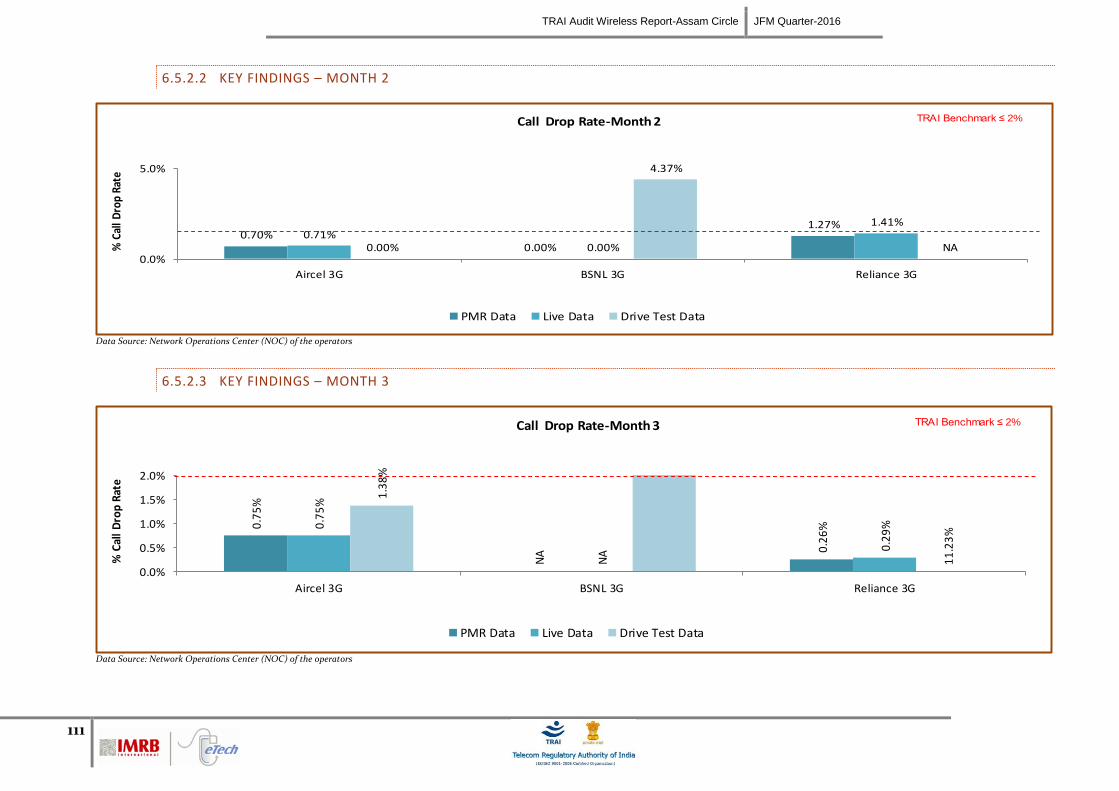
TRAI Audit Wireless Report-Assam Circle JFM Quarter-2016
111
6.5.2.2 KEY FINDINGS – MONTH 2
0.70%0.00%
1.27%0.71%
0.00%
1.41%
0.00%
4.37%
NA0.0%
5.0%
Aircel 3G BSNL 3G Reliance 3G
% C
all D
rop
Rate
Call Drop Rate-Month 2
PMR Data Live Data Drive Test Data
TRAI Benchmark ≤ 2%
Data Source: Network Operations Center (NOC) of the operators
6.5.2.3 KEY FINDINGS – MONTH 3
0.7
5%
NA 0
.26
%0.7
5%
NA 0
.29
%
1.3
8%
11
.23
%
0.0%
0.5%
1.0%
1.5%
2.0%
Aircel 3G BSNL 3G Reliance 3G
% C
all
Dro
p R
ate
Call Drop Rate-Month 3
PMR Data Live Data Drive Test Data
TRAI Benchmark ≤ 2%
Data Source: Network Operations Center (NOC) of the operators
TRAI Audit Wireless Report-Assam Circle JFM Quarter-2016
112
6.6 WORST AFFECTED CELLS HAVING MORE THAN 3% CIRCUIT SWITCHED VOICE DROP RATE
6.6.1 PARAMETER DESCRIPTION
1. Definition- Cells having more than 3% circuit switch voice quality: The existing parameter has been amended to cover 3G Networks to
assess worst affected cells having more than 3% CSV Drop Rate.
2. Data Extraction/collection methodology - Data extraction to be done from appropriate counters. Auditors should be aware of counter
details and definitions for each operator.
3. Source of Data: Network Operation Center (NOC) or a Central Server
4. Computational Methodology: (Number of cells having CSV drop rate > 3% during CBBH in a month / Total number of cells in the licensed area) x
100
5. TRAI Benchmark –
Worst affected cells having CSV drop rate > 3% during CBBH in a month ≤ 3%
6. Audit Procedure –
Audit of traffic data of the relevant quarter kept in OMC-R at MSCs and used for arriving at CDR would be conducted.
The operator should only be considering those calls which are dropped during Cell Bouncing Busy hour (CBBH) for all days of the relevant quarter.
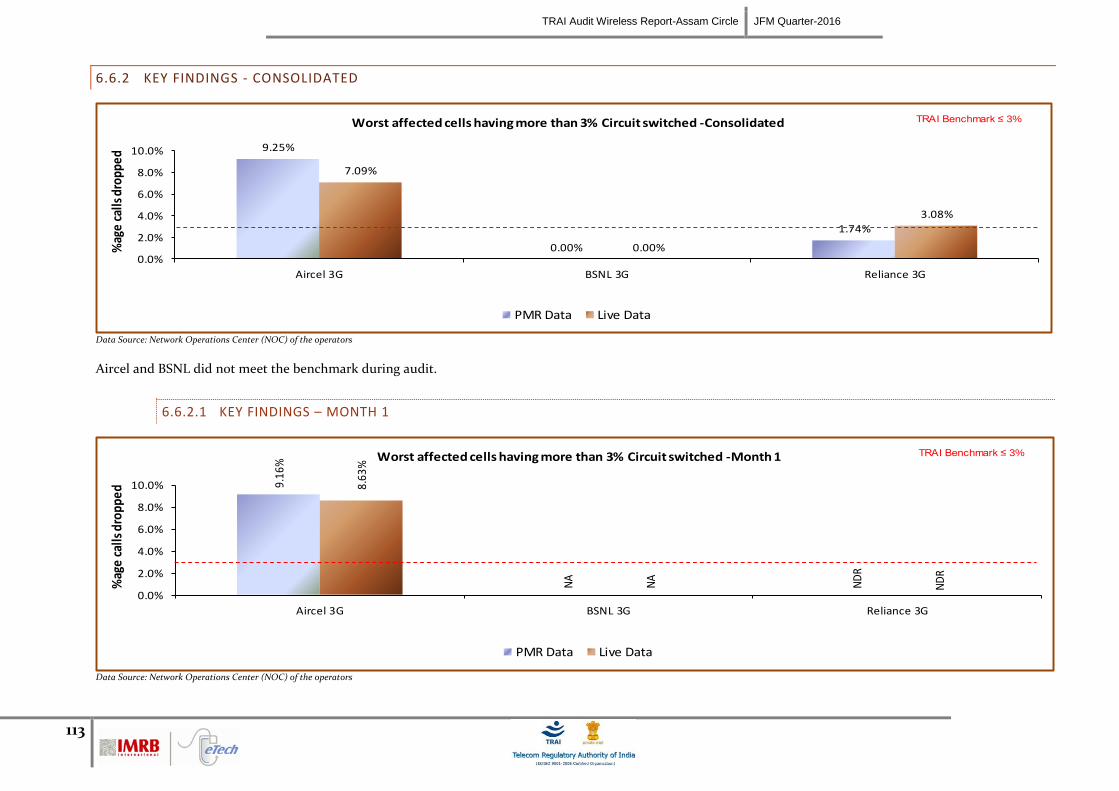
TRAI Audit Wireless Report-Assam Circle JFM Quarter-2016
113
6.6.2 KEY FINDINGS - CONSOLIDATED
9.25%
0.00%
1.74%
7.09%
0.00%
3.08%
0.0%
2.0%
4.0%
6.0%
8.0%
10.0%
Aircel 3G BSNL 3G Reliance 3G
%ag
e ca
lls d
ropp
edWorst affected cells having more than 3% Circuit switched -Consolidated
PMR Data Live Data
TRAI Benchmark ≤ 3%
Data Source: Network Operations Center (NOC) of the operators
Aircel and BSNL did not meet the benchmark during audit.
6.6.2.1 KEY FINDINGS – MONTH 1
9.16
%
NA
ND
R
8.63
%
NA
ND
R
0.0%
2.0%
4.0%
6.0%
8.0%
10.0%
Aircel 3G BSNL 3G Reliance 3G
%ag
e ca
lls d
ropp
ed
Worst affected cells having more than 3% Circuit switched -Month 1
PMR Data Live Data
TRAI Benchmark ≤ 3%
Data Source: Network Operations Center (NOC) of the operators
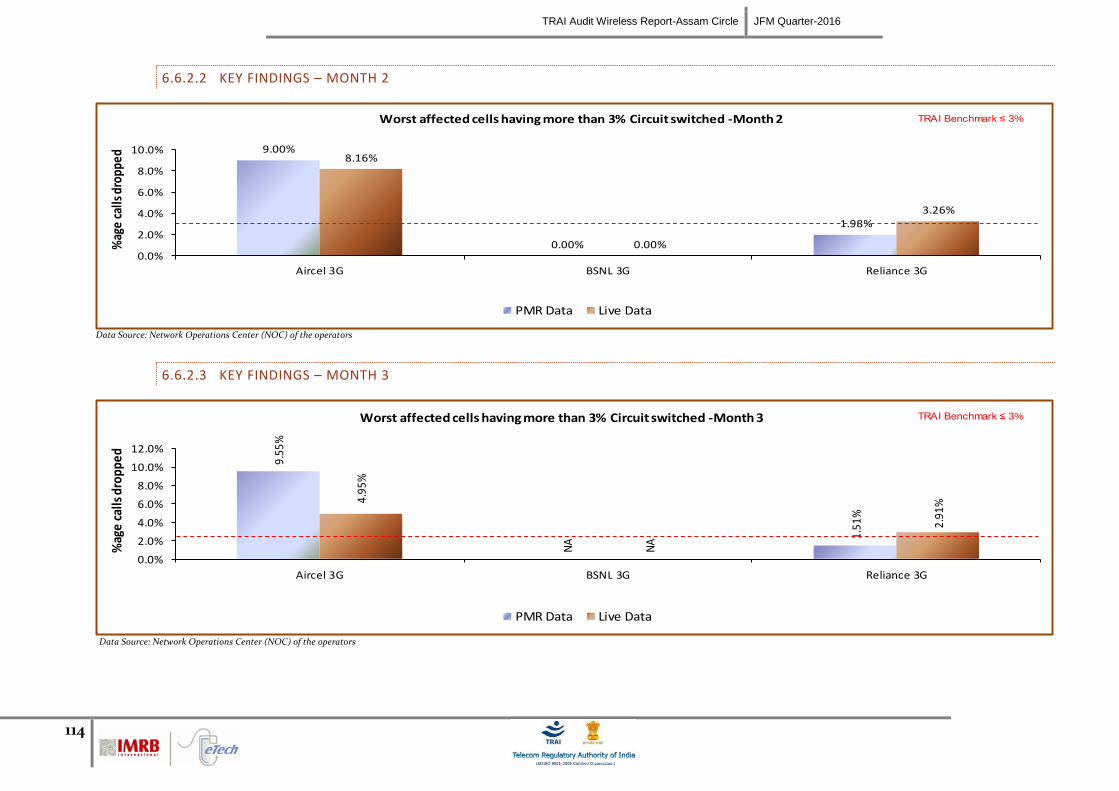
TRAI Audit Wireless Report-Assam Circle JFM Quarter-2016
114
6.6.2.2 KEY FINDINGS – MONTH 2
9.00%
0.00%
1.98%
8.16%
0.00%
3.26%
0.0%
2.0%
4.0%
6.0%
8.0%
10.0%
Aircel 3G BSNL 3G Reliance 3G
%ag
e ca
lls d
ropp
edWorst affected cells having more than 3% Circuit switched -Month 2
PMR Data Live Data
TRAI Benchmark ≤ 3%
Data Source: Network Operations Center (NOC) of the operators
6.6.2.3 KEY FINDINGS – MONTH 3
9.55
%
NA
1.51
%
4.95
%
NA
2.91
%
0.0%
2.0%
4.0%
6.0%
8.0%
10.0%
12.0%
Aircel 3G BSNL 3G Reliance 3G
%ag
e ca
lls d
ropp
ed
Worst affected cells having more than 3% Circuit switched -Month 3
PMR Data Live Data
TRAI Benchmark ≤ 3%
Data Source: Network Operations Center (NOC) of the operators
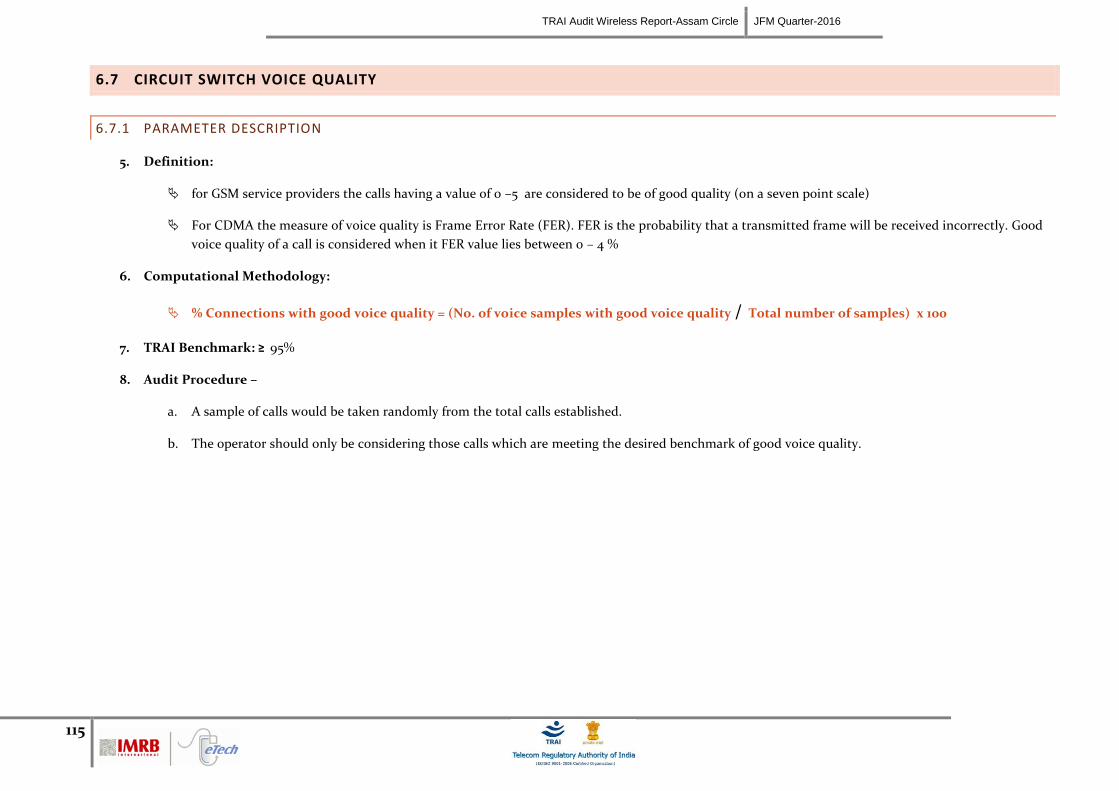
TRAI Audit Wireless Report-Assam Circle JFM Quarter-2016
115
6.7 CIRCUIT SWITCH VOICE QUALITY
6.7.1 PARAMETER DESCRIPTION
5. Definition:
for GSM service providers the calls having a value of 0 –5 are considered to be of good quality (on a seven point scale)
For CDMA the measure of voice quality is Frame Error Rate (FER). FER is the probability that a transmitted frame will be received incorrectly. Good
voice quality of a call is considered when it FER value lies between 0 – 4 %
6. Computational Methodology:
% Connections with good voice quality = (No. of voice samples with good voice quality / Total number of samples) x 100
7. TRAI Benchmark: ≥ 95%
8. Audit Procedure –
a. A sample of calls would be taken randomly from the total calls established.
b. The operator should only be considering those calls which are meeting the desired benchmark of good voice quality.
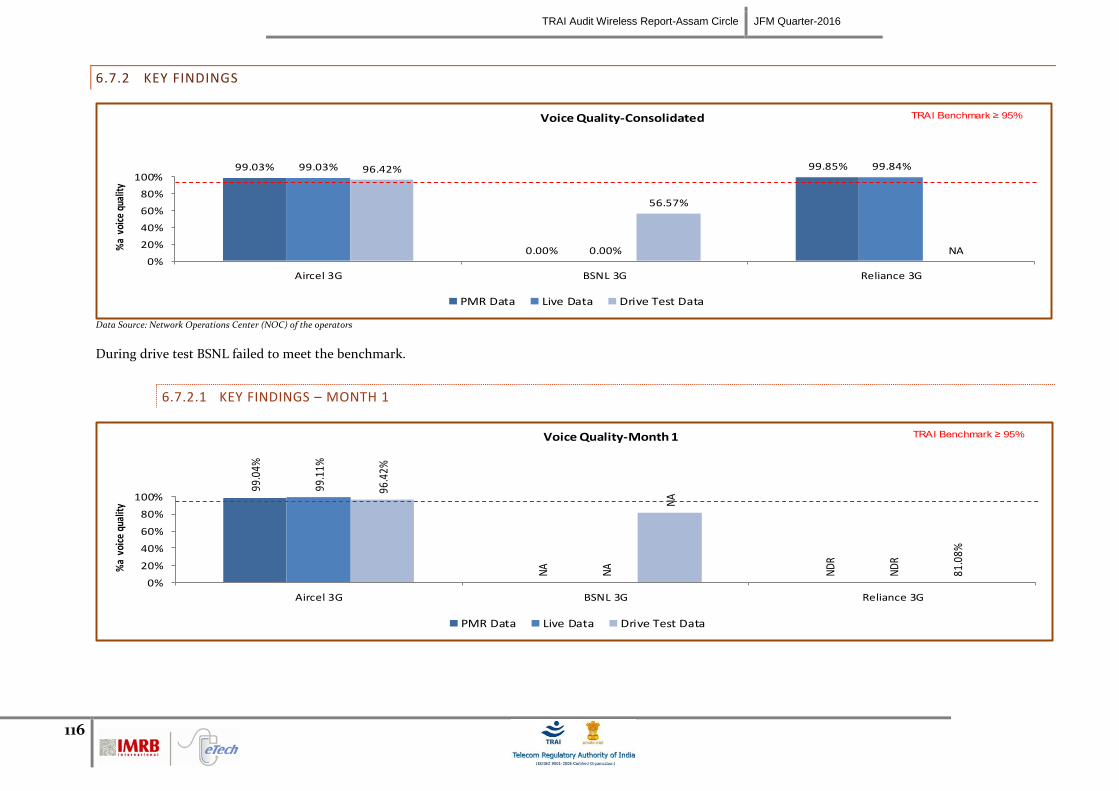
TRAI Audit Wireless Report-Assam Circle JFM Quarter-2016
116
6.7.2 KEY FINDINGS
99.03%
0.00%
99.85%99.03%
0.00%
99.84%96.42%
56.57%
NA0%
20%
40%
60%
80%
100%
Aircel 3G BSNL 3G Reliance 3G
%a
voi
ce q
ualit
yVoice Quality-Consolidated
PMR Data Live Data Drive Test Data
TRAI Benchmark ≥ 95%
Data Source: Network Operations Center (NOC) of the operators
During drive test BSNL failed to meet the benchmark.
6.7.2.1 KEY FINDINGS – MONTH 1
99.0
4%
NA
ND
R
99.1
1%
NA
ND
R
96.4
2%
NA
81.0
8%
0%
20%
40%
60%
80%
100%
Aircel 3G BSNL 3G Reliance 3G
%a
voi
ce q
ualit
y
Voice Quality-Month 1
PMR Data Live Data Drive Test Data
TRAI Benchmark ≥ 95%
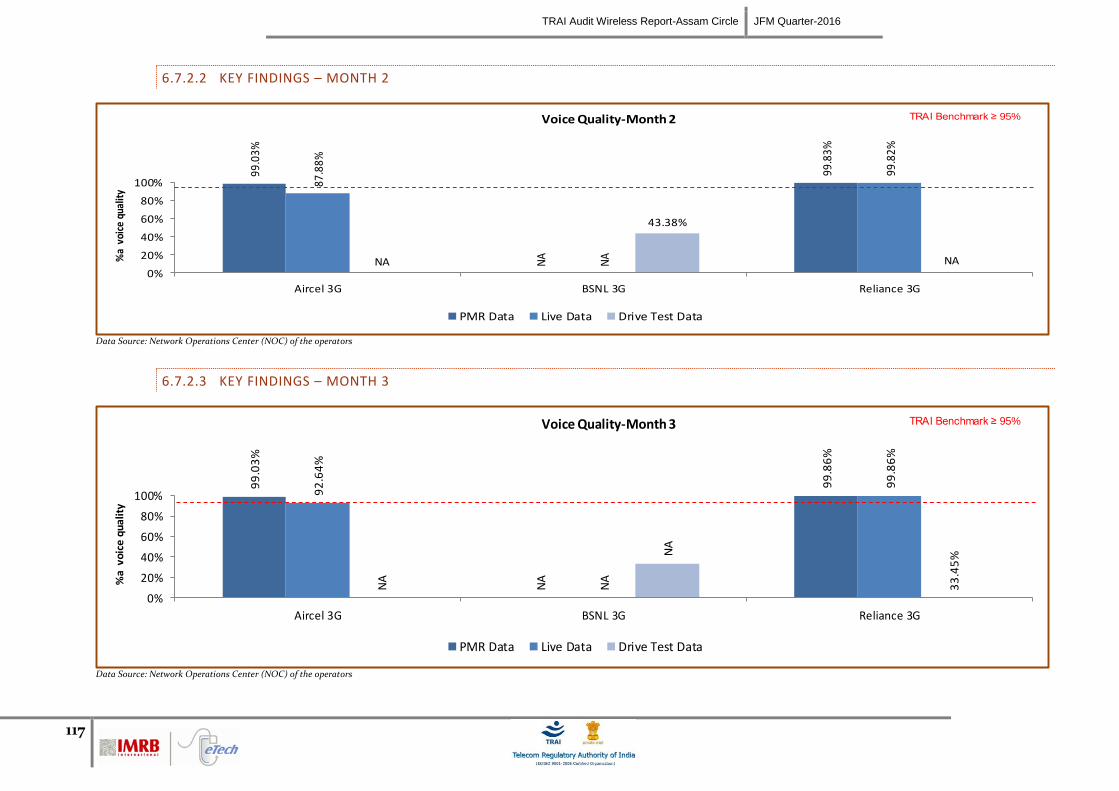
TRAI Audit Wireless Report-Assam Circle JFM Quarter-2016
117
6.7.2.2 KEY FINDINGS – MONTH 2
99.0
3%
NA
99.8
3%
87.8
8%
NA
99.8
2%
NA
43.38%
NA0%
20%
40%
60%
80%
100%
Aircel 3G BSNL 3G Reliance 3G
%a
voi
ce q
ualit
yVoice Quality-Month 2
PMR Data Live Data Drive Test Data
TRAI Benchmark ≥ 95%
Data Source: Network Operations Center (NOC) of the operators
6.7.2.3 KEY FINDINGS – MONTH 3
99
.03
%
NA
99
.86
%
92
.64
%
NA
99
.86
%
NA
NA
33
.45
%
0%
20%
40%
60%
80%
100%
Aircel 3G BSNL 3G Reliance 3G
%a
vo
ice
qu
ali
ty
Voice Quality-Month 3
PMR Data Live Data Drive Test Data
TRAI Benchmark ≥ 95%
Data Source: Network Operations Center (NOC) of the operators
TRAI Audit Wireless Report-Assam Circle JFM Quarter-2016
118
7 PARAMETER DESCRIPTION & DETAILED FINDINGS - WIRELESS DATA SERVICES (2G & 3G)
7.1 SERVICE ACTIVATION /PROVISIONING FOR 2G & 3G
7.1.1 PARAMETER DESCRIPTION
This refers to the activation of services after activation of the SIM. This involves programming the various databases with the customer's information and any
gateways to standard Internet chat or mail services or any data services. The service provider typically sends these settings to the subscriber's handset using SMS or
WAP.
% activation done within 4 hours = Total Time Taken for Activation ×100 Total request time made
Benchmark: >=95%
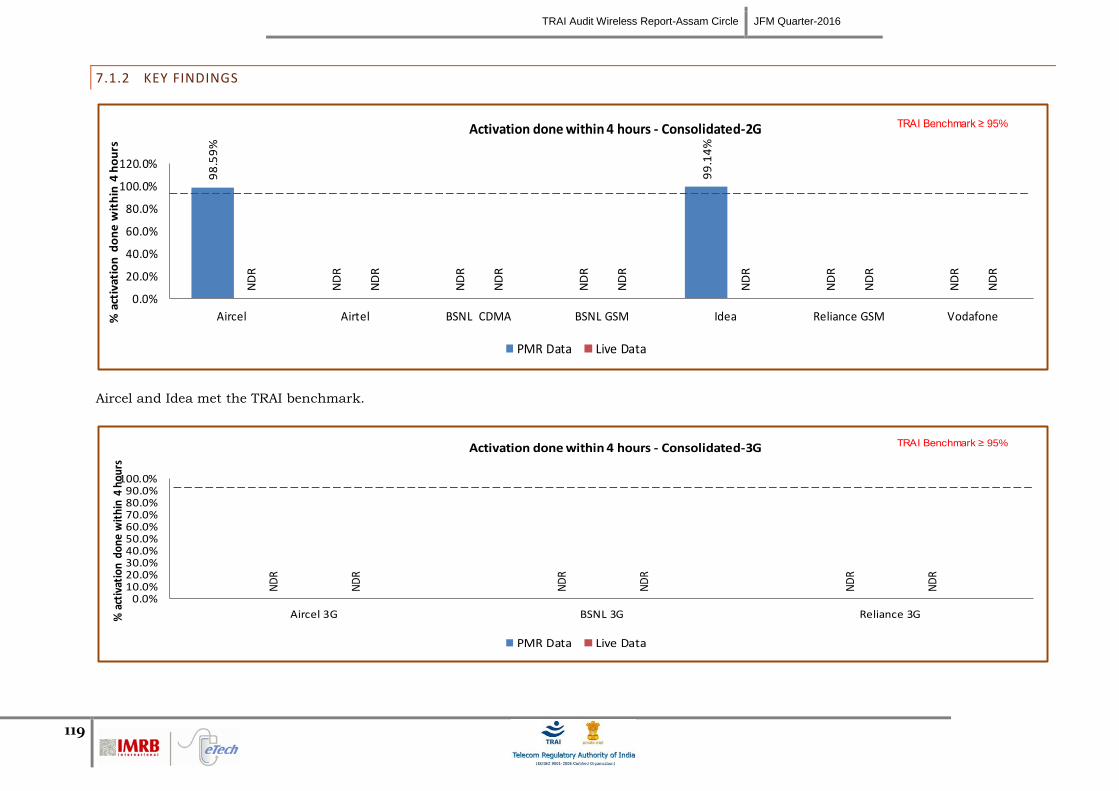
TRAI Audit Wireless Report-Assam Circle JFM Quarter-2016
119
7.1.2 KEY FINDINGS
98
.59
%
ND
R
ND
R
ND
R
99
.14
%
ND
R
ND
R
ND
R
ND
R
ND
R
ND
R
ND
R
ND
R
ND
R
0.0%
20.0%
40.0%
60.0%
80.0%
100.0%
120.0%
Aircel Airtel BSNL CDMA BSNL GSM Idea Reliance GSM Vodafone% a
ctiv
atio
n d
on
e w
ith
in 4
ho
urs
Activation done within 4 hours - Consolidated-2G
PMR Data Live Data
TRAI Benchmark ≥ 95%
Aircel and Idea met the TRAI benchmark.
ND
R
ND
R
ND
R
ND
R
ND
R
ND
R
0.0%10.0%20.0%30.0%40.0%50.0%60.0%70.0%80.0%90.0%
100.0%
Aircel 3G BSNL 3G Reliance 3G% a
ctiv
atio
n do
ne w
ithi
n 4
hour
s
Activation done within 4 hours - Consolidated-3G
PMR Data Live Data
TRAI Benchmark ≥ 95%
TRAI Audit Wireless Report-Assam Circle JFM Quarter-2016
120
7.2 PDP CONTEXT ACTIVATION SUCCESS RATE FOR 2G & 3G
7.2.1 PARAMETER DESCRIPTION
A Packet Data Protocol (PDP) context specifies access to an external packet-switching network. The data associated with the PDP context contains information such
as the type of packet-switching network, the Mobile Station PDP (MS PDP) address that is the IP address, the reference of Gateway GPRS Support Node (GGSN), and
the requested QoS. A PDP context is handled by the MS, Serving GPRS Support Node (SGSN) and GGSN and is identified by a mobile's PDP address within these
entities. Several PDP contexts can be activated at the same time within a given MS.
Measurement
This measurement provides the number of successfully completed PDP context activations. For these context activations, the GGSN is updated successfully and a
report of PDP context activation success is generated at GGSN.
PDP Context Activation Success Rate (%) =
Number of successfully completed PDP context activations ×100 Total attempts of context activation Benchmark: >=95%
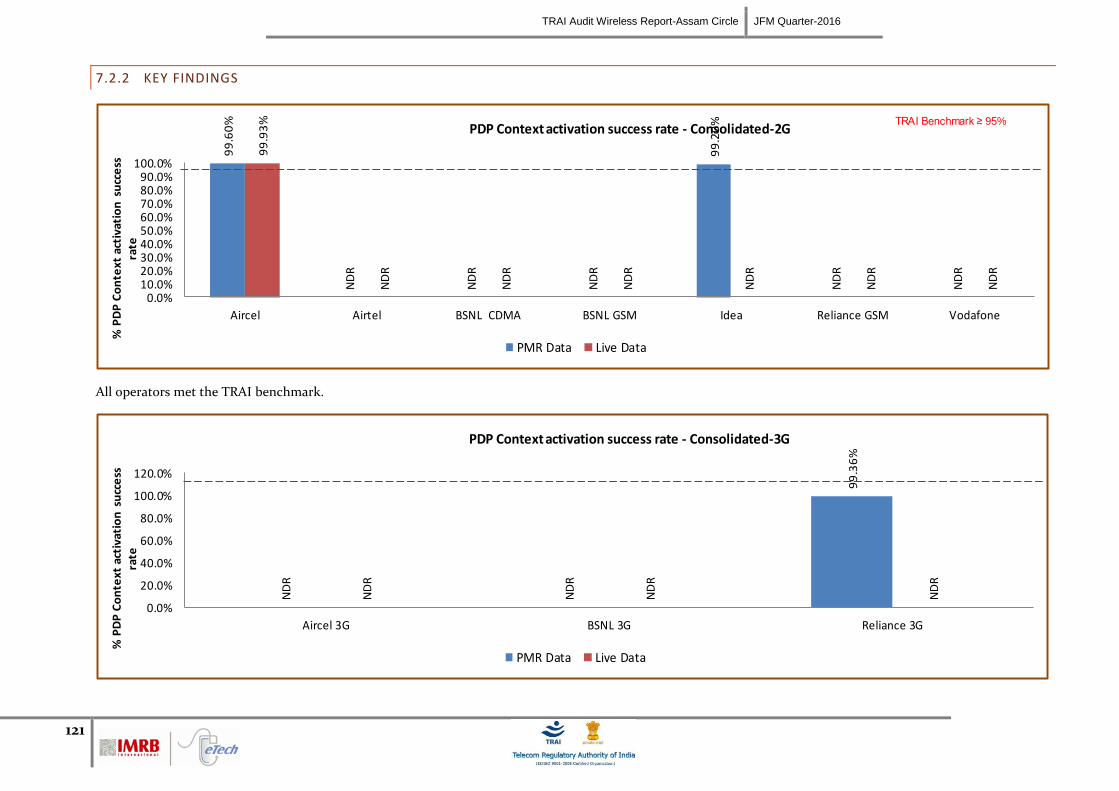
TRAI Audit Wireless Report-Assam Circle JFM Quarter-2016
121
7.2.2 KEY FINDINGS
99
.60
%
ND
R
ND
R
ND
R
99
.20
%
ND
R
ND
R
99
.93
%
ND
R
ND
R
ND
R
ND
R
ND
R
ND
R
0.0%10.0%20.0%30.0%40.0%50.0%60.0%70.0%80.0%90.0%
100.0%
Aircel Airtel BSNL CDMA BSNL GSM Idea Reliance GSM Vodafone
% P
DP
Co
nte
xt a
ctiv
atio
n s
ucc
ess
ra
te
PDP Context activation success rate - Consolidated-2G
PMR Data Live Data
TRAI Benchmark ≥ 95%
All operators met the TRAI benchmark.
ND
R
ND
R
99
.36
%
ND
R
ND
R
ND
R
0.0%
20.0%
40.0%
60.0%
80.0%
100.0%
120.0%
Aircel 3G BSNL 3G Reliance 3G
% P
DP
Co
nte
xt a
ctiv
atio
n s
ucc
ess
ra
te
PDP Context activation success rate - Consolidated-3G
PMR Data Live Data
TRAI Audit Wireless Report-Assam Circle JFM Quarter-2016
122
7.3 DROP RATE FOR 2G & 3G
7.3.1 PARAMETER DESCRIPTION
It measures the inability of Network to maintain a connection and is defined as the ratio of abnormal disconnects w.r.t. all disconnects (both normal and abnormal).
An abnormal disconnect may happen because of Radio Link Failures, Uplink (UL) or Downlink (DL) interference, bad coverage, unsuccessful handovers or any other
reason. The drop rate is to be measured for all generations of the technologies separately.
Drop rate = No. of Dropped data Calls ×100
No. of Successful data calls
Benchmark: <=5%
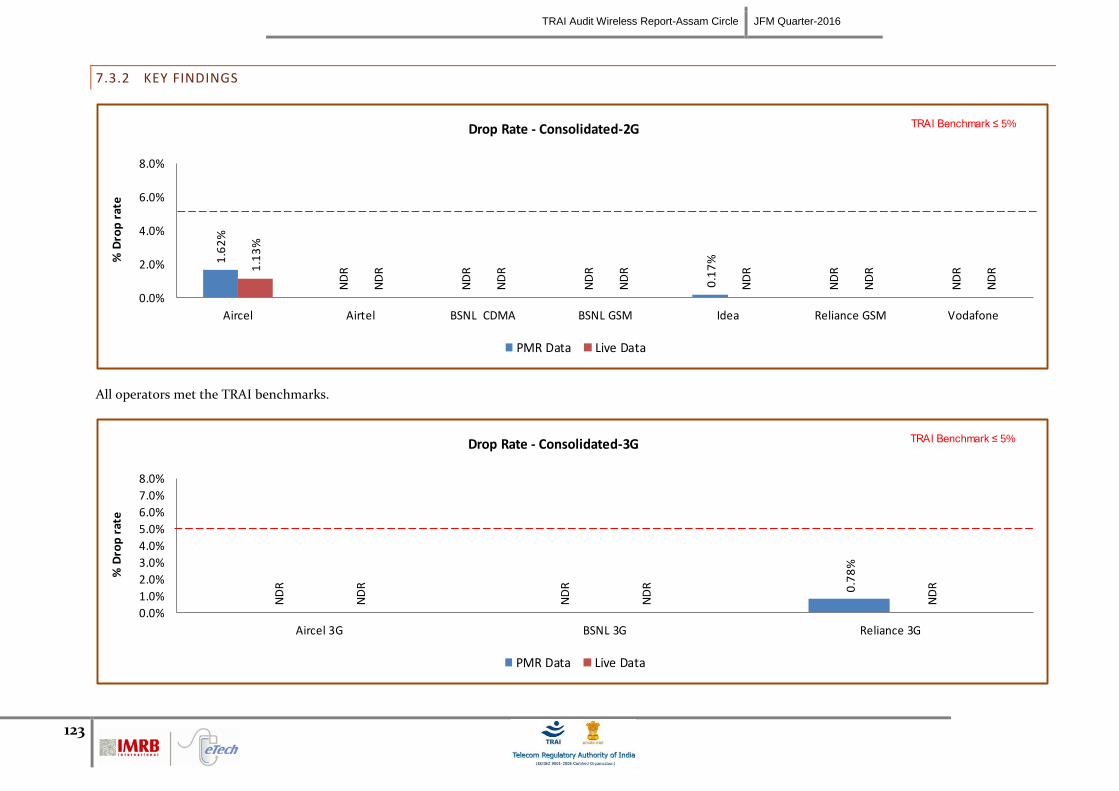
TRAI Audit Wireless Report-Assam Circle JFM Quarter-2016
123
7.3.2 KEY FINDINGS
1.6
2%
ND
R
ND
R
ND
R
0.1
7%
ND
R
ND
R1.1
3%
ND
R
ND
R
ND
R
ND
R
ND
R
ND
R
0.0%
2.0%
4.0%
6.0%
8.0%
Aircel Airtel BSNL CDMA BSNL GSM Idea Reliance GSM Vodafone
% D
rop
rat
e
Drop Rate - Consolidated-2G
PMR Data Live Data
TRAI Benchmark ≤ 5%
All operators met the TRAI benchmarks.
ND
R
ND
R 0.7
8%
ND
R
ND
R
ND
R
0.0%
1.0%
2.0%
3.0%
4.0%
5.0%
6.0%
7.0%
8.0%
Aircel 3G BSNL 3G Reliance 3G
% D
rop
rat
e
Drop Rate - Consolidated-3G
PMR Data Live Data
TRAI Benchmark ≤ 5%
TRAI Audit Wireless Report-Assam Circle JFM Quarter-2016
124
8 PARAMETER DESCRIPTION AND DETAILED FINDINGS – NON-NETWORK PARAMETERS
8.1 METERING AND BILLING CREDIBILITY
The billing complaints for postpaid are calculated by averaging over one billing cycle in a quarter. For example, there are three billing cycles in a quarter, the data for
each billing cycle is calculated separately and then averaged over.
The charging complaints for prepaid are calculated by taking all complaints in a quarter.
8.1.1 PARAMETER DESCRIPTION
All the complaints related to billing/ charging as per clause 3.7.2 of QoS regulation of 20th
March, 2009 were covered. The types of billing complaints covered are
listed below.
Payments made and not credited to the subscriber account
Payment made on time but late payment charge levied wrongly
Wrong roaming charges
Double charges
Charging for toll free services
Local calls charged/billed as STD/ISD or vice versa
Calls or messages made disputed
Validity related complaints
Credit agreed to be given in resolution of complaint, but not accounted in the bill
Charging for services provided without consent
Charging not as per tariff plans or top up vouchers/ special packs etc.
Overcharging or undercharging
TRAI Audit Wireless Report-Assam Circle JFM Quarter-2016
125
In addition to the above, any billing complaint which leads to billing error, waiver, refund, credit, or any adjustment is also considered as valid billing complaint for calculating the number of disputed bills.
Computational Methodology:
Billing complaints per 100 bills issued (Postpaid) = (Total billing complaints** received during the relevant billing cycle / Total bills generated*
during the relevant billing cycle)*100
*Operator to include all types of bills generated for customers. This would include printed bills, online bills and any other forms of bills generated
**Billing complaints here shall include only dispute related issues (including those that February arise because of a lack of awareness at the
subscribers’ end). It does not include any provisional issues (such as delayed dispatch of billing statements, etc.) in which the operator has opened a
ticket internally.
Charging complaints per 100 subscribers (Prepaid) = (Total charging complaints received during the quarter/ Total number of subscribers
reported by the operator at the end of the quarter) * 100
TRAI Benchmark: <= 0.1%
Audit Procedure:
Audit of billing complaint details for the complaints received during the quarter and used for arriving at the benchmark reported to TRAI would be
conducted
For Postpaid, the total billing complaints would be audited by averaging over billing cycles in a quarter
For Prepaid, the data of total charging complaints in a quarter would be taken for the purpose of audit
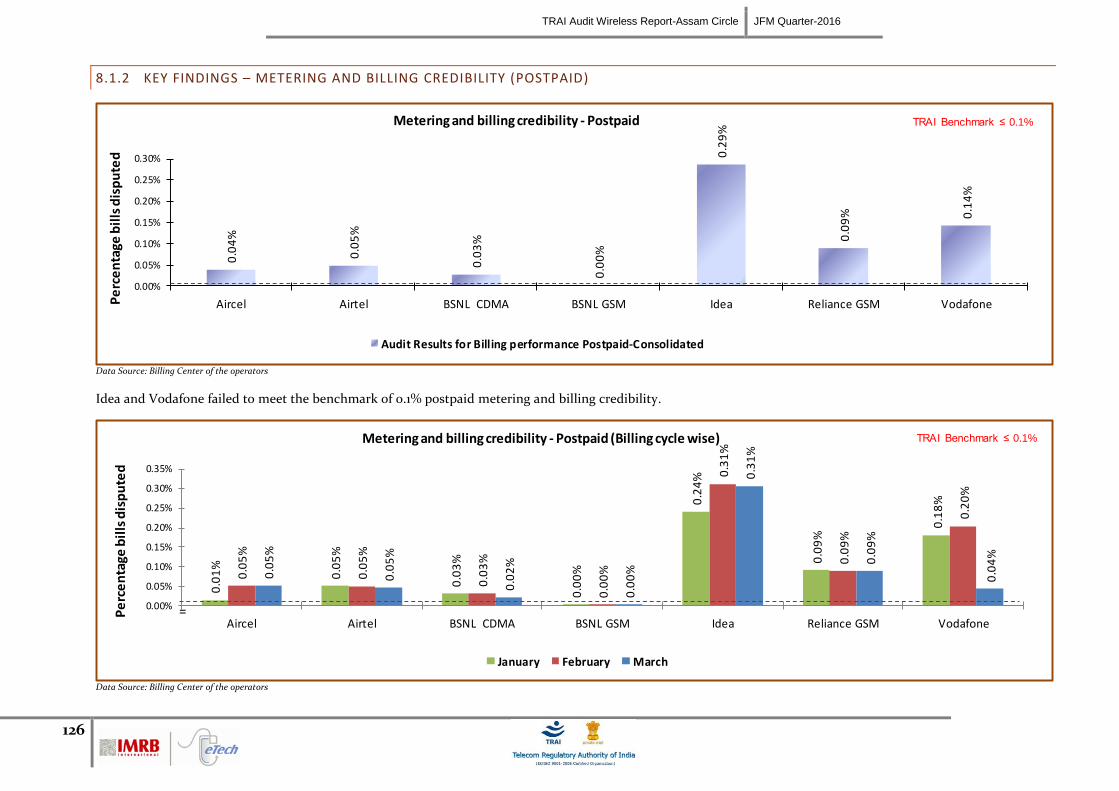
TRAI Audit Wireless Report-Assam Circle JFM Quarter-2016
126
8.1.2 KEY FINDINGS – METERING AND BILLING CREDIBILITY (POSTPAID)
0.0
4%
0.0
5%
0.0
3%
0.0
0%
0.2
9%
0.0
9% 0
.14
%
0.00%
0.05%
0.10%
0.15%
0.20%
0.25%
0.30%
Aircel Airtel BSNL CDMA BSNL GSM Idea Reliance GSM VodafonePe
rce
nta
ge b
ills
dis
pu
ted
Metering and billing credibility - Postpaid
Audit Results for Billing performance Postpaid-Consolidated
TRAI Benchmark ≤ 0.1%
Data Source: Billing Center of the operators
Idea and Vodafone failed to meet the benchmark of 0.1% postpaid metering and billing credibility.
0.0
1%
0.0
5%
0.0
3%
0.0
0%
0.2
4%
0.0
9%
0.1
8%
0.0
5%
0.0
5%
0.0
3%
0.0
0%
0.3
1%
0.0
9%
0.2
0%
0.0
5%
0.0
5%
0.0
2%
0.0
0%
0.3
1%
0.0
9%
0.0
4%
0.00%
0.05%
0.10%
0.15%
0.20%
0.25%
0.30%
0.35%
Aircel Airtel BSNL CDMA BSNL GSM Idea Reliance GSM Vodafone
Pe
rce
nta
ge b
ills
dis
pu
ted
Metering and billing credibility - Postpaid (Billing cycle wise)
January February March
=
TRAI Benchmark ≤ 0.1%
Data Source: Billing Center of the operators
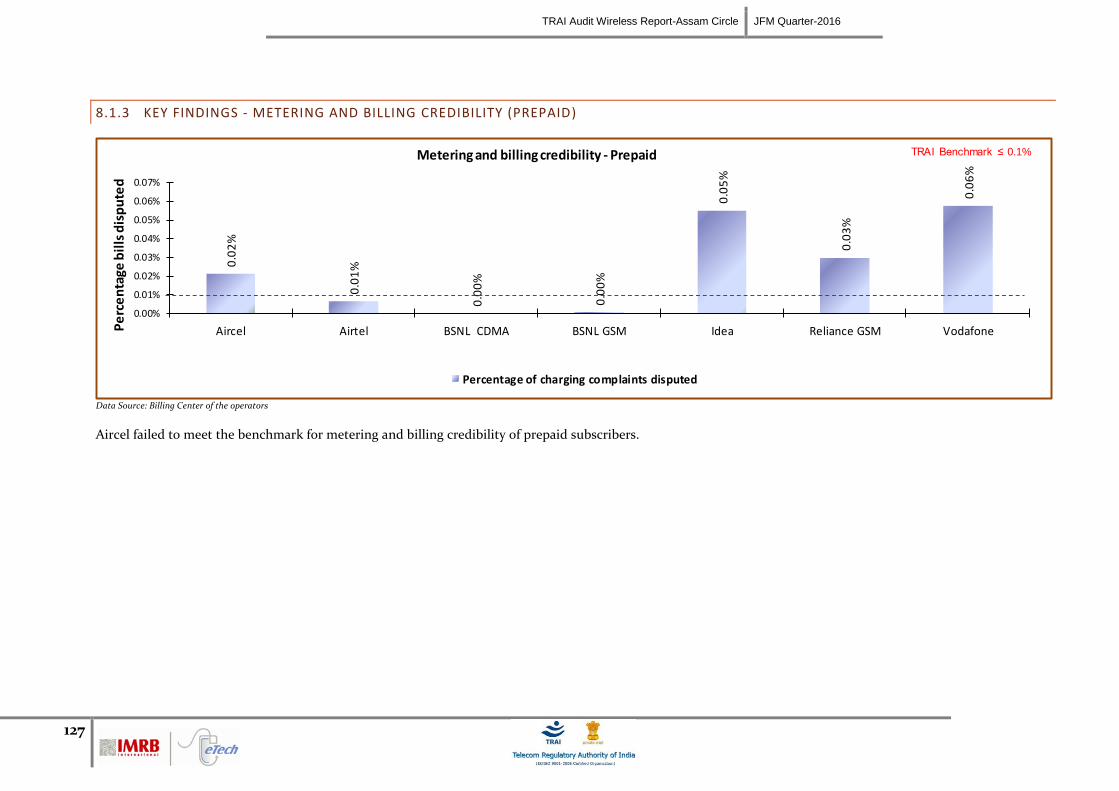
TRAI Audit Wireless Report-Assam Circle JFM Quarter-2016
127
8.1.3 KEY FINDINGS - METERING AND BILLING CREDIBILITY (PREPAID)
0.0
2%
0.0
1%
0.0
0%
0.0
0%
0.0
5%
0.0
3%
0.0
6%
0.00%
0.01%
0.02%
0.03%
0.04%
0.05%
0.06%
0.07%
Aircel Airtel BSNL CDMA BSNL GSM Idea Reliance GSM VodafonePe
rce
nta
ge b
ills
dis
pu
ted
Metering and billing credibility - Prepaid
Percentage of charging complaints disputed
TRAI Benchmark ≤ 0.1%
Data Source: Billing Center of the operators
Aircel failed to meet the benchmark for metering and billing credibility of prepaid subscribers.
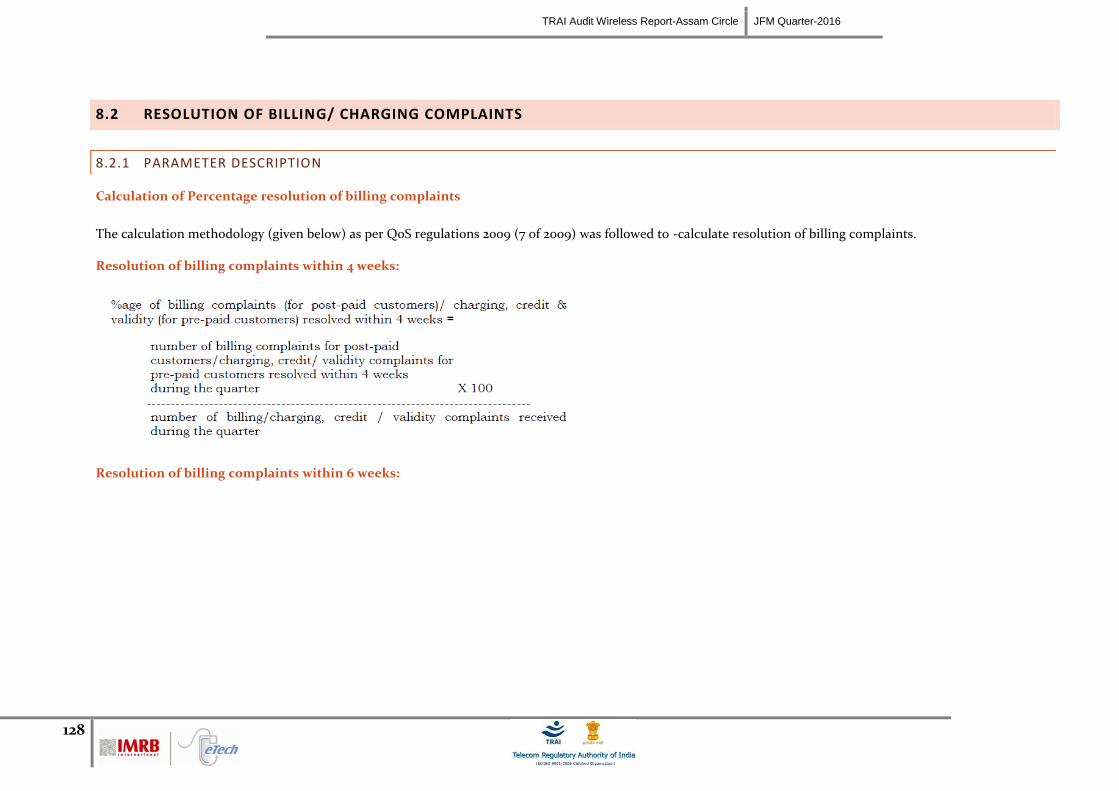
TRAI Audit Wireless Report-Assam Circle JFM Quarter-2016
128
8.2 RESOLUTION OF BILLING/ CHARGING COMPLAINTS
8.2.1 PARAMETER DESCRIPTION
Calculation of Percentage resolution of billing complaints
The calculation methodology (given below) as per QoS regulations 2009 (7 of 2009) was followed to -calculate resolution of billing complaints.
Resolution of billing complaints within 4 weeks:
Resolution of billing complaints within 6 weeks:
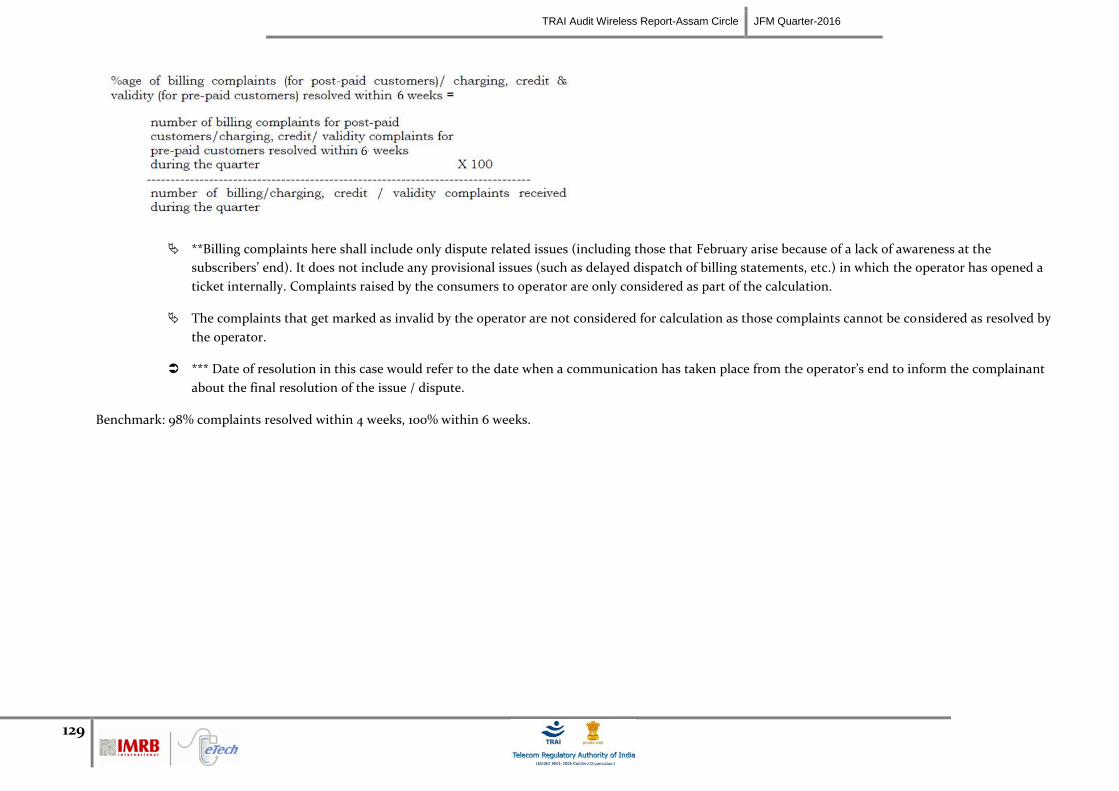
TRAI Audit Wireless Report-Assam Circle JFM Quarter-2016
129
**Billing complaints here shall include only dispute related issues (including those that February arise because of a lack of awareness at the
subscribers’ end). It does not include any provisional issues (such as delayed dispatch of billing statements, etc.) in which the operator has opened a
ticket internally. Complaints raised by the consumers to operator are only considered as part of the calculation.
The complaints that get marked as invalid by the operator are not considered for calculation as those complaints cannot be considered as resolved by
the operator.
*** Date of resolution in this case would refer to the date when a communication has taken place from the operator’s end to inform the complainant
about the final resolution of the issue / dispute.
Benchmark: 98% complaints resolved within 4 weeks, 100% within 6 weeks.
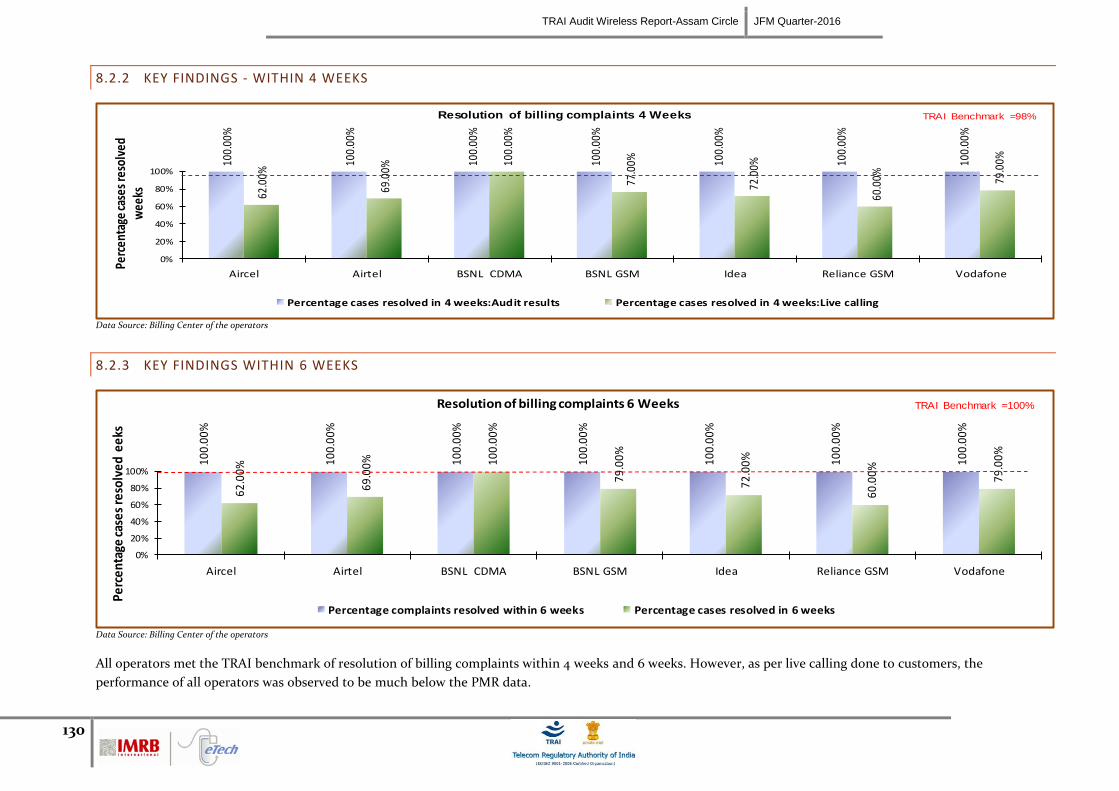
TRAI Audit Wireless Report-Assam Circle JFM Quarter-2016
130
8.2.2 KEY FINDINGS - WITHIN 4 WEEKS
100.
00%
100.
00%
100.
00%
100.
00%
100.
00%
100.
00%
100.
00%
62.0
0%
69.0
0%
100.
00%
77.0
0%
72.0
0%
60.0
0% 79.0
0%
0%
20%
40%
60%
80%
100%
Aircel Airtel BSNL CDMA BSNL GSM Idea Reliance GSM Vodafone
Perc
enta
ge ca
ses r
esol
ved
w
eeks
Resolution of billing complaints 4 Weeks
Percentage cases resolved in 4 weeks:Audit results Percentage cases resolved in 4 weeks:Live calling
TRAI Benchmark =98%
Data Source: Billing Center of the operators
8.2.3 KEY FINDINGS WITHIN 6 WEEKS
100.
00%
100.
00%
100.
00%
100.
00%
100.
00%
100.
00%
100.
00%
62.0
0%
69.0
0% 100.
00%
79.0
0%
72.0
0%
60.0
0% 79.0
0%
0%
20%
40%
60%
80%
100%
Aircel Airtel BSNL CDMA BSNL GSM Idea Reliance GSM Vodafone
Perc
enta
ge ca
ses
reso
lved
eek
s
Resolution of billing complaints 6 Weeks
Percentage complaints resolved within 6 weeks Percentage cases resolved in 6 weeks
TRAI Benchmark =100%
Data Source: Billing Center of the operators
All operators met the TRAI benchmark of resolution of billing complaints within 4 weeks and 6 weeks. However, as per live calling done to customers, the
performance of all operators was observed to be much below the PMR data.
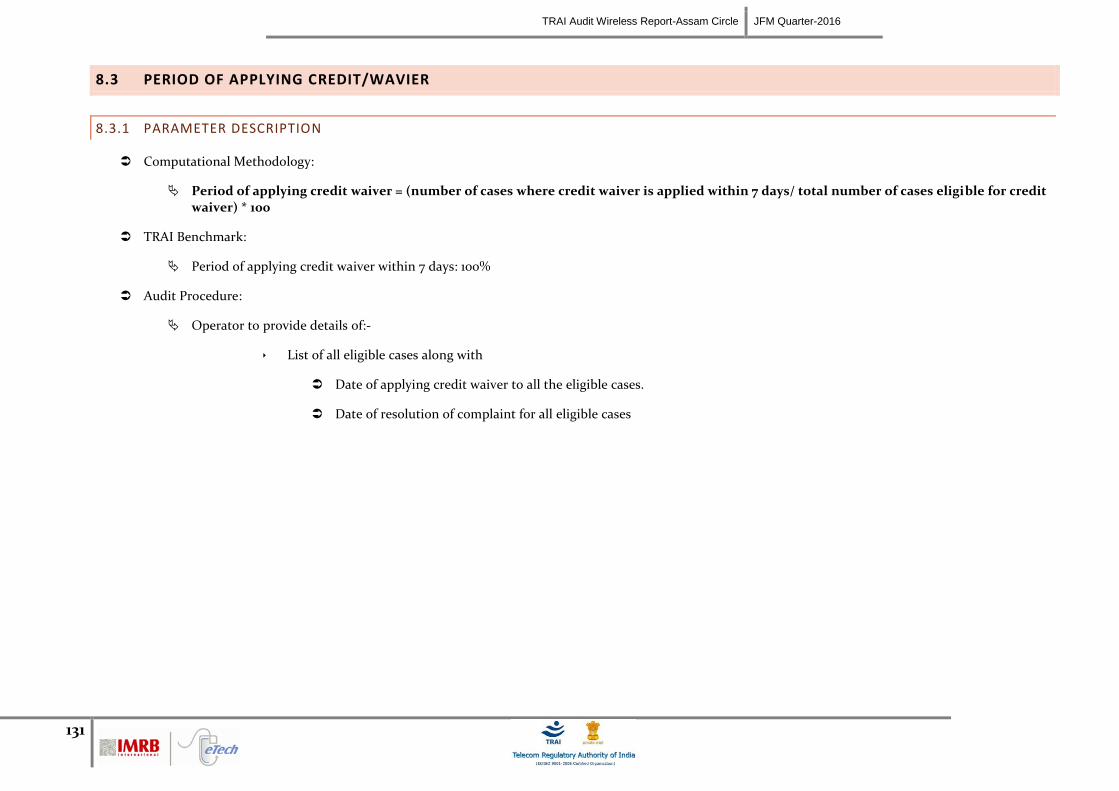
TRAI Audit Wireless Report-Assam Circle JFM Quarter-2016
131
8.3 PERIOD OF APPLYING CREDIT/WAVIER
8.3.1 PARAMETER DESCRIPTION
Computational Methodology:
Period of applying credit waiver = (number of cases where credit waiver is applied within 7 days/ total number of cases eligible for credit waiver) * 100
TRAI Benchmark:
Period of applying credit waiver within 7 days: 100%
Audit Procedure:
Operator to provide details of:-
List of all eligible cases along with
Date of applying credit waiver to all the eligible cases.
Date of resolution of complaint for all eligible cases
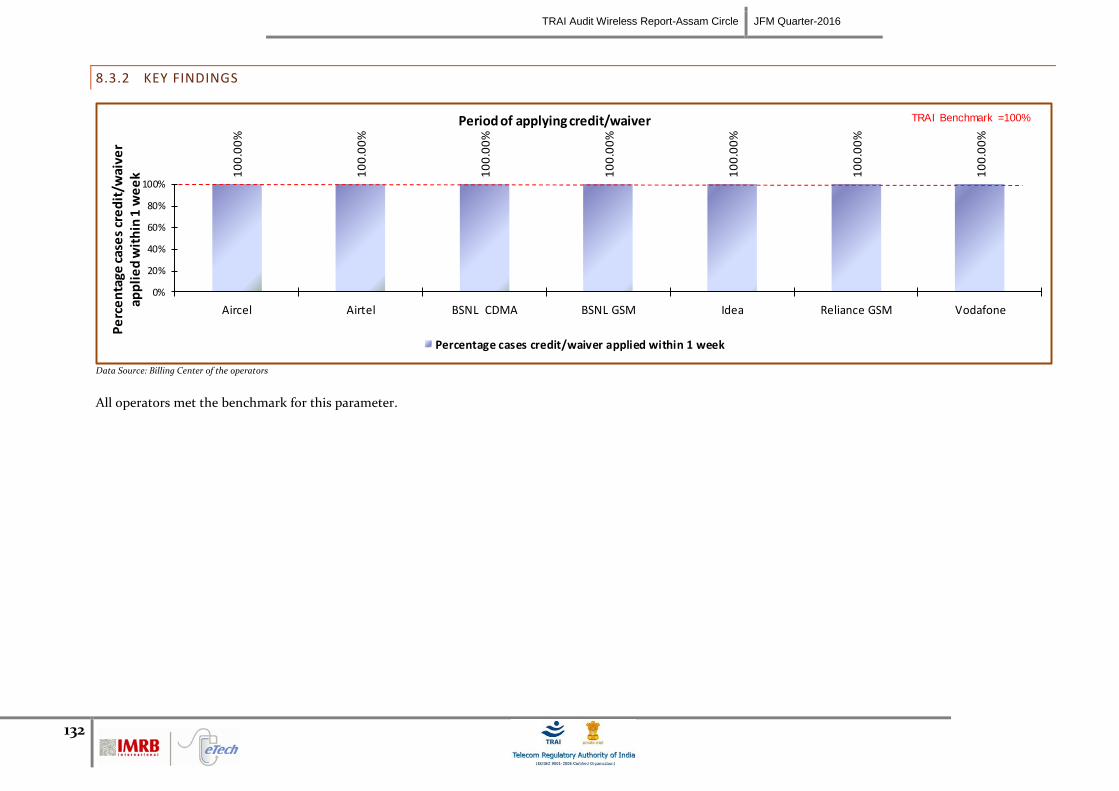
TRAI Audit Wireless Report-Assam Circle JFM Quarter-2016
132
8.3.2 KEY FINDINGS
10
0.0
0%
10
0.0
0%
10
0.0
0%
10
0.0
0%
10
0.0
0%
10
0.0
0%
10
0.0
0%
0%
20%
40%
60%
80%
100%
Aircel Airtel BSNL CDMA BSNL GSM Idea Reliance GSM Vodafone
Pe
rce
nta
ge c
ase
s cr
ed
it/w
aive
r ap
pli
ed
wit
hin
1 w
ee
kPeriod of applying credit/waiver
Percentage cases credit/waiver applied within 1 week
TRAI Benchmark =100%
Data Source: Billing Center of the operators
All operators met the benchmark for this parameter.
TRAI Audit Wireless Report-Assam Circle JFM Quarter-2016
133
8.4 CALL CENTRE PERFORMANCE-IVR
8.4.1 PARAMETER DESCRIPTION
Computational Methodology:
Call centre performance IVR = (Number of calls connected and answered by IVR/ All calls attempted to IVR) * 100
TRAI Benchmark: >= 95%
Audit Procedure:
Operators provide details of the following from their central call centre/ customer service database:
Total calls connected and answered by IVR
Total calls attempted to IVR
Also live calling is done to test the calls connected and answered by IVR
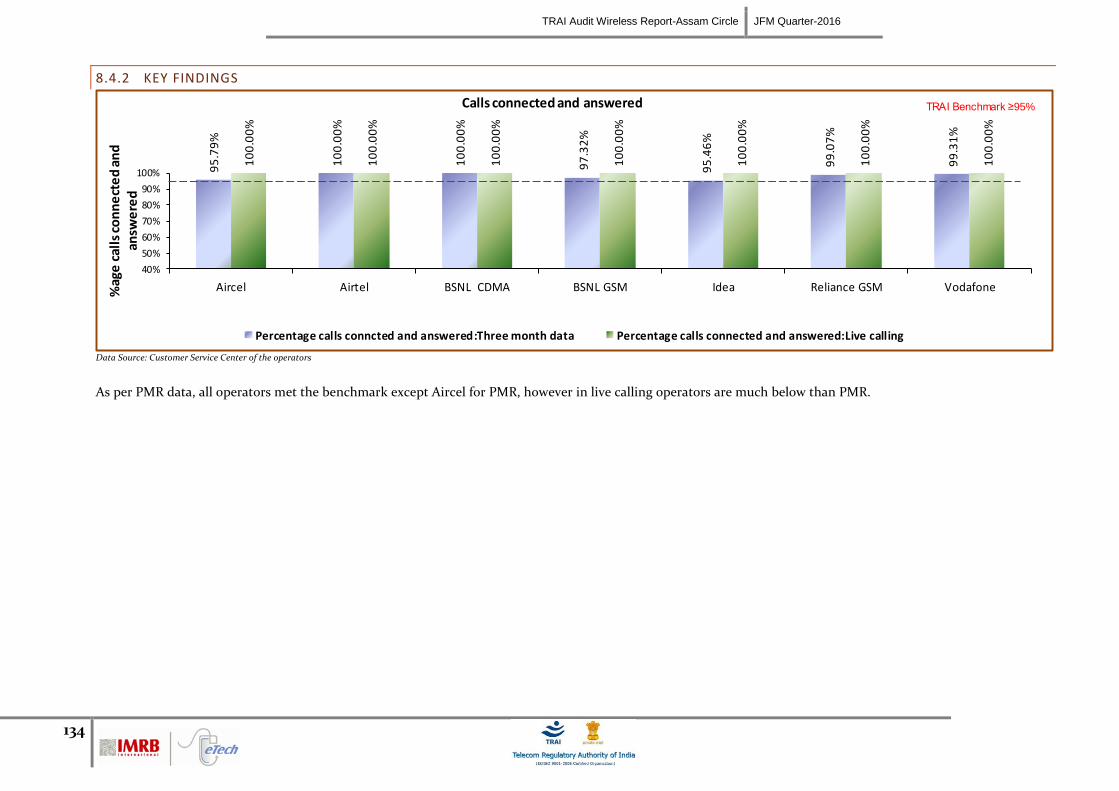
TRAI Audit Wireless Report-Assam Circle JFM Quarter-2016
134
8.4.2 KEY FINDINGS
95
.79
%
10
0.0
0%
10
0.0
0%
97
.32
%
95
.46
%
99
.07
%
99
.31
%
10
0.0
0%
10
0.0
0%
10
0.0
0%
10
0.0
0%
10
0.0
0%
10
0.0
0%
10
0.0
0%
40%
50%
60%
70%
80%
90%
100%
Aircel Airtel BSNL CDMA BSNL GSM Idea Reliance GSM Vodafone%ag
e c
alls
co
nn
ect
ed
an
d
answ
ere
d
Calls connected and answered
Percentage calls conncted and answered:Three month data Percentage calls connected and answered:Live calling
TRAI Benchmark ≥95%
Data Source: Customer Service Center of the operators
As per PMR data, all operators met the benchmark except Aircel for PMR, however in live calling operators are much below than PMR.
TRAI Audit Wireless Report-Assam Circle JFM Quarter-2016
135
8.5 CALL CENTRE PERFORMANCE-VOICE TO VOICE
8.5.1 PARAMETER DESCRIPTION
Computational Methodology:
Call centre performance Voice to Voice = (Number of calls answered by operator within 90 seconds/ All calls attempted to connect to the operator) *
100
Audit Procedure:
Operators provide details of the following from their central call centre/ customer service database:
Total calls connected and answered by operator within 90 seconds
Total calls attempted to connect to the operator
Also live calling was done to test the calls answered within 90 seconds by the operator
Benchmark: 95% calls to be answered within 90 seconds
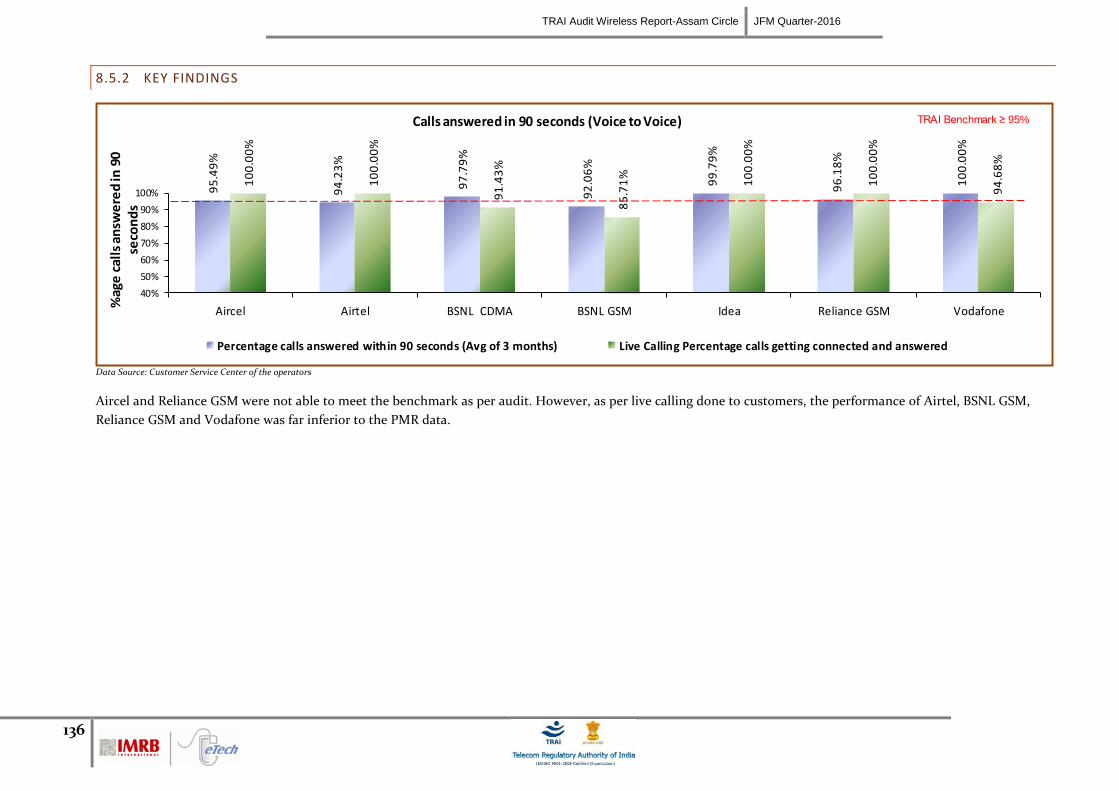
TRAI Audit Wireless Report-Assam Circle JFM Quarter-2016
136
8.5.2 KEY FINDINGS
95
.49
%
94
.23
%
97
.79
%
92
.06
%
99
.79
%
96
.18
%
10
0.0
0%
10
0.0
0%
10
0.0
0%
91
.43
%
85
.71
%
10
0.0
0%
10
0.0
0%
94
.68
%
40%
50%
60%
70%
80%
90%
100%
Aircel Airtel BSNL CDMA BSNL GSM Idea Reliance GSM Vodafone
%ag
e c
alls
an
swe
red
in 9
0 se
con
ds
Calls answered in 90 seconds (Voice to Voice)
Percentage calls answered within 90 seconds (Avg of 3 months) Live Calling Percentage calls getting connected and answered
TRAI Benchmark ≥ 95%
Data Source: Customer Service Center of the operators
Aircel and Reliance GSM were not able to meet the benchmark as per audit. However, as per live calling done to customers, the performance of Airtel, BSNL GSM,
Reliance GSM and Vodafone was far inferior to the PMR data.
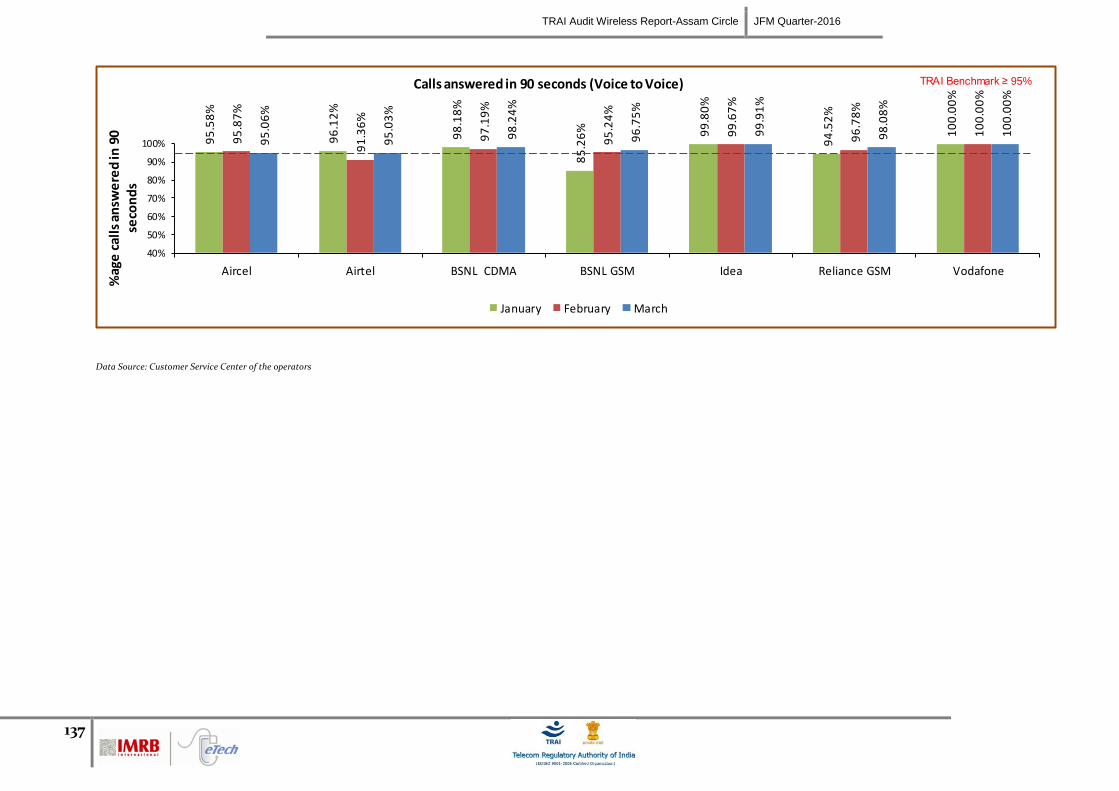
TRAI Audit Wireless Report-Assam Circle JFM Quarter-2016
137
95
.58
%
96
.12
%
98
.18
%
85
.26
% 99
.80
%
94
.52
%
10
0.0
0%
95
.87
%
91
.36
%
97
.19
%
95
.24
%
99
.67
%
96
.78
%
10
0.0
0%
95
.06
%
95
.03
%
98
.24
%
96
.75
%
99
.91
%
98
.08
%
10
0.0
0%
40%
50%
60%
70%
80%
90%
100%
Aircel Airtel BSNL CDMA BSNL GSM Idea Reliance GSM Vodafone
%ag
e c
alls
an
swe
red
in 9
0 se
con
ds
Calls answered in 90 seconds (Voice to Voice)
January February March
TRAI Benchmark ≥ 95%
Data Source: Customer Service Center of the operators
TRAI Audit Wireless Report-Assam Circle JFM Quarter-2016
138
8.6 TERMINATION/CLOSURE OF SERVICE
8.6.1 PARAMETER DESCRIPTION
Computational Methodology:
Time taken for closure of service = (number of closures done within 7 days/ total number of closure requests) * 100
TRAI Benchmark:
Termination/Closure of Service: <=7 days
Audit Procedure:
Operator provide details of the following from their central billing/CS database:
Date of lodging the closure request (all requests in given period)
Date of closure of service
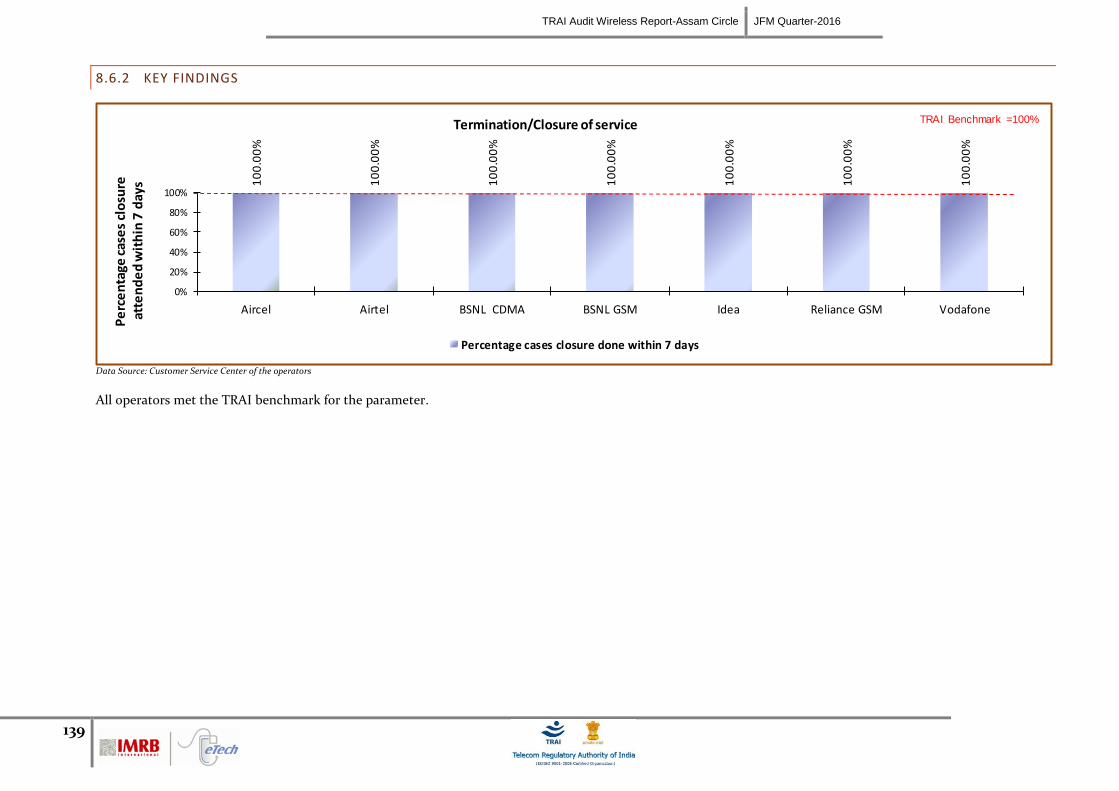
TRAI Audit Wireless Report-Assam Circle JFM Quarter-2016
139
8.6.2 KEY FINDINGS
10
0.0
0%
10
0.0
0%
10
0.0
0%
10
0.0
0%
10
0.0
0%
10
0.0
0%
10
0.0
0%
0%
20%
40%
60%
80%
100%
Aircel Airtel BSNL CDMA BSNL GSM Idea Reliance GSM Vodafone
Pe
rce
nta
ge c
ase
s cl
osu
re
atte
nd
ed
wit
hin
7 d
ays
Termination/Closure of service
Percentage cases closure done within 7 days
TRAI Benchmark =100%
Data Source: Customer Service Center of the operators
All operators met the TRAI benchmark for the parameter.
TRAI Audit Wireless Report-Assam Circle JFM Quarter-2016
140
8.7 REFUND OF DEPOSITS AFTER CLOSURE
8.7.1 PARAMETER DESCRIPTION
Computational Methodology:
Time taken for refund for deposit after closures = (number of cases of refund after closure done within 60 days/ total number of cases of
refund after closure) * 100
Any case where the operators need to return the amount back to consumers post closure of service in form of cheque/cash is considered to be refund.
TRAI Benchmark:
Time taken for refund for deposit after closures: 100% within 60 days
Audit Procedure:
Operator provide details of the following from their central billing/refund database:
Dates of completion of all ‘closure requests’ resulting in requirement of a refund by the operator.
Dates of refund pertaining to all closure request received during the relevant quarter
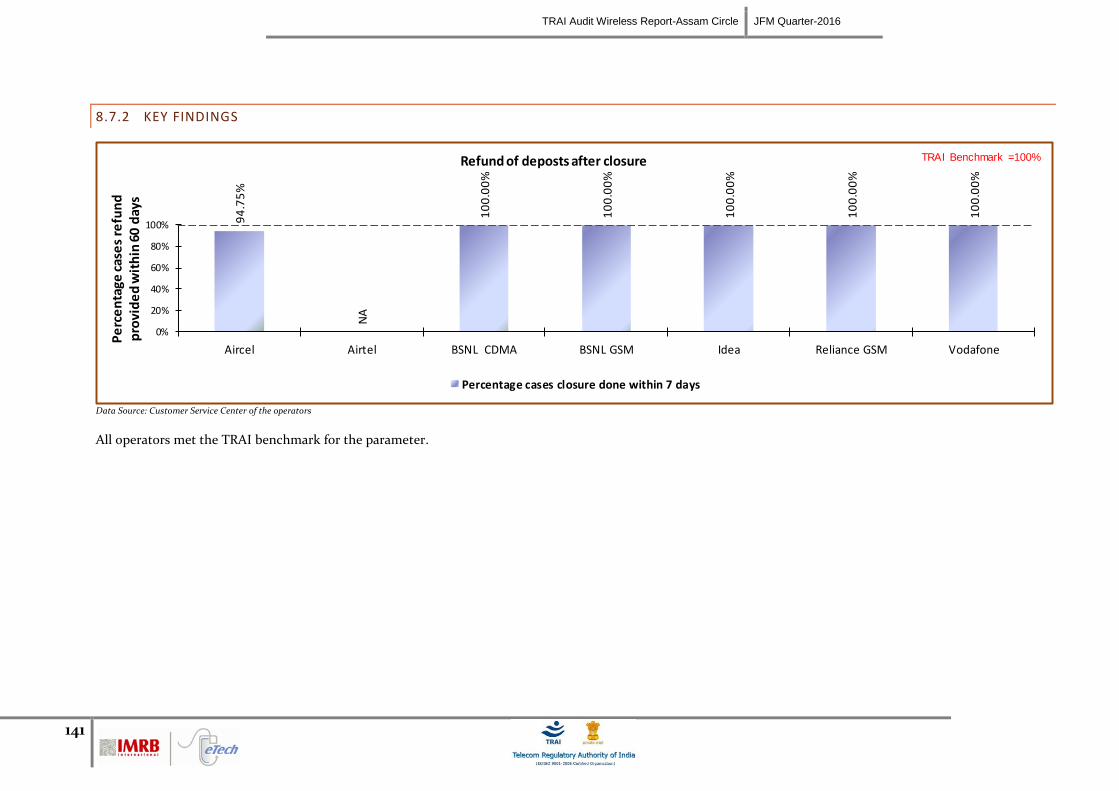
TRAI Audit Wireless Report-Assam Circle JFM Quarter-2016
141
8.7.2 KEY FINDINGS
94
.75
%
NA
10
0.0
0%
10
0.0
0%
10
0.0
0%
10
0.0
0%
10
0.0
0%
0%
20%
40%
60%
80%
100%
Aircel Airtel BSNL CDMA BSNL GSM Idea Reliance GSM Vodafone
Pe
rce
nta
ge c
ase
s re
fun
d
pro
vid
ed
wit
hin
60
day
s
Refund of deposts after closure
Percentage cases closure done within 7 days
TRAI Benchmark =100%
Data Source: Customer Service Center of the operators
All operators met the TRAI benchmark for the parameter.
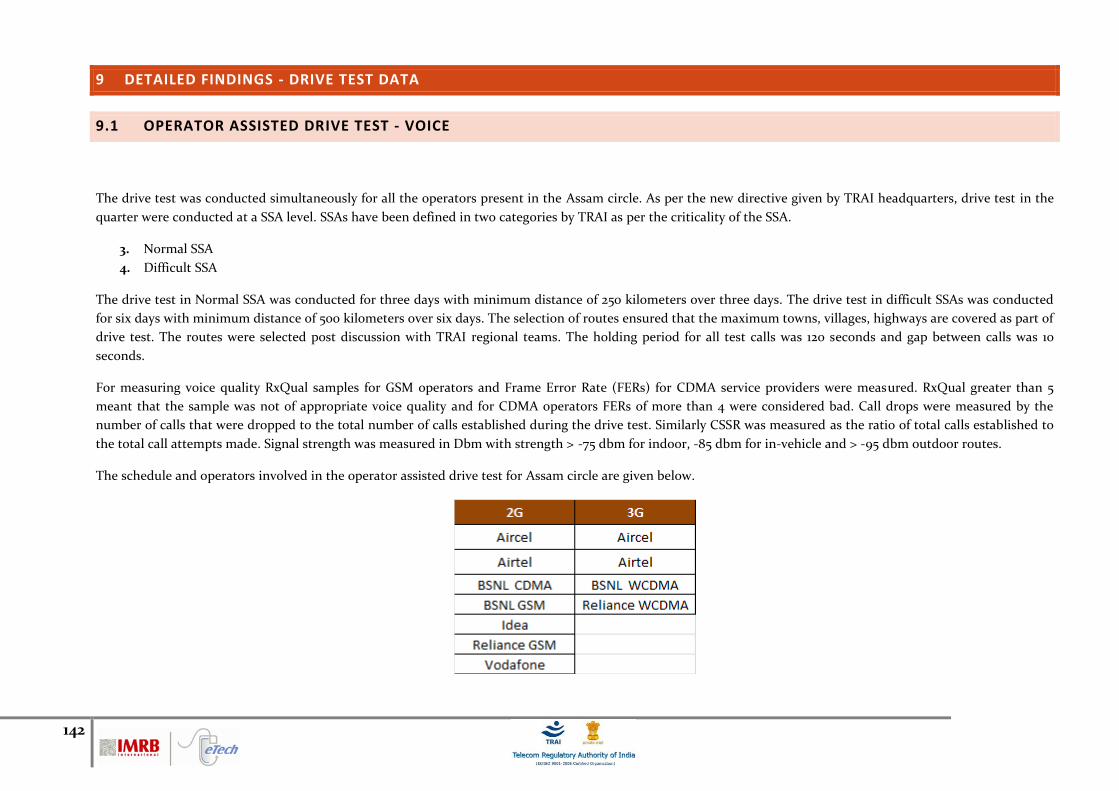
142
9 DETAILED FINDINGS - DRIVE TEST DATA
9.1 OPERATOR ASSISTED DRIVE TEST - VOICE
The drive test was conducted simultaneously for all the operators present in the Assam circle. As per the new directive given by TRAI headquarters, drive test in the
quarter were conducted at a SSA level. SSAs have been defined in two categories by TRAI as per the criticality of the SSA.
3. Normal SSA
4. Difficult SSA
The drive test in Normal SSA was conducted for three days with minimum distance of 250 kilometers over three days. The drive test in difficult SSAs was conducted
for six days with minimum distance of 500 kilometers over six days. The selection of routes ensured that the maximum towns, villages, highways are covered as part of
drive test. The routes were selected post discussion with TRAI regional teams. The holding period for all test calls was 120 seconds and gap between calls was 10
seconds.
For measuring voice quality RxQual samples for GSM operators and Frame Error Rate (FERs) for CDMA service providers were measured. RxQual greater than 5
meant that the sample was not of appropriate voice quality and for CDMA operators FERs of more than 4 were considered bad. Call drops were measured by the
number of calls that were dropped to the total number of calls established during the drive test. Similarly CSSR was measured as the ratio of total calls established to
the total call attempts made. Signal strength was measured in Dbm with strength > -75 dbm for indoor, -85 dbm for in-vehicle and > -95 dbm outdoor routes.
The schedule and operators involved in the operator assisted drive test for Assam circle are given below.
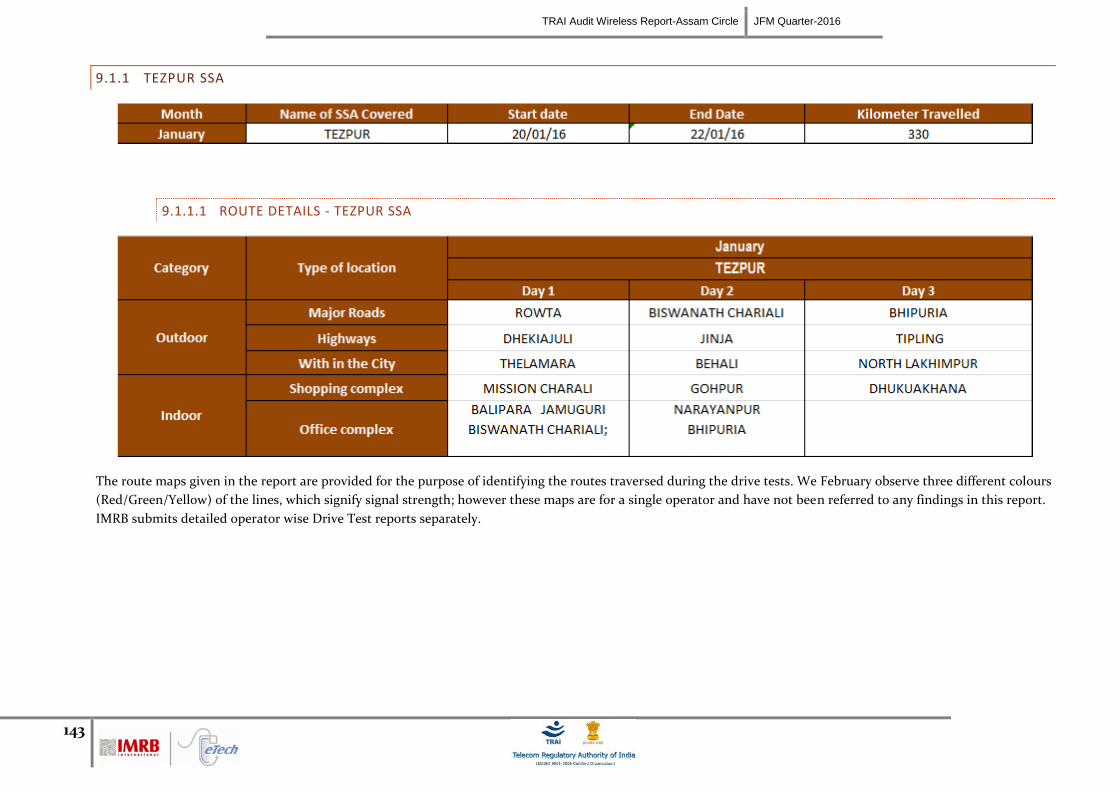
TRAI Audit Wireless Report-Assam Circle JFM Quarter-2016
143
9.1.1 TEZPUR SSA
9.1.1.1 ROUTE DETAILS - TEZPUR SSA
The route maps given in the report are provided for the purpose of identifying the routes traversed during the drive tests. We February observe three different colours
(Red/Green/Yellow) of the lines, which signify signal strength; however these maps are for a single operator and have not been referred to any findings in this report.
IMRB submits detailed operator wise Drive Test reports separately.
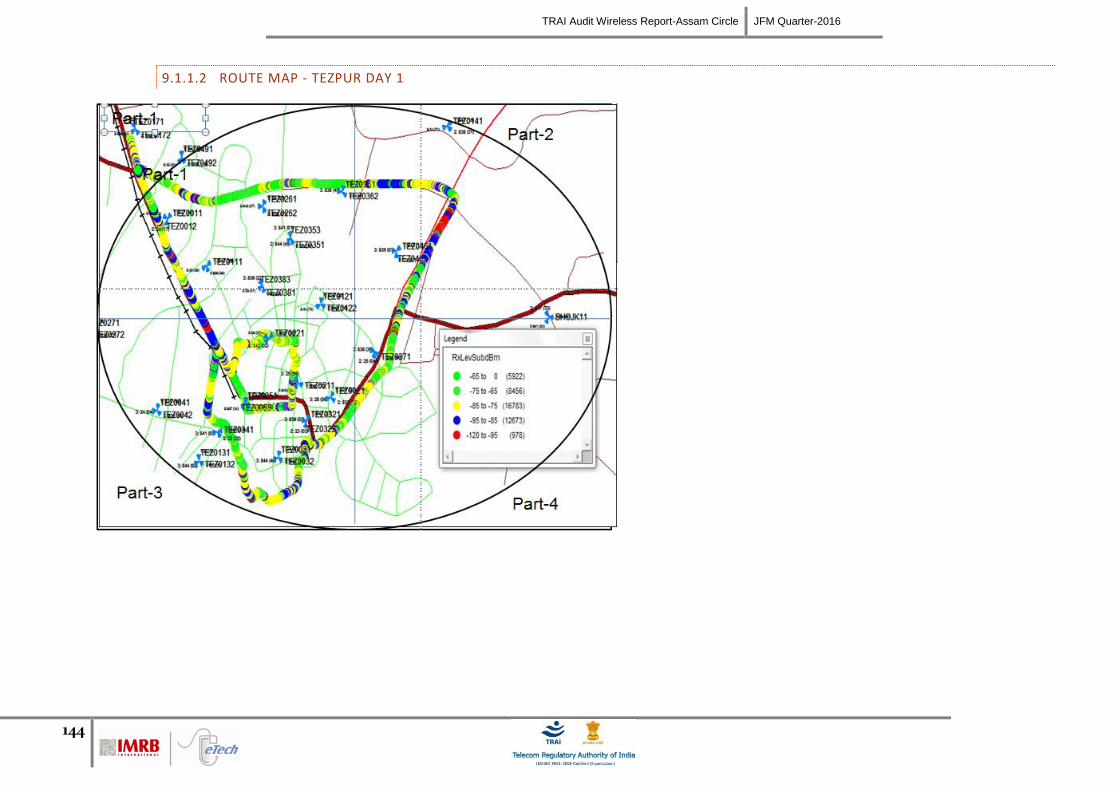
TRAI Audit Wireless Report-Assam Circle JFM Quarter-2016
144
9.1.1.2 ROUTE MAP - TEZPUR DAY 1
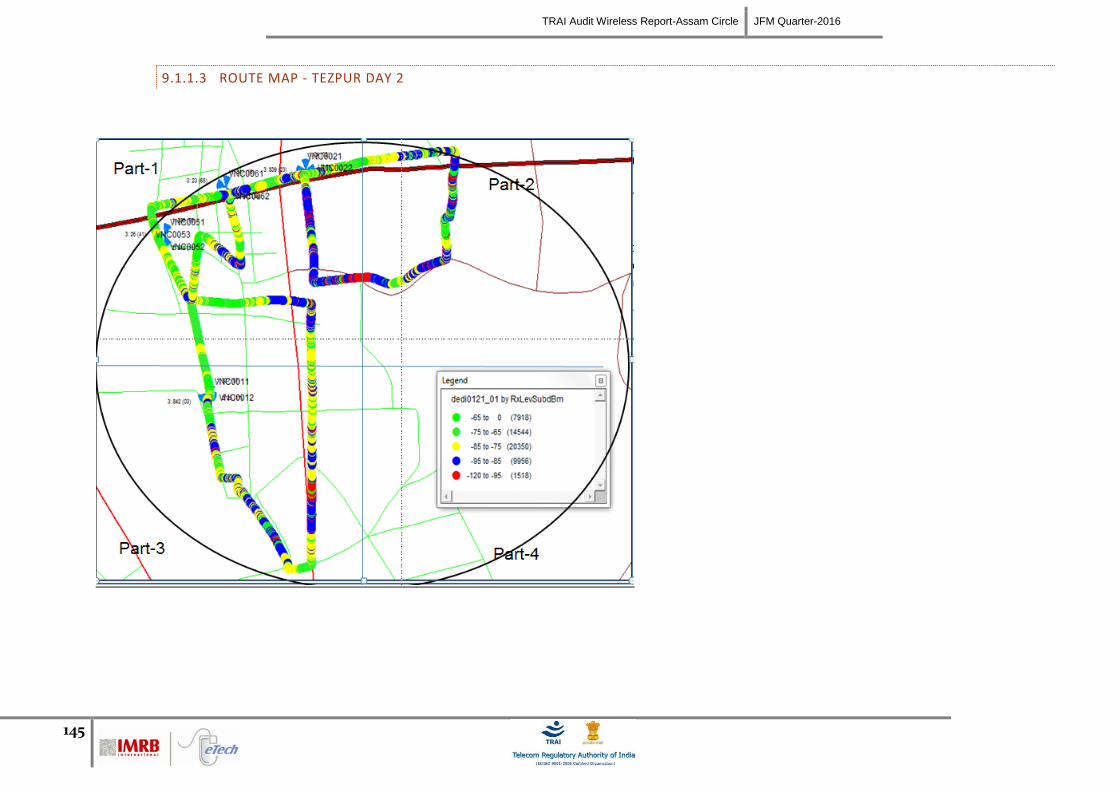
TRAI Audit Wireless Report-Assam Circle JFM Quarter-2016
145
9.1.1.3 ROUTE MAP - TEZPUR DAY 2
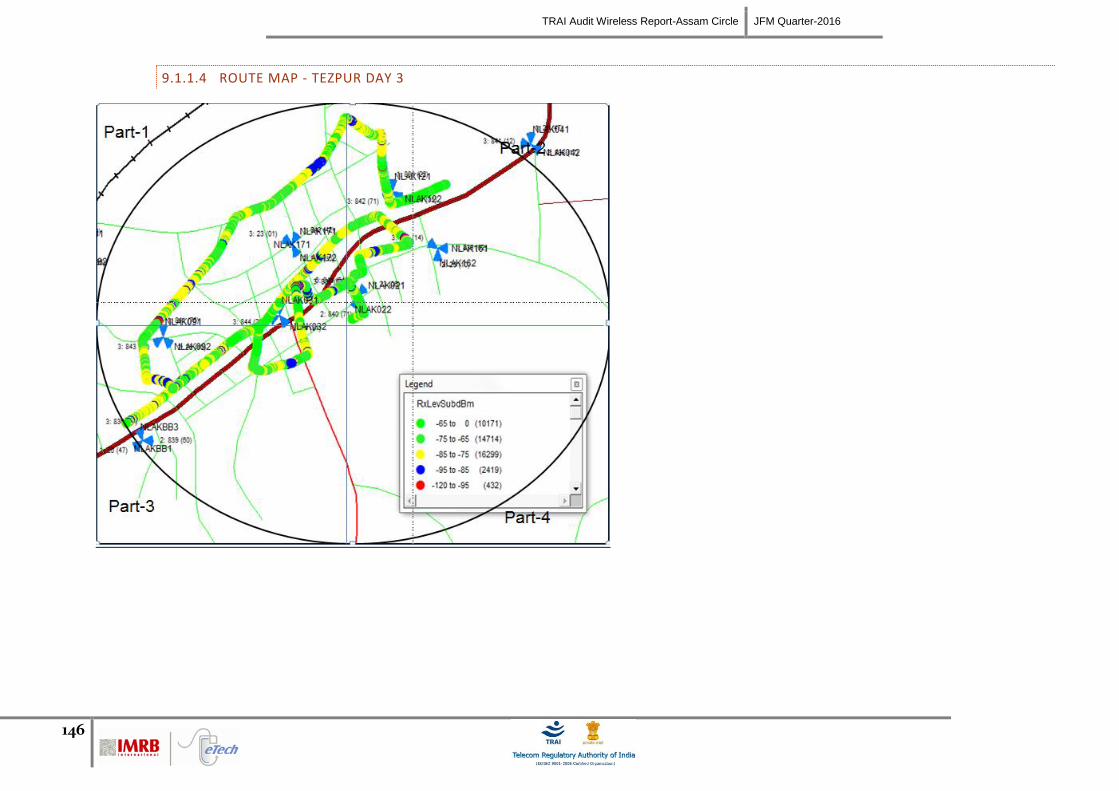
TRAI Audit Wireless Report-Assam Circle JFM Quarter-2016
146
9.1.1.4 ROUTE MAP - TEZPUR DAY 3
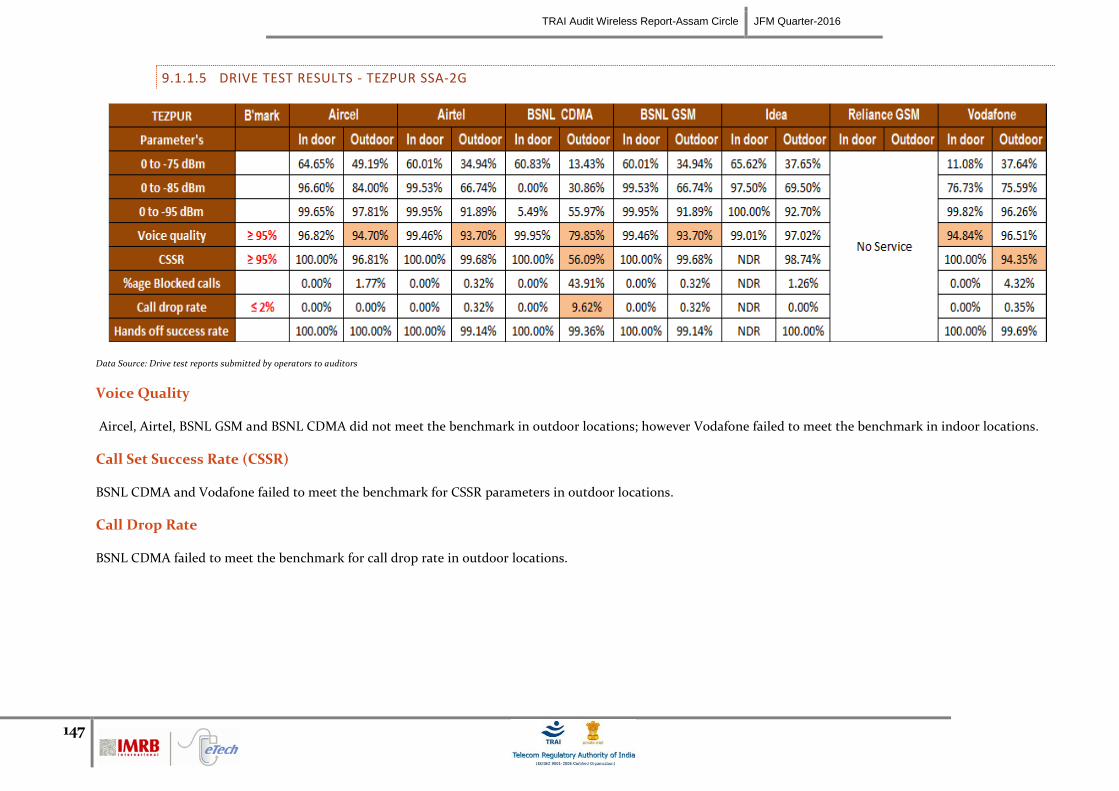
TRAI Audit Wireless Report-Assam Circle JFM Quarter-2016
147
9.1.1.5 DRIVE TEST RESULTS - TEZPUR SSA-2G
Data Source: Drive test reports submitted by operators to auditors
Voice Quality
Aircel, Airtel, BSNL GSM and BSNL CDMA did not meet the benchmark in outdoor locations; however Vodafone failed to meet the benchmark in indoor locations.
Call Set Success Rate (CSSR)
BSNL CDMA and Vodafone failed to meet the benchmark for CSSR parameters in outdoor locations.
Call Drop Rate
BSNL CDMA failed to meet the benchmark for call drop rate in outdoor locations.
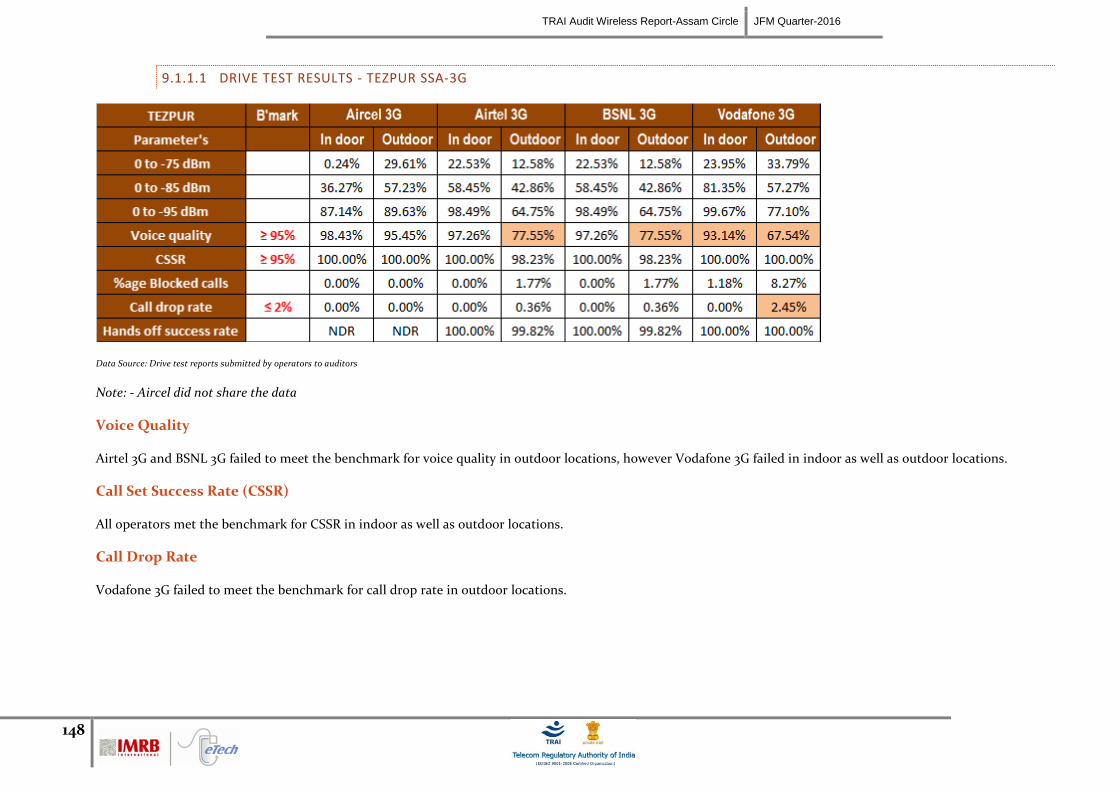
TRAI Audit Wireless Report-Assam Circle JFM Quarter-2016
148
9.1.1.1 DRIVE TEST RESULTS - TEZPUR SSA-3G
Data Source: Drive test reports submitted by operators to auditors
Note: - Aircel did not share the data
Voice Quality
Airtel 3G and BSNL 3G failed to meet the benchmark for voice quality in outdoor locations, however Vodafone 3G failed in indoor as well as outdoor locations.
Call Set Success Rate (CSSR)
All operators met the benchmark for CSSR in indoor as well as outdoor locations.
Call Drop Rate
Vodafone 3G failed to meet the benchmark for call drop rate in outdoor locations.
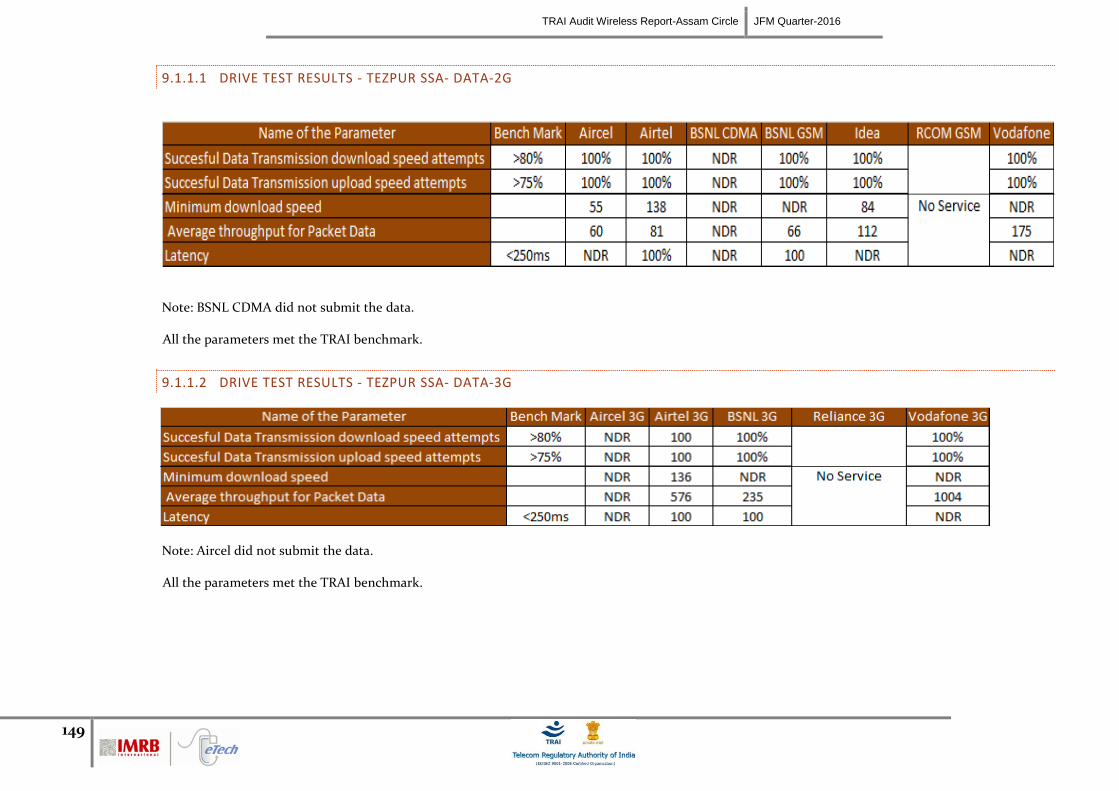
TRAI Audit Wireless Report-Assam Circle JFM Quarter-2016
149
9.1.1.1 DRIVE TEST RESULTS - TEZPUR SSA- DATA-2G
Note: BSNL CDMA did not submit the data.
All the parameters met the TRAI benchmark.
9.1.1.2 DRIVE TEST RESULTS - TEZPUR SSA- DATA-3G
Note: Aircel did not submit the data.
All the parameters met the TRAI benchmark.
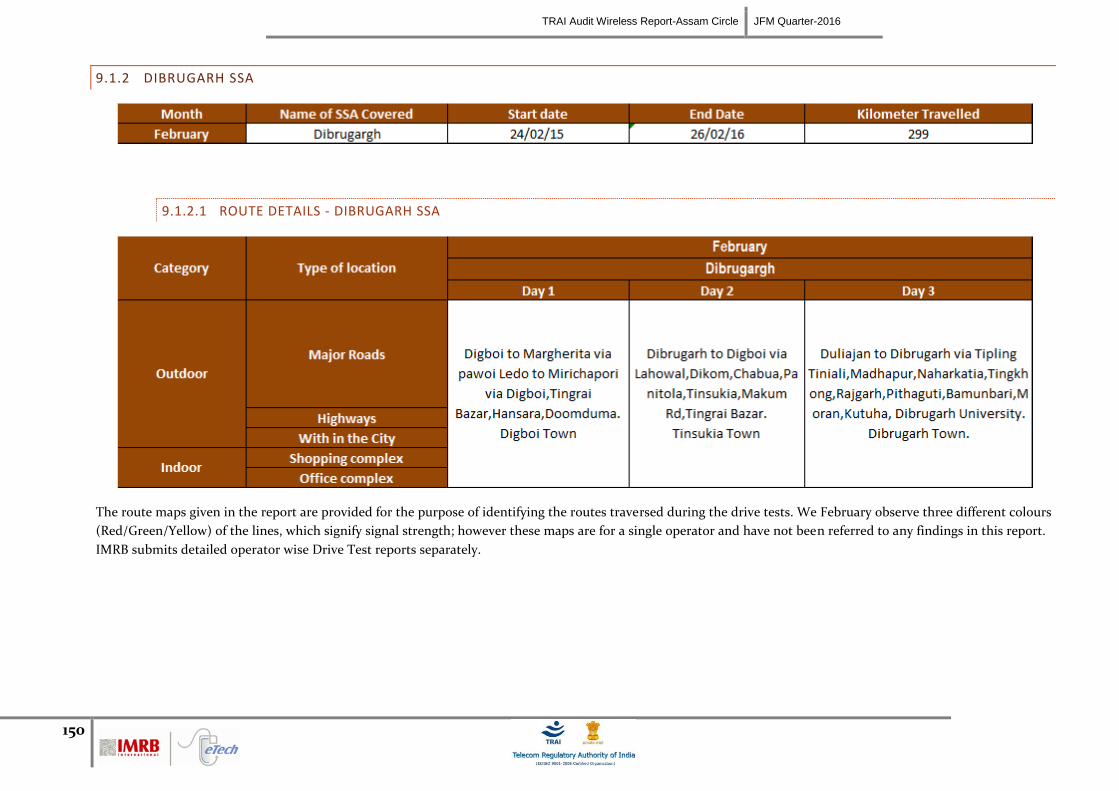
TRAI Audit Wireless Report-Assam Circle JFM Quarter-2016
150
9.1.2 DIBRUGARH SSA
9.1.2.1 ROUTE DETAILS - DIBRUGARH SSA
The route maps given in the report are provided for the purpose of identifying the routes traversed during the drive tests. We February observe three different colours
(Red/Green/Yellow) of the lines, which signify signal strength; however these maps are for a single operator and have not been referred to any findings in this report.
IMRB submits detailed operator wise Drive Test reports separately.
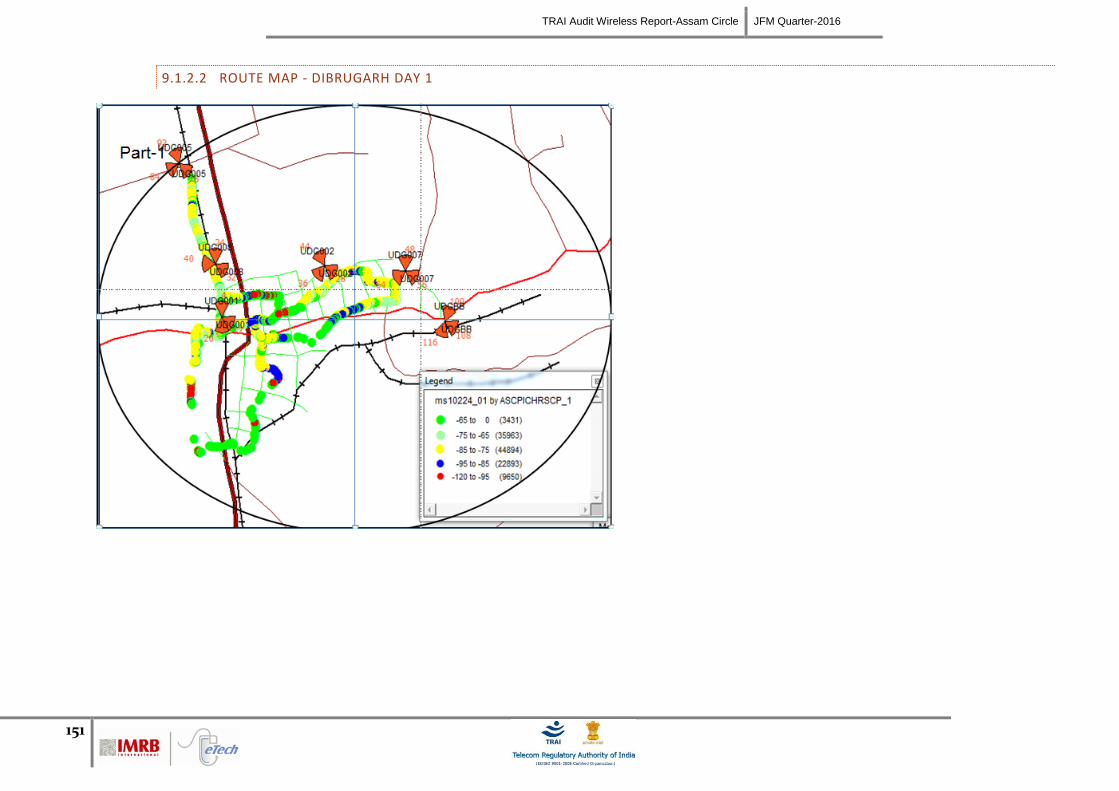
TRAI Audit Wireless Report-Assam Circle JFM Quarter-2016
151
9.1.2.2 ROUTE MAP - DIBRUGARH DAY 1
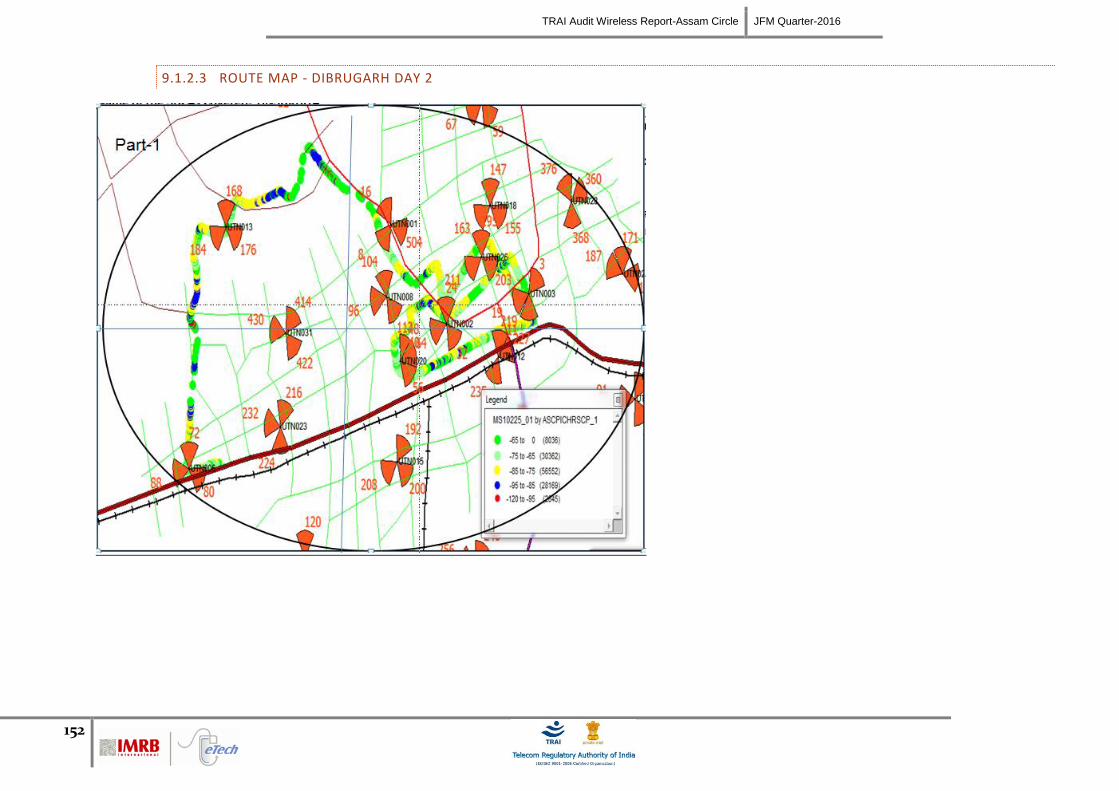
TRAI Audit Wireless Report-Assam Circle JFM Quarter-2016
152
9.1.2.3 ROUTE MAP - DIBRUGARH DAY 2
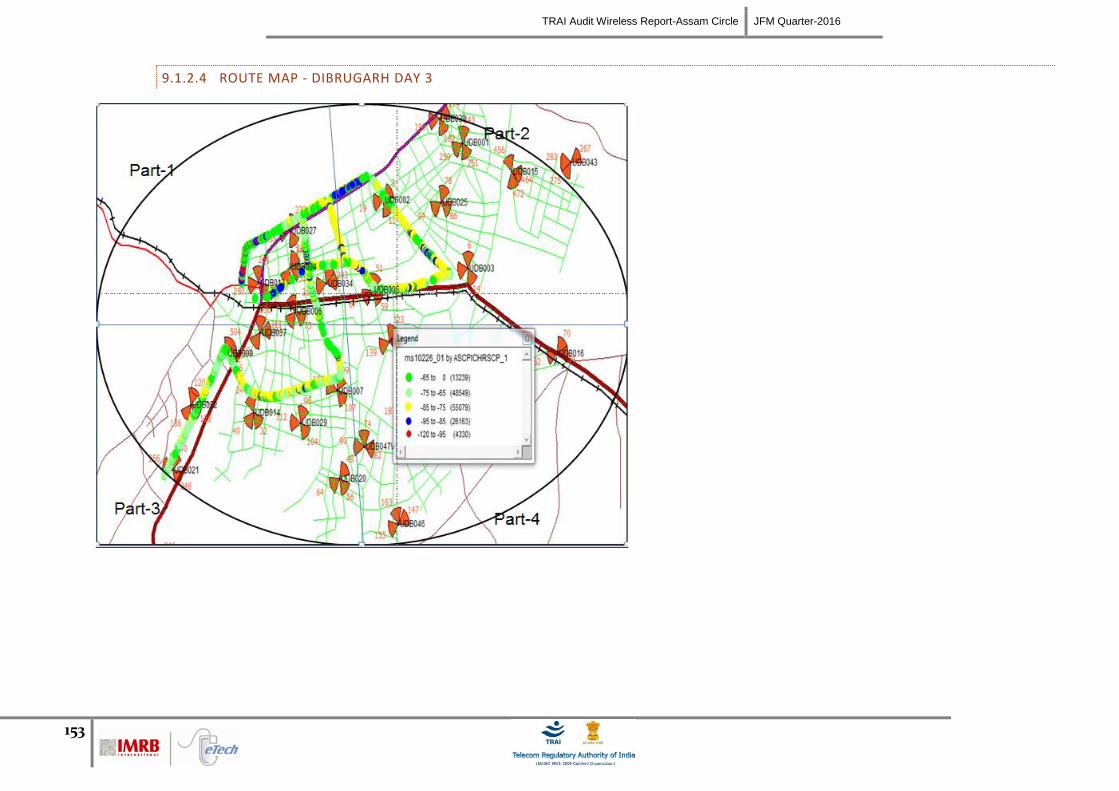
TRAI Audit Wireless Report-Assam Circle JFM Quarter-2016
153
9.1.2.4 ROUTE MAP - DIBRUGARH DAY 3
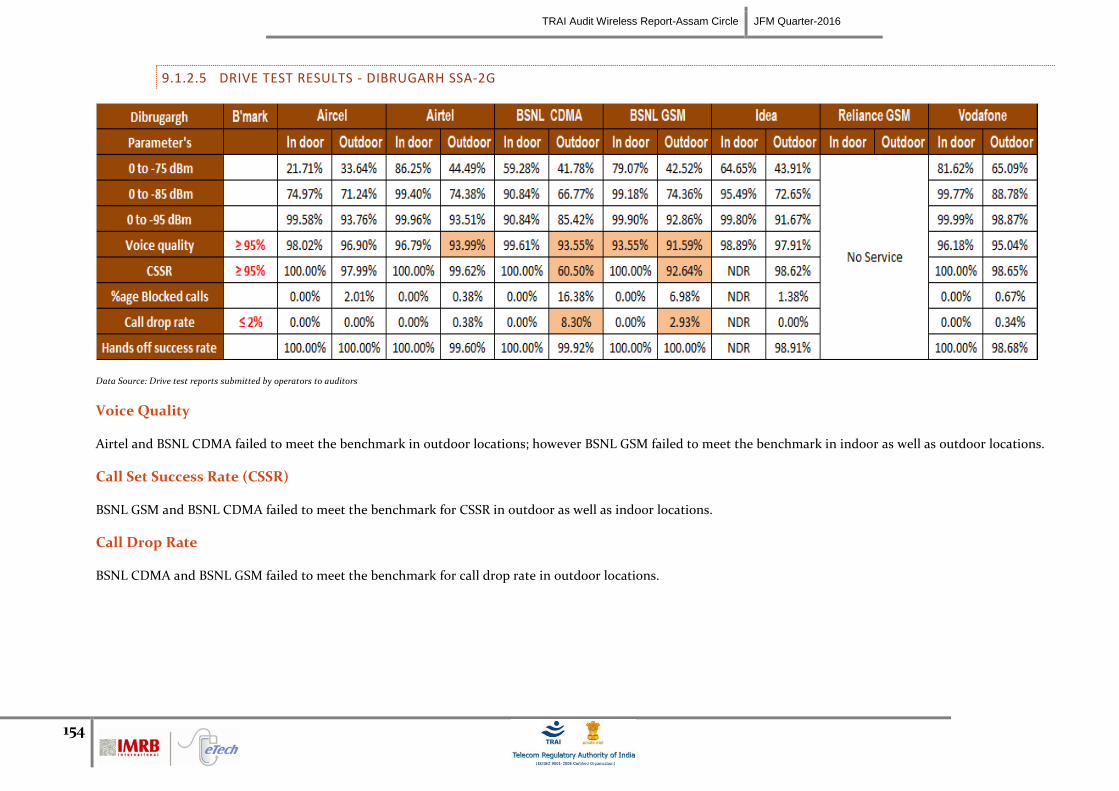
TRAI Audit Wireless Report-Assam Circle JFM Quarter-2016
154
9.1.2.5 DRIVE TEST RESULTS - DIBRUGARH SSA-2G
Data Source: Drive test reports submitted by operators to auditors
Voice Quality
Airtel and BSNL CDMA failed to meet the benchmark in outdoor locations; however BSNL GSM failed to meet the benchmark in indoor as well as outdoor locations.
Call Set Success Rate (CSSR)
BSNL GSM and BSNL CDMA failed to meet the benchmark for CSSR in outdoor as well as indoor locations.
Call Drop Rate
BSNL CDMA and BSNL GSM failed to meet the benchmark for call drop rate in outdoor locations.
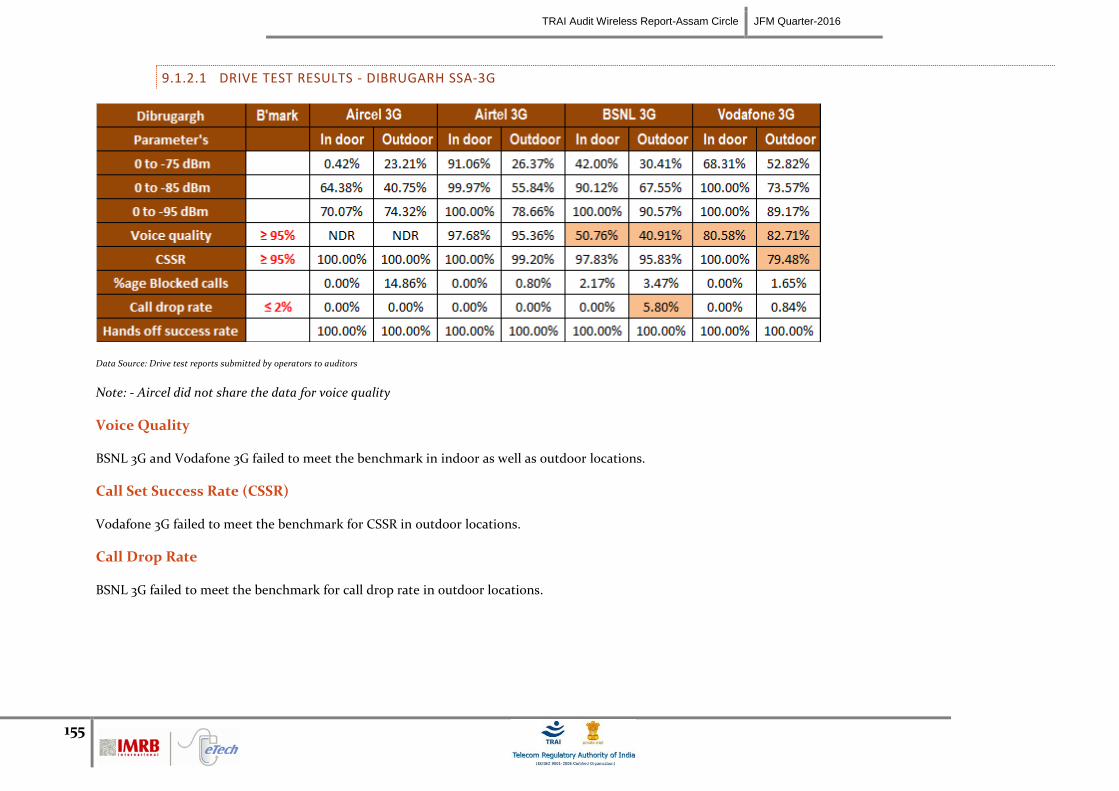
TRAI Audit Wireless Report-Assam Circle JFM Quarter-2016
155
9.1.2.1 DRIVE TEST RESULTS - DIBRUGARH SSA-3G
Data Source: Drive test reports submitted by operators to auditors
Note: - Aircel did not share the data for voice quality
Voice Quality
BSNL 3G and Vodafone 3G failed to meet the benchmark in indoor as well as outdoor locations.
Call Set Success Rate (CSSR)
Vodafone 3G failed to meet the benchmark for CSSR in outdoor locations.
Call Drop Rate
BSNL 3G failed to meet the benchmark for call drop rate in outdoor locations.
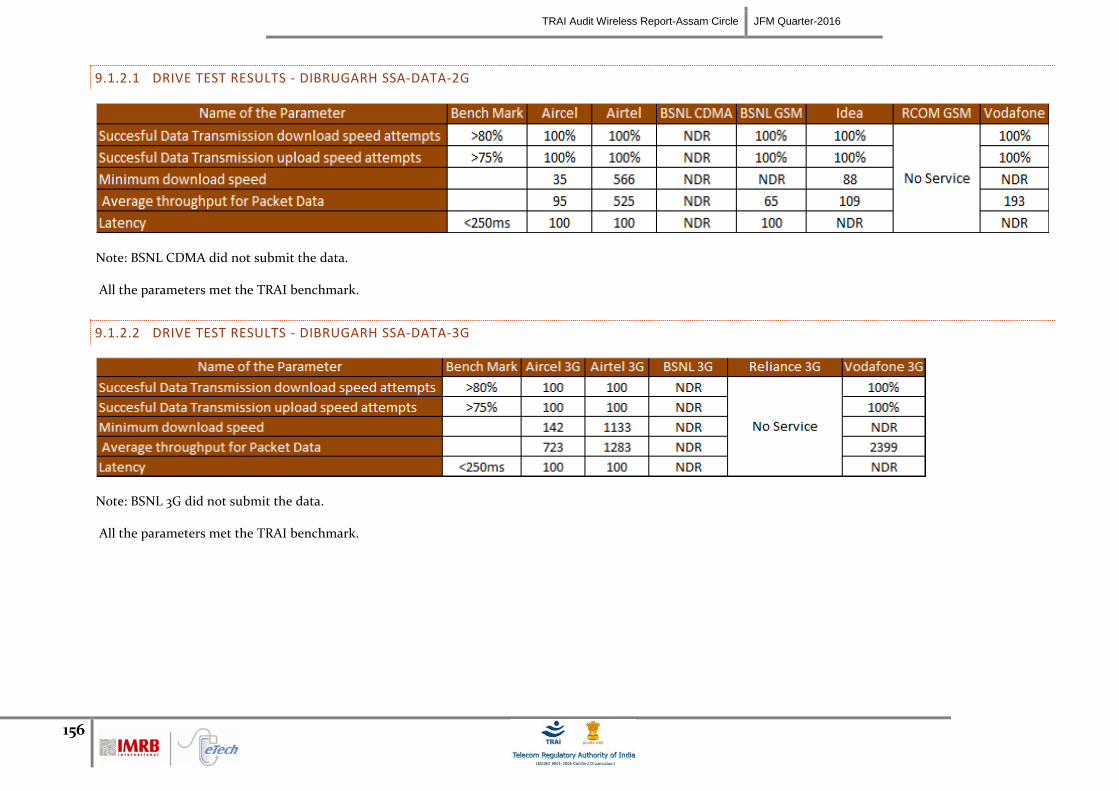
TRAI Audit Wireless Report-Assam Circle JFM Quarter-2016
156
9.1.2.1 DRIVE TEST RESULTS - DIBRUGARH SSA-DATA-2G
Note: BSNL CDMA did not submit the data.
All the parameters met the TRAI benchmark.
9.1.2.2 DRIVE TEST RESULTS - DIBRUGARH SSA-DATA-3G
Note: BSNL 3G did not submit the data.
All the parameters met the TRAI benchmark.
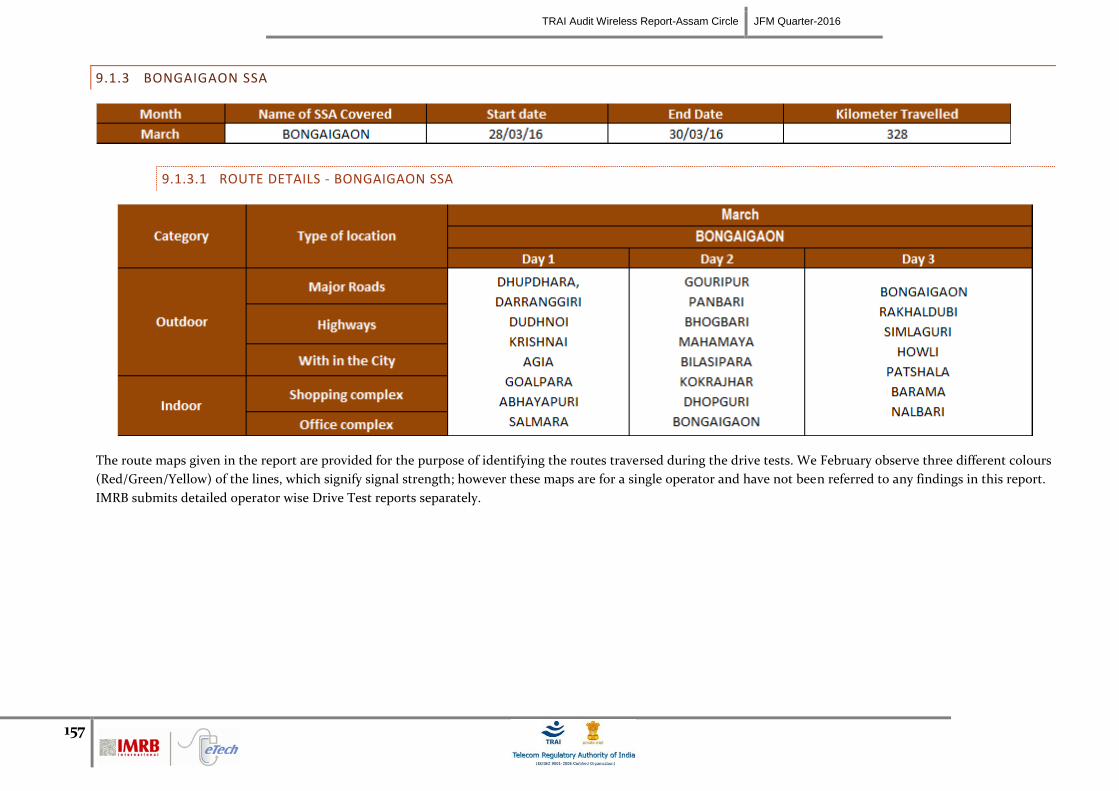
TRAI Audit Wireless Report-Assam Circle JFM Quarter-2016
157
9.1.3 BONGAIGAON SSA
9.1.3.1 ROUTE DETAILS - BONGAIGAON SSA
The route maps given in the report are provided for the purpose of identifying the routes traversed during the drive tests. We February observe three different colours
(Red/Green/Yellow) of the lines, which signify signal strength; however these maps are for a single operator and have not been referred to any findings in this report.
IMRB submits detailed operator wise Drive Test reports separately.
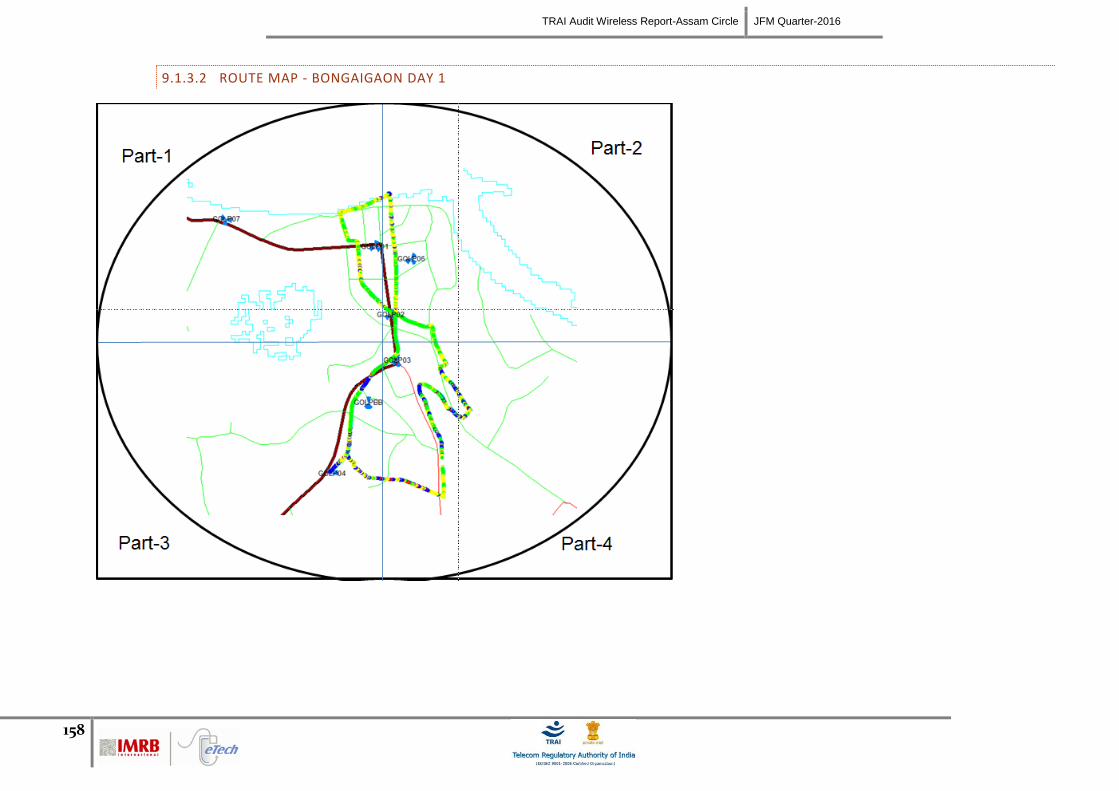
TRAI Audit Wireless Report-Assam Circle JFM Quarter-2016
158
9.1.3.2 ROUTE MAP - BONGAIGAON DAY 1
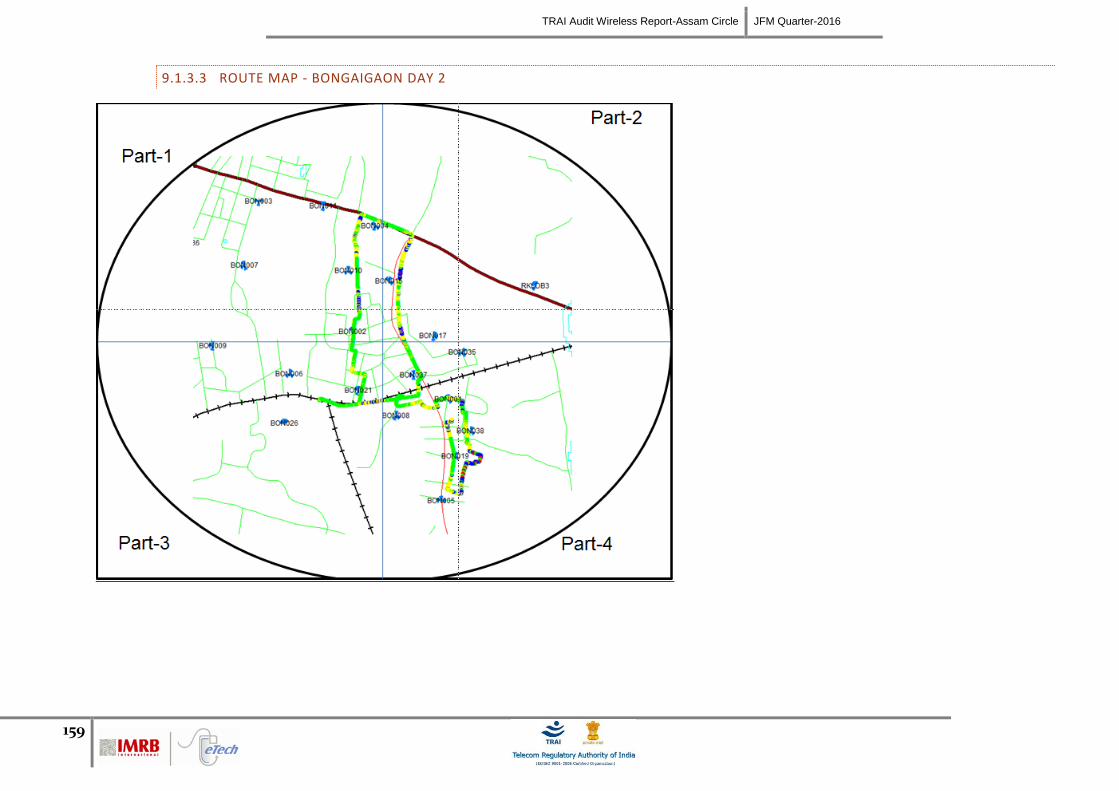
TRAI Audit Wireless Report-Assam Circle JFM Quarter-2016
159
9.1.3.3 ROUTE MAP - BONGAIGAON DAY 2
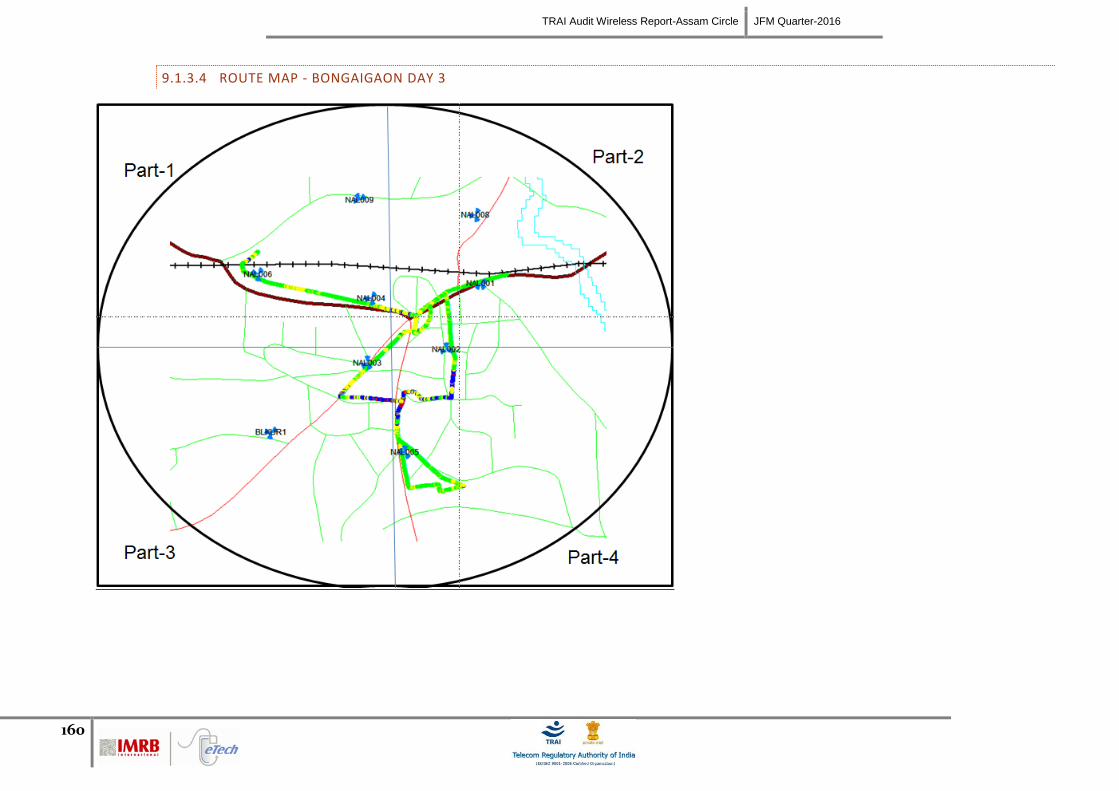
TRAI Audit Wireless Report-Assam Circle JFM Quarter-2016
160
9.1.3.4 ROUTE MAP - BONGAIGAON DAY 3
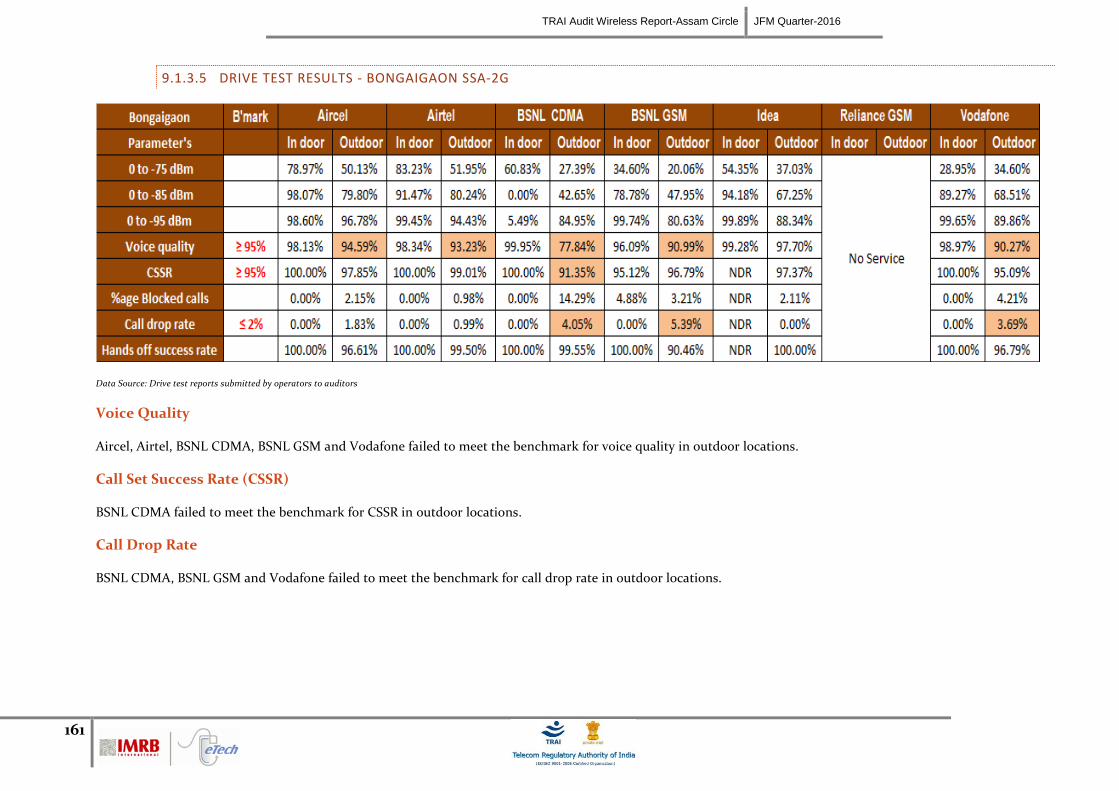
TRAI Audit Wireless Report-Assam Circle JFM Quarter-2016
161
9.1.3.5 DRIVE TEST RESULTS - BONGAIGAON SSA-2G
Data Source: Drive test reports submitted by operators to auditors
Voice Quality
Aircel, Airtel, BSNL CDMA, BSNL GSM and Vodafone failed to meet the benchmark for voice quality in outdoor locations.
Call Set Success Rate (CSSR)
BSNL CDMA failed to meet the benchmark for CSSR in outdoor locations.
Call Drop Rate
BSNL CDMA, BSNL GSM and Vodafone failed to meet the benchmark for call drop rate in outdoor locations.
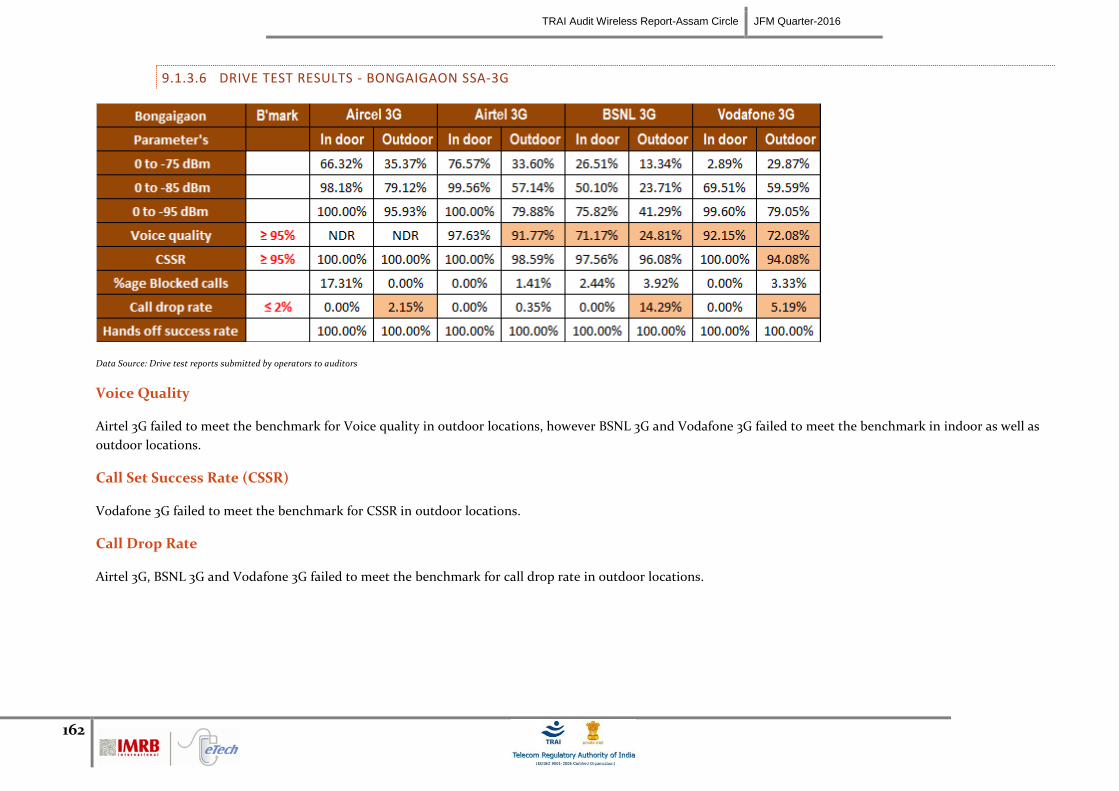
TRAI Audit Wireless Report-Assam Circle JFM Quarter-2016
162
9.1.3.6 DRIVE TEST RESULTS - BONGAIGAON SSA-3G
Data Source: Drive test reports submitted by operators to auditors
Voice Quality
Airtel 3G failed to meet the benchmark for Voice quality in outdoor locations, however BSNL 3G and Vodafone 3G failed to meet the benchmark in indoor as well as
outdoor locations.
Call Set Success Rate (CSSR)
Vodafone 3G failed to meet the benchmark for CSSR in outdoor locations.
Call Drop Rate
Airtel 3G, BSNL 3G and Vodafone 3G failed to meet the benchmark for call drop rate in outdoor locations.
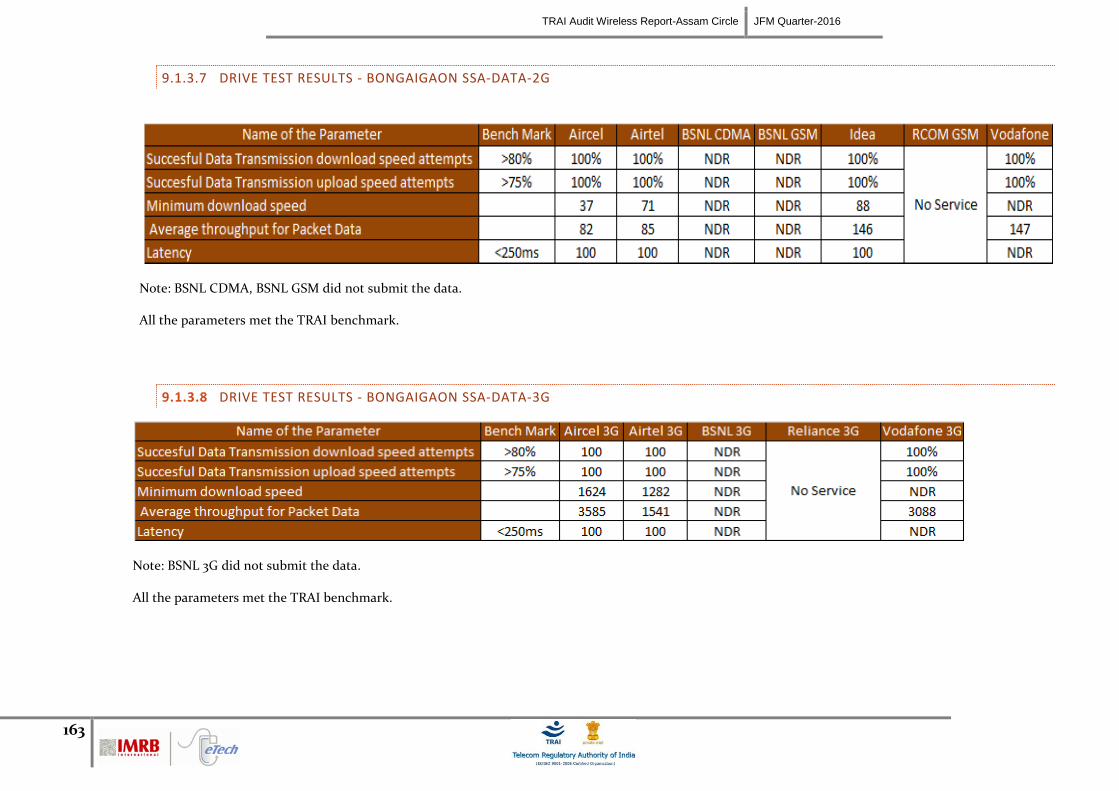
TRAI Audit Wireless Report-Assam Circle JFM Quarter-2016
163
9.1.3.7 DRIVE TEST RESULTS - BONGAIGAON SSA-DATA-2G
Note: BSNL CDMA, BSNL GSM did not submit the data.
All the parameters met the TRAI benchmark.
9.1.3.8 DRIVE TEST RESULTS - BONGAIGAON SSA-DATA-3G
Note: BSNL 3G did not submit the data.
All the parameters met the TRAI benchmark.
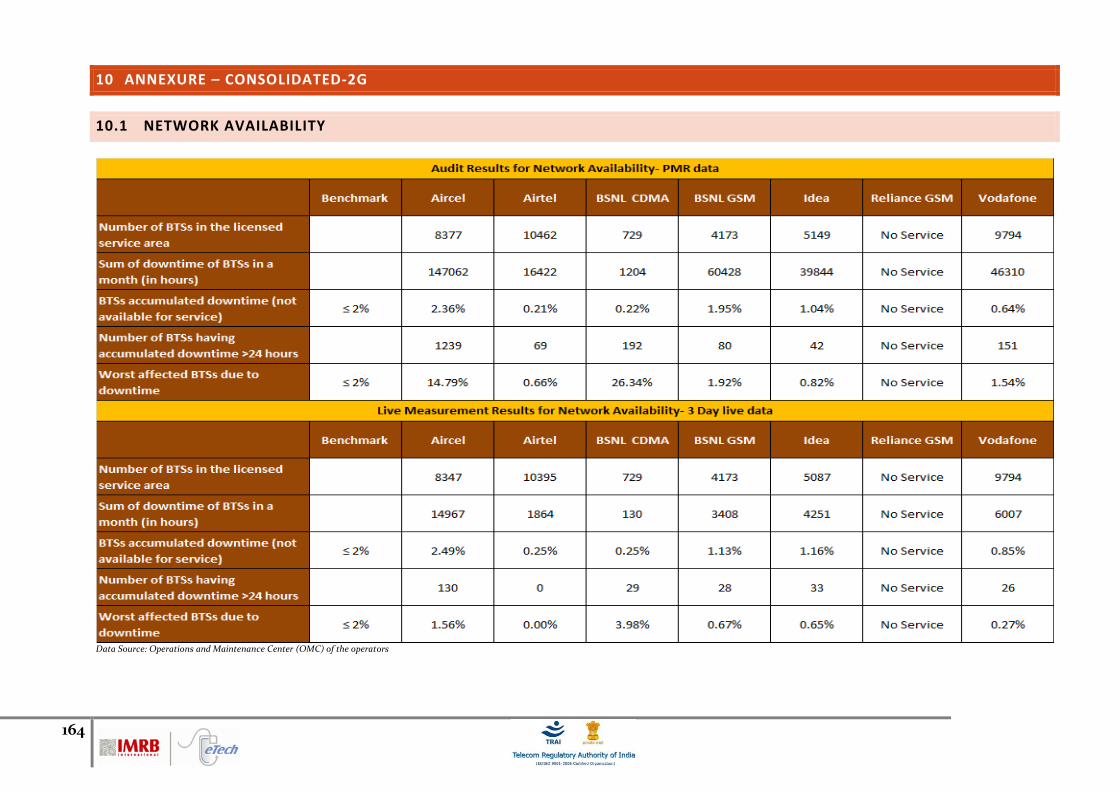
164
10 ANNEXURE – CONSOLIDATED-2G
10.1 NETWORK AVAILABILITY
Data Source: Operations and Maintenance Center (OMC) of the operators
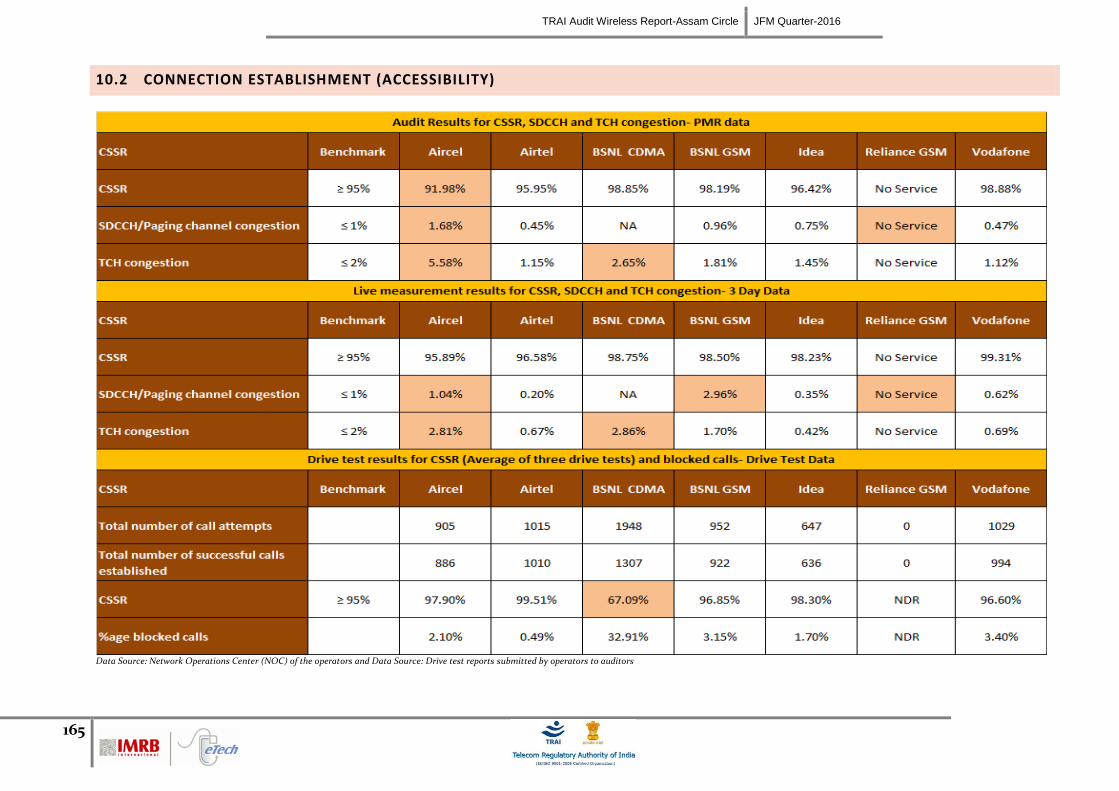
TRAI Audit Wireless Report-Assam Circle JFM Quarter-2016
165
10.2 CONNECTION ESTABLISHMENT (ACCESSIBILITY)
Data Source: Network Operations Center (NOC) of the operators and Data Source: Drive test reports submitted by operators to auditors
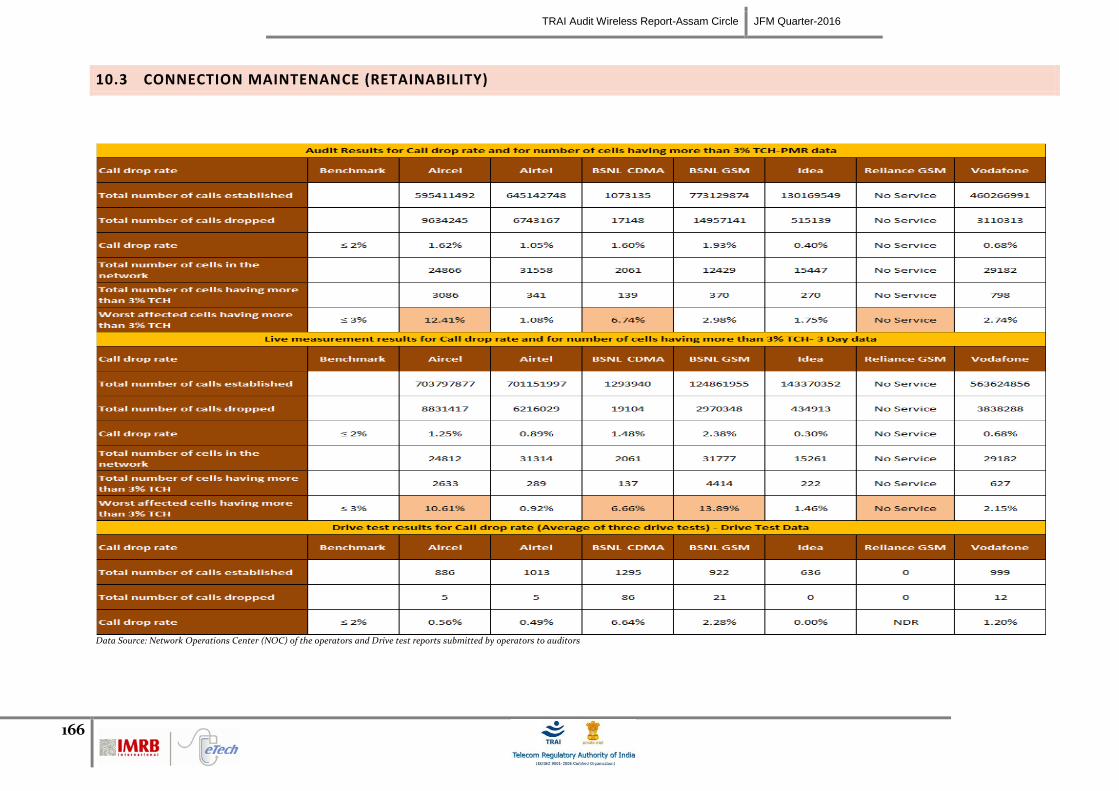
TRAI Audit Wireless Report-Assam Circle JFM Quarter-2016
166
10.3 CONNECTION MAINTENANCE (RETAINABILITY)
Data Source: Network Operations Center (NOC) of the operators and Drive test reports submitted by operators to auditors
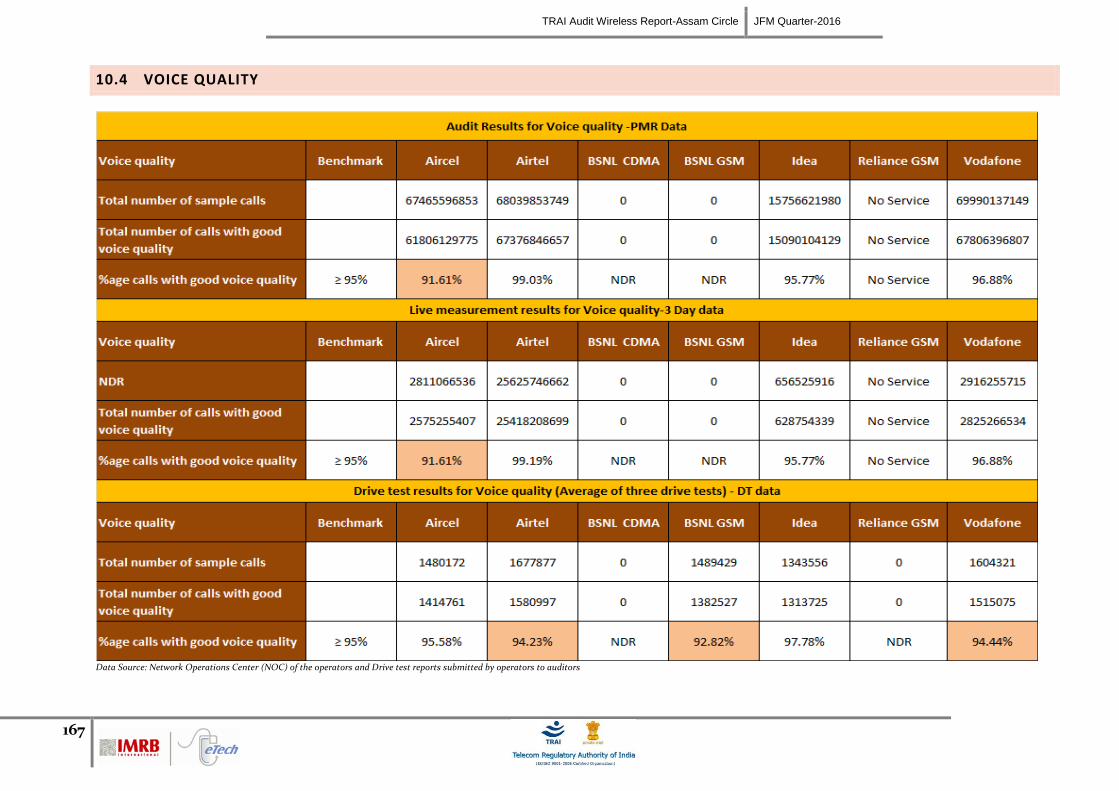
TRAI Audit Wireless Report-Assam Circle JFM Quarter-2016
167
10.4 VOICE QUALITY
Data Source: Network Operations Center (NOC) of the operators and Drive test reports submitted by operators to auditors
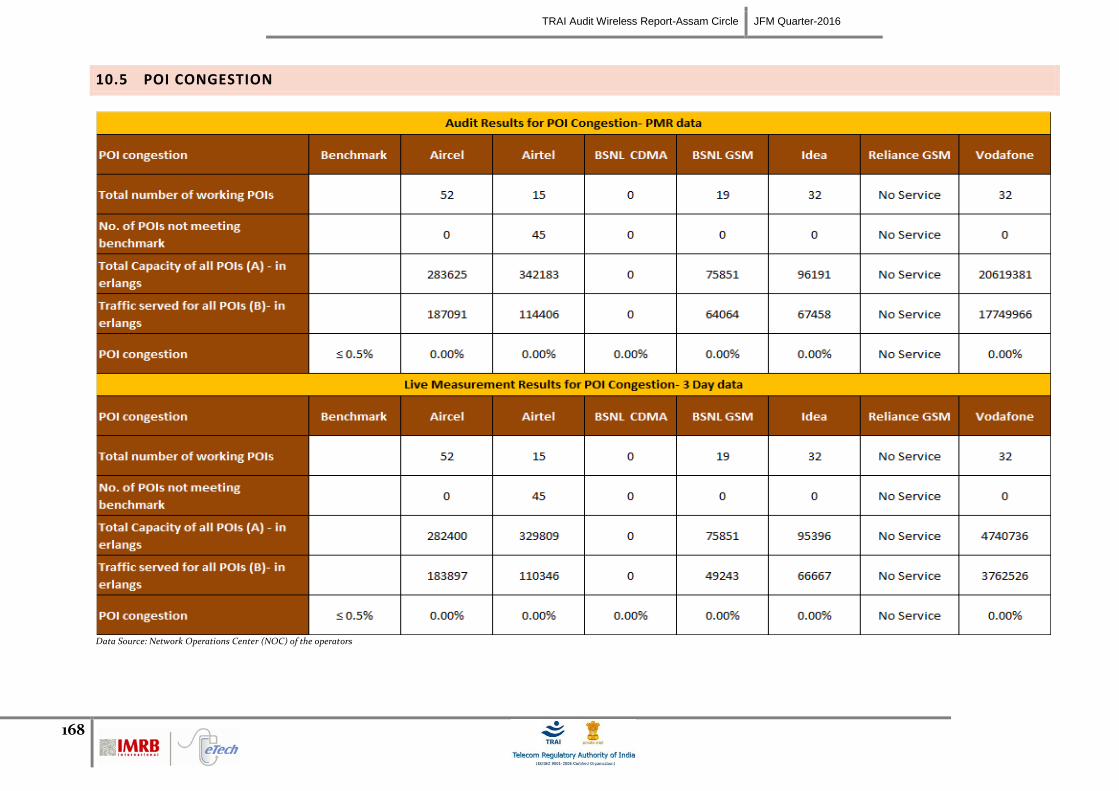
TRAI Audit Wireless Report-Assam Circle JFM Quarter-2016
168
10.5 POI CONGESTION
Data Source: Network Operations Center (NOC) of the operators
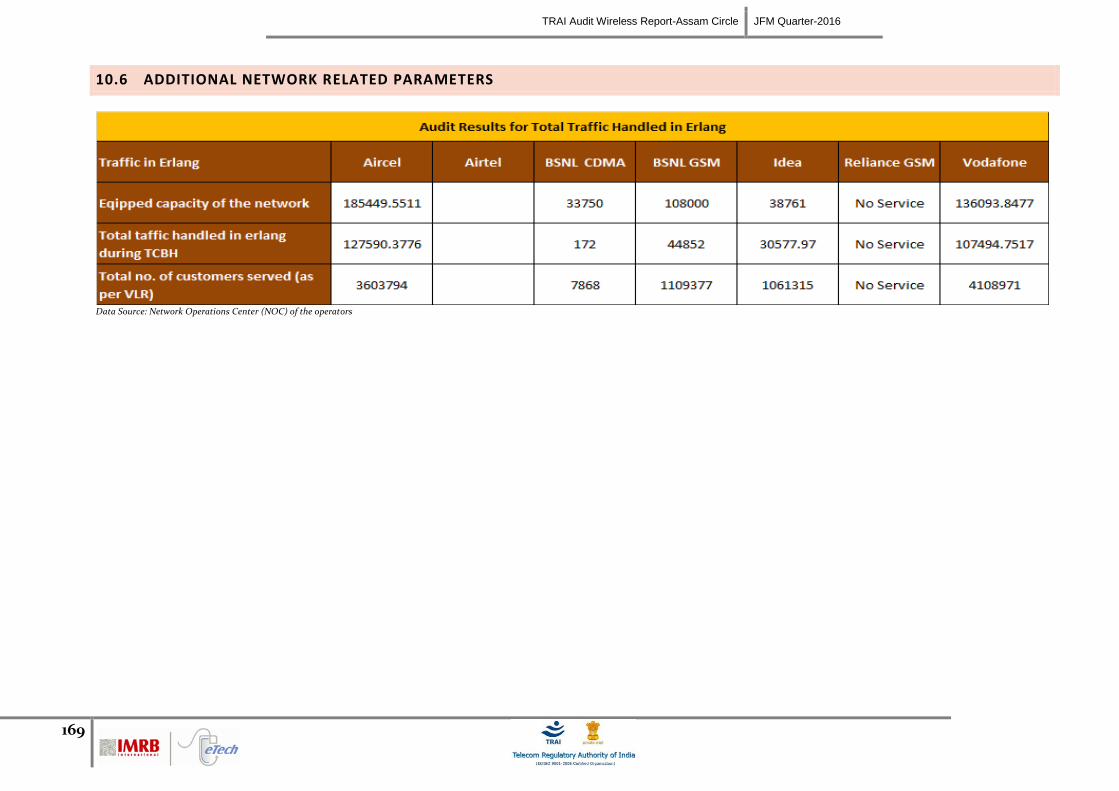
TRAI Audit Wireless Report-Assam Circle JFM Quarter-2016
169
10.6 ADDITIONAL NETWORK RELATED PARAMETERS
Data Source: Network Operations Center (NOC) of the operators
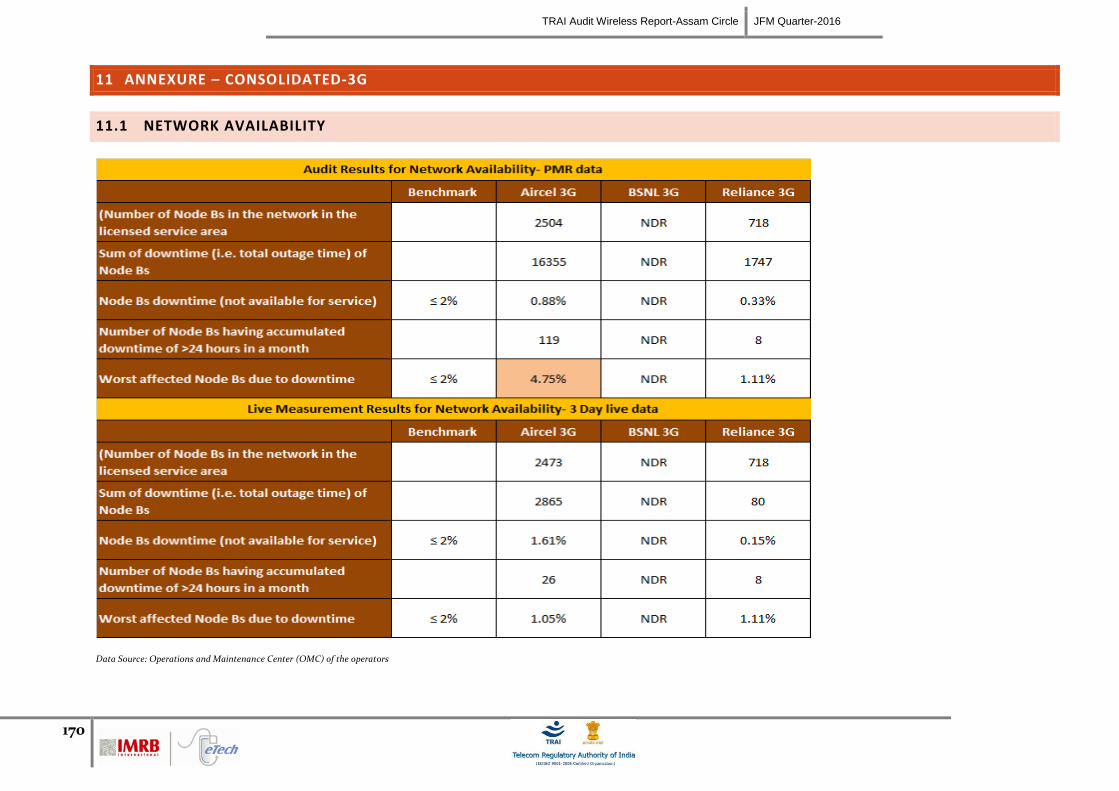
TRAI Audit Wireless Report-Assam Circle JFM Quarter-2016
170
11 ANNEXURE – CONSOLIDATED-3G
11.1 NETWORK AVAILABILITY
Data Source: Operations and Maintenance Center (OMC) of the operators
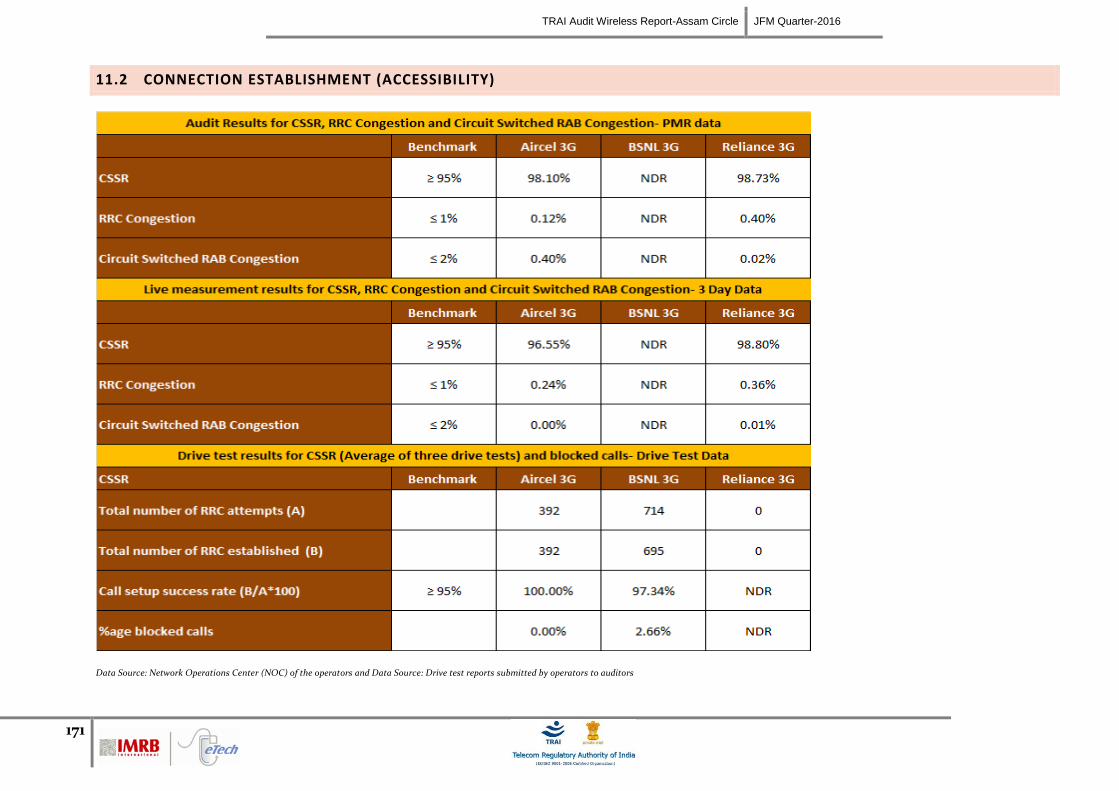
TRAI Audit Wireless Report-Assam Circle JFM Quarter-2016
171
11.2 CONNECTION ESTABLISHMENT (ACCESSIBILITY)
Data Source: Network Operations Center (NOC) of the operators and Data Source: Drive test reports submitted by operators to auditors
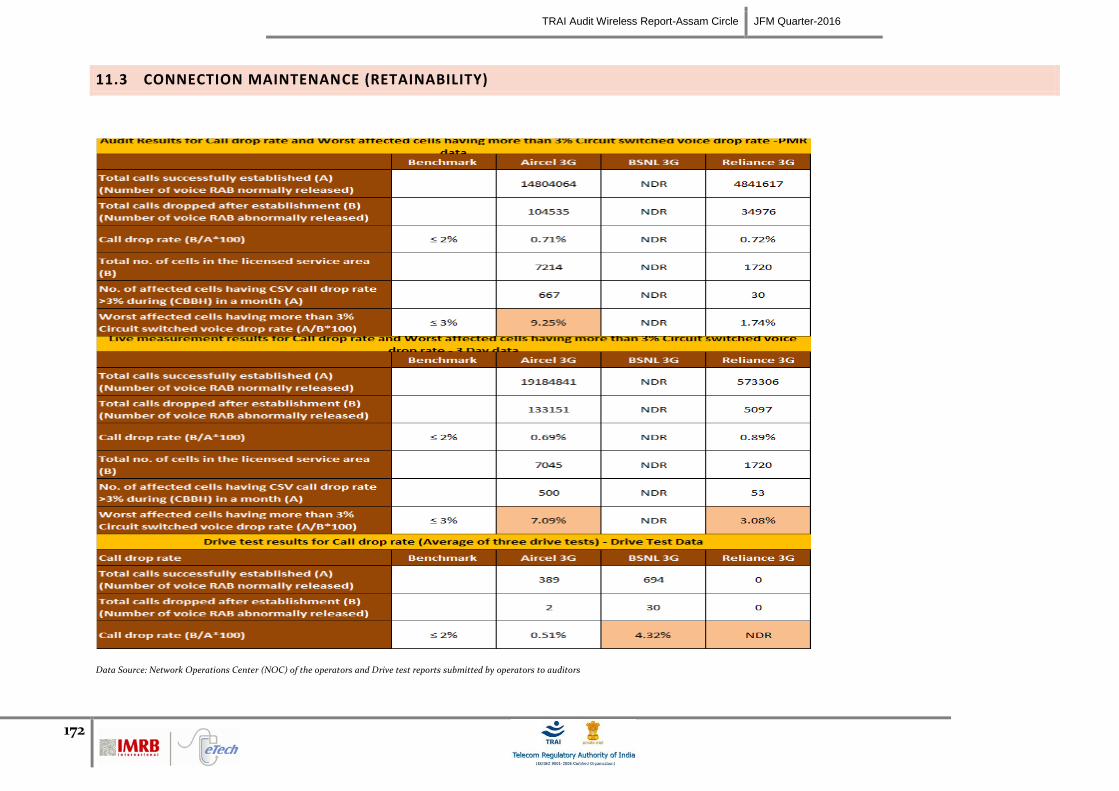
TRAI Audit Wireless Report-Assam Circle JFM Quarter-2016
172
11.3 CONNECTION MAINTENANCE (RETAINABILITY)
Data Source: Network Operations Center (NOC) of the operators and Drive test reports submitted by operators to auditors
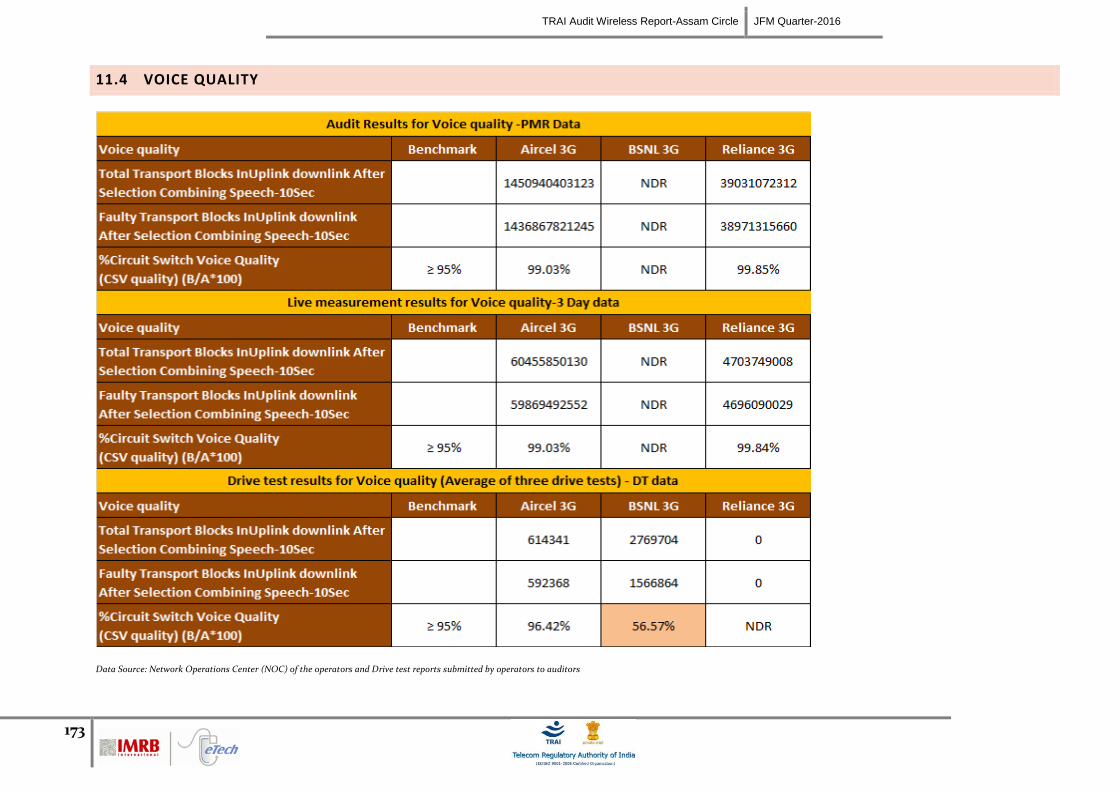
TRAI Audit Wireless Report-Assam Circle JFM Quarter-2016
173
11.4 VOICE QUALITY
Data Source: Network Operations Center (NOC) of the operators and Drive test reports submitted by operators to auditors
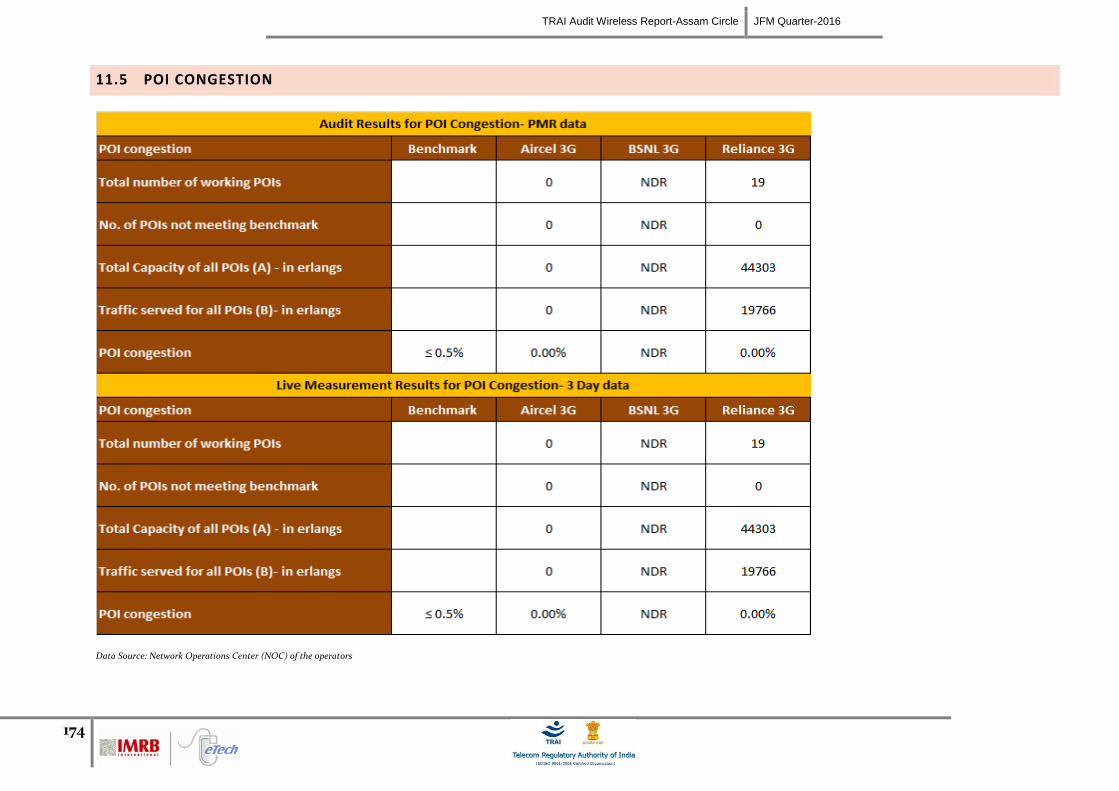
TRAI Audit Wireless Report-Assam Circle JFM Quarter-2016
174
11.5 POI CONGESTION
Data Source: Network Operations Center (NOC) of the operators
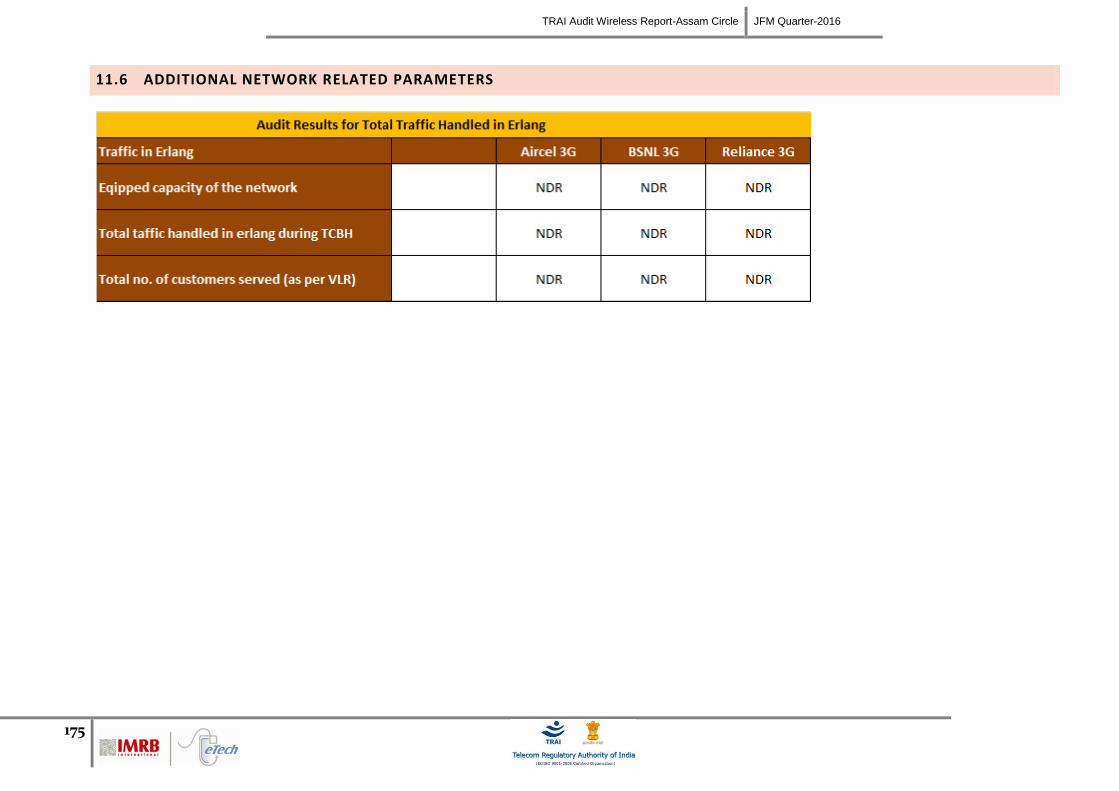
TRAI Audit Wireless Report-Assam Circle JFM Quarter-2016
175
11.6 ADDITIONAL NETWORK RELATED PARAMETERS
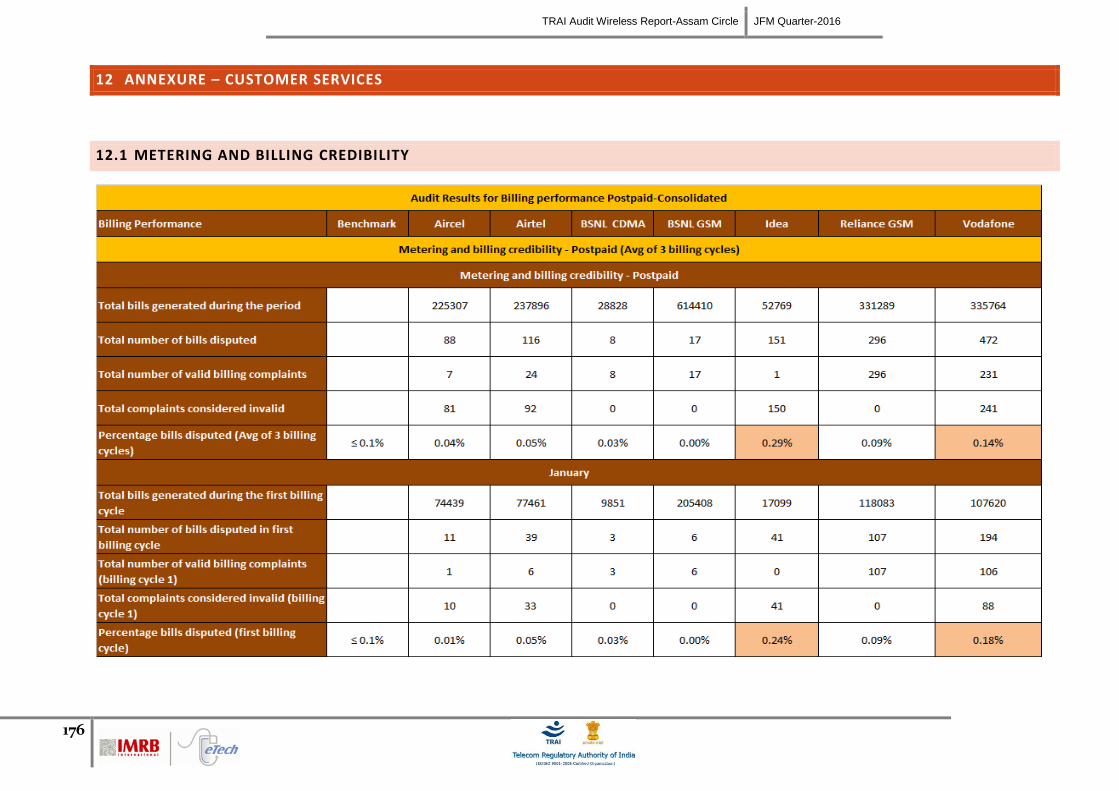
TRAI Audit Wireless Report-Assam Circle JFM Quarter-2016
176
12 ANNEXURE – CUSTOMER SERVICES
12.1 METERING AND BILLING CREDIBILITY
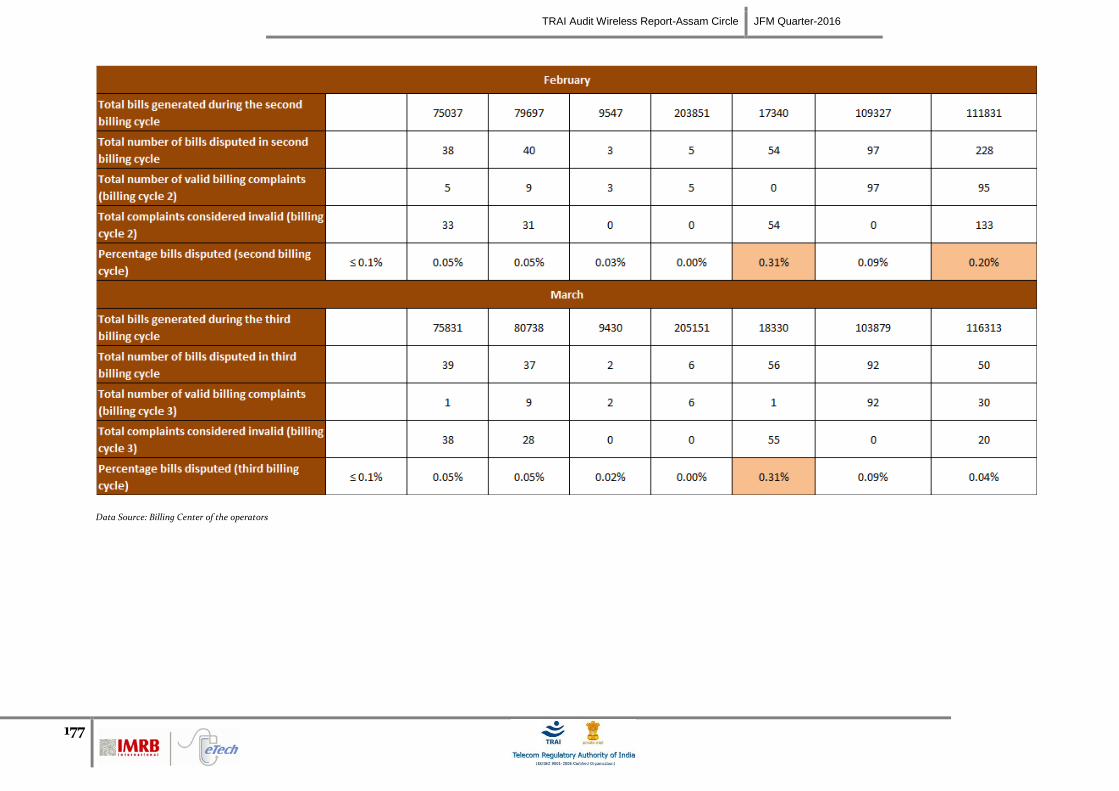
TRAI Audit Wireless Report-Assam Circle JFM Quarter-2016
177
Data Source: Billing Center of the operators
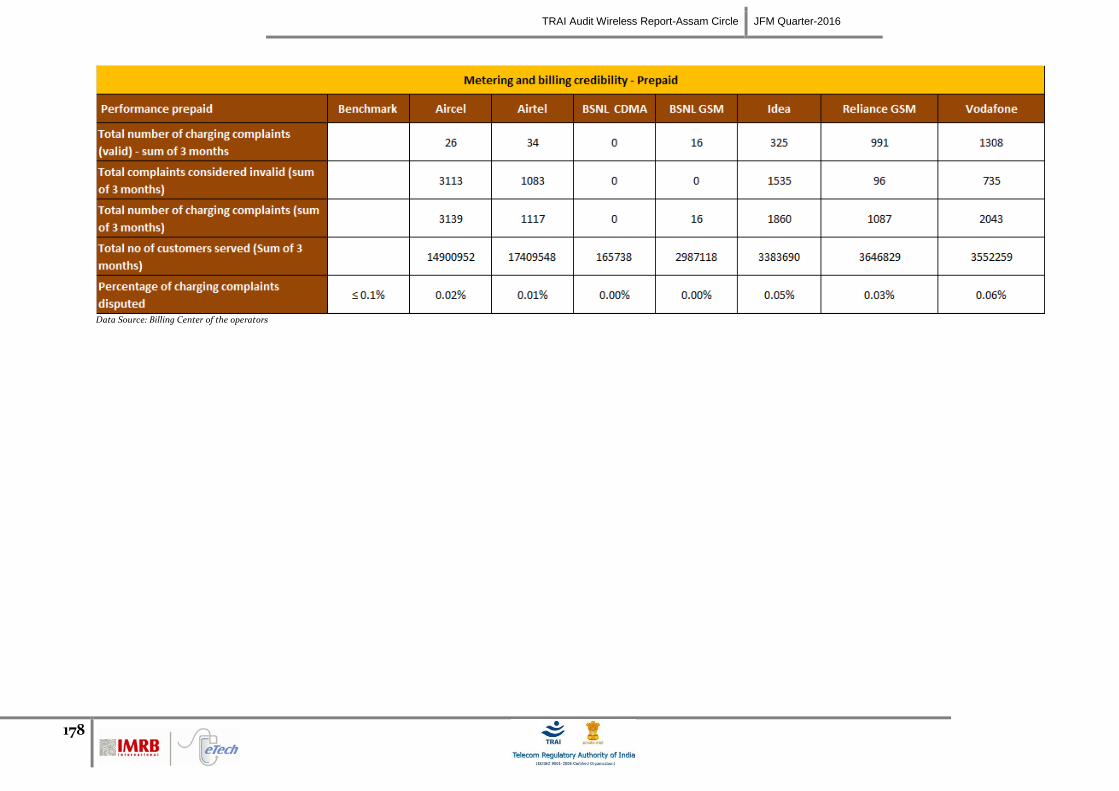
TRAI Audit Wireless Report-Assam Circle JFM Quarter-2016
178
Data Source: Billing Center of the operators
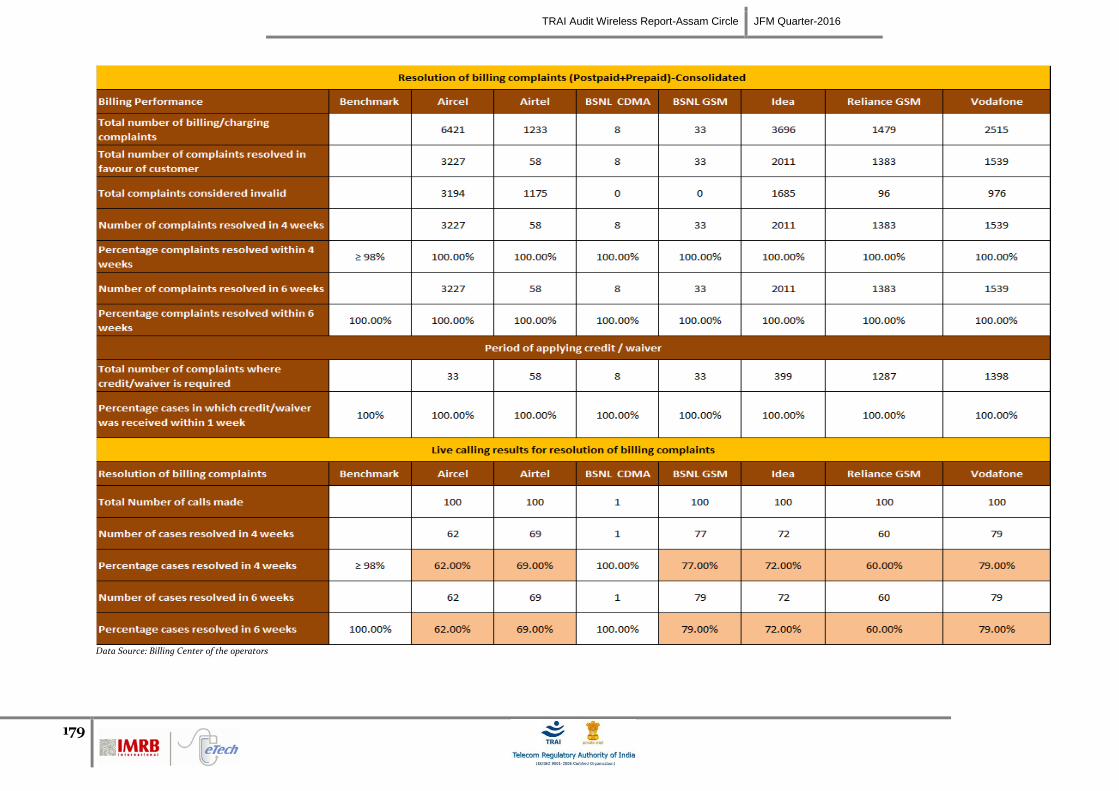
TRAI Audit Wireless Report-Assam Circle JFM Quarter-2016
179
Data Source: Billing Center of the operators
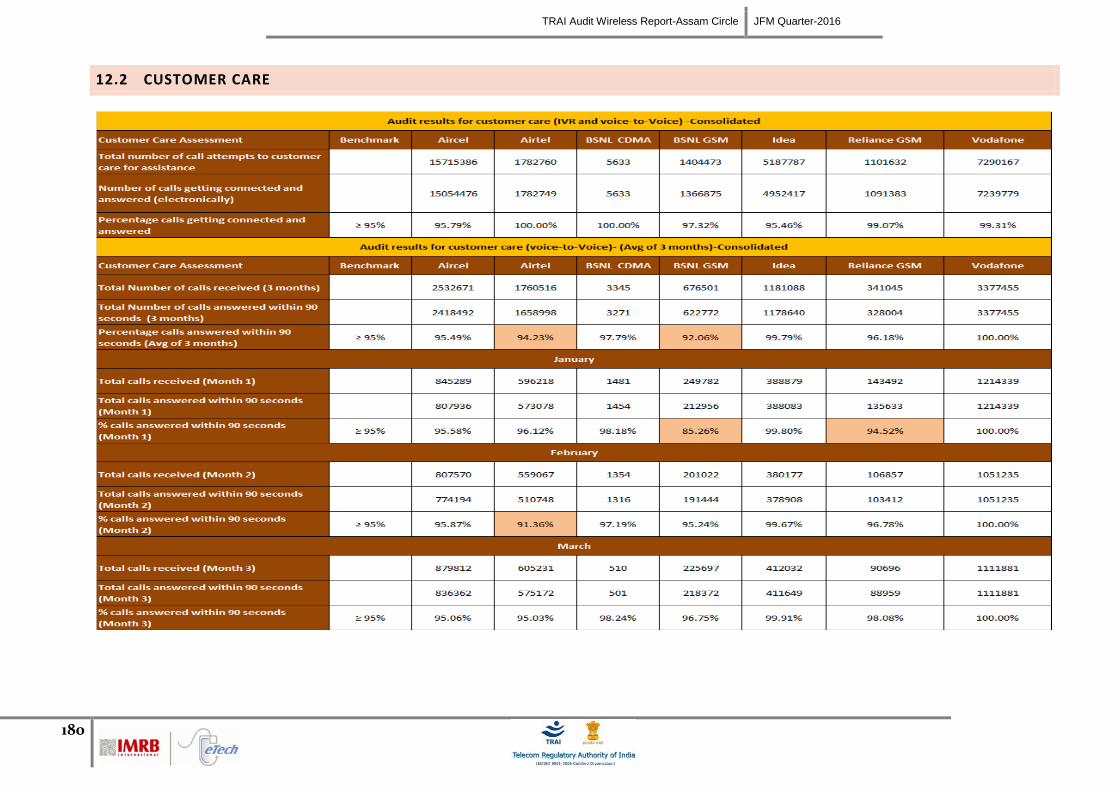
TRAI Audit Wireless Report-Assam Circle JFM Quarter-2016
180
12.2 CUSTOMER CARE
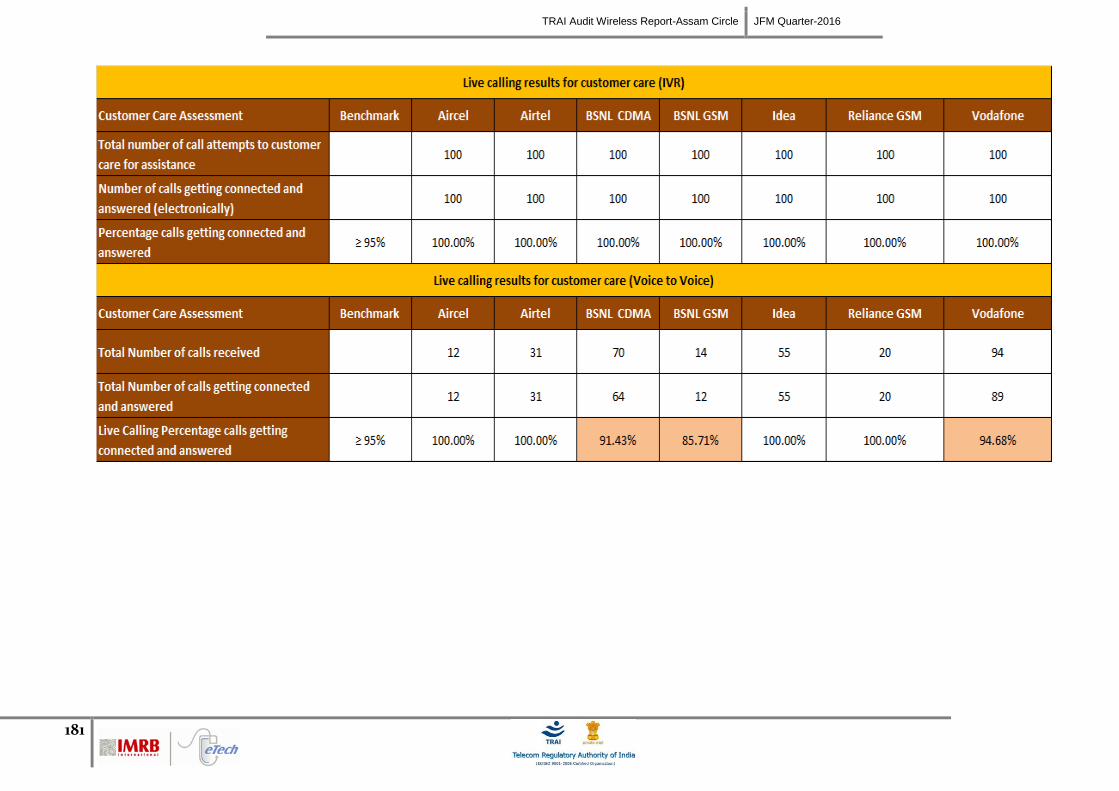
TRAI Audit Wireless Report-Assam Circle JFM Quarter-2016
181
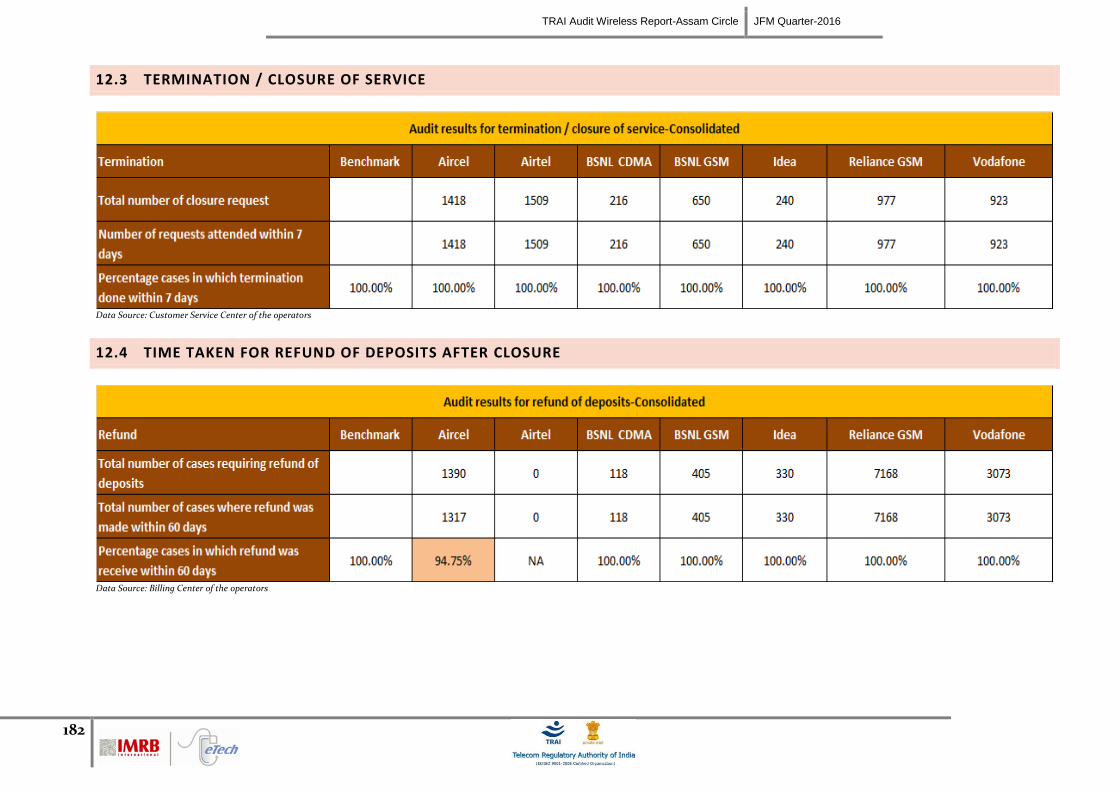
TRAI Audit Wireless Report-Assam Circle JFM Quarter-2016
182
12.3 TERMINATION / CLOSURE OF SERVICE
Data Source: Customer Service Center of the operators
12.4 TIME TAKEN FOR REFUND OF DEPOSITS AFTER CLOSURE
Data Source: Billing Center of the operators
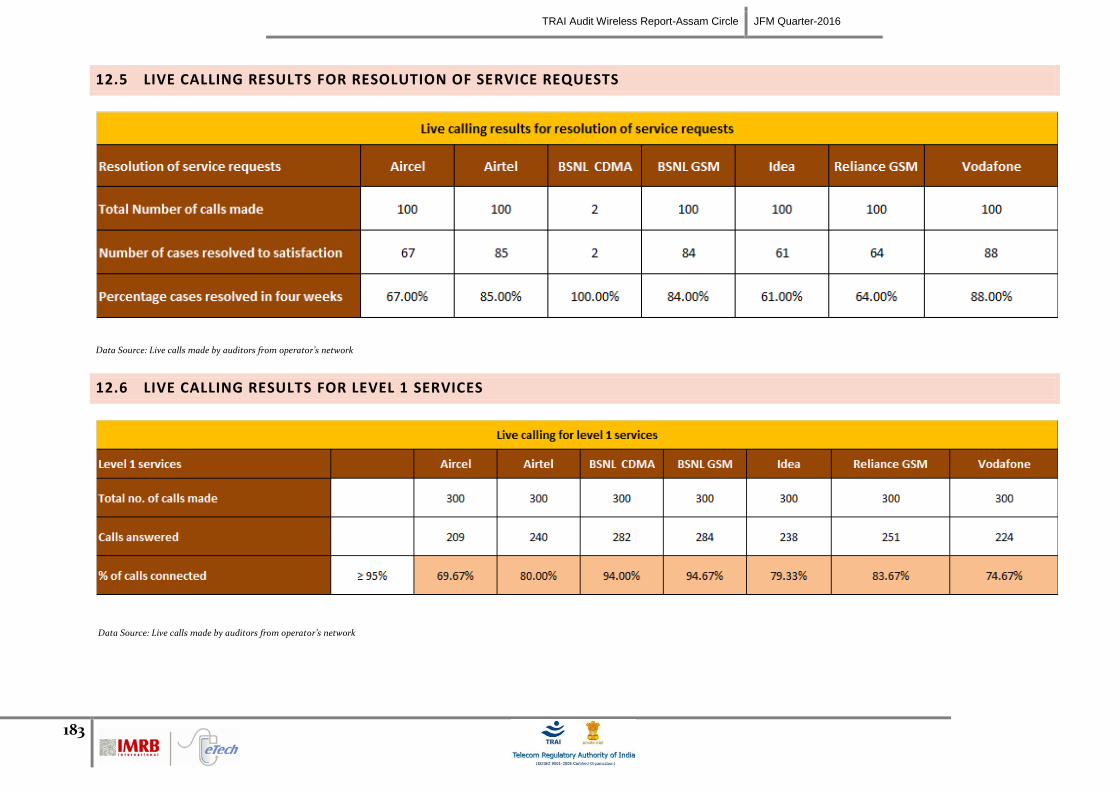
TRAI Audit Wireless Report-Assam Circle JFM Quarter-2016
183
12.5 LIVE CALLING RESULTS FOR RESOLUTION OF SERVICE REQUESTS
Data Source: Live calls made by auditors from operator’s network
12.6 LIVE CALLING RESULTS FOR LEVEL 1 SERVICES
Data Source: Live calls made by auditors from operator’s network
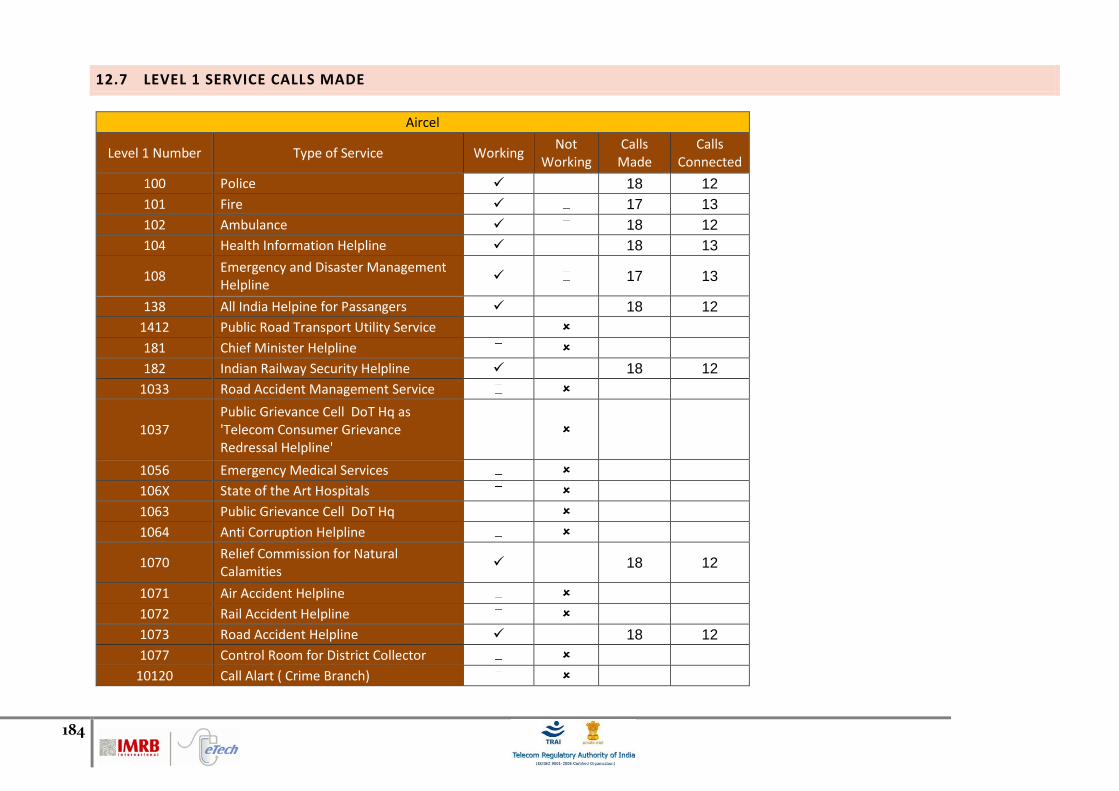
184
12.7 LEVEL 1 SERVICE CALLS MADE
Aircel
Level 1 Number Type of Service Working Not
Working Calls
Made Calls
Connected
100 Police 18 12
101 Fire 17 13
102 Ambulance 18 12
104 Health Information Helpline 18 13
108 Emergency and Disaster Management Helpline
17 13
138 All India Helpine for Passangers 18 12
1412 Public Road Transport Utility Service
181 Chief Minister Helpline
182 Indian Railway Security Helpline 18 12
1033 Road Accident Management Service
1037 Public Grievance Cell DoT Hq as 'Telecom Consumer Grievance Redressal Helpline'
1056 Emergency Medical Services
106X State of the Art Hospitals
1063 Public Grievance Cell DoT Hq
1064 Anti Corruption Helpline
1070 Relief Commission for Natural Calamities
18 12
1071 Air Accident Helpline
1072 Rail Accident Helpline
1073 Road Accident Helpline 18 12
1077 Control Room for District Collector
10120 Call Alart ( Crime Branch)
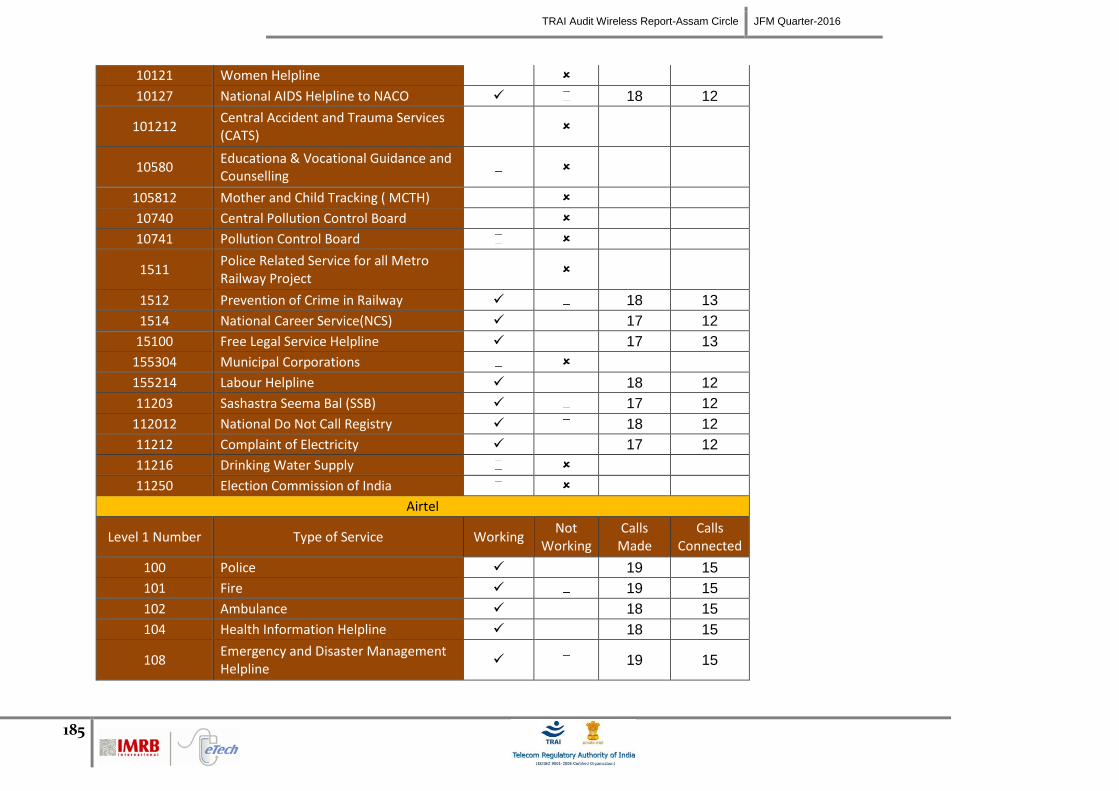
TRAI Audit Wireless Report-Assam Circle JFM Quarter-2016
185
10121 Women Helpline
10127 National AIDS Helpline to NACO 18 12
101212 Central Accident and Trauma Services (CATS)
10580 Educationa & Vocational Guidance and Counselling
105812 Mother and Child Tracking ( MCTH)
10740 Central Pollution Control Board
10741 Pollution Control Board
1511 Police Related Service for all Metro Railway Project
1512 Prevention of Crime in Railway 18 13
1514 National Career Service(NCS) 17 12
15100 Free Legal Service Helpline 17 13
155304 Municipal Corporations
155214 Labour Helpline 18 12
11203 Sashastra Seema Bal (SSB) 17 12
112012 National Do Not Call Registry 18 12
11212 Complaint of Electricity 17 12
11216 Drinking Water Supply
11250 Election Commission of India
Airtel
Level 1 Number Type of Service Working Not
Working Calls
Made Calls
Connected
100 Police 19 15
101 Fire 19 15
102 Ambulance 18 15
104 Health Information Helpline 18 15
108 Emergency and Disaster Management Helpline
19 15
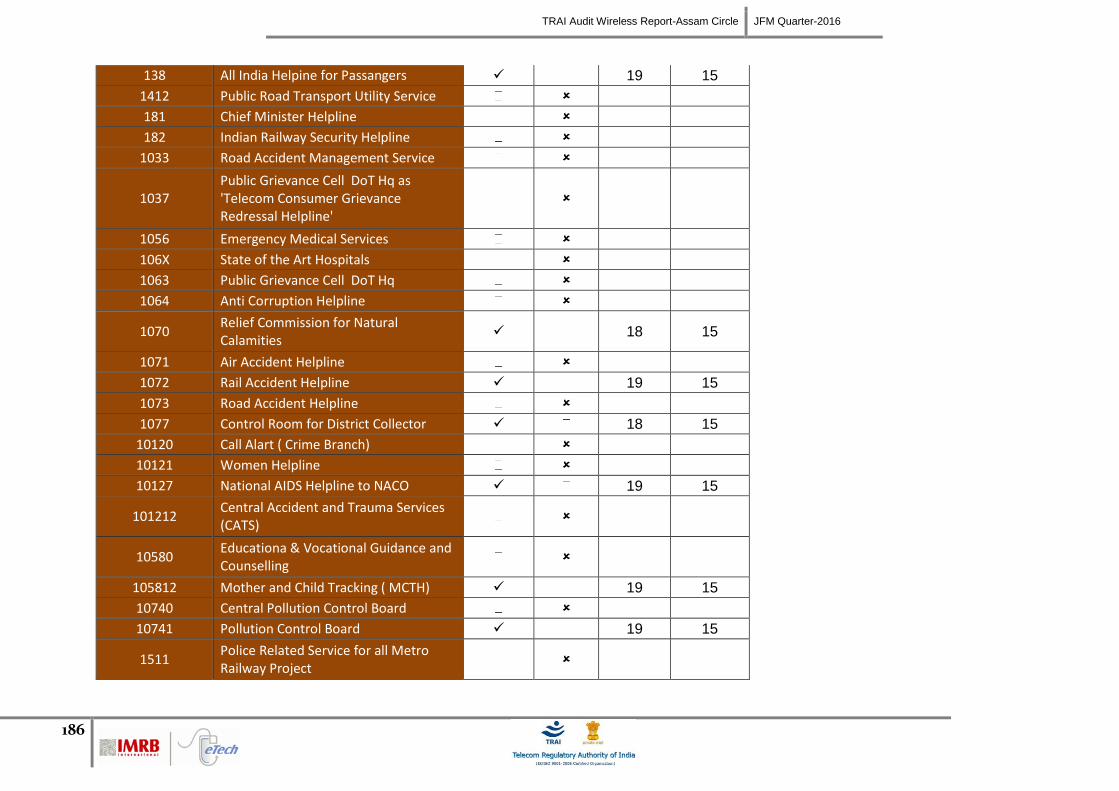
TRAI Audit Wireless Report-Assam Circle JFM Quarter-2016
186
138 All India Helpine for Passangers 19 15
1412 Public Road Transport Utility Service
181 Chief Minister Helpline
182 Indian Railway Security Helpline
1033 Road Accident Management Service
1037 Public Grievance Cell DoT Hq as 'Telecom Consumer Grievance Redressal Helpline'
1056 Emergency Medical Services
106X State of the Art Hospitals
1063 Public Grievance Cell DoT Hq
1064 Anti Corruption Helpline
1070 Relief Commission for Natural Calamities
18 15
1071 Air Accident Helpline
1072 Rail Accident Helpline 19 15
1073 Road Accident Helpline
1077 Control Room for District Collector 18 15
10120 Call Alart ( Crime Branch)
10121 Women Helpline
10127 National AIDS Helpline to NACO 19 15
101212 Central Accident and Trauma Services (CATS)
10580 Educationa & Vocational Guidance and Counselling
105812 Mother and Child Tracking ( MCTH) 19 15
10740 Central Pollution Control Board
10741 Pollution Control Board 19 15
1511 Police Related Service for all Metro Railway Project
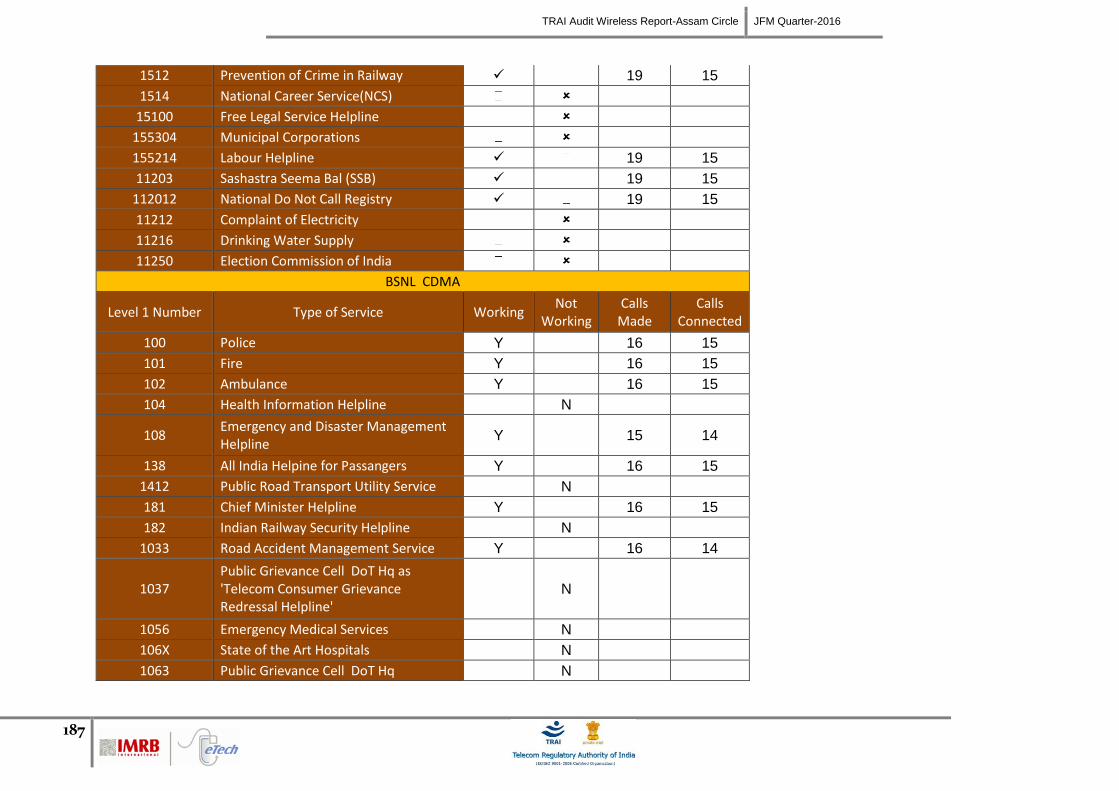
TRAI Audit Wireless Report-Assam Circle JFM Quarter-2016
187
1512 Prevention of Crime in Railway 19 15
1514 National Career Service(NCS)
15100 Free Legal Service Helpline
155304 Municipal Corporations
155214 Labour Helpline 19 15
11203 Sashastra Seema Bal (SSB) 19 15
112012 National Do Not Call Registry 19 15
11212 Complaint of Electricity
11216 Drinking Water Supply
11250 Election Commission of India
BSNL CDMA
Level 1 Number Type of Service Working Not
Working Calls
Made Calls
Connected
100 Police Y 16 15
101 Fire Y 16 15
102 Ambulance Y 16 15
104 Health Information Helpline N
108 Emergency and Disaster Management Helpline
Y 15 14
138 All India Helpine for Passangers Y 16 15
1412 Public Road Transport Utility Service N
181 Chief Minister Helpline Y 16 15
182 Indian Railway Security Helpline N
1033 Road Accident Management Service Y 16 14
1037 Public Grievance Cell DoT Hq as 'Telecom Consumer Grievance Redressal Helpline'
N
1056 Emergency Medical Services N
106X State of the Art Hospitals N
1063 Public Grievance Cell DoT Hq N
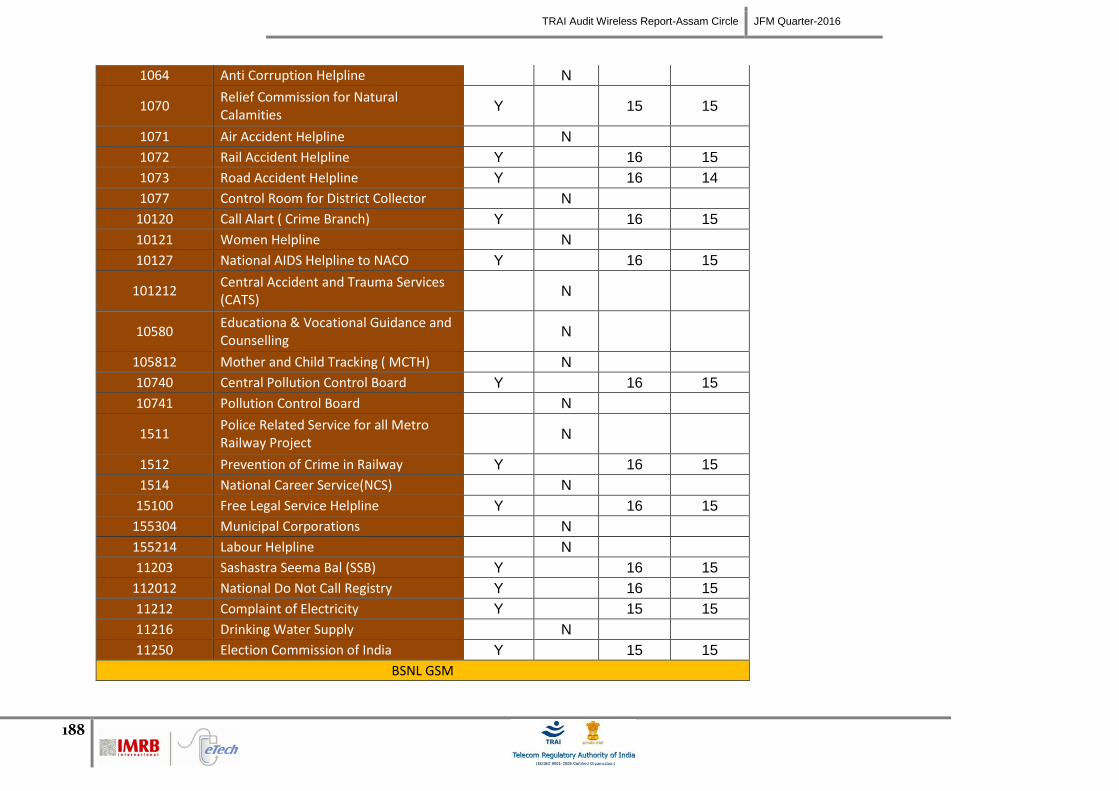
TRAI Audit Wireless Report-Assam Circle JFM Quarter-2016
188
1064 Anti Corruption Helpline N
1070 Relief Commission for Natural Calamities
Y 15 15
1071 Air Accident Helpline N
1072 Rail Accident Helpline Y 16 15
1073 Road Accident Helpline Y 16 14
1077 Control Room for District Collector N
10120 Call Alart ( Crime Branch) Y 16 15
10121 Women Helpline N
10127 National AIDS Helpline to NACO Y 16 15
101212 Central Accident and Trauma Services (CATS)
N
10580 Educationa & Vocational Guidance and Counselling
N
105812 Mother and Child Tracking ( MCTH) N
10740 Central Pollution Control Board Y 16 15
10741 Pollution Control Board N
1511 Police Related Service for all Metro Railway Project
N
1512 Prevention of Crime in Railway Y 16 15
1514 National Career Service(NCS) N
15100 Free Legal Service Helpline Y 16 15
155304 Municipal Corporations N
155214 Labour Helpline N
11203 Sashastra Seema Bal (SSB) Y 16 15
112012 National Do Not Call Registry Y 16 15
11212 Complaint of Electricity Y 15 15
11216 Drinking Water Supply N
11250 Election Commission of India Y 15 15
BSNL GSM

TRAI Audit Wireless Report-Assam Circle JFM Quarter-2016
189
Level 1 Number Type of Service Working Not
Working Calls
Made Calls
Connected
100 Police Y 16 16
101 Fire Y 16 16
102 Ambulance N
104 Health Information Helpline N
108 Emergency and Disaster Management Helpline
Y 17 16
138 All India Helpine for Passangers Y 16 16
1412 Public Road Transport Utility Service N
181 Chief Minister Helpline Y 17 15
182 Indian Railway Security Helpline Y 17 16
1033 Road Accident Management Service Y 16 15
1037 Public Grievance Cell DoT Hq as 'Telecom Consumer Grievance Redressal Helpline'
N
1056 Emergency Medical Services N
106X State of the Art Hospitals N
1063 Public Grievance Cell DoT Hq N
1064 Anti Corruption Helpline N
1070 Relief Commission for Natural Calamities
N
1071 Air Accident Helpline N
1072 Rail Accident Helpline Y 16 16
1073 Road Accident Helpline Y 17 16
1077 Control Room for District Collector N
10120 Call Alart ( Crime Branch) Y 16 15
10121 Women Helpline N
10127 National AIDS Helpline to NACO Y 17 16
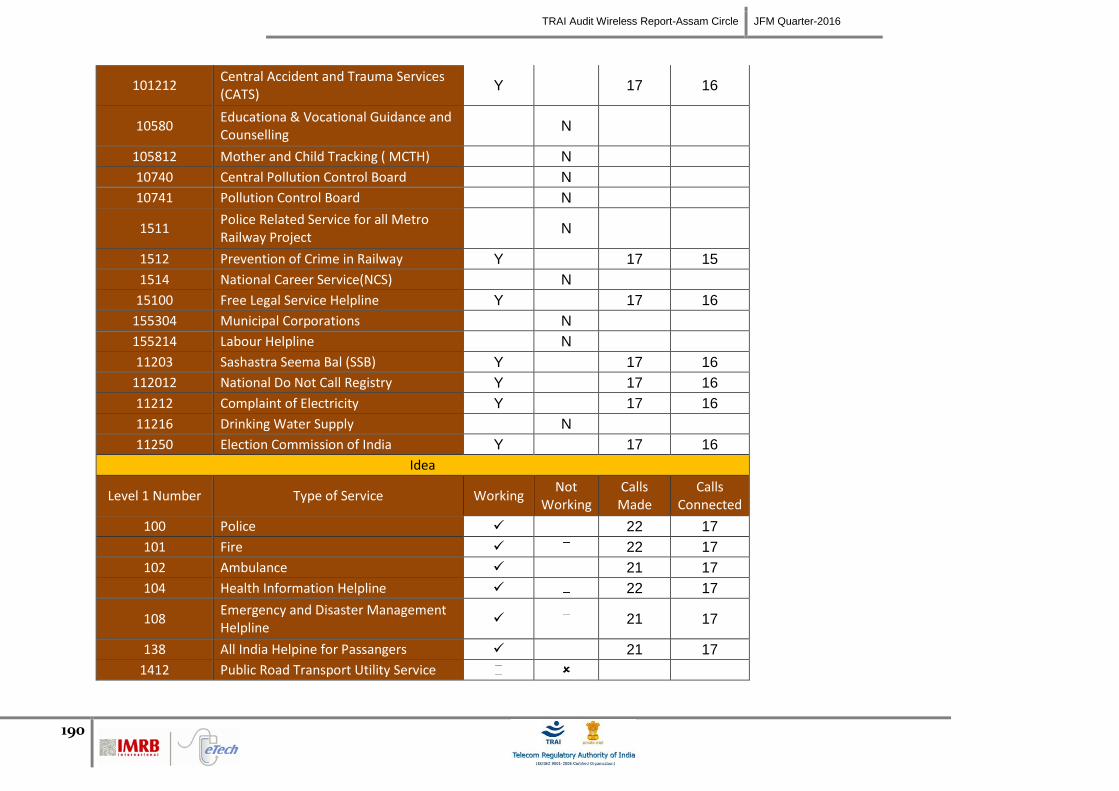
TRAI Audit Wireless Report-Assam Circle JFM Quarter-2016
190
101212 Central Accident and Trauma Services (CATS)
Y 17 16
10580 Educationa & Vocational Guidance and Counselling
N
105812 Mother and Child Tracking ( MCTH) N
10740 Central Pollution Control Board N
10741 Pollution Control Board N
1511 Police Related Service for all Metro Railway Project
N
1512 Prevention of Crime in Railway Y 17 15
1514 National Career Service(NCS) N
15100 Free Legal Service Helpline Y 17 16
155304 Municipal Corporations N
155214 Labour Helpline N
11203 Sashastra Seema Bal (SSB) Y 17 16
112012 National Do Not Call Registry Y 17 16
11212 Complaint of Electricity Y 17 16
11216 Drinking Water Supply N
11250 Election Commission of India Y 17 16
Idea
Level 1 Number Type of Service Working Not
Working Calls
Made Calls
Connected
100 Police 22 17
101 Fire 22 17
102 Ambulance 21 17
104 Health Information Helpline 22 17
108 Emergency and Disaster Management Helpline
21 17
138 All India Helpine for Passangers 21 17
1412 Public Road Transport Utility Service
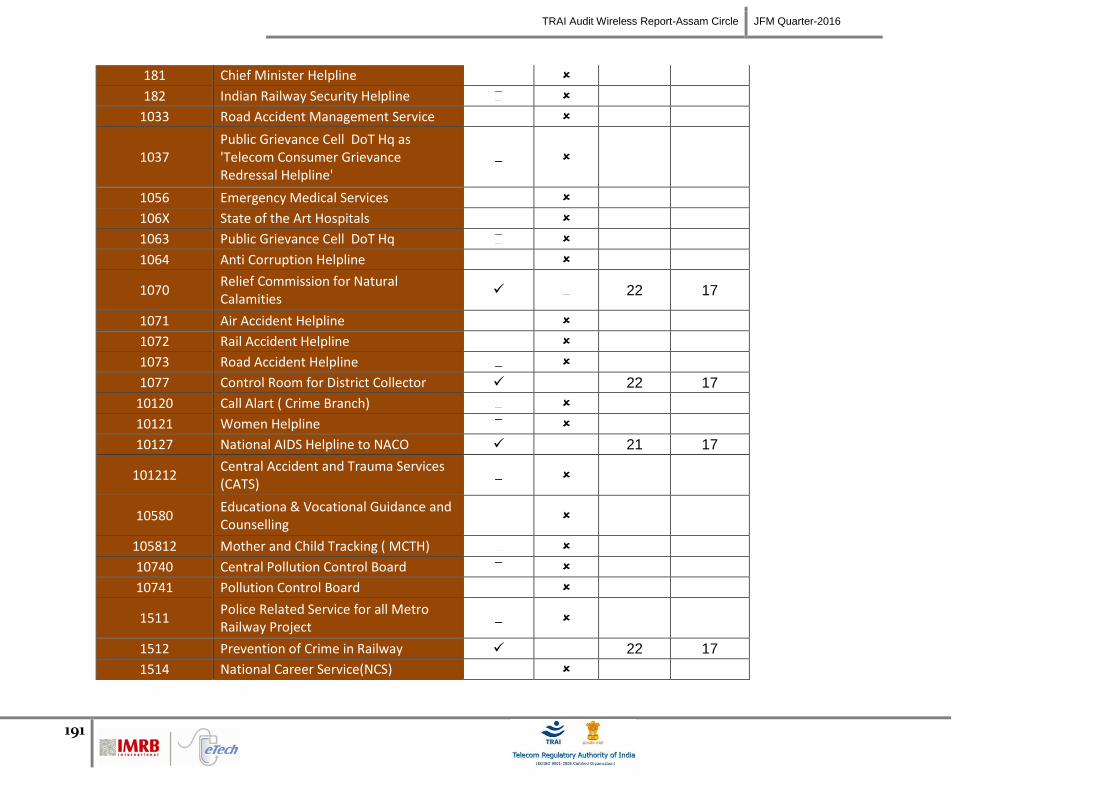
TRAI Audit Wireless Report-Assam Circle JFM Quarter-2016
191
181 Chief Minister Helpline
182 Indian Railway Security Helpline
1033 Road Accident Management Service
1037 Public Grievance Cell DoT Hq as 'Telecom Consumer Grievance Redressal Helpline'
1056 Emergency Medical Services
106X State of the Art Hospitals
1063 Public Grievance Cell DoT Hq
1064 Anti Corruption Helpline
1070 Relief Commission for Natural Calamities
22 17
1071 Air Accident Helpline
1072 Rail Accident Helpline
1073 Road Accident Helpline
1077 Control Room for District Collector 22 17
10120 Call Alart ( Crime Branch)
10121 Women Helpline
10127 National AIDS Helpline to NACO 21 17
101212 Central Accident and Trauma Services (CATS)
10580 Educationa & Vocational Guidance and Counselling
105812 Mother and Child Tracking ( MCTH)
10740 Central Pollution Control Board
10741 Pollution Control Board
1511 Police Related Service for all Metro Railway Project
1512 Prevention of Crime in Railway 22 17
1514 National Career Service(NCS)
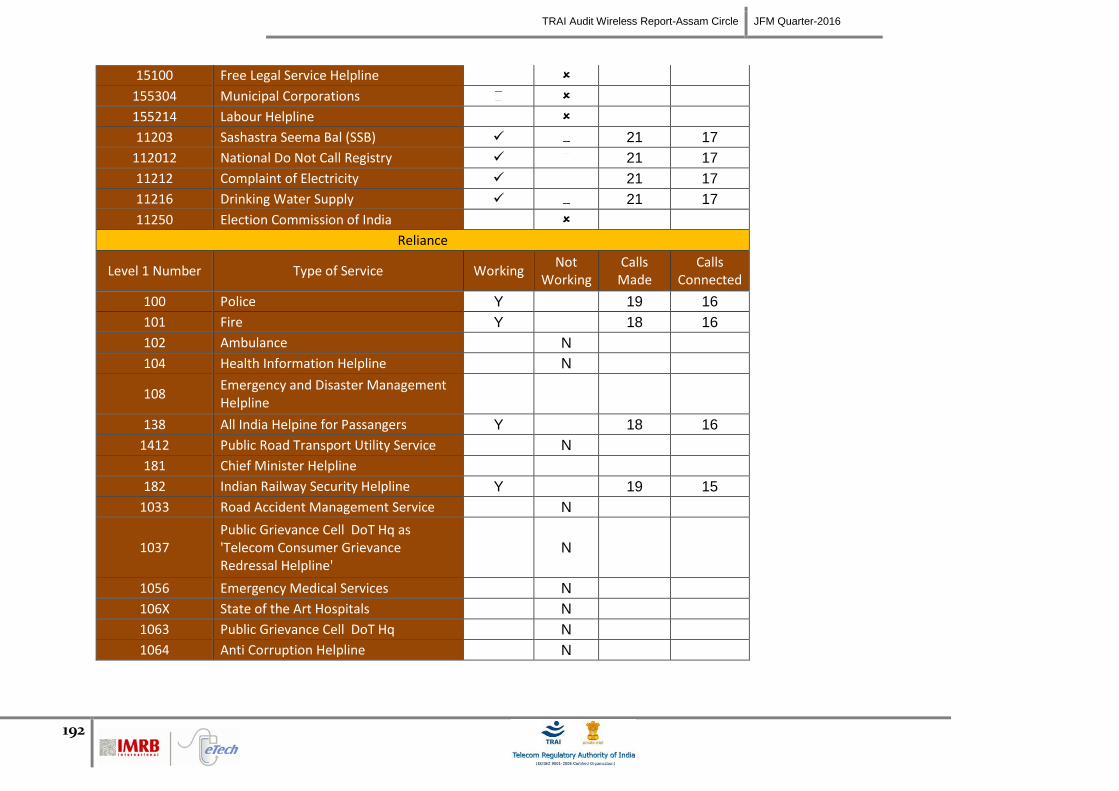
TRAI Audit Wireless Report-Assam Circle JFM Quarter-2016
192
15100 Free Legal Service Helpline
155304 Municipal Corporations
155214 Labour Helpline
11203 Sashastra Seema Bal (SSB) 21 17
112012 National Do Not Call Registry 21 17
11212 Complaint of Electricity 21 17
11216 Drinking Water Supply 21 17
11250 Election Commission of India
Reliance
Level 1 Number Type of Service Working Not
Working Calls
Made Calls
Connected
100 Police Y 19 16
101 Fire Y 18 16
102 Ambulance N
104 Health Information Helpline N
108 Emergency and Disaster Management Helpline
138 All India Helpine for Passangers Y 18 16
1412 Public Road Transport Utility Service N
181 Chief Minister Helpline
182 Indian Railway Security Helpline Y 19 15
1033 Road Accident Management Service N
1037 Public Grievance Cell DoT Hq as 'Telecom Consumer Grievance Redressal Helpline'
N
1056 Emergency Medical Services N
106X State of the Art Hospitals N
1063 Public Grievance Cell DoT Hq N
1064 Anti Corruption Helpline N
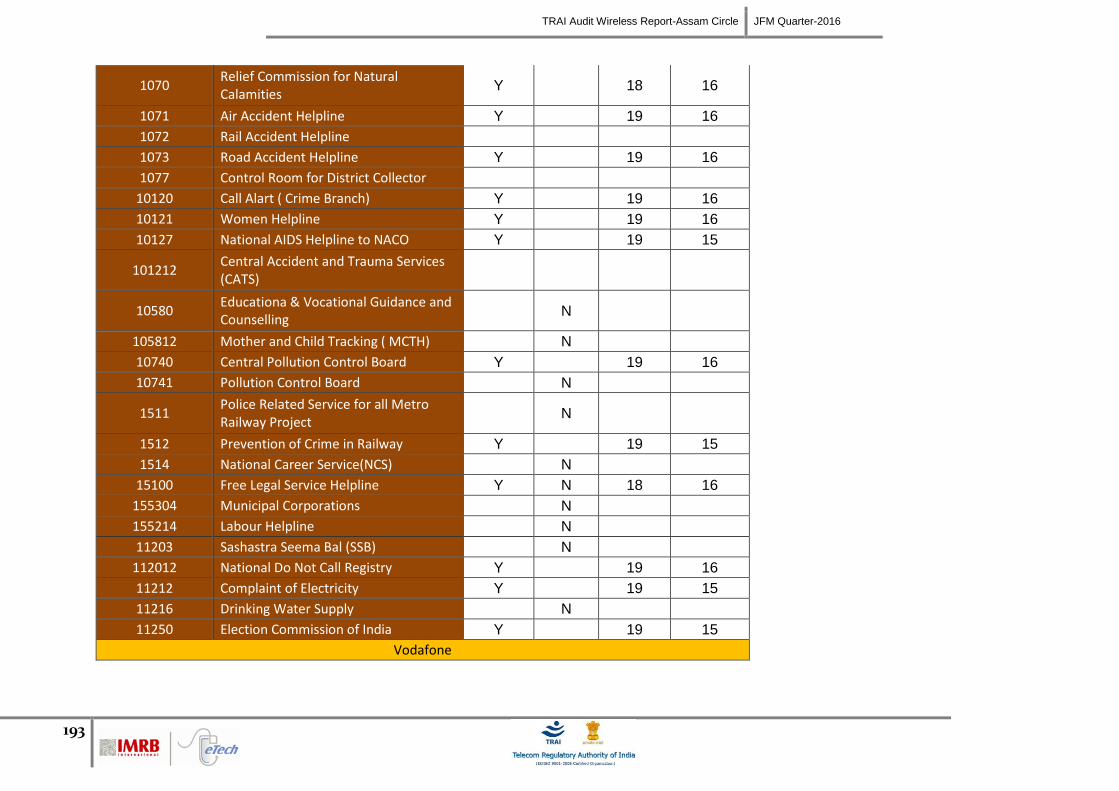
TRAI Audit Wireless Report-Assam Circle JFM Quarter-2016
193
1070 Relief Commission for Natural Calamities
Y 18 16
1071 Air Accident Helpline Y 19 16
1072 Rail Accident Helpline
1073 Road Accident Helpline Y 19 16
1077 Control Room for District Collector
10120 Call Alart ( Crime Branch) Y 19 16
10121 Women Helpline Y 19 16
10127 National AIDS Helpline to NACO Y 19 15
101212 Central Accident and Trauma Services (CATS)
10580 Educationa & Vocational Guidance and Counselling
N
105812 Mother and Child Tracking ( MCTH) N
10740 Central Pollution Control Board Y 19 16
10741 Pollution Control Board N
1511 Police Related Service for all Metro Railway Project
N
1512 Prevention of Crime in Railway Y 19 15
1514 National Career Service(NCS) N
15100 Free Legal Service Helpline Y N 18 16
155304 Municipal Corporations N
155214 Labour Helpline N
11203 Sashastra Seema Bal (SSB) N
112012 National Do Not Call Registry Y 19 16
11212 Complaint of Electricity Y 19 15
11216 Drinking Water Supply N
11250 Election Commission of India Y 19 15
Vodafone
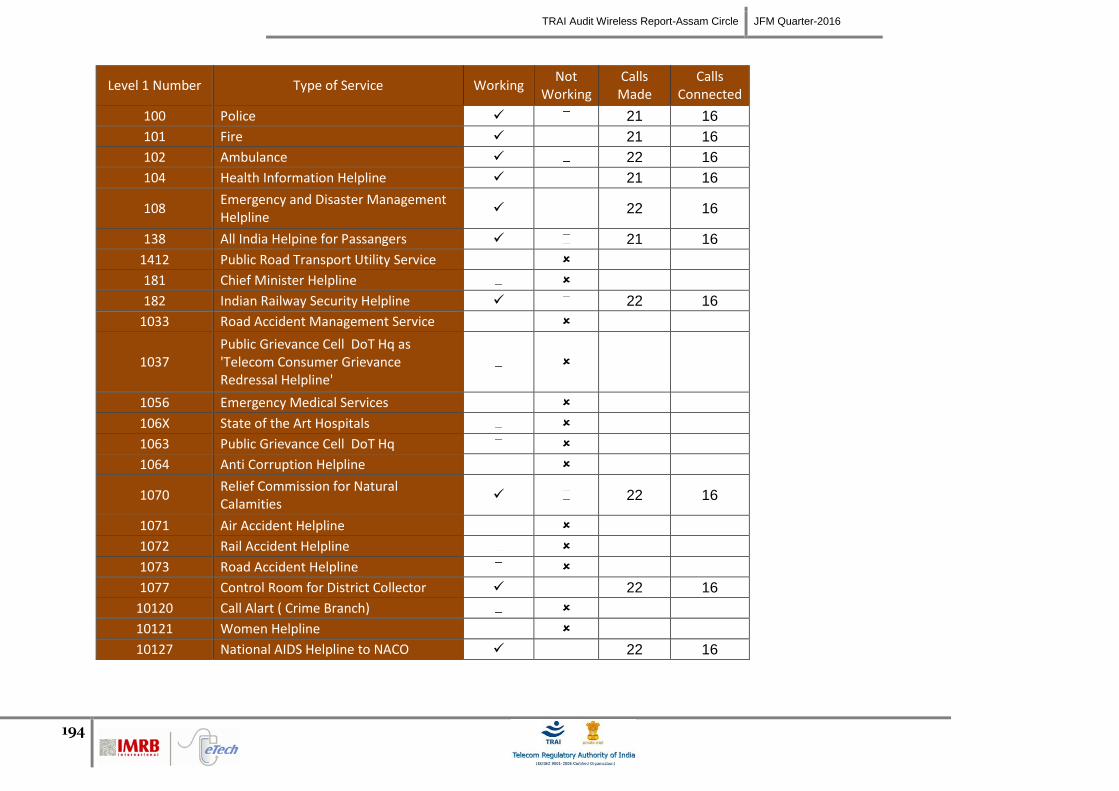
TRAI Audit Wireless Report-Assam Circle JFM Quarter-2016
194
Level 1 Number Type of Service Working Not
Working Calls
Made Calls
Connected
100 Police 21 16
101 Fire 21 16
102 Ambulance 22 16
104 Health Information Helpline 21 16
108 Emergency and Disaster Management Helpline
22 16
138 All India Helpine for Passangers 21 16
1412 Public Road Transport Utility Service
181 Chief Minister Helpline
182 Indian Railway Security Helpline 22 16
1033 Road Accident Management Service
1037 Public Grievance Cell DoT Hq as 'Telecom Consumer Grievance Redressal Helpline'
1056 Emergency Medical Services
106X State of the Art Hospitals
1063 Public Grievance Cell DoT Hq
1064 Anti Corruption Helpline
1070 Relief Commission for Natural Calamities
22 16
1071 Air Accident Helpline
1072 Rail Accident Helpline
1073 Road Accident Helpline
1077 Control Room for District Collector 22 16
10120 Call Alart ( Crime Branch)
10121 Women Helpline
10127 National AIDS Helpline to NACO 22 16
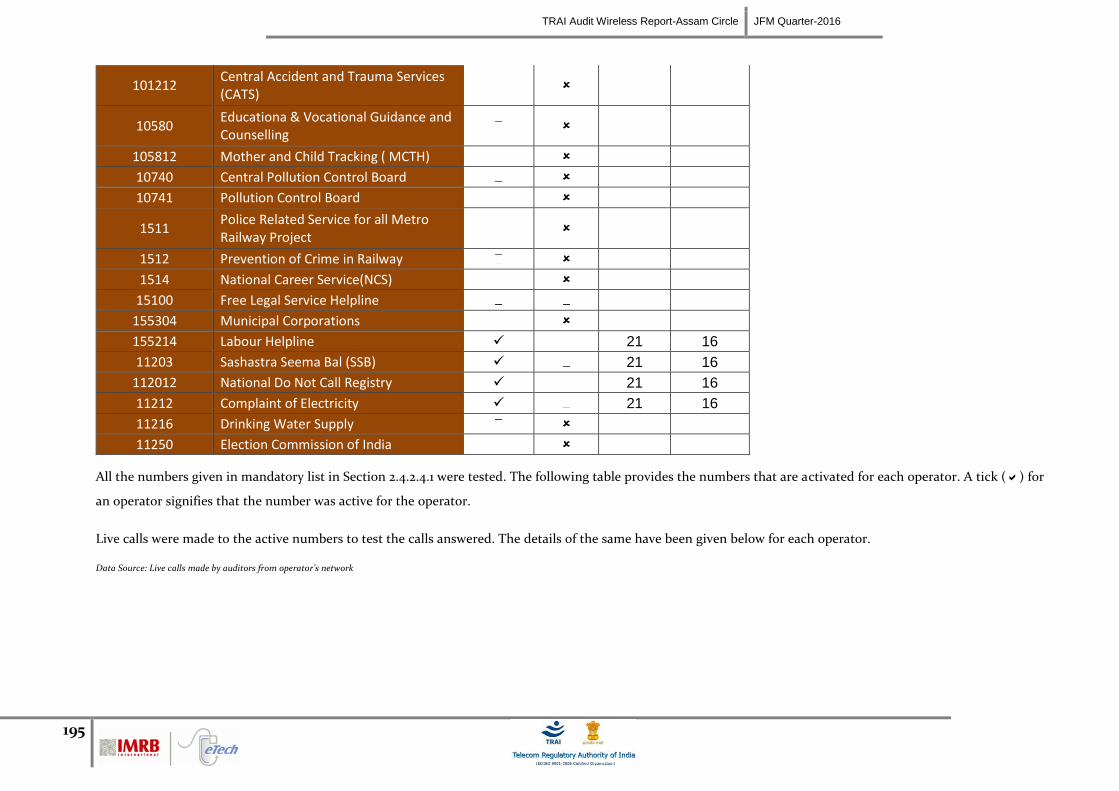
TRAI Audit Wireless Report-Assam Circle JFM Quarter-2016
195
101212 Central Accident and Trauma Services (CATS)
10580 Educationa & Vocational Guidance and Counselling
105812 Mother and Child Tracking ( MCTH)
10740 Central Pollution Control Board
10741 Pollution Control Board
1511 Police Related Service for all Metro Railway Project
1512 Prevention of Crime in Railway
1514 National Career Service(NCS)
15100 Free Legal Service Helpline
155304 Municipal Corporations
155214 Labour Helpline 21 16
11203 Sashastra Seema Bal (SSB) 21 16
112012 National Do Not Call Registry 21 16
11212 Complaint of Electricity 21 16
11216 Drinking Water Supply
11250 Election Commission of India
All the numbers given in mandatory list in Section 2.4.2.4.1 were tested. The following table provides the numbers that are activated for each operator. A tick () for
an operator signifies that the number was active for the operator.
Live calls were made to the active numbers to test the calls answered. The details of the same have been given below for each operator.
Data Source: Live calls made by auditors from operator’s network
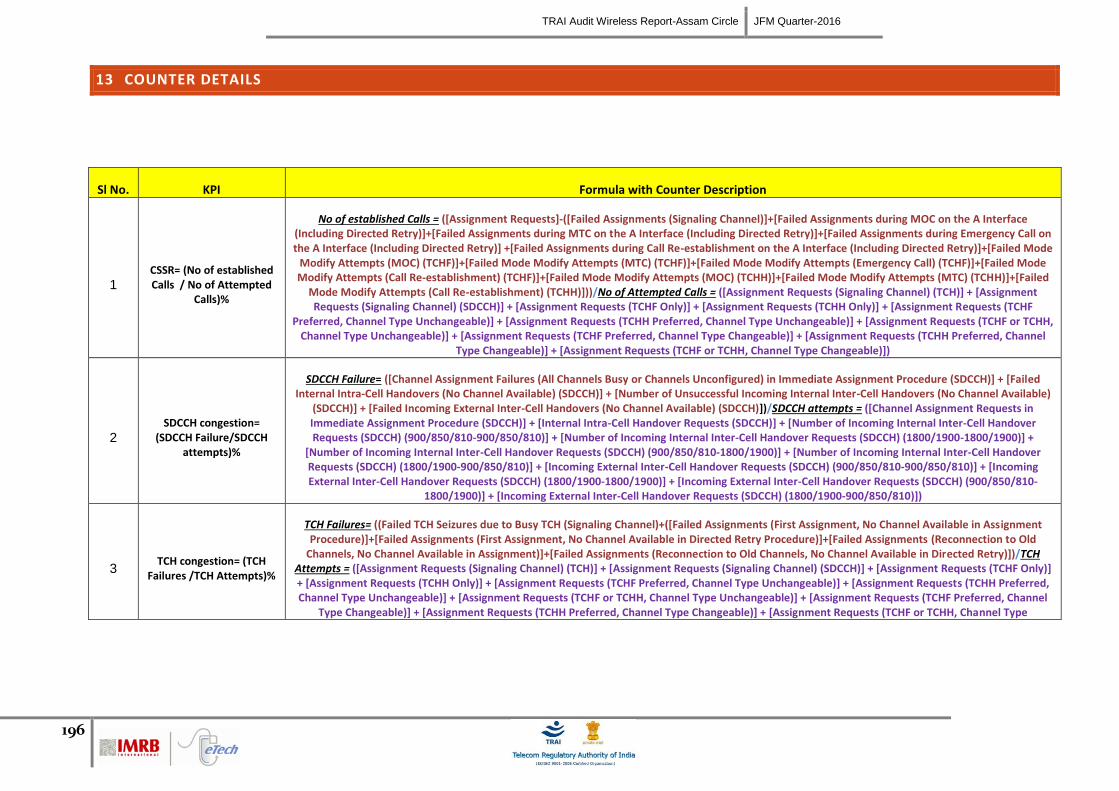
TRAI Audit Wireless Report-Assam Circle JFM Quarter-2016
196
13 COUNTER DETAILS
Sl No. KPI Formula with Counter Description
1 CSSR= (No of established Calls / No of Attempted
Calls)%
No of established Calls = ([Assignment Requests]-([Failed Assignments (Signaling Channel)]+[Failed Assignments during MOC on the A Interface (Including Directed Retry)]+[Failed Assignments during MTC on the A Interface (Including Directed Retry)]+[Failed Assignments during Emergency Call on the A Interface (Including Directed Retry)] +[Failed Assignments during Call Re-establishment on the A Interface (Including Directed Retry)]+[Failed Mode
Modify Attempts (MOC) (TCHF)]+[Failed Mode Modify Attempts (MTC) (TCHF)]+[Failed Mode Modify Attempts (Emergency Call) (TCHF)]+[Failed Mode Modify Attempts (Call Re-establishment) (TCHF)]+[Failed Mode Modify Attempts (MOC) (TCHH)]+[Failed Mode Modify Attempts (MTC) (TCHH)]+[Failed
Mode Modify Attempts (Call Re-establishment) (TCHH)]))/No of Attempted Calls = ([Assignment Requests (Signaling Channel) (TCH)] + [Assignment Requests (Signaling Channel) (SDCCH)] + [Assignment Requests (TCHF Only)] + [Assignment Requests (TCHH Only)] + [Assignment Requests (TCHF
Preferred, Channel Type Unchangeable)] + [Assignment Requests (TCHH Preferred, Channel Type Unchangeable)] + [Assignment Requests (TCHF or TCHH, Channel Type Unchangeable)] + [Assignment Requests (TCHF Preferred, Channel Type Changeable)] + [Assignment Requests (TCHH Preferred, Channel
Type Changeable)] + [Assignment Requests (TCHF or TCHH, Channel Type Changeable)])
2 SDCCH congestion=
(SDCCH Failure/SDCCH attempts)%
SDCCH Failure= ([Channel Assignment Failures (All Channels Busy or Channels Unconfigured) in Immediate Assignment Procedure (SDCCH)] + [Failed Internal Intra-Cell Handovers (No Channel Available) (SDCCH)] + [Number of Unsuccessful Incoming Internal Inter-Cell Handovers (No Channel Available)
(SDCCH)] + [Failed Incoming External Inter-Cell Handovers (No Channel Available) (SDCCH)])/SDCCH attempts = ([Channel Assignment Requests in Immediate Assignment Procedure (SDCCH)] + [Internal Intra-Cell Handover Requests (SDCCH)] + [Number of Incoming Internal Inter-Cell Handover Requests (SDCCH) (900/850/810-900/850/810)] + [Number of Incoming Internal Inter-Cell Handover Requests (SDCCH) (1800/1900-1800/1900)] +
[Number of Incoming Internal Inter-Cell Handover Requests (SDCCH) (900/850/810-1800/1900)] + [Number of Incoming Internal Inter-Cell Handover Requests (SDCCH) (1800/1900-900/850/810)] + [Incoming External Inter-Cell Handover Requests (SDCCH) (900/850/810-900/850/810)] + [Incoming External Inter-Cell Handover Requests (SDCCH) (1800/1900-1800/1900)] + [Incoming External Inter-Cell Handover Requests (SDCCH) (900/850/810-
1800/1900)] + [Incoming External Inter-Cell Handover Requests (SDCCH) (1800/1900-900/850/810)])
3 TCH congestion= (TCH
Failures /TCH Attempts)%
TCH Failures= ((Failed TCH Seizures due to Busy TCH (Signaling Channel)+([Failed Assignments (First Assignment, No Channel Available in Assignment Procedure)]+[Failed Assignments (First Assignment, No Channel Available in Directed Retry Procedure)]+[Failed Assignments (Reconnection to Old
Channels, No Channel Available in Assignment)]+[Failed Assignments (Reconnection to Old Channels, No Channel Available in Directed Retry)])/TCH Attempts = ([Assignment Requests (Signaling Channel) (TCH)] + [Assignment Requests (Signaling Channel) (SDCCH)] + [Assignment Requests (TCHF Only)] + [Assignment Requests (TCHH Only)] + [Assignment Requests (TCHF Preferred, Channel Type Unchangeable)] + [Assignment Requests (TCHH Preferred, Channel Type Unchangeable)] + [Assignment Requests (TCHF or TCHH, Channel Type Unchangeable)] + [Assignment Requests (TCHF Preferred, Channel
Type Changeable)] + [Assignment Requests (TCHH Preferred, Channel Type Changeable)] + [Assignment Requests (TCHF or TCHH, Channel Type
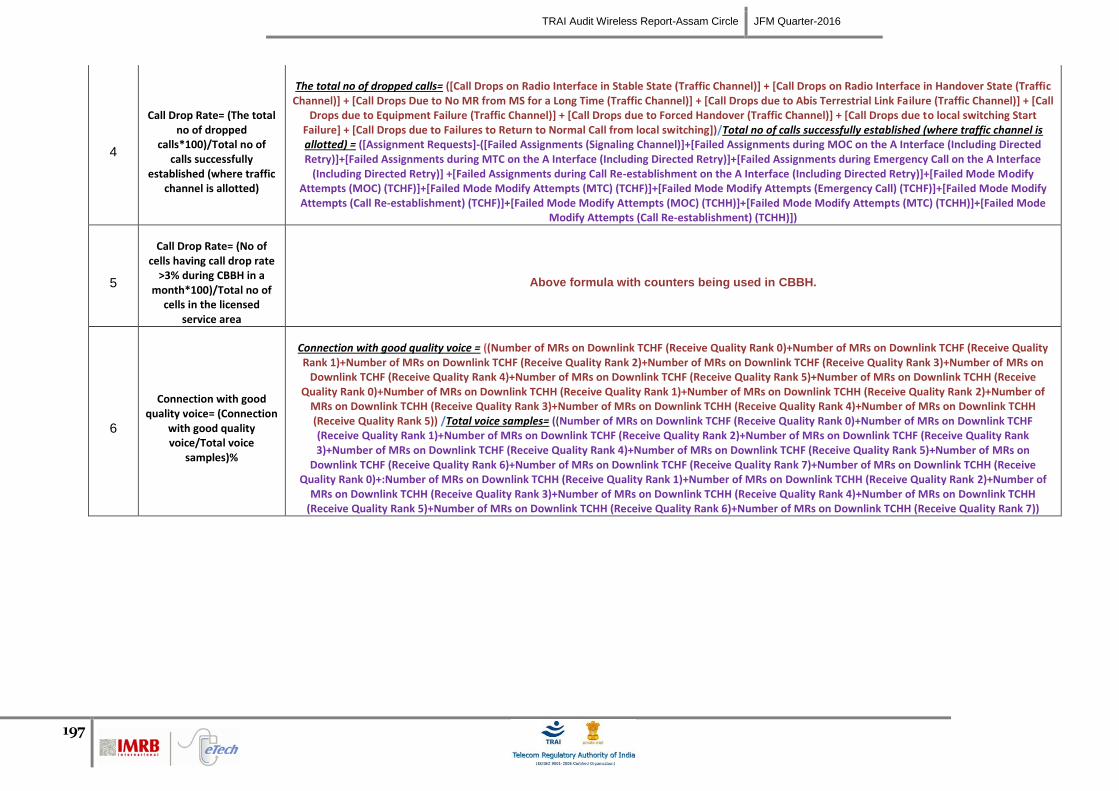
TRAI Audit Wireless Report-Assam Circle JFM Quarter-2016
197
4
Call Drop Rate= (The total no of dropped
calls*100)/Total no of calls successfully
established (where traffic channel is allotted)
The total no of dropped calls= ([Call Drops on Radio Interface in Stable State (Traffic Channel)] + [Call Drops on Radio Interface in Handover State (Traffic Channel)] + [Call Drops Due to No MR from MS for a Long Time (Traffic Channel)] + [Call Drops due to Abis Terrestrial Link Failure (Traffic Channel)] + [Call
Drops due to Equipment Failure (Traffic Channel)] + [Call Drops due to Forced Handover (Traffic Channel)] + [Call Drops due to local switching Start Failure] + [Call Drops due to Failures to Return to Normal Call from local switching])/Total no of calls successfully established (where traffic channel is allotted) = ([Assignment Requests]-([Failed Assignments (Signaling Channel)]+[Failed Assignments during MOC on the A Interface (Including Directed Retry)]+[Failed Assignments during MTC on the A Interface (Including Directed Retry)]+[Failed Assignments during Emergency Call on the A Interface
(Including Directed Retry)] +[Failed Assignments during Call Re-establishment on the A Interface (Including Directed Retry)]+[Failed Mode Modify Attempts (MOC) (TCHF)]+[Failed Mode Modify Attempts (MTC) (TCHF)]+[Failed Mode Modify Attempts (Emergency Call) (TCHF)]+[Failed Mode Modify Attempts (Call Re-establishment) (TCHF)]+[Failed Mode Modify Attempts (MOC) (TCHH)]+[Failed Mode Modify Attempts (MTC) (TCHH)]+[Failed Mode
Modify Attempts (Call Re-establishment) (TCHH)])
5
Call Drop Rate= (No of cells having call drop rate
>3% during CBBH in a month*100)/Total no of
cells in the licensed service area
Above formula with counters being used in CBBH.
6
Connection with good quality voice= (Connection
with good quality voice/Total voice
samples)%
Connection with good quality voice = ((Number of MRs on Downlink TCHF (Receive Quality Rank 0)+Number of MRs on Downlink TCHF (Receive Quality Rank 1)+Number of MRs on Downlink TCHF (Receive Quality Rank 2)+Number of MRs on Downlink TCHF (Receive Quality Rank 3)+Number of MRs on
Downlink TCHF (Receive Quality Rank 4)+Number of MRs on Downlink TCHF (Receive Quality Rank 5)+Number of MRs on Downlink TCHH (Receive Quality Rank 0)+Number of MRs on Downlink TCHH (Receive Quality Rank 1)+Number of MRs on Downlink TCHH (Receive Quality Rank 2)+Number of
MRs on Downlink TCHH (Receive Quality Rank 3)+Number of MRs on Downlink TCHH (Receive Quality Rank 4)+Number of MRs on Downlink TCHH (Receive Quality Rank 5)) /Total voice samples= ((Number of MRs on Downlink TCHF (Receive Quality Rank 0)+Number of MRs on Downlink TCHF (Receive Quality Rank 1)+Number of MRs on Downlink TCHF (Receive Quality Rank 2)+Number of MRs on Downlink TCHF (Receive Quality Rank 3)+Number of MRs on Downlink TCHF (Receive Quality Rank 4)+Number of MRs on Downlink TCHF (Receive Quality Rank 5)+Number of MRs on
Downlink TCHF (Receive Quality Rank 6)+Number of MRs on Downlink TCHF (Receive Quality Rank 7)+Number of MRs on Downlink TCHH (Receive Quality Rank 0)+:Number of MRs on Downlink TCHH (Receive Quality Rank 1)+Number of MRs on Downlink TCHH (Receive Quality Rank 2)+Number of
MRs on Downlink TCHH (Receive Quality Rank 3)+Number of MRs on Downlink TCHH (Receive Quality Rank 4)+Number of MRs on Downlink TCHH (Receive Quality Rank 5)+Number of MRs on Downlink TCHH (Receive Quality Rank 6)+Number of MRs on Downlink TCHH (Receive Quality Rank 7))
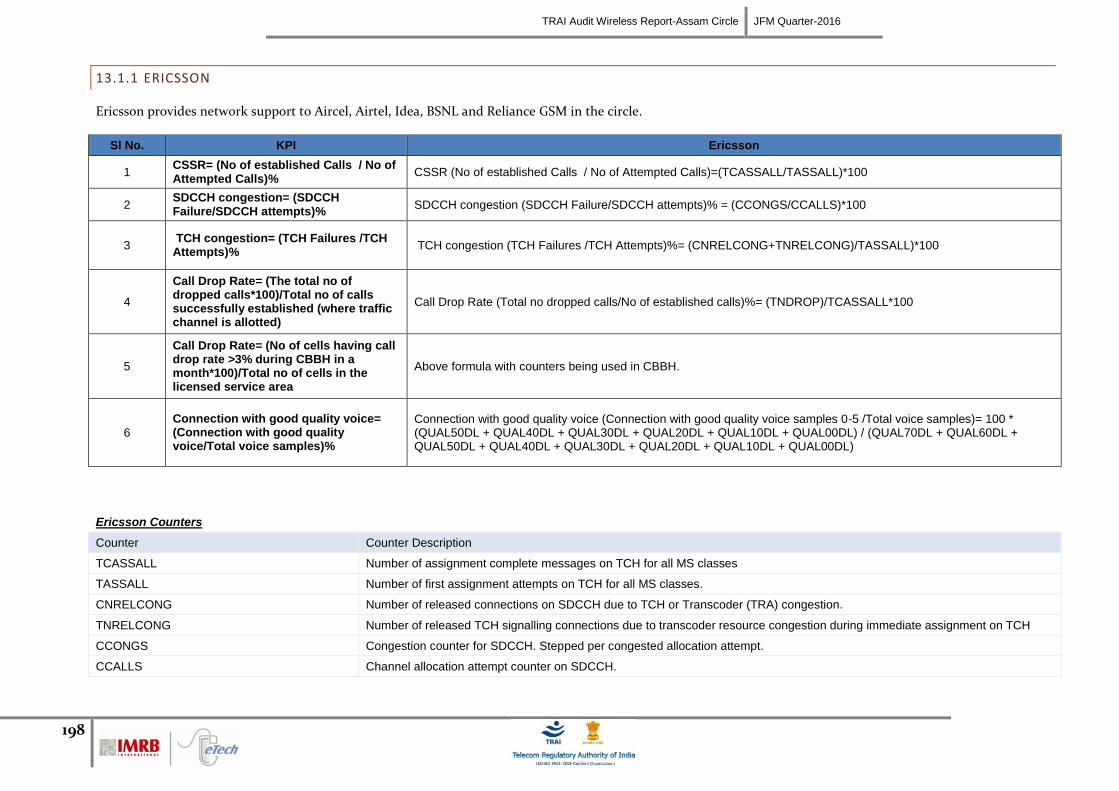
TRAI Audit Wireless Report-Assam Circle JFM Quarter-2016
198
13.1.1 ERICSSON
Ericsson provides network support to Aircel, Airtel, Idea, BSNL and Reliance GSM in the circle.
Sl No. KPI Ericsson
1 CSSR= (No of established Calls / No of Attempted Calls)%
CSSR (No of established Calls / No of Attempted Calls)=(TCASSALL/TASSALL)*100
2 SDCCH congestion= (SDCCH Failure/SDCCH attempts)%
SDCCH congestion (SDCCH Failure/SDCCH attempts)% = (CCONGS/CCALLS)*100
3 TCH congestion= (TCH Failures /TCH Attempts)%
TCH congestion (TCH Failures /TCH Attempts)%= (CNRELCONG+TNRELCONG)/TASSALL)*100
4
Call Drop Rate= (The total no of dropped calls*100)/Total no of calls successfully established (where traffic channel is allotted)
Call Drop Rate (Total no dropped calls/No of established calls)%= (TNDROP)/TCASSALL*100
5
Call Drop Rate= (No of cells having call drop rate >3% during CBBH in a month*100)/Total no of cells in the licensed service area
Above formula with counters being used in CBBH.
6
Connection with good quality voice= (Connection with good quality voice/Total voice samples)%
Connection with good quality voice (Connection with good quality voice samples 0-5 /Total voice samples)= 100 * (QUAL50DL + QUAL40DL + QUAL30DL + QUAL20DL + QUAL10DL + QUAL00DL) / (QUAL70DL + QUAL60DL + QUAL50DL + QUAL40DL + QUAL30DL + QUAL20DL + QUAL10DL + QUAL00DL)
Ericsson Counters
Counter Counter Description
TCASSALL Number of assignment complete messages on TCH for all MS classes
TASSALL Number of first assignment attempts on TCH for all MS classes.
CNRELCONG Number of released connections on SDCCH due to TCH or Transcoder (TRA) congestion.
TNRELCONG Number of released TCH signalling connections due to transcoder resource congestion during immediate assignment on TCH
CCONGS Congestion counter for SDCCH. Stepped per congested allocation attempt.
CCALLS Channel allocation attempt counter on SDCCH.
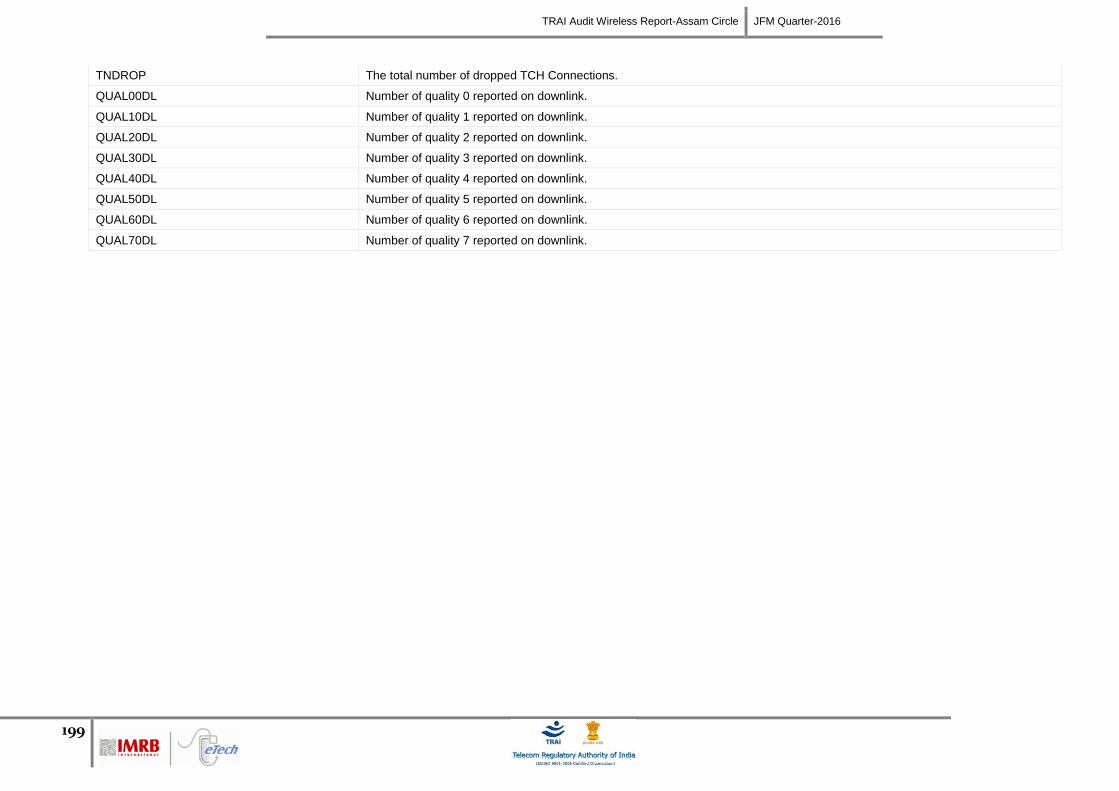
TRAI Audit Wireless Report-Assam Circle JFM Quarter-2016
199
TNDROP The total number of dropped TCH Connections.
QUAL00DL Number of quality 0 reported on downlink.
QUAL10DL Number of quality 1 reported on downlink.
QUAL20DL Number of quality 2 reported on downlink.
QUAL30DL Number of quality 3 reported on downlink.
QUAL40DL Number of quality 4 reported on downlink.
QUAL50DL Number of quality 5 reported on downlink.
QUAL60DL Number of quality 6 reported on downlink.
QUAL70DL Number of quality 7 reported on downlink.
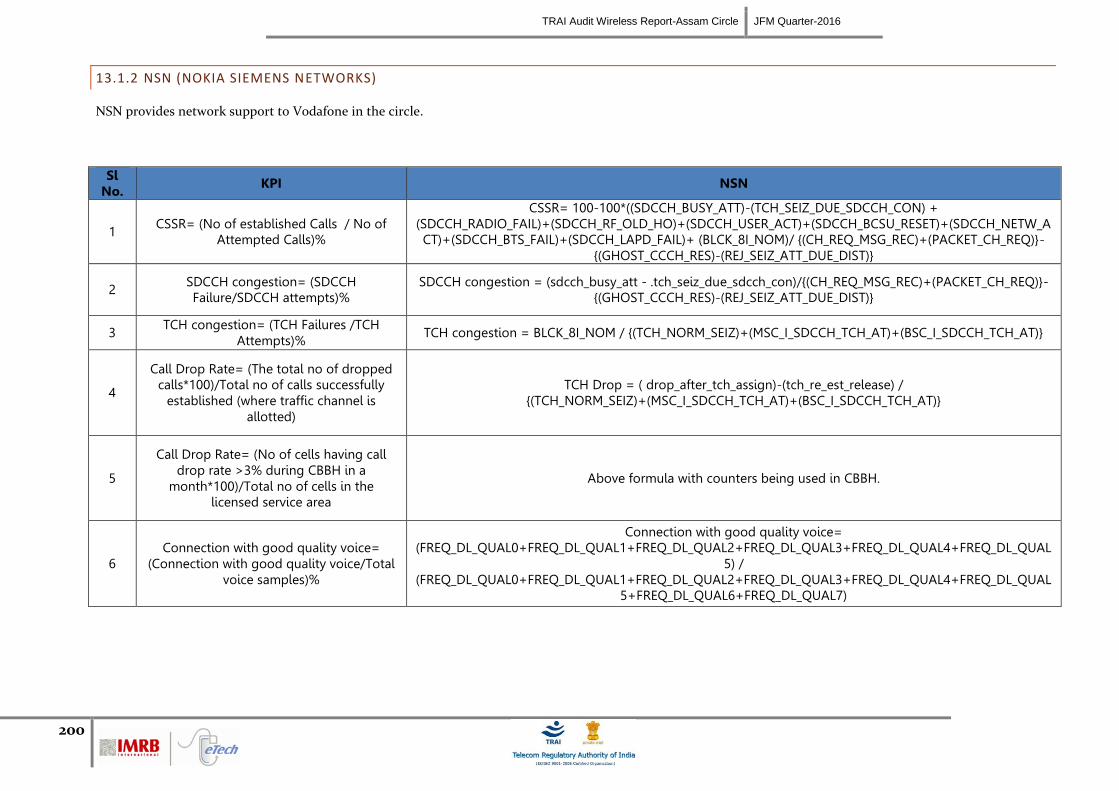
TRAI Audit Wireless Report-Assam Circle JFM Quarter-2016
200
13.1.2 NSN (NOKIA SIEMENS NETWORKS)
NSN provides network support to Vodafone in the circle.
Sl No.
KPI NSN
1 CSSR= (No of established Calls / No of
Attempted Calls)%
CSSR= 100-100*((SDCCH_BUSY_ATT)-(TCH_SEIZ_DUE_SDCCH_CON) + (SDCCH_RADIO_FAIL)+(SDCCH_RF_OLD_HO)+(SDCCH_USER_ACT)+(SDCCH_BCSU_RESET)+(SDCCH_NETW_ACT)+(SDCCH_BTS_FAIL)+(SDCCH_LAPD_FAIL)+ (BLCK_8I_NOM)/ {(CH_REQ_MSG_REC)+(PACKET_CH_REQ)}-
{(GHOST_CCCH_RES)-(REJ_SEIZ_ATT_DUE_DIST)}
2 SDCCH congestion= (SDCCH Failure/SDCCH attempts)%
SDCCH congestion = (sdcch_busy_att - .tch_seiz_due_sdcch_con)/{(CH_REQ_MSG_REC)+(PACKET_CH_REQ)}-{(GHOST_CCCH_RES)-(REJ_SEIZ_ATT_DUE_DIST)}
3 TCH congestion= (TCH Failures /TCH
Attempts)% TCH congestion = BLCK_8I_NOM / {(TCH_NORM_SEIZ)+(MSC_I_SDCCH_TCH_AT)+(BSC_I_SDCCH_TCH_AT)}
4
Call Drop Rate= (The total no of dropped calls*100)/Total no of calls successfully
established (where traffic channel is allotted)
TCH Drop = ( drop_after_tch_assign)-(tch_re_est_release) / {(TCH_NORM_SEIZ)+(MSC_I_SDCCH_TCH_AT)+(BSC_I_SDCCH_TCH_AT)}
5
Call Drop Rate= (No of cells having call drop rate >3% during CBBH in a
month*100)/Total no of cells in the licensed service area
Above formula with counters being used in CBBH.
6 Connection with good quality voice=
(Connection with good quality voice/Total voice samples)%
Connection with good quality voice= (FREQ_DL_QUAL0+FREQ_DL_QUAL1+FREQ_DL_QUAL2+FREQ_DL_QUAL3+FREQ_DL_QUAL4+FREQ_DL_QUAL
5) / (FREQ_DL_QUAL0+FREQ_DL_QUAL1+FREQ_DL_QUAL2+FREQ_DL_QUAL3+FREQ_DL_QUAL4+FREQ_DL_QUAL
5+FREQ_DL_QUAL6+FREQ_DL_QUAL7)
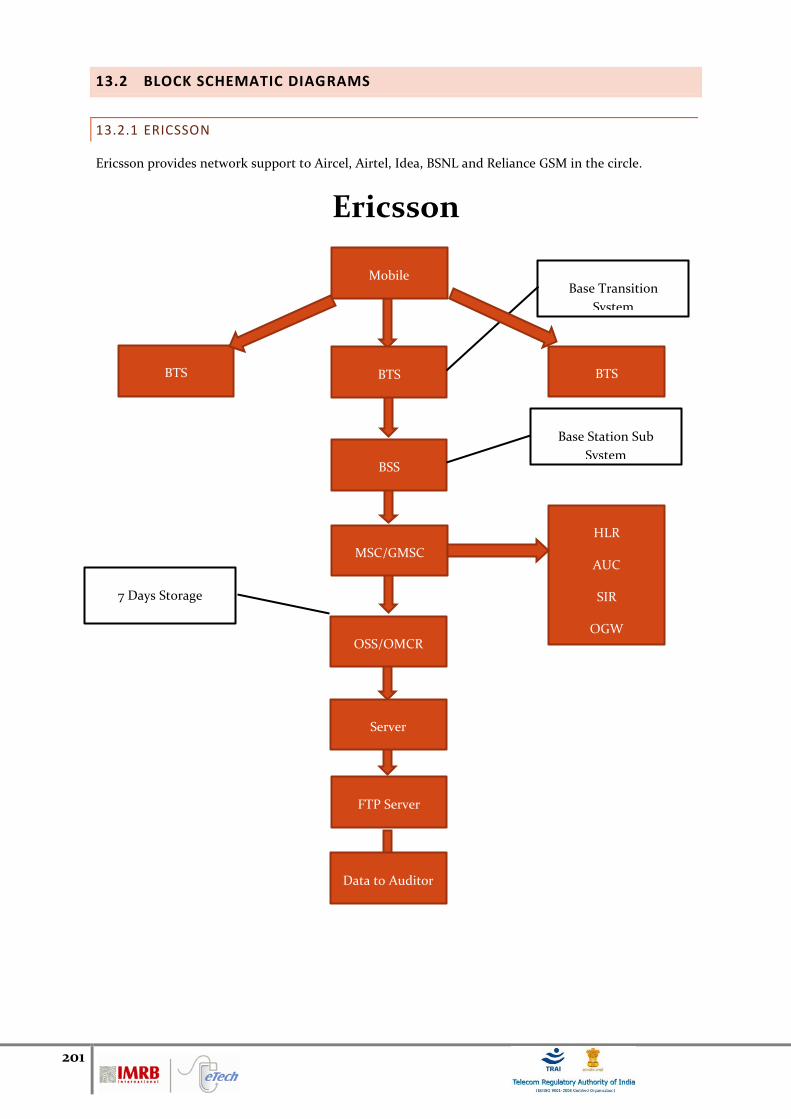
201
13.2 BLOCK SCHEMATIC DIAGRAMS
13.2.1 ERICSSON
Ericsson provides network support to Aircel, Airtel, Idea, BSNL and Reliance GSM in the circle.
Ericsson
Mobile
BTS
BSS
MSC/GMSC
HLR
AUC
SIR
OGW
Server
Data to Auditor
OSS/OMCR
Base Transition
System
Base Station Sub
System
7 Days Storage
BTS BTS
FTP Server
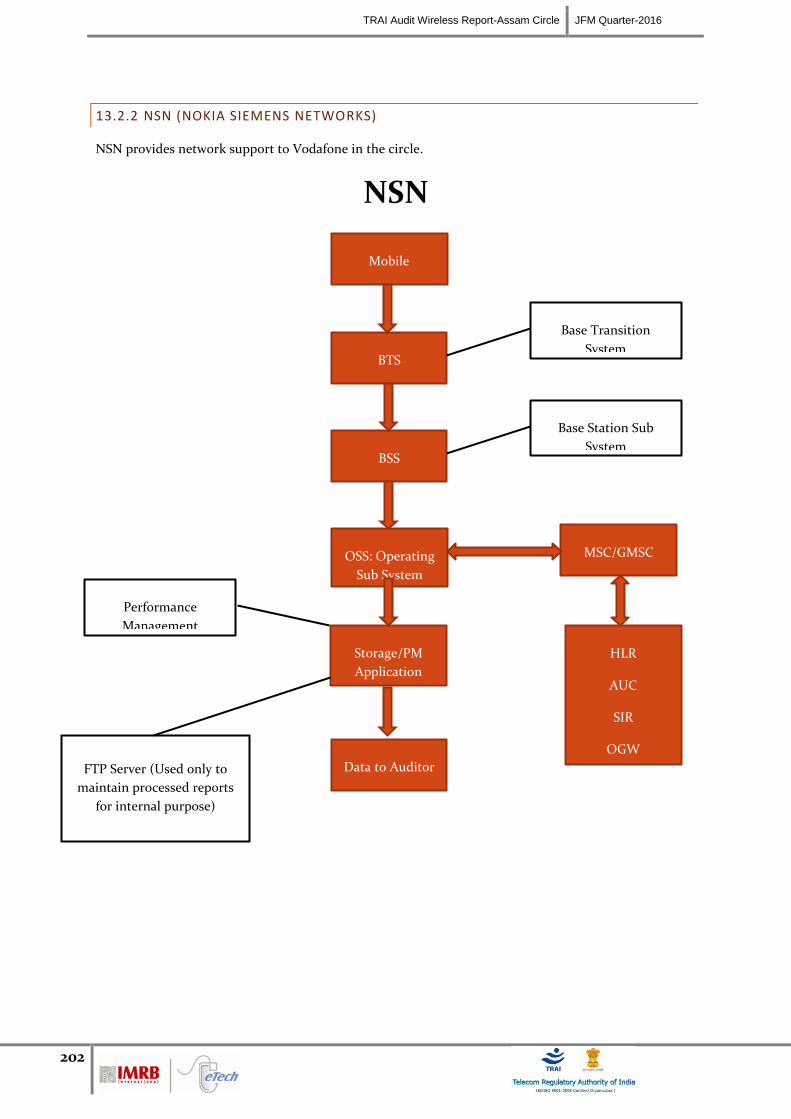
TRAI Audit Wireless Report-Assam Circle JFM Quarter-2016
202
13.2.2 NSN (NOKIA SIEMENS NETWORKS)
NSN provides network support to Vodafone in the circle.
NSN
Mobile
BTS
BSS
MSC/GMSC
HLR
AUC
SIR
OGW
Storage/PM
Application
Data to Auditor
OSS: Operating
Sub System
FTP Server (Used only to
maintain processed reports
for internal purpose)
Base Transition
System
Base Station Sub
System
Performance
Management
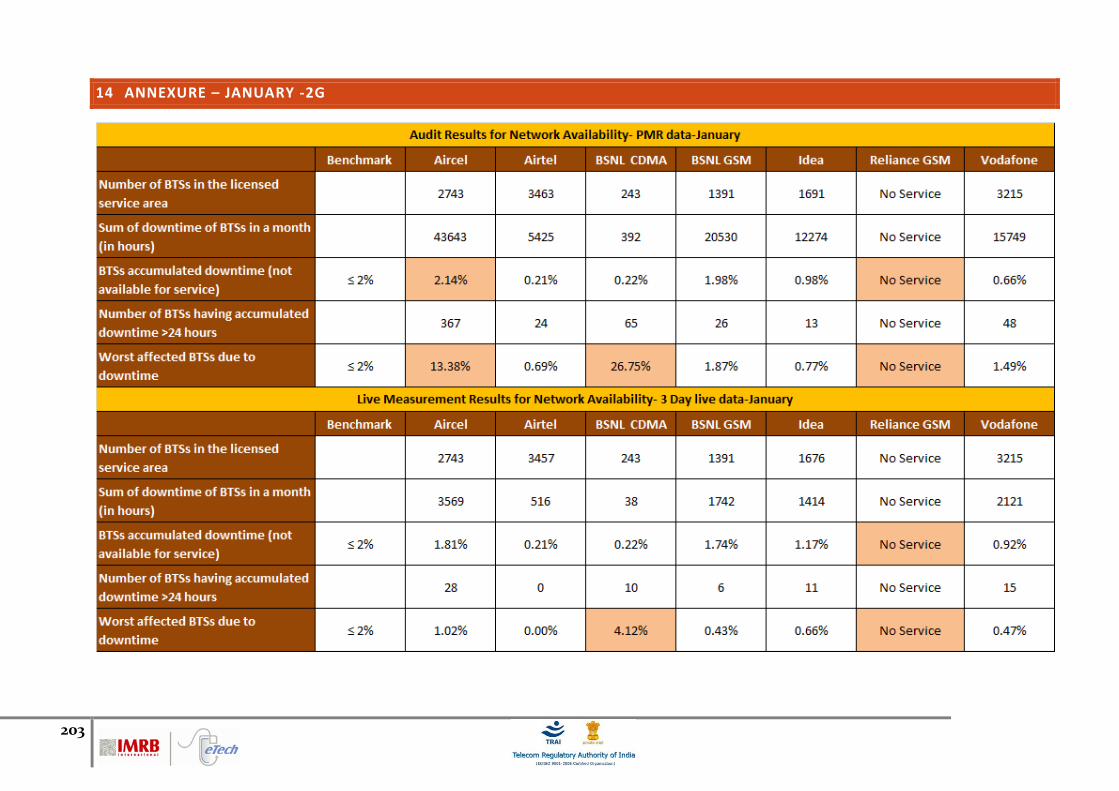
203
14 ANNEXURE – JANUARY -2G
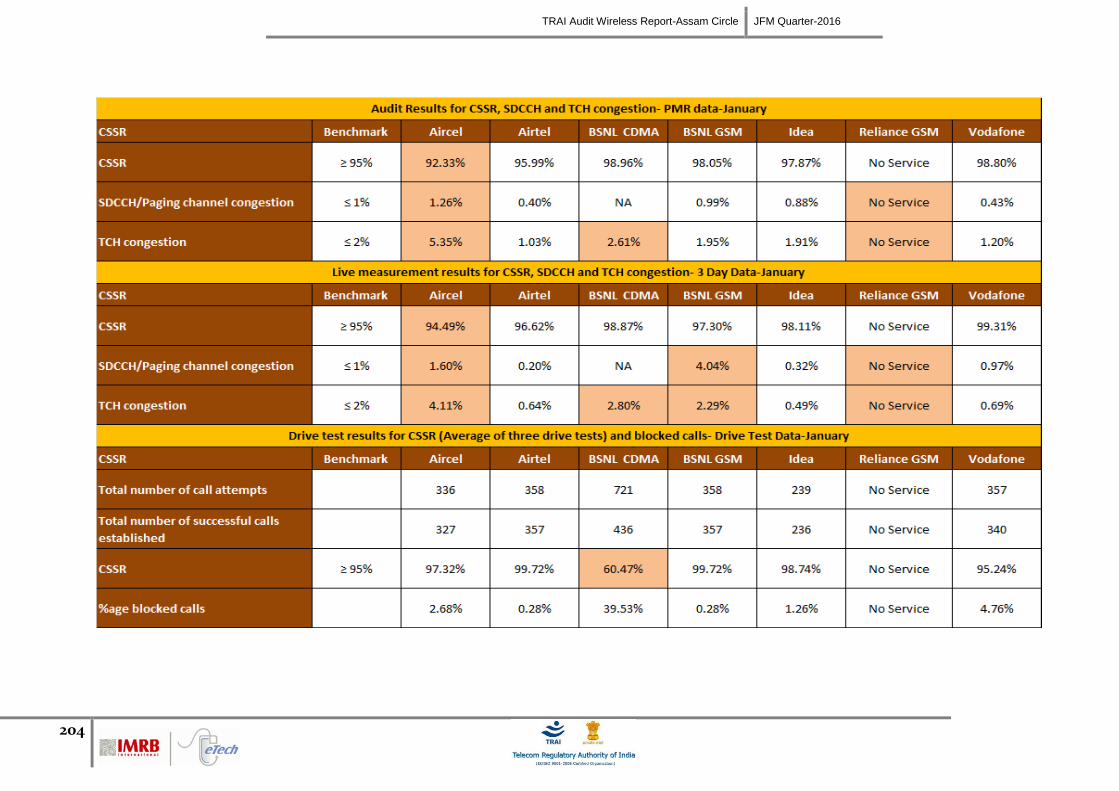
TRAI Audit Wireless Report-Assam Circle JFM Quarter-2016
204
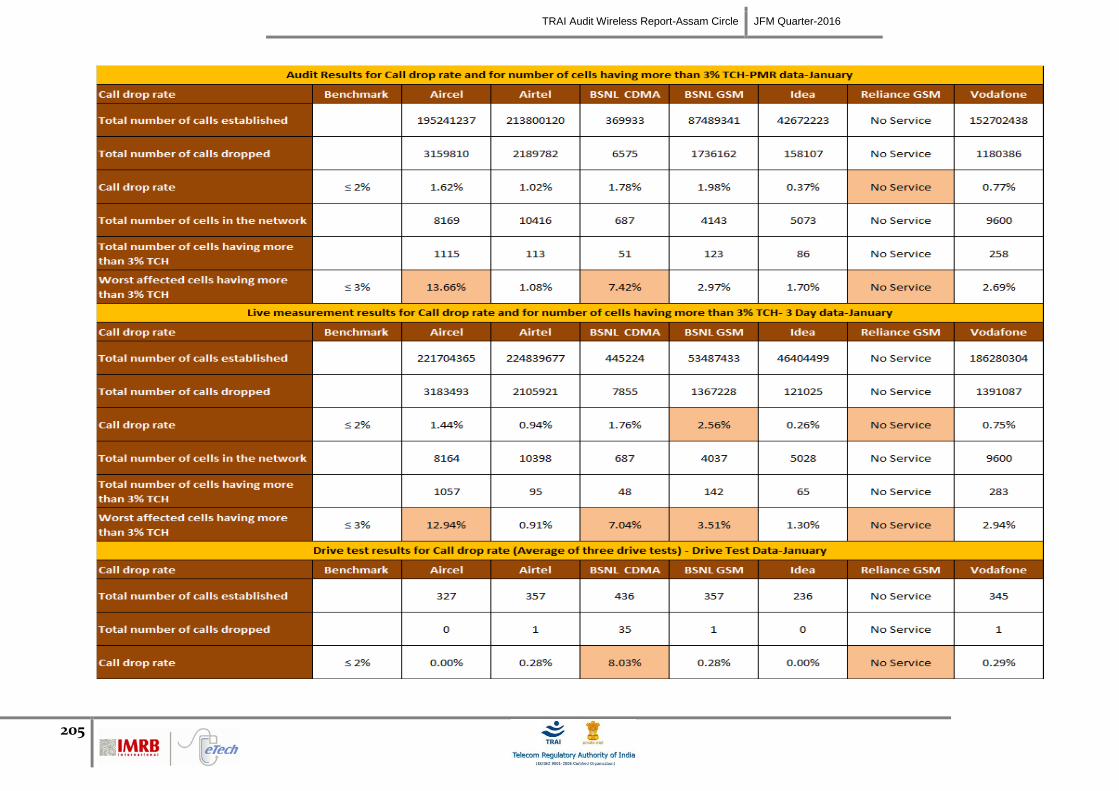
TRAI Audit Wireless Report-Assam Circle JFM Quarter-2016
205
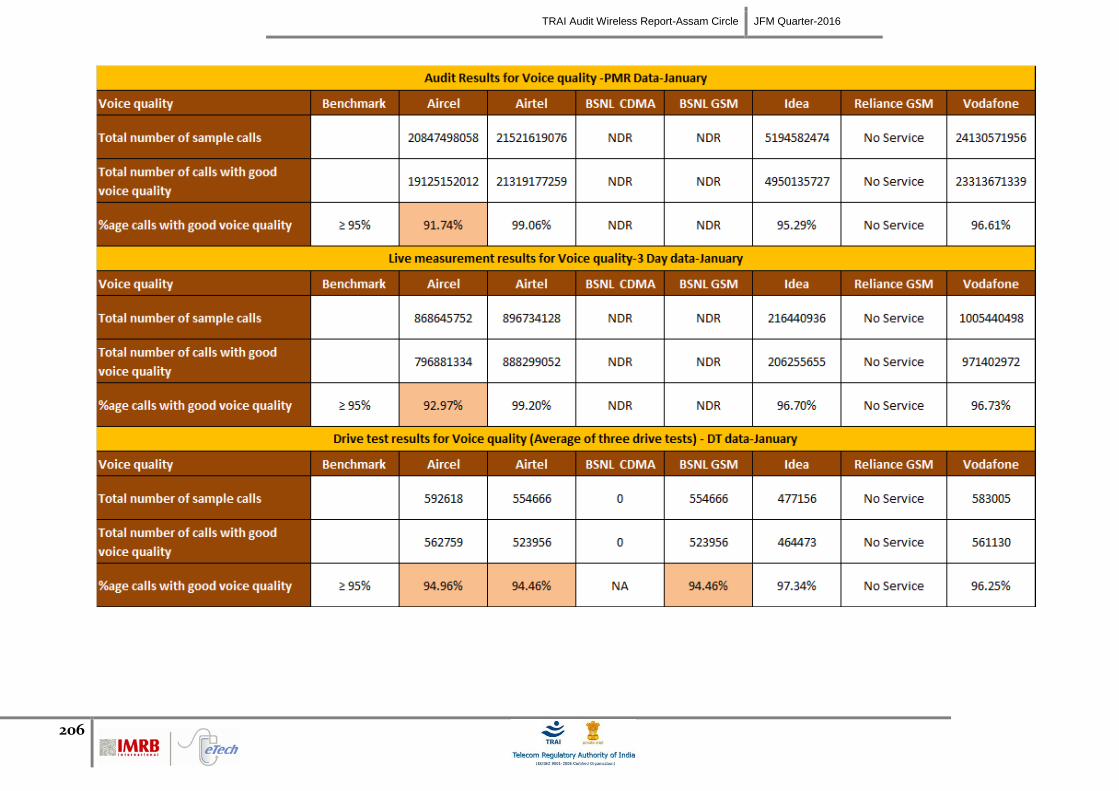
TRAI Audit Wireless Report-Assam Circle JFM Quarter-2016
206
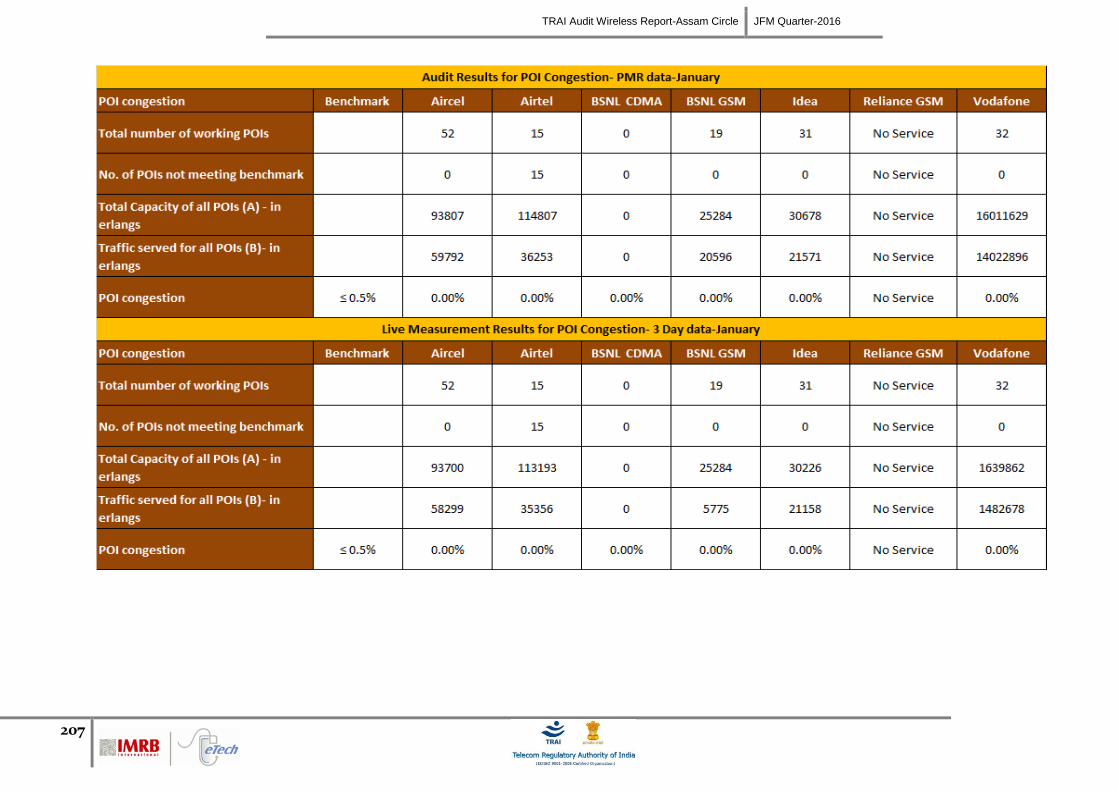
TRAI Audit Wireless Report-Assam Circle JFM Quarter-2016
207
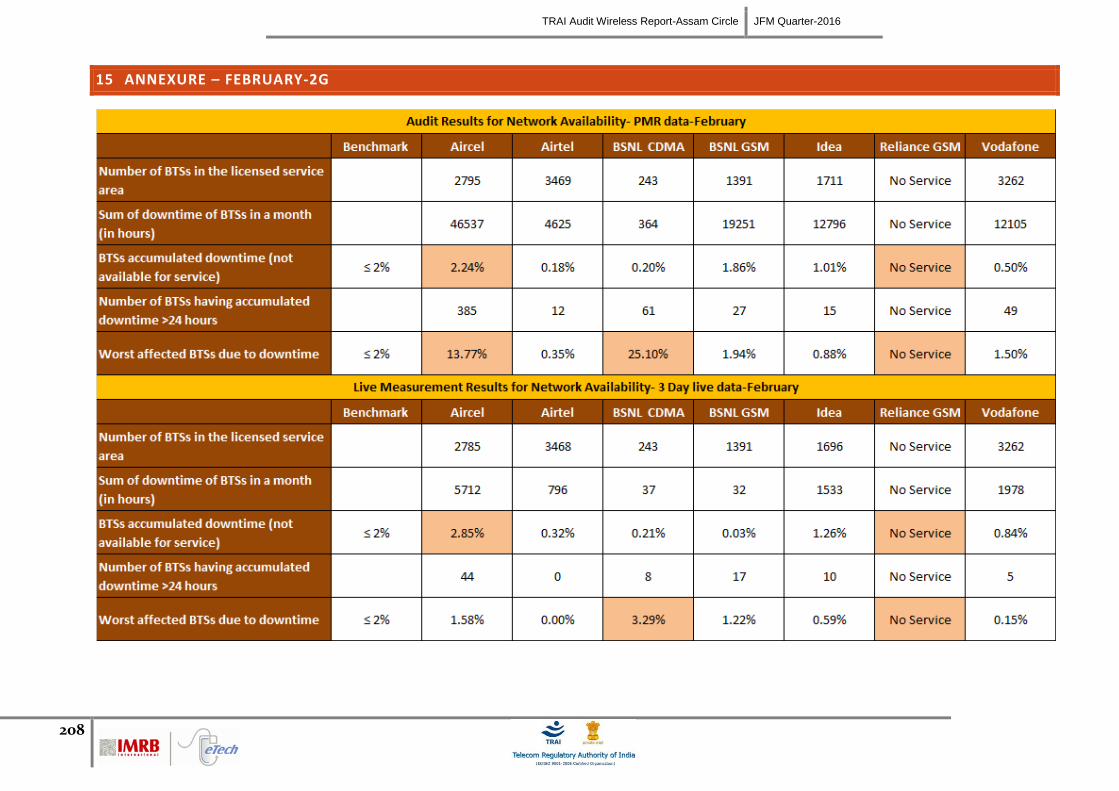
TRAI Audit Wireless Report-Assam Circle JFM Quarter-2016
208
15 ANNEXURE – FEBRUARY-2G
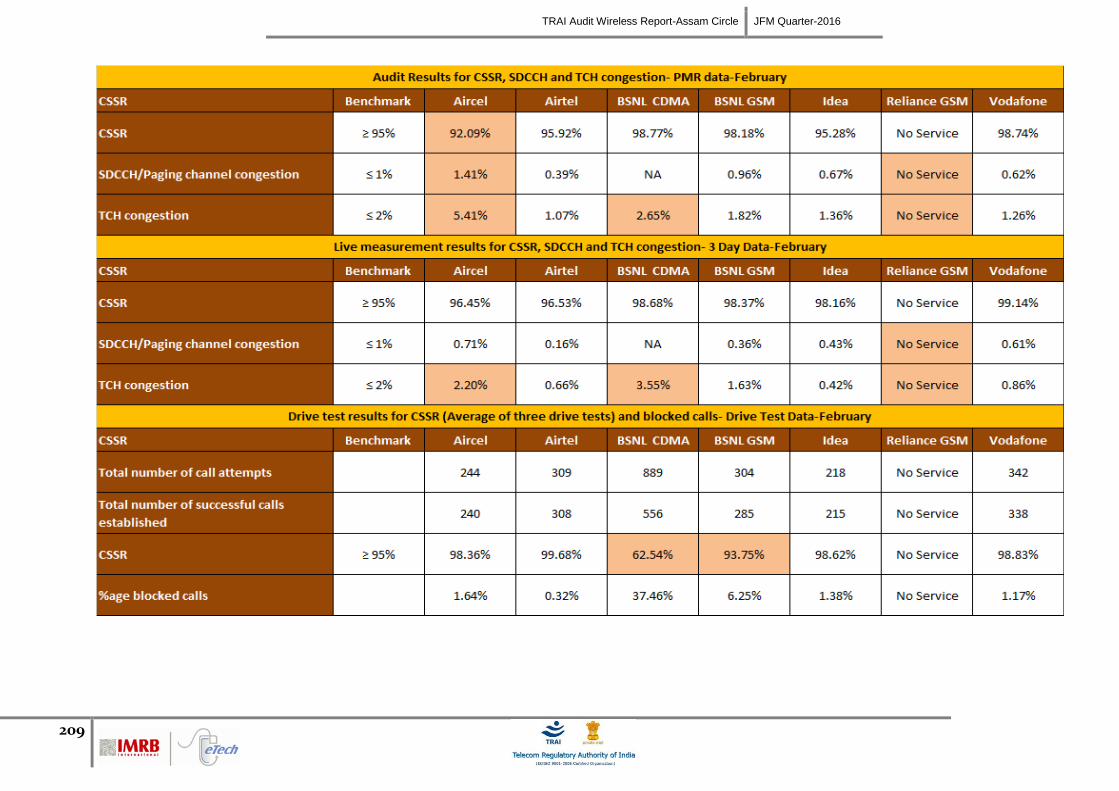
TRAI Audit Wireless Report-Assam Circle JFM Quarter-2016
209
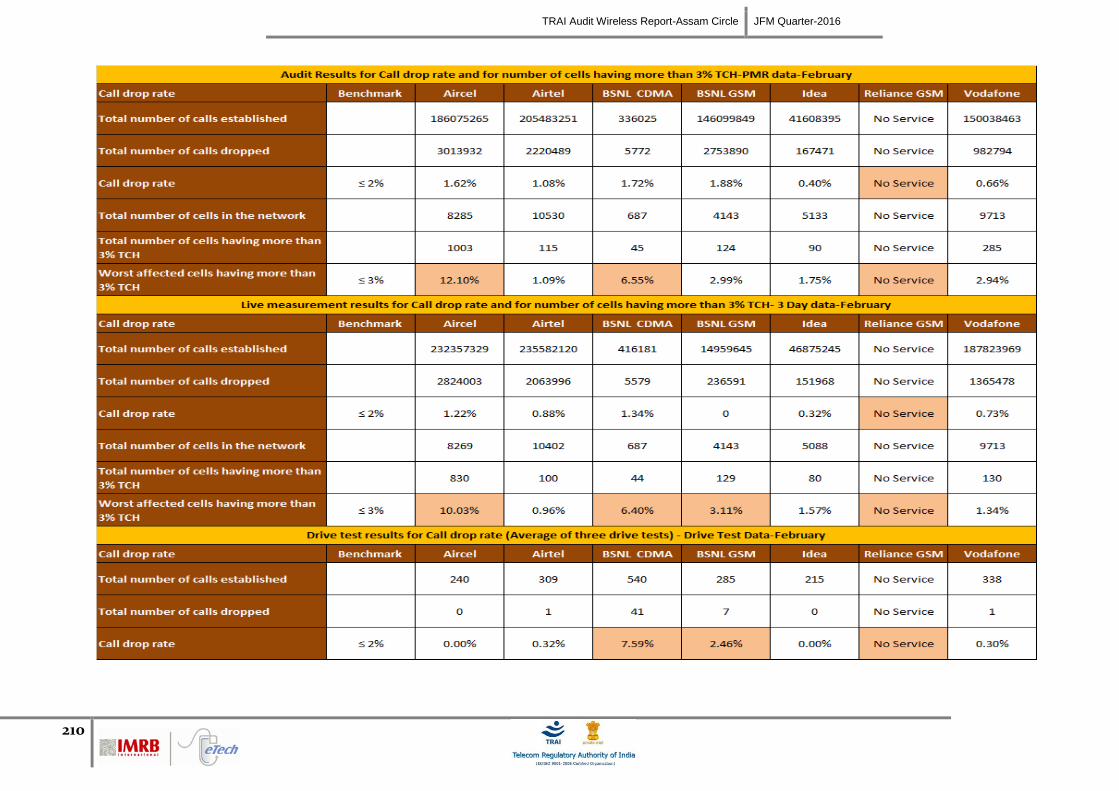
TRAI Audit Wireless Report-Assam Circle JFM Quarter-2016
210
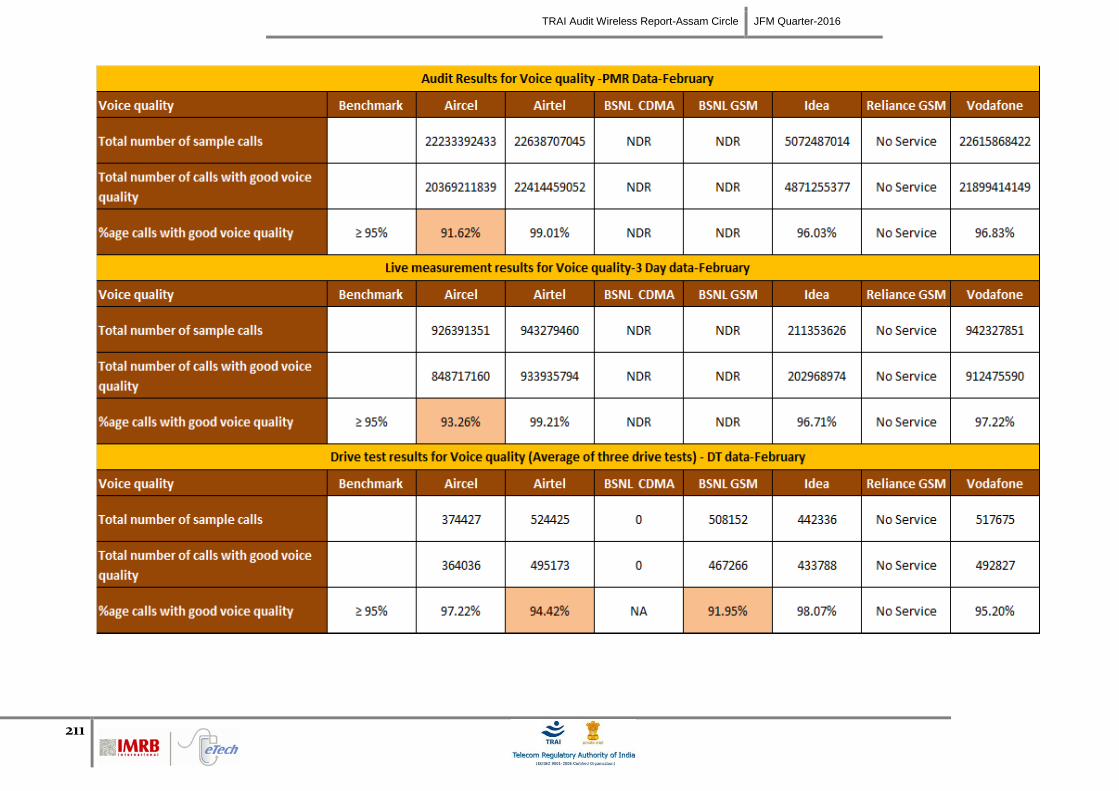
TRAI Audit Wireless Report-Assam Circle JFM Quarter-2016
211
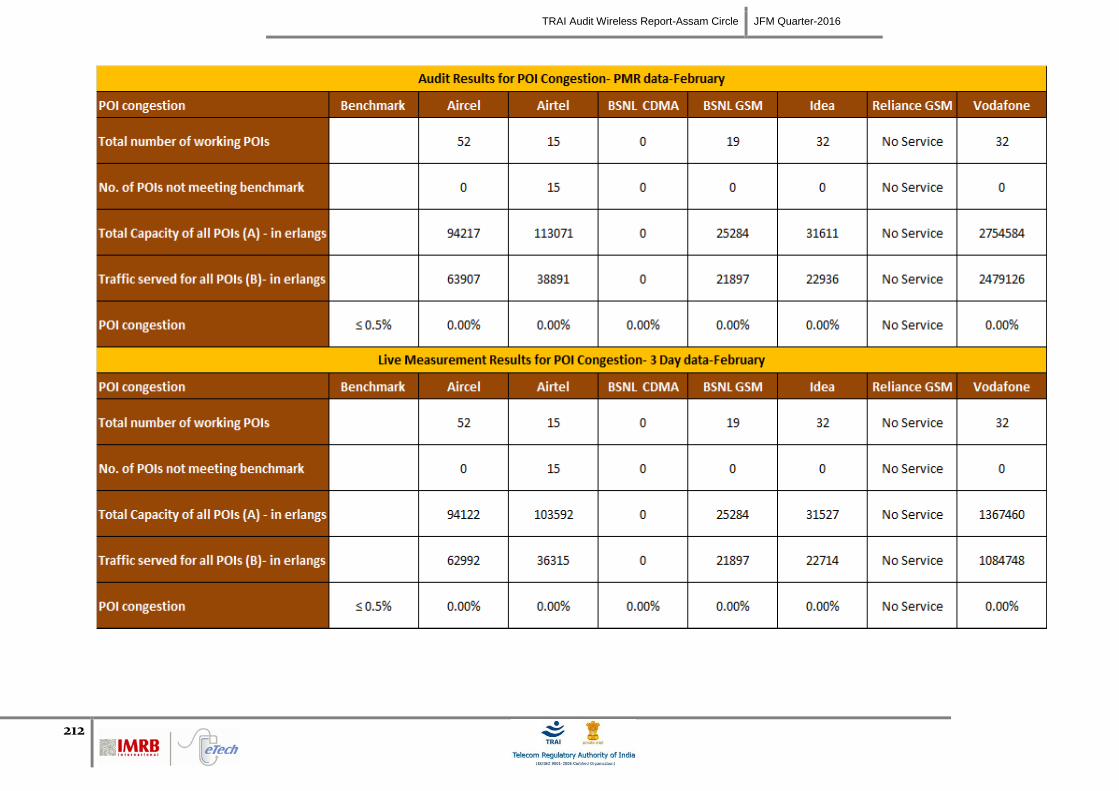
TRAI Audit Wireless Report-Assam Circle JFM Quarter-2016
212
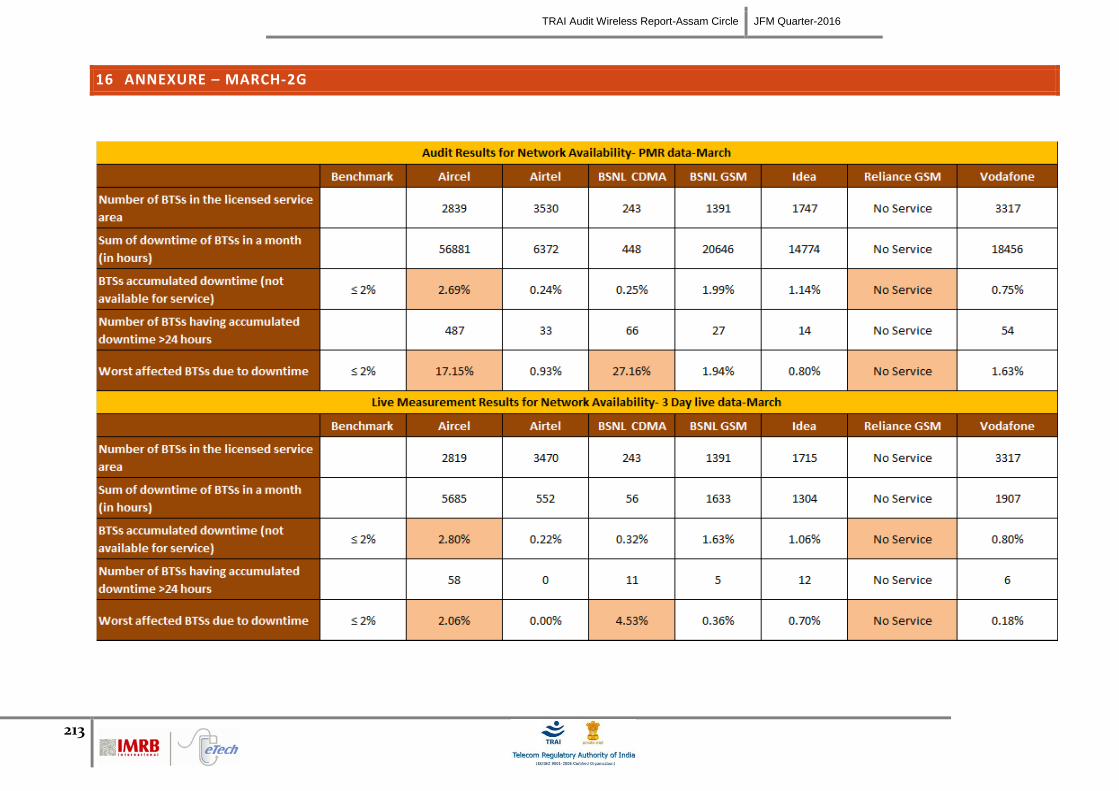
TRAI Audit Wireless Report-Assam Circle JFM Quarter-2016
213
16 ANNEXURE – MARCH-2G
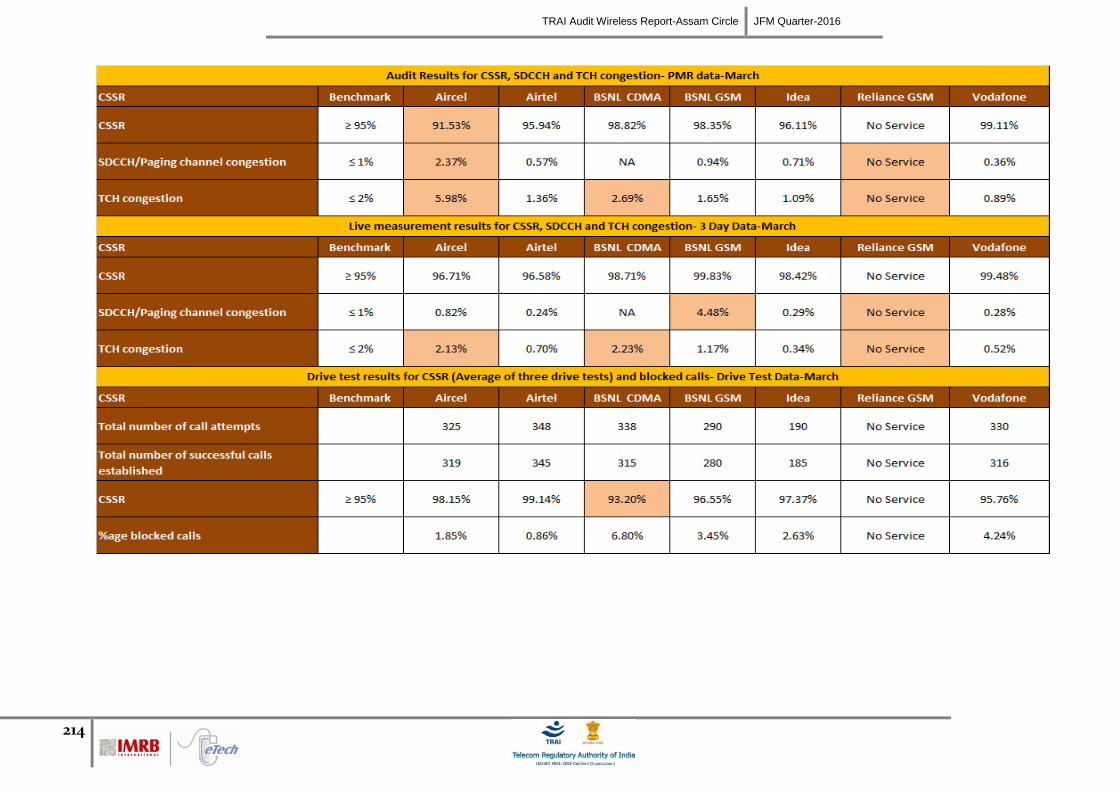
TRAI Audit Wireless Report-Assam Circle JFM Quarter-2016
214
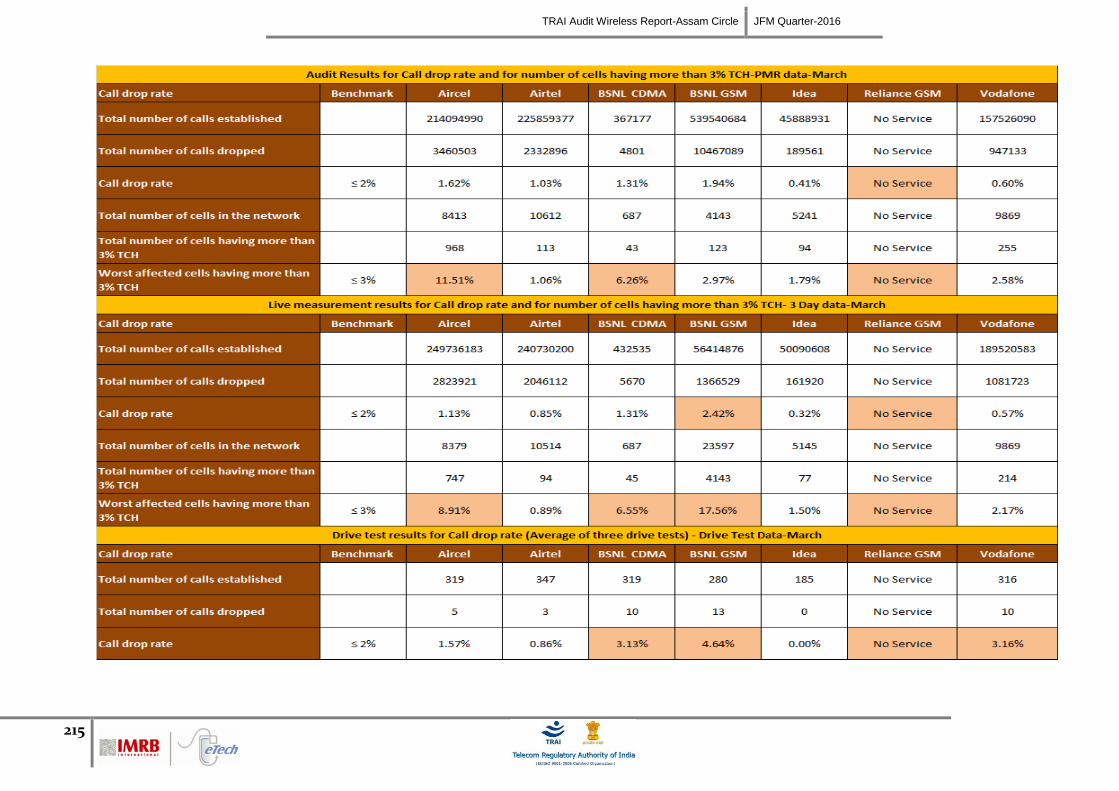
TRAI Audit Wireless Report-Assam Circle JFM Quarter-2016
215
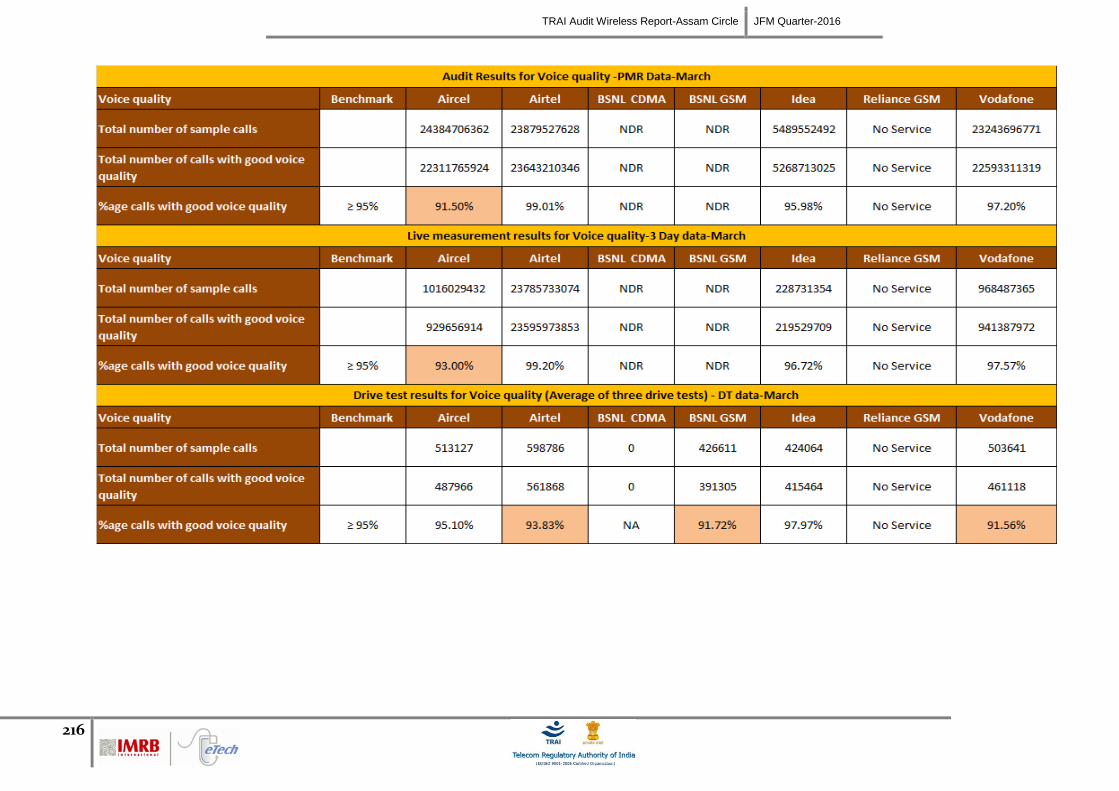
TRAI Audit Wireless Report-Assam Circle JFM Quarter-2016
216
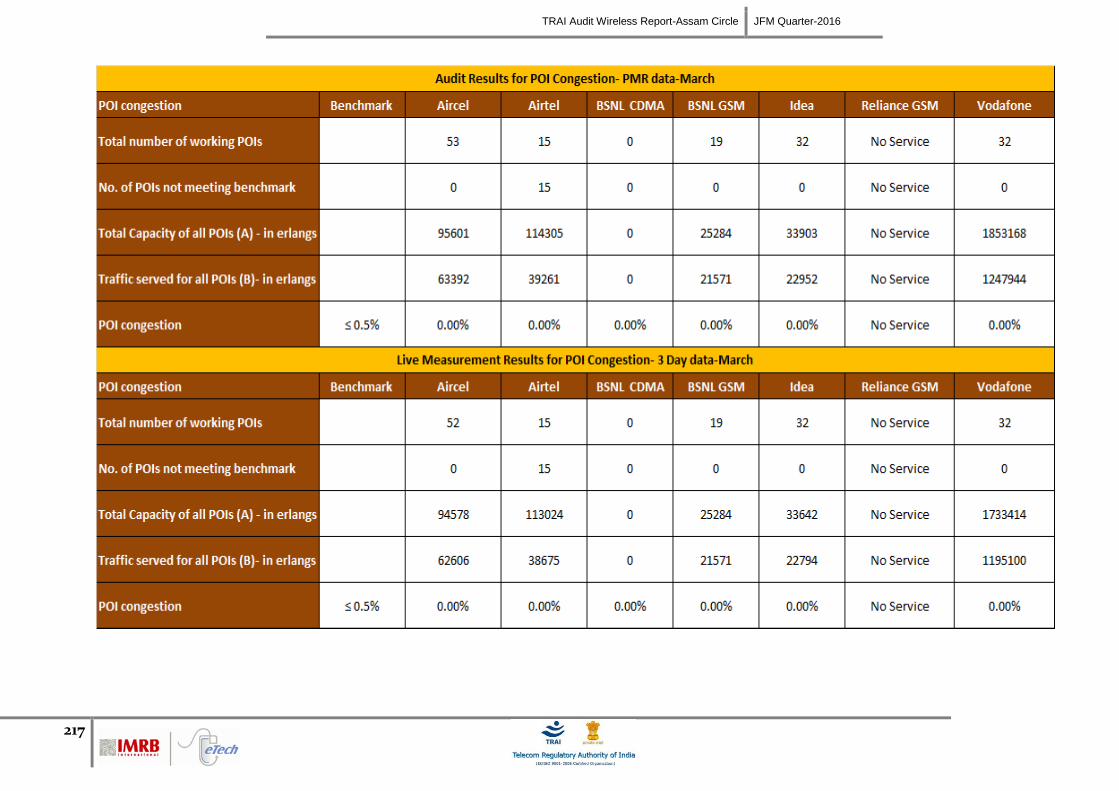
TRAI Audit Wireless Report-Assam Circle JFM Quarter-2016
217
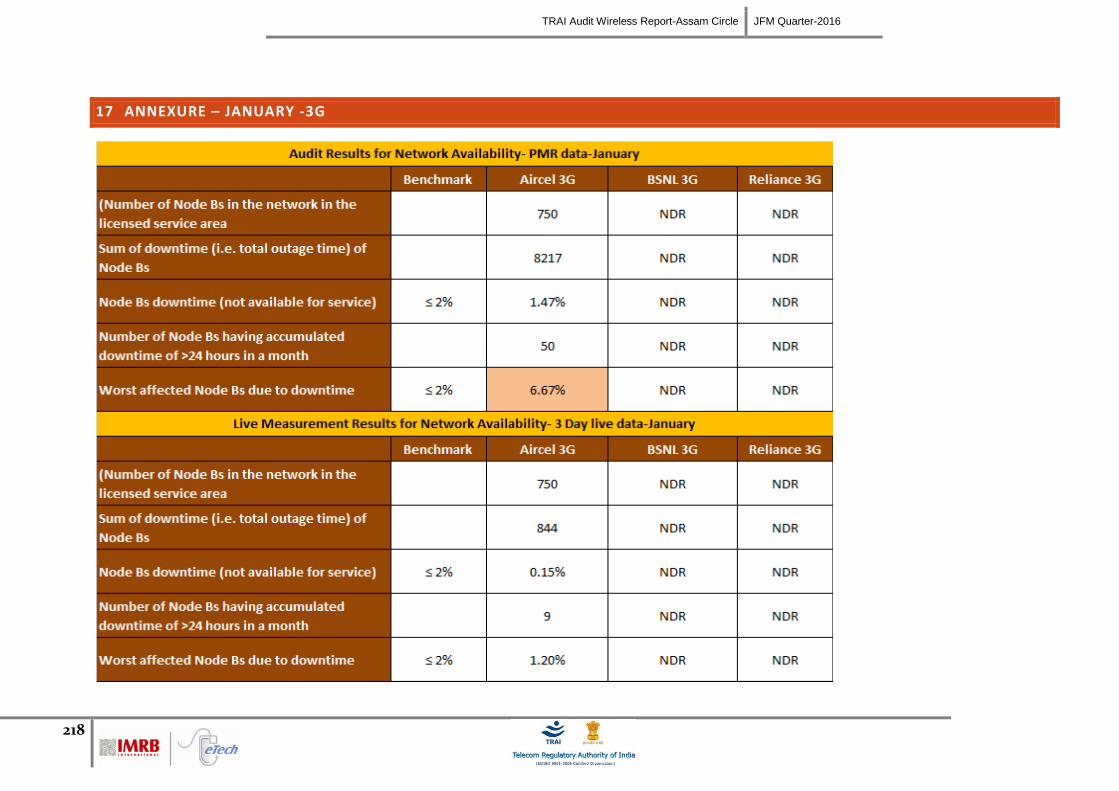
TRAI Audit Wireless Report-Assam Circle JFM Quarter-2016
218
17 ANNEXURE – JANUARY -3G
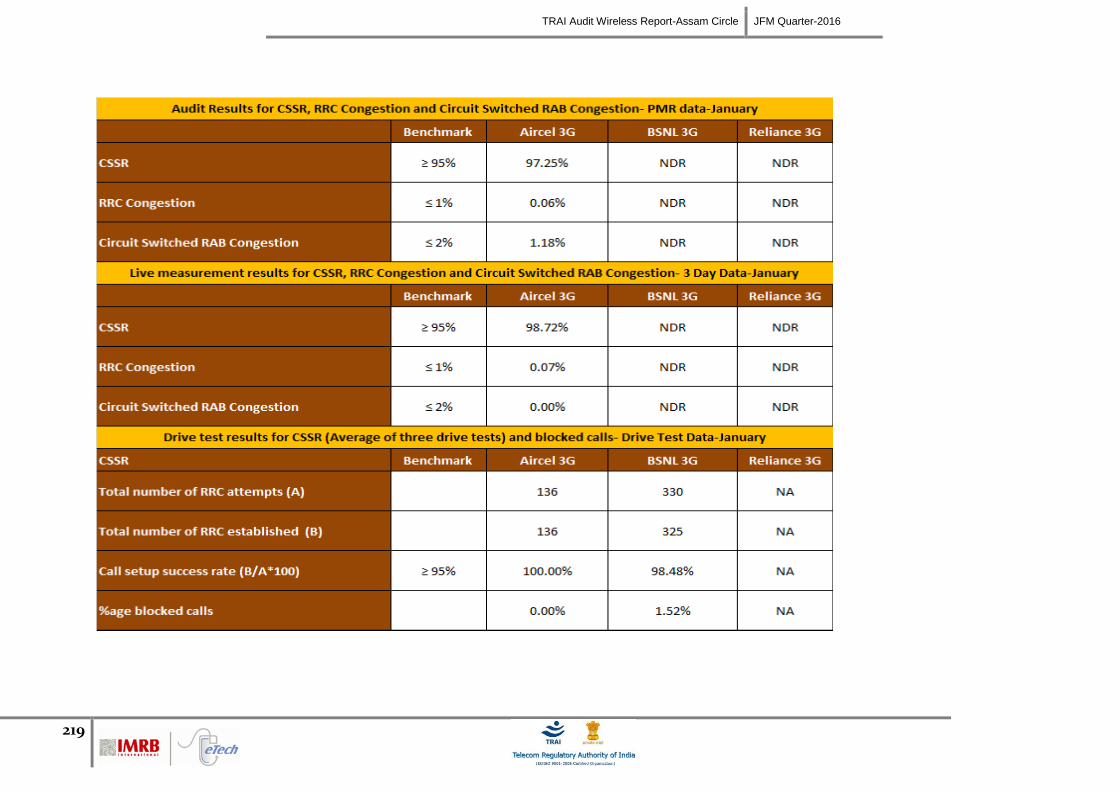
TRAI Audit Wireless Report-Assam Circle JFM Quarter-2016
219
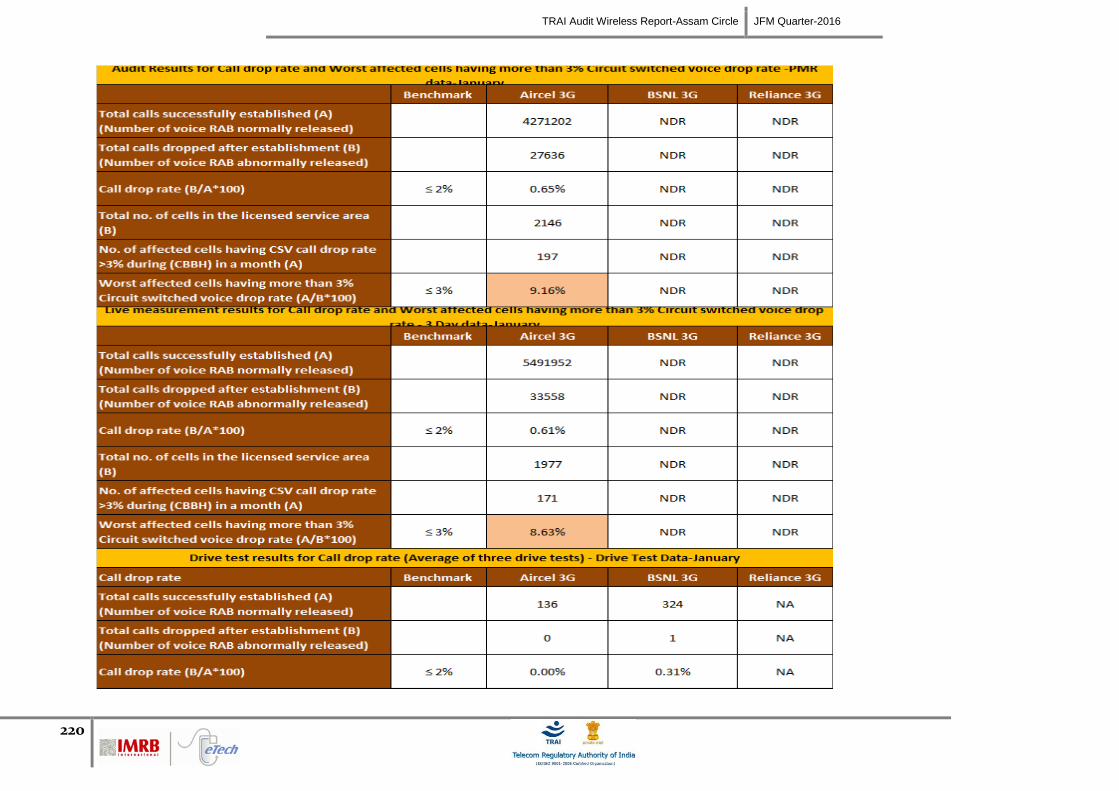
TRAI Audit Wireless Report-Assam Circle JFM Quarter-2016
220
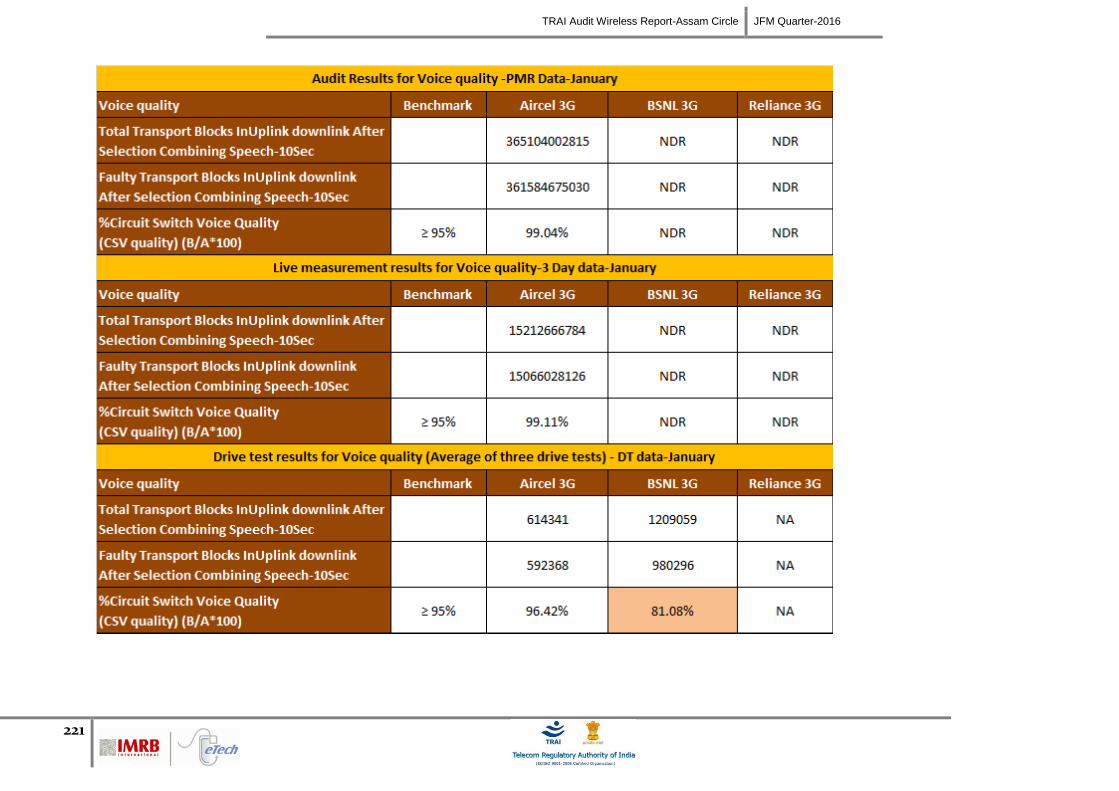
TRAI Audit Wireless Report-Assam Circle JFM Quarter-2016
221
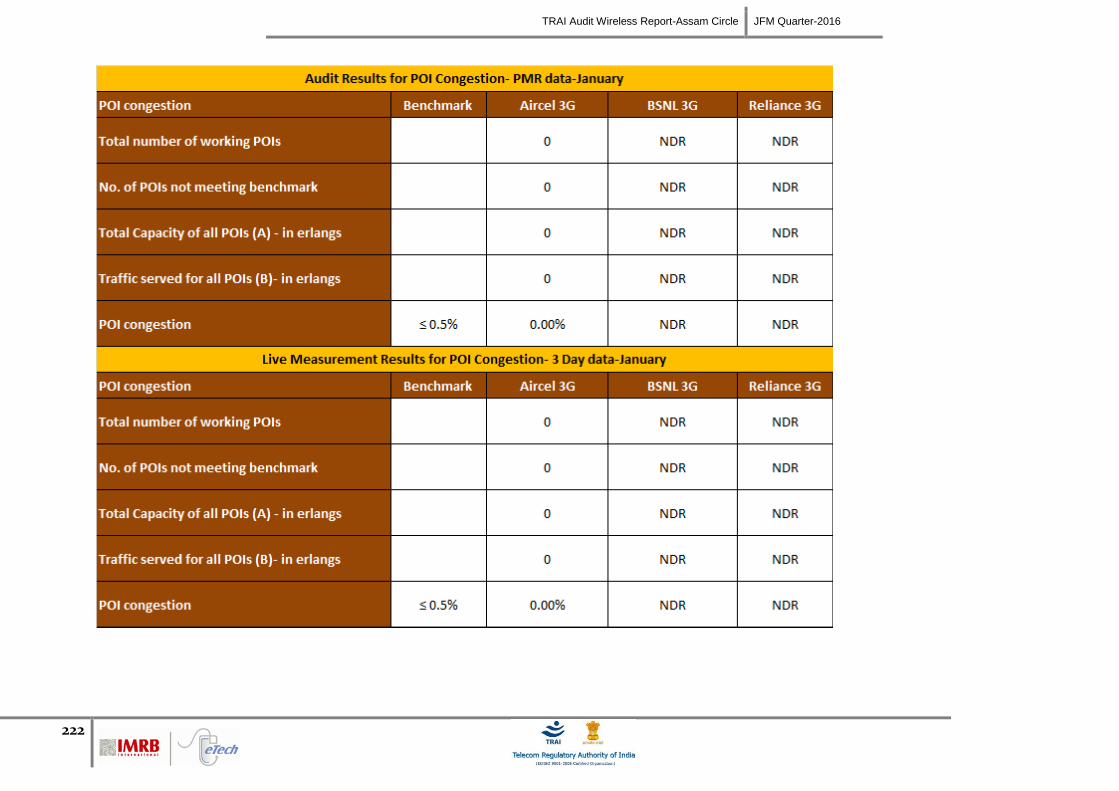
TRAI Audit Wireless Report-Assam Circle JFM Quarter-2016
222
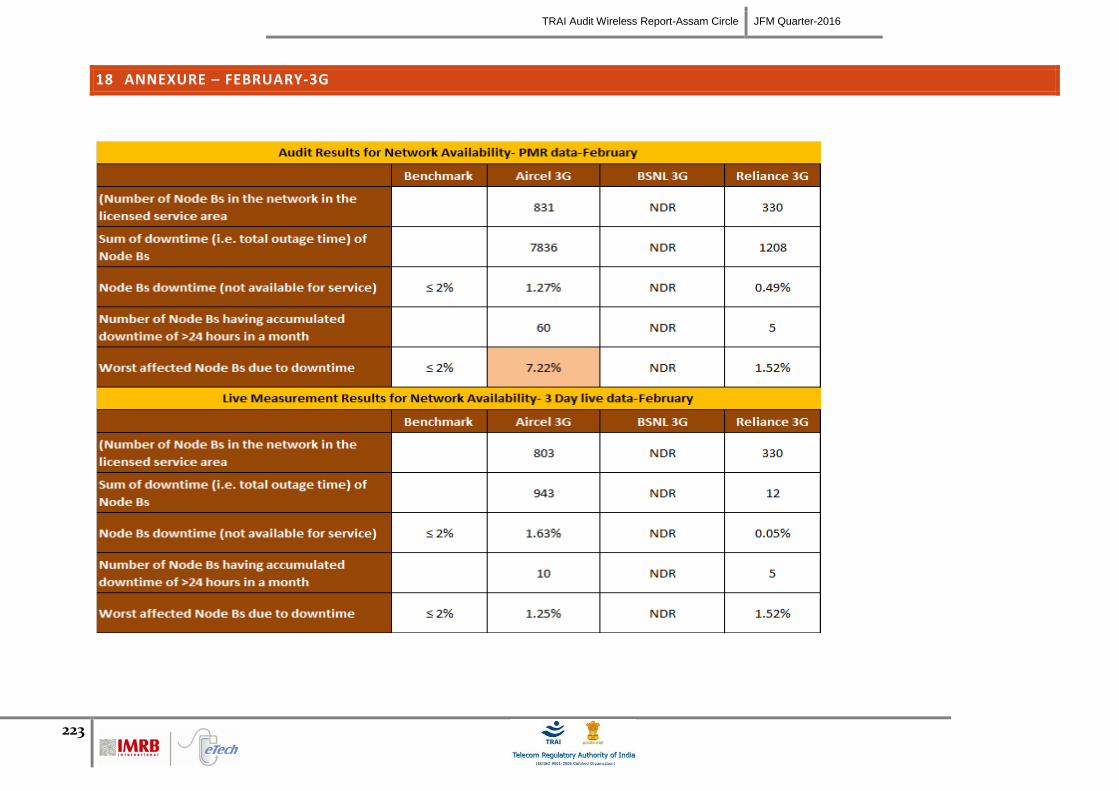
TRAI Audit Wireless Report-Assam Circle JFM Quarter-2016
223
18 ANNEXURE – FEBRUARY-3G
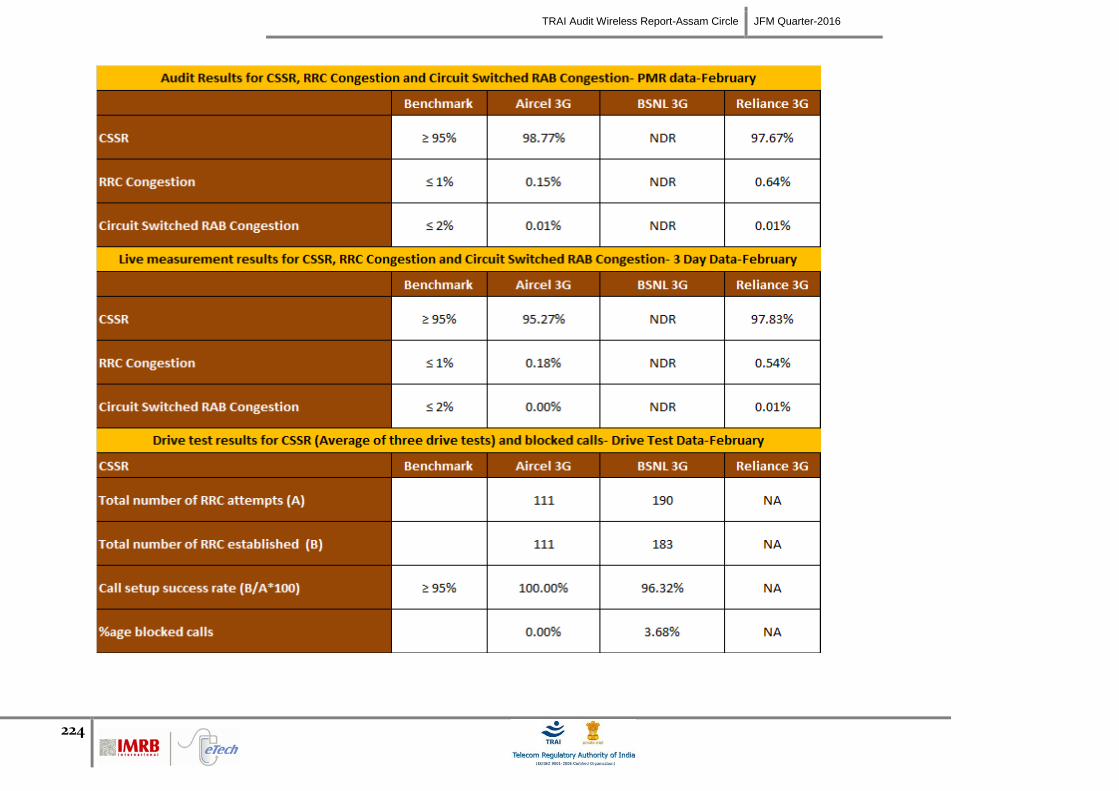
TRAI Audit Wireless Report-Assam Circle JFM Quarter-2016
224
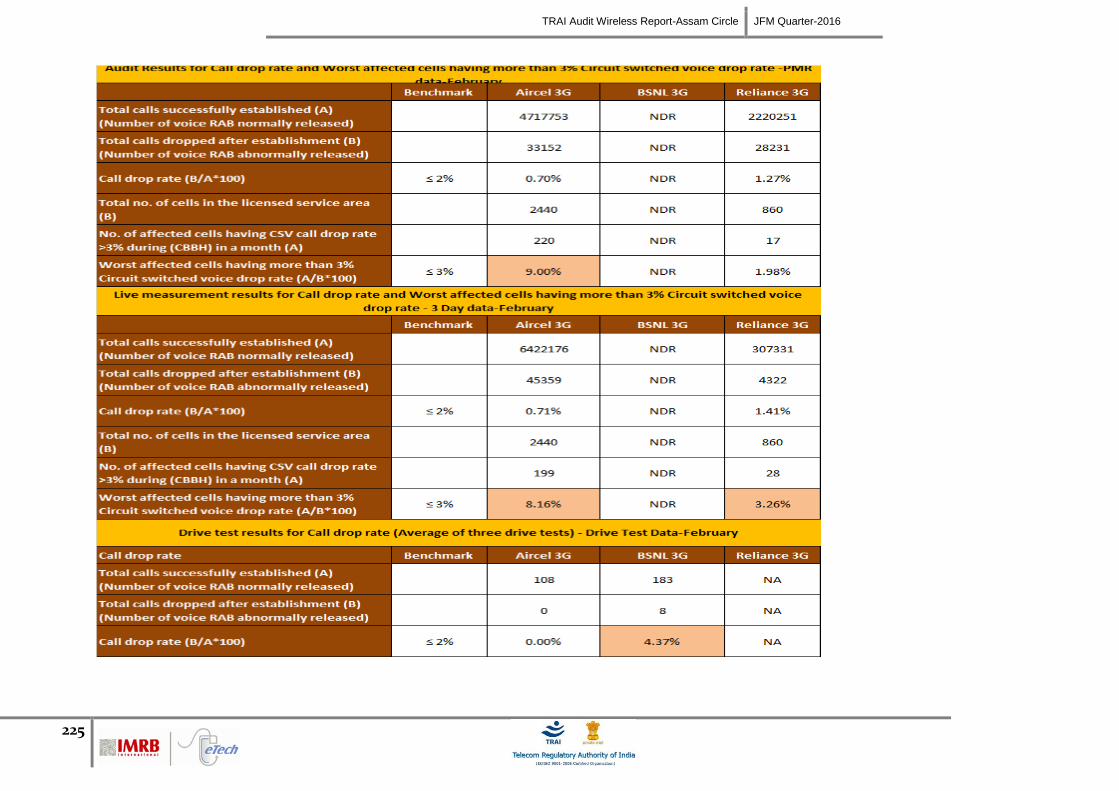
TRAI Audit Wireless Report-Assam Circle JFM Quarter-2016
225
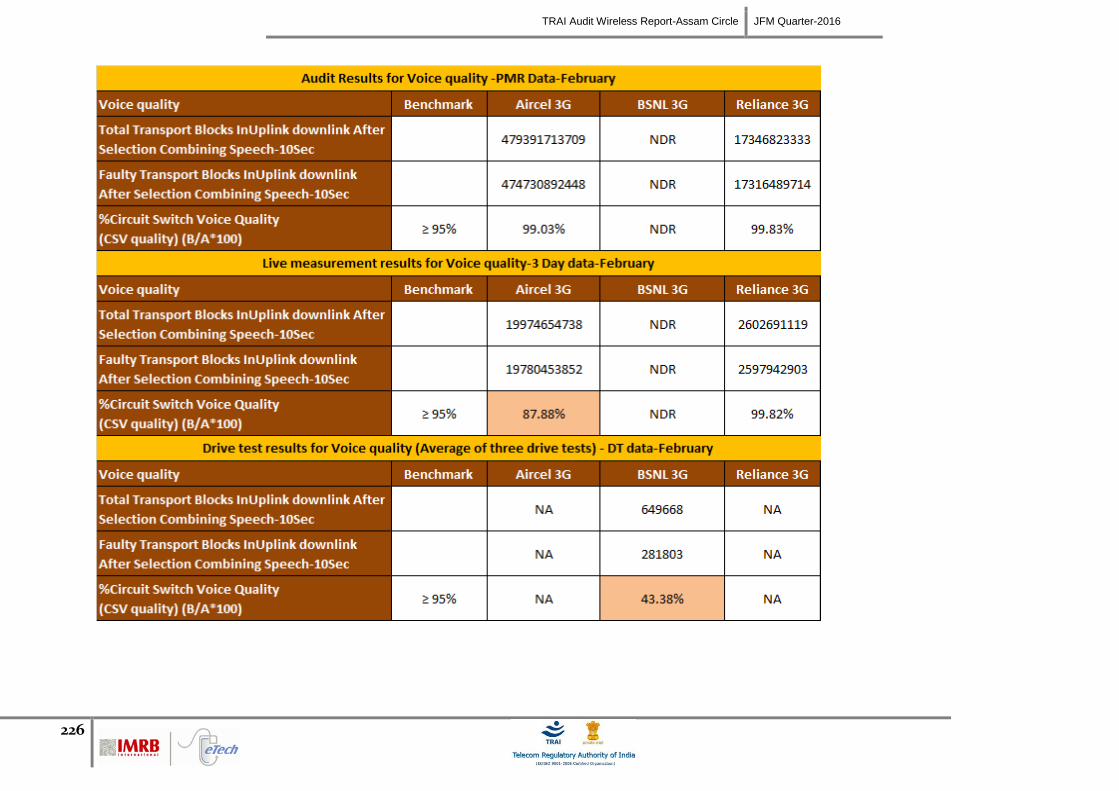
TRAI Audit Wireless Report-Assam Circle JFM Quarter-2016
226
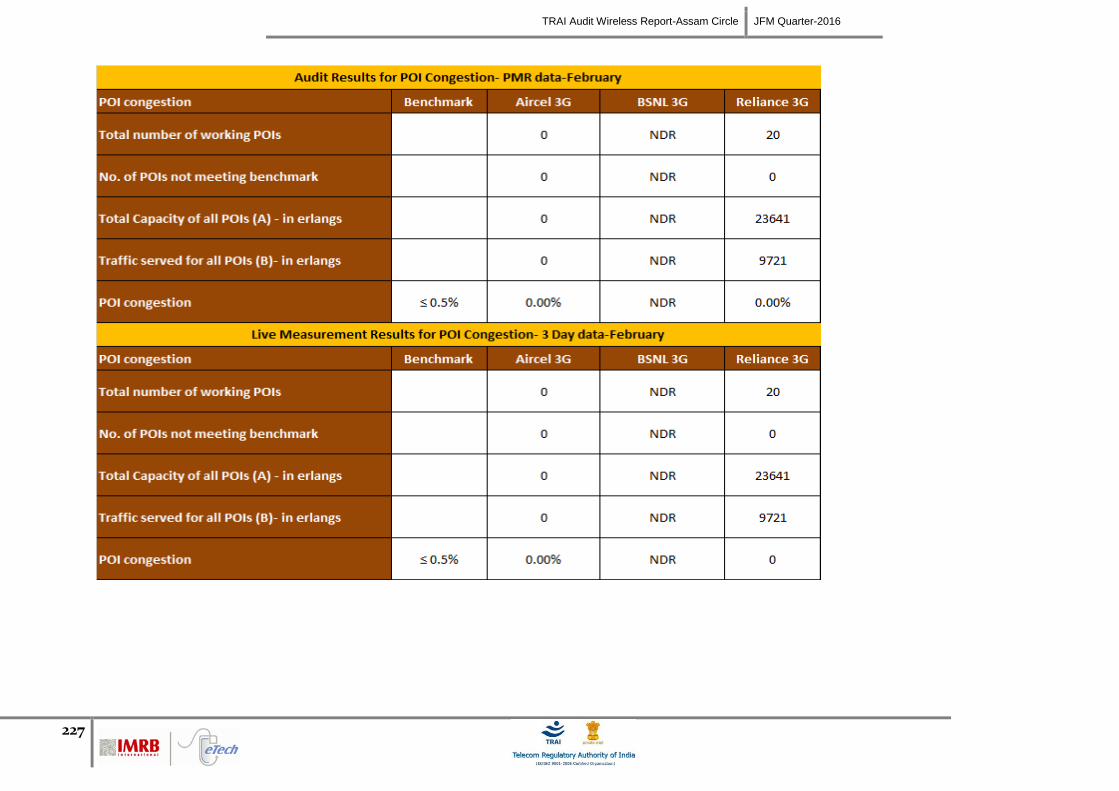
TRAI Audit Wireless Report-Assam Circle JFM Quarter-2016
227
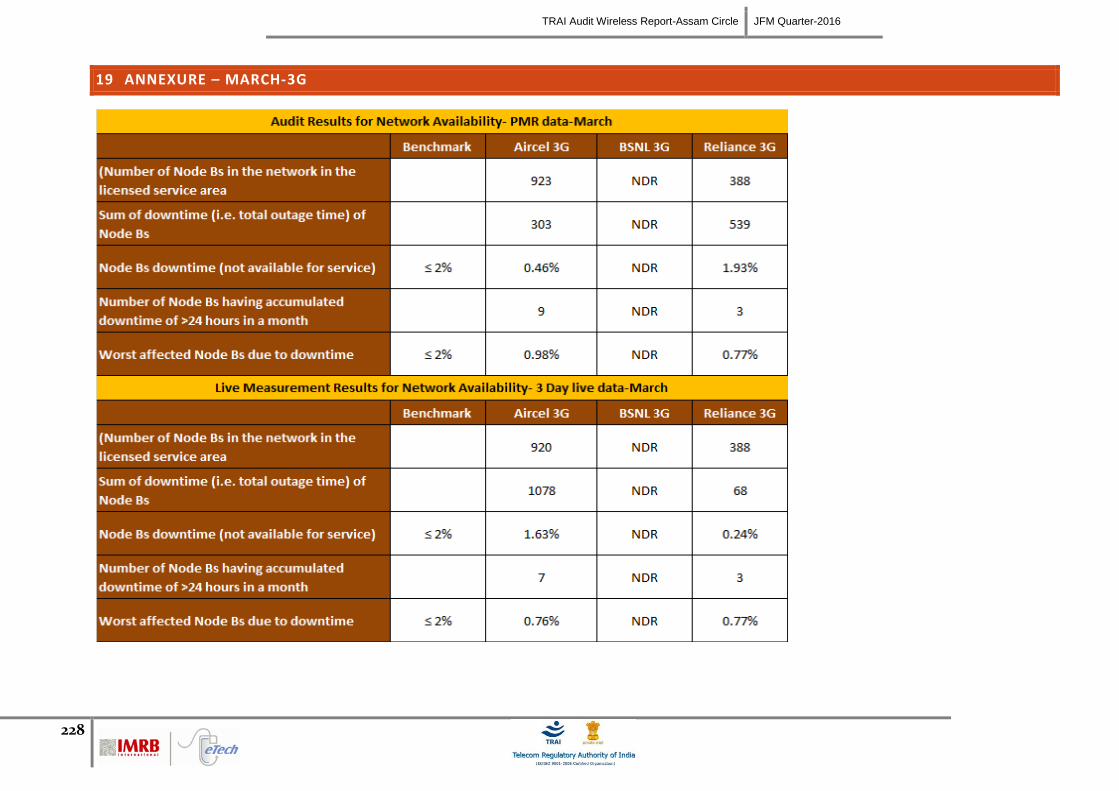
TRAI Audit Wireless Report-Assam Circle JFM Quarter-2016
228
19 ANNEXURE – MARCH-3G
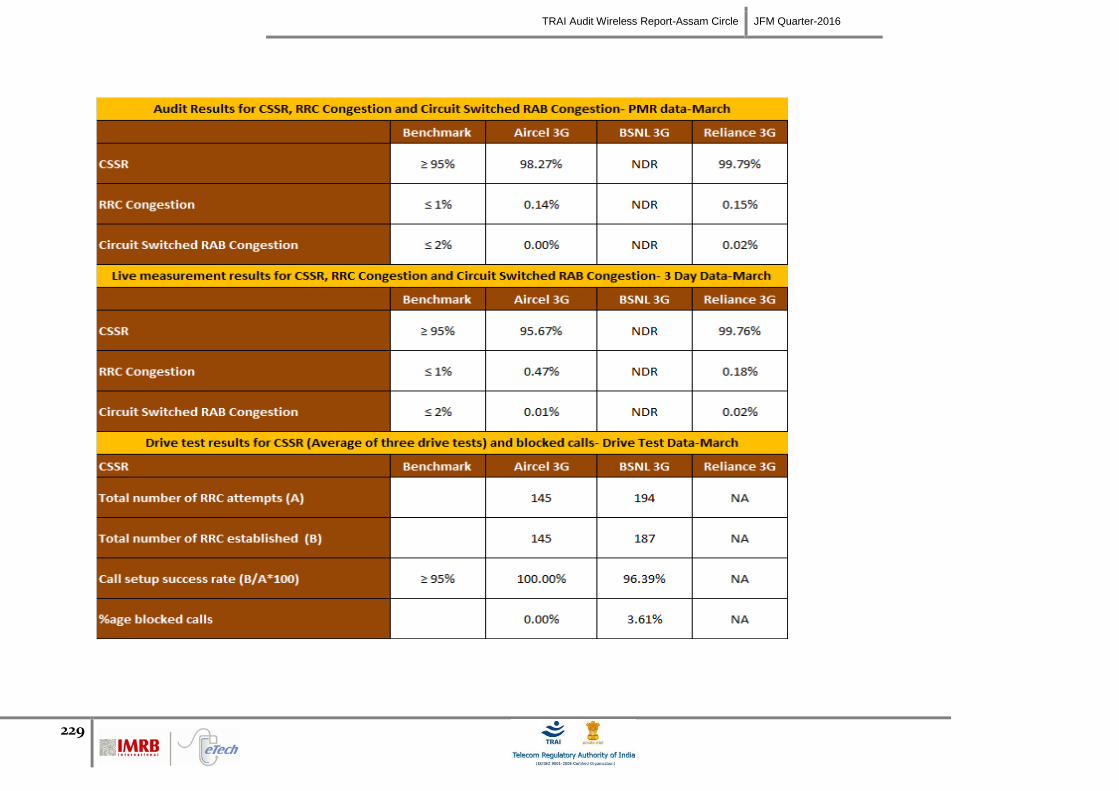
TRAI Audit Wireless Report-Assam Circle JFM Quarter-2016
229
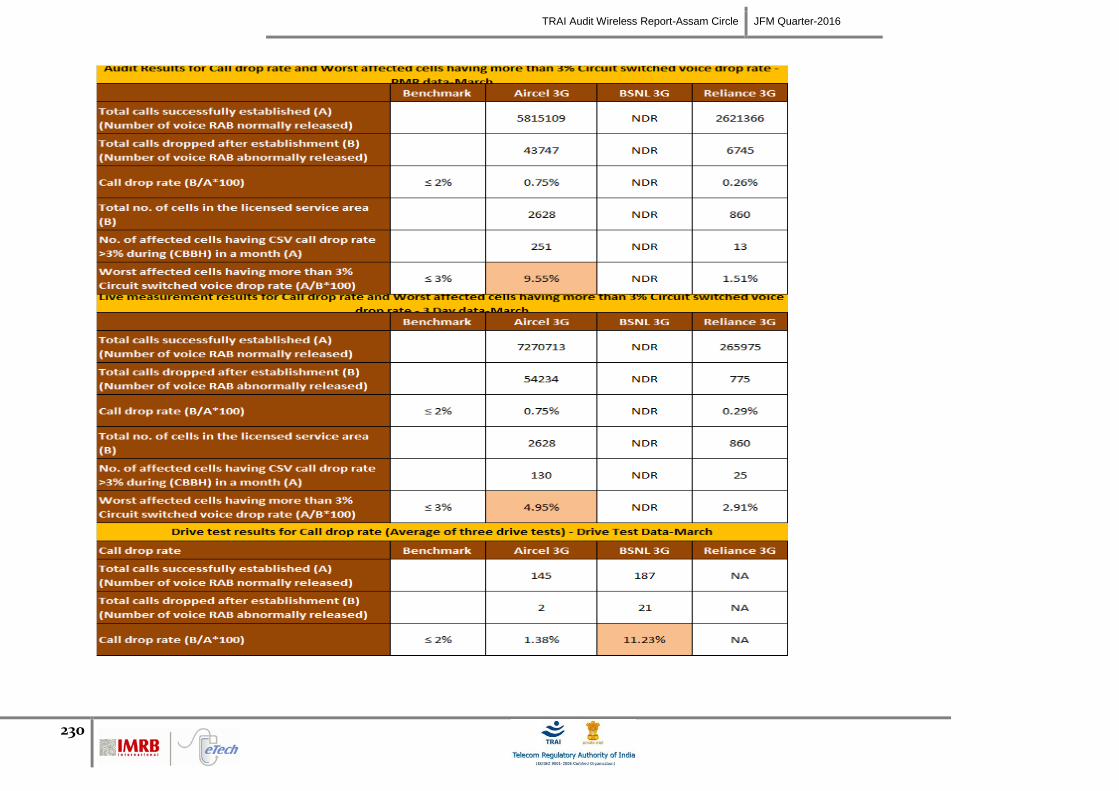
TRAI Audit Wireless Report-Assam Circle JFM Quarter-2016
230
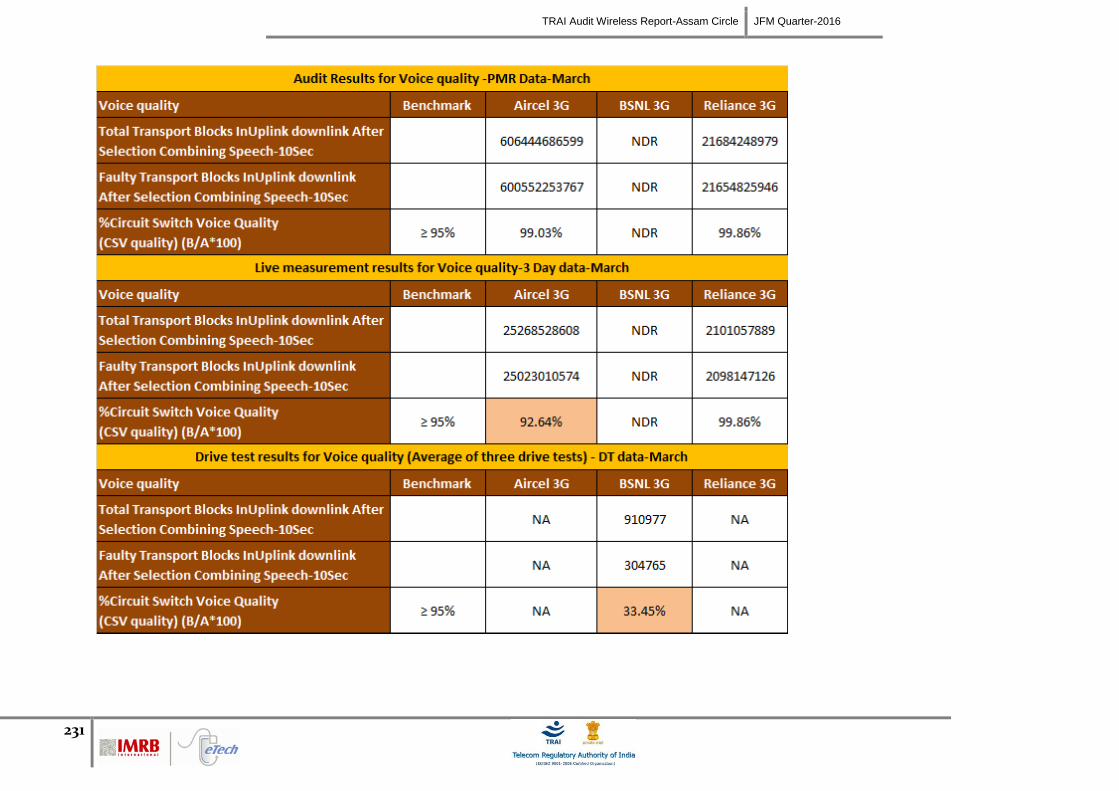
TRAI Audit Wireless Report-Assam Circle JFM Quarter-2016
231
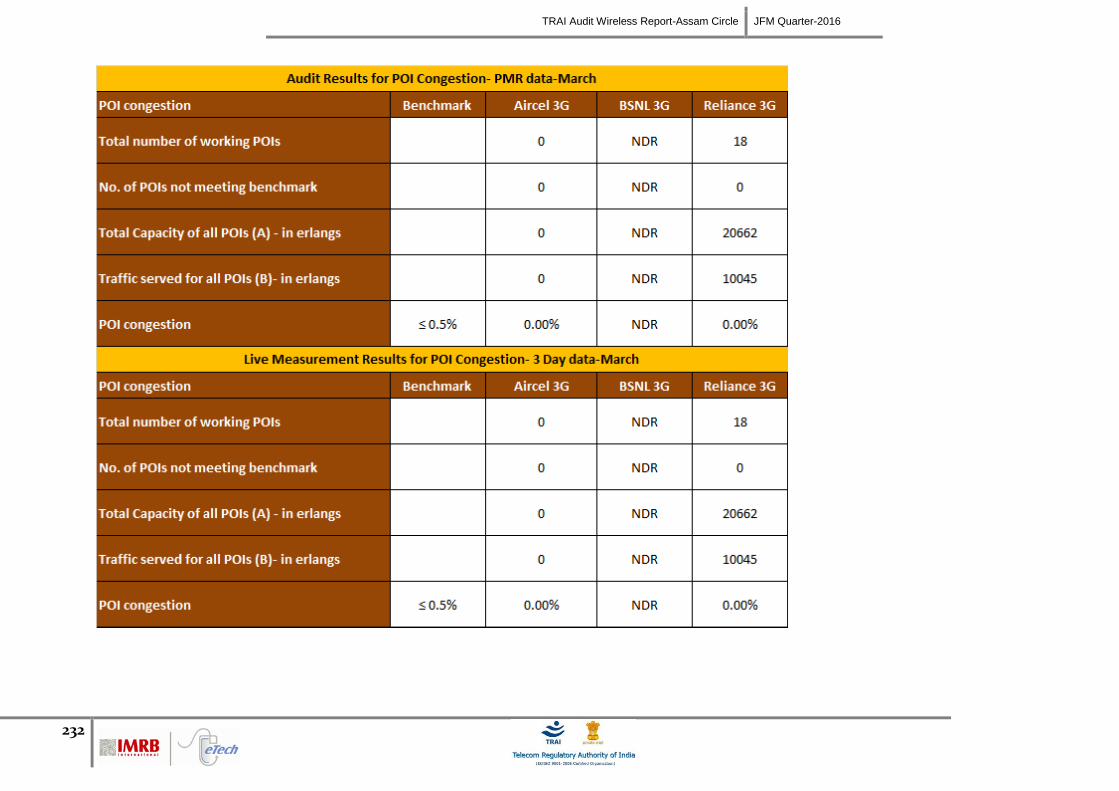
TRAI Audit Wireless Report-Assam Circle JFM Quarter-2016
232
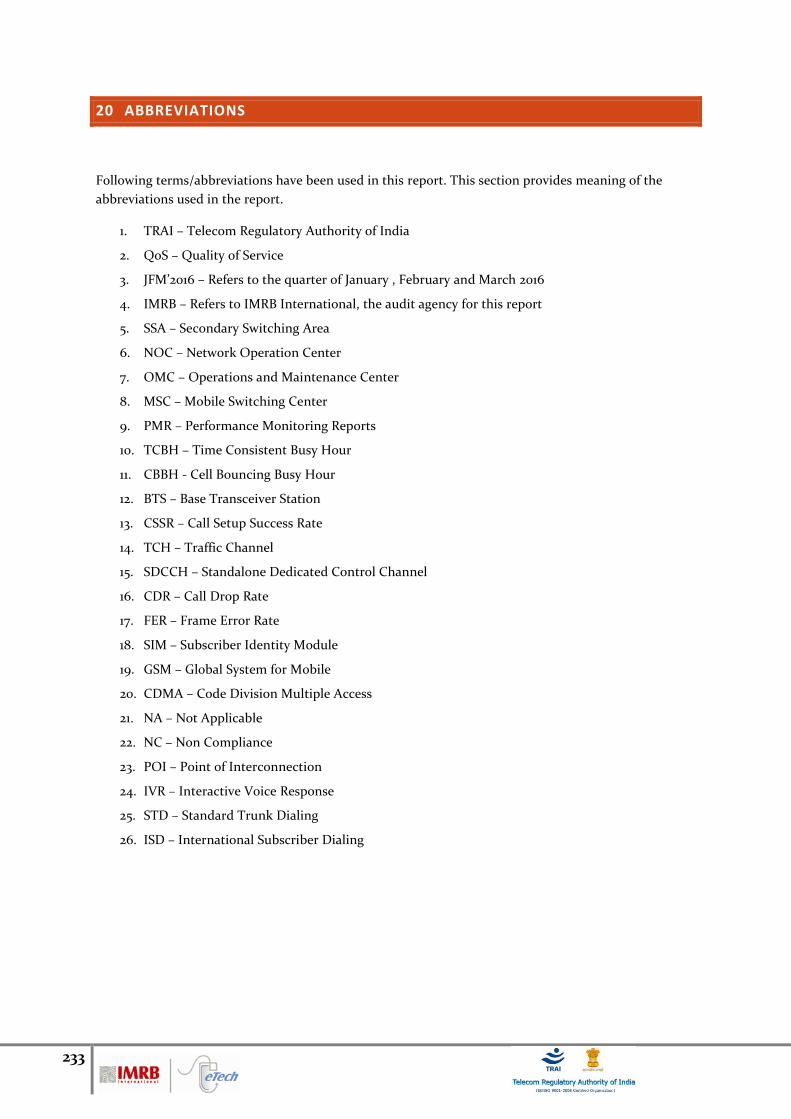
233
20 ABBREVIATIONS
Following terms/abbreviations have been used in this report. This section provides meaning of the
abbreviations used in the report.
1. TRAI – Telecom Regulatory Authority of India
2. QoS – Quality of Service
3. JFM’2016 – Refers to the quarter of January , February and March 2016
4. IMRB – Refers to IMRB International, the audit agency for this report
5. SSA – Secondary Switching Area
6. NOC – Network Operation Center
7. OMC – Operations and Maintenance Center
8. MSC – Mobile Switching Center
9. PMR – Performance Monitoring Reports
10. TCBH – Time Consistent Busy Hour
11. CBBH - Cell Bouncing Busy Hour
12. BTS – Base Transceiver Station
13. CSSR – Call Setup Success Rate
14. TCH – Traffic Channel
15. SDCCH – Standalone Dedicated Control Channel
16. CDR – Call Drop Rate
17. FER – Frame Error Rate
18. SIM – Subscriber Identity Module
19. GSM – Global System for Mobile
20. CDMA – Code Division Multiple Access
21. NA – Not Applicable
22. NC – Non Compliance
23. POI – Point of Interconnection
24. IVR – Interactive Voice Response
25. STD – Standard Trunk Dialing
26. ISD – International Subscriber Dialing

234
SCO 47, 5th
Floor, Old Judicial Complex, Sector 15
Part 1, Gurgaon, Haryana – 122001
+91 (124) 4217300
www.imrbint.com
TRAI Audit Broadband Report-Bihar-Jharkhand JFM Quarter-2015
1
EAST
ZONE TRAI AUDIT BROADBAND REPORT –
ASSAM - AUDIT OF JFM QUARTER, 2016
TRAI Audit Broadband Report-Assam JFM Quarter-2016
2
TABLE OF CONTENTS
1. Introduction .................................................................................................................................................. 5
1.1 About TRAI .......................................................................................................................................... 5
1.2 Objectives ............................................................................................................................................ 5
1.3 Coverage ............................................................................................................................................... 6
1.4 Audit Process and operator selection ............................................................................................... 6
1.5 Framework Used ................................................................................................................................. 7
1.5.1 PMR Reports - Significance and Methodology ............................................................................ 8
1.5.2 Live Calling - Significance and Methodology ............................................................................. 10
1.6 Sampling Methodology ..................................................................................................................... 12
1.6.1 Sampling Plan - BSNL ................................................................................................................... 12
1.7 Colour Code to read the report ........................................................................................................ 17
1.8 Audit Methodology ............................................................................................................................ 18
2. Executive Summary ..................................................................................................................................... 19
2.1 PMR Quarterly Data – JFM’2016 ....................................................................................................... 19
2.1.1 Service Provisioning/ Activation Time ....................................................................................... 20
2.1.2 Fault Repair/ Restoration ............................................................................................................. 20
2.1.3 Billing Performance ...................................................................................................................... 20
2.1.4 Response time to customer for assistance ................................................................................. 20
2.1.5 Bandwidth Utilization and Throughput..................................................................................... 20
2.1.6 Network Latency ........................................................................................................................... 20
2.2 Live Measurement .............................................................................................................................. 21
2.2.1 Bandwidth Utilization and Throughput...................................................................................... 21
2.2.2 Network Latency ............................................................................................................................ 21
2.3 Live Calling ........................................................................................................................................ 22
2.3.1 Service Provisioning/ Activation Times ..................................................................................... 22
2.3.2 Fault Repair/ Restoration ............................................................................................................. 22
2.3.3 Billing Performance ...................................................................................................................... 22
2.3.4 Response time to customer for assistance ................................................................................. 22
TRAI Audit Broadband Report-Assam JFM Quarter-2016
3
3. CRITICAL FINDINGS ................................................................................................................................. 23
4. Detailed Findings - Comparison between PMR Data and Live Measurement/ Calling Data ............. 24
4.1 Service Provisioning/ Activation Time ........................................................................................... 24
4.1.1 Parameter Explanation ................................................................................................................. 24
4.1.2 Detailed Findings - Service Provisoning..................................................................................... 25
4.2 Fault Repair/ Restoration Time ....................................................................................................... 25
4.2.1 Parameter Explanation ................................................................................................................. 25
4.2.2 Detailed Findings - Fault Repair within Next Working Day .................................................... 26
4.2.3 Detailed Findings - Fault Repair within 3 Working Days ......................................................... 27
4.3 Metering and Billing Credibility ...................................................................................................... 27
4.3.1 Parameter Explanation – billing complaints .............................................................................. 27
4.4 Time Taken to Refund after Closure ................................................................................................ 31
4.4.1 Parameter Explanation .................................................................................................................. 31
4.4.2 Detailed Findings - Refund of Deposits ...................................................................................... 31
4.5 Response Time to Customer for Assistance ................................................................................... 32
4.5.1 Parameter Explanation ................................................................................................................. 32
4.5.2 Detailed Findings - Call Answered within 60 Seconds ............................................................. 32
4.5.3 Detailed Findings - Call Answered within 90 Seconds ............................................................. 33
4.6 Bandwidth Utilization & Download Speed .................................................................................... 33
4.6.1 Parameter Explanation – Bandwidth Utilization ...................................................................... 33
4.6.2 Detailed findings – Bandwidth Utilization ................................................................................ 34
4.6.3 Parameter Explanation - Broadband Download Speed ............................................................ 35
4.6.4 Detailed findings – Broadband Download Speed ...................................................................... 36
4.7 Service Availability/Uptime ............................................................................................................. 36
4.7.2 Detailed Findings - Service Availability...................................................................................... 37
4.8 Network Latency & Packet Loss ...................................................................................................... 37
4.8.1 Parameter Explanation - Network Latency ................................................................................ 37
4.8.2 Parameter Explanation – Packet Loss ......................................................................................... 38
4.8.3 Detailed Findings - Network Latency / Packet Loss ................................................................. 39
5. Annexure – JFM’2016 .................................................................................................................................. 40
TRAI Audit Broadband Report-Assam JFM Quarter-2016
4
5.1 Service Provisioning .......................................................................................................................... 40
5.2 Fault Repair/ Restoration ................................................................................................................. 40
5.3 Billing Performance – Metering and billing credibility .................................................................. 41
5.4 Response Time to the Customer for Assistance............................................................................. 42
5.5 Bandwidth Utilization ...................................................................................................................... 43
5.6 Broadband Download Speed ............................................................................................................ 44
5.7 Service Availability/ Uptime ............................................................................................................ 44
5.8 Network Latency / Packet Loss ....................................................................................................... 45
5.9 Total Capacity and Subscribers ....................................................................................................... 45
TRAI Audit Broadband Report-Assam JFM Quarter-2016
5
1. INTRODUCTION
1.1 About TRAI
TRAI's mission is to create and nurture conditions for growth of telecommunications in the country in a
manner and at a pace that will enable India to play a leading role in the emerging global information
society. One of the main objectives of TRAI is to provide a fair and transparent policy environment
which promotes a level playing field and facilitates fair competition.
In pursuance of above objective, TRAI has been issuing regulations, order and directives to deal with
the issues or complaints raised by the operators as well as the consumers. These regulations, order and
directives have helped to nurture the growth of multi operator multi service - an open competitive
market from a government owned monopoly. Also, the directions, orders and regulations issued cover a
wide range of subjects including tariff, interconnection and quality of service as well as governance of
the Authority.
TRAI initiated a regulation - The Standards of Quality of Service of Basic Telephone Service (Wire line)
and Cellular Mobile Telephone Service Regulations, 2009 (7 of 2009) dated 20thMarch, 2009, the
"Standards of Quality of Service for Wireless Data Services Regulations, 2012 dated 4th December 2012,
and the "Quality of Service of Broadband Service Regulations", 2006 (11 of 2006) dated 6th October,
2006 that provide the benchmarks for the parameters on customer perception of service to be achieved
by service provider.
In order to assess the above regulations, TRAI has commissioned a third party agency to conduct the
audit of the service providers and check the performance of the operators on the various benchmarks
set by Telecom Regulatory Authority of India (TRAI).
1.2 OBJECTIVES
The primary objective of the Audit module is to:
Audit and Assess the Quality of Services being rendered by Basic (Wireline), Cellular Mobile
(Wireless), and Broadband service against the parameters notified by TRAI. (The parameters of
Quality of Services (QoS) have been specified by in the respective regulations published by
TRAI).
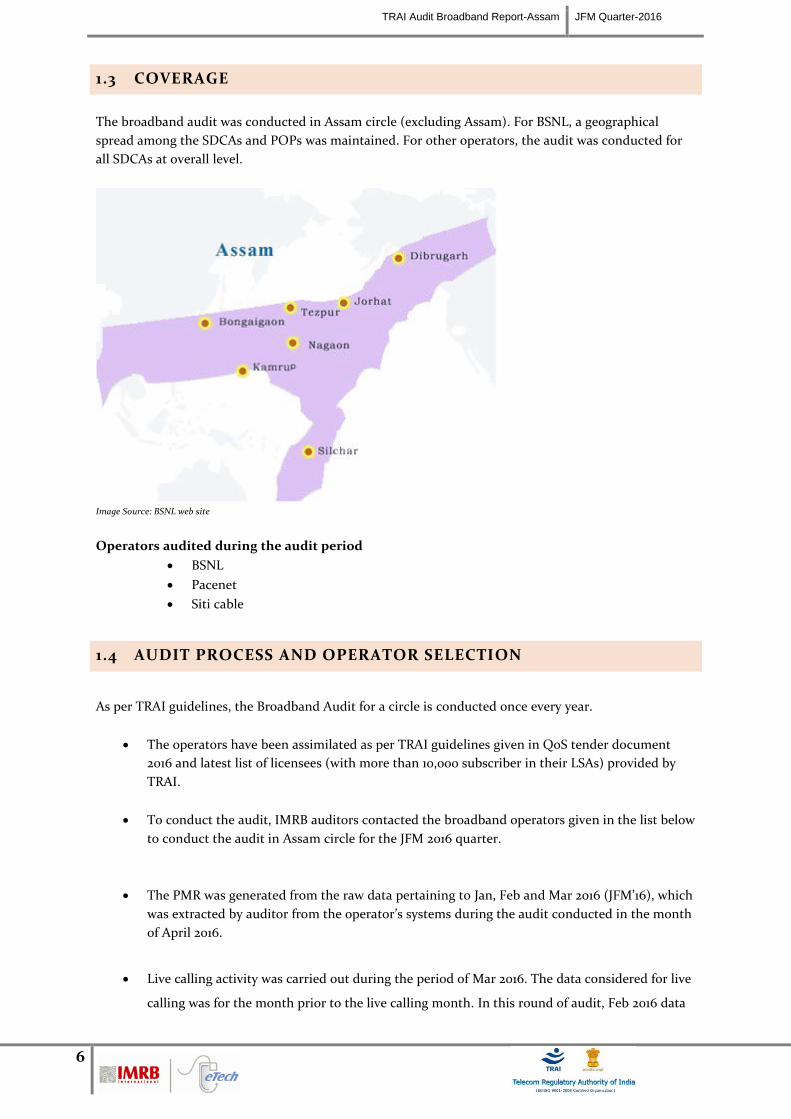
TRAI Audit Broadband Report-Assam JFM Quarter-2016
6
1.3 COVERAGE
The broadband audit was conducted in Assam circle (excluding Assam). For BSNL, a geographical
spread among the SDCAs and POPs was maintained. For other operators, the audit was conducted for
all SDCAs at overall level.
Image Source: BSNL web site
Operators audited during the audit period
BSNL
Pacenet
Siti cable
1.4 AUDIT PROCESS AND OPERATOR SELECTION
As per TRAI guidelines, the Broadband Audit for a circle is conducted once every year.
The operators have been assimilated as per TRAI guidelines given in QoS tender document
2016 and latest list of licensees (with more than 10,000 subscriber in their LSAs) provided by
TRAI.
To conduct the audit, IMRB auditors contacted the broadband operators given in the list below
to conduct the audit in Assam circle for the JFM 2016 quarter.
The PMR was generated from the raw data pertaining to Jan, Feb and Mar 2016 (JFM’16), which
was extracted by auditor from the operator’s systems during the audit conducted in the month
of April 2016.
Live calling activity was carried out during the period of Mar 2016. The data considered for live
calling was for the month prior to the live calling month. In this round of audit, Feb 2016 data
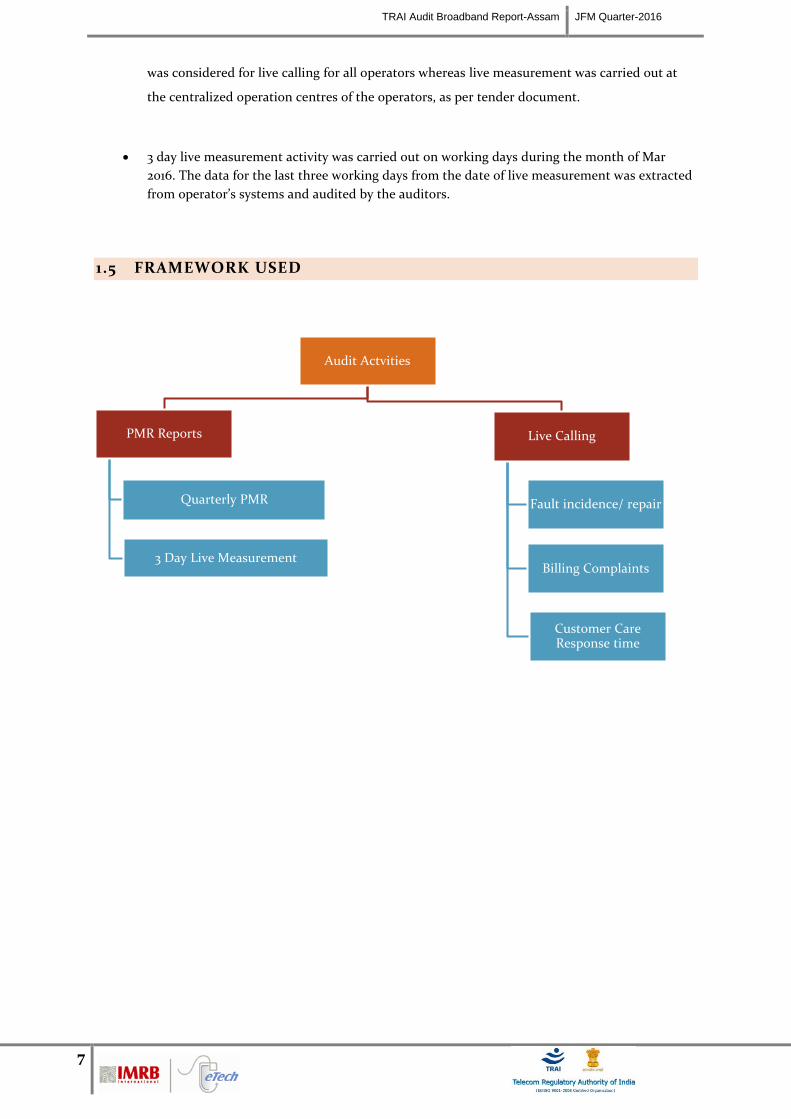
TRAI Audit Broadband Report-Assam JFM Quarter-2016
7
was considered for live calling for all operators whereas live measurement was carried out at
the centralized operation centres of the operators, as per tender document.
3 day live measurement activity was carried out on working days during the month of Mar
2016. The data for the last three working days from the date of live measurement was extracted
from operator’s systems and audited by the auditors.
1.5 FRAMEWORK USED
Audit Actvities
PMR Reports
Quarterly PMR
3 Day Live Measurement
Live Calling
Fault incidence/ repair
Billing Complaints
Customer Care Response time
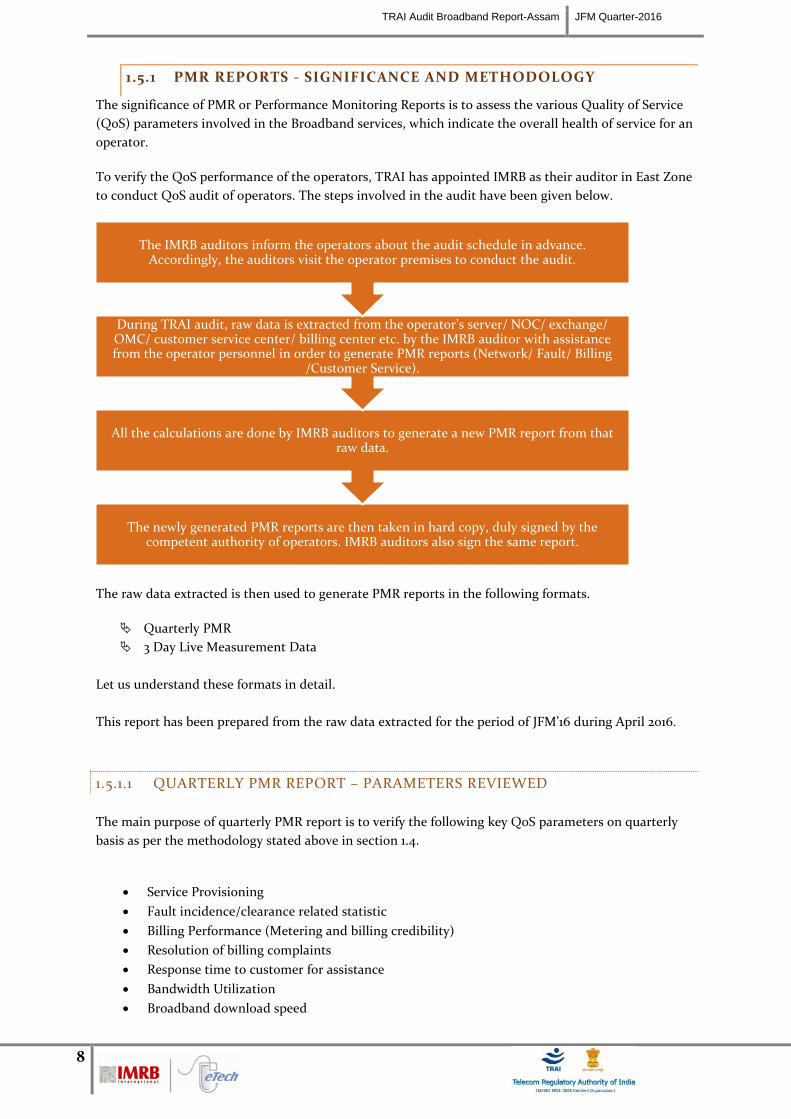
TRAI Audit Broadband Report-Assam JFM Quarter-2016
8
1.5.1 PMR REPORTS - SIGNIFICANCE AND METHODOLOGY
The significance of PMR or Performance Monitoring Reports is to assess the various Quality of Service
(QoS) parameters involved in the Broadband services, which indicate the overall health of service for an
operator.
To verify the QoS performance of the operators, TRAI has appointed IMRB as their auditor in East Zone
to conduct QoS audit of operators. The steps involved in the audit have been given below.
The raw data extracted is then used to generate PMR reports in the following formats.
Quarterly PMR
3 Day Live Measurement Data
Let us understand these formats in detail.
This report has been prepared from the raw data extracted for the period of JFM’16 during April 2016.
1.5.1.1 QUARTERLY PMR REPORT – PARAMETERS REVIEWED
The main purpose of quarterly PMR report is to verify the following key QoS parameters on quarterly
basis as per the methodology stated above in section 1.4.
Service Provisioning
Fault incidence/clearance related statistic
Billing Performance (Metering and billing credibility)
Resolution of billing complaints
Response time to customer for assistance
Bandwidth Utilization
Broadband download speed
The newly generated PMR reports are then taken in hard copy, duly signed by the competent authority of operators. IMRB auditors also sign the same report.
All the calculations are done by IMRB auditors to generate a new PMR report from that raw data.
During TRAI audit, raw data is extracted from the operator’s server/ NOC/ exchange/ OMC/ customer service center/ billing center etc. by the IMRB auditor with assistance from the operator personnel in order to generate PMR reports (Network/ Fault/ Billing
/Customer Service).
The IMRB auditors inform the operators about the audit schedule in advance. Accordingly, the auditors visit the operator premises to conduct the audit.
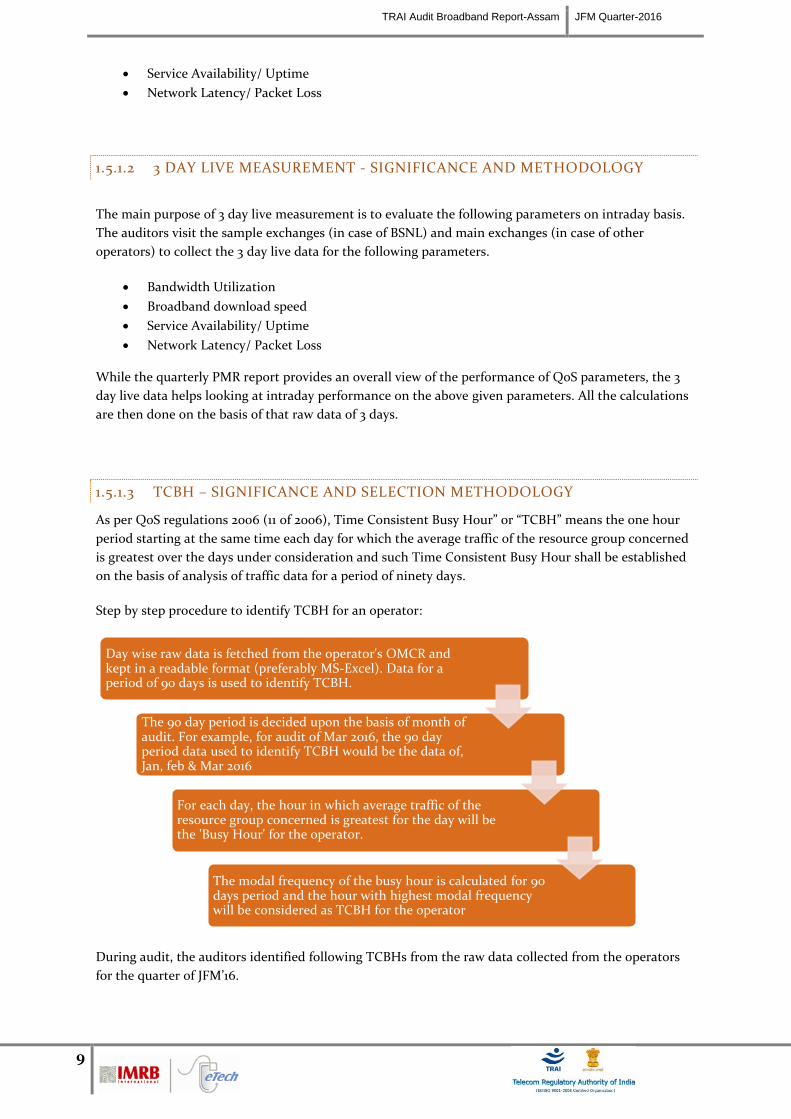
TRAI Audit Broadband Report-Assam JFM Quarter-2016
9
Service Availability/ Uptime
Network Latency/ Packet Loss
1.5.1.2 3 DAY LIVE MEASUREMENT - SIGNIFICANCE AND METHODOLOGY
The main purpose of 3 day live measurement is to evaluate the following parameters on intraday basis.
The auditors visit the sample exchanges (in case of BSNL) and main exchanges (in case of other
operators) to collect the 3 day live data for the following parameters.
Bandwidth Utilization
Broadband download speed
Service Availability/ Uptime
Network Latency/ Packet Loss
While the quarterly PMR report provides an overall view of the performance of QoS parameters, the 3
day live data helps looking at intraday performance on the above given parameters. All the calculations
are then done on the basis of that raw data of 3 days.
1.5.1.3 TCBH – SIGNIFICANCE AND SELECTION METHODOLOGY
As per QoS regulations 2006 (11 of 2006), Time Consistent Busy Hour” or “TCBH” means the one hour
period starting at the same time each day for which the average traffic of the resource group concerned
is greatest over the days under consideration and such Time Consistent Busy Hour shall be established
on the basis of analysis of traffic data for a period of ninety days.
Step by step procedure to identify TCBH for an operator:
During audit, the auditors identified following TCBHs from the raw data collected from the operators
for the quarter of JFM’16.
Day wise raw data is fetched from the operator's OMCR and kept in a readable format (preferably MS-Excel). Data for a period of 90 days is used to identify TCBH.
The 90 day period is decided upon the basis of month of audit. For example, for audit of Mar 2016, the 90 day period data used to identify TCBH would be the data of, Jan, feb & Mar 2016
For each day, the hour in which average traffic of the resource group concerned is greatest for the day will be the 'Busy Hour' for the operator.
The modal frequency of the busy hour is calculated for 90 days period and the hour with highest modal frequency will be considered as TCBH for the operator
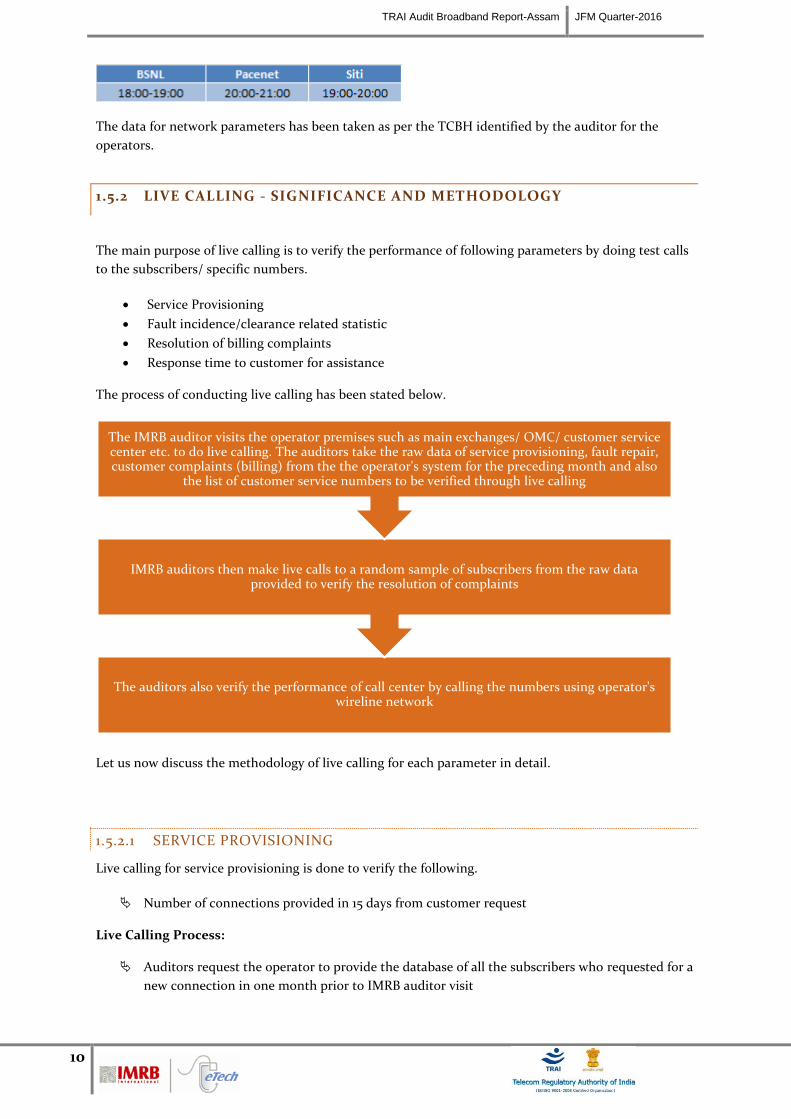
TRAI Audit Broadband Report-Assam JFM Quarter-2016
10
The data for network parameters has been taken as per the TCBH identified by the auditor for the
operators.
1.5.2 LIVE CALLING - SIGNIFICANCE AND METHODOLOGY
The main purpose of live calling is to verify the performance of following parameters by doing test calls
to the subscribers/ specific numbers.
Service Provisioning
Fault incidence/clearance related statistic
Resolution of billing complaints
Response time to customer for assistance
The process of conducting live calling has been stated below.
Let us now discuss the methodology of live calling for each parameter in detail.
1.5.2.1 SERVICE PROVISIONING
Live calling for service provisioning is done to verify the following.
Number of connections provided in 15 days from customer request
Live Calling Process:
Auditors request the operator to provide the database of all the subscribers who requested for a
new connection in one month prior to IMRB auditor visit
The auditors also verify the performance of call center by calling the numbers using operator's wireline network
IMRB auditors then make live calls to a random sample of subscribers from the raw data provided to verify the resolution of complaints
The IMRB auditor visits the operator premises such as main exchanges/ OMC/ customer service center etc. to do live calling. The auditors take the raw data of service provisioning, fault repair, customer complaints (billing) from the the operator's system for the preceding month and also
the list of customer service numbers to be verified through live calling
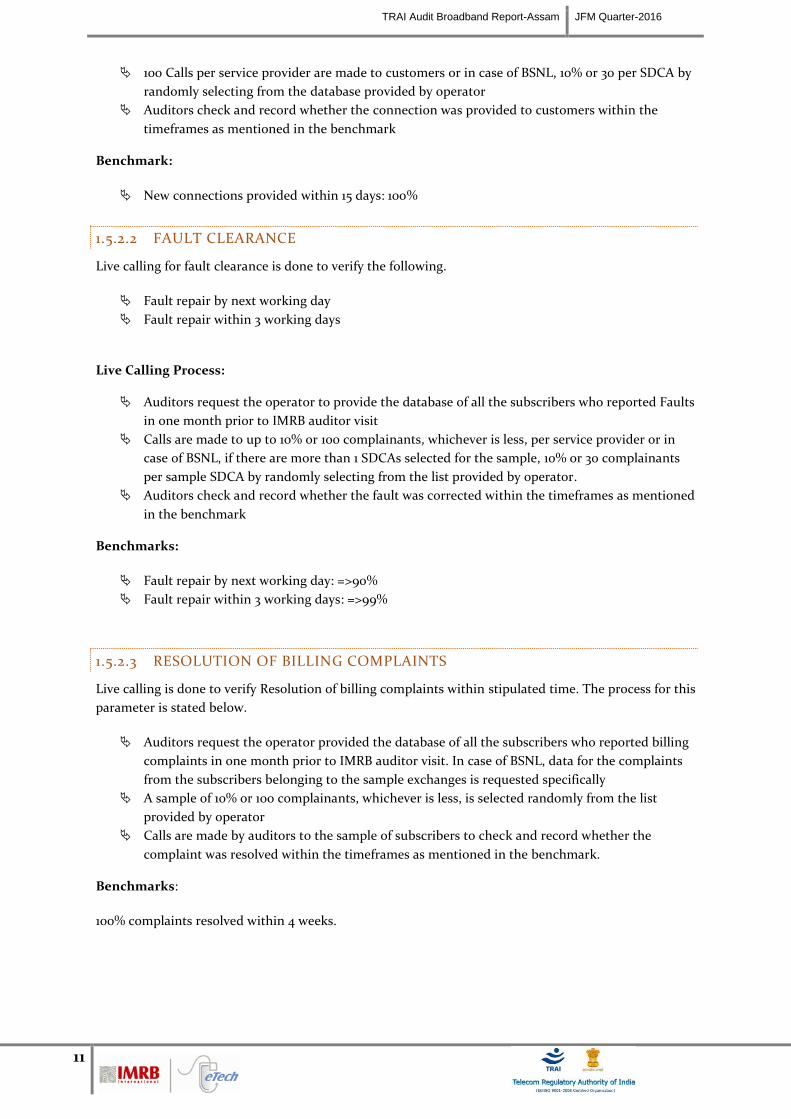
TRAI Audit Broadband Report-Assam JFM Quarter-2016
11
100 Calls per service provider are made to customers or in case of BSNL, 10% or 30 per SDCA by
randomly selecting from the database provided by operator
Auditors check and record whether the connection was provided to customers within the
timeframes as mentioned in the benchmark
Benchmark:
New connections provided within 15 days: 100%
1.5.2.2 FAULT CLEARANCE
Live calling for fault clearance is done to verify the following.
Fault repair by next working day
Fault repair within 3 working days
Live Calling Process:
Auditors request the operator to provide the database of all the subscribers who reported Faults
in one month prior to IMRB auditor visit
Calls are made to up to 10% or 100 complainants, whichever is less, per service provider or in
case of BSNL, if there are more than 1 SDCAs selected for the sample, 10% or 30 complainants
per sample SDCA by randomly selecting from the list provided by operator.
Auditors check and record whether the fault was corrected within the timeframes as mentioned
in the benchmark
Benchmarks:
Fault repair by next working day: =>90%
Fault repair within 3 working days: =>99%
1.5.2.3 RESOLUTION OF BILLING COMPLAINTS
Live calling is done to verify Resolution of billing complaints within stipulated time. The process for this
parameter is stated below.
Auditors request the operator provided the database of all the subscribers who reported billing
complaints in one month prior to IMRB auditor visit. In case of BSNL, data for the complaints
from the subscribers belonging to the sample exchanges is requested specifically
A sample of 10% or 100 complainants, whichever is less, is selected randomly from the list
provided by operator
Calls are made by auditors to the sample of subscribers to check and record whether the
complaint was resolved within the timeframes as mentioned in the benchmark.
Benchmarks:
100% complaints resolved within 4 weeks.
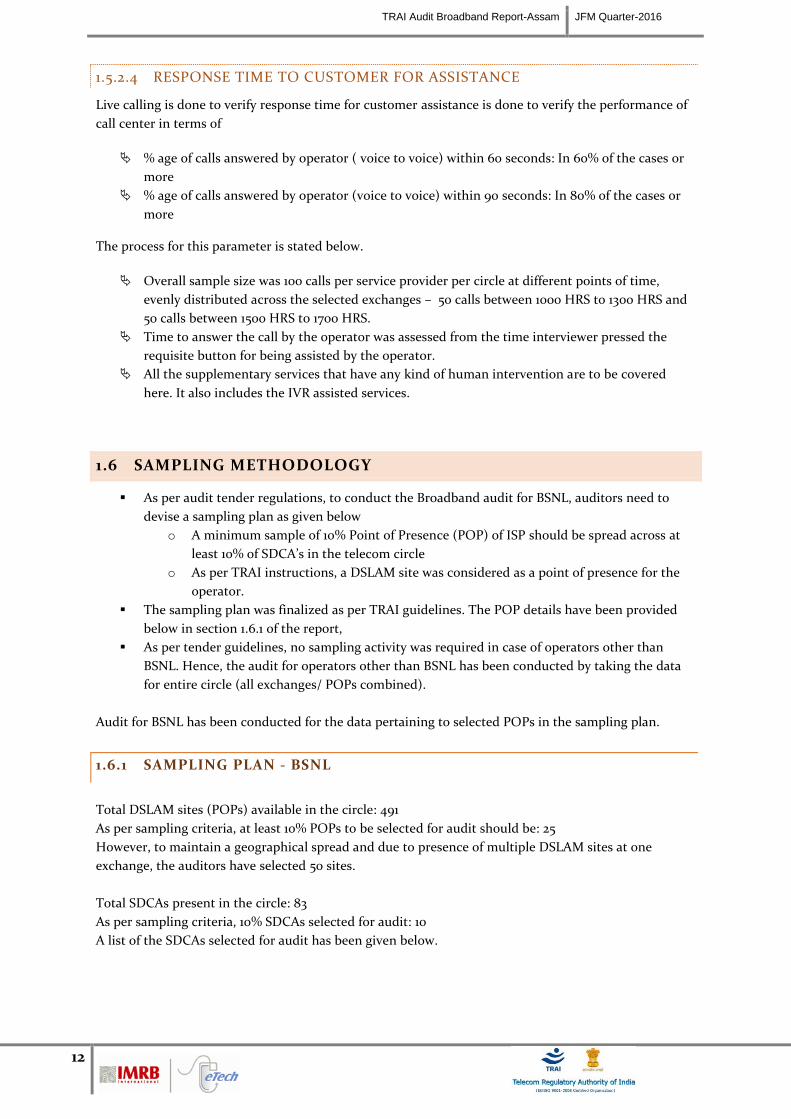
TRAI Audit Broadband Report-Assam JFM Quarter-2016
12
1.5.2.4 RESPONSE TIME TO CUSTOMER FOR ASSISTANCE
Live calling is done to verify response time for customer assistance is done to verify the performance of
call center in terms of
% age of calls answered by operator ( voice to voice) within 60 seconds: In 60% of the cases or
more
% age of calls answered by operator (voice to voice) within 90 seconds: In 80% of the cases or
more
The process for this parameter is stated below.
Overall sample size was 100 calls per service provider per circle at different points of time,
evenly distributed across the selected exchanges – 50 calls between 1000 HRS to 1300 HRS and
50 calls between 1500 HRS to 1700 HRS.
Time to answer the call by the operator was assessed from the time interviewer pressed the
requisite button for being assisted by the operator.
All the supplementary services that have any kind of human intervention are to be covered
here. It also includes the IVR assisted services.
1.6 SAMPLING METHODOLOGY
As per audit tender regulations, to conduct the Broadband audit for BSNL, auditors need to
devise a sampling plan as given below
o A minimum sample of 10% Point of Presence (POP) of ISP should be spread across at
least 10% of SDCA’s in the telecom circle
o As per TRAI instructions, a DSLAM site was considered as a point of presence for the
operator.
The sampling plan was finalized as per TRAI guidelines. The POP details have been provided
below in section 1.6.1 of the report,
As per tender guidelines, no sampling activity was required in case of operators other than
BSNL. Hence, the audit for operators other than BSNL has been conducted by taking the data
for entire circle (all exchanges/ POPs combined).
Audit for BSNL has been conducted for the data pertaining to selected POPs in the sampling plan.
1.6.1 SAMPLING PLAN - BSNL
Total DSLAM sites (POPs) available in the circle: 491
As per sampling criteria, at least 10% POPs to be selected for audit should be: 25
However, to maintain a geographical spread and due to presence of multiple DSLAM sites at one
exchange, the auditors have selected 50 sites.
Total SDCAs present in the circle: 83
As per sampling criteria, 10% SDCAs selected for audit: 10
A list of the SDCAs selected for audit has been given below.
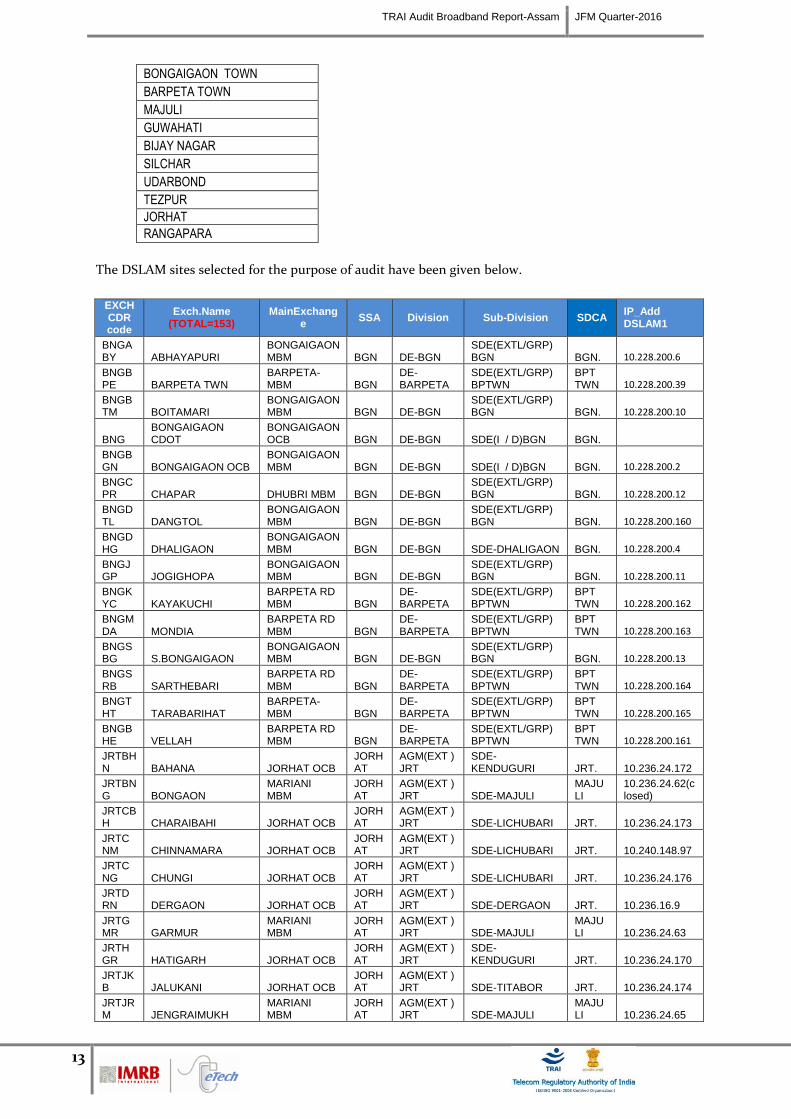
TRAI Audit Broadband Report-Assam JFM Quarter-2016
13
BONGAIGAON TOWN
BARPETA TOWN
MAJULI
GUWAHATI
BIJAY NAGAR
SILCHAR
UDARBOND
TEZPUR
JORHAT
RANGAPARA
The DSLAM sites selected for the purpose of audit have been given below.
EXCH CDR code
Exch.Name (TOTAL=153)
MainExchange
SSA Division Sub-Division SDCA IP_Add DSLAM1
BNGABY ABHAYAPURI
BONGAIGAON MBM BGN DE-BGN
SDE(EXTL/GRP) BGN BGN. 10.228.200.6
BNGBPE BARPETA TWN
BARPETA-MBM BGN
DE-BARPETA
SDE(EXTL/GRP) BPTWN
BPT TWN 10.228.200.39
BNGBTM BOITAMARI
BONGAIGAON MBM BGN DE-BGN
SDE(EXTL/GRP) BGN BGN. 10.228.200.10
BNG BONGAIGAON CDOT
BONGAIGAON OCB BGN DE-BGN SDE(I / D)BGN BGN.
BNGBGN BONGAIGAON OCB
BONGAIGAON MBM BGN DE-BGN SDE(I / D)BGN BGN. 10.228.200.2
BNGCPR CHAPAR DHUBRI MBM BGN DE-BGN
SDE(EXTL/GRP) BGN BGN. 10.228.200.12
BNGDTL DANGTOL
BONGAIGAON MBM BGN DE-BGN
SDE(EXTL/GRP) BGN BGN. 10.228.200.160
BNGDHG DHALIGAON
BONGAIGAON MBM BGN DE-BGN SDE-DHALIGAON BGN. 10.228.200.4
BNGJGP JOGIGHOPA
BONGAIGAON MBM BGN DE-BGN
SDE(EXTL/GRP) BGN BGN. 10.228.200.11
BNGKYC KAYAKUCHI
BARPETA RD MBM BGN
DE-BARPETA
SDE(EXTL/GRP) BPTWN
BPT TWN 10.228.200.162
BNGMDA MONDIA
BARPETA RD MBM BGN
DE-BARPETA
SDE(EXTL/GRP) BPTWN
BPT TWN 10.228.200.163
BNGSBG S.BONGAIGAON
BONGAIGAON MBM BGN DE-BGN
SDE(EXTL/GRP) BGN BGN. 10.228.200.13
BNGSRB SARTHEBARI
BARPETA RD MBM BGN
DE-BARPETA
SDE(EXTL/GRP) BPTWN
BPT TWN 10.228.200.164
BNGTHT TARABARIHAT
BARPETA-MBM BGN
DE-BARPETA
SDE(EXTL/GRP) BPTWN
BPT TWN 10.228.200.165
BNGBHE VELLAH
BARPETA RD MBM BGN
DE-BARPETA
SDE(EXTL/GRP) BPTWN
BPT TWN 10.228.200.161
JRTBHN BAHANA JORHAT OCB
JORHAT
AGM(EXT ) JRT
SDE-KENDUGURI JRT. 10.236.24.172
JRTBNG BONGAON
MARIANI MBM
JORHAT
AGM(EXT ) JRT SDE-MAJULI
MAJULI
10.236.24.62(closed)
JRTCBH CHARAIBAHI JORHAT OCB
JORHAT
AGM(EXT ) JRT SDE-LICHUBARI JRT. 10.236.24.173
JRTCNM CHINNAMARA JORHAT OCB
JORHAT
AGM(EXT ) JRT SDE-LICHUBARI JRT. 10.240.148.97
JRTCNG CHUNGI JORHAT OCB
JORHAT
AGM(EXT ) JRT SDE-LICHUBARI JRT. 10.236.24.176
JRTDRN DERGAON JORHAT OCB
JORHAT
AGM(EXT ) JRT SDE-DERGAON JRT. 10.236.16.9
JRTGMR GARMUR
MARIANI MBM
JORHAT
AGM(EXT ) JRT SDE-MAJULI
MAJULI 10.236.24.63
JRTHGR HATIGARH JORHAT OCB
JORHAT
AGM(EXT ) JRT
SDE-KENDUGURI JRT. 10.236.24.170
JRTJKB JALUKANI JORHAT OCB
JORHAT
AGM(EXT ) JRT SDE-TITABOR JRT. 10.236.24.174
JRTJRM JENGRAIMUKH
MARIANI MBM
JORHAT
AGM(EXT ) JRT SDE-MAJULI
MAJULI 10.236.24.65
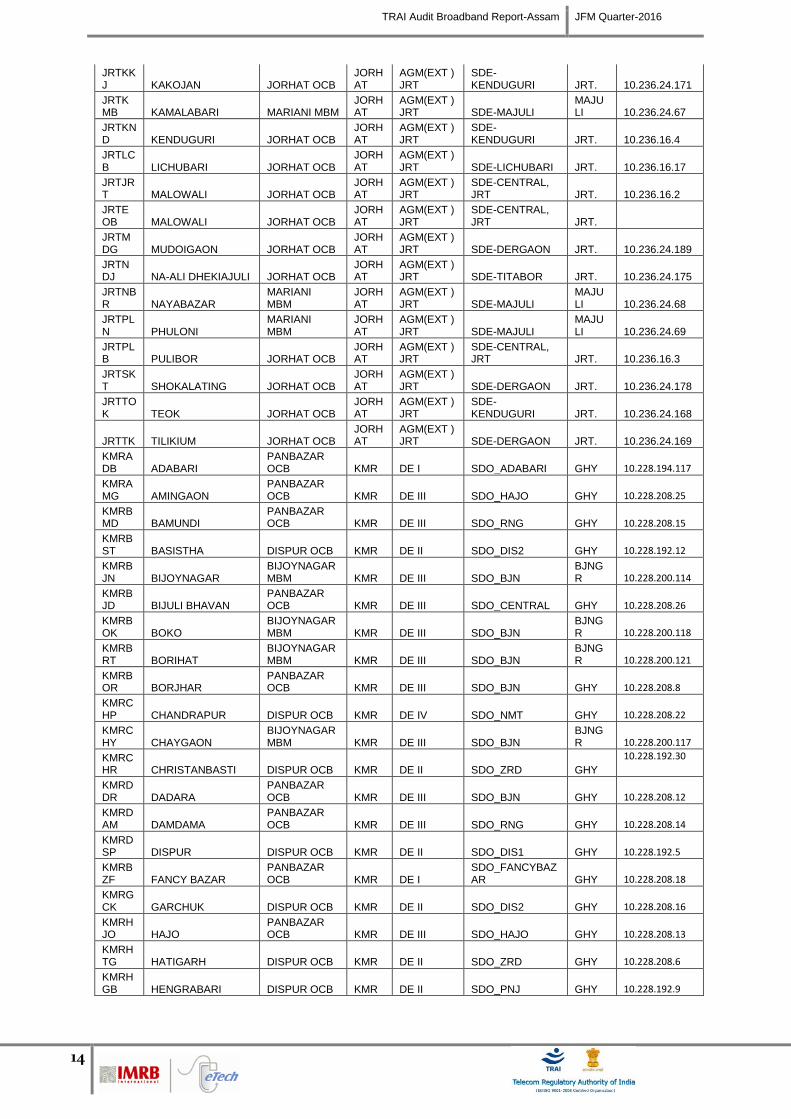
TRAI Audit Broadband Report-Assam JFM Quarter-2016
14
JRTKKJ KAKOJAN JORHAT OCB
JORHAT
AGM(EXT ) JRT
SDE-KENDUGURI JRT. 10.236.24.171
JRTKMB KAMALABARI MARIANI MBM
JORHAT
AGM(EXT ) JRT SDE-MAJULI
MAJULI 10.236.24.67
JRTKND KENDUGURI JORHAT OCB
JORHAT
AGM(EXT ) JRT
SDE-KENDUGURI JRT. 10.236.16.4
JRTLCB LICHUBARI JORHAT OCB
JORHAT
AGM(EXT ) JRT SDE-LICHUBARI JRT. 10.236.16.17
JRTJRT MALOWALI JORHAT OCB
JORHAT
AGM(EXT ) JRT
SDE-CENTRAL, JRT JRT. 10.236.16.2
JRTEOB MALOWALI JORHAT OCB
JORHAT
AGM(EXT ) JRT
SDE-CENTRAL, JRT JRT.
JRTMDG MUDOIGAON JORHAT OCB
JORHAT
AGM(EXT ) JRT SDE-DERGAON JRT. 10.236.24.189
JRTNDJ NA-ALI DHEKIAJULI JORHAT OCB
JORHAT
AGM(EXT ) JRT SDE-TITABOR JRT. 10.236.24.175
JRTNBR NAYABAZAR
MARIANI MBM
JORHAT
AGM(EXT ) JRT SDE-MAJULI
MAJULI 10.236.24.68
JRTPLN PHULONI
MARIANI MBM
JORHAT
AGM(EXT ) JRT SDE-MAJULI
MAJULI 10.236.24.69
JRTPLB PULIBOR JORHAT OCB
JORHAT
AGM(EXT ) JRT
SDE-CENTRAL, JRT JRT. 10.236.16.3
JRTSKT SHOKALATING JORHAT OCB
JORHAT
AGM(EXT ) JRT SDE-DERGAON JRT. 10.236.24.178
JRTTOK TEOK JORHAT OCB
JORHAT
AGM(EXT ) JRT
SDE-KENDUGURI JRT. 10.236.24.168
JRTTK TILIKIUM JORHAT OCB JORHAT
AGM(EXT ) JRT SDE-DERGAON JRT. 10.236.24.169
KMRADB ADABARI
PANBAZAR OCB KMR DE I SDO_ADABARI GHY 10.228.194.117
KMRAMG AMINGAON
PANBAZAR OCB KMR DE III SDO_HAJO GHY 10.228.208.25
KMRBMD BAMUNDI
PANBAZAR OCB KMR DE III SDO_RNG GHY 10.228.208.15
KMRBST BASISTHA DISPUR OCB KMR DE II SDO_DIS2 GHY 10.228.192.12
KMRBJN BIJOYNAGAR
BIJOYNAGAR MBM KMR DE III SDO_BJN
BJNGR 10.228.200.114
KMRBJD BIJULI BHAVAN
PANBAZAR OCB KMR DE III SDO_CENTRAL GHY 10.228.208.26
KMRBOK BOKO
BIJOYNAGAR MBM KMR DE III SDO_BJN
BJNGR 10.228.200.118
KMRBRT BORIHAT
BIJOYNAGAR MBM KMR DE III SDO_BJN
BJNGR 10.228.200.121
KMRBOR BORJHAR
PANBAZAR OCB KMR DE III SDO_BJN GHY 10.228.208.8
KMRCHP CHANDRAPUR DISPUR OCB KMR DE IV SDO_NMT GHY 10.228.208.22
KMRCHY CHAYGAON
BIJOYNAGAR MBM KMR DE III SDO_BJN
BJNGR 10.228.200.117
KMRCHR CHRISTANBASTI DISPUR OCB KMR DE II SDO_ZRD GHY
10.228.192.30
KMRDDR DADARA
PANBAZAR OCB KMR DE III SDO_BJN GHY 10.228.208.12
KMRDAM DAMDAMA
PANBAZAR OCB KMR DE III SDO_RNG GHY 10.228.208.14
KMRDSP DISPUR DISPUR OCB KMR DE II SDO_DIS1 GHY 10.228.192.5
KMRBZF FANCY BAZAR
PANBAZAR OCB KMR DE I
SDO_FANCYBAZAR GHY 10.228.208.18
KMRGCK GARCHUK DISPUR OCB KMR DE II SDO_DIS2 GHY 10.228.208.16
KMRHJO HAJO
PANBAZAR OCB KMR DE III SDO_HAJO GHY 10.228.208.13
KMRHTG HATIGARH DISPUR OCB KMR DE II SDO_ZRD GHY 10.228.208.6
KMRHGB HENGRABARI DISPUR OCB KMR DE II SDO_PNJ GHY 10.228.192.9
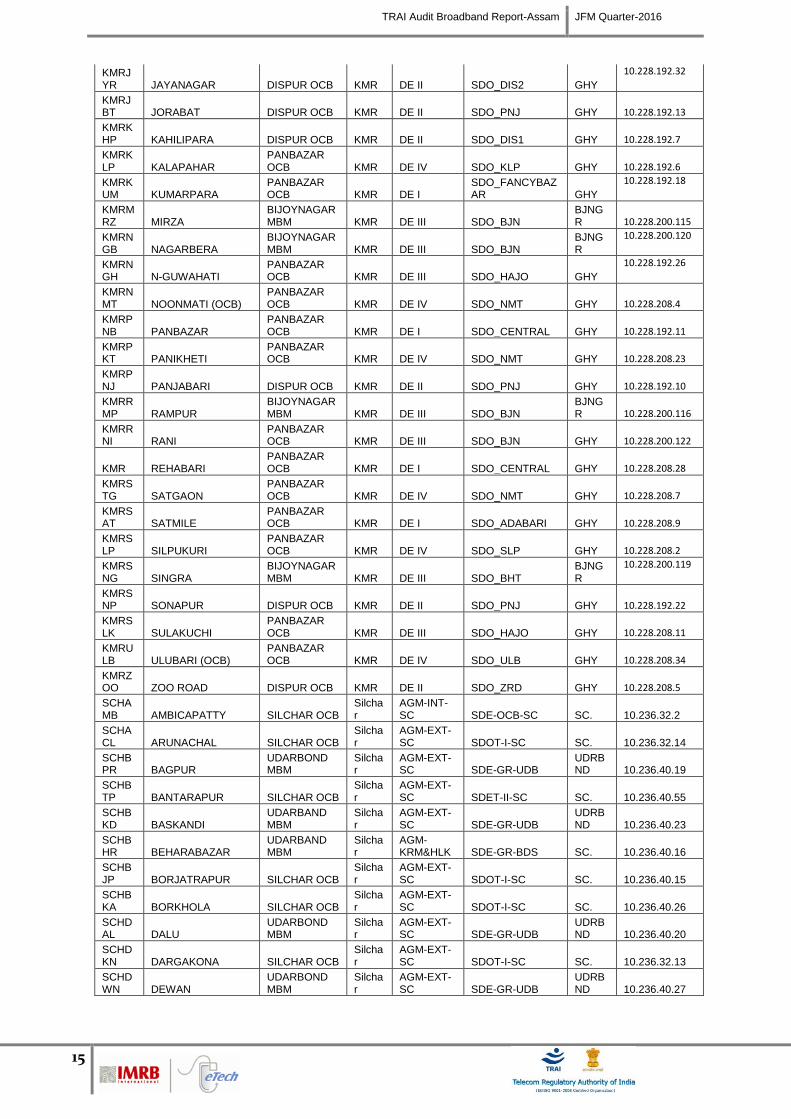
TRAI Audit Broadband Report-Assam JFM Quarter-2016
15
KMRJYR JAYANAGAR DISPUR OCB KMR DE II SDO_DIS2 GHY
10.228.192.32
KMRJBT JORABAT DISPUR OCB KMR DE II SDO_PNJ GHY 10.228.192.13
KMRKHP KAHILIPARA DISPUR OCB KMR DE II SDO_DIS1 GHY 10.228.192.7
KMRKLP KALAPAHAR
PANBAZAR OCB KMR DE IV SDO_KLP GHY 10.228.192.6
KMRKUM KUMARPARA
PANBAZAR OCB KMR DE I
SDO_FANCYBAZAR GHY
10.228.192.18
KMRMRZ MIRZA
BIJOYNAGAR MBM KMR DE III SDO_BJN
BJNGR 10.228.200.115
KMRNGB NAGARBERA
BIJOYNAGAR MBM KMR DE III SDO_BJN
BJNGR
10.228.200.120
KMRNGH N-GUWAHATI
PANBAZAR OCB KMR DE III SDO_HAJO GHY
10.228.192.26
KMRNMT NOONMATI (OCB)
PANBAZAR OCB KMR DE IV SDO_NMT GHY 10.228.208.4
KMRPNB PANBAZAR
PANBAZAR OCB KMR DE I SDO_CENTRAL GHY 10.228.192.11
KMRPKT PANIKHETI
PANBAZAR OCB KMR DE IV SDO_NMT GHY 10.228.208.23
KMRPNJ PANJABARI DISPUR OCB KMR DE II SDO_PNJ GHY 10.228.192.10
KMRRMP RAMPUR
BIJOYNAGAR MBM KMR DE III SDO_BJN
BJNGR 10.228.200.116
KMRRNI RANI
PANBAZAR OCB KMR DE III SDO_BJN GHY 10.228.200.122
KMR REHABARI PANBAZAR OCB KMR DE I SDO_CENTRAL GHY 10.228.208.28
KMRSTG SATGAON
PANBAZAR OCB KMR DE IV SDO_NMT GHY 10.228.208.7
KMRSAT SATMILE
PANBAZAR OCB KMR DE I SDO_ADABARI GHY 10.228.208.9
KMRSLP SILPUKURI
PANBAZAR OCB KMR DE IV SDO_SLP GHY 10.228.208.2
KMRSNG SINGRA
BIJOYNAGAR MBM KMR DE III SDO_BHT
BJNGR
10.228.200.119
KMRSNP SONAPUR DISPUR OCB KMR DE II SDO_PNJ GHY 10.228.192.22
KMRSLK SULAKUCHI
PANBAZAR OCB KMR DE III SDO_HAJO GHY 10.228.208.11
KMRULB ULUBARI (OCB)
PANBAZAR OCB KMR DE IV SDO_ULB GHY 10.228.208.34
KMRZOO ZOO ROAD DISPUR OCB KMR DE II SDO_ZRD GHY 10.228.208.5
SCHAMB AMBICAPATTY SILCHAR OCB
Silchar
AGM-INT-SC SDE-OCB-SC SC. 10.236.32.2
SCHACL ARUNACHAL SILCHAR OCB
Silchar
AGM-EXT-SC SDOT-I-SC SC. 10.236.32.14
SCHBPR BAGPUR
UDARBOND MBM
Silchar
AGM-EXT-SC SDE-GR-UDB
UDRBND 10.236.40.19
SCHBTP BANTARAPUR SILCHAR OCB
Silchar
AGM-EXT-SC SDET-II-SC SC. 10.236.40.55
SCHBKD BASKANDI
UDARBAND MBM
Silchar
AGM-EXT-SC SDE-GR-UDB
UDRBND 10.236.40.23
SCHBHR BEHARABAZAR
UDARBAND MBM
Silchar
AGM-KRM&HLK SDE-GR-BDS SC. 10.236.40.16
SCHBJP BORJATRAPUR SILCHAR OCB
Silchar
AGM-EXT-SC SDOT-I-SC SC. 10.236.40.15
SCHBKA BORKHOLA SILCHAR OCB
Silchar
AGM-EXT-SC SDOT-I-SC SC. 10.236.40.26
SCHDAL DALU
UDARBOND MBM
Silchar
AGM-EXT-SC SDE-GR-UDB
UDRBND 10.236.40.20
SCHDKN DARGAKONA SILCHAR OCB
Silchar
AGM-EXT-SC SDOT-I-SC SC. 10.236.32.13
SCHDWN DEWAN
UDARBOND MBM
Silchar
AGM-EXT-SC SDE-GR-UDB
UDRBND 10.236.40.27
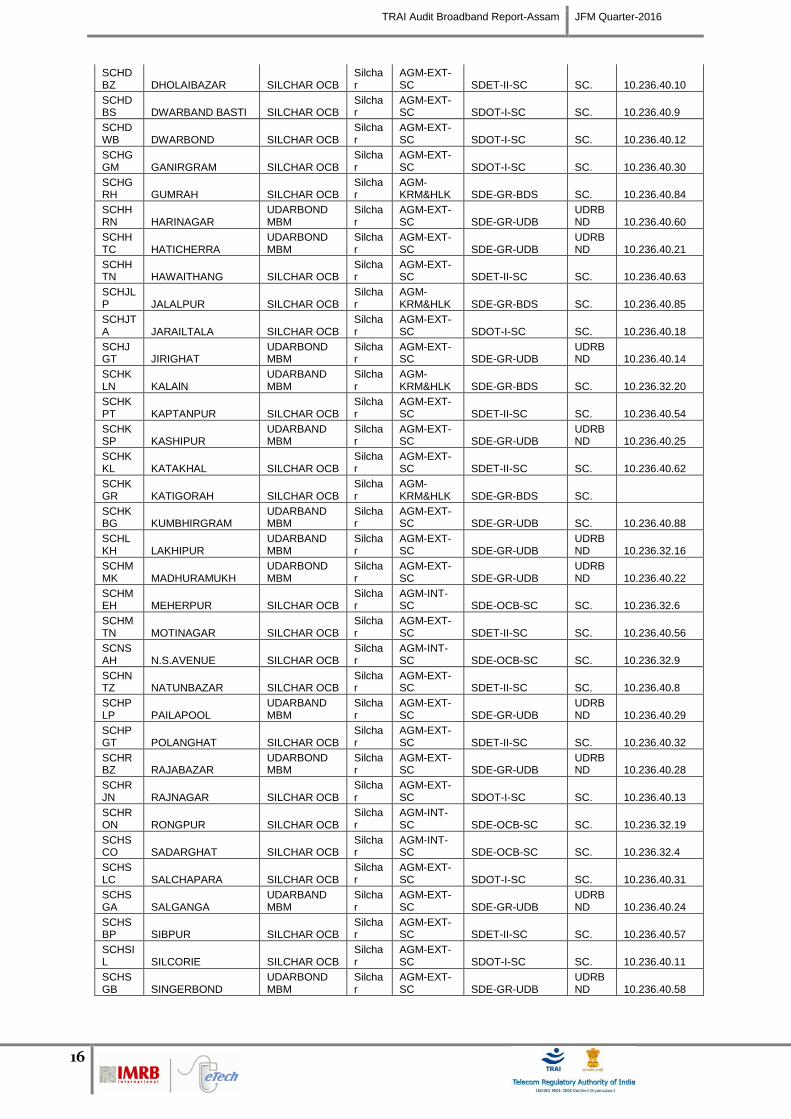
TRAI Audit Broadband Report-Assam JFM Quarter-2016
16
SCHDBZ DHOLAIBAZAR SILCHAR OCB
Silchar
AGM-EXT-SC SDET-II-SC SC. 10.236.40.10
SCHDBS DWARBAND BASTI SILCHAR OCB
Silchar
AGM-EXT-SC SDOT-I-SC SC. 10.236.40.9
SCHDWB DWARBOND SILCHAR OCB
Silchar
AGM-EXT-SC SDOT-I-SC SC. 10.236.40.12
SCHGGM GANIRGRAM SILCHAR OCB
Silchar
AGM-EXT-SC SDOT-I-SC SC. 10.236.40.30
SCHGRH GUMRAH SILCHAR OCB
Silchar
AGM-KRM&HLK SDE-GR-BDS SC. 10.236.40.84
SCHHRN HARINAGAR
UDARBOND MBM
Silchar
AGM-EXT-SC SDE-GR-UDB
UDRBND 10.236.40.60
SCHHTC HATICHERRA
UDARBOND MBM
Silchar
AGM-EXT-SC SDE-GR-UDB
UDRBND 10.236.40.21
SCHHTN HAWAITHANG SILCHAR OCB
Silchar
AGM-EXT-SC SDET-II-SC SC. 10.236.40.63
SCHJLP JALALPUR SILCHAR OCB
Silchar
AGM-KRM&HLK SDE-GR-BDS SC. 10.236.40.85
SCHJTA JARAILTALA SILCHAR OCB
Silchar
AGM-EXT-SC SDOT-I-SC SC. 10.236.40.18
SCHJGT JIRIGHAT
UDARBOND MBM
Silchar
AGM-EXT-SC SDE-GR-UDB
UDRBND 10.236.40.14
SCHKLN KALAlN
UDARBAND MBM
Silchar
AGM-KRM&HLK SDE-GR-BDS SC. 10.236.32.20
SCHKPT KAPTANPUR SILCHAR OCB
Silchar
AGM-EXT-SC SDET-II-SC SC. 10.236.40.54
SCHKSP KASHIPUR
UDARBAND MBM
Silchar
AGM-EXT-SC SDE-GR-UDB
UDRBND 10.236.40.25
SCHKKL KATAKHAL SILCHAR OCB
Silchar
AGM-EXT-SC SDET-II-SC SC. 10.236.40.62
SCHKGR KATIGORAH SILCHAR OCB
Silchar
AGM-KRM&HLK SDE-GR-BDS SC.
SCHKBG KUMBHIRGRAM
UDARBAND MBM
Silchar
AGM-EXT-SC SDE-GR-UDB SC. 10.236.40.88
SCHLKH LAKHIPUR
UDARBAND MBM
Silchar
AGM-EXT-SC SDE-GR-UDB
UDRBND 10.236.32.16
SCHMMK MADHURAMUKH
UDARBOND MBM
Silchar
AGM-EXT-SC SDE-GR-UDB
UDRBND 10.236.40.22
SCHMEH MEHERPUR SILCHAR OCB
Silchar
AGM-INT-SC SDE-OCB-SC SC. 10.236.32.6
SCHMTN MOTINAGAR SILCHAR OCB
Silchar
AGM-EXT-SC SDET-II-SC SC. 10.236.40.56
SCNSAH N.S.AVENUE SILCHAR OCB
Silchar
AGM-INT-SC SDE-OCB-SC SC. 10.236.32.9
SCHNTZ NATUNBAZAR SILCHAR OCB
Silchar
AGM-EXT-SC SDET-II-SC SC. 10.236.40.8
SCHPLP PAILAPOOL
UDARBAND MBM
Silchar
AGM-EXT-SC SDE-GR-UDB
UDRBND 10.236.40.29
SCHPGT POLANGHAT SILCHAR OCB
Silchar
AGM-EXT-SC SDET-II-SC SC. 10.236.40.32
SCHRBZ RAJABAZAR
UDARBOND MBM
Silchar
AGM-EXT-SC SDE-GR-UDB
UDRBND 10.236.40.28
SCHRJN RAJNAGAR SILCHAR OCB
Silchar
AGM-EXT-SC SDOT-I-SC SC. 10.236.40.13
SCHRON RONGPUR SILCHAR OCB
Silchar
AGM-INT-SC SDE-OCB-SC SC. 10.236.32.19
SCHSCO SADARGHAT SILCHAR OCB
Silchar
AGM-INT-SC SDE-OCB-SC SC. 10.236.32.4
SCHSLC SALCHAPARA SILCHAR OCB
Silchar
AGM-EXT-SC SDOT-I-SC SC. 10.236.40.31
SCHSGA SALGANGA
UDARBAND MBM
Silchar
AGM-EXT-SC SDE-GR-UDB
UDRBND 10.236.40.24
SCHSBP SIBPUR SILCHAR OCB
Silchar
AGM-EXT-SC SDET-II-SC SC. 10.236.40.57
SCHSIL SILCORIE SILCHAR OCB
Silchar
AGM-EXT-SC SDOT-I-SC SC. 10.236.40.11
SCHSGB SINGERBOND
UDARBOND MBM
Silchar
AGM-EXT-SC SDE-GR-UDB
UDRBND 10.236.40.58
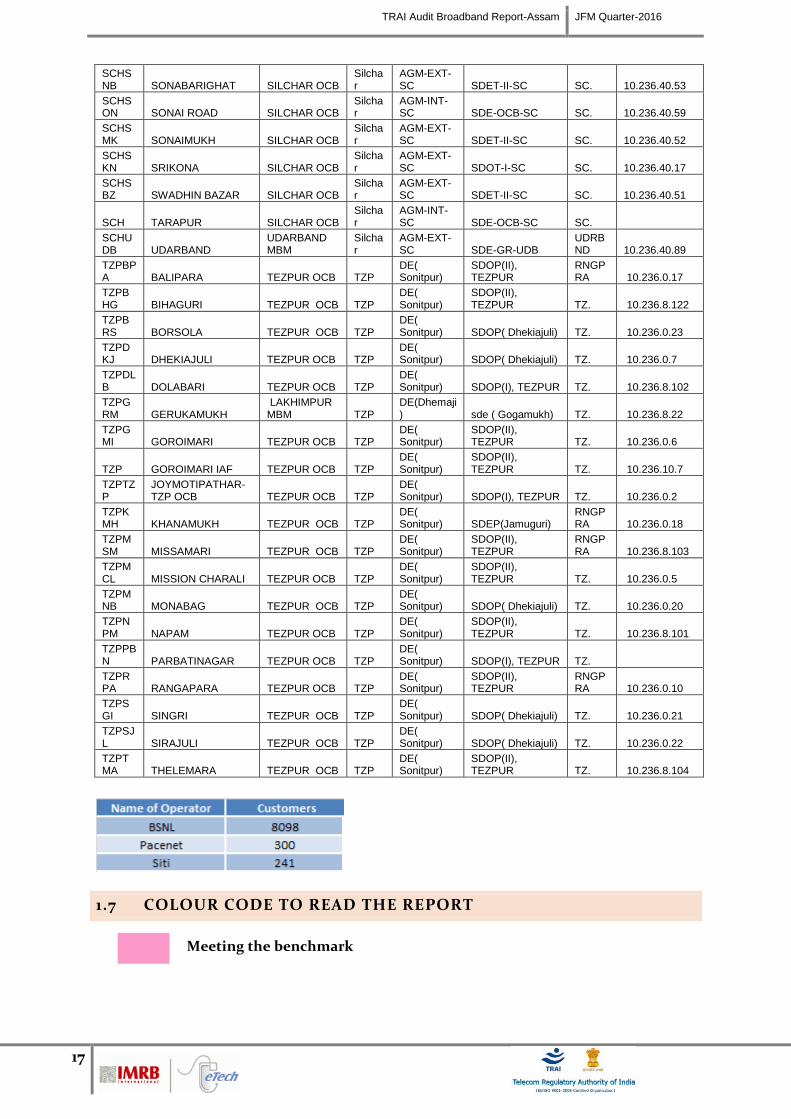
TRAI Audit Broadband Report-Assam JFM Quarter-2016
17
SCHSNB SONABARIGHAT SILCHAR OCB
Silchar
AGM-EXT-SC SDET-II-SC SC. 10.236.40.53
SCHSON SONAI ROAD SILCHAR OCB
Silchar
AGM-INT-SC SDE-OCB-SC SC. 10.236.40.59
SCHSMK SONAIMUKH SILCHAR OCB
Silchar
AGM-EXT-SC SDET-II-SC SC. 10.236.40.52
SCHSKN SRIKONA SILCHAR OCB
Silchar
AGM-EXT-SC SDOT-I-SC SC. 10.236.40.17
SCHSBZ SWADHIN BAZAR SILCHAR OCB
Silchar
AGM-EXT-SC SDET-II-SC SC. 10.236.40.51
SCH TARAPUR SILCHAR OCB Silchar
AGM-INT-SC SDE-OCB-SC SC.
SCHUDB UDARBAND
UDARBAND MBM
Silchar
AGM-EXT-SC SDE-GR-UDB
UDRBND 10.236.40.89
TZPBPA BALIPARA TEZPUR OCB TZP
DE( Sonitpur)
SDOP(II), TEZPUR
RNGPRA 10.236.0.17
TZPBHG BIHAGURI TEZPUR OCB TZP
DE( Sonitpur)
SDOP(II), TEZPUR TZ. 10.236.8.122
TZPBRS BORSOLA TEZPUR OCB TZP
DE( Sonitpur) SDOP( Dhekiajuli) TZ. 10.236.0.23
TZPDKJ DHEKIAJULI TEZPUR OCB TZP
DE( Sonitpur) SDOP( Dhekiajuli) TZ. 10.236.0.7
TZPDLB DOLABARI TEZPUR OCB TZP
DE( Sonitpur) SDOP(I), TEZPUR TZ. 10.236.8.102
TZPGRM GERUKAMUKH
LAKHIMPUR MBM TZP
DE(Dhemaji) sde ( Gogamukh) TZ. 10.236.8.22
TZPGMI GOROIMARI TEZPUR OCB TZP
DE( Sonitpur)
SDOP(II), TEZPUR TZ. 10.236.0.6
TZP GOROIMARI IAF TEZPUR OCB TZP DE( Sonitpur)
SDOP(II), TEZPUR TZ. 10.236.10.7
TZPTZP
JOYMOTIPATHAR-TZP OCB TEZPUR OCB TZP
DE( Sonitpur) SDOP(I), TEZPUR TZ. 10.236.0.2
TZPKMH KHANAMUKH TEZPUR OCB TZP
DE( Sonitpur) SDEP(Jamuguri)
RNGPRA 10.236.0.18
TZPMSM MISSAMARI TEZPUR OCB TZP
DE( Sonitpur)
SDOP(II), TEZPUR
RNGPRA 10.236.8.103
TZPMCL MISSION CHARALI TEZPUR OCB TZP
DE( Sonitpur)
SDOP(II), TEZPUR TZ. 10.236.0.5
TZPMNB MONABAG TEZPUR OCB TZP
DE( Sonitpur) SDOP( Dhekiajuli) TZ. 10.236.0.20
TZPNPM NAPAM TEZPUR OCB TZP
DE( Sonitpur)
SDOP(II), TEZPUR TZ. 10.236.8.101
TZPPBN PARBATINAGAR TEZPUR OCB TZP
DE( Sonitpur) SDOP(I), TEZPUR TZ.
TZPRPA RANGAPARA TEZPUR OCB TZP
DE( Sonitpur)
SDOP(II), TEZPUR
RNGPRA 10.236.0.10
TZPSGI SINGRI TEZPUR OCB TZP
DE( Sonitpur) SDOP( Dhekiajuli) TZ. 10.236.0.21
TZPSJL SIRAJULI TEZPUR OCB TZP
DE( Sonitpur) SDOP( Dhekiajuli) TZ. 10.236.0.22
TZPTMA THELEMARA TEZPUR OCB TZP
DE( Sonitpur)
SDOP(II), TEZPUR TZ. 10.236.8.104
1.7 COLOUR CODE TO READ THE REPORT
Not Meeting the benchmark
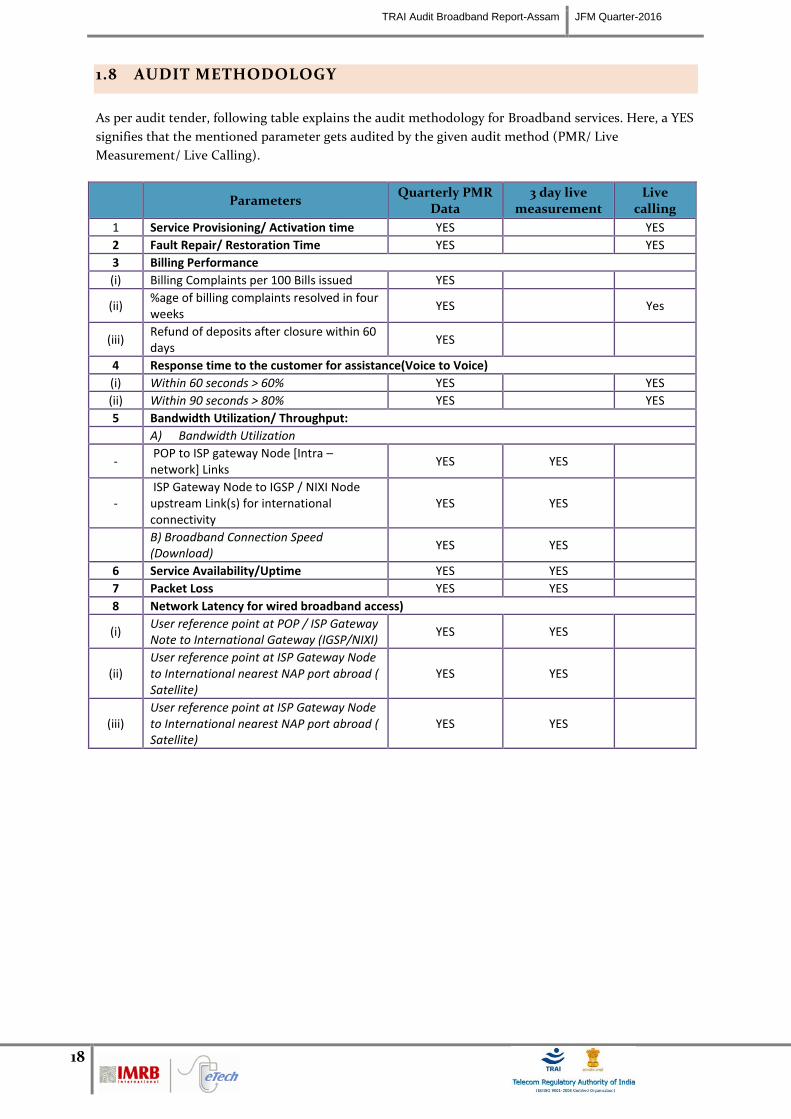
TRAI Audit Broadband Report-Assam JFM Quarter-2016
18
1.8 AUDIT METHODOLOGY
As per audit tender, following table explains the audit methodology for Broadband services. Here, a YES
signifies that the mentioned parameter gets audited by the given audit method (PMR/ Live
Measurement/ Live Calling).
Parameters Quarterly PMR
Data 3 day live
measurement Live
calling
1 Service Provisioning/ Activation time YES YES
2 Fault Repair/ Restoration Time YES YES
3 Billing Performance
(i) Billing Complaints per 100 Bills issued YES
(ii) %age of billing complaints resolved in four weeks
YES Yes
(iii) Refund of deposits after closure within 60 days
YES
4 Response time to the customer for assistance(Voice to Voice)
(i) Within 60 seconds > 60% YES YES
(ii) Within 90 seconds > 80% YES YES
5 Bandwidth Utilization/ Throughput:
A) Bandwidth Utilization
- POP to ISP gateway Node [Intra – network] Links
YES YES
- ISP Gateway Node to IGSP / NIXI Node upstream Link(s) for international connectivity
YES YES
B) Broadband Connection Speed (Download)
YES YES
6 Service Availability/Uptime YES YES
7 Packet Loss YES YES
8 Network Latency for wired broadband access)
(i) User reference point at POP / ISP Gateway Note to International Gateway (IGSP/NIXI)
YES YES
(ii) User reference point at ISP Gateway Node to International nearest NAP port abroad ( Satellite)
YES YES
(iii) User reference point at ISP Gateway Node to International nearest NAP port abroad ( Satellite)
YES YES
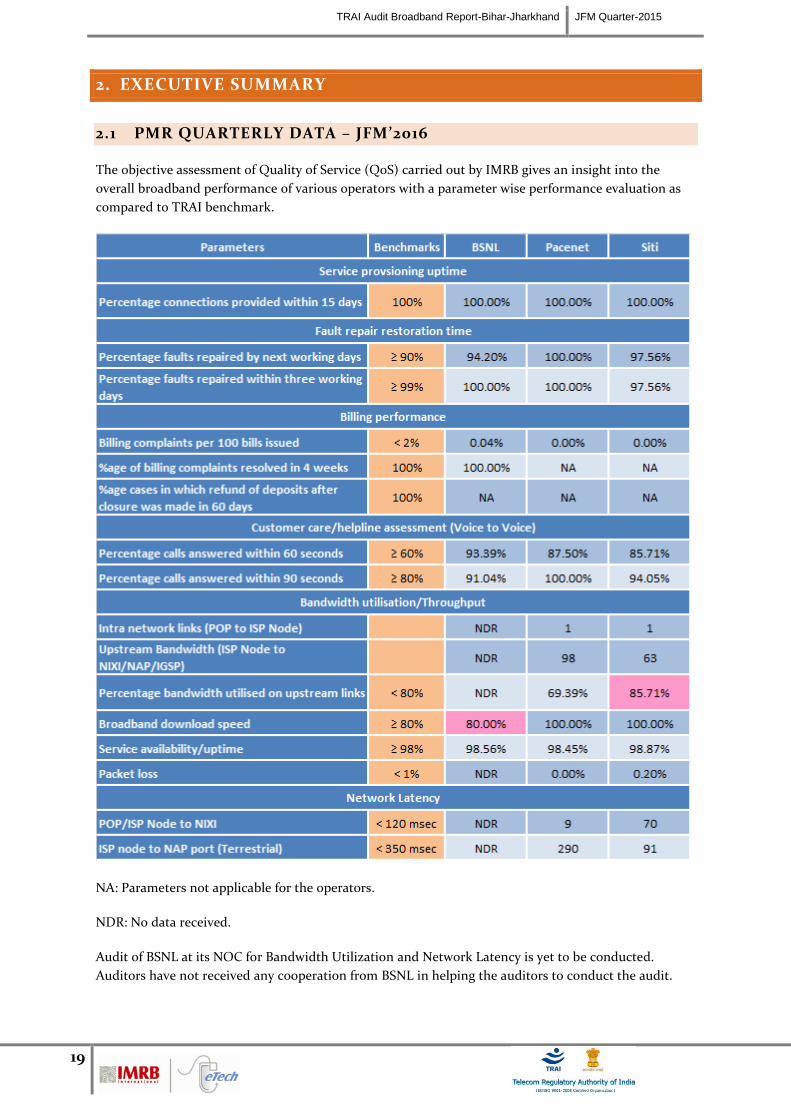
TRAI Audit Broadband Report-Bihar-Jharkhand JFM Quarter-2015
19
2. EXECUTIVE SUMMARY
2.1 PMR QUARTERLY DATA – JFM’2016
The objective assessment of Quality of Service (QoS) carried out by IMRB gives an insight into the
overall broadband performance of various operators with a parameter wise performance evaluation as
compared to TRAI benchmark.
NA: Parameters not applicable for the operators.
NDR: No data received.
Audit of BSNL at its NOC for Bandwidth Utilization and Network Latency is yet to be conducted.
Auditors have not received any cooperation from BSNL in helping the auditors to conduct the audit.
TRAI Audit Broadband Report-Assam JFM Quarter-2016
20
Following are the parameter wise observations for the operators in Assam circle.
2.1.1 SERVICE PROVISIONING/ ACTIVATION TIME
As per audit, all operators met the benchmark for providing new connections within 15 days.
2.1.2 FAULT REPAIR/ RESTORATION
The benchmark of repairing 90% faults within the next day and 99% faults within next three days of
receiving complaints was met by all operators.
2.1.3 BILLING PERFORMANCE
As per audit, all operators met the benchmark for metering and billing credibility. BSNL met the
benchmark for resolution of billing complaints within 4 weeks
NA: Subscribers of Broadband Pacenet and Siti Cable did not log any billing complaints. Hence,
resolution of billing complaints is not applicable for the operators.
None of the operators had any billing dispute that required a refund.
2.1.4 RESPONSE TIME TO CUSTOMER FOR ASSISTANCE
All operators met the benchmark for answering 60% calls within 60 seconds and 80% calls within 90
seconds as per audit.
2.1.5 BANDWIDTH UTILIZATION AND THROUGHPUT
Siti cable failed to meet the benchmark for bandwidth utilized on upstream links during audit.
All operators met the benchmark for service availability time as per audit.
NDR: No data has been received for these parameters from BSNL.
2.1.6 NETWORK LATENCY
All operators met the benchmark for Network Latency parameters.
NDR: No data has been received for these parameters from BSNL.
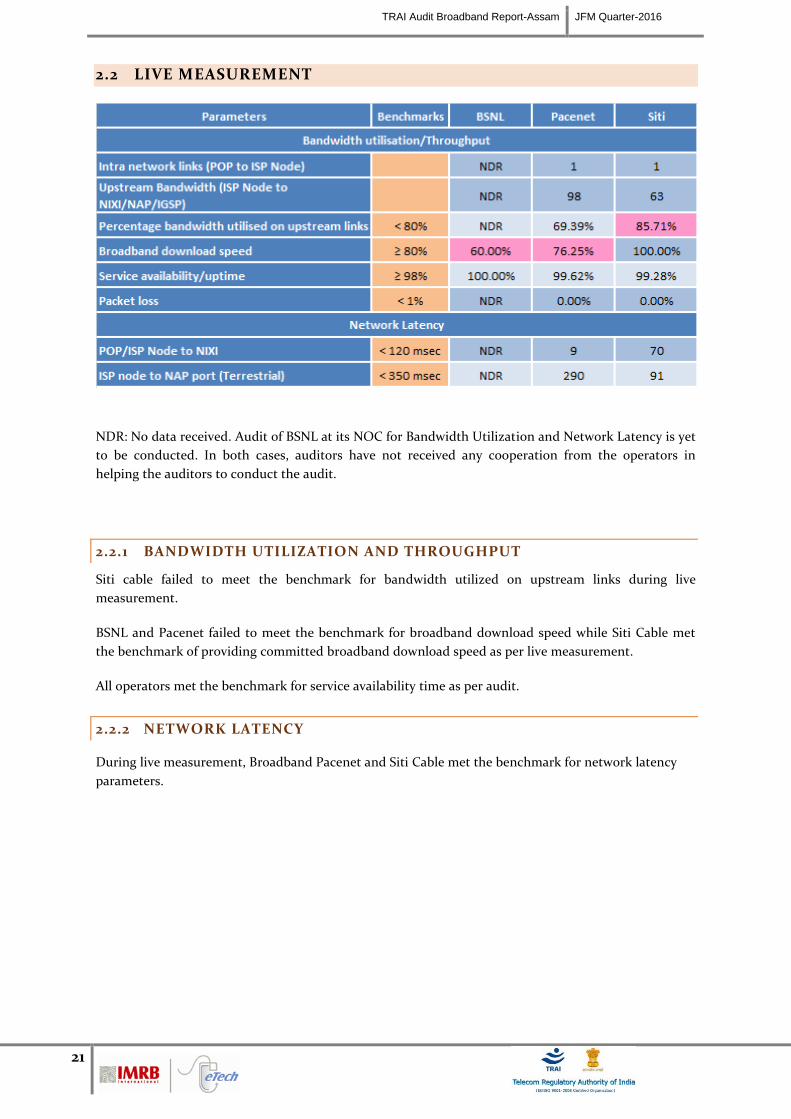
TRAI Audit Broadband Report-Assam JFM Quarter-2016
21
2.2 LIVE MEASUREMENT
NDR: No data received. Audit of BSNL at its NOC for Bandwidth Utilization and Network Latency is yet
to be conducted. In both cases, auditors have not received any cooperation from the operators in
helping the auditors to conduct the audit.
2.2.1 BANDWIDTH UTILIZATION AND THROUGHPUT
Siti cable failed to meet the benchmark for bandwidth utilized on upstream links during live
measurement.
BSNL and Pacenet failed to meet the benchmark for broadband download speed while Siti Cable met
the benchmark of providing committed broadband download speed as per live measurement.
All operators met the benchmark for service availability time as per audit.
2.2.2 NETWORK LATENCY
During live measurement, Broadband Pacenet and Siti Cable met the benchmark for network latency
parameters.
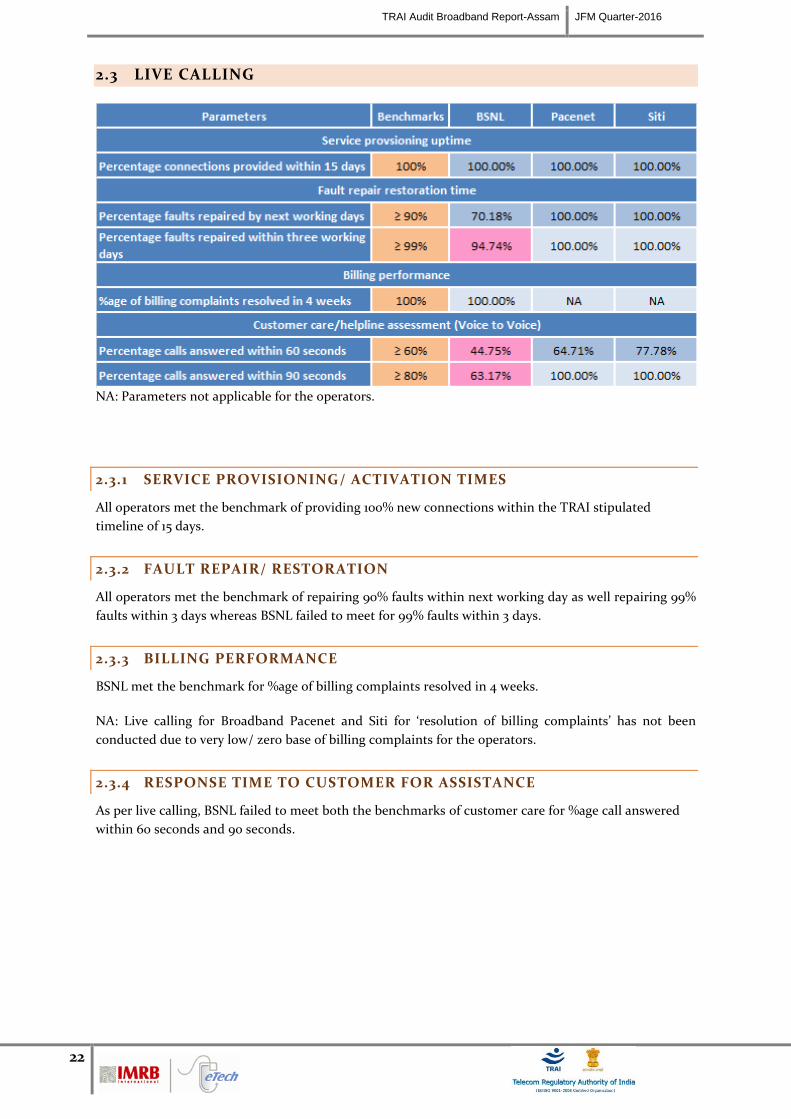
TRAI Audit Broadband Report-Assam JFM Quarter-2016
22
2.3 LIVE CALLING
NA: Parameters not applicable for the operators.
2.3.1 SERVICE PROVISIONING/ ACTIVATION TIMES
All operators met the benchmark of providing 100% new connections within the TRAI stipulated
timeline of 15 days.
2.3.2 FAULT REPAIR/ RESTORATION
All operators met the benchmark of repairing 90% faults within next working day as well repairing 99%
faults within 3 days whereas BSNL failed to meet for 99% faults within 3 days.
2.3.3 BILLING PERFORMANCE
BSNL met the benchmark for %age of billing complaints resolved in 4 weeks.
NA: Live calling for Broadband Pacenet and Siti for ‘resolution of billing complaints’ has not been
conducted due to very low/ zero base of billing complaints for the operators.
2.3.4 RESPONSE TIME TO CUSTOMER FOR ASSISTANCE
As per live calling, BSNL failed to meet both the benchmarks of customer care for %age call answered
within 60 seconds and 90 seconds.
TRAI Audit Broadband Report-Assam JFM Quarter-2016
23
3. CRITICAL FINDINGS
Service Provisioning/ Activation Time
As per audit, all operators met the benchmark for providing new connections within 15 days.
Fault Repair/ Restoration
The benchmark of repairing 90% faults within the next day and 99% faults within next three days of
receiving complaints was met by all operators. However during live calling BSNL failed to meet the
benchmark for fault repaired within 3days.
Billing Performance
As per audit, all operators met the benchmark for metering and billing credibility. BSNL met the
benchmark for resolution of billing complaints within 4 weeks
NA: Subscribers of Broadband Pacenet and Siti Cable did not log any billing complaints. Hence,
resolution of billing complaints is not applicable for the operators.
None of the operators had any billing dispute that required a refund.
Response time to customer for assistance
All operators met the benchmark for answering 60% calls within 60 seconds and 80% calls within 90
seconds as per audit. However during live calling BSNL failed to meet the benchmark of customer care
for %age call answered within 60 seconds and 90 seconds.
Bandwidth Utilization and Throughput
Siti cable failed to meet the benchmark for bandwidth utilized on upstream links during live
measurement.
BSNL and Pacenet failed to meet the benchmark for broadband download speed while Siti Cable met
the benchmark of providing committed broadband download speed as per live measurement.
All operators met the benchmark for service availability time as per audit.
TRAI Audit Broadband Report-Bihar-Jharkhand JFM Quarter-2015
24
4. DETAILED FINDINGS - COMPARISON BETWEEN PMR DATA
AND LIVE MEASUREMENT/ CALLING DATA
4.1 SERVICE PROVISIONING/ ACTIVATION TIME
4.1.1 PARAMETER EXPLANATION
4.1.1.1 AUDIT PROCEDURE
IMRB Auditors verified and collected data pertaining to number of applications received at the service
provider’s level in the following time frames:-
Number of applications received at the service provider’s level
Number of connections provided within 15 days
Number of connections provided after 15 days
Live Calling: -
At least 10% of the subscribers who had requested for new connections in month prior to Audit
were called to check whether connection was provided in 15 days
Data for the parameter was extracted from OMC (Operations and Maintenance Center) of the
operators.
4.1.1.2 COMPUTATIONAL METHODOLOGY
Technically Non Feasible (TNF) cases such as unavailability of Broadband infrastructure/
equipment in the Area or Spare Capacity i.e. Broadband Ports including equipment to be
installed at the customer premises for activating Broadband connection were excluded from the
calculation of this parameter.
Also, problems relating to customer owned equipment such as PC, LAN Card/ USB Port and
internal wiring or non-availability of such equipment were excluded from the calculation of this
parameter.
Percentage connections provided within X working days = No of connections provided within X
working days/ Total number of connections registered during the period * 100
4.1.1.3 BENCHMARK
100 % cases in =<15 working days.
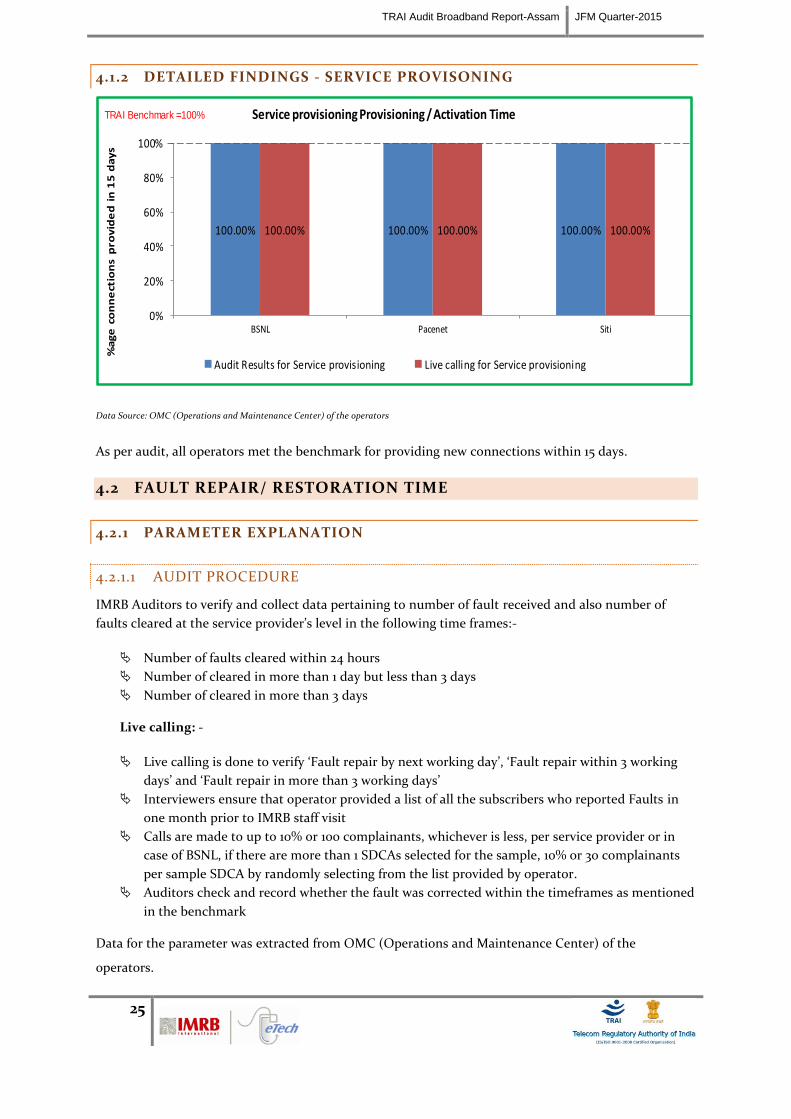
TRAI Audit Broadband Report-Assam JFM Quarter-2015
25
4.1.2 DETAILED FINDINGS - SERVICE PROVISONING
100.00% 100.00% 100.00%100.00% 100.00% 100.00%
0%
20%
40%
60%
80%
100%
BSNL Pacenet Siti
%a
ge
co
nn
ect
ion
s p
rov
ide
d i
n 1
5 d
ay
sService provisioning Provisioning / Activation Time
Audit Results for Service provisioning Live calling for Service provisioning
TRAI Benchmark =100%
Data Source: OMC (Operations and Maintenance Center) of the operators
As per audit, all operators met the benchmark for providing new connections within 15 days.
4.2 FAULT REPAIR/ RESTORATION TIME
4.2.1 PARAMETER EXPLANATION
4.2.1.1 AUDIT PROCEDURE
IMRB Auditors to verify and collect data pertaining to number of fault received and also number of
faults cleared at the service provider’s level in the following time frames:-
Number of faults cleared within 24 hours
Number of cleared in more than 1 day but less than 3 days
Number of cleared in more than 3 days
Live calling: -
Live calling is done to verify ‘Fault repair by next working day’, ‘Fault repair within 3 working
days’ and ‘Fault repair in more than 3 working days’
Interviewers ensure that operator provided a list of all the subscribers who reported Faults in
one month prior to IMRB staff visit
Calls are made to up to 10% or 100 complainants, whichever is less, per service provider or in
case of BSNL, if there are more than 1 SDCAs selected for the sample, 10% or 30 complainants
per sample SDCA by randomly selecting from the list provided by operator.
Auditors check and record whether the fault was corrected within the timeframes as mentioned
in the benchmark
Data for the parameter was extracted from OMC (Operations and Maintenance Center) of the
operators.
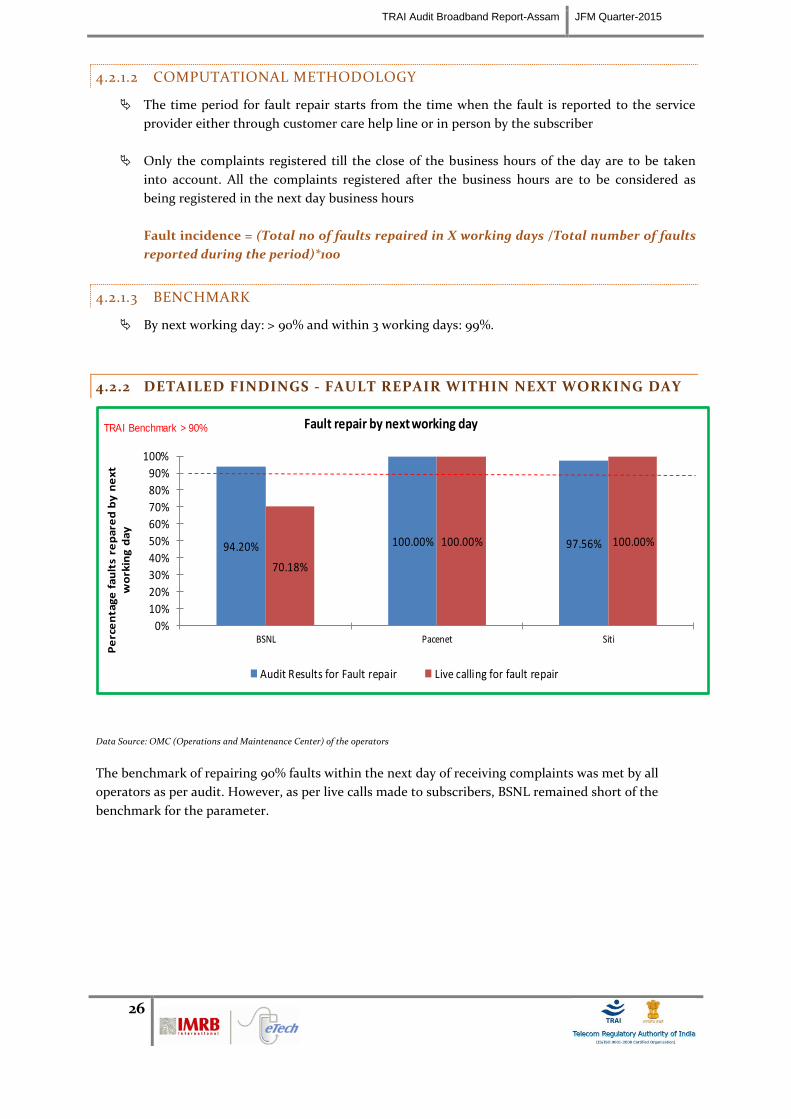
TRAI Audit Broadband Report-Assam JFM Quarter-2015
26
4.2.1.2 COMPUTATIONAL METHODOLOGY
The time period for fault repair starts from the time when the fault is reported to the service
provider either through customer care help line or in person by the subscriber
Only the complaints registered till the close of the business hours of the day are to be taken
into account. All the complaints registered after the business hours are to be considered as
being registered in the next day business hours
Fault incidence = (Total no of faults repaired in X working days /Total number of faults
reported during the period)*100
4.2.1.3 BENCHMARK
By next working day: > 90% and within 3 working days: 99%.
4.2.2 DETAILED FINDINGS - FAULT REPAIR WITHIN NEXT WORKING DAY
94.20% 100.00% 97.56%
70.18%
100.00% 100.00%
0%
10%
20%
30%
40%
50%
60%
70%
80%
90%
100%
BSNL Pacenet Siti
Pe
rce
nta
ge
fa
ult
s re
pa
red
by
ne
xt
wo
rkin
g d
ay
Fault repair by next working day
Audit Results for Fault repair Live calling for fault repair
TRAI Benchmark > 90%
Data Source: OMC (Operations and Maintenance Center) of the operators
The benchmark of repairing 90% faults within the next day of receiving complaints was met by all
operators as per audit. However, as per live calls made to subscribers, BSNL remained short of the
benchmark for the parameter.
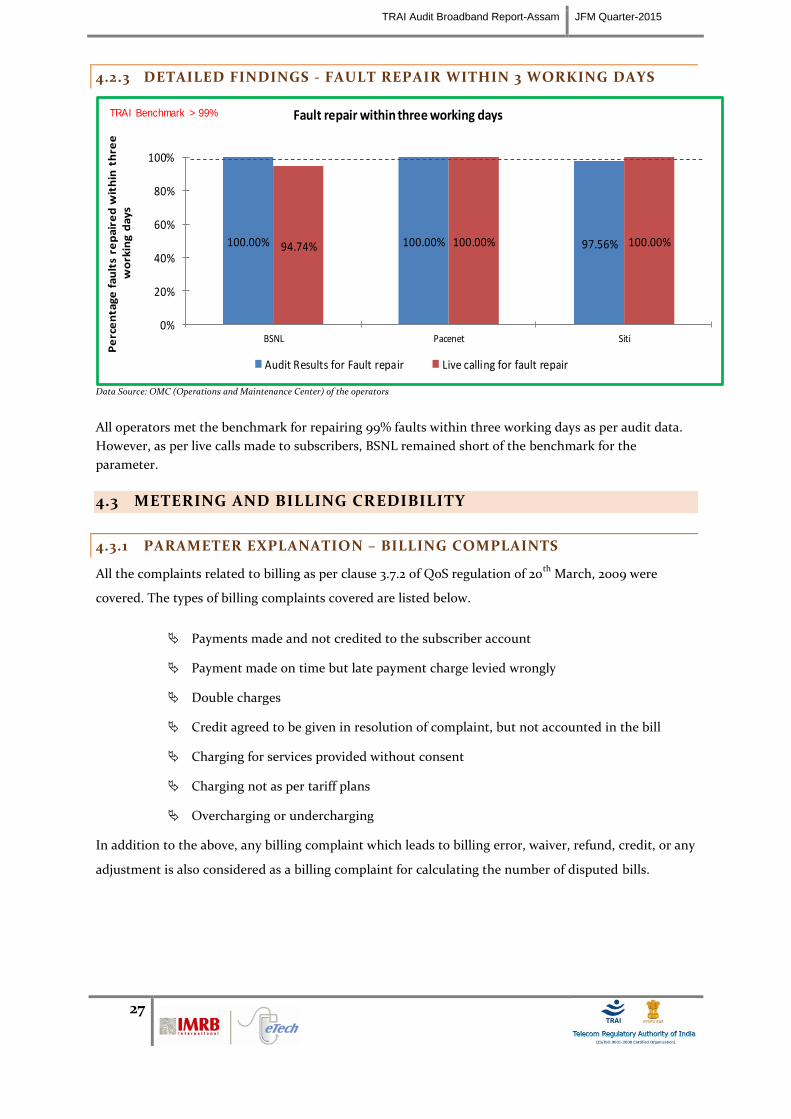
TRAI Audit Broadband Report-Assam JFM Quarter-2015
27
4.2.3 DETAILED FINDINGS - FAULT REPAIR WITHIN 3 WORKING DAYS
100.00% 100.00% 97.56%94.74% 100.00% 100.00%
0%
20%
40%
60%
80%
100%
BSNL Pacenet Siti
Pe
rce
nta
ge
fa
ult
s re
pa
ire
d w
ith
in t
hre
e
wo
rkin
g d
ay
sFault repair within three working days
Audit Results for Fault repair Live calling for fault repair
TRAI Benchmark > 99%
Data Source: OMC (Operations and Maintenance Center) of the operators
All operators met the benchmark for repairing 99% faults within three working days as per audit data.
However, as per live calls made to subscribers, BSNL remained short of the benchmark for the
parameter.
4.3 METERING AND BILLING CREDIBILITY
4.3.1 PARAMETER EXPLANATION – BILLING COMPLAINTS
All the complaints related to billing as per clause 3.7.2 of QoS regulation of 20th
March, 2009 were
covered. The types of billing complaints covered are listed below.
Payments made and not credited to the subscriber account
Payment made on time but late payment charge levied wrongly
Double charges
Credit agreed to be given in resolution of complaint, but not accounted in the bill
Charging for services provided without consent
Charging not as per tariff plans
Overcharging or undercharging
In addition to the above, any billing complaint which leads to billing error, waiver, refund, credit, or any
adjustment is also considered as a billing complaint for calculating the number of disputed bills.
TRAI Audit Broadband Report-Assam JFM Quarter-2015
28
4.3.1.1 AUDIT PROCEDURE
IMRB Auditors to verify and collect data pertaining to –
Number of Billing complaints received at the service provider’s level
Last billing cycle stated should be such that due date for payment of bills must be beyond the
date when this form is filled.
Include all types of bills generated for customers. This could include online as well as other
forms of bills presentation including printed bills
Billing complaint is any of written complaint/ personal visit/ telephonic complaint related to:
Excess metering/ wrong tariff scheme charged, Payment made in time but charged penalty/ not
reflected in next bill, Last payment not reflected in bill, Adjustment/ waiver not done, Anything
else related to bills, Toll free numbers charged etc.
Billing complaints resolution database, with opening and closing date of complaint to identify
the time taken to resolve a complaint
Live calling:
Auditors request the operator provided the database of all the subscribers who reported billing
complaints in one month prior to IMRB auditor visit. In case of BSNL, data for the complaints
from the subscribers belonging to the sample exchanges is requested specifically. In case the
sample data is too low to fulfill the target calls, auditors may call subscribers whose complaints
got resolved in other months of the same audit period.
A sample of 10% or 100 complainants, whichever is less, is selected randomly from the list
provided by operator
Calls are made by auditors to the sample of subscribers to check and record whether the
complaint was resolved within the timeframes as mentioned in the benchmark.
Raw data for the parameter was extracted from central billing center of the operators.
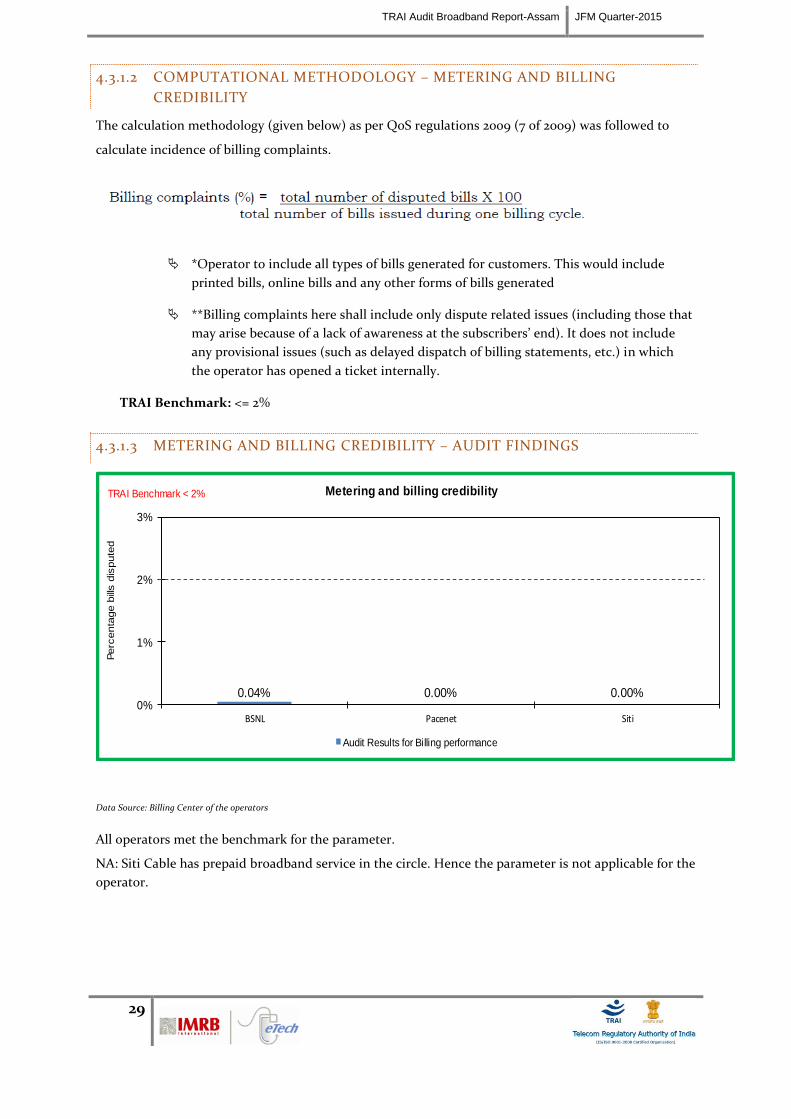
TRAI Audit Broadband Report-Assam JFM Quarter-2015
29
4.3.1.2 COMPUTATIONAL METHODOLOGY – METERING AND BILLING
CREDIBILITY
The calculation methodology (given below) as per QoS regulations 2009 (7 of 2009) was followed to
calculate incidence of billing complaints.
*Operator to include all types of bills generated for customers. This would include
printed bills, online bills and any other forms of bills generated
**Billing complaints here shall include only dispute related issues (including those that
may arise because of a lack of awareness at the subscribers’ end). It does not include
any provisional issues (such as delayed dispatch of billing statements, etc.) in which
the operator has opened a ticket internally.
TRAI Benchmark: <= 2%
4.3.1.3 METERING AND BILLING CREDIBILITY – AUDIT FINDINGS
0.04% 0.00% 0.00%0%
1%
2%
3%
BSNL Pacenet Siti
Perc
enta
ge b
ills d
ispute
d
Metering and billing credibility
Audit Results for Billing performance
TRAI Benchmark < 2%
Data Source: Billing Center of the operators
All operators met the benchmark for the parameter.
NA: Siti Cable has prepaid broadband service in the circle. Hence the parameter is not applicable for the
operator.
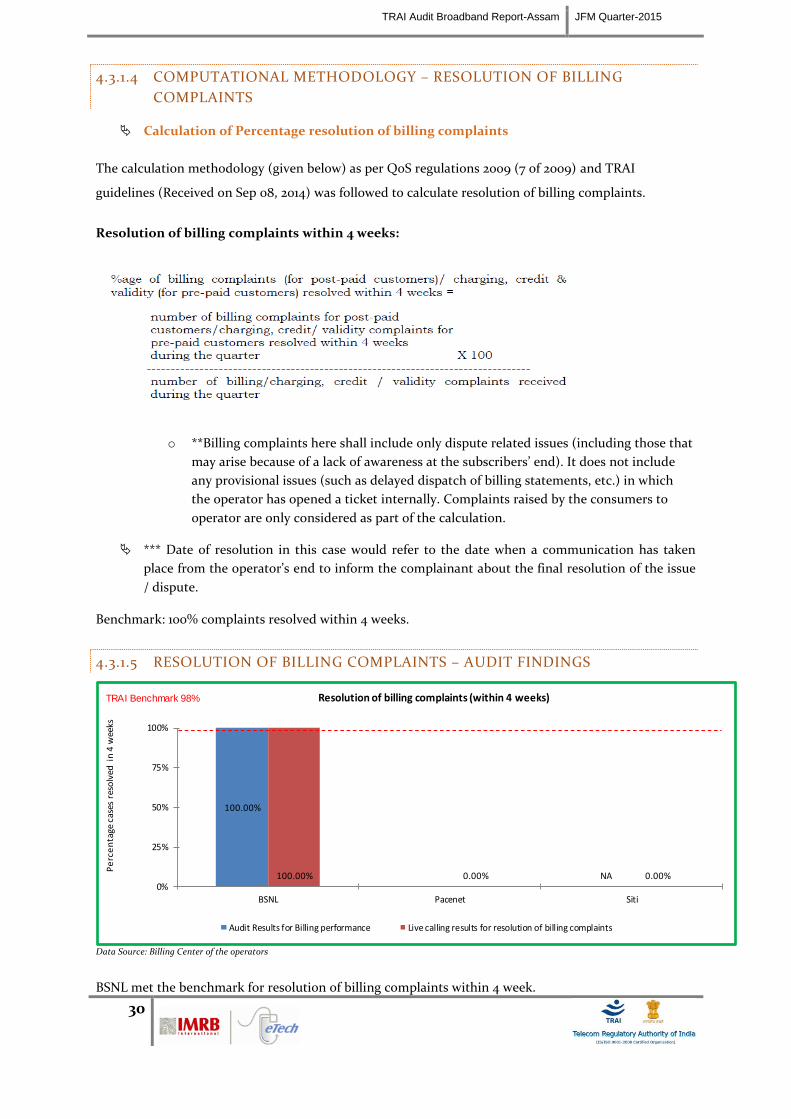
TRAI Audit Broadband Report-Assam JFM Quarter-2015
30
4.3.1.4 COMPUTATIONAL METHODOLOGY – RESOLUTION OF BILLING
COMPLAINTS
Calculation of Percentage resolution of billing complaints
The calculation methodology (given below) as per QoS regulations 2009 (7 of 2009) and TRAI
guidelines (Received on Sep 08, 2014) was followed to calculate resolution of billing complaints.
Resolution of billing complaints within 4 weeks:
o **Billing complaints here shall include only dispute related issues (including those that
may arise because of a lack of awareness at the subscribers’ end). It does not include
any provisional issues (such as delayed dispatch of billing statements, etc.) in which
the operator has opened a ticket internally. Complaints raised by the consumers to
operator are only considered as part of the calculation.
*** Date of resolution in this case would refer to the date when a communication has taken
place from the operator’s end to inform the complainant about the final resolution of the issue
/ dispute.
Benchmark: 100% complaints resolved within 4 weeks.
4.3.1.5 RESOLUTION OF BILLING COMPLAINTS – AUDIT FINDINGS
100.00%
NA100.00% 0.00% 0.00%0%
25%
50%
75%
100%
BSNL Pacenet Siti
Pe
rce
nta
ge c
ases
res
olv
ed i
n 4
wee
ks
Resolution of billing complaints (within 4 weeks)
Audit Results for Billing performance Live calling results for resolution of billing complaints
TRAI Benchmark 98%
Data Source: Billing Center of the operators
BSNL met the benchmark for resolution of billing complaints within 4 week.
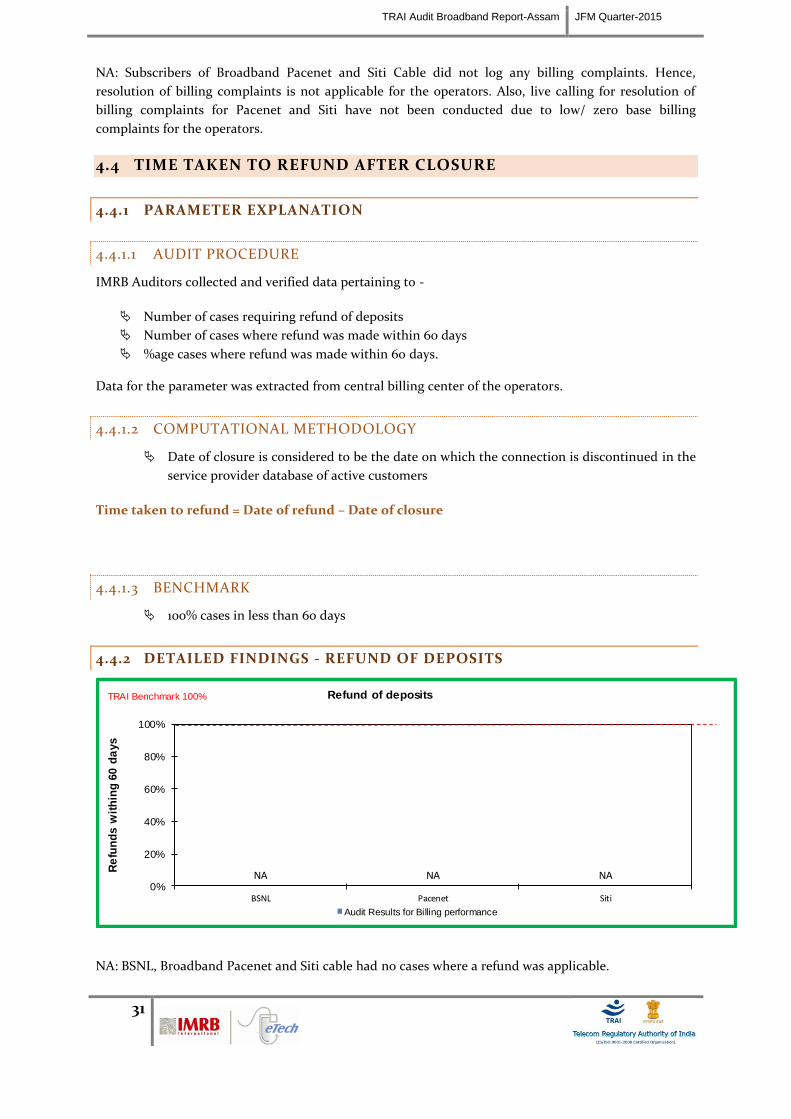
TRAI Audit Broadband Report-Assam JFM Quarter-2015
31
NA: Subscribers of Broadband Pacenet and Siti Cable did not log any billing complaints. Hence,
resolution of billing complaints is not applicable for the operators. Also, live calling for resolution of
billing complaints for Pacenet and Siti have not been conducted due to low/ zero base billing
complaints for the operators.
4.4 TIME TAKEN TO REFUND AFTER CLOSURE
4.4.1 PARAMETER EXPLANATION
4.4.1.1 AUDIT PROCEDURE
IMRB Auditors collected and verified data pertaining to -
Number of cases requiring refund of deposits
Number of cases where refund was made within 60 days
%age cases where refund was made within 60 days.
Data for the parameter was extracted from central billing center of the operators.
4.4.1.2 COMPUTATIONAL METHODOLOGY
Date of closure is considered to be the date on which the connection is discontinued in the
service provider database of active customers
Time taken to refund = Date of refund – Date of closure
4.4.1.3 BENCHMARK
100% cases in less than 60 days
4.4.2 DETAILED FINDINGS - REFUND OF DEPOSITS
NA NA NA0%
20%
40%
60%
80%
100%
BSNL Pacenet Siti
Re
fun
ds
wit
hin
g 6
0 d
ays
Refund of deposits
Audit Results for Billing performance
TRAI Benchmark 100%
NA: BSNL, Broadband Pacenet and Siti cable had no cases where a refund was applicable.
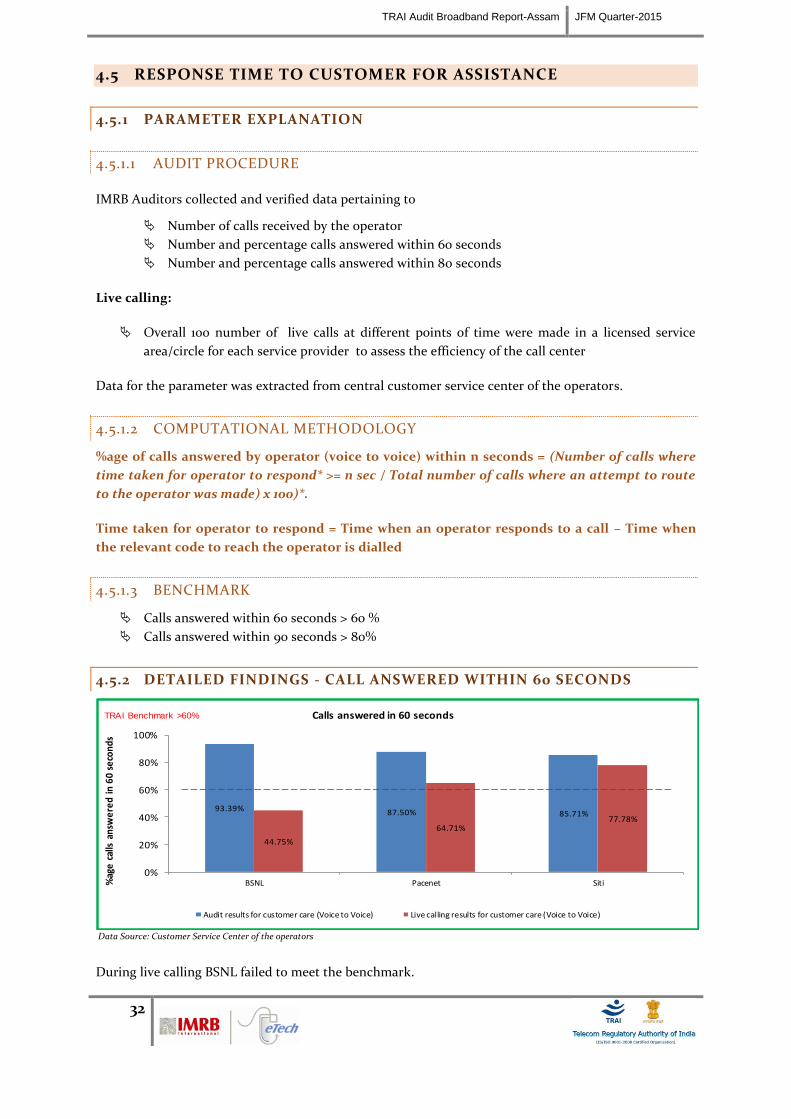
TRAI Audit Broadband Report-Assam JFM Quarter-2015
32
4.5 RESPONSE TIME TO CUSTOMER FOR ASSISTANCE
4.5.1 PARAMETER EXPLANATION
4.5.1.1 AUDIT PROCEDURE
IMRB Auditors collected and verified data pertaining to
Number of calls received by the operator
Number and percentage calls answered within 60 seconds
Number and percentage calls answered within 80 seconds
Live calling:
Overall 100 number of live calls at different points of time were made in a licensed service
area/circle for each service provider to assess the efficiency of the call center
Data for the parameter was extracted from central customer service center of the operators.
4.5.1.2 COMPUTATIONAL METHODOLOGY
%age of calls answered by operator (voice to voice) within n seconds = (Number of calls where
time taken for operator to respond* >= n sec / Total number of calls where an attempt to route
to the operator was made) x 100)*.
Time taken for operator to respond = Time when an operator responds to a call – Time when
the relevant code to reach the operator is dialled
4.5.1.3 BENCHMARK
Calls answered within 60 seconds > 60 %
Calls answered within 90 seconds > 80%
4.5.2 DETAILED FINDINGS - CALL ANSWERED WITHIN 60 SECONDS
93.39% 87.50% 85.71%
44.75%
64.71%77.78%
0%
20%
40%
60%
80%
100%
BSNL Pacenet Siti%ag
e c
alls
an
swe
red
in
60
se
con
ds
Calls answered in 60 seconds
Audit results for customer care (Voice to Voice) Live calling results for customer care (Voice to Voice)
TRAI Benchmark >60%
Data Source: Customer Service Center of the operators
During live calling BSNL failed to meet the benchmark.
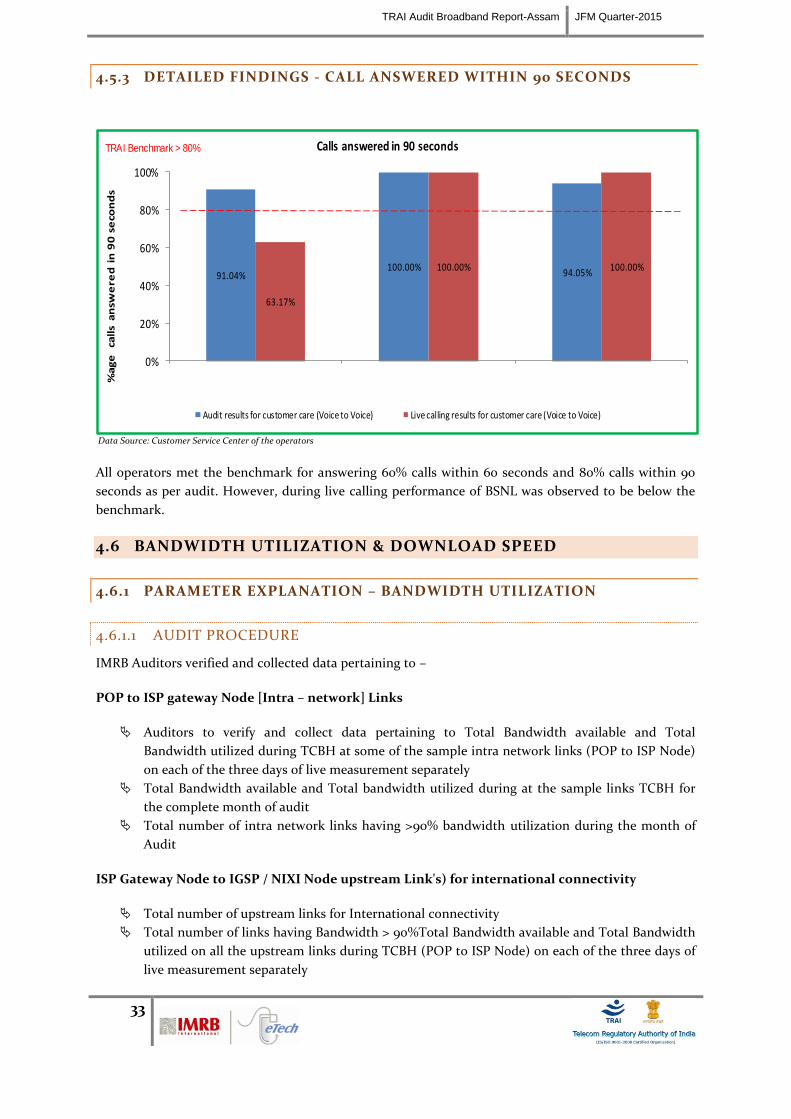
TRAI Audit Broadband Report-Assam JFM Quarter-2015
33
4.5.3 DETAILED FINDINGS - CALL ANSWERED WITHIN 90 SECONDS
91.04%100.00%
94.05%
63.17%
100.00% 100.00%
0%
20%
40%
60%
80%
100%
%a
ge
ca
lls
an
swe
red
in
90
se
con
ds
Calls answered in 90 seconds
Audit results for customer care (Voice to Voice) Live calling results for customer care (Voice to Voice)
TRAI Benchmark > 80%
Data Source: Customer Service Center of the operators
All operators met the benchmark for answering 60% calls within 60 seconds and 80% calls within 90
seconds as per audit. However, during live calling performance of BSNL was observed to be below the
benchmark.
4.6 BANDWIDTH UTILIZATION & DOWNLOAD SPEED
4.6.1 PARAMETER EXPLANATION – BANDWIDTH UTILIZATION
4.6.1.1 AUDIT PROCEDURE
IMRB Auditors verified and collected data pertaining to –
POP to ISP gateway Node [Intra – network] Links
Auditors to verify and collect data pertaining to Total Bandwidth available and Total
Bandwidth utilized during TCBH at some of the sample intra network links (POP to ISP Node)
on each of the three days of live measurement separately
Total Bandwidth available and Total bandwidth utilized during at the sample links TCBH for
the complete month of audit
Total number of intra network links having >90% bandwidth utilization during the month of
Audit
ISP Gateway Node to IGSP / NIXI Node upstream Link's) for international connectivity
Total number of upstream links for International connectivity
Total number of links having Bandwidth > 90%Total Bandwidth available and Total Bandwidth
utilized on all the upstream links during TCBH (POP to ISP Node) on each of the three days of
live measurement separately
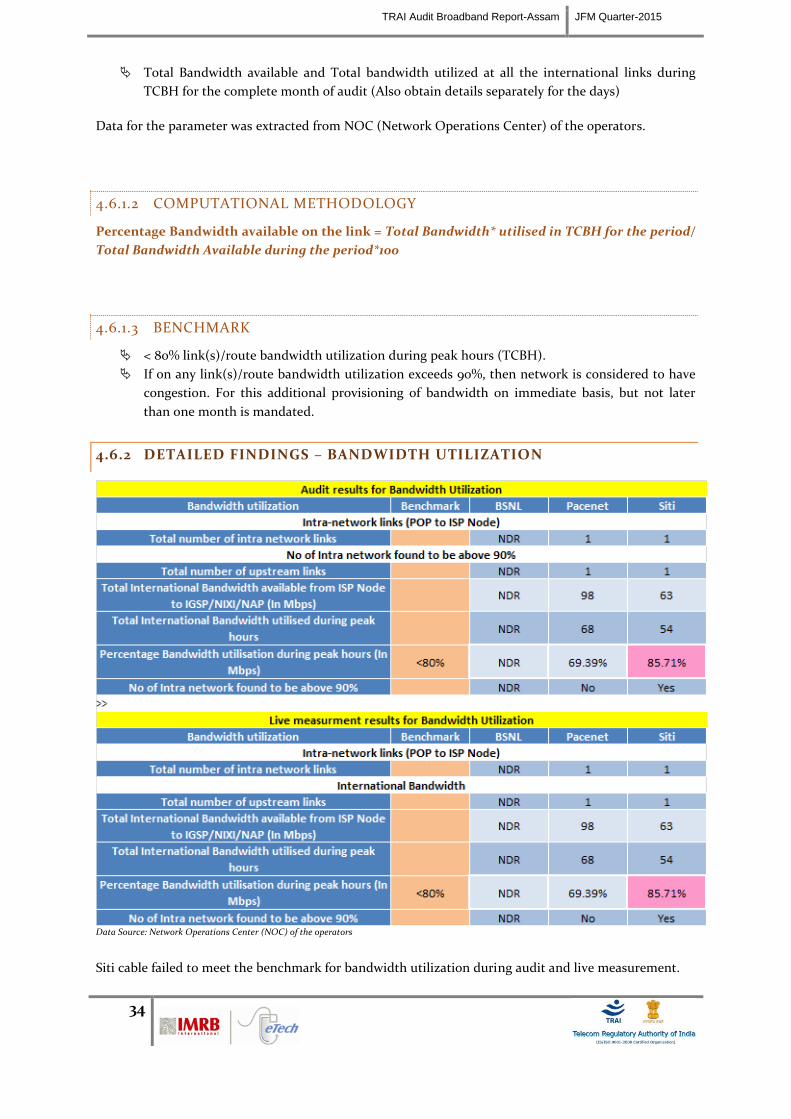
TRAI Audit Broadband Report-Assam JFM Quarter-2015
34
Total Bandwidth available and Total bandwidth utilized at all the international links during
TCBH for the complete month of audit (Also obtain details separately for the days)
Data for the parameter was extracted from NOC (Network Operations Center) of the operators.
4.6.1.2 COMPUTATIONAL METHODOLOGY
Percentage Bandwidth available on the link = Total Bandwidth* utilised in TCBH for the period/
Total Bandwidth Available during the period*100
4.6.1.3 BENCHMARK
< 80% link(s)/route bandwidth utilization during peak hours (TCBH).
If on any link(s)/route bandwidth utilization exceeds 90%, then network is considered to have
congestion. For this additional provisioning of bandwidth on immediate basis, but not later
than one month is mandated.
4.6.2 DETAILED FINDINGS – BANDWIDTH UTILIZATION
Data Source: Network Operations Center (NOC) of the operators
Siti cable failed to meet the benchmark for bandwidth utilization during audit and live measurement.
TRAI Audit Broadband Report-Assam JFM Quarter-2015
35
NDR: No data received. Audit of BSNL at its NOC for Bandwidth Utilization is yet to be conducted.
Auditors have contacted the NOC of BSNL, however, the operator is yet to provide an appointment to
IMRB auditors to conduct audit at BSNL NOC.
4.6.3 PARAMETER EXPLANATION - BROADBAND DOWNLOAD SPEED
4.6.3.1 AUDIT PROCEDURE
Auditors collected and verified the following information from the operator’s system.
Total committed download speed to the all subscribers (In Mbps) (A)
Total average download speed observed during TCBH (In Mbps)
Live Calling/ Measurement:
Details of live customers were obtained from the service providers
Overall 50 numbers of live calls at were made during peak hours (TCBH) in a licensed service
area/circle for each service provider to assess the download speed available to subscribers. A
download measurement software tool provided by the service providers was used for the same
Details of total committed download speed and speed available to the users were recorded for
each of the subscriber
4.6.3.2 COMPUTATIONAL METHODOLOGY
The download speed for one customer is calculated by the download speed measurement
software using the formula provided below:
Data Download Speed = Size of test file (data) in ISP server/ Transmission time required for
error free transfer of the entire data
Percentage download speed available was calculated as = Sum of total speed available for 50
customers/Total committed download speed for 50 customers*100
4.6.3.3 BENCHMARK
Subscribed broadband connection speed to be met >= 80% from ISP Node to user
Data for the parameter was taken from “Download measurement software” installed in the server at ISP
Node of the operators.
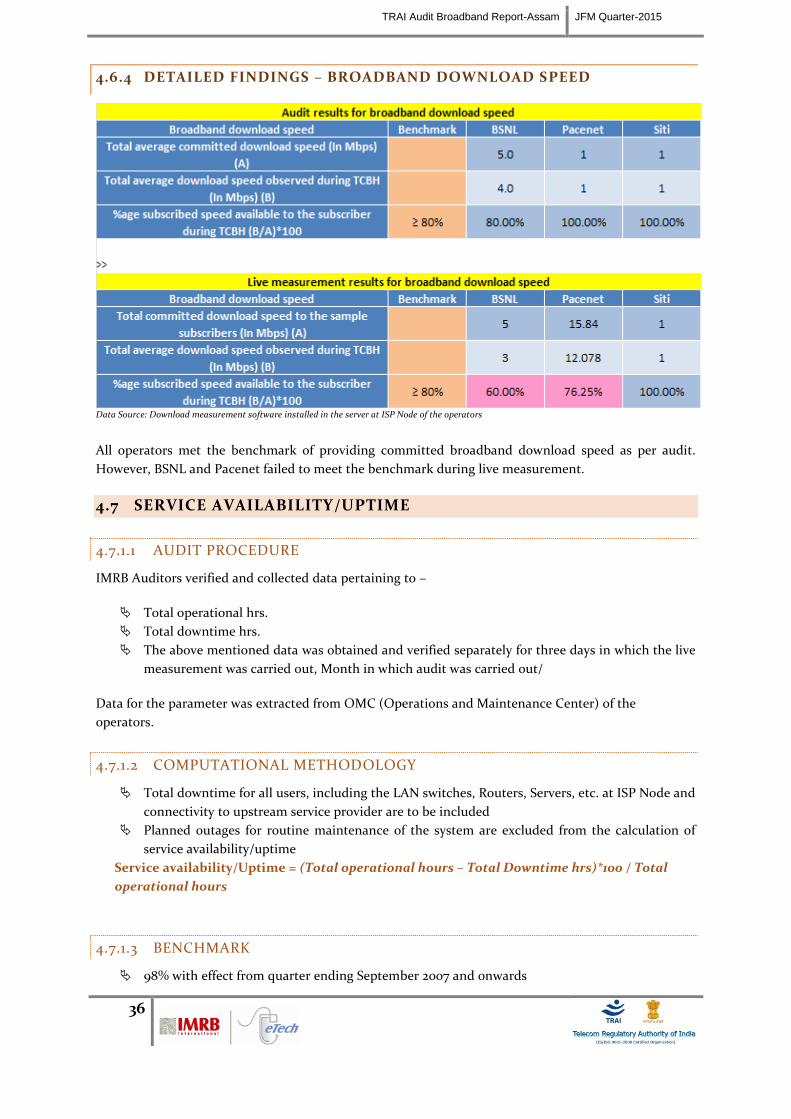
TRAI Audit Broadband Report-Assam JFM Quarter-2015
36
4.6.4 DETAILED FINDINGS – BROADBAND DOWNLOAD SPEED
Data Source: Download measurement software installed in the server at ISP Node of the operators
All operators met the benchmark of providing committed broadband download speed as per audit.
However, BSNL and Pacenet failed to meet the benchmark during live measurement.
4.7 SERVICE AVAILABILITY/UPTIME
4.7.1.1 AUDIT PROCEDURE
IMRB Auditors verified and collected data pertaining to –
Total operational hrs.
Total downtime hrs.
The above mentioned data was obtained and verified separately for three days in which the live
measurement was carried out, Month in which audit was carried out/
Data for the parameter was extracted from OMC (Operations and Maintenance Center) of the
operators.
4.7.1.2 COMPUTATIONAL METHODOLOGY
Total downtime for all users, including the LAN switches, Routers, Servers, etc. at ISP Node and
connectivity to upstream service provider are to be included
Planned outages for routine maintenance of the system are excluded from the calculation of
service availability/uptime
Service availability/Uptime = (Total operational hours – Total Downtime hrs)*100 / Total
operational hours
4.7.1.3 BENCHMARK
98% with effect from quarter ending September 2007 and onwards
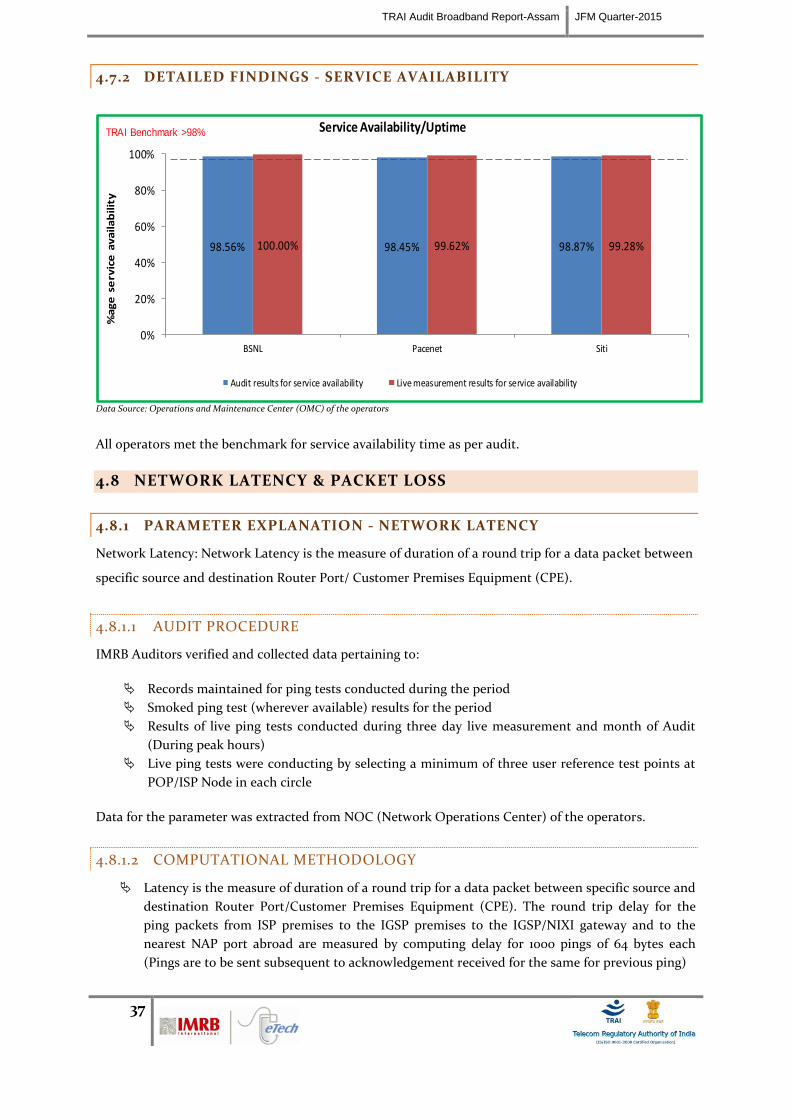
TRAI Audit Broadband Report-Assam JFM Quarter-2015
37
4.7.2 DETAILED FINDINGS - SERVICE AVAILABILITY
98.56% 98.45% 98.87%100.00% 99.62% 99.28%
0%
20%
40%
60%
80%
100%
BSNL Pacenet Siti
%a
ge
se
rvic
e a
va
ila
bil
ity
Service Availability/Uptime
Audit results for service availability Live measurement results for service availability
TRAI Benchmark >98%
Data Source: Operations and Maintenance Center (OMC) of the operators
All operators met the benchmark for service availability time as per audit.
4.8 NETWORK LATENCY & PACKET LOSS
4.8.1 PARAMETER EXPLANATION - NETWORK LATENCY
Network Latency: Network Latency is the measure of duration of a round trip for a data packet between
specific source and destination Router Port/ Customer Premises Equipment (CPE).
4.8.1.1 AUDIT PROCEDURE
IMRB Auditors verified and collected data pertaining to:
Records maintained for ping tests conducted during the period
Smoked ping test (wherever available) results for the period
Results of live ping tests conducted during three day live measurement and month of Audit
(During peak hours)
Live ping tests were conducting by selecting a minimum of three user reference test points at
POP/ISP Node in each circle
Data for the parameter was extracted from NOC (Network Operations Center) of the operators.
4.8.1.2 COMPUTATIONAL METHODOLOGY
Latency is the measure of duration of a round trip for a data packet between specific source and
destination Router Port/Customer Premises Equipment (CPE). The round trip delay for the
ping packets from ISP premises to the IGSP premises to the IGSP/NIXI gateway and to the
nearest NAP port abroad are measured by computing delay for 1000 pings of 64 bytes each
(Pings are to be sent subsequent to acknowledgement received for the same for previous ping)
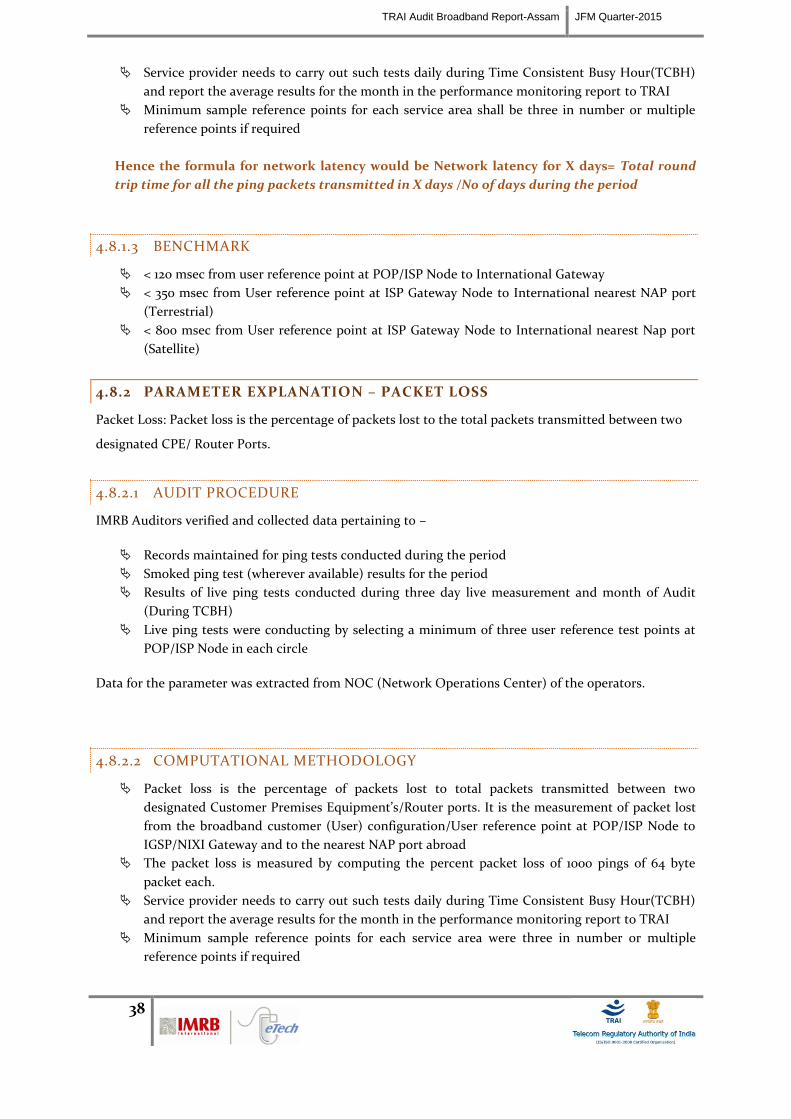
TRAI Audit Broadband Report-Assam JFM Quarter-2015
38
Service provider needs to carry out such tests daily during Time Consistent Busy Hour(TCBH)
and report the average results for the month in the performance monitoring report to TRAI
Minimum sample reference points for each service area shall be three in number or multiple
reference points if required
Hence the formula for network latency would be Network latency for X days= Total round
trip time for all the ping packets transmitted in X days /No of days during the period
4.8.1.3 BENCHMARK
< 120 msec from user reference point at POP/ISP Node to International Gateway
< 350 msec from User reference point at ISP Gateway Node to International nearest NAP port
(Terrestrial)
< 800 msec from User reference point at ISP Gateway Node to International nearest Nap port
(Satellite)
4.8.2 PARAMETER EXPLANATION – PACKET LOSS
Packet Loss: Packet loss is the percentage of packets lost to the total packets transmitted between two
designated CPE/ Router Ports.
4.8.2.1 AUDIT PROCEDURE
IMRB Auditors verified and collected data pertaining to –
Records maintained for ping tests conducted during the period
Smoked ping test (wherever available) results for the period
Results of live ping tests conducted during three day live measurement and month of Audit
(During TCBH)
Live ping tests were conducting by selecting a minimum of three user reference test points at
POP/ISP Node in each circle
Data for the parameter was extracted from NOC (Network Operations Center) of the operators.
4.8.2.2 COMPUTATIONAL METHODOLOGY
Packet loss is the percentage of packets lost to total packets transmitted between two
designated Customer Premises Equipment’s/Router ports. It is the measurement of packet lost
from the broadband customer (User) configuration/User reference point at POP/ISP Node to
IGSP/NIXI Gateway and to the nearest NAP port abroad
The packet loss is measured by computing the percent packet loss of 1000 pings of 64 byte
packet each.
Service provider needs to carry out such tests daily during Time Consistent Busy Hour(TCBH)
and report the average results for the month in the performance monitoring report to TRAI
Minimum sample reference points for each service area were three in number or multiple
reference points if required
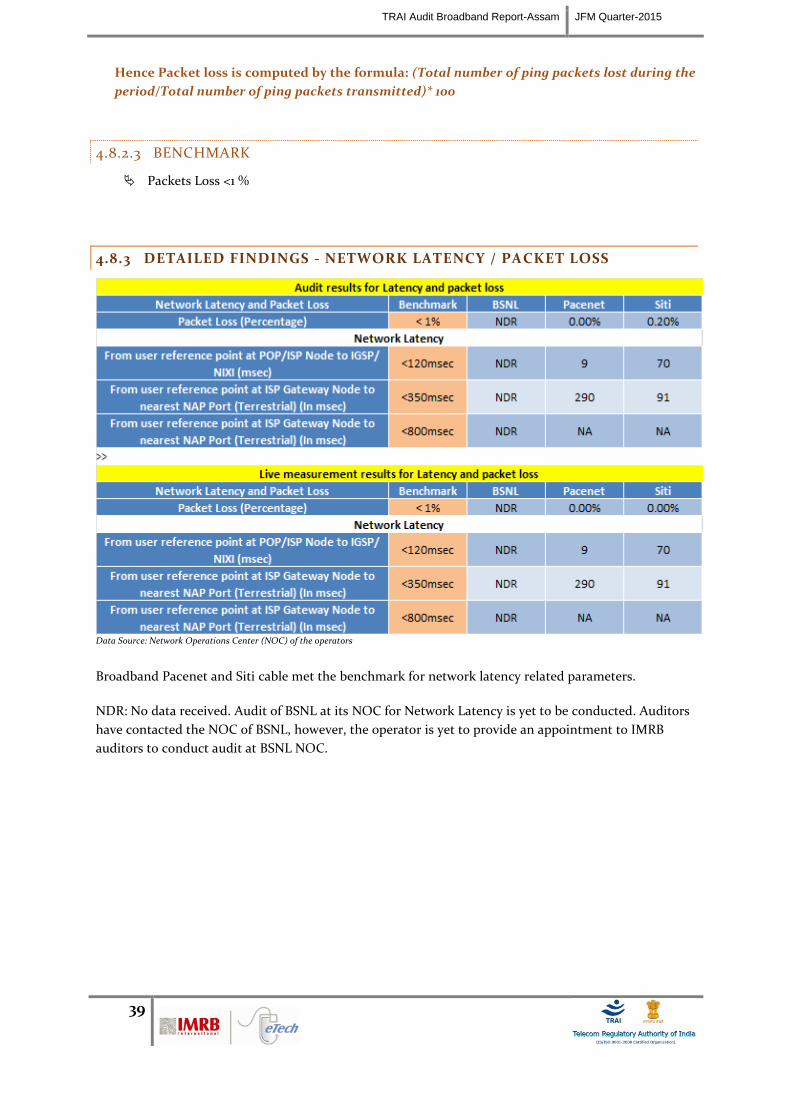
TRAI Audit Broadband Report-Assam JFM Quarter-2015
39
Hence Packet loss is computed by the formula: (Total number of ping packets lost during the
period/Total number of ping packets transmitted)* 100
4.8.2.3 BENCHMARK
Packets Loss <1 %
4.8.3 DETAILED FINDINGS - NETWORK LATENCY / PACKET LOSS
Data Source: Network Operations Center (NOC) of the operators
Broadband Pacenet and Siti cable met the benchmark for network latency related parameters.
NDR: No data received. Audit of BSNL at its NOC for Network Latency is yet to be conducted. Auditors
have contacted the NOC of BSNL, however, the operator is yet to provide an appointment to IMRB
auditors to conduct audit at BSNL NOC.
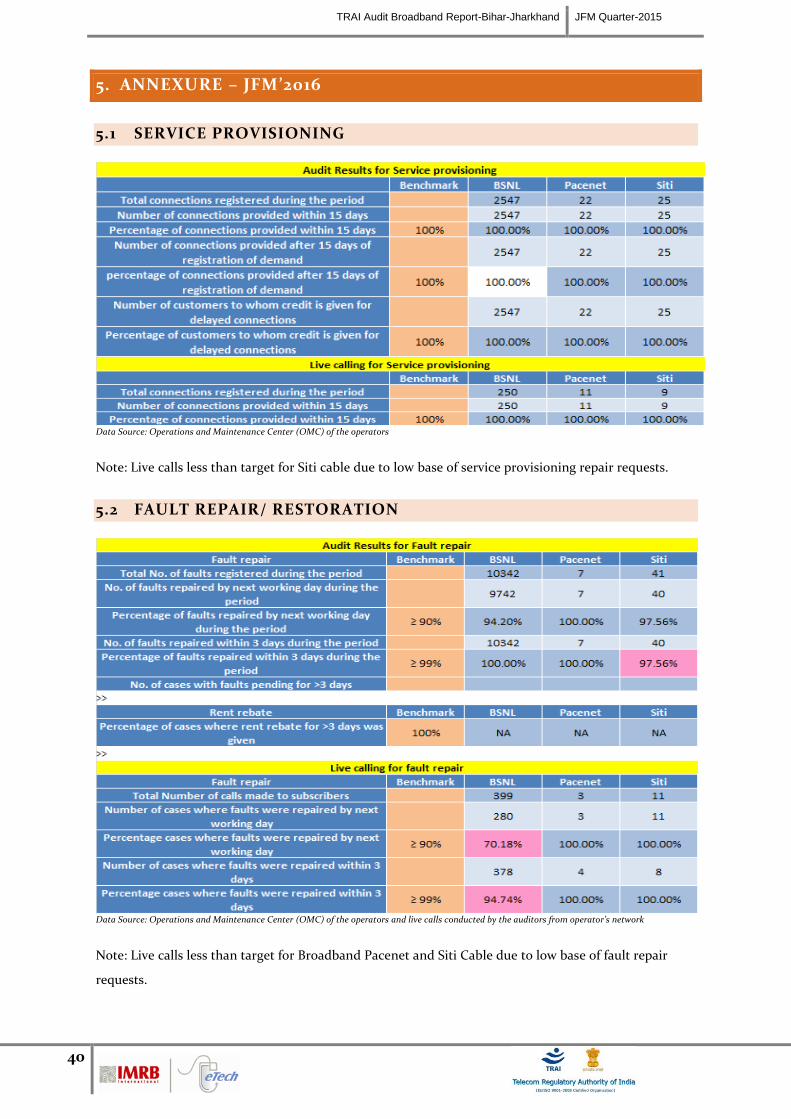
TRAI Audit Broadband Report-Bihar-Jharkhand JFM Quarter-2015
40
5. ANNEXURE – JFM’2016
5.1 SERVICE PROVISIONING
Data Source: Operations and Maintenance Center (OMC) of the operators
Note: Live calls less than target for Siti cable due to low base of service provisioning repair requests.
5.2 FAULT REPAIR/ RESTORATION
Data Source: Operations and Maintenance Center (OMC) of the operators and live calls conducted by the auditors from operator’s network
Note: Live calls less than target for Broadband Pacenet and Siti Cable due to low base of fault repair
requests.
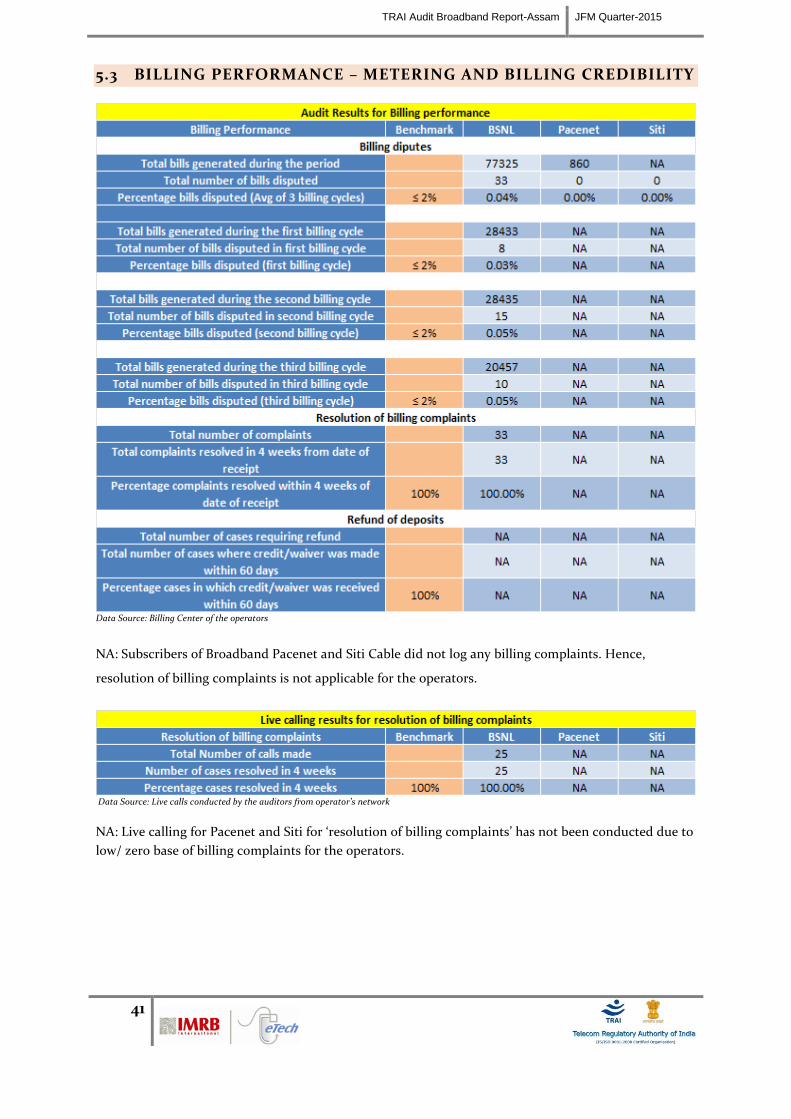
TRAI Audit Broadband Report-Assam JFM Quarter-2015
41
5.3 BILLING PERFORMANCE – METERING AND BILLING CREDIBILITY
Data Source: Billing Center of the operators
NA: Subscribers of Broadband Pacenet and Siti Cable did not log any billing complaints. Hence,
resolution of billing complaints is not applicable for the operators.
Data Source: Live calls conducted by the auditors from operator’s network
NA: Live calling for Pacenet and Siti for ‘resolution of billing complaints’ has not been conducted due to
low/ zero base of billing complaints for the operators.
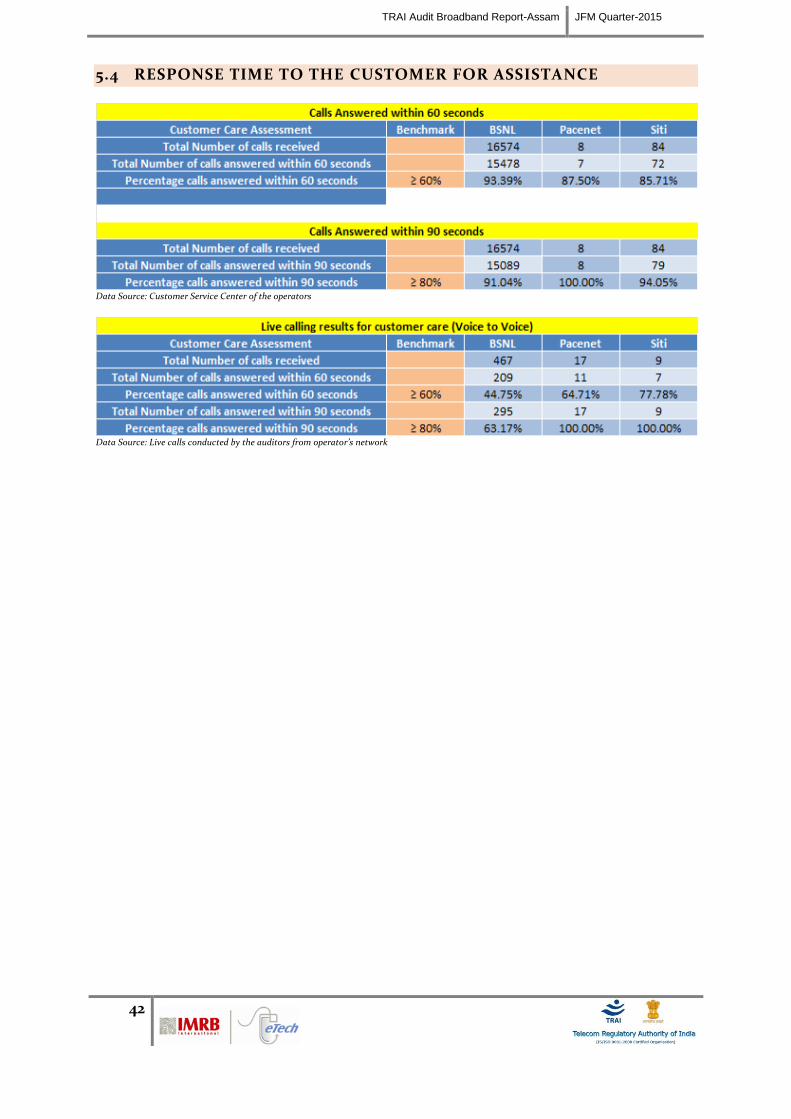
TRAI Audit Broadband Report-Assam JFM Quarter-2015
42
5.4 RESPONSE TIME TO THE CUSTOMER FOR ASSISTANCE
Data Source: Customer Service Center of the operators
Data Source: Live calls conducted by the auditors from operator’s network
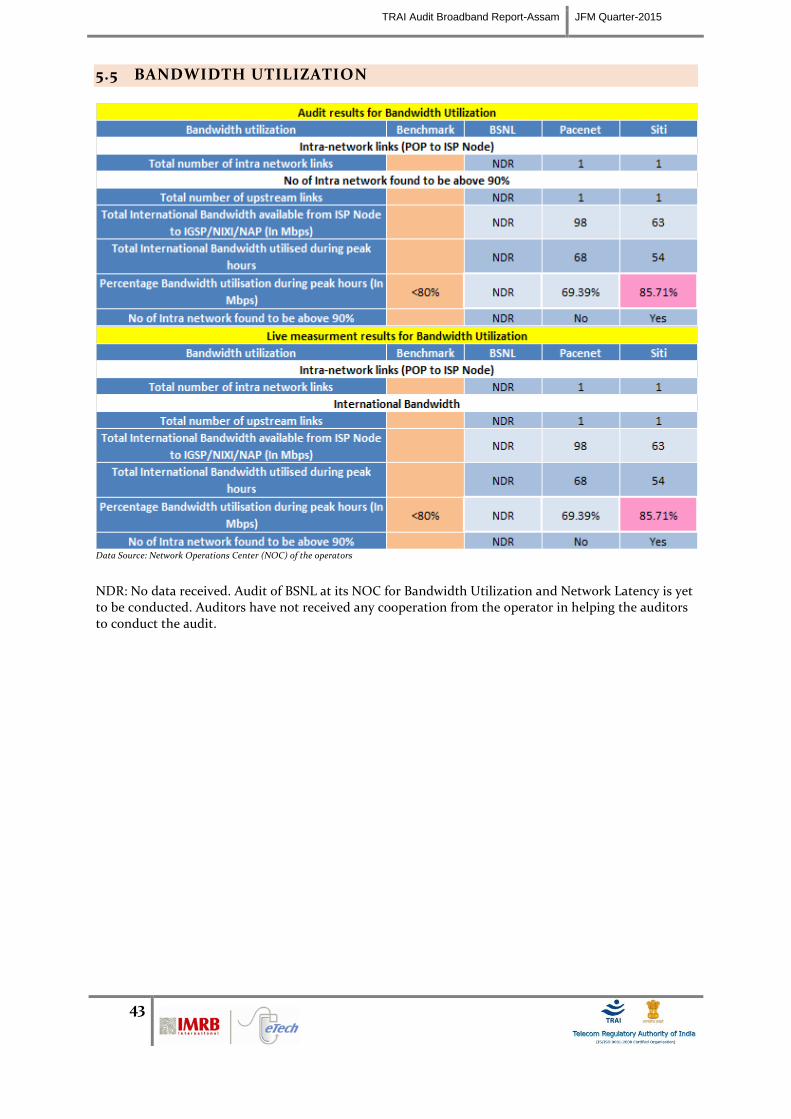
TRAI Audit Broadband Report-Assam JFM Quarter-2015
43
5.5 BANDWIDTH UTILIZATION
Data Source: Network Operations Center (NOC) of the operators
NDR: No data received. Audit of BSNL at its NOC for Bandwidth Utilization and Network Latency is yet to be conducted. Auditors have not received any cooperation from the operator in helping the auditors to conduct the audit.
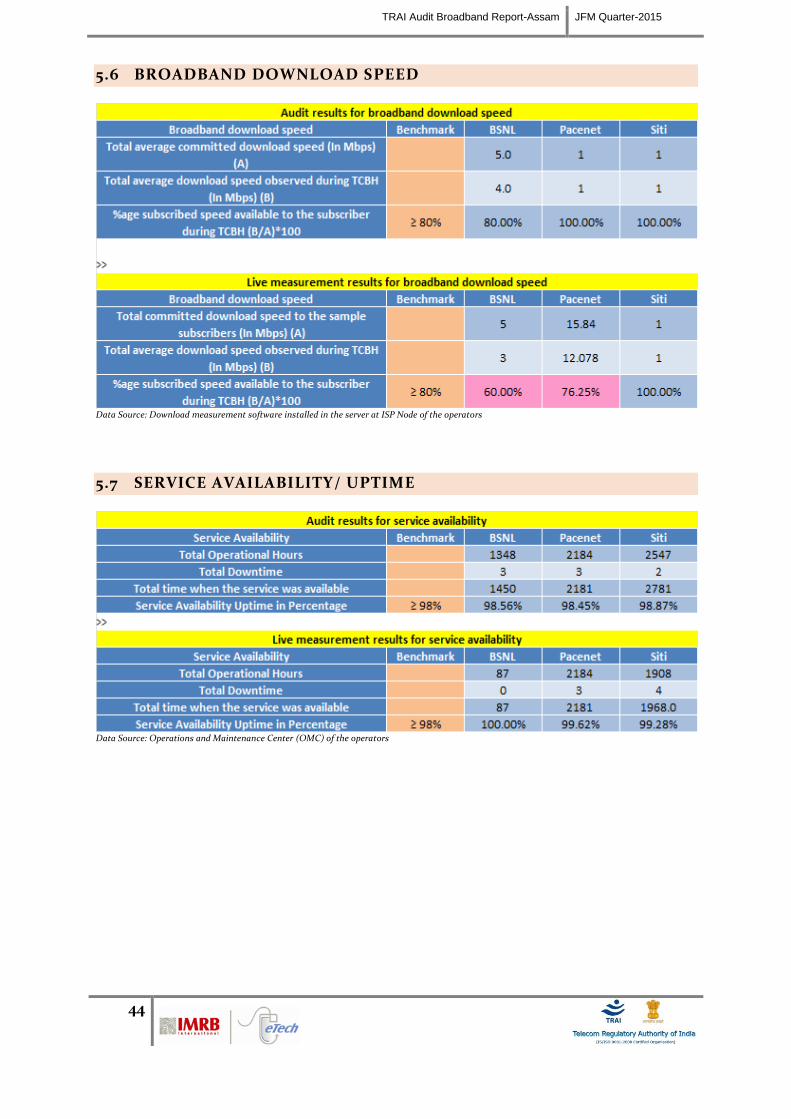
TRAI Audit Broadband Report-Assam JFM Quarter-2015
44
5.6 BROADBAND DOWNLOAD SPEED
Data Source: Download measurement software installed in the server at ISP Node of the operators
5.7 SERVICE AVAILABILITY/ UPTIME
Data Source: Operations and Maintenance Center (OMC) of the operators
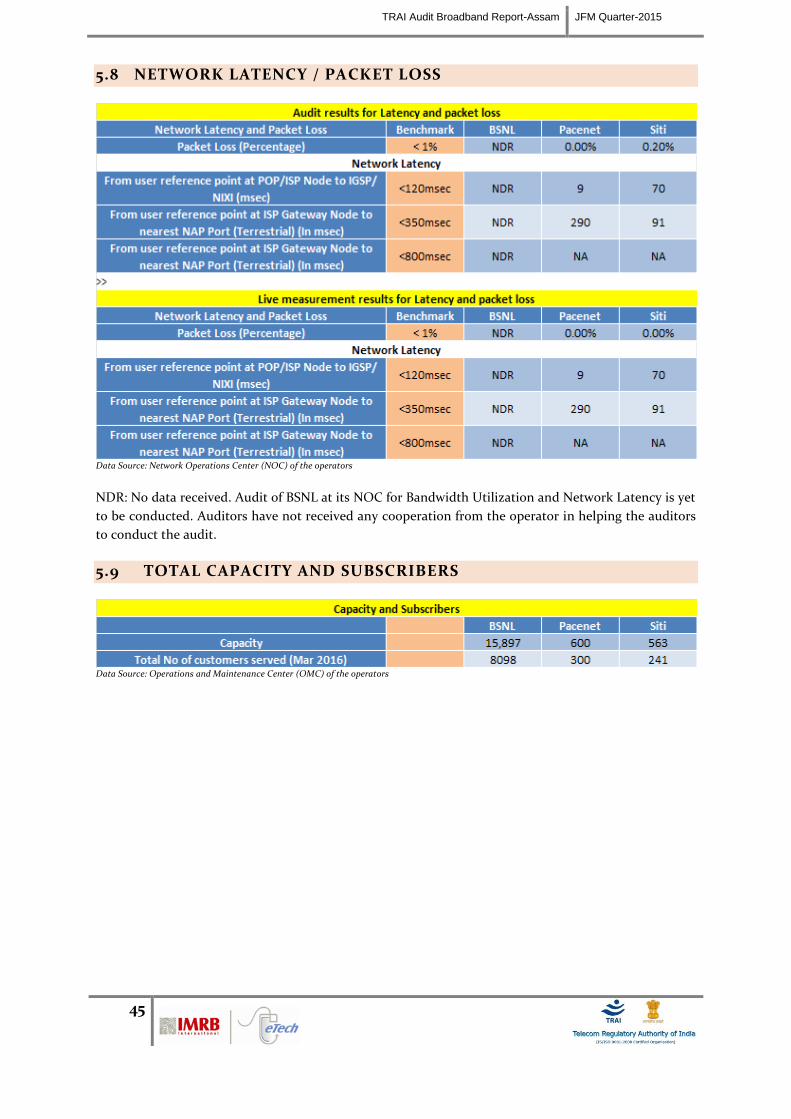
TRAI Audit Broadband Report-Assam JFM Quarter-2015
45
5.8 NETWORK LATENCY / PACKET LOSS
Data Source: Network Operations Center (NOC) of the operators
NDR: No data received. Audit of BSNL at its NOC for Bandwidth Utilization and Network Latency is yet
to be conducted. Auditors have not received any cooperation from the operator in helping the auditors
to conduct the audit.
5.9 TOTAL CAPACITY AND SUBSCRIBERS
Data Source: Operations and Maintenance Center (OMC) of the operators

TRAI Audit Broadband Report-Assam JFM Quarter-2015
46
SCO 47, 5th
Floor, Old Judicial Complex, Sector 15
Part 1, Gurgaon, Haryana – 122001
+91 (124) 4217300
www.imrbint.com
TRAI Audit Wireline Report-Assam Circle AMJ Quarter-2015
1
EAST
ZONE TRAI AUDIT WIRELINE REPORT – ASSAM CIRCLE
- AUDIT OF JFM QUARTER, 2016
TRAI Audit Wireline Report-Assam Circle JFM Quarter-2016
2
TABLE OF CONTENTS
1 Introduction .................................................................................................................................................. 5
1.1 About TRAI .......................................................................................................................................... 5
1.2 Objectives ............................................................................................................................................ 5
1.3 Coverage ............................................................................................................................................... 6
1.4 Audit Process ....................................................................................................................................... 6
1.5 Framework Used ................................................................................................................................. 7
1.5.1 PMR Reports - Significance and Methodology ............................................................................ 7
1.5.2 Live Calling - Significance and Methodology .............................................................................. 9
1.5.3 Audit Methodology........................................................................................................................ 13
1.5.4 Measurement Methodology ......................................................................................................... 14
1.6 Sampling Methodology ..................................................................................................................... 15
1.7 Colour Code to read the report ........................................................................................................ 15
2 Executive Summary ..................................................................................................................................... 16
2.1 PMR (Performance Monitoring Report) Data – JFM’15 .................................................................. 16
2.1.1 Fault Incidence / Clearance Statistics.......................................................................................... 16
2.1.2 POI (Point of Interconnection) Congestion ............................................................................... 17
2.1.3 Metering and Billing Credibility .................................................................................................. 17
2.1.4 Resolution of Billing Complaints ................................................................................................. 17
2.1.5 Period of Applying Credit/ Waiver .............................................................................................. 17
2.1.6 CLOSURE WITHIN 7 DAYS ......................................................................................................... 17
2.1.7 Response time to customer for assistance .................................................................................. 17
2.1.8 Refund of deposit within 60 days from closure .......................................................................... 17
2.2 3 Day Live Measurement ................................................................................................................... 18
2.2.1 POI (Point of Interconnection) Congestion ............................................................................... 18
2.3 Live Calling ......................................................................................................................................... 19
2.3.1 Faults Repair/ Clearance ............................................................................................................... 19
2.3.2 Resolutionof billing complaints ................................................................................................... 19
2.3.3 Response time to customer for assistance .................................................................................. 19
TRAI Audit Wireline Report-Assam Circle JFM Quarter-2016
3
2.3.4 Level 1 Services ............................................................................................................................... 19
3 Critical Findings - JFM’15 ........................................................................................................................... 20
4 Parameter Explanation and Detailed Findings - Comparison Between PMR and Live Calling/
Measurement Data .............................................................................................................................................. 21
4.1 Fault Incidence/ Clearance Related Services .................................................................................. 21
4.1.1 Parameter Explanation .................................................................................................................. 21
4.1.2 Detailed Findings - Fault Incidence ............................................................................................ 23
4.1.3 Detailed Findings - Fault repair by next day (Urban) ............................................................... 23
4.1.1 Detailed Findings - Fault repair by next day (Rural) ................................................................ 24
4.1.2 Findings - Fault repair within five working days (Urban) ........................................................ 24
4.1.1 Findings - Fault repair within Seven working days (Rural) ...................................................... 25
4.1.2 Detailed Findings - Mean time to repair .................................................................................... 25
4.2 Metering and billing credibility ....................................................................................................... 26
4.2.1 Parameter Explanation ................................................................................................................. 26
4.3 Response Time to Customer ............................................................................................................. 31
4.3.1 Parameter Explanation .................................................................................................................. 31
4.3.2 Calls Getting Connected and Answered ..................................................................................... 32
4.3.3 Call Answered by Operator within 90 Seconds ......................................................................... 32
4.4 Customer Care Promptness ............................................................................................................. 33
4.4.1 Parameter Explanation ................................................................................................................. 33
4.4.2 Findings - Closure Request Attended in 7 days ......................................................................... 33
4.5 Time taken to refund deposit after closure .................................................................................... 34
4.5.1 Parameter Explanation ................................................................................................................. 34
4.5.2 Findings - Refund of deposit after closure within 60 days ....................................................... 34
5 Annexure – JFM’15 ...................................................................................................................................... 35
5.1 Fault Incidence / Clearance Statistic .............................................................................................. 35
5.2 POI Congestion ................................................................................................................................. 36
5.3 Metering and Billing credibility ....................................................................................................... 37
5.4 Response time to the customer for assistance ............................................................................... 38
5.5 Customer Care - Promptness in attending customer request ...................................................... 38
TRAI Audit Wireline Report-Assam Circle JFM Quarter-2016
4
5.6 Time taken for refund of deposits after closure ............................................................................. 39
5.7 Live Calling for Level 1 Services ....................................................................................................... 39
5.8 Exchange capacity and Subscribers – Sample Exchanges ............................................................. 42
5.9 Exchanges selected as per sampling plan – BSNL.......................................................................... 42
5.10 Abbreviations .................................................................................................................................... 45
TRAI Audit Wireline Report-Assam Circle JFM Quarter-2016
5
1 INTRODUCTION
1.1 About TRAI
TRAI's mission is to create and nurture conditions for growth of telecommunications in the country in a
manner and at a pace that will enable India to play a leading role in the emerging global information
society. One of the main objectives of TRAI is to provide a fair and transparent policy environment
which promotes a level playing field and facilitates fair competition.
In pursuance of above objective, TRAI has been issuing regulations, order and directives to deal with
the issues or complaints raised by the operators as well as the consumers. These regulations, order and
directives have helped to nurture the growth of multi operator multi service - an open competitive
market from a government owned monopoly. Also, the directions, orders and regulations issued cover a
wide range of subjects including tariff, interconnection and quality of service as well as governance of
the Authority.
TRAI initiated a regulation - The Standards of Quality of Service of Basic Telephone Service (Wire line)
and Cellular Mobile Telephone Service Regulations, 2009 (7 of 2009) dated 20thMarch, 2009, the
"Standards of Quality of Service for Wireless Data Services Regulations, 2012 dated 4th
March 2012, and
the "Quality of Service of Broadband Service Regulations", 2006 (11 of 2006) dated 6th January, 2006 that
provide the benchmarks for the parameters on customer perception of service to be achieved by service
provider.
In order to assess the above regulations, TRAI has commissioned a third party agency to conduct the
audit of the service providers and check the performance of the operators on the various benchmarks
set by Telecom Regulatory Authority of India (TRAI).
1.2 OBJECTIVES
The primary objective of the Audit module is to -
Audit and Assess the Quality of Services being rendered by Basic (Wireline), Cellular Mobile
(Wireless), and Broadband service against the parameters notified by TRAI. (The parameters of
Quality of Services (QoS) have been specified by in the respective regulations published by
TRAI).
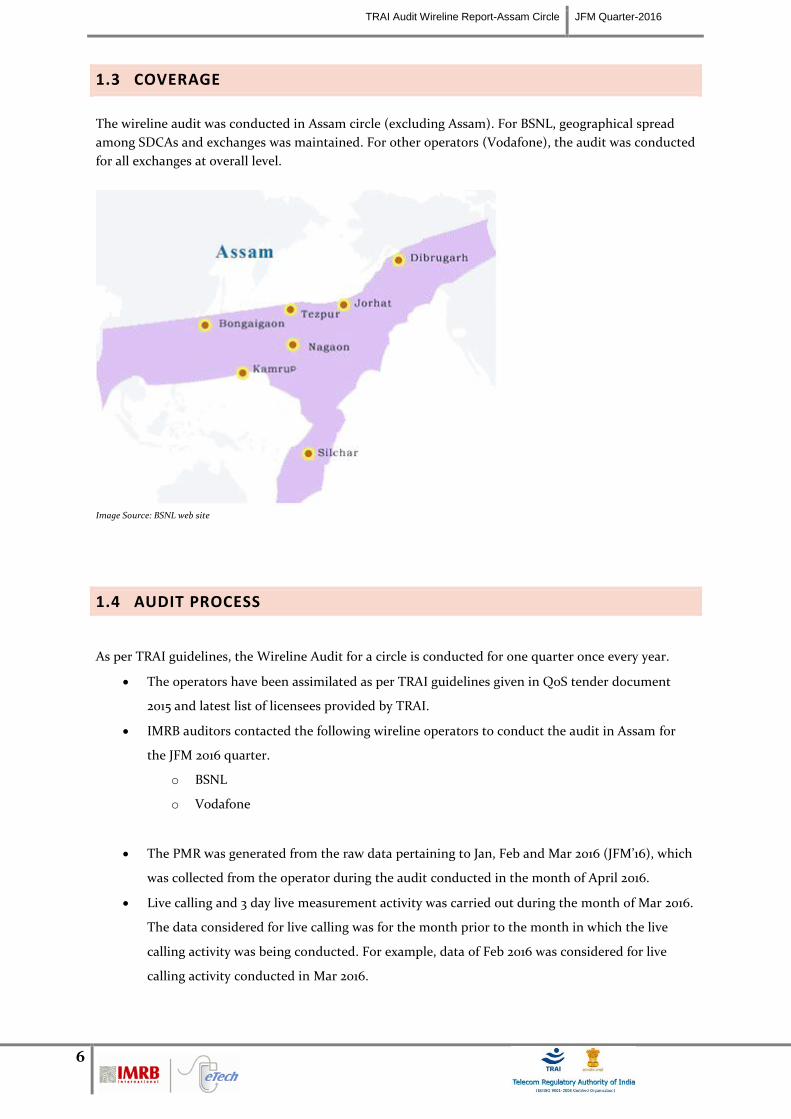
TRAI Audit Wireline Report-Assam Circle JFM Quarter-2016
6
1.3 COVERAGE
The wireline audit was conducted in Assam circle (excluding Assam). For BSNL, geographical spread
among SDCAs and exchanges was maintained. For other operators (Vodafone), the audit was conducted
for all exchanges at overall level.
Image Source: BSNL web site
1.4 AUDIT PROCESS
As per TRAI guidelines, the Wireline Audit for a circle is conducted for one quarter once every year.
The operators have been assimilated as per TRAI guidelines given in QoS tender document
2015 and latest list of licensees provided by TRAI.
IMRB auditors contacted the following wireline operators to conduct the audit in Assam for
the JFM 2016 quarter.
o BSNL
o Vodafone
The PMR was generated from the raw data pertaining to Jan, Feb and Mar 2016 (JFM’16), which
was collected from the operator during the audit conducted in the month of April 2016.
Live calling and 3 day live measurement activity was carried out during the month of Mar 2016.
The data considered for live calling was for the month prior to the month in which the live
calling activity was being conducted. For example, data of Feb 2016 was considered for live
calling activity conducted in Mar 2016.
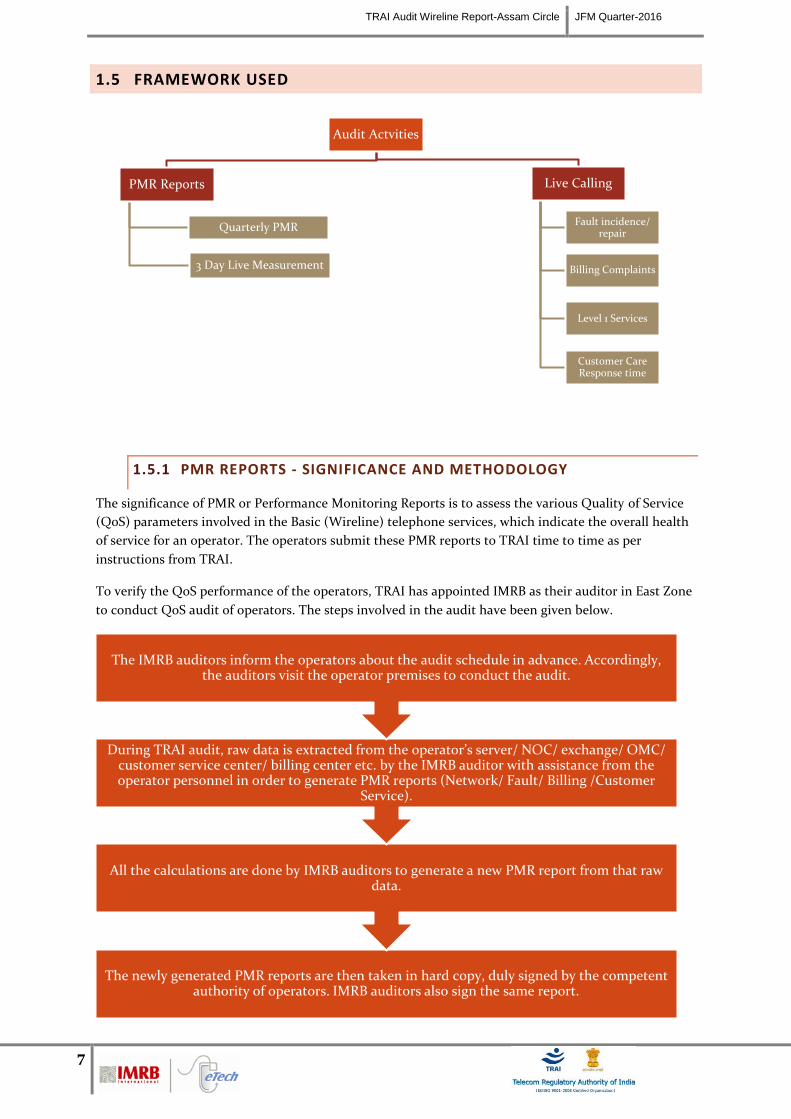
TRAI Audit Wireline Report-Assam Circle JFM Quarter-2016
7
1.5 FRAMEWORK USED
1.5.1 PMR REPORTS - SIGNIFICANCE AND METHODOLOGY
The significance of PMR or Performance Monitoring Reports is to assess the various Quality of Service
(QoS) parameters involved in the Basic (Wireline) telephone services, which indicate the overall health
of service for an operator. The operators submit these PMR reports to TRAI time to time as per
instructions from TRAI.
To verify the QoS performance of the operators, TRAI has appointed IMRB as their auditor in East Zone
to conduct QoS audit of operators. The steps involved in the audit have been given below.
Audit Actvities
PMR Reports
Quarterly PMR
3 Day Live Measurement
Live Calling
Fault incidence/ repair
Billing Complaints
Level 1 Services
Customer Care Response time
The newly generated PMR reports are then taken in hard copy, duly signed by the competent authority of operators. IMRB auditors also sign the same report.
All the calculations are done by IMRB auditors to generate a new PMR report from that raw data.
During TRAI audit, raw data is extracted from the operator’s server/ NOC/ exchange/ OMC/ customer service center/ billing center etc. by the IMRB auditor with assistance from the operator personnel in order to generate PMR reports (Network/ Fault/ Billing /Customer
Service).
The IMRB auditors inform the operators about the audit schedule in advance. Accordingly, the auditors visit the operator premises to conduct the audit.
TRAI Audit Wireline Report-Assam Circle JFM Quarter-2016
8
The raw data extracted is then used to generate PMR reports in the following formats.
Quarterly PMR
3 Day Live Measurement Data
Let us understand these formats in detail.
1.5.1.1 QUARTERLY PMR REPORT – PARAMETERS REVIEWED
The main purpose of quarterly PMR report is to verify the following key QoS parameters on quarterly basis as per the methodology stated above in section 1.4
Fault incidence/clearance related statistic
Mean Time to Repair (MTTR)
POI (Point of Interconnection) Congestion
Metering and billing credibility
Resolution of billing complaints
Customer care promptness
Time taken to refund of deposits after closure
1.5.1.2 3 DAY LIVE MEASUREMENT – METHODOLOGY AND PARAMETERS REVIEWED
The main purpose of 3 day live measurement is to evaluate the following parameters on intraday basis.
The auditors visit the sample exchanges (in case of BSNL) and main exchanges (in case of other
operators) to collect the 3 day live data for the following parameters
POI (Point of Interconnection) Congestion
While the quarterly PMR report provides an overall view of the performance of QoS parameters, the 3
day live data helps looking at intraday performance on the above given parameters. All the calculations
are then done on the basis of that raw data of 3 days.
1.5.1.3 TCBH – SIGNIFICANCE AND SELECTION METHODOLOGY
As per QoS regulations 2009 (7 of 2009), Time Consistent Busy Hour” or “TCBH” means the one hour
period starting at the same time each day for which the average traffic of the resource group concerned
is greatest over the days under consideration and such Time Consistent Busy Hour shall be established
on the basis of analysis of traffic data for a period of ninety days.
Step by step procedure to identify TCBH for an operator:
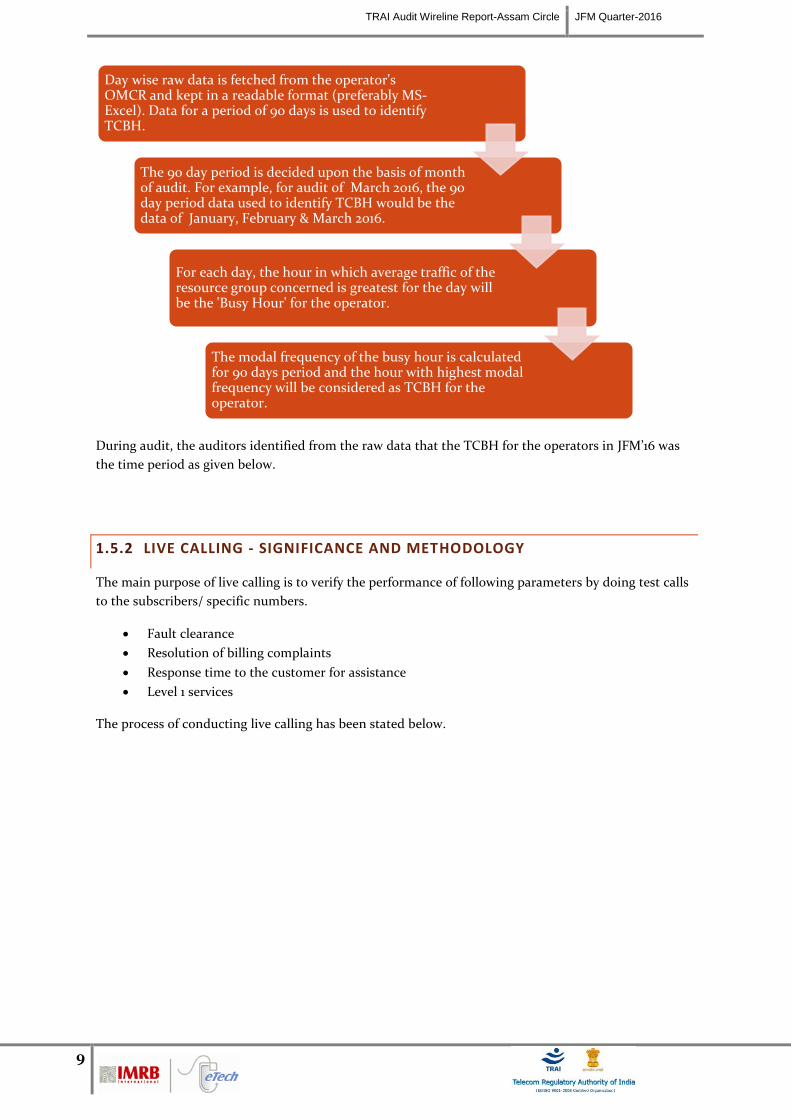
TRAI Audit Wireline Report-Assam Circle JFM Quarter-2016
9
During audit, the auditors identified from the raw data that the TCBH for the operators in JFM’16 was
the time period as given below.
1.5.2 LIVE CALLING - SIGNIFICANCE AND METHODOLOGY
The main purpose of live calling is to verify the performance of following parameters by doing test calls
to the subscribers/ specific numbers.
Fault clearance
Resolution of billing complaints
Response time to the customer for assistance
Level 1 services
The process of conducting live calling has been stated below.
Day wise raw data is fetched from the operator's OMCR and kept in a readable format (preferably MS-Excel). Data for a period of 90 days is used to identify TCBH.
The 90 day period is decided upon the basis of month of audit. For example, for audit of March 2016, the 90 day period data used to identify TCBH would be the data of January, February & March 2016.
For each day, the hour in which average traffic of the resource group concerned is greatest for the day will be the 'Busy Hour' for the operator.
The modal frequency of the busy hour is calculated for 90 days period and the hour with highest modal frequency will be considered as TCBH for the operator.
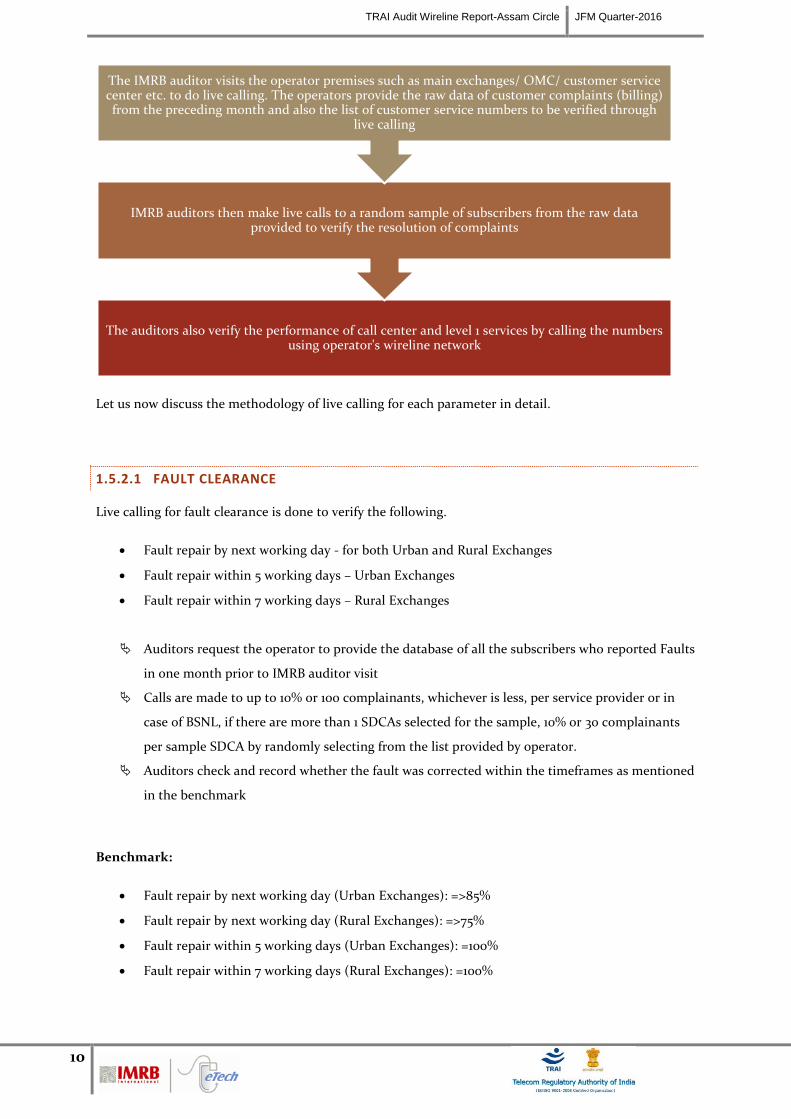
TRAI Audit Wireline Report-Assam Circle JFM Quarter-2016
10
Let us now discuss the methodology of live calling for each parameter in detail.
1.5.2.1 FAULT CLEARANCE
Live calling for fault clearance is done to verify the following.
Fault repair by next working day - for both Urban and Rural Exchanges
Fault repair within 5 working days – Urban Exchanges
Fault repair within 7 working days – Rural Exchanges
Auditors request the operator to provide the database of all the subscribers who reported Faults
in one month prior to IMRB auditor visit
Calls are made to up to 10% or 100 complainants, whichever is less, per service provider or in
case of BSNL, if there are more than 1 SDCAs selected for the sample, 10% or 30 complainants
per sample SDCA by randomly selecting from the list provided by operator.
Auditors check and record whether the fault was corrected within the timeframes as mentioned
in the benchmark
Benchmark:
Fault repair by next working day (Urban Exchanges): =>85%
Fault repair by next working day (Rural Exchanges): =>75%
Fault repair within 5 working days (Urban Exchanges): =100%
Fault repair within 7 working days (Rural Exchanges): =100%
The auditors also verify the performance of call center and level 1 services by calling the numbers using operator's wireline network
IMRB auditors then make live calls to a random sample of subscribers from the raw data provided to verify the resolution of complaints
The IMRB auditor visits the operator premises such as main exchanges/ OMC/ customer service center etc. to do live calling. The operators provide the raw data of customer complaints (billing) from the preceding month and also the list of customer service numbers to be verified through
live calling
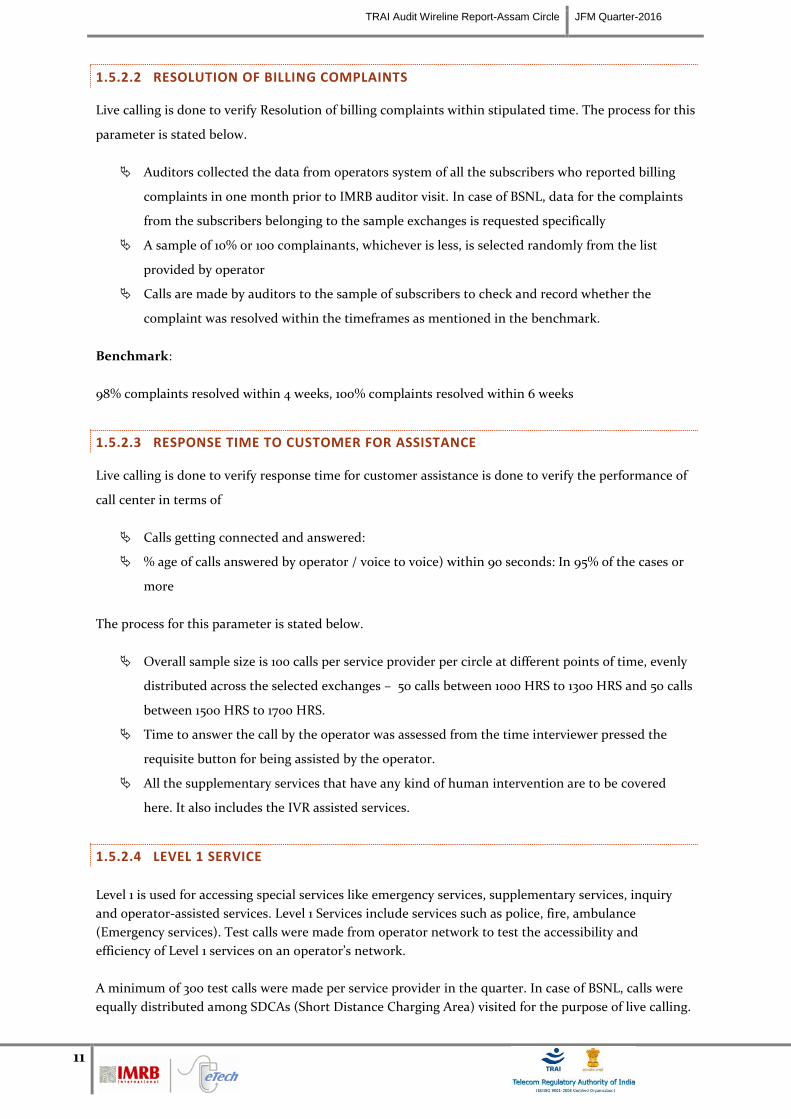
TRAI Audit Wireline Report-Assam Circle JFM Quarter-2016
11
1.5.2.2 RESOLUTION OF BILLING COMPLAINTS
Live calling is done to verify Resolution of billing complaints within stipulated time. The process for this
parameter is stated below.
Auditors collected the data from operators system of all the subscribers who reported billing
complaints in one month prior to IMRB auditor visit. In case of BSNL, data for the complaints
from the subscribers belonging to the sample exchanges is requested specifically
A sample of 10% or 100 complainants, whichever is less, is selected randomly from the list
provided by operator
Calls are made by auditors to the sample of subscribers to check and record whether the
complaint was resolved within the timeframes as mentioned in the benchmark.
Benchmark:
98% complaints resolved within 4 weeks, 100% complaints resolved within 6 weeks
1.5.2.3 RESPONSE TIME TO CUSTOMER FOR ASSISTANCE
Live calling is done to verify response time for customer assistance is done to verify the performance of
call center in terms of
Calls getting connected and answered:
% age of calls answered by operator / voice to voice) within 90 seconds: In 95% of the cases or
more
The process for this parameter is stated below.
Overall sample size is 100 calls per service provider per circle at different points of time, evenly
distributed across the selected exchanges – 50 calls between 1000 HRS to 1300 HRS and 50 calls
between 1500 HRS to 1700 HRS.
Time to answer the call by the operator was assessed from the time interviewer pressed the
requisite button for being assisted by the operator.
All the supplementary services that have any kind of human intervention are to be covered
here. It also includes the IVR assisted services.
1.5.2.4 LEVEL 1 SERVICE
Level 1 is used for accessing special services like emergency services, supplementary services, inquiry
and operator-assisted services. Level 1 Services include services such as police, fire, ambulance
(Emergency services). Test calls were made from operator network to test the accessibility and
efficiency of Level 1 services on an operator’s network.
A minimum of 300 test calls were made per service provider in the quarter. In case of BSNL, calls were
equally distributed among SDCAs (Short Distance Charging Area) visited for the purpose of live calling.
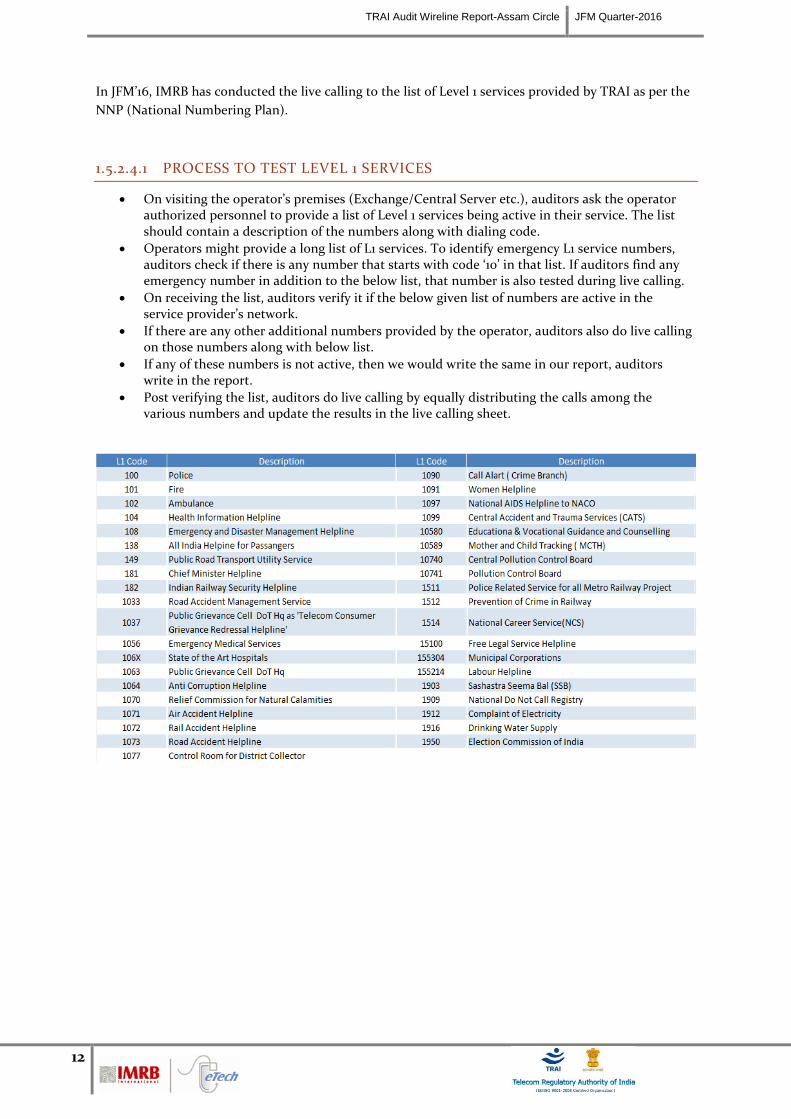
TRAI Audit Wireline Report-Assam Circle JFM Quarter-2016
12
In JFM’16, IMRB has conducted the live calling to the list of Level 1 services provided by TRAI as per the
NNP (National Numbering Plan).
1.5.2.4.1 PROCESS TO TEST LEVEL 1 SERVICES
On visiting the operator’s premises (Exchange/Central Server etc.), auditors ask the operator authorized personnel to provide a list of Level 1 services being active in their service. The list should contain a description of the numbers along with dialing code.
Operators might provide a long list of L1 services. To identify emergency L1 service numbers, auditors check if there is any number that starts with code ‘10’ in that list. If auditors find any emergency number in addition to the below list, that number is also tested during live calling.
On receiving the list, auditors verify it if the below given list of numbers are active in the service provider’s network.
If there are any other additional numbers provided by the operator, auditors also do live calling on those numbers along with below list.
If any of these numbers is not active, then we would write the same in our report, auditors write in the report.
Post verifying the list, auditors do live calling by equally distributing the calls among the various numbers and update the results in the live calling sheet.
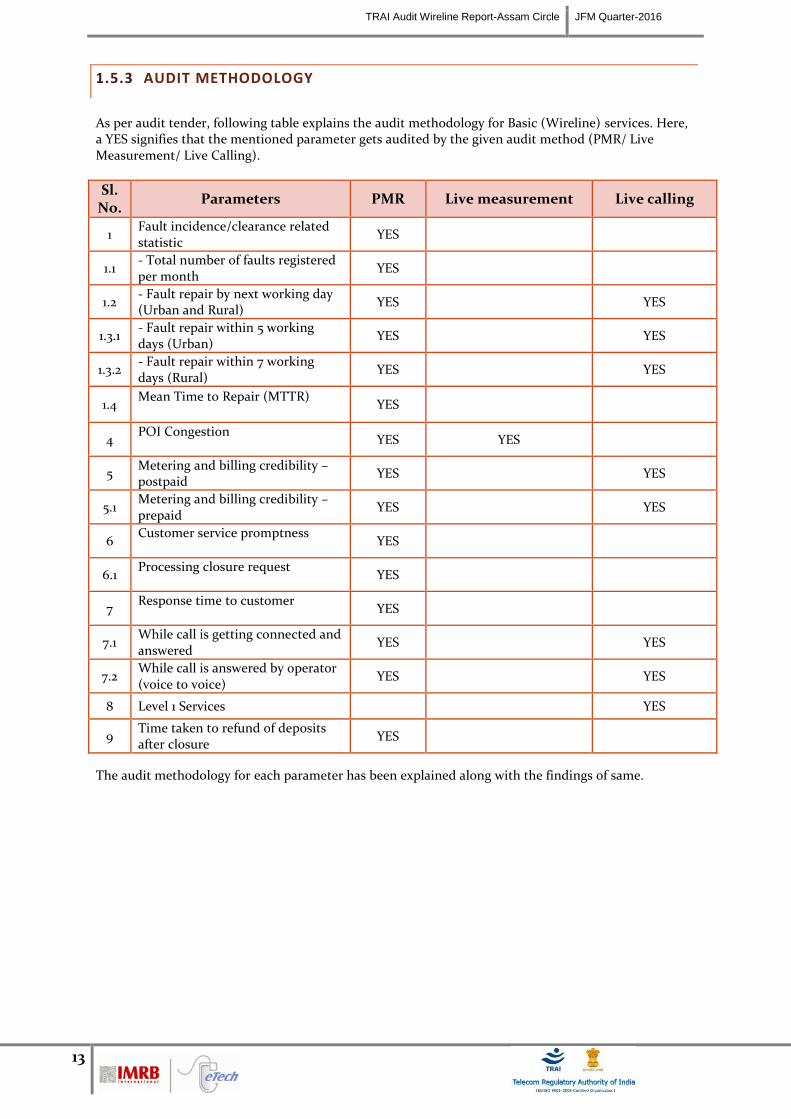
TRAI Audit Wireline Report-Assam Circle JFM Quarter-2016
13
1.5.3 AUDIT METHODOLOGY
As per audit tender, following table explains the audit methodology for Basic (Wireline) services. Here, a YES signifies that the mentioned parameter gets audited by the given audit method (PMR/ Live Measurement/ Live Calling).
Sl. No.
Parameters PMR Live measurement Live calling
1 Fault incidence/clearance related statistic
YES
1.1 - Total number of faults registered per month
YES
1.2 - Fault repair by next working day (Urban and Rural)
YES YES
1.3.1 - Fault repair within 5 working days (Urban)
YES YES
1.3.2 - Fault repair within 7 working days (Rural)
YES YES
1.4 Mean Time to Repair (MTTR)
YES
4 POI Congestion
YES YES
5 Metering and billing credibility – postpaid
YES YES
5.1 Metering and billing credibility – prepaid
YES YES
6 Customer service promptness
YES
6.1 Processing closure request
YES
7 Response time to customer
YES
7.1 While call is getting connected and answered
YES YES
7.2 While call is answered by operator (voice to voice)
YES YES
8 Level 1 Services YES
9 Time taken to refund of deposits after closure
YES
The audit methodology for each parameter has been explained along with the findings of same.
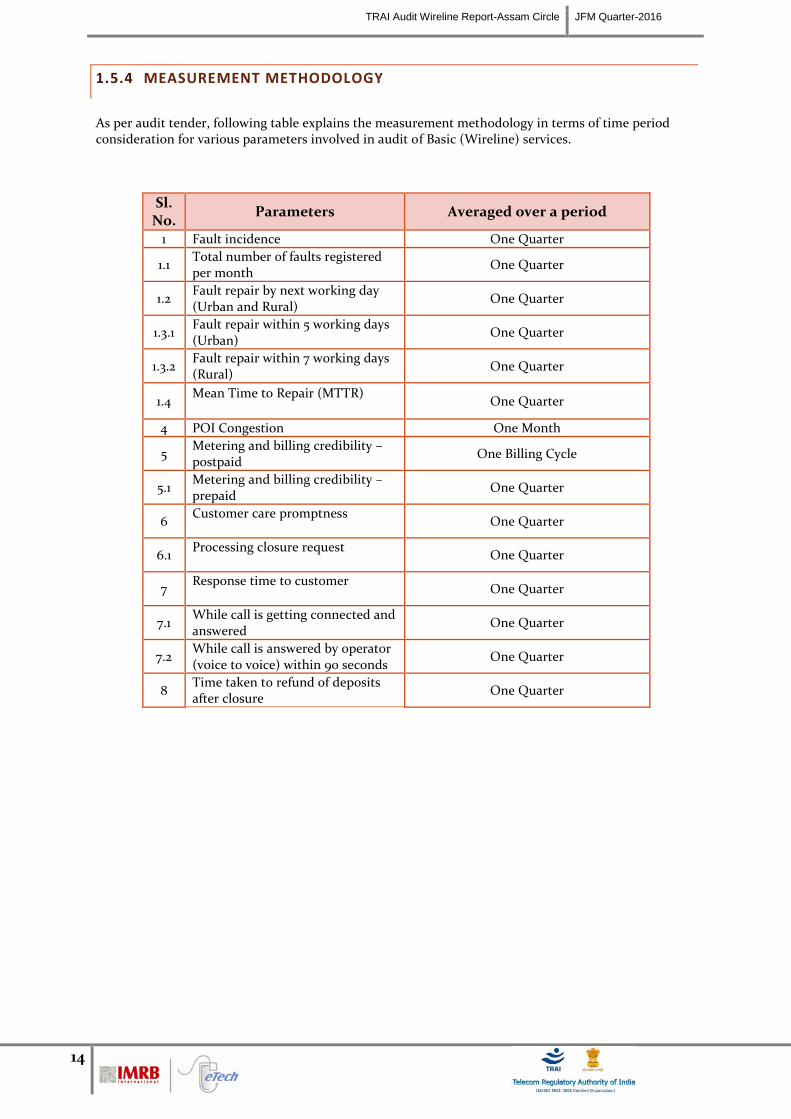
TRAI Audit Wireline Report-Assam Circle JFM Quarter-2016
14
1.5.4 MEASUREMENT METHODOLOGY
As per audit tender, following table explains the measurement methodology in terms of time period consideration for various parameters involved in audit of Basic (Wireline) services.
Sl. No.
Parameters Averaged over a period
1 Fault incidence One Quarter
1.1 Total number of faults registered per month
One Quarter
1.2 Fault repair by next working day (Urban and Rural)
One Quarter
1.3.1 Fault repair within 5 working days (Urban)
One Quarter
1.3.2 Fault repair within 7 working days (Rural)
One Quarter
1.4 Mean Time to Repair (MTTR)
One Quarter
4 POI Congestion One Month
5 Metering and billing credibility – postpaid
One Billing Cycle
5.1 Metering and billing credibility – prepaid
One Quarter
6 Customer care promptness
One Quarter
6.1 Processing closure request
One Quarter
7 Response time to customer
One Quarter
7.1 While call is getting connected and answered
One Quarter
7.2 While call is answered by operator (voice to voice) within 90 seconds
One Quarter
8 Time taken to refund of deposits after closure
One Quarter
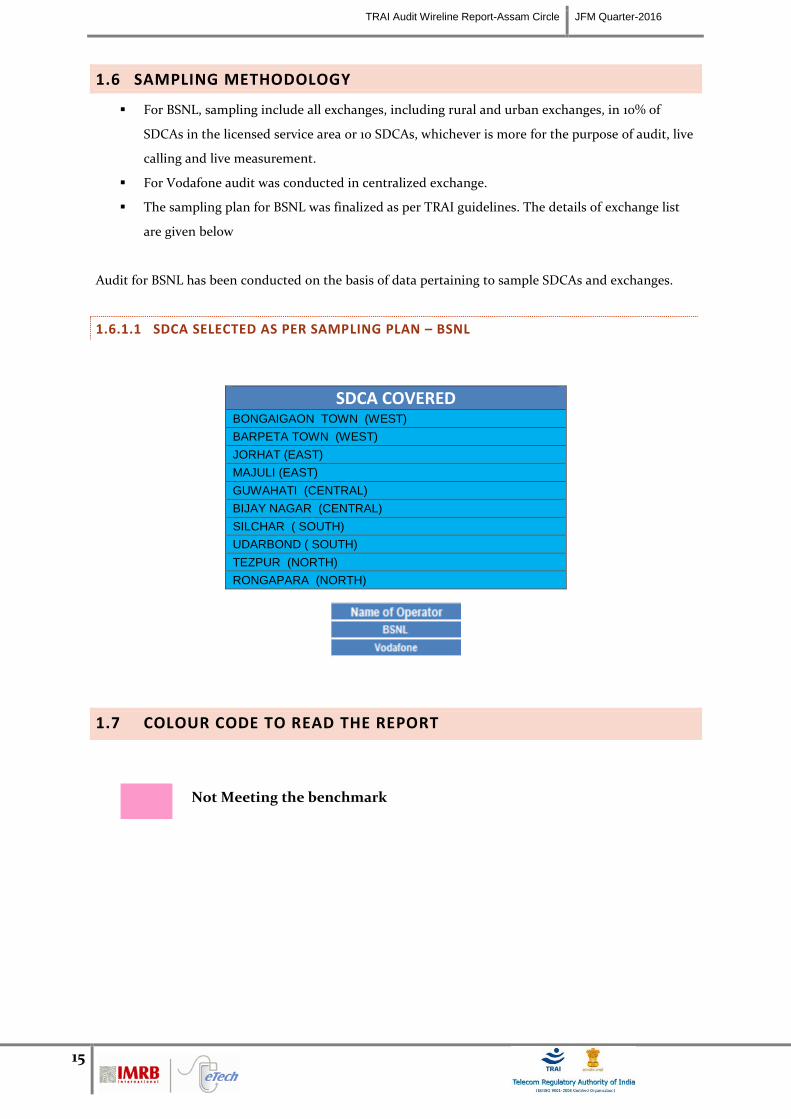
TRAI Audit Wireline Report-Assam Circle JFM Quarter-2016
15
1.6 SAMPLING METHODOLOGY
For BSNL, sampling include all exchanges, including rural and urban exchanges, in 10% of
SDCAs in the licensed service area or 10 SDCAs, whichever is more for the purpose of audit, live
calling and live measurement.
For Vodafone audit was conducted in centralized exchange.
The sampling plan for BSNL was finalized as per TRAI guidelines. The details of exchange list
are given below
Audit for BSNL has been conducted on the basis of data pertaining to sample SDCAs and exchanges.
1.6.1.1 SDCA SELECTED AS PER SAMPLING PLAN – BSNL
SDCA COVERED
BONGAIGAON TOWN (WEST)
BARPETA TOWN (WEST)
JORHAT (EAST)
MAJULI (EAST)
GUWAHATI (CENTRAL)
BIJAY NAGAR (CENTRAL)
SILCHAR ( SOUTH)
UDARBOND ( SOUTH)
TEZPUR (NORTH)
RONGAPARA (NORTH)
1.7 COLOUR CODE TO READ THE REPORT
Not Meeting the benchmark
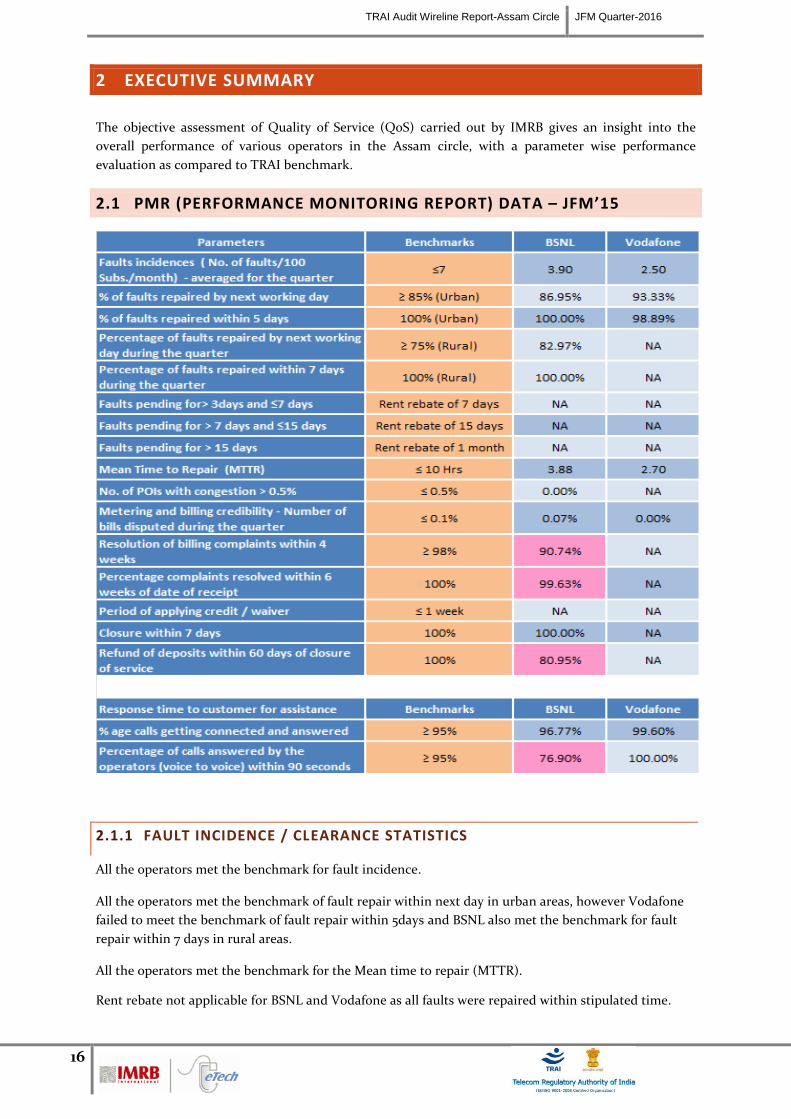
TRAI Audit Wireline Report-Assam Circle JFM Quarter-2016
16
2 EXECUTIVE SUMMARY
The objective assessment of Quality of Service (QoS) carried out by IMRB gives an insight into the
overall performance of various operators in the Assam circle, with a parameter wise performance
evaluation as compared to TRAI benchmark.
2.1 PMR (PERFORMANCE MONITORING REPORT) DATA – JFM’15
2.1.1 FAULT INCIDENCE / CLEARANCE STATISTICS
All the operators met the benchmark for fault incidence.
All the operators met the benchmark of fault repair within next day in urban areas, however Vodafone
failed to meet the benchmark of fault repair within 5days and BSNL als0 met the benchmark for fault
repair within 7 days in rural areas.
All the operators met the benchmark for the Mean time to repair (MTTR).
Rent rebate not applicable for BSNL and Vodafone as all faults were repaired within stipulated time.
TRAI Audit Wireline Report-Assam Circle JFM Quarter-2016
17
2.1.2 POI (POINT OF INTERCONNECTION) CONGESTION
BSNL met the benchmark by reporting 0% POIs with congestion.
NA: In case of POI for Vodafone, there is no direct POI from Wireline MSC. All Calls are getting routed
via Inter MSC TGs with GSM MSCs. So, Total number of working POI is not present in the wireline
system of Vodafone. The operator system is not equipped to provide the POI data separately for
wireline.
2.1.3 METERING AND BILLING CREDIBILITY
All the operators met the benchmark for metering and billing credibility.
2.1.4 RESOLUTION OF BILLING COMPLAINTS
BSNL failed to meet the benchmark for resolution of billing complaints within 4 weeks and for
resolution of billing complaints within 6 weeks.
NA: Parameter not applicable for Vodafone as no billing complaints were logged in the audit period.
2.1.5 PERIOD OF APPLYING CREDIT/ WAIVER
NA: BSNL and Vodafone had no cases where credit/ waiver were required during the audit period.
2.1.6 CLOSURE WITHIN 7 DAYS
BSNL met the benchmark for the parameter..
2.1.7 RESPONSE TIME TO CUSTOMER FOR ASSISTANCE
BSNL & Vodafone met the TRAI benchmark in terms of number of IVR calls being connected and
answered.
The benchmark of 95% of voice to voice calls answered within stipulated time of 90 seconds was not
met by BSNL while Vodafone was able to meet the benchmark for the parameter.
2.1.8 REFUND OF DEPOSIT WITHIN 60 DAYS FROM CLOSURE
BSNL did not meet the benchmark for the parameter.
NA: Vodafone did not have any closure request during the audit period.
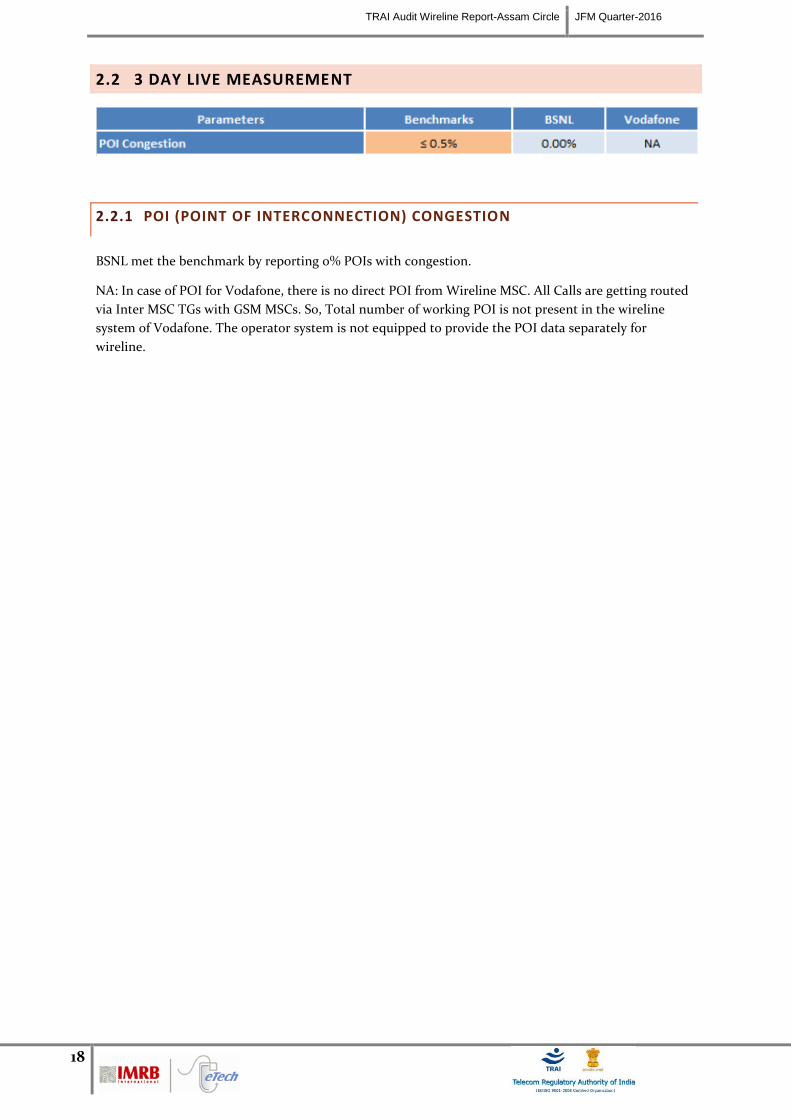
TRAI Audit Wireline Report-Assam Circle JFM Quarter-2016
18
2.2 3 DAY LIVE MEASUREMENT
2.2.1 POI (POINT OF INTERCONNECTION) CONGESTION
BSNL met the benchmark by reporting 0% POIs with congestion.
NA: In case of POI for Vodafone, there is no direct POI from Wireline MSC. All Calls are getting routed
via Inter MSC TGs with GSM MSCs. So, Total number of working POI is not present in the wireline
system of Vodafone. The operator system is not equipped to provide the POI data separately for
wireline.
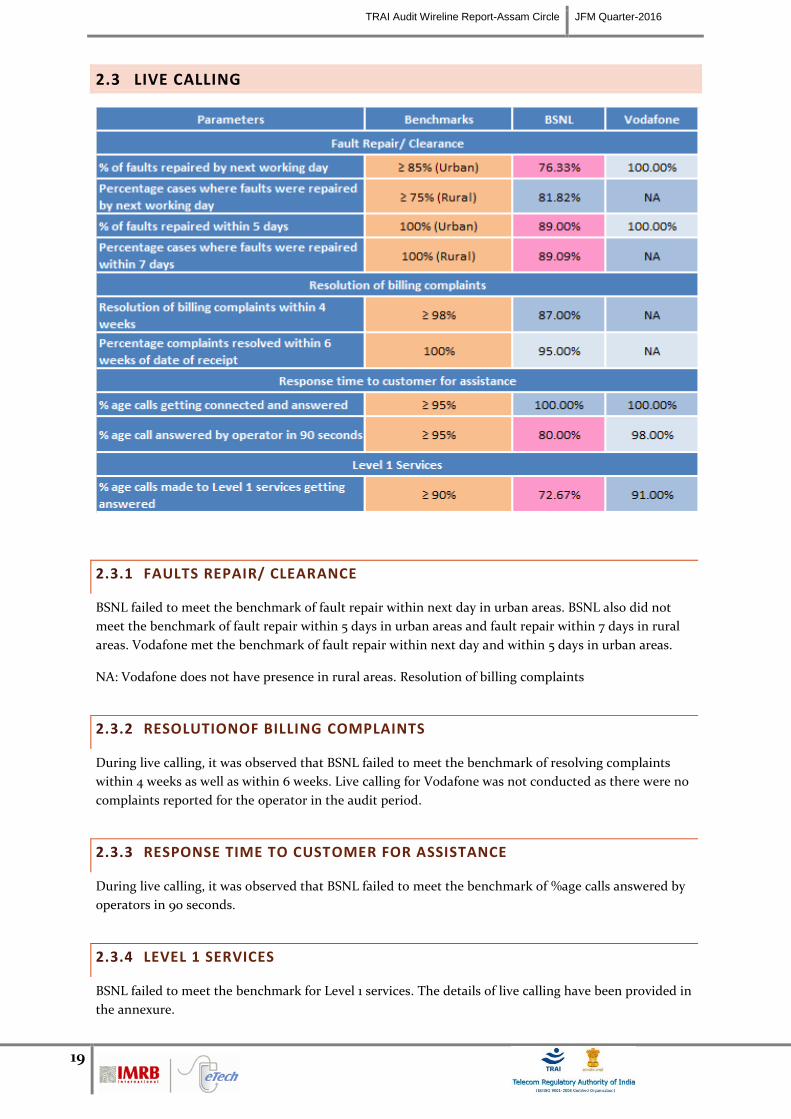
TRAI Audit Wireline Report-Assam Circle JFM Quarter-2016
19
2.3 LIVE CALLING
2.3.1 FAULTS REPAIR/ CLEARANCE
BSNL failed to meet the benchmark of fault repair within next day in urban areas. BSNL also did not
meet the benchmark of fault repair within 5 days in urban areas and fault repair within 7 days in rural
areas. Vodafone met the benchmark of fault repair within next day and within 5 days in urban areas.
NA: Vodafone does not have presence in rural areas. Resolution of billing complaints
2.3.2 RESOLUTIONOF BILLING COMPLAINTS
During live calling, it was observed that BSNL failed to meet the benchmark of resolving complaints
within 4 weeks as well as within 6 weeks. Live calling for Vodafone was not conducted as there were no
complaints reported for the operator in the audit period.
2.3.3 RESPONSE TIME TO CUSTOMER FOR ASSISTANCE
During live calling, it was observed that BSNL failed to meet the benchmark of %age calls answered by
operators in 90 seconds.
2.3.4 LEVEL 1 SERVICES
BSNL failed to meet the benchmark for Level 1 services. The details of live calling have been provided in
the annexure.
TRAI Audit Wireline Report-Assam Circle AMJ Quarter-2015
20
3 CRITICAL FINDINGS - JFM’15
Fault Incidence/ Clearance Statistic/ POI
Vodafone failed to meet the benchmark of fault repair within 5days.
Rent rebate not applicable for BSNL and Vodafone as all faults were repaired within stipulated
time.
BSNL met the benchmark by reporting 0% POIs with congestion.
o NA: In case of POI for Vodafone, there is no direct POI from Wireline MSC. All Calls
are getting routed via Inter MSC TGs with GSM MSCs. So, Total number of working
POI is not present in the wireline system of Vodafone. The operator system is not
equipped to provide the POI data separately for wireline.
Resolution of Billing Complaints
BSNL failed to meet the benchmark for resolution of billing complaints within 4 weeks and for
resolution of billing complaints within 6 weeks.
NA: Parameter not applicable for Vodafone as no billing complaints were logged in the audit
period.
Response time for customer assistance
The benchmark of 95% of voice to voice calls answered within stipulated time of 90 seconds
was not met by BSNL.
Refund of deposit within 60 days from closure
BSNL did not meet the benchmark for the parameter.
NA: Vodafone did not have any closure request during the audit period.
Live Calling
BSNL failed to meet the benchmark of fault repair within next day in urban areas. BSNL also
did not meet the benchmark of fault repair within 5 days in urban areas and fault repair within
7 days in rural areas. Vodafone met the benchmark of fault repair within next day and within 5
days in urban areas.
NA: Vodafone does not have presence in rural areas. Resolution of billing complaints
During live calling, it was observed that BSNL failed to meet the benchmark of resolving
complaints within 4 weeks as well as within 6 weeks. Live calling for Vodafone was not
conducted as there were no complaints reported for the operator in the audit period.
During live calling, it was observed that BSNL failed to meet the benchmark of %age calls
answered by operators in 90 seconds.
BSNL failed to meet the benchmark for Level 1 services. The details of live calling have been
provided in the annexure.
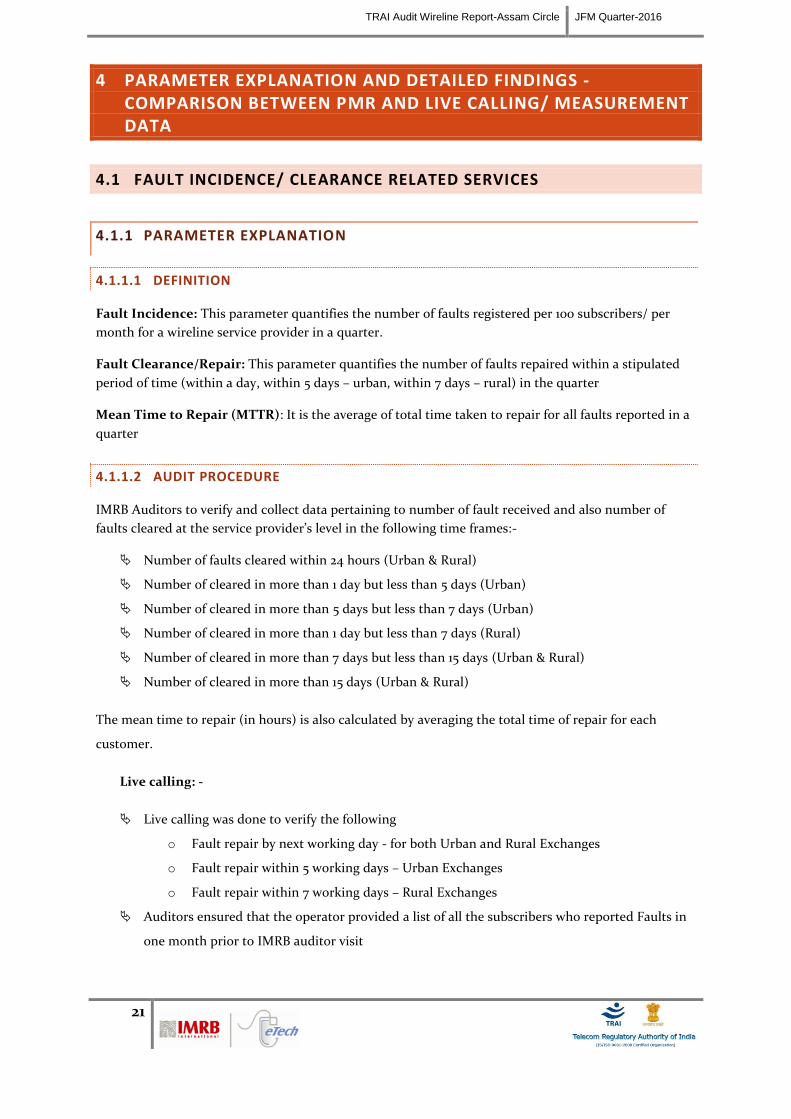
TRAI Audit Wireline Report-Assam Circle JFM Quarter-2016
21
4 PARAMETER EXPLANATION AND DETAILED FINDINGS - COMPARISON BETWEEN PMR AND LIVE CALLING/ MEASUREMENT DATA
4.1 FAULT INCIDENCE/ CLEARANCE RELATED SERVICES
4.1.1 PARAMETER EXPLANATION
4.1.1.1 DEFINITION
Fault Incidence: This parameter quantifies the number of faults registered per 100 subscribers/ per
month for a wireline service provider in a quarter.
Fault Clearance/Repair: This parameter quantifies the number of faults repaired within a stipulated
period of time (within a day, within 5 days – urban, within 7 days – rural) in the quarter
Mean Time to Repair (MTTR): It is the average of total time taken to repair for all faults reported in a
quarter
4.1.1.2 AUDIT PROCEDURE
IMRB Auditors to verify and collect data pertaining to number of fault received and also number of
faults cleared at the service provider’s level in the following time frames:-
Number of faults cleared within 24 hours (Urban & Rural)
Number of cleared in more than 1 day but less than 5 days (Urban)
Number of cleared in more than 5 days but less than 7 days (Urban)
Number of cleared in more than 1 day but less than 7 days (Rural)
Number of cleared in more than 7 days but less than 15 days (Urban & Rural)
Number of cleared in more than 15 days (Urban & Rural)
The mean time to repair (in hours) is also calculated by averaging the total time of repair for each
customer.
Live calling: -
Live calling was done to verify the following
o Fault repair by next working day - for both Urban and Rural Exchanges
o Fault repair within 5 working days – Urban Exchanges
o Fault repair within 7 working days – Rural Exchanges
Auditors ensured that the operator provided a list of all the subscribers who reported Faults in
one month prior to IMRB auditor visit
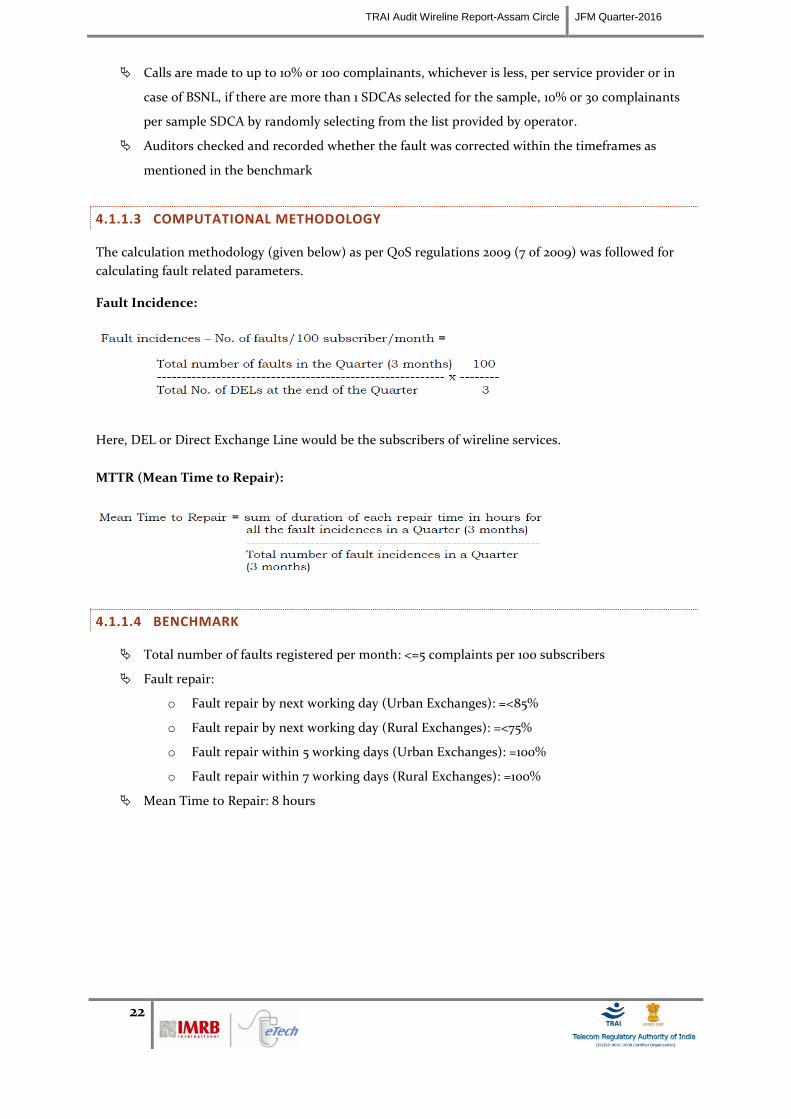
TRAI Audit Wireline Report-Assam Circle JFM Quarter-2016
22
Calls are made to up to 10% or 100 complainants, whichever is less, per service provider or in
case of BSNL, if there are more than 1 SDCAs selected for the sample, 10% or 30 complainants
per sample SDCA by randomly selecting from the list provided by operator.
Auditors checked and recorded whether the fault was corrected within the timeframes as
mentioned in the benchmark
4.1.1.3 COMPUTATIONAL METHODOLOGY
The calculation methodology (given below) as per QoS regulations 2009 (7 of 2009) was followed for
calculating fault related parameters.
Fault Incidence:
Here, DEL or Direct Exchange Line would be the subscribers of wireline services.
MTTR (Mean Time to Repair):
4.1.1.4 BENCHMARK
Total number of faults registered per month: <=5 complaints per 100 subscribers
Fault repair:
o Fault repair by next working day (Urban Exchanges): =<85%
o Fault repair by next working day (Rural Exchanges): =<75%
o Fault repair within 5 working days (Urban Exchanges): =100%
o Fault repair within 7 working days (Rural Exchanges): =100%
Mean Time to Repair: 8 hours
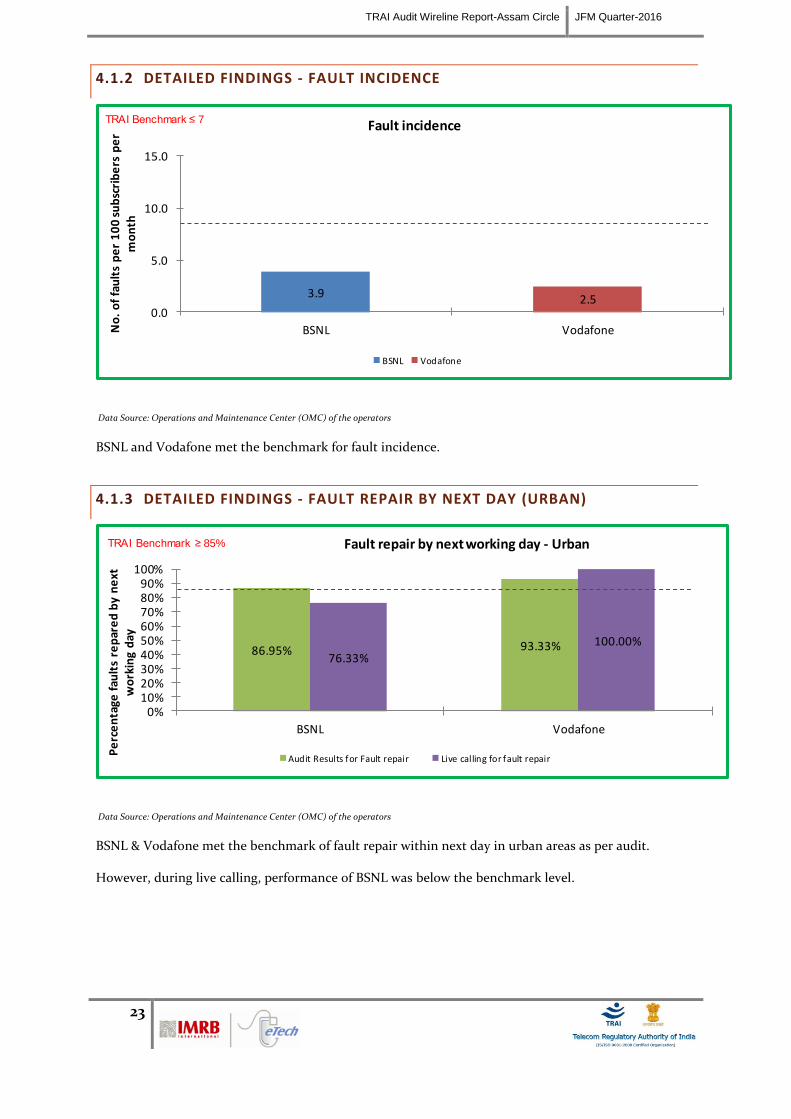
TRAI Audit Wireline Report-Assam Circle JFM Quarter-2016
23
4.1.2 DETAILED FINDINGS - FAULT INCIDENCE
3.9 2.50.0
5.0
10.0
15.0
BSNL VodafoneNo
. o
f fa
ult
s p
er
10
0 s
ub
scri
be
rs p
er
mo
nth
Fault incidence
BSNL Vodafone
TRAI Benchmark ≤ 7
Data Source: Operations and Maintenance Center (OMC) of the operators
BSNL and Vodafone met the benchmark for fault incidence.
4.1.3 DETAILED FINDINGS - FAULT REPAIR BY NEXT DAY (URBAN)
86.95% 93.33%76.33%
100.00%
0%10%20%30%40%50%60%70%80%90%
100%
BSNL Vodafone
Pe
rce
nta
ge f
ault
s re
par
ed
by
ne
xt
wo
rkin
g d
ay
Fault repair by next working day - Urban
Audit Results for Fault repair Live calling for fault repair
TRAI Benchmark ≥ 85%
Data Source: Operations and Maintenance Center (OMC) of the operators
BSNL & Vodafone met the benchmark of fault repair within next day in urban areas as per audit.
However, during live calling, performance of BSNL was below the benchmark level.
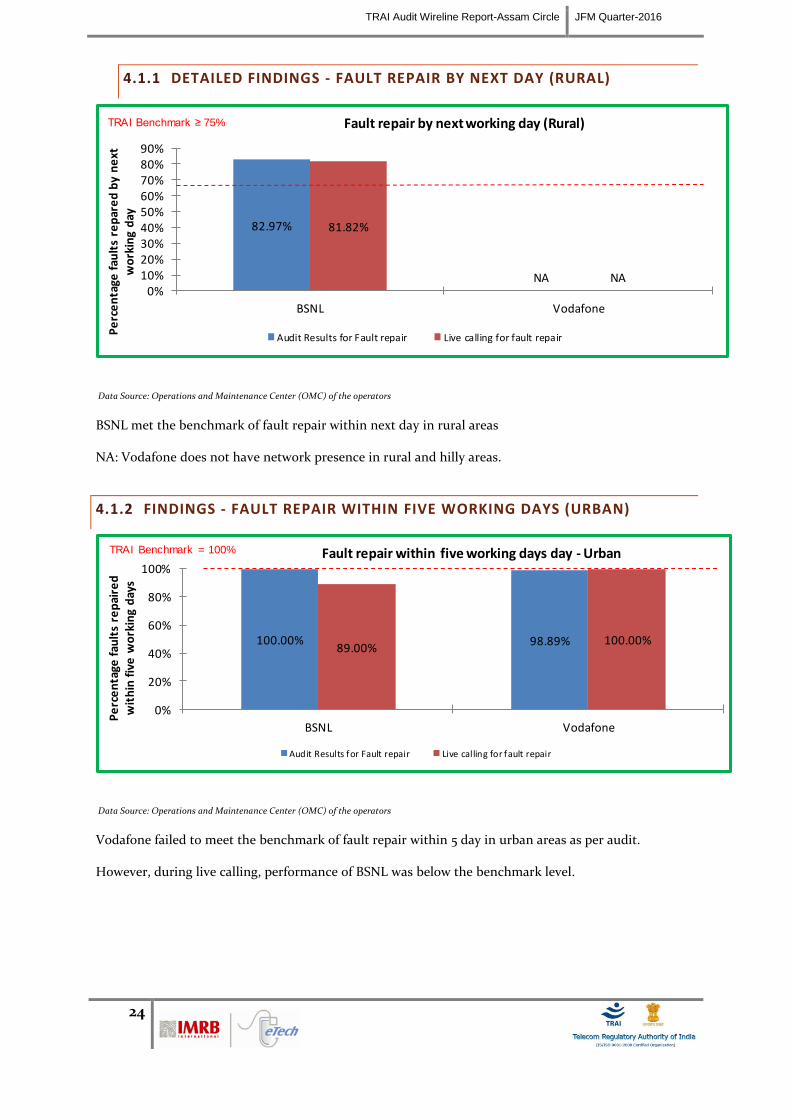
TRAI Audit Wireline Report-Assam Circle JFM Quarter-2016
24
4.1.1 DETAILED FINDINGS - FAULT REPAIR BY NEXT DAY (RURAL)
82.97%
NA
81.82%
NA0%
10%20%30%40%50%60%70%80%90%
BSNL Vodafone
Pe
rce
nta
ge f
ault
s re
par
ed
by
ne
xt
wo
rkin
g d
ayFault repair by next working day (Rural)
Audit Results for Fault repair Live calling for fault repair
TRAI Benchmark ≥ 75%
Data Source: Operations and Maintenance Center (OMC) of the operators
BSNL met the benchmark of fault repair within next day in rural areas
NA: Vodafone does not have network presence in rural and hilly areas.
4.1.2 FINDINGS - FAULT REPAIR WITHIN FIVE WORKING DAYS (URBAN)
100.00% 98.89%89.00%
100.00%
0%
20%
40%
60%
80%
100%
BSNL Vodafone
Pe
rce
nta
ge f
ault
s re
pai
red
w
ith
in f
ive
wo
rkin
g d
ays
Fault repair within five working days day - Urban
Audit Results for Fault repair Live calling for fault repair
TRAI Benchmark = 100%
Data Source: Operations and Maintenance Center (OMC) of the operators
Vodafone failed to meet the benchmark of fault repair within 5 day in urban areas as per audit.
However, during live calling, performance of BSNL was below the benchmark level.
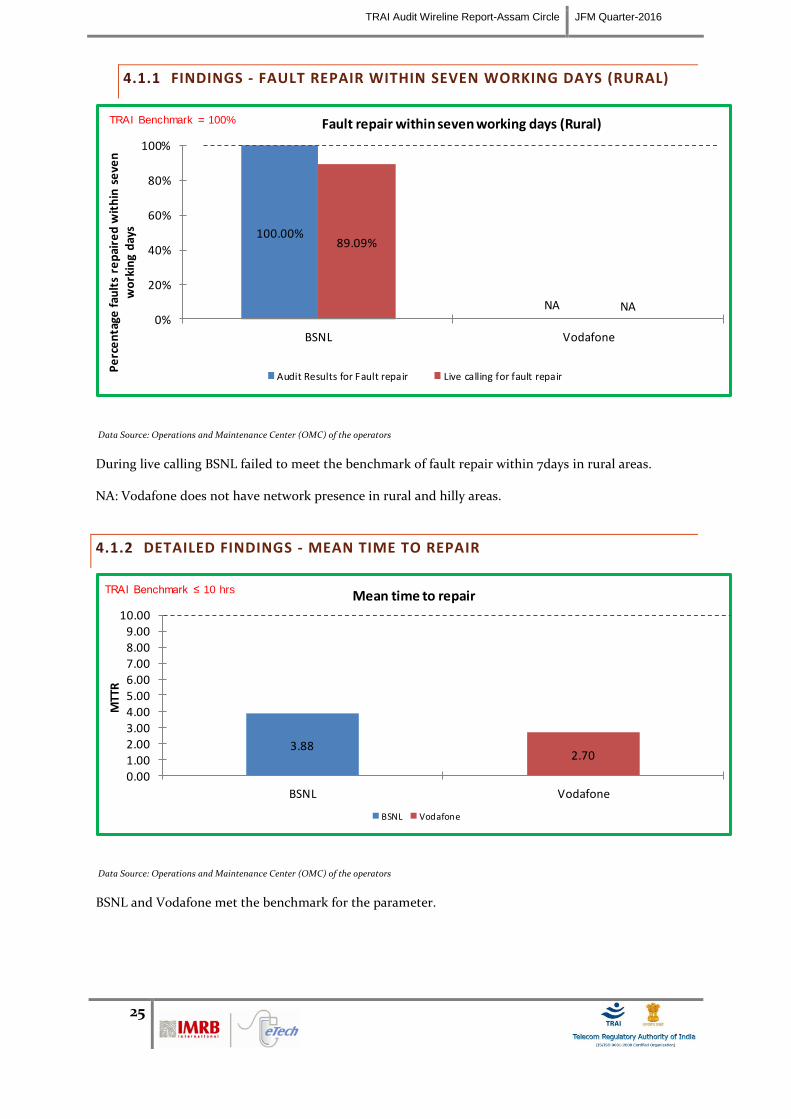
TRAI Audit Wireline Report-Assam Circle JFM Quarter-2016
25
4.1.1 FINDINGS - FAULT REPAIR WITHIN SEVEN WORKING DAYS (RURAL)
100.00%
NA
89.09%
NA0%
20%
40%
60%
80%
100%
BSNL Vodafone
Pe
rce
nta
ge f
ault
s re
pai
red
wit
hin
se
ven
w
ork
ing
day
sFault repair within seven working days (Rural)
Audit Results for Fault repair Live calling for fault repair
TRAI Benchmark = 100%
Data Source: Operations and Maintenance Center (OMC) of the operators
During live calling BSNL failed to meet the benchmark of fault repair within 7days in rural areas.
NA: Vodafone does not have network presence in rural and hilly areas.
4.1.2 DETAILED FINDINGS - MEAN TIME TO REPAIR
3.882.70
0.001.002.003.004.005.006.007.008.009.00
10.00
BSNL Vodafone
MTT
R
Mean time to repair
BSNL Vodafone
TRAI Benchmark ≤ 10 hrs
Data Source: Operations and Maintenance Center (OMC) of the operators
BSNL and Vodafone met the benchmark for the parameter.
TRAI Audit Wireline Report-Assam Circle JFM Quarter-2016
26
4.2 METERING AND BILLING CREDIBILITY
4.2.1 PARAMETER EXPLANATION
All the complaints related to billing as per clause 3.7.2 of QoS regulation of 20th
March, 2009 were
covered. The types of billing complaints covered are listed below.
Payments made and not credited to the subscriber account
Payment made on time but late payment charge levied wrongly
Double charges
Charging for toll free services
Local calls charged/billed as STD/ISD or vice versa
Calls made disputed
Credit agreed to be given in resolution of complaint, but not accounted in the bill
Charging for services provided without consent
Charging not as per tariff plans
Overcharging or undercharging
In addition to the above, any billing complaint which leads to billing error, waiver, refund, credit, or any
adjustment is also considered as a valid billing complaint for calculating the number of disputed bills.
4.2.1.1 AUDIT PROCEDURE
IMRB Auditors to verify and collect data pertaining to –
Number of Billing complaints received at the service provider’s level
Last billing cycle stated should be such that due date for payment of bills must be beyond the
date when this form is filled.
Include all types of bills generated for customers. This could include online as well as other
forms of bills presentation including printed bills
Billing complaint is any of written complaint/ personal visit/ telephonic complaint related to:
Excess metering/ wrong tariff scheme charged, Payment made in time but charged penalty/ not
reflected in next bill, Last payment not reflected in bill, Adjustment/ waiver not done, Anything
else related to bills, Toll free numbers charged etc.
Billing complaints resolution database, with opening and closing date of complaint to identify
the time taken to resolve a complaint
TRAI Audit Wireline Report-Assam Circle JFM Quarter-2016
27
Live calling:
Auditors request the operator provided the database of all the subscribers who reported billing
complaints in one month prior to IMRB auditor visit. In case of BSNL, data for the complaints
from the subscribers belonging to the sample exchanges is requested specifically
A sample of 10% or 100 complainants, whichever is less, is selected randomly from the list
provided by operator
Calls are made by auditors to the sample of subscribers to check and record whether the
complaint was resolved within the timeframes as mentioned in the benchmark.
Benchmarks:
98% complaints resolved within 4 weeks, 100% complaints resolved within 6 weeks
4.2.1.2 COMPUTATIONAL METHODOLOGY – METERING AND BILLING CREDIBILITY
The calculation methodology (given below) as per QoS regulations 2009 (7 of 2009) was followed to
calculate incidence of billing complaints.
*Operator to include all types of bills generated for customers. This would include
printed bills, online bills and any other forms of bills generated
**Billing complaints here shall include only dispute related issues (including those that
may arise because of a lack of awareness at the subscribers’ end). It does not include
any provisional issues (such as delayed dispatch of billing statements, etc.) in which
the operator has opened a ticket internally.
TRAI Benchmark: <= 0.1%
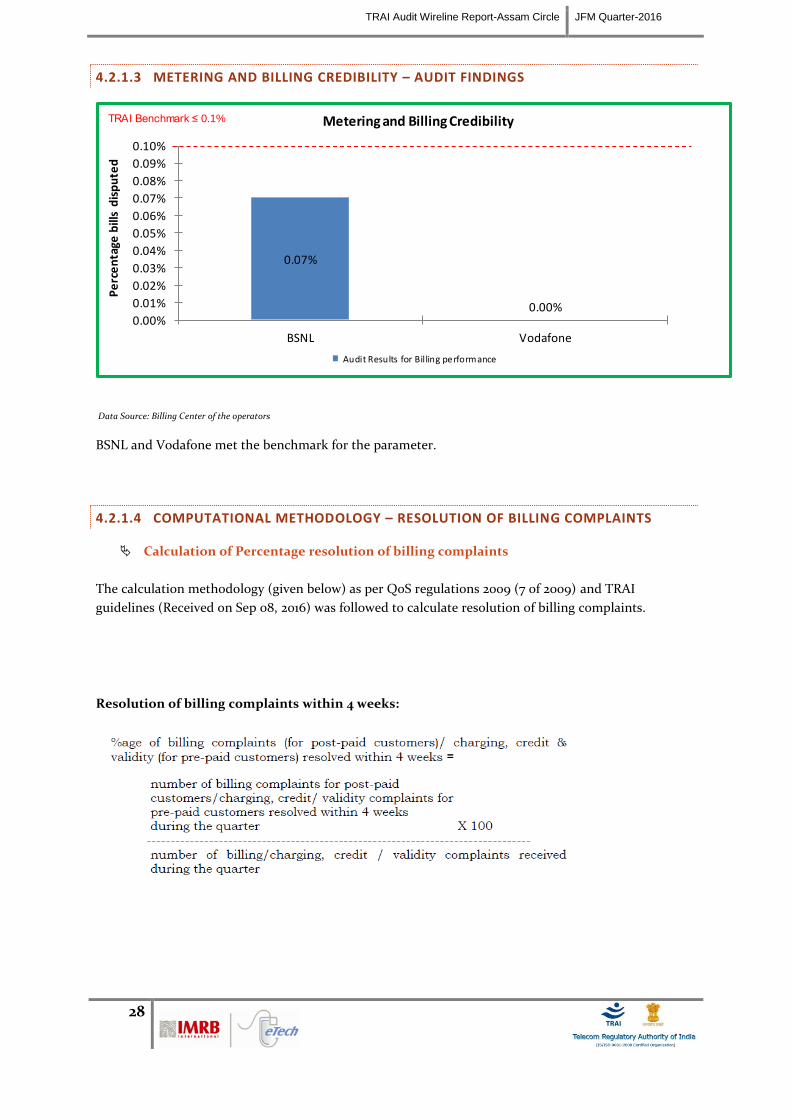
TRAI Audit Wireline Report-Assam Circle JFM Quarter-2016
28
4.2.1.3 METERING AND BILLING CREDIBILITY – AUDIT FINDINGS
0.07%
0.00%0.00%
0.01%
0.02%
0.03%
0.04%
0.05%
0.06%
0.07%
0.08%
0.09%
0.10%
BSNL Vodafone
Pe
rce
nta
ge b
ills
dis
pu
ted
Metering and Billing Credibility
Audit Results for Billing performance
TRAI Benchmark ≤ 0.1%
Data Source: Billing Center of the operators
BSNL and Vodafone met the benchmark for the parameter.
4.2.1.4 COMPUTATIONAL METHODOLOGY – RESOLUTION OF BILLING COMPLAINTS
Calculation of Percentage resolution of billing complaints
The calculation methodology (given below) as per QoS regulations 2009 (7 of 2009) and TRAI
guidelines (Received on Sep 08, 2016) was followed to calculate resolution of billing complaints.
Resolution of billing complaints within 4 weeks:
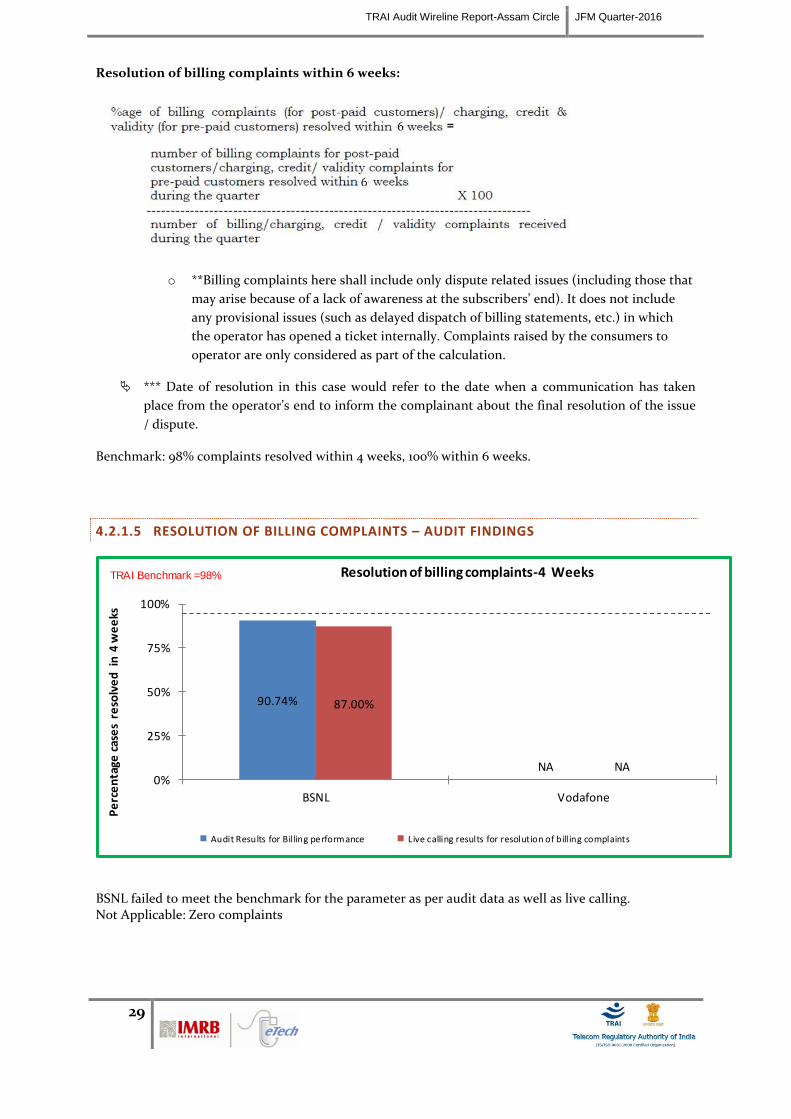
TRAI Audit Wireline Report-Assam Circle JFM Quarter-2016
29
Resolution of billing complaints within 6 weeks:
o **Billing complaints here shall include only dispute related issues (including those that
may arise because of a lack of awareness at the subscribers’ end). It does not include
any provisional issues (such as delayed dispatch of billing statements, etc.) in which
the operator has opened a ticket internally. Complaints raised by the consumers to
operator are only considered as part of the calculation.
*** Date of resolution in this case would refer to the date when a communication has taken
place from the operator’s end to inform the complainant about the final resolution of the issue
/ dispute.
Benchmark: 98% complaints resolved within 4 weeks, 100% within 6 weeks.
4.2.1.5 RESOLUTION OF BILLING COMPLAINTS – AUDIT FINDINGS
90.74%
NA
87.00%
NA0%
25%
50%
75%
100%
BSNL Vodafone
Pe
rce
nta
ge c
ase
s re
solv
ed
in
4 w
ee
ks
Resolution of billing complaints-4 Weeks
Audit Results for Billing performance Live calling results for resolution of billing complaints
TRAI Benchmark =98%
BSNL failed to meet the benchmark for the parameter as per audit data as well as live calling. Not Applicable: Zero complaints
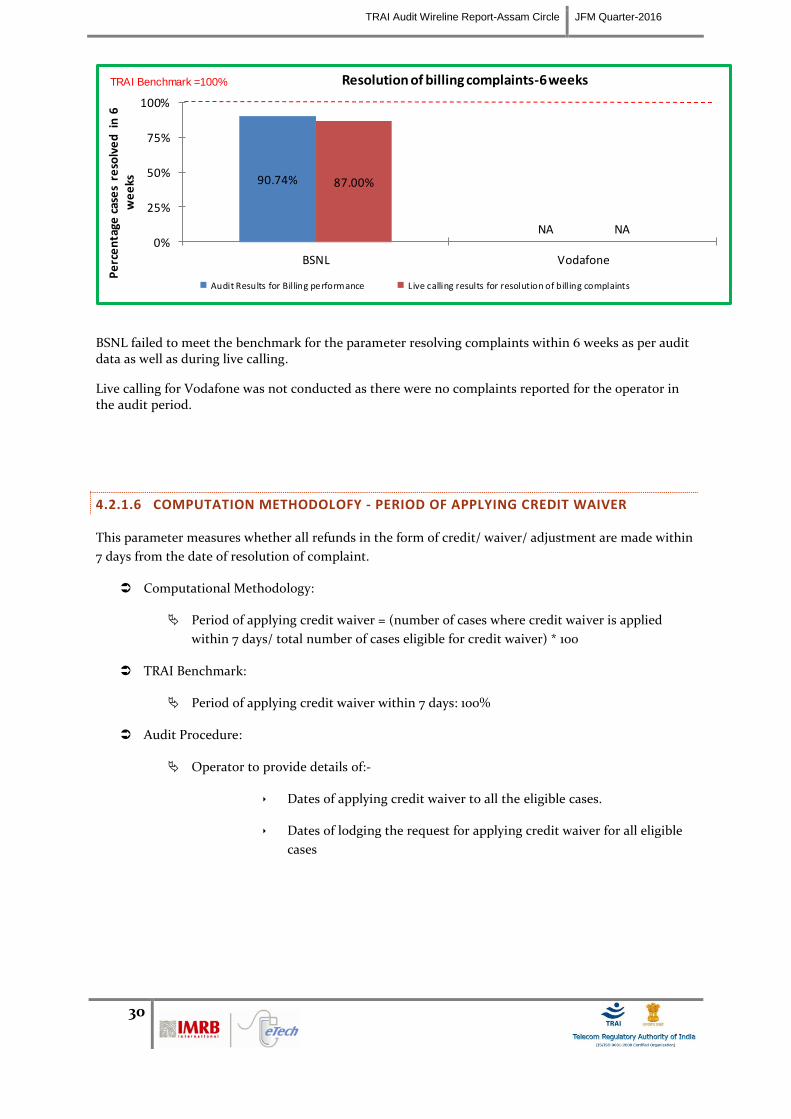
TRAI Audit Wireline Report-Assam Circle JFM Quarter-2016
30
90.74%
NA
87.00%
NA0%
25%
50%
75%
100%
BSNL Vodafone
Pe
rce
nta
ge c
ase
s re
solv
ed
in
6
we
eks
Resolution of billing complaints-6 weeks
Audit Results for Billing performance Live calling results for resolution of billing complaints
TRAI Benchmark =100%
BSNL failed to meet the benchmark for the parameter resolving complaints within 6 weeks as per audit data as well as during live calling.
Live calling for Vodafone was not conducted as there were no complaints reported for the operator in the audit period.
4.2.1.6 COMPUTATION METHODOLOFY - PERIOD OF APPLYING CREDIT WAIVER
This parameter measures whether all refunds in the form of credit/ waiver/ adjustment are made within
7 days from the date of resolution of complaint.
Computational Methodology:
Period of applying credit waiver = (number of cases where credit waiver is applied
within 7 days/ total number of cases eligible for credit waiver) * 100
TRAI Benchmark:
Period of applying credit waiver within 7 days: 100%
Audit Procedure:
Operator to provide details of:-
Dates of applying credit waiver to all the eligible cases.
Dates of lodging the request for applying credit waiver for all eligible
cases
TRAI Audit Wireline Report-Assam Circle JFM Quarter-2016
31
4.3 RESPONSE TIME TO CUSTOMER
4.3.1 PARAMETER EXPLANATION
Following two sub-parameters are covered for this parameter:
Accessibility of Call Centre: The percentage of calls getting connected and answered by the call
center. Not more than 5% calls shall encounter busy signal, no reply or any other failure in
getting connected to the IVR.
% age of calls answered by operators (voice to voice) within stipulated time: Not more than 5%
calls shall encounter busy signal, no reply or any other failure in getting connected to the call
center executive.
4.3.1.1 AUDIT PROCEDURE
IMRB auditors collect the data for time taken to connect a customer’s call both to the IVR as
well as to a customer care executive.
All the supplementary services that have any kind of human intervention are to be covered
here. It also includes the IVR assisted services.
Live calling:
Overall sample size was 100 calls per service provider per circle at different points of time,
evenly distributed across the selected exchanges – 50 calls between 1000 HRS to 1300 HRS and
50 calls between 1500 HRS to 1700 HRS.
Time to answer the call by the operator was assessed from the time interviewer pressed the
requisite button for being assisted by the operator.
All the supplementary services that have any kind of human intervention are to be covered
here. It also includes the IVR assisted services.
4.3.1.2 COMPUTATIONAL METHODOLOGY
Percentage of calls answered in a specified time = (Total no. of calls answered within
that specified time / Total no. of calls dialed for a particular service)*100
4.3.1.3 BENCHMARK
% age of calls getting connected and answered: In 95% of the cases or more.
% age of calls answered by operator / voice to voice) within 90 seconds: In 95% of the cases or
more
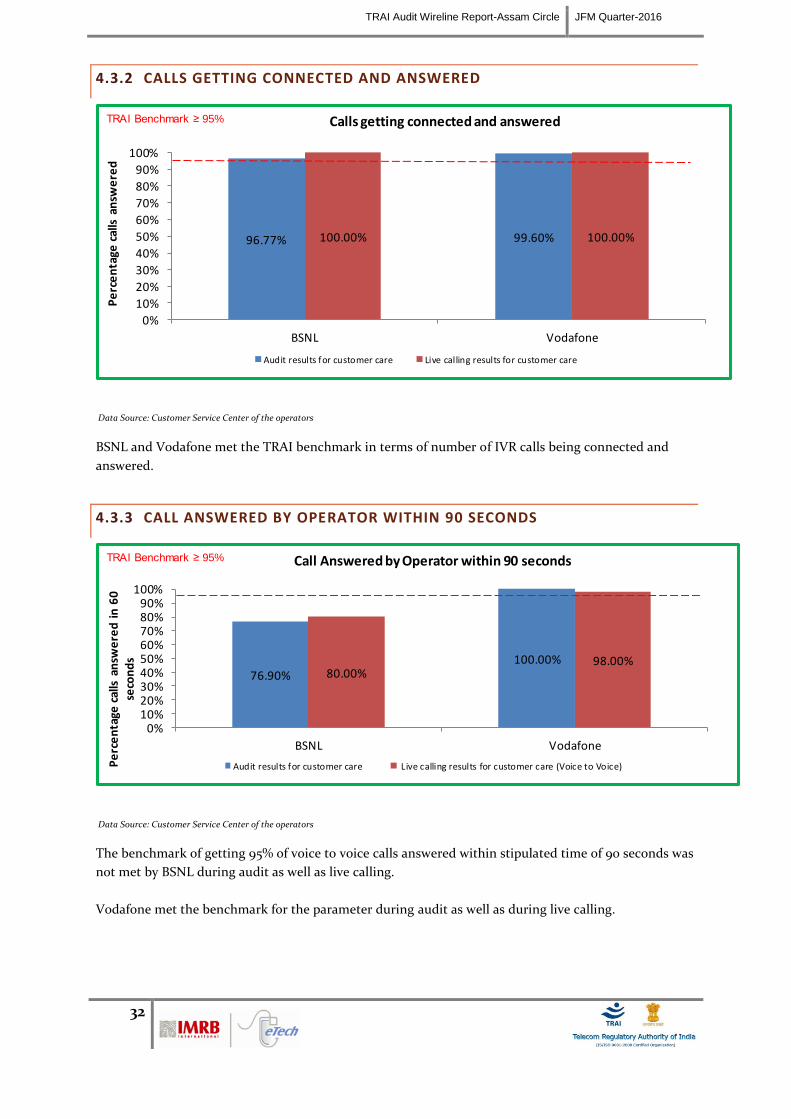
TRAI Audit Wireline Report-Assam Circle JFM Quarter-2016
32
4.3.2 CALLS GETTING CONNECTED AND ANSWERED
96.77% 99.60%100.00% 100.00%
0%
10%
20%
30%
40%
50%
60%
70%
80%
90%
100%
BSNL Vodafone
Pe
rce
nta
ge c
alls
an
swe
red
Calls getting connected and answered
Audit results for customer care Live calling results for customer care
TRAI Benchmark ≥ 95%
Data Source: Customer Service Center of the operators
BSNL and Vodafone met the TRAI benchmark in terms of number of IVR calls being connected and
answered.
4.3.3 CALL ANSWERED BY OPERATOR WITHIN 90 SECONDS
76.90%100.00%
80.00%98.00%
0%10%20%30%40%50%60%70%80%90%
100%
BSNL Vodafone
Pe
rce
nta
ge c
alls
an
swe
red
in
60
se
con
ds
Call Answered by Operator within 90 seconds
Audit results for customer care Live calling results for customer care (Voice to Voice)
TRAI Benchmark ≥ 95%TRAI Benchmark ≥ 95%
Data Source: Customer Service Center of the operators
The benchmark of getting 95% of voice to voice calls answered within stipulated time of 90 seconds was
not met by BSNL during audit as well as live calling.
Vodafone met the benchmark for the parameter during audit as well as during live calling.
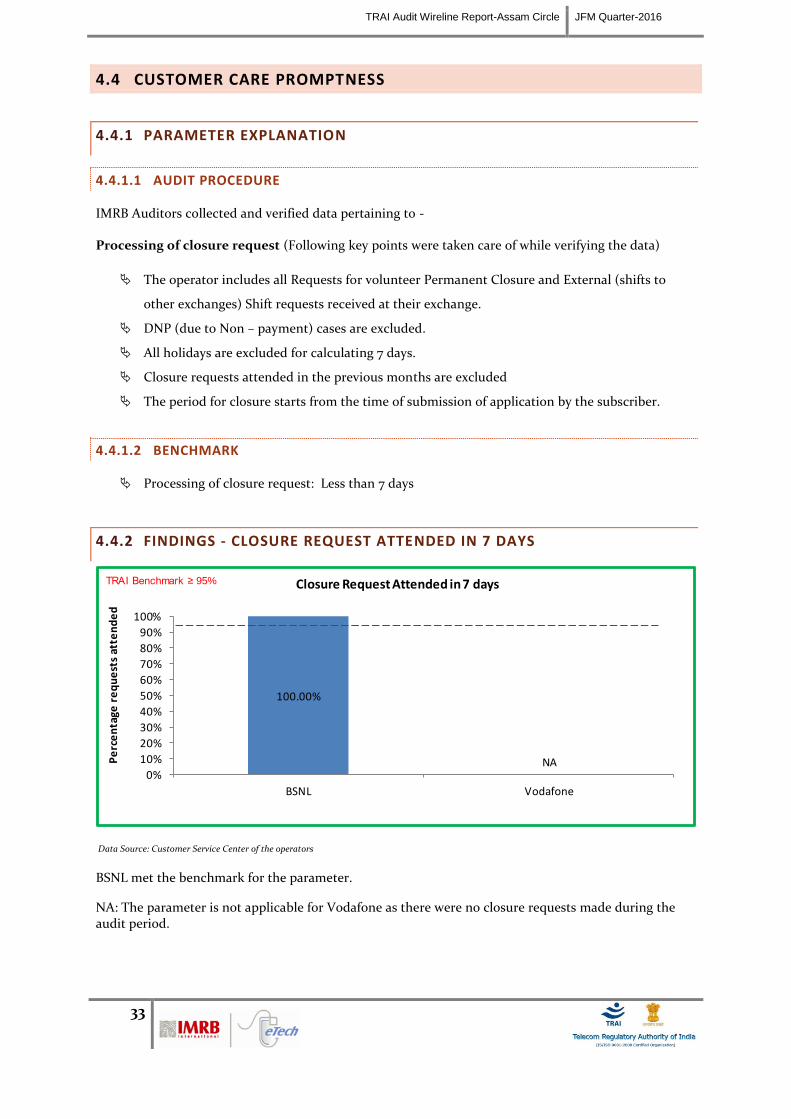
TRAI Audit Wireline Report-Assam Circle JFM Quarter-2016
33
4.4 CUSTOMER CARE PROMPTNESS
4.4.1 PARAMETER EXPLANATION
4.4.1.1 AUDIT PROCEDURE
IMRB Auditors collected and verified data pertaining to -
Processing of closure request (Following key points were taken care of while verifying the data)
The operator includes all Requests for volunteer Permanent Closure and External (shifts to
other exchanges) Shift requests received at their exchange.
DNP (due to Non – payment) cases are excluded.
All holidays are excluded for calculating 7 days.
Closure requests attended in the previous months are excluded
The period for closure starts from the time of submission of application by the subscriber.
4.4.1.2 BENCHMARK
Processing of closure request: Less than 7 days
4.4.2 FINDINGS - CLOSURE REQUEST ATTENDED IN 7 DAYS
100.00%
NA0%
10%
20%
30%
40%
50%
60%
70%
80%
90%
100%
BSNL Vodafone
Pe
rce
nta
ge r
eq
ue
sts
atte
nd
ed
Closure Request Attended in 7 daysTRAI Benchmark = 100%TRAI Benchmark ≥ 95%TRAI Benchmark ≥ 95%
Data Source: Customer Service Center of the operators
BSNL met the benchmark for the parameter.
NA: The parameter is not applicable for Vodafone as there were no closure requests made during the audit period.
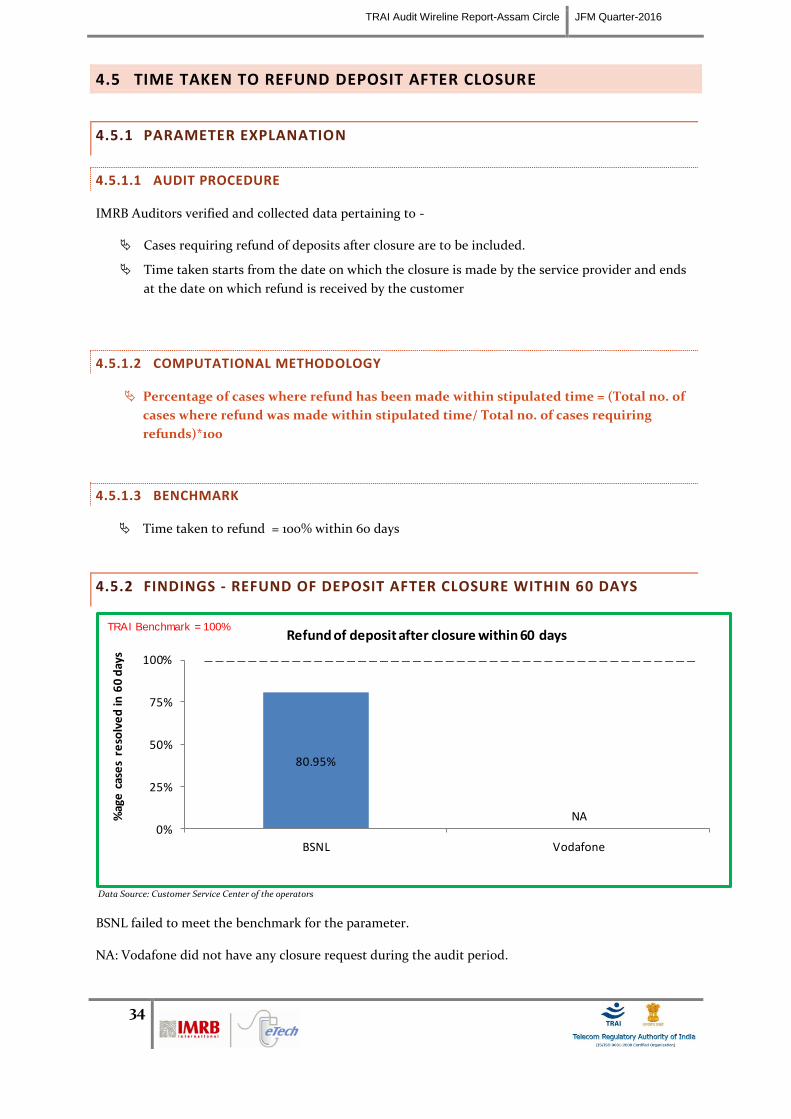
TRAI Audit Wireline Report-Assam Circle JFM Quarter-2016
34
4.5 TIME TAKEN TO REFUND DEPOSIT AFTER CLOSURE
4.5.1 PARAMETER EXPLANATION
4.5.1.1 AUDIT PROCEDURE
IMRB Auditors verified and collected data pertaining to -
Cases requiring refund of deposits after closure are to be included.
Time taken starts from the date on which the closure is made by the service provider and ends
at the date on which refund is received by the customer
4.5.1.2 COMPUTATIONAL METHODOLOGY
Percentage of cases where refund has been made within stipulated time = (Total no. of
cases where refund was made within stipulated time/ Total no. of cases requiring
refunds)*100
4.5.1.3 BENCHMARK
Time taken to refund = 100% within 60 days
4.5.2 FINDINGS - REFUND OF DEPOSIT AFTER CLOSURE WITHIN 60 DAYS
80.95%
NA0%
25%
50%
75%
100%
BSNL Vodafone
%ag
e c
ase
s re
solv
ed
in 6
0 d
ays
Refund of deposit after closure within 60 daysTRAI Benchmark = 100%
Data Source: Customer Service Center of the operators
BSNL failed to meet the benchmark for the parameter.
NA: Vodafone did not have any closure request during the audit period.
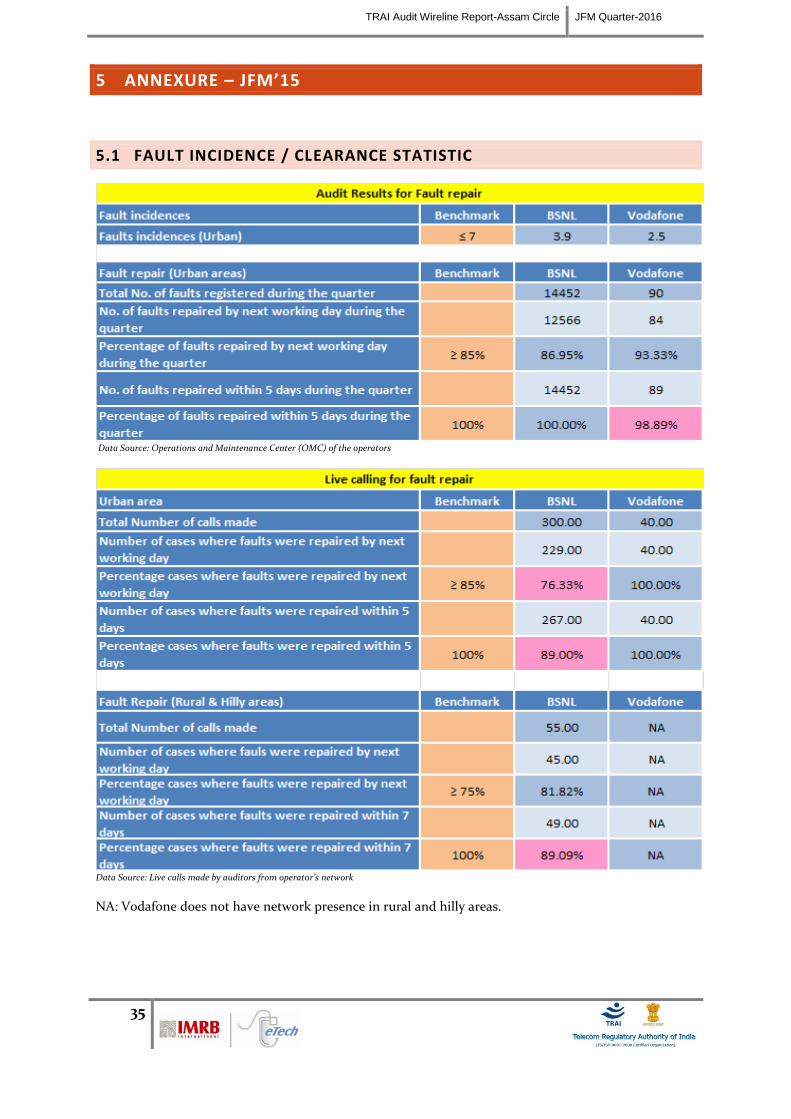
TRAI Audit Wireline Report-Assam Circle JFM Quarter-2016
35
5 ANNEXURE – JFM’15
5.1 FAULT INCIDENCE / CLEARANCE STATISTIC
Data Source: Operations and Maintenance Center (OMC) of the operators
Data Source: Live calls made by auditors from operator’s network
NA: Vodafone does not have network presence in rural and hilly areas.
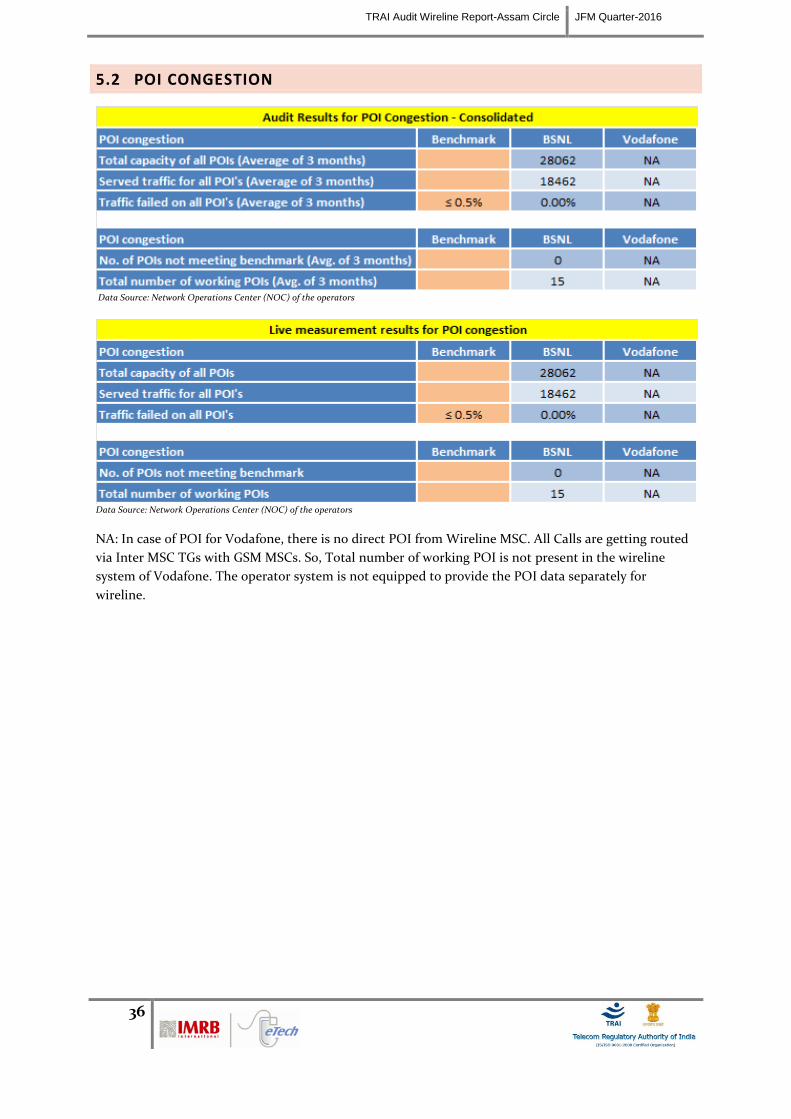
TRAI Audit Wireline Report-Assam Circle JFM Quarter-2016
36
5.2 POI CONGESTION
Data Source: Network Operations Center (NOC) of the operators
Data Source: Network Operations Center (NOC) of the operators
NA: In case of POI for Vodafone, there is no direct POI from Wireline MSC. All Calls are getting routed
via Inter MSC TGs with GSM MSCs. So, Total number of working POI is not present in the wireline
system of Vodafone. The operator system is not equipped to provide the POI data separately for
wireline.
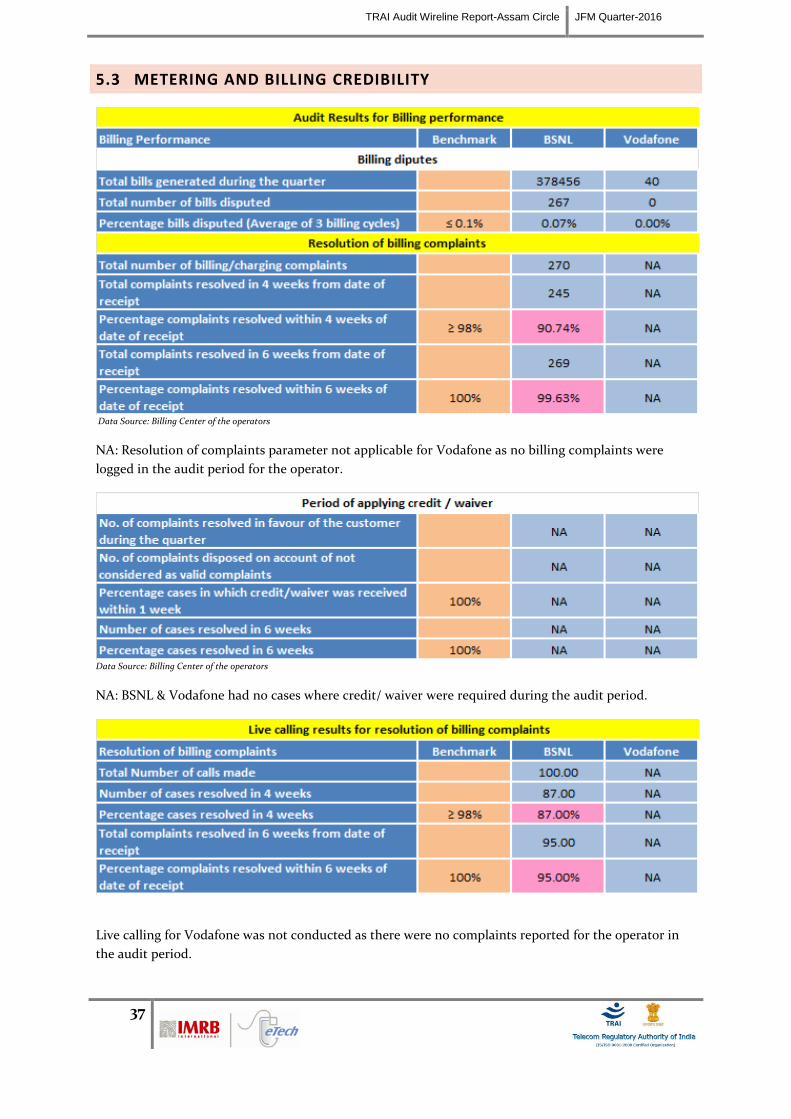
TRAI Audit Wireline Report-Assam Circle JFM Quarter-2016
37
5.3 METERING AND BILLING CREDIBILITY
Data Source: Billing Center of the operators
NA: Resolution of complaints parameter not applicable for Vodafone as no billing complaints were
logged in the audit period for the operator.
Data Source: Billing Center of the operators
NA: BSNL & Vodafone had no cases where credit/ waiver were required during the audit period.
Live calling for Vodafone was not conducted as there were no complaints reported for the operator in
the audit period.
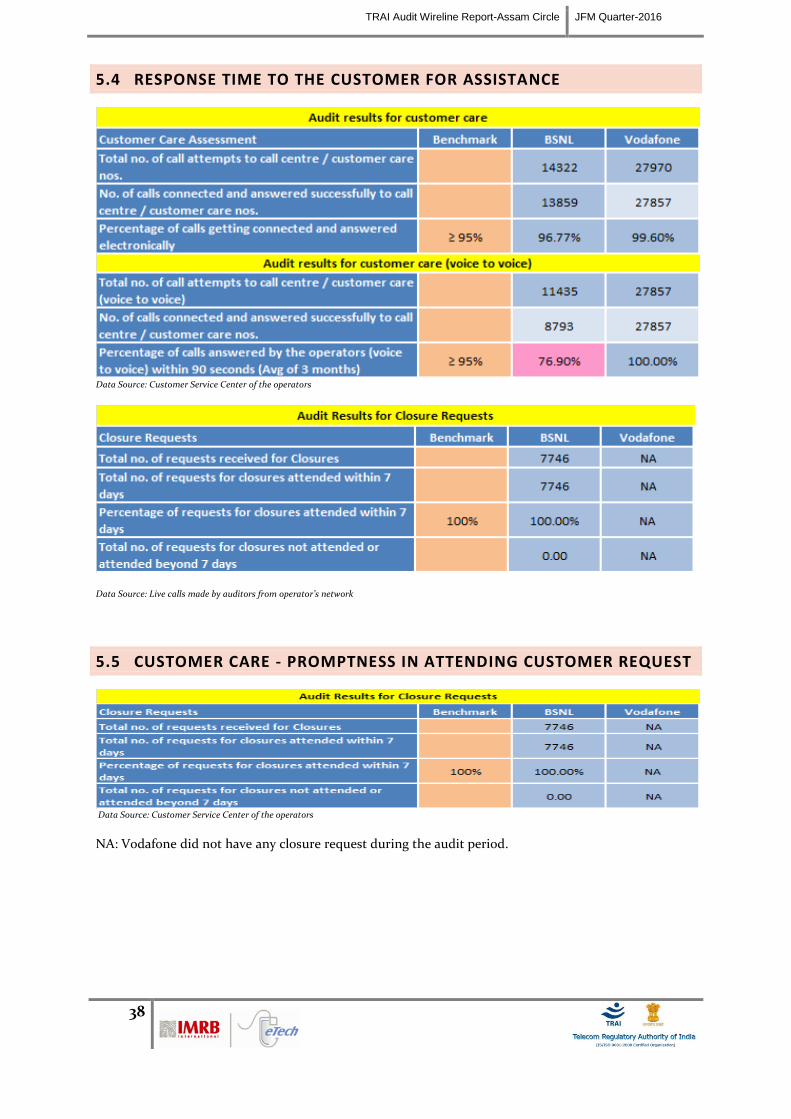
TRAI Audit Wireline Report-Assam Circle JFM Quarter-2016
38
5.4 RESPONSE TIME TO THE CUSTOMER FOR ASSISTANCE
Data Source: Customer Service Center of the operators
Data Source: Live calls made by auditors from operator’s network
5.5 CUSTOMER CARE - PROMPTNESS IN ATTENDING CUSTOMER REQUEST
Data Source: Customer Service Center of the operators
NA: Vodafone did not have any closure request during the audit period.
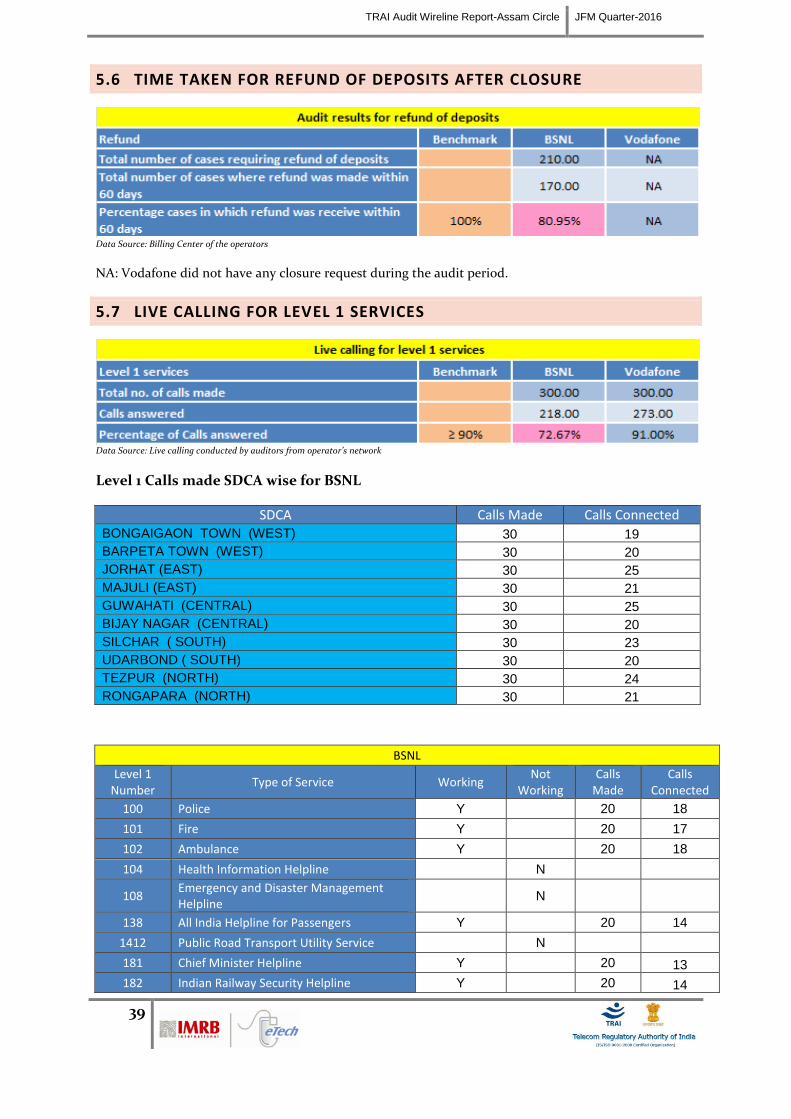
TRAI Audit Wireline Report-Assam Circle JFM Quarter-2016
39
5.6 TIME TAKEN FOR REFUND OF DEPOSITS AFTER CLOSURE
Data Source: Billing Center of the operators
NA: Vodafone did not have any closure request during the audit period.
5.7 LIVE CALLING FOR LEVEL 1 SERVICES
Data Source: Live calling conducted by auditors from operator’s network
Level 1 Calls made SDCA wise for BSNL
SDCA Calls Made Calls Connected BONGAIGAON TOWN (WEST) 30 19
BARPETA TOWN (WEST) 30 20
JORHAT (EAST) 30 25
MAJULI (EAST) 30 21
GUWAHATI (CENTRAL) 30 25
BIJAY NAGAR (CENTRAL) 30 20
SILCHAR ( SOUTH) 30 23
UDARBOND ( SOUTH) 30 20
TEZPUR (NORTH) 30 24
RONGAPARA (NORTH) 30 21
BSNL
Level 1 Number
Type of Service Working Not
Working Calls
Made Calls
Connected
100 Police Y 20 18
101 Fire Y 20 17
102 Ambulance Y 20 18
104 Health Information Helpline N
108 Emergency and Disaster Management Helpline
N
138 All India Helpline for Passengers Y 20 14
1412 Public Road Transport Utility Service N
181 Chief Minister Helpline Y 20 13
182 Indian Railway Security Helpline Y 20 14
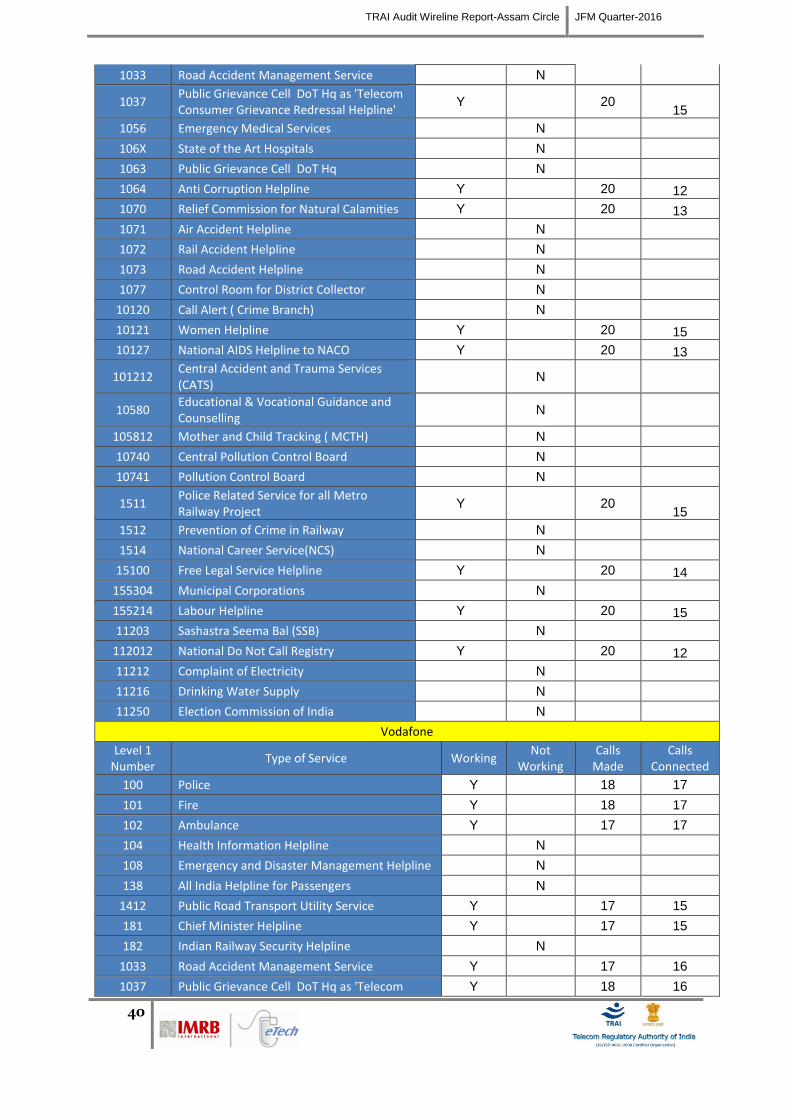
TRAI Audit Wireline Report-Assam Circle JFM Quarter-2016
40
1033 Road Accident Management Service N
1037 Public Grievance Cell DoT Hq as 'Telecom Consumer Grievance Redressal Helpline'
Y 20 15
1056 Emergency Medical Services N
106X State of the Art Hospitals N
1063 Public Grievance Cell DoT Hq N
1064 Anti Corruption Helpline Y 20 12
1070 Relief Commission for Natural Calamities Y 20 13
1071 Air Accident Helpline N
1072 Rail Accident Helpline N
1073 Road Accident Helpline N
1077 Control Room for District Collector N
10120 Call Alert ( Crime Branch) N
10121 Women Helpline Y 20 15
10127 National AIDS Helpline to NACO Y 20 13
101212 Central Accident and Trauma Services (CATS)
N
10580 Educational & Vocational Guidance and Counselling
N
105812 Mother and Child Tracking ( MCTH) N
10740 Central Pollution Control Board N
10741 Pollution Control Board N
1511 Police Related Service for all Metro Railway Project
Y 20 15
1512 Prevention of Crime in Railway N
1514 National Career Service(NCS) N
15100 Free Legal Service Helpline Y 20 14
155304 Municipal Corporations N
155214 Labour Helpline Y 20 15
11203 Sashastra Seema Bal (SSB) N
112012 National Do Not Call Registry Y 20 12
11212 Complaint of Electricity N
11216 Drinking Water Supply N
11250 Election Commission of India N
Vodafone
Level 1 Number
Type of Service Working Not
Working Calls
Made Calls
Connected
100 Police Y 18 17
101 Fire Y 18 17
102 Ambulance Y 17 17
104 Health Information Helpline N
108 Emergency and Disaster Management Helpline N
138 All India Helpline for Passengers N
1412 Public Road Transport Utility Service Y 17 15
181 Chief Minister Helpline Y 17 15
182 Indian Railway Security Helpline N
1033 Road Accident Management Service Y 17 16
1037 Public Grievance Cell DoT Hq as 'Telecom Y 18 16
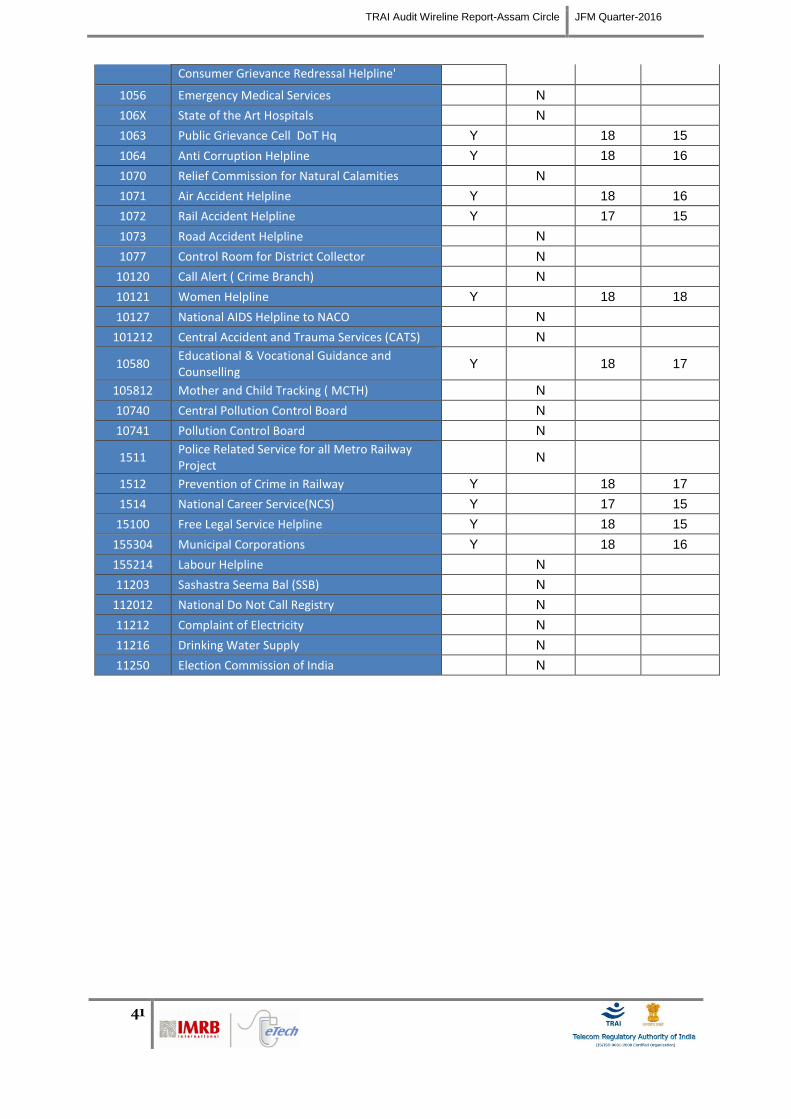
TRAI Audit Wireline Report-Assam Circle JFM Quarter-2016
41
Consumer Grievance Redressal Helpline'
1056 Emergency Medical Services N
106X State of the Art Hospitals N
1063 Public Grievance Cell DoT Hq Y 18 15
1064 Anti Corruption Helpline Y 18 16
1070 Relief Commission for Natural Calamities N
1071 Air Accident Helpline Y 18 16
1072 Rail Accident Helpline Y 17 15
1073 Road Accident Helpline N
1077 Control Room for District Collector N
10120 Call Alert ( Crime Branch) N
10121 Women Helpline Y 18 18
10127 National AIDS Helpline to NACO N
101212 Central Accident and Trauma Services (CATS) N
10580 Educational & Vocational Guidance and Counselling
Y 18 17
105812 Mother and Child Tracking ( MCTH) N
10740 Central Pollution Control Board N
10741 Pollution Control Board N
1511 Police Related Service for all Metro Railway Project
N
1512 Prevention of Crime in Railway Y 18 17
1514 National Career Service(NCS) Y 17 15
15100 Free Legal Service Helpline Y 18 15
155304 Municipal Corporations Y 18 16
155214 Labour Helpline N
11203 Sashastra Seema Bal (SSB) N
112012 National Do Not Call Registry N
11212 Complaint of Electricity N
11216 Drinking Water Supply N
11250 Election Commission of India N
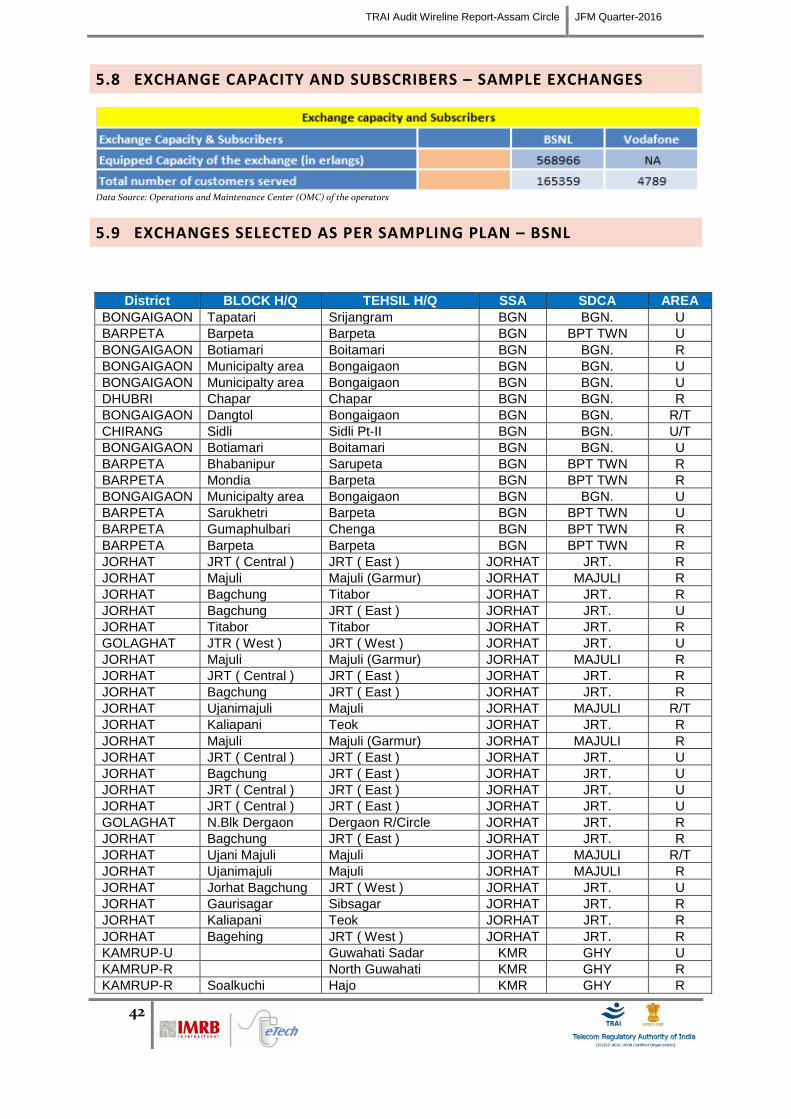
TRAI Audit Wireline Report-Assam Circle JFM Quarter-2016
42
5.8 EXCHANGE CAPACITY AND SUBSCRIBERS – SAMPLE EXCHANGES
Data Source: Operations and Maintenance Center (OMC) of the operators
5.9 EXCHANGES SELECTED AS PER SAMPLING PLAN – BSNL
District BLOCK H/Q TEHSIL H/Q SSA SDCA AREA
BONGAIGAON Tapatari Srijangram BGN BGN. U
BARPETA Barpeta Barpeta BGN BPT TWN U
BONGAIGAON Botiamari Boitamari BGN BGN. R
BONGAIGAON Municipalty area Bongaigaon BGN BGN. U
BONGAIGAON Municipalty area Bongaigaon BGN BGN. U
DHUBRI Chapar Chapar BGN BGN. R
BONGAIGAON Dangtol Bongaigaon BGN BGN. R/T
CHIRANG Sidli Sidli Pt-II BGN BGN. U/T
BONGAIGAON Botiamari Boitamari BGN BGN. U
BARPETA Bhabanipur Sarupeta BGN BPT TWN R
BARPETA Mondia Barpeta BGN BPT TWN R
BONGAIGAON Municipalty area Bongaigaon BGN BGN. U
BARPETA Sarukhetri Barpeta BGN BPT TWN U
BARPETA Gumaphulbari Chenga BGN BPT TWN R
BARPETA Barpeta Barpeta BGN BPT TWN R
JORHAT JRT ( Central ) JRT ( East ) JORHAT JRT. R
JORHAT Majuli Majuli (Garmur) JORHAT MAJULI R
JORHAT Bagchung Titabor JORHAT JRT. R
JORHAT Bagchung JRT ( East ) JORHAT JRT. U
JORHAT Titabor Titabor JORHAT JRT. R
GOLAGHAT JTR ( West ) JRT ( West ) JORHAT JRT. U
JORHAT Majuli Majuli (Garmur) JORHAT MAJULI R
JORHAT JRT ( Central ) JRT ( East ) JORHAT JRT. R
JORHAT Bagchung JRT ( East ) JORHAT JRT. R
JORHAT Ujanimajuli Majuli JORHAT MAJULI R/T
JORHAT Kaliapani Teok JORHAT JRT. R
JORHAT Majuli Majuli (Garmur) JORHAT MAJULI R
JORHAT JRT ( Central ) JRT ( East ) JORHAT JRT. U
JORHAT Bagchung JRT ( East ) JORHAT JRT. U
JORHAT JRT ( Central ) JRT ( East ) JORHAT JRT. U
JORHAT JRT ( Central ) JRT ( East ) JORHAT JRT. U
GOLAGHAT N.Blk Dergaon Dergaon R/Circle JORHAT JRT. R
JORHAT Bagchung JRT ( East ) JORHAT JRT. R
JORHAT Ujani Majuli Majuli JORHAT MAJULI R/T
JORHAT Ujanimajuli Majuli JORHAT MAJULI R
JORHAT Jorhat Bagchung JRT ( West ) JORHAT JRT. U
JORHAT Gaurisagar Sibsagar JORHAT JRT. R
JORHAT Kaliapani Teok JORHAT JRT. R
JORHAT Bagehing JRT ( West ) JORHAT JRT. R
KAMRUP-U Guwahati Sadar KMR GHY U
KAMRUP-R North Guwahati KMR GHY R
KAMRUP-R Soalkuchi Hajo KMR GHY R
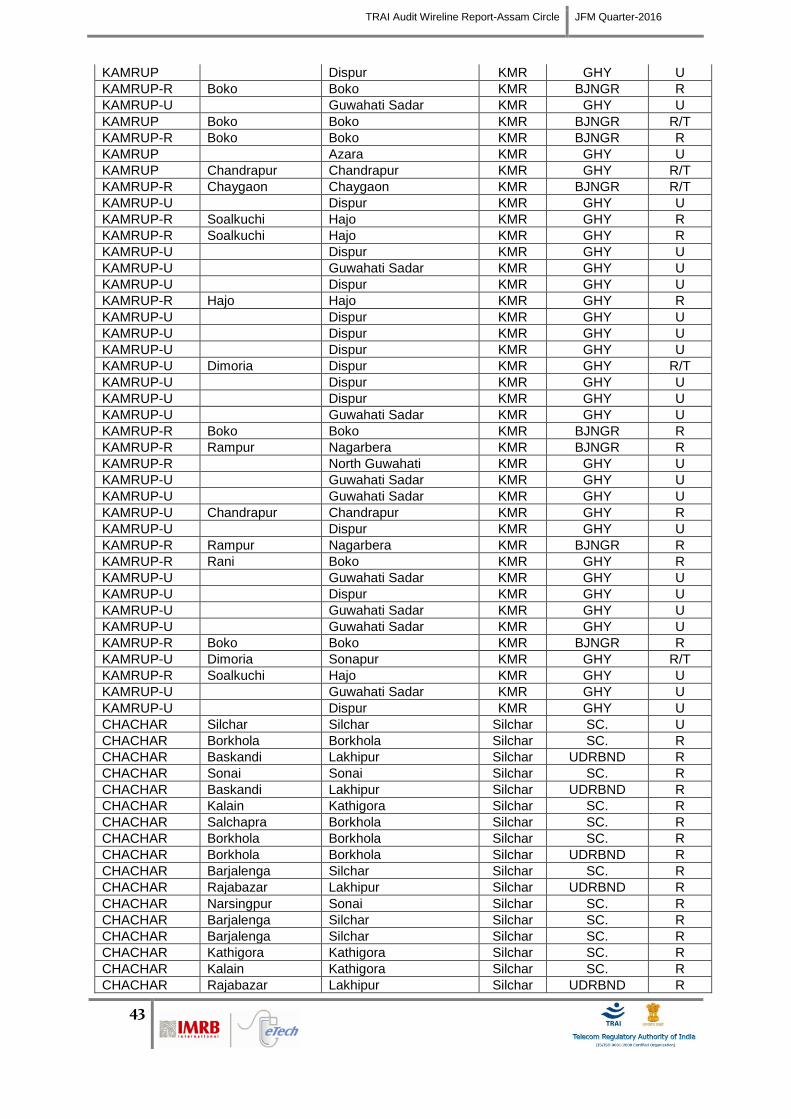
TRAI Audit Wireline Report-Assam Circle JFM Quarter-2016
43
KAMRUP Dispur KMR GHY U
KAMRUP-R Boko Boko KMR BJNGR R
KAMRUP-U Guwahati Sadar KMR GHY U
KAMRUP Boko Boko KMR BJNGR R/T
KAMRUP-R Boko Boko KMR BJNGR R
KAMRUP Azara KMR GHY U
KAMRUP Chandrapur Chandrapur KMR GHY R/T
KAMRUP-R Chaygaon Chaygaon KMR BJNGR R/T
KAMRUP-U Dispur KMR GHY U
KAMRUP-R Soalkuchi Hajo KMR GHY R
KAMRUP-R Soalkuchi Hajo KMR GHY R
KAMRUP-U Dispur KMR GHY U
KAMRUP-U Guwahati Sadar KMR GHY U
KAMRUP-U Dispur KMR GHY U
KAMRUP-R Hajo Hajo KMR GHY R
KAMRUP-U Dispur KMR GHY U
KAMRUP-U Dispur KMR GHY U
KAMRUP-U Dispur KMR GHY U
KAMRUP-U Dimoria Dispur KMR GHY R/T
KAMRUP-U Dispur KMR GHY U
KAMRUP-U Dispur KMR GHY U
KAMRUP-U
Guwahati Sadar KMR GHY U
KAMRUP-R Boko Boko KMR BJNGR R
KAMRUP-R Rampur Nagarbera KMR BJNGR R
KAMRUP-R North Guwahati KMR GHY U
KAMRUP-U Guwahati Sadar KMR GHY U
KAMRUP-U Guwahati Sadar KMR GHY U
KAMRUP-U Chandrapur Chandrapur KMR GHY R
KAMRUP-U Dispur KMR GHY U
KAMRUP-R Rampur Nagarbera KMR BJNGR R
KAMRUP-R Rani Boko KMR GHY R
KAMRUP-U Guwahati Sadar KMR GHY U
KAMRUP-U Dispur KMR GHY U
KAMRUP-U Guwahati Sadar KMR GHY U
KAMRUP-U Guwahati Sadar KMR GHY U
KAMRUP-R Boko Boko KMR BJNGR R
KAMRUP-U Dimoria Sonapur KMR GHY R/T
KAMRUP-R Soalkuchi Hajo KMR GHY U
KAMRUP-U Guwahati Sadar KMR GHY U
KAMRUP-U Dispur KMR GHY U
CHACHAR Silchar Silchar Silchar SC. U
CHACHAR Borkhola Borkhola Silchar SC. R
CHACHAR Baskandi Lakhipur Silchar UDRBND R
CHACHAR Sonai Sonai Silchar SC. R
CHACHAR Baskandi Lakhipur Silchar UDRBND R
CHACHAR Kalain Kathigora Silchar SC. R
CHACHAR Salchapra Borkhola Silchar SC. R
CHACHAR Borkhola Borkhola Silchar SC. R
CHACHAR Borkhola Borkhola Silchar UDRBND R
CHACHAR Barjalenga Silchar Silchar SC. R
CHACHAR Rajabazar Lakhipur Silchar UDRBND R
CHACHAR Narsingpur Sonai Silchar SC. R
CHACHAR Barjalenga Silchar Silchar SC. R
CHACHAR Barjalenga Silchar Silchar SC. R
CHACHAR Kathigora Kathigora Silchar SC. R
CHACHAR Kalain Kathigora Silchar SC. R
CHACHAR Rajabazar Lakhipur Silchar UDRBND R
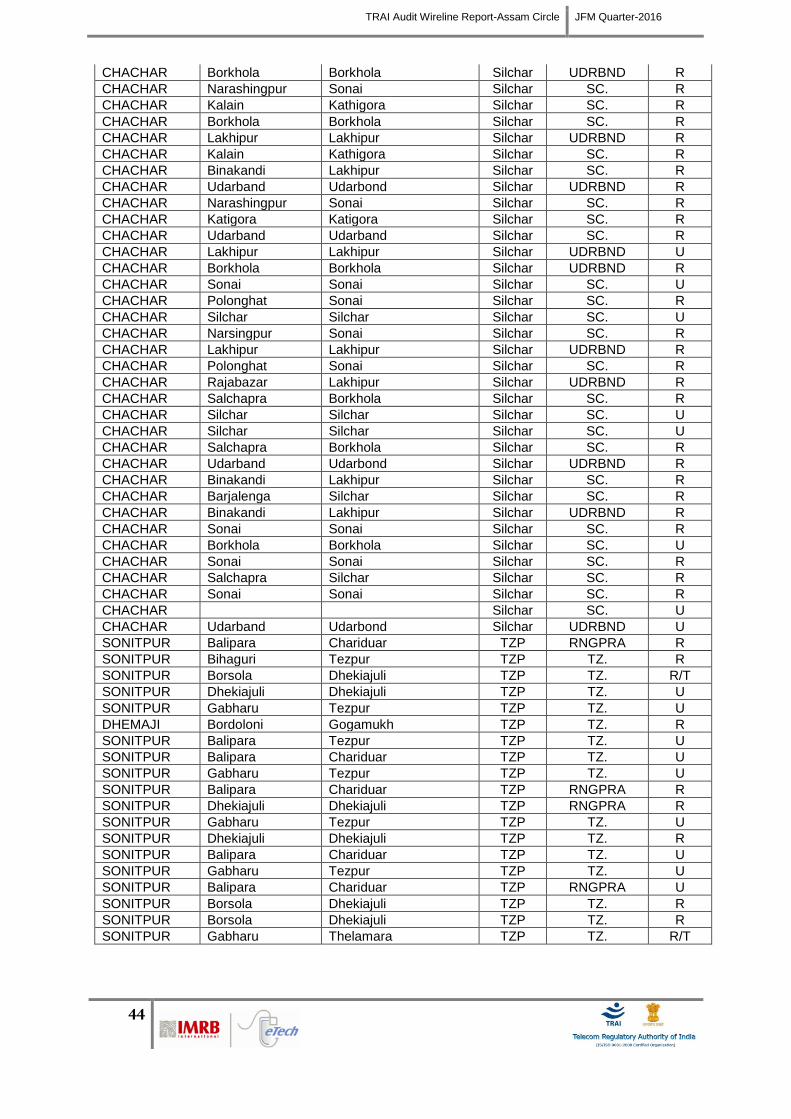
TRAI Audit Wireline Report-Assam Circle JFM Quarter-2016
44
CHACHAR Borkhola Borkhola Silchar UDRBND R
CHACHAR Narashingpur Sonai Silchar SC. R
CHACHAR Kalain Kathigora Silchar SC. R
CHACHAR Borkhola Borkhola Silchar SC. R
CHACHAR Lakhipur Lakhipur Silchar UDRBND R
CHACHAR Kalain Kathigora Silchar SC. R
CHACHAR Binakandi Lakhipur Silchar SC. R
CHACHAR Udarband Udarbond Silchar UDRBND R
CHACHAR Narashingpur Sonai Silchar SC. R
CHACHAR Katigora Katigora Silchar SC. R
CHACHAR Udarband Udarband Silchar SC. R
CHACHAR Lakhipur Lakhipur Silchar UDRBND U
CHACHAR Borkhola Borkhola Silchar UDRBND R
CHACHAR Sonai Sonai Silchar SC. U
CHACHAR Polonghat Sonai Silchar SC. R
CHACHAR Silchar Silchar Silchar SC. U
CHACHAR Narsingpur Sonai Silchar SC. R
CHACHAR Lakhipur Lakhipur Silchar UDRBND R
CHACHAR Polonghat Sonai Silchar SC. R
CHACHAR Rajabazar Lakhipur Silchar UDRBND R
CHACHAR Salchapra Borkhola Silchar SC. R
CHACHAR Silchar Silchar Silchar SC. U
CHACHAR Silchar Silchar Silchar SC. U
CHACHAR Salchapra Borkhola Silchar SC. R
CHACHAR Udarband Udarbond Silchar UDRBND R
CHACHAR Binakandi Lakhipur Silchar SC. R
CHACHAR Barjalenga Silchar Silchar SC. R
CHACHAR Binakandi Lakhipur Silchar UDRBND R
CHACHAR Sonai Sonai Silchar SC. R
CHACHAR Borkhola Borkhola Silchar SC. U
CHACHAR Sonai Sonai Silchar SC. R
CHACHAR Salchapra Silchar Silchar SC. R
CHACHAR Sonai Sonai Silchar SC. R
CHACHAR Silchar SC. U
CHACHAR Udarband Udarbond Silchar UDRBND U
SONITPUR Balipara Chariduar TZP RNGPRA R
SONITPUR Bihaguri Tezpur TZP TZ. R
SONITPUR Borsola Dhekiajuli TZP TZ. R/T
SONITPUR Dhekiajuli Dhekiajuli TZP TZ. U
SONITPUR Gabharu Tezpur TZP TZ. U
DHEMAJI Bordoloni Gogamukh TZP TZ. R
SONITPUR Balipara Tezpur TZP TZ. U
SONITPUR Balipara Chariduar TZP TZ. U
SONITPUR Gabharu Tezpur TZP TZ. U
SONITPUR Balipara Chariduar TZP RNGPRA R
SONITPUR Dhekiajuli Dhekiajuli TZP RNGPRA R
SONITPUR Gabharu Tezpur TZP TZ. U
SONITPUR Dhekiajuli Dhekiajuli TZP TZ. R
SONITPUR Balipara Chariduar TZP TZ. U
SONITPUR Gabharu Tezpur TZP TZ. U
SONITPUR Balipara Chariduar TZP RNGPRA U
SONITPUR Borsola Dhekiajuli TZP TZ. R
SONITPUR Borsola Dhekiajuli TZP TZ. R
SONITPUR Gabharu Thelamara TZP TZ. R/T
TRAI Audit Wireline Report-Assam Circle JFM Quarter-2016
45
5.10 ABBREVIATIONS
The following terms/abbreviations have been commonly used in this report. This section provides
meaning of the abbreviations used in the report.
1. TRAI – Telecom Regulatory Authority of India
2. QoS – Quality of Service
3. JFM’15 – Refers to the quarter of January, February and March 2016
4. IMRB – Refers to IMRB International, the audit agency for this report
5. NOC – Network Operation Center
6. OMC – Operations and Maintenance Center
7. SDCA – Short Distance Charging Area
8. PMR – Performance Monitoring Reports
9. MTTR - Mean Time to Repair faults
10. TCBH – Time Consistent Busy Hour
11. NA – Not Applicable
12. NC – Non Compliance
13. POI – Point of Interconnection
14. IVR – Interactive Voice Response
15. DEL – Direct Exchange Line
16. STD – Standard Trunk Dialing
17. ISD – International Subscriber Dialing

TRAI Audit Wireline Report-Assam Circle JFM Quarter-2016
46
SCO 47, 5th
Floor, Old Judicial Complex, Sector 15
Part 1, Gurgaon, Haryana – 122001
+91 (124) 4217300
www.imrbint.com
Related Documents


