TRAFFIC IMPACT STUDY 6719 GLEN ERIN DRIVE CITY OF MISSISSAUGA PREPARED FOR: STARWOOD GROUP INC. PREPARED BY: C.F. CROZIER & ASSOCIATES INC. 40 HURON STREET COLLINGWOOD, ON, L9Y 4R3 OCTOBER 2021 CFCA FILE NO. 1886-5590 The material in this report reflects best judgment in light of the information available at the time of preparation. Any use which a third party makes of this report, or any reliance on or decisions made based on it, are the responsibilities of such third parties. C.F. Crozier & Associates Inc. accepts no responsibility for damages, if any, suffered by any third party as a result of decisions made or actions based on this report.

Welcome message from author
This document is posted to help you gain knowledge. Please leave a comment to let me know what you think about it! Share it to your friends and learn new things together.
Transcript
TRAFFIC IMPACT STUDY
6719 GLEN ERIN DRIVE
CITY OF MISSISSAUGA
PREPARED FOR:
STARWOOD GROUP INC.
PREPARED BY:
C.F. CROZIER & ASSOCIATES INC.
40 HURON STREET
COLLINGWOOD, ON, L9Y 4R3
OCTOBER 2021
CFCA FILE NO. 1886-5590
The material in this report reflects best judgment in light of the
information available at the time of preparation. Any use which
a third party makes of this report, or any reliance on or decisions
made based on it, are the responsibilities of such third parties.
C.F. Crozier & Associates Inc. accepts no responsibility for
damages, if any, suffered by any third party as a result of
decisions made or actions based on this report.
Starwood Group Inc. Traffic Impact Study
6719 Glen Erin Drive, City of Mississauga October 2021
C.F. Crozier & Associates Inc. i
Project No. 1886-5590
Revision Number Date Comments
Rev.0 June 2020 Issued for coordination
Rev.1 August 2020 Issued for First Submission
Rev.2 October 2021 Issued for Second Submission
Starwood Group Inc. Traffic Impact Study
6719 Glen Erin Drive, City of Mississauga October 2021
C.F. Crozier & Associates Inc. ii
Project No. 1886-5590
1.0 EXECUTIVE SUMMARY Background
C.F. Crozier & Associates Inc. (Crozier) was retained by Starwood Group Inc. to undertake a Traffic
Impact Study (TIS) in support of a Zoning By-Law Amendment (ZBA), Official Plan Amendment (OPA)
and Site Plan Application (SPA)for the proposed residential addition to the site located at 6719 Glen
Erin Drive in the City of Mississauga. This TIS was prepared to address comments from City of
Mississauga Staff regarding the First Submission of the TIS (dated January 7, 2021). The original TIS was
based on the City of Mississauga Traffic Impact Study Guidelines and a term of reference confirmed
in May 2020 by the City of Mississauga Staff.
The development proposal includes keeping the existing 13-storey apartment building (179 units)
and adding a 12-storey apartment building (184 units) as well as four blocks of townhouses (totaling
28 units) on the site. A combined total of 428 parking spaces are proposed and the existing site
access will remain to serve the entire site. The development buildout is in three phases with full
buildout expected before 2025. The proposed residential development is projected to generate a
total of 64 and 73 new two-way auto-trips during the weekday a.m. and p.m. peak hours,
respectively.
Traffic Operations
Under 2020 existing traffic conditions, the signalized intersections of Glen Erin Drive with Aquitaine
Avenue and Shelter Bay Road/ Private Access operates below capacity and at a Level of Service
(LOS) “B” or better during both the weekday a.m. and p.m. peak hours. Similarly, the stop-controlled
site access/private access at Glen Erin Drive operates at a LOS “C” or better.
Under the 2025 future background, the signalized intersections of Glen Erin Drive with Aquitaine
Avenue and Shelter Bay Road/Private Access are projected to operate below capacity and at a
LOS “B” or better during both the weekday a.m. and p.m. peak hours. The stop-controlled minor
connections of the existing site access and private access to Glen Erin Drive are forecast to operate
at a LOS “C” or better during both the a.m. and p.m. peak hours.
Under the 2025 total traffic (includes site generated traffic), the signalized intersections of Glen Erin
Drive with Aquitaine Avenue and Shelter Bay Road/Private Access as well as the stop-controlled site
access at Glen Erin Drive are projected to operate below capacity and at the same LOS as under
the 2025 future background (excludes site generated traffic).
Sensitivity Assessment
A sensitivity assessment incorporating the potential single lane reductions per travel direction on
Glen Erin Drive and Aquitaine Avenue was undertaken for the ultimate study horizon - 2025 total
traffic (includes site generated traffic). The signalized intersections of Glen Erin Drive and Aquitaine
Avenue is forecast to operate a LOS “C” during both a.m. and p.m. peak hours. Glen Erin Drive
intersections with Shelter Bay Road/Private Access as well as the stop-controlled site access at Glen
Erin Drive are projected to operate below capacity and at the same LOS as under the 2025 horizon
(i.e., with or without the lane reductions).
Starwood Group Inc. Traffic Impact Study
6719 Glen Erin Drive, City of Mississauga October 2021
C.F. Crozier & Associates Inc. iii
Project No. 1886-5590
Site Functionality and TDM Measures
The site further capitalizes on available transportation demand management (TDM) opportunities
through design and implementation of TDM measures to promote the use of transit and active
transportation which is expected to result in a reduction of single occupant vehicle trips at the site.
The existing site access is expected to serve the entire site without any safety issues related to
sightlines, corner clearances, access conflicts and transit operational conflicts. Additionally, the site
can accommodate circulation of the Peel Region front-end waste collection vehicle that is
expected to serve the site. A signal warrant was undertaken at the site access and found not to be
warranted under both scenarios of the Glen Erin Drive (i.e., two or four lanes).
Conclusion and Recommendations
We recommend that the City:
• Consider signal system and or timing plan changes as needed alongside monitoring the
intersection of Glen Erin Drive and Aquitaine Avenue in future to ensure optimal intersection
performance and no safety concerns are introduced.
• Consider including 45m right turn storages on all approaches of the Glen Erin Drive and
Aquitaine Avenue intersection in future should plans to reduce a single lane per travel
direction on both roadway proceed.
• Permit the site access (existing to remain) on Glen Erin Drive as no operational issues are
forecasted.
In conclusion, the traffic generated from the proposed development addition at 6719 Glen Erin
Drive will not materially impact the operations of the boundary road network. The ZBA, OPA and SPA
can be supported from a traffic operations perspective as the boundary road system can
accommodate the increase in traffic volumes attributable to the proposed development. Minor
changes to the site plan will not materially affect the conclusions contained within this Study.
Starwood Group Inc. Traffic Impact Study
6719 Glen Erin Drive, City of Mississauga October 2021
C.F. Crozier & Associates Inc. iv
Project No. 1886-5590
TABLE OF CONTENTS
1.0 EXECUTIVE SUMMARY ............................................................................................................... II
2.0 INTRODUCTION ......................................................................................................................... 1
3.0 DEVELOPMENT PROPOSAL ........................................................................................................ 1
4.0 EXISTING CONDITIONS ............................................................................................................. 1
4.1 Study Area .......................................................................................................................... 1
4.2 Boundary Road Network ................................................................................................... 2
4.3 Traffic Data ......................................................................................................................... 2
4.4 Active Transportation Routes ............................................................................................. 3
4.5 Public Transit ....................................................................................................................... 3
4.6 Traffic Modeling .................................................................................................................. 4
4.7 Intersection Operations ..................................................................................................... 4
4.8 Collision History .................................................................................................................. 5
5.0 FUTURE BACKGROUND CONDITIONS ....................................................................................... 5
5.1 Study Horizons .................................................................................................................... 5
5.2 Future Traffic Forecast ........................................................................................................ 5
5.3 Background Developments .............................................................................................. 6
5.4 Future Roadway Improvements ........................................................................................ 6
5.5 Intersection Operations ..................................................................................................... 6
6.0 SITE GENERATED TRAFFIC .......................................................................................................... 7
6.1 Multi-Modal Trip Distribution .............................................................................................. 7
6.2 ITE Trip Generation ............................................................................................................. 7
6.3 Trip Distribution and Assignment ....................................................................................... 8
7.0 TOTAL TRAFFIC CONDITIONS .................................................................................................... 8
7.1 Intersection Operations ..................................................................................................... 8
7.2 Sensitivity Assessment ........................................................................................................ 9
7.3 Warrants Assessment ....................................................................................................... 11
7.4 Site Access Safety Review ............................................................................................... 11
7.5 Vehicle Maneuverability and Waste Removal .............................................................. 11
8.0 TRANSPORTATION DEMAND MANAGEMENT REVIEW ............................................................ 12
8.1 Existing and Future TDM opportunities ............................................................................ 12
8.2 Site Specific TDM measures ............................................................................................. 12
8.3 Municipal Mode Share Targets ....................................................................................... 13
8.4 Non-Auto Site Trip Reduction .......................................................................................... 13
9.0 COMMUNITY IMPACTS ........................................................................................................... 13
10.0 CONCLUSIONS AND RECOMMENDATIONS ........................................................................... 13
Starwood Group Inc. Traffic Impact Study
6719 Glen Erin Drive, City of Mississauga October 2021
C.F. Crozier & Associates Inc. v
Project No. 1886-5590
LIST OF FIGURES Figure 1: Site Location
Figure 2: Site Plan
Figure 3: 2020 Existing Traffic Volumes
Figure 4: Background Development Trips (2700 Aquitaine Avenue)
Figure 5: 2025 Future Background Traffic Volumes
Figure 6: New Site Generated Trip Distribution
Figure 7: New Site Generated Trip Assignment
Figure 8: 2025 Total Traffic Volumes
LIST OF APPENDICES
Appendix A: Correspondence
Appendix B: City of Mississauga Planning Excerpts
Appendix C: Traffic Data
Appendix D: Levels of Service Definitions
Appendix E: Detailed Capacity Analyses
Appendix F: 2700 Aquitaine Avenue TIS Excerpts
Appendix G: Warrant Analysis Sheets
Appendix H: Vehicle Turning and Pavement Marking & Signage Plans
Starwood Group Inc. Traffic Impact Study
6719 Glen Erin Drive, City of Mississauga October 2021
C.F. Crozier & Associates Inc. Page 1
Project No. 1886-5590
2.0 INTRODUCTION C.F. Crozier & Associates Inc. (Crozier) was retained by Starwood Group Inc. to undertake a Traffic
Impact Study in support of a Zoning By-Law Amendment (ZBA) and Official Plan Amendment (OPA)
for the proposed residential addition to the site located at 6719 Glen Erin Drive in the City of
Mississauga. The purpose of the study is to assess the impacts of the proposed development on the
boundary road network and to recommend required mitigation measures, if warranted.
This study was completed in accordance with the procedures set out in the City of Mississauga
Traffic Impact Study Guidelines. Additionally, the scope of work and terms of reference were
confirmed with City of Mississauga via email correspondence between Peter Apasnore (Crozier)
and Lahini Senthil-Kumaran (City of Mississauga) in May 2020. Furthermore, comments from Xinyi
Chen (City of Mississauga) regarding the First Submission of this TIS were incorporated into this new
submission. Refer to Appendix A for relevant correspondence.
3.0 DEVELOPMENT PROPOSAL The development proposal includes adding a 12-storey apartment building (184 units) and four
blocks of townhouses with a total of 28 units on the site. The existing 13-storey apartment building
and its 179 units will remain. A combined total of 428 parking spaces are proposed at grade and
below grade (two levels) to serve the entire site. The development will be completed in three
phases and has an anticipated full buildout before 2025.
As illustrated on the site plan prepared by IBI Group Architects Inc., the development will be
completed as follows:
• Phase One: Demolish the existing at-grade parking lot (44 spaces) and keep the existing 179-
unit apartment and existing parking structure of 225 spaces.
• Phase Two: Demolish the existing parking structure of 225 spaces. Addition of four blocks of
townhouses (28 units), 15 surface parking spaces and two underground levels of parking (282
spaces) on the east side of the property.
• Phase Three: Complete the proposed 12-storey apartment building (184 units) and addition
of one level underground parking (131 spaces) on the west side of the property. Thus, a total
parking supply of 428 parking spaces for the entire site.
The existing site access at Glen Erin will be maintained to serve the entire site. Refer to Figure 2 for
the site plan.
4.0 EXISTING CONDITIONS
4.1 Study Area
The subject land covers an area of approximately 1.8 ha and is currently occupied by a 13-storey
residential apartment building, a two-level parking structure (225 spaces) and a ground level
parking lot (44 spaces). Per schedule B of the City of Mississauga Zoning By-Law 0225-2007, the
property is categorized as Residential Zone “RA4”. Relevant zoning map excerpts are provided in
Appendix B.
Starwood Group Inc. Traffic Impact Study
6719 Glen Erin Drive, City of Mississauga October 2021
C.F. Crozier & Associates Inc. Page 2
Project No. 1886-5590
The property, located in a residential neighbourhood, is bounded by residential townhouses to the
north, Maplewood Park Pathway to the east, Aquitaine Avenue to the south and Glen Erin Drive to
the west. Refer to Figure 1 for the site location.
4.2 Boundary Road Network
The City of Mississauga TIS guidelines requires the study area to include intersections at which the
peak hour site traffic comprises 5% or greater of the existing capacity on an intersection approach.
Based on this criterion, a study of the intersection of Glen Erin Drive with Aquitaine Avenue, Shelter
Bay Road and the existing site access is sufficient. The study intersections were further confirmed by
the City staff via email correspondence included in Appendix A.
Glen Erin Drive is a north-south roadway with a posted speed limit of 50 km/h for both travel
directions. The segment of Glen Erin Drive fronting the site (i.e. within the study area) consists of two
through lanes in each direction and a two-way left turn centre median lane for the segment north
of Aquitaine Avenue. Glen Erin Drive is under the jurisdiction of the City of Mississauga and is
classified as a major collector roadway per schedule 5 of the City of Mississauga Official Plan. There
is a concrete sidewalk located on each side of the roadway, separated from the travel lanes by a
boulevard strip.
Aquitaine Avenue is an east-west roadway with a posted speed limit of 50 km/h for both travel
directions. The segment of Aquitaine Avenue fronting the site (i.e. within the study area) consists of
two through lanes in each direction. Aquitaine Avenue is under the jurisdiction of the City of
Mississauga and is classified as a major collector roadway per schedule 5 of the City of Mississauga
Official Plan. There is a concrete sidewalk located on each side of the roadway separated from the
travel lanes by a boulevard strip.
Shelter Bay Road has a posted speed limit of 40 km/h and the segment within the study area has
been ascribed an east-west orientation in this study. Shelter Bay Road consists of one lane per travel
direction. The road is under the jurisdiction of the City of Mississauga and is classified as a minor
collector roadway per schedule 5 of the City of Mississauga Official Plan. There is a concrete
sidewalk located on each side of the road separated from the travel lanes by a boulevard strip.
The four-legged intersection of Glen Erin Drive and Aquitaine Avenue is signalized and coordinated
with adjacent intersection along Aquitaine Avenue. All four approaches at the intersection consist
of an exclusive left-turn lane, a single exclusive through lane and a shared through/right-turn lane.
The four-legged intersection of Glen Erin Drive and Shelter Bay Road/Private Access (to adjacent
Maple Park residence) is signalized. The north and south approaches (Glen Erin Drive) at the
intersection consist of an exclusive left-turn lane, a single exclusive through lane and a shared
through/right-turn lane. The east and west approaches have single shared lanes.
4.3 Traffic Data
At the time of this study, an ongoing global pandemic has changed typica travel patterns.
Consequently, traffic counts were not undertaken as traffic on the boundary road network will not
be reflective of typical commuter travel patterns. As such, the most current traffic turning movement
counts available were obtained from the City of Mississauga and used for this study.
The traffic turning movement counts at the intersection of Glen Erin Drive and Aquitaine Avenue
were undertaken on Wednesday, October 17, 2018 from 7:00 a.m. to 6:00 p.m. The peak hours of
the turning movement counts occurred between 7:45 a.m. and 8:45 a.m. for the morning peak
period and between 5:00 p.m. and 6:00 p.m. for the evening peak period.
Starwood Group Inc. Traffic Impact Study
6719 Glen Erin Drive, City of Mississauga October 2021
C.F. Crozier & Associates Inc. Page 3
Project No. 1886-5590
Traffic turning movement counts at the intersection of Glen Erin Drive and Shelter Bay Road/ Private
Access were undertaken on Thursday, October 18, 2018 from 7:00 a.m. to 6:00 p.m. The peak hours
of the turning movement counts occurred between 8:00 a.m. and 9:00 a.m. for the morning peak
period and between 5:00 p.m. and 6:00 p.m. for the evening peak period. Summary of the turning
movement counts are provided in Appendix C.
To establish turning movement counts for the intersection of the existing site access/private access
(to the apartment east of Glen Erin Drive) with Glen Erin Drive, the following procedure was used:
• Generate trips for the existing apartment at the 6719 Glen Erin Drive site using the Institute of
Transportation Engineers Trip Generation Manual, 10th Edition. Trip details are presented
under section 6 of this study.
• Distribute the existing apartment generated trips through the site access based on the
Transportation Tomorrow Survey (TTS) as presented under section 6 (Figure 5) of this study.
• For conservativeness, trips were assumed for the opposing private access connecting the
east apartment across Glen Erin Drive. Due to similarities between the properties, it is
assumed that the trips will be like the existing 6719 Glen Erin Drive site trips.
• Extrapolate the northbound and southbound through volumes based on the traffic volumes
at the intersection of Glen Erin Drive and Aquitaine Avenue.
Refer to Appendix C for details of the procedure described above and the resulting extrapolated
intersection volumes.
Traffic volumes were grown from 2018 to 2020 using the methodology described in Section 5.2,
Future Traffic Forecasting. The 2020 existing traffic volumes are illustrated in Figure 4.
4.4 Active Transportation Routes
There are pedestrian sidewalks located on both sides of Glen Erin Drive and Aquitaine Avenue at
the segments fronting the property. No bicycle facilities are currently located on either of the
boundary roads. However, there are off-street multi-use trails connecting the site to several parks,
the Meadowvale community centre, Meadowvale town centre and the surrounding area.
Glen Erin Drive is classified as a future “Primary On-Road/Boulevard Routes” per Schedule 7 “Long
Term Cycling Routes” of the City of Mississauga’s Official Plan. Per Map 5-5 “Proposed Secondary
Cycling Route Network” for the City, Aquitaine Avenue is classified as secondary cycling route for
future implementation. Relevant maps are included in Appendix B.
4.5 Public Transit
There are several transit routes providing services on the boundary roads and bus stops located near
the site. At the time of this study, transit services were impacted by the Covid 19 pandemic,
therefore, details of the typical existing transit services operating adjacent to the site are not fully
captured. At this time, Miway transit bus routes 44, 48, 57 and 90 provides services with stops located
within 100 m of the property. These bus routes connect the site to major city locations such as the
University of Toronto (Mississauga campus), Pearson International Airport, Erin Mills Town Centre and
bus stations for accessing most of the City. The noted bus routes and several other routes at the
Meadowvale town centre (within 500 m of site) typically serve the site and surrounding areas all
week. Refer to the Miway route map excerpts presented in Appendix B.
Starwood Group Inc. Traffic Impact Study
6719 Glen Erin Drive, City of Mississauga October 2021
C.F. Crozier & Associates Inc. Page 4
Project No. 1886-5590
In addition to the Miway transit routes, there is a Meadowvale GO station located approximately
1.25 km from the property. The GO station provides connection to Milton and the union station in
Toronto. There are connecting GO transit routes to most of the Greater Toronto and Hamilton Area
(GTHA) from the union station.
4.6 Traffic Modeling
The assessment of intersections is based on the method outlined in the “Highway Capacity Manual,
2010” using Synchro 9 modeling software. Intersections are assessed using a Level of Service metric,
with ranges of delay assigned a letter from “A” to “F”. A Level of Service “A” or “B” would typically
be measured during off-peak hours when lesser traffic volumes are on the roadways with minimal
delays to traffic. Levels of Service “C” through “F” would typically be measured in the commuter
peak hours when greater vehicle volumes cause delays and longer travel times. The Level of Service
(LOS) definitions for signalized and stop-controlled intersections are included in Appendix D.
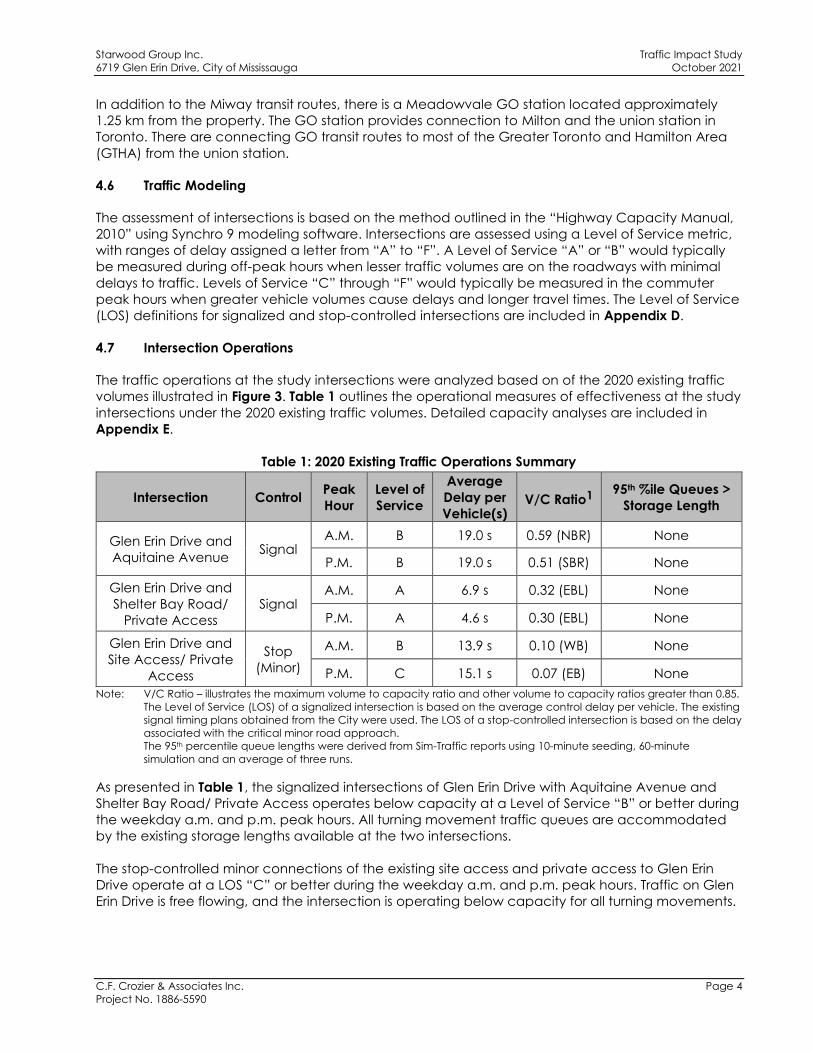
4.7 Intersection Operations
The traffic operations at the study intersections were analyzed based on of the 2020 existing traffic
volumes illustrated in Figure 3. Table 1 outlines the operational measures of effectiveness at the study
intersections under the 2020 existing traffic volumes. Detailed capacity analyses are included in
Appendix E.
Table 1: 2020 Existing Traffic Operations Summary
Note: V/C Ratio – illustrates the maximum volume to capacity ratio and other volume to capacity ratios greater than 0.85.
The Level of Service (LOS) of a signalized intersection is based on the average control delay per vehicle. The existing
signal timing plans obtained from the City were used. The LOS of a stop-controlled intersection is based on the delay
associated with the critical minor road approach.
The 95th percentile queue lengths were derived from Sim-Traffic reports using 10-minute seeding, 60-minute
simulation and an average of three runs.
As presented in Table 1, the signalized intersections of Glen Erin Drive with Aquitaine Avenue and
Shelter Bay Road/ Private Access operates below capacity at a Level of Service “B” or better during
the weekday a.m. and p.m. peak hours. All turning movement traffic queues are accommodated
by the existing storage lengths available at the two intersections.
The stop-controlled minor connections of the existing site access and private access to Glen Erin
Drive operate at a LOS “C” or better during the weekday a.m. and p.m. peak hours. Traffic on Glen
Erin Drive is free flowing, and the intersection is operating below capacity for all turning movements.
Intersection Control Peak
Hour
Level of
Service
Average
Delay per
Vehicle(s) V/C Ratio1
95th %ile Queues >
Storage Length
Glen Erin Drive and
Aquitaine Avenue Signal
A.M. B 19.0 s 0.59 (NBR) None
P.M. B 19.0 s 0.51 (SBR) None
Glen Erin Drive and
Shelter Bay Road/
Private Access
Signal A.M. A 6.9 s 0.32 (EBL) None
P.M. A 4.6 s 0.30 (EBL) None
Glen Erin Drive and
Site Access/ Private
Access
Stop
(Minor)
A.M. B 13.9 s 0.10 (WB) None
P.M. C 15.1 s 0.07 (EB) None
Starwood Group Inc. Traffic Impact Study
6719 Glen Erin Drive, City of Mississauga October 2021
C.F. Crozier & Associates Inc. Page 5
Project No. 1886-5590
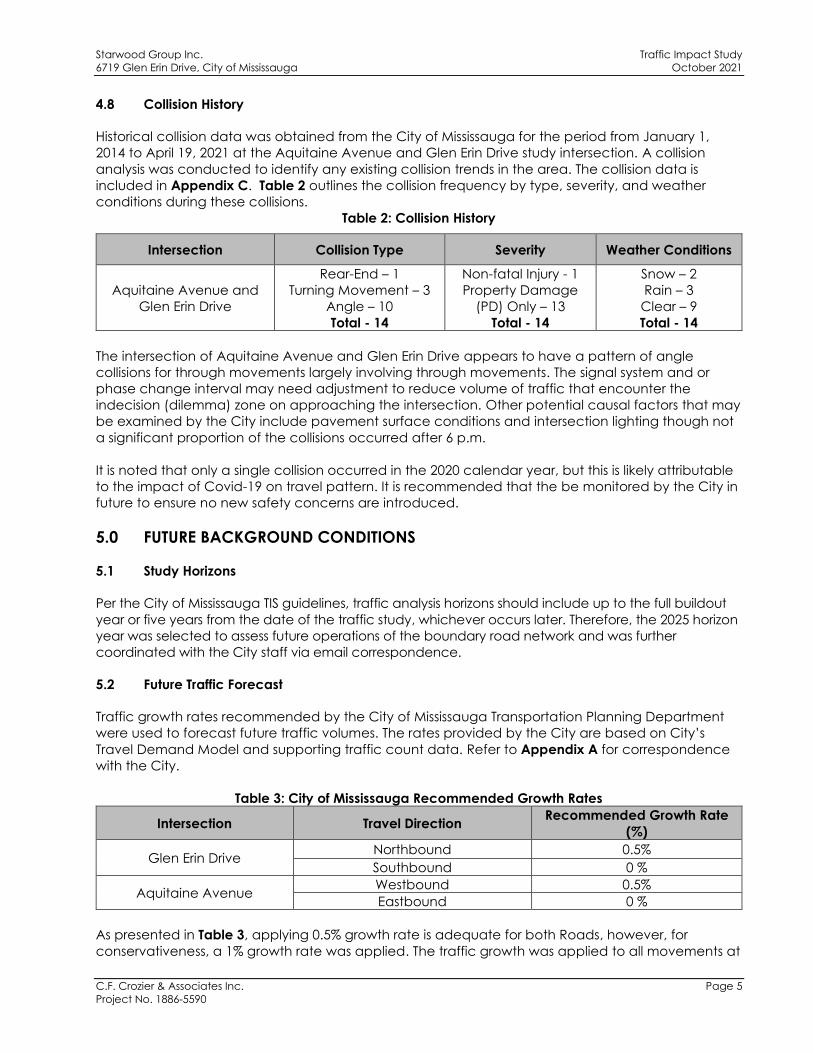
4.8 Collision History
Historical collision data was obtained from the City of Mississauga for the period from January 1,
2014 to April 19, 2021 at the Aquitaine Avenue and Glen Erin Drive study intersection. A collision
analysis was conducted to identify any existing collision trends in the area. The collision data is
included in Appendix C. Table 2 outlines the collision frequency by type, severity, and weather
conditions during these collisions.
Table 2: Collision History
Intersection Collision Type Severity Weather Conditions
Aquitaine Avenue and
Glen Erin Drive
Rear-End – 1
Turning Movement – 3
Angle – 10
Total - 14
Non-fatal Injury - 1
Property Damage
(PD) Only – 13
Total - 14
Snow – 2
Rain – 3
Clear – 9
Total - 14
The intersection of Aquitaine Avenue and Glen Erin Drive appears to have a pattern of angle
collisions for through movements largely involving through movements. The signal system and or
phase change interval may need adjustment to reduce volume of traffic that encounter the
indecision (dilemma) zone on approaching the intersection. Other potential causal factors that may
be examined by the City include pavement surface conditions and intersection lighting though not
a significant proportion of the collisions occurred after 6 p.m.
It is noted that only a single collision occurred in the 2020 calendar year, but this is likely attributable
to the impact of Covid-19 on travel pattern. It is recommended that the be monitored by the City in
future to ensure no new safety concerns are introduced.
5.0 FUTURE BACKGROUND CONDITIONS
5.1 Study Horizons
Per the City of Mississauga TIS guidelines, traffic analysis horizons should include up to the full buildout
year or five years from the date of the traffic study, whichever occurs later. Therefore, the 2025 horizon
year was selected to assess future operations of the boundary road network and was further
coordinated with the City staff via email correspondence.
5.2 Future Traffic Forecast
Traffic growth rates recommended by the City of Mississauga Transportation Planning Department
were used to forecast future traffic volumes. The rates provided by the City are based on City’s
Travel Demand Model and supporting traffic count data. Refer to Appendix A for correspondence
with the City.
Table 3: City of Mississauga Recommended Growth Rates
Intersection Travel Direction Recommended Growth Rate
(%)
Glen Erin Drive Northbound 0.5%
Southbound 0 %
Aquitaine Avenue Westbound 0.5%
Eastbound 0 %
As presented in Table 3, applying 0.5% growth rate is adequate for both Roads, however, for
conservativeness, a 1% growth rate was applied. The traffic growth was applied to all movements at
Starwood Group Inc. Traffic Impact Study
6719 Glen Erin Drive, City of Mississauga October 2021
C.F. Crozier & Associates Inc. Page 6
Project No. 1886-5590
the intersection of Glen Erin Drive with Aquitaine Avenue, and to only the through movements on
Glen Erin Drive at its intersections with the site access and Shelter Bay Road. No growth rates were
available from the City for Shelter Bay Road. Given the limits of Shelter Bay Road, no growth rates
were applied to Shelter Bay Road, the site access or the private accesses.
5.3 Background Developments
Based on comments from the Planning Application Status Report, dated January 7, 2021, the 2700
Aquitaine Avenue background development was incorporated into the future background for this
study. The TIS for this background development was reviewed, with net new site generated trips being
added to the future background total based on the trip distribution and assignment outlined in the TIS
(refer to Appendix F for report excerpts). Furthermore, there was a proposed residential development
at 6550 Glen Erin Drive (under City review), however, it is expected to be captured by the growth rates
proposed herein.
5.4 Future Roadway Improvements
Both the City of Mississauga Official Plan and Transportation Master Plan (2019) does not identify any
future roadway capacity improvements planned by the City for Glen Erin Drive or Aquitaine Avenue
within the study horizons herein. This study maintains the existing roadway configuration for the future
horizon analysis.
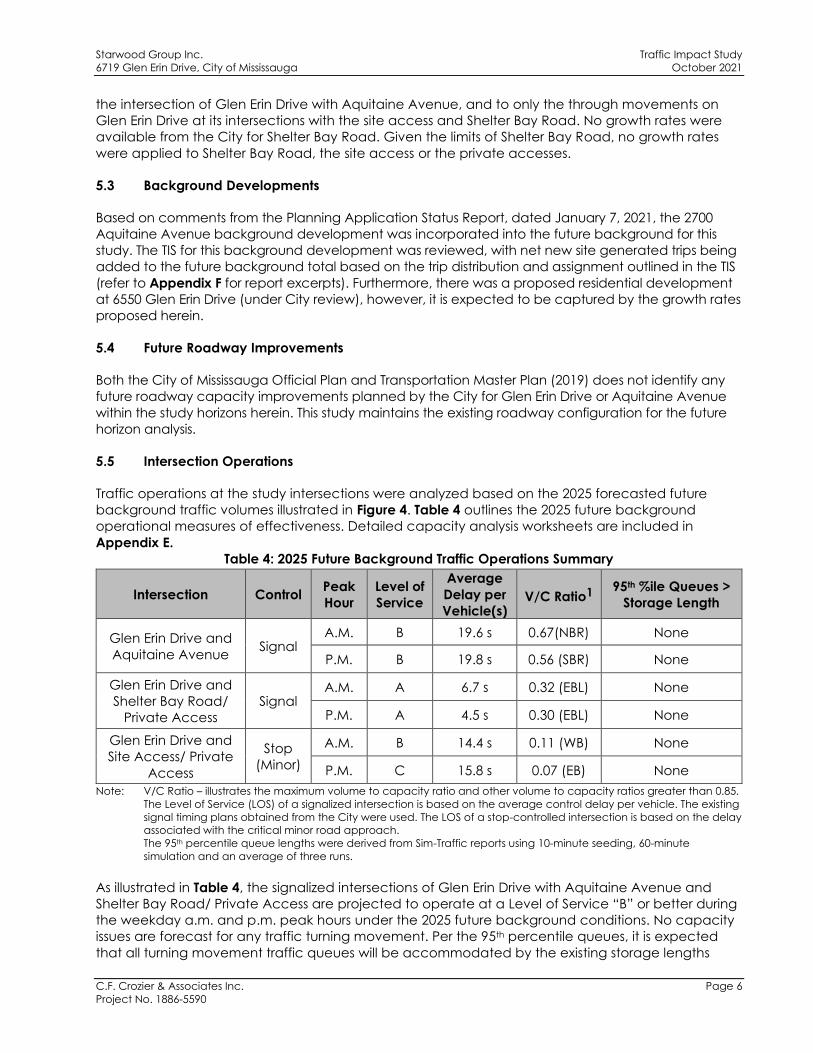
5.5 Intersection Operations
Traffic operations at the study intersections were analyzed based on the 2025 forecasted future
background traffic volumes illustrated in Figure 4. Table 4 outlines the 2025 future background
operational measures of effectiveness. Detailed capacity analysis worksheets are included in
Appendix E.
Table 4: 2025 Future Background Traffic Operations Summary
Note: V/C Ratio – illustrates the maximum volume to capacity ratio and other volume to capacity ratios greater than 0.85.
The Level of Service (LOS) of a signalized intersection is based on the average control delay per vehicle. The existing
signal timing plans obtained from the City were used. The LOS of a stop-controlled intersection is based on the delay
associated with the critical minor road approach.
The 95th percentile queue lengths were derived from Sim-Traffic reports using 10-minute seeding, 60-minute
simulation and an average of three runs.
As illustrated in Table 4, the signalized intersections of Glen Erin Drive with Aquitaine Avenue and
Shelter Bay Road/ Private Access are projected to operate at a Level of Service “B” or better during
the weekday a.m. and p.m. peak hours under the 2025 future background conditions. No capacity
issues are forecast for any traffic turning movement. Per the 95th percentile queues, it is expected
that all turning movement traffic queues will be accommodated by the existing storage lengths
Intersection Control Peak
Hour
Level of
Service
Average
Delay per
Vehicle(s) V/C Ratio1
95th %ile Queues >
Storage Length
Glen Erin Drive and
Aquitaine Avenue Signal
A.M. B 19.6 s 0.67(NBR) None
P.M. B 19.8 s 0.56 (SBR) None
Glen Erin Drive and
Shelter Bay Road/
Private Access
Signal A.M. A 6.7 s 0.32 (EBL) None
P.M. A 4.5 s 0.30 (EBL) None
Glen Erin Drive and
Site Access/ Private
Access
Stop
(Minor)
A.M. B 14.4 s 0.11 (WB) None
P.M. C 15.8 s 0.07 (EB) None
Starwood Group Inc. Traffic Impact Study
6719 Glen Erin Drive, City of Mississauga October 2021
C.F. Crozier & Associates Inc. Page 7
Project No. 1886-5590
available at the intersection. The average delays at the intersection of Glen Erin Drive with Shelter
Bay Road/ Private Access improves slightly compared to the 2020 existing conditions due to an
increase in the less delayed through movements on Glen Erin Drive.
Under the 2025 future background study horizon, the stop-controlled minor connections of the
existing site access and private access to Glen Erin Drive are forecast to operate at a LOS “C” or
better during the weekday a.m. and p.m. peak hours. Traffic on Glen Erin Drive is free flowing, and
the intersection is projected to operate below capacity for all turning movements.
6.0 SITE GENERATED TRAFFIC
The proposed development addition to the site will result in new traffic turning movements on the
boundary road network that would otherwise not exist. This section presents the generated trips and
trip assignment through the study intersections.
6.1 Multi-Modal Trip Distribution
Consideration was given to the transit, pedestrian and bicycle trip generation for the proposed site
expansion. The 2016 Transportation Tomorrow Survey (TTS) data was used to determine the existing
modal split. The results were filtered to the primary mode of travel within the 2006 GTA Zone 3719
where the site is located. The results indicate a modal split of 67% auto driver trips, 13% auto
passenger and 20% non-auto trips (includes all transit types, walking, biking and school buses).
Active transportation and transit are expected to consist a portion of the trips generated by this site.
Though the TTS data indicates 67% to 80% of trips within the study area are attributable to auto, only
a 15% modal split reduction will be applied to the new site generated trips herein for
conservativeness.
6.2 ITE Trip Generation
To forecast the trips generated by the development, the ITE Trip Generation Manual, 10th Edition was
used. Land Use Category (LUC) 221, “Multifamily Housing Mid-Rise” and LUC 222 “Multifamily Housing
High-Rise” were used for the proposed townhouses and 12-storey apartment building, respectively.
For conservativeness, the fitted curve equation methodology was used to generate the trips as it
forecasts higher trips compared to the average rates.
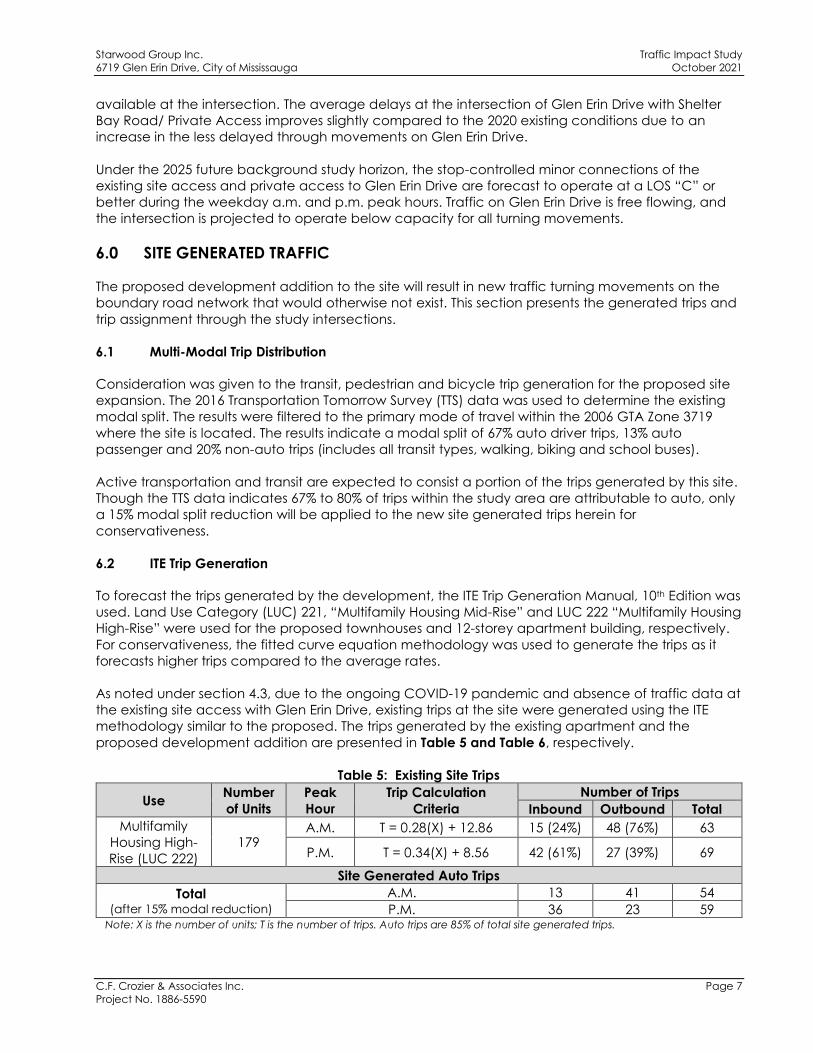
As noted under section 4.3, due to the ongoing COVID-19 pandemic and absence of traffic data at
the existing site access with Glen Erin Drive, existing trips at the site were generated using the ITE
methodology similar to the proposed. The trips generated by the existing apartment and the
proposed development addition are presented in Table 5 and Table 6, respectively.
Table 5: Existing Site Trips
Use Number
of Units
Peak
Hour
Trip Calculation
Criteria
Number of Trips
Inbound Outbound Total
Multifamily
Housing High-
Rise (LUC 222)
179 A.M. T = 0.28(X) + 12.86 15 (24%) 48 (76%) 63
P.M. T = 0.34(X) + 8.56 42 (61%) 27 (39%) 69
Site Generated Auto Trips
Total (after 15% modal reduction)
A.M. 13 41 54
P.M. 36 23 59 Note: X is the number of units; T is the number of trips. Auto trips are 85% of total site generated trips.
Starwood Group Inc. Traffic Impact Study
6719 Glen Erin Drive, City of Mississauga October 2021
C.F. Crozier & Associates Inc. Page 8
Project No. 1886-5590
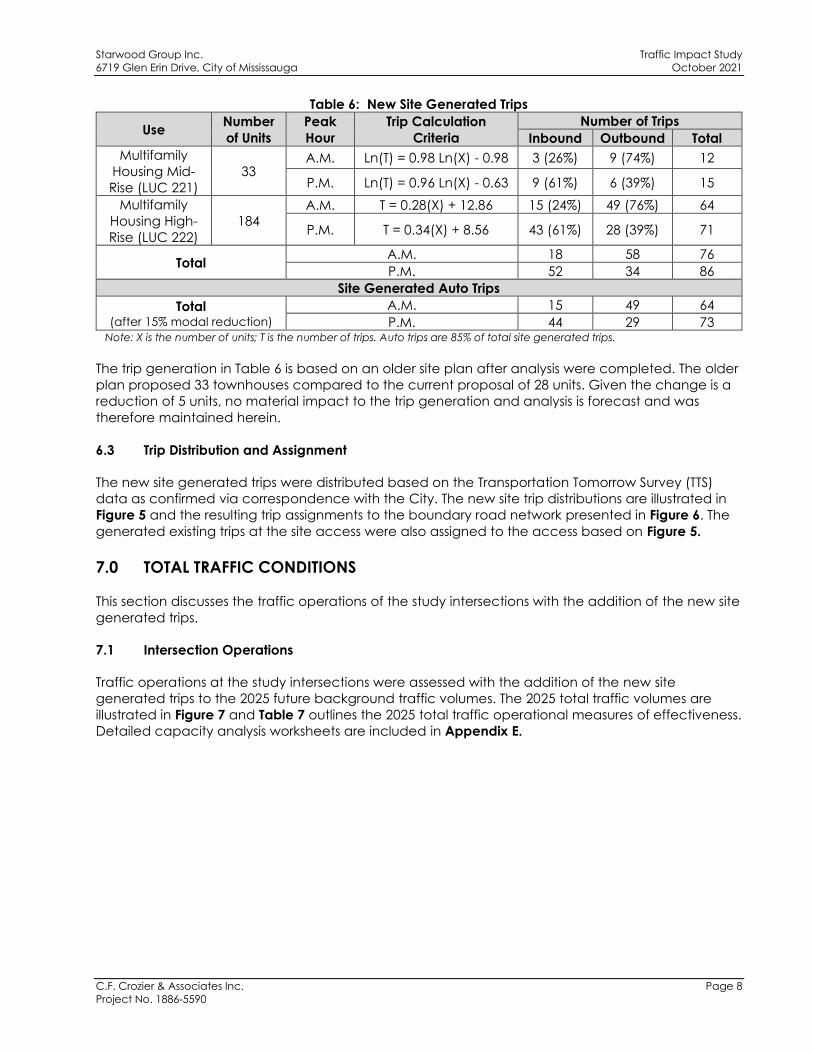
Table 6: New Site Generated Trips
Use Number
of Units
Peak
Hour
Trip Calculation
Criteria
Number of Trips
Inbound Outbound Total
Multifamily
Housing Mid-
Rise (LUC 221)
33 A.M. Ln(T) = 0.98 Ln(X) - 0.98 3 (26%) 9 (74%) 12
P.M. Ln(T) = 0.96 Ln(X) - 0.63 9 (61%) 6 (39%) 15
Multifamily
Housing High-
Rise (LUC 222)
184
A.M. T = 0.28(X) + 12.86 15 (24%) 49 (76%) 64
P.M. T = 0.34(X) + 8.56 43 (61%) 28 (39%) 71
Total A.M. 18 58 76
P.M. 52 34 86
Site Generated Auto Trips
Total (after 15% modal reduction)
A.M. 15 49 64
P.M. 44 29 73 Note: X is the number of units; T is the number of trips. Auto trips are 85% of total site generated trips.
The trip generation in Table 6 is based on an older site plan after analysis were completed. The older
plan proposed 33 townhouses compared to the current proposal of 28 units. Given the change is a
reduction of 5 units, no material impact to the trip generation and analysis is forecast and was
therefore maintained herein.
6.3 Trip Distribution and Assignment
The new site generated trips were distributed based on the Transportation Tomorrow Survey (TTS)
data as confirmed via correspondence with the City. The new site trip distributions are illustrated in
Figure 5 and the resulting trip assignments to the boundary road network presented in Figure 6. The
generated existing trips at the site access were also assigned to the access based on Figure 5.
7.0 TOTAL TRAFFIC CONDITIONS
This section discusses the traffic operations of the study intersections with the addition of the new site
generated trips.
7.1 Intersection Operations
Traffic operations at the study intersections were assessed with the addition of the new site
generated trips to the 2025 future background traffic volumes. The 2025 total traffic volumes are
illustrated in Figure 7 and Table 7 outlines the 2025 total traffic operational measures of effectiveness.
Detailed capacity analysis worksheets are included in Appendix E.
Starwood Group Inc. Traffic Impact Study
6719 Glen Erin Drive, City of Mississauga October 2021
C.F. Crozier & Associates Inc. Page 9
Project No. 1886-5590
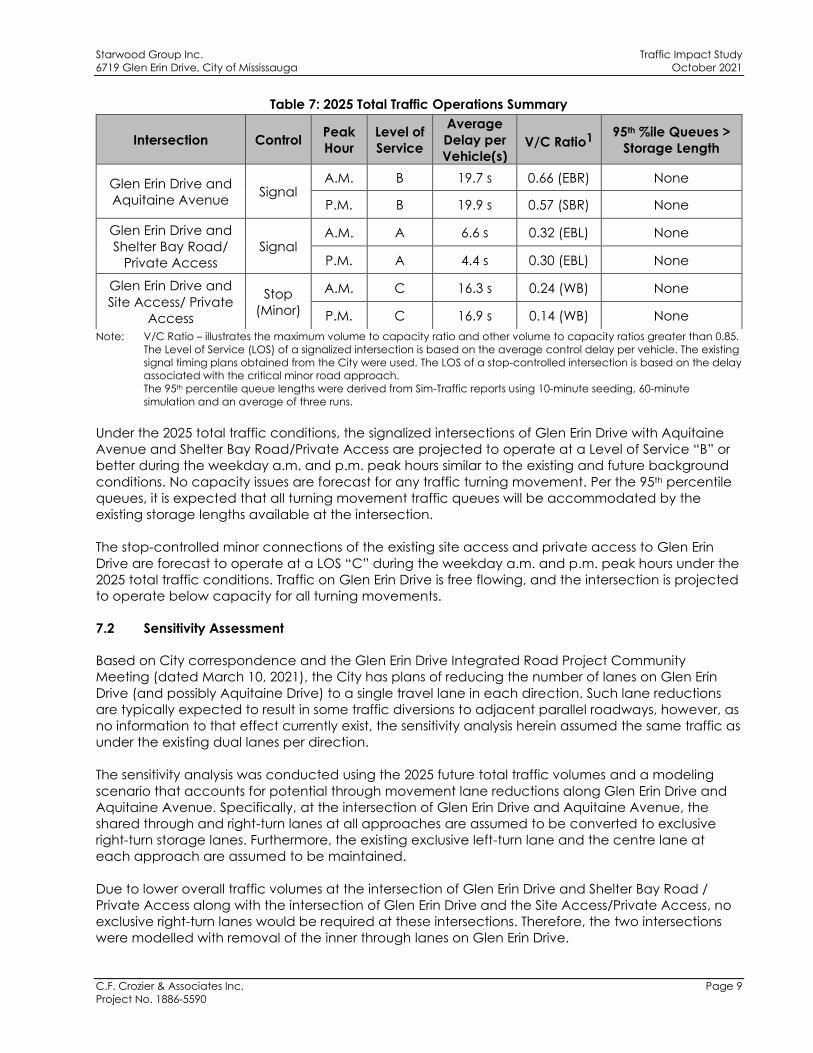
Table 7: 2025 Total Traffic Operations Summary
Note: V/C Ratio – illustrates the maximum volume to capacity ratio and other volume to capacity ratios greater than 0.85.
The Level of Service (LOS) of a signalized intersection is based on the average control delay per vehicle. The existing
signal timing plans obtained from the City were used. The LOS of a stop-controlled intersection is based on the delay
associated with the critical minor road approach.
The 95th percentile queue lengths were derived from Sim-Traffic reports using 10-minute seeding, 60-minute
simulation and an average of three runs.
Under the 2025 total traffic conditions, the signalized intersections of Glen Erin Drive with Aquitaine
Avenue and Shelter Bay Road/Private Access are projected to operate at a Level of Service “B” or
better during the weekday a.m. and p.m. peak hours similar to the existing and future background
conditions. No capacity issues are forecast for any traffic turning movement. Per the 95th percentile
queues, it is expected that all turning movement traffic queues will be accommodated by the
existing storage lengths available at the intersection.
The stop-controlled minor connections of the existing site access and private access to Glen Erin
Drive are forecast to operate at a LOS “C” during the weekday a.m. and p.m. peak hours under the
2025 total traffic conditions. Traffic on Glen Erin Drive is free flowing, and the intersection is projected
to operate below capacity for all turning movements.
7.2 Sensitivity Assessment
Based on City correspondence and the Glen Erin Drive Integrated Road Project Community
Meeting (dated March 10, 2021), the City has plans of reducing the number of lanes on Glen Erin
Drive (and possibly Aquitaine Drive) to a single travel lane in each direction. Such lane reductions
are typically expected to result in some traffic diversions to adjacent parallel roadways, however, as
no information to that effect currently exist, the sensitivity analysis herein assumed the same traffic as
under the existing dual lanes per direction.
The sensitivity analysis was conducted using the 2025 future total traffic volumes and a modeling
scenario that accounts for potential through movement lane reductions along Glen Erin Drive and
Aquitaine Avenue. Specifically, at the intersection of Glen Erin Drive and Aquitaine Avenue, the
shared through and right-turn lanes at all approaches are assumed to be converted to exclusive
right-turn storage lanes. Furthermore, the existing exclusive left-turn lane and the centre lane at
each approach are assumed to be maintained.
Due to lower overall traffic volumes at the intersection of Glen Erin Drive and Shelter Bay Road /
Private Access along with the intersection of Glen Erin Drive and the Site Access/Private Access, no
exclusive right-turn lanes would be required at these intersections. Therefore, the two intersections
were modelled with removal of the inner through lanes on Glen Erin Drive.
Intersection Control Peak
Hour
Level of
Service
Average
Delay per
Vehicle(s) V/C Ratio1
95th %ile Queues >
Storage Length
Glen Erin Drive and
Aquitaine Avenue Signal
A.M. B 19.7 s 0.66 (EBR) None
P.M. B 19.9 s 0.57 (SBR) None
Glen Erin Drive and
Shelter Bay Road/
Private Access
Signal A.M. A 6.6 s 0.32 (EBL) None
P.M. A 4.4 s 0.30 (EBL) None
Glen Erin Drive and
Site Access/ Private
Access
Stop
(Minor)
A.M. C 16.3 s 0.24 (WB) None
P.M. C 16.9 s 0.14 (WB) None
Starwood Group Inc. Traffic Impact Study
6719 Glen Erin Drive, City of Mississauga October 2021
C.F. Crozier & Associates Inc. Page 10
Project No. 1886-5590
Traffic operations at the study intersections were assessed using the 2025 total traffic volumes
illustrated in Figure 7. Table 7 outlines the 2025 sensitivity analysis operational measures of
effectiveness. Detailed capacity analysis worksheets are included in Appendix E.
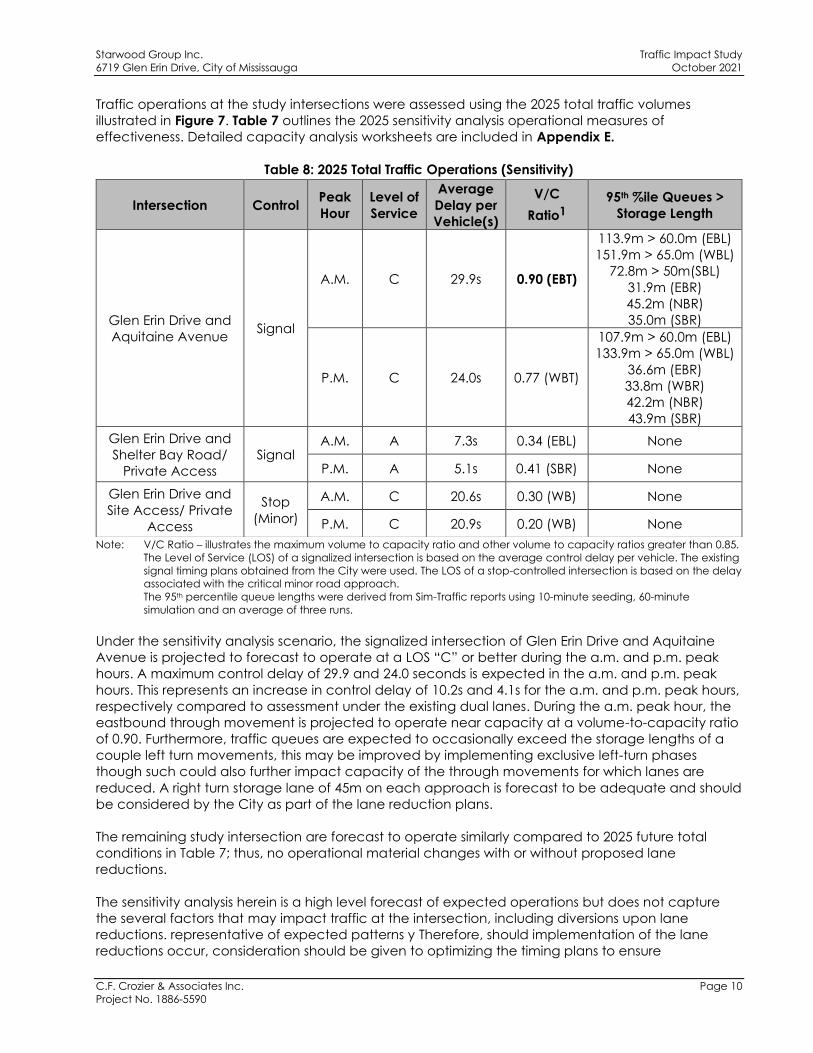
Table 8: 2025 Total Traffic Operations (Sensitivity)
Note: V/C Ratio – illustrates the maximum volume to capacity ratio and other volume to capacity ratios greater than 0.85.
The Level of Service (LOS) of a signalized intersection is based on the average control delay per vehicle. The existing
signal timing plans obtained from the City were used. The LOS of a stop-controlled intersection is based on the delay
associated with the critical minor road approach.
The 95th percentile queue lengths were derived from Sim-Traffic reports using 10-minute seeding, 60-minute
simulation and an average of three runs.
Under the sensitivity analysis scenario, the signalized intersection of Glen Erin Drive and Aquitaine
Avenue is projected to forecast to operate at a LOS “C” or better during the a.m. and p.m. peak
hours. A maximum control delay of 29.9 and 24.0 seconds is expected in the a.m. and p.m. peak
hours. This represents an increase in control delay of 10.2s and 4.1s for the a.m. and p.m. peak hours,
respectively compared to assessment under the existing dual lanes. During the a.m. peak hour, the
eastbound through movement is projected to operate near capacity at a volume-to-capacity ratio
of 0.90. Furthermore, traffic queues are expected to occasionally exceed the storage lengths of a
couple left turn movements, this may be improved by implementing exclusive left-turn phases
though such could also further impact capacity of the through movements for which lanes are
reduced. A right turn storage lane of 45m on each approach is forecast to be adequate and should
be considered by the City as part of the lane reduction plans.
The remaining study intersection are forecast to operate similarly compared to 2025 future total
conditions in Table 7; thus, no operational material changes with or without proposed lane
reductions.
The sensitivity analysis herein is a high level forecast of expected operations but does not capture
the several factors that may impact traffic at the intersection, including diversions upon lane
reductions. representative of expected patterns y Therefore, should implementation of the lane
reductions occur, consideration should be given to optimizing the timing plans to ensure
Intersection Control Peak
Hour
Level of
Service
Average
Delay per
Vehicle(s)
V/C
Ratio1
95th %ile Queues >
Storage Length
Glen Erin Drive and
Aquitaine Avenue Signal
A.M. C 29.9s 0.90 (EBT)
113.9m > 60.0m (EBL)
151.9m > 65.0m (WBL)
72.8m > 50m(SBL)
31.9m (EBR)
45.2m (NBR)
35.0m (SBR)
P.M. C 24.0s 0.77 (WBT)
107.9m > 60.0m (EBL)
133.9m > 65.0m (WBL)
36.6m (EBR)
33.8m (WBR)
42.2m (NBR)
43.9m (SBR)
Glen Erin Drive and
Shelter Bay Road/
Private Access
Signal A.M. A 7.3s 0.34 (EBL) None
P.M. A 5.1s 0.41 (SBR) None
Glen Erin Drive and
Site Access/ Private
Access
Stop
(Minor)
A.M. C 20.6s 0.30 (WB) None
P.M. C 20.9s 0.20 (WB) None
Starwood Group Inc. Traffic Impact Study
6719 Glen Erin Drive, City of Mississauga October 2021
C.F. Crozier & Associates Inc. Page 11
Project No. 1886-5590
appropriate effective green time is provided for optimal intersection performance. It is
recommended and expected that any of such improvements will be investigated (perhaps piloted)
along with assessment of operational and safety impacts by the City prior to implementation.
7.3 Warrants Assessment
Traffic signal warrant analysis was conducted using an Ontario Traffic Manual (OTM) Book 12
configured excel sheet based on the average hourly volume approach. Based on the signal
warrant analysis, traffic signals are not warranted at the existing site access to be retained
(regardless 3 or 5 lanes on Glen Erin Drive). No collision data adjacent to the site access was
available from the City. The traffic signal control warrant analysis and results for the ultimate 2025
horizon is presented in Appendix G. Given no signals are warranted in the ultimate, none is
warranted in prior horizons as the 2025 Future Total is the worst case with the largest volumes. It is
further noted that the OTM 12 identifies a minimum spacing of 215m between signalized
intersections, therefore, the site access would not be an ideal location should signals even be
warranted.
7.4 Site Access Safety Review
The standards set out in the Transportation Association of Canada (TAC) Geometric Design Guide
for Canadian Roads (GDGCR) was used to assess the existing full moves site access at Glen Erin
Drive (to remain) with regards to the adequacy of available sightlines.
As Glen Erin Drive has a speed limit of 50 km/h per municipal regulation, a design speed of 60 km/h
was assumed to assess the available site distance. Assuming a right turn time gap of 6.5 seconds
and a left-turn gap of 7.5 seconds for passenger vehicles per Table 9.9.3, and adopting equation
9.9.1 of the TAC-GDGCR, the minimum sight distance required for a right turn and a left-turn at the
site access is 110 m and 125 m, respectively.
The available sight distances on Glen Erin Drive at the existing site access location were measured
from an online Geographic Information System (GIS) mapping tool. The following assumptions were
made regarding the sight distance measurements:
• A standard driver eye height of 1.08 metres for a passenger car.
• A 4.4 metres setback from the edge of the outer lane to represent a vehicle waiting to exit
the connecting roadway.
The available sight distances exceed 125 metres looking north or south from the site access at Glen
Erin and the layby exit exist . Therefore, no safety concerns related to sightlines are anticipated at
the existing site access. Additionally, no issues such as corner clearances, access conflicts and
transit operational conflicts are forecast. The existing full moves site access is expected to continue
serving the site safely.
7.5 Vehicle Maneuverability and Waste Removal
Vehicle turning plans using the Region of Peel front-end bin loading waste vehicle and an aerial fire
truck as the design vehicles were prepared to assess the ability of the site to accommodate
circulation of expected waste collection and emergency vehicles. The vehicle turning plans as
presented in Appendix G indicate that the site can adequately accommodate circulation of the
design vehicles.
The proposed design for the waste collection vehicle circulation route and collection point were
adapted in conformance with the requirements of the Region of Peel “Waste Collection Design
Starwood Group Inc. Traffic Impact Study
6719 Glen Erin Drive, City of Mississauga October 2021
C.F. Crozier & Associates Inc. Page 12
Project No. 1886-5590
Standard Manual (December 2015)”. Details regarding the waste collection plan for the site are
included in the site plan (Figures 2 of the Appendices).
8.0 TRANSPORTATION DEMAND MANAGEMENT REVIEW
The purpose of the Transportation Demand Management (TDM) Plan is to review the existing and
future TDM opportunities and recommend site specific measures to enhance the development’s
efficiency in reducing site generated single occupancy vehicle (SOV) trips.
8.1 Existing and Future TDM opportunities
As noted under section 4.4 and 4.5, there are non-auto trip options available within the study area
and with convenient connections to the site. There are currently pedestrian facilities on both sides of
the boundary roads as well as multi-use trails connecting to most of the surrounding areas. No
cycling facilities currently exist, but the City has plans of implementing future cycling on both of Glen
Erin Drive and Aquitaine Avenue. There are a plethora of transit routes operating close to the site,
providing services to most major locations within the area. The Meadowvale GO station further
provides intercity connections to several destinations in the Greater Toronto and Hamilton Area.
Given the existing active transportation and transit facilities adjacent to the site herein, there is
opportunity to increase active transportation use with a resultant reduction in SOV trips for the
proposed development addition to the site.
8.2 Site Specific TDM measures
Given the available active transportation and transit on adjacent roads and in proximity to the site,
there are site specific TDM measures that can be implemented to capitalize on the TDM
opportunities.
8.2.1 Infrastructure
Per the current site plan prepared by IBI Group Architects Inc., dated August 1st, 2019, the following
elements are expected to be provided:
• Internal sidewalks connecting the exiting building, the proposed 12-storey building,
townhouse blocks and the proposed internal landscape/ play-ground area.
• Clearly delineated crosswalk markings are proposed to identify the pedestrian crosswalks
and improve pedestrian safety.
• Pedestrian/ cycling path connections from the site to the surrounding trails, Glen Erin Drive
and Aquitaine Avenue.
• The site proposes 20 short term at grade bicycle racks for visitors to store their bicycles.
Similarly, 235 long term tenant bicycle spaces are securely provided underground.
These infrastructures are expected to further encourage and promote active transportation at the
site.
8.2.2 Education/Promotion and Incentives
The provision of up-to-date transit schedules and maps along with pedestrian connectivity maps will
educate them on the available opportunities for their trips aside from auto use. This increased
Starwood Group Inc. Traffic Impact Study
6719 Glen Erin Drive, City of Mississauga October 2021
C.F. Crozier & Associates Inc. Page 13
Project No. 1886-5590
awareness of convenient alternate transportation options has been historically shown to reduce
SOV trips and may provide similar benefit to the subject development. The landowner may consider
providing transit incentives like pre-loaded PRESTO cards to residents upon occupancy to further
encourage transit use.
8.3 Municipal Mode Share Targets
Per the City of Mississauga Transportation Master Plan – TMP (May 2019), the City has a goal of
diversifying travel choices and increasing dependence on non-auto trips.
The City’s TMP identifies a sustainable modal share of 29% for the entire City during 2019. The TMP
defines sustainable transportation as modes other than driving a car, such as walking, cycling,
transit, ridesharing, and ride hailing in a taxi. The City’s goal is to further continue to improve on the
dependence on sustainable travel modes. Some of the measures noted include implementation of
infrastructure to support both transit and active transportation.
Given the goals of the City, supportive active transportation and TDM measures from new
developments are key components in achieving such targets. The proposed design and TDM
measures proposed for the site herein are expected to contribute to the City’s goal of promoting
sustainable transportation, with a forecasted resultant reduction in SOV trips.
8.4 Non-Auto Site Trip Reduction
Given the existing TDM opportunities available to the site as well as the measures proposed by the
development, it is typical to reduce the overall site generated trips by the proportion expected to
use alternative transportation modes.
As noted under section 6.1 of this report, the 2016 Transportation Tomorrow Survey (TTS) for the zone
where the site is located indicates a modal split of 67% auto driver trips, 13% auto passenger and
20% non-auto trips (includes all transit types, walking, biking and school buses). Therefore, 20% to 33%
reduction of the site generated trips to account for non-auto and or non-single occupant vehicle
(SOV) trips (includes all transit types, carpooling, walking, biking and school buses) may be
considered. However, for conservativeness only a 15% trip reduction was applied to the site
generated trips herein.
9.0 COMMUNITY IMPACTS
A virtual community meeting was held on December 1, 2020, where thoughts of the community
were echoed through the ward councilors. Based on the meeting it is understood that a potential
need for signals at the site access on Glen Erin drive be investigated. As presented in section 7.3, a
traffic signal is not warranted at the site access, thus, with 3 or 5 lanes on Glen Erin Drive. Further, the
intersection is forecast to operate at acceptable levels of services under both Glen Erin Drive lane
scenarios. Further, based on the findings of this study, from a traffic operations and safety
perspective, no material impacts to existing conditions in the area is forecast.
10.0 CONCLUSIONS AND RECOMMENDATIONS
This study has assessed the transportation impacts of the proposed residential addition at the 6719
Glen Erin Drive site in the City of Mississauga. The analysis herein regarding the proposed
development has resulted in the following key findings:
• Under 2020 existing traffic conditions, the signalized intersections of Glen Erin Drive with
Starwood Group Inc. Traffic Impact Study
6719 Glen Erin Drive, City of Mississauga October 2021
C.F. Crozier & Associates Inc. Page 14
Project No. 1886-5590
Aquitaine Avenue and Shelter Bay Road/ Private Access operates below capacity and at a
Level of Service (LOS) “B” or better during both the weekday a.m. and p.m. peak hours.
Similarly, the stop-controlled site access/private access at Glen Erin Drive operates at a LOS
“C” or better.
• The proposed residential development is projected to generate a total of 64 and 73 new
two-way auto-trips during the weekday a.m. and p.m. peak hours, respectively.
• Under the 2025 future background, the signalized intersections of Glen Erin Drive with
Aquitaine Avenue and Shelter Bay Road/Private Access are projected to operate below
capacity and at a LOS “B” or better during both the weekday a.m. and p.m. peak hours.
• The stop-controlled minor connections of the existing site access and private access to Glen
Erin Drive are forecast to operate at a LOS “C” or better during both the a.m. and p.m. peak
hours.
• Under the 2025 total traffic (includes site generated traffic), the signalized intersections of
Glen Erin Drive with Aquitaine Avenue and Shelter Bay Road/Private Access as well as the
stop-controlled site access at Glen Erin Drive are projected to operate below capacity and
at the same LOS as under the 2025 future background (excludes site generated traffic).
• A sensitivity assessment incorporating the potential single lane reductions per travel direction
on Glen Erin Drive and Aquitaine Avenue was undertaken for the ultimate study horizon -
2025 total traffic (includes site generated traffic). The signalized intersections of Glen Erin
Drive and Aquitaine Avenue is forecast to operate a LOS “C” during both a.m. and p.m.
peak hours. Glen Erin Drive intersections with Shelter Bay Road/Private Access as well as the
stop-controlled site access at Glen Erin Drive are projected to operate below capacity and
at the same LOS as under the 2025 horizon (i.e., with or without the lane reductions).
• The site further capitalizes on available transportation demand management (TDM)
opportunities through design and implementation of TDM measures to promote the use of
transit and active transportation which is expected to result in a reduction of single
occupant vehicle trips at the site.
• The existing site access is expected to serve the entire site without any safety issues related to
sightlines, corner clearances, access conflicts and transit operational conflicts. Additionally,
the site can accommodate circulation of the Peel Region front-end waste collection vehicle
that is expected to serve the site.
• A signal warrant was undertaken at the site access and found not to be warranted under
both scenarios of the Glen Erin Drive (i.e., two or four lanes).
• We recommend that the City:
o Consider signal system and or timing plan changes as needed alongside monitoring
the intersection of Glen Erin Drive and Aquitaine Avenue in future to ensure optimal
intersection performance and no safety concerns are introduced.
o Consider including 45m right turn storages on all approaches of the Glen Erin Drive
and Aquitaine Avenue intersection in future should plans to reduce a single lane per
travel direction on both roadway proceed.
o Permit the site access (existing to remain) on Glen Erin Drive as no operational issues
are forecasted.

Starwood Group Inc. Traffic Impact Study
6719 Glen Erin Drive, City of Mississauga October 2021
C.F. Crozier & Associates Inc.
Project No. 1886-5590
APPENDIX A
Correspondence
Starwood Group Inc. Transportation Engineering Comments Response Letter
6719 Glen Erin Drive, City of Mississauga October 2021
C.F. Crozier & Associates Inc. Page 2
Project No. 1886-5590
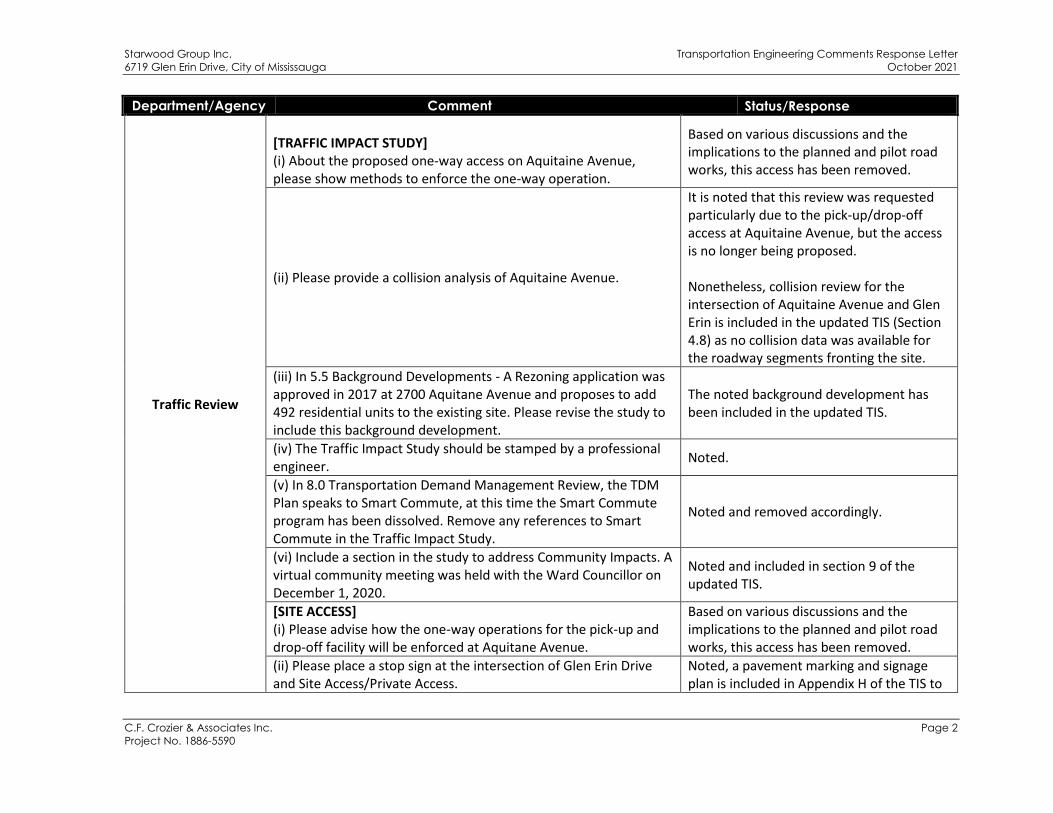
Department/Agency Comment Status/Response
Traffic Review
[TRAFFIC IMPACT STUDY] (i) About the proposed one-way access on Aquitaine Avenue, please show methods to enforce the one-way operation.
Based on various discussions and the implications to the planned and pilot road works, this access has been removed.
(ii) Please provide a collision analysis of Aquitaine Avenue.
It is noted that this review was requested particularly due to the pick-up/drop-off access at Aquitaine Avenue, but the access is no longer being proposed. Nonetheless, collision review for the intersection of Aquitaine Avenue and Glen Erin is included in the updated TIS (Section 4.8) as no collision data was available for the roadway segments fronting the site.
(iii) In 5.5 Background Developments - A Rezoning application was approved in 2017 at 2700 Aquitane Avenue and proposes to add 492 residential units to the existing site. Please revise the study to include this background development.
The noted background development has been included in the updated TIS.
(iv) The Traffic Impact Study should be stamped by a professional engineer.
Noted.
(v) In 8.0 Transportation Demand Management Review, the TDM Plan speaks to Smart Commute, at this time the Smart Commute program has been dissolved. Remove any references to Smart Commute in the Traffic Impact Study.
Noted and removed accordingly.
(vi) Include a section in the study to address Community Impacts. A virtual community meeting was held with the Ward Councillor on December 1, 2020.
Noted and included in section 9 of the updated TIS.
[SITE ACCESS] (i) Please advise how the one-way operations for the pick-up and drop-off facility will be enforced at Aquitane Avenue.
Based on various discussions and the implications to the planned and pilot road works, this access has been removed.
(ii) Please place a stop sign at the intersection of Glen Erin Drive and Site Access/Private Access.
Noted, a pavement marking and signage plan is included in Appendix H of the TIS to
Starwood Group Inc. Transportation Engineering Comments Response Letter
6719 Glen Erin Drive, City of Mississauga October 2021
C.F. Crozier & Associates Inc. Page 3
Project No. 1886-5590
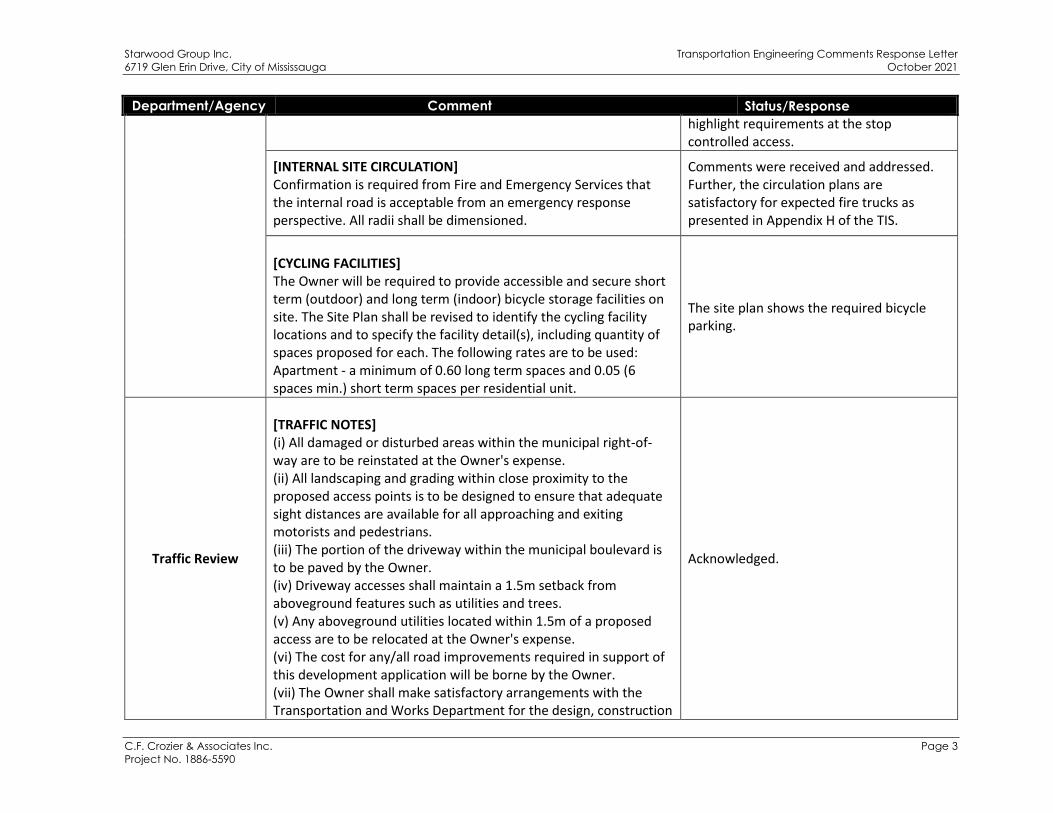
Department/Agency Comment Status/Response
highlight requirements at the stop controlled access.
[INTERNAL SITE CIRCULATION] Confirmation is required from Fire and Emergency Services that the internal road is acceptable from an emergency response perspective. All radii shall be dimensioned.
Comments were received and addressed. Further, the circulation plans are satisfactory for expected fire trucks as presented in Appendix H of the TIS.
[CYCLING FACILITIES] The Owner will be required to provide accessible and secure short term (outdoor) and long term (indoor) bicycle storage facilities on site. The Site Plan shall be revised to identify the cycling facility locations and to specify the facility detail(s), including quantity of spaces proposed for each. The following rates are to be used: Apartment - a minimum of 0.60 long term spaces and 0.05 (6 spaces min.) short term spaces per residential unit.
The site plan shows the required bicycle parking.
Traffic Review
[TRAFFIC NOTES] (i) All damaged or disturbed areas within the municipal right-of-way are to be reinstated at the Owner's expense. (ii) All landscaping and grading within close proximity to the proposed access points is to be designed to ensure that adequate sight distances are available for all approaching and exiting motorists and pedestrians. (iii) The portion of the driveway within the municipal boulevard is to be paved by the Owner. (iv) Driveway accesses shall maintain a 1.5m setback from aboveground features such as utilities and trees. (v) Any aboveground utilities located within 1.5m of a proposed access are to be relocated at the Owner's expense. (vi) The cost for any/all road improvements required in support of this development application will be borne by the Owner. (vii) The Owner shall make satisfactory arrangements with the Transportation and Works Department for the design, construction
Acknowledged.
Starwood Group Inc. Transportation Engineering Comments Response Letter
6719 Glen Erin Drive, City of Mississauga October 2021
C.F. Crozier & Associates Inc. Page 4
Project No. 1886-5590
Department/Agency Comment Status/Response
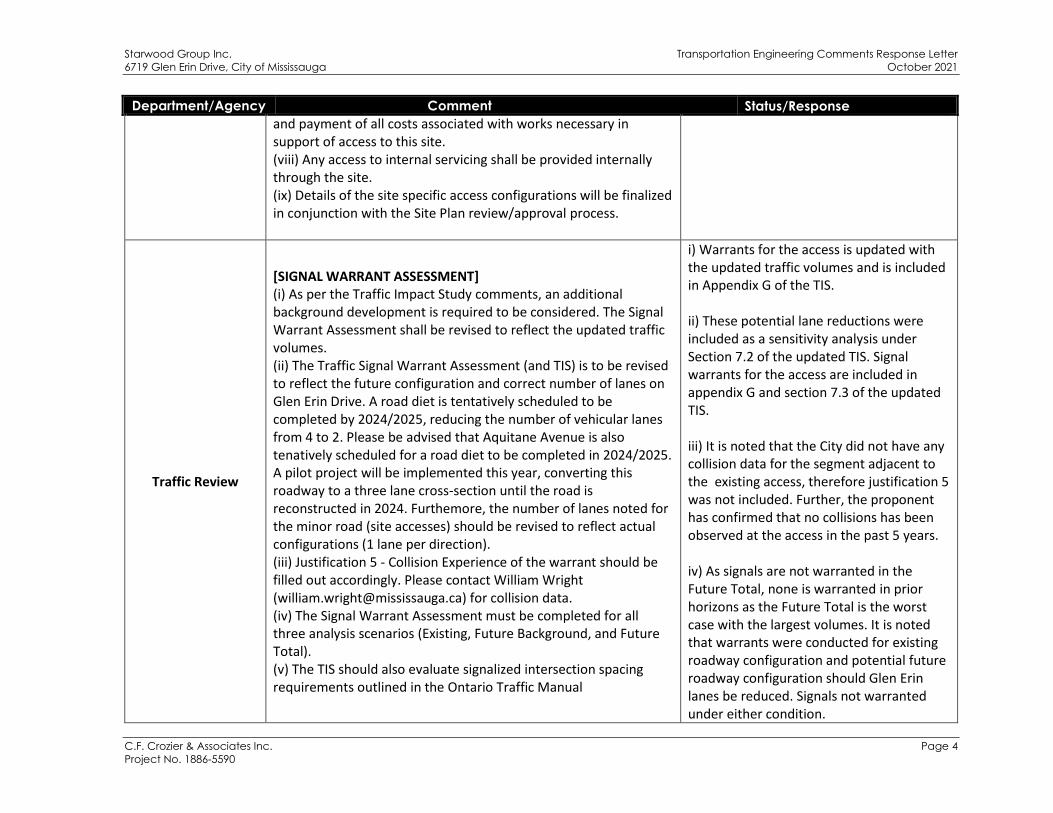
and payment of all costs associated with works necessary in support of access to this site. (viii) Any access to internal servicing shall be provided internally through the site. (ix) Details of the site specific access configurations will be finalized in conjunction with the Site Plan review/approval process.
Traffic Review
[SIGNAL WARRANT ASSESSMENT] (i) As per the Traffic Impact Study comments, an additional background development is required to be considered. The Signal Warrant Assessment shall be revised to reflect the updated traffic volumes. (ii) The Traffic Signal Warrant Assessment (and TIS) is to be revised to reflect the future configuration and correct number of lanes on Glen Erin Drive. A road diet is tentatively scheduled to be completed by 2024/2025, reducing the number of vehicular lanes from 4 to 2. Please be advised that Aquitane Avenue is also tenatively scheduled for a road diet to be completed in 2024/2025. A pilot project will be implemented this year, converting this roadway to a three lane cross-section until the road is reconstructed in 2024. Furthemore, the number of lanes noted for the minor road (site accesses) should be revised to reflect actual configurations (1 lane per direction). (iii) Justification 5 - Collision Experience of the warrant should be filled out accordingly. Please contact William Wright ([email protected]) for collision data. (iv) The Signal Warrant Assessment must be completed for all three analysis scenarios (Existing, Future Background, and Future Total). (v) The TIS should also evaluate signalized intersection spacing requirements outlined in the Ontario Traffic Manual
i) Warrants for the access is updated with the updated traffic volumes and is included in Appendix G of the TIS. ii) These potential lane reductions were included as a sensitivity analysis under Section 7.2 of the updated TIS. Signal warrants for the access are included in appendix G and section 7.3 of the updated TIS. iii) It is noted that the City did not have any collision data for the segment adjacent to the existing access, therefore justification 5 was not included. Further, the proponent has confirmed that no collisions has been observed at the access in the past 5 years. iv) As signals are not warranted in the Future Total, none is warranted in prior horizons as the Future Total is the worst case with the largest volumes. It is noted that warrants were conducted for existing roadway configuration and potential future roadway configuration should Glen Erin lanes be reduced. Signals not warranted under either condition.
Starwood Group Inc. Transportation Engineering Comments Response Letter
6719 Glen Erin Drive, City of Mississauga October 2021
C.F. Crozier & Associates Inc. Page 5
Project No. 1886-5590
Department/Agency Comment Status/Response
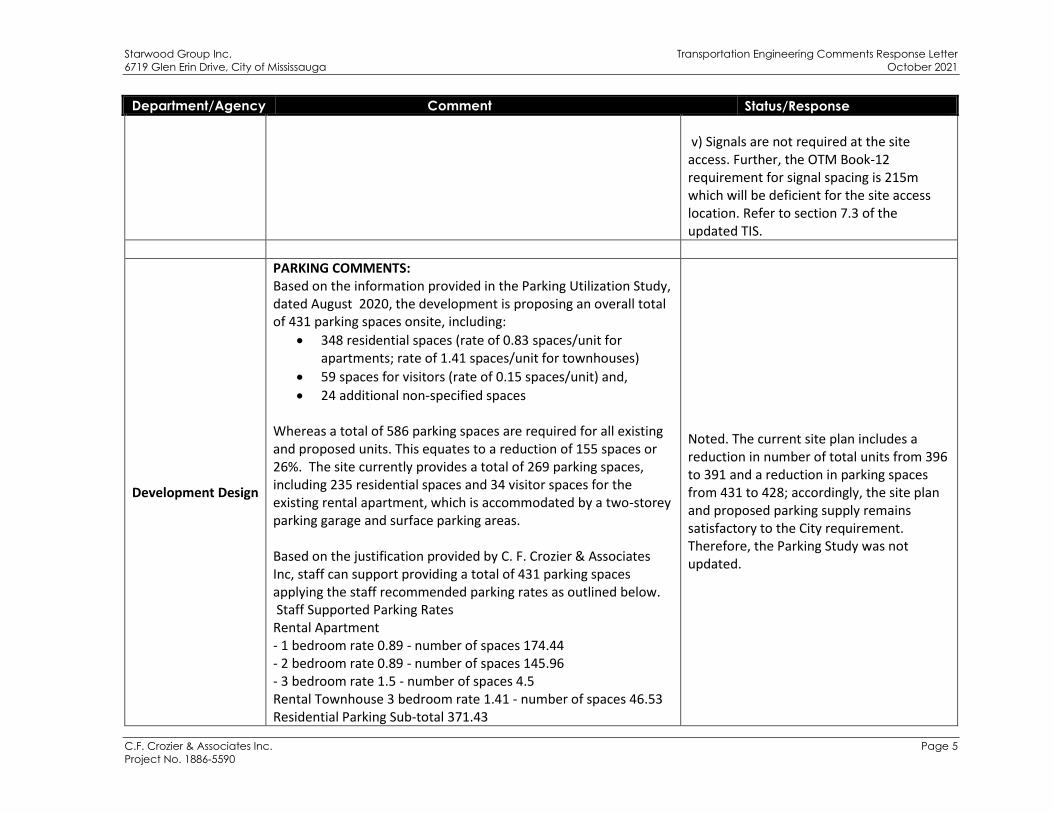
v) Signals are not required at the site access. Further, the OTM Book-12 requirement for signal spacing is 215m which will be deficient for the site access location. Refer to section 7.3 of the updated TIS.
Development Design
PARKING COMMENTS: Based on the information provided in the Parking Utilization Study, dated August 2020, the development is proposing an overall total of 431 parking spaces onsite, including:
• 348 residential spaces (rate of 0.83 spaces/unit for apartments; rate of 1.41 spaces/unit for townhouses)
• 59 spaces for visitors (rate of 0.15 spaces/unit) and,
• 24 additional non-specified spaces Whereas a total of 586 parking spaces are required for all existing and proposed units. This equates to a reduction of 155 spaces or 26%. The site currently provides a total of 269 parking spaces, including 235 residential spaces and 34 visitor spaces for the existing rental apartment, which is accommodated by a two-storey parking garage and surface parking areas. Based on the justification provided by C. F. Crozier & Associates Inc, staff can support providing a total of 431 parking spaces applying the staff recommended parking rates as outlined below. Staff Supported Parking Rates Rental Apartment - 1 bedroom rate 0.89 - number of spaces 174.44 - 2 bedroom rate 0.89 - number of spaces 145.96 - 3 bedroom rate 1.5 - number of spaces 4.5 Rental Townhouse 3 bedroom rate 1.41 - number of spaces 46.53 Residential Parking Sub-total 371.43
Noted. The current site plan includes a reduction in number of total units from 396 to 391 and a reduction in parking spaces from 431 to 428; accordingly, the site plan and proposed parking supply remains satisfactory to the City requirement. Therefore, the Parking Study was not updated.
Starwood Group Inc. Transportation Engineering Comments Response Letter
6719 Glen Erin Drive, City of Mississauga October 2021
C.F. Crozier & Associates Inc. Page 6
Project No. 1886-5590
Department/Agency Comment Status/Response
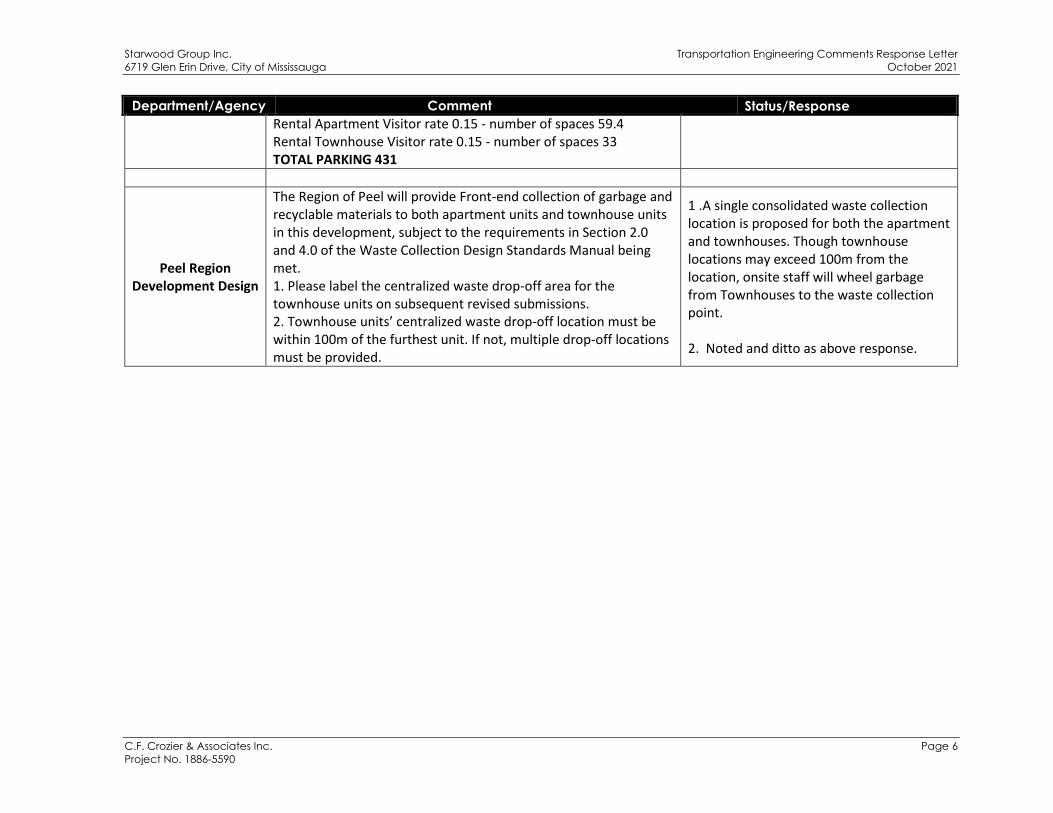
Rental Apartment Visitor rate 0.15 - number of spaces 59.4 Rental Townhouse Visitor rate 0.15 - number of spaces 33 TOTAL PARKING 431
Peel Region Development Design
The Region of Peel will provide Front-end collection of garbage and recyclable materials to both apartment units and townhouse units in this development, subject to the requirements in Section 2.0 and 4.0 of the Waste Collection Design Standards Manual being met. 1. Please label the centralized waste drop-off area for the townhouse units on subsequent revised submissions. 2. Townhouse units’ centralized waste drop-off location must be within 100m of the furthest unit. If not, multiple drop-off locations must be provided.
1 .A single consolidated waste collection location is proposed for both the apartment and townhouses. Though townhouse locations may exceed 100m from the location, onsite staff will wheel garbage from Townhouses to the waste collection point. 2. Noted and ditto as above response.
1
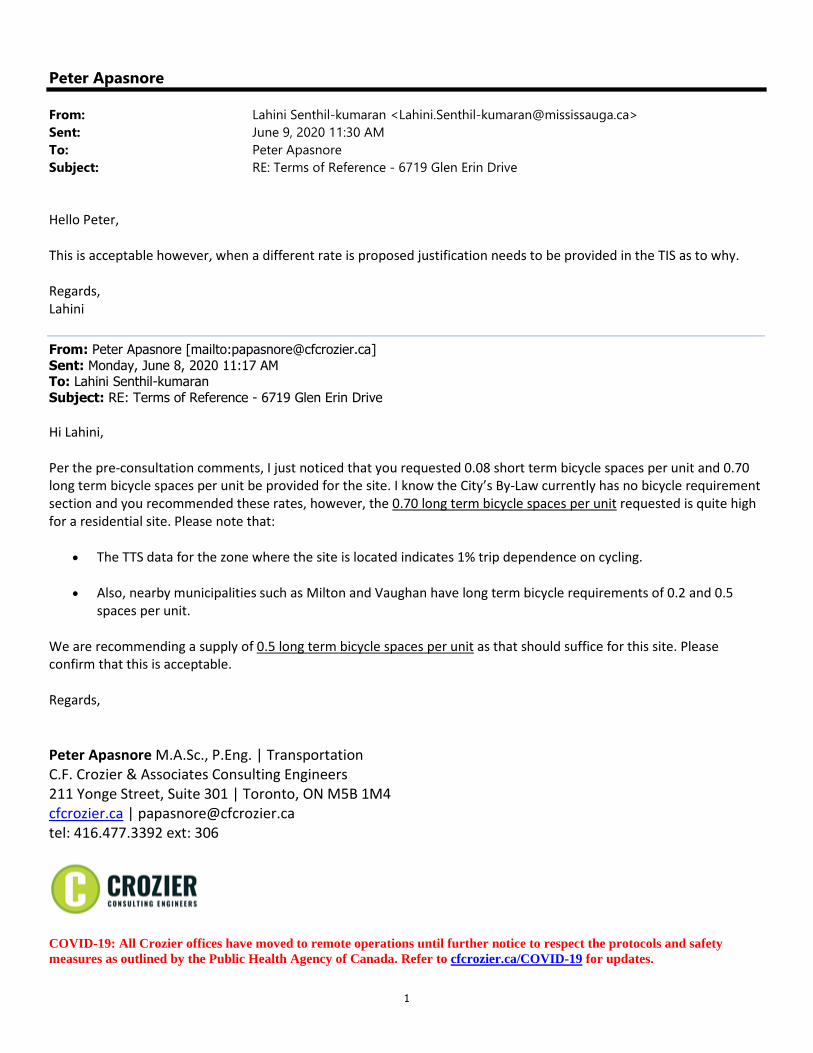
Peter Apasnore
From: Lahini Senthil-kumaran <[email protected]>
Sent: June 9, 2020 11:30 AM
To: Peter Apasnore
Subject: RE: Terms of Reference - 6719 Glen Erin Drive
Hello Peter,
This is acceptable however, when a different rate is proposed justification needs to be provided in the TIS as to why.
Regards, Lahini
From: Peter Apasnore [mailto:[email protected]] Sent: Monday, June 8, 2020 11:17 AM To: Lahini Senthil-kumaran Subject: RE: Terms of Reference - 6719 Glen Erin Drive
Hi Lahini,
Per the pre-consultation comments, I just noticed that you requested 0.08 short term bicycle spaces per unit and 0.70 long term bicycle spaces per unit be provided for the site. I know the City’s By-Law currently has no bicycle requirement section and you recommended these rates, however, the 0.70 long term bicycle spaces per unit requested is quite high for a residential site. Please note that:
The TTS data for the zone where the site is located indicates 1% trip dependence on cycling.
Also, nearby municipalities such as Milton and Vaughan have long term bicycle requirements of 0.2 and 0.5 spaces per unit.
We are recommending a supply of 0.5 long term bicycle spaces per unit as that should suffice for this site. Please confirm that this is acceptable.
Regards,
Peter Apasnore M.A.Sc., P.Eng. | Transportation C.F. Crozier & Associates Consulting Engineers211 Yonge Street, Suite 301 | Toronto, ON M5B 1M4cfcrozier.ca | [email protected] tel: 416.477.3392 ext: 306
COVID-19: All Crozier offices have moved to remote operations until further notice to respect the protocols and safety measures as outlined by the Public Health Agency of Canada. Refer to cfcrozier.ca/COVID-19 for updates.
2
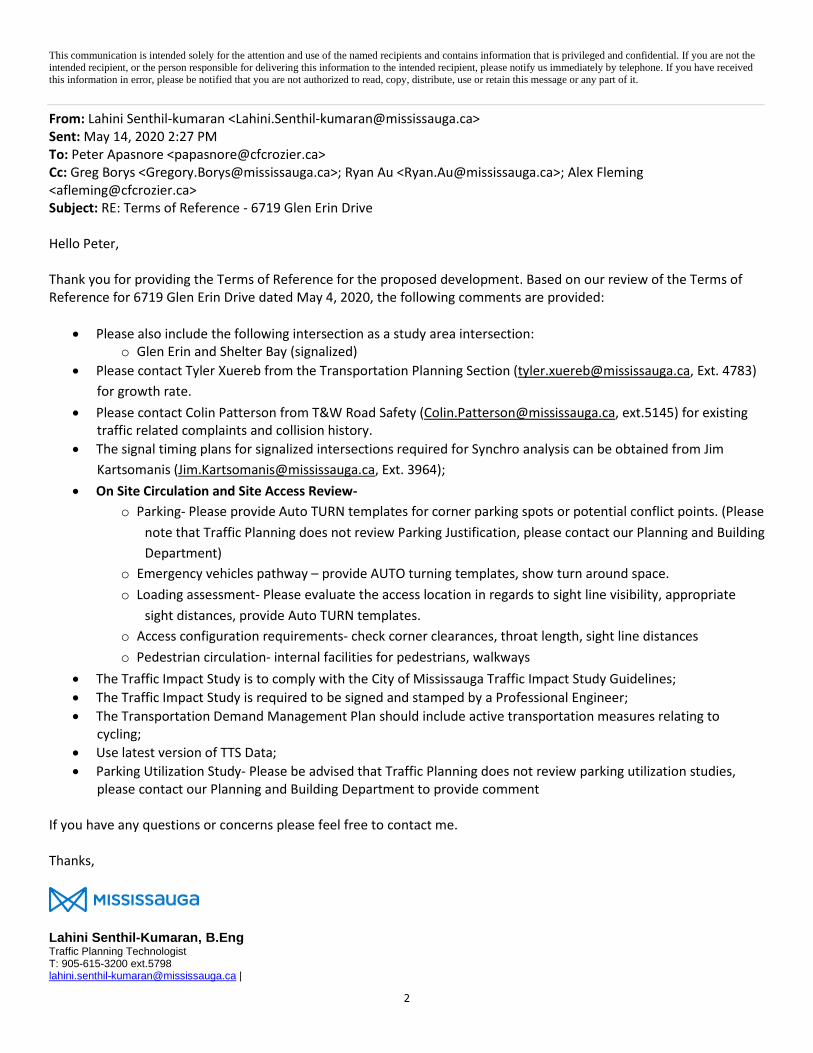
This communication is intended solely for the attention and use of the named recipients and contains information that is privileged and confidential. If you are not the intended recipient, or the person responsible for delivering this information to the intended recipient, please notify us immediately by telephone. If you have received this information in error, please be notified that you are not authorized to read, copy, distribute, use or retain this message or any part of it.
From: Lahini Senthil-kumaran <[email protected]> Sent: May 14, 2020 2:27 PM To: Peter Apasnore <[email protected]> Cc: Greg Borys <[email protected]>; Ryan Au <[email protected]>; Alex Fleming <[email protected]> Subject: RE: Terms of Reference - 6719 Glen Erin Drive
Hello Peter,
Thank you for providing the Terms of Reference for the proposed development. Based on our review of the Terms of Reference for 6719 Glen Erin Drive dated May 4, 2020, the following comments are provided:
Please also include the following intersection as a study area intersection: o Glen Erin and Shelter Bay (signalized)
Please contact Tyler Xuereb from the Transportation Planning Section ([email protected], Ext. 4783)
for growth rate.
Please contact Colin Patterson from T&W Road Safety ([email protected], ext.5145) for existing traffic related complaints and collision history.
The signal timing plans for signalized intersections required for Synchro analysis can be obtained from Jim
Kartsomanis ([email protected], Ext. 3964);
On Site Circulation and Site Access Review-
o Parking- Please provide Auto TURN templates for corner parking spots or potential conflict points. (Please
note that Traffic Planning does not review Parking Justification, please contact our Planning and Building
Department)
o Emergency vehicles pathway – provide AUTO turning templates, show turn around space.
o Loading assessment- Please evaluate the access location in regards to sight line visibility, appropriate
sight distances, provide Auto TURN templates.
o Access configuration requirements- check corner clearances, throat length, sight line distances
o Pedestrian circulation- internal facilities for pedestrians, walkways
The Traffic Impact Study is to comply with the City of Mississauga Traffic Impact Study Guidelines;
The Traffic Impact Study is required to be signed and stamped by a Professional Engineer;
The Transportation Demand Management Plan should include active transportation measures relating to cycling;
Use latest version of TTS Data;
Parking Utilization Study- Please be advised that Traffic Planning does not review parking utilization studies, please contact our Planning and Building Department to provide comment
If you have any questions or concerns please feel free to contact me.
Thanks,
Lahini Senthil-Kumaran, B.EngTraffic Planning Technologist T: 905-615-3200 ext.5798 [email protected] |
1
Peter Apasnore
From: Peter Apasnore
Sent: May 4, 2020 2:10 PM
Cc: Alex Fleming
Subject: Terms of Reference - 6719 Glen Erin Drive
Attachments: SP_6719GlenErin_2020-04-16.pdf
Hi Gregory,
I hope you are keeping safe and that this email finds you well.
We have been retained to prepare a Traffic Impact Study (TIS) and Parking Utilization Study (PUS) for the site located at 6719 Glen Erin Drive in the City of Mississauga in support of a Zoning By-Law Amendment (ZBA) and Official Plan Amendment (OPA).
Previous Traffic Studies (prepared by LEA Consulting Ltd.) were submitted in 2007, 2009 and 2013 for previously proposed development plans at the site. Given the change in site plan and time since the last submission, we understand a new traffic study is required.
Below is an outline of our proposed scope and workplan. Please provide us with your feedback at the earliest possible.
Regards,
The project proposal is detailed in the attached site plan and includes:
Maintaining the existing 13-storey apartment building and its 179 units.
An addition of a 12-storey apartment building (184 units) and 33 townhouse units.
A total parking supply of 440 spaces for the entire site.
Maintaining the existing access at Glen Erin to serve the entire site.
The project has an anticipated full buildout by 2025.
Traffic Impact Study (TIS)
The study will be completed in accordance with the City of Mississauga Traffic Impact Study Guidelines. To conduct the study, we will:
Obtain traffic turning movement count (TMC) data and analyze the 2020 existing traffic operations for the Weekday a.m. and p.m. peak hours at the proposed study intersections listed below:
o Glen Erin Drive and Site Access o Glen Erin Drive and Aquitaine Avenue
Given the impact of the COVID-19 virus, traffic pattern is not expected to reflect typical conditions, therefore existing traffic counts will not be undertaken.
2
o We have requested the latest TMC data from the City’s Traffic Operations Department for the intersection of Glen Erin Drive and Aquitaine Avenue. Available TMC will be obtained if they are newer than 2013, otherwise;
o We will use the TMC’s previously undertaken in April 2013 for the previous TIS submission (i.e. by LEA dated August 2013) and apply growth rates as mentioned subsequently herein.
As noted, the development is expected to be fully built out by 2025, therefore, we will analyze the 2020 (existing) and 2025 horizon years as required per the City’s TIS Guideline. Future background traffic volumes (excludes site generated trips) for the study horizons will be forecasted per the methodology below.
o We have requested historical AADT data from the City’s Traffic Operations to calculate the traffic growth rates for Glen Erin Drive and Aquitaine Avenue.
o Should the AADT data not be available, we will apply an industry standard growth rate of 2% to forecast the future traffic volumes on both roads.
o Per the City’s development applications website, no approved developments in the past 18 months are expected to significantly impact the study intersection. There is a proposed residential development at 6550 Glen Erin Drive (under review), but it’s traffic is expected to be captured by the growth rates proposed herein. Therefore, no background developments will be included in the future traffic forecast.
Forecast the proposed development trips and assign to boundary road network as follows:
o Use the Institute of Transportation Engineers’ (ITE - 10th edition) data to generate the development trips.
o Assign trips to the boundary road network using the 2006 TTS data.
Analyze the total traffic operations (includes site generated trips) for the study horizon years. All analysis will be conducted using Synchro (Version 9) modelling software.
Compare the future background and total traffic operations to identify if capacity issues are forecast to occur per the development proposal herein and recommend mitigation measures as necessary.
Review the existing site access connection to from a safety perspective with regards to design vehicle maneuverability, driver sight lines, intersection spacing, access configuration, and corner clearance.
Assess existing and future Transportation Demand Management (TDM) opportunities, as well as recommend site specific measures for the development to reduce single-occupancy vehicle (SOV) trips and promote sustainable transportation.
Document all analysis and recommendations regarding the findings of the study to maintain acceptable operations of the boundary road network.
Parking Utilization Study (PUS)
Given that the proposed parking supply at the site is more than 10% deficient compared to the requirements of the City of Mississauga Zoning By-law 0225-2007, a PUS consistent with the City's "Terms of Reference - Parking Utilization Studies for Specific Applications” will be prepared. The PUS will include:
A review of the minimum vehicle and bicycle parking requirements for the proposed development per the City of Mississauga Zoning By-law 0225-2007 and compare with the proposed supply.
Establish peak parking demand rates based on the existing 13-storey building’s (at the site) parking utilization. The rates will then be used to forecast the parking demand expected for the new proposed residential units.
3
o As the City’s guideline for PUS has noted that surveys during holidays are unacceptable, it is unclear if parking surveys at the site during this COVID-19 period will be acceptable. Please confirm.
o Alternatively, since the existing building at the site has not changed, we will apply the parking surveys (undertaken in 2006) and the rates for the site as determined in the previous traffic study submissions for this site.
o Additionally, existing parking survey data for similar sites within the Greater Toronto Area can be used to establish the peak parking demand rates. Please advise if this is acceptable.
Forecast the peak parking demands based on other criteria such as the ITE Parking Generation Manual (5th
edition) and Transportation Tomorrow Survey (TTS) data as applicable.
Identify available Transportation Demand Management (TDM) opportunities and assess potential to further support a reduced parking supply.
Based on the findings, confirm the adequacy or shortfall of the proposed parking supply for the development.
Review the minimum loading space requirements for the proposed development per the City of Mississauga Zoning By-law and compare with the proposed supply.
Summarize all findings and recommendations in a Parking Utilization Study for the City’s review.
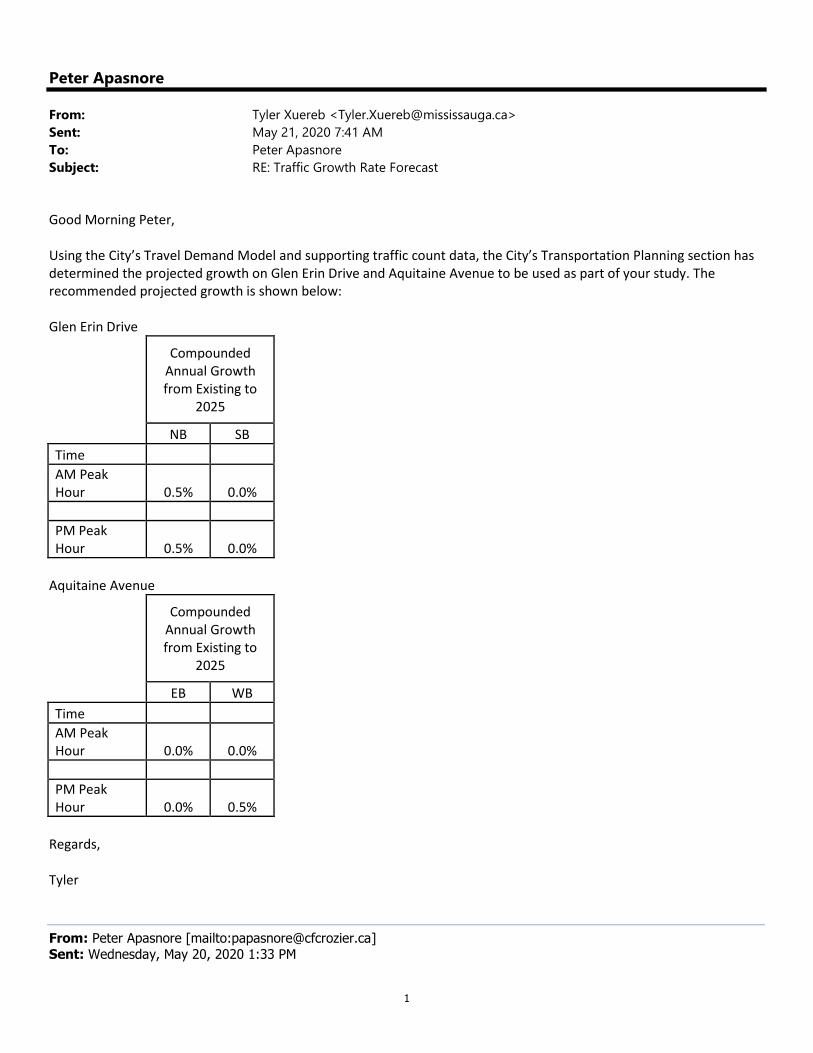
1
Peter Apasnore
From: Tyler Xuereb <[email protected]>
Sent: May 21, 2020 7:41 AM
To: Peter Apasnore
Subject: RE: Traffic Growth Rate Forecast
Good Morning Peter,
Using the City’s Travel Demand Model and supporting traffic count data, the City’s Transportation Planning section has determined the projected growth on Glen Erin Drive and Aquitaine Avenue to be used as part of your study. The recommended projected growth is shown below:
Glen Erin Drive
Compounded Annual Growth from Existing to
2025
NB SB
Time
AM Peak Hour 0.5% 0.0%
PM Peak Hour 0.5% 0.0%
Aquitaine Avenue
Compounded Annual Growth from Existing to
2025
EB WB
Time
AM Peak Hour 0.0% 0.0%
PM Peak Hour 0.0% 0.5%
Regards,
Tyler
From: Peter Apasnore [mailto:[email protected]] Sent: Wednesday, May 20, 2020 1:33 PM
Starwood Group Inc. Traffic Impact Study
6719 Glen Erin Drive, City of Mississauga October 2021
C.F. Crozier & Associates Inc.
Project No. 1886-5590
APPENDIX B
City of Mississauga Planning Excerpts
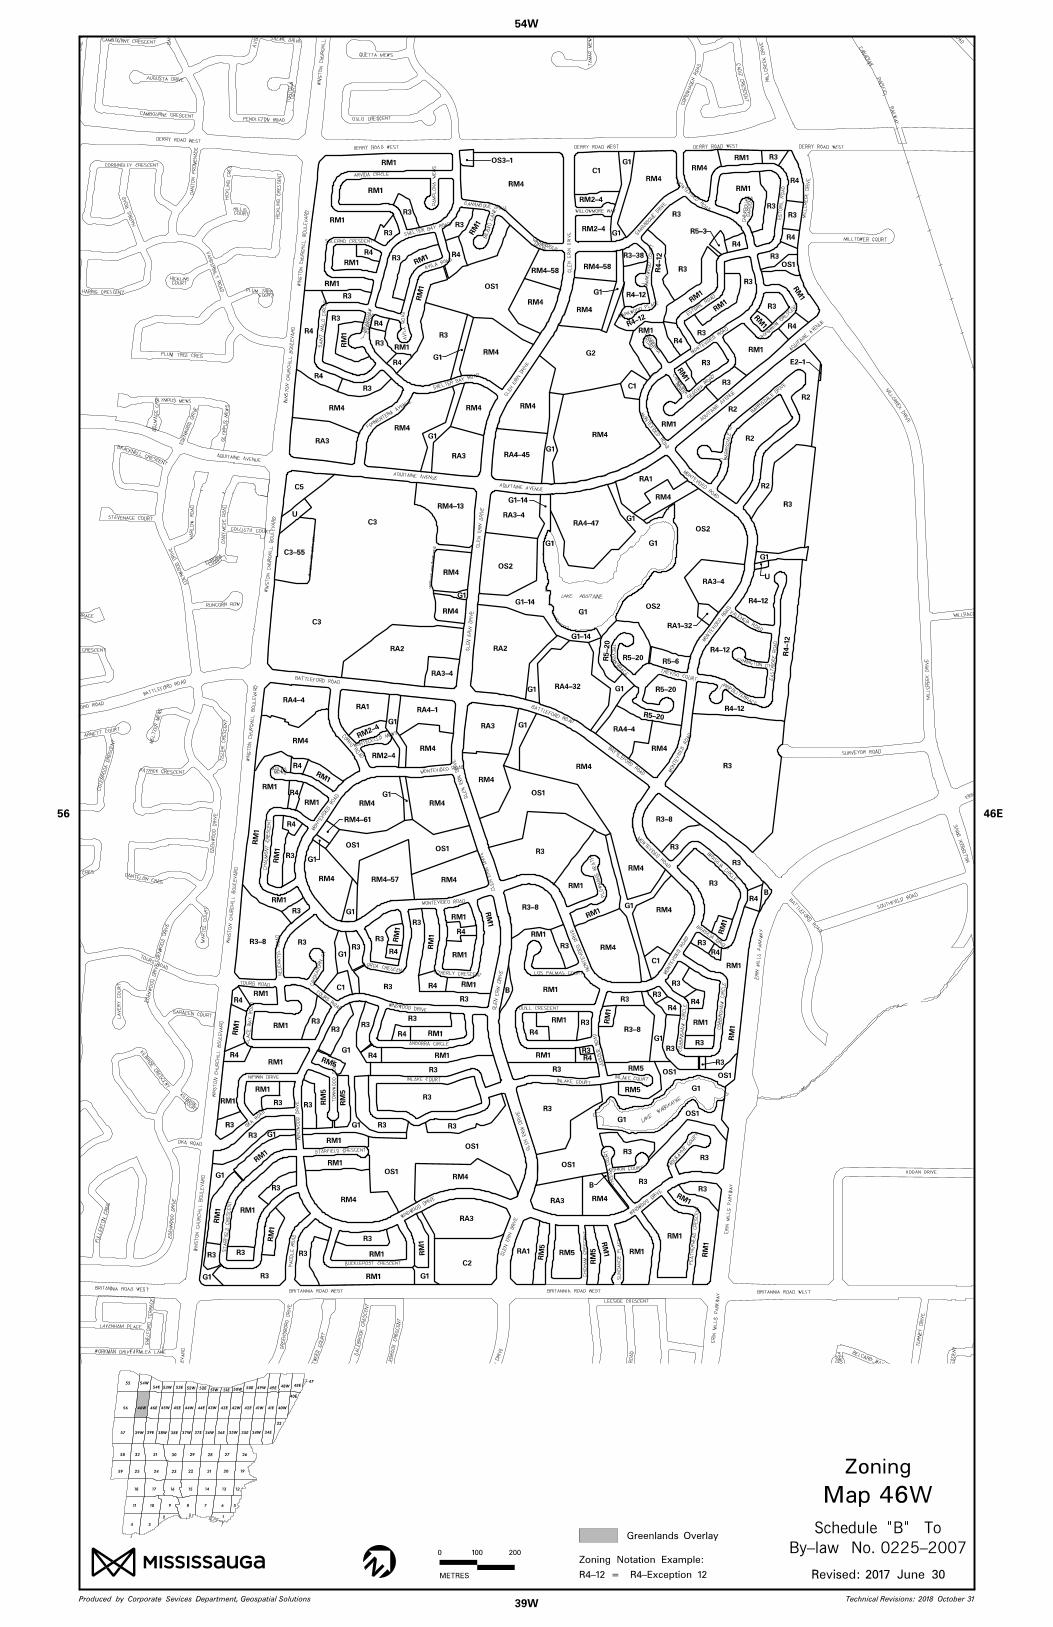
39W
56
54W
46E
Map 46W
Technical Revisions: 2018 October 31
Revised: 2017 June 30N
0 100 200
METRES
Produced by Corporate Sevices Department, Geospatial Solutions
55 54W54E 53W 53E 52W 50E 49W 49E
48W 48E
56 46W 46E 45W 45E 44W 44E 43W 43E 42W 42E 41W 41E 40W
58
57 39W 39E 38W 38E 37W 37E 36W 36E 35W 35E 34W 34E
26272829303132
59 25 24 23 22 21 20 19
18 17 16 15 14 13 12
11 10 9 8 7 6
1
5
34
2
52E51W 51E 50W
40E
47
33
R4-12 = R4-Exception 12
Zoning Notation Example:
Zoning
By-law No. 0225-2007
Schedule B ToGreenlands Overlay
CA
NA
DIA
N P
ACIFIC
RAIL
WA
Y
YA
WLI
AR
CIFI
CA
P
NAI
DA
NA
C
LAKE AQUITAINE
LAKE
WABUKAYNE
MO
NT
EVID
EO
RO
AD
JU
DIQ
UE
RO
AD
CO
BBIN
SH
AW
CIR
CL
E
BRASILIA CIR
CLE
WIN
DW
OOD DRIV
E
GL
EN
ERIN
DRIV
E
WAB
UKA
YNE C
OURT
OSHKIN COURT
CH
EE
GA
CO
UR
T
INLAKE COURT
CO
BBIN
SH
AW
CIR
CL
E
MONTEVID
EO ROAD
BRASILIA
CIRCLE
BARRIS
DALE DRIV
E
MO
NTE
VID
EO
RO
AD
EA
ST
RID
GE
RO
AD
VALENCIA ROAD
BATTLEFO
RD ROAD
BA
RRIS
DA
LE
CT
SYMINGTON CT
TRIPOLI TERRACE
MONTEVID
EO ROAD
MO
NT
EVID
EO
RO
AD
ARVIDA CIRCLE
PA
MP
LO
NA
ME
WS
SALERNO CRESCENT
SAIN
T
MA
LO
CIR
CL
E
FORMENTERA AVENUE
AVILA
ROAD
SHELTER BAY R
OAD
BIL
BA
O
LA
NE
GANANOQUE DRIVE
AQUITAINE AVENUE
WIN
ST
ON
CH
UR
CHIL
L
BO
UL
EV
AR
D
WIN
ST
ON
CH
UR
CHIL
L
BO
UL
EV
AR
D
AVIL
A
RO
AD
SHELTER BAY R
OAD
GANANOQUE
DRIVE
BR
AM
SH
AW
GA
RD
EN
S
WILLOWMORE WAY
GA
NA
NO
QUE DRIV
E
ES
TO
RIL
RO
AD
ESTORI
L ROAD
MONTEVID
EO ROAD
MONTEVI
DEO ROAD
SEGOVIA ROAD
MA
RK
WO
OD
CO
UR
T
AQ
UIT
AIN
E AVENUE
GLE
N ERIN
DRIV
E
GA
RD
EN
S
MARKWOOD PLACE
CH
ER
BO
UR
G
TRONDHEIM
CRESCENT
CA
NBER
RA
RO
AD
GL
EN
ERIN
DRIV
E
AQUITAINE AVENUE
AQ
UIT
AIN
E AVENUE
MO
NTE
VID
EO
RO
AD
CA
NBER
RA
RO
AD
TREVISO COURT
BATTLEFORD ROAD
GL
EN
ERIN
DRIV
E
TR
EVIS
OTERRACE
GL
EN
ERIN
DRIV
E
WIN
ST
ON
CH
UR
CHIL
L
BO
UL
EV
AR
D
BATTLEFORD ROAD
CORFU R
OA
D
MONTECELLO MEWS
WIN
ST
ON
CH
UR
CHIL
L
BO
UL
EV
AR
D
TOURS ROAD
CH
AU
MO
NT
CR
ES
CE
NT
ARLESMEWS
MONTEVIDEO ROAD
WIN
ST
ON
CH
UR
CHIL
L
BO
UL
EV
AR
D
MONTEVIDEO ROAD
MO
NTE
VID
EO
RO
AD
GL
EN
ERIN
DRIV
E
PL
OW
MA
NS
HE
AT
H
GL
EN
ERIN
DRIV
E
MO
NT
EVID
EO
DRIV
E
QUILL CRESCENT
LOS PALMAS COURT
INLAKE COURT
GL
EN
ERIN
DRIV
E
NE
UC
HA
TE
L
RO
AD
CRIC
KA
DO
RN
CT
WINDWOOD DRIVE
LORCA CRESCENT ATHERLY CRESCENT
TOURS RO
AD
NIPIWIN DRIVE
OKA ROAD
GL
AC
E
BA
Y
RO
AD
WIN
ST
ON
CH
UR
CHIL
L
BO
UL
EV
AR
DS
TA
RFIE
LD
CR
ES
CE
NT
WIN
ST
ON
CH
UR
CHIL
L
BO
UL
EV
AR
D
ANDORRA CIRCLE
STARFIELD CRESCENT
TO
WN
WO
OD
CO
UR
T
WIN
DW
OO
D
DRIV
E
INLAKE COURT
WINDWOOD
DRIVE
PA
DD
LE
RO
AD
BUCKLEPOST CRESCENT
BRITANNIA ROAD WEST
FE
AT
HE
RH
EA
D
CR
ES
CE
NT
SU
ND
AN
CE P
LA
CE
CHID
HA
M
CR
ES
CE
NT
BRITANNIA ROAD WEST
GL
EN
ERIN
DRIV
E
ME
AD
OW
VA
LE
TO
WN
CE
NT
RE
CIR
CL
E
ME
AD
OW
VA
LE
TO
WN
CE
NT
RE
CIR
CL
E
BELCARO WAY
ERIN
MIL
LS
PA
RK
WA
Y
SH
AN
DWIC
K
PA
GO
SA
CO
UR
T
RA
YS
HA
W
CR
ES
CE
NT
TU
RN
EY
DRIV
E
TW
EE
D
CO
UR
T
WIN
ST
ON
CH
UR
CHIL
L
BO
UL
EV
AR
D
DA
LE
BR
OO
K
CR
ES
CE
NT
GR
EE
NS
BO
RO
DRIV
E
DA
LE
BR
OO
K
CR
ES
CE
NT
HE
MIN
GW
AY
RO
AD
LEESIDE CRESCENT
GL
EN
ERIN
DRIV
E
WORKMAN DRIVEFARMLEA LANE
CAULFIELD CRESCENT
SH
ELF
OR
D
TE
RR
AC
E
LAVENHAM PLACE
MIL
LC
RE
EK
DRIV
E
SOUTHFIELD
ROAD
BATTLEFORD RO
AD
ERIN
MIL
LS
PA
RK
WA
Y
ERIN
MIL
LS
PA
RK
WA
Y
SURVEYOR ROAD
MILLTOWER COURT
MILLRACE COURT
ERIN MIL
LS P
ARKWAY
MIL
LC
RE
EK
DRIV
E
MIL
LC
REE
K
DRIV
E
MIL
LC
RE
EK
DRIV
E
HOGAN DRIVE
BRITANNIA ROAD WEST
TE
NT
H
LIN
E
WES
T
LA
VE
RY
CO
UR
T
SARACEN COURT
KEYNES CRESCENT
KIL
BRID
E C
RES
CE
NT
ED
EN
WO
OD
DRIV
E
COURT
OKA ROAD
BRITANNIA ROAD WEST
KILBRID
E
ED
EN
WO
OD
DRIV
E
FU
LL
ER
TO
N
CR
ES
MIL
LER'S GROVE
TIS
LE
R
CR
ES
CE
NT
ARNETT COURT
TOURS ROAD
MA
RT
EL
CO
UR
T
ED
EN
WO
OD
DRIV
E
BATTLEFORD ROAD
ME
LT
ZE
R
ME
WS
CO
LE
BR
OO
K
CR
ES
CE
NT
PATRICK CRESCENT
CANTELON CRES
MIL
LE
R'S
GR
OV
E
BARTHOLOMEW CRES
ED
EN
WO
OD
DRIV
E
RUNCORN ROW
ALFRESCO TERRACE
ED
EN
WO
OD
DRIV
E
SPRING CREEK CRESCENT
STEVENAGE COURT
BATTLEFORD ROAD
HA
RL
OW
RO
AD
GA
NY
ME
DE
RO
AD
BRACKNELL CRESCENT
COLLISTA COURT
EUROPA
COURT
OLYMPUS MEWS
HARRIS CRESCENT
HA
RRIS
RO
AD
CORDINGLEY CRESCENT
DA
NT
ON
PR
OM
EN
AD
E
HICKLINGCOURT
HILLISCOURT
PLUM TREE
VA
ND
ER
BIL
T
RO
AD
COURT
ED
EN
WO
OD
DRIV
E
PLUM TREE CRES
AQUITAINE AVENUE
HIC
KLIN
G
CR
ES
OL
YM
PU
S
ME
WS
DO
LM
AG
E
CR
T
HIC
KLIN
G
CR
ES
CE
NT
ARGENTIA ROAD
QUETTA MEWS
WIN
ST
ON
CH
UR
CHIL
L
BO
UL
EV
AR
D
DERRY ROAD WEST
MIL
LC
RE
EK
DRIV
E
DERRY ROAD WEST
OSLO CRESCENT
CA
DIZ
CR
ES
CE
NT
DERRY ROAD WEST
COP
EN
HA
GE
N
RO
AD
COPENHAGEN ROAD
TA
MA
R
ME
WS
DERRY ROAD WEST
AU
GU
ST
A
DRIV
E
DA
NT
ON
PR
OM
EN
AD
E
SALME DRIVE
AUGUSTA DRIVE
TO
RT
OL
AC
OU
RT
CAMBOURNE CRESCENT
CAMBOURNE CRESCENT
TE
NT
H
LIN
E
WES
T
PENDLETON ROAD
RE
DP
AT
H
CIR
CL
E
DERRY ROAD WEST
R3
R3
R3
R3
R3
R2
R2
R2
R2
G1
G1
G1
R3
R3
R3
R3
R3
G1
R3
R3
R3
R3
R3
R3
R3
R3
G1
G1
R3
R3
G1
G1
G1 G1
G1
R3
G1
G1
G1
G1
R3
RM1
RM1
G1
G1
B
G1
R3
R3
G1G1
G1
G1
G1
G1
G1
C2
C1
C1
C5
C3
C1
C1
OS1
OS1
OS1
OS1
OS1
OS1OS1
OS1
U
OS2
OS2
OS2
OS1
OS1
OS3-1
R3
R3-8
R3-8
R3-8
R3-8
R3-38
R3
R3
R3
R3
R3
R3
R3
R3
R3
R3R3 R3
R3
R3 R3
R3
R3
R3
R3
R3
R3
R3
R3
R3
R3
R3R3
R3
R3
R3
R3
R3
R3
R3
R3
R3
R3
R3
R3R3
R4
R4R4
R4
R4
R4
R4
R4
R4R4
R4
R4
R4
R4
R4
R4
R4
R4
R4
R4
R4
R4 R4
R4 R4
R4R4
R4-12
R4-12
R4-12
R4-12
R4-12
R4-12
R4-12
RM1
RM1
RM1
RM1
RM1
RM1
RM1
RM
1
RM
1
RM1
RM
1
RM1RM
1
RM
1
RM1
RM1
RM1
RM1
RM1
RM
1
RM
1
RM1
RM1
RM1RM1 RM
1RM
1
RM
1
RM1
RM1
RM1
RM1
RM1
RM1
RM1
RM1
RM
1
RM1
RM1
RM
1
RM1
RM1
RM1
RM1
RM
1
RM1
RM
1
RM1
RM1
RM1
RM1
RM1
RM1
RM
1
RM1
RM
1
RM
1
RM1
RM
1
RM1
RM4RM4
RM4
RM4
RM4
RM4
RM4
RM4
RM4
RM4 RM4
RM4RM4
RM4 RM4
RM4
RM4
RM4
RM4
RM4
RM4
RM4
RM4-13
RM2-4
RM2-4
RM5
RM5
RM5
RM
5
RM
5
R5-6
R5-20
R5-20
RM
5RM5
RM
5
RM2-4
RM2-4
R5-20
R5-20
RM4RM4
RM4
RM4
RM4
RM4
G2
G1
G1
OS1
G1
G1
G1
RA3
RA3 RA4-45
RA3-4
RA4-47
RA1
RA3-4
RA4-4
RA4-32
RA2
RA3
RA4-1RA1
RA4-4
RA3
RA3
RA1
RA3-4
R3
RM
1
RA2
RM4
RM1
RM4-58RM4-58
RM4-57
B
B
RM1
R5-3
R3
R3
RM4-61
U
RA1-32
C3-55
C3
G1-14
G1-14
G1-14
E2-1
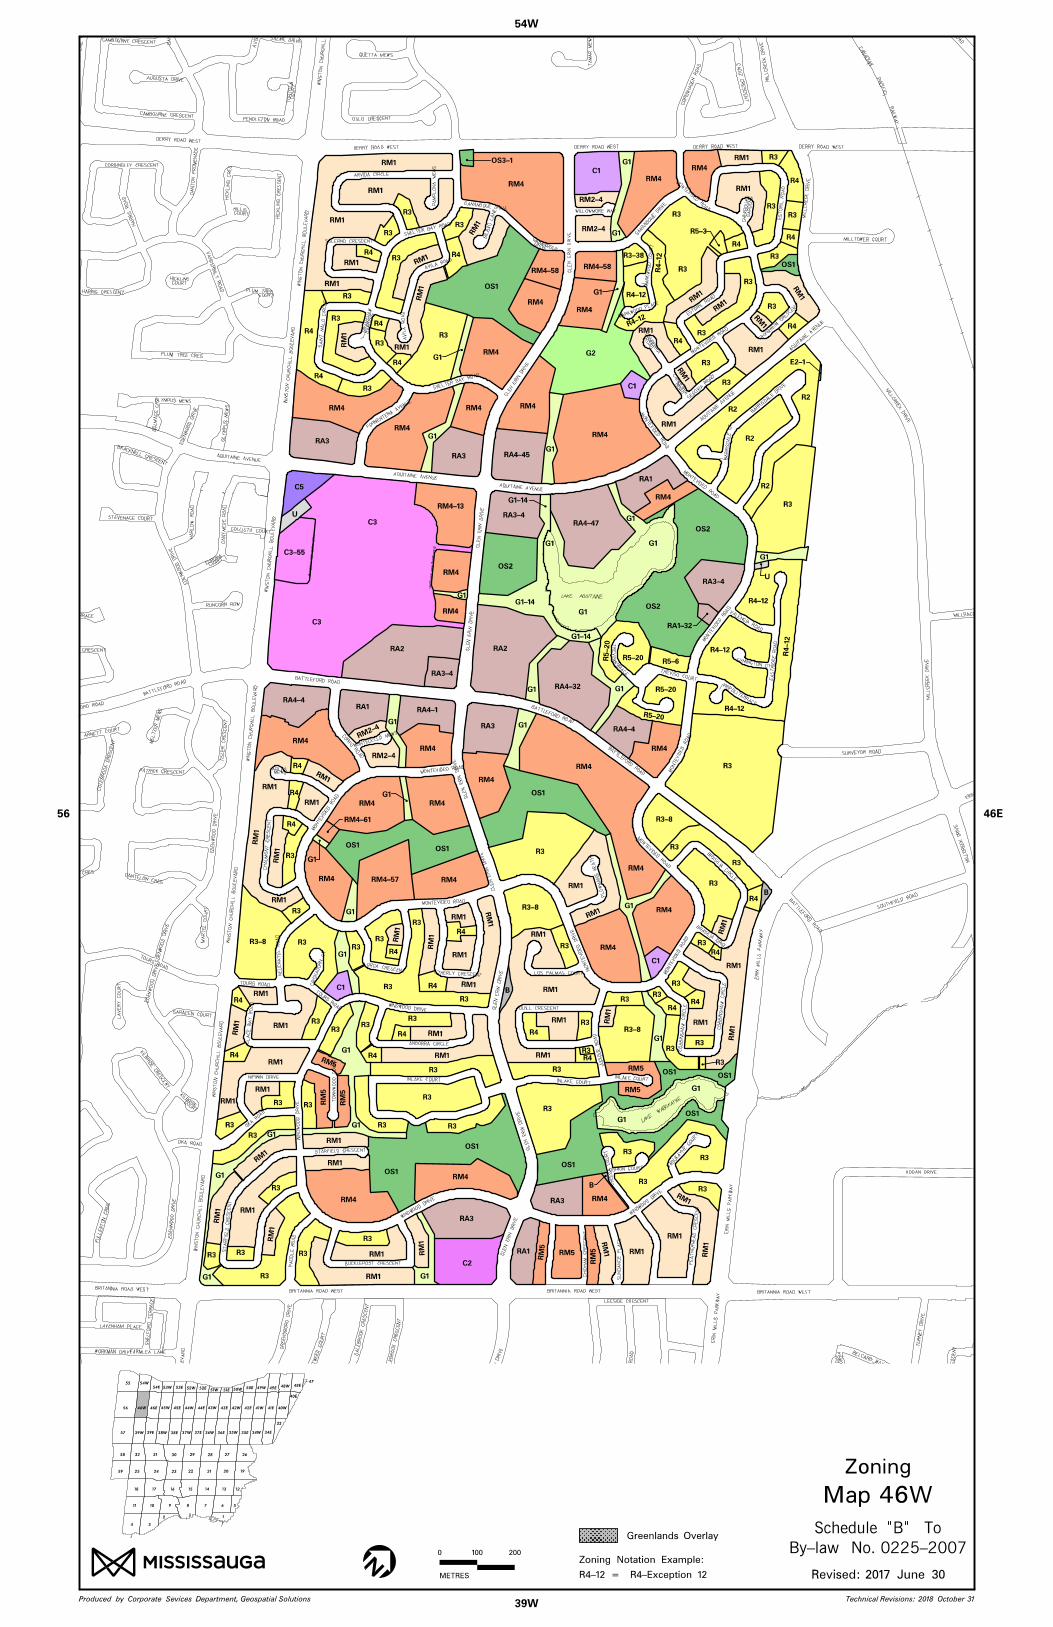
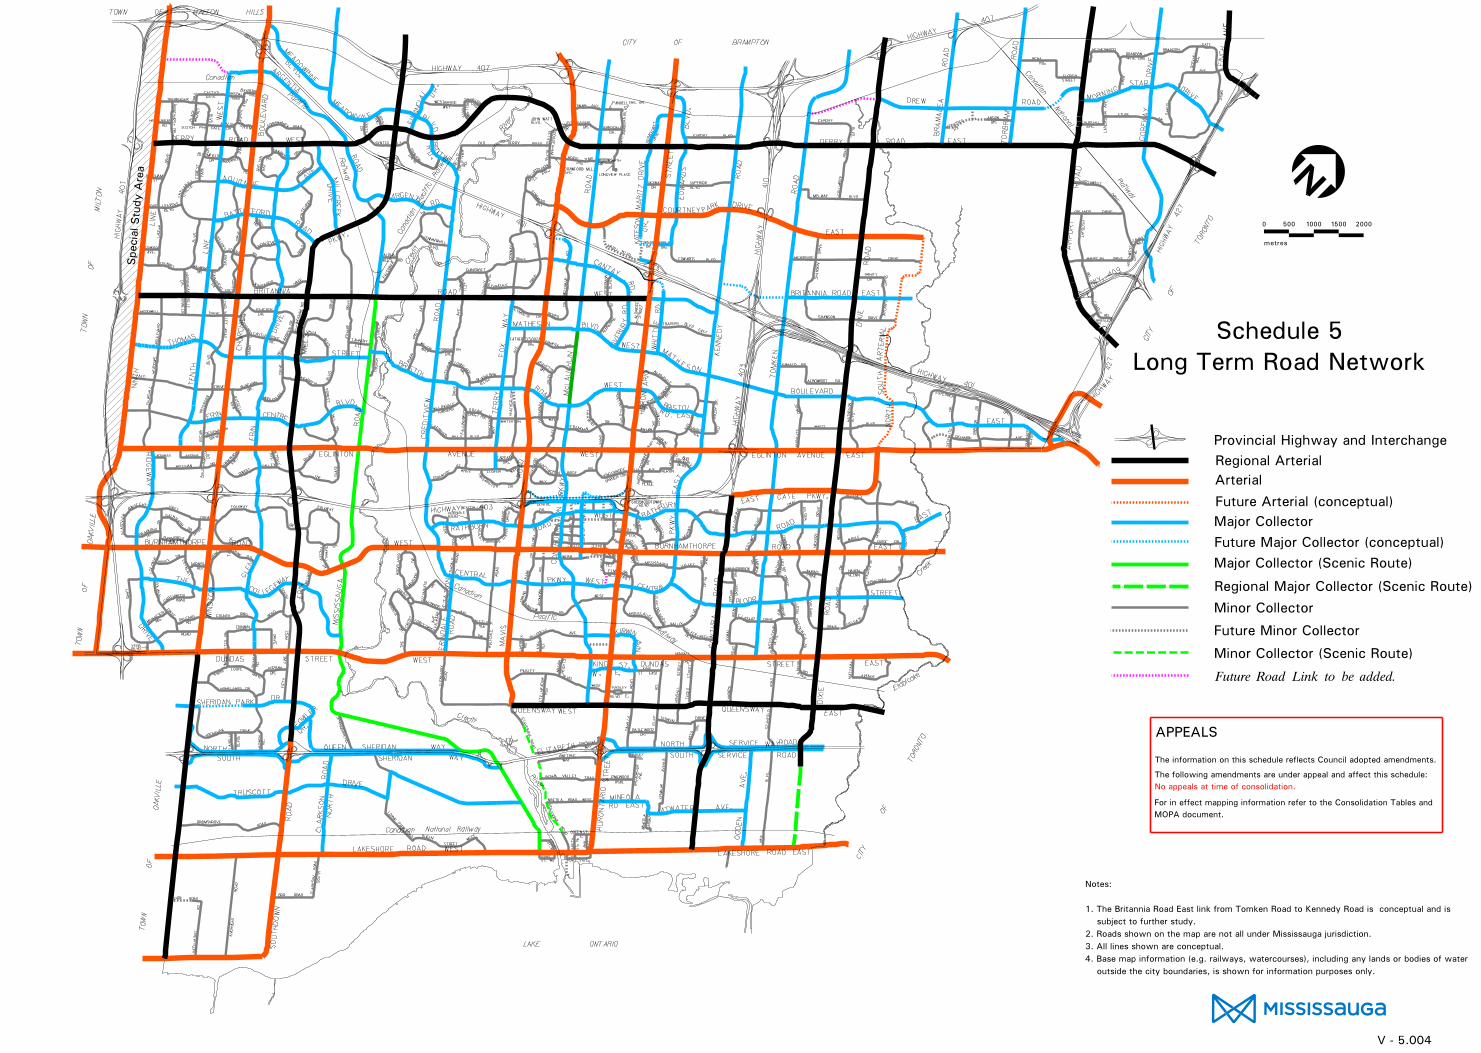
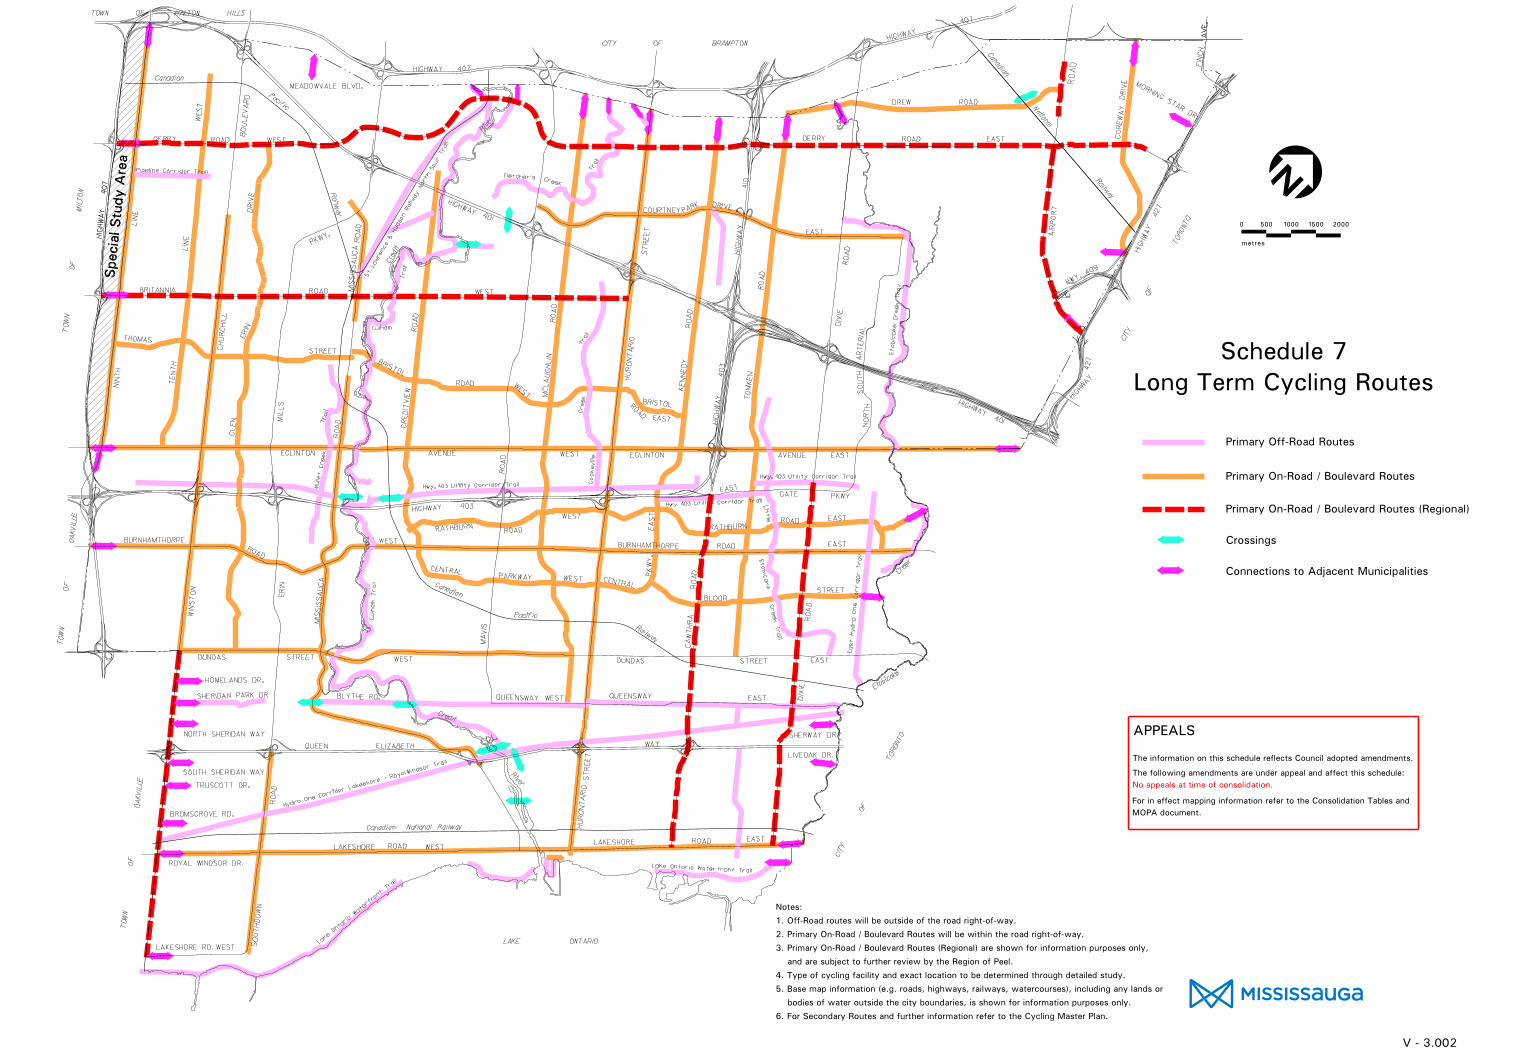
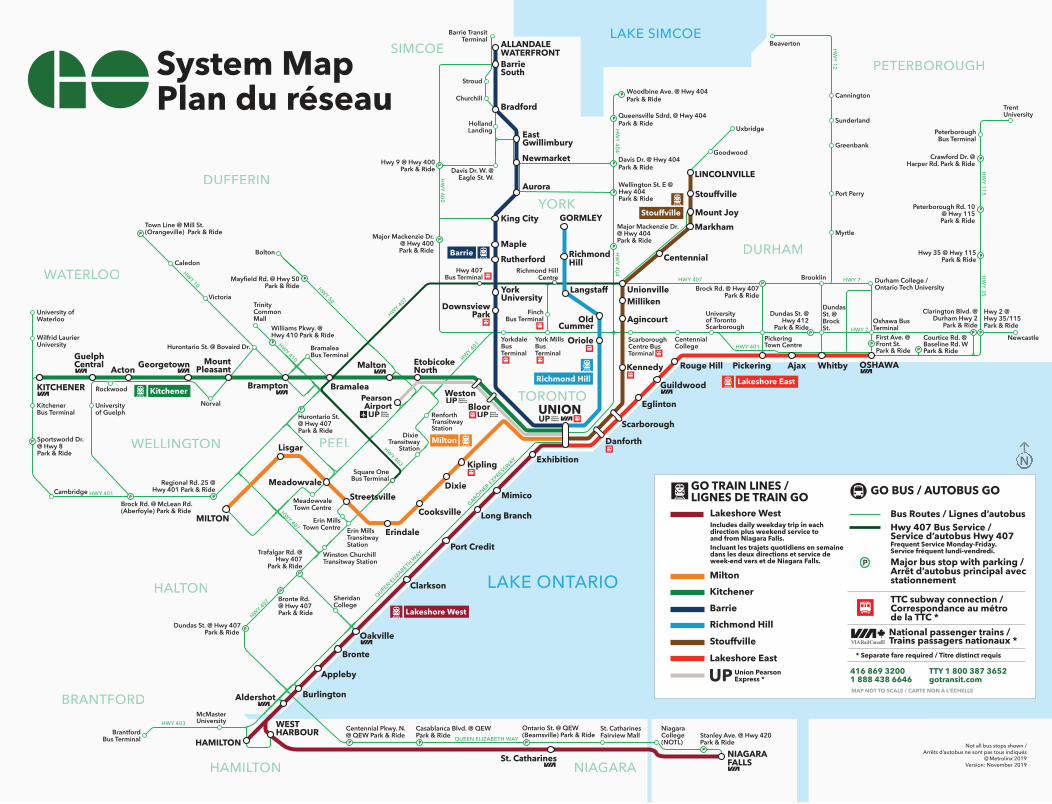
Woodbine Ave. @ Hwy 404Park & Ride
Queensville Sdrd. @ Hwy 404Park & Ride
Uxbridge
Goodwood
LINCOLNVILLE
Stouffville
Mount Joy
Markham
Centennial
UnionvilleMilliken
Agincourt
Kennedy
Wellington St. E @Hwy 404 Park & Ride
TrentUniversity
PeterboroughBus Terminal
Crawford Dr. @Harper Rd. Park & Ride
Peterborough Rd. 10@ Hwy 115Park & Ride
Hwy 35 @ Hwy 115Park & Ride
Durham College /Ontario Tech University
Oshawa BusTerminal
Hwy 2 @Hwy 35/115Park & Ride
OSHAWAWhitbyAjaxPickering
PickeringTown Centre
Universityof TorontoScarborough
Rouge Hill
Guildwood
Eglinton
Scarborough
Danforth
CentennialCollege
ScarboroughCentre BusTerminal
Langstaff
RichmondHill
OldCummer
Oriole
UNION
Richmond HillCentre
ALLANDALEWATERFRONTBarrieSouth
Bradford
EastGwillimbury
Newmarket
Aurora
King City
Maple
Rutherford
YorkUniversity
York MillsBusTerminal
Barrie TransitTerminal
Stroud
Churchill
HollandLanding
Hwy 9 @ Hwy 400Park & Ride
Major Mackenzie Dr.@ Hwy 400Park & Ride
Town Line @ Mill St.(Orangeville) Park & Ride
Caledon
VictoriaTrinityCommonMall
Williams Pkwy. @Hwy 410 Park & Ride
BramaleaBus Terminal
Hurontario St. @ Bovaird Dr.
PearsonAirport
Hurontario St.@ Hwy 407Park & Ride
Norval
Square OneBus Terminal
University ofWaterloo
Wilfrid LaurierUniversity
KitchenerBus Terminal
Sportsworld Dr.@ Hwy 8Park & Ride
Cambridge
Brock Rd. @ McLean Rd.(Aberfoyle) Park & Ride
Rockwood
Universityof Guelph
Regional Rd. 25 @Hwy 401 Park & Ride
Dundas St. @ Hwy 407Park & Ride
Trafalgar Rd. @Hwy 407
Park & Ride
Bronte Rd.@ Hwy 407Park & Ride
SheridanCollege
Erin MillsTown Centre
MeadowvaleTown Centre
McMasterUniversity
Centennial Pkwy. N.@ QEW Park & Ride
Casablanca Blvd. @ QEWPark & Ride
St. CatharinesFairview Mall Stanley Ave. @ Hwy 420
Park & Ride
Bloor
Weston
EtobicokeNorthMalton
BramaleaBrampton
MountPleasantGeorgetown
Acton
GuelphCentral
KITCHENER
Lisgar
MILTON
Meadowvale
Erindale
Cooksville
Kipling
Dixie
Exhibition
Mimico
Long Branch
Port Credit
Clarkson
Oakville
Bronte
Appleby
BurlingtonAldershot
HAMILTON
WESTHARBOUR
St. Catharines NIAGARAFALLS
N
Lakeshore East
Stouffville
Richmond Hill
Lakeshore West
Milton
Barrie
Kitchener
Not all bus stops shown /Arrêts d’autobus ne sont pas tous indiqués
Metrolinx 2019Version: November 2019
System MapPlan du réseau
Brooklin
Brock Rd. @ Hwy 407Park & Ride
LAKE ONTARIO
LAKE SIMCOE
WATERLOO
HALTON
HAMILTON NIAGARA
WELLINGTON
DUFFERIN
SIMCOE
YORK
DURHAM
PETERBOROUGH
TORONTO
Davis Dr. @ Hwy 404Park & Ride
Erin MillsTransitwayStation
QUEEN ELIZABETH WAY
HWY 4
07
HWY 401
QUEEN E
LIZABETH W
AY
HWY 403
HWY 4
01
HWY 4
07
HWY 407
HW
Y 3
5
HWY 10
HW
Y 4
04
HW
Y 4
00
PEEL
HWY 410
YorkdaleBusTerminal
FinchBus Terminal
Clarington Blvd. @Durham Hwy 2
Park & Ride
P
HW
Y 1
15
Newcastle
PP
P
P
PP
P
P
P
PP
P
P
P
P
P
P
P
P P
P
P
P
GARDINER E
XPRESSWAY
HWY 401
BrantfordBus Terminal
BRANTFORD
HWY 403
HWY 7
P
Ontario St. @ QEW(Beamsville) Park & Ride
HWY 2
c
GORMLEY
Winston ChurchillTransitway Station
NiagaraCollege(NOTL)
RenforthTransitwayStation
Dixie Transitway
Station
Streetsville
HWY 407
DownsviewPark
P
Dundas St. @Hwy 412
Park & Ride
Hwy 407Bus Terminal
P
Major Mackenzie Dr.@ Hwy 404 Park & Ride
HW
Y 4
04
PP
First Ave. @Front St.Park & Ride
Courtice Rd. @Baseline Rd. WPark & Ride
GO TRAIN LINES /LIGNES DE TRAIN GO GO BUS / AUTOBUS GO
Lakeshore West
Milton
Kitchener
Barrie
Richmond Hill
Stouffville
Lakeshore East
Includes daily weekday trip in each direction plus weekend service to and from Niagara Falls.
Bus Routes / Lignes d’autobusHwy 407 Bus Service /Service d’autobus Hwy 407Frequent Service Monday-Friday.Service fréquent lundi-vendredi.
416 869 32001 888 438 6646
TTY 1 800 387 3652gotransit.com
MAP NOT TO SCALE / CARTE NON À L’ÉCHELLE
TTC subway connection / Correspondance au métrode la TTC *
* Separate fare required / Titre distinct requis
Union PearsonExpress *
Lorem ipsum
Incluant les trajets quotidiens en semainedans les deux directions et service de week-end vers et de Niagara Falls. P Major bus stop with parking /
Arrêt d’autobus principal avecstationnement
National passenger trains / Trains passagers nationaux *
Bolton
HWY 50
Mayfield Rd. @ Hwy 50Park & Ride
P
Davis Dr. W. @Eagle St. W.
Beaverton
Cannington
Sunderland
Greenbank
Port Perry
Myrtle
DundasSt. @BrockSt.
HW
Y 1
2
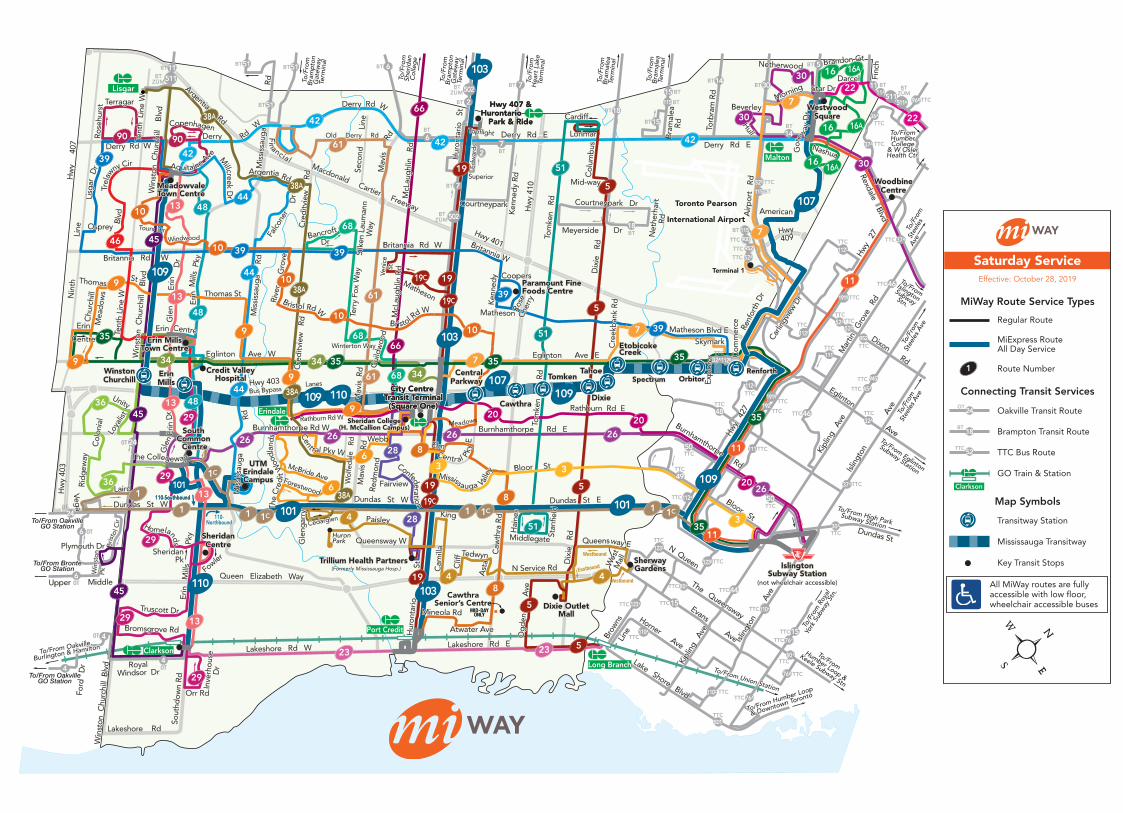
To/F
rom
Roy
al
York
Sub
way
Stn
.
To/F
rom
Roy
al
York
Sub
way
Stn
.
To/F
rom
Roy
al
York
Sub
way
Stn
.
Eastbound
Westbound
Westbound
To/F
rom
Bra
mp
ton
Gat
eway
Term
inal
To/F
rom
Bra
mp
ton
Gat
eway
Term
inal
To/F
rom
Bra
mp
ton
Gat
eway
Term
inal
OT To/From Eglinton
Subway Station
To/From Eglinton
Subway Station
To/From Eglinton
Subway Station
Port Credit
Long Branch
To/FromHumberCollege
& W OslerHealth Ctr.
To/FromHumberCollege
& W OslerHealth Ctr.
To/FromHumberCollege
& W OslerHealth Ctr.
To/F
rom
Stee
les
Ave
To/F
rom
Stee
les
Ave
To/F
rom
Stee
les
Ave
To/F
rom
St
eele
sAv
e
To/F
rom
St
eele
sAv
e
To/F
rom
St
eele
sAv
e
To/From High ParkSubway Station
To/From High ParkSubway Station
To/From High ParkSubway Station
To/FromIslington
SubwayStn.
To/FromIslington
SubwayStn.
To/FromIslington
SubwayStn.
To/F
rom
Stee
les
Ave
To/F
rom
Stee
les
Ave
To/F
rom
Stee
les
Ave
To/From
Humber Loop &
Keele Subway Stn
To/From
Humber Loop &
Keele Subway Stn
To/From
Humber Loop &
Keele Subway Stn
To/From Humber Loop
& Downtown Toronto
To/From Humber Loop
& Downtown Toronto
To/From Humber Loop
& Downtown Toronto
To/From Union Station
To/From Union Station
To/From Union Station
To/F
rom
Bra
mp
ton
Gat
eway
Term
inal
To/F
rom
Bra
mp
ton
Gat
eway
Term
inal
To/F
rom
Bra
mp
ton
Gat
eway
Term
inal
To/F
rom
Bra
mal
eaTe
rmin
al
To/F
rom
Bra
mal
eaTe
rmin
al
To/F
rom
Bra
mal
eaTe
rmin
al
To/F
rom
Bra
mal
eaTe
rmin
al
To/F
rom
Bra
mal
eaTe
rmin
al
To/F
rom
Bra
mal
eaTe
rmin
al
IslingtonSubway Station
IslingtonSubway Station
IslingtonSubway Station
CourtneyparkCourtneyparkCourtneypark
Net
herh
art
Rd
Net
herh
art
Rd
Net
herh
art
Rd
Clarkson
1C11C11C
1C
11
1
7
7
7
7
8
9
9
9
8
8
5
5
33
3
5
44
4
5
5
30
2020
11
11
11
2026
26262626
66
66
19
19
19
23 23
28
28
29
4242
42
4413
13
13
13
13
48
48
48
44
44
42
39
3939
39
3534
3434
68
68
61
61
61
35
35
36
36
35
35
30
30
22
22
OT
OT
6
6
4
24
OT
4OT4
110110
110110109109
109109
109109
109109
107107
107107
103103
103103
103103
TTC
TTC
TTC46
TTC46
TTC
TTC
TTC
TTC50
TTC15
TTC44
TTC49
TTC50
TTC15
TTC501
TTC
TTC
TTC111
TTC111
TTC192
TTC
TTC
900
TTC
TTC
TTC
TTC110A
TTC110+
110C
TTC112+
32A
TTC52A
52A
TTC37+
52D TTC
14
TTC 37A
TTC32A
TTC112+
BT
BT
30BT14BT
15 BT
15BT
18BT51BT
51BT51BT
18BT
5BT
7
BTZÜM502
BT
7BT
115
BT115
BT 115
SouthCommon Centre
SouthCommon Centre
SouthCommon Centre
Credit ValleyHospital
Credit ValleyHospital
Credit ValleyHospital
Erin MillsTown Centre
Erin MillsTown Centre
Erin MillsTown Centre
To/From Oakville,
Burlington & HamiltonTo/From Oakville,
Burlington & HamiltonTo/From Oakville,
Burlington & Hamilton
UTMErindaleCampus
UTMErindaleCampus
UTMErindaleCampus
SheridanCentre
SheridanCentre
SheridanCentre
To/From BronteGO Station
To/From BronteGO Station
To/From BronteGO Station
To/From OakvilleGO Station
To/From OakvilleGO Station
To/From OakvilleGO Station
To/From OakvilleGO Station
To/From OakvilleGO Station
To/From OakvilleGO Station
MeadowvaleTown CentreMeadowvaleTown CentreMeadowvaleTown Centre
To/F
rom
Sher
idan
Col
leg
e
To/F
rom
Sher
idan
Col
leg
e
To/F
rom
Sher
idan
Col
leg
e
Paramount FineFoods CentreParamount FineFoods CentreParamount FineFoods Centre
DixieDixieDixie
TomkenTomkenTomken
CawthraCawthraCawthra
CentralParkway
CentralParkway
CentralParkway
WoodbineCentre
WoodbineCentre
WoodbineCentre
WestwoodSquare
WestwoodSquare
WestwoodSquare
Terminal 1
SherwayGardensSherwayGardensSherwayGardens
CawthraSenior’s Centre
Trillium Health PartnersTrillium Health PartnersTrillium Health Partners(Formerly Mississauga Hosp.)
MID-DAYONLY
HuronPark
Toronto Pearson
International Airport
To/F
rom
Hea
rt L
ake
Term
inal
To/F
rom
Hea
rt L
ake
Term
inal
To/F
rom
Hea
rt L
ake
Term
inal
Dixie OutletMall
Dixie OutletMall
Dixie OutletMall
City Centre Transit Terminal
(Square One)
City Centre Transit Terminal
(Square One)
City Centre Transit Terminal
(Square One)
16
16
16
(not wheelchair accessible)(not wheelchair accessible)(not wheelchair accessible)
9
9
6
6
19C
19C
19C
19
BTZÜM502
2BT
2
7BT
Hwy 407 &Hurontario
Park & Ride
Hwy 407 &Hurontario
Park & Ride
Hwy 407 &Hurontario
Park & Ride
10
10
10
1046
38A
38A
38A
38A
38A
45
45
45
51
51
51
90 90
Erindale
16A
16A
16A
OT24
29
29
29
11BT
511BTZÜM
ErinMillsErinMillsErinMills
TahoeTahoeTahoe
EtobicokeCreekEtobicokeCreekEtobicokeCreek
6BT
6BT
11
51111A
511A
BTZÜM
BT
TTC37A
112B
112C
112C
TTC
TTC
36A
96B
TTC
TTC
123B
123C
TTC
123+
80+
80+
TTC 76A
TTC76B
TTC 76+
191B
191B
30A
45A
TTC52D
TTC48
29 Sheridan College(H. McCallion Campus)
Sheridan College(H. McCallion Campus)
Sheridan College(H. McCallion Campus)
10
101101101101
101101
SpectrumSpectrumSpectrum OrbitorOrbitorOrbitorRenforthRenforthRenforthWinston
ChurchillWinstonChurchillWinstonChurchill
39
35
Malton
TTC 952
TTC 945
TTC952
68
RoyalWindsor Dr
RoyalWindsor Dr
RoyalWindsor Dr
Kipl
ing
Ave
Kipl
ing
Ave
Kipl
ing
Ave
Mar
tin
Gro
ve
Rd
Mar
tin
Gro
ve
Rd
Mar
tin
Gro
ve
Rd
Eglinton Ave
Eglinton Ave
Eglinton Ave
Brow
nsLi
neBrow
nsLi
neBrow
nsLi
ne
Lake Shore Blvd
Lake Shore Blvd
Lake Shore Blvd
The Queensway
The Queensway
The QueenswayHorner Ave
Horner Ave
Horner Ave
N Queen
N Queen
N Queen
Evans Ave
Evans Ave
Evans Ave
Truscott DrTruscott DrTruscott Dr
Ros
ehur
stR
oseh
urst
Ros
ehur
st
Old Derry RdOld Derry RdOld Derry Rd
Mav
isM
avis
Mav
isRdRdRd
Derry RdDerry RdDerry Rd WWW
Britannia Rd WBritannia Rd WBritannia Rd W
Britannia Rd WBritannia Rd WBritannia Rd W
Eglinton Ave WEglinton Ave WEglinton Ave W
Burnhamthorpe Rd WBurnhamthorpe Rd WBurnhamthorpe Rd W Burnhamthorpe Rd EBurnhamthorpe Rd EBurnhamthorpe Rd E
Rathburn Rd ERathburn Rd ERathburn Rd ERathburn Rd WRathburn Rd WRathburn Rd W
Burnhamthorpe Rd
Burnhamthorpe Rd
Burnhamthorpe Rd
Airp
ort
Rd
Airp
ort
Rd
Airp
ort
Rd
Dix
ie
Rd
Dix
ie
Rd
Dix
ie
Rd
Tom
ken
Rd
Tom
ken
Rd
Tom
ken
Rd
Tom
ken
Rd
Tom
ken
Rd
Tom
ken
Rd
McL
aug
hlin
Rd
McL
aug
hlin
Rd
McL
aug
hlin
Rd
Cre
ditv
iew
R
dC
red
itvie
w
Rd
Cre
ditv
iew
R
dGle
nG
len
Gle
nEr
inEr
inEr
inD
rD
rD
r
Hur
onta
rio
S
tH
uron
tario
St
Hur
onta
rio
S
t
Og
den
A
veO
gd
en
Ave
Og
den
A
ve
Queensway WQueensway WQueensway W QueensQueensQueensway Eway Eway E
Mineola RdMineola RdMineola Rd
Red
mon
dR
edm
ond
Red
mon
d
McBride Ave
McBride Ave
McBride AveForestwood
Forestwood
ForestwoodFairviewFairviewFairview
Atwater AveAtwater AveAtwater Ave
N Service RdN Service RdN Service Rd
MiddlegateMiddlegateMiddlegate
TedwynTedwynTedwyn
Clif
fC
liff
Clif
f
Ast
aA
sta
Ast
a
Cam
illa
Cam
illa
Cam
illa
PaisleyPaisleyPaisley
Gle
ngar
ryG
leng
arry
Gle
ngar
ry
CedarglenCedarglenCedarglen
Thomas StThomas StThomas St
Riv
erR
iver
Riv
erG
rove
Gro
veG
rove
BancroftBancroftBancroft
Gui
ldw
ood
Gui
ldw
ood
Gui
ldw
ood
DrDrDr
Lisg
arLi
sgar
Lisg
arD
rD
rD
r
Tours DrTours DrTours Dr
ArgentiaArgentiaArgentia RdRdRd
Falco
ner
Falco
ner
Falco
ner
Dr
Dr
Dr
WindWindWindwoodwoodwood
SheridanPk
SheridanPk
SheridanPk
LairdLairdLairdVega
Vega
Vega
Rid
gew
ayR
idg
eway
Rid
gew
ayC
olon
ial
Col
onia
lC
olon
ial
UnityUnityUnity
Loya
list
Loya
list
Loya
list
Matheson Blvd EMatheson Blvd EMatheson Blvd ESkymarkSkymarkSkymark
CardiffCardiffCardiff
LorimarLorimarLorimar
BeverleyBeverleyBeverley
AmericanAmericanAmerican
HullHullHull
NetherwoodNetherwoodNetherwood
DarcelDarcelDarcel
NashuaNashuaNashua
Finc
hFi
nch
Finc
h
MorningMorningMorning Star DrStar DrStar Dr
Col
umb
usC
olum
bus
Col
umb
us
Mid-wayMid-wayMid-way
Com
mer
ceC
omm
erce
Com
mer
ce
Exp
lore
rEx
plo
rer
Exp
lore
r
Renf
orth
Dr
Renf
orth
Dr
Renf
orth
Dr
Carli
ngvie
w D
r
Carli
ngvie
w D
r
Carli
ngvie
w D
r
Stan
field
Stan
field
Stan
field
Hai
nes
Hai
nes
Hai
nes
Wes
tM
all
Wes
tM
all
Wes
tM
all
Bromsgrove RdBromsgrove RdBromsgrove Rd
Caw
thra
Rd
Caw
thra
Rd
Caw
thra
Rd
Dix
ie
Rd
Dix
ie
Rd
Dix
ie
Rd
Erin
M
ills
Pky
Erin
M
ills
Pky
Erin
M
ills
Pky
Inve
rhou
seD
rIn
verh
ouse
Dr
Inve
rhou
seD
r
Orr RdOrr RdOrr Rd
Mis
siss
aug
aM
issi
ssau
ga
Mis
siss
aug
a
Mis
siss
aug
a R
dM
issi
ssau
ga
Rd
Mis
siss
aug
a R
d
Win
ston
Chu
rchi
ll B
lvd
Win
ston
Chu
rchi
ll B
lvd
Win
ston
Chu
rchi
ll B
lvd
Win
ston
Chu
rchi
ll B
lvd
Win
ston
Chu
rchi
ll B
lvd
Win
ston
Chu
rchi
ll B
lvd
Bloor St
Bloor St
Bloor St
Bloor StBloor StBloor St
Dundas St EDundas St EDundas St E
Islin
gton
Ave
Islin
gton
Ave
Islin
gton
Ave
Dundas St WDundas St WDundas St W
Mav
is
Rd
Mav
is
Rd
Mav
is
Rd
Mav
is R
dM
avis
Rd
Mav
is R
d
Wol
fed
ale
Rd
Wol
fed
ale
Rd
Wol
fed
ale
Rd
Lakeshore Rd WLakeshore Rd WLakeshore Rd W Lakeshore Rd ELakeshore Rd ELakeshore Rd E
Dundas St WDundas St WDundas St W
Eglinton Ave EEglinton Ave EEglinton Ave E
Derry Rd EDerry Rd EDerry Rd EDerry Rd EDerry Rd EDerry Rd E
DerryDerryDerryDerry Rd WDerry Rd WDerry Rd W
Rd Rd Rd
Hwy409Hwy409Hwy409
Torb
ram
Rd
Torb
ram
Rd
Torb
ram
Rd
Ken
ned
y R
dK
enne
dy
Rd
Ken
ned
y R
d
Terr
y Fo
x W
ayTe
rry
Fox
Way
Terr
y Fo
x W
aySi
lken
Lau
man
nW
aySi
lken
Lau
man
nW
aySi
lken
Lau
man
nW
ay
Veni
ceSt
Veni
ceSt
Veni
ceSt
McL
aug
hlin
R
dM
cLau
ghl
in
Rd
McL
aug
hlin
R
d
Seco
nd
Line
Seco
nd
Line
Seco
nd
Line
Cre
ditv
iew
R
dC
red
itvie
w
Rd
Cre
ditv
iew
R
d
Mis
siss
aug
a
Rd
Mis
siss
aug
a
Rd
Mis
siss
aug
a
Rd
Macdonald Cartier Freeway
Macdonald Cartier Freeway
Macdonald Cartier Freeway Hw
y 41
0H
wy
410
Hw
y 41
0
Hwy 401Hwy 401Hwy 401
Hwy 403Hwy 403Hwy 403Bus BypassBus BypassBus Bypass
LanesLanesLanes
Hw
y 40
3H
wy
403
Hw
y 40
3
Queen Elizabeth WayQueen Elizabeth WayQueen Elizabeth Way
Nin
th
Li
neN
inth
Line
Nin
th
Li
neH
wy
407
Hw
y 40
7H
wy
407
Bra
mal
eaR
dB
ram
alea
Rd
Bra
mal
eaR
d
Win
ston
PkWin
ston
PkWin
ston
Pk
CoopersCoopersCoopers
MathesonMathesonMatheson
Matheson
Matheson
Matheson
Rose
Che
rry
Rose
Che
rry
Rose
Che
rryKen
ned
yK
enne
dy
Ken
ned
y
Britannia W
Britannia W
Britannia W
Argentia Rd
Argentia Rd
Argentia Rd
Thomas Thomas Thomas
Rd
Rd
Rd
ErinErinErin CentreCentreCentre
Courtneypark DrCourtneypark DrCourtneypark Dr
Winterton WayWinterton WayWinterton Way
Dundas StDundas StDundas St
Bris
tol C
irB
risto
l Cir
Bris
tol C
ir
Upper MiddleUpper MiddleUpper Middle
Homelands
Homelands
Homelands
Sout
hdow
n R
dSo
uthd
own
Rd
Sout
hdow
n R
d
Lakeshore RdLakeshore RdLakeshore Rd
ElmElmElm
TerragarTerragarTerragar
Tent
h L
ine
WTe
nth
Lin
e W
Tent
h L
ine
W
W W W
Aquitaine A
ve
Aquitaine A
ve
Aquitaine A
ve
Chu
rchi
llM
ead
ows
Chu
rchi
llM
ead
ows
Chu
rchi
llM
ead
ows
Erin
Centre
Erin
Centre
Erin
Centre
Tent
h Li
ne W
Tent
h Li
ne W
Tent
h Li
ne W
RexdaleRexdaleRexdale
BlvdBlvdBlvd
Dixon Rd
Dixon Rd
Dixon Rd
Trel
aw
ny Cir
Trel
aw
ny Cir
Trel
aw
ny Cir
Osprey B
lvd
Osprey B
lvd
Osprey B
lvd
CopenhagenCopenhagenCopenhagen
Erin
Mill
s Pk
yE
rin M
ills
Pky
Erin
Mill
s Pk
y
Bristol Rd W
Bristol Rd W
Bristol Rd W
Bristol Rd WBristol Rd WBristol Rd W
Hw
y 42
7
Hw
y 42
7
Hw
y 42
7
Hw
y 27
Hw
y 27
Hw
y 27
Plymouth DrPlymouth DrPlymouth Dr
Ford
D
rFo
rd
Dr
Ford
D
r
Gle
n E
rin D
rG
len
Erin
Dr
Gle
n E
rin D
r
The CollegewayThe CollegewayThe Collegeway
The
Cre
dit
Woo
dlan
dsTh
e C
red
it W
oodl
ands
The
Cre
dit
Woo
dlan
ds
Centr al Pky
E
Centr al Pky
E
Centr al Pky
EConfederation
Confederation
Confederation
Cent ral Pky W
Cent ral Pky W
Cent ral Pky W
Mississauga Valle
yMississauga Val
ley
Mississauga Valle
y
Meyerside DrMeyerside DrMeyerside Dr
Financial
Financial
Financial
Fowler
Fowler
Fowler
Win
ston
Chu
rchi
ll B
lvd
Win
ston
Chu
rchi
ll B
lvd
Win
ston
Chu
rchi
ll B
lvd
Millcreek D
rM
illcreek Dr
Millcreek D
r
110-Southbound110-Southbound110-Southbound
110-Northbound
110-Northbound
Brandon GtBrandon GtBrandon Gt
Hur
onta
rio
StH
uron
tario
St
Hur
onta
rio
St
SuperiorSuperiorSuperior
Edw
ard
sEd
war
ds
Edw
ard
s
TopflightTopflightTopflight
Gor
eway
Dr
Gor
eway
Dr
Webb
Kipl
ing
Ave
Kipl
ing
Ave
Kipl
ing
Ave
Islin
gton
Av
e
Islin
gton
Av
e
Islin
gton
Av
e
Meadows
St
KingKingKing
Cre
ekb
ank
Rd
Cre
ekb
ank
Rd
Lisgar
Saturday Service
TTC52
BT18
OT24
Regular Route
MiExpress RouteAll Day Service
Route Number
Oakville Transit Route
Brampton Transit Route
TTC Bus Route
GO Train & Station
Connecting Transit Services
1
Clarkson
MiWay Route Service Types
Effective: October 28, 2019
All MiWay routes are fully accessible with low floor, wheelchair accessible buses
Map Symbols
Transitway Station
Mississauga Transitway
Key Transit Stops
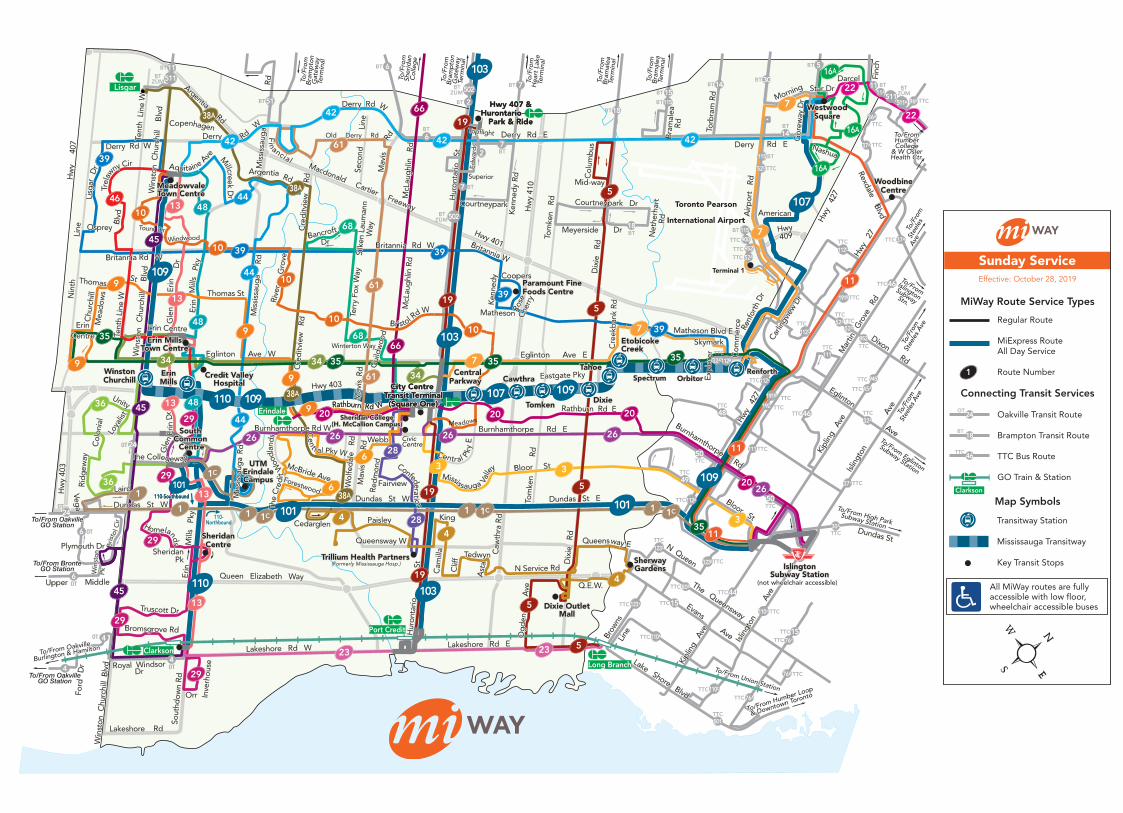
Hw
y 40
7H
wy
407
Hw
y 40
7
110-Southbound110-Southbound110-Southbound
110-Northbound
OT
6
6
4OT
4OT4
To/From OakvilleGO Station
To/From OakvilleGO Station
To/From OakvilleGO Station
Upper MiddleUpper MiddleUpper Middle
Ford
D
rFo
rd
Dr
Ford
D
r
(not wheelchair accessible)(not wheelchair accessible)(not wheelchair accessible)
ErindaleDixieDixieDixie
TomkenTomkenTomken
CawthraCawthraCawthraCentral
ParkwayCentral
ParkwayCentral
ParkwayErinMillsErinMillsErinMills
TahoeTahoeTahoe
EtobicokeCreekEtobicokeCreekEtobicokeCreek
WinstonChurchillWinstonChurchillWinstonChurchill SpectrumSpectrumSpectrum OrbitorOrbitorOrbitor
RenforthRenforthRenforth
To/F
rom
Bra
mp
ton
Gat
eway
Term
inal
To/F
rom
Bra
mp
ton
Gat
eway
Term
inal
To/F
rom
Bra
mp
ton
Gat
eway
Term
inal
OT
OT
OTTo/From Eglinton
Subway Station
To/From Eglinton
Subway Station
To/From Eglinton
Subway Station
Port Credit
Long Branch
To/FromHumberCollege
& W OslerHealth Ctr.
To/FromHumberCollege
& W OslerHealth Ctr.
To/FromHumberCollege
& W OslerHealth Ctr.
To/F
rom
Stee
les
Ave
To/F
rom
Stee
les
Ave
To/F
rom
Stee
les
Ave
To/F
rom
St
eele
sAv
e
To/F
rom
St
eele
sAv
e
To/F
rom
St
eele
sAv
e
To/From High ParkSubway Station
To/From High ParkSubway Station
To/From High ParkSubway Station
To/FromIslington
SubwayStn.
To/FromIslington
SubwayStn.
To/FromIslington
SubwayStn.
To/F
rom
Stee
les
Ave
To/F
rom
Stee
les
Ave
To/F
rom
Stee
les
Ave
To/From Humber Loop
& Downtown Toronto
To/From Humber Loop
& Downtown Toronto
To/From Humber Loop
& Downtown Toronto
To/From Union Station
To/From Union Station
To/From Union Station
To/F
rom
Bra
mp
ton
Gat
eway
Term
inal
To/F
rom
Bra
mp
ton
Gat
eway
Term
inal
To/F
rom
Bra
mp
ton
Gat
eway
Term
inal
To/F
rom
Bra
mal
eaTe
rmin
al
To/F
rom
Bra
mal
eaTe
rmin
al
To/F
rom
Bra
mal
eaTe
rmin
al
To/F
rom
Bra
mal
eaTe
rmin
al
To/F
rom
Bra
mal
eaTe
rmin
al
To/F
rom
Bra
mal
eaTe
rmin
al
IslingtonSubway Station
IslingtonSubway Station
IslingtonSubway Station
Net
herh
art
Rd
Net
herh
art
Rd
Net
herh
art
Rd
Clarkson
1C11C11C
1C
11
1
7
7
7
7
9
9
9
9
9
5
5
33
3
5
5
5
20 20
11
109109
11
11
2026
26262626
1966
66
19
19
19
23 23
28
28
4242
BTZÜM502
42
13
13
13
13
48
48
48
44
44
44
42
39
3939
39
34
3434
61
61
61
36
36
22
22
24
24
110110TTC46
TTC46
TTC
TTC
TTC
TTC50
TTC44
TTC49
TTC50
TTC501
TTC
TTC111
TTC111
TTC192
TTC
TTC
TTC112A
32A
52A
TTC37+
14
TTC 37A
TTC112+
BT
14BT
15BT
18BT
51BT
18BT
5BT
30BT
7BT
7 BT
BT 115
CivicCentre
SouthCommon Centre
SouthCommon Centre
SouthCommon Centre
Credit ValleyHospital
Credit ValleyHospital
Credit ValleyHospital
Erin MillsTown Centre
Erin MillsTown Centre
Erin MillsTown Centre
To/From Oakville,
Burlington & HamiltonTo/From Oakville,
Burlington & HamiltonTo/From Oakville,
Burlington & Hamilton
UTMErindaleCampus
UTMErindaleCampus
UTMErindaleCampus
SheridanCentre
SheridanCentre
SheridanCentre
To/From BronteGO Station
To/From BronteGO Station
To/From BronteGO Station
MeadowvaleTown CentreMeadowvaleTown CentreMeadowvaleTown Centre
To/F
rom
Sher
idan
Col
leg
e
To/F
rom
Sher
idan
Col
leg
e
To/F
rom
Sher
idan
Col
leg
e
Paramount FineFoods CentreParamount FineFoods CentreParamount FineFoods Centre
WoodbineCentre
WoodbineCentre
WoodbineCentre
WestwoodSquare
WestwoodSquare
WestwoodSquare
Terminal 1
SherwayGardensSherwayGardensSherwayGardens
Trillium Health PartnersTrillium Health PartnersTrillium Health Partners(Formerly Mississauga Hosp.)
Toronto Pearson
International Airport
To/F
rom
Hea
rt L
ake
Term
inal
To/F
rom
Hea
rt L
ake
Term
inal
To/F
rom
Hea
rt L
ake
Term
inal
City Centre Transit Terminal
(Square One)
City Centre Transit Terminal
(Square One)
City Centre Transit Terminal
(Square One)
Dixie OutletMall
Dixie OutletMall
Dixie OutletMall
Lisgar
Royal WindsorDr
Royal WindsorDr
Royal WindsorDr
13101101101101
101101
110110
6
6
BTZÜM502
2BT
7BT
Hwy 407 &Hurontario
Park & Ride
Hwy 407 &Hurontario
Park & Ride
Hwy 407 &Hurontario
Park & Ride
38A
45
45
45
38A
38A
38A
29
29
29
20
16A
16A
16ATTC52D
TTC110A
TTC110C
110+
To/From OakvilleGO Station
To/From OakvilleGO Station
To/From OakvilleGO Station
4
4
4
29
11BT
511BTZÜM
6BT
6BT
11
51111A
511A
BTZÜM
BT
BT115
BT115
TTC37A
36A
96B
TTC
TTC
112C
112C
TTC
TTC
TTC
TTC123B
123C
TTC
123+
TTC15
TTC 76A
TTC76B
TTC 76+
TTC15
TTC 80B
TTC
32A112B
TTC191B
191B
TTC48
30A
45A
TTC52ATTC
52D
29 Sheridan College(H. McCallion Campus)
Sheridan College(H. McCallion Campus)
Sheridan College(H. McCallion Campus)
10
10
10109109
10
10
68
68
46
109109109109
3535
35
35
103103
103103
103103
39
107107
107107
35
TTC 900
TTC 952
TTC 945
TTC952
2
Kipl
ing
Ave
Kipl
ing
Ave
Kipl
ing
Ave
Mar
tin
Gro
ve
Rd
Mar
tin
Gro
ve
Rd
Mar
tin
Gro
ve
Rd
Eglinton Ave
Eglinton Ave
Eglinton Ave
Brow
nsLi
neBrow
nsLi
neBrow
nsLi
ne
Lake Shore Blvd
Lake Shore Blvd
Lake Shore Blvd
N Queen
N Queen
N Queen
Truscott DrTruscott DrTruscott Dr
Old Derry RdOld Derry RdOld Derry Rd
Mav
isM
avis
Mav
isRdRdRd
Derry RdDerry RdDerry Rd WWW
Britannia Rd WBritannia Rd WBritannia Rd W
Britannia Rd WBritannia Rd WBritannia Rd W
Eglinton Ave WEglinton Ave WEglinton Ave W
Burnhamthorpe Rd WBurnhamthorpe Rd WBurnhamthorpe Rd W Burnhamthorpe Rd EBurnhamthorpe Rd EBurnhamthorpe Rd E
Rathburn Rd ERathburn Rd ERathburn Rd E
Burnhamthorpe Rd
Burnhamthorpe Rd
Burnhamthorpe Rd
Airp
ort
Rd
Airp
ort
Rd
Airp
ort
Rd
Gor
eway
Dr
Gor
eway
Dr
Gor
eway
Dr
Dix
ie
Rd
Dix
ie
Rd
Dix
ie
Rd
Hur
onta
rio
StH
uron
tario
St
Hur
onta
rio
St
Tom
ken
Rd
Tom
ken
Rd
Tom
ken
Rd
Tom
ken
Rd
Tom
ken
Rd
Tom
ken
Rd
McL
aug
hlin
Rd
McL
aug
hlin
Rd
McL
aug
hlin
Rd
Cre
ditv
iew
R
dC
red
itvie
w
Rd
Cre
ditv
iew
R
dGle
n
Er
inG
len
Erin
Gle
n
Er
inD
rD
rD
r
Hur
onta
rio
S
tH
uron
tario
St
Hur
onta
rio
S
t
Og
den
A
veO
gd
en
Ave
Og
den
A
ve
Queensway WQueensway WQueensway W QueensQueensQueens
TedwynTedwynTedwyn
CedarglenCedarglenCedarglen
Ast
aA
sta
Ast
a
Clif
fC
liff
Clif
f
Cam
illa
Cam
illa
Cam
illa
Q.E.W.Q.E.W.Q.E.W.
N Service RdN Service RdN Service Rd
way Eway Eway E
Red
mon
dR
edm
ond
Red
mon
d
McBride Ave
McBride Ave
McBride AveForestwood
Forestwood
ForestwoodFairviewFairviewFairview
PaisleyPaisleyPaisley
Thomas StThomas StThomas St
Riv
erR
iver
Riv
erG
rove
Gro
veG
rove
Lisg
arLi
sgar
Lisg
arD
rD
rD
r
Tours DrTours DrTours Dr
ArgentiaArgentiaArgentia RdRdRd
WindWindWindwoodwoodwood
SheridanPk
SheridanPk
SheridanPk
LairdLairdLairdVega
Vega
Vega
Rid
gew
ayR
idg
eway
Rid
gew
ayC
olon
ial
Col
onia
lC
olon
ial
UnityUnityUnity
Loya
list
Loya
list
Loya
list
DarcelDarcelDarcel
NashuaNashuaNashua
Finc
hFi
nch
Finc
h
MorningMorningMorning Star DrStar DrStar Dr
Col
umb
usC
olum
bus
Col
umb
us
Renf
orth
Dr
Renf
orth
Dr
Renf
orth
Dr
Matheson Blvd EMatheson Blvd EMatheson Blvd ESkymarkSkymarkSkymark
Com
mer
ceC
omm
erce
Com
mer
ce
Exp
lore
rEx
plo
rer
Exp
lore
r
Carli
ngvie
w D
r
Carli
ngvie
w D
r
Carli
ngvie
w D
r
Bromsgrove RdBromsgrove RdBromsgrove Rd
Caw
thra
Rd
Caw
thra
Rd
Caw
thra
Rd
Dix
ie
Rd
Dix
ie
Rd
Dix
ie
Rd
Erin
M
ills
Pky
Erin
M
ills
Pky
Erin
M
ills
Pky
Mis
siss
aug
a R
dM
issi
ssau
ga
Rd
Mis
siss
aug
a R
d
Mis
siss
aug
a R
dM
issi
ssau
ga
Rd
Mis
siss
aug
a R
d
Win
ston
Chu
rchi
ll B
lvd
Win
ston
Chu
rchi
ll B
lvd
Win
ston
Chu
rchi
ll B
lvd
Win
ston
C
hurc
hill
B
lvd
Win
ston
C
hurc
hill
B
lvd
Win
ston
C
hurc
hill
B
lvd
Bloor St
Bloor St
Bloor St
Bloor StBloor StBloor St
Dundas St EDundas St EDundas St E
Islin
gton
Ave
Islin
gton
Ave
Islin
gton
Ave
Kipl
ing
Ave
Kipl
ing
Ave
Kipl
ing
Ave
Islin
gton
Av
e
Islin
gton
Av
e
Islin
gton
Av
e
Dundas St WDundas St WDundas St W
Mav
is R
dM
avis
Rd
Mav
is R
d
Wol
fed
ale
Rd
Wol
fed
ale
Rd
Wol
fed
ale
Rd
Mav
is
Rd
Mav
is
Rd
Mav
is
Rd
Lakeshore Rd WLakeshore Rd WLakeshore Rd W Lakeshore Rd ELakeshore Rd ELakeshore Rd E
Dundas St WDundas St WDundas St W
Derry Rd EDerry Rd EDerry Rd EDerry Rd EDerry Rd EDerry Rd E
DerryDerryDerryDerry Rd WDerry Rd WDerry Rd W
Rd Rd Rd
Hwy409Hwy409Hwy409
Torb
ram
Rd
Torb
ram
Rd
Torb
ram
Rd
Ken
ned
y R
dK
enne
dy
Rd
Ken
ned
y R
d
Terr
y Fo
x W
ayTe
rry
Fox
Way
Terr
y Fo
x W
ay
Gui
ldw
ood
Gui
ldw
ood
Gui
ldw
ood
Winterton WayWinterton WayWinterton Way
Silk
en L
aum
ann
Way
Silk
en L
aum
ann
Way
Silk
en L
aum
ann
Way
McL
aug
hlin
R
dM
cLau
ghl
in
Rd
McL
aug
hlin
R
d
Seco
nd
Line
Seco
nd
Line
Seco
nd
Line
Cre
ditv
iew
R
dC
red
itvie
w
Rd
Cre
ditv
iew
R
d
Mis
siss
aug
a
Rd
Mis
siss
aug
a
Rd
Mis
siss
aug
a
Rd
Hw
y 41
0H
wy
410
Hw
y 41
0
Hwy 401Hwy 401Hwy 401
Hwy 403Hwy 403Hwy 403
Hw
y 40
3H
wy
403
Hw
y 40
3
Queen Elizabeth WayQueen Elizabeth WayQueen Elizabeth Way
Nin
th
Li
neN
inth
Line
Nin
th
Li
ne
Bra
mal
eaR
dB
ram
alea
Rd
Bra
mal
eaR
d
Win
ston
PkWin
ston
PkWin
ston
Pk
CoopersCoopersCoopers
MathesonMathesonMatheson Rose
Che
rry
Rose
Che
rry
Rose
Che
rryKen
ned
yK
enne
dy
Ken
ned
y
Britannia W
Britannia W
Britannia W
Thomas Thomas Thomas
Erin CentreErin CentreErin Centre
Courtneypark DrCourtneypark DrCourtneypark Dr
Dundas StDundas StDundas St
Homelands
Homelands
Homelands
Sout
hdow
n R
dSo
uthd
own
Rd
Sout
hdow
n R
d
Lakeshore RdLakeshore RdLakeshore Rd
OrrOrrOrr Inve
rhou
seIn
verh
ouse
Inve
rhou
se
Tent
h L
ine
WTe
nth
Lin
e W
Tent
h L
ine
W
Argentia Rd
Argentia Rd
Argentia Rd W W W
Aquitaine A
ve
Aquitaine A
ve
Aquitaine A
ve
Chu
rchi
llM
ead
ows
Chu
rchi
llM
ead
ows
Chu
rchi
llM
ead
ows
ErinCentre
ErinCentre
ErinCentre Te
nth
Line
WTe
nth
Line
WTe
nth
Line
W
RexdaleRexdaleRexdale
BlvdBlvdBlvd
Dixon Rd
Dixon Rd
Dixon Rd
Trel
aw
ny Cir
Trel
aw
ny Cir
Trel
aw
ny Cir
Osprey B
lvd
Osprey B
lvd
Osprey B
lvd
CopenhagenCopenhagenCopenhagen
Erin
M
ills
Pky
Erin
M
ills
Pky
Erin
M
ills
Pky
Bristol Rd W
Bristol Rd W
Bristol Rd W
Meadows Hw
y 42
7
Hw
y 42
7
Hw
y 42
7
Hw
y 27
Hw
y 27
Hw
y 27
Hw
y 42
7
Hw
y 42
7
Hw
y 42
7
Plymouth DrPlymouth DrPlymouth Dr
Gle
n E
rin D
rG
len
Erin
Dr
Gle
n E
rin D
r
The CollegewayThe CollegewayThe Collegeway
The
Cre
dit
Woo
dlan
dsTh
e C
red
it W
oodl
ands
The
Cre
dit
Woo
dlan
ds
Centr al Pky
E
Centr al Pky
E
Centr al Pky
EConfederation
Confederation
Confederation
Cent ral Pky W
Cent ral Pky W
Cent ral Pky W
Mississauga Val
leyMississauga Val
leyMississauga Val
ley
Meyerside DrMeyerside DrMeyerside Dr
Fin
ancial
Fin
ancial
Fin
ancial
Mid-wayMid-wayMid-way
CourtneyparkCourtneyparkCourtneypark
Win
ston
Chu
rchi
ll B
lvd
Win
ston
Chu
rchi
ll B
lvd
Win
ston
Chu
rchi
ll B
lvd
SuperiorSuperiorSuperior
Edw
ard
sEd
war
ds
Edw
ard
s
Macdonald Cartier Freeway
Macdonald Cartier Freeway
Macdonald Cartier Freeway
TopflightTopflightTopflight
Eglinton Ave EEglinton Ave EEglinton Ave E
St
Rathburn Rd WRathburn Rd WRathburn Rd W
Webb
Eastgate PkyEastgate Pky
Bris
tol C
irB
risto
l Cir
Bris
tol C
ir
Evans Ave
Evans Ave
Evans Ave
The Queensway
The Queensway
The Queensway
Millcreek D
rM
illcreek Dr
Millcreek D
r
KingKingKing
Cre
ekb
ank
Rd
Cre
ekb
ank
Rd
AmericanAmericanAmerican
BancroftBancroftBancroft
DrDrDr
Sunday Service
TTC46
BT18
OT24
Regular Route
MiExpress RouteAll Day Service
Route Number
Oakville Transit Route
Brampton Transit Route
TTC Bus Route
GO Train & Station
Connecting Transit Services
1
Clarkson
MiWay Route Service Types
Effective: October 28, 2019
All MiWay routes are fully accessible with low floor, wheelchair accessible buses
Map Symbols
Transitway Station
Mississauga Transitway
Key Transit Stops
Starwood Group Inc. Traffic Impact Study
6719 Glen Erin Drive, City of Mississauga October 2021
C.F. Crozier & Associates Inc.
Project No. 1886-5590
APPENDIX C
Traffic Data
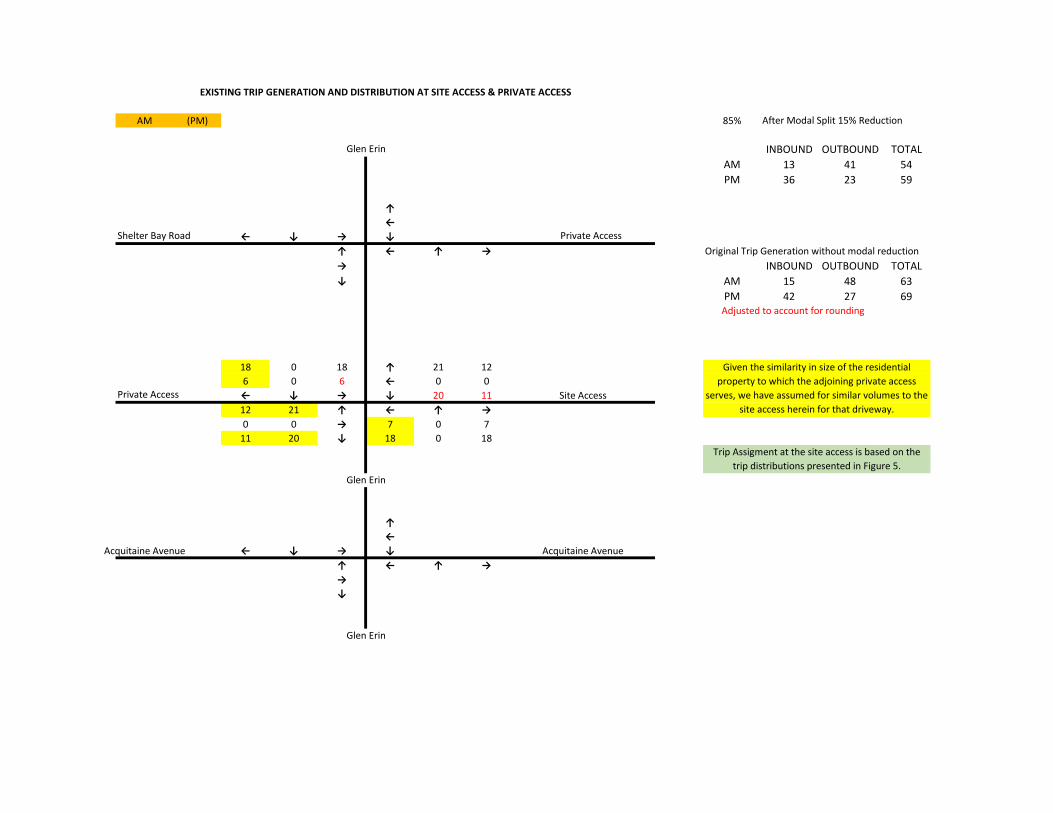
AM (PM) 85% After Modal Split 15% Reduction
INBOUND OUTBOUND TOTAL
AM 13 41 54
PM 36 23 59
↑
←Shelter Bay Road ← ↓ → ↓ Private Access
↑ ← ↑ → Original Trip Generation without modal reduction
→ INBOUND OUTBOUND TOTAL
↓ AM 15 48 63
PM 42 27 69
18 0 18 ↑ 21 12
6 0 6 ← 0 0Private Access ← ↓ → ↓ 20 11 Site Access
12 21 ↑ ← ↑ →
0 0 → 7 0 7
11 20 ↓ 18 0 18
↑
←
Acquitaine Avenue ← ↓ → ↓ Acquitaine Avenue
↑ ← ↑ →
→
↓
Glen Erin
Adjusted to account for rounding
Glen Erin
Glen Erin
Given the similarity in size of the residential
property to which the adjoining private access
serves, we have assumed for similar volumes to the
site access herein for that driveway.
EXISTING TRIP GENERATION AND DISTRIBUTION AT SITE ACCESS & PRIVATE ACCESS
Trip Assigment at the site access is based on the
trip distributions presented in Figure 5.
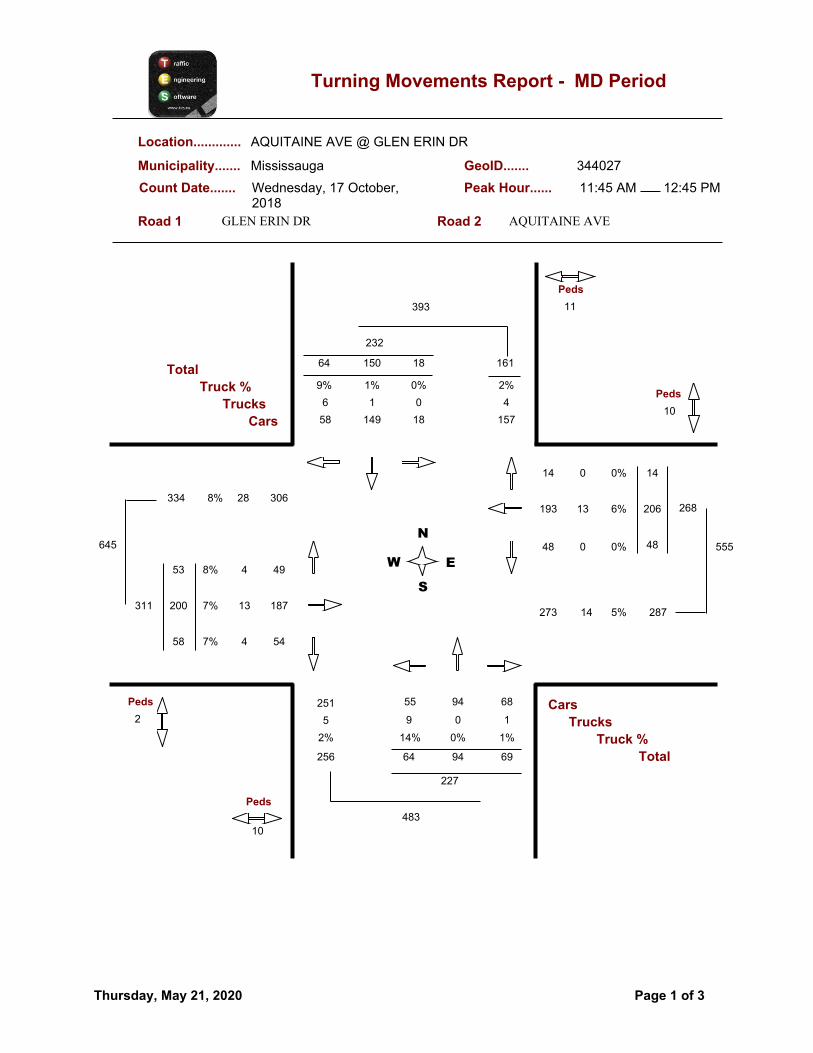
Count Date.......
Turning Movements Report -
Location............. AQUITAINE AVE @ GLEN ERIN DR
MississaugaMunicipality.......
Wednesday, 17 October,2018
344027GeoID.......
12:45 PM11:45 AM
MD Period
Peak Hour......
Road 2 AQUITAINE AVERoad 1 GLEN ERIN DR
Peds
Truck %
Trucks
Cars
Trucks
Cars
S
N
EW
Truck %
157
393
Total
6%193 13
48 0 0%
0 0%14
48
206
14
268
273 14 287
555
13
7%
7%
4
498%
54
4
58
200
53
28 306334
Total
645
251
Peds
483
Peds
10
2
Peds
10
11
18
0
0%
64
6
150
1
1%9%
232
161
2%
4
227
256
2%
5
64
14%
9
1814958
55 68
69
1%
1
94
0
0%
94
311 187
8%
5%
Page 1 of 3Thursday, May 21, 2020
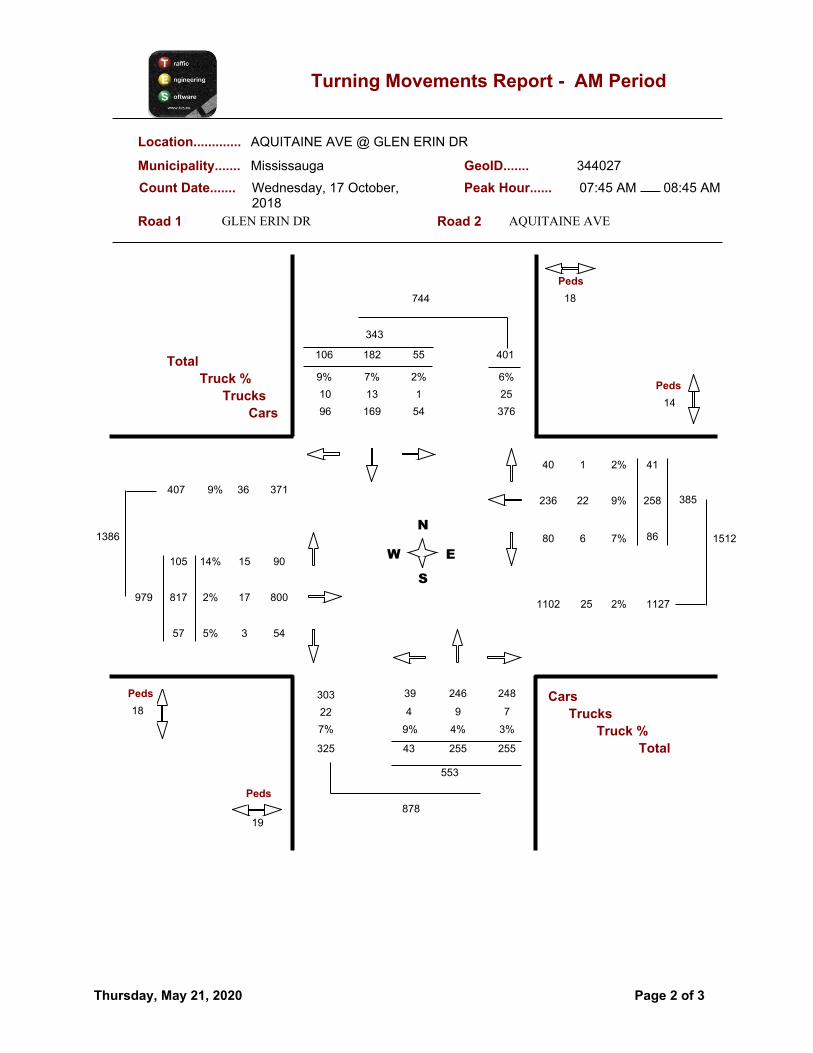
Count Date.......
Turning Movements Report -
Location............. AQUITAINE AVE @ GLEN ERIN DR
MississaugaMunicipality.......
Wednesday, 17 October,2018
344027GeoID.......
08:45 AM07:45 AM
AM Period
Peak Hour......
Road 2 AQUITAINE AVERoad 1 GLEN ERIN DR
Peds
Truck %
Trucks
Cars
Trucks
Cars
S
N
EW
Truck %
376
744
Total
9%236 22
80 6 7%
1 2%40
86
258
41
385
1102 25 1127
1512
17
5%
2%
3
9014%
54
15
57
817
105
36 371407
Total
1386
303
Peds
878
Peds
19
18
Peds
14
18
55
1
2%
106
10
182
13
7%9%
343
401
6%
25
553
325
7%
22
43
9%
4
5416996
39 248
255
3%
7
246
9
4%
255
979 800
9%
2%
Page 2 of 3Thursday, May 21, 2020
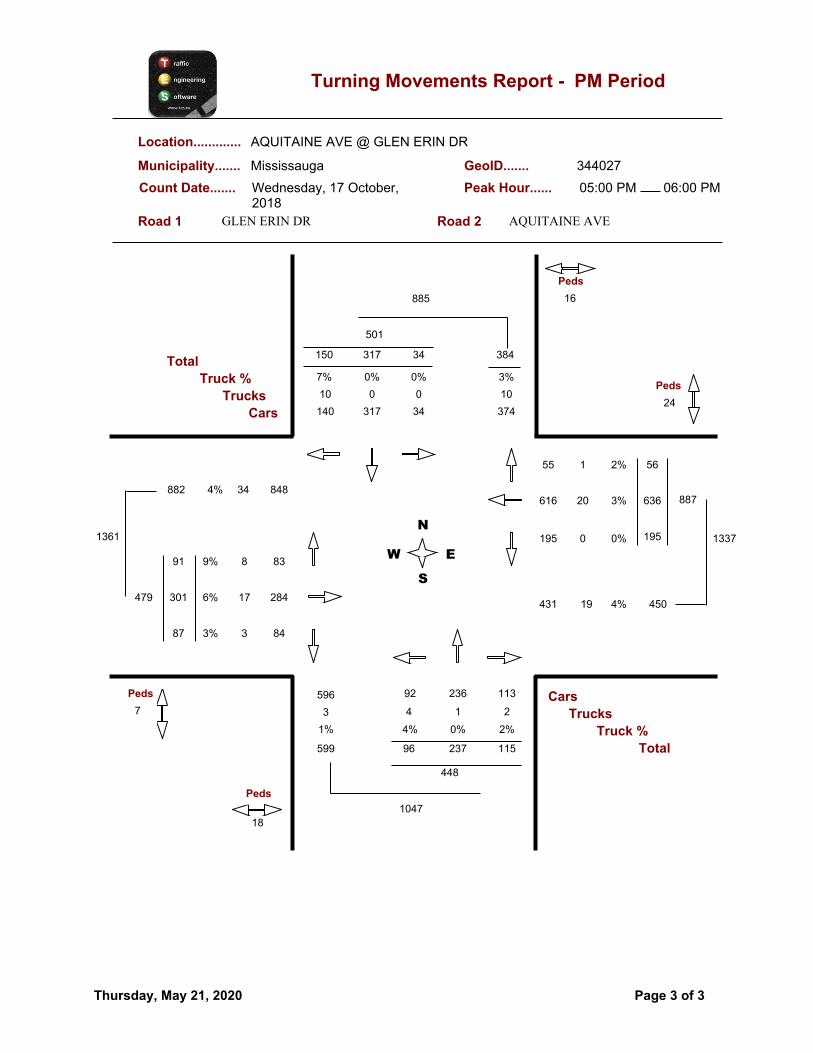
Count Date.......
Turning Movements Report -
Location............. AQUITAINE AVE @ GLEN ERIN DR
MississaugaMunicipality.......
Wednesday, 17 October,2018
344027GeoID.......
06:00 PM05:00 PM
PM Period
Peak Hour......
Road 2 AQUITAINE AVERoad 1 GLEN ERIN DR
Peds
Truck %
Trucks
Cars
Trucks
Cars
S
N
EW
Truck %
374
885
Total
3%616 20
195 0 0%
1 2%55
195
636
56
887
431 19 450
1337
17
3%
6%
3
839%
84
8
87
301
91
34 848882
Total
1361
596
Peds
1047
Peds
18
7
Peds
24
16
34
0
0%
150
10
317
0
0%7%
501
384
3%
10
448
599
1%
3
96
4%
4
34317140
92 113
115
2%
2
236
1
0%
237
479 284
4%
4%
Page 3 of 3Thursday, May 21, 2020
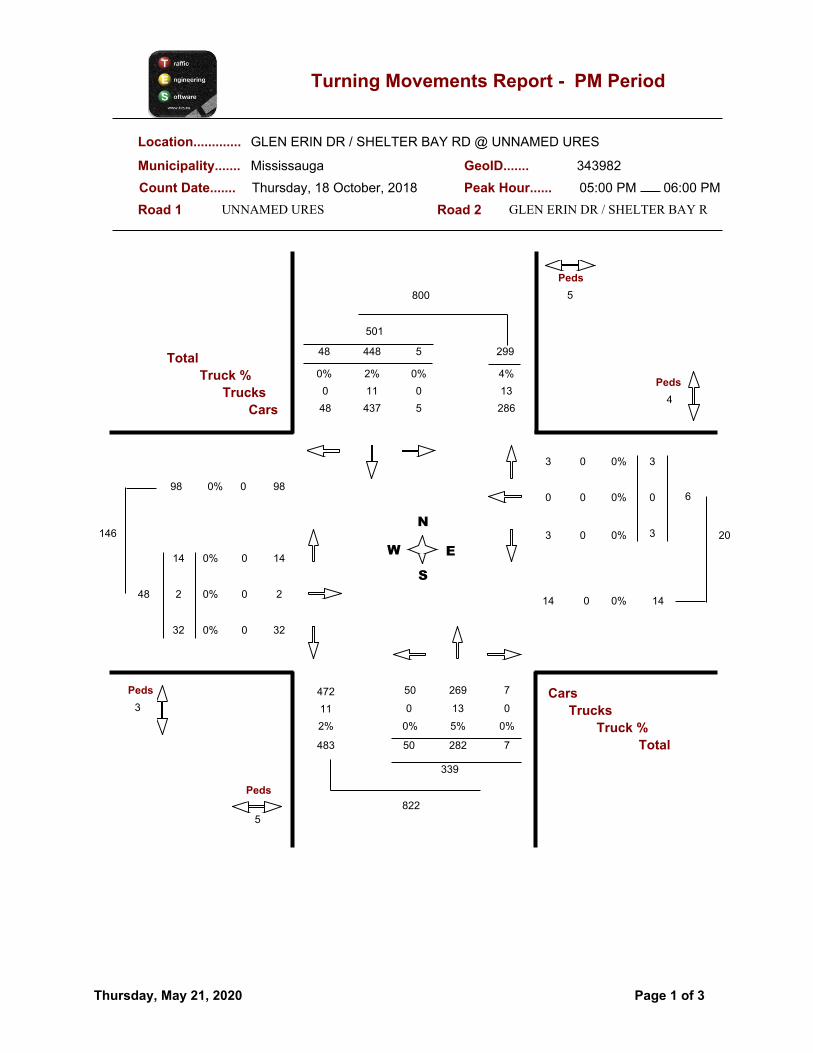
Count Date.......
Turning Movements Report -
Location............. GLEN ERIN DR / SHELTER BAY RD @ UNNAMED URES
MississaugaMunicipality.......
Thursday, 18 October, 2018
343982GeoID.......
06:00 PM05:00 PM
PM Period
Peak Hour......
Road 2 GLEN ERIN DR / SHELTER BAY RRoad 1 UNNAMED URES
Peds
Truck %
Trucks
Cars
Trucks
Cars
S
N
EW
Truck %
286
800
Total
0%0 0
3 0 0%
0 0%3
3
0
3
6
14 0 14
20
0
0%
0%
0
140%
32
0
32
2
14
0 9898
Total
146
472
Peds
822
Peds
5
3
Peds
4
5
5
0
0%
48
0
448
11
2%0%
501
299
4%
13
339
483
2%
11
50
0%
0
543748
50 7
7
0%
0
269
13
5%
282
48 2
0%
0%
Page 1 of 3Thursday, May 21, 2020
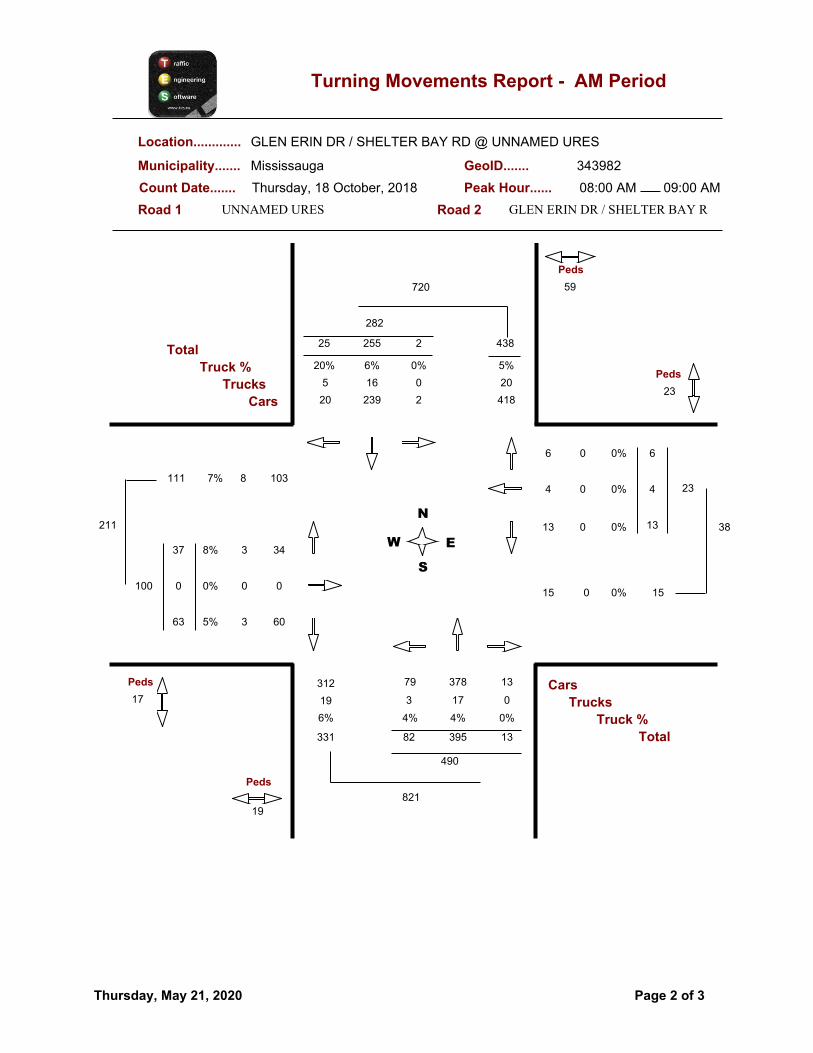
Count Date.......
Turning Movements Report -
Location............. GLEN ERIN DR / SHELTER BAY RD @ UNNAMED URES
MississaugaMunicipality.......
Thursday, 18 October, 2018
343982GeoID.......
09:00 AM08:00 AM
AM Period
Peak Hour......
Road 2 GLEN ERIN DR / SHELTER BAY RRoad 1 UNNAMED URES
Peds
Truck %
Trucks
Cars
Trucks
Cars
S
N
EW
Truck %
418
720
Total
0%4 0
13 0 0%
0 0%6
13
4
6
23
15 0 15
38
0
5%
0%
3
348%
60
3
63
0
37
8 103111
Total
211
312
Peds
821
Peds
19
17
Peds
23
59
2
0
0%
25
5
255
16
6%20%
282
438
5%
20
490
331
6%
19
82
4%
3
223920
79 13
13
0%
0
378
17
4%
395
100 0
7%
0%
Page 2 of 3Thursday, May 21, 2020

Count Date.......
Turning Movements Report -
Location............. GLEN ERIN DR / SHELTER BAY RD @ UNNAMED URES
MississaugaMunicipality.......
Thursday, 18 October, 2018
343982GeoID.......
01:15 PM12:15 PM
MD Period
Peak Hour......
Road 2 GLEN ERIN DR / SHELTER BAY RRoad 1 UNNAMED URES
Peds
Truck %
Trucks
Cars
Trucks
Cars
S
N
EW
Truck %
168
370
Total
0%1 0
4 0 0%
0 0%1
4
1
1
6
14 0 14
20
0
12%
0%
3
147%
22
1
25
1
15
5 4247
Total
88
194
Peds
398
Peds
1
8
Peds
8
6
3
0
0%
19
3
174
6
3%16%
196
174
3%
6
195
203
4%
9
27
7%
2
316816
25 10
10
0%
0
153
5
3%
158
41 1
11%
0%
Page 3 of 3Thursday, May 21, 2020
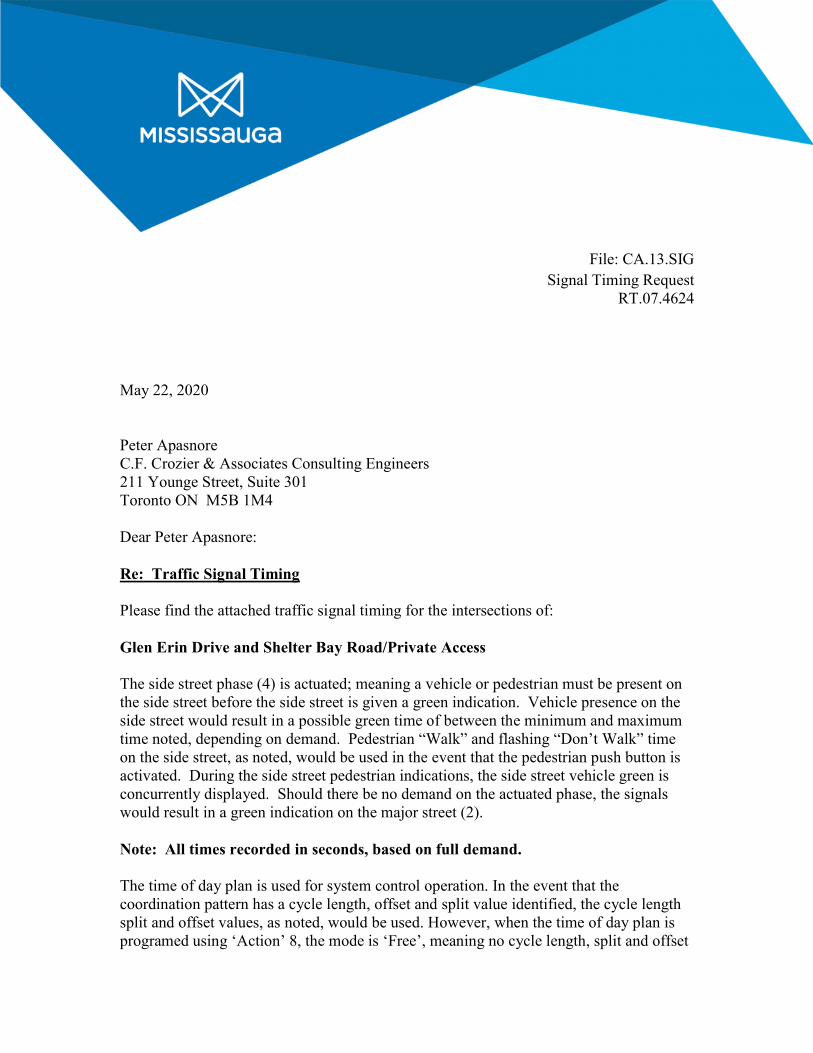
File: CA.13.SIG
Signal Timing Request RT.07.4624
May 22, 2020 Peter Apasnore C.F. Crozier & Associates Consulting Engineers 211 Younge Street, Suite 301 Toronto ON M5B 1M4 Dear Peter Apasnore: Re: Traffic Signal Timing Please find the attached traffic signal timing for the intersections of: Glen Erin Drive and Shelter Bay Road/Private Access The side street phase (4) is actuated; meaning a vehicle or pedestrian must be present on the side street before the side street is given a green indication. Vehicle presence on the side street would result in a possible green time of between the minimum and maximum time noted, depending on demand. Pedestrian “Walk” and flashing “Don’t Walk” time on the side street, as noted, would be used in the event that the pedestrian push button is activated. During the side street pedestrian indications, the side street vehicle green is concurrently displayed. Should there be no demand on the actuated phase, the signals would result in a green indication on the major street (2). Note: All times recorded in seconds, based on full demand. The time of day plan is used for system control operation. In the event that the coordination pattern has a cycle length, offset and split value identified, the cycle length split and offset values, as noted, would be used. However, when the time of day plan is programed using ‘Action’ 8, the mode is ‘Free’, meaning no cycle length, split and offset
Peter Apasnore Re: Traffic Signal Timing May 22, 2020 2 values are given and the intersection operates using the phase timings provided in the report. Should you require further information, please contact Ken Moore, at 905-615-3200 ext. 4054. Sincerely, Ken Moore Coordinator, Traffic Systems and ITS Traffic Signals and Street Lighting Transportation and Works Department City of Mississauga 905-615-3200 ext. 4054 [email protected] c: Javed Khan, Manager, Traffic Signals and Street Lighting
Jim Kartsomanis, Supervisor, Traffic Systems and ITS

Starwood Group Inc. Traffic Impact Study
6719 Glen Erin Drive, City of Mississauga October 2021
C.F. Crozier & Associates Inc.
Project No. 1886-5590
APPENDIX D
Levels of Service Definitions
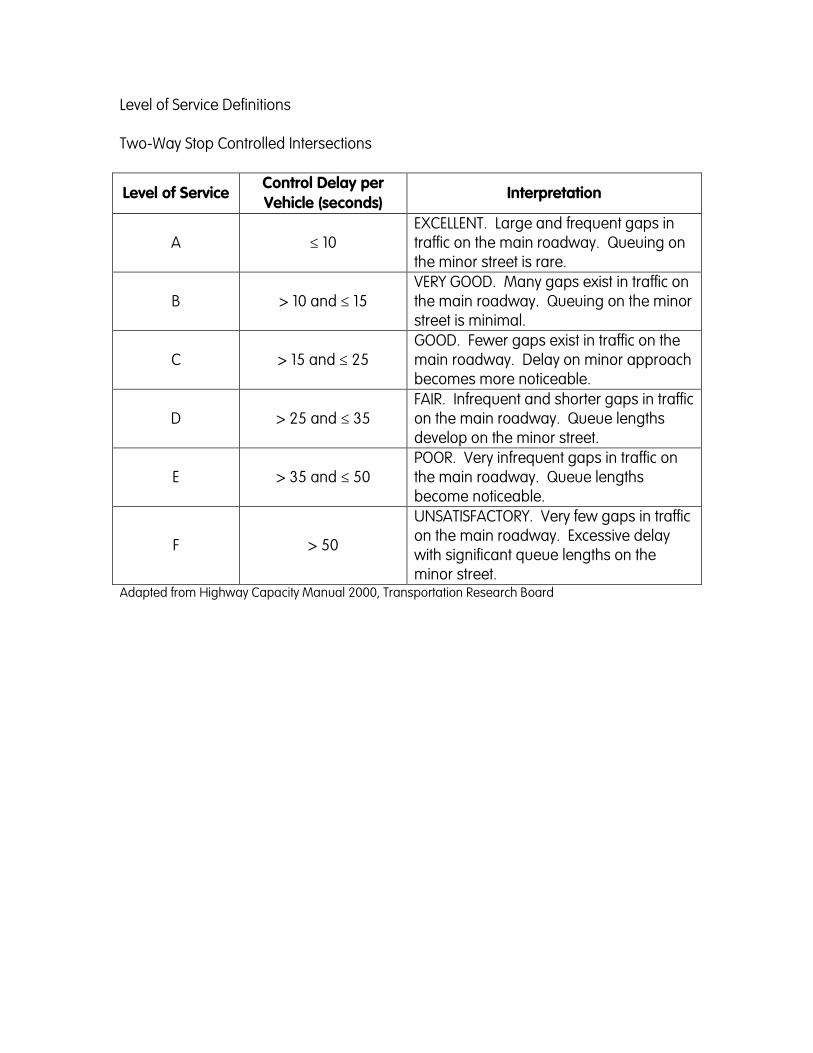
Level of Service Definitions Two-Way Stop Controlled Intersections
Level of Service Control Delay per
Vehicle (seconds) Interpretation
A ≤ 10 EXCELLENT. Large and frequent gaps in traffic on the main roadway. Queuing on the minor street is rare.
B > 10 and ≤ 15 VERY GOOD. Many gaps exist in traffic on the main roadway. Queuing on the minor street is minimal.
C > 15 and ≤ 25 GOOD. Fewer gaps exist in traffic on the main roadway. Delay on minor approach becomes more noticeable.
D > 25 and ≤ 35 FAIR. Infrequent and shorter gaps in traffic on the main roadway. Queue lengths develop on the minor street.
E > 35 and ≤ 50 POOR. Very infrequent gaps in traffic on the main roadway. Queue lengths become noticeable.
F > 50
UNSATISFACTORY. Very few gaps in traffic on the main roadway. Excessive delay with significant queue lengths on the minor street.
Adapted from Highway Capacity Manual 2000, Transportation Research Board
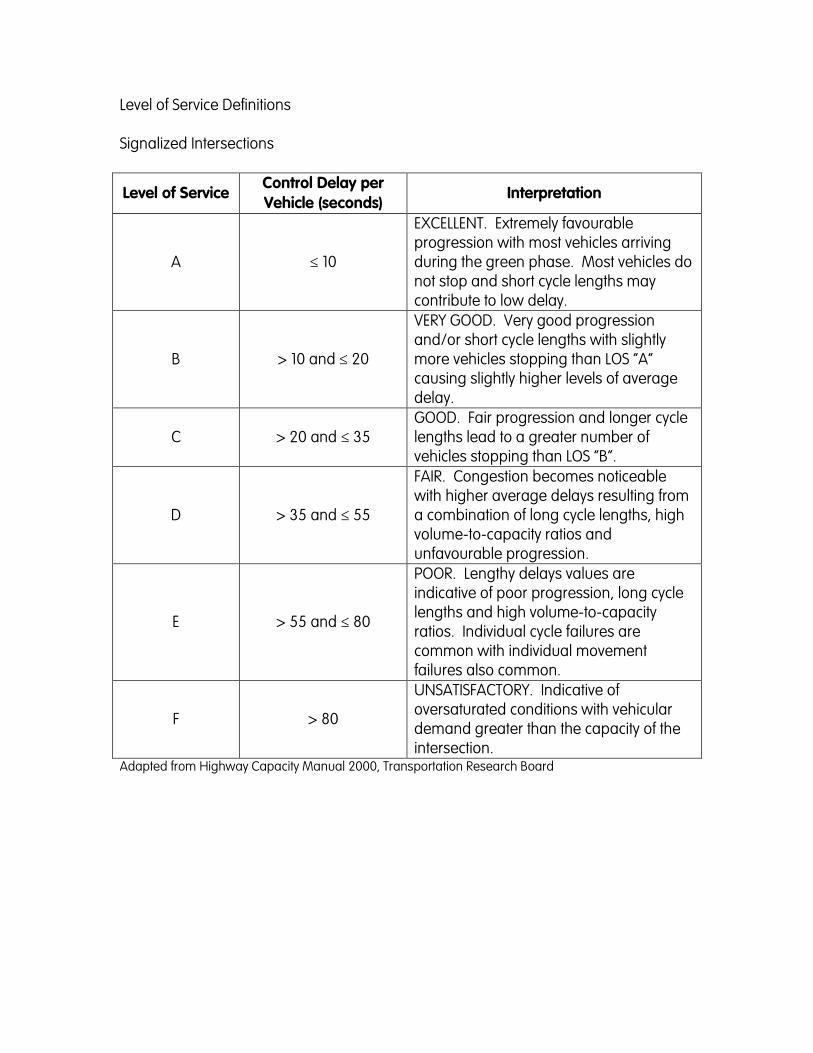
Level of Service Definitions Signalized Intersections
Level of Service Control Delay per
Vehicle (seconds) Interpretation
A ≤ 10
EXCELLENT. Extremely favourable progression with most vehicles arriving during the green phase. Most vehicles do not stop and short cycle lengths may contribute to low delay.
B > 10 and ≤ 20
VERY GOOD. Very good progression and/or short cycle lengths with slightly more vehicles stopping than LOS “A” causing slightly higher levels of average delay.
C > 20 and ≤ 35 GOOD. Fair progression and longer cycle lengths lead to a greater number of vehicles stopping than LOS “B”.
D > 35 and ≤ 55
FAIR. Congestion becomes noticeable with higher average delays resulting from a combination of long cycle lengths, high volume-to-capacity ratios and unfavourable progression.
E > 55 and ≤ 80
POOR. Lengthy delays values are indicative of poor progression, long cycle lengths and high volume-to-capacity ratios. Individual cycle failures are common with individual movement failures also common.
F > 80
UNSATISFACTORY. Indicative of oversaturated conditions with vehicular demand greater than the capacity of the intersection.
Adapted from Highway Capacity Manual 2000, Transportation Research Board
Starwood Group Inc. Traffic Impact Study
6719 Glen Erin Drive, City of Mississauga October 2021
C.F. Crozier & Associates Inc.
Project No. 1886-5590
APPENDIX E
Detailed Capacity Analysis
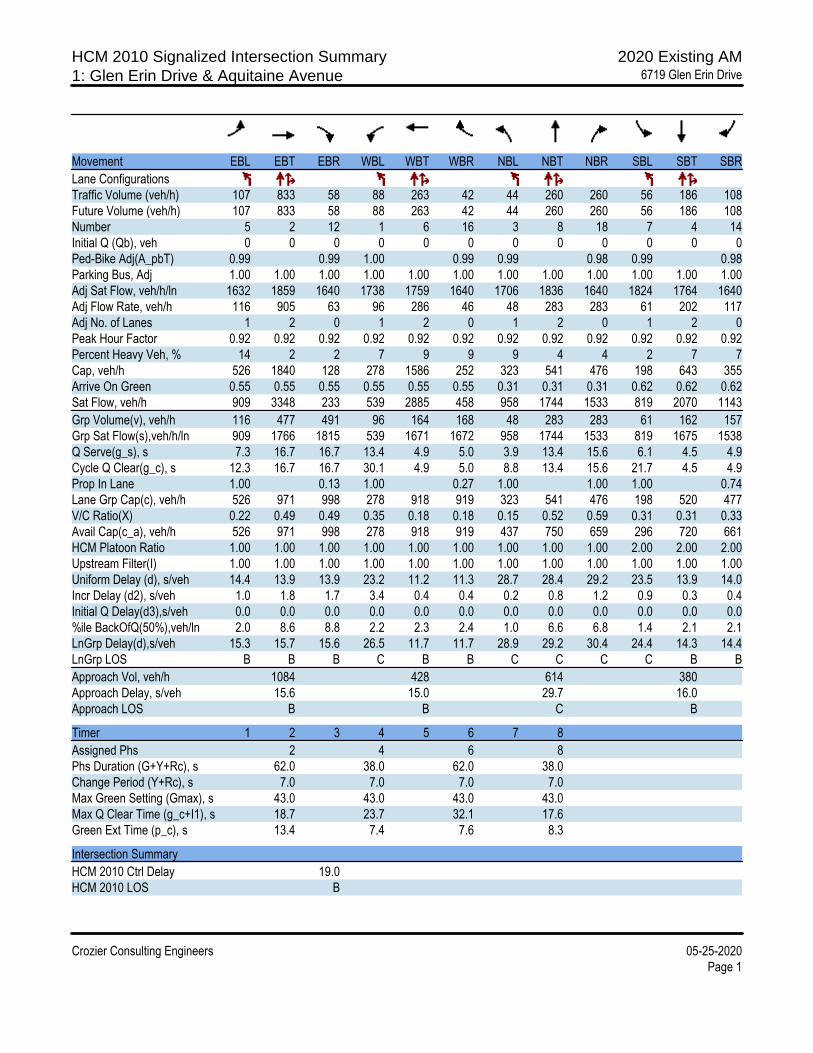
HCM 2010 Signalized Intersection Summary 2020 Existing AM1: Glen Erin Drive & Aquitaine Avenue 6719 Glen Erin Drive
Crozier Consulting Engineers 05-25-2020Page 1
Movement EBL EBT EBR WBL WBT WBR NBL NBT NBR SBL SBT SBR
Lane ConfigurationsTraffic Volume (veh/h) 107 833 58 88 263 42 44 260 260 56 186 108Future Volume (veh/h) 107 833 58 88 263 42 44 260 260 56 186 108Number 5 2 12 1 6 16 3 8 18 7 4 14Initial Q (Qb), veh 0 0 0 0 0 0 0 0 0 0 0 0Ped-Bike Adj(A_pbT) 0.99 0.99 1.00 0.99 0.99 0.98 0.99 0.98Parking Bus, Adj 1.00 1.00 1.00 1.00 1.00 1.00 1.00 1.00 1.00 1.00 1.00 1.00Adj Sat Flow, veh/h/ln 1632 1859 1640 1738 1759 1640 1706 1836 1640 1824 1764 1640Adj Flow Rate, veh/h 116 905 63 96 286 46 48 283 283 61 202 117Adj No. of Lanes 1 2 0 1 2 0 1 2 0 1 2 0Peak Hour Factor 0.92 0.92 0.92 0.92 0.92 0.92 0.92 0.92 0.92 0.92 0.92 0.92Percent Heavy Veh, % 14 2 2 7 9 9 9 4 4 2 7 7Cap, veh/h 526 1840 128 278 1586 252 323 541 476 198 643 355Arrive On Green 0.55 0.55 0.55 0.55 0.55 0.55 0.31 0.31 0.31 0.62 0.62 0.62Sat Flow, veh/h 909 3348 233 539 2885 458 958 1744 1533 819 2070 1143
Grp Volume(v), veh/h 116 477 491 96 164 168 48 283 283 61 162 157Grp Sat Flow(s),veh/h/ln 909 1766 1815 539 1671 1672 958 1744 1533 819 1675 1538Q Serve(g_s), s 7.3 16.7 16.7 13.4 4.9 5.0 3.9 13.4 15.6 6.1 4.5 4.9Cycle Q Clear(g_c), s 12.3 16.7 16.7 30.1 4.9 5.0 8.8 13.4 15.6 21.7 4.5 4.9Prop In Lane 1.00 0.13 1.00 0.27 1.00 1.00 1.00 0.74Lane Grp Cap(c), veh/h 526 971 998 278 918 919 323 541 476 198 520 477V/C Ratio(X) 0.22 0.49 0.49 0.35 0.18 0.18 0.15 0.52 0.59 0.31 0.31 0.33Avail Cap(c_a), veh/h 526 971 998 278 918 919 437 750 659 296 720 661HCM Platoon Ratio 1.00 1.00 1.00 1.00 1.00 1.00 1.00 1.00 1.00 2.00 2.00 2.00Upstream Filter(I) 1.00 1.00 1.00 1.00 1.00 1.00 1.00 1.00 1.00 1.00 1.00 1.00Uniform Delay (d), s/veh 14.4 13.9 13.9 23.2 11.2 11.3 28.7 28.4 29.2 23.5 13.9 14.0Incr Delay (d2), s/veh 1.0 1.8 1.7 3.4 0.4 0.4 0.2 0.8 1.2 0.9 0.3 0.4Initial Q Delay(d3),s/veh 0.0 0.0 0.0 0.0 0.0 0.0 0.0 0.0 0.0 0.0 0.0 0.0%ile BackOfQ(50%),veh/ln 2.0 8.6 8.8 2.2 2.3 2.4 1.0 6.6 6.8 1.4 2.1 2.1LnGrp Delay(d),s/veh 15.3 15.7 15.6 26.5 11.7 11.7 28.9 29.2 30.4 24.4 14.3 14.4LnGrp LOS B B B C B B C C C C B B
Approach Vol, veh/h 1084 428 614 380Approach Delay, s/veh 15.6 15.0 29.7 16.0Approach LOS B B C B
Timer 1 2 3 4 5 6 7 8
Assigned Phs 2 4 6 8Phs Duration (G+Y+Rc), s 62.0 38.0 62.0 38.0Change Period (Y+Rc), s 7.0 7.0 7.0 7.0Max Green Setting (Gmax), s 43.0 43.0 43.0 43.0Max Q Clear Time (g_c+I1), s 18.7 23.7 32.1 17.6Green Ext Time (p_c), s 13.4 7.4 7.6 8.3
Intersection Summary
HCM 2010 Ctrl Delay 19.0HCM 2010 LOS B
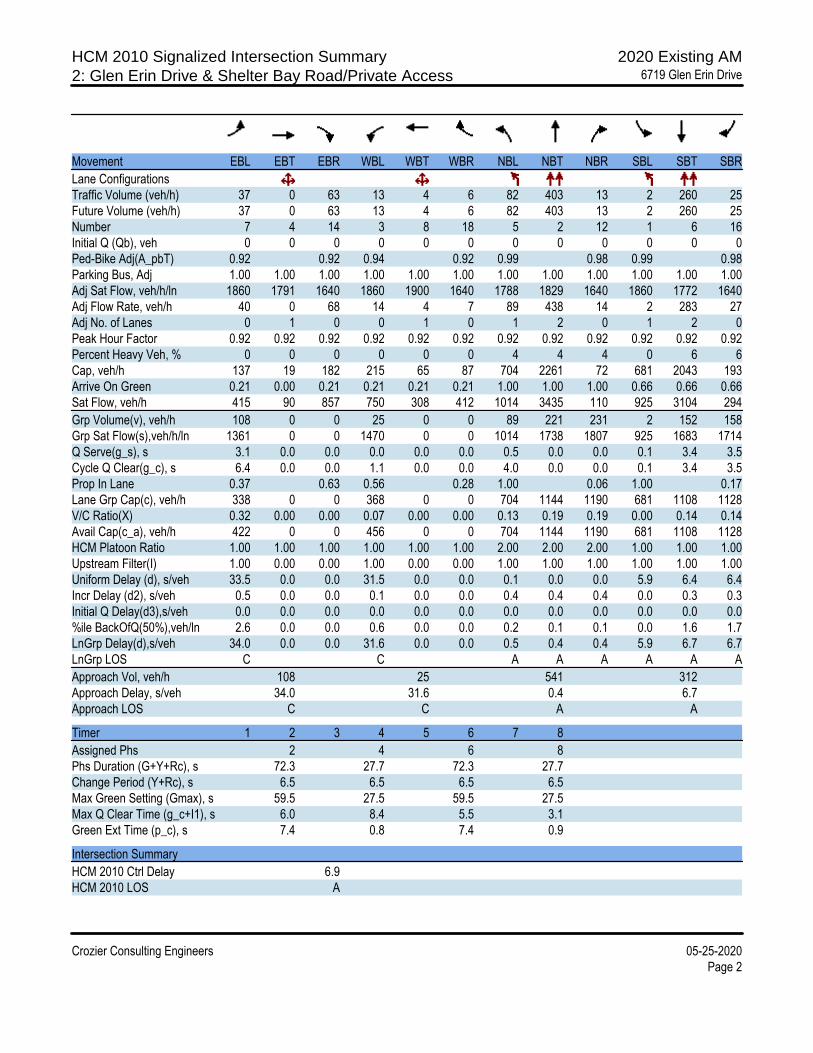
HCM 2010 Signalized Intersection Summary 2020 Existing AM2: Glen Erin Drive & Shelter Bay Road/Private Access 6719 Glen Erin Drive
Crozier Consulting Engineers 05-25-2020Page 2
Movement EBL EBT EBR WBL WBT WBR NBL NBT NBR SBL SBT SBR
Lane ConfigurationsTraffic Volume (veh/h) 37 0 63 13 4 6 82 403 13 2 260 25Future Volume (veh/h) 37 0 63 13 4 6 82 403 13 2 260 25Number 7 4 14 3 8 18 5 2 12 1 6 16Initial Q (Qb), veh 0 0 0 0 0 0 0 0 0 0 0 0Ped-Bike Adj(A_pbT) 0.92 0.92 0.94 0.92 0.99 0.98 0.99 0.98Parking Bus, Adj 1.00 1.00 1.00 1.00 1.00 1.00 1.00 1.00 1.00 1.00 1.00 1.00Adj Sat Flow, veh/h/ln 1860 1791 1640 1860 1900 1640 1788 1829 1640 1860 1772 1640Adj Flow Rate, veh/h 40 0 68 14 4 7 89 438 14 2 283 27Adj No. of Lanes 0 1 0 0 1 0 1 2 0 1 2 0Peak Hour Factor 0.92 0.92 0.92 0.92 0.92 0.92 0.92 0.92 0.92 0.92 0.92 0.92Percent Heavy Veh, % 0 0 0 0 0 0 4 4 4 0 6 6Cap, veh/h 137 19 182 215 65 87 704 2261 72 681 2043 193Arrive On Green 0.21 0.00 0.21 0.21 0.21 0.21 1.00 1.00 1.00 0.66 0.66 0.66Sat Flow, veh/h 415 90 857 750 308 412 1014 3435 110 925 3104 294
Grp Volume(v), veh/h 108 0 0 25 0 0 89 221 231 2 152 158Grp Sat Flow(s),veh/h/ln 1361 0 0 1470 0 0 1014 1738 1807 925 1683 1714Q Serve(g_s), s 3.1 0.0 0.0 0.0 0.0 0.0 0.5 0.0 0.0 0.1 3.4 3.5Cycle Q Clear(g_c), s 6.4 0.0 0.0 1.1 0.0 0.0 4.0 0.0 0.0 0.1 3.4 3.5Prop In Lane 0.37 0.63 0.56 0.28 1.00 0.06 1.00 0.17Lane Grp Cap(c), veh/h 338 0 0 368 0 0 704 1144 1190 681 1108 1128V/C Ratio(X) 0.32 0.00 0.00 0.07 0.00 0.00 0.13 0.19 0.19 0.00 0.14 0.14Avail Cap(c_a), veh/h 422 0 0 456 0 0 704 1144 1190 681 1108 1128HCM Platoon Ratio 1.00 1.00 1.00 1.00 1.00 1.00 2.00 2.00 2.00 1.00 1.00 1.00Upstream Filter(I) 1.00 0.00 0.00 1.00 0.00 0.00 1.00 1.00 1.00 1.00 1.00 1.00Uniform Delay (d), s/veh 33.5 0.0 0.0 31.5 0.0 0.0 0.1 0.0 0.0 5.9 6.4 6.4Incr Delay (d2), s/veh 0.5 0.0 0.0 0.1 0.0 0.0 0.4 0.4 0.4 0.0 0.3 0.3Initial Q Delay(d3),s/veh 0.0 0.0 0.0 0.0 0.0 0.0 0.0 0.0 0.0 0.0 0.0 0.0%ile BackOfQ(50%),veh/ln 2.6 0.0 0.0 0.6 0.0 0.0 0.2 0.1 0.1 0.0 1.6 1.7LnGrp Delay(d),s/veh 34.0 0.0 0.0 31.6 0.0 0.0 0.5 0.4 0.4 5.9 6.7 6.7LnGrp LOS C C A A A A A A
Approach Vol, veh/h 108 25 541 312Approach Delay, s/veh 34.0 31.6 0.4 6.7Approach LOS C C A A
Timer 1 2 3 4 5 6 7 8
Assigned Phs 2 4 6 8Phs Duration (G+Y+Rc), s 72.3 27.7 72.3 27.7Change Period (Y+Rc), s 6.5 6.5 6.5 6.5Max Green Setting (Gmax), s 59.5 27.5 59.5 27.5Max Q Clear Time (g_c+I1), s 6.0 8.4 5.5 3.1Green Ext Time (p_c), s 7.4 0.8 7.4 0.9
Intersection Summary
HCM 2010 Ctrl Delay 6.9HCM 2010 LOS A

HCM 2010 TWSC 2020 Existing AM3: Glen Erin Drive & Private Access/Site Access 6719 Glen Erin Drive
Crozier Consulting Engineers 05-25-2020Page 1
Intersection
Int Delay, s/veh 1.4
Movement EBL EBT EBR WBL WBT WBR NBL NBT NBR SBL SBT SBR
Lane ConfigurationsTraffic Vol, veh/h 21 0 20 20 0 21 7 457 7 6 309 6Future Vol, veh/h 21 0 20 20 0 21 7 457 7 6 309 6Conflicting Peds, #/hr 0 0 0 0 0 0 0 0 0 0 0 0Sign Control Stop Stop Stop Stop Stop Stop Free Free Free Free Free FreeRT Channelized - - None - - None - - None - - NoneStorage Length - - - - - - 150 - - 350 - -Veh in Median Storage, # - 0 - - 0 - - 0 - - 0 -Grade, % - 0 - - 0 - - 0 - - 0 -Peak Hour Factor 92 92 92 92 92 92 92 92 92 92 92 92Heavy Vehicles, % 2 2 2 2 2 2 2 2 2 2 2 2Mvmt Flow 23 0 22 22 0 23 8 497 8 7 336 7
Major/Minor Minor2 Minor1 Major1 Major2
Conflicting Flow All 619 875 172 699 874 253 343 0 0 505 0 0 Stage 1 354 354 - 517 517 - - - - - - - Stage 2 265 521 - 182 357 - - - - - - -Critical Hdwy 7.54 6.54 6.94 7.54 6.54 6.94 4.14 - - 4.14 - -Critical Hdwy Stg 1 6.54 5.54 - 6.54 5.54 - - - - - - -Critical Hdwy Stg 2 6.54 5.54 - 6.54 5.54 - - - - - - -Follow-up Hdwy 3.52 4.02 3.32 3.52 4.02 3.32 2.22 - - 2.22 - -Pot Cap-1 Maneuver 373 286 842 327 287 746 1213 - - 1056 - - Stage 1 636 629 - 509 532 - - - - - - - Stage 2 717 530 - 802 627 - - - - - - -Platoon blocked, % - - - -Mov Cap-1 Maneuver 358 282 842 315 283 746 1213 - - 1056 - -Mov Cap-2 Maneuver 358 282 - 315 283 - - - - - - - Stage 1 632 625 - 505 528 - - - - - - - Stage 2 690 526 - 776 623 - - - - - - -
Approach EB WB NB SB
HCM Control Delay, s 13 13.9 0.1 0.2HCM LOS B B
Minor Lane/Major Mvmt NBL NBT NBR EBLn1WBLn1 SBL SBT SBR
Capacity (veh/h) 1213 - - 497 447 1056 - -HCM Lane V/C Ratio 0.006 - - 0.09 0.1 0.006 - -HCM Control Delay (s) 8 - - 13 13.9 8.4 - -HCM Lane LOS A - - B B A - -HCM 95th %tile Q(veh) 0 - - 0.3 0.3 0 - -

Timing Report, Sorted By Phase 2020 Existing AM1: Glen Erin Drive & Aquitaine Avenue 6719 Glen Erin Drive
Crozier Consulting Engineers 06-09-2020Page 1
Phase Number 2 4 6 8
Movement EBTL SBTL WBTL NBTLLead/LagLead-Lag OptimizeRecall Mode C-Max None C-Max NoneMaximum Split (s) 50 50 50 50Maximum Split (%) 50.0% 50.0% 50.0% 50.0%Minimum Split (s) 44 37 44 37Yellow Time (s) 4 4 4 4All-Red Time (s) 3 3 3 3Minimum Initial (s) 8 8 8 8Vehicle Extension (s) 3 3 3 3Minimum Gap (s) 3 3 3 3Time Before Reduce (s) 0 0 0 0Time To Reduce (s) 0 0 0 0Walk Time (s) 15 12 15 12Flash Dont Walk (s) 22 18 22 18Dual Entry Yes Yes Yes YesInhibit Max Yes Yes Yes YesStart Time (s) 90 40 90 40End Time (s) 40 90 40 90Yield/Force Off (s) 33 83 33 83Yield/Force Off 170(s) 11 65 11 65Local Start Time (s) 0 50 0 50Local Yield (s) 43 93 43 93Local Yield 170(s) 21 75 21 75
Intersection Summary
Cycle Length 100Control Type Actuated-CoordinatedNatural Cycle 85Offset: 90 (90%), Referenced to phase 2:EBTL and 6:WBTL, Start of Green
Splits and Phases: 1: Glen Erin Drive & Aquitaine Avenue
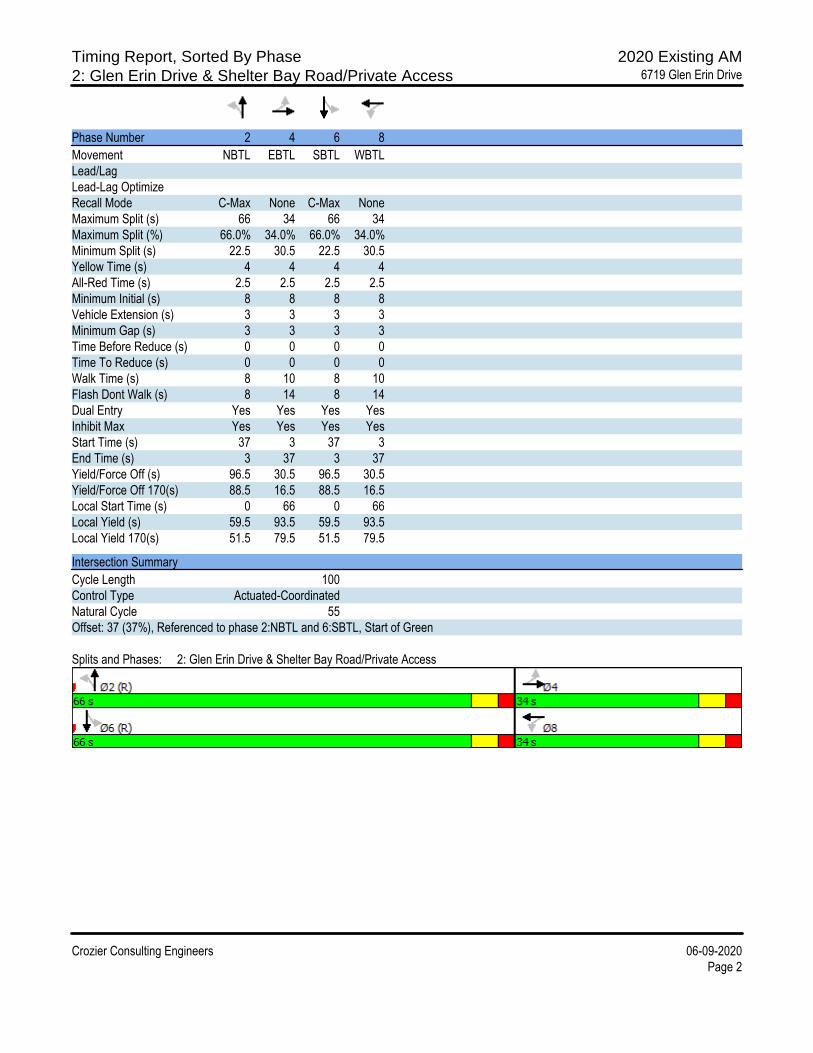
Timing Report, Sorted By Phase 2020 Existing AM2: Glen Erin Drive & Shelter Bay Road/Private Access 6719 Glen Erin Drive
Crozier Consulting Engineers 06-09-2020Page 2
Phase Number 2 4 6 8
Movement NBTL EBTL SBTL WBTLLead/LagLead-Lag OptimizeRecall Mode C-Max None C-Max NoneMaximum Split (s) 66 34 66 34Maximum Split (%) 66.0% 34.0% 66.0% 34.0%Minimum Split (s) 22.5 30.5 22.5 30.5Yellow Time (s) 4 4 4 4All-Red Time (s) 2.5 2.5 2.5 2.5Minimum Initial (s) 8 8 8 8Vehicle Extension (s) 3 3 3 3Minimum Gap (s) 3 3 3 3Time Before Reduce (s) 0 0 0 0Time To Reduce (s) 0 0 0 0Walk Time (s) 8 10 8 10Flash Dont Walk (s) 8 14 8 14Dual Entry Yes Yes Yes YesInhibit Max Yes Yes Yes YesStart Time (s) 37 3 37 3End Time (s) 3 37 3 37Yield/Force Off (s) 96.5 30.5 96.5 30.5Yield/Force Off 170(s) 88.5 16.5 88.5 16.5Local Start Time (s) 0 66 0 66Local Yield (s) 59.5 93.5 59.5 93.5Local Yield 170(s) 51.5 79.5 51.5 79.5
Intersection Summary
Cycle Length 100Control Type Actuated-CoordinatedNatural Cycle 55Offset: 37 (37%), Referenced to phase 2:NBTL and 6:SBTL, Start of Green
Splits and Phases: 2: Glen Erin Drive & Shelter Bay Road/Private Access
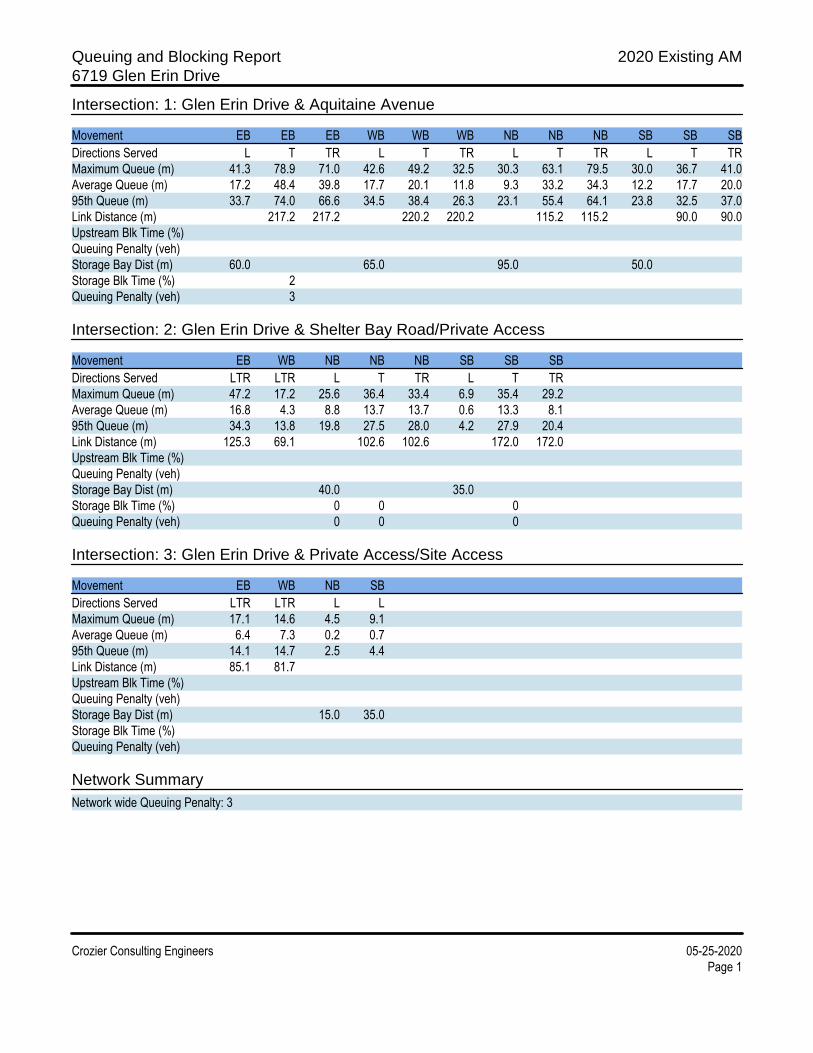
Queuing and Blocking Report 2020 Existing AM6719 Glen Erin Drive
Crozier Consulting Engineers 05-25-2020Page 1
Intersection: 1: Glen Erin Drive & Aquitaine Avenue
Movement EB EB EB WB WB WB NB NB NB SB SB SB
Directions Served L T TR L T TR L T TR L T TRMaximum Queue (m) 41.3 78.9 71.0 42.6 49.2 32.5 30.3 63.1 79.5 30.0 36.7 41.0Average Queue (m) 17.2 48.4 39.8 17.7 20.1 11.8 9.3 33.2 34.3 12.2 17.7 20.095th Queue (m) 33.7 74.0 66.6 34.5 38.4 26.3 23.1 55.4 64.1 23.8 32.5 37.0Link Distance (m) 217.2 217.2 220.2 220.2 115.2 115.2 90.0 90.0Upstream Blk Time (%)Queuing Penalty (veh)Storage Bay Dist (m) 60.0 65.0 95.0 50.0Storage Blk Time (%) 2Queuing Penalty (veh) 3
Intersection: 2: Glen Erin Drive & Shelter Bay Road/Private Access
Movement EB WB NB NB NB SB SB SB
Directions Served LTR LTR L T TR L T TRMaximum Queue (m) 47.2 17.2 25.6 36.4 33.4 6.9 35.4 29.2Average Queue (m) 16.8 4.3 8.8 13.7 13.7 0.6 13.3 8.195th Queue (m) 34.3 13.8 19.8 27.5 28.0 4.2 27.9 20.4Link Distance (m) 125.3 69.1 102.6 102.6 172.0 172.0Upstream Blk Time (%)Queuing Penalty (veh)Storage Bay Dist (m) 40.0 35.0Storage Blk Time (%) 0 0 0Queuing Penalty (veh) 0 0 0
Intersection: 3: Glen Erin Drive & Private Access/Site Access
Movement EB WB NB SB
Directions Served LTR LTR L LMaximum Queue (m) 17.1 14.6 4.5 9.1Average Queue (m) 6.4 7.3 0.2 0.795th Queue (m) 14.1 14.7 2.5 4.4Link Distance (m) 85.1 81.7Upstream Blk Time (%)Queuing Penalty (veh)Storage Bay Dist (m) 15.0 35.0Storage Blk Time (%)Queuing Penalty (veh)
Network Summary
Network wide Queuing Penalty: 3
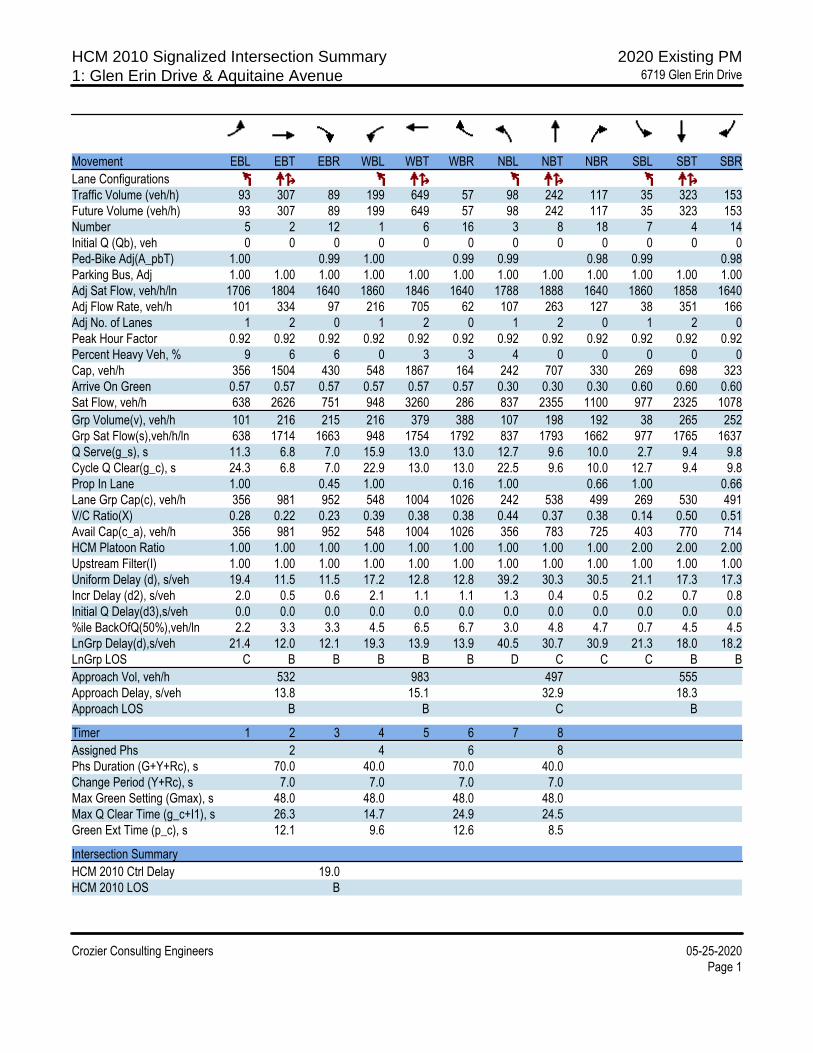
HCM 2010 Signalized Intersection Summary 2020 Existing PM1: Glen Erin Drive & Aquitaine Avenue 6719 Glen Erin Drive
Crozier Consulting Engineers 05-25-2020Page 1
Movement EBL EBT EBR WBL WBT WBR NBL NBT NBR SBL SBT SBR
Lane ConfigurationsTraffic Volume (veh/h) 93 307 89 199 649 57 98 242 117 35 323 153Future Volume (veh/h) 93 307 89 199 649 57 98 242 117 35 323 153Number 5 2 12 1 6 16 3 8 18 7 4 14Initial Q (Qb), veh 0 0 0 0 0 0 0 0 0 0 0 0Ped-Bike Adj(A_pbT) 1.00 0.99 1.00 0.99 0.99 0.98 0.99 0.98Parking Bus, Adj 1.00 1.00 1.00 1.00 1.00 1.00 1.00 1.00 1.00 1.00 1.00 1.00Adj Sat Flow, veh/h/ln 1706 1804 1640 1860 1846 1640 1788 1888 1640 1860 1858 1640Adj Flow Rate, veh/h 101 334 97 216 705 62 107 263 127 38 351 166Adj No. of Lanes 1 2 0 1 2 0 1 2 0 1 2 0Peak Hour Factor 0.92 0.92 0.92 0.92 0.92 0.92 0.92 0.92 0.92 0.92 0.92 0.92Percent Heavy Veh, % 9 6 6 0 3 3 4 0 0 0 0 0Cap, veh/h 356 1504 430 548 1867 164 242 707 330 269 698 323Arrive On Green 0.57 0.57 0.57 0.57 0.57 0.57 0.30 0.30 0.30 0.60 0.60 0.60Sat Flow, veh/h 638 2626 751 948 3260 286 837 2355 1100 977 2325 1078
Grp Volume(v), veh/h 101 216 215 216 379 388 107 198 192 38 265 252Grp Sat Flow(s),veh/h/ln 638 1714 1663 948 1754 1792 837 1793 1662 977 1765 1637Q Serve(g_s), s 11.3 6.8 7.0 15.9 13.0 13.0 12.7 9.6 10.0 2.7 9.4 9.8Cycle Q Clear(g_c), s 24.3 6.8 7.0 22.9 13.0 13.0 22.5 9.6 10.0 12.7 9.4 9.8Prop In Lane 1.00 0.45 1.00 0.16 1.00 0.66 1.00 0.66Lane Grp Cap(c), veh/h 356 981 952 548 1004 1026 242 538 499 269 530 491V/C Ratio(X) 0.28 0.22 0.23 0.39 0.38 0.38 0.44 0.37 0.38 0.14 0.50 0.51Avail Cap(c_a), veh/h 356 981 952 548 1004 1026 356 783 725 403 770 714HCM Platoon Ratio 1.00 1.00 1.00 1.00 1.00 1.00 1.00 1.00 1.00 2.00 2.00 2.00Upstream Filter(I) 1.00 1.00 1.00 1.00 1.00 1.00 1.00 1.00 1.00 1.00 1.00 1.00Uniform Delay (d), s/veh 19.4 11.5 11.5 17.2 12.8 12.8 39.2 30.3 30.5 21.1 17.3 17.3Incr Delay (d2), s/veh 2.0 0.5 0.6 2.1 1.1 1.1 1.3 0.4 0.5 0.2 0.7 0.8Initial Q Delay(d3),s/veh 0.0 0.0 0.0 0.0 0.0 0.0 0.0 0.0 0.0 0.0 0.0 0.0%ile BackOfQ(50%),veh/ln 2.2 3.3 3.3 4.5 6.5 6.7 3.0 4.8 4.7 0.7 4.5 4.5LnGrp Delay(d),s/veh 21.4 12.0 12.1 19.3 13.9 13.9 40.5 30.7 30.9 21.3 18.0 18.2LnGrp LOS C B B B B B D C C C B B
Approach Vol, veh/h 532 983 497 555Approach Delay, s/veh 13.8 15.1 32.9 18.3Approach LOS B B C B
Timer 1 2 3 4 5 6 7 8
Assigned Phs 2 4 6 8Phs Duration (G+Y+Rc), s 70.0 40.0 70.0 40.0Change Period (Y+Rc), s 7.0 7.0 7.0 7.0Max Green Setting (Gmax), s 48.0 48.0 48.0 48.0Max Q Clear Time (g_c+I1), s 26.3 14.7 24.9 24.5Green Ext Time (p_c), s 12.1 9.6 12.6 8.5
Intersection Summary
HCM 2010 Ctrl Delay 19.0HCM 2010 LOS B

HCM 2010 Signalized Intersection Summary 2020 Existing PM2: Glen Erin Drive & Shelter Bay Road/Private Access 6719 Glen Erin Drive
Crozier Consulting Engineers 05-25-2020Page 2
Movement EBL EBT EBR WBL WBT WBR NBL NBT NBR SBL SBT SBR
Lane ConfigurationsTraffic Volume (veh/h) 14 2 32 3 0 3 50 288 7 5 457 48Future Volume (veh/h) 14 2 32 3 0 3 50 288 7 5 457 48Number 7 4 14 3 8 18 5 2 12 1 6 16Initial Q (Qb), veh 0 0 0 0 0 0 0 0 0 0 0 0Ped-Bike Adj(A_pbT) 0.98 0.98 0.99 0.98 1.00 1.00 1.00 1.00Parking Bus, Adj 1.00 1.00 1.00 1.00 1.00 1.00 1.00 1.00 1.00 1.00 1.00 1.00Adj Sat Flow, veh/h/ln 1900 1900 1900 1900 1900 1900 1900 1812 1900 1900 1866 1900Adj Flow Rate, veh/h 15 2 35 3 0 3 54 313 8 5 497 52Adj No. of Lanes 0 1 0 0 1 0 1 2 0 1 2 0Peak Hour Factor 0.92 0.92 0.92 0.92 0.92 0.92 0.92 0.92 0.92 0.92 0.92 0.92Percent Heavy Veh, % 0 0 0 0 0 0 0 5 5 0 2 2Cap, veh/h 65 20 89 100 15 66 729 2739 70 923 2588 270Arrive On Green 0.08 0.08 0.08 0.08 0.00 0.08 1.00 1.00 1.00 0.80 0.80 0.80Sat Flow, veh/h 279 241 1071 608 181 789 871 3430 87 1074 3241 338
Grp Volume(v), veh/h 52 0 0 6 0 0 54 157 164 5 271 278Grp Sat Flow(s),veh/h/ln 1591 0 0 1578 0 0 871 1721 1796 1074 1773 1806Q Serve(g_s), s 0.0 0.0 0.0 0.0 0.0 0.0 0.3 0.0 0.0 0.1 4.0 4.0Cycle Q Clear(g_c), s 3.2 0.0 0.0 0.4 0.0 0.0 4.4 0.0 0.0 0.1 4.0 4.0Prop In Lane 0.29 0.67 0.50 0.50 1.00 0.05 1.00 0.19Lane Grp Cap(c), veh/h 174 0 0 180 0 0 729 1375 1434 923 1416 1442V/C Ratio(X) 0.30 0.00 0.00 0.03 0.00 0.00 0.07 0.11 0.11 0.01 0.19 0.19Avail Cap(c_a), veh/h 432 0 0 426 0 0 729 1375 1434 923 1416 1442HCM Platoon Ratio 1.00 1.00 1.00 1.00 1.00 1.00 2.00 2.00 2.00 1.00 1.00 1.00Upstream Filter(I) 1.00 0.00 0.00 1.00 0.00 0.00 1.00 1.00 1.00 1.00 1.00 1.00Uniform Delay (d), s/veh 47.7 0.0 0.0 46.4 0.0 0.0 0.1 0.0 0.0 2.2 2.6 2.6Incr Delay (d2), s/veh 0.9 0.0 0.0 0.1 0.0 0.0 0.2 0.2 0.2 0.0 0.3 0.3Initial Q Delay(d3),s/veh 0.0 0.0 0.0 0.0 0.0 0.0 0.0 0.0 0.0 0.0 0.0 0.0%ile BackOfQ(50%),veh/ln 1.5 0.0 0.0 0.2 0.0 0.0 0.1 0.1 0.1 0.0 2.1 2.1LnGrp Delay(d),s/veh 48.7 0.0 0.0 46.5 0.0 0.0 0.3 0.2 0.2 2.3 2.9 2.9LnGrp LOS D D A A A A A A
Approach Vol, veh/h 52 6 375 554Approach Delay, s/veh 48.7 46.5 0.2 2.9Approach LOS D D A A
Timer 1 2 3 4 5 6 7 8
Assigned Phs 2 4 6 8Phs Duration (G+Y+Rc), s 94.4 15.6 94.4 15.6Change Period (Y+Rc), s 6.5 6.5 6.5 6.5Max Green Setting (Gmax), s 69.5 27.5 69.5 27.5Max Q Clear Time (g_c+I1), s 6.4 5.2 6.0 2.4Green Ext Time (p_c), s 8.6 0.3 8.6 0.3
Intersection Summary
HCM 2010 Ctrl Delay 4.6HCM 2010 LOS A
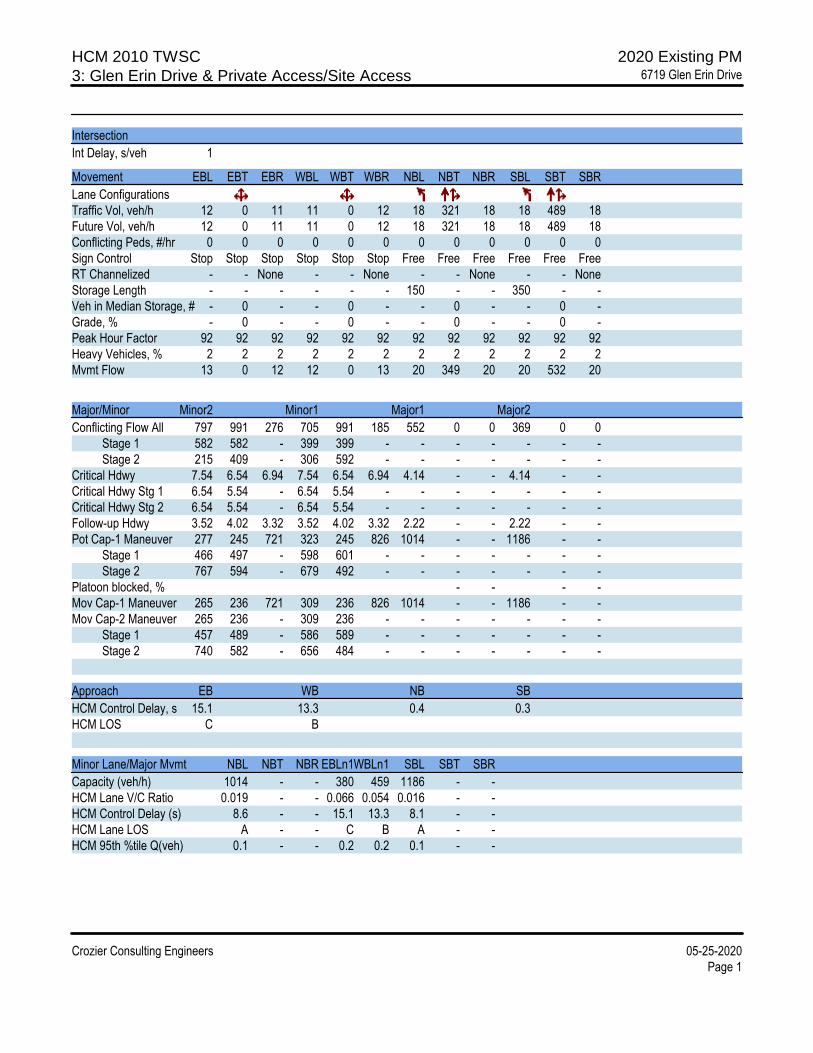
HCM 2010 TWSC 2020 Existing PM3: Glen Erin Drive & Private Access/Site Access 6719 Glen Erin Drive
Crozier Consulting Engineers 05-25-2020Page 1
Intersection
Int Delay, s/veh 1
Movement EBL EBT EBR WBL WBT WBR NBL NBT NBR SBL SBT SBR
Lane ConfigurationsTraffic Vol, veh/h 12 0 11 11 0 12 18 321 18 18 489 18Future Vol, veh/h 12 0 11 11 0 12 18 321 18 18 489 18Conflicting Peds, #/hr 0 0 0 0 0 0 0 0 0 0 0 0Sign Control Stop Stop Stop Stop Stop Stop Free Free Free Free Free FreeRT Channelized - - None - - None - - None - - NoneStorage Length - - - - - - 150 - - 350 - -Veh in Median Storage, # - 0 - - 0 - - 0 - - 0 -Grade, % - 0 - - 0 - - 0 - - 0 -Peak Hour Factor 92 92 92 92 92 92 92 92 92 92 92 92Heavy Vehicles, % 2 2 2 2 2 2 2 2 2 2 2 2Mvmt Flow 13 0 12 12 0 13 20 349 20 20 532 20
Major/Minor Minor2 Minor1 Major1 Major2
Conflicting Flow All 797 991 276 705 991 185 552 0 0 369 0 0 Stage 1 582 582 - 399 399 - - - - - - - Stage 2 215 409 - 306 592 - - - - - - -Critical Hdwy 7.54 6.54 6.94 7.54 6.54 6.94 4.14 - - 4.14 - -Critical Hdwy Stg 1 6.54 5.54 - 6.54 5.54 - - - - - - -Critical Hdwy Stg 2 6.54 5.54 - 6.54 5.54 - - - - - - -Follow-up Hdwy 3.52 4.02 3.32 3.52 4.02 3.32 2.22 - - 2.22 - -Pot Cap-1 Maneuver 277 245 721 323 245 826 1014 - - 1186 - - Stage 1 466 497 - 598 601 - - - - - - - Stage 2 767 594 - 679 492 - - - - - - -Platoon blocked, % - - - -Mov Cap-1 Maneuver 265 236 721 309 236 826 1014 - - 1186 - -Mov Cap-2 Maneuver 265 236 - 309 236 - - - - - - - Stage 1 457 489 - 586 589 - - - - - - - Stage 2 740 582 - 656 484 - - - - - - -
Approach EB WB NB SB
HCM Control Delay, s 15.1 13.3 0.4 0.3HCM LOS C B
Minor Lane/Major Mvmt NBL NBT NBR EBLn1WBLn1 SBL SBT SBR
Capacity (veh/h) 1014 - - 380 459 1186 - -HCM Lane V/C Ratio 0.019 - - 0.066 0.054 0.016 - -HCM Control Delay (s) 8.6 - - 15.1 13.3 8.1 - -HCM Lane LOS A - - C B A - -HCM 95th %tile Q(veh) 0.1 - - 0.2 0.2 0.1 - -
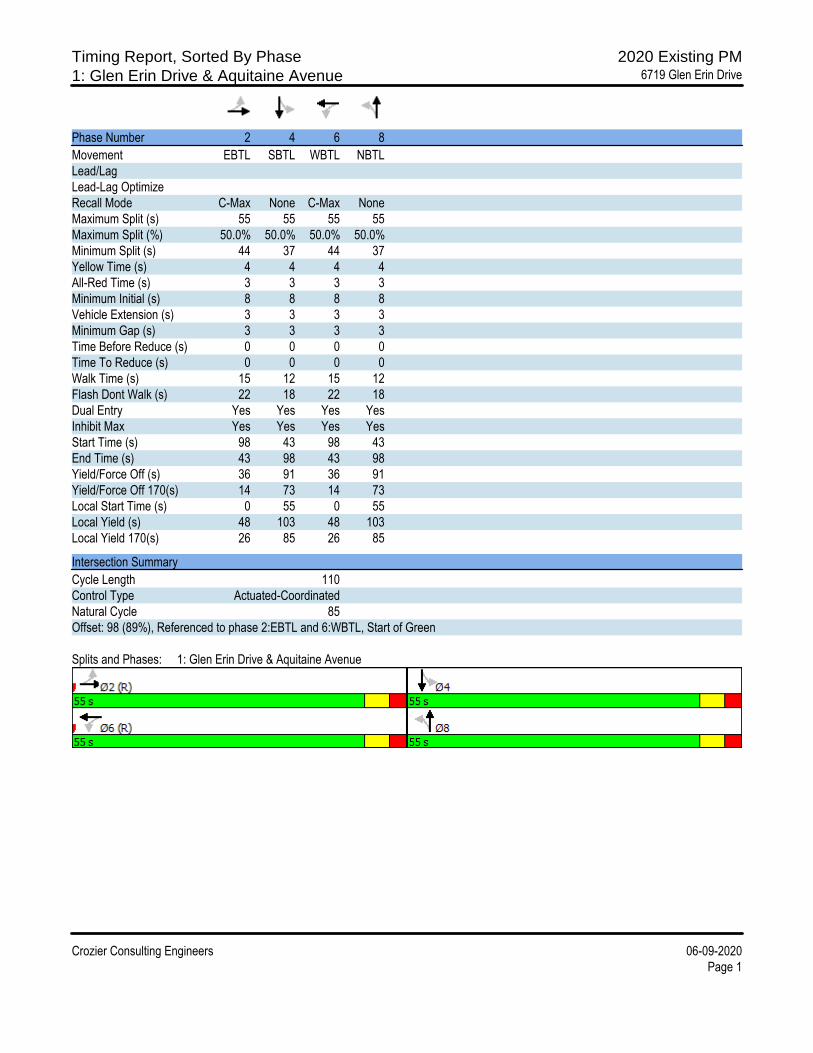
Timing Report, Sorted By Phase 2020 Existing PM1: Glen Erin Drive & Aquitaine Avenue 6719 Glen Erin Drive
Crozier Consulting Engineers 06-09-2020Page 1
Phase Number 2 4 6 8
Movement EBTL SBTL WBTL NBTLLead/LagLead-Lag OptimizeRecall Mode C-Max None C-Max NoneMaximum Split (s) 55 55 55 55Maximum Split (%) 50.0% 50.0% 50.0% 50.0%Minimum Split (s) 44 37 44 37Yellow Time (s) 4 4 4 4All-Red Time (s) 3 3 3 3Minimum Initial (s) 8 8 8 8Vehicle Extension (s) 3 3 3 3Minimum Gap (s) 3 3 3 3Time Before Reduce (s) 0 0 0 0Time To Reduce (s) 0 0 0 0Walk Time (s) 15 12 15 12Flash Dont Walk (s) 22 18 22 18Dual Entry Yes Yes Yes YesInhibit Max Yes Yes Yes YesStart Time (s) 98 43 98 43End Time (s) 43 98 43 98Yield/Force Off (s) 36 91 36 91Yield/Force Off 170(s) 14 73 14 73Local Start Time (s) 0 55 0 55Local Yield (s) 48 103 48 103Local Yield 170(s) 26 85 26 85
Intersection Summary
Cycle Length 110Control Type Actuated-CoordinatedNatural Cycle 85Offset: 98 (89%), Referenced to phase 2:EBTL and 6:WBTL, Start of Green
Splits and Phases: 1: Glen Erin Drive & Aquitaine Avenue
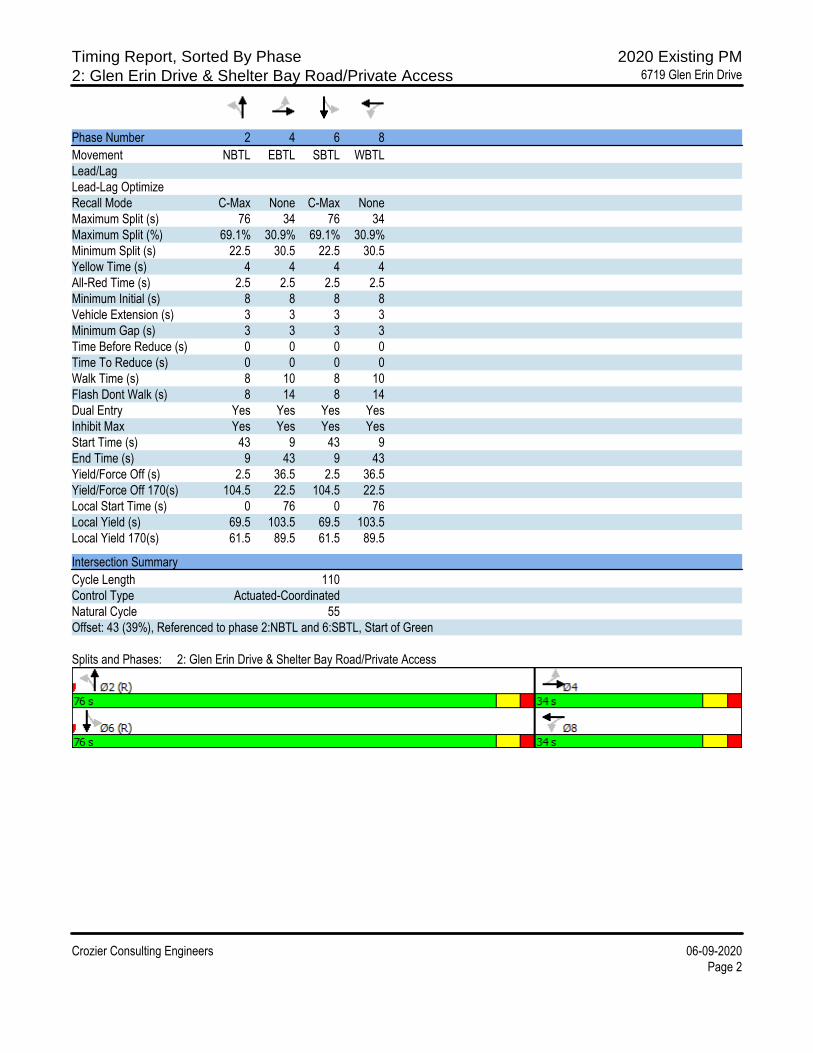
Timing Report, Sorted By Phase 2020 Existing PM2: Glen Erin Drive & Shelter Bay Road/Private Access 6719 Glen Erin Drive
Crozier Consulting Engineers 06-09-2020Page 2
Phase Number 2 4 6 8
Movement NBTL EBTL SBTL WBTLLead/LagLead-Lag OptimizeRecall Mode C-Max None C-Max NoneMaximum Split (s) 76 34 76 34Maximum Split (%) 69.1% 30.9% 69.1% 30.9%Minimum Split (s) 22.5 30.5 22.5 30.5Yellow Time (s) 4 4 4 4All-Red Time (s) 2.5 2.5 2.5 2.5Minimum Initial (s) 8 8 8 8Vehicle Extension (s) 3 3 3 3Minimum Gap (s) 3 3 3 3Time Before Reduce (s) 0 0 0 0Time To Reduce (s) 0 0 0 0Walk Time (s) 8 10 8 10Flash Dont Walk (s) 8 14 8 14Dual Entry Yes Yes Yes YesInhibit Max Yes Yes Yes YesStart Time (s) 43 9 43 9End Time (s) 9 43 9 43Yield/Force Off (s) 2.5 36.5 2.5 36.5Yield/Force Off 170(s) 104.5 22.5 104.5 22.5Local Start Time (s) 0 76 0 76Local Yield (s) 69.5 103.5 69.5 103.5Local Yield 170(s) 61.5 89.5 61.5 89.5
Intersection Summary
Cycle Length 110Control Type Actuated-CoordinatedNatural Cycle 55Offset: 43 (39%), Referenced to phase 2:NBTL and 6:SBTL, Start of Green
Splits and Phases: 2: Glen Erin Drive & Shelter Bay Road/Private Access
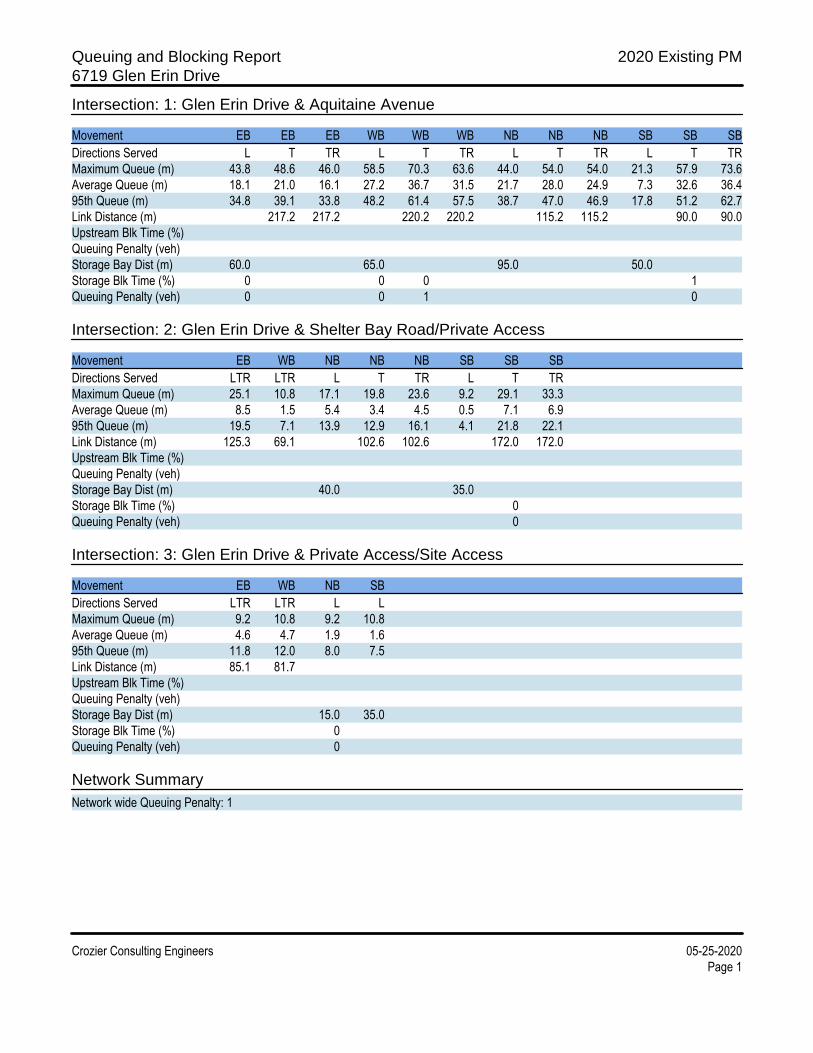
Queuing and Blocking Report 2020 Existing PM6719 Glen Erin Drive
Crozier Consulting Engineers 05-25-2020Page 1
Intersection: 1: Glen Erin Drive & Aquitaine Avenue
Movement EB EB EB WB WB WB NB NB NB SB SB SB
Directions Served L T TR L T TR L T TR L T TRMaximum Queue (m) 43.8 48.6 46.0 58.5 70.3 63.6 44.0 54.0 54.0 21.3 57.9 73.6Average Queue (m) 18.1 21.0 16.1 27.2 36.7 31.5 21.7 28.0 24.9 7.3 32.6 36.495th Queue (m) 34.8 39.1 33.8 48.2 61.4 57.5 38.7 47.0 46.9 17.8 51.2 62.7Link Distance (m) 217.2 217.2 220.2 220.2 115.2 115.2 90.0 90.0Upstream Blk Time (%)Queuing Penalty (veh)Storage Bay Dist (m) 60.0 65.0 95.0 50.0Storage Blk Time (%) 0 0 0 1Queuing Penalty (veh) 0 0 1 0
Intersection: 2: Glen Erin Drive & Shelter Bay Road/Private Access
Movement EB WB NB NB NB SB SB SB
Directions Served LTR LTR L T TR L T TRMaximum Queue (m) 25.1 10.8 17.1 19.8 23.6 9.2 29.1 33.3Average Queue (m) 8.5 1.5 5.4 3.4 4.5 0.5 7.1 6.995th Queue (m) 19.5 7.1 13.9 12.9 16.1 4.1 21.8 22.1Link Distance (m) 125.3 69.1 102.6 102.6 172.0 172.0Upstream Blk Time (%)Queuing Penalty (veh)Storage Bay Dist (m) 40.0 35.0Storage Blk Time (%) 0Queuing Penalty (veh) 0
Intersection: 3: Glen Erin Drive & Private Access/Site Access
Movement EB WB NB SB
Directions Served LTR LTR L LMaximum Queue (m) 9.2 10.8 9.2 10.8Average Queue (m) 4.6 4.7 1.9 1.695th Queue (m) 11.8 12.0 8.0 7.5Link Distance (m) 85.1 81.7Upstream Blk Time (%)Queuing Penalty (veh)Storage Bay Dist (m) 15.0 35.0Storage Blk Time (%) 0Queuing Penalty (veh) 0
Network Summary
Network wide Queuing Penalty: 1

HCM 2010 Signalized Intersection Summary 2025 Future Background AM1: Glen Erin Drive & Aquitaine Avenue
Crozier Consulting Engineers Page 1
Movement EBL EBT EBR WBL WBT WBR NBL NBT NBR SBL SBT SBRLane ConfigurationsTraffic Volume (veh/h) 113 902 61 105 323 47 46 273 281 61 195 114Future Volume (veh/h) 113 902 61 105 323 47 46 273 281 61 195 114Number 5 2 12 1 6 16 3 8 18 7 4 14Initial Q (Qb), veh 0 0 0 0 0 0 0 0 0 0 0 0Ped-Bike Adj(A_pbT) 1.00 0.99 1.00 0.99 0.99 0.98 0.99 0.98Parking Bus, Adj 1.00 1.00 1.00 1.00 1.00 1.00 1.00 1.00 1.00 1.00 1.00 1.00Adj Sat Flow, veh/h/ln 1632 1859 1640 1738 1757 1640 1706 1836 1640 1824 1764 1640Adj Flow Rate, veh/h 123 980 66 114 351 51 50 297 305 66 212 124Adj No. of Lanes 1 2 0 1 2 0 1 2 0 1 2 0Peak Hour Factor 0.92 0.92 0.92 0.92 0.92 0.92 0.92 0.92 0.92 0.92 0.92 0.92Percent Heavy Veh, % 14 2 5 7 9 2 9 4 3 2 7 9Cap, veh/h 500 1888 127 263 1646 237 300 519 456 169 613 342Arrive On Green 0.56 0.56 0.56 0.56 0.56 0.56 0.30 0.30 0.30 0.60 0.60 0.60Sat Flow, veh/h 853 3357 226 501 2926 421 943 1744 1532 792 2060 1151Grp Volume(v), veh/h 123 516 530 114 199 203 50 297 305 66 171 165Grp Sat Flow(s),veh/h/ln 853 1766 1817 501 1670 1678 943 1744 1532 792 1675 1535Q Serve(g_s), s 8.4 18.0 18.0 18.2 5.9 6.0 4.2 14.4 17.5 7.5 5.2 5.6Cycle Q Clear(g_c), s 14.4 18.0 18.0 36.3 5.9 6.0 9.8 14.4 17.5 25.0 5.2 5.6Prop In Lane 1.00 0.12 1.00 0.25 1.00 1.00 1.00 0.75Lane Grp Cap(c), veh/h 500 993 1022 263 939 944 300 519 456 169 499 457V/C Ratio(X) 0.25 0.52 0.52 0.43 0.21 0.22 0.17 0.57 0.67 0.39 0.34 0.36Avail Cap(c_a), veh/h 500 993 1022 263 939 944 425 750 659 274 720 660HCM Platoon Ratio 1.00 1.00 1.00 1.00 1.00 1.00 1.00 1.00 1.00 2.00 2.00 2.00Upstream Filter(I) 1.00 1.00 1.00 1.00 1.00 1.00 1.00 1.00 1.00 1.00 1.00 1.00Uniform Delay (d), s/veh 14.5 13.5 13.5 24.7 10.9 10.9 30.3 29.7 30.8 27.2 15.3 15.3Incr Delay (d2), s/veh 1.2 1.9 1.9 5.1 0.5 0.5 0.3 1.0 1.7 1.5 0.4 0.5Initial Q Delay(d3),s/veh 0.0 0.0 0.0 0.0 0.0 0.0 0.0 0.0 0.0 0.0 0.0 0.0%ile BackOfQ(50%),veh/ln 2.1 9.3 9.5 2.9 2.8 2.9 1.1 7.1 7.6 1.7 2.4 2.4LnGrp Delay(d),s/veh 15.6 15.5 15.4 29.8 11.4 11.4 30.6 30.7 32.5 28.6 15.7 15.8LnGrp LOS B B B C B B C C C C B BApproach Vol, veh/h 1169 516 652 402Approach Delay, s/veh 15.5 15.5 31.6 17.9Approach LOS B B C B
Timer 1 2 3 4 5 6 7 8Assigned Phs 2 4 6 8Phs Duration (G+Y+Rc), s 63.2 36.8 63.2 36.8Change Period (Y+Rc), s 7.0 7.0 7.0 7.0Max Green Setting (Gmax), s 43.0 43.0 43.0 43.0Max Q Clear Time (g_c+I1), s 20.0 27.0 38.3 19.5Green Ext Time (p_c), s 9.9 2.6 1.7 5.2
Intersection SummaryHCM 2010 Ctrl Delay 19.6HCM 2010 LOS B

Timing Report, Sorted By Phase 2025 Future Background AM1: Glen Erin Drive & Aquitaine Avenue
Crozier Consulting Engineers Page 2
Phase Number 2 4 6 8Movement EBTL SBTL WBTL NBTLLead/LagLead-Lag OptimizeRecall Mode C-Max None C-Max NoneMaximum Split (s) 50 50 50 50Maximum Split (%) 50.0% 50.0% 50.0% 50.0%Minimum Split (s) 44 37 44 37Yellow Time (s) 4 4 4 4All-Red Time (s) 3 3 3 3Minimum Initial (s) 8 8 8 8Vehicle Extension (s) 3 3 3 3Minimum Gap (s) 3 3 3 3Time Before Reduce (s) 0 0 0 0Time To Reduce (s) 0 0 0 0Walk Time (s) 15 12 15 12Flash Dont Walk (s) 22 18 22 18Dual Entry Yes Yes Yes YesInhibit Max Yes Yes Yes YesStart Time (s) 90 40 90 40End Time (s) 40 90 40 90Yield/Force Off (s) 33 83 33 83Yield/Force Off 170(s) 11 65 11 65Local Start Time (s) 0 50 0 50Local Yield (s) 43 93 43 93Local Yield 170(s) 21 75 21 75
Intersection SummaryCycle Length 100Control Type Actuated-CoordinatedNatural Cycle 85Offset: 90 (90%), Referenced to phase 2:EBTL and 6:WBTL, Start of Green
Splits and Phases: 1: Glen Erin Drive & Aquitaine Avenue
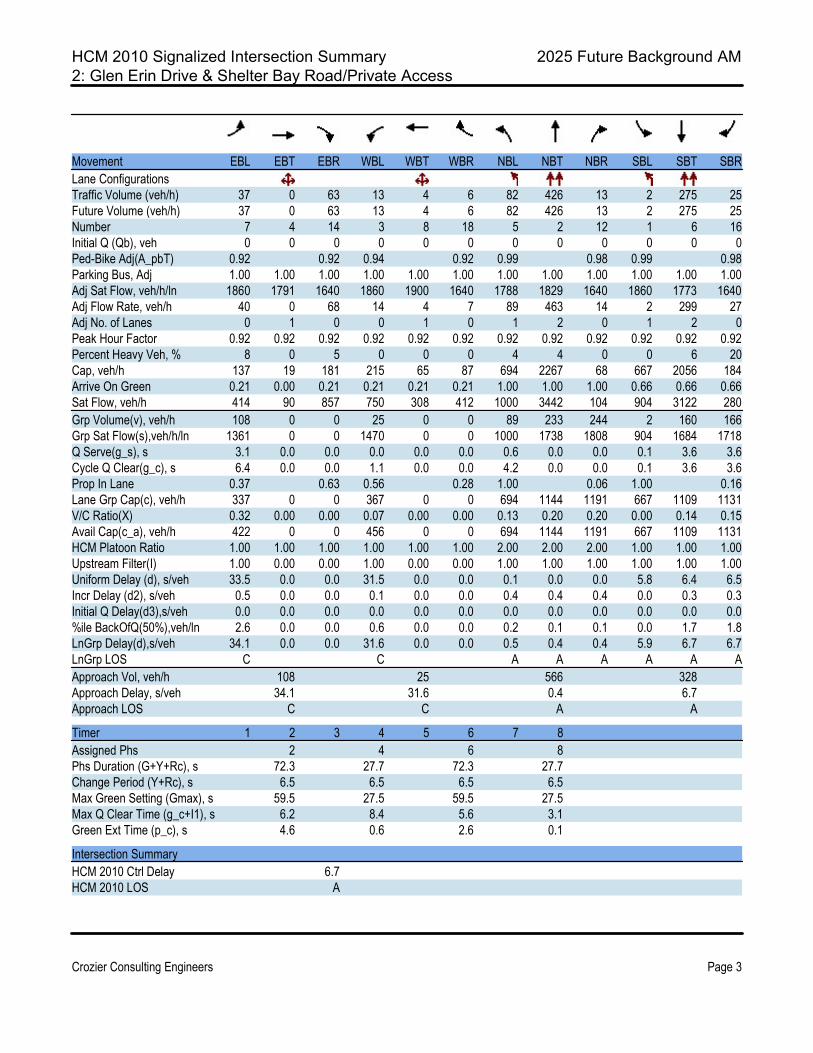
HCM 2010 Signalized Intersection Summary 2025 Future Background AM2: Glen Erin Drive & Shelter Bay Road/Private Access
Crozier Consulting Engineers Page 3
Movement EBL EBT EBR WBL WBT WBR NBL NBT NBR SBL SBT SBRLane ConfigurationsTraffic Volume (veh/h) 37 0 63 13 4 6 82 426 13 2 275 25Future Volume (veh/h) 37 0 63 13 4 6 82 426 13 2 275 25Number 7 4 14 3 8 18 5 2 12 1 6 16Initial Q (Qb), veh 0 0 0 0 0 0 0 0 0 0 0 0Ped-Bike Adj(A_pbT) 0.92 0.92 0.94 0.92 0.99 0.98 0.99 0.98Parking Bus, Adj 1.00 1.00 1.00 1.00 1.00 1.00 1.00 1.00 1.00 1.00 1.00 1.00Adj Sat Flow, veh/h/ln 1860 1791 1640 1860 1900 1640 1788 1829 1640 1860 1773 1640Adj Flow Rate, veh/h 40 0 68 14 4 7 89 463 14 2 299 27Adj No. of Lanes 0 1 0 0 1 0 1 2 0 1 2 0Peak Hour Factor 0.92 0.92 0.92 0.92 0.92 0.92 0.92 0.92 0.92 0.92 0.92 0.92Percent Heavy Veh, % 8 0 5 0 0 0 4 4 0 0 6 20Cap, veh/h 137 19 181 215 65 87 694 2267 68 667 2056 184Arrive On Green 0.21 0.00 0.21 0.21 0.21 0.21 1.00 1.00 1.00 0.66 0.66 0.66Sat Flow, veh/h 414 90 857 750 308 412 1000 3442 104 904 3122 280Grp Volume(v), veh/h 108 0 0 25 0 0 89 233 244 2 160 166Grp Sat Flow(s),veh/h/ln 1361 0 0 1470 0 0 1000 1738 1808 904 1684 1718Q Serve(g_s), s 3.1 0.0 0.0 0.0 0.0 0.0 0.6 0.0 0.0 0.1 3.6 3.6Cycle Q Clear(g_c), s 6.4 0.0 0.0 1.1 0.0 0.0 4.2 0.0 0.0 0.1 3.6 3.6Prop In Lane 0.37 0.63 0.56 0.28 1.00 0.06 1.00 0.16Lane Grp Cap(c), veh/h 337 0 0 367 0 0 694 1144 1191 667 1109 1131V/C Ratio(X) 0.32 0.00 0.00 0.07 0.00 0.00 0.13 0.20 0.20 0.00 0.14 0.15Avail Cap(c_a), veh/h 422 0 0 456 0 0 694 1144 1191 667 1109 1131HCM Platoon Ratio 1.00 1.00 1.00 1.00 1.00 1.00 2.00 2.00 2.00 1.00 1.00 1.00Upstream Filter(I) 1.00 0.00 0.00 1.00 0.00 0.00 1.00 1.00 1.00 1.00 1.00 1.00Uniform Delay (d), s/veh 33.5 0.0 0.0 31.5 0.0 0.0 0.1 0.0 0.0 5.8 6.4 6.5Incr Delay (d2), s/veh 0.5 0.0 0.0 0.1 0.0 0.0 0.4 0.4 0.4 0.0 0.3 0.3Initial Q Delay(d3),s/veh 0.0 0.0 0.0 0.0 0.0 0.0 0.0 0.0 0.0 0.0 0.0 0.0%ile BackOfQ(50%),veh/ln 2.6 0.0 0.0 0.6 0.0 0.0 0.2 0.1 0.1 0.0 1.7 1.8LnGrp Delay(d),s/veh 34.1 0.0 0.0 31.6 0.0 0.0 0.5 0.4 0.4 5.9 6.7 6.7LnGrp LOS C C A A A A A AApproach Vol, veh/h 108 25 566 328Approach Delay, s/veh 34.1 31.6 0.4 6.7Approach LOS C C A A
Timer 1 2 3 4 5 6 7 8Assigned Phs 2 4 6 8Phs Duration (G+Y+Rc), s 72.3 27.7 72.3 27.7Change Period (Y+Rc), s 6.5 6.5 6.5 6.5Max Green Setting (Gmax), s 59.5 27.5 59.5 27.5Max Q Clear Time (g_c+I1), s 6.2 8.4 5.6 3.1Green Ext Time (p_c), s 4.6 0.6 2.6 0.1
Intersection SummaryHCM 2010 Ctrl Delay 6.7HCM 2010 LOS A
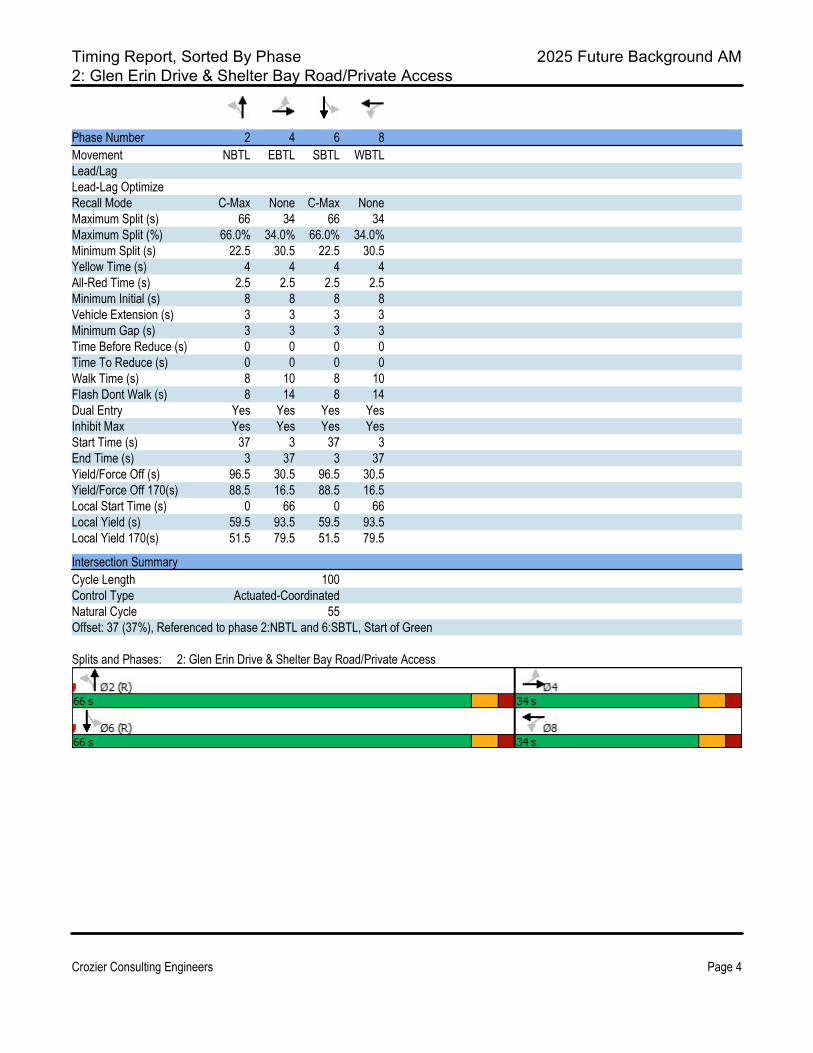
Timing Report, Sorted By Phase 2025 Future Background AM2: Glen Erin Drive & Shelter Bay Road/Private Access
Crozier Consulting Engineers Page 4
Phase Number 2 4 6 8Movement NBTL EBTL SBTL WBTLLead/LagLead-Lag OptimizeRecall Mode C-Max None C-Max NoneMaximum Split (s) 66 34 66 34Maximum Split (%) 66.0% 34.0% 66.0% 34.0%Minimum Split (s) 22.5 30.5 22.5 30.5Yellow Time (s) 4 4 4 4All-Red Time (s) 2.5 2.5 2.5 2.5Minimum Initial (s) 8 8 8 8Vehicle Extension (s) 3 3 3 3Minimum Gap (s) 3 3 3 3Time Before Reduce (s) 0 0 0 0Time To Reduce (s) 0 0 0 0Walk Time (s) 8 10 8 10Flash Dont Walk (s) 8 14 8 14Dual Entry Yes Yes Yes YesInhibit Max Yes Yes Yes YesStart Time (s) 37 3 37 3End Time (s) 3 37 3 37Yield/Force Off (s) 96.5 30.5 96.5 30.5Yield/Force Off 170(s) 88.5 16.5 88.5 16.5Local Start Time (s) 0 66 0 66Local Yield (s) 59.5 93.5 59.5 93.5Local Yield 170(s) 51.5 79.5 51.5 79.5
Intersection SummaryCycle Length 100Control Type Actuated-CoordinatedNatural Cycle 55Offset: 37 (37%), Referenced to phase 2:NBTL and 6:SBTL, Start of Green
Splits and Phases: 2: Glen Erin Drive & Shelter Bay Road/Private Access

HCM 2010 TWSC 2025 Future Background AM3: Glen Erin Drive & Private Access/Site Access
Crozier Consulting Engineers Page 5
IntersectionInt Delay, s/veh 1.4
Movement EBL EBT EBR WBL WBT WBR NBL NBT NBR SBL SBT SBRLane ConfigurationsTraffic Vol, veh/h 21 0 20 20 0 21 7 483 7 6 327 6Future Vol, veh/h 21 0 20 20 0 21 7 483 7 6 327 6Conflicting Peds, #/hr 0 0 0 0 0 0 0 0 0 0 0 0Sign Control Stop Stop Stop Stop Stop Stop Free Free Free Free Free FreeRT Channelized - - None - - None - - None - - NoneStorage Length - - - - - - 150 - - 350 - -Veh in Median Storage, # - 0 - - 0 - - 0 - - 0 -Grade, % - 0 - - 0 - - 0 - - 0 -Peak Hour Factor 92 92 92 92 92 92 92 92 92 92 92 92Heavy Vehicles, % 2 2 2 2 2 2 2 2 2 2 2 2Mvmt Flow 23 0 22 22 0 23 8 525 8 7 355 7
Major/Minor Minor2 Minor1 Major1 Major2Conflicting Flow All 652 922 181 737 921 267 362 0 0 533 0 0 Stage 1 373 373 - 545 545 - - - - - - - Stage 2 279 549 - 192 376 - - - - - - -Critical Hdwy 7.54 6.54 6.94 7.54 6.54 6.94 4.14 - - 4.14 - -Critical Hdwy Stg 1 6.54 5.54 - 6.54 5.54 - - - - - - -Critical Hdwy Stg 2 6.54 5.54 - 6.54 5.54 - - - - - - -Follow-up Hdwy 3.52 4.02 3.32 3.52 4.02 3.32 2.22 - - 2.22 - -Pot Cap-1 Maneuver 353 269 831 307 269 731 1193 - - 1031 - - Stage 1 620 617 - 490 517 - - - - - - - Stage 2 704 515 - 791 615 - - - - - - -Platoon blocked, % - - - -Mov Cap-1 Maneuver 339 265 831 296 265 731 1193 - - 1031 - -Mov Cap-2 Maneuver 339 265 - 296 265 - - - - - - - Stage 1 616 613 - 487 513 - - - - - - - Stage 2 677 511 - 765 611 - - - - - - -
Approach EB WB NB SBHCM Control Delay, s 13.3 14.4 0.1 0.2HCM LOS B B
Minor Lane/Major Mvmt NBL NBT NBR EBLn1WBLn1 SBL SBT SBRCapacity (veh/h) 1193 - - 477 426 1031 - -HCM Lane V/C Ratio 0.006 - - 0.093 0.105 0.006 - -HCM Control Delay (s) 8 - - 13.3 14.4 8.5 - -HCM Lane LOS A - - B B A - -HCM 95th %tile Q(veh) 0 - - 0.3 0.3 0 - -
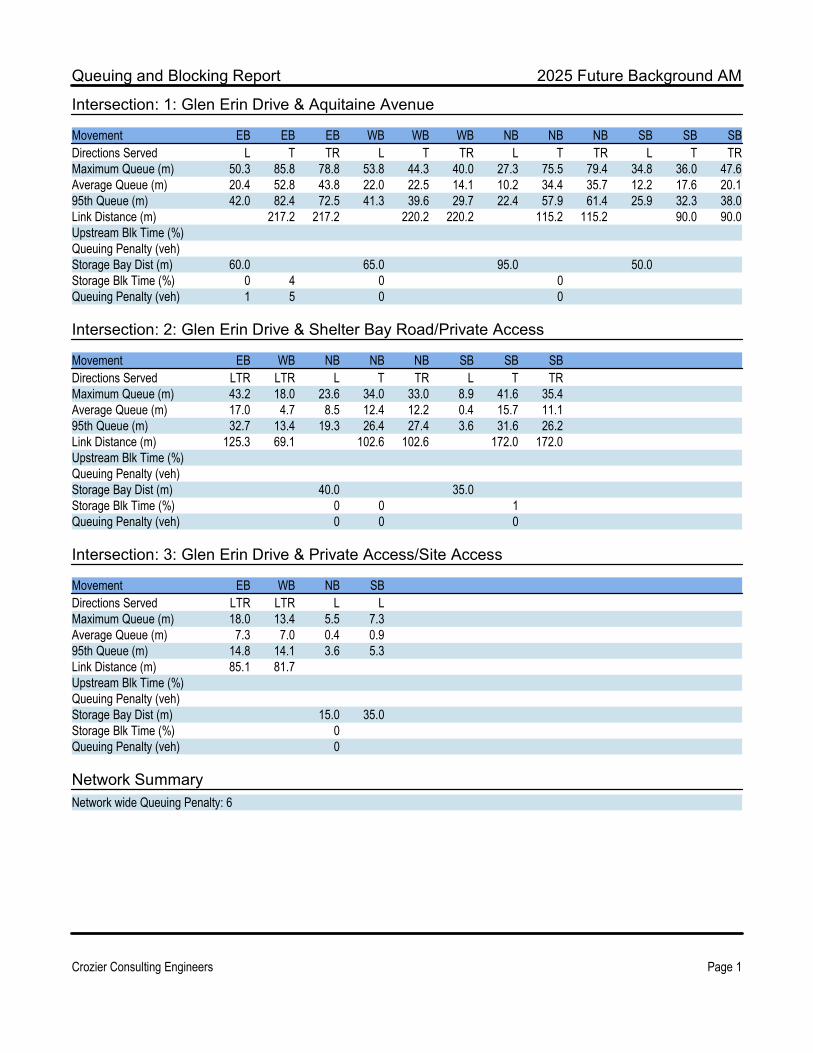
Queuing and Blocking Report 2025 Future Background AM
Crozier Consulting Engineers Page 1
Intersection: 1: Glen Erin Drive & Aquitaine Avenue
Movement EB EB EB WB WB WB NB NB NB SB SB SBDirections Served L T TR L T TR L T TR L T TRMaximum Queue (m) 50.3 85.8 78.8 53.8 44.3 40.0 27.3 75.5 79.4 34.8 36.0 47.6Average Queue (m) 20.4 52.8 43.8 22.0 22.5 14.1 10.2 34.4 35.7 12.2 17.6 20.195th Queue (m) 42.0 82.4 72.5 41.3 39.6 29.7 22.4 57.9 61.4 25.9 32.3 38.0Link Distance (m) 217.2 217.2 220.2 220.2 115.2 115.2 90.0 90.0Upstream Blk Time (%)Queuing Penalty (veh)Storage Bay Dist (m) 60.0 65.0 95.0 50.0Storage Blk Time (%) 0 4 0 0Queuing Penalty (veh) 1 5 0 0
Intersection: 2: Glen Erin Drive & Shelter Bay Road/Private Access
Movement EB WB NB NB NB SB SB SBDirections Served LTR LTR L T TR L T TRMaximum Queue (m) 43.2 18.0 23.6 34.0 33.0 8.9 41.6 35.4Average Queue (m) 17.0 4.7 8.5 12.4 12.2 0.4 15.7 11.195th Queue (m) 32.7 13.4 19.3 26.4 27.4 3.6 31.6 26.2Link Distance (m) 125.3 69.1 102.6 102.6 172.0 172.0Upstream Blk Time (%)Queuing Penalty (veh)Storage Bay Dist (m) 40.0 35.0Storage Blk Time (%) 0 0 1Queuing Penalty (veh) 0 0 0
Intersection: 3: Glen Erin Drive & Private Access/Site Access
Movement EB WB NB SBDirections Served LTR LTR L LMaximum Queue (m) 18.0 13.4 5.5 7.3Average Queue (m) 7.3 7.0 0.4 0.995th Queue (m) 14.8 14.1 3.6 5.3Link Distance (m) 85.1 81.7Upstream Blk Time (%)Queuing Penalty (veh)Storage Bay Dist (m) 15.0 35.0Storage Blk Time (%) 0Queuing Penalty (veh) 0
Network SummaryNetwork wide Queuing Penalty: 6
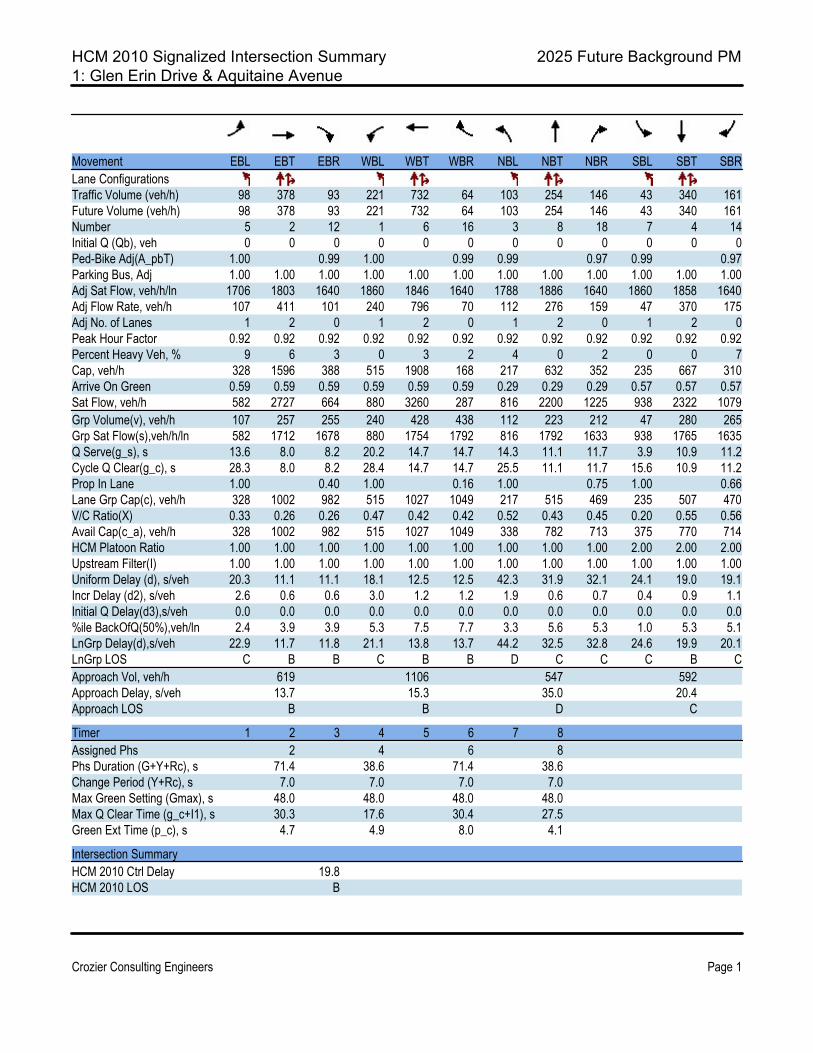
HCM 2010 Signalized Intersection Summary 2025 Future Background PM1: Glen Erin Drive & Aquitaine Avenue
Crozier Consulting Engineers Page 1
Movement EBL EBT EBR WBL WBT WBR NBL NBT NBR SBL SBT SBRLane ConfigurationsTraffic Volume (veh/h) 98 378 93 221 732 64 103 254 146 43 340 161Future Volume (veh/h) 98 378 93 221 732 64 103 254 146 43 340 161Number 5 2 12 1 6 16 3 8 18 7 4 14Initial Q (Qb), veh 0 0 0 0 0 0 0 0 0 0 0 0Ped-Bike Adj(A_pbT) 1.00 0.99 1.00 0.99 0.99 0.97 0.99 0.97Parking Bus, Adj 1.00 1.00 1.00 1.00 1.00 1.00 1.00 1.00 1.00 1.00 1.00 1.00Adj Sat Flow, veh/h/ln 1706 1803 1640 1860 1846 1640 1788 1886 1640 1860 1858 1640Adj Flow Rate, veh/h 107 411 101 240 796 70 112 276 159 47 370 175Adj No. of Lanes 1 2 0 1 2 0 1 2 0 1 2 0Peak Hour Factor 0.92 0.92 0.92 0.92 0.92 0.92 0.92 0.92 0.92 0.92 0.92 0.92Percent Heavy Veh, % 9 6 3 0 3 2 4 0 2 0 0 7Cap, veh/h 328 1596 388 515 1908 168 217 632 352 235 667 310Arrive On Green 0.59 0.59 0.59 0.59 0.59 0.59 0.29 0.29 0.29 0.57 0.57 0.57Sat Flow, veh/h 582 2727 664 880 3260 287 816 2200 1225 938 2322 1079Grp Volume(v), veh/h 107 257 255 240 428 438 112 223 212 47 280 265Grp Sat Flow(s),veh/h/ln 582 1712 1678 880 1754 1792 816 1792 1633 938 1765 1635Q Serve(g_s), s 13.6 8.0 8.2 20.2 14.7 14.7 14.3 11.1 11.7 3.9 10.9 11.2Cycle Q Clear(g_c), s 28.3 8.0 8.2 28.4 14.7 14.7 25.5 11.1 11.7 15.6 10.9 11.2Prop In Lane 1.00 0.40 1.00 0.16 1.00 0.75 1.00 0.66Lane Grp Cap(c), veh/h 328 1002 982 515 1027 1049 217 515 469 235 507 470V/C Ratio(X) 0.33 0.26 0.26 0.47 0.42 0.42 0.52 0.43 0.45 0.20 0.55 0.56Avail Cap(c_a), veh/h 328 1002 982 515 1027 1049 338 782 713 375 770 714HCM Platoon Ratio 1.00 1.00 1.00 1.00 1.00 1.00 1.00 1.00 1.00 2.00 2.00 2.00Upstream Filter(I) 1.00 1.00 1.00 1.00 1.00 1.00 1.00 1.00 1.00 1.00 1.00 1.00Uniform Delay (d), s/veh 20.3 11.1 11.1 18.1 12.5 12.5 42.3 31.9 32.1 24.1 19.0 19.1Incr Delay (d2), s/veh 2.6 0.6 0.6 3.0 1.2 1.2 1.9 0.6 0.7 0.4 0.9 1.1Initial Q Delay(d3),s/veh 0.0 0.0 0.0 0.0 0.0 0.0 0.0 0.0 0.0 0.0 0.0 0.0%ile BackOfQ(50%),veh/ln 2.4 3.9 3.9 5.3 7.5 7.7 3.3 5.6 5.3 1.0 5.3 5.1LnGrp Delay(d),s/veh 22.9 11.7 11.8 21.1 13.8 13.7 44.2 32.5 32.8 24.6 19.9 20.1LnGrp LOS C B B C B B D C C C B CApproach Vol, veh/h 619 1106 547 592Approach Delay, s/veh 13.7 15.3 35.0 20.4Approach LOS B B D C
Timer 1 2 3 4 5 6 7 8Assigned Phs 2 4 6 8Phs Duration (G+Y+Rc), s 71.4 38.6 71.4 38.6Change Period (Y+Rc), s 7.0 7.0 7.0 7.0Max Green Setting (Gmax), s 48.0 48.0 48.0 48.0Max Q Clear Time (g_c+I1), s 30.3 17.6 30.4 27.5Green Ext Time (p_c), s 4.7 4.9 8.0 4.1
Intersection SummaryHCM 2010 Ctrl Delay 19.8HCM 2010 LOS B

Timing Report, Sorted By Phase 2025 Future Background PM1: Glen Erin Drive & Aquitaine Avenue
Crozier Consulting Engineers Page 2
Phase Number 2 4 6 8Movement EBTL SBTL WBTL NBTLLead/LagLead-Lag OptimizeRecall Mode C-Max None C-Max NoneMaximum Split (s) 55 55 55 55Maximum Split (%) 50.0% 50.0% 50.0% 50.0%Minimum Split (s) 44 37 44 37Yellow Time (s) 4 4 4 4All-Red Time (s) 3 3 3 3Minimum Initial (s) 8 8 8 8Vehicle Extension (s) 3 3 3 3Minimum Gap (s) 3 3 3 3Time Before Reduce (s) 0 0 0 0Time To Reduce (s) 0 0 0 0Walk Time (s) 15 12 15 12Flash Dont Walk (s) 22 18 22 18Dual Entry Yes Yes Yes YesInhibit Max Yes Yes Yes YesStart Time (s) 98 43 98 43End Time (s) 43 98 43 98Yield/Force Off (s) 36 91 36 91Yield/Force Off 170(s) 14 73 14 73Local Start Time (s) 0 55 0 55Local Yield (s) 48 103 48 103Local Yield 170(s) 26 85 26 85
Intersection SummaryCycle Length 110Control Type Actuated-CoordinatedNatural Cycle 85Offset: 98 (89%), Referenced to phase 2:EBTL and 6:WBTL, Start of Green
Splits and Phases: 1: Glen Erin Drive & Aquitaine Avenue
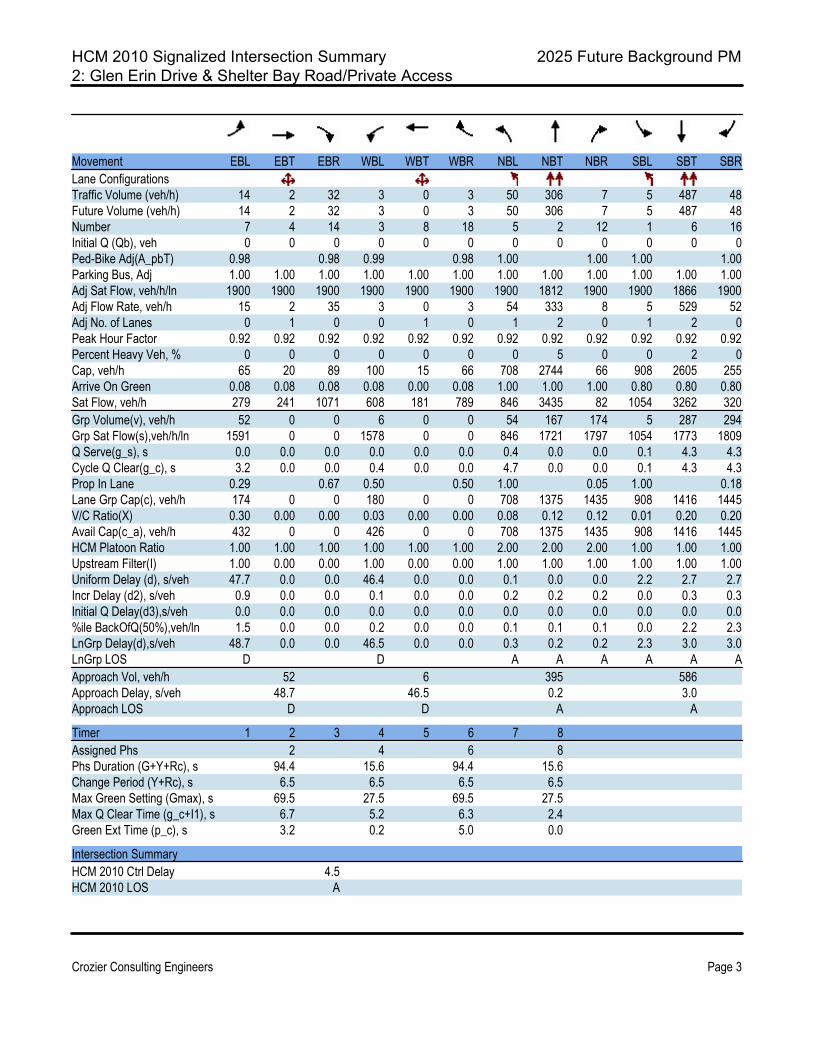
HCM 2010 Signalized Intersection Summary 2025 Future Background PM2: Glen Erin Drive & Shelter Bay Road/Private Access
Crozier Consulting Engineers Page 3
Movement EBL EBT EBR WBL WBT WBR NBL NBT NBR SBL SBT SBRLane ConfigurationsTraffic Volume (veh/h) 14 2 32 3 0 3 50 306 7 5 487 48Future Volume (veh/h) 14 2 32 3 0 3 50 306 7 5 487 48Number 7 4 14 3 8 18 5 2 12 1 6 16Initial Q (Qb), veh 0 0 0 0 0 0 0 0 0 0 0 0Ped-Bike Adj(A_pbT) 0.98 0.98 0.99 0.98 1.00 1.00 1.00 1.00Parking Bus, Adj 1.00 1.00 1.00 1.00 1.00 1.00 1.00 1.00 1.00 1.00 1.00 1.00Adj Sat Flow, veh/h/ln 1900 1900 1900 1900 1900 1900 1900 1812 1900 1900 1866 1900Adj Flow Rate, veh/h 15 2 35 3 0 3 54 333 8 5 529 52Adj No. of Lanes 0 1 0 0 1 0 1 2 0 1 2 0Peak Hour Factor 0.92 0.92 0.92 0.92 0.92 0.92 0.92 0.92 0.92 0.92 0.92 0.92Percent Heavy Veh, % 0 0 0 0 0 0 0 5 0 0 2 0Cap, veh/h 65 20 89 100 15 66 708 2744 66 908 2605 255Arrive On Green 0.08 0.08 0.08 0.08 0.00 0.08 1.00 1.00 1.00 0.80 0.80 0.80Sat Flow, veh/h 279 241 1071 608 181 789 846 3435 82 1054 3262 320Grp Volume(v), veh/h 52 0 0 6 0 0 54 167 174 5 287 294Grp Sat Flow(s),veh/h/ln 1591 0 0 1578 0 0 846 1721 1797 1054 1773 1809Q Serve(g_s), s 0.0 0.0 0.0 0.0 0.0 0.0 0.4 0.0 0.0 0.1 4.3 4.3Cycle Q Clear(g_c), s 3.2 0.0 0.0 0.4 0.0 0.0 4.7 0.0 0.0 0.1 4.3 4.3Prop In Lane 0.29 0.67 0.50 0.50 1.00 0.05 1.00 0.18Lane Grp Cap(c), veh/h 174 0 0 180 0 0 708 1375 1435 908 1416 1445V/C Ratio(X) 0.30 0.00 0.00 0.03 0.00 0.00 0.08 0.12 0.12 0.01 0.20 0.20Avail Cap(c_a), veh/h 432 0 0 426 0 0 708 1375 1435 908 1416 1445HCM Platoon Ratio 1.00 1.00 1.00 1.00 1.00 1.00 2.00 2.00 2.00 1.00 1.00 1.00Upstream Filter(I) 1.00 0.00 0.00 1.00 0.00 0.00 1.00 1.00 1.00 1.00 1.00 1.00Uniform Delay (d), s/veh 47.7 0.0 0.0 46.4 0.0 0.0 0.1 0.0 0.0 2.2 2.7 2.7Incr Delay (d2), s/veh 0.9 0.0 0.0 0.1 0.0 0.0 0.2 0.2 0.2 0.0 0.3 0.3Initial Q Delay(d3),s/veh 0.0 0.0 0.0 0.0 0.0 0.0 0.0 0.0 0.0 0.0 0.0 0.0%ile BackOfQ(50%),veh/ln 1.5 0.0 0.0 0.2 0.0 0.0 0.1 0.1 0.1 0.0 2.2 2.3LnGrp Delay(d),s/veh 48.7 0.0 0.0 46.5 0.0 0.0 0.3 0.2 0.2 2.3 3.0 3.0LnGrp LOS D D A A A A A AApproach Vol, veh/h 52 6 395 586Approach Delay, s/veh 48.7 46.5 0.2 3.0Approach LOS D D A A
Timer 1 2 3 4 5 6 7 8Assigned Phs 2 4 6 8Phs Duration (G+Y+Rc), s 94.4 15.6 94.4 15.6Change Period (Y+Rc), s 6.5 6.5 6.5 6.5Max Green Setting (Gmax), s 69.5 27.5 69.5 27.5Max Q Clear Time (g_c+I1), s 6.7 5.2 6.3 2.4Green Ext Time (p_c), s 3.2 0.2 5.0 0.0
Intersection SummaryHCM 2010 Ctrl Delay 4.5HCM 2010 LOS A
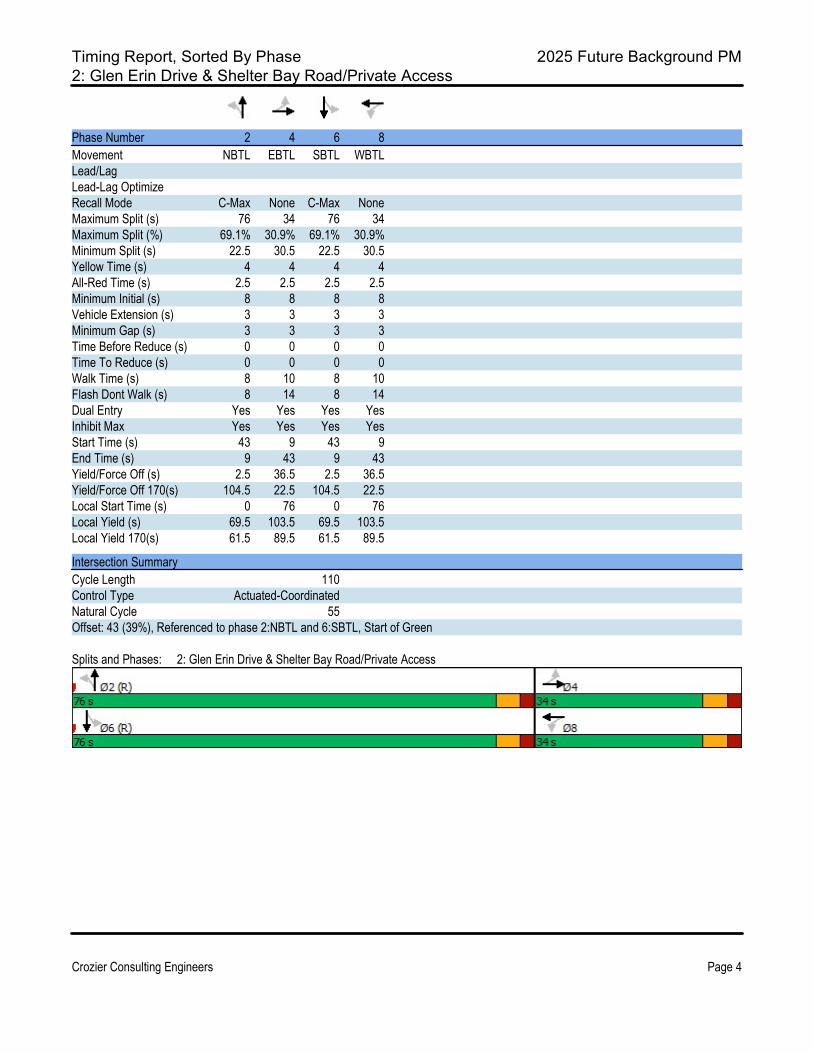
Timing Report, Sorted By Phase 2025 Future Background PM2: Glen Erin Drive & Shelter Bay Road/Private Access
Crozier Consulting Engineers Page 4
Phase Number 2 4 6 8Movement NBTL EBTL SBTL WBTLLead/LagLead-Lag OptimizeRecall Mode C-Max None C-Max NoneMaximum Split (s) 76 34 76 34Maximum Split (%) 69.1% 30.9% 69.1% 30.9%Minimum Split (s) 22.5 30.5 22.5 30.5Yellow Time (s) 4 4 4 4All-Red Time (s) 2.5 2.5 2.5 2.5Minimum Initial (s) 8 8 8 8Vehicle Extension (s) 3 3 3 3Minimum Gap (s) 3 3 3 3Time Before Reduce (s) 0 0 0 0Time To Reduce (s) 0 0 0 0Walk Time (s) 8 10 8 10Flash Dont Walk (s) 8 14 8 14Dual Entry Yes Yes Yes YesInhibit Max Yes Yes Yes YesStart Time (s) 43 9 43 9End Time (s) 9 43 9 43Yield/Force Off (s) 2.5 36.5 2.5 36.5Yield/Force Off 170(s) 104.5 22.5 104.5 22.5Local Start Time (s) 0 76 0 76Local Yield (s) 69.5 103.5 69.5 103.5Local Yield 170(s) 61.5 89.5 61.5 89.5
Intersection SummaryCycle Length 110Control Type Actuated-CoordinatedNatural Cycle 55Offset: 43 (39%), Referenced to phase 2:NBTL and 6:SBTL, Start of Green
Splits and Phases: 2: Glen Erin Drive & Shelter Bay Road/Private Access
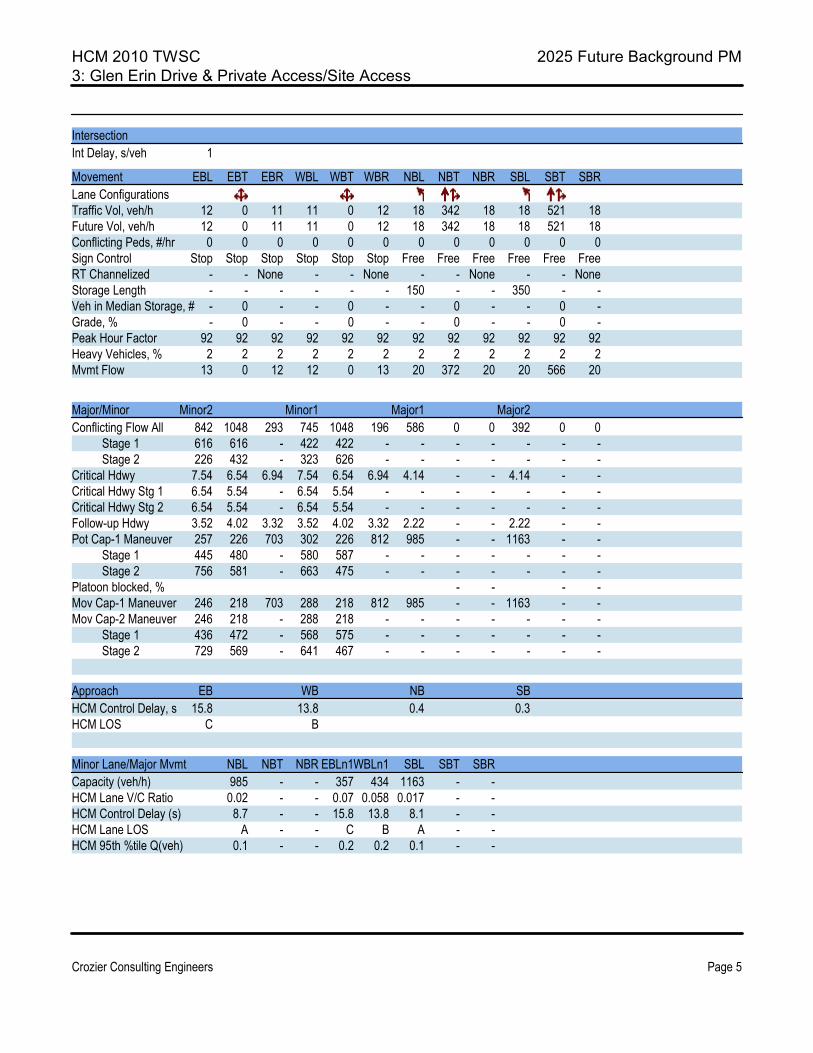
HCM 2010 TWSC 2025 Future Background PM3: Glen Erin Drive & Private Access/Site Access
Crozier Consulting Engineers Page 5
IntersectionInt Delay, s/veh 1
Movement EBL EBT EBR WBL WBT WBR NBL NBT NBR SBL SBT SBRLane ConfigurationsTraffic Vol, veh/h 12 0 11 11 0 12 18 342 18 18 521 18Future Vol, veh/h 12 0 11 11 0 12 18 342 18 18 521 18Conflicting Peds, #/hr 0 0 0 0 0 0 0 0 0 0 0 0Sign Control Stop Stop Stop Stop Stop Stop Free Free Free Free Free FreeRT Channelized - - None - - None - - None - - NoneStorage Length - - - - - - 150 - - 350 - -Veh in Median Storage, # - 0 - - 0 - - 0 - - 0 -Grade, % - 0 - - 0 - - 0 - - 0 -Peak Hour Factor 92 92 92 92 92 92 92 92 92 92 92 92Heavy Vehicles, % 2 2 2 2 2 2 2 2 2 2 2 2Mvmt Flow 13 0 12 12 0 13 20 372 20 20 566 20
Major/Minor Minor2 Minor1 Major1 Major2Conflicting Flow All 842 1048 293 745 1048 196 586 0 0 392 0 0 Stage 1 616 616 - 422 422 - - - - - - - Stage 2 226 432 - 323 626 - - - - - - -Critical Hdwy 7.54 6.54 6.94 7.54 6.54 6.94 4.14 - - 4.14 - -Critical Hdwy Stg 1 6.54 5.54 - 6.54 5.54 - - - - - - -Critical Hdwy Stg 2 6.54 5.54 - 6.54 5.54 - - - - - - -Follow-up Hdwy 3.52 4.02 3.32 3.52 4.02 3.32 2.22 - - 2.22 - -Pot Cap-1 Maneuver 257 226 703 302 226 812 985 - - 1163 - - Stage 1 445 480 - 580 587 - - - - - - - Stage 2 756 581 - 663 475 - - - - - - -Platoon blocked, % - - - -Mov Cap-1 Maneuver 246 218 703 288 218 812 985 - - 1163 - -Mov Cap-2 Maneuver 246 218 - 288 218 - - - - - - - Stage 1 436 472 - 568 575 - - - - - - - Stage 2 729 569 - 641 467 - - - - - - -
Approach EB WB NB SBHCM Control Delay, s 15.8 13.8 0.4 0.3HCM LOS C B
Minor Lane/Major Mvmt NBL NBT NBR EBLn1WBLn1 SBL SBT SBRCapacity (veh/h) 985 - - 357 434 1163 - -HCM Lane V/C Ratio 0.02 - - 0.07 0.058 0.017 - -HCM Control Delay (s) 8.7 - - 15.8 13.8 8.1 - -HCM Lane LOS A - - C B A - -HCM 95th %tile Q(veh) 0.1 - - 0.2 0.2 0.1 - -
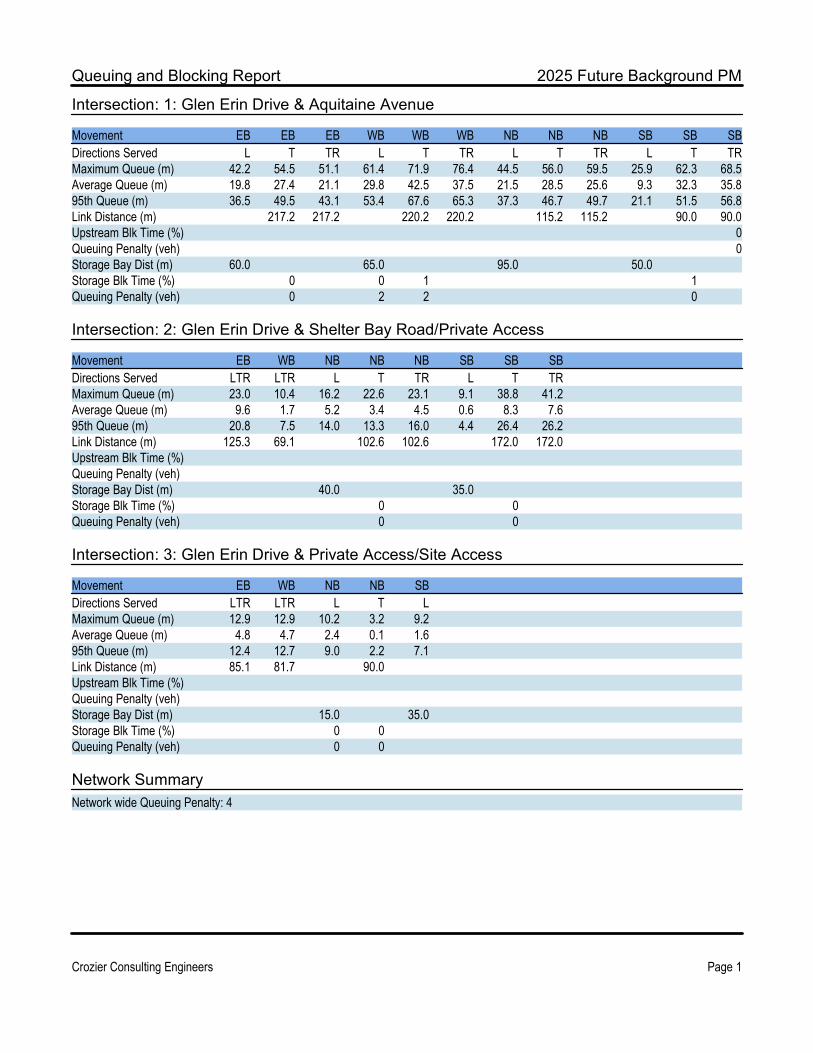
Queuing and Blocking Report 2025 Future Background PM
Crozier Consulting Engineers Page 1
Intersection: 1: Glen Erin Drive & Aquitaine Avenue
Movement EB EB EB WB WB WB NB NB NB SB SB SBDirections Served L T TR L T TR L T TR L T TRMaximum Queue (m) 42.2 54.5 51.1 61.4 71.9 76.4 44.5 56.0 59.5 25.9 62.3 68.5Average Queue (m) 19.8 27.4 21.1 29.8 42.5 37.5 21.5 28.5 25.6 9.3 32.3 35.895th Queue (m) 36.5 49.5 43.1 53.4 67.6 65.3 37.3 46.7 49.7 21.1 51.5 56.8Link Distance (m) 217.2 217.2 220.2 220.2 115.2 115.2 90.0 90.0Upstream Blk Time (%) 0Queuing Penalty (veh) 0Storage Bay Dist (m) 60.0 65.0 95.0 50.0Storage Blk Time (%) 0 0 1 1Queuing Penalty (veh) 0 2 2 0
Intersection: 2: Glen Erin Drive & Shelter Bay Road/Private Access
Movement EB WB NB NB NB SB SB SBDirections Served LTR LTR L T TR L T TRMaximum Queue (m) 23.0 10.4 16.2 22.6 23.1 9.1 38.8 41.2Average Queue (m) 9.6 1.7 5.2 3.4 4.5 0.6 8.3 7.695th Queue (m) 20.8 7.5 14.0 13.3 16.0 4.4 26.4 26.2Link Distance (m) 125.3 69.1 102.6 102.6 172.0 172.0Upstream Blk Time (%)Queuing Penalty (veh)Storage Bay Dist (m) 40.0 35.0Storage Blk Time (%) 0 0Queuing Penalty (veh) 0 0
Intersection: 3: Glen Erin Drive & Private Access/Site Access
Movement EB WB NB NB SBDirections Served LTR LTR L T LMaximum Queue (m) 12.9 12.9 10.2 3.2 9.2Average Queue (m) 4.8 4.7 2.4 0.1 1.695th Queue (m) 12.4 12.7 9.0 2.2 7.1Link Distance (m) 85.1 81.7 90.0Upstream Blk Time (%)Queuing Penalty (veh)Storage Bay Dist (m) 15.0 35.0Storage Blk Time (%) 0 0Queuing Penalty (veh) 0 0
Network SummaryNetwork wide Queuing Penalty: 4

HCM 2010 Signalized Intersection Summary 2025 Total Traffic AM1: Glen Erin Drive & Aquitaine Avenue =
Crozier Consulting Engineers Page 1
Movement EBL EBT EBR WBL WBT WBR NBL NBT NBR SBL SBT SBRLane ConfigurationsTraffic Volume (veh/h) 114 902 61 105 323 49 46 278 281 66 212 116Future Volume (veh/h) 114 902 61 105 323 49 46 278 281 66 212 116Number 5 2 12 1 6 16 3 8 18 7 4 14Initial Q (Qb), veh 0 0 0 0 0 0 0 0 0 0 0 0Ped-Bike Adj(A_pbT) 0.99 0.99 1.00 0.99 0.99 0.98 0.99 0.98Parking Bus, Adj 1.00 1.00 1.00 1.00 1.00 1.00 1.00 1.00 1.00 1.00 1.00 1.00Adj Sat Flow, veh/h/ln 1632 1859 1640 1738 1758 1640 1706 1836 1640 1824 1764 1640Adj Flow Rate, veh/h 124 980 66 114 351 53 50 302 305 72 230 126Adj No. of Lanes 1 2 0 1 2 0 1 2 0 1 2 0Peak Hour Factor 0.92 0.92 0.92 0.92 0.92 0.92 0.92 0.92 0.92 0.92 0.92 0.92Percent Heavy Veh, % 14 2 5 7 9 2 9 4 3 2 7 9Cap, veh/h 494 1869 126 259 1621 242 299 529 465 175 640 337Arrive On Green 0.56 0.56 0.56 0.56 0.56 0.56 0.30 0.30 0.30 0.61 0.61 0.61Sat Flow, veh/h 852 3357 226 501 2910 435 926 1744 1533 789 2110 1110Grp Volume(v), veh/h 124 516 530 114 200 204 50 302 305 72 181 175Grp Sat Flow(s),veh/h/ln 852 1766 1817 501 1670 1676 926 1744 1533 789 1676 1544Q Serve(g_s), s 8.6 18.3 18.3 18.5 6.0 6.1 4.3 14.6 17.3 8.3 5.4 5.8Cycle Q Clear(g_c), s 14.7 18.3 18.3 36.7 6.0 6.1 10.1 14.6 17.3 25.6 5.4 5.8Prop In Lane 1.00 0.12 1.00 0.26 1.00 1.00 1.00 0.72Lane Grp Cap(c), veh/h 494 984 1012 259 930 933 299 529 465 175 508 468V/C Ratio(X) 0.25 0.52 0.52 0.44 0.22 0.22 0.17 0.57 0.66 0.41 0.36 0.37Avail Cap(c_a), veh/h 494 984 1012 259 930 933 417 750 659 275 721 664HCM Platoon Ratio 1.00 1.00 1.00 1.00 1.00 1.00 1.00 1.00 1.00 2.00 2.00 2.00Upstream Filter(I) 1.00 1.00 1.00 1.00 1.00 1.00 1.00 1.00 1.00 1.00 1.00 1.00Uniform Delay (d), s/veh 14.9 13.9 13.9 25.4 11.2 11.2 30.1 29.4 30.3 26.6 14.8 14.9Incr Delay (d2), s/veh 1.2 2.0 1.9 5.3 0.5 0.5 0.3 1.0 1.6 1.6 0.4 0.5Initial Q Delay(d3),s/veh 0.0 0.0 0.0 0.0 0.0 0.0 0.0 0.0 0.0 0.0 0.0 0.0%ile BackOfQ(50%),veh/ln 2.2 9.4 9.7 2.9 2.9 3.0 1.1 7.2 7.5 1.9 2.5 2.5LnGrp Delay(d),s/veh 16.1 15.9 15.8 30.7 11.7 11.7 30.4 30.3 31.9 28.1 15.2 15.3LnGrp LOS B B B C B B C C C C B BApproach Vol, veh/h 1170 518 657 428Approach Delay, s/veh 15.9 15.9 31.1 17.4Approach LOS B B C B
Timer 1 2 3 4 5 6 7 8Assigned Phs 2 4 6 8Phs Duration (G+Y+Rc), s 62.7 37.3 62.7 37.3Change Period (Y+Rc), s 7.0 7.0 7.0 7.0Max Green Setting (Gmax), s 43.0 43.0 43.0 43.0Max Q Clear Time (g_c+I1), s 20.3 27.6 38.7 19.3Green Ext Time (p_c), s 9.9 2.7 1.6 5.3
Intersection SummaryHCM 2010 Ctrl Delay 19.7HCM 2010 LOS B
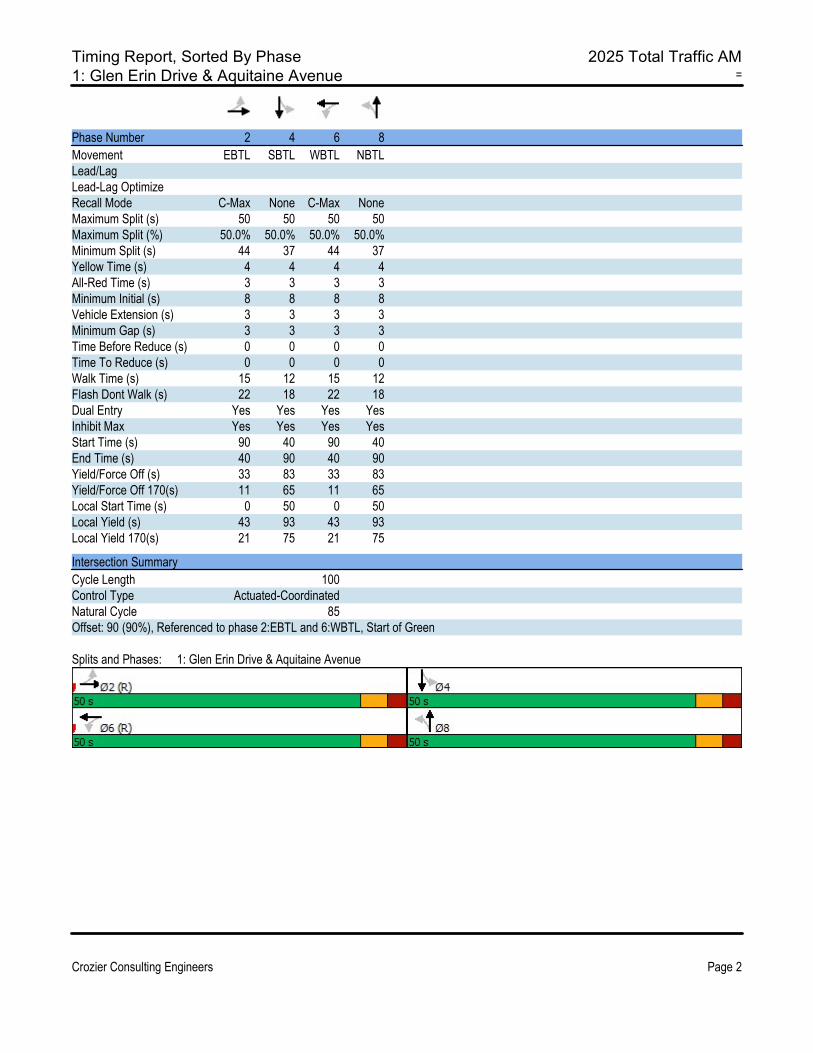
Timing Report, Sorted By Phase 2025 Total Traffic AM1: Glen Erin Drive & Aquitaine Avenue =
Crozier Consulting Engineers Page 2
Phase Number 2 4 6 8Movement EBTL SBTL WBTL NBTLLead/LagLead-Lag OptimizeRecall Mode C-Max None C-Max NoneMaximum Split (s) 50 50 50 50Maximum Split (%) 50.0% 50.0% 50.0% 50.0%Minimum Split (s) 44 37 44 37Yellow Time (s) 4 4 4 4All-Red Time (s) 3 3 3 3Minimum Initial (s) 8 8 8 8Vehicle Extension (s) 3 3 3 3Minimum Gap (s) 3 3 3 3Time Before Reduce (s) 0 0 0 0Time To Reduce (s) 0 0 0 0Walk Time (s) 15 12 15 12Flash Dont Walk (s) 22 18 22 18Dual Entry Yes Yes Yes YesInhibit Max Yes Yes Yes YesStart Time (s) 90 40 90 40End Time (s) 40 90 40 90Yield/Force Off (s) 33 83 33 83Yield/Force Off 170(s) 11 65 11 65Local Start Time (s) 0 50 0 50Local Yield (s) 43 93 43 93Local Yield 170(s) 21 75 21 75
Intersection SummaryCycle Length 100Control Type Actuated-CoordinatedNatural Cycle 85Offset: 90 (90%), Referenced to phase 2:EBTL and 6:WBTL, Start of Green
Splits and Phases: 1: Glen Erin Drive & Aquitaine Avenue

HCM 2010 Signalized Intersection Summary 2025 Total Traffic AM2: Glen Erin Drive & Shelter Bay Road/Private Access =
Crozier Consulting Engineers Page 3
Movement EBL EBT EBR WBL WBT WBR NBL NBT NBR SBL SBT SBRLane ConfigurationsTraffic Volume (veh/h) 37 0 63 13 4 6 82 451 13 2 282 25Future Volume (veh/h) 37 0 63 13 4 6 82 451 13 2 282 25Number 7 4 14 3 8 18 5 2 12 1 6 16Initial Q (Qb), veh 0 0 0 0 0 0 0 0 0 0 0 0Ped-Bike Adj(A_pbT) 0.92 0.92 0.94 0.92 0.99 0.98 0.99 0.98Parking Bus, Adj 1.00 1.00 1.00 1.00 1.00 1.00 1.00 1.00 1.00 1.00 1.00 1.00Adj Sat Flow, veh/h/ln 1860 1791 1640 1860 1900 1640 1788 1829 1640 1860 1774 1640Adj Flow Rate, veh/h 40 0 68 14 4 7 89 490 14 2 307 27Adj No. of Lanes 0 1 0 0 1 0 1 2 0 1 2 0Peak Hour Factor 0.92 0.92 0.92 0.92 0.92 0.92 0.92 0.92 0.92 0.92 0.92 0.92Percent Heavy Veh, % 8 0 5 0 0 0 4 4 0 0 6 20Cap, veh/h 137 19 181 215 65 87 688 2271 65 653 2062 180Arrive On Green 0.21 0.00 0.21 0.21 0.21 0.21 1.00 1.00 1.00 0.66 0.66 0.66Sat Flow, veh/h 414 90 857 750 308 412 992 3448 98 882 3131 273Grp Volume(v), veh/h 108 0 0 25 0 0 89 247 257 2 164 170Grp Sat Flow(s),veh/h/ln 1361 0 0 1470 0 0 992 1737 1809 882 1685 1720Q Serve(g_s), s 3.1 0.0 0.0 0.0 0.0 0.0 0.6 0.0 0.0 0.1 3.7 3.7Cycle Q Clear(g_c), s 6.4 0.0 0.0 1.1 0.0 0.0 4.3 0.0 0.0 0.1 3.7 3.7Prop In Lane 0.37 0.63 0.56 0.28 1.00 0.05 1.00 0.16Lane Grp Cap(c), veh/h 337 0 0 367 0 0 688 1144 1191 653 1109 1132V/C Ratio(X) 0.32 0.00 0.00 0.07 0.00 0.00 0.13 0.22 0.22 0.00 0.15 0.15Avail Cap(c_a), veh/h 422 0 0 456 0 0 688 1144 1191 653 1109 1132HCM Platoon Ratio 1.00 1.00 1.00 1.00 1.00 1.00 2.00 2.00 2.00 1.00 1.00 1.00Upstream Filter(I) 1.00 0.00 0.00 1.00 0.00 0.00 1.00 1.00 1.00 1.00 1.00 1.00Uniform Delay (d), s/veh 33.5 0.0 0.0 31.5 0.0 0.0 0.1 0.0 0.0 5.8 6.5 6.5Incr Delay (d2), s/veh 0.5 0.0 0.0 0.1 0.0 0.0 0.4 0.4 0.4 0.0 0.3 0.3Initial Q Delay(d3),s/veh 0.0 0.0 0.0 0.0 0.0 0.0 0.0 0.0 0.0 0.0 0.0 0.0%ile BackOfQ(50%),veh/ln 2.6 0.0 0.0 0.6 0.0 0.0 0.2 0.1 0.1 0.0 1.8 1.8LnGrp Delay(d),s/veh 34.1 0.0 0.0 31.6 0.0 0.0 0.5 0.4 0.4 5.9 6.7 6.8LnGrp LOS C C A A A A A AApproach Vol, veh/h 108 25 593 336Approach Delay, s/veh 34.1 31.6 0.4 6.7Approach LOS C C A A
Timer 1 2 3 4 5 6 7 8Assigned Phs 2 4 6 8Phs Duration (G+Y+Rc), s 72.3 27.7 72.3 27.7Change Period (Y+Rc), s 6.5 6.5 6.5 6.5Max Green Setting (Gmax), s 59.5 27.5 59.5 27.5Max Q Clear Time (g_c+I1), s 6.3 8.4 5.7 3.1Green Ext Time (p_c), s 4.9 0.6 2.6 0.1
Intersection SummaryHCM 2010 Ctrl Delay 6.6HCM 2010 LOS A
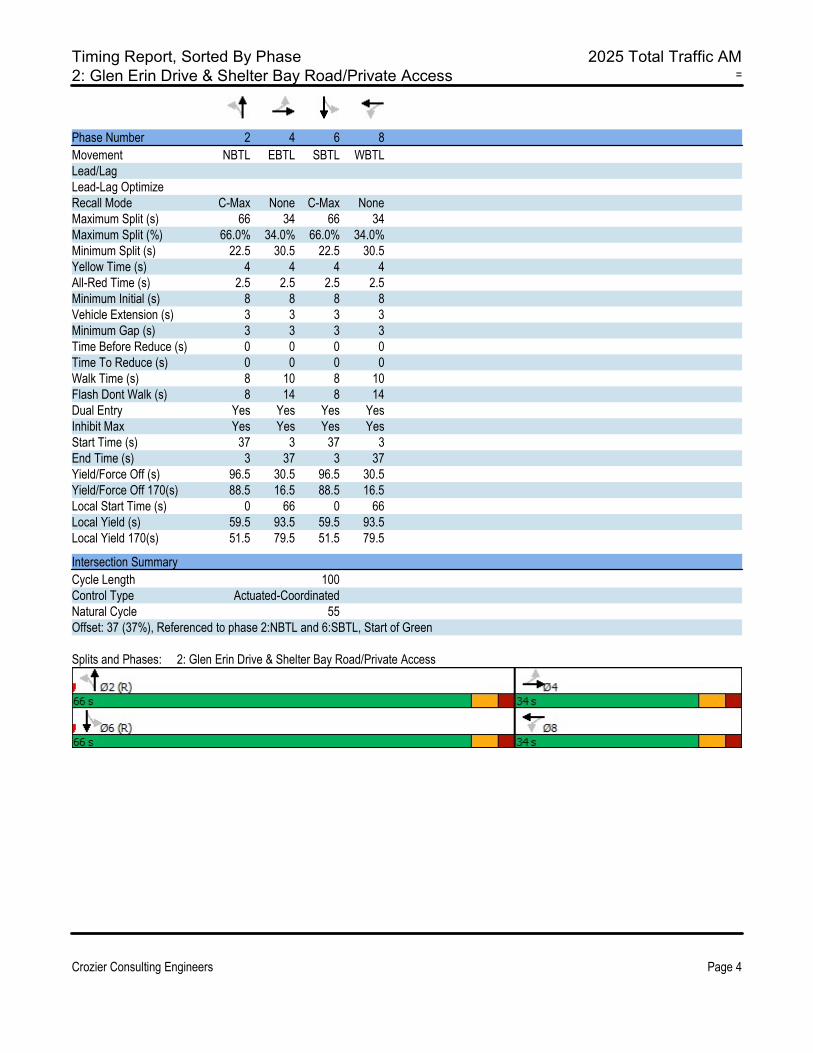
Timing Report, Sorted By Phase 2025 Total Traffic AM2: Glen Erin Drive & Shelter Bay Road/Private Access =
Crozier Consulting Engineers Page 4
Phase Number 2 4 6 8Movement NBTL EBTL SBTL WBTLLead/LagLead-Lag OptimizeRecall Mode C-Max None C-Max NoneMaximum Split (s) 66 34 66 34Maximum Split (%) 66.0% 34.0% 66.0% 34.0%Minimum Split (s) 22.5 30.5 22.5 30.5Yellow Time (s) 4 4 4 4All-Red Time (s) 2.5 2.5 2.5 2.5Minimum Initial (s) 8 8 8 8Vehicle Extension (s) 3 3 3 3Minimum Gap (s) 3 3 3 3Time Before Reduce (s) 0 0 0 0Time To Reduce (s) 0 0 0 0Walk Time (s) 8 10 8 10Flash Dont Walk (s) 8 14 8 14Dual Entry Yes Yes Yes YesInhibit Max Yes Yes Yes YesStart Time (s) 37 3 37 3End Time (s) 3 37 3 37Yield/Force Off (s) 96.5 30.5 96.5 30.5Yield/Force Off 170(s) 88.5 16.5 88.5 16.5Local Start Time (s) 0 66 0 66Local Yield (s) 59.5 93.5 59.5 93.5Local Yield 170(s) 51.5 79.5 51.5 79.5
Intersection SummaryCycle Length 100Control Type Actuated-CoordinatedNatural Cycle 55Offset: 37 (37%), Referenced to phase 2:NBTL and 6:SBTL, Start of Green
Splits and Phases: 2: Glen Erin Drive & Shelter Bay Road/Private Access
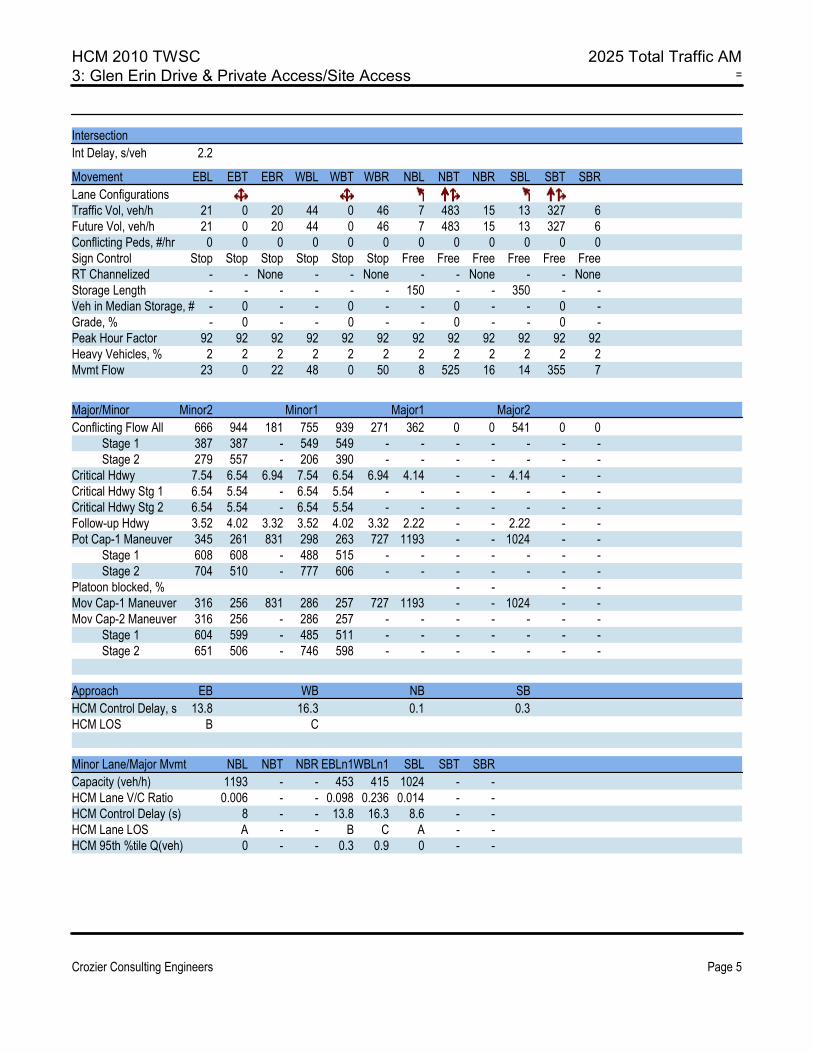
HCM 2010 TWSC 2025 Total Traffic AM3: Glen Erin Drive & Private Access/Site Access =
Crozier Consulting Engineers Page 5
IntersectionInt Delay, s/veh 2.2
Movement EBL EBT EBR WBL WBT WBR NBL NBT NBR SBL SBT SBRLane ConfigurationsTraffic Vol, veh/h 21 0 20 44 0 46 7 483 15 13 327 6Future Vol, veh/h 21 0 20 44 0 46 7 483 15 13 327 6Conflicting Peds, #/hr 0 0 0 0 0 0 0 0 0 0 0 0Sign Control Stop Stop Stop Stop Stop Stop Free Free Free Free Free FreeRT Channelized - - None - - None - - None - - NoneStorage Length - - - - - - 150 - - 350 - -Veh in Median Storage, # - 0 - - 0 - - 0 - - 0 -Grade, % - 0 - - 0 - - 0 - - 0 -Peak Hour Factor 92 92 92 92 92 92 92 92 92 92 92 92Heavy Vehicles, % 2 2 2 2 2 2 2 2 2 2 2 2Mvmt Flow 23 0 22 48 0 50 8 525 16 14 355 7
Major/Minor Minor2 Minor1 Major1 Major2Conflicting Flow All 666 944 181 755 939 271 362 0 0 541 0 0 Stage 1 387 387 - 549 549 - - - - - - - Stage 2 279 557 - 206 390 - - - - - - -Critical Hdwy 7.54 6.54 6.94 7.54 6.54 6.94 4.14 - - 4.14 - -Critical Hdwy Stg 1 6.54 5.54 - 6.54 5.54 - - - - - - -Critical Hdwy Stg 2 6.54 5.54 - 6.54 5.54 - - - - - - -Follow-up Hdwy 3.52 4.02 3.32 3.52 4.02 3.32 2.22 - - 2.22 - -Pot Cap-1 Maneuver 345 261 831 298 263 727 1193 - - 1024 - - Stage 1 608 608 - 488 515 - - - - - - - Stage 2 704 510 - 777 606 - - - - - - -Platoon blocked, % - - - -Mov Cap-1 Maneuver 316 256 831 286 257 727 1193 - - 1024 - -Mov Cap-2 Maneuver 316 256 - 286 257 - - - - - - - Stage 1 604 599 - 485 511 - - - - - - - Stage 2 651 506 - 746 598 - - - - - - -
Approach EB WB NB SBHCM Control Delay, s 13.8 16.3 0.1 0.3HCM LOS B C
Minor Lane/Major Mvmt NBL NBT NBR EBLn1WBLn1 SBL SBT SBRCapacity (veh/h) 1193 - - 453 415 1024 - -HCM Lane V/C Ratio 0.006 - - 0.098 0.236 0.014 - -HCM Control Delay (s) 8 - - 13.8 16.3 8.6 - -HCM Lane LOS A - - B C A - -HCM 95th %tile Q(veh) 0 - - 0.3 0.9 0 - -
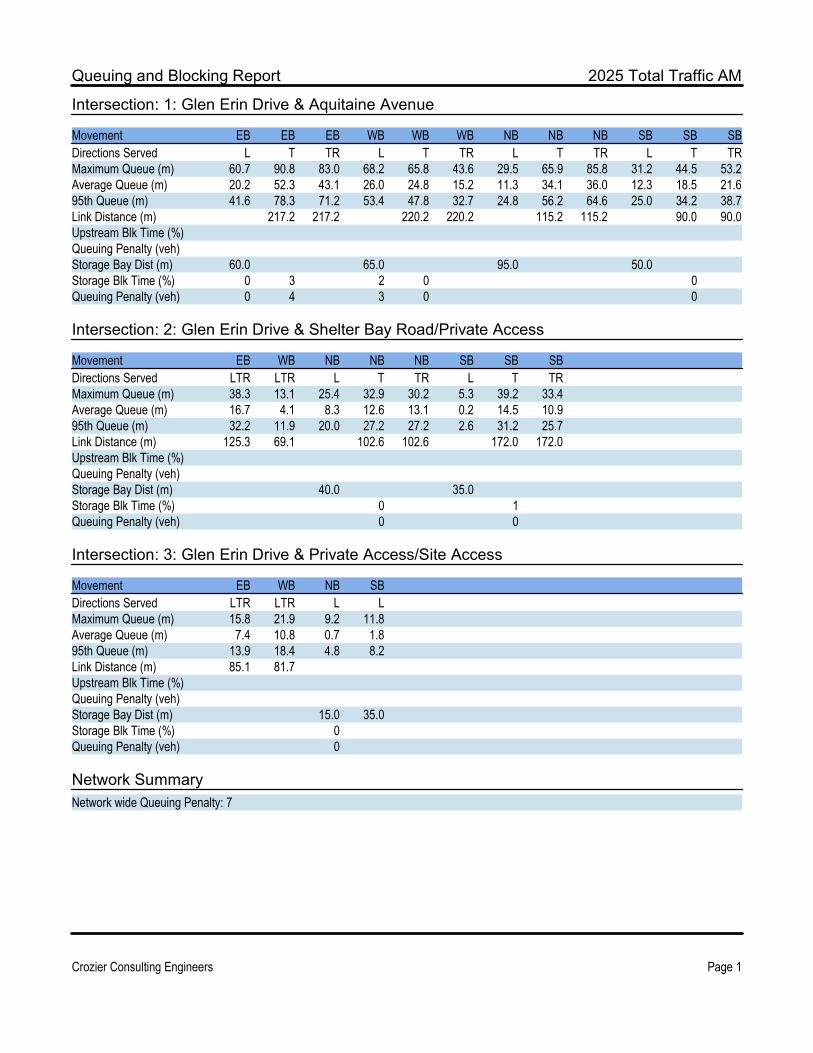
Queuing and Blocking Report 2025 Total Traffic AM
Crozier Consulting Engineers Page 1
Intersection: 1: Glen Erin Drive & Aquitaine Avenue
Movement EB EB EB WB WB WB NB NB NB SB SB SBDirections Served L T TR L T TR L T TR L T TRMaximum Queue (m) 60.7 90.8 83.0 68.2 65.8 43.6 29.5 65.9 85.8 31.2 44.5 53.2Average Queue (m) 20.2 52.3 43.1 26.0 24.8 15.2 11.3 34.1 36.0 12.3 18.5 21.695th Queue (m) 41.6 78.3 71.2 53.4 47.8 32.7 24.8 56.2 64.6 25.0 34.2 38.7Link Distance (m) 217.2 217.2 220.2 220.2 115.2 115.2 90.0 90.0Upstream Blk Time (%)Queuing Penalty (veh)Storage Bay Dist (m) 60.0 65.0 95.0 50.0Storage Blk Time (%) 0 3 2 0 0Queuing Penalty (veh) 0 4 3 0 0
Intersection: 2: Glen Erin Drive & Shelter Bay Road/Private Access
Movement EB WB NB NB NB SB SB SBDirections Served LTR LTR L T TR L T TRMaximum Queue (m) 38.3 13.1 25.4 32.9 30.2 5.3 39.2 33.4Average Queue (m) 16.7 4.1 8.3 12.6 13.1 0.2 14.5 10.995th Queue (m) 32.2 11.9 20.0 27.2 27.2 2.6 31.2 25.7Link Distance (m) 125.3 69.1 102.6 102.6 172.0 172.0Upstream Blk Time (%)Queuing Penalty (veh)Storage Bay Dist (m) 40.0 35.0Storage Blk Time (%) 0 1Queuing Penalty (veh) 0 0
Intersection: 3: Glen Erin Drive & Private Access/Site Access
Movement EB WB NB SBDirections Served LTR LTR L LMaximum Queue (m) 15.8 21.9 9.2 11.8Average Queue (m) 7.4 10.8 0.7 1.895th Queue (m) 13.9 18.4 4.8 8.2Link Distance (m) 85.1 81.7Upstream Blk Time (%)Queuing Penalty (veh)Storage Bay Dist (m) 15.0 35.0Storage Blk Time (%) 0Queuing Penalty (veh) 0
Network SummaryNetwork wide Queuing Penalty: 7
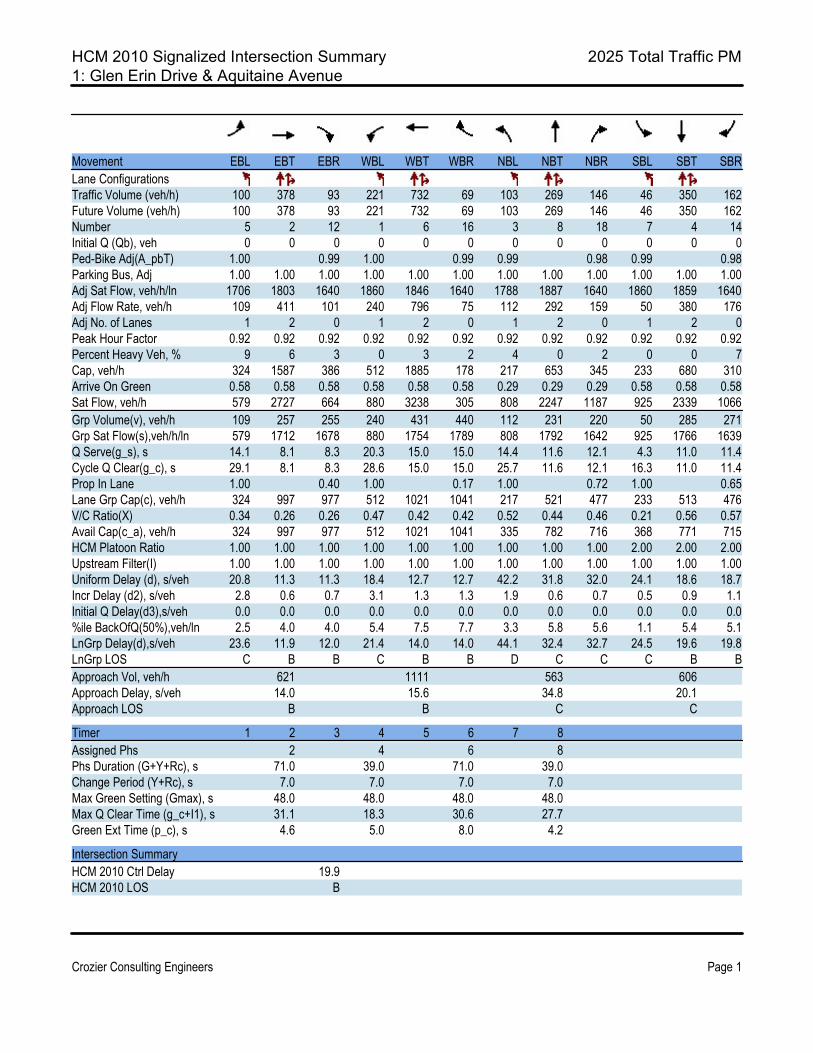
HCM 2010 Signalized Intersection Summary 2025 Total Traffic PM1: Glen Erin Drive & Aquitaine Avenue
Crozier Consulting Engineers Page 1
Movement EBL EBT EBR WBL WBT WBR NBL NBT NBR SBL SBT SBRLane ConfigurationsTraffic Volume (veh/h) 100 378 93 221 732 69 103 269 146 46 350 162Future Volume (veh/h) 100 378 93 221 732 69 103 269 146 46 350 162Number 5 2 12 1 6 16 3 8 18 7 4 14Initial Q (Qb), veh 0 0 0 0 0 0 0 0 0 0 0 0Ped-Bike Adj(A_pbT) 1.00 0.99 1.00 0.99 0.99 0.98 0.99 0.98Parking Bus, Adj 1.00 1.00 1.00 1.00 1.00 1.00 1.00 1.00 1.00 1.00 1.00 1.00Adj Sat Flow, veh/h/ln 1706 1803 1640 1860 1846 1640 1788 1887 1640 1860 1859 1640Adj Flow Rate, veh/h 109 411 101 240 796 75 112 292 159 50 380 176Adj No. of Lanes 1 2 0 1 2 0 1 2 0 1 2 0Peak Hour Factor 0.92 0.92 0.92 0.92 0.92 0.92 0.92 0.92 0.92 0.92 0.92 0.92Percent Heavy Veh, % 9 6 3 0 3 2 4 0 2 0 0 7Cap, veh/h 324 1587 386 512 1885 178 217 653 345 233 680 310Arrive On Green 0.58 0.58 0.58 0.58 0.58 0.58 0.29 0.29 0.29 0.58 0.58 0.58Sat Flow, veh/h 579 2727 664 880 3238 305 808 2247 1187 925 2339 1066Grp Volume(v), veh/h 109 257 255 240 431 440 112 231 220 50 285 271Grp Sat Flow(s),veh/h/ln 579 1712 1678 880 1754 1789 808 1792 1642 925 1766 1639Q Serve(g_s), s 14.1 8.1 8.3 20.3 15.0 15.0 14.4 11.6 12.1 4.3 11.0 11.4Cycle Q Clear(g_c), s 29.1 8.1 8.3 28.6 15.0 15.0 25.7 11.6 12.1 16.3 11.0 11.4Prop In Lane 1.00 0.40 1.00 0.17 1.00 0.72 1.00 0.65Lane Grp Cap(c), veh/h 324 997 977 512 1021 1041 217 521 477 233 513 476V/C Ratio(X) 0.34 0.26 0.26 0.47 0.42 0.42 0.52 0.44 0.46 0.21 0.56 0.57Avail Cap(c_a), veh/h 324 997 977 512 1021 1041 335 782 716 368 771 715HCM Platoon Ratio 1.00 1.00 1.00 1.00 1.00 1.00 1.00 1.00 1.00 2.00 2.00 2.00Upstream Filter(I) 1.00 1.00 1.00 1.00 1.00 1.00 1.00 1.00 1.00 1.00 1.00 1.00Uniform Delay (d), s/veh 20.8 11.3 11.3 18.4 12.7 12.7 42.2 31.8 32.0 24.1 18.6 18.7Incr Delay (d2), s/veh 2.8 0.6 0.7 3.1 1.3 1.3 1.9 0.6 0.7 0.5 0.9 1.1Initial Q Delay(d3),s/veh 0.0 0.0 0.0 0.0 0.0 0.0 0.0 0.0 0.0 0.0 0.0 0.0%ile BackOfQ(50%),veh/ln 2.5 4.0 4.0 5.4 7.5 7.7 3.3 5.8 5.6 1.1 5.4 5.1LnGrp Delay(d),s/veh 23.6 11.9 12.0 21.4 14.0 14.0 44.1 32.4 32.7 24.5 19.6 19.8LnGrp LOS C B B C B B D C C C B BApproach Vol, veh/h 621 1111 563 606Approach Delay, s/veh 14.0 15.6 34.8 20.1Approach LOS B B C C
Timer 1 2 3 4 5 6 7 8Assigned Phs 2 4 6 8Phs Duration (G+Y+Rc), s 71.0 39.0 71.0 39.0Change Period (Y+Rc), s 7.0 7.0 7.0 7.0Max Green Setting (Gmax), s 48.0 48.0 48.0 48.0Max Q Clear Time (g_c+I1), s 31.1 18.3 30.6 27.7Green Ext Time (p_c), s 4.6 5.0 8.0 4.2
Intersection SummaryHCM 2010 Ctrl Delay 19.9HCM 2010 LOS B
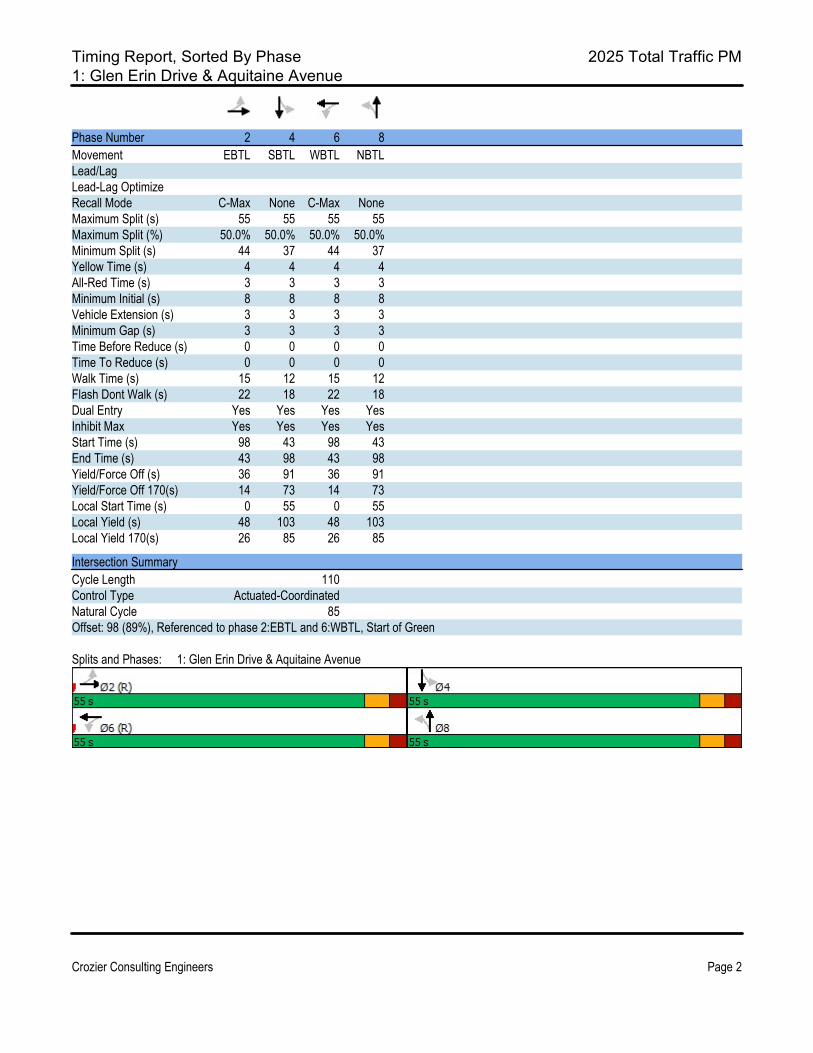
Timing Report, Sorted By Phase 2025 Total Traffic PM1: Glen Erin Drive & Aquitaine Avenue
Crozier Consulting Engineers Page 2
Phase Number 2 4 6 8Movement EBTL SBTL WBTL NBTLLead/LagLead-Lag OptimizeRecall Mode C-Max None C-Max NoneMaximum Split (s) 55 55 55 55Maximum Split (%) 50.0% 50.0% 50.0% 50.0%Minimum Split (s) 44 37 44 37Yellow Time (s) 4 4 4 4All-Red Time (s) 3 3 3 3Minimum Initial (s) 8 8 8 8Vehicle Extension (s) 3 3 3 3Minimum Gap (s) 3 3 3 3Time Before Reduce (s) 0 0 0 0Time To Reduce (s) 0 0 0 0Walk Time (s) 15 12 15 12Flash Dont Walk (s) 22 18 22 18Dual Entry Yes Yes Yes YesInhibit Max Yes Yes Yes YesStart Time (s) 98 43 98 43End Time (s) 43 98 43 98Yield/Force Off (s) 36 91 36 91Yield/Force Off 170(s) 14 73 14 73Local Start Time (s) 0 55 0 55Local Yield (s) 48 103 48 103Local Yield 170(s) 26 85 26 85
Intersection SummaryCycle Length 110Control Type Actuated-CoordinatedNatural Cycle 85Offset: 98 (89%), Referenced to phase 2:EBTL and 6:WBTL, Start of Green
Splits and Phases: 1: Glen Erin Drive & Aquitaine Avenue

HCM 2010 Signalized Intersection Summary 2025 Total Traffic PM2: Glen Erin Drive & Shelter Bay Road/Private Access
Crozier Consulting Engineers Page 3
Movement EBL EBT EBR WBL WBT WBR NBL NBT NBR SBL SBT SBRLane ConfigurationsTraffic Volume (veh/h) 14 2 32 3 0 3 50 321 7 5 509 48Future Volume (veh/h) 14 2 32 3 0 3 50 321 7 5 509 48Number 7 4 14 3 8 18 5 2 12 1 6 16Initial Q (Qb), veh 0 0 0 0 0 0 0 0 0 0 0 0Ped-Bike Adj(A_pbT) 0.98 0.98 0.99 0.98 1.00 1.00 1.00 1.00Parking Bus, Adj 1.00 1.00 1.00 1.00 1.00 1.00 1.00 1.00 1.00 1.00 1.00 1.00Adj Sat Flow, veh/h/ln 1900 1900 1900 1900 1900 1900 1900 1811 1900 1900 1866 1900Adj Flow Rate, veh/h 15 2 35 3 0 3 54 349 8 5 553 52Adj No. of Lanes 0 1 0 0 1 0 1 2 0 1 2 0Peak Hour Factor 0.92 0.92 0.92 0.92 0.92 0.92 0.92 0.92 0.92 0.92 0.92 0.92Percent Heavy Veh, % 0 0 0 0 0 0 0 5 0 0 2 0Cap, veh/h 65 20 89 100 15 66 692 2747 63 895 2616 245Arrive On Green 0.08 0.08 0.08 0.08 0.00 0.08 1.00 1.00 1.00 0.80 0.80 0.80Sat Flow, veh/h 279 241 1071 608 181 789 827 3439 79 1039 3276 307Grp Volume(v), veh/h 52 0 0 6 0 0 54 174 183 5 299 306Grp Sat Flow(s),veh/h/ln 1591 0 0 1578 0 0 827 1721 1797 1039 1773 1811Q Serve(g_s), s 0.0 0.0 0.0 0.0 0.0 0.0 0.4 0.0 0.0 0.1 4.5 4.5Cycle Q Clear(g_c), s 3.2 0.0 0.0 0.4 0.0 0.0 4.9 0.0 0.0 0.1 4.5 4.5Prop In Lane 0.29 0.67 0.50 0.50 1.00 0.04 1.00 0.17Lane Grp Cap(c), veh/h 174 0 0 180 0 0 692 1374 1435 895 1416 1446V/C Ratio(X) 0.30 0.00 0.00 0.03 0.00 0.00 0.08 0.13 0.13 0.01 0.21 0.21Avail Cap(c_a), veh/h 432 0 0 426 0 0 692 1374 1435 895 1416 1446HCM Platoon Ratio 1.00 1.00 1.00 1.00 1.00 1.00 2.00 2.00 2.00 1.00 1.00 1.00Upstream Filter(I) 1.00 0.00 0.00 1.00 0.00 0.00 1.00 1.00 1.00 1.00 1.00 1.00Uniform Delay (d), s/veh 47.7 0.0 0.0 46.4 0.0 0.0 0.1 0.0 0.0 2.2 2.7 2.7Incr Delay (d2), s/veh 0.9 0.0 0.0 0.1 0.0 0.0 0.2 0.2 0.2 0.0 0.3 0.3Initial Q Delay(d3),s/veh 0.0 0.0 0.0 0.0 0.0 0.0 0.0 0.0 0.0 0.0 0.0 0.0%ile BackOfQ(50%),veh/ln 1.5 0.0 0.0 0.2 0.0 0.0 0.1 0.1 0.1 0.0 2.3 2.3LnGrp Delay(d),s/veh 48.7 0.0 0.0 46.5 0.0 0.0 0.3 0.2 0.2 2.3 3.0 3.0LnGrp LOS D D A A A A A AApproach Vol, veh/h 52 6 411 610Approach Delay, s/veh 48.7 46.5 0.2 3.0Approach LOS D D A A
Timer 1 2 3 4 5 6 7 8Assigned Phs 2 4 6 8Phs Duration (G+Y+Rc), s 94.4 15.6 94.4 15.6Change Period (Y+Rc), s 6.5 6.5 6.5 6.5Max Green Setting (Gmax), s 69.5 27.5 69.5 27.5Max Q Clear Time (g_c+I1), s 6.9 5.2 6.5 2.4Green Ext Time (p_c), s 3.3 0.2 5.3 0.0
Intersection SummaryHCM 2010 Ctrl Delay 4.4HCM 2010 LOS A
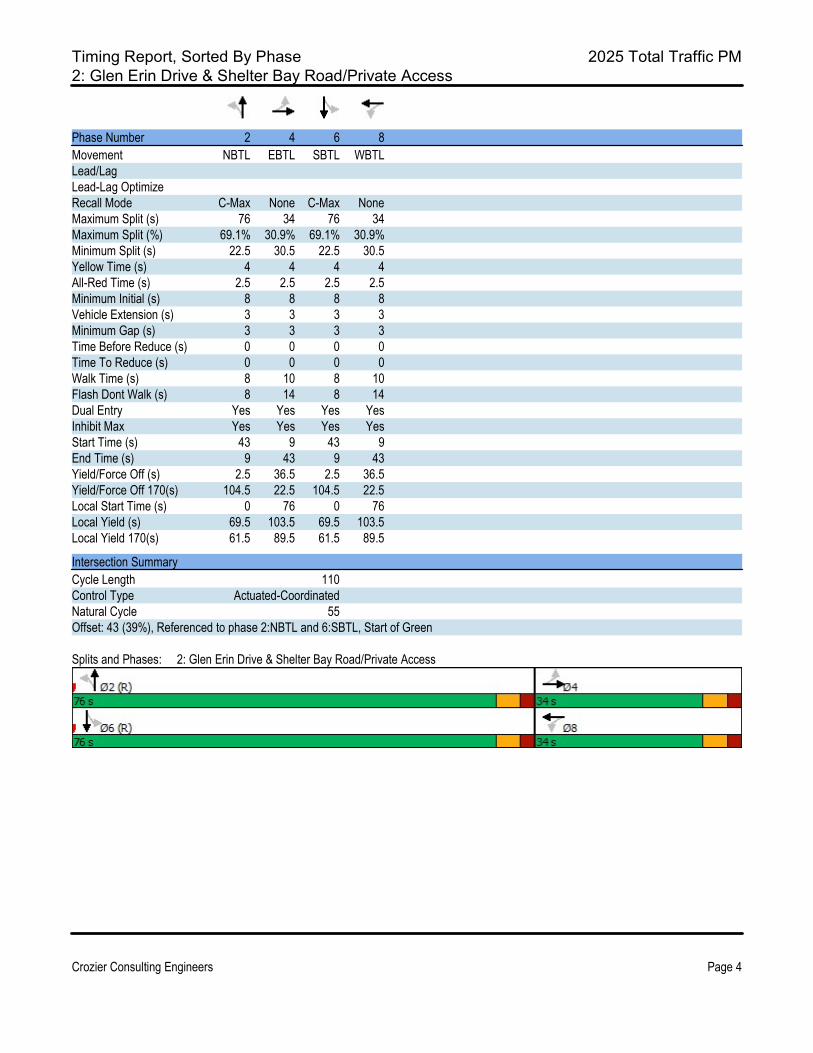
Timing Report, Sorted By Phase 2025 Total Traffic PM2: Glen Erin Drive & Shelter Bay Road/Private Access
Crozier Consulting Engineers Page 4
Phase Number 2 4 6 8Movement NBTL EBTL SBTL WBTLLead/LagLead-Lag OptimizeRecall Mode C-Max None C-Max NoneMaximum Split (s) 76 34 76 34Maximum Split (%) 69.1% 30.9% 69.1% 30.9%Minimum Split (s) 22.5 30.5 22.5 30.5Yellow Time (s) 4 4 4 4All-Red Time (s) 2.5 2.5 2.5 2.5Minimum Initial (s) 8 8 8 8Vehicle Extension (s) 3 3 3 3Minimum Gap (s) 3 3 3 3Time Before Reduce (s) 0 0 0 0Time To Reduce (s) 0 0 0 0Walk Time (s) 8 10 8 10Flash Dont Walk (s) 8 14 8 14Dual Entry Yes Yes Yes YesInhibit Max Yes Yes Yes YesStart Time (s) 43 9 43 9End Time (s) 9 43 9 43Yield/Force Off (s) 2.5 36.5 2.5 36.5Yield/Force Off 170(s) 104.5 22.5 104.5 22.5Local Start Time (s) 0 76 0 76Local Yield (s) 69.5 103.5 69.5 103.5Local Yield 170(s) 61.5 89.5 61.5 89.5
Intersection SummaryCycle Length 110Control Type Actuated-CoordinatedNatural Cycle 55Offset: 43 (39%), Referenced to phase 2:NBTL and 6:SBTL, Start of Green
Splits and Phases: 2: Glen Erin Drive & Shelter Bay Road/Private Access

HCM 2010 TWSC 2025 Total Traffic PM3: Glen Erin Drive & Private Access/Site Access
Crozier Consulting Engineers Page 5
IntersectionInt Delay, s/veh 1.6
Movement EBL EBT EBR WBL WBT WBR NBL NBT NBR SBL SBT SBRLane ConfigurationsTraffic Vol, veh/h 12 0 11 25 0 27 18 342 40 40 521 18Future Vol, veh/h 12 0 11 25 0 27 18 342 40 40 521 18Conflicting Peds, #/hr 0 0 0 0 0 0 0 0 0 0 0 0Sign Control Stop Stop Stop Stop Stop Stop Free Free Free Free Free FreeRT Channelized - - None - - None - - None - - NoneStorage Length - - - - - - 150 - - 350 - -Veh in Median Storage, # - 0 - - 0 - - 0 - - 0 -Grade, % - 0 - - 0 - - 0 - - 0 -Peak Hour Factor 92 92 92 92 92 92 92 92 92 92 92 92Heavy Vehicles, % 2 2 2 2 2 2 2 2 2 2 2 2Mvmt Flow 13 0 12 27 0 29 20 372 43 43 566 20
Major/Minor Minor2 Minor1 Major1 Major2Conflicting Flow All 888 1117 293 803 1106 208 586 0 0 415 0 0 Stage 1 662 662 - 434 434 - - - - - - - Stage 2 226 455 - 369 672 - - - - - - -Critical Hdwy 7.54 6.54 6.94 7.54 6.54 6.94 4.14 - - 4.14 - -Critical Hdwy Stg 1 6.54 5.54 - 6.54 5.54 - - - - - - -Critical Hdwy Stg 2 6.54 5.54 - 6.54 5.54 - - - - - - -Follow-up Hdwy 3.52 4.02 3.32 3.52 4.02 3.32 2.22 - - 2.22 - -Pot Cap-1 Maneuver 238 206 703 275 209 798 985 - - 1140 - - Stage 1 417 457 - 570 579 - - - - - - - Stage 2 756 567 - 623 453 - - - - - - -Platoon blocked, % - - - -Mov Cap-1 Maneuver 219 194 703 259 197 798 985 - - 1140 - -Mov Cap-2 Maneuver 219 194 - 259 197 - - - - - - - Stage 1 409 440 - 559 567 - - - - - - - Stage 2 713 556 - 589 436 - - - - - - -
Approach EB WB NB SBHCM Control Delay, s 16.9 15.5 0.4 0.6HCM LOS C C
Minor Lane/Major Mvmt NBL NBT NBR EBLn1WBLn1 SBL SBT SBRCapacity (veh/h) 985 - - 327 399 1140 - -HCM Lane V/C Ratio 0.02 - - 0.076 0.142 0.038 - -HCM Control Delay (s) 8.7 - - 16.9 15.5 8.3 - -HCM Lane LOS A - - C C A - -HCM 95th %tile Q(veh) 0.1 - - 0.2 0.5 0.1 - -
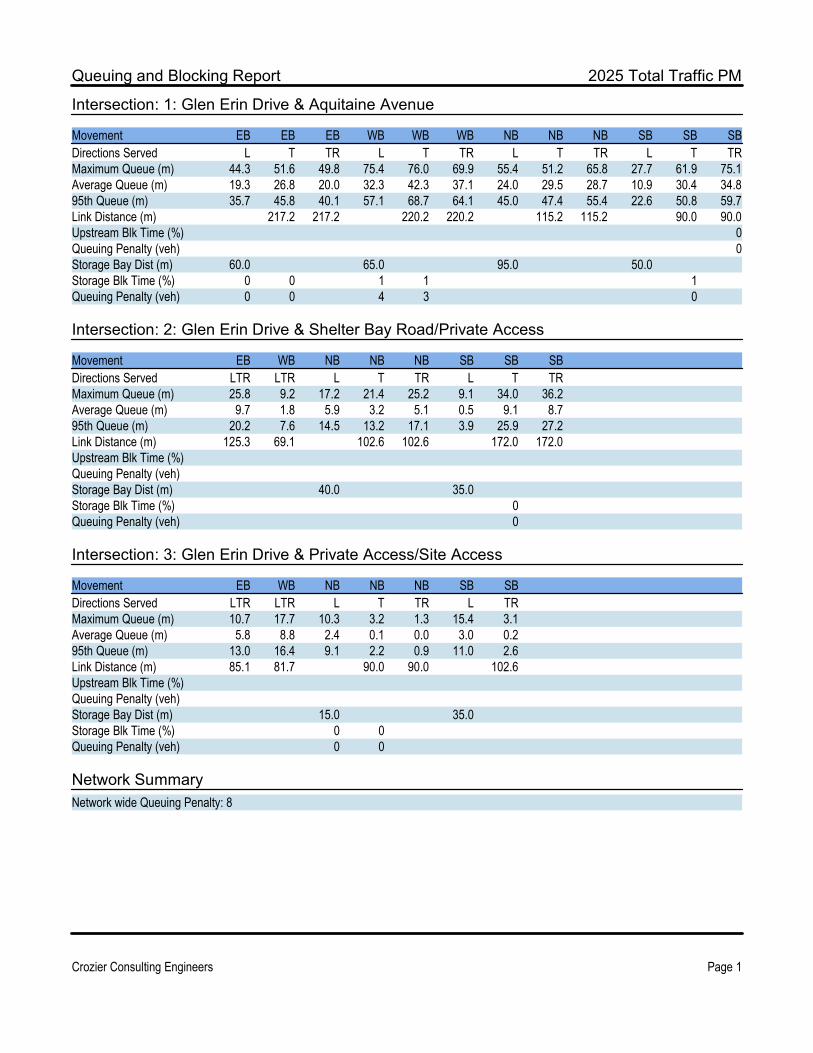
Queuing and Blocking Report 2025 Total Traffic PM
Crozier Consulting Engineers Page 1
Intersection: 1: Glen Erin Drive & Aquitaine Avenue
Movement EB EB EB WB WB WB NB NB NB SB SB SBDirections Served L T TR L T TR L T TR L T TRMaximum Queue (m) 44.3 51.6 49.8 75.4 76.0 69.9 55.4 51.2 65.8 27.7 61.9 75.1Average Queue (m) 19.3 26.8 20.0 32.3 42.3 37.1 24.0 29.5 28.7 10.9 30.4 34.895th Queue (m) 35.7 45.8 40.1 57.1 68.7 64.1 45.0 47.4 55.4 22.6 50.8 59.7Link Distance (m) 217.2 217.2 220.2 220.2 115.2 115.2 90.0 90.0Upstream Blk Time (%) 0Queuing Penalty (veh) 0Storage Bay Dist (m) 60.0 65.0 95.0 50.0Storage Blk Time (%) 0 0 1 1 1Queuing Penalty (veh) 0 0 4 3 0
Intersection: 2: Glen Erin Drive & Shelter Bay Road/Private Access
Movement EB WB NB NB NB SB SB SBDirections Served LTR LTR L T TR L T TRMaximum Queue (m) 25.8 9.2 17.2 21.4 25.2 9.1 34.0 36.2Average Queue (m) 9.7 1.8 5.9 3.2 5.1 0.5 9.1 8.795th Queue (m) 20.2 7.6 14.5 13.2 17.1 3.9 25.9 27.2Link Distance (m) 125.3 69.1 102.6 102.6 172.0 172.0Upstream Blk Time (%)Queuing Penalty (veh)Storage Bay Dist (m) 40.0 35.0Storage Blk Time (%) 0Queuing Penalty (veh) 0
Intersection: 3: Glen Erin Drive & Private Access/Site Access
Movement EB WB NB NB NB SB SBDirections Served LTR LTR L T TR L TRMaximum Queue (m) 10.7 17.7 10.3 3.2 1.3 15.4 3.1Average Queue (m) 5.8 8.8 2.4 0.1 0.0 3.0 0.295th Queue (m) 13.0 16.4 9.1 2.2 0.9 11.0 2.6Link Distance (m) 85.1 81.7 90.0 90.0 102.6Upstream Blk Time (%)Queuing Penalty (veh)Storage Bay Dist (m) 15.0 35.0Storage Blk Time (%) 0 0Queuing Penalty (veh) 0 0
Network SummaryNetwork wide Queuing Penalty: 8
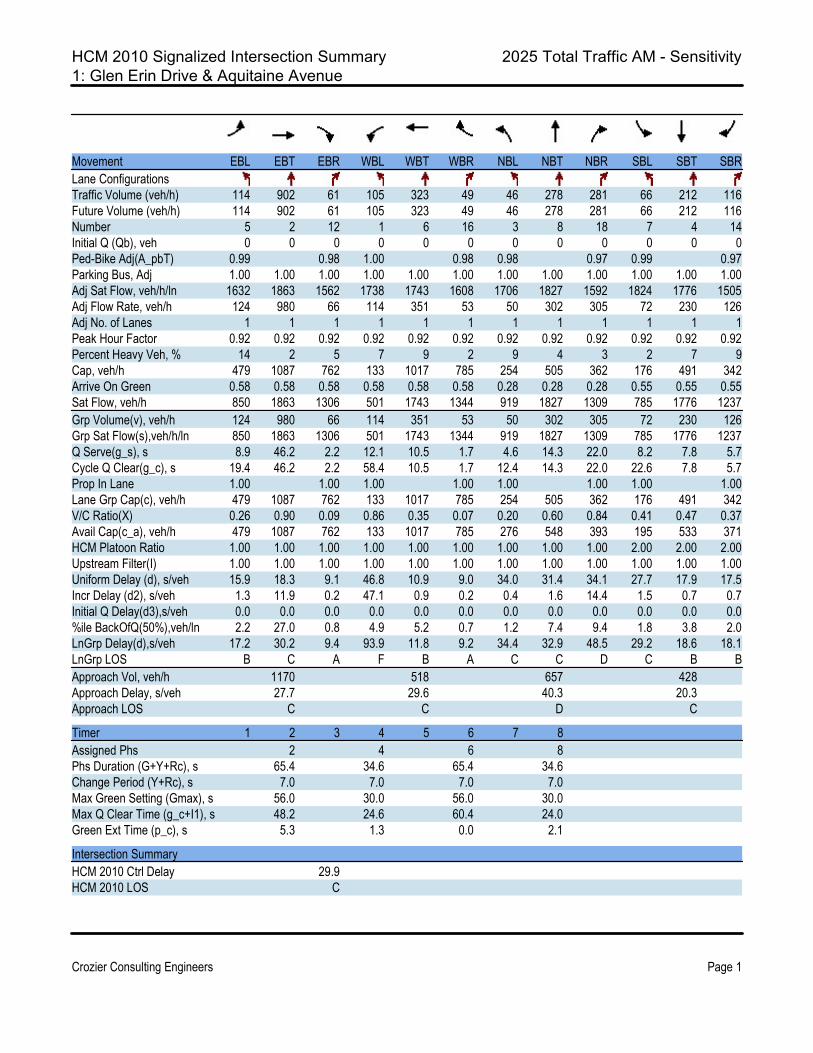
HCM 2010 Signalized Intersection Summary 2025 Total Traffic AM - Sensitivity1: Glen Erin Drive & Aquitaine Avenue
Crozier Consulting Engineers Page 1
Movement EBL EBT EBR WBL WBT WBR NBL NBT NBR SBL SBT SBRLane ConfigurationsTraffic Volume (veh/h) 114 902 61 105 323 49 46 278 281 66 212 116Future Volume (veh/h) 114 902 61 105 323 49 46 278 281 66 212 116Number 5 2 12 1 6 16 3 8 18 7 4 14Initial Q (Qb), veh 0 0 0 0 0 0 0 0 0 0 0 0Ped-Bike Adj(A_pbT) 0.99 0.98 1.00 0.98 0.98 0.97 0.99 0.97Parking Bus, Adj 1.00 1.00 1.00 1.00 1.00 1.00 1.00 1.00 1.00 1.00 1.00 1.00Adj Sat Flow, veh/h/ln 1632 1863 1562 1738 1743 1608 1706 1827 1592 1824 1776 1505Adj Flow Rate, veh/h 124 980 66 114 351 53 50 302 305 72 230 126Adj No. of Lanes 1 1 1 1 1 1 1 1 1 1 1 1Peak Hour Factor 0.92 0.92 0.92 0.92 0.92 0.92 0.92 0.92 0.92 0.92 0.92 0.92Percent Heavy Veh, % 14 2 5 7 9 2 9 4 3 2 7 9Cap, veh/h 479 1087 762 133 1017 785 254 505 362 176 491 342Arrive On Green 0.58 0.58 0.58 0.58 0.58 0.58 0.28 0.28 0.28 0.55 0.55 0.55Sat Flow, veh/h 850 1863 1306 501 1743 1344 919 1827 1309 785 1776 1237Grp Volume(v), veh/h 124 980 66 114 351 53 50 302 305 72 230 126Grp Sat Flow(s),veh/h/ln 850 1863 1306 501 1743 1344 919 1827 1309 785 1776 1237Q Serve(g_s), s 8.9 46.2 2.2 12.1 10.5 1.7 4.6 14.3 22.0 8.2 7.8 5.7Cycle Q Clear(g_c), s 19.4 46.2 2.2 58.4 10.5 1.7 12.4 14.3 22.0 22.6 7.8 5.7Prop In Lane 1.00 1.00 1.00 1.00 1.00 1.00 1.00 1.00Lane Grp Cap(c), veh/h 479 1087 762 133 1017 785 254 505 362 176 491 342V/C Ratio(X) 0.26 0.90 0.09 0.86 0.35 0.07 0.20 0.60 0.84 0.41 0.47 0.37Avail Cap(c_a), veh/h 479 1087 762 133 1017 785 276 548 393 195 533 371HCM Platoon Ratio 1.00 1.00 1.00 1.00 1.00 1.00 1.00 1.00 1.00 2.00 2.00 2.00Upstream Filter(I) 1.00 1.00 1.00 1.00 1.00 1.00 1.00 1.00 1.00 1.00 1.00 1.00Uniform Delay (d), s/veh 15.9 18.3 9.1 46.8 10.9 9.0 34.0 31.4 34.1 27.7 17.9 17.5Incr Delay (d2), s/veh 1.3 11.9 0.2 47.1 0.9 0.2 0.4 1.6 14.4 1.5 0.7 0.7Initial Q Delay(d3),s/veh 0.0 0.0 0.0 0.0 0.0 0.0 0.0 0.0 0.0 0.0 0.0 0.0%ile BackOfQ(50%),veh/ln 2.2 27.0 0.8 4.9 5.2 0.7 1.2 7.4 9.4 1.8 3.8 2.0LnGrp Delay(d),s/veh 17.2 30.2 9.4 93.9 11.8 9.2 34.4 32.9 48.5 29.2 18.6 18.1LnGrp LOS B C A F B A C C D C B BApproach Vol, veh/h 1170 518 657 428Approach Delay, s/veh 27.7 29.6 40.3 20.3Approach LOS C C D C
Timer 1 2 3 4 5 6 7 8Assigned Phs 2 4 6 8Phs Duration (G+Y+Rc), s 65.4 34.6 65.4 34.6Change Period (Y+Rc), s 7.0 7.0 7.0 7.0Max Green Setting (Gmax), s 56.0 30.0 56.0 30.0Max Q Clear Time (g_c+I1), s 48.2 24.6 60.4 24.0Green Ext Time (p_c), s 5.3 1.3 0.0 2.1
Intersection SummaryHCM 2010 Ctrl Delay 29.9HCM 2010 LOS C
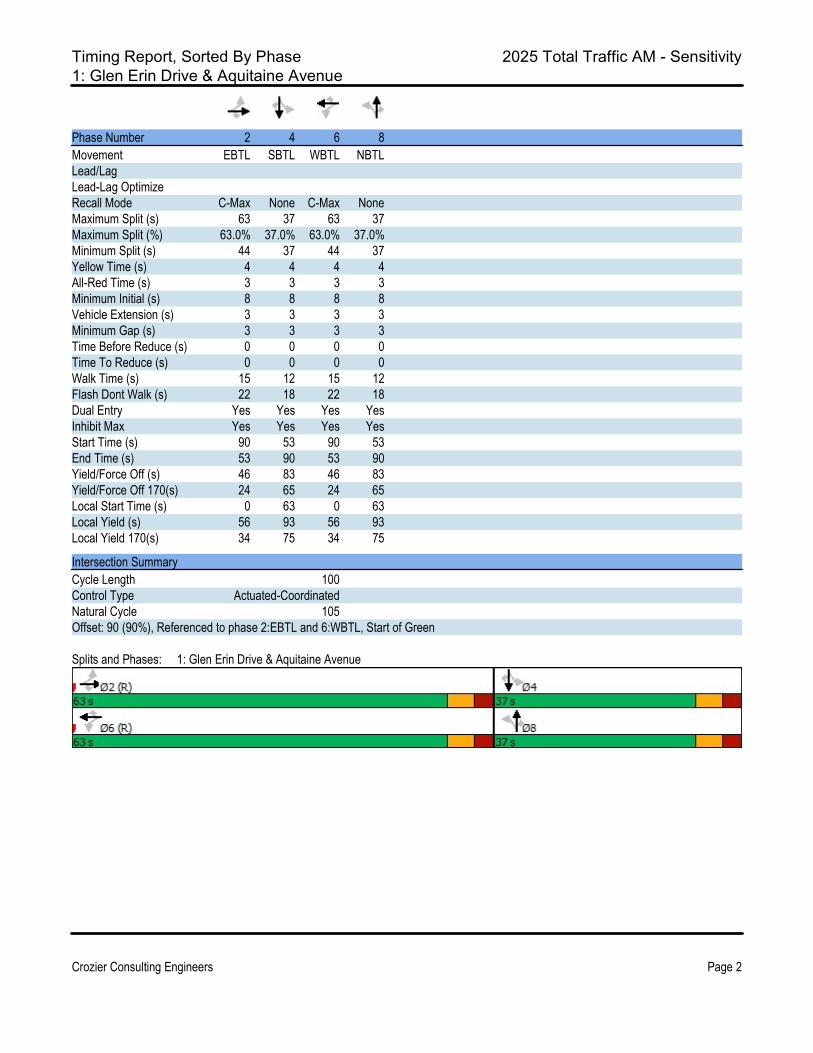
Timing Report, Sorted By Phase 2025 Total Traffic AM - Sensitivity1: Glen Erin Drive & Aquitaine Avenue
Crozier Consulting Engineers Page 2
Phase Number 2 4 6 8Movement EBTL SBTL WBTL NBTLLead/LagLead-Lag OptimizeRecall Mode C-Max None C-Max NoneMaximum Split (s) 63 37 63 37Maximum Split (%) 63.0% 37.0% 63.0% 37.0%Minimum Split (s) 44 37 44 37Yellow Time (s) 4 4 4 4All-Red Time (s) 3 3 3 3Minimum Initial (s) 8 8 8 8Vehicle Extension (s) 3 3 3 3Minimum Gap (s) 3 3 3 3Time Before Reduce (s) 0 0 0 0Time To Reduce (s) 0 0 0 0Walk Time (s) 15 12 15 12Flash Dont Walk (s) 22 18 22 18Dual Entry Yes Yes Yes YesInhibit Max Yes Yes Yes YesStart Time (s) 90 53 90 53End Time (s) 53 90 53 90Yield/Force Off (s) 46 83 46 83Yield/Force Off 170(s) 24 65 24 65Local Start Time (s) 0 63 0 63Local Yield (s) 56 93 56 93Local Yield 170(s) 34 75 34 75
Intersection SummaryCycle Length 100Control Type Actuated-CoordinatedNatural Cycle 105Offset: 90 (90%), Referenced to phase 2:EBTL and 6:WBTL, Start of Green
Splits and Phases: 1: Glen Erin Drive & Aquitaine Avenue
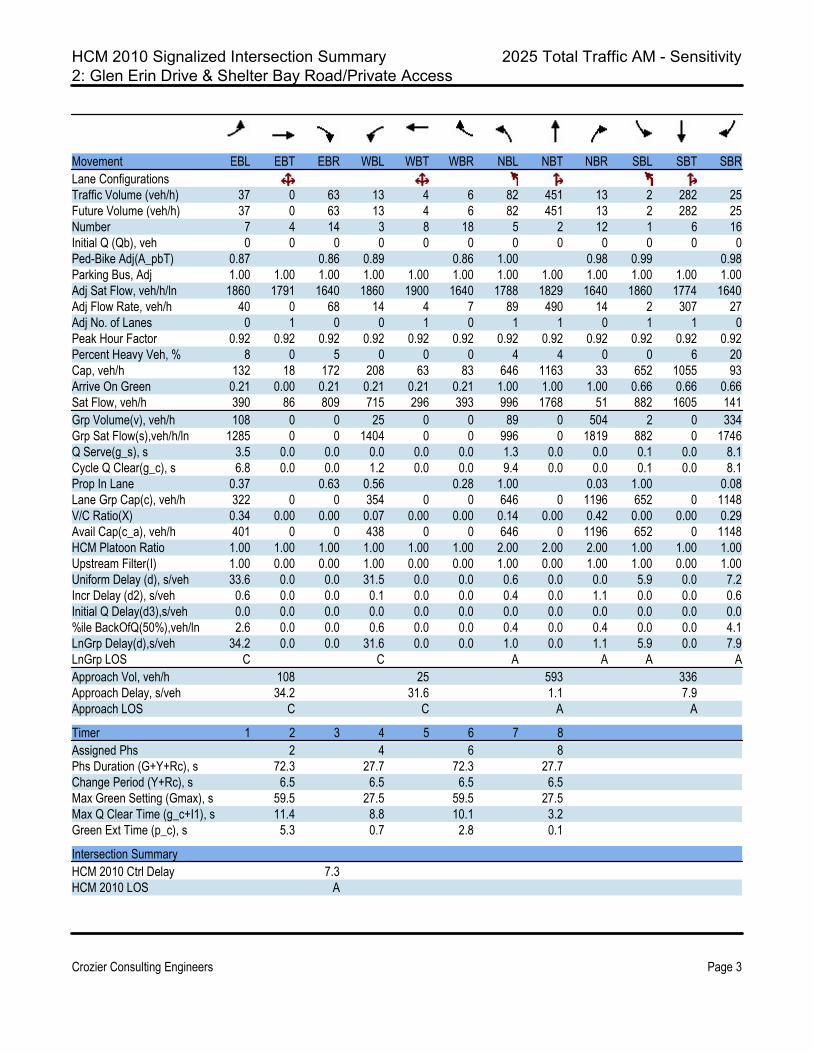
HCM 2010 Signalized Intersection Summary 2025 Total Traffic AM - Sensitivity2: Glen Erin Drive & Shelter Bay Road/Private Access
Crozier Consulting Engineers Page 3
Movement EBL EBT EBR WBL WBT WBR NBL NBT NBR SBL SBT SBRLane ConfigurationsTraffic Volume (veh/h) 37 0 63 13 4 6 82 451 13 2 282 25Future Volume (veh/h) 37 0 63 13 4 6 82 451 13 2 282 25Number 7 4 14 3 8 18 5 2 12 1 6 16Initial Q (Qb), veh 0 0 0 0 0 0 0 0 0 0 0 0Ped-Bike Adj(A_pbT) 0.87 0.86 0.89 0.86 1.00 0.98 0.99 0.98Parking Bus, Adj 1.00 1.00 1.00 1.00 1.00 1.00 1.00 1.00 1.00 1.00 1.00 1.00Adj Sat Flow, veh/h/ln 1860 1791 1640 1860 1900 1640 1788 1829 1640 1860 1774 1640Adj Flow Rate, veh/h 40 0 68 14 4 7 89 490 14 2 307 27Adj No. of Lanes 0 1 0 0 1 0 1 1 0 1 1 0Peak Hour Factor 0.92 0.92 0.92 0.92 0.92 0.92 0.92 0.92 0.92 0.92 0.92 0.92Percent Heavy Veh, % 8 0 5 0 0 0 4 4 0 0 6 20Cap, veh/h 132 18 172 208 63 83 646 1163 33 652 1055 93Arrive On Green 0.21 0.00 0.21 0.21 0.21 0.21 1.00 1.00 1.00 0.66 0.66 0.66Sat Flow, veh/h 390 86 809 715 296 393 996 1768 51 882 1605 141Grp Volume(v), veh/h 108 0 0 25 0 0 89 0 504 2 0 334Grp Sat Flow(s),veh/h/ln 1285 0 0 1404 0 0 996 0 1819 882 0 1746Q Serve(g_s), s 3.5 0.0 0.0 0.0 0.0 0.0 1.3 0.0 0.0 0.1 0.0 8.1Cycle Q Clear(g_c), s 6.8 0.0 0.0 1.2 0.0 0.0 9.4 0.0 0.0 0.1 0.0 8.1Prop In Lane 0.37 0.63 0.56 0.28 1.00 0.03 1.00 0.08Lane Grp Cap(c), veh/h 322 0 0 354 0 0 646 0 1196 652 0 1148V/C Ratio(X) 0.34 0.00 0.00 0.07 0.00 0.00 0.14 0.00 0.42 0.00 0.00 0.29Avail Cap(c_a), veh/h 401 0 0 438 0 0 646 0 1196 652 0 1148HCM Platoon Ratio 1.00 1.00 1.00 1.00 1.00 1.00 2.00 2.00 2.00 1.00 1.00 1.00Upstream Filter(I) 1.00 0.00 0.00 1.00 0.00 0.00 1.00 0.00 1.00 1.00 0.00 1.00Uniform Delay (d), s/veh 33.6 0.0 0.0 31.5 0.0 0.0 0.6 0.0 0.0 5.9 0.0 7.2Incr Delay (d2), s/veh 0.6 0.0 0.0 0.1 0.0 0.0 0.4 0.0 1.1 0.0 0.0 0.6Initial Q Delay(d3),s/veh 0.0 0.0 0.0 0.0 0.0 0.0 0.0 0.0 0.0 0.0 0.0 0.0%ile BackOfQ(50%),veh/ln 2.6 0.0 0.0 0.6 0.0 0.0 0.4 0.0 0.4 0.0 0.0 4.1LnGrp Delay(d),s/veh 34.2 0.0 0.0 31.6 0.0 0.0 1.0 0.0 1.1 5.9 0.0 7.9LnGrp LOS C C A A A AApproach Vol, veh/h 108 25 593 336Approach Delay, s/veh 34.2 31.6 1.1 7.9Approach LOS C C A A
Timer 1 2 3 4 5 6 7 8Assigned Phs 2 4 6 8Phs Duration (G+Y+Rc), s 72.3 27.7 72.3 27.7Change Period (Y+Rc), s 6.5 6.5 6.5 6.5Max Green Setting (Gmax), s 59.5 27.5 59.5 27.5Max Q Clear Time (g_c+I1), s 11.4 8.8 10.1 3.2Green Ext Time (p_c), s 5.3 0.7 2.8 0.1
Intersection SummaryHCM 2010 Ctrl Delay 7.3HCM 2010 LOS A
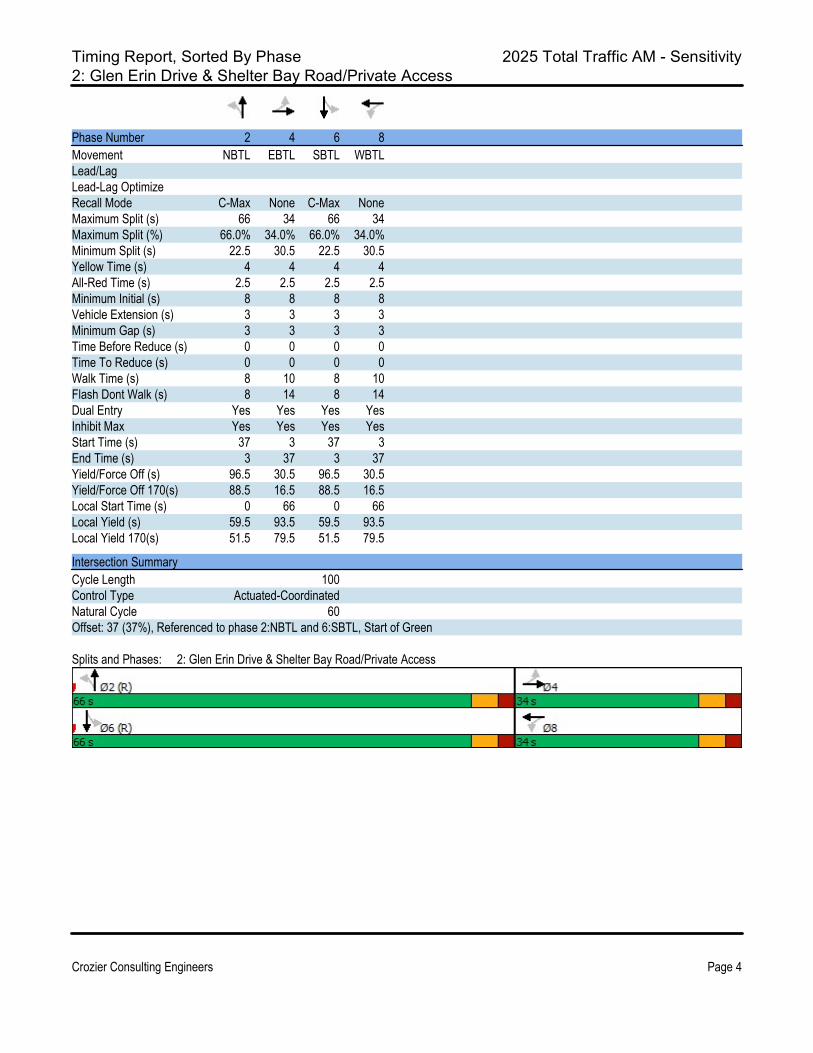
Timing Report, Sorted By Phase 2025 Total Traffic AM - Sensitivity2: Glen Erin Drive & Shelter Bay Road/Private Access
Crozier Consulting Engineers Page 4
Phase Number 2 4 6 8Movement NBTL EBTL SBTL WBTLLead/LagLead-Lag OptimizeRecall Mode C-Max None C-Max NoneMaximum Split (s) 66 34 66 34Maximum Split (%) 66.0% 34.0% 66.0% 34.0%Minimum Split (s) 22.5 30.5 22.5 30.5Yellow Time (s) 4 4 4 4All-Red Time (s) 2.5 2.5 2.5 2.5Minimum Initial (s) 8 8 8 8Vehicle Extension (s) 3 3 3 3Minimum Gap (s) 3 3 3 3Time Before Reduce (s) 0 0 0 0Time To Reduce (s) 0 0 0 0Walk Time (s) 8 10 8 10Flash Dont Walk (s) 8 14 8 14Dual Entry Yes Yes Yes YesInhibit Max Yes Yes Yes YesStart Time (s) 37 3 37 3End Time (s) 3 37 3 37Yield/Force Off (s) 96.5 30.5 96.5 30.5Yield/Force Off 170(s) 88.5 16.5 88.5 16.5Local Start Time (s) 0 66 0 66Local Yield (s) 59.5 93.5 59.5 93.5Local Yield 170(s) 51.5 79.5 51.5 79.5
Intersection SummaryCycle Length 100Control Type Actuated-CoordinatedNatural Cycle 60Offset: 37 (37%), Referenced to phase 2:NBTL and 6:SBTL, Start of Green
Splits and Phases: 2: Glen Erin Drive & Shelter Bay Road/Private Access

HCM 2010 TWSC 2025 Total Traffic AM - Sensitivity3: Glen Erin Drive & Private Access/Site Access
Crozier Consulting Engineers Page 5
IntersectionInt Delay, s/veh 2.8
Movement EBL EBT EBR WBL WBT WBR NBL NBT NBR SBL SBT SBRLane ConfigurationsTraffic Vol, veh/h 21 0 20 44 0 46 7 483 15 13 327 6Future Vol, veh/h 21 0 20 44 0 46 7 483 15 13 327 6Conflicting Peds, #/hr 0 0 0 0 0 0 0 0 0 0 0 0Sign Control Stop Stop Stop Stop Stop Stop Free Free Free Free Free FreeRT Channelized - - None - - None - - None - - NoneStorage Length - - - - - - 150 - - 350 - -Veh in Median Storage, # - 0 - - 0 - - 0 - - 0 -Grade, % - 0 - - 0 - - 0 - - 0 -Peak Hour Factor 92 92 92 92 92 92 92 92 92 92 92 92Heavy Vehicles, % 2 2 2 2 2 2 2 2 2 2 2 2Mvmt Flow 23 0 22 48 0 50 8 525 16 14 355 7
Major/Minor Minor2 Minor1 Major1 Major2Conflicting Flow All 961 944 359 947 939 533 362 0 0 541 0 0 Stage 1 387 387 - 549 549 - - - - - - - Stage 2 574 557 - 398 390 - - - - - - -Critical Hdwy 7.12 6.52 6.22 7.12 6.52 6.22 4.12 - - 4.12 - -Critical Hdwy Stg 1 6.12 5.52 - 6.12 5.52 - - - - - - -Critical Hdwy Stg 2 6.12 5.52 - 6.12 5.52 - - - - - - -Follow-up Hdwy 3.518 4.018 3.318 3.518 4.018 3.318 2.218 - - 2.218 - -Pot Cap-1 Maneuver 236 262 685 241 264 547 1197 - - 1028 - - Stage 1 637 610 - 520 516 - - - - - - - Stage 2 504 512 - 628 608 - - - - - - -Platoon blocked, % - - - -Mov Cap-1 Maneuver 211 256 685 230 258 547 1197 - - 1028 - -Mov Cap-2 Maneuver 211 256 - 230 258 - - - - - - - Stage 1 633 601 - 516 512 - - - - - - - Stage 2 455 508 - 600 599 - - - - - - -
Approach EB WB NB SBHCM Control Delay, s 18.1 20.6 0.1 0.3HCM LOS C C
Minor Lane/Major Mvmt NBL NBT NBR EBLn1WBLn1 SBL SBT SBRCapacity (veh/h) 1197 - - 319 327 1028 - -HCM Lane V/C Ratio 0.006 - - 0.14 0.299 0.014 - -HCM Control Delay (s) 8 - - 18.1 20.6 8.6 - -HCM Lane LOS A - - C C A - -HCM 95th %tile Q(veh) 0 - - 0.5 1.2 0 - -
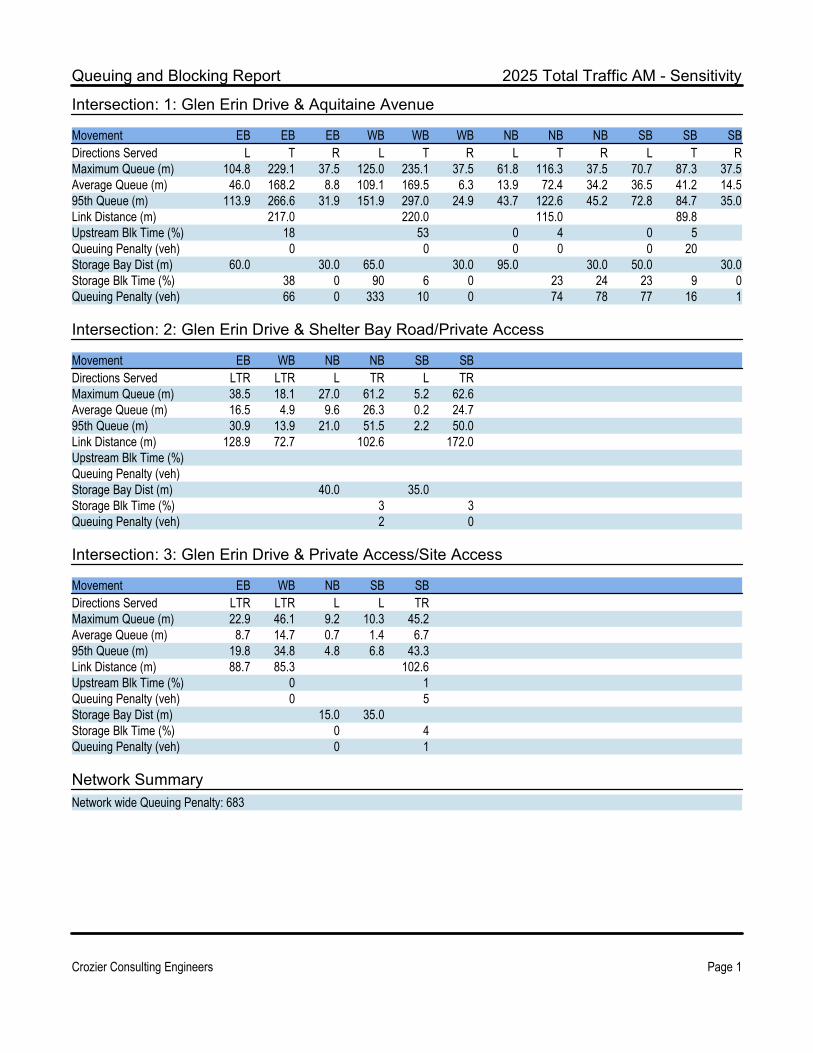
Queuing and Blocking Report 2025 Total Traffic AM - Sensitivity
Crozier Consulting Engineers Page 1
Intersection: 1: Glen Erin Drive & Aquitaine Avenue
Movement EB EB EB WB WB WB NB NB NB SB SB SBDirections Served L T R L T R L T R L T RMaximum Queue (m) 104.8 229.1 37.5 125.0 235.1 37.5 61.8 116.3 37.5 70.7 87.3 37.5Average Queue (m) 46.0 168.2 8.8 109.1 169.5 6.3 13.9 72.4 34.2 36.5 41.2 14.595th Queue (m) 113.9 266.6 31.9 151.9 297.0 24.9 43.7 122.6 45.2 72.8 84.7 35.0Link Distance (m) 217.0 220.0 115.0 89.8Upstream Blk Time (%) 18 53 0 4 0 5Queuing Penalty (veh) 0 0 0 0 0 20Storage Bay Dist (m) 60.0 30.0 65.0 30.0 95.0 30.0 50.0 30.0Storage Blk Time (%) 38 0 90 6 0 23 24 23 9 0Queuing Penalty (veh) 66 0 333 10 0 74 78 77 16 1
Intersection: 2: Glen Erin Drive & Shelter Bay Road/Private Access
Movement EB WB NB NB SB SBDirections Served LTR LTR L TR L TRMaximum Queue (m) 38.5 18.1 27.0 61.2 5.2 62.6Average Queue (m) 16.5 4.9 9.6 26.3 0.2 24.795th Queue (m) 30.9 13.9 21.0 51.5 2.2 50.0Link Distance (m) 128.9 72.7 102.6 172.0Upstream Blk Time (%)Queuing Penalty (veh)Storage Bay Dist (m) 40.0 35.0Storage Blk Time (%) 3 3Queuing Penalty (veh) 2 0
Intersection: 3: Glen Erin Drive & Private Access/Site Access
Movement EB WB NB SB SBDirections Served LTR LTR L L TRMaximum Queue (m) 22.9 46.1 9.2 10.3 45.2Average Queue (m) 8.7 14.7 0.7 1.4 6.795th Queue (m) 19.8 34.8 4.8 6.8 43.3Link Distance (m) 88.7 85.3 102.6Upstream Blk Time (%) 0 1Queuing Penalty (veh) 0 5Storage Bay Dist (m) 15.0 35.0Storage Blk Time (%) 0 4Queuing Penalty (veh) 0 1
Network SummaryNetwork wide Queuing Penalty: 683
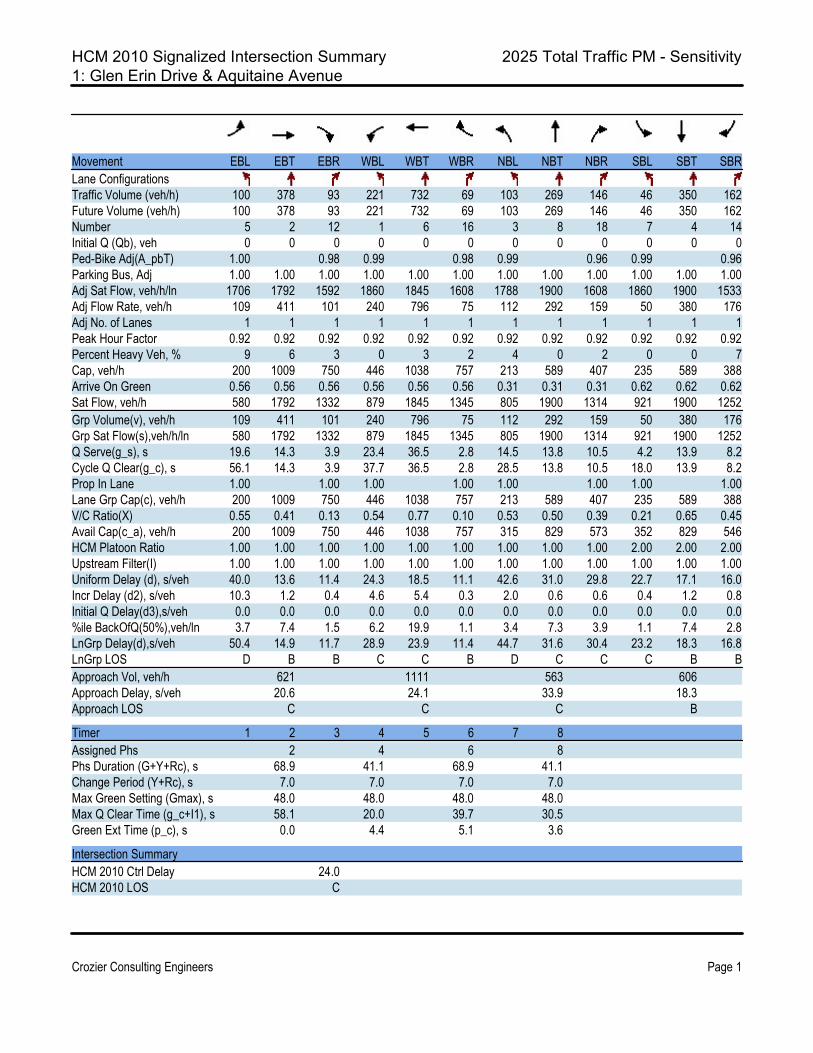
HCM 2010 Signalized Intersection Summary 2025 Total Traffic PM - Sensitivity1: Glen Erin Drive & Aquitaine Avenue
Crozier Consulting Engineers Page 1
Movement EBL EBT EBR WBL WBT WBR NBL NBT NBR SBL SBT SBRLane ConfigurationsTraffic Volume (veh/h) 100 378 93 221 732 69 103 269 146 46 350 162Future Volume (veh/h) 100 378 93 221 732 69 103 269 146 46 350 162Number 5 2 12 1 6 16 3 8 18 7 4 14Initial Q (Qb), veh 0 0 0 0 0 0 0 0 0 0 0 0Ped-Bike Adj(A_pbT) 1.00 0.98 0.99 0.98 0.99 0.96 0.99 0.96Parking Bus, Adj 1.00 1.00 1.00 1.00 1.00 1.00 1.00 1.00 1.00 1.00 1.00 1.00Adj Sat Flow, veh/h/ln 1706 1792 1592 1860 1845 1608 1788 1900 1608 1860 1900 1533Adj Flow Rate, veh/h 109 411 101 240 796 75 112 292 159 50 380 176Adj No. of Lanes 1 1 1 1 1 1 1 1 1 1 1 1Peak Hour Factor 0.92 0.92 0.92 0.92 0.92 0.92 0.92 0.92 0.92 0.92 0.92 0.92Percent Heavy Veh, % 9 6 3 0 3 2 4 0 2 0 0 7Cap, veh/h 200 1009 750 446 1038 757 213 589 407 235 589 388Arrive On Green 0.56 0.56 0.56 0.56 0.56 0.56 0.31 0.31 0.31 0.62 0.62 0.62Sat Flow, veh/h 580 1792 1332 879 1845 1345 805 1900 1314 921 1900 1252Grp Volume(v), veh/h 109 411 101 240 796 75 112 292 159 50 380 176Grp Sat Flow(s),veh/h/ln 580 1792 1332 879 1845 1345 805 1900 1314 921 1900 1252Q Serve(g_s), s 19.6 14.3 3.9 23.4 36.5 2.8 14.5 13.8 10.5 4.2 13.9 8.2Cycle Q Clear(g_c), s 56.1 14.3 3.9 37.7 36.5 2.8 28.5 13.8 10.5 18.0 13.9 8.2Prop In Lane 1.00 1.00 1.00 1.00 1.00 1.00 1.00 1.00Lane Grp Cap(c), veh/h 200 1009 750 446 1038 757 213 589 407 235 589 388V/C Ratio(X) 0.55 0.41 0.13 0.54 0.77 0.10 0.53 0.50 0.39 0.21 0.65 0.45Avail Cap(c_a), veh/h 200 1009 750 446 1038 757 315 829 573 352 829 546HCM Platoon Ratio 1.00 1.00 1.00 1.00 1.00 1.00 1.00 1.00 1.00 2.00 2.00 2.00Upstream Filter(I) 1.00 1.00 1.00 1.00 1.00 1.00 1.00 1.00 1.00 1.00 1.00 1.00Uniform Delay (d), s/veh 40.0 13.6 11.4 24.3 18.5 11.1 42.6 31.0 29.8 22.7 17.1 16.0Incr Delay (d2), s/veh 10.3 1.2 0.4 4.6 5.4 0.3 2.0 0.6 0.6 0.4 1.2 0.8Initial Q Delay(d3),s/veh 0.0 0.0 0.0 0.0 0.0 0.0 0.0 0.0 0.0 0.0 0.0 0.0%ile BackOfQ(50%),veh/ln 3.7 7.4 1.5 6.2 19.9 1.1 3.4 7.3 3.9 1.1 7.4 2.8LnGrp Delay(d),s/veh 50.4 14.9 11.7 28.9 23.9 11.4 44.7 31.6 30.4 23.2 18.3 16.8LnGrp LOS D B B C C B D C C C B BApproach Vol, veh/h 621 1111 563 606Approach Delay, s/veh 20.6 24.1 33.9 18.3Approach LOS C C C B
Timer 1 2 3 4 5 6 7 8Assigned Phs 2 4 6 8Phs Duration (G+Y+Rc), s 68.9 41.1 68.9 41.1Change Period (Y+Rc), s 7.0 7.0 7.0 7.0Max Green Setting (Gmax), s 48.0 48.0 48.0 48.0Max Q Clear Time (g_c+I1), s 58.1 20.0 39.7 30.5Green Ext Time (p_c), s 0.0 4.4 5.1 3.6
Intersection SummaryHCM 2010 Ctrl Delay 24.0HCM 2010 LOS C

Timing Report, Sorted By Phase 2025 Total Traffic PM - Sensitivity1: Glen Erin Drive & Aquitaine Avenue
Crozier Consulting Engineers Page 2
Phase Number 2 4 6 8Movement EBTL SBTL WBTL NBTLLead/LagLead-Lag OptimizeRecall Mode C-Max None C-Max NoneMaximum Split (s) 55 55 55 55Maximum Split (%) 50.0% 50.0% 50.0% 50.0%Minimum Split (s) 44 37 44 37Yellow Time (s) 4 4 4 4All-Red Time (s) 3 3 3 3Minimum Initial (s) 8 8 8 8Vehicle Extension (s) 3 3 3 3Minimum Gap (s) 3 3 3 3Time Before Reduce (s) 0 0 0 0Time To Reduce (s) 0 0 0 0Walk Time (s) 15 12 15 12Flash Dont Walk (s) 22 18 22 18Dual Entry Yes Yes Yes YesInhibit Max Yes Yes Yes YesStart Time (s) 98 43 98 43End Time (s) 43 98 43 98Yield/Force Off (s) 36 91 36 91Yield/Force Off 170(s) 14 73 14 73Local Start Time (s) 0 55 0 55Local Yield (s) 48 103 48 103Local Yield 170(s) 26 85 26 85
Intersection SummaryCycle Length 110Control Type Actuated-CoordinatedNatural Cycle 85Offset: 98 (89%), Referenced to phase 2:EBTL and 6:WBTL, Start of Green
Splits and Phases: 1: Glen Erin Drive & Aquitaine Avenue

HCM 2010 Signalized Intersection Summary 2025 Total Traffic PM - Sensitivity2: Glen Erin Drive & Shelter Bay Road/Private Access
Crozier Consulting Engineers Page 3
Movement EBL EBT EBR WBL WBT WBR NBL NBT NBR SBL SBT SBRLane ConfigurationsTraffic Volume (veh/h) 14 2 32 3 0 3 50 321 7 5 509 48Future Volume (veh/h) 14 2 32 3 0 3 50 321 7 5 509 48Number 7 4 14 3 8 18 5 2 12 1 6 16Initial Q (Qb), veh 0 0 0 0 0 0 0 0 0 0 0 0Ped-Bike Adj(A_pbT) 0.97 0.97 0.98 0.97 1.00 1.00 1.00 1.00Parking Bus, Adj 1.00 1.00 1.00 1.00 1.00 1.00 1.00 1.00 1.00 1.00 1.00 1.00Adj Sat Flow, veh/h/ln 1900 1900 1900 1900 1900 1900 1900 1811 1900 1900 1866 1900Adj Flow Rate, veh/h 15 2 35 3 0 3 54 349 8 5 553 52Adj No. of Lanes 0 1 0 0 1 0 1 1 0 1 1 0Peak Hour Factor 0.92 0.92 0.92 0.92 0.92 0.92 0.92 0.92 0.92 0.92 0.92 0.92Percent Heavy Veh, % 0 0 0 0 0 0 0 5 0 0 2 0Cap, veh/h 65 20 88 99 15 65 645 1409 32 895 1341 126Arrive On Green 0.08 0.08 0.08 0.08 0.00 0.08 1.00 1.00 1.00 0.80 0.80 0.80Sat Flow, veh/h 276 239 1060 603 180 783 828 1764 40 1039 1680 158Grp Volume(v), veh/h 52 0 0 6 0 0 54 0 357 5 0 605Grp Sat Flow(s),veh/h/ln 1574 0 0 1566 0 0 828 0 1804 1039 0 1838Q Serve(g_s), s 0.0 0.0 0.0 0.0 0.0 0.0 1.0 0.0 0.0 0.1 0.0 10.9Cycle Q Clear(g_c), s 3.3 0.0 0.0 0.4 0.0 0.0 11.8 0.0 0.0 0.1 0.0 10.9Prop In Lane 0.29 0.67 0.50 0.50 1.00 0.02 1.00 0.09Lane Grp Cap(c), veh/h 173 0 0 179 0 0 645 0 1441 895 0 1468V/C Ratio(X) 0.30 0.00 0.00 0.03 0.00 0.00 0.08 0.00 0.25 0.01 0.00 0.41Avail Cap(c_a), veh/h 427 0 0 422 0 0 645 0 1441 895 0 1468HCM Platoon Ratio 1.00 1.00 1.00 1.00 1.00 1.00 2.00 2.00 2.00 1.00 1.00 1.00Upstream Filter(I) 1.00 0.00 0.00 1.00 0.00 0.00 1.00 0.00 1.00 1.00 0.00 1.00Uniform Delay (d), s/veh 47.7 0.0 0.0 46.4 0.0 0.0 0.7 0.0 0.0 2.2 0.0 3.3Incr Delay (d2), s/veh 1.0 0.0 0.0 0.1 0.0 0.0 0.3 0.0 0.4 0.0 0.0 0.9Initial Q Delay(d3),s/veh 0.0 0.0 0.0 0.0 0.0 0.0 0.0 0.0 0.0 0.0 0.0 0.0%ile BackOfQ(50%),veh/ln 1.5 0.0 0.0 0.2 0.0 0.0 0.2 0.0 0.2 0.0 0.0 5.7LnGrp Delay(d),s/veh 48.7 0.0 0.0 46.5 0.0 0.0 1.0 0.0 0.4 2.3 0.0 4.2LnGrp LOS D D A A A AApproach Vol, veh/h 52 6 411 610Approach Delay, s/veh 48.7 46.5 0.5 4.2Approach LOS D D A A
Timer 1 2 3 4 5 6 7 8Assigned Phs 2 4 6 8Phs Duration (G+Y+Rc), s 94.4 15.6 94.4 15.6Change Period (Y+Rc), s 6.5 6.5 6.5 6.5Max Green Setting (Gmax), s 69.5 27.5 69.5 27.5Max Q Clear Time (g_c+I1), s 13.8 5.3 12.9 2.4Green Ext Time (p_c), s 3.5 0.2 6.1 0.0
Intersection SummaryHCM 2010 Ctrl Delay 5.1HCM 2010 LOS A
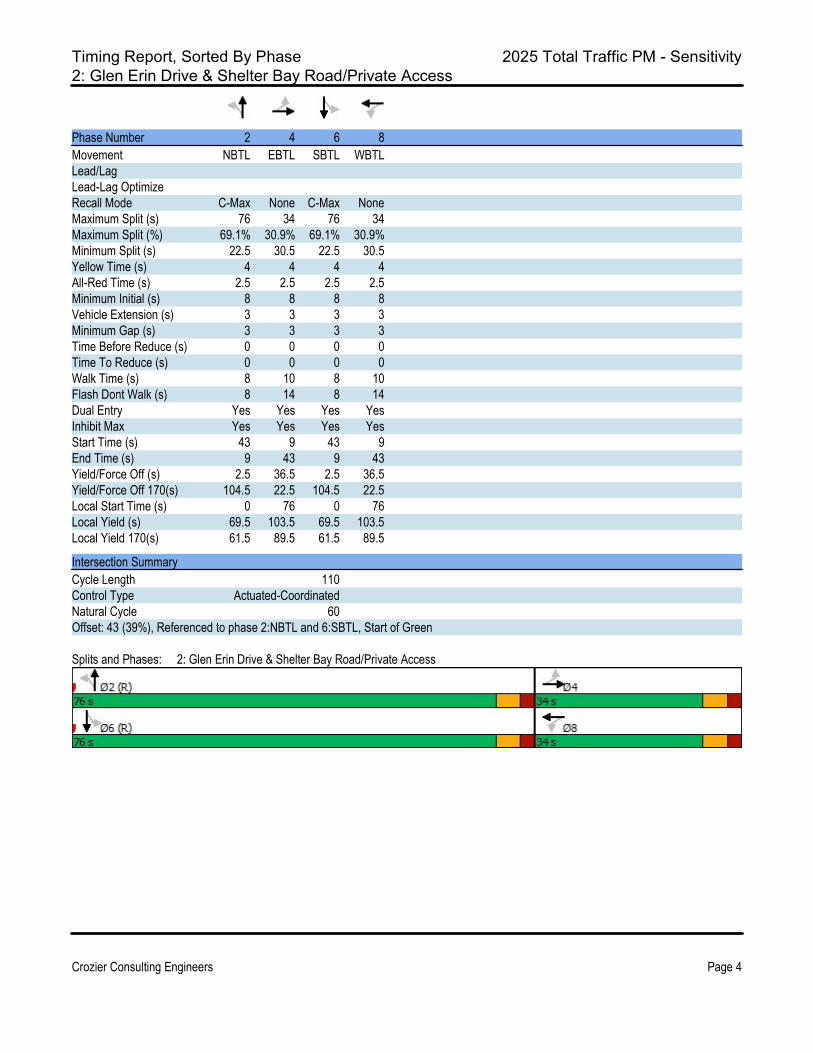
Timing Report, Sorted By Phase 2025 Total Traffic PM - Sensitivity2: Glen Erin Drive & Shelter Bay Road/Private Access
Crozier Consulting Engineers Page 4
Phase Number 2 4 6 8Movement NBTL EBTL SBTL WBTLLead/LagLead-Lag OptimizeRecall Mode C-Max None C-Max NoneMaximum Split (s) 76 34 76 34Maximum Split (%) 69.1% 30.9% 69.1% 30.9%Minimum Split (s) 22.5 30.5 22.5 30.5Yellow Time (s) 4 4 4 4All-Red Time (s) 2.5 2.5 2.5 2.5Minimum Initial (s) 8 8 8 8Vehicle Extension (s) 3 3 3 3Minimum Gap (s) 3 3 3 3Time Before Reduce (s) 0 0 0 0Time To Reduce (s) 0 0 0 0Walk Time (s) 8 10 8 10Flash Dont Walk (s) 8 14 8 14Dual Entry Yes Yes Yes YesInhibit Max Yes Yes Yes YesStart Time (s) 43 9 43 9End Time (s) 9 43 9 43Yield/Force Off (s) 2.5 36.5 2.5 36.5Yield/Force Off 170(s) 104.5 22.5 104.5 22.5Local Start Time (s) 0 76 0 76Local Yield (s) 69.5 103.5 69.5 103.5Local Yield 170(s) 61.5 89.5 61.5 89.5
Intersection SummaryCycle Length 110Control Type Actuated-CoordinatedNatural Cycle 60Offset: 43 (39%), Referenced to phase 2:NBTL and 6:SBTL, Start of Green
Splits and Phases: 2: Glen Erin Drive & Shelter Bay Road/Private Access
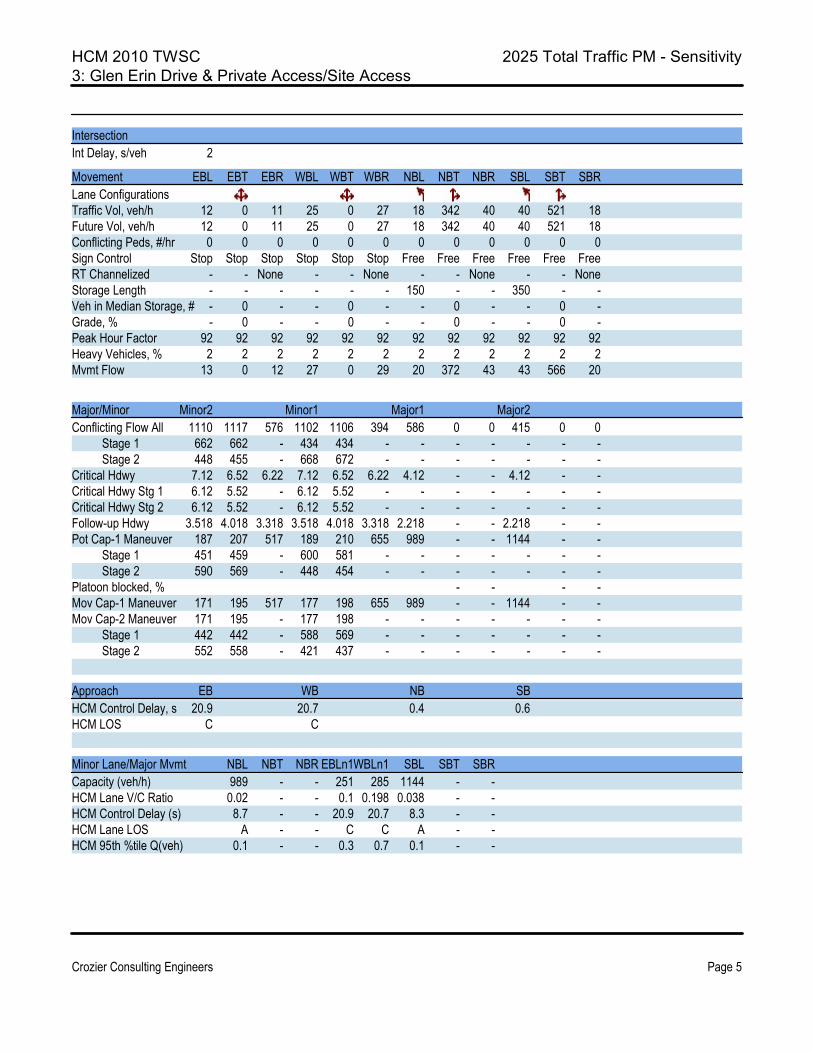
HCM 2010 TWSC 2025 Total Traffic PM - Sensitivity3: Glen Erin Drive & Private Access/Site Access
Crozier Consulting Engineers Page 5
IntersectionInt Delay, s/veh 2
Movement EBL EBT EBR WBL WBT WBR NBL NBT NBR SBL SBT SBRLane ConfigurationsTraffic Vol, veh/h 12 0 11 25 0 27 18 342 40 40 521 18Future Vol, veh/h 12 0 11 25 0 27 18 342 40 40 521 18Conflicting Peds, #/hr 0 0 0 0 0 0 0 0 0 0 0 0Sign Control Stop Stop Stop Stop Stop Stop Free Free Free Free Free FreeRT Channelized - - None - - None - - None - - NoneStorage Length - - - - - - 150 - - 350 - -Veh in Median Storage, # - 0 - - 0 - - 0 - - 0 -Grade, % - 0 - - 0 - - 0 - - 0 -Peak Hour Factor 92 92 92 92 92 92 92 92 92 92 92 92Heavy Vehicles, % 2 2 2 2 2 2 2 2 2 2 2 2Mvmt Flow 13 0 12 27 0 29 20 372 43 43 566 20
Major/Minor Minor2 Minor1 Major1 Major2Conflicting Flow All 1110 1117 576 1102 1106 394 586 0 0 415 0 0 Stage 1 662 662 - 434 434 - - - - - - - Stage 2 448 455 - 668 672 - - - - - - -Critical Hdwy 7.12 6.52 6.22 7.12 6.52 6.22 4.12 - - 4.12 - -Critical Hdwy Stg 1 6.12 5.52 - 6.12 5.52 - - - - - - -Critical Hdwy Stg 2 6.12 5.52 - 6.12 5.52 - - - - - - -Follow-up Hdwy 3.518 4.018 3.318 3.518 4.018 3.318 2.218 - - 2.218 - -Pot Cap-1 Maneuver 187 207 517 189 210 655 989 - - 1144 - - Stage 1 451 459 - 600 581 - - - - - - - Stage 2 590 569 - 448 454 - - - - - - -Platoon blocked, % - - - -Mov Cap-1 Maneuver 171 195 517 177 198 655 989 - - 1144 - -Mov Cap-2 Maneuver 171 195 - 177 198 - - - - - - - Stage 1 442 442 - 588 569 - - - - - - - Stage 2 552 558 - 421 437 - - - - - - -
Approach EB WB NB SBHCM Control Delay, s 20.9 20.7 0.4 0.6HCM LOS C C
Minor Lane/Major Mvmt NBL NBT NBR EBLn1WBLn1 SBL SBT SBRCapacity (veh/h) 989 - - 251 285 1144 - -HCM Lane V/C Ratio 0.02 - - 0.1 0.198 0.038 - -HCM Control Delay (s) 8.7 - - 20.9 20.7 8.3 - -HCM Lane LOS A - - C C A - -HCM 95th %tile Q(veh) 0.1 - - 0.3 0.7 0.1 - -
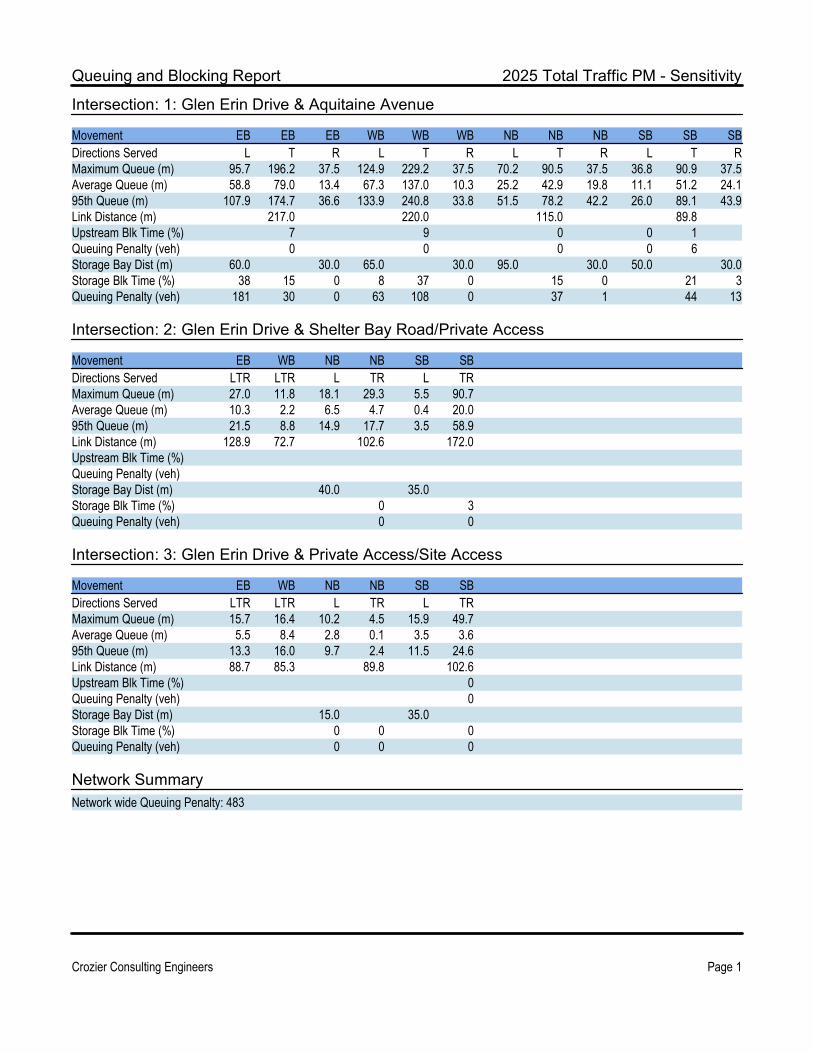
Queuing and Blocking Report 2025 Total Traffic PM - Sensitivity
Crozier Consulting Engineers Page 1
Intersection: 1: Glen Erin Drive & Aquitaine Avenue
Movement EB EB EB WB WB WB NB NB NB SB SB SBDirections Served L T R L T R L T R L T RMaximum Queue (m) 95.7 196.2 37.5 124.9 229.2 37.5 70.2 90.5 37.5 36.8 90.9 37.5Average Queue (m) 58.8 79.0 13.4 67.3 137.0 10.3 25.2 42.9 19.8 11.1 51.2 24.195th Queue (m) 107.9 174.7 36.6 133.9 240.8 33.8 51.5 78.2 42.2 26.0 89.1 43.9Link Distance (m) 217.0 220.0 115.0 89.8Upstream Blk Time (%) 7 9 0 0 1Queuing Penalty (veh) 0 0 0 0 6Storage Bay Dist (m) 60.0 30.0 65.0 30.0 95.0 30.0 50.0 30.0Storage Blk Time (%) 38 15 0 8 37 0 15 0 21 3Queuing Penalty (veh) 181 30 0 63 108 0 37 1 44 13
Intersection: 2: Glen Erin Drive & Shelter Bay Road/Private Access
Movement EB WB NB NB SB SBDirections Served LTR LTR L TR L TRMaximum Queue (m) 27.0 11.8 18.1 29.3 5.5 90.7Average Queue (m) 10.3 2.2 6.5 4.7 0.4 20.095th Queue (m) 21.5 8.8 14.9 17.7 3.5 58.9Link Distance (m) 128.9 72.7 102.6 172.0Upstream Blk Time (%)Queuing Penalty (veh)Storage Bay Dist (m) 40.0 35.0Storage Blk Time (%) 0 3Queuing Penalty (veh) 0 0
Intersection: 3: Glen Erin Drive & Private Access/Site Access
Movement EB WB NB NB SB SBDirections Served LTR LTR L TR L TRMaximum Queue (m) 15.7 16.4 10.2 4.5 15.9 49.7Average Queue (m) 5.5 8.4 2.8 0.1 3.5 3.695th Queue (m) 13.3 16.0 9.7 2.4 11.5 24.6Link Distance (m) 88.7 85.3 89.8 102.6Upstream Blk Time (%) 0Queuing Penalty (veh) 0Storage Bay Dist (m) 15.0 35.0Storage Blk Time (%) 0 0 0Queuing Penalty (veh) 0 0 0
Network SummaryNetwork wide Queuing Penalty: 483
Starwood Group Inc. Traffic Impact Study
6719 Glen Erin Drive, City of Mississauga October 2021
C.F. Crozier & Associates Inc.
Project No. 1886-5590
APPENDIX F
2700 Aquitaine Avenue TIS Excerpts
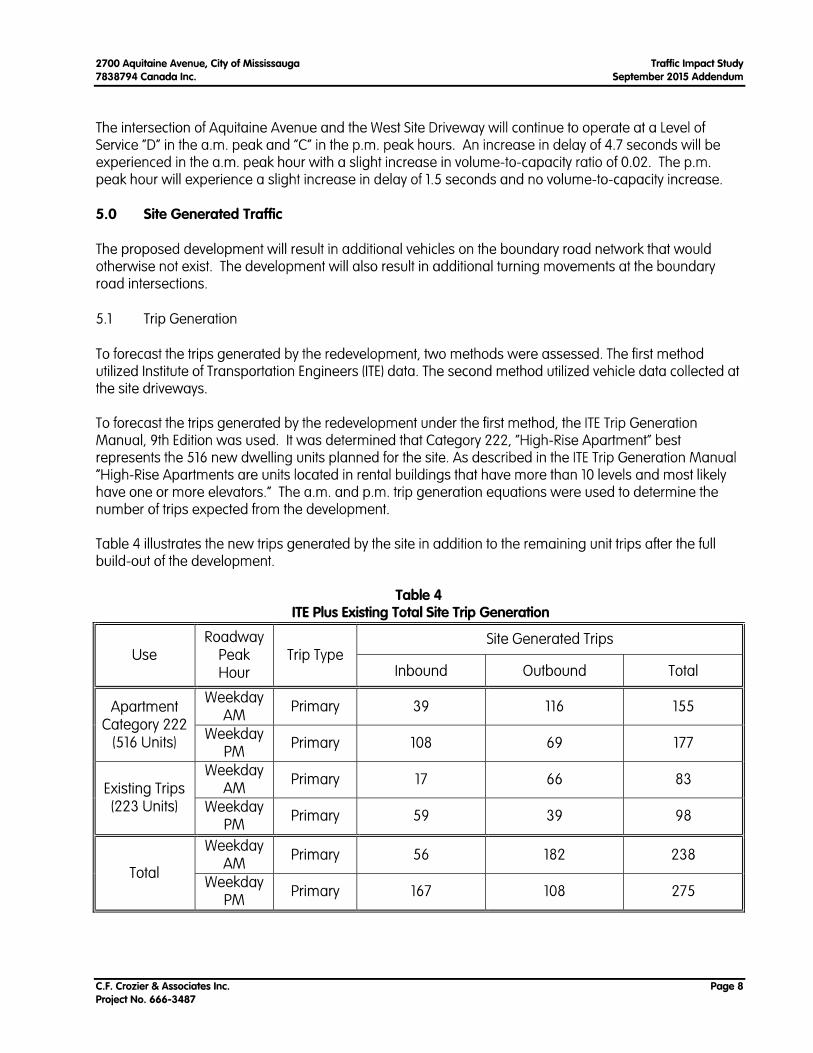
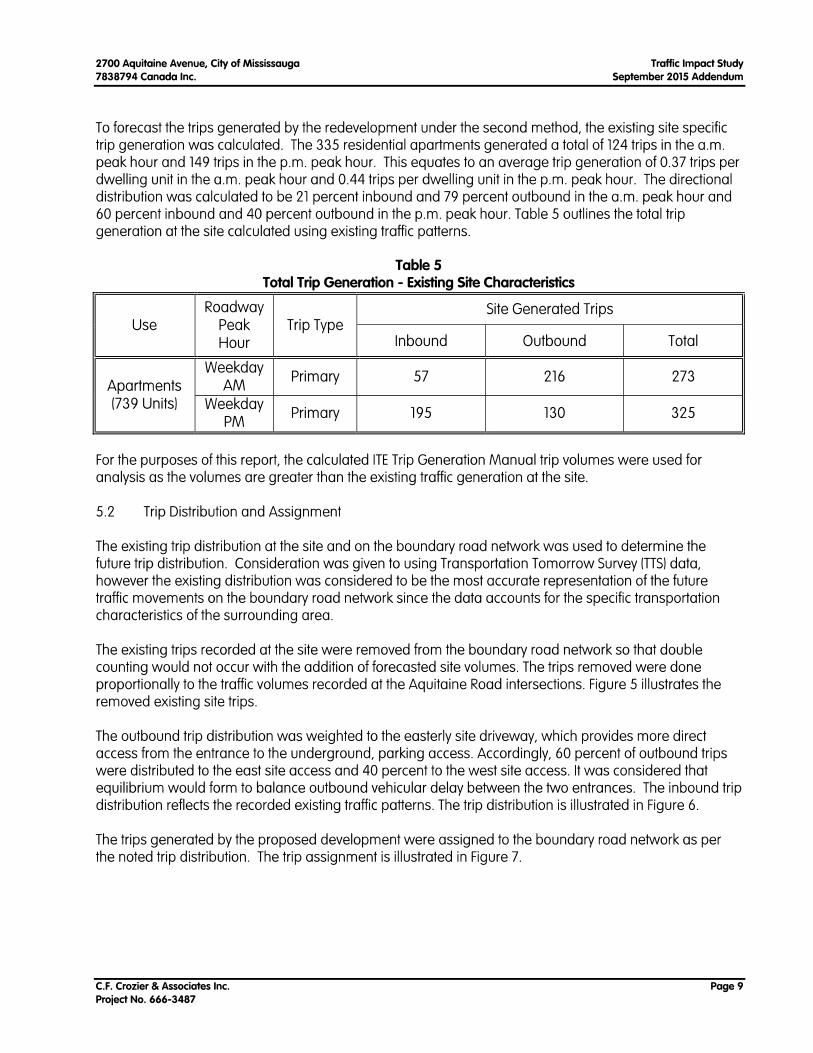
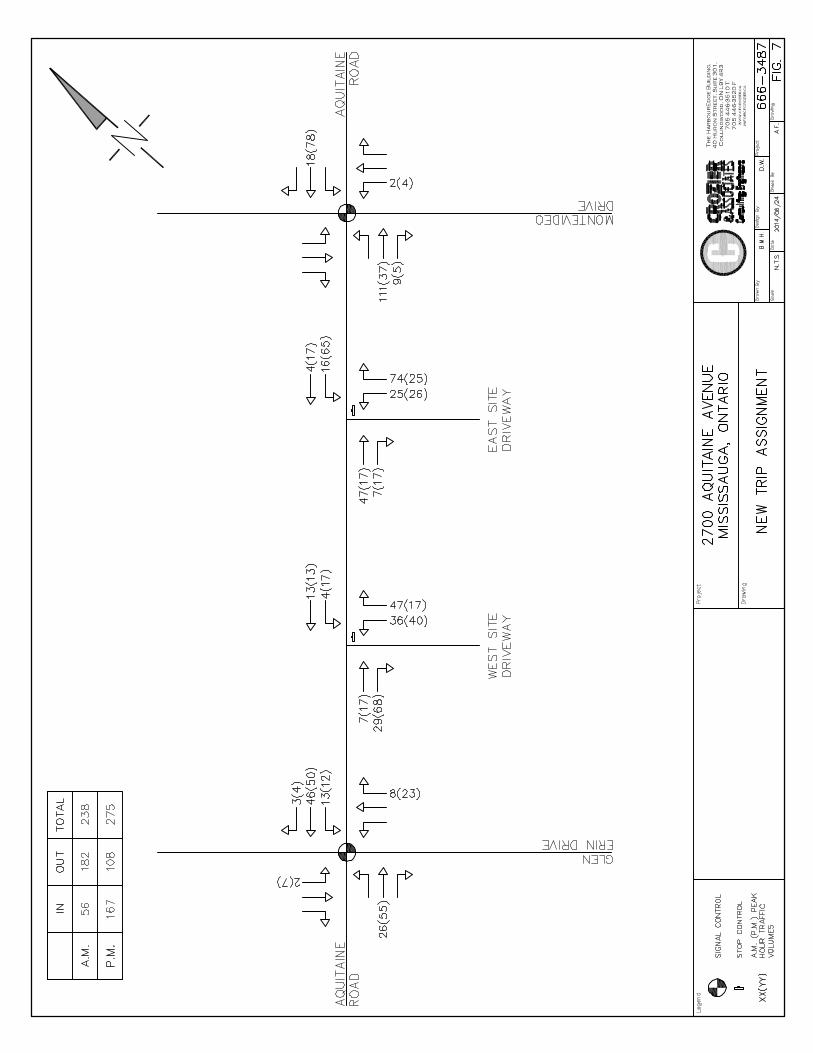
Starwood Group Inc. Traffic Impact Study
6719 Glen Erin Drive, City of Mississauga October 2021
C.F. Crozier & Associates Inc.
Project No. 1886-5590
APPENDIX G
Warrant Analysis Sheets
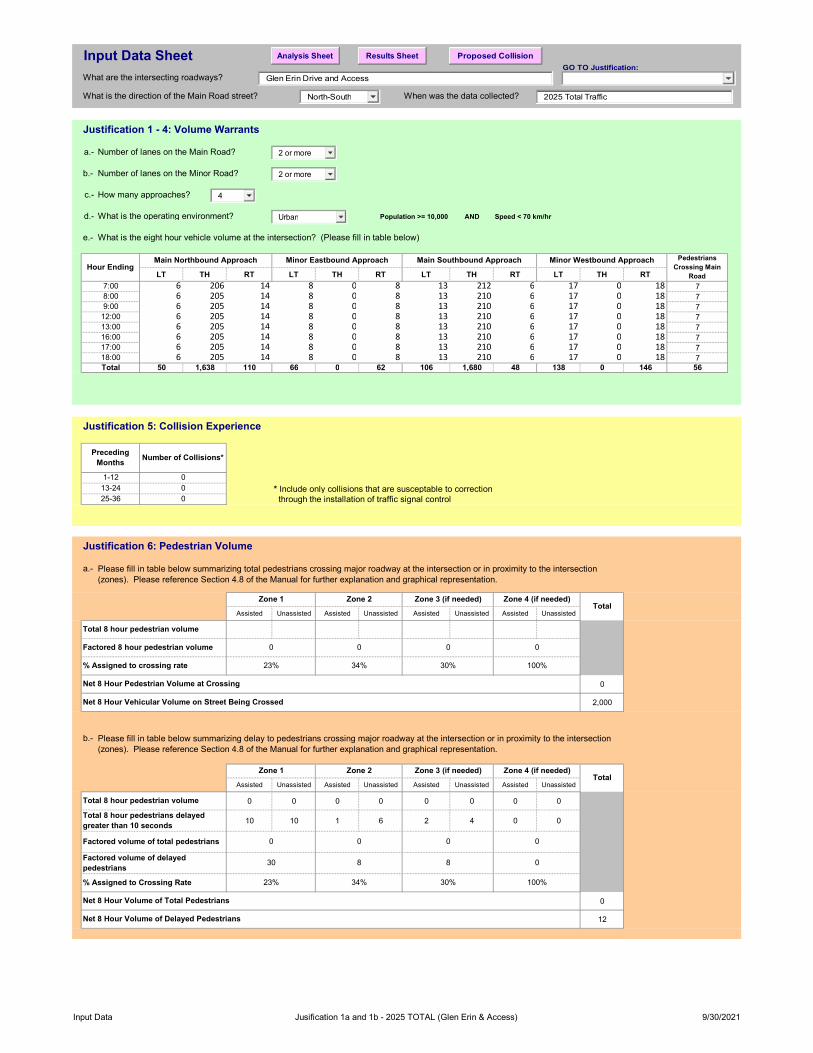
Input Data Sheet
What are the intersecting roadways? Glen Erin Drive and Access
What is the direction of the Main Road street? When was the data collected? 2025 Total Traffic
Justification 1 - 4: Volume Warrants
a.- Number of lanes on the Main Road?
b.- Number of lanes on the Minor Road?
c.- How many approaches?
d.- What is the operating environment? AND Speed < 70 km/hr
e.- What is the eight hour vehicle volume at the intersection? (Please fill in table below)
LT TH RT LT TH RT LT TH RT LT TH RT
6 206 14 8 0 8 13 212 6 17 0 18 76 205 14 8 0 8 13 210 6 17 0 18 76 205 14 8 0 8 13 210 6 17 0 18 76 205 14 8 0 8 13 210 6 17 0 18 76 205 14 8 0 8 13 210 6 17 0 18 76 205 14 8 0 8 13 210 6 17 0 18 76 205 14 8 0 8 13 210 6 17 0 18 76 205 14 8 0 8 13 210 6 17 0 18 7
50 1,638 110 66 0 62 106 1,680 48 138 0 146 56
Justification 5: Collision Experience
* Include only collisions that are susceptable to correction through the installation of traffic signal control
Justification 6: Pedestrian Volume
a.-
Assisted Unassisted Assisted Unassisted Assisted Unassisted Assisted Unassisted
0
2,000
b.-
Assisted Unassisted Assisted Unassisted Assisted Unassisted Assisted Unassisted
0 0 0 0 0 0 0 0
10 10 1 6 2 4 0 0
0
12
Please fill in table below summarizing total pedestrians crossing major roadway at the intersection or in proximity to the intersection (zones). Please reference Section 4.8 of the Manual for further explanation and graphical representation.
Population >= 10,000
Total 8 hour pedestrian volume
Zone 4 (if needed)Total
Net 8 Hour Pedestrian Volume at Crossing
Net 8 Hour Vehicular Volume on Street Being Crossed
23% 34%
Total 8 hour pedestrians delayed greater than 10 seconds
Factored volume of total pedestrians
Zone 3 (if needed)
Total 8 hour pedestrian volume
Factored 8 hour pedestrian volume
% Assigned to crossing rate
Zone 1 Zone 2
Please fill in table below summarizing delay to pedestrians crossing major roadway at the intersection or in proximity to the intersection (zones). Please reference Section 4.8 of the Manual for further explanation and graphical representation.
Factored volume of delayed pedestrians
% Assigned to Crossing Rate
Net 8 Hour Volume of Total Pedestrians
Net 8 Hour Volume of Delayed Pedestrians
23% 34% 30% 100%
0
30 8 8 0
0 0 0
30% 100%
Total
0 0 0 0
Zone 1 Zone 2 Zone 3 (if needed) Zone 4 (if needed)
8:00
Minor Westbound Approach Pedestrians Crossing Main
RoadHour Ending
7:00
Main Northbound Approach Main Southbound ApproachMinor Eastbound Approach
18:00Total
9:0012:0013:00
17:0016:00
25-36
Number of Collisions*
000
Preceding Months
1-1213-24
Glen Erin Drive and Access
North-South
2 or more
4
Urban
GO TO Justification:
Analysis Sheet Results Sheet
2 or more
Proposed Collision
2025 Total Traffic
Input Data Jusification 1a and 1b - 2025 TOTAL (Glen Erin & Access) 9/30/2021
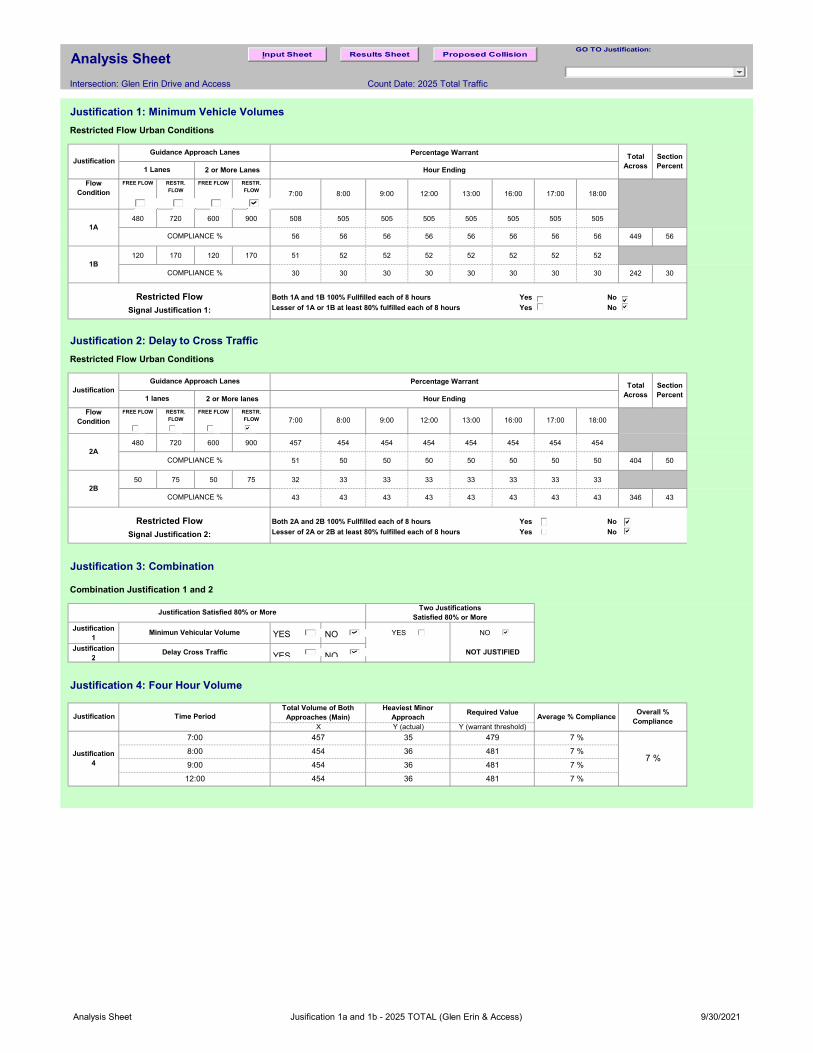
Analysis Sheet
Intersection: Glen Erin Drive and Access Count Date: 2025 Total Traffic
Flow Condition
FREE FLOW RESTR.
FLOW
FREE FLOW RESTR.
FLOW
FALSE FALSE FALSE TRUE
480 720 600 900 508 505 505 505 505 505 505 505
120 170 120 170 51 52 52 52 52 52 52 52
Both 1A and 1B 100% Fullfilled each of 8 hours Yes FALSE No TRUE
Lesser of 1A or 1B at least 80% fulfilled each of 8 hours Yes FALSE No TRUE
Flow Condition
FREE FLOW RESTR.
FLOW
FREE FLOW RESTR.
FLOW
FALSE FALSE FALSE TRUE
480 720 600 900 457 454 454 454 454 454 454 454
50 75 50 75 32 33 33 33 33 33 33 33
Both 2A and 2B 100% Fullfilled each of 8 hours Yes FALSE No TRUE
Lesser of 2A or 2B at least 80% fulfilled each of 8 hours Yes FALSE No TRUE
Justification 1
FALSE TRUE YES FALSE NO TRUE
Justification 2
FALSE TRUE
1 Lanes 2 or More Lanes
Guidance Approach Lanes
7:00 8:00 9:00
5656 56 56 56
Total Across
56 449
17:00
1ACOMPLIANCE %
1BCOMPLIANCE % 30 30
Restricted Flow
Signal Justification 1:
30
Justification 4
35
36
36
3612:00
Restricted Flow
17:00 18:00
50
7 %
Hour Ending
43 43
Average % Compliance
7 %
7 %
12:00 13:00
30
NOT JUSTIFIED
Justification 3: Combination
Justification Satisfied 80% or More
Overall %Compliance
7 %454
454
454
457
481
7 %
Y (warrant threshold)
479
Justification 2: Delay to Cross Traffic
Hour Ending
JustificationPercentage Warrant
Justification 1: Minimum Vehicle Volumes
Percentage Warrant
30 30
56
Signal Justification 2:
Minimun Vehicular Volume
2A
2B
COMPLIANCE %
COMPLIANCE % 43 43
JustificationHeaviest Minor
Approach
Two Justifications Satisfied 80% or More
Justification 4: Four Hour Volume
Delay Cross Traffic
Total Volume of Both Approaches (Main)Time Period
7:00
8:00
9:00
X Y (actual)
481
481
16:00
16:00
50 50
30 30
Required Value
56
Section Percent
7:00 8:00 9:00 12:00 13:00
56
242 30
18:00
Restricted Flow Urban Conditions
Restricted Flow Urban Conditions
Combination Justification 1 and 2
Justification
50 50
Guidance Approach Lanes
1 lanes 2 or More lanes
51 50 50
Total Across
Section Percent
404 50
43 43 43 43 346 43
GO TO Justification:Input Sheet Results Sheet
YES
YES
NO
NO
Proposed Collision
YES
Analysis Sheet Jusification 1a and 1b - 2025 TOTAL (Glen Erin & Access) 9/30/2021
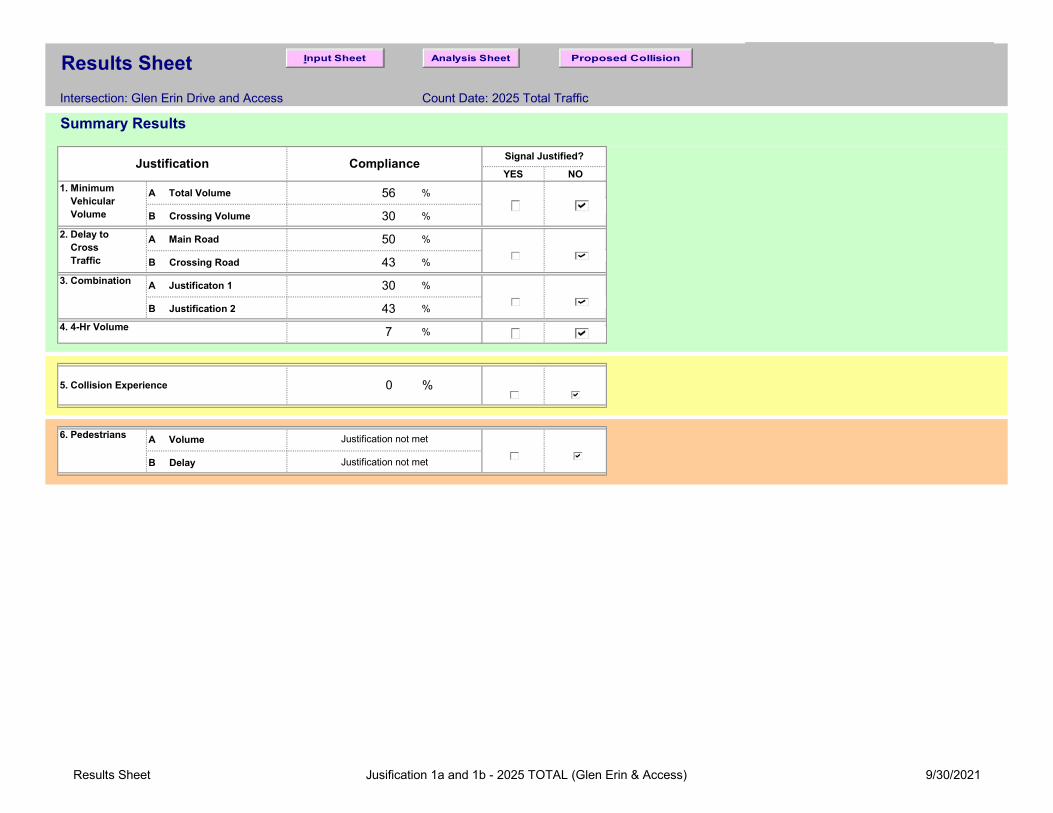
Results Sheet
Intersection: Glen Erin Drive and Access Count Date: 2025 Total Traffic
YES NO
A Total Volume 56 %
B Crossing Volume 30 %
A Main Road 50 %
B Crossing Road 43 %
A Justificaton 1 30 %
B Justification 2 43 %
4. 4-Hr Volume 7 % FALSE TRUE
A Volume
B Delay
TRUE
Signal Justified?
3. Combination
2. Delay to Cross Traffic
FALSE TRUE
FALSE TRUE
FALSE TRUE
Summary Results
1. Minimum Vehicular Volume
ComplianceJustification
5. Collision Experience
TRUE
0 %
FALSE
6. Pedestrians
FALSE
Justification not met
Justification not met
GO TO Justification:Input Sheet Analysis Sheet Proposed Collision
Results Sheet Jusification 1a and 1b - 2025 TOTAL (Glen Erin & Access) 9/30/2021

Input Data Sheet
What are the intersecting roadways? Glen Erin Drive and Access
What is the direction of the Main Road street? When was the data collected? 2025 Total Traffic - Sensitivity
Justification 1 - 4: Volume Warrants
a.- Number of lanes on the Main Road?
b.- Number of lanes on the Minor Road?
c.- How many approaches?
d.- What is the operating environment? AND Speed < 70 km/hr
e.- What is the eight hour vehicle volume at the intersection? (Please fill in table below)
LT TH RT LT TH RT LT TH RT LT TH RT
6 206 14 8 0 8 13 212 6 17 0 18 76 205 14 8 0 8 13 210 6 17 0 18 76 205 14 8 0 8 13 210 6 17 0 18 76 205 14 8 0 8 13 210 6 17 0 18 76 205 14 8 0 8 13 210 6 17 0 18 76 205 14 8 0 8 13 210 6 17 0 18 76 205 14 8 0 8 13 210 6 17 0 18 76 205 14 8 0 8 13 210 6 17 0 18 7
50 1,638 110 66 0 62 106 1,680 48 138 0 146 56
Justification 5: Collision Experience
* Include only collisions that are susceptable to correction through the installation of traffic signal control
Justification 6: Pedestrian Volume
a.-
Assisted Unassisted Assisted Unassisted Assisted Unassisted Assisted Unassisted
0
2,000
b.-
Assisted Unassisted Assisted Unassisted Assisted Unassisted Assisted Unassisted
0 0 0 0 0 0 0 0
10 10 1 6 2 4 0 0
0
12
Please fill in table below summarizing total pedestrians crossing major roadway at the intersection or in proximity to the intersection (zones). Please reference Section 4.8 of the Manual for further explanation and graphical representation.
Population >= 10,000
Total 8 hour pedestrian volume
Zone 4 (if needed)Total
Net 8 Hour Pedestrian Volume at Crossing
Net 8 Hour Vehicular Volume on Street Being Crossed
23% 34%
Total 8 hour pedestrians delayed greater than 10 seconds
Factored volume of total pedestrians
Zone 3 (if needed)
Total 8 hour pedestrian volume
Factored 8 hour pedestrian volume
% Assigned to crossing rate
Zone 1 Zone 2
Please fill in table below summarizing delay to pedestrians crossing major roadway at the intersection or in proximity to the intersection (zones). Please reference Section 4.8 of the Manual for further explanation and graphical representation.
Factored volume of delayed pedestrians
% Assigned to Crossing Rate
Net 8 Hour Volume of Total Pedestrians
Net 8 Hour Volume of Delayed Pedestrians
23% 34% 30% 100%
0
30 8 8 0
0 0 0
30% 100%
Total
0 0 0 0
Zone 1 Zone 2 Zone 3 (if needed) Zone 4 (if needed)
8:00
Minor Westbound Approach Pedestrians Crossing Main
RoadHour Ending
7:00
Main Northbound Approach Main Southbound ApproachMinor Eastbound Approach
18:00Total
9:0012:0013:00
17:0016:00
25-36
Number of Collisions*
000
Preceding Months
1-1213-24
Glen Erin Drive and Access
North-South
1
4
Urban
GO TO Justification:
Analysis Sheet Results Sheet
1
Proposed Collision
2025 Total Traffic - Sensitivity
Input Data Jusification 1a and 1b - 2025 TOTAL (Glen Erin & Access) 9/30/2021

Analysis Sheet
Intersection: Glen Erin Drive and Access Count Date: 2025 Total Traffic - Sensitivity
Flow Condition
FREE FLOW RESTR.
FLOW
FREE FLOW RESTR.
FLOW
FALSE TRUE FALSE FALSE
480 720 600 900 508 505 505 505 505 505 505 505
120 170 120 170 51 52 52 52 52 52 52 52
Both 1A and 1B 100% Fullfilled each of 8 hours Yes FALSE No TRUE
Lesser of 1A or 1B at least 80% fulfilled each of 8 hours Yes FALSE No TRUE
Flow Condition
FREE FLOW RESTR.
FLOW
FREE FLOW RESTR.
FLOW
FALSE TRUE FALSE FALSE
480 720 600 900 457 454 454 454 454 454 454 454
50 75 50 75 32 33 33 33 33 33 33 33
Both 2A and 2B 100% Fullfilled each of 8 hours Yes FALSE No TRUE
Lesser of 2A or 2B at least 80% fulfilled each of 8 hours Yes FALSE No TRUE
Justification 1
FALSE TRUE YES FALSE NO TRUE
Justification 2
FALSE TRUE
1 Lanes 2 or More Lanes
Guidance Approach Lanes
7:00 8:00 9:00
7071 70 70 70
Total Across
70 562
17:00
1ACOMPLIANCE %
1BCOMPLIANCE % 30 30
Restricted Flow
Signal Justification 1:
30
Justification 4
35
36
36
3612:00
Restricted Flow
17:00 18:00
63
13 %
Hour Ending
43 43
Average % Compliance
12 %
13 %
12:00 13:00
30
NOT JUSTIFIED
Justification 3: Combination
Justification Satisfied 80% or More
Overall %Compliance
13 %454
454
454
457
283
13 %
Y (warrant threshold)
281
Justification 2: Delay to Cross Traffic
Hour Ending
JustificationPercentage Warrant
Justification 1: Minimum Vehicle Volumes
Percentage Warrant
30 30
70
Signal Justification 2:
Minimun Vehicular Volume
2A
2B
COMPLIANCE %
COMPLIANCE % 43 43
JustificationHeaviest Minor
Approach
Two Justifications Satisfied 80% or More
Justification 4: Four Hour Volume
Delay Cross Traffic
Total Volume of Both Approaches (Main)Time Period
7:00
8:00
9:00
X Y (actual)
283
283
16:00
16:00
63 63
30 30
Required Value
70
Section Percent
7:00 8:00 9:00 12:00 13:00
70
242 30
18:00
Restricted Flow Urban Conditions
Restricted Flow Urban Conditions
Combination Justification 1 and 2
Justification
63 63
Guidance Approach Lanes
1 lanes 2 or More lanes
63 63 63
Total Across
Section Percent
504 63
43 43 43 43 346 43
GO TO Justification:Input Sheet Results Sheet
YES
YES
NO
NO
Proposed Collision
YES
Analysis Sheet Jusification 1a and 1b - 2025 TOTAL (Glen Erin & Access) 9/30/2021
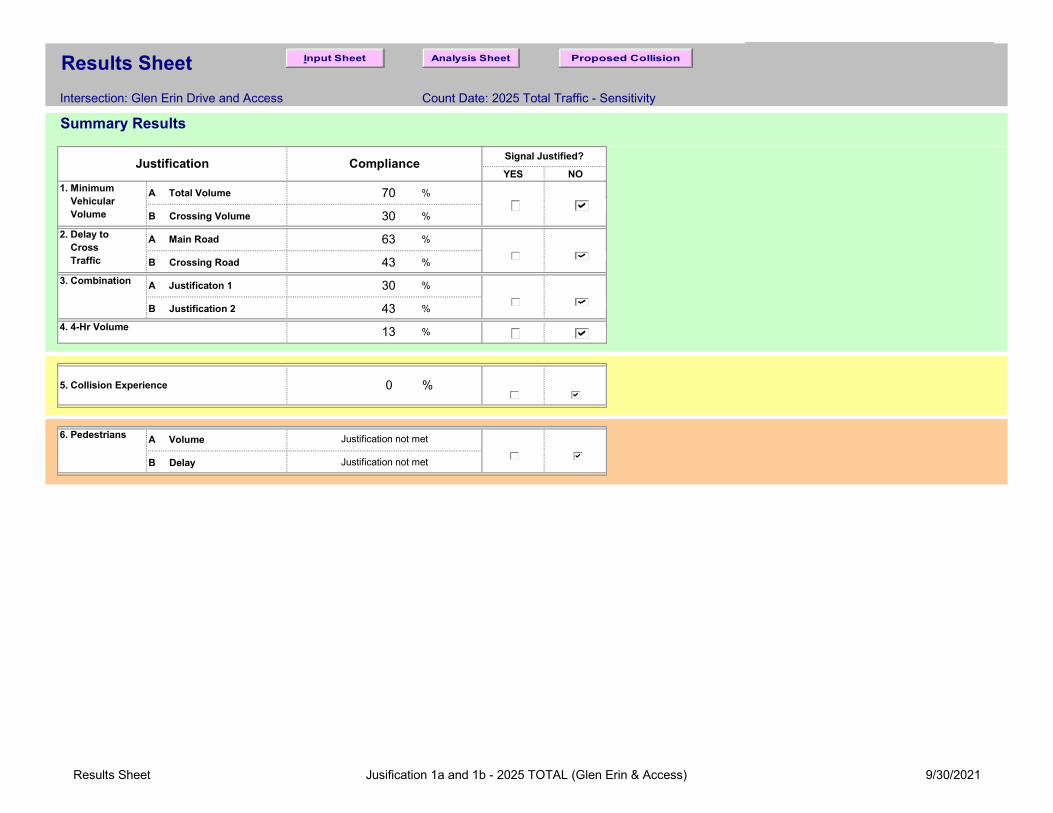
Results Sheet
Intersection: Glen Erin Drive and Access Count Date: 2025 Total Traffic - Sensitivity
YES NO
A Total Volume 70 %
B Crossing Volume 30 %
A Main Road 63 %
B Crossing Road 43 %
A Justificaton 1 30 %
B Justification 2 43 %
4. 4-Hr Volume 13 % FALSE TRUE
A Volume
B Delay
TRUE
Signal Justified?
3. Combination
2. Delay to Cross Traffic
FALSE TRUE
FALSE TRUE
FALSE TRUE
Summary Results
1. Minimum Vehicular Volume
ComplianceJustification
5. Collision Experience
TRUE
0 %
FALSE
6. Pedestrians
FALSE
Justification not met
Justification not met
GO TO Justification:Input Sheet Analysis Sheet Proposed Collision
Results Sheet Jusification 1a and 1b - 2025 TOTAL (Glen Erin & Access) 9/30/2021
Starwood Group Inc. Traffic Impact Study
6719 Glen Erin Drive, City of Mississauga October 2021
C.F. Crozier & Associates Inc.
Project No. 1886-5590
APPENDIX H
Vehicle Turning and Pavement Marking & Signage Plans
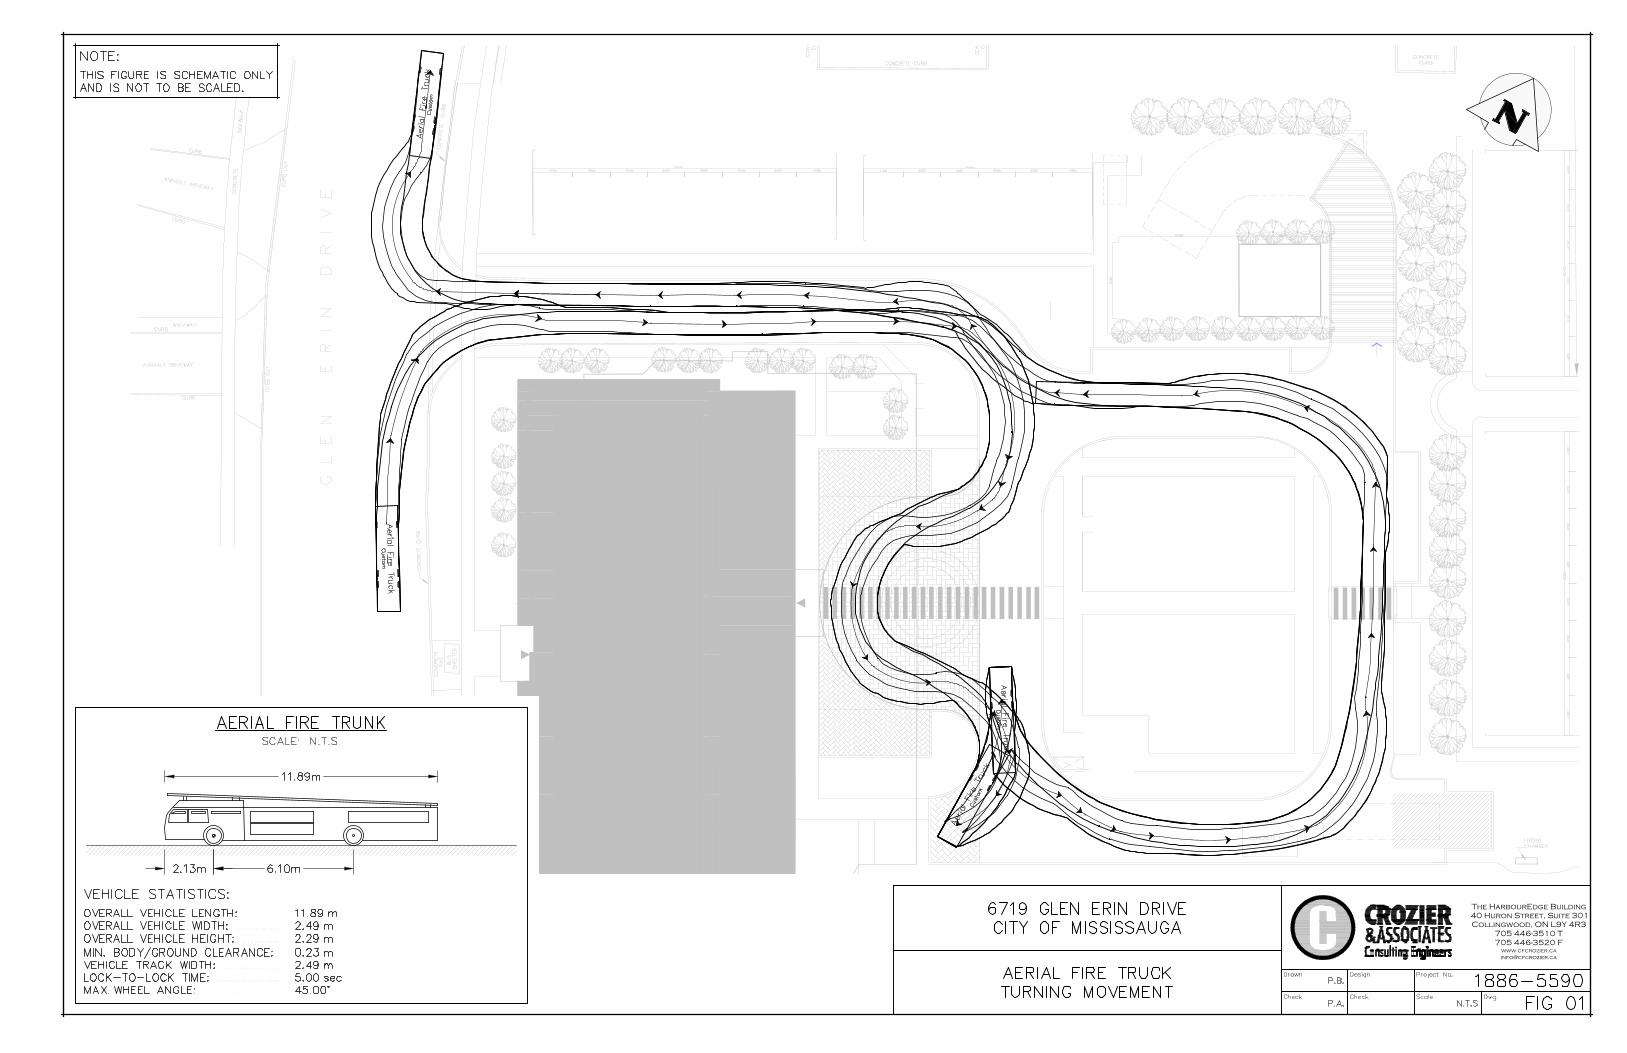
The HarbourEdge Building
40 Huron Street, Suite 301
Collingwood, ON L9Y 4R3
705 446-3510 T
705 446-3520 F
www.cfcrozier.ca
AutoCAD SHX Text
G L E N E R I N D R I V E
AutoCAD SHX Text
CONCRETE
AutoCAD SHX Text
CURB
AutoCAD SHX Text
CURB
AutoCAD SHX Text
CONCRETE
AutoCAD SHX Text
CONCRETE CURB
AutoCAD SHX Text
CONCRETE
AutoCAD SHX Text
CURB
AutoCAD SHX Text
CONCRETE PAD
AutoCAD SHX Text
HYDRO
AutoCAD SHX Text
CHAMBER
AutoCAD SHX Text
BUS
AutoCAD SHX Text
SHELTER
AutoCAD SHX Text
CONCRETE
AutoCAD SHX Text
PAD
AutoCAD SHX Text
CONCRETE CURB
AutoCAD SHX Text
CONCRETE CURB
AutoCAD SHX Text
CURB
AutoCAD SHX Text
CURB
AutoCAD SHX Text
CURB
AutoCAD SHX Text
CURB
AutoCAD SHX Text
ASPHALT DRIVEWAY
AutoCAD SHX Text
ASPHALT DRIVEWAY
AutoCAD SHX Text
WALKWAY
AutoCAD SHX Text
CURB CUT
AutoCAD SHX Text
CURB CUT
AutoCAD SHX Text
CONCRETE
AutoCAD SHX Text
SIDEWALK
AutoCAD SHX Text
Aerial Fire Truck
AutoCAD SHX Text
Custom
AutoCAD SHX Text
Aerial Fire Truck
AutoCAD SHX Text
Custom
AutoCAD SHX Text
Aerial Fire Truck
AutoCAD SHX Text
Custom
AutoCAD SHX Text
(c) 2021 Transoft Solutions, Inc. All rights reserved.
AutoCAD SHX Text
Aerial Fire Truck
AutoCAD SHX Text
Custom
AutoCAD SHX Text
(c) 2021 Transoft Solutions, Inc. All rights reserved.
AutoCAD SHX Text
Project No.
AutoCAD SHX Text
Dwg.
AutoCAD SHX Text
Design
AutoCAD SHX Text
Check
AutoCAD SHX Text
Drawn
AutoCAD SHX Text
Check
AutoCAD SHX Text
P.B.
AutoCAD SHX Text
Scale
AutoCAD SHX Text
N.T.S
AutoCAD SHX Text
1886-5590
AutoCAD SHX Text
P.A.
AutoCAD SHX Text
AERIAL FIRE TRUCK TURNING MOVEMENT
AutoCAD SHX Text
6719 GLEN ERIN DRIVE CITY OF MISSISSAUGA
AutoCAD SHX Text
NOTE: THIS FIGURE IS SCHEMATIC ONLY AND IS NOT TO BE SCALED.
AutoCAD SHX Text
FIG 01
AutoCAD SHX Text
%%UAERIAL FIRE TRUNK
AutoCAD SHX Text
SCALE: N.T.S.
AutoCAD SHX Text
VEHICLE STATISTICS: OVERALL VEHICLE LENGTH: ......... 11.89 m ......... 11.89 m 11.89 m m m OVERALL VEHICLE WIDTH: ............ 2.49 m ............ 2.49 m 2.49 m m m OVERALL VEHICLE HEIGHT: .......... 2.29 m .......... 2.29 m 2.29 m m m MIN. BODY/GROUND CLEARANCE: 0.23 m 0.23 m m m VEHICLE TRACK WIDTH: ............... 2.49 m ............... 2.49 m 2.49 m m m LOCK-TO-LOCK TIME: ................. 5.00 sec ................. 5.00 sec 5.00 sec sec sec MAX. WHEEL ANGLE: .................... 45.00 WHEEL ANGLE: .................... 45.00 .................... 45.00 45.00°
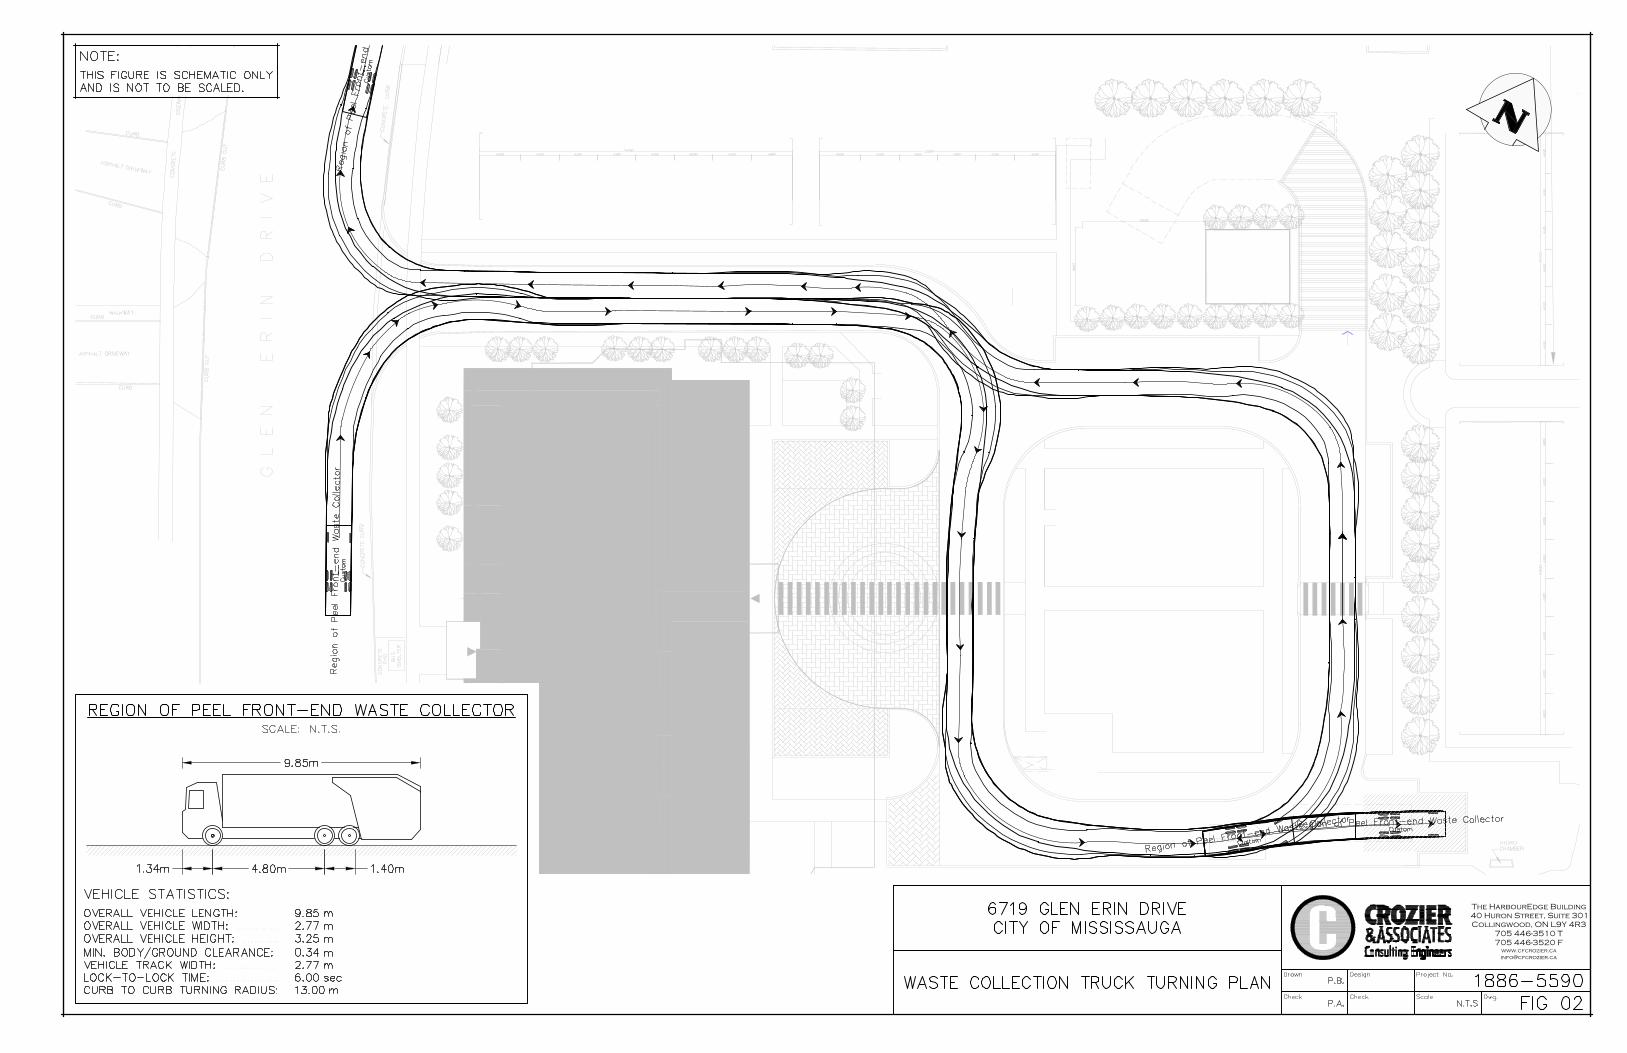
The HarbourEdge Building
40 Huron Street, Suite 301
Collingwood, ON L9Y 4R3
705 446-3510 T
705 446-3520 F
www.cfcrozier.ca
AutoCAD SHX Text
G L E N E R I N D R I V E
AutoCAD SHX Text
CONCRETE PAD
AutoCAD SHX Text
HYDRO
AutoCAD SHX Text
CHAMBER
AutoCAD SHX Text
BUS
AutoCAD SHX Text
SHELTER
AutoCAD SHX Text
CONCRETE
AutoCAD SHX Text
PAD
AutoCAD SHX Text
CONCRETE CURB
AutoCAD SHX Text
CONCRETE CURB
AutoCAD SHX Text
CURB
AutoCAD SHX Text
CURB
AutoCAD SHX Text
CURB
AutoCAD SHX Text
CURB
AutoCAD SHX Text
ASPHALT DRIVEWAY
AutoCAD SHX Text
ASPHALT DRIVEWAY
AutoCAD SHX Text
WALKWAY
AutoCAD SHX Text
CURB CUT
AutoCAD SHX Text
CURB CUT
AutoCAD SHX Text
CONCRETE
AutoCAD SHX Text
SIDEWALK
AutoCAD SHX Text
Region of Peel Front-end Waste Collector
AutoCAD SHX Text
Custom
AutoCAD SHX Text
Region of Peel Front-end Waste Collector
AutoCAD SHX Text
Custom
AutoCAD SHX Text
Region of Peel Front-end Waste Collector
AutoCAD SHX Text
Custom
AutoCAD SHX Text
(c) 2021 Transoft Solutions, Inc. All rights reserved.
AutoCAD SHX Text
Region of Peel Front-end Waste Collector
AutoCAD SHX Text
Custom
AutoCAD SHX Text
(c) 2021 Transoft Solutions, Inc. All rights reserved.
AutoCAD SHX Text
Project No.
AutoCAD SHX Text
Dwg.
AutoCAD SHX Text
Design
AutoCAD SHX Text
Check
AutoCAD SHX Text
Drawn
AutoCAD SHX Text
Check
AutoCAD SHX Text
P.B.
AutoCAD SHX Text
Scale
AutoCAD SHX Text
N.T.S
AutoCAD SHX Text
1886-5590
AutoCAD SHX Text
P.A.
AutoCAD SHX Text
WASTE COLLECTION TRUCK TURNING PLAN
AutoCAD SHX Text
6719 GLEN ERIN DRIVE CITY OF MISSISSAUGA
AutoCAD SHX Text
NOTE: THIS FIGURE IS SCHEMATIC ONLY AND IS NOT TO BE SCALED.
AutoCAD SHX Text
FIG 02
AutoCAD SHX Text
%%UREGION OF PEEL FRONT-END WASTE COLLECTOR
AutoCAD SHX Text
SCALE: N.T.S.
AutoCAD SHX Text
VEHICLE STATISTICS: OVERALL VEHICLE LENGTH: ......... 9.85 m ......... 9.85 m 9.85 m m m OVERALL VEHICLE WIDTH: ............ 2.77 m ............ 2.77 m 2.77 m m m OVERALL VEHICLE HEIGHT: .......... 3.25 m .......... 3.25 m 3.25 m m m MIN. BODY/GROUND CLEARANCE: 0.34 m 0.34 m m m VEHICLE TRACK WIDTH: ............... 2.77 m ............... 2.77 m 2.77 m m m LOCK-TO-LOCK TIME: ................. 6.00 sec ................. 6.00 sec 6.00 sec sec sec CURB TO CURB TURNING RADIUS: 13.00 m13.00 m mm
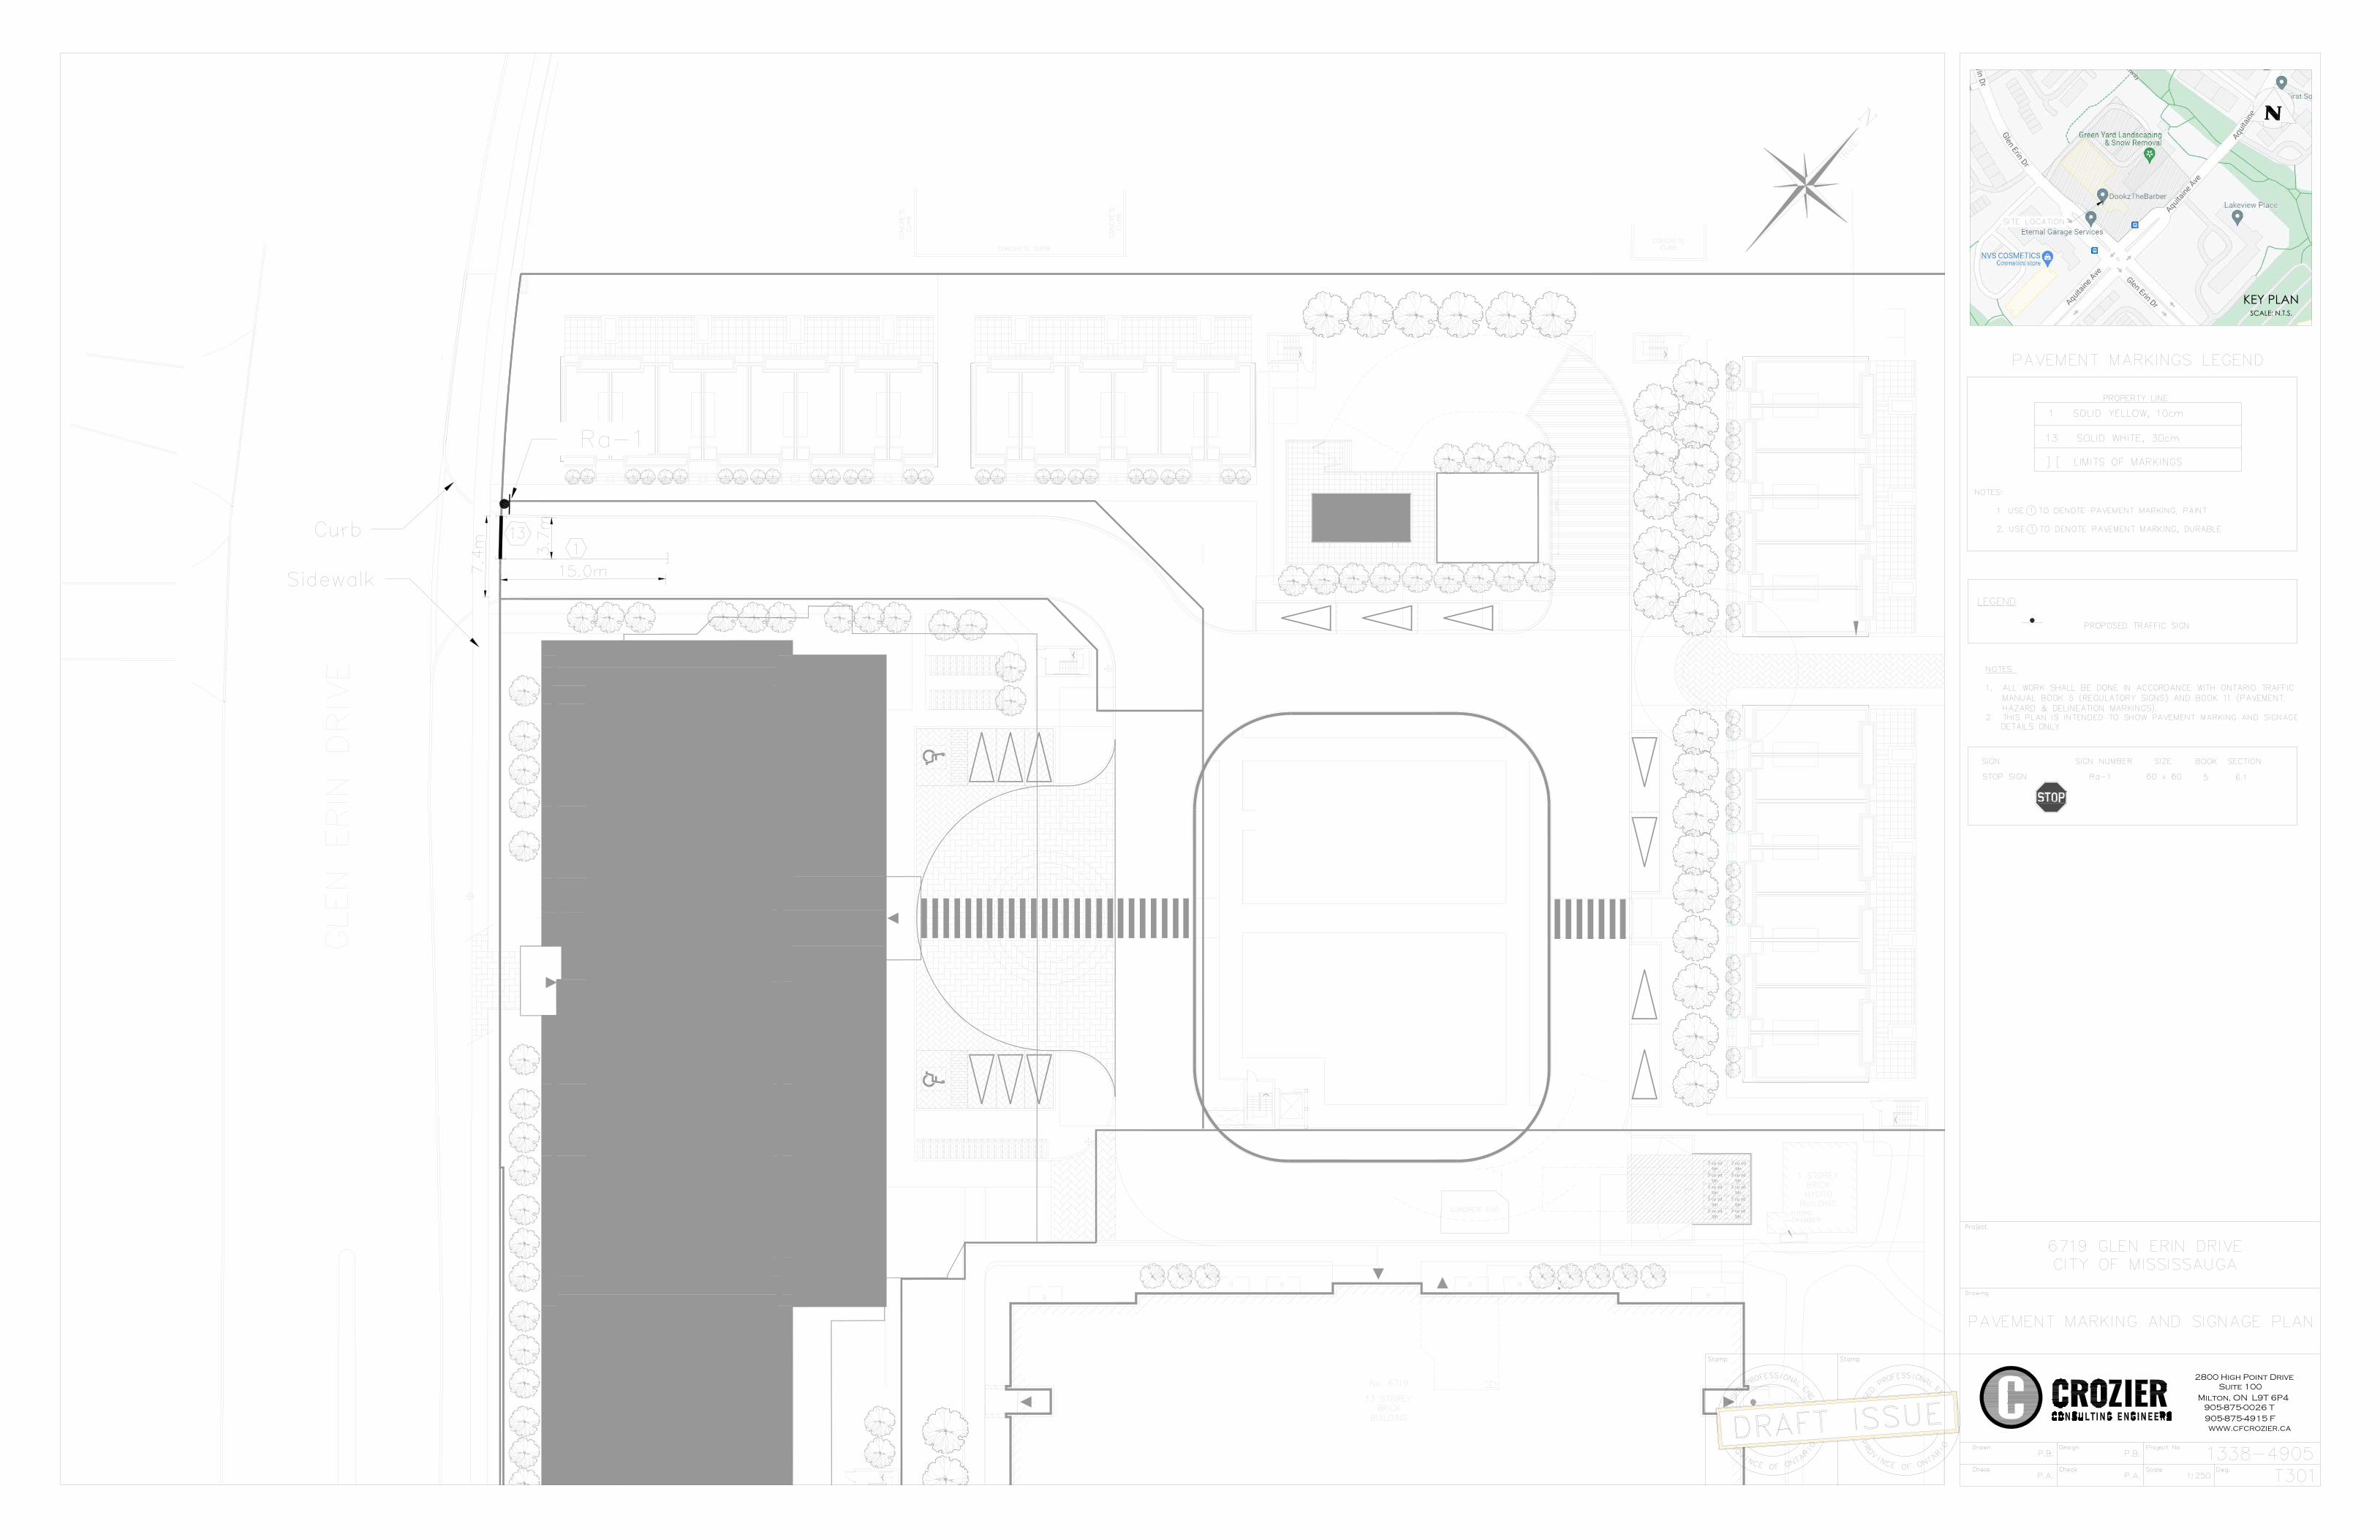
3 cu ydbin
3 cu ydbin
3 cu ydbin
3 cu ydbin
3 cu ydbin
3 cu ydbin
3 cu ydbin
3 cu ydbin
3 cu ydbin
3 cu ydbin
2800 High Point Drive
Suite 100
Milton, ON L9T 6P4
905-875-0026 T
905-875-4915 F
www.cfcrozier.ca
KEY PLANSCALE: N.T.S.
AutoCAD SHX Text
G L E N E R I N D R I V E
AutoCAD SHX Text
CONCRETE
AutoCAD SHX Text
CURB
AutoCAD SHX Text
CURB
AutoCAD SHX Text
CONCRETE
AutoCAD SHX Text
CONCRETE CURB
AutoCAD SHX Text
CONCRETE
AutoCAD SHX Text
CURB
AutoCAD SHX Text
CONCRETE PAD
AutoCAD SHX Text
AIR SHAFT
AutoCAD SHX Text
HYDRO
AutoCAD SHX Text
CHAMBER
AutoCAD SHX Text
1 STOREY
AutoCAD SHX Text
BRICK
AutoCAD SHX Text
HYDRO
AutoCAD SHX Text
BUILDING
AutoCAD SHX Text
STEP
AutoCAD SHX Text
DOWN
AutoCAD SHX Text
B
AutoCAD SHX Text
B
AutoCAD SHX Text
B
AutoCAD SHX Text
B
AutoCAD SHX Text
B
AutoCAD SHX Text
B
AutoCAD SHX Text
No. 6719
AutoCAD SHX Text
13 STOREY
AutoCAD SHX Text
BRICK
AutoCAD SHX Text
BUILDING
AutoCAD SHX Text
13
AutoCAD SHX Text
Ra-1
AutoCAD SHX Text
1
AutoCAD SHX Text
Curb
AutoCAD SHX Text
Sidewalk
AutoCAD SHX Text
]
AutoCAD SHX Text
[
AutoCAD SHX Text
[
AutoCAD SHX Text
[
AutoCAD SHX Text
Project No.
AutoCAD SHX Text
Dwg.
AutoCAD SHX Text
Design
AutoCAD SHX Text
Check
AutoCAD SHX Text
Drawn
AutoCAD SHX Text
Check
AutoCAD SHX Text
Drawing
AutoCAD SHX Text
Project
AutoCAD SHX Text
P.B.
AutoCAD SHX Text
PAVEMENT MARKING AND SIGNAGE PLAN
AutoCAD SHX Text
Scale
AutoCAD SHX Text
1:250
AutoCAD SHX Text
1338-4905
AutoCAD SHX Text
SITE LOCATION
AutoCAD SHX Text
6719 GLEN ERIN DRIVE CITY OF MISSISSAUGA
AutoCAD SHX Text
P.A.
AutoCAD SHX Text
P.A.
AutoCAD SHX Text
PROPERTY LINE
AutoCAD SHX Text
T301
AutoCAD SHX Text
Stamp
AutoCAD SHX Text
P
AutoCAD SHX Text
R
AutoCAD SHX Text
O
AutoCAD SHX Text
V
AutoCAD SHX Text
I
AutoCAD SHX Text
N
AutoCAD SHX Text
C
AutoCAD SHX Text
E
AutoCAD SHX Text
O
AutoCAD SHX Text
F
AutoCAD SHX Text
O
AutoCAD SHX Text
N
AutoCAD SHX Text
T
AutoCAD SHX Text
A
AutoCAD SHX Text
R
AutoCAD SHX Text
I
AutoCAD SHX Text
O
AutoCAD SHX Text
L
AutoCAD SHX Text
I
AutoCAD SHX Text
C
AutoCAD SHX Text
E
AutoCAD SHX Text
N
AutoCAD SHX Text
S
AutoCAD SHX Text
E
AutoCAD SHX Text
D
AutoCAD SHX Text
P
AutoCAD SHX Text
R
AutoCAD SHX Text
O
AutoCAD SHX Text
F
AutoCAD SHX Text
E
AutoCAD SHX Text
S
AutoCAD SHX Text
S
AutoCAD SHX Text
I
AutoCAD SHX Text
O
AutoCAD SHX Text
N
AutoCAD SHX Text
A
AutoCAD SHX Text
L
AutoCAD SHX Text
E
AutoCAD SHX Text
N
AutoCAD SHX Text
G
AutoCAD SHX Text
I
AutoCAD SHX Text
N
AutoCAD SHX Text
E
AutoCAD SHX Text
E
AutoCAD SHX Text
R
AutoCAD SHX Text
N. MOCAN
AutoCAD SHX Text
100061476
AutoCAD SHX Text
P
AutoCAD SHX Text
R
AutoCAD SHX Text
O
AutoCAD SHX Text
V
AutoCAD SHX Text
I
AutoCAD SHX Text
N
AutoCAD SHX Text
C
AutoCAD SHX Text
E
AutoCAD SHX Text
O
AutoCAD SHX Text
F
AutoCAD SHX Text
O
AutoCAD SHX Text
N
AutoCAD SHX Text
T
AutoCAD SHX Text
A
AutoCAD SHX Text
R
AutoCAD SHX Text
I
AutoCAD SHX Text
O
AutoCAD SHX Text
L
AutoCAD SHX Text
I
AutoCAD SHX Text
C
AutoCAD SHX Text
E
AutoCAD SHX Text
N
AutoCAD SHX Text
S
AutoCAD SHX Text
E
AutoCAD SHX Text
D
AutoCAD SHX Text
P
AutoCAD SHX Text
R
AutoCAD SHX Text
O
AutoCAD SHX Text
F
AutoCAD SHX Text
E
AutoCAD SHX Text
S
AutoCAD SHX Text
S
AutoCAD SHX Text
I
AutoCAD SHX Text
O
AutoCAD SHX Text
N
AutoCAD SHX Text
A
AutoCAD SHX Text
L
AutoCAD SHX Text
E
AutoCAD SHX Text
N
AutoCAD SHX Text
G
AutoCAD SHX Text
I
AutoCAD SHX Text
N
AutoCAD SHX Text
E
AutoCAD SHX Text
E
AutoCAD SHX Text
R
AutoCAD SHX Text
A. PATEL
AutoCAD SHX Text
100035721
AutoCAD SHX Text
DRAFT ISSUE
AutoCAD SHX Text
Stamp
AutoCAD SHX Text
N
AutoCAD SHX Text
TRUE
AutoCAD SHX Text
PAVEMENT MARKINGS LEGEND
AutoCAD SHX Text
NOTES: 1. USE 1 TO DENOTE PAVEMENT MARKING, PAINT 2. USE 1 TO DENOTE PAVEMENT MARKING, DURABLE
AutoCAD SHX Text
1 SOLID YELLOW, 10cm
AutoCAD SHX Text
] [ LIMITS OF MARKINGS
AutoCAD SHX Text
13 SOLID WHITE, 30cm
AutoCAD SHX Text
NOTES: 1. ALL WORK SHALL BE DONE IN ACCORDANCE WITH ONTARIO TRAFFIC ALL WORK SHALL BE DONE IN ACCORDANCE WITH ONTARIO TRAFFIC MANUAL BOOK 5 (REGULATORY SIGNS) AND BOOK 11 (PAVEMENT, HAZARD & DELINEATION MARKINGS). 2. THIS PLAN IS INTENDED TO SHOW PAVEMENT MARKING AND SIGNAGE THIS PLAN IS INTENDED TO SHOW PAVEMENT MARKING AND SIGNAGE DETAILS ONLY.
AutoCAD SHX Text
%%ULEGEND
AutoCAD SHX Text
PROPOSED TRAFFIC SIGN
AutoCAD SHX Text
P.B.
AutoCAD SHX Text
Ra-1
AutoCAD SHX Text
60 x 60
AutoCAD SHX Text
6.1
AutoCAD SHX Text
5
AutoCAD SHX Text
STOP SIGN
AutoCAD SHX Text
SIZE
AutoCAD SHX Text
BOOK
AutoCAD SHX Text
SECTION
AutoCAD SHX Text
SIGN
AutoCAD SHX Text
SIGN NUMBER
AutoCAD SHX Text
GLEN ERIN DRIVE
Starwood Group Inc. Traffic Impact Study
6719 Glen Erin Drive, City of Mississauga October 2021
C.F. Crozier & Associates Inc.
Project No. 1886-5590
FIGURES
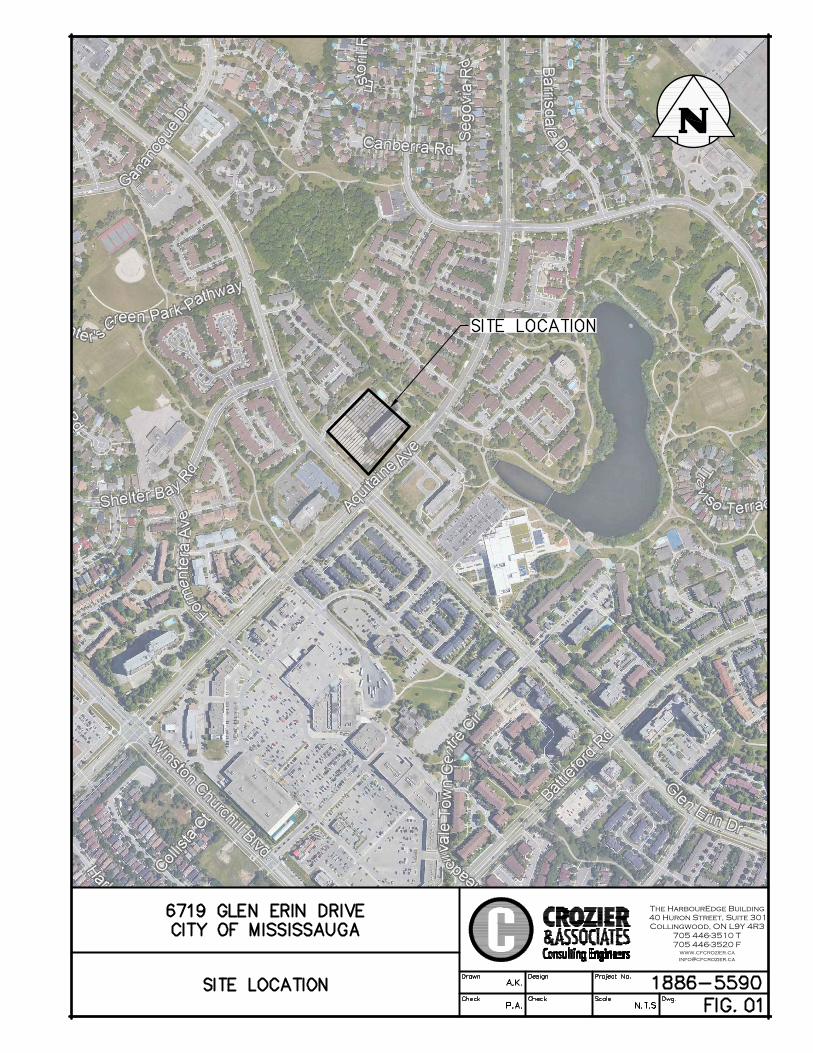
The HarbourEdge Building
40 Huron Street, Suite 301
Collingwood, ON L9Y 4R3
705 446-3510 T
705 446-3520 F
www.cfcrozier.ca
AutoCAD SHX Text
Project No.
AutoCAD SHX Text
Dwg.
AutoCAD SHX Text
Design
AutoCAD SHX Text
Check
AutoCAD SHX Text
Drawn
AutoCAD SHX Text
Check
AutoCAD SHX Text
A.K.
AutoCAD SHX Text
Scale
AutoCAD SHX Text
N.T.S
AutoCAD SHX Text
1886-5590
AutoCAD SHX Text
P.A.
AutoCAD SHX Text
FIG. 01 0101
AutoCAD SHX Text
SITE LOCATION
AutoCAD SHX Text
6719 GLEN ERIN DRIVE CITY OF MISSISSAUGA
AutoCAD SHX Text
SITE LOCATION
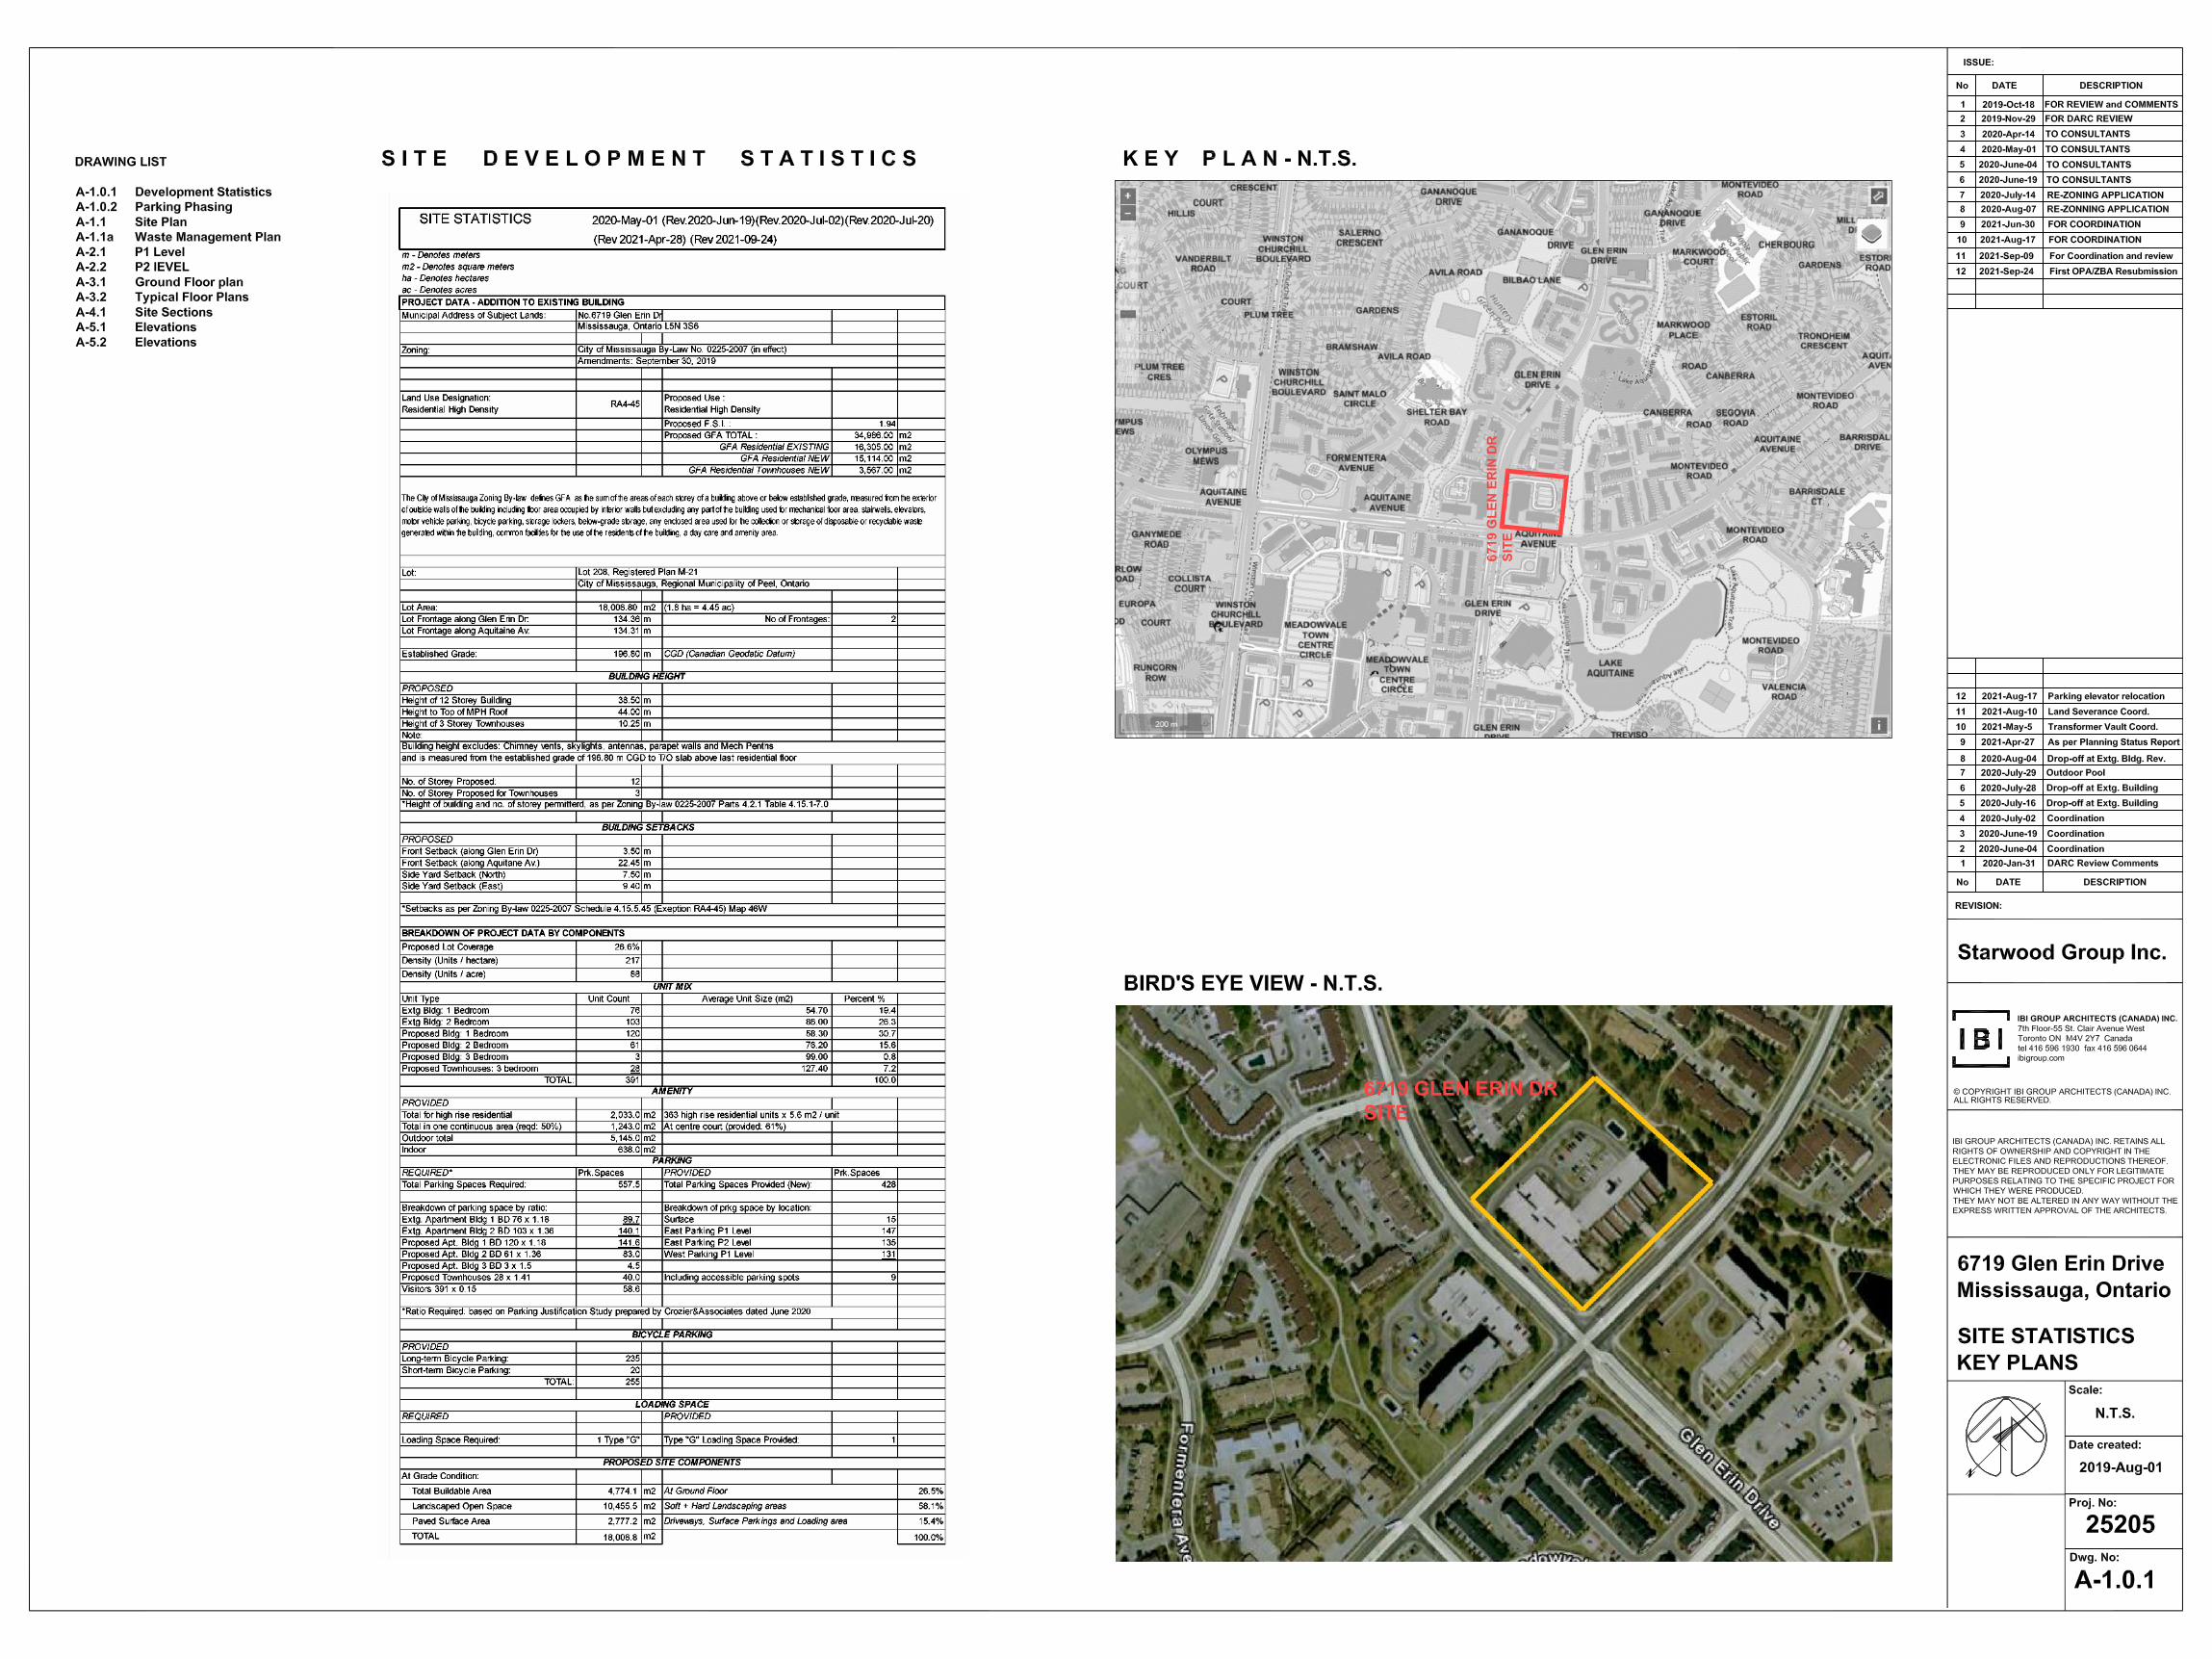
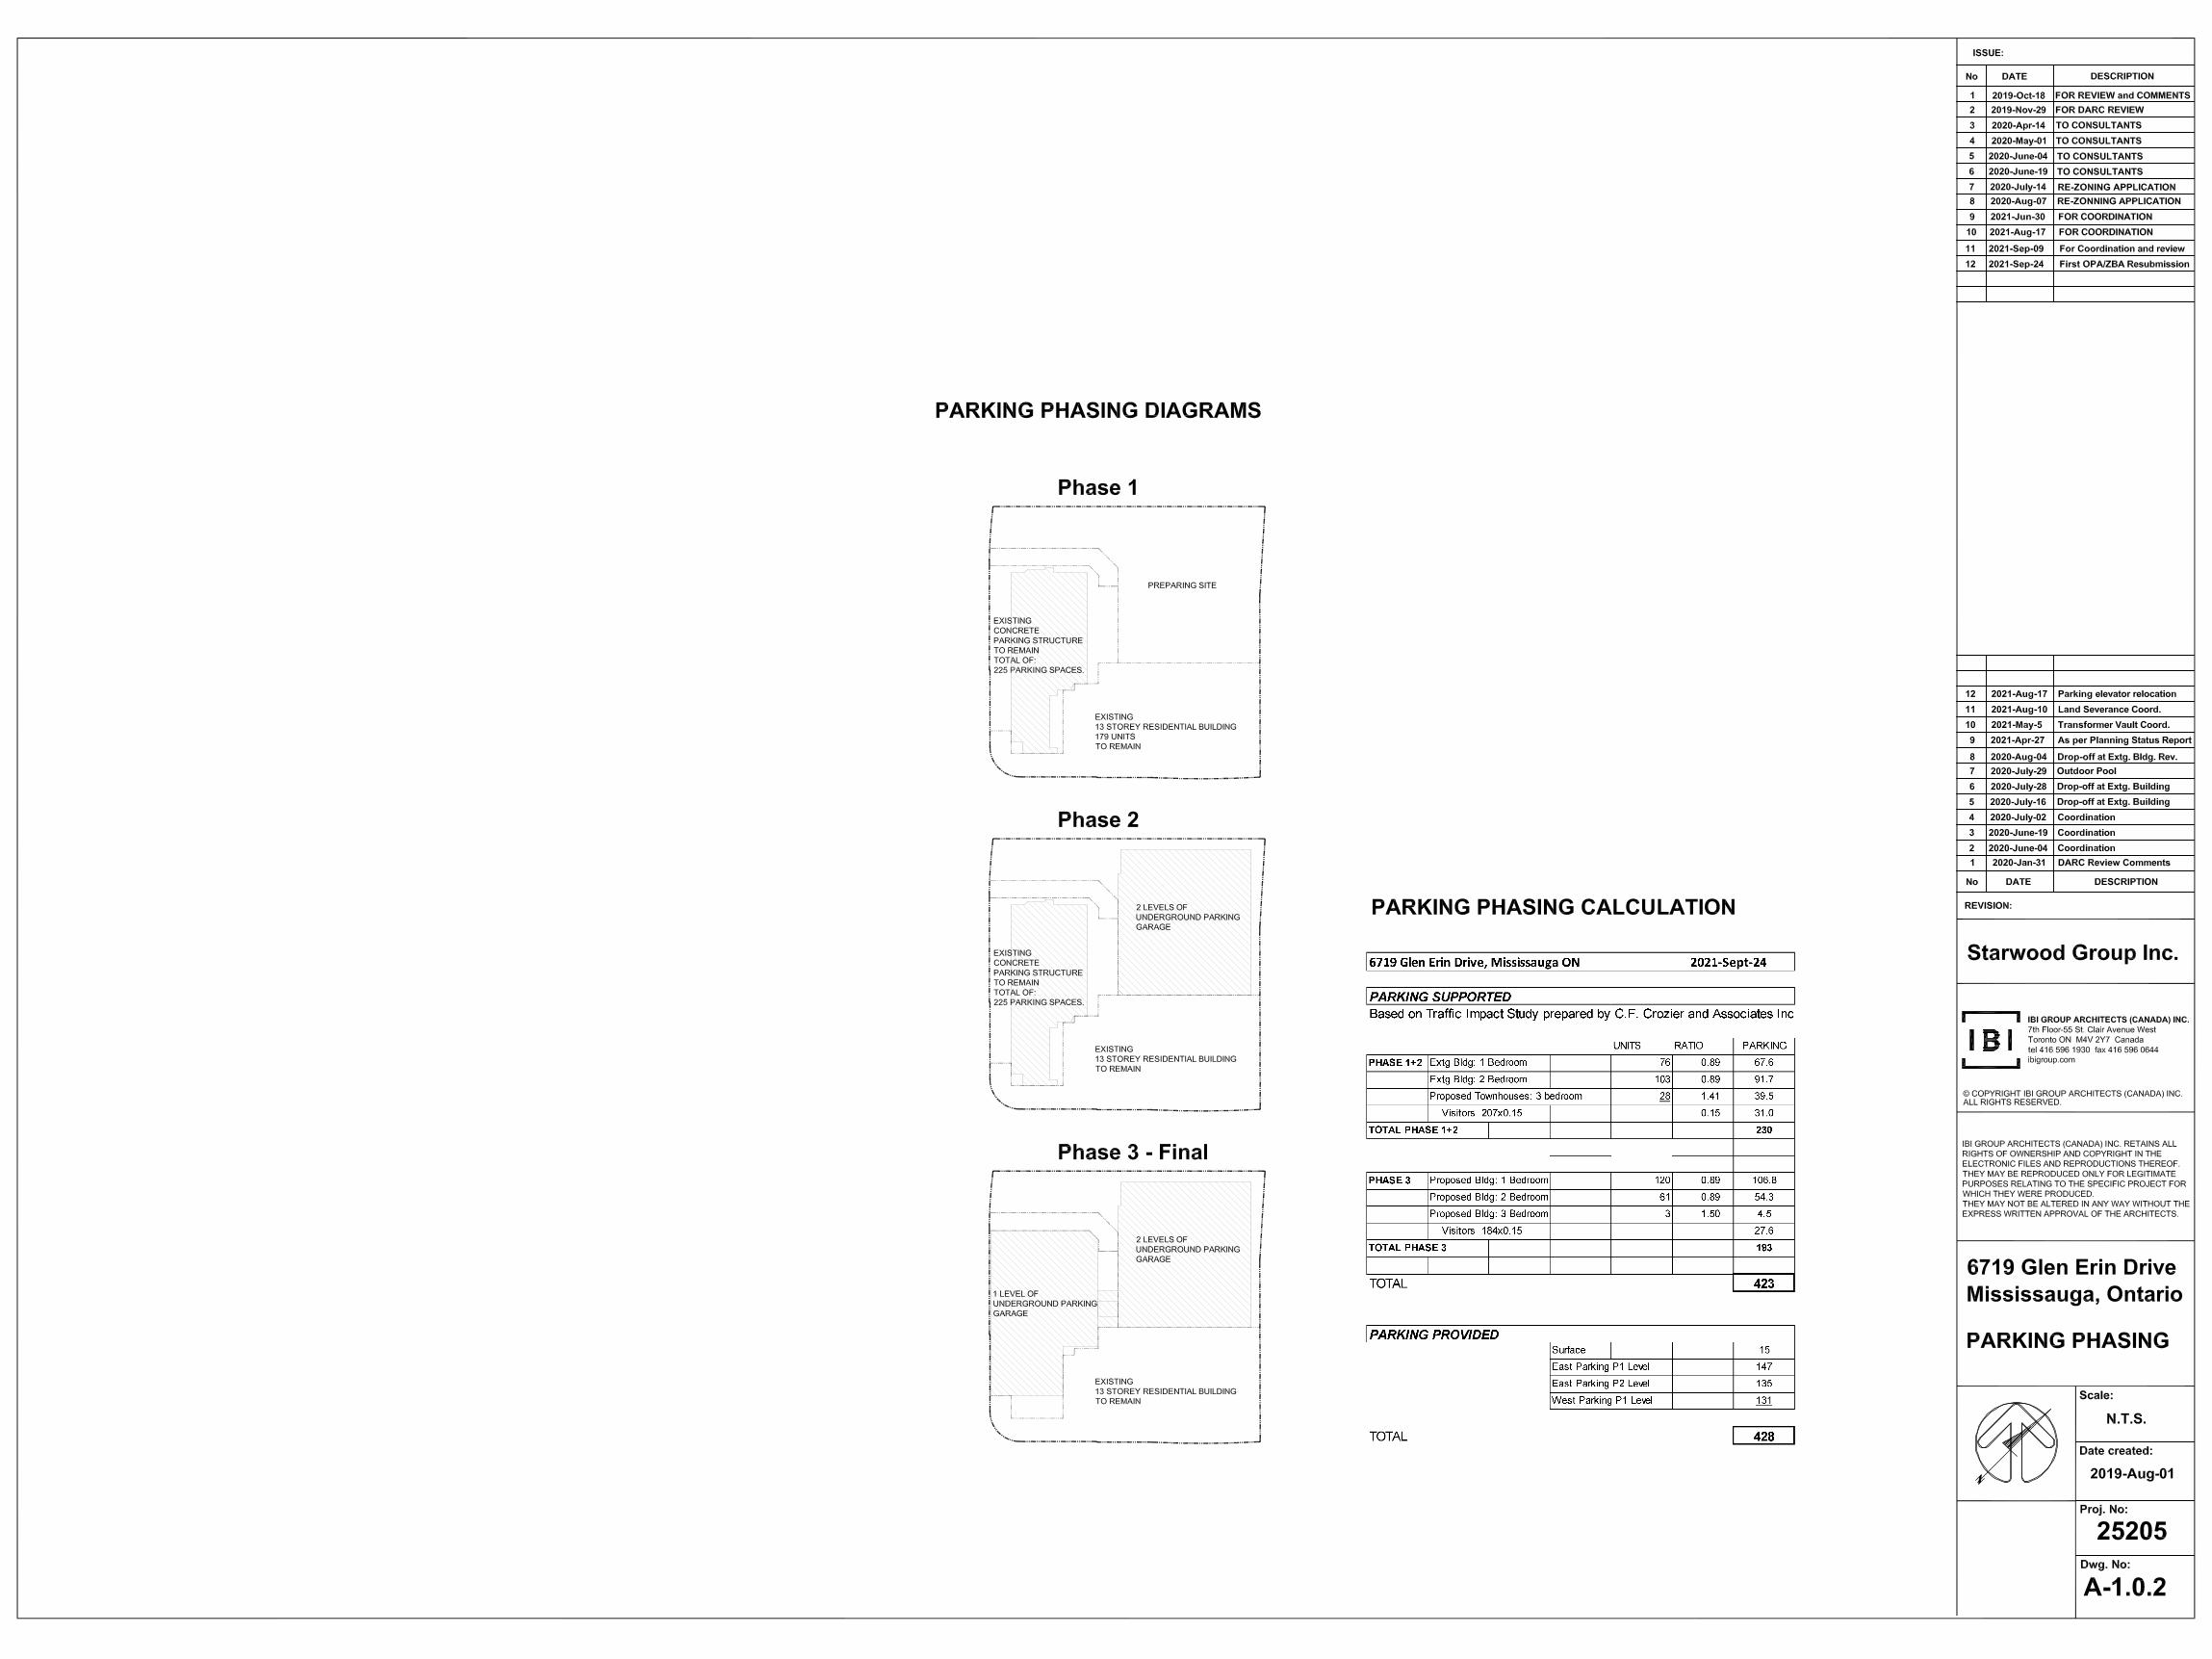
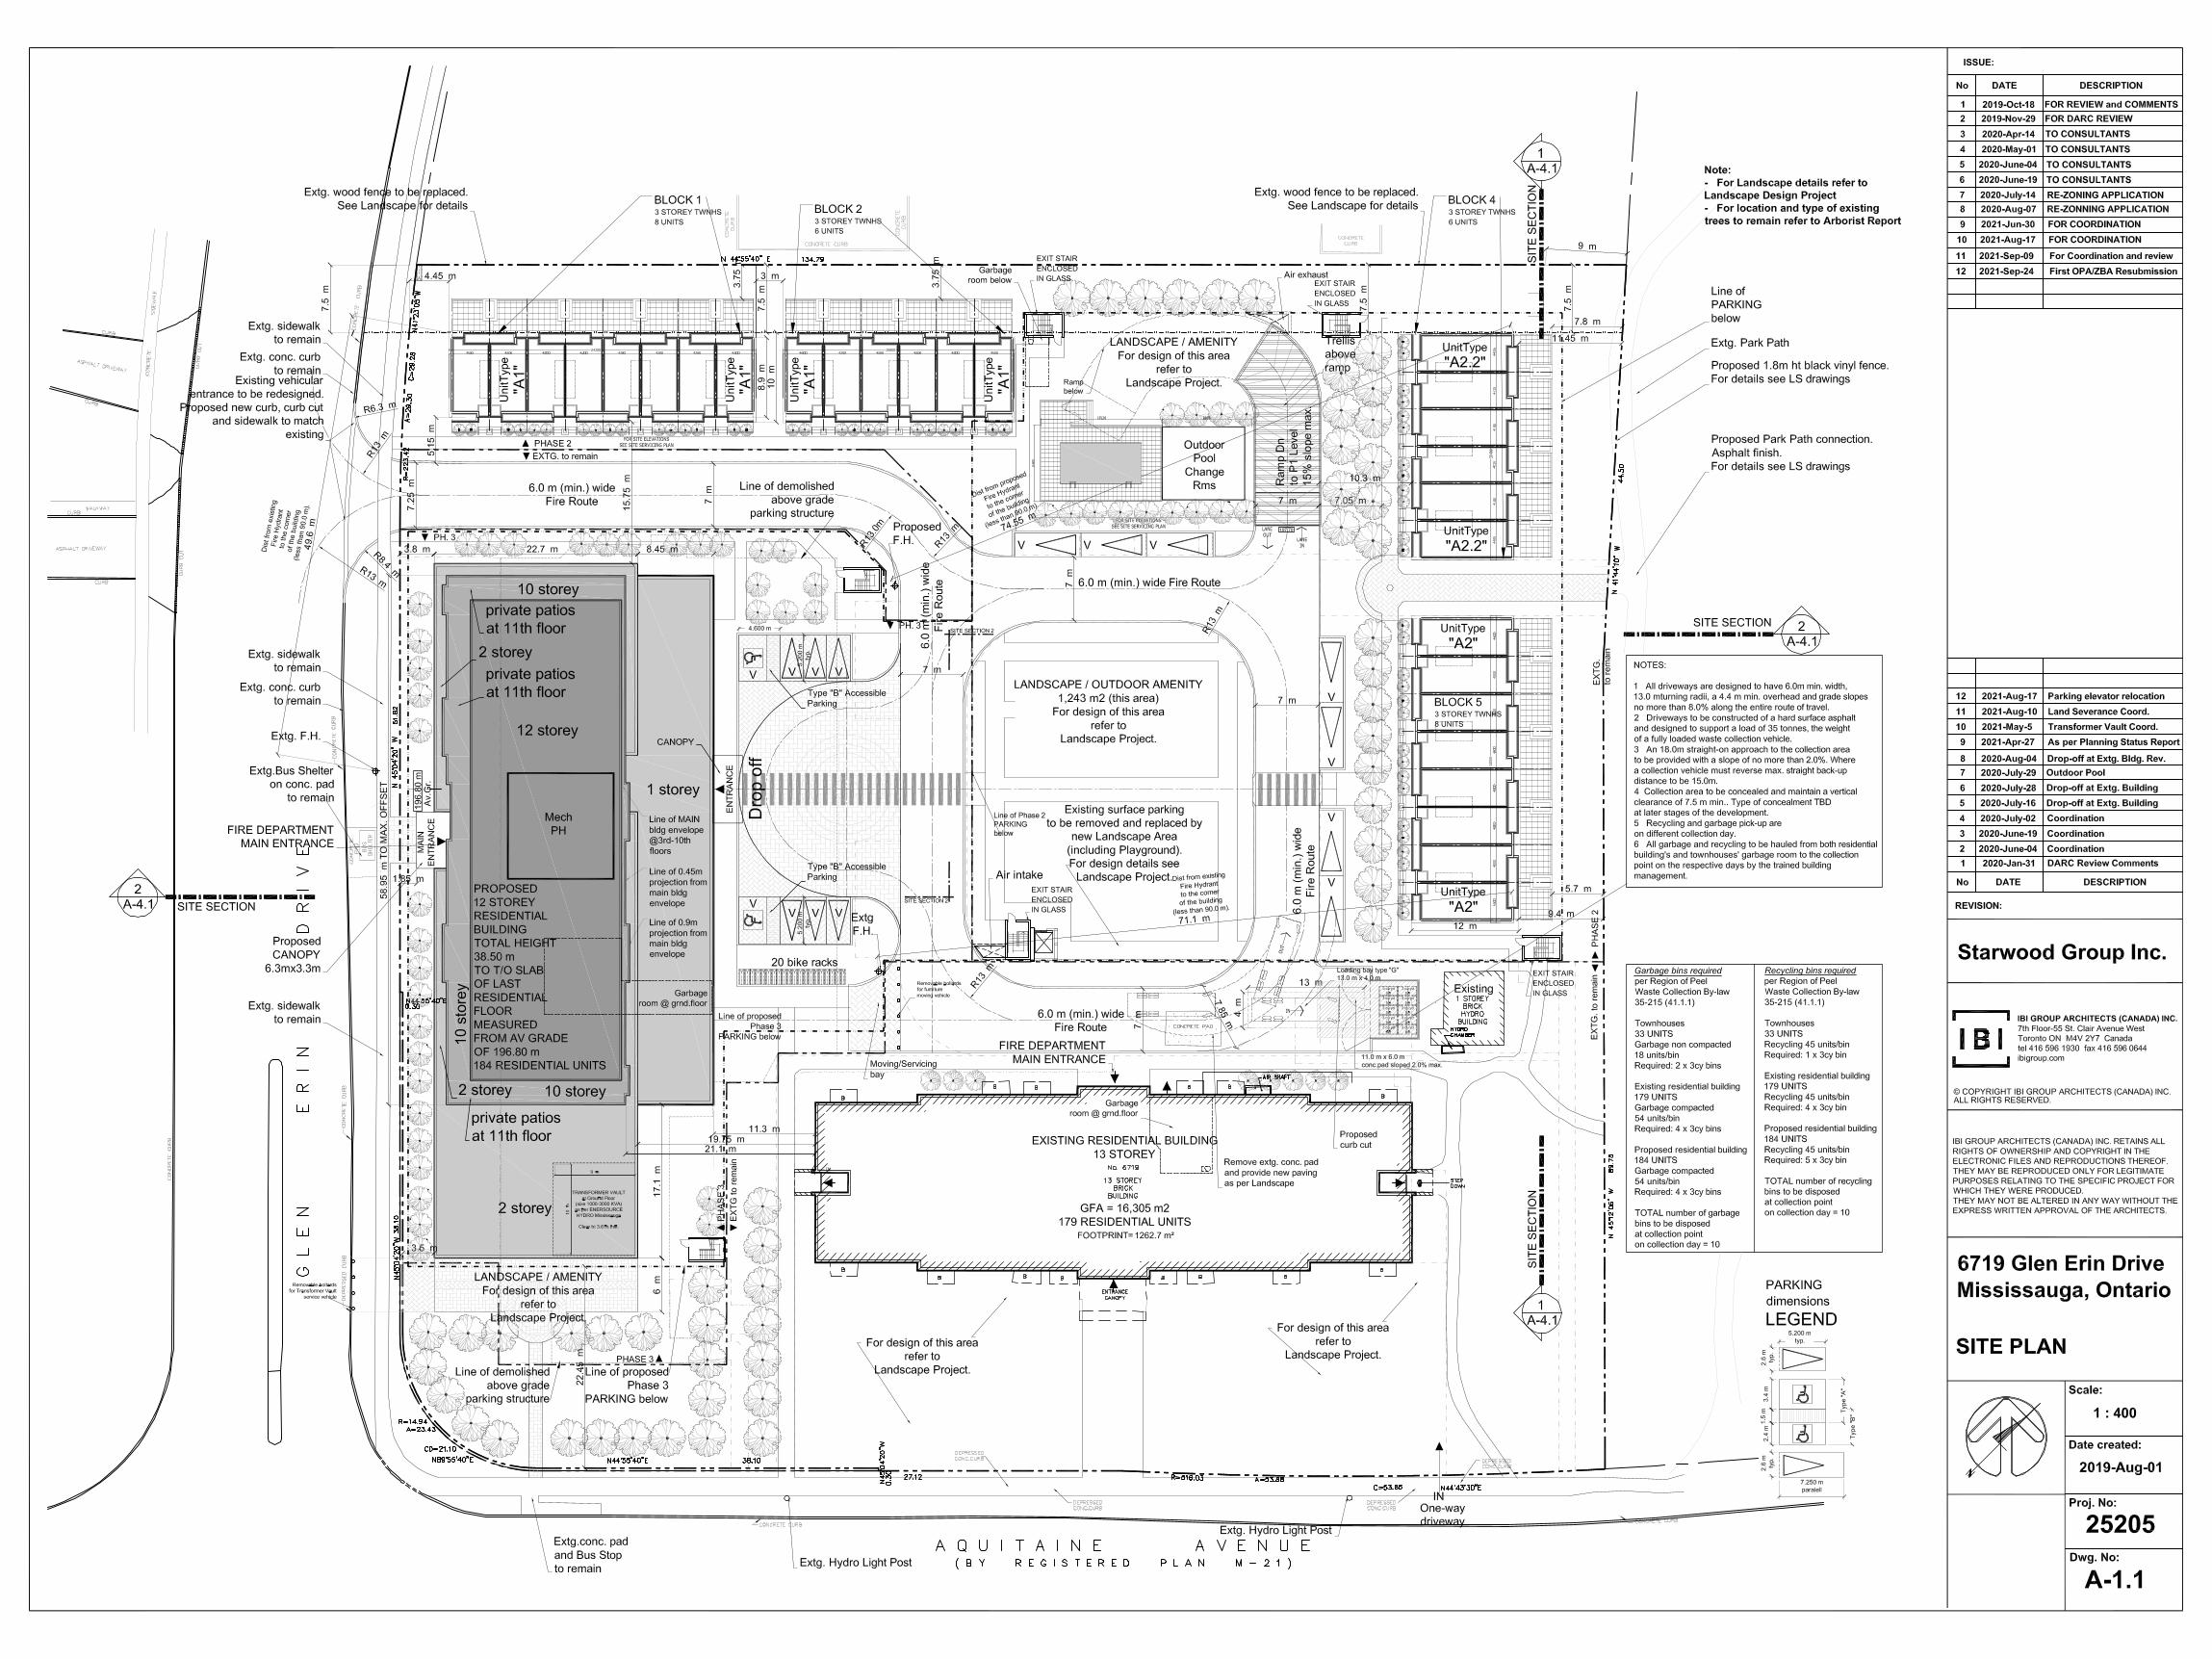
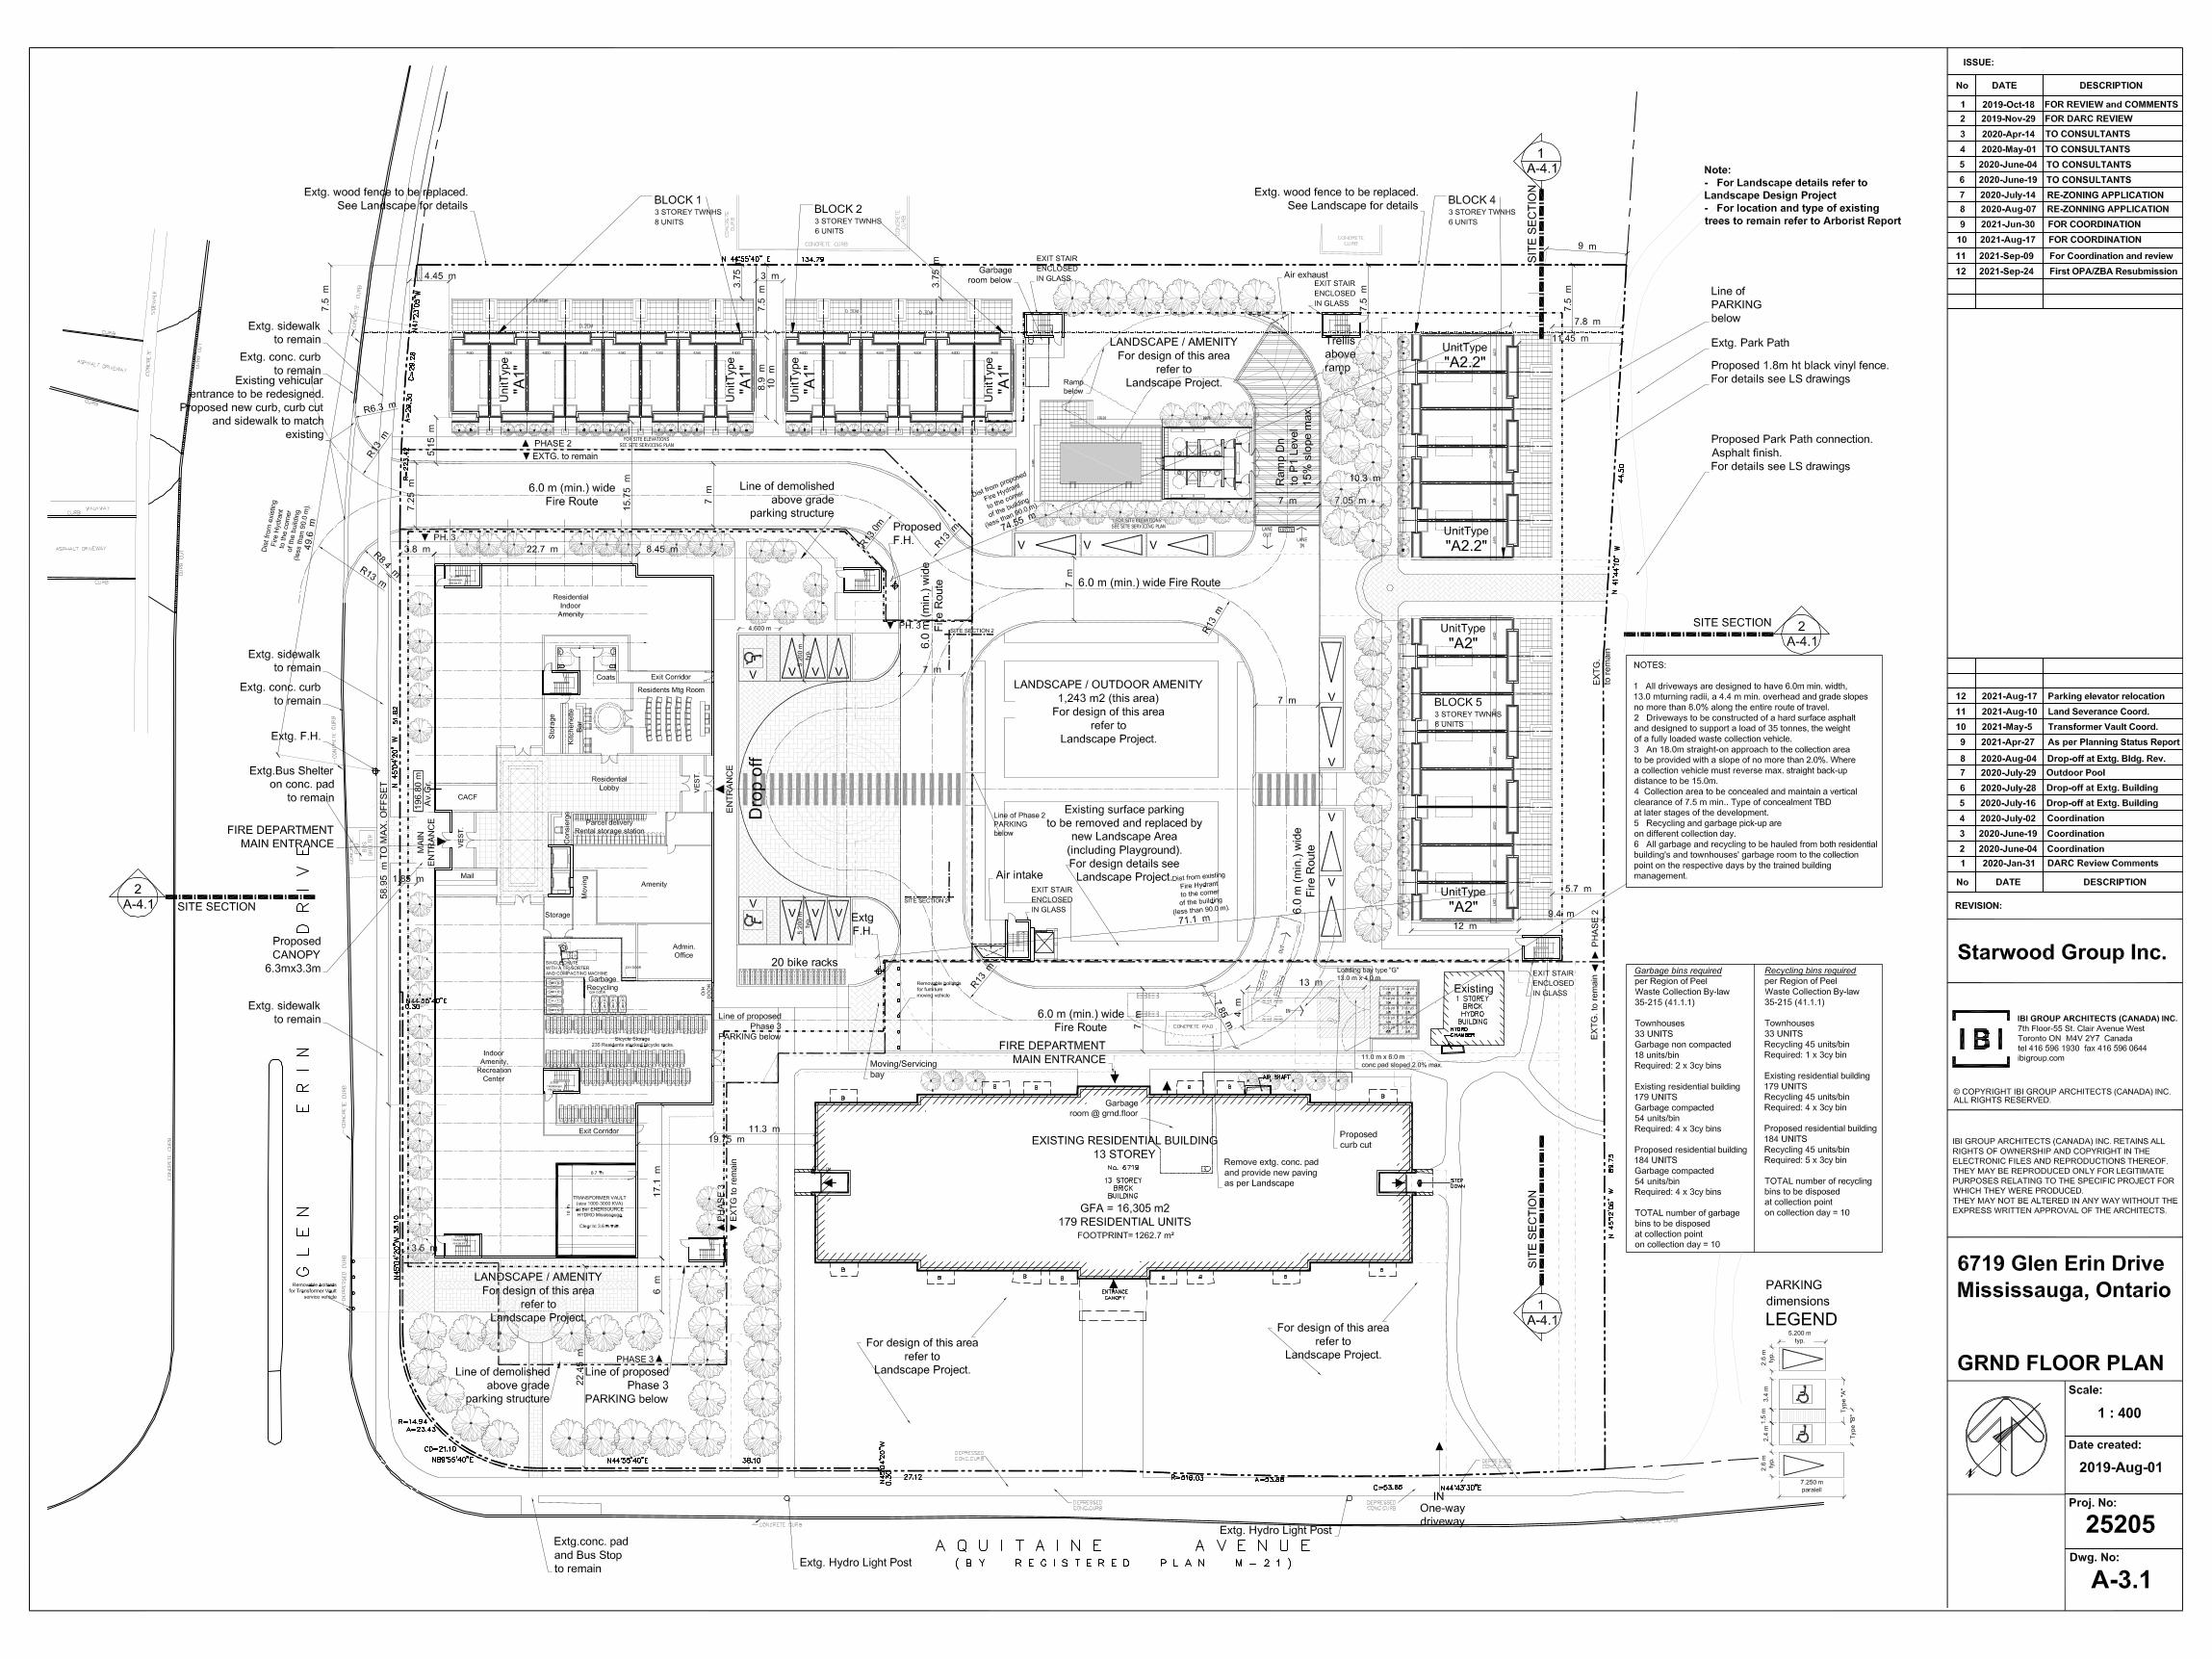

The HarbourEdge Building
40 Huron Street, Suite 301
Collingwood, ON L9Y 4R3
705 446-3510 T
705 446-3520 F
www.cfcrozier.ca
AutoCAD SHX Text
AQUITAINE AVE
AutoCAD SHX Text
SHELTER BAY ROAD
AutoCAD SHX Text
GLEN ERIN
AutoCAD SHX Text
Project No.
AutoCAD SHX Text
Dwg.
AutoCAD SHX Text
Design
AutoCAD SHX Text
Check
AutoCAD SHX Text
Drawn
AutoCAD SHX Text
Check
AutoCAD SHX Text
A.K.
AutoCAD SHX Text
Scale
AutoCAD SHX Text
N.T.S
AutoCAD SHX Text
1886-5590
AutoCAD SHX Text
P.A.
AutoCAD SHX Text
FIG. 03 0303
AutoCAD SHX Text
2020 EXISTING TRAFFIC VOLUMES
AutoCAD SHX Text
6719 GLEN ERIN DRIVE CITY OF MISSISSAUGA
AutoCAD SHX Text
NOTE: THIS FIGURE IS SCHEMATIC ONLY AND IS NOT TO BE SCALED.
AutoCAD SHX Text
LEGEND:
AutoCAD SHX Text
WEEKDAY AM(PM) TRIP DISTRIBUTION
AutoCAD SHX Text
AM(PM)
AutoCAD SHX Text
4(0)
AutoCAD SHX Text
13(3)
AutoCAD SHX Text
6(3)
AutoCAD SHX Text
260(457)
AutoCAD SHX Text
2(5)
AutoCAD SHX Text
25(48)
AutoCAD SHX Text
(242)260
AutoCAD SHX Text
(98)44
AutoCAD SHX Text
(117)260
AutoCAD SHX Text
263(649)
AutoCAD SHX Text
88(199)
AutoCAD SHX Text
42(57)
AutoCAD SHX Text
(307)833
AutoCAD SHX Text
(93)107
AutoCAD SHX Text
(89)58
AutoCAD SHX Text
186(323)
AutoCAD SHX Text
56(35)
AutoCAD SHX Text
108(153)
AutoCAD SHX Text
(288)403
AutoCAD SHX Text
(50)82
AutoCAD SHX Text
(7)13
AutoCAD SHX Text
(2)0
AutoCAD SHX Text
(14)37
AutoCAD SHX Text
(32)63
AutoCAD SHX Text
PRIVATE ACCESS
AutoCAD SHX Text
(321)457
AutoCAD SHX Text
(18)7
AutoCAD SHX Text
(18)7
AutoCAD SHX Text
0(0)
AutoCAD SHX Text
20(11)
AutoCAD SHX Text
21(12)
AutoCAD SHX Text
(0)0
AutoCAD SHX Text
(12)21
AutoCAD SHX Text
(11)20
AutoCAD SHX Text
309(489)
AutoCAD SHX Text
6(18)
AutoCAD SHX Text
6(18)
AutoCAD SHX Text
AQUITAINE AVE
AutoCAD SHX Text
SITE ACCESS
AutoCAD SHX Text
PRIVATE ACCESS
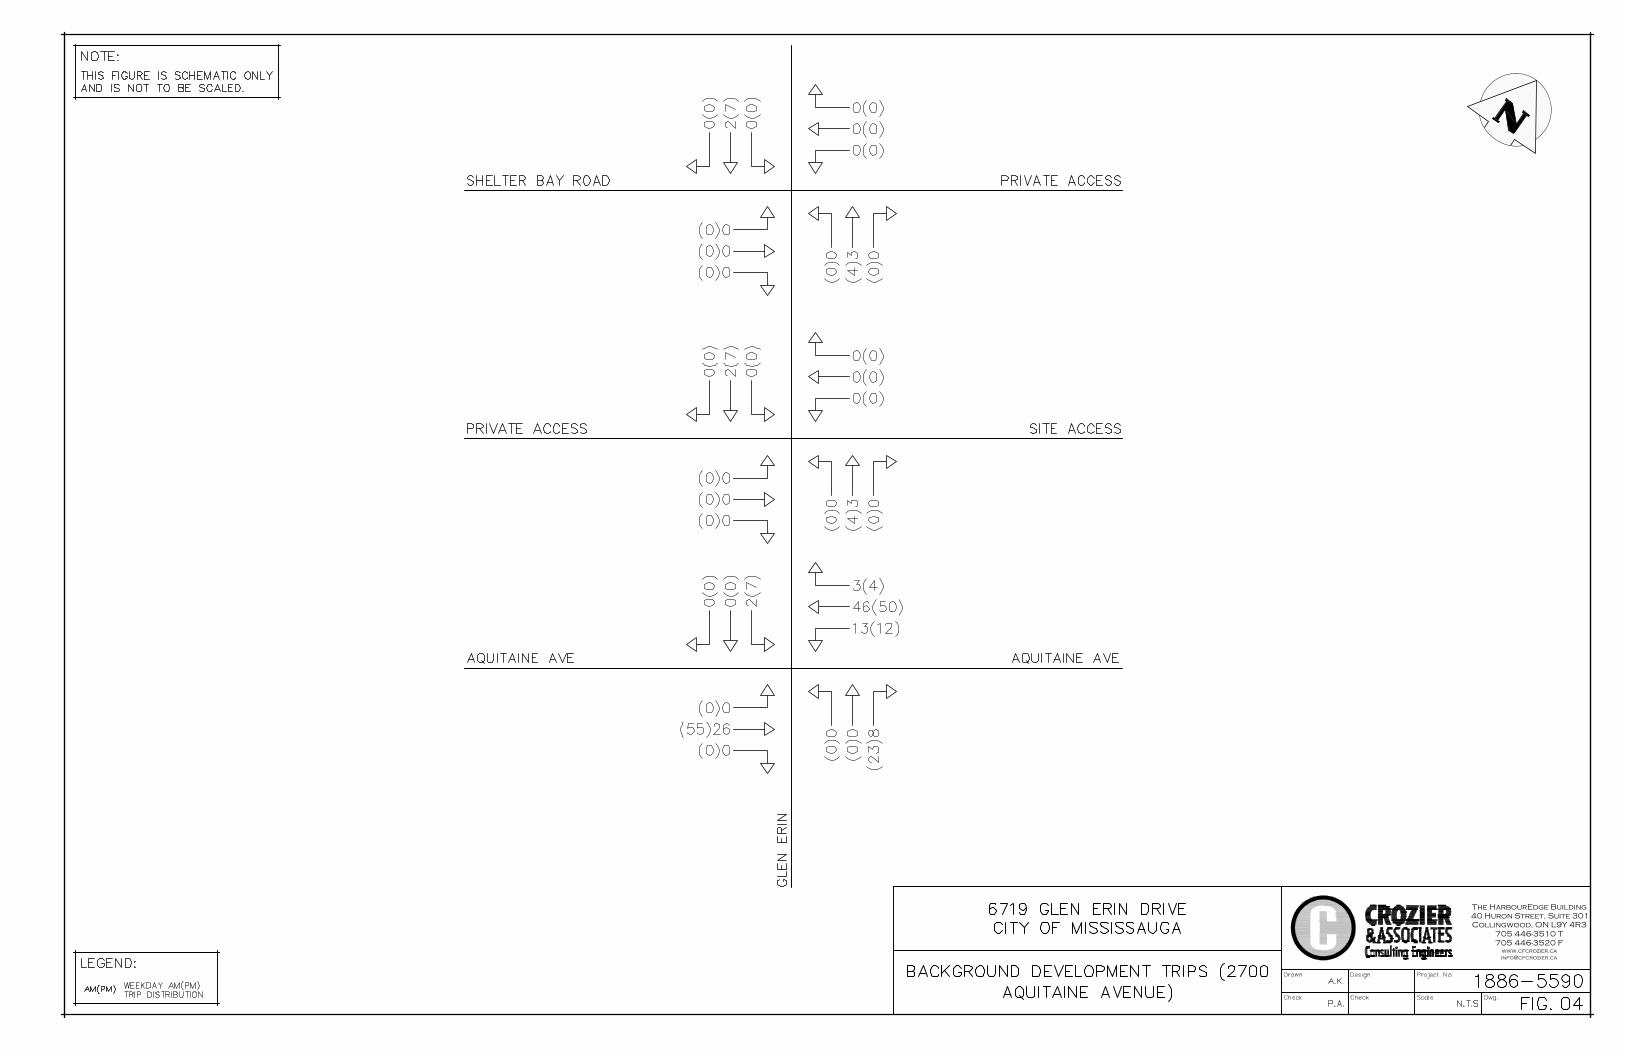
The HarbourEdge Building
40 Huron Street, Suite 301
Collingwood, ON L9Y 4R3
705 446-3510 T
705 446-3520 F
www.cfcrozier.ca
AutoCAD SHX Text
Project No.
AutoCAD SHX Text
Dwg.
AutoCAD SHX Text
Design
AutoCAD SHX Text
Check
AutoCAD SHX Text
Drawn
AutoCAD SHX Text
Check
AutoCAD SHX Text
A.K.
AutoCAD SHX Text
Scale
AutoCAD SHX Text
N.T.S
AutoCAD SHX Text
1886-5590
AutoCAD SHX Text
P.A.
AutoCAD SHX Text
FIG. 04 0404
AutoCAD SHX Text
BACKGROUND DEVELOPMENT TRIPS (2700 AQUITAINE AVENUE)
AutoCAD SHX Text
6719 GLEN ERIN DRIVE CITY OF MISSISSAUGA
AutoCAD SHX Text
NOTE: THIS FIGURE IS SCHEMATIC ONLY AND IS NOT TO BE SCALED.
AutoCAD SHX Text
LEGEND:
AutoCAD SHX Text
WEEKDAY AM(PM) TRIP DISTRIBUTION
AutoCAD SHX Text
AM(PM)
AutoCAD SHX Text
0(0)
AutoCAD SHX Text
0(0)
AutoCAD SHX Text
0(0)
AutoCAD SHX Text
2(7)
AutoCAD SHX Text
0(0)
AutoCAD SHX Text
0(0)
AutoCAD SHX Text
(0)0
AutoCAD SHX Text
(0)0
AutoCAD SHX Text
(23)8
AutoCAD SHX Text
46(50)
AutoCAD SHX Text
13(12)
AutoCAD SHX Text
3(4)
AutoCAD SHX Text
(55)26
AutoCAD SHX Text
(0)0
AutoCAD SHX Text
(0)0
AutoCAD SHX Text
0(0)
AutoCAD SHX Text
2(7)
AutoCAD SHX Text
0(0)
AutoCAD SHX Text
(4)3
AutoCAD SHX Text
(0)0
AutoCAD SHX Text
(0)0
AutoCAD SHX Text
(0)0
AutoCAD SHX Text
(0)0
AutoCAD SHX Text
(0)0
AutoCAD SHX Text
AQUITAINE AVE
AutoCAD SHX Text
SHELTER BAY ROAD
AutoCAD SHX Text
GLEN ERIN
AutoCAD SHX Text
PRIVATE ACCESS
AutoCAD SHX Text
(4)3
AutoCAD SHX Text
(0)0
AutoCAD SHX Text
(0)0
AutoCAD SHX Text
0(0)
AutoCAD SHX Text
0(0)
AutoCAD SHX Text
0(0)
AutoCAD SHX Text
(0)0
AutoCAD SHX Text
(0)0
AutoCAD SHX Text
(0)0
AutoCAD SHX Text
2(7)
AutoCAD SHX Text
0(0)
AutoCAD SHX Text
0(0)
AutoCAD SHX Text
AQUITAINE AVE
AutoCAD SHX Text
SITE ACCESS
AutoCAD SHX Text
PRIVATE ACCESS
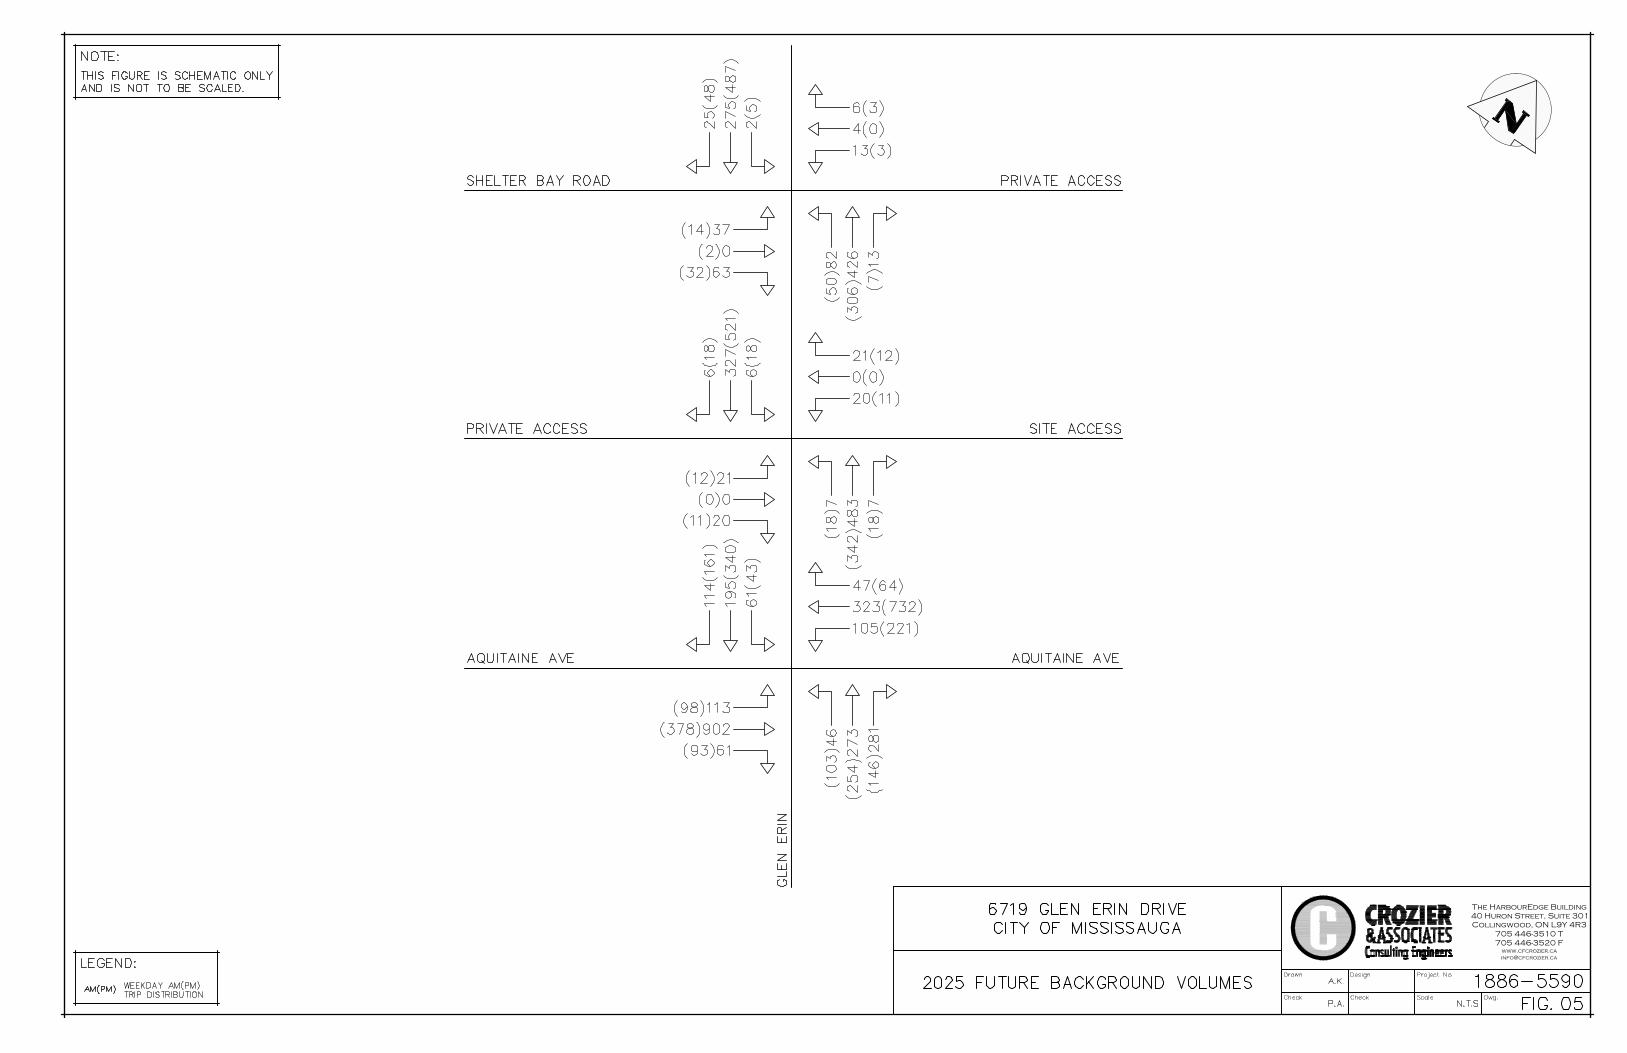
The HarbourEdge Building
40 Huron Street, Suite 301
Collingwood, ON L9Y 4R3
705 446-3510 T
705 446-3520 F
www.cfcrozier.ca
AutoCAD SHX Text
Project No.
AutoCAD SHX Text
Dwg.
AutoCAD SHX Text
Design
AutoCAD SHX Text
Check
AutoCAD SHX Text
Drawn
AutoCAD SHX Text
Check
AutoCAD SHX Text
A.K.
AutoCAD SHX Text
Scale
AutoCAD SHX Text
N.T.S
AutoCAD SHX Text
1886-5590
AutoCAD SHX Text
P.A.
AutoCAD SHX Text
FIG. 05 0505
AutoCAD SHX Text
2025 FUTURE BACKGROUND VOLUMES
AutoCAD SHX Text
6719 GLEN ERIN DRIVE CITY OF MISSISSAUGA
AutoCAD SHX Text
NOTE: THIS FIGURE IS SCHEMATIC ONLY AND IS NOT TO BE SCALED.
AutoCAD SHX Text
LEGEND:
AutoCAD SHX Text
WEEKDAY AM(PM) TRIP DISTRIBUTION
AutoCAD SHX Text
AM(PM)
AutoCAD SHX Text
4(0)
AutoCAD SHX Text
13(3)
AutoCAD SHX Text
6(3)
AutoCAD SHX Text
275(487)
AutoCAD SHX Text
2(5)
AutoCAD SHX Text
25(48)
AutoCAD SHX Text
(254)273
AutoCAD SHX Text
(103)46
AutoCAD SHX Text
(146)281
AutoCAD SHX Text
323(732)
AutoCAD SHX Text
105(221)
AutoCAD SHX Text
47(64)
AutoCAD SHX Text
(378)902
AutoCAD SHX Text
(98)113
AutoCAD SHX Text
(93)61
AutoCAD SHX Text
195(340)
AutoCAD SHX Text
61(43)
AutoCAD SHX Text
114(161)
AutoCAD SHX Text
(306)426
AutoCAD SHX Text
(50)82
AutoCAD SHX Text
(7)13
AutoCAD SHX Text
(2)0
AutoCAD SHX Text
(14)37
AutoCAD SHX Text
(32)63
AutoCAD SHX Text
AQUITAINE AVE
AutoCAD SHX Text
SHELTER BAY ROAD
AutoCAD SHX Text
GLEN ERIN
AutoCAD SHX Text
PRIVATE ACCESS
AutoCAD SHX Text
(342)483
AutoCAD SHX Text
(18)7
AutoCAD SHX Text
(18)7
AutoCAD SHX Text
0(0)
AutoCAD SHX Text
20(11)
AutoCAD SHX Text
21(12)
AutoCAD SHX Text
(0)0
AutoCAD SHX Text
(12)21
AutoCAD SHX Text
(11)20
AutoCAD SHX Text
327(521)
AutoCAD SHX Text
6(18)
AutoCAD SHX Text
6(18)
AutoCAD SHX Text
AQUITAINE AVE
AutoCAD SHX Text
SITE ACCESS
AutoCAD SHX Text
PRIVATE ACCESS
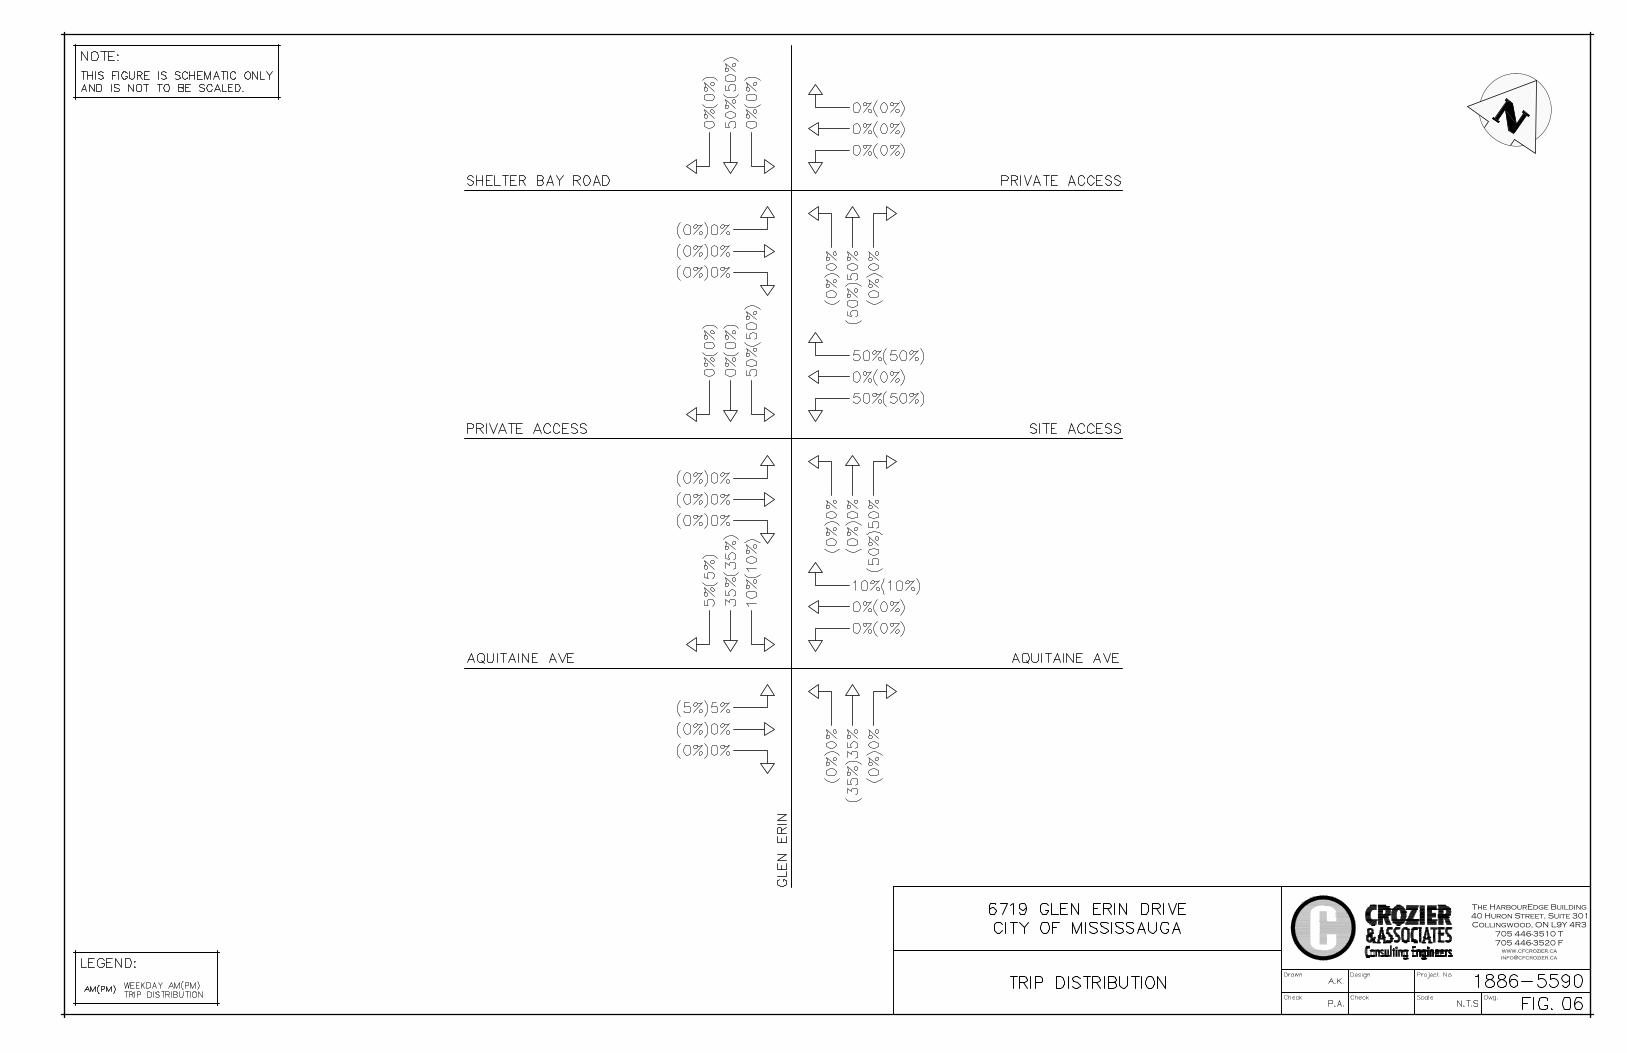
The HarbourEdge Building
40 Huron Street, Suite 301
Collingwood, ON L9Y 4R3
705 446-3510 T
705 446-3520 F
www.cfcrozier.ca
AutoCAD SHX Text
Project No.
AutoCAD SHX Text
Dwg.
AutoCAD SHX Text
Design
AutoCAD SHX Text
Check
AutoCAD SHX Text
Drawn
AutoCAD SHX Text
Check
AutoCAD SHX Text
A.K.
AutoCAD SHX Text
Scale
AutoCAD SHX Text
N.T.S
AutoCAD SHX Text
1886-5590
AutoCAD SHX Text
P.A.
AutoCAD SHX Text
FIG. 06 0606
AutoCAD SHX Text
TRIP DISTRIBUTION
AutoCAD SHX Text
6719 GLEN ERIN DRIVE CITY OF MISSISSAUGA
AutoCAD SHX Text
NOTE: THIS FIGURE IS SCHEMATIC ONLY AND IS NOT TO BE SCALED.
AutoCAD SHX Text
LEGEND:
AutoCAD SHX Text
WEEKDAY AM(PM) TRIP DISTRIBUTION
AutoCAD SHX Text
AM(PM)
AutoCAD SHX Text
0%(0%)
AutoCAD SHX Text
0%(0%)
AutoCAD SHX Text
0%(0%)
AutoCAD SHX Text
50%%%(50%%%)
AutoCAD SHX Text
0%%%(0%%%)
AutoCAD SHX Text
0%%%(0%%%)
AutoCAD SHX Text
(35%%%)35%%%
AutoCAD SHX Text
(0%)0%
AutoCAD SHX Text
(0%)0%
AutoCAD SHX Text
0%%%(0%%%)
AutoCAD SHX Text
0%%%(0%%%)
AutoCAD SHX Text
10%%%(10%%%)
AutoCAD SHX Text
(0%)0%
AutoCAD SHX Text
(5%%%)5%%%
AutoCAD SHX Text
(0%)0%
AutoCAD SHX Text
35%%%(35%%%)
AutoCAD SHX Text
10%%%(10%%%)
AutoCAD SHX Text
5%%%(5%%%)
AutoCAD SHX Text
(50%%%)50%%%
AutoCAD SHX Text
(0%%%)0%%%
AutoCAD SHX Text
(0%%%)0%%%
AutoCAD SHX Text
(0%%%)0%%%
AutoCAD SHX Text
(0%%%)0%%%
AutoCAD SHX Text
(0%%%)0%%%
AutoCAD SHX Text
AQUITAINE AVE
AutoCAD SHX Text
SHELTER BAY ROAD
AutoCAD SHX Text
GLEN ERIN
AutoCAD SHX Text
PRIVATE ACCESS
AutoCAD SHX Text
(0%)0%
AutoCAD SHX Text
(0%)0%
AutoCAD SHX Text
(50%)50%
AutoCAD SHX Text
0%%%(0%%%)
AutoCAD SHX Text
50%%%(50%%%)
AutoCAD SHX Text
50%%%(50%%%)
AutoCAD SHX Text
(0%)0%
AutoCAD SHX Text
(0%)0%
AutoCAD SHX Text
(0%)0%
AutoCAD SHX Text
0%%%(0%%%)
AutoCAD SHX Text
50%%%(50%%%)
AutoCAD SHX Text
0%%%(0%%%)
AutoCAD SHX Text
AQUITAINE AVE
AutoCAD SHX Text
SITE ACCESS
AutoCAD SHX Text
PRIVATE ACCESS
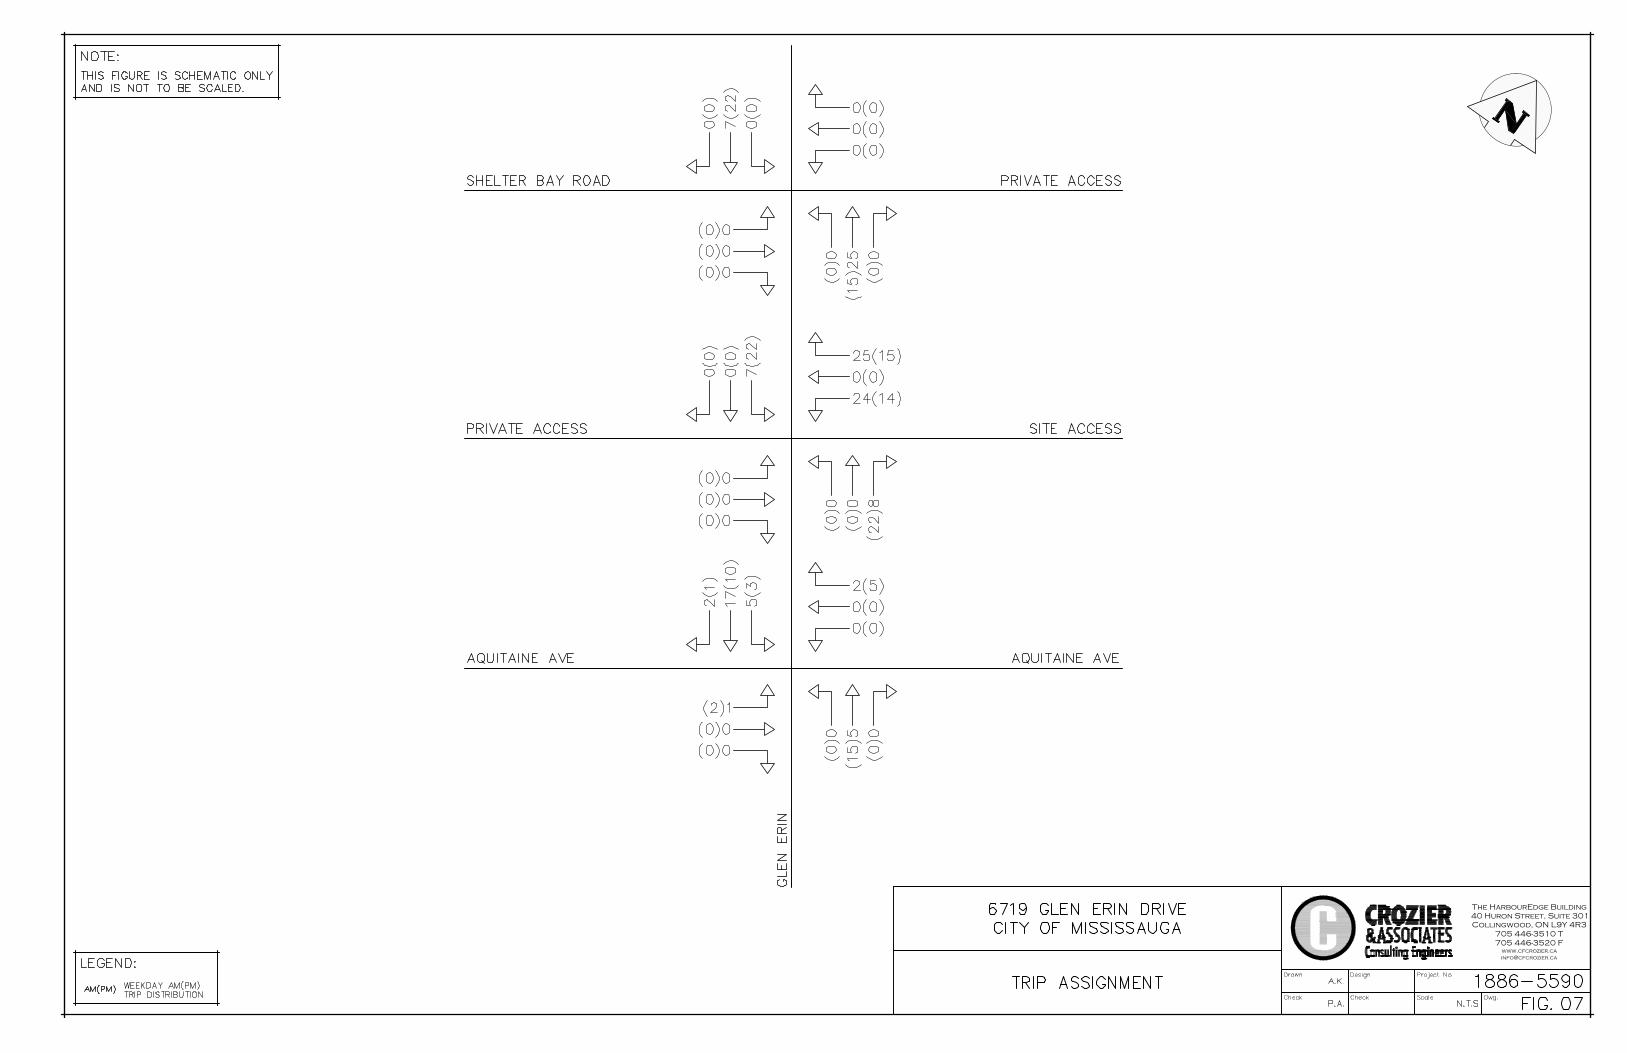
The HarbourEdge Building
40 Huron Street, Suite 301
Collingwood, ON L9Y 4R3
705 446-3510 T
705 446-3520 F
www.cfcrozier.ca
AutoCAD SHX Text
Project No.
AutoCAD SHX Text
Dwg.
AutoCAD SHX Text
Design
AutoCAD SHX Text
Check
AutoCAD SHX Text
Drawn
AutoCAD SHX Text
Check
AutoCAD SHX Text
A.K.
AutoCAD SHX Text
Scale
AutoCAD SHX Text
N.T.S
AutoCAD SHX Text
1886-5590
AutoCAD SHX Text
P.A.
AutoCAD SHX Text
FIG. 07 0707
AutoCAD SHX Text
TRIP ASSIGNMENT
AutoCAD SHX Text
6719 GLEN ERIN DRIVE CITY OF MISSISSAUGA
AutoCAD SHX Text
NOTE: THIS FIGURE IS SCHEMATIC ONLY AND IS NOT TO BE SCALED.
AutoCAD SHX Text
LEGEND:
AutoCAD SHX Text
WEEKDAY AM(PM) TRIP DISTRIBUTION
AutoCAD SHX Text
AM(PM)
AutoCAD SHX Text
0(0)
AutoCAD SHX Text
0(0)
AutoCAD SHX Text
0(0)
AutoCAD SHX Text
7(22)
AutoCAD SHX Text
0(0)
AutoCAD SHX Text
0(0)
AutoCAD SHX Text
(15)5
AutoCAD SHX Text
(0)0
AutoCAD SHX Text
(0)0
AutoCAD SHX Text
0(0)
AutoCAD SHX Text
0(0)
AutoCAD SHX Text
2(5)
AutoCAD SHX Text
(0)0
AutoCAD SHX Text
(2)1
AutoCAD SHX Text
(0)0
AutoCAD SHX Text
17(10)
AutoCAD SHX Text
5(3)
AutoCAD SHX Text
2(1)
AutoCAD SHX Text
(15)25
AutoCAD SHX Text
(0)0
AutoCAD SHX Text
(0)0
AutoCAD SHX Text
(0)0
AutoCAD SHX Text
(0)0
AutoCAD SHX Text
(0)0
AutoCAD SHX Text
AQUITAINE AVE
AutoCAD SHX Text
SHELTER BAY ROAD
AutoCAD SHX Text
GLEN ERIN
AutoCAD SHX Text
PRIVATE ACCESS
AutoCAD SHX Text
(0)0
AutoCAD SHX Text
(0)0
AutoCAD SHX Text
(22)8
AutoCAD SHX Text
0(0)
AutoCAD SHX Text
24(14)
AutoCAD SHX Text
25(15)
AutoCAD SHX Text
(0)0
AutoCAD SHX Text
(0)0
AutoCAD SHX Text
(0)0
AutoCAD SHX Text
0(0)
AutoCAD SHX Text
7(22)
AutoCAD SHX Text
0(0)
AutoCAD SHX Text
AQUITAINE AVE
AutoCAD SHX Text
SITE ACCESS
AutoCAD SHX Text
PRIVATE ACCESS
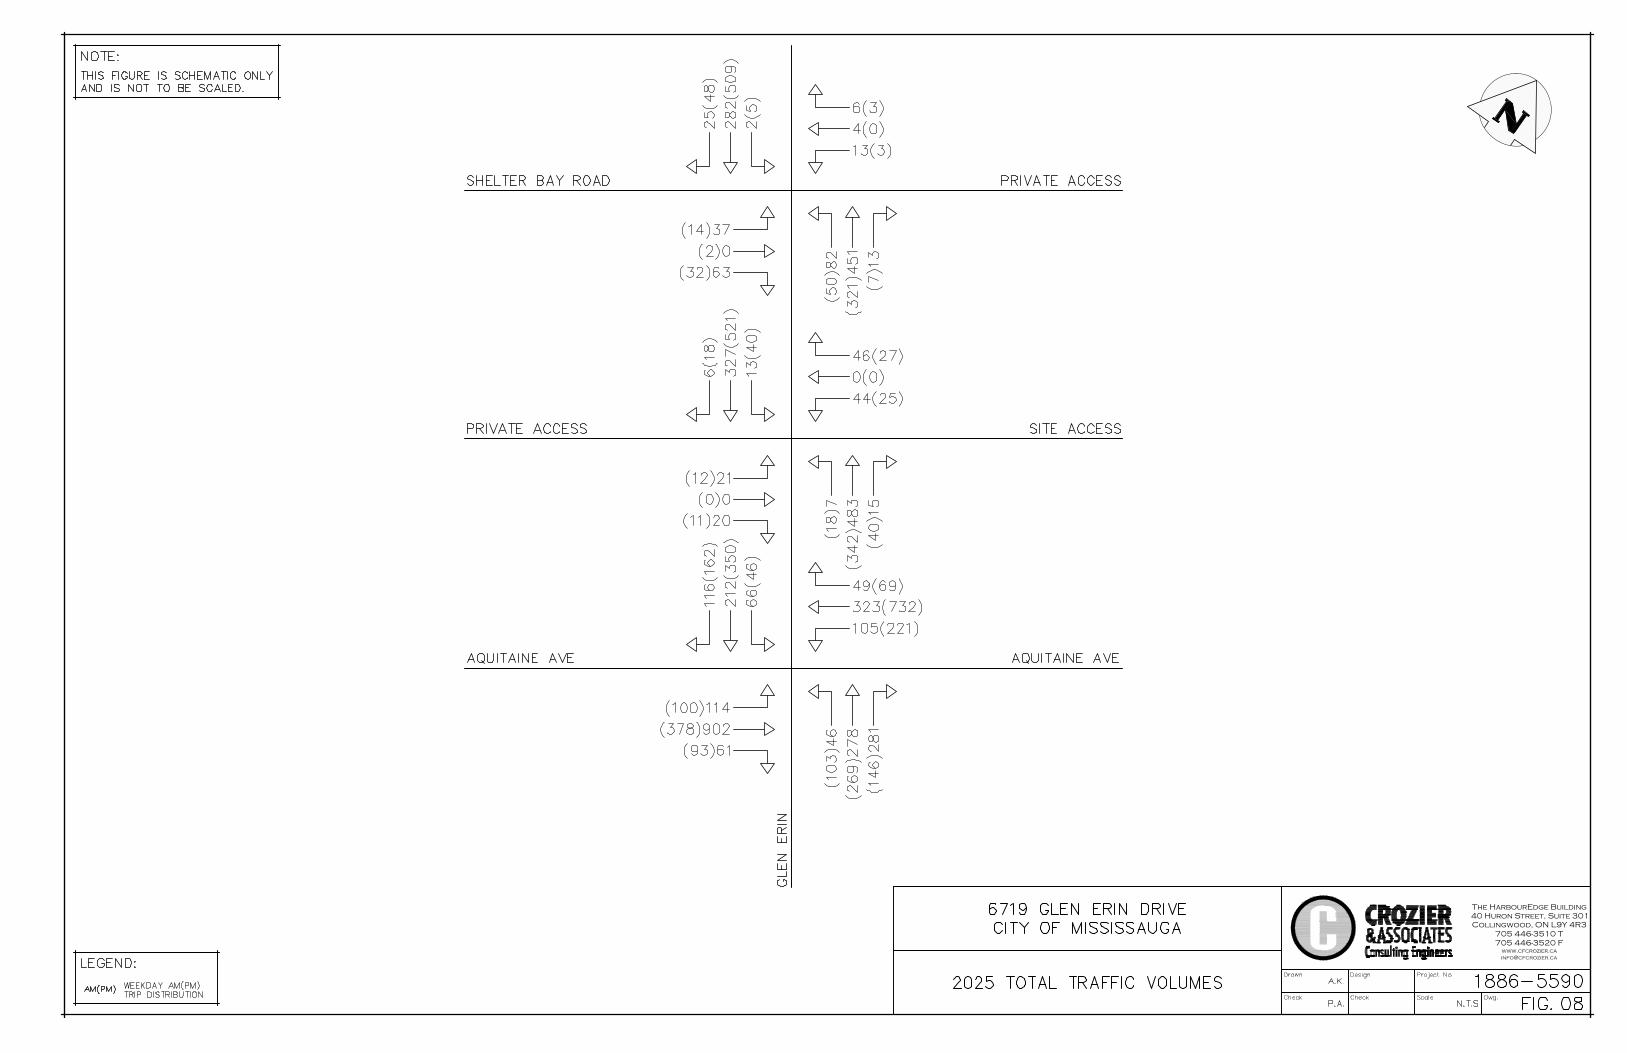
The HarbourEdge Building
40 Huron Street, Suite 301
Collingwood, ON L9Y 4R3
705 446-3510 T
705 446-3520 F
www.cfcrozier.ca
AutoCAD SHX Text
Project No.
AutoCAD SHX Text
Dwg.
AutoCAD SHX Text
Design
AutoCAD SHX Text
Check
AutoCAD SHX Text
Drawn
AutoCAD SHX Text
Check
AutoCAD SHX Text
A.K.
AutoCAD SHX Text
Scale
AutoCAD SHX Text
N.T.S
AutoCAD SHX Text
1886-5590
AutoCAD SHX Text
P.A.
AutoCAD SHX Text
FIG. 08 0808
AutoCAD SHX Text
2025 TOTAL TRAFFIC VOLUMES
AutoCAD SHX Text
6719 GLEN ERIN DRIVE CITY OF MISSISSAUGA
AutoCAD SHX Text
NOTE: THIS FIGURE IS SCHEMATIC ONLY AND IS NOT TO BE SCALED.
AutoCAD SHX Text
LEGEND:
AutoCAD SHX Text
WEEKDAY AM(PM) TRIP DISTRIBUTION
AutoCAD SHX Text
AM(PM)
AutoCAD SHX Text
4(0)
AutoCAD SHX Text
13(3)
AutoCAD SHX Text
6(3)
AutoCAD SHX Text
282(509)
AutoCAD SHX Text
2(5)
AutoCAD SHX Text
25(48)
AutoCAD SHX Text
(269)278
AutoCAD SHX Text
(103)46
AutoCAD SHX Text
(146)281
AutoCAD SHX Text
323(732)
AutoCAD SHX Text
105(221)
AutoCAD SHX Text
49(69)
AutoCAD SHX Text
(378)902
AutoCAD SHX Text
(100)114
AutoCAD SHX Text
(93)61
AutoCAD SHX Text
212(350)
AutoCAD SHX Text
66(46)
AutoCAD SHX Text
116(162)
AutoCAD SHX Text
(321)451
AutoCAD SHX Text
(50)82
AutoCAD SHX Text
(7)13
AutoCAD SHX Text
(2)0
AutoCAD SHX Text
(14)37
AutoCAD SHX Text
(32)63
AutoCAD SHX Text
AQUITAINE AVE
AutoCAD SHX Text
SHELTER BAY ROAD
AutoCAD SHX Text
GLEN ERIN
AutoCAD SHX Text
PRIVATE ACCESS
AutoCAD SHX Text
(342)483
AutoCAD SHX Text
(18)7
AutoCAD SHX Text
(40)15
AutoCAD SHX Text
0(0)
AutoCAD SHX Text
44(25)
AutoCAD SHX Text
46(27)
AutoCAD SHX Text
(0)0
AutoCAD SHX Text
(12)21
AutoCAD SHX Text
(11)20
AutoCAD SHX Text
327(521)
AutoCAD SHX Text
13(40)
AutoCAD SHX Text
6(18)
AutoCAD SHX Text
AQUITAINE AVE
AutoCAD SHX Text
SITE ACCESS
AutoCAD SHX Text
PRIVATE ACCESS
Related Documents