Traffic Impact Models By Sia Ardekani, Ezra Hauer, Bahram Jamei Sung Yoon Park 11/09/2012

Welcome message from author
This document is posted to help you gain knowledge. Please leave a comment to let me know what you think about it! Share it to your friends and learn new things together.
Transcript
Traffic Impact Models
By Sia Ardekani, Ezra Hauer, Bahram Jamei
Sung Yoon Park 11/09/2012

Outline Traffic and Safety
Fuel Consumption Model
Air Quality Model
Traffic and Safety Safety of an entity:
The number of accidents by type, expected to occur on the entity in a certain period, per unit of time.
Safety performance function: A functional relationship between expected number of
accidents and the traffic flow Accident rate:
Proportional to the slope of the line joining the origin and a point of the safety performance function

Traffic and Safety Point A: 1.05 accidents
per year Accident rate =
1.05/(3000*365) = 0.96*10^(-6) accident/ vehicle
Comparison only valid when entities or periods are compared with same traffic flow Safety performance function and accident rate

Traffic and Safety Simple model with very low traffic flow (near the
origin) 𝑚𝑠𝑠𝑠𝑠𝑠𝑠−𝑣𝑠𝑣𝑠𝑣𝑠𝑠 = 𝑞 ∙ 𝑝(𝑞)
𝑚: 𝑒𝑒𝑝𝑒𝑒𝑒𝑒𝑒 𝑛𝑛𝑚𝑛𝑒𝑛 𝑜𝑜 𝑠𝑠𝑛𝑠𝑠𝑒 − 𝑣𝑒𝑣𝑠𝑒𝑠𝑒 𝑎𝑒𝑒𝑠𝑒𝑒𝑛𝑒 𝑝𝑒𝑛 𝑛𝑛𝑠𝑒 𝑒𝑠𝑚𝑒
𝑞: 𝑜𝑠𝑜𝑓(𝑣𝑒𝑣𝑠𝑒𝑒𝑠 𝑝𝑒𝑛 𝑠𝑠𝑣𝑒𝑛 𝑒𝑠𝑚𝑒) 𝑝: 𝑝𝑛𝑜𝑛𝑎𝑛𝑠𝑠𝑠𝑒𝑝 𝑜𝑜 𝑎 𝑠𝑠𝑛𝑠𝑠𝑒 − 𝑣𝑒𝑣𝑠𝑒𝑠𝑒 𝑎𝑒𝑒𝑠𝑒𝑒𝑛𝑒
Accident rate is an increasing function of flows P(q) is an increasing function, then m would be
increase more than in proportion with flow
Traffic and Safety Empirical Studies
Develop a functional relationship between accident counts and traffic flow
Data collection method Cross-section
Choose similar road sections or intersections for flows and accidents Provide more dates but other externalities are not considered
Time-sequence Select one location for flows and accidents Prevent bias on the cross-section data

Traffic and Safety Models
Power function When only one traffic stream is relevant
𝑚 = 𝑎𝑞𝛽 (1) Complex power function
𝑚 = 𝑎𝑞𝛽+𝛾𝛾𝛾𝛾(𝑞) (1a) When two or more traffic streams
𝑚 = 𝑎𝑞1𝛽𝑞2𝛾 (1c) Advantage:
Simple Can satisfy condition near origin
Disadvantage: function has to be a straight line when there is only one flow If there are two flows, the quadratic growth applies to all q

Traffic and Safety Polynomial
𝑚 = 𝑎𝑞 + 𝛽𝑞2 + ⋯ (2) log 𝑚 = log 𝑎 + 𝛽 log 𝑞 + 𝛾[log 𝑞 ]2 (2a) Advantage:
Simple Using more terms so that the curve can be shaped
Disadvantage: Cannot capture the condition near the origin

Traffic and Safety
Shapes of selected model equations
Safety performance function and accident rate

Traffic and Safety To capture the fact slope become decreased or
negative at certain point of flows 𝑚 = 𝑎𝑞𝑘𝑒𝛽𝑞 (4)
Where k =1 or 2 based on near-origin requirement Meet requirement at near-origin and also follow the shape of the data
Fuel Consumption factors Variables from traffic conditions
Speed, number of stops, speed noise, and acceleration noise Variables from environments
Roadway gradient, wind, temperature, altitude, pavement type, surface condition
Variables from vehicles (Energy consumption) Vehicle weight, engine size and type, transmission type, tire size
and type, tire pressure, wheel alignment, status of brake, etc. Variables from drivers
Degree of aggressiveness
Fuel Consumption Urban Fuel Consumption Model (Elemental Model)
Chang and Herman 1981; Chang et al. 1976; Evans and Herman 1978; Evans et al. 1976
Fixed vehicle, driver, and environmental characteristics Speed alone accounts for over 70% of the variability in fuel
consumption (Evans, Herman, and Lam 1976) Model
ϕ = 𝐾1 + 𝐾2𝑇,𝑉 < 55𝑘𝑚/𝑣𝑛 Φ: fuel consumption per unit distance T: average travel time per unit distance V(=1/T): average speed 𝐾 : (mL/km) fuel used to overcome the rolling friction

Fuel Consumption Akcelik 1981; Richardson and Akcelik 1983) Similar model used in TRANSYT-7F Divide fuel consumption into driving cycle
Cruising, idling, and deceleration-acceleration cycle
𝐹 = 𝑜1𝑋𝑠 + 𝑜2𝑒𝑠 + 𝑜3𝑣 F: avg. fuel consumption per roadway section (mL) 𝑋𝑠: total section distance(km) 𝑒𝑠: average stopped delay per vehicle (sec) h: average number of stops per vehicle 𝑜1: fuel consumption rate while cruising (mL/km)

Fuel Consumption Watson et al. (1980) Incorporate changes in the positive kinetic energy during acceleration as a
predictor variable
𝐹 = 𝐾1 +𝐾2𝑉𝑠
+ 𝐾3𝑉𝑠 + 𝐾4𝑃𝐾𝑃
F: fuel consumed (L/km) 𝑉𝑠: space mean speed (km/hr) 𝐾1: parameter representing idle flow rate 𝐾2: parameter representing fuel consumption to overcome rolling resistance 𝐾3: parameter representing fuel consumption to overcome air resistance 𝐾4: parameter related to fuel consumption due to positive acceleration
𝑃𝐾𝑃 = �(𝑣𝑓2 − 𝑣𝑠2)/(12,960𝑋𝑠)
fi l d

Fuel Consumption Highway Fuel Consumption Model (steady-state)
Vincent, Mitchell, and Robertson 1980 Used in TRANSYT-8
𝑜𝑣 = 𝑎 + 𝑛𝑉𝑣 + 𝑒𝑉𝑣2 𝑜𝑣: steady-state fuel consumption rate at cruising speed (mL/km) 𝑉𝑣: steady-state cruising speed (km/hr) i.e. for mid-size passenger cars a: 170 mL/km b: -4.55 mL-hr/𝑘𝑚2 c: 0.049 mL-𝑣𝑛2/𝑘𝑚3
Fuel Consumption Post et al. (1981) Add 𝑉2 term to Elemental Model to account for air-
dynamic effects 𝑜𝑣 = 𝑛1 + 𝑛2/𝑉𝑣 + 𝑛3𝑉𝑣2
𝑜𝑣: steady-state fuel consumption rate at cruising speed (mL/km) 𝑉𝑣: steady-state cruising speed (km/hr) i.e. for Ford Cortina Wagon, 6-Cyl, 4.1L, automatic
transmission (1981) 𝑛1:15.9 mL/km 𝑛2: 2520 mL/hr 𝑛 : 0 00792 mL-𝑣𝑛2/𝑘𝑚3
Fuel Consumption Instantaneous Fuel Consumption Model (non steady-
state) Akcelik and Bayley (1983) Non-steady-state speed condition under both urban and
freeway 𝑜 = 𝐾1 + 𝐾2𝑉 + 𝐾3𝑉3 +/𝐾4𝑎𝑉 + 𝐾5𝑎2𝑉/
𝑜: instantaneous fuel consumption (mL/sec) 𝑉: instantaneous speed (km/hr) a: instantaneous acceleration rate (km/hr/sec) 𝐾1:parameter for idle flow rate (mL/sec) 𝐾2:parameter for fuel consumption to overcome rolling resistance
Air Quality Model More than half of air pollutant comes from mobile source US Clean Air Act (1970)
Each state required to prepare State Implementation Plan (SIP) which describe how it will control 6 pollutants: Particulate matter (PM10) Sulfur dioxide (SO2) Carbon monoxide (CO) Nitrogen dioxide (NO2) Ozone (O3) Lead (Pb)
US Clean Air Act(1990) Tightened regulation on pollution standard from cars and trucks Withhold highway funds from states where fail to meet the
standard

Air Quality Model Comparison of
pollution standard from 1970 and 1990 US Clean Air Act

Air Quality Model To reduce congestion and improve mobility and air
quality ITE (Institute of Transportation Engineers) suggested several actions Getting most out of existing highway system
ITS, ramp metering, HOV, super streets, parking management, enforcement
Building new capacity New highways, reconstruction
Providing transit service Paratransit service, encouraging transit use
Managing transportation demand Congestion pricing, ride sharing
Funding and institutional measures

Air Quality Model Data required for Highway air quality
models Meteorological data Traffic data Site type Period measurement

Air Quality Model UMTA model
Developed by Federal Transit Administration Simple and quick response method for comparison Relate vehicle speeds to emission level Combination of free flow and restrained speed
Source: UMTA Characteristics of urban transportation system (1985)
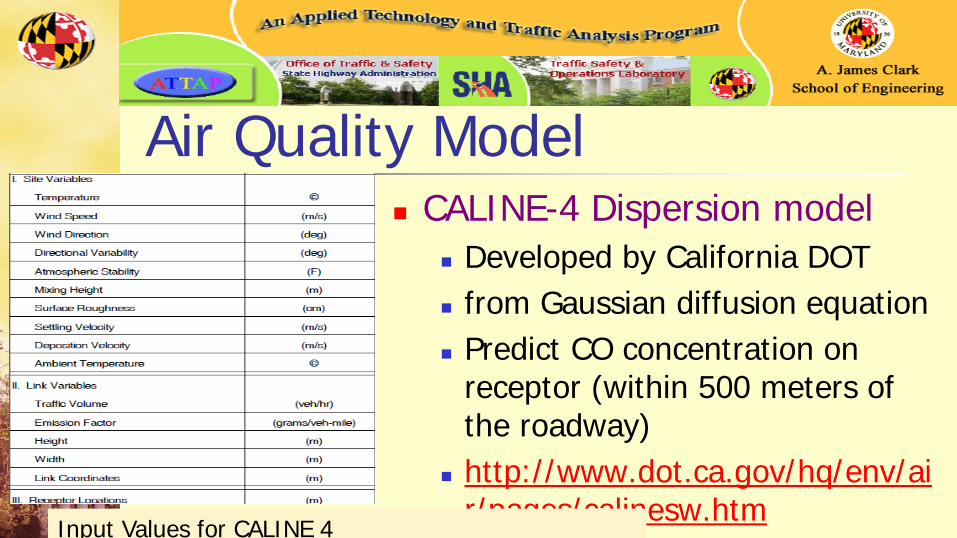
Air Quality Model CALINE-4 Dispersion model
Developed by California DOT from Gaussian diffusion equation Predict CO concentration on
receptor (within 500 meters of the roadway)
http://www.dot.ca.gov/hq/env/air/pages/calinesw.htm
Input Values for CALINE 4
Air Quality Model Mobile source emission factor model (MOBILE
4.1) Developed by US EPA (Environmental Protection
Agency) Estimate hydrocarbon, carbon monoxide, oxides of
nitrogen based on various conditions such as ambient temperature,
speed(low 4-32, moderate 32-77, high 77-105km/hr), and mileage accrual rates
8 types of vehicle with two region (high or low altitude) Latest version is Mobile 6.2 (2004) Replaced by MOVES(Motor Vehicle Emission Simulator
2010)
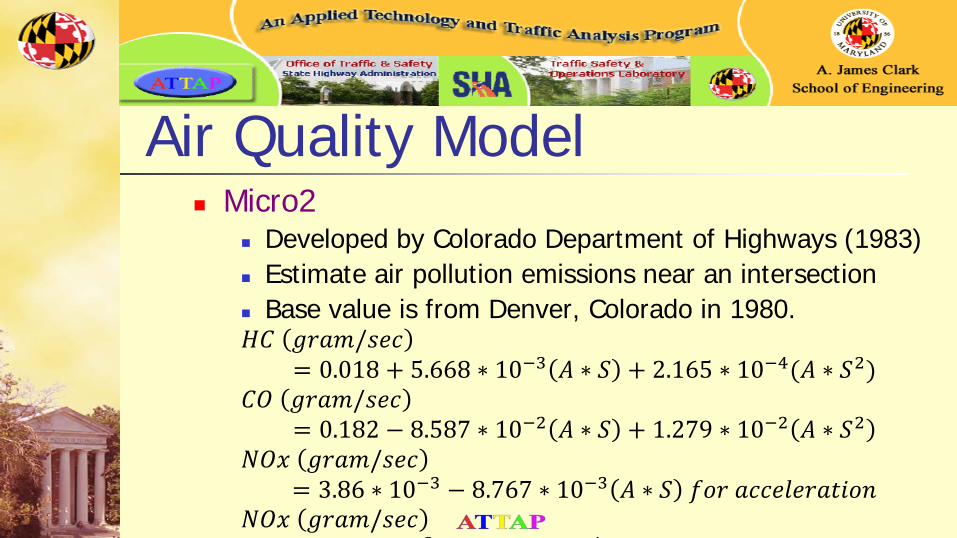
Air Quality Model Micro2
Developed by Colorado Department of Highways (1983) Estimate air pollution emissions near an intersection Base value is from Denver, Colorado in 1980. 𝐻𝐻 𝑠𝑛𝑎𝑚/𝑠𝑒𝑒
= 0.018 + 5.668 ∗ 10−3 𝐴 ∗ 𝑆 + 2.165 ∗ 10−4(𝐴 ∗ 𝑆2) 𝐻𝐶 𝑠𝑛𝑎𝑚/𝑠𝑒𝑒
= 0.182 − 8.587 ∗ 10−2 𝐴 ∗ 𝑆 + 1.279 ∗ 10−2 𝐴 ∗ 𝑆2 𝑁𝐶𝑒 𝑠𝑛𝑎𝑚/𝑠𝑒𝑒
= 3.86 ∗ 10−3 − 8.767 ∗ 10−3 𝐴 ∗ 𝑆 𝑜𝑜𝑛 𝑎𝑒𝑒𝑒𝑠𝑒𝑛𝑎𝑒𝑠𝑜𝑛 𝑁𝐶𝑒 𝑠𝑛𝑎𝑚/𝑠𝑒𝑒
3 4

Air Quality Model The TRRL
Developed by British Transport and Road Research Laboratory (1984)
Predict air pollution from road traffic Hourly CO concentration will be provided HC and NOx can be approximated from CO concentration
𝐻𝐻 𝑝𝑝𝑚 = 1.8 𝐻𝐶 𝑝𝑝𝑚 × 𝑅 + 4.0 𝑁𝐶𝑥 𝑝𝑝𝑚 = 𝐻𝐶 𝑝𝑝𝑚 × 𝑅 + 0.1
R is the ratio of pollutant emission rate for a given mean speed Annual max 8 hour CO concentration can be calculated
from average peak hour concentration 𝐻 1 85𝐻 + 1 19

Thank you
Related Documents