TRADING QUALIFIED TRENDS L.A Little (Author, Professional Trader) Founder of Technical Analysis Today www.tatoday.com

Welcome message from author
This document is posted to help you gain knowledge. Please leave a comment to let me know what you think about it! Share it to your friends and learn new things together.
Transcript

TRADING
QUALIFIED
TRENDS
L.A Little (Author, Professional Trader)
Founder of Technical Analysis Today
www.tatoday.com

What is Trading?
• Many loose definitions floating around …
• My definition is that trading is speculating. It’s speculating on a future outcome typically based on some bias
• Most trading systems are:
• Based on a Bias (fundamental, technical, sentiment, behavioral, etc.)
• Probability based (because the future is necessarily probabilistic – no certainties)
• Typically trend based
www.tatoday.com

Trend – The Most Basic TA Concept
• Why is the definition of trend so important?
• Trend is at the center of most trading systems
• Moving Averages,
• MACD,
• Oscillators,
• Bollinger Bands, etc.
• It’s pervasive in the literature and referred to repeatedly
• The problem is that trend hasn’t been precisely defined
www.tatoday.com

So … what is Trend?
• Again … many loose definitions …
• Some say trend is the directional movement of price
• The classical definition of trend was proposed by Charles
Dow and William Hamilton over 100 years ago as:
• Uptrend is a series of higher highs & higher lows
• Downtrend is a series of lower highs & lower lows
www.tatoday.com

Classical Uptrend in Google
www.tatoday.com

Classical Downtrend in Google
www.tatoday.com

Given the downtrend, do you sell Google?
www.tatoday.com
If you did you are still kicking yourself
www.tatoday.com
How Can You Avoid Buying or Selling at Exactly
the Wrong Time?
• Compute and Consider Trend Holistically
• Key Characteristics are:
• Systematic and programmatic
• Provides a qualitative measure
• Applicable to all time frames
• Utilizes the basic TA fundamental data points
• Price
• Volume
• Time
www.tatoday.com
… and that’s what I have done
www.tatoday.com

Defining Trend Systematically/Programmatically
• The basic algorithm is:
• All bars are potential SPL/SPH
• For SPL, if next six bars have a higher low, then it’s SPL
• For SPH, if next six bars have a lower high, then SPH
www.tatoday.com

Defining Trend more Precisely
• This trend identification process is referred to as the Neoclassical Methodology. It allows for:
• Algorithmic definition of swing points
• Systematic detection of swing point tests and ability to measure the intensity of the buyers/sellers at those price points
• Algorithmic detection and measurement of swing point breaks and thus the qualification of trend as … • Strong or weak
• Confirmed or suspect
www.tatoday.com

Checking Our Trend Definition Checklist
• Systematic and programmatic
• Provides a qualitative measure
• Applicable to all time frames
• Utilizes the basic TA fundamental data points
• Price
• Volume
• Time
www.tatoday.com

Trend Definition and Qualification
• Trends come into existence and are qualified when a
swing point is tested and breaks
• When a break of a swing point has comparatively more
volume it is denoted as Confirmed
• When a break of a swing point has comparatively less
volume it is denoted as Suspect
• “Comparatively” implies measuring volume that existed at
the prior swing point to the break out bar
www.tatoday.com

Confirmed Bullish Trend – an example
www.tatoday.com
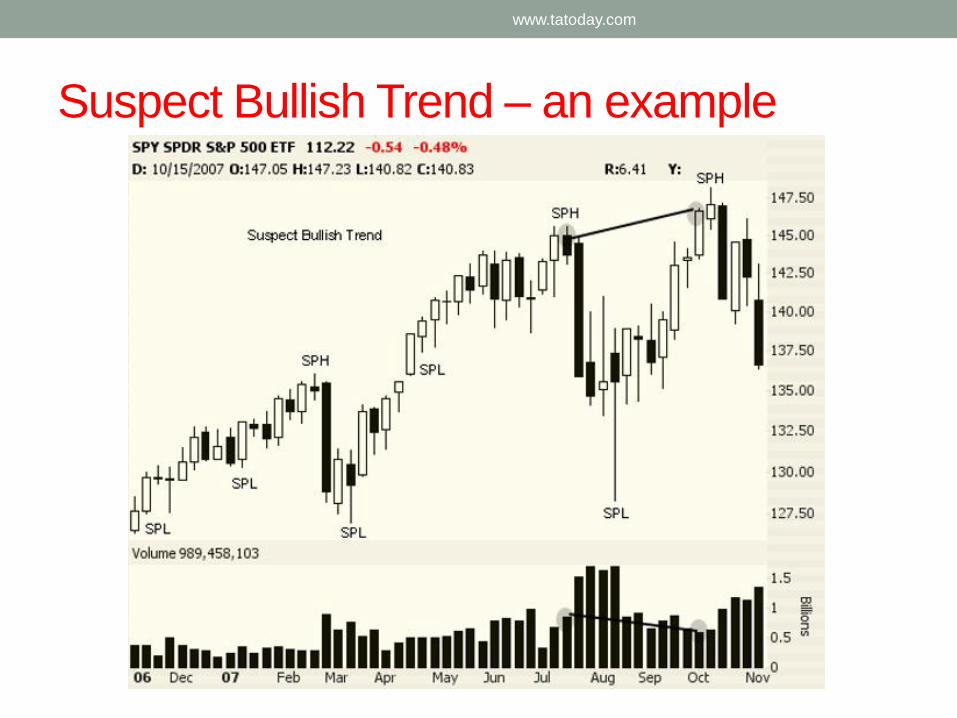
Suspect Bullish Trend – an example
www.tatoday.com

Trends and Friends • They say that the “Trend is your Friend” and that’s
generally true but some friends are better than others
• A Confirmed trend is generally a better friend and
typically the one you want pursue
• It has greater persistence – from 2% to 7% greater
depending on the time frame and the direction
• A Suspect trend is a more questionable friend … not
one you can blindly trust
• It has less persistence and is more likely to die an early
death
• In trading, you get to choose your friends
• You should choose them carefully
www.tatoday.com

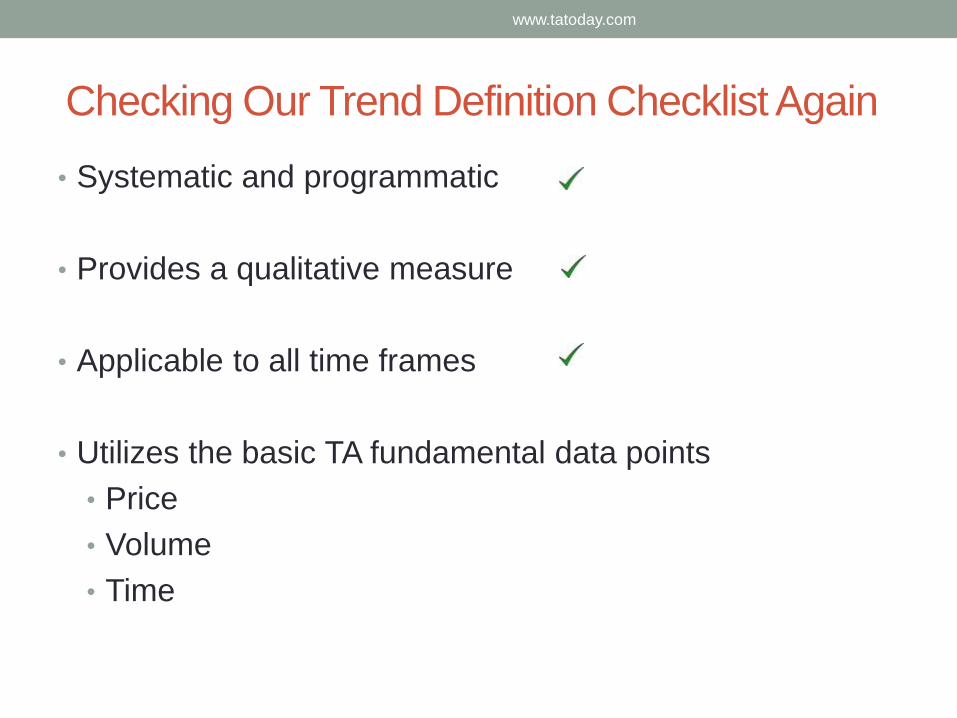
Checking Our Trend Definition Checklist Again
• Systematic and programmatic
• Provides a qualitative measure
• Applicable to all time frames
• Utilizes the basic TA fundamental data points
• Price
• Volume
• Time
www.tatoday.com
How are Time Frames Defined?
• Each time frame needs to be reasonably consistent in
terms of the number of bars so that they can be treated
identically
• Roughly 60 bars to a time frame – not too much or too
little data to analyze
• Width of the bar can be varied to create differing time
frames
• Treating time as bars on a chart is a valuable abstraction
www.tatoday.com

Defining time frames as bars gives abstraction
• Generally accepted that there are 3 time frames so to get roughly 60 bars per time frame here are examples for a swing trader versus a day trader
• Swing Trader Time Frames
• Short Term Time Frame – 3 months of daily bars
• Intermediate Term Time Frame – 1 year of weekly bars
• Long Term Time Frame – 5 years of monthly bars
• Day Trader Time Frames
• Short Term Time Frame – 2 days of 10 minute bars
• Intermediate Term Time Frame – 10 days of 60 minute bars
• Long Term Time Frame – 20 days of 2 hour bars
www.tatoday.com

Trends & Time Frames
• Unlike classical TA, when you qualify trends you end up with 6 – not 3 trend types
• Confirmed or Suspect Bullish
• Confirmed or Suspect Bearish
• Confirmed or Suspect Sideways
• … and there are 3 time frames
• Short, Intermediate, and Long Term
• … and there are outside influences on a stock’s trend – namely the sector and general market influences
• That’s a lot of data to try and visualize so I create a visualization tool called The Trading Cube
www.tatoday.com

The Trading Cube
www.tatoday.com
The Trading Cube is a snapshot view of trend
• It is like an accountant’s balance sheet
• It tells you what is the qualified trend at a
specific moment in time for
• The stock
• The stock’s sector
• The general market
www.tatoday.com

Swing Trader’s Time Frames per Trading Cube
www.tatoday.com
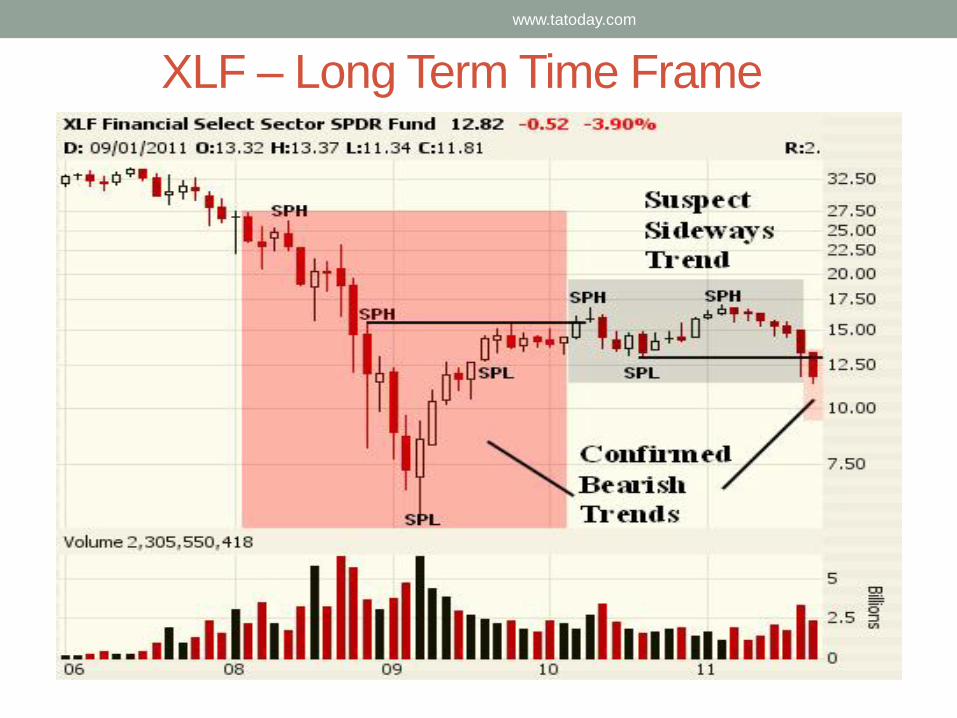
XLF – Long Term Time Frame
www.tatoday.com

XLF – Intermediate Term Time Frame
www.tatoday.com

XLF - Short Term Time Frame
www.tatoday.com

Why are all Time Frames Important?
• Circling back to Google – how do you know not to exit?
• The break was suspect
• Trend had not broken on the intermediate term
www.tatoday.com
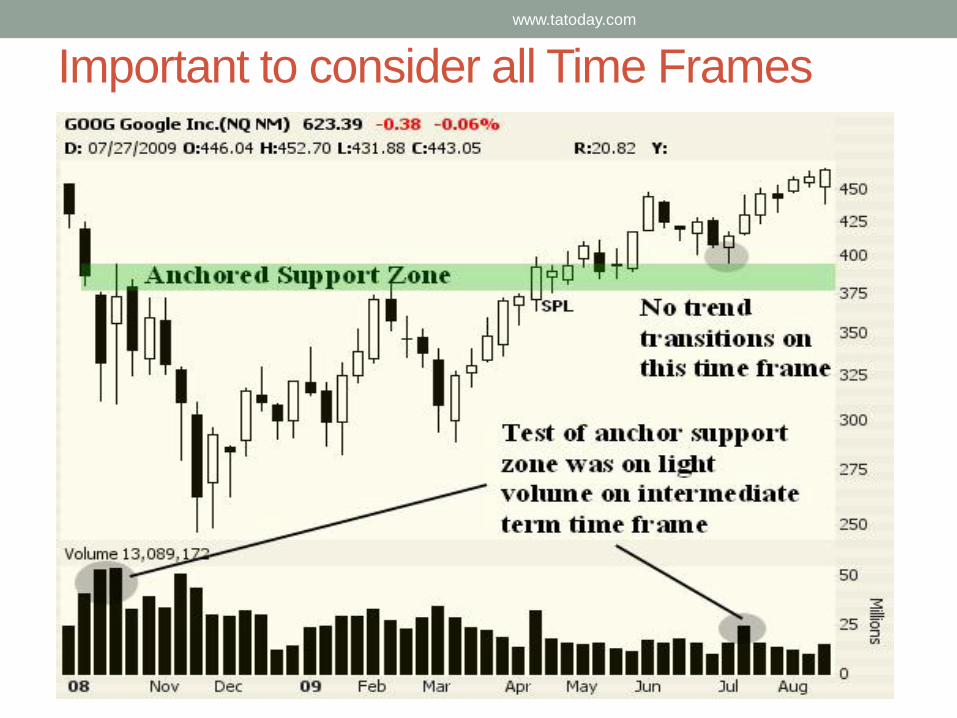
Important to consider all Time Frames
www.tatoday.com
Checking Our Trend Definition Checklist Again
• Systematic and programmatic
• Provides a qualitative measure
• Applicable to all time frames
• Utilizes the basic TA fundamental data points
• Price
• Volume
• Time
www.tatoday.com

Price and Volume …
www.tatoday.com
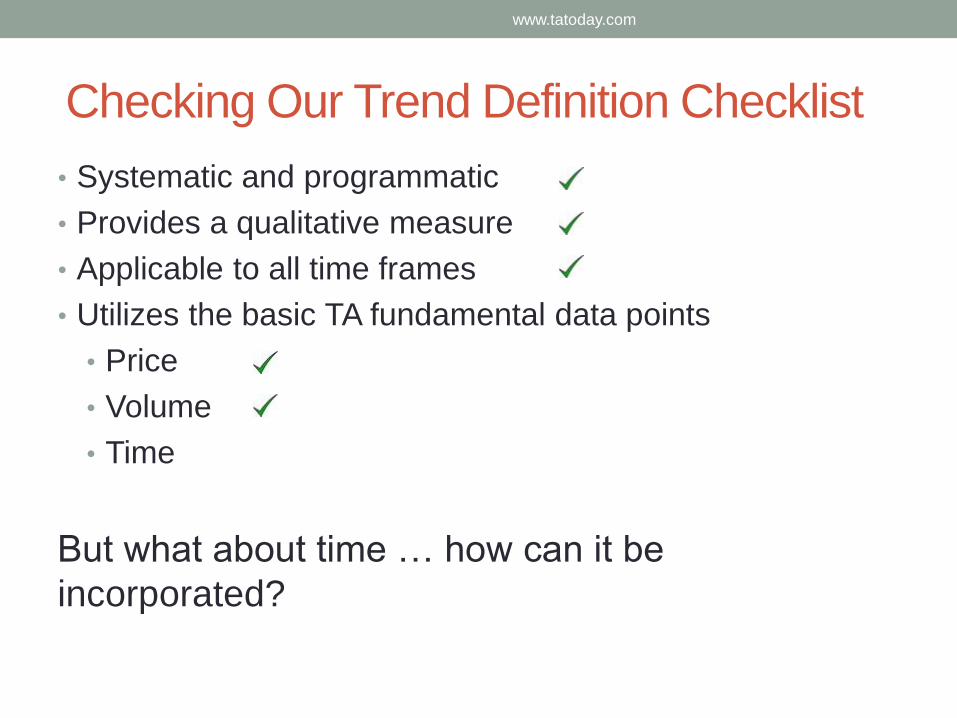
Checking Our Trend Definition Checklist
• Systematic and programmatic
• Provides a qualitative measure
• Applicable to all time frames
• Utilizes the basic TA fundamental data points
• Price
• Volume
• Time
But what about time … how can it be
incorporated?
www.tatoday.com

What if ...
• What if trend was thought about as having a life cycle
• A trend comes into existence
• A trend persists for some period of time
• A trend eventually ends
• If viewed this way, a trend could be thought of as a
household appliance … like a microwave for example
www.tatoday.com

A microwave has an expected life cycle
• The failure rate can be computed
• It can be presented as a probability table/curve
• For a microwave, the mean failure rate is roughly 10
years
• So what about trends … can probability failure rates be
computed?
www.tatoday.com

A trend has an expected life cycle also
• Because trends can be determined algorithmically
• … the creation of a trend is kind of like the microwave
hitting the store shelf and being bought
• … and because trend transitions can also be determined
automatically this is like the microwave finally breaking
• Thus, trends have failure rates too and they can be
computed and displayed as tables/graphs
www.tatoday.com

What was the failure probability rate at 2009 low?
www.tatoday.com
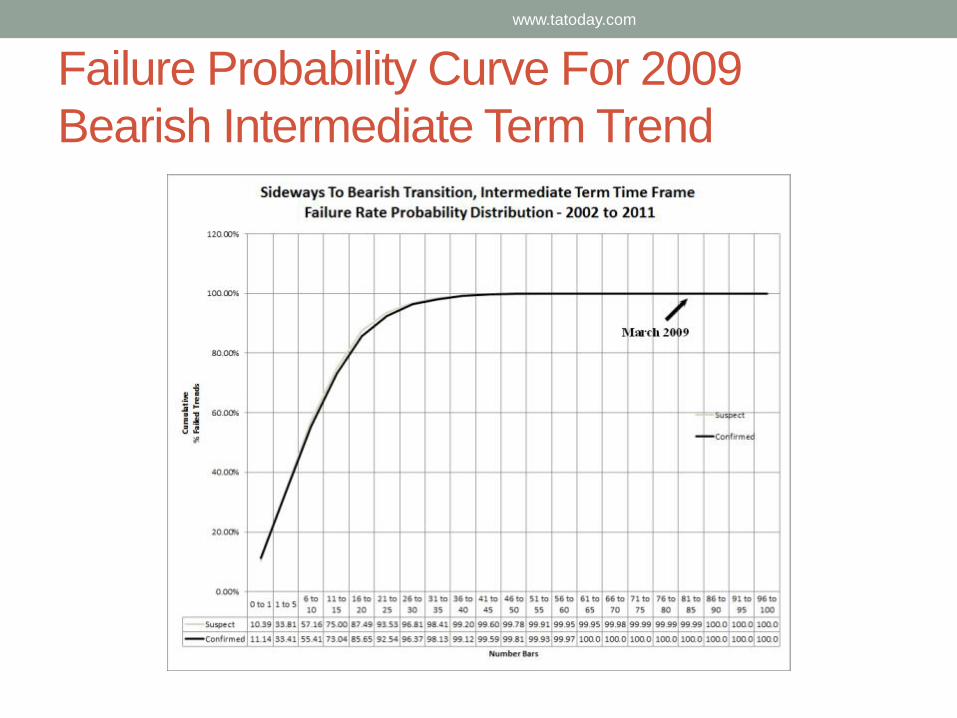
Failure Probability Curve For 2009
Bearish Intermediate Term Trend
www.tatoday.com
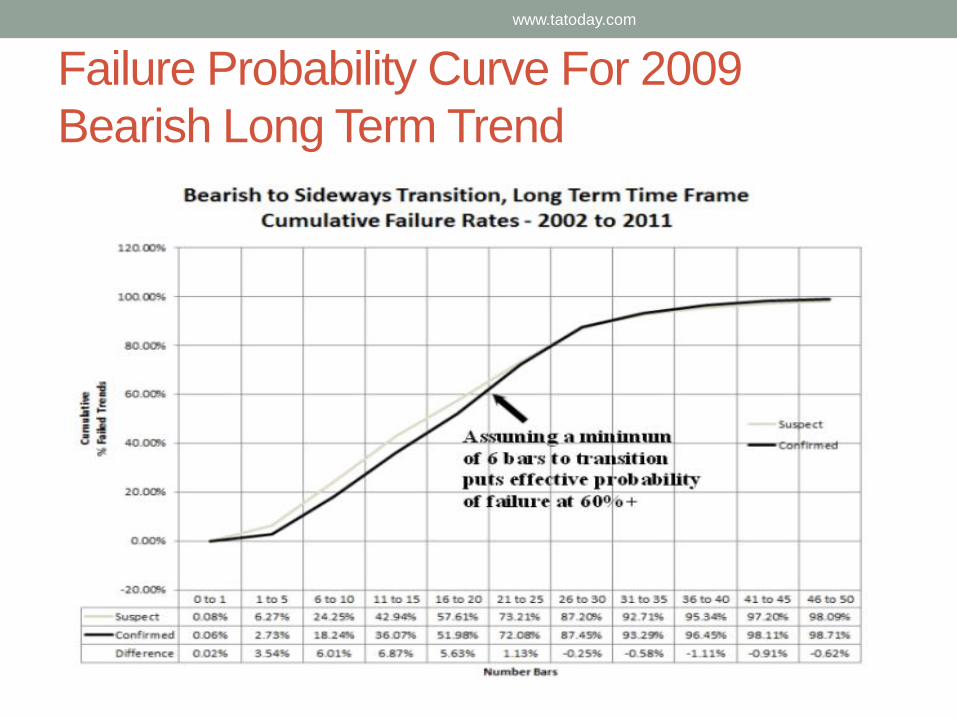
Failure Probability Curve For 2009
Bearish Long Term Trend
www.tatoday.com
So, is there is a Better Way to Determine
and Trade Trend?
• ABSOLUTELY!!!
• Systematically and programmatically
• By qualifying trend as Suspect or Confirmed
• By being able to apply the methodology to all time frames
• By utilizing all three of the basic TA fundamental data points
• Price
• Volume
• Time
With Qualified Trends you can avoid buying and selling stocks at exactly the wrong time.
www.tatoday.com
If you want to learn more …
Buy the book … Get the tools free for a month …
• Trading Cube
• Trading Cube Scanner
• Anchored Support &
Resistance
• Trading Signals
• Swing Trading Portfolio
• Etc. all on
www.tatoday.com
www.tatoday.com
Related Documents