Beginning Account Capital: Rs.400,000.00 Current Value of Account: Rs.400,000.00 Value Difference: 0.00 % Difference: 0.00% Long Short Reason for Entry Reason for Exit use ( - ) use ( - ) ò ò ò ò ò ò ò ò DATE 1 0.00 #DIV/0! Rs 0.00 #DIV/0! 0.00 DATE 1 0.00 #DIV/0! Rs 0.00 #DIV/0! 0.00 WIN % LOSS % LONGS 1 0 0% 0 0% P & L Fees SHORTS 1 0 0% 0 0% Rs 0 0 0 Rs 0 0 0 Rs 0 ### Rs 0 0 Rs 0 Totals 2 0 0% 0 0% #DIV/0! #DIV/0! Rs 0 0.00 #DIV/0! Commissions Rs 0.00 Rs 0.00 ü All YELLOW Highlighted Boxes Contain "At-A-Glance" Information About Your Account Progress ü DATE 1 0.00 #DIV/0! Rs 0.00 #DIV/0! 0.00 DATE 1 0.00 #DIV/0! Rs 0.00 #DIV/0! 0.00 Trade Date Stock Symbol Trade Setup Entry Pattern # Shares Entry Price Stop Rs. Risk 1st Target Reward to EXIT Gain / Loss Rs. WIN Long WIN Short PROFIT Rs. Amount LOSS LOSS LOSS Rs. ( R ) Multiple Actual Risk Amount Total Trans- actions Trade Fees ï To Paste - Click Left Number, Go To The Toolbar Menu And Click Insert, Then Rows - Then Paste Appropriate Long or Short Row (From Below) By Clicking The Actual Row "Number". Cumulative Win/Loss % Cumulative Stats WIN Long WIN Short TOTAL PROFIT LOSS LOSS TOTAL LOSS Sharpe Ratio Avg Risk Trans- actions Cumulative Expenses Other Scroll To The Right To Continue With Trade Journal Input (Reason For Entry, Exit And Mistake Columns) DAILY TRADE JOURNAL "Replace Emotions Of Fear & Greed With The Calm Confidence Of Having A Plan In Place, And Trading According To Plan." Easy Step-By-Step Instructions: 1) You Will Need To Copy/Paste The Appropriate Long or Short Rows (Directly Above, Or Right Below For Your Trade Data Input. Column "A" And Its Corresponding Blue (Long) And Orange (Short) Cells Help You Distinguish Between Long & Short Trades. Blue Is Long, Orange Is Short. 2) DO NOT Delete Rows 7 or 8 When Starting Out. You Will Lose The Formulas Used To Calculate Your Progress. Start Your First Data Input On Either Row 7 or 8 (Just Type Over The Pre-Existing Data), Then you Can Delete Unused Data Row And Start Inserting Your Own Rows By Pasting Underneath Them. 3) Fill Out ALL Trade Journal Data In The White Boxes. The Shaded Areas Have Formulas That You Do Not Want To Lose. If You Accidentally Type In A Grey Shaded Box, Quickly Go To Edit, Undo Typing . 4) The Cells Along Row 5 And The Corresponding BLUE / ORANGE Boxes Are Used For Calculations. Do Not Skip These Boxes. Input A #1 In Each Box (Column C or D) That Pertains To Your Specific Trade Criteria. 5) Input Your Starting Capital In The Top Middle Square (LM1). Your Progress Will Be Updated Automatically. This Figure Will Be Your Net P&L As It Accounts For Your Broker Commissions & Expenses From (Z 20) 6) BE SPECIFIC When Entering Data Into Columns F & G. You Will Need Corresponding Data Fields In Column ( C ) Of Your Strategy Tracking Sheet To Import The Correct Data. 7) After Each Trade, You Will Need To Transfer Data (R Thru W, Corresponding With F & G) To Your Strategy Tracking Sheet. 8) Column Z21 Will Need A Manual Input. Keep Track Of Your Cumulative Expenses (Other Than Broker Fees, Which Are Totalled Automatically In The box Above It) Such As Stamp Duty, Transaction Charges, Courses, Service Tax & Etc.) 9) Row 6 Can Be Used To Sort (If Needed). If The Sort Feature Does Not Work, You Will Need To Unlock The Sheet. Go To Tools, Protection, Unprotect Sheet (Make Sure You Change Back To Protect Once Finished). 10) If You See A Small Red Triangle In The Upper Right-Hand Corner Of A Box, Put The Mouse Cursor Over It To Read Any Instructions And/Or Explanations. 11) Use The Coloured Tabs At The Bottom To Navigate Thru All Of Your Trading Tool Sheets. (Tabs May Not Be Coloured If Your MS Office Is Not XP Version) ,

Welcome message from author
This document is posted to help you gain knowledge. Please leave a comment to let me know what you think about it! Share it to your friends and learn new things together.
Transcript

Beginning Account Capital: Rs.400,000.00
Current Value of Account: Rs.400,000.00
Value Difference: 0.00
% Difference: 0.00%
Long Short Reason for Entry Reason for Exit
use ( - ) use ( - ) ò ò ò ò ò ò ò òDATE 1 0.00 #DIV/0! Rs 0.00 #DIV/0! 0.00
DATE 1 0.00 #DIV/0! Rs 0.00 #DIV/0! 0.00
WIN % LOSS %
LONGS 1 0 0% 0 0% P & L Fees
SHORTS 1 0 0% 0 0% Rs 0 0 0 Rs 0 0 0 Rs 0 #DIV/0! Rs 0 0 Rs 0
Totals 2 0 0% 0 0% #DIV/0! #DIV/0!Rs 0 0.00 #DIV/0!
Commissions Rs 0.00
Rs 0.00
ü All YELLOW Highlighted Boxes Contain "At-A-Glance" Information About Your Account Progress
ü
DATE 1 0.00 #DIV/0! Rs 0.00 #DIV/0! 0.00
DATE 1 0.00 #DIV/0! Rs 0.00 #DIV/0! 0.00
Trade
Date
Stock
Symbol
Trade
Setup
Entry
Pattern
#
Shares
Entry
Price
Stop
Price
Rs.
Risk
Amount
1st Target
Price
Reward to
ïRisk
EXIT (AVG)
Gain / Loss
Rs.
WIN
Long
WIN
Short
PROFIT Rs. Amount
LOSS Long
LOSS Short
LOSS Rs. Amount
( R )
Multiple
Actual
Risk
Amount
Total
Trans-
actions
Trade
Fees
ï To Paste - Click Left Number, Go To The Toolbar Menu And Click Insert, Then Rows - Then Paste Appropriate Long or Short Row (From Below) By Clicking The Actual Row "Number".
Cumulative
Win/Loss %
Cumulative
Stats
WIN
Long
WIN
Short
TOTAL
PROFIT
LOSS Long
LOSS Short
TOTAL
LOSS
Sharpe
Ratio
Avg
Risk
Trans-
actions
Cumulative
ExpensesOther
Expenses
Scroll To The Right To Continue With Trade Journal Input (Reason For Entry, Exit And Mistake Columns)
DAILY TRADE JOURNAL "Replace Emotions Of Fear & Greed With The Calm Confidence Of Having A Plan In Place, And Trading According To Plan."
Easy Step-By-Step Instructions:
1) You Will Need To Copy/Paste The Appropriate Long or Short Rows (Directly Above, Or Right Below For Your Trade Data Input. Column "A" And Its Corresponding Blue (Long) And Orange (Short) Cells Help You Distinguish Between Long & Short Trades. Blue Is Long, Orange Is Short.
2) DO NOT Delete Rows 7 or 8 When Starting Out. You Will Lose The Formulas Used To Calculate Your Progress. Start Your First Data Input On Either Row 7 or 8 (Just Type Over The Pre-Existing Data), Then you Can Delete Unused Data Row And Start Inserting Your Own Rows By Pasting Underneath Them.
3) Fill Out ALL Trade Journal Data In The White Boxes. The Shaded Areas Have Formulas That You Do Not Want To Lose. If You Accidentally Type In A Grey Shaded Box, Quickly Go To Edit, Undo Typing.
4) The Cells Along Row 5 And The Corresponding BLUE / ORANGE Boxes Are Used For Calculations. Do Not Skip These Boxes. Input A #1 In Each Box (Column C or D) That Pertains To Your Specific Trade Criteria.
5) Input Your Starting Capital In The Top Middle Square (LM1). Your Progress Will Be Updated Automatically. This Figure Will Be Your Net P&L As It Accounts For Your Broker Commissions & Expenses From (Z 20)
6) BE SPECIFIC When Entering Data Into Columns F & G. You Will Need Corresponding Data Fields In Column ( C ) Of Your Strategy Tracking Sheet To Import The Correct Data.
7) After Each Trade, You Will Need To Transfer Data (R Thru W, Corresponding With F & G) To Your Strategy Tracking Sheet.
8) Column Z21 Will Need A Manual Input. Keep Track Of Your Cumulative Expenses (Other Than Broker Fees, Which Are Totalled Automatically In The box Above It) Such As Stamp Duty, Transaction Charges, Courses, Service Tax & Etc.)
9) Row 6 Can Be Used To Sort (If Needed). If The Sort Feature Does Not Work, You Will Need To Unlock The Sheet. Go To Tools, Protection, Unprotect Sheet (Make Sure You Change Back To Protect Once Finished).
10) If You See A Small Red Triangle In The Upper Right-Hand Corner Of A Box, Put The Mouse Cursor Over It To Read Any Instructions And/Or Explanations.
11) Use The Coloured Tabs At The Bottom To Navigate Thru All Of Your Trading Tool Sheets. (Tabs May Not Be Coloured If Your MS Office Is Not XP Version)
,
H2
SavantGarde: INCLUDES ALL CUMULATIVE EXPENSES.
B5
SavantGarde: INPUT DATE OF TRADE ENTRY HERE
D5
SavantGarde: Put A ( 1 ) In This Box If It Is A LONG Trade
E5
SavantGarde: Put A ( 1 ) In This Box If It Is A SHORT Trade
F5
SavantGarde: WHAT TYPE OF SETUP IS THIS? SWING TRADE, GAP PLAY, 15-MINUTE REVERSAL, ETC.
G5
SavantGarde: HOW DID YOU ENTER YOUR SETUP? PULLBACK, BREAKOUT, W-PATTERN, ETC…ETC.
H5
SavantGarde: TOTAL NUMBER OF SHARES THAT YOU GOT FILLED.
I5
SavantGarde: PRICE YOU WERE FILLED AT BY YOUR BROKER
J5
SavantGarde: INITIAL STOP PRICE. The Price You Have Pre-Determined To Get Out At If The Stock Does Not Go In Your Direction.
K5
SavantGarde: THIS BOX CALCULATES AUTOMATICALLY
L5
SavantGarde: THE PRICE WHERE YOU INTEND TO TAKE ALL OR PARTIAL PROFITS. USED TO CALCULATE YOUR REWARD to RISK AMOUNT.
M5
SavantGarde: HOW MUCH YOU STAND TO MAKE IF YOUR TRADE REACHES YOUR PRE-DETERMINED TARGET BASED ON YOUR POSITION SIZE... SEE ( LOT SIZE ) TAB.
O5
SavantGarde: ENTER THE AMOUNT OF YOUR AVERAGE EXIT PRICE (IF MORE THAN ONE EXIT) BASED ON YOUR BROKER INFORMATION OR YOUR OWN CALCULATION OR CONTRACT.
Q5
SavantGarde: THIS BOX IS AUTOMATIC CALC
R5
SavantGarde: Put A ( 1 ) In This Box If It Was A Winning LONG Trade.
S5
SavantGarde: Put A ( 1 ) In This Box If It Was A Winning SHORT Trade.
T5
SavantGarde: IF YOUR TRADE WAS A WINNER, ENTER THE AMOUNT FROM THE GAIN / LOSS COLUMN (HERE)
U5
SavantGarde: Put A ( 1 ) In This Box If It Was A Losing LONG Trade.
V5
SavantGarde: Put A ( 1 ) In This Box If It Was A Losing SHORT Trade.
W5
SavantGarde: IF YOUR TRADE WAS A LOSS, ENTER THE AMOUNT FROM THE GAIN / LOSS COLUMN (HERE)
X5
SavantGarde: THIS IS THE AMOUNT YOU MADE BASED ON ( R ) Ex., A Figure Of 2.5 Means You Made 2 1/2 Times Your Initial Risk Amount.
Y5
SavantGarde: THE TOTAL AMOUNT OF MONEY YOU WERE AT RISK DURING THE TRADE, Minus Slippage & Fees, BASED ON YOUR POSITION SIZE.
Z5
SavantGarde: Will Cover In / Out & Any Partial's Taken During The Trade. Put Total Number Of Transactions.
AA5
SavantGarde: TOTAL AMOUNT OF COMMISSIONS YOU PAID YOUR BROKER ON THIS TRADE.
X12
SavantGarde: Average Gains Divided by Averages Losses.
Y12
SavantGarde: AVERAGE AMOUNT OF MONEY RISKED PER TRADE.
T14
SavantGarde: AVERAGE Rs WIN
W14
SavantGarde: AVERAGE Rs LOSS
Y14
SavantGarde: Total Amount Of Rs. RISKED On ALL Trades.
Z14
SavantGarde: Used As Part Of Formula For (Strategy Tracking Sheet). Please Leave As Is.
AA14
SavantGarde: Average Fee Per /Each Transaction.
Z16
SavantGarde: Cumulatively Adds Up All Trade Brokerage Fees (Commissions).
Z17
SavantGarde: Manually Input All Other Expenses Used In Your Trading. Do This Daily Or Wait For Your Monthly Broker's Statement.

Any Mistakes?
ò ò ò ò

Strategy Tracking Sheet
# Win # Loss
Total Loss
WIN %ò use ( - )
Long Term 0 Rs 0 0 Rs 0 0 #DIV/0!
Entry Pattern 0 #DIV/0!
Entry Pattern 0 #DIV/0!
Entry Pattern 0 #DIV/0!
Entry Pattern 0 #DIV/0!
Swing 0 Rs 0 0 Rs 0 0 #DIV/0!
Entry Pattern 0 #DIV/0!
Entry Pattern 0 #DIV/0!
Entry Pattern 0 #DIV/0!
Entry Pattern 0 #DIV/0!
DayTrade 0 Rs 0 0 Rs 0 0 #DIV/0!
Entry Pattern 0 #DIV/0!
Entry Pattern 0 #DIV/0!
Entry Pattern 0 #DIV/0!
Entry Pattern 0 #DIV/0!
Scalp 0 Rs 0 0 Rs 0 0 #DIV/0!
Entry Pattern 0 #DIV/0!
Entry Pattern 0 #DIV/0!
Entry Pattern 0 #DIV/0!
Entry Pattern 0 #DIV/0!0 Rs 0 0 Rs 0 0 #DIV/0!
ALL TRADES * You Will Only Need To Input Data In Columns D Thru G. All Other Cells Use Formulas & Are Locked For Protection.
LONG 0 #DIV/0!
SHORT 0 #DIV/0!0 Rs 0 0 Rs 0 0 #DIV/0!
After A "String" Of Trades (No Less Than 20), You Will Need To Review Your Progress With That Individual (Trade Setup) And/Or (Entry Pattern). Do This With Each Completed String Until You Are Following Your Plan Consistently.
Setup &
Entry Pattern
Total
Profit
Total #
Trades
To Be A Winner, One Must First Experience Being A Talented Looser. Winning Is Always Born Out Of Losing. Keep "Score" Of Your Trades! It Is The Only Way To Know Where You've Been & WhereYyou're Going. This Specific Sheet Is Responsible For My Trading. I Simply Started Tracking Each And Every Setup And Entry Pattern That Was In My Trading Plan. After A String Of 20 Trades For Each, I Would Evaluate It. If It Showed Promise, I Would Continue Another 20-String, And So On (Trying To Eliminate Any Errors Along The Way). Once You Accumulate Enough Data, You Will Have The Needed Confidence To Exploit That That Certain Setup, To Trade It Over And Over Again, As You Will Know Your Long Term "Expectancy" For That Setup.
If A Certain Setup Is Not Working As Desired, Evaluate It For Possible Errors (That You May Be Unknowingly Committing), Or Just Stop Trading It And Focus On Building More Trade "Frequency" On Another Setup That Is Providing Consistent Profits. A Huge Key To Making Money Is Finding A System With A Positive Expectancy And One That Provides Enough Trade Frequency To Realize Your Profit Goals. How Can You Do This Without Keeping TrackOf What Is Working, And What Isn't?
C3
SavantGarde: Re-Type Your Trade Plan SETUPS And ENTRY PATTERNS (Below)
E3
SavantGarde: This Column Is CUMULATIVE. Add All Future Profits Together. These Figures Will Always Get Larger As Each Trade Profit Is Added To The Last One.
G3
SavantGarde: This Column Is CUMULATIVE. Add All Future Losses To This Figure. These Figures Will Always Get Larger As Each Trade Loss Is Added To The Prior One. REMEMBER TO USE THE ( - ) SIGN WHEN INPUTING FIGURES INTO THE LOSS COLUMN.

To Be A Winner, One Must First Experience Being A Talented Looser. Winning Is Always Born Out Of Losing. Keep "Score" Of Your Trades! It Is The Only Way To Know Where You've Been & WhereYyou're Going. This Specific Sheet Is Responsible For My Trading. I Simply Started Tracking Each And Every Setup And Entry Pattern That Was In My Trading Plan. After A String Of 20 Trades For Each, I Would Evaluate It. If It Showed Promise, I Would Continue Another 20-String, And So On (Trying To Eliminate Any Errors Along The Way). Once You Accumulate Enough Data, You Will Have The Needed Confidence To Exploit That That Certain Setup, To Trade It Over And Over Again, As You Will Know Your Long Term "Expectancy" For That Setup.
If A Certain Setup Is Not Working As Desired, Evaluate It For Possible Errors (That You May Be Unknowingly Committing), Or Just Stop Trading It And Focus On Building More Trade "Frequency" On Another Setup That Is Providing Consistent Profits. A Huge Key To Making Money Is Finding A System With A Positive Expectancy And One That Provides Enough Trade Frequency To Realize Your Profit Goals. How Can You Do This Without Keeping TrackOf What Is Working, And What Isn't?

Avg Rs Win Avg Rs Loss P & L
Est. Net Profit
#DIV/0! #DIV/0! #DIV/0! Rs 0 #DIV/0! #DIV/0!
#DIV/0! #DIV/0! #DIV/0! Rs 0 #DIV/0! #DIV/0!
#DIV/0! #DIV/0! #DIV/0! Rs 0 #DIV/0! #DIV/0!
#DIV/0! #DIV/0! #DIV/0! Rs 0 #DIV/0! #DIV/0!
#DIV/0! #DIV/0! #DIV/0! Rs 0 #DIV/0! #DIV/0!
#DIV/0! #DIV/0! #DIV/0! Rs 0 #DIV/0! #DIV/0!
#DIV/0! #DIV/0! #DIV/0! Rs 0 #DIV/0! #DIV/0!
#DIV/0! #DIV/0! #DIV/0! Rs 0 #DIV/0! #DIV/0!
#DIV/0! #DIV/0! #DIV/0! Rs 0 #DIV/0! #DIV/0!
#DIV/0! #DIV/0! #DIV/0! Rs 0 #DIV/0! #DIV/0!
#DIV/0! #DIV/0! #DIV/0! Rs 0 #DIV/0! #DIV/0!
#DIV/0! #DIV/0! #DIV/0! Rs 0 #DIV/0! #DIV/0!
#DIV/0! #DIV/0! #DIV/0! Rs 0 #DIV/0! #DIV/0!
#DIV/0! #DIV/0! #DIV/0! Rs 0 #DIV/0! #DIV/0!
#DIV/0! #DIV/0! #DIV/0! Rs 0 #DIV/0! #DIV/0!
#DIV/0! #DIV/0! #DIV/0! Rs 0 #DIV/0! #DIV/0!
#DIV/0! #DIV/0! #DIV/0! Rs 0 #DIV/0! #DIV/0!
#DIV/0! #DIV/0! #DIV/0! Rs 0 #DIV/0! #DIV/0!
#DIV/0! #DIV/0! #DIV/0! Rs 0 #DIV/0! #DIV/0!
#DIV/0! #DIV/0! #DIV/0! Rs 0 #DIV/0! #DIV/0!#DIV/0! #DIV/0! #DIV/0! Rs 0 #DIV/0! #DIV/0!
* You Will Only Need To Input Data In Columns D Thru G. All Other Cells Use Formulas & Are Locked For Protection.
#DIV/0! #DIV/0! #DIV/0! Rs 0 #DIV/0! #DIV/0!
#DIV/0! #DIV/0! #DIV/0! Rs 0 #DIV/0! #DIV/0!#DIV/0! #DIV/0! #DIV/0! Rs 0 #DIV/0! #DIV/0!
After A "String" Of Trades (No Less Than 20), You Will Need To Review Your Progress With That Individual (Trade Setup) And/Or (Entry Pattern). Do This With Each Completed String Until You Are Following Your Plan Consistently.
Sharpe
Ratio
Expectancy
per Trade
To Be A Winner, One Must First Experience Being A Talented Looser. Winning Is Always Born Out Of Losing. Keep "Score" Of Your Trades! It Is The Only Way To Know Where You've Been & WhereYyou're Going. This Specific Sheet Is Responsible For My Trading. I Simply Started Tracking Each And Every Setup And Entry Pattern That Was In My Trading Plan. After A String Of 20 Trades For Each, I Would Evaluate It. If It Showed Promise, I Would Continue Another 20-String, And So On (Trying To Eliminate Any Errors Along The Way). Once You Accumulate Enough Data, You Will Have The Needed Confidence To Exploit That That Certain Setup, To Trade It Over And Over Again, As You Will Know Your Long Term "Expectancy" For That Setup.
If A Certain Setup Is Not Working As Desired, Evaluate It For Possible Errors (That You May Be Unknowingly Committing), Or Just Stop Trading It And Focus On Building More Trade "Frequency" On Another Setup That Is Providing Consistent Profits. A Huge Key To Making Money Is Finding A System With A Positive Expectancy And One That Provides Enough Trade Frequency To Realize Your Profit Goals. How Can You Do This Without Keeping TrackOf What Is Working, And What Isn't?
L3
SavantGarde: Average Wins Divided by Average Losses. A Figure Of 2 Means You Are Winning Twice The Amount You Are Losing On That Particular Strategy Or Setup. It Is The General Rule That You Will Need A Sharpe Ratio Of 1.5 Or Better At A 40% Win Ratio To Be In A Positive Situation. Usually A High Sharpe Comes At The Expense Of A High Winning Percentage, And Vice-Versa.
N3
SavantGarde: After Average Commission Costs Are Deducted From Gross Profit/Loss
O3
SavantGarde: How Much You Can Expect (On Average) To Make On Each Trade Going Forward Assuming Equal Performance Is Achieved. If This Column Is In Negative Territory After A String Of (20) Trades, Then Re-Evaluate This Part Of Your PlanFor Psychological And For Management Errors, Mistakes Etc.

To Be A Winner, One Must First Experience Being A Talented Looser. Winning Is Always Born Out Of Losing. Keep "Score" Of Your Trades! It Is The Only Way To Know Where You've Been & WhereYyou're Going. This Specific Sheet Is Responsible For My Trading. I Simply Started Tracking Each And Every Setup And Entry Pattern That Was In My Trading Plan. After A String Of 20 Trades For Each, I Would Evaluate It. If It Showed Promise, I Would Continue Another 20-String, And So On (Trying To Eliminate Any Errors Along The Way). Once You Accumulate Enough Data, You Will Have The Needed Confidence To Exploit That That Certain Setup, To Trade It Over And Over Again, As You Will Know Your Long Term "Expectancy" For That Setup.
If A Certain Setup Is Not Working As Desired, Evaluate It For Possible Errors (That You May Be Unknowingly Committing), Or Just Stop Trading It And Focus On Building More Trade "Frequency" On Another Setup That Is Providing Consistent Profits. A Huge Key To Making Money Is Finding A System With A Positive Expectancy And One That Provides Enough Trade Frequency To Realize Your Profit Goals. How Can You Do This Without Keeping TrackOf What Is Working, And What Isn't?

Notes
After A "String" Of Trades (No Less Than 20), You Will Need To Review Your Progress With That Individual (Trade Setup) And/Or (Entry Pattern). Do This With Each Completed String Until You Are Following Your Plan Consistently.
To Be A Winner, One Must First Experience Being A Talented Looser. Winning Is Always Born Out Of Losing. Keep "Score" Of Your Trades! It Is The Only Way To Know Where You've Been & WhereYyou're Going. This Specific Sheet Is Responsible For My Trading. I Simply Started Tracking Each And Every Setup And Entry Pattern That Was In My Trading Plan. After A String Of 20 Trades For Each, I Would Evaluate It. If It Showed Promise, I Would Continue Another 20-String, And So On (Trying To Eliminate Any Errors Along The Way). Once You Accumulate Enough Data, You Will Have The Needed Confidence To Exploit That That Certain Setup, To Trade It Over And Over Again, As You Will Know Your Long Term "Expectancy" For That Setup.
If A Certain Setup Is Not Working As Desired, Evaluate It For Possible Errors (That You May Be Unknowingly Committing), Or Just Stop Trading It And Focus On Building More Trade "Frequency" On Another Setup That Is Providing Consistent Profits. A Huge Key To Making Money Is Finding A System With A Positive Expectancy And One That Provides Enough Trade Frequency To Realize Your Profit Goals. How Can You Do This Without Keeping TrackOf What Is Working, And What Isn't?

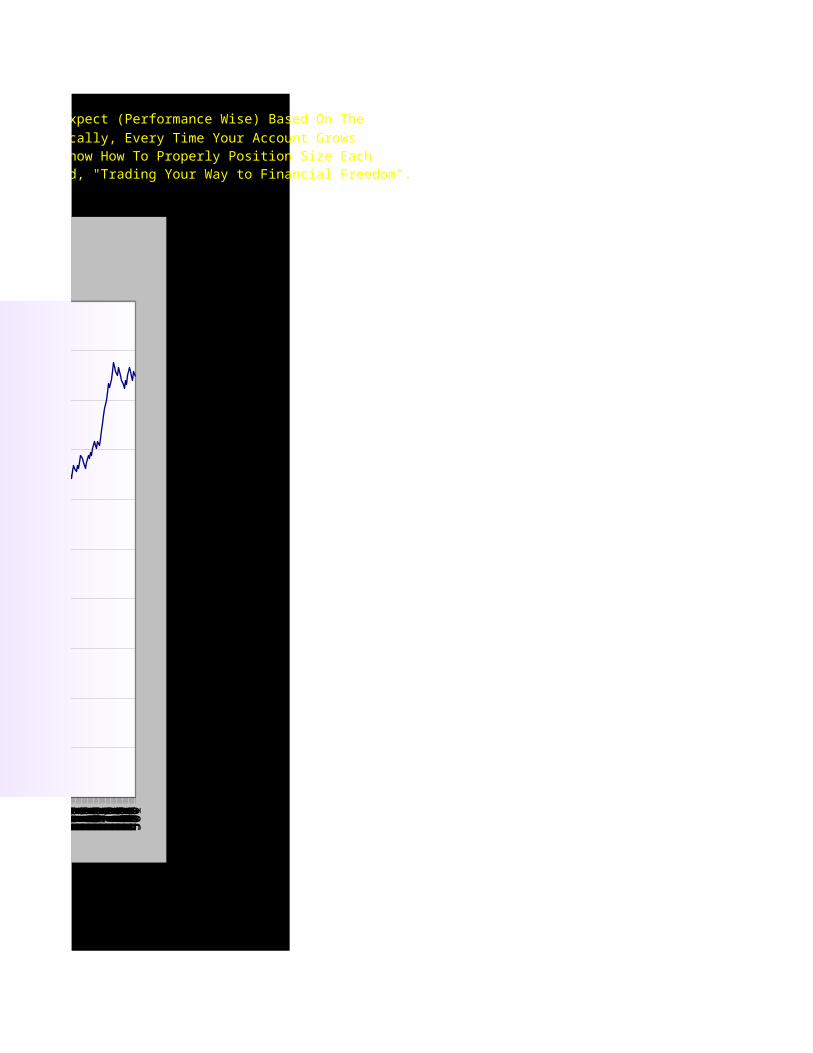
Starting Capital (Rs) Rs.400,000.00 * Each Time You Hit F9, It Will Give You Another 500-Trade Random Sample Of What You Could Expect (Performance Wise) Based On The
Risk (%) of Capital 1.00% Parameters You Entered. The Concept Is Based On Van Tharpe's Theory Of Position-Sizing. Basically, Every Time Your Account GrowsWinning (%) 45 (Or Draw Downs) You Risk The Same % Of Capital On Each Trade. I Believe That If You Do Not Know How To Properly Position Size EachSharpe ( R ) 2.05 And Every Trade, You Stand Little Chance To Succeed. It Is That Important! His Book Is Called, "Trading Your Way to Financial Freedom". Commission (Rs) Rs.20.00
Winning Trades 231Final Return Rs.2,874,346.35Drawdown 395,980 Peak Gain 2,874,346
Trades Monte Carlo Random No. Starting Cap (Rs) Amount Outcome1 26 96 400,000 4000 L2 10 14 395,980 3,960 W3 81 3 404,078 4,041 W4 14 60 412,341 4,123 L5 67 0 408,198 4,082 W6 60 2 416,546 4,165 W7 95 46 425,065 4,251 L8 10 52 420,794 4,208 L9 96 70 416,566 4,166 L
10 67 52 412,381 4,124 L11 21 18 408,237 4,082 W12 10 47 416,586 4,166 L13 95 12 412,400 4,124 W14 84 29 420,834 4,208 W15 84 10 429,441 4,294 W16 58 87 438,225 4,382 L17 2 92 433,823 4,338 L18 87 82 429,464 4,295 L19 9 18 425,150 4,251 W20 76 84 433,845 4,338 L21 92 70 429,487 4,295 L22 49 76 425,172 4,252 L23 4 94 420,900 4,209 L24 35 22 416,671 4,167 W25 95 16 425,193 4,252 W26 36 47 433,889 4,339 L27 50 95 429,531 4,295 L28 2 80 425,215 4,252 L29 61 23 420,943 4,209 W30 54 6 429,552 4,296 W31 89 73 438,338 4,383 L32 67 95 433,935 4,339 L33 12 76 429,575 4,296 L34 31 1 425,260 4,253 W35 40 32 433,958 4,340 W36 55 9 442,834 4,428 W37 76 37 451,892 4,519 W38 54 21 461,136 4,611 W39 92 87 470,569 4,706 L40 5 94 465,843 4,658 L
D3
SavantGarde: Current Risk Amount In Relation To Your Total Trading Capital, In Percentage.
D4
SavantGarde: A.K.A., Batting Average, Win Percentage.
D5
SavantGarde: Sharpe Is Your Current AVG WINS / AVG LOSSES
D6
SavantGarde: Commission Cost Per Round-Trip Trade.

41 25 6 461,165 4,612 W42 23 46 470,599 4,706 L43 59 26 465,873 4,659 W44 48 31 475,403 4,754 W45 76 61 485,129 4,851 L46 73 25 480,257 4,803 W47 97 91 490,083 4,901 L48 88 84 485,162 4,852 L49 96 53 480,290 4,803 L50 2 85 475,467 4,755 L51 42 48 470,693 4,707 L52 27 13 465,966 4,660 W53 40 11 475,498 4,755 W54 24 48 485,226 4,852 L55 39 65 480,354 4,804 L56 99 25 475,530 4,755 W57 49 75 485,258 4,853 L58 97 58 480,386 4,804 L59 42 43 475,562 4,756 W60 56 84 485,291 4,853 L61 50 44 480,418 4,804 W62 84 3 490,247 4,902 W63 68 91 500,277 5,003 L64 57 82 495,254 4,953 L65 84 17 490,281 4,903 W66 98 66 500,312 5,003 L67 83 29 495,289 4,953 W68 43 23 505,422 5,054 W69 14 20 515,764 5,158 W70 80 36 526,317 5,263 W71 10 8 537,086 5,371 W72 84 31 548,077 5,481 W73 39 63 559,292 5,593 L74 76 52 553,679 5,537 L75 96 51 548,122 5,481 L76 48 26 542,621 5,426 W77 55 52 553,725 5,537 L78 24 80 548,168 5,482 L79 2 87 542,666 5,427 L80 2 88 537,219 5,372 L81 79 62 531,827 5,318 L82 70 75 526,489 5,265 L83 76 22 521,204 5,212 W84 60 60 531,869 5,319 L85 29 92 526,530 5,265 L86 51 64 521,245 5,212 L87 35 78 516,012 5,160 L88 90 37 510,832 5,108 W89 6 87 521,284 5,213 L90 15 48 516,051 5,161 L91 66 11 510,871 5,109 W92 46 13 521,324 5,213 W93 79 26 531,991 5,320 W94 83 38 542,877 5,429 W

95 26 52 553,986 5,540 L96 22 37 548,426 5,484 W97 58 7 559,648 5,596 W98 39 62 571,101 5,711 L99 34 6 565,370 5,654 W
100 100 39 576,940 5,769 W101 74 10 588,748 5,887 W102 25 38 600,797 6,008 W103 52 85 613,093 6,131 L104 37 45 606,942 6,069 W105 95 39 619,365 6,194 W106 31 58 632,042 6,320 L107 25 82 625,701 6,257 L108 39 61 619,424 6,194 L109 61 53 613,210 6,132 L110 8 14 607,058 6,071 W111 30 32 619,482 6,195 W112 52 71 632,162 6,322 L113 0 32 625,820 6,258 W114 36 42 638,630 6,386 W115 82 89 651,701 6,517 L116 68 97 645,164 6,452 L117 40 33 638,693 6,387 W118 16 58 651,766 6,518 L119 58 73 645,228 6,452 L120 5 56 638,756 6,388 L121 33 11 632,349 6,323 W122 36 79 645,292 6,453 L123 95 62 638,819 6,388 L124 81 21 632,411 6,324 W125 13 60 645,355 6,454 L126 23 23 638,881 6,389 W127 78 18 651,959 6,520 W128 0 27 665,304 6,653 W129 37 60 678,922 6,789 L130 64 71 672,113 6,721 L131 23 33 665,372 6,654 W132 12 91 678,992 6,790 L133 8 78 672,182 6,722 L134 43 68 665,440 6,654 L135 3 89 658,766 6,588 L136 70 38 652,158 6,522 W137 72 36 665,508 6,655 W138 8 53 679,130 6,791 L139 49 54 672,319 6,723 L140 59 24 665,576 6,656 W141 55 49 679,200 6,792 L142 66 64 672,388 6,724 L143 13 62 665,644 6,656 L144 67 22 658,968 6,590 W145 90 1 672,457 6,725 W146 65 95 686,222 6,862 L147 61 26 679,340 6,793 W148 47 10 693,246 6,932 W

149 17 93 707,438 7,074 L150 22 27 700,344 7,003 W151 43 17 714,681 7,147 W152 18 92 729,312 7,293 L153 92 35 721,998 7,220 W154 2 47 736,779 7,368 L155 95 15 729,392 7,294 W156 55 32 744,324 7,443 W157 1 46 759,563 7,596 L158 90 78 751,947 7,519 L159 16 3 744,408 7,444 W160 39 94 759,648 7,596 L161 32 52 752,032 7,520 L162 95 24 744,491 7,445 W163 72 69 759,733 7,597 L164 96 61 752,116 7,521 L165 48 55 744,575 7,446 L166 11 28 737,109 7,371 W167 20 5 752,200 7,522 W168 85 78 767,600 7,676 L169 49 88 759,904 7,599 L170 30 34 752,285 7,523 W171 43 69 767,687 7,677 L172 40 77 759,990 7,600 L173 39 73 752,370 7,524 L174 75 65 744,826 7,448 L175 56 26 737,358 7,374 W176 61 75 752,454 7,525 L177 20 64 744,909 7,449 L178 66 64 737,440 7,374 L179 2 31 730,046 7,300 W180 79 82 744,992 7,450 L181 50 76 737,522 7,375 L182 9 72 730,127 7,301 L183 50 100 722,805 7,228 L184 42 71 715,557 7,156 L185 24 46 708,382 7,084 L186 19 62 701,278 7,013 L187 98 60 694,245 6,942 L188 0 59 687,283 6,873 L189 76 17 680,390 6,804 W190 97 47 694,318 6,943 L191 46 86 687,355 6,874 L192 31 0 680,461 6,805 W193 95 75 694,391 6,944 L194 60 32 687,427 6,874 W195 51 20 701,499 7,015 W196 28 82 715,860 7,159 L197 86 49 708,681 7,087 L198 30 51 701,574 7,016 L199 79 88 694,539 6,945 L200 87 84 687,573 6,876 L201 66 34 680,677 6,807 W202 11 56 694,611 6,946 L

203 60 79 687,645 6,876 L204 91 62 680,749 6,807 L205 32 62 673,921 6,739 L206 80 78 667,162 6,672 L207 6 15 660,470 6,605 W208 22 47 673,990 6,740 L209 13 76 667,230 6,672 L210 31 89 660,538 6,605 L211 58 17 653,912 6,539 W212 20 95 667,298 6,673 L213 3 45 660,605 6,606 L214 77 21 653,979 6,540 W215 45 84 667,365 6,674 L216 40 14 660,672 6,607 W217 12 54 674,195 6,742 L218 44 65 667,433 6,674 L219 80 59 660,739 6,607 L220 63 55 654,112 6,541 L221 22 45 647,551 6,476 W222 91 95 660,805 6,608 L223 30 32 654,177 6,542 W224 39 16 667,568 6,676 W225 83 34 681,233 6,812 W226 92 97 695,178 6,952 L227 51 11 688,207 6,882 W228 51 73 702,295 7,023 L229 80 16 695,252 6,953 W230 2 66 709,484 7,095 L231 84 57 702,370 7,024 L232 6 30 695,326 6,953 W233 71 30 709,560 7,096 W234 84 65 724,086 7,241 L235 57 78 716,825 7,168 L236 95 99 709,637 7,096 L237 34 54 702,521 7,025 L238 84 5 695,475 6,955 W239 30 27 709,713 7,097 W240 93 12 724,242 7,242 W241 30 58 739,069 7,391 L242 1 32 731,658 7,317 W243 50 49 746,637 7,466 L244 40 98 739,151 7,392 L245 89 14 731,739 7,317 W246 37 26 746,720 7,467 W247 48 76 762,008 7,620 L248 42 53 754,367 7,544 L249 79 43 746,804 7,468 W250 35 45 762,093 7,621 W251 2 10 777,696 7,777 W252 25 75 793,619 7,936 L253 52 21 785,663 7,857 W254 90 94 801,749 8,017 L255 37 55 793,711 7,937 L256 59 19 785,754 7,858 W

257 98 61 801,842 8,018 L258 59 41 793,804 7,938 W259 16 12 810,057 8,101 W260 43 12 826,643 8,266 W261 17 7 843,569 8,436 W262 40 72 860,842 8,608 L263 7 22 852,214 8,522 W264 69 71 869,664 8,697 L265 41 21 860,948 8,609 W266 79 75 878,577 8,786 L267 70 10 869,771 8,698 W268 71 67 887,582 8,876 L269 32 5 878,686 8,787 W270 20 35 896,679 8,967 W271 99 68 915,041 9,150 L272 10 10 905,870 9,059 W273 26 73 924,421 9,244 L274 94 42 915,156 9,152 W275 51 34 933,897 9,339 W276 22 66 953,022 9,530 L277 63 71 943,472 9,435 L278 74 71 934,017 9,340 L279 37 29 924,657 9,247 W280 15 41 943,592 9,436 W281 40 54 962,916 9,629 L282 35 0 953,267 9,533 W283 0 7 972,789 9,728 W284 73 10 992,711 9,927 W285 35 47 1,013,042 10,130 L286 48 54 1,002,891 10,029 L287 26 91 992,842 9,928 L288 85 100 982,894 9,829 L289 66 23 973,045 9,730 W290 20 42 992,972 9,930 W291 66 5 1,013,308 10,133 W292 68 51 1,034,061 10,341 L293 58 72 1,023,700 10,237 L294 45 3 1,013,443 10,134 W295 92 36 1,034,199 10,342 W296 69 8 1,055,380 10,554 W297 93 27 1,076,995 10,770 W298 41 61 1,099,054 10,991 L299 30 92 1,088,043 10,880 L300 45 11 1,077,143 10,771 W301 68 6 1,099,204 10,992 W302 74 75 1,121,718 11,217 L303 51 37 1,110,481 11,105 W304 20 46 1,133,226 11,332 L305 7 16 1,121,873 11,219 W306 63 78 1,144,852 11,449 L307 23 73 1,133,383 11,334 L308 32 3 1,122,029 11,220 W309 39 86 1,145,011 11,450 L310 97 14 1,133,541 11,335 W

311 51 96 1,156,759 11,568 L312 38 32 1,145,171 11,452 W313 3 64 1,168,627 11,686 L314 37 6 1,156,921 11,569 W315 19 94 1,180,618 11,806 L316 26 69 1,168,791 11,688 L317 22 37 1,157,084 11,571 W318 90 63 1,180,784 11,808 L319 27 26 1,168,956 11,690 W320 8 22 1,192,899 11,929 W321 83 37 1,217,334 12,173 W322 61 92 1,242,269 12,423 L323 26 43 1,229,827 12,298 W324 38 6 1,255,018 12,550 W325 29 9 1,280,726 12,807 W326 37 28 1,306,961 13,070 W327 8 48 1,333,733 13,337 L328 7 66 1,320,376 13,204 L329 28 13 1,307,152 13,072 W330 57 50 1,333,929 13,339 L331 72 65 1,320,570 13,206 L332 41 57 1,307,344 13,073 L333 79 39 1,294,251 12,943 W334 88 63 1,320,763 13,208 L335 72 97 1,307,535 13,075 L336 58 60 1,294,440 12,944 L337 26 92 1,281,475 12,815 L338 83 23 1,268,641 12,686 W339 75 86 1,294,628 12,946 L340 44 67 1,281,661 12,817 L341 70 33 1,268,825 12,688 W342 38 54 1,294,816 12,948 L343 44 9 1,281,848 12,818 W344 20 18 1,308,105 13,081 W345 39 16 1,334,902 13,349 W346 48 95 1,362,247 13,622 L347 57 20 1,348,605 13,486 W348 59 68 1,376,231 13,762 L349 46 32 1,362,449 13,624 W350 28 28 1,390,359 13,904 W351 76 16 1,418,841 14,188 W352 81 11 1,447,907 14,479 W353 4 88 1,477,570 14,776 L354 36 30 1,462,774 14,628 W355 31 33 1,492,741 14,927 W356 92 45 1,523,322 15,233 L357 96 43 1,508,069 15,081 W358 78 41 1,538,964 15,390 W359 24 71 1,570,493 15,705 L360 56 81 1,554,768 15,548 L361 90 4 1,539,200 15,392 W362 28 72 1,570,734 15,707 L363 90 64 1,555,007 15,550 L364 21 7 1,539,436 15,394 W

365 46 54 1,570,975 15,710 L366 54 41 1,555,245 15,552 W367 51 28 1,587,108 15,871 W368 21 18 1,619,623 16,196 W369 54 41 1,652,806 16,528 W370 71 91 1,686,668 16,867 L371 90 5 1,669,782 16,698 W372 26 14 1,703,992 17,040 W373 5 55 1,738,904 17,389 L374 75 9 1,721,495 17,215 W375 74 59 1,756,766 17,568 L376 58 81 1,739,178 17,392 L377 36 21 1,721,766 17,218 W378 9 97 1,757,042 17,570 L379 2 62 1,739,452 17,395 L380 33 60 1,722,037 17,220 L381 26 32 1,704,797 17,048 W382 5 75 1,739,725 17,397 L383 5 9 1,722,308 17,223 W384 23 42 1,757,595 17,576 W385 80 89 1,793,606 17,936 L386 4 88 1,775,650 17,757 L387 55 57 1,757,874 17,579 L388 9 43 1,740,275 17,403 W389 68 77 1,775,930 17,759 L390 20 36 1,758,151 17,582 W391 21 83 1,794,173 17,942 L392 100 20 1,776,211 17,762 W393 44 69 1,812,604 18,126 L394 31 16 1,794,458 17,945 W395 12 50 1,831,224 18,312 L396 12 73 1,812,892 18,129 L397 28 59 1,794,743 17,947 L398 65 29 1,776,776 17,768 W399 46 43 1,813,179 18,132 W400 59 39 1,850,330 18,503 W401 51 62 1,888,241 18,882 L402 18 48 1,869,339 18,693 L403 13 98 1,850,626 18,506 L404 0 85 1,832,099 18,321 L405 13 29 1,813,758 18,138 W406 80 72 1,850,920 18,509 L407 99 55 1,832,391 18,324 L408 31 76 1,814,047 18,140 L409 11 23 1,795,887 17,959 W410 78 8 1,832,682 18,327 W411 73 78 1,870,232 18,702 L412 56 75 1,851,510 18,515 L413 14 71 1,832,975 18,330 L414 94 8 1,814,625 18,146 W415 87 10 1,851,805 18,518 W416 7 44 1,889,747 18,897 W417 40 57 1,928,467 19,285 L418 25 53 1,909,162 19,092 L

419 43 99 1,890,051 18,901 L420 15 44 1,871,130 18,711 W421 33 70 1,909,468 19,095 L422 64 55 1,890,354 18,904 L423 71 1 1,871,430 18,714 W424 30 78 1,909,774 19,098 L425 99 6 1,890,657 18,907 W426 8 41 1,929,395 19,294 W427 7 56 1,968,928 19,689 L428 70 87 1,949,218 19,492 L429 2 18 1,929,706 19,297 W430 41 85 1,969,245 19,692 L431 43 26 1,949,533 19,495 W432 16 96 1,989,478 19,895 L433 93 2 1,969,563 19,696 W434 47 76 2,009,919 20,099 L435 73 75 1,989,800 19,898 L436 88 3 1,969,882 19,699 W437 52 77 2,010,245 20,102 L438 85 42 1,990,122 19,901 W439 65 78 2,030,900 20,309 L440 25 72 2,010,571 20,106 L441 0 72 1,990,445 19,904 L442 93 25 1,970,521 19,705 W443 69 11 2,010,896 20,109 W444 82 35 2,052,100 20,521 W445 16 68 2,094,148 20,941 L446 40 25 2,073,186 20,732 W447 14 21 2,115,667 21,157 W448 47 7 2,159,018 21,590 W449 85 25 2,203,258 22,033 W450 97 20 2,248,405 22,484 W451 43 82 2,294,477 22,945 L452 60 60 2,271,512 22,715 L453 45 12 2,248,777 22,488 W454 65 99 2,294,857 22,949 L455 7 61 2,271,888 22,719 L456 47 86 2,249,149 22,491 L457 71 60 2,226,638 22,266 L458 8 30 2,204,352 22,044 W459 14 65 2,249,521 22,495 L460 12 4 2,227,006 22,270 W461 75 44 2,272,639 22,726 W462 84 38 2,319,208 23,192 W463 6 58 2,366,732 23,667 L464 96 63 2,343,045 23,430 L465 59 10 2,319,594 23,196 W466 91 10 2,367,126 23,671 W467 99 44 2,415,632 24,156 W468 19 66 2,465,132 24,651 L469 77 77 2,440,461 24,405 L470 69 19 2,416,037 24,160 W471 55 69 2,465,545 24,655 L472 38 18 2,440,870 24,409 W

473 82 44 2,490,888 24,909 W474 64 61 2,541,931 25,419 L475 67 72 2,516,492 25,165 L476 96 86 2,491,307 24,913 L477 1 20 2,466,374 24,664 W478 43 26 2,516,914 25,169 W479 80 17 2,568,491 25,685 W480 44 77 2,621,125 26,211 L481 70 96 2,594,894 25,949 L482 36 99 2,568,925 25,689 L483 86 58 2,543,216 25,432 L484 8 15 2,517,763 25,178 W485 8 63 2,569,358 25,694 L486 68 13 2,543,644 25,436 W487 47 55 2,595,769 25,958 L488 43 27 2,569,791 25,698 W489 97 76 2,622,452 26,225 L490 64 49 2,596,207 25,962 L491 20 4 2,570,225 25,702 W492 13 8 2,622,895 26,229 W493 99 31 2,676,644 26,766 W494 91 96 2,731,495 27,315 L495 7 34 2,704,160 27,042 W496 85 75 2,759,576 27,596 L497 93 78 2,731,960 27,320 L498 44 2 2,704,620 27,046 W499 7 17 2,760,045 27,600 W500 41 27 2,816,606 28,166 W
2,874,346

* Each Time You Hit F9, It Will Give You Another 500-Trade Random Sample Of What You Could Expect (Performance Wise) Based On The
Parameters You Entered. The Concept Is Based On Van Tharpe's Theory Of Position-Sizing. Basically, Every Time Your Account Grows(Or Draw Downs) You Risk The Same % Of Capital On Each Trade. I Believe That If You Do Not Know How To Properly Position Size EachAnd Every Trade, You Stand Little Chance To Succeed. It Is That Important! His Book Is Called, "Trading Your Way to Financial Freedom".
1 2 3 4 5 6 7 8 91
01
11
21
31
41
51
61
71
81
92
02
12
22
32
42
52
62
72
82
93
03
13
23
33
43
53
63
73
83
94
04
14
24
34
44
54
64
74
84
95
05
15
25
35
45
55
65
75
85
96
06
16
26
36
46
56
66
76
86
97
07
17
27
37
47
57
67
77
87
98
08
18
28
38
48
58
68
78
88
99
09
19
29
39
49
59
69
79
89
91
00
10
11
02
10
31
04
10
51
06
10
71
08
10
91
10
11
11
12
11
31
14
11
51
16
11
71
18
11
91
20
12
11
22
12
31
24
12
51
26
12
71
28
12
91
30
13
11
32
13
31
34
13
51
36
13
71
38
13
91
40
14
11
42
14
31
44
14
51
46
14
71
48
14
91
50
15
11
52
15
31
54
15
51
56
15
71
58
15
91
60
16
11
62
16
31
64
16
51
66
16
71
68
16
91
70
17
11
72
17
31
74
17
51
76
17
71
78
17
91
80
18
11
82
18
31
84
18
51
86
18
71
88
18
91
90
19
11
92
19
31
94
19
51
96
19
71
98
19
92
00
20
12
02
20
32
04
20
52
06
20
72
08
20
92
10
21
12
12
21
32
14
21
52
16
21
72
18
21
92
20
22
12
22
22
32
24
22
52
26
22
72
28
22
92
30
23
12
32
23
32
34
23
52
36
23
72
38
23
92
40
24
12
42
24
32
44
24
52
46
24
72
48
24
92
50
25
12
52
25
32
54
25
52
56
25
72
58
25
92
60
26
12
62
26
32
64
26
52
66
26
72
68
26
92
70
27
12
72
27
32
74
27
52
76
27
72
78
27
92
80
28
12
82
28
32
84
28
52
86
28
72
88
28
92
90
29
12
92
29
32
94
29
52
96
29
72
98
29
93
00
30
13
02
30
33
04
30
53
06
30
73
08
30
93
10
31
13
12
31
33
14
31
53
16
31
73
18
31
93
20
32
13
22
32
33
24
32
53
26
32
73
28
32
93
30
33
13
32
33
33
34
33
53
36
33
73
38
33
93
40
34
13
42
34
33
44
34
53
46
34
73
48
34
93
50
35
13
52
35
33
54
35
53
56
35
73
58
35
93
60
36
13
62
36
33
64
36
53
66
36
73
68
36
93
70
37
13
72
37
33
74
37
53
76
37
73
78
37
93
80
38
13
82
38
33
84
38
53
86
38
73
88
38
93
90
39
13
92
39
33
94
39
53
96
39
73
98
39
94
00
40
14
02
40
34
04
40
54
06
40
74
08
40
94
10
41
14
12
41
34
14
41
54
16
41
74
18
41
94
20
42
14
22
42
34
24
42
54
26
42
74
28
42
94
30
43
14
32
43
34
34
43
54
36
43
74
38
43
94
40
44
14
42
44
34
44
44
54
46
44
74
48
44
94
50
45
14
52
45
34
54
45
54
56
45
74
58
45
94
60
46
14
62
46
34
64
46
54
66
46
74
68
46
94
70
47
14
72
47
34
74
47
54
76
47
74
78
47
94
80
48
14
82
48
34
84
48
54
86
48
74
88
48
94
90
49
14
92
49
34
94
49
54
96
49
74
98
49
95
00
50
1
0
20000
40000
60000
80000
100000
120000
140000
160000
180000
200000
Capital Variations (Rs)
No. of Trades
M O N T H L Y P E R F O R M A N C E T R A C K I N G 1) All GREY Shaded Boxes Need To Be Manually Calculated Each Month And Filled Out (Below)
2) All WHITE Boxes Use Formulas And Will Populate Automatically. Please Do Not Type In Them.
3)
4) Little Red Triangles In The Corner Of Various Boxes Give Instructions And/Or Explanations (Scroll Over Them)
Gross ò ò
MONTH P & L Expenses Yield Net P & L Avg Rs Win Avg Rs Loss2011 January Rs 0
February Rs 0
March Rs 0
April Rs 0
May Rs 0
June Rs 0
July Rs 0
August Rs 0
September Rs 0
October Rs 0
November Rs 0
December Rs 02012 January Rs 0
February Rs 0
March Rs 0
April Rs 0
May Rs 0
June Rs 0
July Rs 0
August Rs 0
September Rs 0
October Rs 0
November Rs 0
December Rs 0
TOTAL / AVG Rs 0 Rs 0 Rs 0 Rs 0 Rs 0 Rs 0
Use Minus ( - ) Sign For The Ttwo Columns With Red ò Arrows When Inputting Figures
Janu
ary
Febr
uary
Mar
chApr
ilMay
June Ju
ly
Augus
t
Sept
embe
r
Octob
er
Novem
ber
Decem
ber
Janu
ary
Febr
uary
Mar
chApr
ilMay
June Ju
ly
Augus
t
Sept
embe
r
Octob
er
Novem
ber
Decem
ber
Rs 0
Rs 1
Rs 1
Rs 0 Rs 0 Rs 0 Rs 0 Rs 0 Rs 0 Rs 0 Rs 0 Rs 0 Rs 0 Rs 0 Rs 0 Rs 0 Rs 0 Rs 0 Rs 0 Rs 0 Rs 0 Rs 0 Rs 0 Rs 0 Rs 0 Rs 0 Rs 0
NET Profit/Loss, 2011 - Present
G34
SavantGarde: ADD ENTIRE COLUMN ( G ), THEN DIVIDE BY NUMBER OF TOTAL MONTHS TRADED TO DATE.
H34
SavantGarde: ADD ENTIRE COLUMN ( H ), THEN DIVIDE BY NUMBER OF TOTAL MONTHS TRADED TO DATE.

* Trendline Is Average Of Each Prior (3) Trading Periods, And Can Be Changed By Right-Clicking On The T
Janu
ary
Febr
uary
Mar
chApr
ilMay
June Ju
ly
Augus
t
Sept
embe
r
Octob
er
Novem
ber
Decem
ber
Janu
ary
Febr
uary
Mar
chApr
ilMay
June Ju
ly
Augus
t
Sept
embe
r
Octob
er
Novem
ber
Decem
ber
Rs 0
Rs 1
Rs 1
Rs 0 Rs 0 Rs 0 Rs 0 Rs 0 Rs 0 Rs 0 Rs 0 Rs 0 Rs 0 Rs 0 Rs 0 Rs 0 Rs 0 Rs 0 Rs 0 Rs 0 Rs 0 Rs 0 Rs 0 Rs 0 Rs 0 Rs 0 Rs 0
NET Profit/Loss, 2011 - Present

M O N T H L Y P E R F O R M A N C E T R A C K I N G All GREY Shaded Boxes Need To Be Manually Calculated Each Month And Filled Out (Below)
All WHITE Boxes Use Formulas And Will Populate Automatically. Please Do Not Type In Them.
Little Red Triangles In The Corner Of Various Boxes Give Instructions And/Or Explanations (Scroll Over Them) NET
Total
Total # Win Sharpe Expectancy per Rs Avg Rs Amount
# Wins # Loss Trades % Ratio per Trade Risked Risk Risked0 #DIV/0! #DIV/0! #DIV/0! #DIV/0! Rs 0
0 #DIV/0! #DIV/0! #DIV/0! #DIV/0! Rs 0
0 #DIV/0! #DIV/0! #DIV/0! #DIV/0! Rs 0
0 #DIV/0! #DIV/0! #DIV/0! #DIV/0! Rs 0
0 #DIV/0! #DIV/0! #DIV/0! #DIV/0! Rs 0
0 #DIV/0! #DIV/0! #DIV/0! #DIV/0! Rs 0
0 #DIV/0! #DIV/0! #DIV/0! #DIV/0! Rs 0
0 #DIV/0! #DIV/0! #DIV/0! #DIV/0! Rs 0
0 #DIV/0! #DIV/0! #DIV/0! #DIV/0! Rs 0
0 #DIV/0! #DIV/0! #DIV/0! #DIV/0! Rs 0
0 #DIV/0! #DIV/0! #DIV/0! #DIV/0! Rs 0
0 #DIV/0! #DIV/0! #DIV/0! #DIV/0! Rs 0
0 #DIV/0! #DIV/0! #DIV/0! #DIV/0! Rs 0
0 #DIV/0! #DIV/0! #DIV/0! #DIV/0! Rs 0
0 #DIV/0! #DIV/0! #DIV/0! #DIV/0! Rs 0
0 #DIV/0! #DIV/0! #DIV/0! #DIV/0! Rs 0
0 #DIV/0! #DIV/0! #DIV/0! #DIV/0! Rs 0
0 #DIV/0! #DIV/0! #DIV/0! #DIV/0! Rs 0
0 #DIV/0! #DIV/0! #DIV/0! #DIV/0! Rs 0
0 #DIV/0! #DIV/0! #DIV/0! #DIV/0! Rs 0
0 #DIV/0! #DIV/0! #DIV/0! #DIV/0! Rs 0
0 #DIV/0! #DIV/0! #DIV/0! #DIV/0! Rs 0
0 #DIV/0! #DIV/0! #DIV/0! #DIV/0! Rs 0
0 #DIV/0! #DIV/0! #DIV/0! #DIV/0! Rs 0
0 0 0 #DIV/0! #DIV/0! #DIV/0! #DIV/0! Rs 0.0 Rs 0
Arrows When Inputting Figures
Janu
ary
Febr
uary
Mar
chApr
ilMay
June Ju
ly
Augus
t
Sept
embe
r
Octob
er
Novem
ber
Decem
ber
Janu
ary
Febr
uary
Mar
chApr
ilMay
June Ju
ly
Augus
t
Sept
embe
r
Octob
er
Novem
ber
Decem
ber
Rs 0
Rs 1
Rs 1
Rs 0 Rs 0 Rs 0 Rs 0 Rs 0 Rs 0 Rs 0 Rs 0 Rs 0 Rs 0 Rs 0 Rs 0 Rs 0 Rs 0 Rs 0 Rs 0 Rs 0 Rs 0 Rs 0 Rs 0 Rs 0 Rs 0 Rs 0 Rs 0
NET Profit/Loss, 2011 - Present
M9
SavantGarde: Average Wins (Divided) By Average Losses. The Higher The Ratio, Higher The Potential Profit As Long As Win % Is Not Too low. Eg. At 40% Wins, You Will Need A 1.5 Sharpe Ratio To Be In A Profitable Situation.
O9
SavantGarde: NEEDS COLUMN ( R ) TO BE INPUTED BEFORE IT CAN CALCULATE.
P9
SavantGarde: AVERAGE FOR THE MONTH. FORMULA EQUALS = AVG RISK AMOUNT ON ALL TRADES (DIVIDED) BY NUMBER OF TRADES FOR THE MONTH.
M34
SavantGarde: NEEDS ( G43 ) and ( H43 ) BEFORE THIS BOX CAN CALCULATE.
O34
SavantGarde: NEEDS (R43) TO BE INPUTED BEFORE THIS BOX CAN CALCULATE.
P34
SavantGarde: ADD ENTIRE COLUMN ( Q ), THEN DIVIDE BY NUMBER OF TOTAL MONTHS TRADED TO DATE.

* Trendline Is Average Of Each Prior (3) Trading Periods, And Can Be Changed By Right-Clicking On The Trend Line, Then Format, Then Type (tab), Then Type In Desired Moving Average.
Janu
ary
Febr
uary
Mar
chApr
ilMay
June Ju
ly
Augus
t
Sept
embe
r
Octob
er
Novem
ber
Decem
ber
Janu
ary
Febr
uary
Mar
chApr
ilMay
June Ju
ly
Augus
t
Sept
embe
r
Octob
er
Novem
ber
Decem
ber
Rs 0
Rs 1
Rs 1
Rs 0 Rs 0 Rs 0 Rs 0 Rs 0 Rs 0 Rs 0 Rs 0 Rs 0 Rs 0 Rs 0 Rs 0 Rs 0 Rs 0 Rs 0 Rs 0 Rs 0 Rs 0 Rs 0 Rs 0 Rs 0 Rs 0 Rs 0 Rs 0
NET Profit/Loss, 2011 - Present


2011 2012
Highest ( R ) Trade: WIN
Most Rs Made On A Single Trade:
Most Rs Made In A Day:
Most Rs Made In A Month (Net):
Best Monthly Batting Average:
Best Monthly Sharpe Ratio:
Consecutive Trades Won In A Row:
Biggest Consecutive Wins In Rs
Highest ( R ) Trade: LOSS
Most Rs Lost On A Single Trade:
Most Rs Lost In A Day
Consecutive Trades Lost In A Row:
Biggest Consecutive Losses In Rs
Educational Courses Attended:
Brokers I Have Used:
Months Trading Full Time:
# Trades For The Year:
Is To Keep You Humble, As Your Trading Plan Should State Just How Much You Are Able To Lose On Any Given Trade And/Or
Day. Keep Your Self HONEST And Use This Sheet To Log Pertinent Data Here To Prove To Yourself That You Are Following
Delete These Rows.
Yearly STATISTICS
& MILESTONES Notes ò
This Sheet Is Meant For Fun, But Also To Keep Tabs On Your Progress. The Green Section Is For Tracking Some Common
Goals That You May Have. (Just Type Over The Headings If You Wish To Replace Them With Others). The Peach Section
Your Plan. The Lime Coloured Section Is Miscellaneous Items That May Or May Not Be Important To You. If Not, Simply
B3
SavantGarde: Where ( R ) Is The Risk You Placed On The Trade. This Will Be Your R-Multiple. How Much Did You Make In Relation To Your R?
B8
SavantGarde: 10 TRADES OR MORE
B9
SavantGarde: 10 TRADES OR MORE
B12
SavantGarde: (2) Or More Trades
B15
SavantGarde: Where ( R ) Is The Risk You Placed On The Trade. This Will Be Your R-Multiple. How Much Did You Make In Relation To Your R?
B16
SavantGarde: Should Not Be More Than Your Original Risk Amount, Plus Any Slippage (If Occurred).
B17
SavantGarde: This Amount Should Not Be More Than What Your Trading Plan Allows For. YOU HAVE A TRADING PLAN, RIGHT?.....:)
B19
SavantGarde: Take Your Current Win % And Use The DRAWDOWN Worksheet
B20
SavantGarde: (2) Or More Trades

2013 2014 2015
Is To Keep You Humble, As Your Trading Plan Should State Just How Much You Are Able To Lose On Any Given Trade And/Or
Day. Keep Your Self HONEST And Use This Sheet To Log Pertinent Data Here To Prove To Yourself That You Are Following
Notes ò Notes ò Notes ò
This Sheet Is Meant For Fun, But Also To Keep Tabs On Your Progress. The Green Section Is For Tracking Some Common
Goals That You May Have. (Just Type Over The Headings If You Wish To Replace Them With Others). The Peach Section
Section Is Miscellaneous Items That May Or May Not Be Important To You. If Not, Simply

Notes ò

DAILY WORKSHEET Reward to Risk
Entry 1st FINAL # Price of
Date Stock Pattern ENTRY STOP ( R ) 1:1 2:1 TARGET TARGET Shares Entry Notes


Share Size Risk Amount Share Size Risk Amount
80 1.25 233 0.4383 1.20 238 0.42
87 1.15 244 0.41
91 1.10 250 0.40
95 1.05 256 0.39
100 1.00 263 0.38
105 0.95 270 0.37
111 0.90 278 0.36
118 0.85 286 0.35
125 0.80 294 0.34
133 0.75 303 0.33
143 0.70 313 0.32
154 0.65 323 0.31
156 0.64 333 0.30
159 0.63 345 0.29
161 0.62 357 0.28
164 0.61 370 0.27
167 0.60 385 0.26
169 0.59 400 0.25
172 0.58 417 0.24
175 0.57 435 0.23
179 0.56 455 0.22
182 0.55 476 0.21
185 0.54 500 0.20
189 0.53 526 0.19
192 0.52 556 0.18
196 0.51 588 0.17
200 0.50 625 0.16
204 0.49 667 0.15
208 0.48 714 0.14
213 0.47 769 0.13
217 0.46 833 0.12
222 0.45 909 0.11
227 0.44 1000 0.10
Rs 100 Risk Amount

D E M O N F I N D E RSIN #
1 2 3 4 5 6 7 8 9
FAUTLY CHART PATTERN
EXITED TOO SOON
EXITED TOO LATE
ENTERED TOO SOON
ENTERED TOO LATE
NOT IN TRADING PLAN
INCORRECT STOP PLACEMENT
WRONG SHARE SIZE
DIDN'T TAKE PLANNED TRADE
ê STOP TRADING ê
RULES:
* Place A Check-Mark In The Corresponding Box Each Time You Commit The Error.
* Determine Which Trading Error Is Outpacing The Rest; Kill That Demon As Quickly As Possible And Then Move On To The Next.
* If You Reach (10) Errors In Any Given Category; You May Have Some Serious Psychological Issues That Are Blocking Your Progress As A Consistently Profitable Trader. You Should Probably Think About Closing Your Trading Account If You Are Not Making Money By The Time The 10th Error Is Committed.
DEMONS ARE KILLED AFTER TAKING A TRADE (4) TIMES IN A ROW WITHOUT COMMITTING A SPECIFIC SIN
LEARN FROM YOUR ERRORS. IT IS THE ONLY WAY TO ACHIEVE SUCCESS
YOUR FUTURE PROFITABILITY IS COVERED UP BY YOUR PAST DEMONS

WIN % Rs Rs
60 45 0.55 0.45 7 5
Percentage Probability Of Seeing At Least (X) Consecutive Losing Trades Within A 50-Trade Period *ò 2 3 4 5 6 7 85% 100.0% 100.0% 100.0% 100.0% 100.0% 100.0% 100.0%
10% 100.0% 100.0% 100.0% 100.0% 100.0% 100.0% 100.0%15% 100.0% 100.0% 100.0% 100.0% 100.0% 100.0% 100.0%20% 100.0% 100.0% 100.0% 100.0% 100.0% 100.0% 100.0%25% 100.0% 100.0% 100.0% 100.0% 100.0% 99.8% 98.9%30% 100.0% 100.0% 100.0% 100.0% 99.6% 97.7% 92.2%35% 100.0% 100.0% 100.0% 99.7% 97.1% 89.0% 75.2%40% 100.0% 100.0% 99.9% 97.6% 88.4% 71.3% 51.7%45% 100.0% 100.0% 98.9% 90.7% 71.7% 49.1% 30.3%50% 100.0% 99.8% 95.2% 76.8% 50.8% 29.2% 15.5%55% 100.0% 99.0% 86.0% 57.5% 31.3% 15.2% 7.0%60% 100.0% 95.8% 70.4% 37.7% 16.9% 7.0% 2.8%65% 99.8% 87.8% 50.9% 21.5% 7.9% 2.8% 1.0%70% 99.0% 73.1% 31.8% 10.6% 3.2% 1.0% 0.3%75% 95.8% 53.0% 16.8% 4.4% 1.1% 0.3% 0.1%80% 86.5% 32.0% 7.2% 1.5% 0.3% 0.1% 0.0%85% 67.2% 15.0% 2.4% 0.3% 0.1% 0.0% 0.0%90% 38.9% 4.7% 0.5% 0.0% 0.0% 0.0% 0.0%95% 11.5% 0.6% 0.0% 0.0% 0.0% 0.0% 0.0%
* Make Sure Your Account Can Sustain A Worst-Case Scenario (Drawdown). If Not, You May Want To Lower Your Risk Amount.
Number Of Trades
Consecutive Losing Trades
Consecutive Winning Trades
B3
SavantGarde: Enter The Total Number Of Trades Made
C3
SavantGarde: Insert The % Successful Trades Here
F3
SavantGarde: DO NOT ENTER ANYTHING IN THIS CELL
G3
SavantGarde: DO NOT ENTER ANYTHING IN THIS CELL

Probability Of Seeing At Least (X) Consecutive Losing Trades Within A 50-Trade Period *9 10 11
100.0% 100.0% 100.0%100.0% 100.0% 100.0%100.0% 100.0% 99.9%99.8% 99.1% 97.2%96.2% 90.7% 82.2%82.3% 69.1% 55.0%58.5% 42.6% 29.6%34.6% 22.0% 13.5%17.6% 9.9% 5.4%7.9% 3.9% 1.9%3.1% 1.4% 0.6%1.1% 0.4% 0.2%0.3% 0.1% 0.0%0.1% 0.0% 0.0%0.0% 0.0% 0.0%0.0% 0.0% 0.0%0.0% 0.0% 0.0%0.0% 0.0% 0.0%0.0% 0.0% 0.0%
* Make Sure Your Account Can Sustain A Worst-Case Scenario (Drawdown). If Not, You May Want To Lower Your Risk Amount.
Type In # Of Trades (B3)
And Your Current Win %
(C3) To See Results (In
White Boxes)
Related Documents