1 TRADE RESTRICTIONS AND AFRICA’S EXPORTS By Olayinka Idowu Kareem Department of Economics, University of Ibadan, Ibadan, Nigeria. Matric No.: 113675 E-mail: [email protected] A Paper to be presented at the 2009 Centre for the Studies of African Economies (CSAE) Conference in the University of Oxford, England. February, 2009

Welcome message from author
This document is posted to help you gain knowledge. Please leave a comment to let me know what you think about it! Share it to your friends and learn new things together.
Transcript
1
TRADE RESTRICTIONS AND AFRICA’S EXPORTS
By
Olayinka Idowu Kareem Department of Economics,
University of Ibadan, Ibadan, Nigeria.
Matric No.: 113675 E-mail: [email protected]
A Paper to be presented at the 2009 Centre for the Studies of African Economies (CSAE)
Conference in the University of Oxford, England.
February, 2009
2
1. The Problem
The potential of developing countries to achieve rapid and sustainable economic growth and
reduction in the level of poverty in part depend on their integration into global markets. These
potential gains from global trade could be achieved if all participating countries can limit their barriers
to trade, so as to encourage the free flow of goods and services. In reality, this is often not the case as
there are various market access barriers to some key exports of developing countries, which make it
difficult for them to take full advantage of the opportunities that abound in global trade.
In international trade theory of comparative cost advantage, countries are advised to specialize
in the production of commodities in which they have comparative cost advantage over other countries.
This will make countries to gain from international trade. African exports prior to this time (during
1950s and 1960s) have performed well in terms of the volume and number of products, while the issue
of market access barriers to their exports in the markets of their trading partners did not arise. Though,
Africa has its strength in the production of primary products that attract fewer restrictions in the
developed nations’ markets (especially in the markets of their colonial masters), continent has
however gain from trade in which the returns serve as the bulk of their foreign exchange during these
periods.
However, recently, the developed countries found it appropriate to engage in backward
integration (that is, to encourage the production of primary products for the use of the industrial sector
of their economies) that will reduce the import bills they pay to their trading partners. It is as a result
of this that the developed countries started encouraging the production of primary products especially
agricultural products, which attracted some supports and subsidies that distort international prices of
these commodities. These subsidies and supports made imports from African countries to be less
competitive coupled with the fact that these developed countries imposed restrictions on agricultural
exports access to their markets.
So far, there has been a divergence of opinions as to what really undermines Africa’s exports
in global trade. While a school of thought believes that it is the trade restrictions that hindered Africa’s
exports to developed countries and some developing countries, thereby reducing the income level and
employment rate, another argued that even if Africa’s exports are allowed free access to the developed
countries’ markets, the continent lacks the ability to produce to meet the demand due to Africa’s
supply constraints.
Some studies have been carried out on the issue of market access conditions, many of which
ascertained the extent that Africa has gained from the trade preferences granted to the continent. The
studies that modeled the actual distortions to trade due to market access restrictions focused on trade
mostly between developed and developing, i.e. North-South trade and in particular for sub-Saharan
Africa. It is against this background that this study intends to assess whether market access conditions
in developed and developing countries have any effect on Africa’s exports.

3
2.0 Review of Literature
In general market access conditions affect a broad range of sectors, which in the WTO are
subdivided into four groups: agricultural goods, textile and clothing, industrial goods and services
sectors. Different types of restrictions face items of these sectors when exported to another country.
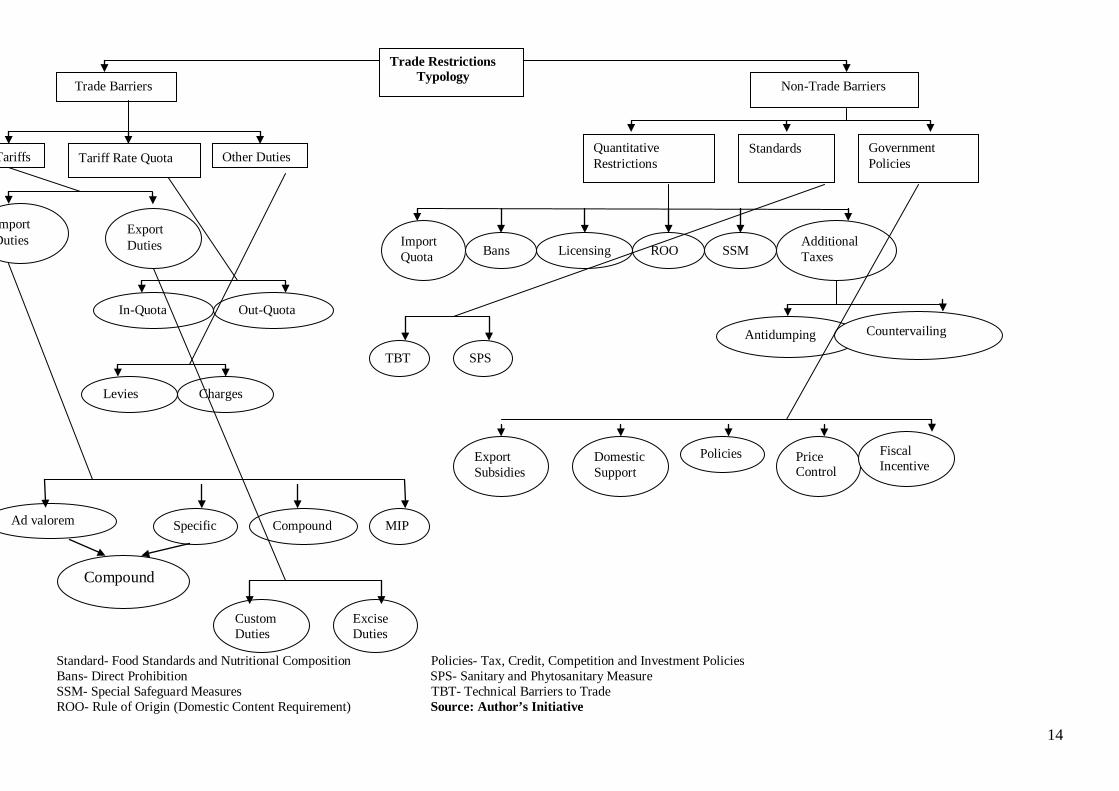
The main market access restrictions are categorized in the following way:
(a) Tariffs and other price-based border measures: These are restrictions that are imposed in
order to inhibit the access of certain commodities and also for raising of revenue. They
include: import duties, export duties, tariff quotas, levies and charges, and other border duties.
(b) Non-tariff border measures: These restrictions involve non-price measures, such as,
quantitative restrictions (import quotas, direct prohibitions, domestic content requirements,
licencing); contingency measures (antidumping, countervailing, and safeguard measure);
technical barriers to trade (TBT) (technical regulations, standards, testing and certification
procedures); sanitary and phytosanitary measures (SPS) (for food, animal and plant health and
safety).
(c) Domestic policy measures: These are measures that may restrict access of commodities if not
applied uniformly to both imported and domestic goods and services. They include: credit,
competition, tax and investment policies; fiscal incentives, such as trade-distorting export
subsidies and domestic support.
Specifically, table 1 below shows the type and extent of tariff barriers facing Africa’s exports
in the markets of Quad countries (Canada, EU, Japan and US), China and India. Since most of
Africa’s exports are mainly agricultural based products, table 1 shows the extent to which the
countries of Quad place restrictions on agricultural and non-agricultural products. In Canada, the
simple average MFN applied tariff rate is 17.3% for agricultural products against 3.7% for non-
agricultural in 2006. In addition, Canada imports little agricultural commodities compared to non-
agricultural goods; an amount representing less than 6% of its total imports. This, apart from
subjecting agricultural inputs to tariff peak, the low level of imports of this category of imports further
restricts Africa’s access to Canadian markets.
In the EU, agricultural imports also face higher tariffs than non-agricultural products. The
simple average MFN applied tariff ratio for agriculture is 15.1% as against the applied 4% for non-
agriculture in 2006. Also, non-agricultural goods imports accounted for over 94% of the total imports
in EU, leaving agriculture with less than 6%. Similarly, 90% of Japan’s imports were non-agricultural
commodities with little tariffs imposed, compared to that of agriculture where the tariffs are at peak in
the same period.
4
However, United States of America had the lowest tariffs imposed on agricultural products
with an average of less than 6%. Despite the seemingly reduction in agricultural products tariffs in the
United States, agriculture accounts for a very low percentage of their imports, and this is less than 5%.
Further, the table shows that China imposed about 16% simple average MFN applied tariff rate
on agricultural commodities that Africa has comparative advantage in and 9% on non-agricultural
goods in 2006. Thus, from the $602.7 billion total imports of China in 2005, agricultural imports
accounted for 4.3% while non-agricultural products accounted for the rest. In India, agricultural
products imports attracted high simple average MFN applied tariff up to 37.6% while that of non-
agricultural products is 16.4% in 2005. Also, about 95% of India’s total import value goes to non-
agricultural commodities as against 5% for agriculture.
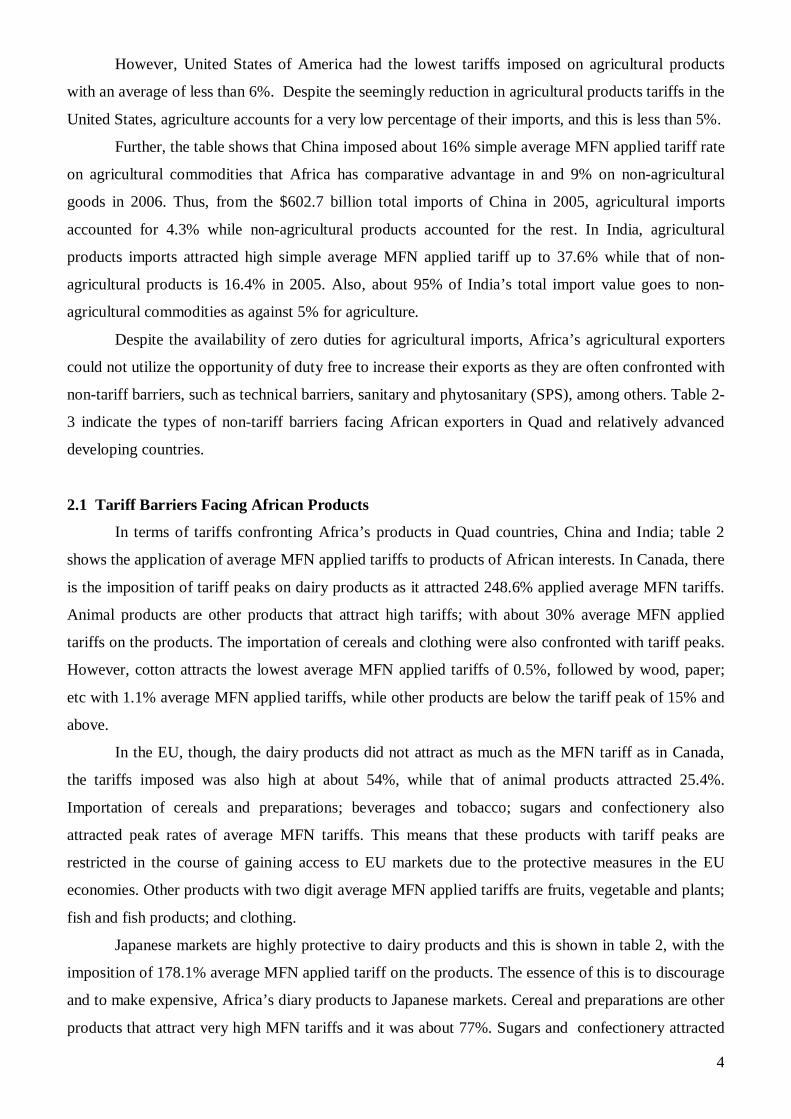
Despite the availability of zero duties for agricultural imports, Africa’s agricultural exporters
could not utilize the opportunity of duty free to increase their exports as they are often confronted with
non-tariff barriers, such as technical barriers, sanitary and phytosanitary (SPS), among others. Table 2-
3 indicate the types of non-tariff barriers facing African exporters in Quad and relatively advanced
developing countries.
2.1 Tariff Barriers Facing African Products
In terms of tariffs confronting Africa’s products in Quad countries, China and India; table 2
shows the application of average MFN applied tariffs to products of African interests. In Canada, there
is the imposition of tariff peaks on dairy products as it attracted 248.6% applied average MFN tariffs.
Animal products are other products that attract high tariffs; with about 30% average MFN applied
tariffs on the products. The importation of cereals and clothing were also confronted with tariff peaks.
However, cotton attracts the lowest average MFN applied tariffs of 0.5%, followed by wood, paper;
etc with 1.1% average MFN applied tariffs, while other products are below the tariff peak of 15% and
above.
In the EU, though, the dairy products did not attract as much as the MFN tariff as in Canada,
the tariffs imposed was also high at about 54%, while that of animal products attracted 25.4%.
Importation of cereals and preparations; beverages and tobacco; sugars and confectionery also
attracted peak rates of average MFN tariffs. This means that these products with tariff peaks are
restricted in the course of gaining access to EU markets due to the protective measures in the EU
economies. Other products with two digit average MFN applied tariffs are fruits, vegetable and plants;
fish and fish products; and clothing.
Japanese markets are highly protective to dairy products and this is shown in table 2, with the
imposition of 178.1% average MFN applied tariff on the products. The essence of this is to discourage
and to make expensive, Africa’s diary products to Japanese markets. Cereal and preparations are other
products that attract very high MFN tariffs and it was about 77%. Sugars and confectionery attracted

5
27.3% while animal products and leather, footwear, etc were imposed 15.5% and 15% MFN tariffs
respectively, beverages and tobacco as well as coffee and tea were faced with 15.5% and 16.7% MFN
applied tariffs respectively. Apart from these tariff peaks products, only oilseeds, fats and oils are
faced with two-digit average MFN applied tariffs in Japan, all other products attracted single-digit
tariffs.
The United States on the average has relatively low tariffs compared to other countries in table
2. Apart from dairy products that were faced with 25% MFN applied tariffs, sugars and confectionary
with 20.5%, and beverages and tobacco with 15.5% average MFN applied tariffs, other products have
less than tariff peaks. For instance, it is only clothing that was faced with another double digit average
MFN applied tariffs in the US, other products attracted single-digit average MFN applied tariffs.
In China, most of the products imported from Africa attracted double-digit average MFN
applied tariffs. Dairy products that attracted very high tariffs in other countries were below the tariff
peak of 15%. Animal products and fruit, vegetable and plant MFN applied tariffs were also slightly
below the tariff peak. Cereals and preparations importation in China attracted 24.4% average MFN
applied tariffs, while sugars and confectionery; beverages and tobacco as well as cotton were faced
with 27.4%, 22.7% and 22.0% average MFN applied tariffs respectively. Apart from these products,
clothing importation to China is also confronted with relatively high tariff of 16.1%. Only seven tariff
lines out of the products groups attracted single-digit average MFN applied tariffs while others are
doubled-digits.
Finally, in India, all Africa’s products imports to the Indian markets were imposed with
doubled-digit average MFN applied tariffs. Table 2 shows that 17 tariff lines out of 22 have tariff
peaks as the average MFN applied tariffs. This means that over 77% of African products exports to
India are faced with tariff peaks. Also, all African exports to Indian markets were confronted with
doubled-digit average MFN applied tariffs.
Further, it could be seen from table 2 that China and India imposed higher tariffs to Africa’s
exports than the Quad countries. Also, while the last four tariff lines attracted single-digit average
MFN applied tariffs in the Quad countries, they were confronted with doubled-digits average MFN
applied tariffs in China and India, a hypothetical case of South-South trade.

6
Table 1: Tariffs and Imports: Summary and Duty Ranges
Summary Canada EU Japan USA Total Ag Non-Ag1 Total 2 Ag Non-Ag1 Total 2 Ag Non-Ag1 Total 2 Ag Non-Ag1 2
Simple Average final bound 6.8 16.9 5.3 5.4 15.4 3.9 6.1 28.4 2.7 3.5 5.2 3.3
Simple Average MFN
Applied
2006 5.5 17.3 3.7 5.4 15.1 3.9 5.6 24.3 2.8 3.5 5.3 3.3
Trade Weighted Average 2005 3.6 16.0 2.9 3.4 12.3 2.9 4.5 27.0 1.9 2.5 4.8 2.4
Imports in Billion US$ 2005 276.6 15.3 261.3 1,395.5 82.9 1,312.6 508.0 52.0 456.0 1,433.3 63.5 1,369.8
Duty Free 57.8 56.5 31.1 28.5 35.6 55.1 32.9 47.5
Source: Author’s Compilation from WTO, ITC and UN World Tariff Profiles 2006.
1. Agricultural Products
2. Non-Agricultural products Table 1 (cont.): Tariffs and Imports: Summary and Duty Ranges
Summary China India Total Ag Non-Ag1 2 Total Ag Non-Ag1 2 Simple Average final bound 10.0 15.8 9.1 49.2 114.2 34.9 Simple Average MFN Applied 2006 9.9 15.7 9.0 2005 19.2 37.6 16.4 Trade Weighted Average 2005 4.7 15.4 4.2 2004 14.7 60.6 12.3 Imports in Billion US$ 2005 602.7 26.0 576.7 2004 102.7 5.2 97.5 Duty Free 6.0 6.0 7.3 2.5 2.4
Source: Author’s Compilation from WTO, ITC and UN World Tariff Profiles 2006

7
Table 2: Average MFN Applied Tariffs in Quad Countries, China and India to Africa’s Exports Product Group Canada EU Japan US China India Animal products 29.6 25.4 15.5 2.5 14.8 33.0 Dairy products 248.6 53.8 178.1 25.0 12.2 35.0 Fruit, vegetables, plants 3.3 11.8 12.9 5.0 14.9 31.5 Coffee, tea 10.4 6.5 16.7 4.1 14.6 56.3 Cereals & preparations 20.1 25.6 76.6 3.8 24.4 37.3 Oilseeds, fats & oils 4.9 5.9 10.8 4.6 11.0 52.5 Sugars and confectionery 5.7 32.9 27.3 20.5 27.4 48.4 Beverages & tobacco 7.2 20.2 15.5 15.9 22.7 68.9 Cotton 0.5 0.0 0.0 5.2 22.0 17.0 Other agricultural products 6.9 5.3 6.3 1.1 12.0 27.1 Fish & fish products 1.0 10.3 5.7 1.1 11.0 30.0 Minerals & metals 1.7 1.9 1.0 1.7 7.7 15.0 Petroleum 2.7 2.7 0.7 2.1 4.5 14.0 Chemicals 2.8 4.6 2.5 2.8 6.7 15.0 Wood, paper, etc. 1.1 1.1 0.9 0.4 4.9 13.5 Textiles 6.9 6.6 5.5 7.9 9.7 20.2 Clothing 17.0 11.5 9.2 11.5 16.1 22.4 Leather, footwear, etc 5.6 4.2 15.0 4.3 13.0 15.4 Non-electrical machinery 1.5 1.7 0.0 1.2 8.3 14.3 Electrical machinery 2.4 2.5 0.2 1.7 8.7 12.3 Transport equipment 5.8 4.1 0.0 3.1 11.6 24.8 Manufactures, n.e.s. 2.8 2.4 1.1 2.1 11.7 13.9 Source: WTO, ITC, United Nation, World Tariff Profile, 2006
8
Table 3: Non-Tariff Measures Incidence (%) in Quad Countries, China and India Product Group Canada EU Japan US China India Live Animals - - - - - - Meat & Edible Meat 100 100 0 100 100 100 Ornamen tal Fish 100 50 100 50 0 100 Diary Products 100 0 0 100 0 100 Leeks and other alliaceous vegetables 100 0 0 100 0 100 Vegetable Seeds 100 0 0 100 0 0 Edible Fruits & Nuts 100 0 0 100 0 100 Coffee, Tea 0 0 0 100 0 100 Cereal 100 0 0 100 0 0 Beer from Malt 0 0 0 100 0 100 Full Grains, Unsplit; Grain Splits 0 0 0 0 n.a n.a. Gum Arabic 100 0 0 0 0 0 Brooms & Brushes with Twigs or Other Vegetable Materials
0 0 0 0 0 100
Animal Fats & Oils and their Fractions 0 50 0 50 0 100 Preparation based on Sausages & Similar Products, Meat, Meat Offal/Blood
25 0 100 100 0 100
Sugar Beet 100 0 0 0 0 100 Cocoa Beans 0 0 0 0 100 0 Preparation of Tapioca & Substitutes from Starch 0 0 0 100 0 100 Machinery for the Preparation Animal or Fixed or Vegetable Fats or Oils
0 0 0 0 0 0
Ice Cream & Other Edible Ice 3 0 0 100 0 0 Fermented Beverages; Mixtures of Fermented Beverages & Non-alcoholic Beverage
0 0 0 100 0
Residues of Starch Manufactures & Similar Residues 0 0 0 0 0 0 Tobacco not Stemmed or Stripped 0 0 0 0 100 0 Source: UNCTAD TRAINS Database
9
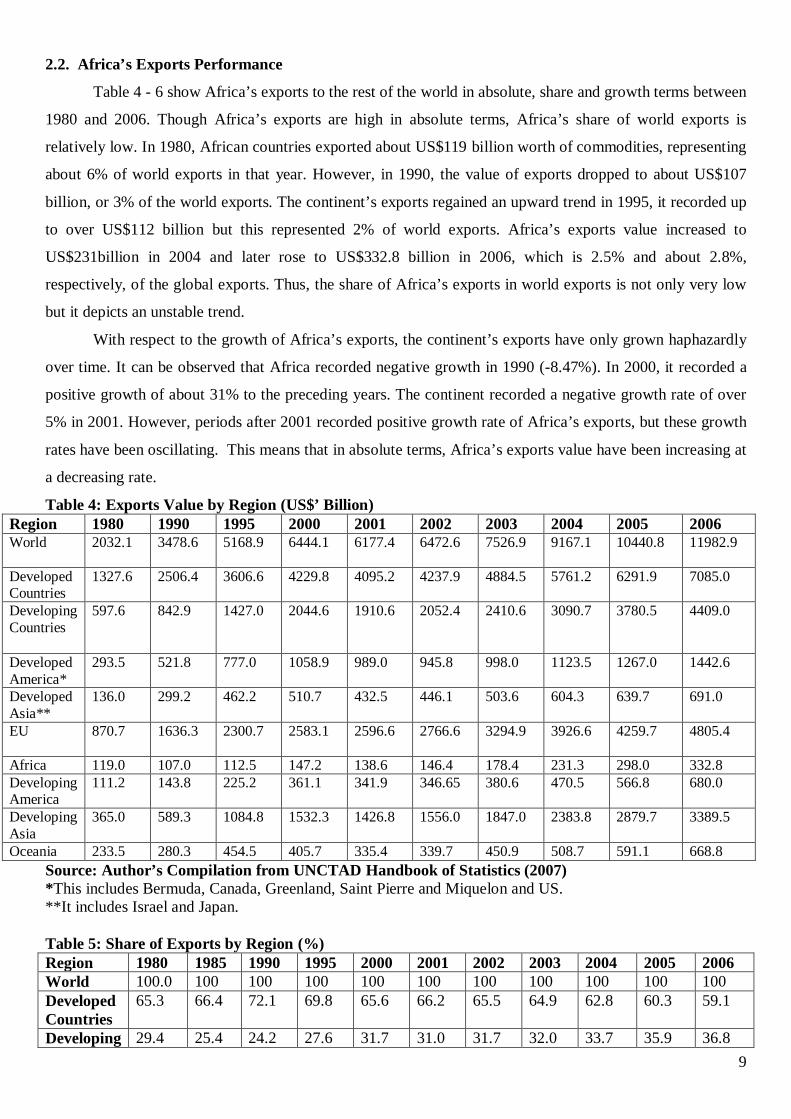
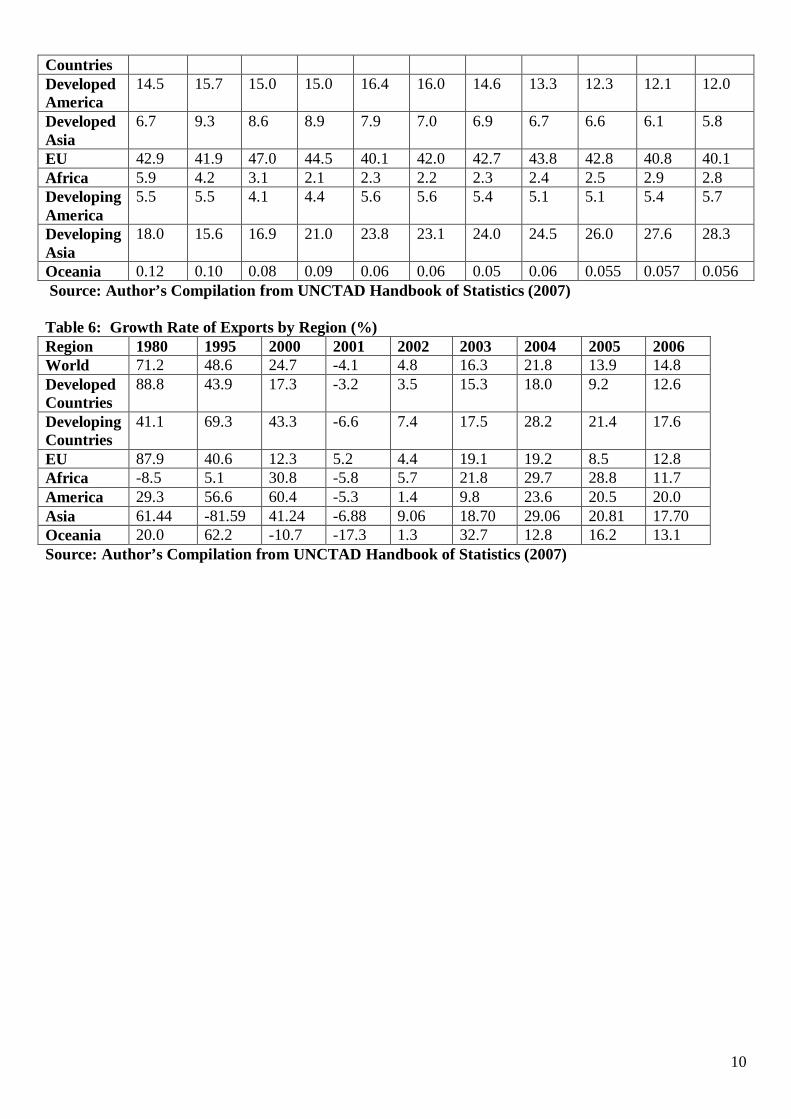
2.2. Africa’s Exports Performance
Table 4 - 6 show Africa’s exports to the rest of the world in absolute, share and growth terms between
1980 and 2006. Though Africa’s exports are high in absolute terms, Africa’s share of world exports is
relatively low. In 1980, African countries exported about US$119 billion worth of commodities, representing
about 6% of world exports in that year. However, in 1990, the value of exports dropped to about US$107
billion, or 3% of the world exports. The continent’s exports regained an upward trend in 1995, it recorded up
to over US$112 billion but this represented 2% of world exports. Africa’s exports value increased to
US$231billion in 2004 and later rose to US$332.8 billion in 2006, which is 2.5% and about 2.8%,
respectively, of the global exports. Thus, the share of Africa’s exports in world exports is not only very low
but it depicts an unstable trend.
With respect to the growth of Africa’s exports, the continent’s exports have only grown haphazardly
over time. It can be observed that Africa recorded negative growth in 1990 (-8.47%). In 2000, it recorded a
positive growth of about 31% to the preceding years. The continent recorded a negative growth rate of over
5% in 2001. However, periods after 2001 recorded positive growth rate of Africa’s exports, but these growth
rates have been oscillating. This means that in absolute terms, Africa’s exports value have been increasing at
a decreasing rate.
Table 4: Exports Value by Region (US$’ Billion) Region 1980 1990 1995 2000 2001 2002 2003 2004 2005 2006 World 2032.1 3478.6 5168.9 6444.1 6177.4 6472.6 7526.9 9167.1 10440.8 11982.9
Developed Countries
1327.6 2506.4 3606.6 4229.8 4095.2 4237.9 4884.5 5761.2 6291.9 7085.0
Developing Countries
597.6 842.9 1427.0 2044.6 1910.6 2052.4 2410.6 3090.7 3780.5 4409.0
Developed America*
293.5 521.8 777.0 1058.9 989.0 945.8 998.0 1123.5 1267.0 1442.6
Developed Asia**
136.0 299.2 462.2 510.7 432.5 446.1 503.6 604.3 639.7 691.0
EU 870.7 1636.3 2300.7 2583.1 2596.6 2766.6 3294.9 3926.6 4259.7 4805.4
Africa 119.0 107.0 112.5 147.2 138.6 146.4 178.4 231.3 298.0 332.8 Developing America
111.2 143.8 225.2 361.1 341.9 346.65 380.6 470.5 566.8 680.0
Developing Asia
365.0 589.3 1084.8 1532.3 1426.8 1556.0 1847.0 2383.8 2879.7 3389.5
Oceania 233.5 280.3 454.5 405.7 335.4 339.7 450.9 508.7 591.1 668.8 Source: Author’s Compilation from UNCTAD Handbook of Statistics (2007) *This includes Bermuda, Canada, Greenland, Saint Pierre and Miquelon and US. **It includes Israel and Japan. Table 5: Share of Exports by Region (%) Region 1980 1985 1990 1995 2000 2001 2002 2003 2004 2005 2006 World 100.0 100 100 100 100 100 100 100 100 100 100 Developed Countries
65.3 66.4 72.1 69.8 65.6 66.2 65.5 64.9 62.8 60.3 59.1
Developing 29.4 25.4 24.2 27.6 31.7 31.0 31.7 32.0 33.7 35.9 36.8
10
Countries Developed America
14.5 15.7 15.0 15.0 16.4 16.0 14.6 13.3 12.3 12.1 12.0
Developed Asia
6.7 9.3 8.6 8.9 7.9 7.0 6.9 6.7 6.6 6.1 5.8
EU 42.9 41.9 47.0 44.5 40.1 42.0 42.7 43.8 42.8 40.8 40.1 Africa 5.9 4.2 3.1 2.1 2.3 2.2 2.3 2.4 2.5 2.9 2.8 Developing America
5.5 5.5 4.1 4.4 5.6 5.6 5.4 5.1 5.1 5.4 5.7
Developing Asia
18.0 15.6 16.9 21.0 23.8 23.1 24.0 24.5 26.0 27.6 28.3
Oceania 0.12 0.10 0.08 0.09 0.06 0.06 0.05 0.06 0.055 0.057 0.056 Source: Author’s Compilation from UNCTAD Handbook of Statistics (2007) Table 6: Growth Rate of Exports by Region (%) Region 1980 1995 2000 2001 2002 2003 2004 2005 2006 World 71.2 48.6 24.7 -4.1 4.8 16.3 21.8 13.9 14.8 Developed Countries
88.8 43.9 17.3 -3.2 3.5 15.3 18.0 9.2 12.6
Developing Countries
41.1 69.3 43.3 -6.6 7.4 17.5 28.2 21.4 17.6
EU 87.9 40.6 12.3 5.2 4.4 19.1 19.2 8.5 12.8 Africa -8.5 5.1 30.8 -5.8 5.7 21.8 29.7 28.8 11.7 America 29.3 56.6 60.4 -5.3 1.4 9.8 23.6 20.5 20.0 Asia 61.44 -81.59 41.24 -6.88 9.06 18.70 29.06 20.81 17.70 Oceania 20.0 62.2 -10.7 -17.3 1.3 32.7 12.8 16.2 13.1 Source: Author’s Compilation from UNCTAD Handbook of Statistics (2007)
11
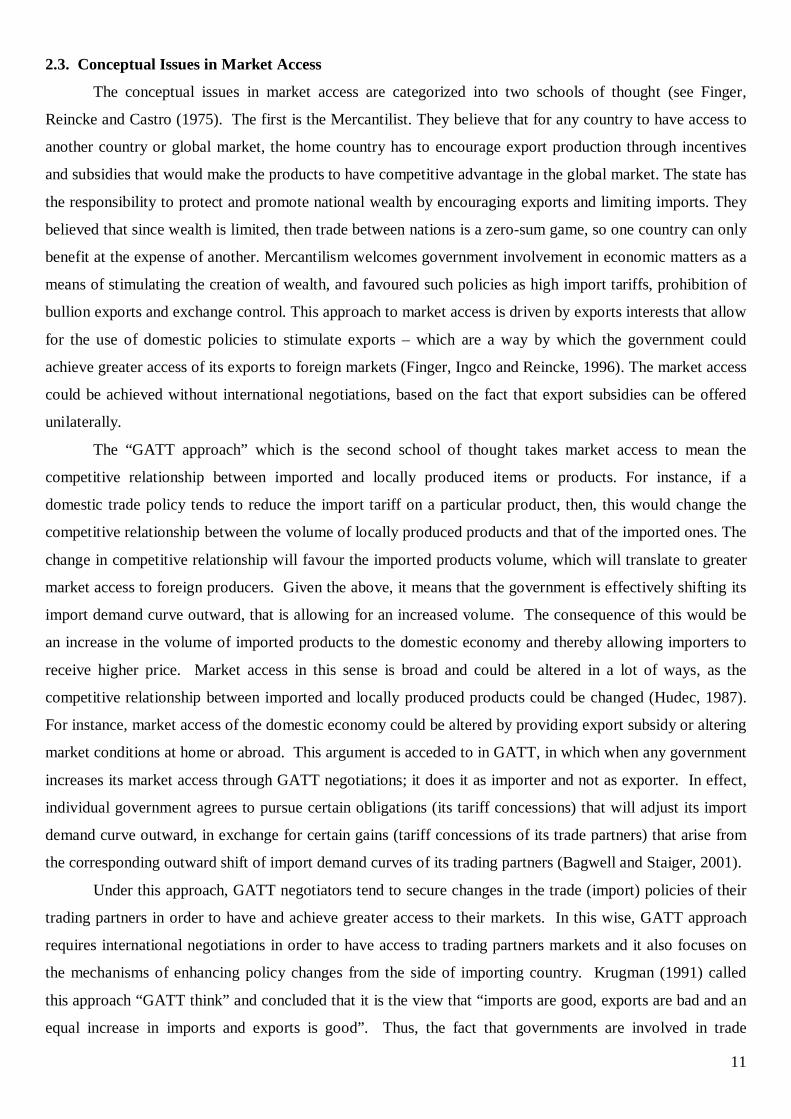
2.3. Conceptual Issues in Market Access
The conceptual issues in market access are categorized into two schools of thought (see Finger,
Reincke and Castro (1975). The first is the Mercantilist. They believe that for any country to have access to
another country or global market, the home country has to encourage export production through incentives
and subsidies that would make the products to have competitive advantage in the global market. The state has
the responsibility to protect and promote national wealth by encouraging exports and limiting imports. They
believed that since wealth is limited, then trade between nations is a zero-sum game, so one country can only
benefit at the expense of another. Mercantilism welcomes government involvement in economic matters as a
means of stimulating the creation of wealth, and favoured such policies as high import tariffs, prohibition of
bullion exports and exchange control. This approach to market access is driven by exports interests that allow
for the use of domestic policies to stimulate exports – which are a way by which the government could
achieve greater access of its exports to foreign markets (Finger, Ingco and Reincke, 1996). The market access
could be achieved without international negotiations, based on the fact that export subsidies can be offered
unilaterally.
The “GATT approach” which is the second school of thought takes market access to mean the
competitive relationship between imported and locally produced items or products. For instance, if a
domestic trade policy tends to reduce the import tariff on a particular product, then, this would change the
competitive relationship between the volume of locally produced products and that of the imported ones. The
change in competitive relationship will favour the imported products volume, which will translate to greater
market access to foreign producers. Given the above, it means that the government is effectively shifting its
import demand curve outward, that is allowing for an increased volume. The consequence of this would be
an increase in the volume of imported products to the domestic economy and thereby allowing importers to
receive higher price. Market access in this sense is broad and could be altered in a lot of ways, as the
competitive relationship between imported and locally produced products could be changed (Hudec, 1987).
For instance, market access of the domestic economy could be altered by providing export subsidy or altering
market conditions at home or abroad. This argument is acceded to in GATT, in which when any government
increases its market access through GATT negotiations; it does it as importer and not as exporter. In effect,
individual government agrees to pursue certain obligations (its tariff concessions) that will adjust its import
demand curve outward, in exchange for certain gains (tariff concessions of its trade partners) that arise from
the corresponding outward shift of import demand curves of its trading partners (Bagwell and Staiger, 2001).
Under this approach, GATT negotiators tend to secure changes in the trade (import) policies of their
trading partners in order to have and achieve greater access to their markets. In this wise, GATT approach
requires international negotiations in order to have access to trading partners markets and it also focuses on
the mechanisms of enhancing policy changes from the side of importing country. Krugman (1991) called
this approach “GATT think” and concluded that it is the view that “imports are good, exports are bad and an
equal increase in imports and exports is good”. Thus, the fact that governments are involved in trade

12
negotiations as a mechanism of improving market access for their exports suggests that the GATT approach
to market access is different from that of mercantilist forces.
Furthermore, the political economy interpretation (this shows the way the free traders and the
protectionists lobby the government through appropriate legislation that would protect their interests) of
market access has been offered by Hilman and Moser (1996), while the economic meaning (how countries
will gain by encouraging trade) of the “GATT think” is given by Bagwell and Staiger (1999). The usefulness
of the most-favoured-nations (MFN) clause if countries follow GATT think has been studied by Ethier
(1998). Apart from the studies above, many other studies have also been put forward on the implementation
of market access and the use of import targets to enhance access, which is a consequence of perceived
closure of certain markets (Irwin, 1994); Greeney (1996); Krishna and Morgan (1998); Krishna et al (1998)
and Verdier (1998).
Thus, the market access initiative under the regional trade agreement (RTA) in Africa follows directly
from that of “GATT think” approach that allows for international trade negotiations between African
countries and their trading partners. The initiative proposed the granting of concessions to African products
between African countries (South) and their trading partners (North). The reason why African countries are
seeking for market access through tariff concessions is that many countries in the continent are vulnerable
largely due to their poor trade performance, reliance on primary products and resource-based sectors and
their narrow export bases (NEPAD Document, 2001). These hindered their growth and development as they
cannot compete favourable in international trade. The problems have led to drastic reduction in their level of
income and therefore have aggravated the level of poverty in these countries. Thus, Africa’s market access
initiative is to pursue a comprehensive strategy that will be used to overcome the problem of deficiencies in
trade and the decline in the earnings from exports through a regulatory trade framework at the national, sub-
regional and regional levels. Free trade through market access of countries is said to be highly beneficial not
only to the exporting countries but also to importing countries. Protectionists oppose trade talks and they do
so in order to oppose open markets. But the fact that protectionists are against trade negotiations does not
mean that free traders should automatically embrace them (Lindsey, 2000)
In trade negotiations, countries are willing to cut down their import barriers in exchange for other
countries’ offers of equivalent reductions. Put differently, this means that liberalization at home is made
contingent upon liberalization abroad. According to the rhetoric of negotiations, removal of domestic
protectionist policies is taken as the price to be paid for market access elsewhere. Garba (2005) defines
negotiations to be a process and typically it involves discussions, haggling or bargaining on a contending
issue or subject between two or more parties with the goal of generating some agreements. She further
explains that there are three important parts to this definition, they are; the contending issues, the process of
negotiation, and the final conclusion. She argued that a multilateral trade negotiation has serious
consequences for global trade, investment, employment, growth, development and security. Thus, countries
gain access to other countries’ markets in exchange for which they give up greater access to their own. Based

13
on the general agreements on tariffs and trade (GATT) official parlance, these commitments to open one’s
own market are labeled “concessions” while other countries’ commitments to open their markets are labeled
“benefits”.
14
Standard- Food Standards and Nutritional Composition Policies- Tax, Credit, Competition and Investment Policies Bans- Direct Prohibition SPS- Sanitary and Phytosanitary Measure SSM- Special Safeguard Measures TBT- Technical Barriers to Trade ROO- Rule of Origin (Domestic Content Requirement) Source: Author’s Initiative
Import Quota Bans Licensing SSM ROO
TBT SPS
Antidumping
Additional Taxes
Export Subsidies
Domestic Support
Policies Price Control
Export Duties
In-Quota Out-Quota
Levies Charges
Specific Compound MIP
Custom Duties
Excise Duties
Compound
Trade Restrictions Typology Trade Barriers Non-Trade Barriers
Tariffs Tariff Rate Quota Other Duties Quantitative Restrictions
Standards Government Policies
Countervailing
Fiscal Incentive
Import Duties
Ad valorem
15
2.4. Review of Market Access Conditions in North and South Markets
There had been reduction in the global tariffs due to the continuous rounds of WTO and the processes
of the unilateral liberalization, focus of many policy makers are now on the non-tariff barriers (NTBs) as an
impediment to trade. Michalopoulos (1999) opined that the pervasiveness of NTBs has reduced. According to
Amjadi and Yeats (1995), due to the Uruguay round, NTBs from Organisation of Economic Cooperation and
Development (OECD) countries to African exporters have declined from around 11% of all sub-Saharan
African exports, to around 2%.
However, countries that wish to protect their domestic markets and producers, the conditions imposed
by the World Trade Organisation (WTO) system on permitted tariff levels has led to the search for the
appropriate protection instruments, which of recent there has been prevalence of product standards,
phytosanitary and environmental control and anti-dumping measures (Mold, 2005). Out of these protection
instruments, product standards are the most problematic that are used in the North markets. Wilson, Otsuki
and Sewadel (2002) discuss two categories of product standard in the North market, and they are product and
process standards. Product standards define characteristics such as quality, safety and authenticity that goods
should pose (for instance, minimum nutritional content of any food item, the maximum level of pesticide
residues, and performance requirements for items like furniture and machinery). On the other hand, process
standards entail the conditions under which the products themselves are produced, packaged or refined (for
example, technical processes used for fishing, the traceability requirements required for meat and some
horticultural products, and working conditions of labourers). Gibbons and Ponte (2005) have observed a shift
in EU from product to process standards.
The quantification of NTBs is often difficult and it depends on the definition given to the barrier to
trade. According to Mold (2005), taking a broad definition, domestic subsides to agricultural sector constitute
impediment to trade, which there is no doubt that Africa has suffered immensely from the lost of export
opportunities due to subsidization in OECD agriculture. The heterogeneous nature of subsidies and price
support regimes indicate that the effect is difficult to quantify precisely. Also, the use of voluntary export
restraints (VER) is rare and it often occurs in the North market, especially Japan (Moon, 1999).
With respect to phytosanitary regulations, Jaffee and Henson (2004) have shown that the US and EU
being Africa’s leading markets, have increased the number of detentions under phytosanitary controls and the
rise in the incidence of rejection of new standards for hazards that is formerly unregulated and (perhaps most
significantly) substantially increased capacity for inspection and enforcement.
According to Grimwade (2000), one of the often utilized NTBs in the North markets and also
increasingly used in the South markets especially China, India and Brazil, has been the imposition of anti-
dumping or counter-veiling duties on imports. Anti-dumping rules are based on the practices of developed
countries and are very complex; gathering data on the facts of the case can be a cumbersome and costly
process, especially when the country is obliged to have expensive legal experts to defend it (UNCTAD,
1998).

16
Rules of origin are another market access condition that is required in both the South and North
markets for Africa’s exports. There is a consensus that the potential gains from the market access have been
constrained because of excessive use of strict rule of origin. The rules of origin oblige the beneficiary
countries to ascertain or prove that a high percentage value-added has been created within the national
territory, thereby restricting sourcing from third countries (Mold, 2005). Estebadeordal and Suominen (2003)
estimate that the administrative costs of compliance for rules of origin correspond to a tax of between 2% and
5.7%, which could completely offset any advantage from preferential access where the preference margin is
small.
In terms of tariff lines, a significant number of lines in the manufacturing remain unbound. The share
of tariff lines bound for many of the industrial countries is above 97%, while in the developing countries
there are many cases where the scope of bindings is much more limited – especially in Asia and Africa
(WTO, 2001). The complete implementation of the Uruguay Round is estimated to result in a relatively low
bound simple average tariff of 7% across all merchandise trade and all WTO members. However, these low
figures cover significant differences across products and countries. The average bound tariff for the
manufacturing goods is 6%, while that of textiles and clothing is twice as high at 12%, and for the
agriculture, it is more than five times as high at 32%.
The high tariffs that are applicable to agriculture have resulted in large part from the process of
tariffication (replacing quantitative restrictions and other non- tariff barriers) as part of the Uruguay round
agreements on agriculture (URAA) and ceiling bindings offered by many developing countries. Tariffication
improves the transparency of market access conditions, but most observers agreed that the URAA will not
result in a significant reduction in protection in agriculture, due to the fact that quotas were converted into
high tariff rates and tariff rate quotas that restrict market access.
On the average, post-Uruguay Round bound rates are significantly higher than applied rates (7%
against 4%), with the largest difference in agriculture (32% against 25%). Thus, especially in agriculture,
there is considerable scope for applied tariff protection to increase and still be consistent with Uruguay
Round commitments. Since industrial countries generally set applied rates close to bound levels, the
difference between bound and applied rates is due mainly to such differences in developing countries. The
applied tariff rates in 2001 varied considerably across country groupings. Despite the significant progress
made in recent years, sub-Saharan Africa (SSA) countries continue to have the highest simple average tariff
protection of 17%, followed by the Middle East and North Africa (MENA) with 16.8%. Among broad
country grouping, it is notable that the average tariff of least developed countries (LDCs) is 17.9%, which is
greater than the other developing countries 14.0% and well above that of industrial countries of 5.2% (IMF
and World Bank, 2002).
The post-Uruguay Round bound simple average tariff rate for developed countries across all
commodities is 4%, while for the developing countries, it is considerably higher – 25%. The large differences
in average tariff rates persist between industrial and developing countries across all products, with
17
developing countries generally having higher tariffs. The least difference is seen in the textiles and clothing,
and the highest in agriculture. A similar pattern is evident in applied rates, except for agriculture, where
industrial countries have applied rates of 27% that are significantly greater than those of developing countries
18%.
2.5. Market Access Conditions and Africa’s Exports Recently, there has been resurgence concern regarding the application of NTBs, especially the most
recently introduced import controls by the North and South markets, such as anti-dumping measures, sanitary
and phytosanitary (SPS) measure, labour and environmental controls, and rules of origin. Evidence from the
literature demonstrates that African countries are increasingly suffering from the impact of these recently
introduced NTBs, particularly with respect to phytosanitary controls and quality standards. According to
Grimwade (2000), this will affect African countries that depend on one or two primary commodities for the
bulk of their export earnings and for such countries, the potential loss of trade through the imposition of
higher standards in the export market can run into million of dollars. This is the reason why the issue of
product standards has been paramount to African leaders in the NEPAD market access initiatives’ document
(Millennium Project, 2005).
Africa countries have been unable to participate in the setting of these standards and regulations and
this is the reason why World Bank (2003) report assumed Africa to be the standard taker because they are
forced to accept and try to meet international standards. Mold (2005) study observed that as far as less
developed countries (LDCs) are concerned, Quad countries imposed more NTBs than the South countries,
particularly African countries. In agriculture commodities, the incidence is more than twice as frequent as in
SSA countries, covering 42% of exports compared to 18.6% for SSA countries. The study noticed that
African countries do not impose NTBs to protect their agricultural sector to the same extent as other regions
– only South Asia uses NTBs with less intensity. In minerals and fuel commodities, by contrast, the
frequency of NTBs applied by Quad countries is far less, affecting only 6.5% of exports. In relative terms,
the real significant protection is to be found in manufacturing goods, where NTBs are applied to 17% of
goods (compared to less than 2% in the case of African countries). According to this study, this indicates that
NTBs in manufacturing are applied 8 times more frequently in the Quad countries than in the average SSA
countries.
The review of literature indicates that NTBs are being applied in a pragmatic pattern that unfairly
impedes exports from Africa and other developing countries. The advanced countries have apparently been
far more agile in imposing NTBs on imports than African countries than vice versa (Jaffee and Henson,
2004). African exporters of horticultural and food crops have suffered a number of serious cases of
prohibitions of their products. For instance, large scale Kenya horticultural farmers have reportedly been
discussing the possibility of relocation to neighbouring Ethiopia because of the strict trade and hygiene rules
imposed on them by the EU. The horticultural trade is currently worth around US$500 million a year to the
18
Kenyan economy. But at the start of 2005, new chemical and hygiene standards were imposed on Kenya
exporters of horticultural products (Stevens and Kennan, 2004). According to Ogunkola and Oyejide (2001)
non-tariff measures (NTMs) facing Nigeria’s exports are high and some cases, a product faces more than one
measure e.g. 80% of Nigeria’s textile exports to EU encountered up to four types of NTMs such as anti-
dumping duties, multifibres agreement (MFA) consultative agreement and MFA administrative cooperation.
3.0 The New Trade Theory
This theory evolved with the work of Krugman (1979) and Helpman and Krugman (1985), who
assumed that international trade between countries with similar factors proportion occurs mainly in
differentiated variety on the basis of increasing return to scale (increasing scale economies). These basic
principles cannot fit within the traditional neoclassical models of the Heckscher-Ohlin theory postulating the
development of inter-industry trade between countries as a result of differences in their relative factor
endowments.
Conventional trade theory claims that free trade benefits economies by increasing economies of scale
as they open up wider markets. New trade theory has probed this claim and found that it is true only if certain
strict conditions are met. For example, it requires that industries in which there are increasing returns to scale
expand after trade liberalization. If these industries merely lose sales to foreign competition, then returns to
scale go into reverse.
Similarly, conventional trade theory claims that free trade enhances technological dynamism.
Unfortunately, this is based on the casual assumption that increased competition necessarily increases
dynamism. Thus, it is well established that the relationship between competition and innovation is a lot more
complex than that.
The new trade theory is the theory that based international trade on economies of scale and imperfect
competition. The theory tends to relax the two major assumptions of the no-trade model or the Heckscher-
Ohlin (H-O) model as follows:
1. While the H-O theory assumed constant returns to scale (CRS), international trade can also be based
on increasing returns to scale (IRS).
2. Relaxing the assumption of perfect competition can also lead to new trade theory. About half of the
trade in manufactured goods among industrialized nations is based on product differentiation and
economies of scale, which are not easily reconciled with the H-O factor endowment model. Thus, to
explain intra-industry trade, we need new trade theories.
Underlying the application of the monopolistic competition model to trade is the idea that trade
increases market size. In the industries where there are economies of scale, both the variety of goods that
a country can produce and the scale of its production are constrained by the size of the market. By trading
with each other, and therefore forming an integrated world market that is bigger than any individual
national market, nations are able to loosen the constraints. Each country can specialize in producing a
19
narrower range of products than it would in the absence of trade; yet by buying goods that it does not
make from other countries, each nation can simultaneously increase the variety of goods available to its
consumers. As a result, trade offers an opportunity for mutual gain even when countries do not differ in
their resources or technology.
Suppose for example that there are two countries, each with an annual market for one million
automobiles. By trading with each other, these countries can create combined market of two million
automobiles. In this combined market, more varieties of automobiles can be produced at lower average
costs, than in either market alone (economic of scale).
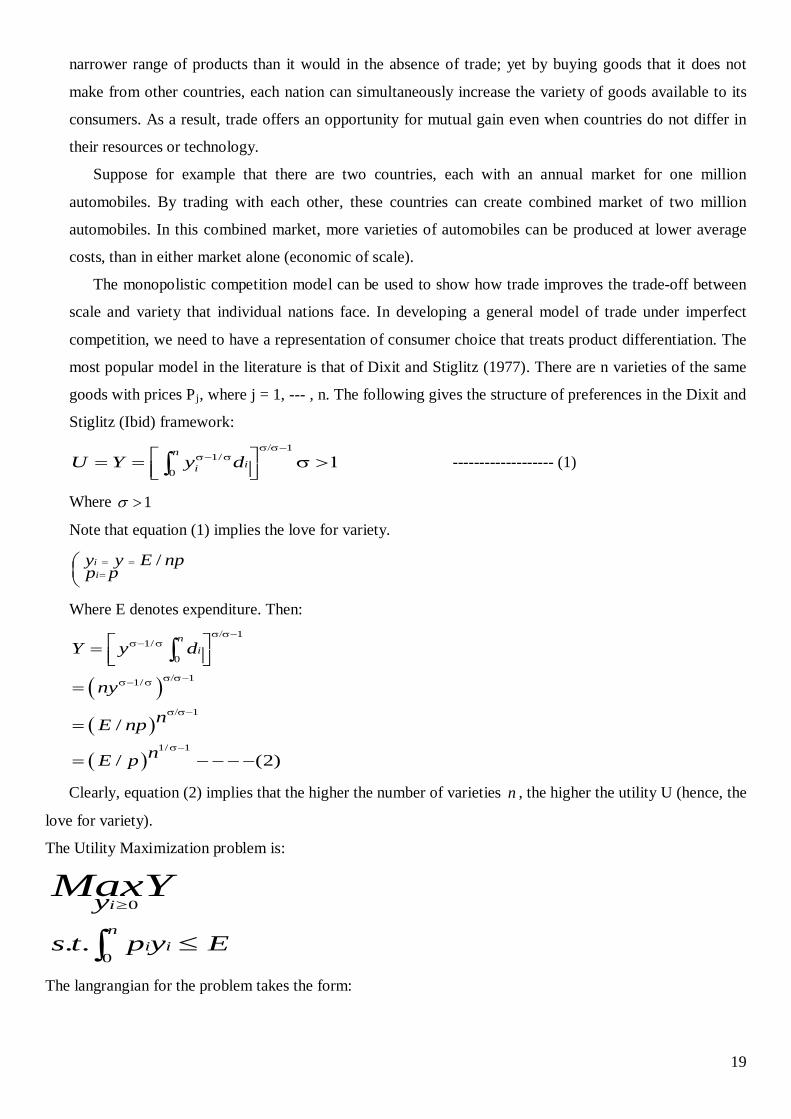
The monopolistic competition model can be used to show how trade improves the trade-off between
scale and variety that individual nations face. In developing a general model of trade under imperfect
competition, we need to have a representation of consumer choice that treats product differentiation. The
most popular model in the literature is that of Dixit and Stiglitz (1977). There are n varieties of the same
goods with prices Pj
11/
0
niiU Y y d
σ/σ−σ− σ = = σ >1 ∫
, where j = 1, --- , n. The following gives the structure of preferences in the Dixit and
Stiglitz (Ibid) framework:
------------------- (1)
Where 1σ >
Note that equation (1) implies the love for variety.
/ii
y y E npp p
= ==
Where E denotes expenditure. Then:
( )( )
( )
11/
0
11/
1
1/ 1
/
/ (2)
niY y d
ny
nE np
nE p
σ/σ−σ− σ
σ/σ−σ− σ
σ/σ−
σ−
=
=
=
= − − − −
∫
Clearly, equation (2) implies that the higher the number of varieties n , the higher the utility U (hence, the
love for variety).
The Utility Maximization problem is:
0
0. .
i
ni i
y
s t p y E
MaxY≥
≤∫
The langrangian for the problem takes the form:

20
11/
0
n nii i il y d p y E
σ/σ−σ− σ
0
= −λ − ∫ ∫
The necessary and sufficient FOC’s for this problem are
For variety i : ( )( )1) 1
1/ 1/
01) 1/
n
i i i iy d y p(σ/σ− −
σ− σ (σ− σ)−1 (σ/σ − σ− σ = λ ∫
For variety i : ( )( )1) 1
1/ 1/
01) 1/
n
i i j jy d y p(σ/σ− −
σ− σ (σ− σ)−1 (σ/σ − σ− σ = λ ∫
Taking the ratio of the FOC’s we get:
1/
i i i i
j j j j
y p y py p y p
− σ −σ
= ⇔ =
(3)
Or, using the law of logarithms,
ln ln (4)
ln( ) ln( ) ln( ) ln( ) (5)
i i
j j
i j i j
y py p
y y p p
= −σ − − − −
⇔ − = −σ − − − − −
Equation (3) represents the relative demand for any two varieties as a function of relative prices and σ . We
can now be more explicit on the parameterσ :
(a). | σ | is the (constant) elasticity of substitution between varieties – see equation (4)
(b). | σ | is also the constant price elasticity of demand – see equation (5).
Now we can manipulate equation (3) in order to get an expression for :
yi= yi (pi, E, p)
Multiply both side by pi,
i i i
j j
p y py p
1−σ
−σ=
to get:
Integrate between 0 and n
0 0
n n
i i i i i
j i
p y d p d
y p
1−σ
−σ=∫ ∫
Using the budget constraint, we can conveniently rewrite this expression as follow:
21
0
0
/
(6)
n
i ii
j
jj n
i i
p dE y
p
py E
p d
1−σ
−σ
−σ
1−σ
=
= − − − − −
∫
∫
Now, define the price index as a CES aggregate of prices:
1/1
0
n
i ip p d−σ
1−σ = ∫ ------------ (7)
Equation (6) then becomes:
( ) 1, , ji j j
py y p E p E
p
−σ
−σ= = ---------- (8)
Which is the demand for variety j.
3.1 The Model
The model for this thesis is adapted from the empirical work of Mayer and Zignago (2005) that
modeled market access in global and regional trade through a border-effect methodology. The modification
that our thesis has done to the work of Mayer and Zignago (2005) is by including regional trade agreements,
colonial affiliation and language. The theoretical underpinning the gravity type will occur in almost every
trade model with full specialization, as shown by Evenett and Keller (2003). The theoretical framework for
this model is derived from the new trade theory above that made provision for economic of scale and
imperfect market. Bergstrand (1990)1
Tinbergan (1962), Poyhonen (1963) and Linnemann (1966) were the set of researchers that first
applied gravity model to the analysis of global trade flows. The name of the model was derived from its
passing similarity to Newtonian physics, which indicates that large economic entities such as countries or
cities are said to exert pulling power on people (Migration Model) or their goods (trade models) or capital
(FDI model). The simplest form of international trade gravity model assumes that the volume of trade
between any two trading partners is an increasing function of their national incomes and populations, and a
decreasing function of the distance between them. In the model it is common to use the dummy variables to
capture geographical effects (such as signaling whether the two countries share a border, or if a country has
provides a description of the link between gravity equation and
bilateral trade patterns in a monopolistic competition framework of the new trade theory.
1 See the appendix for the specification of Bergstrand equations that gave the basis for the use of gravity model in this thesis.

22
access to the sea), cultural and historical similarities (such as if two countries share a language or were linked
by past colonial ties), regional integration (such as belonging to a free trade agreement or sharing a common
currency), as well as other macroeconomic policy variables (such as biliateral exchange rate volatility).
Anderson (1979), Bergstrand (1985) and Helpman and Krugman (1985) have derived gravity equations from
trade models based on product differentiation and increasing returns to scale. Linnemann and Verbruggen
(1991) have explicitly studied the impact of tariffs on bilateral trade patterns using a gravity model
framework. However, it was Estevadeordal and Robertson (2002) that explicitly studied the incorporation of
preferential tariff rates in a gravity model.
The monopolistic competition model of new trade theory provides the theoretical foundations to the
gravity model (Helpman, 1987 and Bergstrand, 1989). Here, the product differentiation by country of origin
approach is replaced by product differentiation among producing firms, while the empirical success of the
gravity model is considered to be supportive of the monopolistic competition explanation of intra-industry
trade.
Assume that the consumers in country i have a two-level utility function where the upper level is a
Cobb-Douglas with expenditure parameter ui, which gives rise to a fixed expenditure share out of the
income, yi
( )1
1
1 1
N jN
i ij ijj h
U a c
σσσ
σ−−
= =
= ∑ ∑
. The lower level utility function on the other hand is a constant elasticity of substitution (CES)
aggregate of differentiated varieties produced in the considered industry, with σ representing an inverse index
of product differentiation.
-------------------------------- (9)
The CES structure usually indicates the love for variety, based on the fact that the consumers are
willing to consume all the available varieties. Our study shall deal with a situation where the consumers have
different preferences over varieties depending on bias. The consumers’ preference parameter in country i for
varieties produced in j is denoted aij
ijτ
.
Given the fact that most of these varieties are produced in foreign countries, there is need to model
trade cost, that ought to be ad valorem, and incurred by the consumer when the good is transported from
country j to country i . The delivered price pij faced by consumers in i for products from j is therefore the
product of the mill price (cost of production) pj and the trade cost. The trade costs include all transaction
costs associated with the movement of goods across the space and natural borders. The demand for a
representative variety produced in j is denoted as cij,
1 1 1 1 (10)ij j ij ij j ij j ij i i iM P C a P Y Pσ σ σ ση η τ µ− − − −= =
which the demand function derived from this system
gives the bilateral total imports by country i from country j for a given industry.
where ( ) ( )σσκ
σκ
σκκκ τη
−−−−∑=1/1111
iii PaP is the “price index” in each location.

23
From equation (2), one could see that trade costs influence demand when there is a high elasticity of
substitution, σ . Based on Head and Mayer (2000), we take the ratio of mij over mii
1−σµ iii py
, country i’s imports from
itself, the term then drops and we are left with relative numbers of firms, relative preferences, and
relative costs in country i and j. 111 −−−
=
σσσσ
ii
ij
i
j
ii
ij
i
j
ii
ij
TT
PP
aa
nn
mm
(11)
In order to estimate equation (3), the model must be specified fully by adopting the supply side
features of the monopolistic competition model. Hence, the firms producing qj in country j employ lj
jj rqFl +=
workers in an IRS production function , where F is a fixed (labour) costs, and r is the inverse
productivity of firms. The profits are ( )jjjjj rqFwqp +−= , where wj
( )r
Fq j1−
=σ
is the wage rate in country j. Thus,
equilibrium output of each representative firm is, . We assume an identical technology that is
Nqq jj 1, =≡ ν and Vj is the value of production for the considered industry in country j, υj=qpjnj
j j i
i i j
n pn p
υυ
=
, from
equation (3):
------------------------ (12)
Also, the functional forms of trade cost )( ijτ and preferences (aij) have to be specified in order to get
an estimable equation. The trade costs are function of distance (dij, which proxies for transport cost) and
“border-related costs” that consist of tariffs and non-tariffs barriers (NTBs) (these include, quantitative
restrictions, administrative burden, sanitary measures, etc). The ad valorem equivalent of all border-related
costs brcij
( )1ij ij ijd brcδτ ≡ +
is given as:
------------------------------ (13)
We shall allow the border related costs to be flexible in this study, since our aim is to assess a
possible North-South divide in market access; we then need to allow for different levels of broadly defined
protection in each (North-South and South-South) direction. Also, of importance is the issue of effect of
regionalism, which we are going to control in the assessment of North markets’ access by Southern exporters.
Further, we observed some of the actual protection that is taking place between importing and exporting
countries (tariffs and NTBs). We shall include measures of market access initiatives in order to determine
the extent to which these initiatives would impact on African exports.
Generally, we assume the following structure for border-related costs that vary across country pair
and depend on the direction of the flow of a given pair:
( )( )( )1 1 1 exp ijij ij ij ij ij ijbrc t ntb E RTA NS SNη θ ϑ ϕ + ≡ + + + + + -------------- (14)

24
From this specification, tij denotes the ad valorem bilateral tariffs, ntbij is a frequency index of NTBs.
Trade Agreements, RTAij ( )ji ≠ is a dummy variable set equal to 1 when and j belongs to a regional
integration agreement. We expect θ > 0 to be the lowest of those parameters, which will be true if all
national borders impose transaction costs, with the minimum burden of those costs being between RTA
members.
The preferences have a random component eij
β
, and a systemic preference component for goods
produced in the home country, . The home bias is assumed to be mitigated by the share of a common
language.
( )( )expij ij ij ij ij ija e L E NS SNβ λ ≡ − − + + -------------------- (15)
Lij is set equal to 1 when two different countries share the same language. When Lij
β
switches from 0 to 1,
home bias changes from to β - λ .
Therefore, based on all the above, we obtain an estimable equation with respect to Africa’s trade
relations with her trading partners from the monopolistic competitive equation of Krugman (1980) with home
bias:
( )[ ] ( ) ( ) ( ) ( ) ( )
[ ]1 1
1 1 1 1 1 1
( 1)
ij j jij ij
ii i i
ijij ij
ii
m PIn In In In t In ntb
m P
dIn RTA
d
υσ β η σ σ σ σ δ
υ
σ θ η
= − − + + − − − + − − + − −
− − − +∈
----------- (16)
where ( )( )1ij ij iie eσ∈ = − −
( )[ ]( )ηβσ +−− 1 is the constant of equation (16) and it gives the border effect of the international trade for
countries that belong to the same group, the South for instance. This includes both the level of protection of
the importing country (η ) and the home bias of consumer ( β ). The coefficient RTA measures the effect that
the regional and multilateral trade agreements have on African exports.
3.2 Apriori Expectation
Theoretically, we expect an inverse relationship between relative price and Africa’s exports, due to
the problem of imported inflation that might arise in the economies of Africa’s trading partners. Relative
output is expected to have a direct relationship with Africa’s exports, that is, as output increases; there will be
more to export. Tariffs and non-tariffs are expected to have inverse relationship with Africa’s exports. This
means that as more market conditions are imposed on Africa’s exports there will be restriction in the access
25
of Africa’s exports and if eventually the exports get into the trading partners market, it cannot compete
favourably with similar products.
Same colonial affiliation is expected to enhance trade theoretically, that is, countries of the same
colonial affiliation tend to trade more with themselves. Language is a barrier to trade if the trading partners
did not speak similar language. Distance is another inhibiting factor to trade, that is the higher the distance,
the lower the trade. Involvement in trade agreements is expected to boost trade among trading partners.
3.3 Estimation Issues
The main reason for preferring panel data analysis is that the cross-section specification is very likely
to suffer from omitted bias because of the unobserved county specific effects, outlines, model uncertainty and
it completely neglects the temporal aspects (and dynamics) of foreign trade.
The generalized method of movements is adopted as the estimation technique in this thesis because it has the
potential to correct for endogeneity and heteroscedascity problems that may arise from the use of other panel
data estimation techniques. According to Greene (2004), GMM provides an estimation framework that
possesses a method of formulating models and implied estimators without making strong distribution
assumptions.
Endogeneity of the right-hand regressors is a serious problem to the ordinary least square (OLS)
estimators, because it will lead to omission of variables, measurement error, self-selection and sample
selectivity. Thus, these problems cause inconsistency in the OLS estimates and thus could be corrected by the
use of any instrumental variables estimators (Baltagi, 2001). The GMM estimator is asymptotically efficient
with an increasing set of instruments as the sample size grows attains the semi-parametric efficiency band of
the model (Conley, 1991)
3.4 Estimation Techniques
This study makes use of generalized method of moment panel data analytical methods with the test of
the panel data properties and panel granger causality. These methods allow us to estimate our regression
equations for the whole of Africa and the sub-groups.
The reason for the use of panel data technique in the gravity model is based on the several benefits of
the technique as identified by Hsiao (1985, 1986), Klevmarken (1989) and Solon (1989). It could be used to
control for individual heterogeneity, it provides more informative data, more variability, less collinearity
among the chosen variables, more degree of freedom and more efficiency. Also, panel data technique is a
better option when one intends to study the dynamics of adjustment and duration of economic states like
poverty and employment, and if these panels are long enough, they can shed light on the speed of
adjustments to economic policy changes. Panels are necessary for the estimation of inter-temporal relations,
life-cycle and intergenerational model and they can easily relate individual’s experiences and behaviour at

26
another point in time. They are better able to identify and measure effects that are simply not detectable in
cross-section or time-series data, such as in ordinary least square (OLS) method.
The basic class of specification of these models is given as:
( ) ittiitit XfY ∈+++= γδβ, (1)
This leading case involves a linear conditional mean specification, so that we have:
ittiititit XY ∈++++= γδβα (2)
Where Yit stands for the dependent variable, Xit it∈ is a K – vector of regressors and are the error terms for i
= 1, 2, …, M cross-sectional units observed for dated periods t = 1, 2, …, T. The α represents the constant
of the model, while the iδ and tγ represent the fixed and random effects, respectively. Identification
obviously requires that the β coefficients have restrictions placed upon them. They may be divided into sets
of common (cross-section and periods), cross-section specific, and period specific regressor parameters.
This panel estimation technique will enable us to estimate panel equations using linear or non-linear
squares or instrumental variables (system of equations), with correction for the fixed or random effects in
both the cross-section and period dimensions and in addition, the generalized method of moment (GMM) will
be used to estimate the specification with various system weighting matrices. It should be noted that apart
from the above basis for panel data analysis, panel equations allow us to specify equations in general form
and also permits specification of non-linear coefficients mean equations with additive effects. Panel
equations do not automatically allow for β coefficients that vary across-sections or period, but one may
create interaction variables that permit such variation.
Table 6: Variable Definitions and Sources Variable Description Source Pj/Pi This is the ratio of prices between Africa
and her trading partners (measured by CPI and also known as relative prices)
= Ratio of Prices (Rprices)
IFS
Vj/Vi The ratio of output/production between Africa and the selected trade partners (Measured by their GDP)
= Ratio of Outputs (Routputs)
IFS
Dis = distance The distance from the capital of country ί (trade partners) to the capital of country j (selected African countries). This is a measure of transport cost.
www.timeanddate.com
tij Weighted average of Ad-valorem tariffs = Tariffs UNCTAD (WITS) Lij Language of the trading countries = Language www.wikipedia.org Colij The Colonial link between country ί and
country j = Colonial www.wikipedia.org
NTB = Non-tariff barriers Non-tariff barriers measured by the number of times (known as coverage ratio) Quad countries, China and India use these to distort trade.
WTO (WITS)
RTA = regional Trade Agreements
Regional trade agreement is given the value of one when both partners belong to this arrangement, otherwise zero.
Dummy

27
Mij/Mii This is the ratio of imports from Africa in Quad countries, China and India to imports from their domestic economies
= Ratio of Imports (Rimports)
+
IMF DOT
. +
Group
The imports from these countries to themselves are calculated as: total output – exports (also known as domestic consumption of domestic outputs)
4.0 Research Findings
The panel data used in this study covers the period 1990 to 2005 for 31 African countries that cut
across the groupings and classification of African countries in this study. The groups are, Low income and
Middle income and Oil exporting countries and Non-oil exporting countries. The following table highlights
the countries in each group.
Table 7: Classification of African Countries into Groups Country
Low Income Angola, Burkina Faso, Burundi, Central African Republic, Cameroun, Chad, Congo D.R., Cote d’Ivoire, Ghana, Guinea, Kenya, Lesotho, Libya, Niger, Nigeria, Rwanda, Senegal, Sudan, Tanzania and Uganda.
Middle Income Algeria, Botwana, Cape Verde, Egypt, Garbon, Mauritius, Morocco, Namibia, South Africa, Swaziland and Tunisia.
Oil Exporters Algeria*, Angola, Congo, Gabon, Libya* and Nigeria*. Non-oil Exporters Botswana, Burkina Faso, Central Africa Republic, Cameroon,
Cote d’Ivoire, Egypt, Ghana, Guinea, Kenya, Lesotho, Mauritius, Morocco, Namibia, Niger, Rwanda, Senegal, South Africa, Swaziland, Tanzania, Tunisia and Uganda.
Note: This classification is drawn from UNCTAD Handbook of Statistics, 2006 * These countries are OPEC members.
4.1. The Results
The results of the panel-gravity models used in this study are presented below. The estimates of the
panel-gravity models are done through generalized method of moments (GMM). We have decided to
estimate the random effect due to the fact that the models for this study are gravity models that have dummy
variables of which fixed effect estimator will be inappropriate. According to Baltagi (2001) and Greene
(2003), fixed effect also known as least squares dummy variables (LSDV) suffers from a large loss of degree
of freedom, in which when it involves estimating (N – 1) extra parameters and too many dummy variables,
this will aggravate the problem of multicollinearity among the regressors. Also, the fixed effect estimator
cannot estimate the effect of any time-invariant variable like sex, race, language, religious, colonial links,
schooling etc because they will be wiped out by the Q transformation, the deviations from means
transformation. Thus, they concluded that any regression attempting to use this estimator will fail. It is on
this basis that in this thesis we have used the random effect estimator. However, before we present the GMM
panel-gravity results, it is important to know the direction of causality among these variables.

28
4.1.1. Africa – US Trade Relations
The results of the groups of countries as classified above are presented below. However, we also
present the results of all the selected countries in Africa when pooled together to determine the effect of trade
restrictions on Africa’s exports in the United States. Thus, the results shall be presented in the form of low
income versus middle-income countries, while we only estimate non-oil exporting countries because data for
oil exporting countries are inadequate for meaningful estimation.
All African Countries Result
The coefficient of the ratio of output which is also known in the literature to be the relative production
is insignificant for all African countries. Apart from being insignificant, it is positive, which signify that the
more the output of goods and services in Africa the higher the US will import her products. Though, the
coefficient of this variable is 0.0043, it means that the rate of absorption of African exports by the US is
0.4%, which is far below the 100% that is predicted by the theory and often found in the gravity equation
literature. This result contradicts what Mayer and Zignago (2004) got for all developing countries, which is,
78% for their whole sample.
Ratio of prices, which is also relative prices show an insignificant positive relationship; though the
coefficient is very small but conform with the result of Erkel-Rousse and Mirza (2002). The sign of the
relative prices does not conform with the apriori expectation of a negative relationship. The implication of
this is that as the relative price between Africa and the US increases there will be more demand for Africa’s
exports, however, the coefficient is absolutely small, though it is insignificant, but it would not add much
value to Africa exports in the US.
Tariffs, which are an important variable in trade restrictions model, does not conform with the apriori
expectation that the more tariffs are imposed, the lower the market access of any given product. What we
discovered here is that there is a significant positive relationship between tariffs imposition in the United
States and Africa’s exports. This means that as the US increase their tariff there are more African exports to
the US. Though, the coefficient of this is 0.0005 which is very small, indicates that for every 1% increase in
US tariff rate, there will be 0.05% increase in Africa’s exports. This increase in exports of countries in Africa
is attributable to the trade preference granted to African countries by the United State based on the rules of
origin. This result contradict the finding of Mayer and Zignago (2004) that found tariffs to be negative
between North and South, but positive between South and North.
The non-tariff barriers (NTB) also have similar result with the tariffs, as there is a significant positive
relationship between the imposition of NTB and Africa’s exports access to the United States. Actually, this
is contrary to the apriori expectation of a negative relationship. This means that despite the technical barriers
to trade, sanitary and phytosantiary measure safeguard measures etc that were imposed by the US, African
countries still have little access to the markets of the United States. This might be due to the trade preference
granted to Africa as said earlier and also the presence of oil exporting countries in the continent. This result
also contradicts what Mayer and Zignago (2004) got for majority of their models.
29
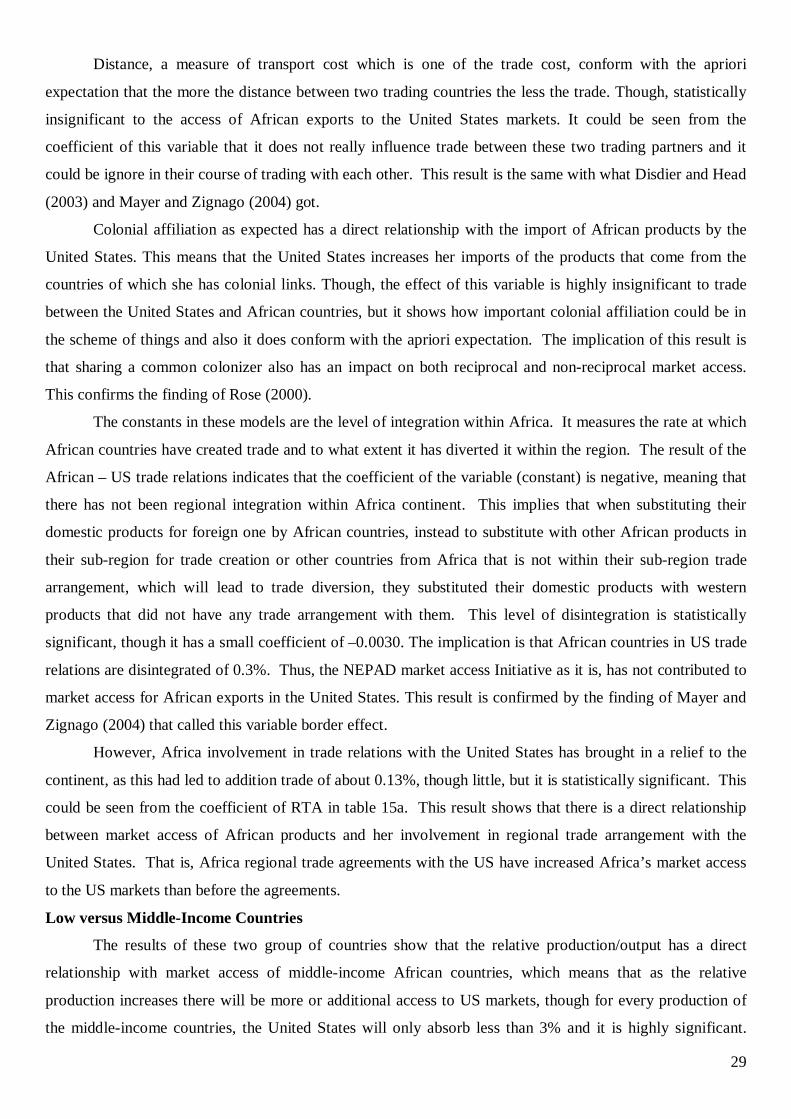
Distance, a measure of transport cost which is one of the trade cost, conform with the apriori
expectation that the more the distance between two trading countries the less the trade. Though, statistically
insignificant to the access of African exports to the United States markets. It could be seen from the
coefficient of this variable that it does not really influence trade between these two trading partners and it
could be ignore in their course of trading with each other. This result is the same with what Disdier and Head
(2003) and Mayer and Zignago (2004) got.
Colonial affiliation as expected has a direct relationship with the import of African products by the
United States. This means that the United States increases her imports of the products that come from the
countries of which she has colonial links. Though, the effect of this variable is highly insignificant to trade
between the United States and African countries, but it shows how important colonial affiliation could be in
the scheme of things and also it does conform with the apriori expectation. The implication of this result is
that sharing a common colonizer also has an impact on both reciprocal and non-reciprocal market access.
This confirms the finding of Rose (2000).
The constants in these models are the level of integration within Africa. It measures the rate at which
African countries have created trade and to what extent it has diverted it within the region. The result of the
African – US trade relations indicates that the coefficient of the variable (constant) is negative, meaning that
there has not been regional integration within Africa continent. This implies that when substituting their
domestic products for foreign one by African countries, instead to substitute with other African products in
their sub-region for trade creation or other countries from Africa that is not within their sub-region trade
arrangement, which will lead to trade diversion, they substituted their domestic products with western
products that did not have any trade arrangement with them. This level of disintegration is statistically
significant, though it has a small coefficient of –0.0030. The implication is that African countries in US trade
relations are disintegrated of 0.3%. Thus, the NEPAD market access Initiative as it is, has not contributed to
market access for African exports in the United States. This result is confirmed by the finding of Mayer and
Zignago (2004) that called this variable border effect.
However, Africa involvement in trade relations with the United States has brought in a relief to the
continent, as this had led to addition trade of about 0.13%, though little, but it is statistically significant. This
could be seen from the coefficient of RTA in table 15a. This result shows that there is a direct relationship
between market access of African products and her involvement in regional trade arrangement with the
United States. That is, Africa regional trade agreements with the US have increased Africa’s market access
to the US markets than before the agreements.
Low versus Middle-Income Countries
The results of these two group of countries show that the relative production/output has a direct
relationship with market access of middle-income African countries, which means that as the relative
production increases there will be more or additional access to US markets, though for every production of
the middle-income countries, the United States will only absorb less than 3% and it is highly significant.

30
However, the low-income group has an indirect relationship with the US markets. This means that as more
goods are produce in the low income group the US will allow less of it to gain access to its markets. This
might be due to the quality and rule of origin requirement of the US. The implication of this is that the low-
income group will continue to languish in poverty due to the reduction in their foreign exchange earning
from their trade with the US. The relative price has a direct relationship with the market access of low-
income countries. Though, the coefficient of the variable is very small and could be overlooked, despite that,
it is still statistically significant. This is not the case for the middle-income group as the relative prices has
hindered the access of their products to the United States. This means that if the relative price increases by a
unit, there will be a significant reduction of about 0.13% in their access to US markets.
High tariffs will be a significant restriction to trade in the middle-income group, while it is not with
the low income group. The reason is that the United States often give aid in form of concession to the low-
income group, which allow more of their products into their markets than the middle-income group. Thus,
for every 1% increase in the US tariff rates, there will be about 0.02% additional access to the low-income
group and 0.01% reduction in the access of the middle-income countries. We got similar result for the non-
tariff barriers (NTB). It shows that the imposition of NTB by US will restrict trade to the middle-income
group, but significantly raise the level of which the products of the low-income group enter the US markets.
The implication of the major trade restrictions is that the US has been supporting the low-income group in
Africa, so that they could use their earnings (foreign exchange) to alleviate the level of poverty in their
countries and at the same time meet the Millennium Development Goals (MDGs).
The low-income group experiences no integration within the group as show with the coefficient of
constant, which is –0.0115. This means that there has not been regional trade integration among the low-
income group and this is significant. Indicating that the low-income group has neither involved in trade
creation nor diversion. However, the involvement in regional trade agreements with the US has brought
additional market access to them and this is 0.13%. The middle-income group has experience trade creation
and diversion within the group. What this means is that their consumers have been substituting their
domestic products with products from their sub-region (trade creation) and also substitute domestic product
with foreign products that is from the countries with the regional trade agreements (trade diversion). Thus,
there is regional integration in the middle-income group. Though, their rate of integration is over 0.8%, their
engagement in the RTA has contributed a reduction of 0.25% to their access to the US markets. That is, the
middle-income group has not benefited from their engagement in regional trade agreement with the US.
Instead of getting more access to US markets, they are experiencing more restrictions of their products.
Non-Oil Exporting Countries
From the estimate of the no effect in table 15a, it could be seen that relative outputs of non-oil
exporting countries have positive relationship with imports of United States from these two group countries
(market access) and they are statistically significant. This means that the United States absorption of non-oil
31
exporting countries product is over 2%. The relative price has a significant positive relationship with imports
of non-oil exporting group by the US.
Tariffs have significant direct relationship with the market access of non-oil exporting group. This
means that the higher the tariff rates imposed on the products of non-oil exporting countries, the more their
products gain access to the markets of the United States. The rationale behind this is that, as the US impose
more taxes on the import of certain products of which Africa has comparative advantages, they (US) provide
assistance in form of aid and grants to these group of countries to cushion the effect of the additional taxes,
which increase their production capacity, and thus enhance their output and since these group of countries
have positive US absorptive capacity and with the trade agreements they signed, then more of their products
will be allow access to United States markets. The NTB also has direct effect on market access of this group
of countries exports and it is statistically significant. Both trade restriction variables have similar effects on
market access of these groups. For both restriction variables, every additional restrictions imposed with
allow access of 0.03% for non-oil exporting countries.
The constant, a measure of integration within the group, shows an inverse relationship for non oil exporting
countries. This means that the group has no trade integration within them. That is, there has been no trade
creation and diversion in the group of countries and this result is statistically significant. Thus, relief came
on their way with the engagement in regional trade agreements with the USA, therefore this has brought
about 0.01% additional access to US markets by the non oil exporting countries.
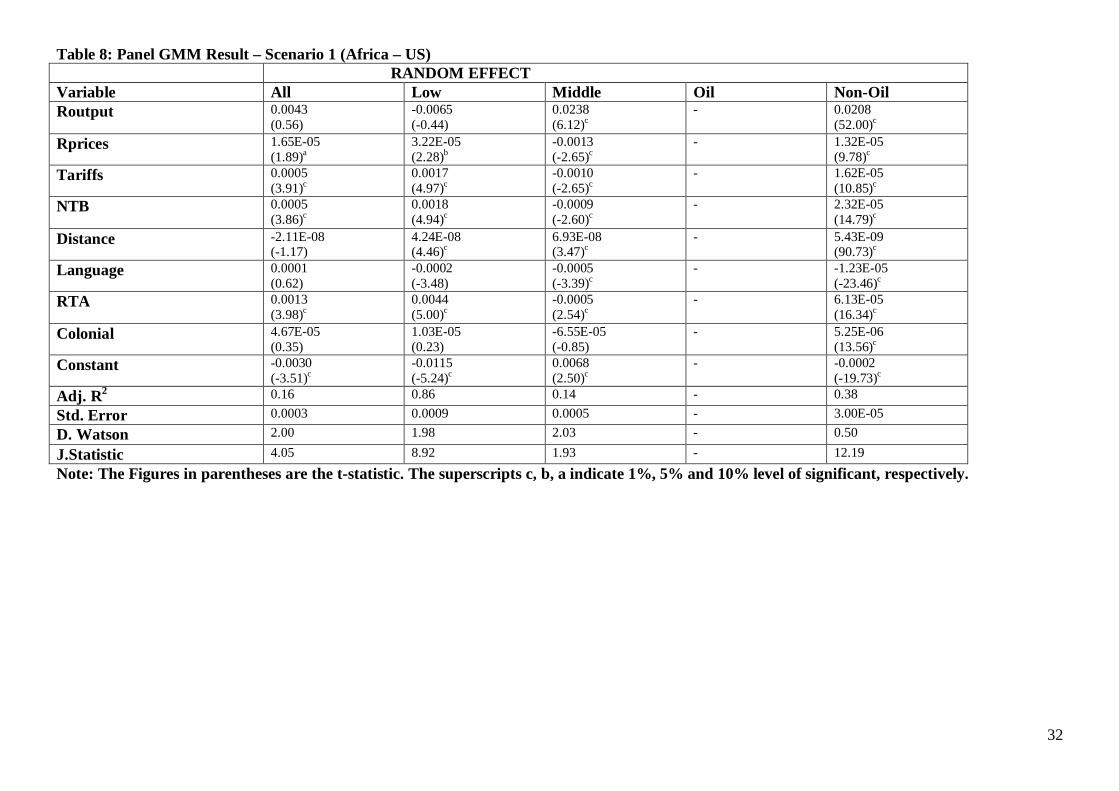
32
Table 8: Panel GMM Result – Scenario 1 (Africa – US) RANDOM EFFECT Variable All Low Middle Oil Non-Oil Routput 0.0043
(0.56) -0.0065 (-0.44)
0.0238 (6.12)
- c
0.0208 (52.00)c
Rprices 1.65E-05 (1.89)
3.22E-05 (2.28)a
-0.0013 (-2.65)b
- c
1.32E-05 (9.78)c
Tariffs 0.0005 (3.91)
0.0017 (4.97)c
-0.0010 (-2.65)c
- c
1.62E-05 (10.85)c
NTB 0.0005 (3.86)
0.0018 (4.94)c
-0.0009 (-2.60)c
- c
2.32E-05 (14.79)c
Distance -2.11E-08 (-1.17)
4.24E-08 (4.46)
6.93E-08 (3.47)c
- c
5.43E-09 (90.73)c
Language 0.0001 (0.62)
-0.0002 (-3.48)
-0.0005 (-3.39)
- c
-1.23E-05 (-23.46)c
RTA 0.0013 (3.98)
0.0044 (5.00)c
-0.0005 (2.54)c
- c
6.13E-05 (16.34)c
Colonial 4.67E-05 (0.35)
1.03E-05 (0.23)
-6.55E-05 (-0.85)
- 5.25E-06 (13.56)c
Constant -0.0030 (-3.51)
-0.0115 (-5.24)c
0.0068 (2.50)c
- c
-0.0002 (-19.73)c
Adj. R 0.16 2 0.86 0.14 - 0.38
Std. Error 0.0003 0.0009 0.0005 - 3.00E-05
D. Watson 2.00 1.98 2.03 - 0.50
J.Statistic 4.05 8.92 1.93 - 12.19
Note: The Figures in parentheses are the t-statistic. The superscripts c, b, a indicate 1%, 5% and 10% level of significant, respectively.
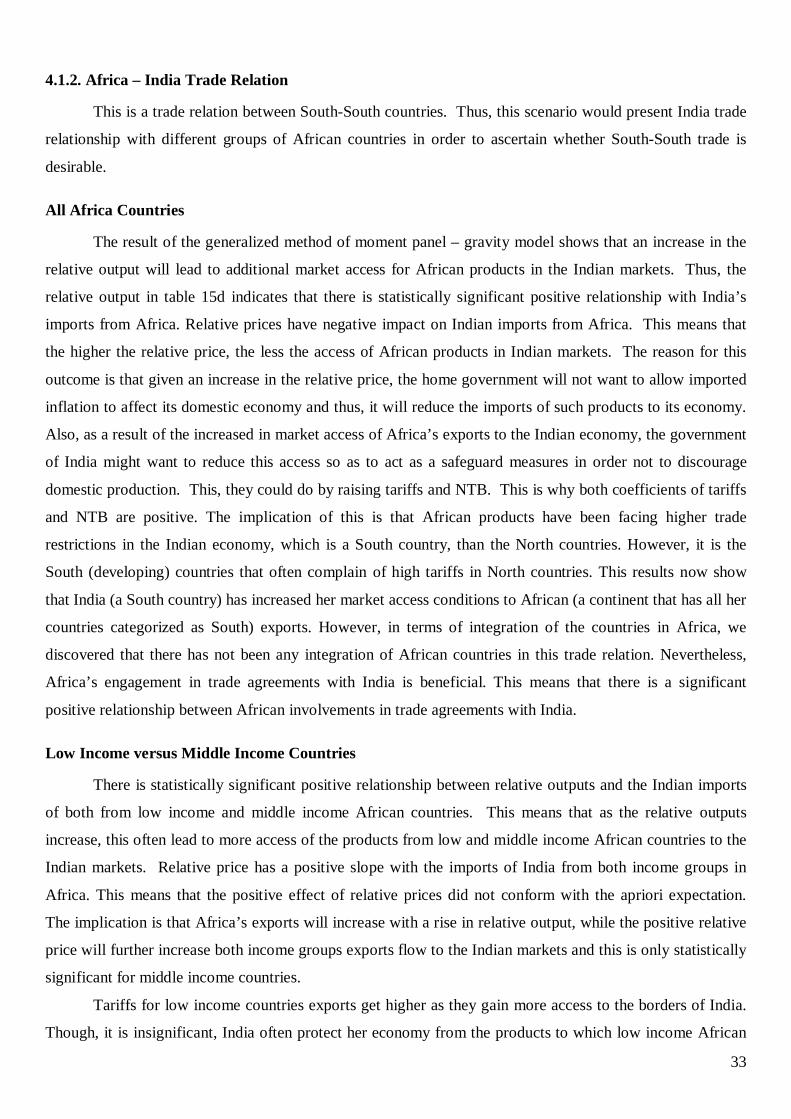
33
4.1.2. Africa – India Trade Relation
This is a trade relation between South-South countries. Thus, this scenario would present India trade
relationship with different groups of African countries in order to ascertain whether South-South trade is
desirable.
All Africa Countries
The result of the generalized method of moment panel – gravity model shows that an increase in the
relative output will lead to additional market access for African products in the Indian markets. Thus, the
relative output in table 15d indicates that there is statistically significant positive relationship with India’s
imports from Africa. Relative prices have negative impact on Indian imports from Africa. This means that
the higher the relative price, the less the access of African products in Indian markets. The reason for this
outcome is that given an increase in the relative price, the home government will not want to allow imported
inflation to affect its domestic economy and thus, it will reduce the imports of such products to its economy.
Also, as a result of the increased in market access of Africa’s exports to the Indian economy, the government
of India might want to reduce this access so as to act as a safeguard measures in order not to discourage
domestic production. This, they could do by raising tariffs and NTB. This is why both coefficients of tariffs
and NTB are positive. The implication of this is that African products have been facing higher trade
restrictions in the Indian economy, which is a South country, than the North countries. However, it is the
South (developing) countries that often complain of high tariffs in North countries. This results now show
that India (a South country) has increased her market access conditions to African (a continent that has all her
countries categorized as South) exports. However, in terms of integration of the countries in Africa, we
discovered that there has not been any integration of African countries in this trade relation. Nevertheless,
Africa’s engagement in trade agreements with India is beneficial. This means that there is a significant
positive relationship between African involvements in trade agreements with India.
Low Income versus Middle Income Countries
There is statistically significant positive relationship between relative outputs and the Indian imports
of both from low income and middle income African countries. This means that as the relative outputs
increase, this often lead to more access of the products from low and middle income African countries to the
Indian markets. Relative price has a positive slope with the imports of India from both income groups in
Africa. This means that the positive effect of relative prices did not conform with the apriori expectation.
The implication is that Africa’s exports will increase with a rise in relative output, while the positive relative
price will further increase both income groups exports flow to the Indian markets and this is only statistically
significant for middle income countries.
Tariffs for low income countries exports get higher as they gain more access to the borders of India.
Though, it is insignificant, India often protect her economy from the products to which low income African

34
countries have advantage. Also, she tend to increase her non-tariff barriers to the products of relevance in the
low income countries, meaning that there has been high market access on products relevant to the low
income countries. On the contrary, the more the products of middle income countries get to the Indian
markets the lower the tariffs imposed, but the bulk of the hindrances is in the non-tariff barriers that have
positive slope. This means that the products of the middle income countries might not have a good substitute
within the Indian economy, thus they need to allow their access to Indian markets but not without facing
stringent and rigorous non-tariff barriers, which is even acknowledged in the literature to be tougher than
tariffs.
Thus, we still have the constant coefficients of both low income and middle income groups showing that
for the trade relations between India and these two income groups, there has not been integration within
these two groups. This simply means that the border effects of this trade (trade creation and diversion) are
negative. However, their trade agreements with India have contributed to more access to India markets.
Non-Oil Exporting Countries
In table 15d, it could be seen that non-oil exporting countries in Africa have relative output to be inversely
related to India’s imports from non-oil exporting countries. This means that the higher the relative output
in non-oil exporting countries, the more the rate at which these exports have access into India markets.
This means that as the relative outputs increase, the government of India might be afraid of the influx of
such products in their markets, which might affect their domestic industries and thus lead to dumping of
these products, and then, they restrict the access of the products from Africa’s no-oil exporting countries
into their markets. The relative outputs variable has a significant positive relationship with India imports
of non- oil exporting countries products. This means that the products of non- oil exporting countries are
necessary and desirable to the consumers in the India markets. Relative price in non- oil exporting
countries are insignificantly and directly correlated with the imports of India in this two groups of
countries. This might be due to the demand of these products, in which it is highly essential in the
economy of India and of which the supply capacity of non- oil exporting countries is insufficient thereby
making the demand to surpass the supply, which invariably increases the prices.
Interestingly, non- oil exporting countries exports respond to market access conditions in India. The
exports have lower restrictions as they gain more access to Indian markets and they are significant. The
implication of these is that Indian prefer or allow the access of non- oil exporting countries products in
their markets. Thus, countries within the non- oil exporting countries in Africa have been promoting trade
among themselves. There has been improvement in non- oil exporting countries intra-trade relations.
This could be seen from the coefficients of constant in oil and non- oil exporting countries model results.
These indicate that there have been trade creation and trade diversion within these two groups of
countries. Also, the involvement and participation of these groups of countries in RTA have brought bout

35
additional trade and more access to the Indian markets. This means, that their participation in trade
agreements have been beneficial.
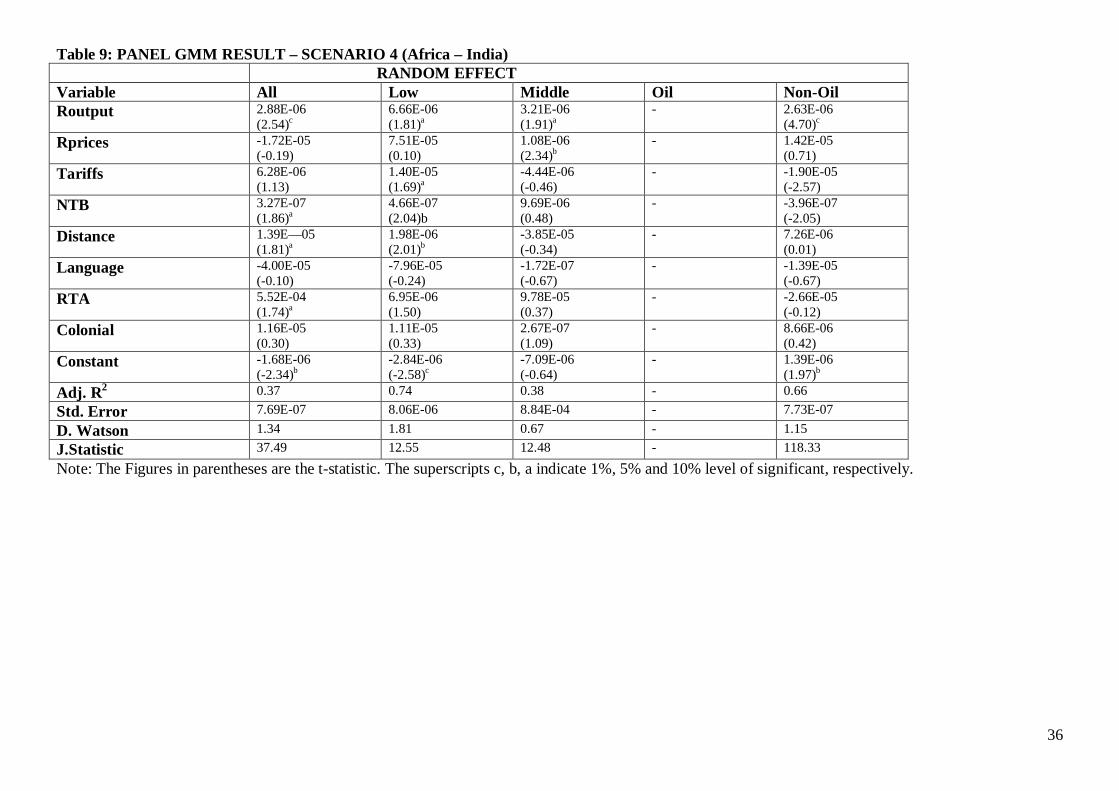
36
Table 9: PANEL GMM RESULT – SCENARIO 4 (Africa – India) RANDOM EFFECT
Variable All Low Middle Oil Non-Oil Routput 2.88E-06
(2.54)6.66E-06 (1.81)c
3.21E-06 (1.91)a
- a
2.63E-06 (4.70)c
Rprices -1.72E-05 (-0.19)
7.51E-05 (0.10)
1.08E-06 (2.34)
- b
1.42E-05 (0.71)
Tariffs 6.28E-06 (1.13)
1.40E-05 (1.69)
-4.44E-06 (-0.46) a
- -1.90E-05 (-2.57)
NTB 3.27E-07 (1.86)
4.66E-07 (2.04)b a
9.69E-06 (0.48)
- -3.96E-07 (-2.05)
Distance 1.39E—05 (1.81)
1.98E-06 (2.01)a
-3.85E-05 (-0.34) b
- 7.26E-06 (0.01)
Language -4.00E-05 (-0.10)
-7.96E-05 (-0.24)
-1.72E-07 (-0.67)
- -1.39E-05 (-0.67)
RTA 5.52E-04 (1.74)
6.95E-06 (1.50) a
9.78E-05 (0.37)
- -2.66E-05 (-0.12)
Colonial 1.16E-05 (0.30)
1.11E-05 (0.33)
2.67E-07 (1.09)
- 8.66E-06 (0.42)
Constant -1.68E-06 (-2.34)
-2.84E-06 (-2.58)b
-7.09E-06 (-0.64) c
- 1.39E-06 (1.97)b
Adj. R 0.37 2 0.74 0.38 - 0.66 Std. Error 7.69E-07 8.06E-06 8.84E-04 - 7.73E-07
D. Watson 1.34 1.81 0.67 - 1.15 J.Statistic 37.49 12.55 12.48 - 118.33
Note: The Figures in parentheses are the t-statistic. The superscripts c, b, a indicate 1%, 5% and 10% level of significant, respectively.

37
5. Conclusion
This study has shown in details the various trade restrictions that Africa’s exports are encountering in
the course of gaining access to the markets of the selected trading partners in both the North and South
countries. We have also shown empirically using both descriptive analysis and econometrics method, the
effect of these trade restrictions on Africa’s export products access to both industrialized and developing
markets. Furthermore, the directions of causality between trade restrictions and market access of products
relevant and of importance to African countries have been established.
Thus, at this juncture, it is important to note that all the objective of this study has been adequately
achieved and accomplished, that is, we have shown the effect of market access conditions on Africa’s exports
in the developed country (USA) and developing country (India).
Therefore, we conclude that African exports have not been gaining access to both industrialized and
developing countries not only because of the trade restrictions imposed on their products, but due to the fact
that Africa has low and inadequate production capacity that will enable her to meet up with the market access
allowed to her products despite the potentiality of her output gaining access to these trading partners markets.
We also conclude that products of relevance to African countries are confronted with higher trade restrictions
mostly in the developing countries than in the developed countries. This means that there are more market
access conditions in South-South trade than North-South trade, which confirm the results of Mayer and
Zignago (2005), and Hammouda, Karingi and Perez (2005).
Reference Ackah, C. and O., Morrissey (2005) “Trade Policy and Performance in Sub-Saharan Africa since the 1980s”, CREDIT Research Paper, No. 05/13. Amponsah, W.A. (2002) “Analytical and Empirical Evidence of Trade Policy Effects of Regional Integration: Implications for Africa”. A Paper presented at the Africa Development Forum III on Defining Priorities for Regional Integration, March 3-8, Addis Ababa, Ethiopia. Anderson, J.E. (1979) “A Theoretical Foundation for the Gravity Equation”, American Economic Review,
Vol. 69 Anderson, J.E. (1988) “The Relative Inefficiency of Quotas”, Cambridge, Mass: MIT Press. Anderson, J.E. and L. Young (1982) “The Optimality of Tariff-Quotas Under Uncertainty, Journal of
International Economics, vol.13, pp.337-52. Anderson, J.E., and J.P., Neary (1999) ”The Mercantilist Index of Trade Policy”, NBER Working Papers,
no.6870. Arrelano, M., and O., Bover (1995), Änother Look at the Instrumental Variables Estimation of Error-
Components Models,” Journal of Econometrics, Vol. 68, pp 29-51. Bagwell, K. and R.W, Staiger (2001) “The WTO as a mechanism for securing market Access Property
Right: Implications for Global Labour and Environment Issues”, Mimeo, March.
38
Bagwell, K.J. and R.W, Staiger (1999) “An Economic Theory of GATT,” American Economic Review, vol. 89, no. 25-48.
Baltagi, B.H., (2001) “Econometric Analysis of Panel Data”, Second Edition, West Sussex, John Wiley &
Son.
Bergstrand, J.H (1985) “The Gravity Equation in International Trade: Some Microeconomic Foundations and Empirical Evidence”, Review of Economic and Statistic, vol. 67.
Bergstrand, J.H (1989) “The Generalized Gravity Equation, Monopolistic Competiion, and the Factor- Proportions Theory in International Trade”, Review of Economies and Statistics, 71(1):pp 143-153 Bhagwati, J.N. (1971) “The Generalized Theory of Distortions and Welfare”, In J.Bhagwati et al. (eds.),
“Trade, Balance of Payment and Growth”, Amsterdam: North-Holland, pp.69-90. Bhagwati, J.N. and T.N., Srinivasan (1980) “Revenue-Seeking: A Generalization of the Theory of Tariffs”,
Journal of Political Economy, vol.88, pp.1069-87. Bharagava, A., Franzini, L., and W., Navendranathan (1982) “Serial Correlation and Fixed Effects Model”,
Review of Economic Studies, Vol. 49, pp 533-549 Bouet, A., Fontagne, L., Mimouni, M., and X., Pichot (2001) “MAcMaps: A Bilateral and Disaggregated Measure of Market Access”, CEPII Working Paper, 2001-18 Brander, J., and B., Spencer (1984) “Trade Warfare: Tariffs and Cartels”, Journal of international
Economics, Vol. 16, 227-42. Brander, J., and B., Spencer (1984b) “Tariff Protection and Imperfect Competion”, In the Kierzkowsk (eds.),
“Monopolistic Competition and International Trade”, New York:Oxford University Press, pp. 194-206.
Breitung, J. (2000) “The Local Power of Some Unit Root Tests for Panel Data,” In. Baltagi (ed.), Advantages in Econometrics, Vol. 15: Nonstationary Panels, Panel Cointegration, and Dynamic Panels, Amsterdam: JAI Press, pp 161-178 Cernat, L., Laird, S., and A., Turrini (20020 “Back to Basics: Market Access in the Doha Agenda,” UNCTAD. Choi, I. (1999) “Unit Root Tests for Panel Data”, Working Paper (Department of Economics, Kookmin
University, Korea). Conley, T.G. (1999) “GMM Estimation with Cross-Sectional Dependence”, Journal of Econometrics, Vol.
92, pp 1-45. Das, S.P. (1990) “Foreign Lobbying and the Political Economy of Protection”, Japan and the World
Economy Journal, May-June. Deardoff, A.V. (2000), “Market Access for Developing Countries,” Paper prepared for the Conference on Efficiency, Equity and Legitimacy: The Multilateral Trading System at the Millennium, in Memory of Prof. Raymond Vernm, Harvard University, June. Dixit, A.K. (1985) “Tax Policy in Open Economies”, In A. Averbach and M. Feldstein (eds.), “Handbook of
Public Economics, vol.1, Amsterdam: North-Holland. Dixit, A.K. (1987) “Strategic Aspects of Trade Policy”, In T.Bewley (eds.), “Advances in Economic
Theory”: Fifth World Congress, New York: Cambridge University Press, pp.329-62. Dixit, A.K., and V., Norman (1980) “Theory of International Trade”, Cambridge University Press: Cambridge. Estevadeorda, A. and R. Robertson (2002) “From Distant Partners to close Neighbours” The FTAA and the
pattern of trade, Integration, Trade and Hemispheric issues Division, Inter-American Development Bank.
Estevadeordal A., and K., Suominan (2003) “Rules of Origin: A World Map and Trade Effects”, Paper Prepared for the Workshop, “The Origin of Goods”, IADB, INRA, DELTA, CEPR, Paris, May.
Ethier, W. (1998) “Reciprocity, Non Discrimination, and Multilateral World, Mimeo, University of Pennsylvania.
Evenett, S. and W. Keller (2003) “On Theories Explaining the Success of the Gravity Equation” Journal of Political Economy, vol. 110, No. 281-316
39
Evenett, S.J., and B.M., Hoekman (2002), “Government Procurement: Market Access, Transparency, and Multi-lateral Trade Rules,” A Paper delivered at a Seminar at the World Bank.
Falvey, R.E. (1979) “The Composition of Trade Within Import-Restricted Product Categories”, Journal of Political Economy, vol.87, pp.1105-14.
Feenstra, R. (2003) “Advanced International Trade. Theory and Evidence”, Princeton: Princeton University Press.
Finger, M.J., Ingco, M.E., and U., Reincke (1996) “The Uruguay Round: Statistics on Tariff Concessions Given and Received,” Washington D.C., World Bank.
Finger, M.J., Reincle, U. and A., Castro (1975) “Trade Overlap and Inter-Industry Trade”, Economic Inquiry, XII (4), pp 581-89.
Fox, É.M., (1997), “Toward World Antitrust and Market Access,” The American Journal of International Law, Vol. 91, No.1, January.
Francois, J., and W., Martin (2003) “A Formula for Success? Potential Approaches to Market Access Negotiations”, World Economic, Vol. 26, Issue 1, January, pp 1-28. Godek, P.E., (1986) “The Politically Optimal Tariff Levels of Trade Restrictions across Developed
Countries”, Economic Inquiry, Vol. 24, pp. 587-93. Godek, P.E., (1989) “Foreign Form Profits and the Political Economy of International Trade Quotas, Mimeo,
Economist Incorporated. Greaney, T. (1996) “Import now! Analysis of Market Share Voluntary Import Expansions (VIES)” Journal
of International Economics vol. 40, no 49-63. Greene, W.H., (2003) “Econometric Analysis”, Third Edition, New Jersey, Prentice Hall.
Gresser, E., (2002) “America’s Hidden Tax on the Poor: The Case for Performing U.S. Tariff Policy”, Progressive Policy Institute Policy Report, March (Washington: Progressive Policy Institute).
Grimwade, N. (2000) “International Trade – New Patterns of Trade, Production and Investment”, (Second Edition), Rouledge, London.
Hadri, K. (1999) “Testing the Null Hypothesis of Stationarity Against the Alternative of a Unit Root in Panel Data with Serially Correlated Errors, Manuscript (Department of Economics and Accounting, University of Liverpool)
Hammouda, H.B., Karingi, S., and R., Perez, (2005), “Unrestricted Market Access for Sub-Saharan African: Important Benefits with Little Cost to the QUAD”, UNECA ATPC Work in Progress, No. 11.
Helpman, E. (1987) “Imperfect Competition and International Trad: Evidence from fourtenn Industrial Countries”, Journal of the Japanese and International Economics, (1).
Helpman, E. and P. Krugman (1985) “Market Structure and Foreign Trade” Cambridge, MA: MIT Press. Hillman, A., (1989) “The Political Economy of Protection”, New York: Harwood Academic. Hilman, A. L, and P., Moser 91996) “Trade Liberalization as Politically Optimal Exchange of Market
Access”. In: Canzoneri, M.B., Ethier, W.J., Grilli, V. (Eds.), The New Trans-Atlantic Economy, Cambridge University Press, New York and Melbourne, pp. 295-316.
Hoekman, B, Ng, F. and M., Olareaga (2001) “Tariff Peaks in the Quad and Least Developed Countries’ Exports. Hudder, R.E. 91987) “Developing Countries in the GATT Legal System”, London, Trade Policy Research
Centre. Huff, K. (2000) “Developing Countries Concerns and Multilateral Trade Negotiations”, CATRN Paper,
2000-02, Canadian Agri-Food Trade Research Network (January). Im, K.S., Pesaran, M.H. , and Y. Shin (2003) “Testing for Unit Roots in Heterogeneous Panels,” Journal of
Econometrics, 115, 53-73. International Monetary Fund (IMF) (2002), “Market Access for Developing Countries Exports – Selected
Issues” Staff Paper, September,26. International Monetary Fund (IMF) and World Bank (2001) “Market Access for Developing Countries’
Exports”, Staff Paper, International Monetary Fund (IMF) and World Bank (2002) “Market Access for Developing Country
Exports: Selected Issue”. A Paper approved by Geithner and Nankani. Irwin, D.A (1994) “Managed Trade; the Case Against Import Target”, The AEI Press, Washington, DC.
40
Jaffee, S.M., and S., Henson (2005) “Standards and Agro-food Exports from Developing Countries: Rebalancing the Debate”, World Bank Policy Research Working Paper, 3348, June.
Johnson, H.G (1954) “Optimum Tariffs and Retaliation”, Review of Economic Studies, vol.21, pp.142-53. Kao, C. (1999) “Spurious Regression and Residual-Based Tests for Cointegration in Panel Data”, Journal of
Econometrics, vol.90, no 1- 44. Kennan, J. and R., Riezman (1988) “Do Big Countries Win Tariff Wars?”, International Economics
Review, Vol. 29, 81-4. Krishna, K. and J. Morgan (1998) “Implementing Results Oriented Trade Policies: The Case of the US -
Japanese Auto Part Dispute”, European Economic Review, Vol. 42. No. 1443-67 Krishna, K. Roy, S. and M. Thurby (1998) “Implementing Market Access”, Review of International
Economics, vol. 6, No. 529-44 Krugman, P.R. (1980) “Scale Economics, Product Differentiation and the Pattern of Trade”, American
Economic Review, vol. 70. 950-59 Krugman, P.R. (1980) “Scale Economies, Product Differentiation, and the Pattern of Trade”, American Economic Review, pp 950-59. Laussel, D. and C., Montet (1994) “Strategic Trade Policies”, In David Greenaway and L. Alan Winters
(eds.), “Surveys in International Trade”, Oxford: Blackwell, USA. Lenway, S., Rehbein, K., and L., Starks (1990) “The Impact of Protectionism on Firm Wealth: The
Experience of the Steel Industry”, Southern Economic Journal, Vol. 56, April, pp. 1078-93. Levin, A. and C.F., Lin (1992) “Unit Root Test in Panel Data: Asymptotic and Finite sample Properties”,
Discussion Paper, No. 92-93 (University of California at San Drego) Linnemann, H. (1966) “An Econometric Study of International Trade Flows” Amsterdam, North-Holland. Linnemann, H. and H. Verbruggen (1991) “GSTP Tariff Reduction and its effects on South-South Trade in
Manufactures”, World Development, vol.19. Maddala, G.S. (1999) “On the Use of Panel Data Methods with cross Country Data”, Amales DÉconomie et
de Statistique, Vol. 55-56, pp 429-448. Maddala, G.S. and S. Wu (1999) “A Comparative Study of Unit Root Tests with Panel Data and A New
Simple Test,” Oxford Bulletin of Economics and Statistics, Vol. 61, 631-52. Magee, S.P., Brock, W.A., and L., Young (1989) “Black Hole Tariffs and Endogenous Policy Theory”,
Cambridge: Cambridge University Press. Matoo, A., Devesh, R., and A., Subramanian (2003) “The African Growth and Opportunity Act and its Rules
of Origin: Generosity Undermined?”, The World Economy, Vol. 26, Issue 6, June, pp 829-52 Mayer, T. and S. Zignago (2005) “Market Access in Global and Regional Trade”, CEP II Working Paper,
No. 2005-02. Mayer, W. and R., Riezman (1990) “Voter Preferences for Trade Policy Instruments”, Economics and
Politics, vol.2, November, pp.259-74. McMillan, J. (1986) “Game Theory in International Economies”, Vol.1, Fundamentals of Pure and Applied
Economics, M.Kemp (eds.), London: Harvard. Michalopoulos, C. (1999) “Trade Policy and Market Access Issues for Developing Countries”, World Bank
Policy Research Working Paper, October. Millenium Project (2005) “Trade for Development – Achieving the Millennium Development Goals”,
London, Earthscan. Mold, A. (2005) “Non-tariff Barriers –Their Prevalence and Relevance for African Countries”, UNECA
ATPC Work in Progress, No. 25. Moon, B.E., (1999) “Dilemmas of International Trade”, (Second Edition), Boulder, Colorado, Westview
Press. Moon, H.R., and P.C.B, Phillips (2000) ‘’Estimation of Autoregressive Roots Near Unity Using Panel Data”,
Econometric Theory, Vol. 16, pp 927-97. Mundell, R.A. (1968) “International Economics”, New York: Macmillian. Nash, J. (1993) “Trade Policy Reform Implementation in Sub-Saharan Africa: How Much Heat and How Much Light?” Mimeograph, The World Bank, Washington, D.C. NBER Working Paper, No, 6870. NEPAD (2001) “A Summary of New Partnership for Africa’s Development (NEPAD) Action Plans”,
NEPAD Secretariat, South Africa.

41
Ogunkola, E.O., and T.A. Oyejide (2001), “Market Access for Nigeria’s Exports in the European Union: An Assessment of the Impact of the Lome Convention and the Uruguay Round,” Nigerian Journal of Economic and Social Studies, Vol. 43, No. 1.
Olson, M. (1965) “The logic of Collection Action: Public Goods and the Theory of Groups”, Cambridge, Harvard university Press.
Oyejide, T.A. (2000) “Policies for Regional Integration in Africa”, African Development Bank Economic Research Papers, No. 62. Oyejide, T.A. (2004) “Nigeria in the World Trade System: The Challenge of Multidisciplinary Research and Policies Analysis”, University of Ibadan Postgraduate School Interdisciplinary Research Discourse, June. Phillips, P.C.B and H.R., Moon (1999) “Linear Regression Limit Theory for Nonstationary Panel Data”,
Econometrics, Vol. 67, pp 1057-1111 Quah, D. (1994) “Exploiting Cross-Section Variation for Unit Root Inference in Dynamic Data”, Economics
Letters, Vol. 44, pp 9-19 Ray, E.J. (1981) “Protection of Manufacturers in the United States, Mimeo, Ohio State University. Rehbein, K., and L., Starks (1991) “Changes in US Trade Policies: The Wealth Effects on Japanese Steel
Firms”, Mimeo, University of Texas at Austin. Riezman, R. (1982) “Tariff Retaliation from a Strategic Viewpoint”, Southern Economic Journal, vol.48,
pp.583-93. Riezman, R. (1991) “Dynamic Tariffs with Asymptotic Information”, Journal of International Economics,
vol.30, pp.267-84. Schelling, T. (1960) “The Strategy of Conflict”, Cambridge, Mass: Harvard University Press. Sharer, R. (1999) “Trade: An Engine of Growth for Africa”, Finance and Development, December. Tangermann, S. and T., Josling (1999) “The Interests of Developing Countries in the Next Round of WTO
Agricultural Negotiations”, Paper prepared for the UNCTAD Workshop on Developing a Proactive and Coherent Trade Agenda for African Countries, Pretoria, June 29-July 2.
Tarr, D. (1989) “A General Equilibrium Analysis of the Welfare and Employment Effects of US Quotas in Textiles, Autos and Steel”, Washington, Federal Trade Commission.
Tinbergen, J, (1962) “Shaping the World Economy Suggestions for an International Economic Policy”, the Twentieth Century Fund.
UNCTAD (1998) “The Least Developed Countries 1998 Report – Trade, Investment and the Multilateral System”, UNCTAD
UNCTAD (2002) “Back to Basics: Market Access Issues in the Doha Agenda.” Verdier, T. (1998) “Result Oriented Versus Rules-Oriented Trade Policies: A Theoretical Survey” European
Economic Review, vol. 42. No. 733-44. Weck-Hannemann, H. (1990b) “Protectionism in Direct Democracy”, Journal of Institutional and
Theoretical Economics, Vol.146, pp.389-418. Wilson, J. (1990) “Are Efficiency improvements in Government Transfer Policies Self-Defeating in Political
Equilibrium”, Economics and Politics, Vol.2, November, pp.241-58. Wilson, J.S, Otsuki, T., and M., Sewadel (2002) “Dirty Exports and Environmental Regulation: Do Standards
to Trade Matter?”, Development Research Group, World Bank, March. World Bank (2002) “Development, Trade and the World Trade Organisation (WTO): A Handbook,
(Washington) World Trade Organisation (2001) “Market Access: Unfinished Business”, Economic Research and Analysis
Division. World Bank (2003) “Standards and Global Trade: A Voice for Africa”, The WorldBank, Washington, D.C.
Related Documents