“Trade policy and internal armed conflict: can tariffs reduce the negative economic impact of war?” ERASMUS UNIVERSITY ROTTERDAM Erasmus School of Economics Department of Economics Master thesis MSc Economics and Business Economics – Specialization International Economics Name: Camilo Rivera Pérez Exam number: 382452 Supervisor: Julian Emami Namini E-mail address: [email protected] Place and date: Rotterdam, The Netherlands. 25th August 2014

Welcome message from author
This document is posted to help you gain knowledge. Please leave a comment to let me know what you think about it! Share it to your friends and learn new things together.
Transcript

“Trade policy and internal armed conflict:
can tariffs reduce the negative economic
impact of war?”
ERASMUS UNIVERSITY ROTTERDAM
Erasmus School of Economics
Department of Economics
Master thesis MSc Economics and Business Economics –
Specialization International Economics
Name: Camilo Rivera Pérez
Exam number: 382452
Supervisor: Julian Emami Namini
E-mail address: [email protected]
Place and date: Rotterdam, The Netherlands. 25th August 2014

1
List of contents
Introduction ...................................................................................................................... 3
1. Literature Review ...................................................................................................... 6
1.1. Second best policies ........................................................................................... 8
1.2. Tariffs and income growth ................................................................................. 9
1.3. Conflict and income growth ............................................................................ 11
2. Theoretical framework ............................................................................................ 14
2.1. Production and consumption ........................................................................... 15
2.2. The appropriation sector .................................................................................. 15
2.3. The equilibrium ................................................................................................ 17
2.4. The effects of conflict in an open economy ..................................................... 19
2.5. Trade policy and conflict ................................................................................. 22
3. Methodology ........................................................................................................... 24
3.1. Indicators of the structure of tariff protection .................................................. 24
3.2. Empirical specification .................................................................................... 25
3.3. Data sources and variables description ............................................................ 29
3.3.1. Internal armed conflict data ...................................................................... 29
3.3.2. Tariffs data ................................................................................................ 31
3.3.3. Income and control variables .................................................................... 32
4. Results ..................................................................................................................... 34
4.1. Main results ...................................................................................................... 36
4.2. Robustness checks and sensitivity analysis: .................................................... 43
5. Conclusions: ............................................................................................................ 46
References ...................................................................................................................... 50
Annex 1. Countries included classification and internal conflict incidence ................... 56
Annex 2. Definition of the labor-intensive and capital-intensive goods ........................ 58
2
Annex 3. Robustness Checks: Regressions excluding countries by level of development
and regions ...................................................................................................................... 59

3
Introduction
This paper analyzes the effects of trade policy in economies affected by internal armed
conflict from a theoretical and empirical point of view. Particularly, the effect of the
use of tariffs as second best instruments in economies where markets are distorted by
the incidence of armed conflict is examined. Despite the considerable costs that internal
armed conflicts generate to the economy, the analysis about the effects that different
economic policies have on these particular economies have only recently gained
attention in mainstream economics (The World Bank, 2011; Collier et al., 2003).
Internal armed conflicts are often cited as one the main causes for low economic
development in several countries, especially during the period following the Second
World War (Collier, 2007). Armed conflicts have terrible and lasting effects on the
general wellbeing of the people and generate economic as well as social costs for the
countries affected. The social costs of conflicts are mainly associated with the fatalities
and displacement of populations, but also with the persistent health, emotional,
institutional and political legacies that a conflict generates (Collier et al., 2003). The
social cost adds to the direct economic burden and in this sense the decline in economic
activity will be reflecting both types of cost.
Although the consequences of conflicts go well beyond the economic scope, the onset
of civil strife generates a decline in overall economic activity that could be of
considerable magnitude. A review of the literature shows that the negative effects of
conflict are estimated in a range between 1 and 3.5 percentage points of reduction in
yearly income per capita growth (Collier, 1999; Gardeazabal, 2012; Imai & Weinstein,
2000). Hence, an internal armed conflict lasting ten years could account for a 10.5%
difference in the income level1 compared to a non-conflict situation, using the lower
estimates.
Unfortunately, internal conflicts are not an unlikely event. After the end of the Second
World War, there was a steady increase in the number of countries affected by civil
wars2. The internal armed conflict incidence reached its peak in 1990, after this year
there was a rapid decrease in the number of conflicts, and the trend has stabilized
1 The different estimates could reflect different empirical methods and samples but also different
intensities of conflicts considered. 2 According to the definition of the Political Instability Task Force Project. See section 3.3.1

4
between 20 to 25 countries affected in the last decade3. According to a recent report of
the Uppsala Conflict Data Program (UDCP) in recent years the number and intensity of
armed conflicts had reduced considerably (Themnér & Wallensteen, 2013). However,
the onset of high-intensity conflicts in Syria, Libya, the separatist movement in Ukraine
and the increase of the insurgency activity in Iraq could change this trend.
Graph 1. Countries affected by civil war 1948-2013
Source: Authors calculation based on Political Instability Task Force Project: Internal Wars and Failures
of Governance 1955-2012 database. **See section 3.3.1 for the definition of internal armed conflict
employed
On the other hand, during the 1990’s the finalization of the negotiations of the Uruguay
Round of the General Agreement on Tariffs and Trade (GATT) led to the creation of the
World Trade Organization (WTO). Some authors coined the period as the “Great
Liberalization of the 1990’s” (Estevadeordal & Taylor, 2013). However, some common
criticism of the process of economic liberalization is that it generates destabilization and
reduces the trade policy maneuver of countries to face it. Therefore, liberalization
processes would trigger internal conflicts or exacerbate the effect of the existing ones
(Curtis, 2007; Nieman, 2011). The evidence seems to contradict this view, but the
theoretical links between trade policies and the incidence of conflict is not clear
(Elbadawi & Hegre, 2008).
This paper seeks to shed light on the possibility that trade policy measures have a
different effect on overall economic activity when applied in conflict-affected
3 The same general trend is observed when focusing on the number of battle related deaths using the
UCDP Battle-Related Deaths Dataset (Available at: http://www.pcr.uu.se/research/ucdp/datasets/)
5
economies. The theoretical model employed by Dal Bó & Dal Bó (2011) and its
predictions are the main motivations of this paper. The authors proposed, that
apparently inefficient interventions, like international trade restrictions or cross
subsidies schemes, could lead to relatively lower decline of income growth in
economies affected by conflict. The main objective of this paper is to determine whether
there is some empirical support for this theoretical prediction; focusing on the specific
effects of tariffs, although the research also covers the theoretical effect of other policy
instruments.
The model proposed by Dal Bó & Dal Bó (2011) introduces armed conflict as an
income appropriation sector in an otherwise standard Heckscher, Ohlin, Samuelson
(HOS) international trade model. The model allows studying how different income
shocks and economic policies affect the economy given the existence of the
appropriation sector. The main result of this model is that the general economic effects
of conflicts are the result of two balancing forces, the opportunity cost of engaging in
appropriation activities instead of the productive sector, in relation to the magnitude of
the appropriable resources.
Formally, any income shock or policy that generates a relative increase (decrease) in the
remuneration paid by productive sectors to labor will reduce (increase) appropriation
activities and therefore reduce (increase) the negative effects of conflict on the total
production (thus, consumption and welfare) of the economy; as long as, the
appropriation sector is labor-intensive relative to the overall economy. Therefore,
changes in relative prices like international income shocks or changes as a result of an
economic policy intervention could have non-linear effects over the overall economy
depending on whether they are affected by internal conflict.
The preceding result leads to the hypothesis that tariff interventions that bias the
structure of tariffs towards the protection of labor-intensive productive sectors would
induce an increase in relative wages. Consequently, there would be a reduction of the
incidence of appropriation activities via the opportunity cost and then an increase in the
overall output.
In this paper, the income and tariff data for a panel of 107 economies during the period
1986-2010 is employed to evaluate the proposed theory. Using detailed tariff data from
the UNCTAD-TRAINS database; two measures of labor-bias-of-tariffs were computed,
the bias towards the agriculture sector and a more direct measure of the bias towards
6
labor-intensive sectors using and index of capital intensity at the product level (Shirotori
et al., 2010). The general results only give evidence in favor of a positive and significant
direct relation of the labor-bias-of-tariffs and economic growth once the internal armed
conflict effect is accounted for. However, and given that tariffs are distorting
instruments, the simultaneous effect of conflict and labor-bias-of-tariffs is still negative.
Therefore, the main hypothesis proposed in this paper is not supported by the data and
methods employed.
Despite these results, it cannot be concluded that the main propositions derived from the
theoretical framework are incorrect or are not fitting the data. Indeed Dal Bó & Dal Bó
(2012) show that tariffs to international trade will be an instrument dominated by other
policy measures that could reduce the conflict intensity without generating the
distortionary effects.
The organization of this paper is as follows. Following this introduction, section 1
provides a literature review on the subject of conflict, tariffs conceived as an instrument
for achieving second best outcomes and the armed conflict effects on economic growth.
Section 2, presents a general version of the model of Dal Bó & Dal Bó (2011) and the
main results are derived. Furthermore, the null hypothesis about the effects of tariffs
when there is an appropriation sector in the economy is developed. Section 3, presents
the methodology applied for the indicators and describes the estimation procedures as
well as the data sources. Section 4, shows the main results of the estimations of the
cross-country growth regressions and some robustness checks. Finally, as a conclusion
of the paper, section 5 summarizes the main findings, points out their implications
regarding the initial research question, discusses the shortcomings of the empirical
methodology and proposes some options of further research.
1. Literature Review
The economic analysis of Internal Armed Conflicts (IAC) and their effects on
wellbeing, long run economic development, or growth is a relatively new field in the
economic literature. As highlighted by Blattman & Miguel (2010), consistent analysis
of internal conflicts and their economic causes and consequences had been scarce in the
economic profession until the mid-1990s. Although, the proportion of conflicts affected
by an IAC increased steadily during the second part of the twentieth century and often
civil strife is often cited as the cause of underdevelopment of several developing

7
countries especially in Africa (Collier, 2007). However, many of the recent research in
the field have centered attention on which are the determinants of internal armed
conflict rather than on its economic consequences.
The principal channel through which conflict affects the economy according to the
existing literature is the destruction of part of the stock of factors of production, human
or capital resources, the destruction effect according to Collier (1999). Warfare destroys
infrastructure and leads to the loss of lives of part of the population (and therefore
labor), but also makes part of the labor force become temporally or even permanently
unproductive due to physical and emotional wounds or the forced displacement
(relocation) from some production zones (Collier, 1999). Another related effect is the
diversion of the public and private investment from productive activities to defense
activities, the diversion effect (Knight et al., 1996) or the increased production costs
associated with making property rights enforceable (Blattman & Miguel, 2010; Collier,
1999). Countries affected by conflict also tend to suffer from a fall in savings generating
an additional effect to the destruction of capital stock, or relocation resources (physical
and human) out of the country, generating a portfolio substitution effect (Collier, 1999;
Collier et al., 2004).
Internal armed conflicts, or war in general, are expected to generate other effects not
directly related to factors of production. There could be a disruption of production in the
economy as the fear of attacks or the physical disconnection between some parts of the
country could potentially lead to a disruption of the supply chain. Moreover, internal
conflicts could even lead to deterioration of institutional quality, political institutions
and cause social disorder, distorting the existing arrangement of property rights in a
society (Blattman & Miguel, 2010; Collier, 1999; Collier et al., 2003).
A common criticism of the process of economic liberalization is that it generates
destabilization, increases the external vulnerability of countries and reduces the trade
policy maneuver to face it. Therefore, liberalization processes are often blamed of
trigger internal conflicts or exacerbate the effect of the existing ones. In this sense, this
argument could be used as support for the introduction of international trade restrictions
or control to the international movement of factors of production, given that conflict
poses a greater distortion, in search for a second best result (Lipsey & Lancaster, 1956).
However, Elbadawi & Hegre (2008) in a study of the effects of international trade on
the likelihood of internal armed conflicts onset, do not find robust support for the
8
conclusion that trade is a cause for the onset of internal conflicts. On the other hand,
Nieman (2011) argues that greater exposure to international markets could trigger
internal armed conflicts if the process is too fast and overwhelms the capacity of
national states to cope with the associated transition effects and provides some
supporting evidence. In a related argument, Curtis (2007) states that economic
liberalization reduces the trade policy maneuver of developing countries to face the
increased vulnerability that comes with a greater openness in developing countries.
In a related context Dal Bó & Dal Bó (2011) include the existence of armed conflict as a
sector dedicated to appropriation activities in a standard international trade HOS model.
This allows them, to study how different types of income shocks affect the economy
given the incidence of social conflict. Their main result is that the intensity of
appropriation activity, and therefore the negative economic effect of conflict, is a result
of two opposing effects. The opportunity cost of allocating productive resources to
appropriation activities instead of the productive sectors and the rapacity effect induced
by the income of the economy susceptible to be appropriated by force.
Therefore, Dal Bó & Dal Bó (2011, p.648) claim “…interventions must distort the
prices perceived by agents in order to reduce appropriation; non-distortionary lump
sum redistribution cannot affect appropriation in this economy. This can explain why
we observe distortionary policies in reality: they buy social peace.” Moreover, they
argue that an example of the interventions susceptible to accomplish this objective could
be the use of “…trade interventions that lower the protection of capital-intensive
industries relative to labor-intensive ones.” The model proposed by these authors and
their results are the main motivations of this paper, their proposed instrument is
confronted with the data on growth and detailed tariff figures to construct measures of
protection to labor-intensive sectors.
1.1. Second best policies
In the field of welfare economics, second best policies, or second best optimums refer to
those in which introducing additional distortions into the economy could be welfare
improving. This result derives from the application of the general theorem of the second
best (Lipsey & Lancaster, 1956). In the presence of distortions that impede the
fulfillment of all the Pareto optimality conditions, the theorem implies that applying
policies to partially achieve the optimality conditions or eliminate only some of the

9
actual distortions into the economy will reduce welfare and be a non-desirable result.
Therefore, introducing new distortions and consequently altering other equilibrium
conditions could be a welfare improving situation, although always second to the direct
elimination to the original distortion (first best). The theory of the second best has been
widely applied in economics and used as a theoretical framework to justify market
interventions4.
The seminal paper of Bhagwati (1971) provides a classification of the different types of
distortions identified in the existing economic literature at that time. Moreover, the
author offers a classification of types of distortions and factors causing them and
provides a ranking of the most efficient interventions under those settings. The main
premise about second best interventions is that if some variable in the economy should
be constrained based on a second best policy, the most efficient instrument to achieve
this goal is one that affects the variable directly (Bhagwati, 1971).
In a related paper, Dal Bó & Dal Bó (2012) explore the different interventions
susceptible to be welfare improving for conflict-affected economies and classify them
according to the Bhagwati (1971) ranking. The authors show that, in their model,
conflict activities withdraw resources from productive sectors and therefore could be
assimilated to a distortion in the factor markets. In this case, the most efficient
intervention is a direct tax-subsidy scheme that affects the prices of the productive
factors. Moreover, following Bhagwati (1971) we could consider social conflict in
general, and specifically an internal armed conflict as an “autonomous” distortion, e.g. a
historical accident. In this sense, the model employed in this paper do not account for
the motivations and rationality for the emergence of an appropriation sector.
1.2. Tariffs and income growth
The focus of this paper is on tariffs for two reasons. Firstly, because the idea of tariffs as
efficiency enhancers, thus an argument for protectionism; goes against one of the most
important theoretical results in international trade theory. The welfare effects after
imposing tariffs in a small economy, taking world prices as given, are negative.
Moreover, even if it is assumed that the government redistributes income, the efficiency
losses are deadweight for the economy. The result is so widely accepted that Rose
(2013) states that the sole idea could be responsible for the apparent disconnection
4 See Krishna & Panagariya (2000) for a survey of the main results of applying the second best theorem in
international trade theory.
10
between tariffs and economic cycles after the Second World War. The second reason is
the data availability, as will be discussed further in the methodology section; there is no
widely available information for tax-subsidies schemes applied in different countries or
other forms of distortions at the product or sector level5.
However, the effect of direct measures of trade policy liberalization in the last decades
has been a matter of controversy. The first wave of studies about the effects of trade
liberalization, or openness to international markets in general, as growth enhancers
found a positive relation between trade and growth (Sachs et al., 1995; Frankel &
Romer, 1999; Dollar & Kraay, 2003). However, recent research has questioned those
initial results on the basis of their methods as well as their theoretical approaches
(Rodrik, 2006). Additionally, the widely cited works of Sala-i-Martin et al. (2004) and
Ciccone & Jarocinski (2010) about the robustness of long run economic growth
predictors do not find any openness related measure being a strong predictor of long run
economic growth.
Moreover, in recent years the debate was centered on the fundamental causes of growth:
institutions, geography, culture and luck; instead of economic policies, among them
trade policy liberalization (Acemoglu et al., 2001; Rigobon & Rodrik, 2004; Rodrik et
al., 2004; Sachs, 2003).
In contrast to the previous debate, a relatively recent and emerging literature has
focused the analysis on the structure of tariffs over long run economic development
rather than on the average level of tariff protection. Nunn & Trefler (2010) find
evidence for a positive correlation between protection and long term growth when the
tariff structure is biased towards sector intensive in skilled labor. Minier & Unel (2013)
in a related study find a positive association between average tariffs and growth for
skill-abundant countries.
Finally, Estevadeordal & Taylor (2013) argue in favor of a positive effect of trade
liberalization on long run economic growth, but relates the effect on the relatively faster
reduction of tariffs for capital goods and intermediate goods, therefore resembling the
concept of effective protection rates (Corden, 1966). However, none of these results
give support to the idea that a tax structure biased towards labor-intensive goods could
foster economic growth.
5 The recently published Estimates of Distortions to Agricultural Incentives (DAI) 1955-2011 described
in Anderson et al. (2008) offer the opportunity for further research in this direction.
11
1.3. Conflict and income growth
The theoretical impacts of internal armed conflict over economic growth are linked to
the general theories about economic growth in the long run. In the neoclassical growth
model augmented for human capital e.g. Mankiw et al. (1992), the impact of internal
armed conflict depends greatly on its effects over the stock of factors of production; as
well as the perception that agents in the economy have about the effects of conflict.
Under the neoclassical Solow growth framework, it is expected that any effect of
internal armed conflict on the economy will be temporal, i.e. only perceivable in the
short run. Therefore, once conflict has ceased the stocks of factors of production should
return to the long run steady state levels and therefore having high growth rates once
conflict have ceased, the so-called peace dividend (Blattman & Miguel, 2010).
However, if agents perceive the income shock as temporary, the consumption
smoothing could potentially reduce the short run effects of conflicts, but affect the long
run through a decrease in the saving rate. Although, there is a theoretical possibility for
saving rates (and therefore consumption) to reduce only marginally during civil strife
episodes, conflict could also affect the risk perception and expected life horizons of
agents. This in turn distorts saving and investment decisions, adding to the capital stock
losses attributed to the direct destruction effect, despite the initial consumption
smoothing reaction, and affect economic growth in the short and long run (Echeverry et
al., 2001).
On the other hand, the endogenous economic growth theories (Barro & Sala-i-Martin,
2003) predict that the effects of conflict on the reduction of the stocks of factors of
production could have persistent effects over long run income. The transitional growth
rate to the steady-state is reduced even after conflict have ceased, as well as the
possibility of a peace dividend.
The mechanics of the neoclassical growth model, in which steady-state levels of income
are reached relatively faster after the end of the conflict, relies on the strong assumption
that the technological change rate and the institutional framework of the economy are
not affected during the conflict. This assumption is inconsistent with the recent
literature about the economic effects of conflicts in which, as shown before, conflicts
could affect the institutional framework of the economy generating a negative shock to
productivity due to an increase in costs to enforce property rights, e.g. military

12
expenditure will be high even after the end of war (Blattman & Miguel, 2010; Collier et
al., 2003).
The preceding discussion leads to a relation between growth and conflict that is
mediated by the other variables that could affect economic growth or could be
correlated with internal armed conflict; for instance, the institutional framework
(Acemoglu et al., 2001; Rodrik et al., 2004). Accounting for these factors leads to the
conditional convergence models like the one employed in this paper. In fact, just the
inclusion of country-specific effects allows for permanent income differences in the
steady state, therefore allowing for different steady-state income levels (Durlauf et al.,
2005).
Most of the empirical literature about the economic costs of the incidence of armed
conflicts uses a counterfactual approach to the problem. This method is preferred to a
direct accounting method (like measuring military expenditure), because it could
capture a broader set of effects like the ones previously discussed that are not readily
linked to conflict. The usual approach is to establish a cross-country growth regression
or a panel data version of it under the assumption of conditional convergence
(Gardeazabal, 2012)6.
The main results in the literature about the effects of internal armed conflicts on
economic growth indicate a negative effect in the short and medium term and mixed
evidence over the long run economic growth. The effect of internal armed conflict is in
general negative and statistically significant for medium term growth (5-10 years);
ranging between a reduction in growth rates of 1 percentage point7 and 3.5 percentage
points, according to the different studies. Furthermore, Gardeazabal (2012), who
reviews the measuring of conflict costs, concludes that the effects are of a considerable
magnitude and in general statistically significant, even though the channels and precise
estimates vary considerably. However, cross-section analyses of robust regressors of
economic growth do not identify war or related variables as strong predictors of long-
term income growth (Ciccone & Jarocinski, 2010; Sala-i-Martin et al., 2004). These
results could be explained by the lack of accounting for endogeneity in the variables or
6 Gardeazabal (2012) presents a survey of the different methods for measure the cost of social conflict in
a broad sense i.e. including riots, terrorism and other closely related forms of conflict besides armed
conflict and summarizes some important results. 7 For instance, for two similar countries which are expected to growth at 5% in peace full times, if one of
them is affected by an armed conflict it is expected to grow at 4%.

13
for the omitted variable bias inherent in the data for conflict-affected economies
(Gardeazabal, 2012).
With respect to the effects of internal armed conflicts on a purely neoclassical growth
model setting, Murdoch & Sandler (2002) estimate cross-country growth regressions for
a panel of countries between 1960 and 1990. Their main findings suggest that a civil
war within the country or on its neighbors have a negative effect of around -1.83
percentage points8 on yearly average income growth. However, they found little
evidence for an effect of civil conflict on long run growth. The authors catalog these
results as consistent with the predictions of the neoclassical growth model. The initial
effect of conflict over the human and physical capital endowments of the economy will
be accounted in subsequent periods by the initial income variable, leaving lower effects
for the rest of the periods affected by civil war.
Knight et al. (1996), analyze the effect of a reduction in military expenditure on long
run economic growth for a sample of 79 countries and five-year periods from 1971 to
1985. They propose that civil wars affect growth directly and indirectly through their
effect on private investment. Their results show a negative effect of armed conflict of
around -3.5 percentage points of per capita income growth. The previously mentioned
study of Collier (1999) for 78 countries during 1960 to 1989 using decade averages,
estimates that that during civil wars, the annual per capita income growth rate is reduced
on average by 2.2 percentage points.
In general, the studies of the incidence of armed conflict consider each episode as a
similar event using dummies or the duration of war as a measure of armed conflicts,
without considering the different characteristics of armed conflicts. Imai & Weinstein
(2000), argue that it is possible that conflicts could have different manifestations given
their magnitude. They exploit an earlier version of the data employed in this paper,
provided by the Political Instability Task Force Project9 about different dimensions of
conflict and an assessment of its intensity (Goldstone et al., 2010). They estimate the
effect of a widespread civil war as a reduction of 1.25 percentage points on the annual
per capita income growth in a sample of 104 countries using decade averages between
1960 to1998. Blomberg et al. (2004), use the same database and estimate the negative
effect of conflict as a reduction of 1.3 percentage points in annual per capita income
8 Original coefficient estimate is -0.073 for the growth of the complete 4 years spans, e.g. 1981-1985.
9 This database is explained in the methodological section.

14
growth using a Structural VAR methodology, on a sample of 177 countries from 1968
to 2000.
As previously stated, the recent literature about internal armed conflicts was centered on
the determinants of conflict rather than on its economic effects. The most cited results in
this field are the association between low levels of income and incidence of conflict, as
well as a relation between income growth shocks and the onset of internal armed
conflicts. Although, in the latter case the actual sign and channel of the effect remains
open to debate. Blattman & Miguel (2010) argue that the effect of income shocks over
conflict onset or incidence are difficult to identify and interpret, due to the reverse
causality issues. Additionally, the apparent connection between conflict and income or
income growth could be jointly determined by a third factor like institutions.
In a widely cited paper, Miguel et al. (2004) address the reverse causality between
conflict and income growth using rainfall shocks as instruments for yearly economic
growth in Sub-Saharan Africa. They find a negative and significant effect for lagged
income growth, but an insignificant effect for contemporaneous income growth. In
addition, once controlling for income growth the other determinants of conflict
incidence lose their statistical significance.
Likewise, Ciccone (2013) argue that the rainfall instrument will be more appropriate in
a model where conflict is related to transitory income shocks rather than permanent
ones and finds that negative transitory income shocks reduce conflict. Thus, any
empirical application relating income and conflict should acknowledge the possibility of
bias in the estimated effect of conflict on economic growth due to reverse causality.
2. Theoretical framework
As previously mentioned, the theoretical framework employed in this paper is based on
the model proposed by Dal Bó & Dal Bó (2011). The economy is described as a HOS
international trade model but augmented by the existence of an appropriation sector,
which represents social conflict (in this paper armed conflict) over the distribution of
income. In this setting, the appropriation sector produces a total effort of appropriation α
in order to appropriate a fraction A(α) of the total households income by force10
i.e. the
10
Given the standard assumption of constant returns to scale, the household income, i.e. payments to
factors of production, will be equal to the total value of production of the economy. Therefore if the
appropriation sector is assumed to appropriate production instead of income the results will be similar.
15
rents of labor and capital. Hence, there is always an incentive to appropriate a larger
fraction and generates a rapacity effect. Nevertheless, the appropriation effort α requires
the use of factors of production (labor and capital) and will divert resources from
productive sectors. Those resources will only be reallocated to appropriation activities if
the net rents derived from the appropriation effort are greater than or equal to the ones
obtained in the productive sector generating an opportunity cost effect.
2.1. Production and consumption
The production and consumption in the economy are defined as in the standard HOS
trade model; with two sectors of production (industries), 1 and 2, which output levels
will be represented by q1 and q2. The price of the product for industry 1 will be denoted
by p1 and p2 for industry 2. These sectors use capital (Ki) and labor (Li) as inputs in their
productions process, the endowment of these factors are fixed and denoted by K and L
the rental price of capital is represented by r and the rental price of labor by w.
Moreover, each production sector is characterized by many profit-maximizing firms,
producing with constant returns to scale technologies and under perfect competition.
Each firm in each sector uses the same technology for production; however technologies
of production differ between sectors 1 and 2 in their relative factor intensities.
The consumers in this economy have identical homothetic preferences over bundles of
the goods 1 and 2. The maximization of the utility of consumers given their preferences,
the relative prices p1/p2 and the income M defines the demands for the goods of
industries 1 and 2, and are represented by d1(p1/p2,M) and d1(p1/p2,M). Finally, it is
assumed that the economy is small; therefore in the case of being open to international
trade the prices of the consumption goods will be given by the international markets.
2.2. The appropriation sector
Following Dal Bó & Dal Bó (2011), the existence of social conflict is introduced in this
model as a third sector that does not produce, but instead appropriates a share of the
total income or production of the economy by force, this sector is denominated the
“appropriation” sector. This paper develops a general case of the model of Dal Bó &
Dal Bó (2011)11
, in which the appropriation could use capital and labor as inputs in
order to appropriate income or production by force.
11
The authors present this general case in their appendix A.

16
The appropriation sector is formed by a number n of appropriation groups hiring labor
(li) and capital (ki) for their appropriation activities ai= ai(li,ki,), the total fraction of
wealth that is appropriated in the economy is a function A(a1+ a2+ a3+… +an), where
A(0)0 and A(a( K , L ))1. It is assumed that the amount that each group receives from
the total appropriated income in the economy is proportional to their effort ai. In this
sense, appropriation groups are entities in a similar way to the firms in a conventional
neoclassical model. Each group chooses li and ki at the minimum possible cost (Dal Bó
& Dal Bó, 2011). Moreover the appropriation sector must pay factor prices net of
appropriation, [1- A(.)]w and [1- A(.)]r; thus li,and ki are defined as the minimum cost
demand functions li(w/r, ai) and ki(w/r, ai). The total amount of labor and capital
allocated to appropriation by the n appropriation groups in the economy is represented
by LA and KA respectively.
In addition, it is assumed the appropriation sector is competitive12
and the different
group’s technology of appropriation (ai) has constant returns to scale. Nonetheless, the
aggregate share appropriated A(.) is strictly concave13
, thus A’(.)>0 and A’’(.) <0. This
could be justified as “congestion effects” caused by coordination failures among the
different groups (Dal Bó & Dal Bó, 2011 p. 650). The strict concavity is a key
assumption of the model and implies that the average revenue derived from
appropriation is decreasing in the amount of resources allocated to it.
Therefore, each group i maximizes its net revenue, given the endowments and the gross
factor prices defined in the production sectors of the economy, according to:
1 10
1
argmax ( ) ( ) ( ) 1 ( ) ( / , ) ( / , )i
in A A n i i i in
ajj
aA a a r K K w L L A a a rk w r a wl w r a
a
Taking the derivative of this expression establishes the first order conditions for
maximization. As usual, it is assumed the symmetry of the equilibrium for each group
(a1=… =an =a) in order to simplify the expression. Moreover, it is possible to exploit
the assumption for constant returns to scale in ai, which implies marginal costs are
constant and equal to mean costs. Finally, taking the limit of the resulting expression
12
The specific industrial organization setting of the appropriation sector does not affect the main
conclusions of the model. See the Appendix A of Dal Bó & Dal Bó (2011) for a detailed demonstration of
this result assuming an arbitrary number of N appropriation groups. 13
As highlighted by Dal Bó & Dal Bó (2011) the concavity assumption is made for convenience, the
result will hold with a linear function as long as A’() >0.

17
when n→∞, leads to the following expression (see the appendix A of Dal Bó & Dal Bó
(2011), for a detailed derivation of this expression).
( ) ( ) ( ) 1 ( ) ( ) ( )
( ) ( ( )) and ( ) ( ( ))
A A A A
A A
A r K K w L L A rK A wL A
where K A f A L A f A
(1)
Where α = limn→∞ na, establishes that the overall extraction effort14
among the groups
(a1+ a2+ a3+… +an = na) converges to a finite value. Moreover, KA{A(α)} and
LA{A(α)} stress that the total amount of resources diverted to appropriation activities is
a function of the total appropriative effort α and the effect over the total appropriation
share A(.).
The equation (1) is the equivalent of equation (5) in Dal Bó & Dal Bó (2011), for the
general case in which appropriation sector uses labor and capital for its activities; it then
has the same straightforward interpretation. The right-hand side of the equation
establishes that the total amount of income appropriated given the total appropriative
effort α should be equal to the economy-wide net payment (after appropriation) for the
total amount of resources diverted to the appropriation sector. Therefore, equation (1)
establishes a no-arbitrage condition in the economy and implicitly defines the amount of
resources allocated to the appropriation sector.
2.3. The equilibrium
The general equilibrium in this economy given the endowments of capital and labor and
the technologies of production and appropriation determines the quantities produced and
consumed q1, q2, d1, d2 and the equilibrium prices15
of the goods p1 and p2. Equally, the
resources allocation in the economy for the sectors of production (1 and 2) and the
appropriation (A) sector K1, L1, K2, L2, KA, LA and the gross factor prices of the economy
w and r.
Before proceeding, the minimum unit-cost input requirements in each industry (cij) are
defined as the minimum amount of input j necessary to obtain a unit of output i, given
the technologies of production and factor prices w and r. Therefore, the minimum unit
cost-input requirements cij are a function of the relative factor prices w/r.
14
The limn→∞ na must be finite given the limited amount of resources in the economy. If we interpret a as
the average appropriative effort of the n groups; then when n increases the average appropriative effort
must decrease. 15
As will be shown later; for the open economy case prices are set in the international markets given the
assumption of a small economy.
18
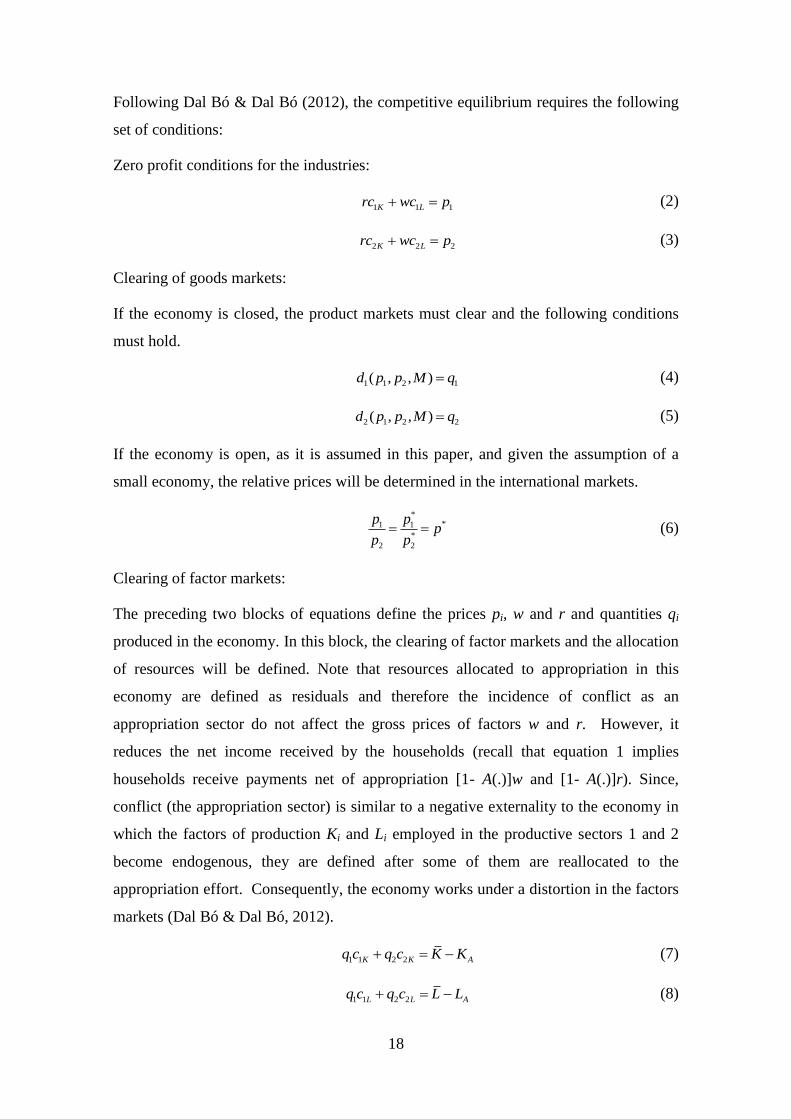
Following Dal Bó & Dal Bó (2012), the competitive equilibrium requires the following
set of conditions:
Zero profit conditions for the industries:
1 1 1K Lrc wc p (2)
2 2 2K Lrc wc p (3)
Clearing of goods markets:
If the economy is closed, the product markets must clear and the following conditions
must hold.
1 1 2 1( , , )d p p M q (4)
2 1 2 2( , , )d p p M q (5)
If the economy is open, as it is assumed in this paper, and given the assumption of a
small economy, the relative prices will be determined in the international markets.
*
*1 1
*
2 2
p pp
p p (6)
Clearing of factor markets:
The preceding two blocks of equations define the prices pi, w and r and quantities qi
produced in the economy. In this block, the clearing of factor markets and the allocation
of resources will be defined. Note that resources allocated to appropriation in this
economy are defined as residuals and therefore the incidence of conflict as an
appropriation sector do not affect the gross prices of factors w and r. However, it
reduces the net income received by the households (recall that equation 1 implies
households receive payments net of appropriation [1- A(.)]w and [1- A(.)]r). Since,
conflict (the appropriation sector) is similar to a negative externality to the economy in
which the factors of production Ki and Li employed in the productive sectors 1 and 2
become endogenous, they are defined after some of them are reallocated to the
appropriation effort. Consequently, the economy works under a distortion in the factors
markets (Dal Bó & Dal Bó, 2012).
1 1 2 2K K Aq c q c K K (7)
1 1 2 2L L Aq c q c L L (8)
19
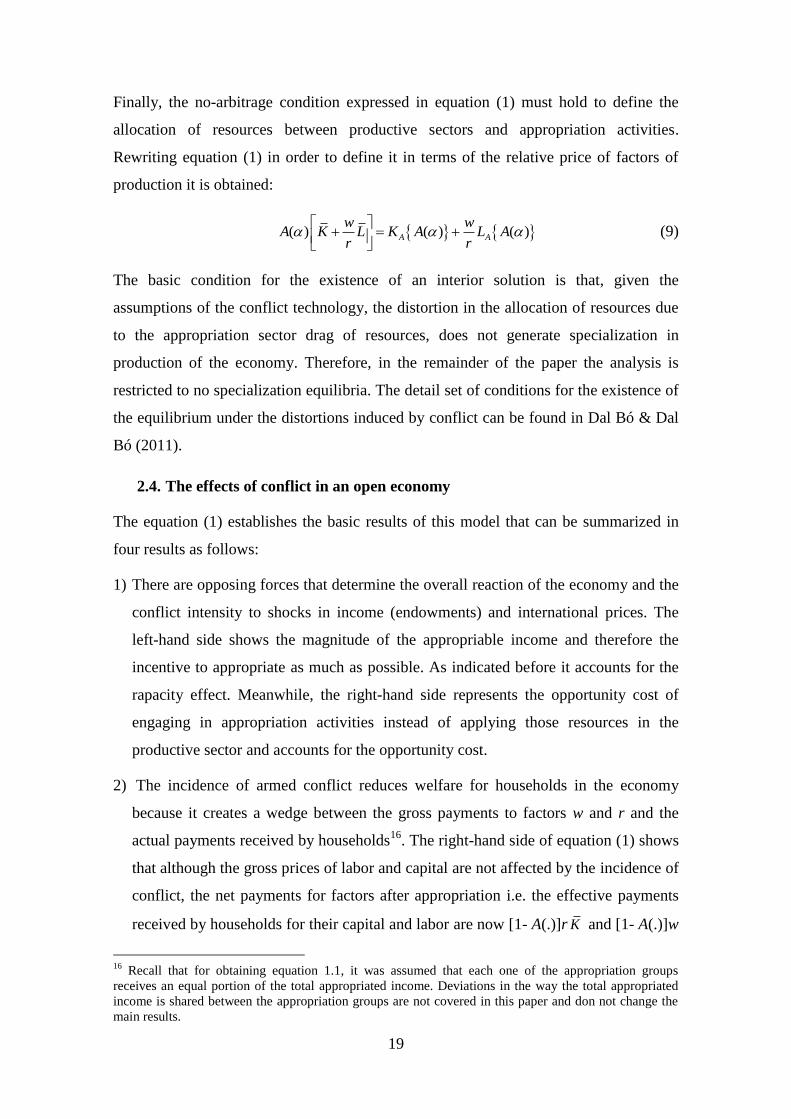
Finally, the no-arbitrage condition expressed in equation (1) must hold to define the
allocation of resources between productive sectors and appropriation activities.
Rewriting equation (1) in order to define it in terms of the relative price of factors of
production it is obtained:
( ) ( ) ( )A A
w wA K L K A L A
r r
(9)
The basic condition for the existence of an interior solution is that, given the
assumptions of the conflict technology, the distortion in the allocation of resources due
to the appropriation sector drag of resources, does not generate specialization in
production of the economy. Therefore, in the remainder of the paper the analysis is
restricted to no specialization equilibria. The detail set of conditions for the existence of
the equilibrium under the distortions induced by conflict can be found in Dal Bó & Dal
Bó (2011).
2.4. The effects of conflict in an open economy
The equation (1) establishes the basic results of this model that can be summarized in
four results as follows:
1) There are opposing forces that determine the overall reaction of the economy and the
conflict intensity to shocks in income (endowments) and international prices. The
left-hand side shows the magnitude of the appropriable income and therefore the
incentive to appropriate as much as possible. As indicated before it accounts for the
rapacity effect. Meanwhile, the right-hand side represents the opportunity cost of
engaging in appropriation activities instead of applying those resources in the
productive sector and accounts for the opportunity cost.
2) The incidence of armed conflict reduces welfare for households in the economy
because it creates a wedge between the gross payments to factors w and r and the
actual payments received by households16
. The right-hand side of equation (1) shows
that although the gross prices of labor and capital are not affected by the incidence of
conflict, the net payments for factors after appropriation i.e. the effective payments
received by households for their capital and labor are now [1- A(.)]r K and [1- A(.)]w
16
Recall that for obtaining equation 1.1, it was assumed that each one of the appropriation groups
receives an equal portion of the total appropriated income. Deviations in the way the total appropriated
income is shared between the appropriation groups are not covered in this paper and don not change the
main results.

20
L . Therefore, in a conflict the owners of factors of production are worse off, in this
sense the model do not account for the rationality of the existence of an internal
armed conflict (the appropriation sector). Instead, it focuses on the effects of a given
conflict over the economy.
3) For a small open economy with internal armed conflict, there will be a relative
decrease in the production of the sector that intensively use the same factor of
production in which the technology of the appropriation is relatively intense. This
result is derived directly from the application of the Rybczynski theorem
(Rybczynski, 1955). As noted earlier equations (7) and (8) define the allocation of
resources to appropriation as residuals, in other words, they could be interpreted as
an endogenous change in the endowments of the productive sectors of the economy.
Therefore, given the international prices, if the appropriation sector is labor (capital)
intensive the relative endowment of the economy ( K -KA)/( L -LA) is larger (smaller)
than the relative endowment without conflict K / L . As a result, there is a relative
increase in the production of the sector that uses capital (labor) intensively in its
production process, as long as both goods are produced. This change in the conflict
relative endowment could be so important that might potentially change the patterns
of trade of the economy (Dal Bó & Dal Bó, 2012).
4) Given the above assumptions, a relative increase (decrease) in the price of the good
produced by the industry that intensively uses the same factor of production in which
the appropriation sector is relatively intense will reduce (increase) the conflict
intensity. This result follows in two parts; first the Stolper-Samuelson Theorem
(Stolper & Samuelson, 1941) establishes that an increase in the relative price of a
good will increase the relative price of the factor used intensively by the industry that
produces it. The second part implies that the total appropriation effort decreases
when there is an increase in the relative price of the factor used intensively in the
appropriation sector.
Formally, it is necessary to establish the determinants of the sign of the derivative of
A(.) with respect to a change in the relative prices of factors (w/r) in equation (9).
Taking the derivative on both sides of the equation, taking into account that A(.) is a
function the total appropriation effort α and rearranging:

21
( ) ( )
( / ) ( )
A
A A
L A A Ld
d w r dK dLdA w wK L
d r d r d
Using the equation (9) to replace A(α) and K w r L , note that:
( ) ( )
( )A A
wK A L A
rAw
K Lr
and ( ) ( )
( )
A A
wK A L A
w rK Lr A
Replacing this expressions the following equation is obtained, where the functional
definition of KA{A(α)} and LA{A(α)} is omitted for convenience.
( ( ))
( / )( )
( )
A A
A
A AA A
wK L
rL A Lw
K Ld r
wd w rK L
dK dLdA wr
d A d r d
(10)
The denominator of the equation (10) is negative given the assumption of concavity
in the appropriation function A(), i.e. the overall appropriation costs are convex, and
realizing that the terms in brackets are the difference between the average cost of the
appropriation share in the economy and the marginal cost of it. This difference will
be negative because the marginal cost of the appropriation activity will grow faster
than the average cost17
. The numerator of this expression will determine the sign of
the derivative; it can be shown easily that it will be positive or negative depending on
the relative factor intensity of the appropriation sector compared to the relative factor
endowment of the economy.
0( / )
0( / )
A
A
A
A
KK dif
L L d w r
KK dif
L L d w r
(11)
Therefore, if the international relative price of the labor intensive good increases (and
leading to an increase in w/r too, following the Stolper-Samuelson theorem) and the
17
Note that, as mentioned before, strict concavity of A() is assumed for simplicity, quasiconcavity will
lead to the same result, although after some value of α, the congestion effects kick in and there should be
a reduction in the average revenue of appropriation.

22
conflict sector is labor-intensive compared to the economy, there will be a reduction
in conflict intensity. The opportunity cost dominates the direct incentives to
appropriate (rapacity), or in the opposite case where the appropriation technology is
capital-intensive it is expected an increase in conflict intensity.
The preceding third and fourth results have important implications for the empirical
analysis of the effects of trade flows on economies affected by internal conflict as well.
It is safe to assume the most plausible case in which the appropriation sector is labor-
intensive relative to the economy, but the economy is still labor-intensive relative to the
world, as it is the case of most developing economies. There will be a relative increase
in the production of industries that are capital-intensive as a consequence of the
incidence of conflict, i.e. the conflict is affecting the relative endowment of the
economy.
Moreover, it would also be expected that any negative shock to the relative prices of the
labor-intensive goods will have a broader effect on conflict economies. First, the
conflict will reduce the production in the economy especially the labor intensive sector
due to terms of trade deterioration, but the reduction in relative wages could also
increase the magnitude of the conflict and potentially generate a broader negative effect
on the overall production of the economy.
The results above have important implications concerning the main objective of this
paper. Some a priori inefficient interventions could be efficiency enhancers of overall
production, and therefore welfare improving if the incidence of conflict is accounted
for, e.g. like the introduction of trade restrictions to protect labor-intensive sectors, or
factor tax-subsidy schemes.
2.5. Trade policy and conflict
The implications of the model presented above derive into policy implications for
countries under the incidence of armed conflict. Dal Bó & Dal Bó (2011) show several
policy options that would have positive effects for the economy under conflict distorted
markets. One policy suggested by the authors is the imposition of tariffs for the imports
of the labor-intensive good given that is the the same factor of production that is used
intensively in the appropriation sector. The predicted effect is readily derived from the
main results of the model presented above, and proceeds as follows:

23
In the presence of tariffs for goods 1 and 2, the relative prices in equation (6) could be
represented as:
**11
*
2 2
(1 ) (1 )
(1 ) (1 )
k k
l l
p t tpp
p p t t
Assuming that tl > tk implies that the sector that produces the labor-intensive good is
relatively more protected that the capital-intensive sector, in the simpler case it could be
assumed that tl >0 and tk =0. The first effect of this setting derives from the Stolper-
Samuelson theorem and therefore it is expected that the relative price of labor (w/r) will
increase as well. The net effect clearly depends on the relative factor intensity of the
appropriation sector compared to the total economy as shown in result 4 in section 2.4.
In the most plausible case, in which the appropriation sector is labor-intensive compared
to the whole economy, there will be a reduction in the negative effects of conflict in the
economy. This is explained by a reduction to the incentives to appropriate due to an
increase in the opportunity cost as a result of the new tariff scheme, as could be deduced
from equations (10) and (11).
Moreover, going back to the third result in section 2.4 above, under positive levels of
conflict there is an excessive production of the capital-intensive good. Therefore, based
on the Rybczynski theorem, the increase of relative price of labor induced by tariffs will
generate an increase in the production of the relatively labor-intensive good (q2), as a
consequence of the reduction in the distortion induced to the terms of trade by the
appropriation activities (conflict). The total effect suggests a marginal increase in the
total production of the economy mainly due to a reduction in conflict levels.
Therefore, the first hypothesis derived from the theoretical framework could be stated
as:
For countries under the distortion of an armed conflict, if a tariff protecting the
labor-intensive sector, relative to the capital-intensive one, is introduced, the
negative effect of the conflict to the overall production of the economy should be
reduced.
However, what could be the expected magnitude of this effect? It is possible that the
appropriate tariff structure could even eliminate conflict in this setting? As explained
previously, internal armed conflicts could be considered as an “autonomous” distortion
that diverts factors of production from production activities into the appropriation

24
sector. In this case, tariff interventions would be dominated by other kind of
interventions, the most efficient one would be a tax-subsidy scheme in the capital and
labor markets directed to increase the demand of labor in the productive sectors.
Moreover, there are no price interventions (tariffs or price taxes and subsidies schemes)
that could eliminate the incentive for appropriation completely and therefore return the
economy to the undistorted production possibility frontier18
as shown by Dal Bó & Dal
Bó (2012).
Therefore, the second hypothesis derived from the theoretical framework is:
For countries under the distortion of the armed conflict, the effect of any tariff
intervention that could reduce the conflict burden on the economy should have a
relatively low effect and could not eliminate the direct effect of conflict
completely.
3. Methodology
3.1. Indicators of the structure of tariff protection
The structure of tariff protection for the sample is measured using the difference
between the average tariffs applied to labor-intensive goods and the average tariffs
applied to the non-labor-intensive goods
(1 )
ln ln(1 ) ln(1 )(1 )
ll l
k
tDIFFtlab t t
t
(12)
However trying to link theory with evidence is difficult due to the lack of an exact
definition of goods that could be considered as labor-intensive. In a similar way to the
indicators employed by Nunn & Trefler (2010), two different measures to approximate
the level of bias in tariffs towards the labor-intensive sectors (labor-bias-of-tariffs
measures) were computed. The first measure Diff_Agriculture considers the agriculture
sector as the products classified in the Division 1 of the International Standard Industrial
Classification of Goods (ISIC) Rev. 2. and covers agriculture, hunting, forestry and
fishing sectors and the non-agricultural sector that includes the remaining products.
The second proposed measure Diff_Lintensive tries to address the labor intensity of
goods directly using the index of relative capital intensity (RCI) at the product level
18
See proposition 6. in (Dal Bó & Dal Bó, 2012).

25
(digits 4 and 5) of the Standard International Trade Classification of Goods (SITC) Rev.
1. produced by Shirotori et al. (2010). The index of relative capital intensity is measured
as real capital per worker, in 2000 US dollars from 1962 to 2007 in its last update19
. The
values of the index for the year 2000 were used as the benchmark year for the
calculations in this paper. The relative factor intensity of a product is calculated using
the weighted average factor abundance of countries that export this good, giving more
weight to the countries that show more revealed comparative advantage20
in the export
of the product (Shirotori et al., 2010).
Following the methodology proposed by Shirotori et al. (2010), the 1165 products of the
SITC Rev.1. were divided into five clusters using the means partition-clustering
method21
, and organized from the less to the more capital-intensive products. Therefore,
the products classified in clusters 1 or 2 (217 products) are considered relatively labor-
intensive and products classified in cluster 5 are considered capital-intensive (392
products)22
. The following table shows a summary of the resulting divisions using this
method.
Table 1. Summary products classified according to capital intensity-RCI
(Values in US dollars from 2000)
Clusters Mean Median
(p>50%) S.D. Min Max N
1 11,331.1 12,464.1 4,357.9 1,987.8 17,015.1 67
2 29,352.4 29,780.5 5,949.3 17,587.2 39,349.3 150
3 54,542.0 54,493.1 8,212.6 39,534.0 68,070.3 237
4 86,102.9 86,008.2 10,522.6 68,285.8 104,578.3 319
5 128,809.5 126,468.3 16,174.6 104,874.2 204,931.6 392
Total 82,445.2 81,922.8 40,962.1 1,987.8 204,931.6 1165
Source: Authors calculations, based on data from Shirotori et al. (2010).
3.2. Empirical specification
The theoretical framework previously exposed leads to some empirically testable
results. Specifically, we could estimate the potentially non-linear effects of trade policy
on income growth in countries affected by internal armed conflict. In order to evaluate
these effects in a sample of countries, a canonical cross-country growth regression will
19
Available at http://www.unctad.info/en/Trade-Analysis-Branch/Data-And-Statistics/Other-Databases/ 20
The comparative advantage in assessed using the Balassa’s revealed comparative advantage index. 21
The optimal division into five clusters was determined using the stopping rule of the Duda and Hart
indices. 22
Tables in Annex 2. show a more detailed division of the products. The complete list is available upon
request.

26
be performed using non-overlapping five years spans of data from 1986 to 201023
for an
unbalanced panel of 107 countries24
. The sample period and country coverage is
restricted by the availability of tariff data.
The selected five-year length of the spans follows the empirical application proposed by
Barro (1997), who argues that the cross-country growth regression model relates to
long-term growth. Therefore, the high frequency (yearly) data could be dominated by
the short run dynamics making it prone to measurement error bias (Durlauf et al., 2005).
Following Durlauf et al. (2005), the regression equation is defined as:
; , 0 , 1 , 2 , 3 , ,ln *i t t p i t p it p i t i t i t i t
it p i t it
y X iac DIFFtl iac DIFFtl
Z
(13)
Where γi,t,t-p represents the average annual growth rate of GDP per capita in country i
between periods t and t-p. The GDP per capita is measured in terms of the employed
population, and accounts for product per worker as in Durlauf et al. (2008). The variable
yi,t-p accounts for the initial GDP per capita level on each five-year span and captures
the conditional convergence in income levels. The vector Xit includes variables that
capture the other neoclassical (Solow) determinants of economic long run growth i.e. it
includes proxies for fixed and human capital accumulation.
In a similar way, the vector Zit accounts for the control variables and includes proxies
for the other “proximate” or “fundamental” determinants of economic growth according
to the distinction made by Durlauf et al. (2008) and Acemoglu (2008). The regression
equations include a series of country-specific effects captured by the parameters αi that
can be assumed to be fixed and control for unobserved heterogeneity and omitted
variables bias. The parameters μt are time fixed effects and capture exogenous
productivity shocks at world level and other common fluctuations like shocks to world
commodity prices. Finally, it accounts for the error term in the equation.
The coefficients of principal interest are the parameters i, these parameters capture the
effects on economic growth from the conflict and tariffs variables. The variable iacit is a
proxy of the incidence or the intensity of an internal armed conflict during the period
while the variable DIFFtlit denotes the measures of labor-bias-of-tariffs.
23
The spans are defined as 1986-1990, 1991-1995, 1996-2000, 2001-2005, 2005-2010. 24
The sample is relatively balanced between developed and developing countries. Among the 107
countries, 47 are high-income economies according to the World Bank´s income categories and the
remainder are classified as medium and low-income economies.
27
According to the theoretical framework proposed, it is expected that the measures of
labor-bias-of-tariff are positively associated with income growth through the effect on
reducing conflict. However, if the conflict variable is not included as a control, it is
expected that the point estimates of the labor-bias-of-tariffs measures should be biased
downwards. Once controlling for conflict and according to the null hypothesis
proposed, the estimate for any of the labor-bias-of-tariff measures should be positive.
Moreover, the estimated coefficient of the interaction term between the labor-bias-of-
tariff measure and the proxy for conflict should capture the marginal reduction in the
negative effects of conflict over the income growth rate. Therefore, the estimated
coefficient of the interaction term is expected to be positive, although insignificant or its
estimated value could not imply a cancelling out of the direct effects of conflicts on
growth, according to the second hypothesis proposed. As will be shown in the results
section, the main specification is also adjusted to include the average tariff as a control,
in order to isolate the effect of the labor-bias-of-tariffs measures.
The equations are estimated using the ordinary least squares method on a fixed effects
panel data estimator. Moreover, the variance-covariance matrix is estimated using the
robust to heteroskedasticity estimator (Huber-White) and the errors are clustered at
country level in order to allow for intragroup autocorrelation. The use of a random
effect estimator is avoided because the theoretical and dynamic construction of the
growth regression equations implies a non-zero correlation between the explanatory
variables and the individual effects (Durlauf et al., 2005), violating the principal
assumption of the estimator. Moreover, it is considered that the country-fixed and time
effects would minimize the possible bias due to omitted variables.
The bias related to measurement error could be an important issue when working with
data for conflict-affected countries (Collier & Hoeffler, 2004; Montalvo & Reynal-
Querol, 2005). The measurement error is reduced by the empirical design using five-
year period averages and, as long as the measurement errors occur in a random way, the
estimated coefficients will be biased towards zero. Then, this allows to an interpretation
of any finding of significant estimates as lower bounds for actual parameters. This is
especially important when dealing with the different variables in order to measure the
incidence of conflict (Gardeazabal, 2012). Moreover, it is also expected to incur in
measurement error bias when calculating the average of applied tariffs rates for each

28
span given the large proportion of missing data for this variable; this will be discussed
further in the data sources section.
In order to reduce the incidence of reverse causality bias, the investment rate and
population growth are included in the equations as lagged variables, in addition the
human capital accumulation proxies are included as initial period values. The estimation
methodology does not instrument the endogenous variables using lags of the variables
like Durlauf et al. (2008), but rather they are included as predetermined (lagged values)
which is equivalent to a reduced form specification. Thus, the initial GDP per capita, the
population growth, and the proxies for fixed and human capital accumulation constitute
the baseline regressors of the empirical specification.
However, the reverse causality bias is not completely addressed in this paper. Firstly, as
mentioned in the literature review income levels and growth are related with the onset
and incidence of internal armed conflict, therefore a case of reverse causality. Secondly,
other endogeneity-related shortcoming arises from the dynamic specification of the
model, which leads to a dynamic panel data bias (Durlauf et al., 2005). The Dynamic
GMM (Arellano & Bond, 1991) and System GMM (Blundell & Bond, 1998) estimation
procedures have been applied to deal with a dynamic specification in panel data as well
as for the reverse causality problems of the covariates and constitute an avenue for
future research25
. However, it is not clear that instruments based only on lags of the
variables will allow for proper identification of effects without imposing strong
assumption of the dynamic relations among the variables. Therefore, the estimations
could be improved if there is an opportunity to exploit external instruments (Angrist &
Pischke, 2009; Durlauf et al., 2005).
Finally, in the case of the tariffs related variables it is considered that any bias related
with reverse causality arising from income growth should be relatively low and
therefore is not a big concern. The idea of conceiving tariffs as exogenous variations
relative to growth comes from two recent empirical analyses. First, Rose (2013) argues
that tariffs have become systematically independent from the economic cycles in the
period after the Second World War. In addition, Estevadeordal & Taylor (2013) use
instrumental variables to account for the possible endogeneity of tariffs in a growth
25
Initial applications of this methodology showed that the number of instruments is relatively high
compared with the number of observations in the sample. Estimations using the System GMM estimator
imply use around 159 instruments in a sample of 224 usable observations after first differencing.

29
regression and finds no significant difference in their estimations with respect to OLS
estimates. Moreover, Nunn & Trefler (2010) argue that theoretically tariffs will be more
related to the structure of the economy and the political process as in the protection for
sale model of Grossman and Helpman (1994), and not necessarily to overall income
growth.
To summarize the discussion about the estimation methods employed in this paper, the
results should be interpreted as an empirical investigation of the main hypothesis
derived by the theoretical model developed previously, rather than an inference of a
causality effect among the variables.
3.3. Data sources and variables description
3.3.1. Internal armed conflict data
The first problem that any research project related to internal armed conflicts faces is
the definition of conflict itself. Most of the available systematic collection of
information about internal armed conflicts relies on the definition of conflict as an
incompatibility between two or more organized parties, one of them being a state; that
results in the use of armed force and battle-related deaths. Moreover, it is usual practice
to use the imposition of a minimum threshold of battle-related deaths (Gleditsch et al.,
2002). However, the discussion of a proper definition of internal armed conflict is
outside the scope of this paper.
The second issue that arises working with internal armed conflict data; relates to the
appropriate indicator to be used. The researcher has to decide whether to use a measure
of the onset of armed conflict or a measure of incidence of it instead. For the purposes
of this paper, and given that the theoretical model employed do not account for the onset
of armed conflicts, the variables used will be related to the incidence of these events.
The internal armed conflict data comes from the Internal Wars and Failures of
Governance 1955-2012 database produced by the Political Instability Task Force
Project26
; the database is described in Goldstone et al. (2010). This database lists
information about revolutionary wars, ethnic wars, adverse regime changes, and
genocides and political assassinations. Only the datasets for ethnic and revolutionary
wars were employed in this research. The threshold identifications of an internal armed
conflict (termed as civil wars in the database) are: each party must mobilize at least
26
Available at the Center for Systemic Peace web page: http://www.systemicpeace.org/inscrdata.html
30
1000 armed agents (troops). Additionally, there should be at least 1000 direct conflict-
related deaths since the onset of the conflict. Moreover, the annual conflict-related
deaths should be greater than 100 fatalities in at least one year during the course of the
conflict (Marshall et al., 2014).
The advantage of the Internal Wars and Failures of Governance 1955-2012 database is
that it provides indexes of existence and intensity of civil war according to three
characteristics, based on public information about the conflicts and analyst judgment of
the Political Instability Task Force Project (Marshall et al., 2014). The three
characteristics are the number of rebel combatants or activists, the annual number of
fatalities related to fighting and the portion of the country affected by fighting. Finally,
the three indicators are combined to calculate an “average magnitude of conflict”
measure (Avemag). The indexes range from 0 (peace) to 4 (high-intensity conflict) in a
discrete scale, the average magnitude of conflict index changes in 0.5 units27
. Based on
the Avemag variable, two dummy variables identifying incidence of ethnic or
revolutionary conflicts were constructed (Statefailcw). In an analogous way, it is
possible to obtain the same variables discriminated among revolutionary (Avemagrev
and Statefailcwrev) and ethnic conflicts (Avemagethn and Statefailcwethn). However,
the focus of the research is centered on the aggregate measures.
Another widely used database in the recent literature of internal armed conflict is the
UCDP/PRIO Armed Conflict Dataset 1946-2012 version 4-201328
described in
Gleditsch et al. (2002). However, in this database conflicts are defined with a minimum
threshold of 25 battle-related deaths. The additional information this database could
provide, compared to the Political Instability Task Force Project, is about the marginal
effects of conflict which might not necessarily be relevant from an economy-wide
perspective (Imai & Weinstein, 2000). The UDCP/PRIO also produces a database of
battle-related deaths, the UCDP Battle-Related Deaths Dataset 1989-2012 version 5-
201329
. The dataset includes a "best" estimate of the fatalities of a conflict based on
publicly available data; when there are missing values for the best estimate, the average
between the low and high estimates is used instead. The variable Battledeaths accounts
for battle-related deaths in millions of casualties. However, the results employing this
27
For details about the coding and methodology see: Marshall et al. (2014) available at:
http://www.systemicpeace.org/inscr/PITFProbSetCodebook2013.pdf 28
Available at: http://www.pcr.uu.se/research/ucdp/datasets/ucdp_prio_armed_conflict_dataset/ 29
Available at: http://www.pcr.uu.se/research/ucdp/datasets/ucdp_battle-related_deaths_dataset/
31
variable were mostly not statistically significant as will be discussed in the results
section.
3.3.2. Tariffs data
The tariffs data comes from the Trade Analysis and Information System (UNCTAD30
-
TRAINS) database using the World Integrated Trade Solution (WITS) software from
the World Bank31
. The UNCTAD–TRAINS database covers around 160 countries since
1988 to 2011; however, the actual reporting for each year varies considerably (Table 2
shows the availability of the data). In order to reduce the loss of data, especially for the
span 1986-1990, the averages for tariffs were calculated allowing for some missing
values as follows: for the first span 1986-1990, the average was calculated allowing for
missing values without restriction. For the latter spans, the averages were calculated
allowing for a maximum of two missing values.
There is no guide in the literature about the proper way of working with tariff data on
periods prior the closing of the Uruguay Round that led to the creation of the World
Trade Organization (WTO) in 1995 and therefore to the systematic collection and
reporting of tariff data. However, Estevadeordal & Taylor (2013) and Nunn & Trefler
(2010) use periods of around three years to calculate the initial values for the tariff data
they employ in their analyses. Therefore, the approach employed here is considered
appropriate.
In all the calculations, the “applied” ad valorem tariffs, i.e. including regional and
bilateral preferences, are used instead of the Most Favored Nation (MFN) tariffs. It is
considered that applied tariffs are a better indicator of the trade policy stand of a
country, especially in the last two decades where there was a huge increase in regional
trade agreements. For instance, by mid-2014 the WTO reports that 379 regional trade
agreements were in force (The World Bank, 2014a). Finally, for the cases in which
there are specific tariffs for certain products, the equivalent ad-valorem tariffs using the
UNCTAD method option in WITS was selected32
.
Table 2. Number of countries reporting data in UNCTAD-TRAINS database
Year Number of Countries
Reporting
30
Acronym for United Nations Conference on Trade and Development. 31
Available at https://wits.worldbank.org/WITS/WITS/Restricted/Login.aspx 32
See http://wits.worldbank.org/WITS/docs/AVEmeth.doc for more information.
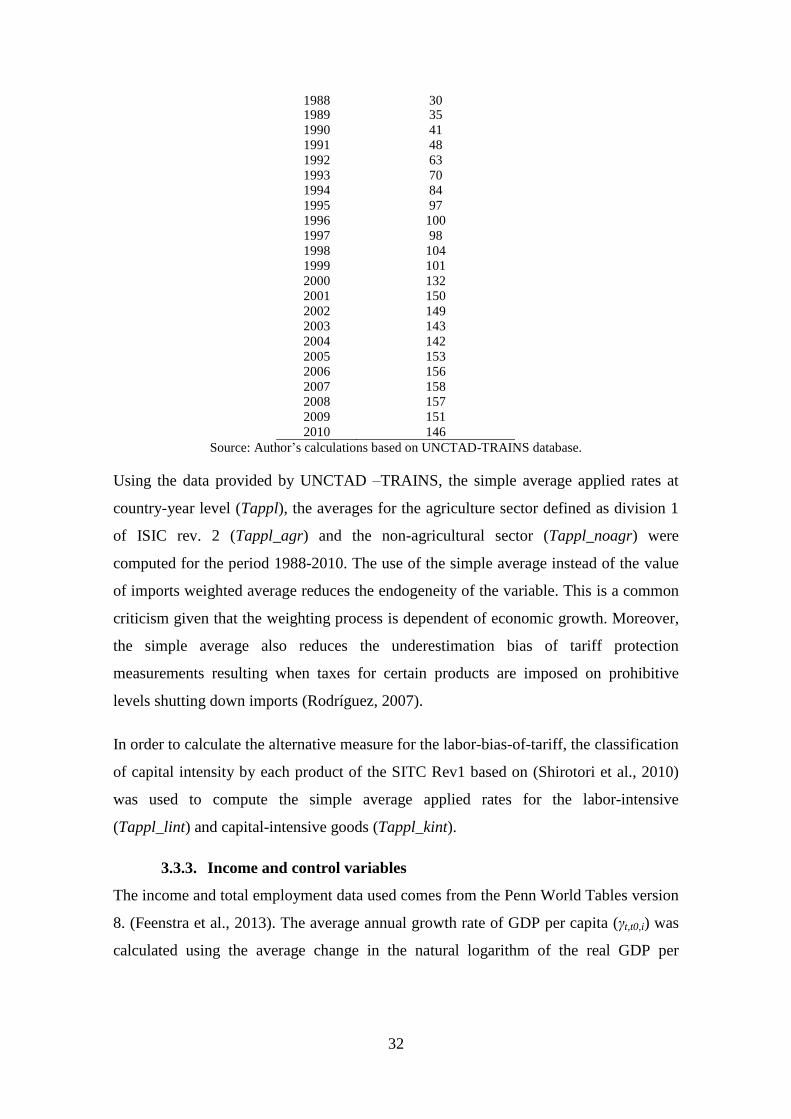
32
1988 30 1989 35
1990 41 1991 48
1992 63
1993 70 1994 84
1995 97 1996 100
1997 98
1998 104 1999 101
2000 132 2001 150
2002 149 2003 143
2004 142
2005 153 2006 156
2007 158 2008 157
2009 151
2010 146
Source: Author’s calculations based on UNCTAD-TRAINS database.
Using the data provided by UNCTAD –TRAINS, the simple average applied rates at
country-year level (Tappl), the averages for the agriculture sector defined as division 1
of ISIC rev. 2 (Tappl_agr) and the non-agricultural sector (Tappl_noagr) were
computed for the period 1988-2010. The use of the simple average instead of the value
of imports weighted average reduces the endogeneity of the variable. This is a common
criticism given that the weighting process is dependent of economic growth. Moreover,
the simple average also reduces the underestimation bias of tariff protection
measurements resulting when taxes for certain products are imposed on prohibitive
levels shutting down imports (Rodríguez, 2007).
In order to calculate the alternative measure for the labor-bias-of-tariff, the classification
of capital intensity by each product of the SITC Rev1 based on (Shirotori et al., 2010)
was used to compute the simple average applied rates for the labor-intensive
(Tappl_lint) and capital-intensive goods (Tappl_kint).
3.3.3. Income and control variables
The income and total employment data used comes from the Penn World Tables version
8. (Feenstra et al., 2013). The average annual growth rate of GDP per capita (γt,t0,i) was
calculated using the average change in the natural logarithm of the real GDP per

33
worker33
at constant 2005 national prices in millions of US dollars of 2005. The initial
income per capita corresponds to the natural logarithm of the output-side real GDP per
capita at chained purchasing power parity (PPP) in millions of US dollars of 2005
(lnGDPpc initial). The use of national accounts data to calculate the growth rates and
PPP adjusted values for the convergence terms follow the recommendations of Feenstra
et al. (2013).
The vector Xit accounts for the neoclassical determinants of economic long run growth;
it includes the investment rate (lnSk) and the population growth over each period (), the
source for both variables is the Penn World Tables version 8. The human capital
accumulation proxies include the natural logarithm of the average years of schooling for
population aged 15 and over (lnSchool) calculated by Barro & Lee (2013) and the
logarithm of life expectancy at birth (lnLexpect) from the World Bank World
Development Indicators database (The World Bank, 2014b)34
.
In order to control for possible biases due omitted variables that are relevant for income
growth, several proxies for the proximate and fundamental causes for growth where
considered. The proposed variable in order to account for the effect of institutions is the
Index of Legal Structure and Security of Property Rights from the Economic Freedom
of the World Report, published by the Fraser Institute35
. The index ranges from 0-10
where 0 corresponds to the lowest level of Legal Structure and Security of Property
Rights and 10 to the highest (Gwartney et al., 2012). Regarding the variables that proxy
for the other fundamental causes of growth like geographical or cultural factors, the
usual controls employed in the literature are mostly time invariant, therefore they
already accounted for by the country-specific effects.
Among the proximate causes related to the macroeconomic environment a measure of
price of household consumption volatility (inflation volatility) in the period and the
lagged value of the Government consumption share over GDP (lnGovtt-1) are included,
the source of this data is the Penn World Tables Database version 8. Finally, the initial
level of trade in goods and services over GDP (lnTradeinitial) for each span is included in
order to account for the effects of openness of the economy and comes from the from
33
Then average growth rate of Y is equal to(ln(Yt)-ln(Yt-4))/4. 34
Data retrieved form the World Bank Data web page http://data.worldbank.org/data-catalog/world-
development-indicators on 7th August 2014. 35
Avilable at http://www.freetheworld.com/datasets_efw.html. Another widely used indicators like the
World Bank World Governance Indicators (Kaufmann et al., 2010), were not considered because the
period coverage of the data begins in 1996.

34
the World Bank World Development Indicators. The next table presents a summary
statistics of the data for the 107 countries included in the sample.
Table 3. Summary statistics for the countries in the sample VARIABLES Mean S.D. N. Min Max
GrowthGDPpc (5 year span) 0.0157 0.0319 525 -0.1552 0.2104
GDPpcinitial year of span 29069.7 27115.0 525 575.6 176577.6
Skt (Inv. Rate) 21.14 7.87 525 1.59 49.89
Schoolinitial year of span 7.26 2.84 535 0.78 12.86
Lexpectinitial year of span 68.60 9.61 535 42.12 85.16
t (Pop. Growth Rate) 0.0148 0.0140 527 -0.0553 0.1466
Tapplt 0.0819 0.0979 257 0.0 1.0540
Tappl_agrt 0.0855 0.0925 257 0.0 0.8757
Tappl_noagrt 0.0816 0.0986 257 0.0 1.0625
Tappl_lintt 0.0825 0.0988 257 0.0 1.1437
Tappl_kintt 0.0595 0.0788 257 0.0 0.7472
Diff_Agriculturet 0.0035 0.0410 257 -0.1283 0.2038
Diff_Lintensivet 0.0205 0.0278 257 -0.0534 0.2121
Statefailcwt 0.1813 0.3856 535 0.0 1.0000
Statefailcw Revolutionaryt 0.0617 0.2408 535 0.0 1.0000
Statefailcw Ethnict 0.1439 0.3513 535 0.0 1.0000
Avemag IACt 0.3379 0.8160 535 0.0 3.4000
Avemag Revolutionaryt 0.1144 0.5120 535 0.0 3.4000
Avemag Ethnict 0.2553 0.7018 535 0.0 3.4000
Battledeathst 0.0009 0.0039 535 0.0 0.0577
Leg. Str. & Prop. Rights initial for span 6.11 1.99 449 1.42 9.62
Trade initial year of span 82.99 55.03 515 12.01 430.36
Govtt-p 0.1817 0.0866 535 0.0 0.6538
Inflation Volatilityt 0.0676 0.0668 525 0.0 1.0963
Source: Author’s calculations based on: Political Instability Task Force Project. UCDP/PRIO. UNCTAD-
TRAINS database. Penn World Tables version 8. Barro & Lee (2013). World Bank World Development
Indicators database. The Fraser Institute.
4. Results
The theoretical framework suggests that the measures of labor-bias-of-tariffs should be
positively associated with income growth especially if countries are affected by armed
conflict, which is the first null hypothesis explored in this paper. The Graph 2 shows the
scatterplots of the relation between the 5 year average annual growth rate of GDP per
capita in the Y-axis36
and the constructed measures of labor-bias-of-tariffs in the
agricultural and labor-intensive sectors respectively in both of the X-axes for the 107
countries included in the sample during the 5 spans defined over the period 1986 to
2010.
As can be seen in Graph 2, there is not a clear relation between the labor-bias-of-tariffs
measures and income growth rates for the sample considered. Although, the estimated
36
As explained earlier, measured by the average annual log change in per capita GDP over the duration of
each span.

35
Pearson correlation coefficients are positive for both measures (represented by the
straight lines in both graphs), none of the point estimates is statistically significant at
95% confidence.
Graph 2. Labor-bias-of-tariffs and income growth
Source: Author’s calculations based on: Political Instability Task Force Project. Penn World Tables
version 8.
However, according to the proposed hypotheses the lack of apparent relation between
the variables could be explained by the fact of not accounting for the incidence of
conflict. The Graph 3 shows the same scatterplots for the five-year average annual
growth rate of GDP per capita and the measures of labor-bias-of-tariffs. Although in this
case, only the country-year observations in which there is an active conflict are included
(i.e. Statefailcw=1).
Graph 3. Labor-bias-of-tariff and growth in conflict episodes
-.15
-.1
-.05
0
.05
.1.1
5.2
-.15 -.1 -.05 0 .05 .1 .15 .2Differential Protection Agri. Avg. 5 years
-.15
-.1
-.05
0
.05
.1.1
5.2
-.05 0 .05 .1 .15 .2 .25Differential Protection Labor Intensive Avg. 5 years
Fitted values GDP per capita (emp) growth 5 years
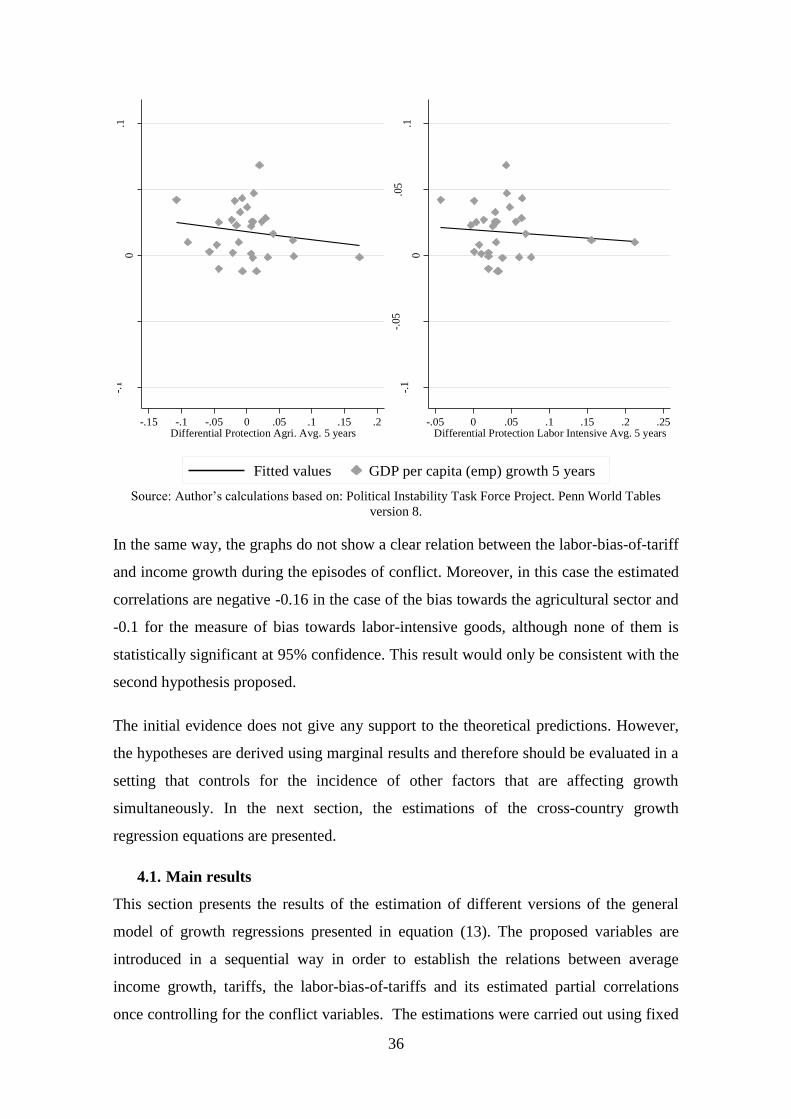
36
Source: Author’s calculations based on: Political Instability Task Force Project. Penn World Tables
version 8.
In the same way, the graphs do not show a clear relation between the labor-bias-of-tariff
and income growth during the episodes of conflict. Moreover, in this case the estimated
correlations are negative -0.16 in the case of the bias towards the agricultural sector and
-0.1 for the measure of bias towards labor-intensive goods, although none of them is
statistically significant at 95% confidence. This result would only be consistent with the
second hypothesis proposed.
The initial evidence does not give any support to the theoretical predictions. However,
the hypotheses are derived using marginal results and therefore should be evaluated in a
setting that controls for the incidence of other factors that are affecting growth
simultaneously. In the next section, the estimations of the cross-country growth
regression equations are presented.
4.1. Main results
This section presents the results of the estimation of different versions of the general
model of growth regressions presented in equation (13). The proposed variables are
introduced in a sequential way in order to establish the relations between average
income growth, tariffs, the labor-bias-of-tariffs and its estimated partial correlations
once controlling for the conflict variables. The estimations were carried out using fixed
-.1
-.05
0
.05
.1
-.15 -.1 -.05 0 .05 .1 .15 .2Differential Protection Agri. Avg. 5 years
-.1
-.05
0
.05
.1
-.05 0 .05 .1 .15 .2 .25Differential Protection Labor Intensive Avg. 5 years
Fitted values GDP per capita (emp) growth 5 years

37
effects estimator and adjusting the standard errors for heteroskedasticity and clustered
for autocorrelation in each panel (country level). The total number of observations in
most of the regressions is 257, implying an average of 2.4 observations per country.
Table 4. Regressions income growth and tariff measures Dependent Variable: Average Growth Rate of GDP per capita (worker)
VARIABLES (1) (2) (3) (4) (5) (6) (7) (8) lnGDPpcinitial year of span -0.059*** -0.055*** -0.056*** -0.055*** -0.055*** -0.054*** -0.057*** -0.059*** (0.012) (0.016) (0.016) (0.016) (0.016) (0.016) (0.016) (0.016)
lnSkt-p -0.007 -0.007 -0.006 -0.007 -0.006 -0.009 -0.004 -0.003
(0.005) (0.009) (0.009) (0.009) (0.009) (0.009) (0.009) (0.009) lnSchoolinitial year of span 0.002 0.014 0.017 0.014 0.015 0.010 0.019 0.019
(0.011) (0.014) (0.015) (0.014) (0.015) (0.014) (0.015) (0.015)
lnLexpectinitial year of span 0.093*** 0.017 0.029 0.017 0.019 0.009 0.035 0.048 (0.034) (0.050) (0.050) (0.050) (0.050) (0.049) (0.050) (0.054)
lnht-p -0.267 -0.038 -0.090 -0.036 -0.040 0.044 -0.121 -0.160
(0.332) (0.450) (0.448) (0.451) (0.451) (0.451) (0.460) (0.459) ln(1+Tappl)t
-0.038
(0.037)
ln(1+Tappl_agr)t
-0.026
(0.028)
ln(1+Tappl_noagr)t -0.038
(0.037)
ln(1+Tappl_lint)t
-0.030
(0.031)
ln(1+Tappl_kint)t
-0.078
(0.055)
Diff_Agriculturet 0.004
(0.039)
Diff_Lintensivet
0.058
(0.058)
Constant 0.209 0.491** 0.443** 0.492** 0.476** 0.529*** 0.412* 0.370 (0.156) (0.209) (0.217) (0.209) (0.209) (0.200) (0.229) (0.234)
Observations 515 257 257 257 257 257 257 257
R-squared 0.231 0.300 0.299 0.300 0.299 0.309 0.295 0.298 Number of Countries 107 107 107 107 107 107 107 107
*** Significant at 1%, ** significant at 5%, * significant at 5%. Robust standard errors adjusted for
clustering at the country level in parentheses. All specifications include time and fixed effects.
Table 4 above presents the result for the estimates of the base specification and the
partial relations between income growth, the tariff measures and the labor-bias-of-tariff
measures. With respect to the Solow regressors, only the conditional convergence term
appears to be statistically significant in all specifications. Although, the estimated
convergence parameter appears to be high compared to the ones obtained by Murdoch
& Sandler (2002), of around 3% which are more in line with the results of the growth
regressions literature of around 2.5% from Barro (1997).
The lack of significance for the Solow determinants of economic growth, besides the
convergence term, is in line with the results obtained by Estevadeordal & Taylor (2013),
who also use tariff data and economic growth but rather in a difference-in-difference
method application. With respect to the human capital proxies, the estimated
coefficients have the correct sign but are statistically insignificant once the tariff
measures are included in the specification.

38
With regard to the different tariff measures, all the actual estimates are negative but
statistically insignificant, a result consistent with the recent literature (Nunn & Trefler,
2010). As expected, the measures of labor-bias-of-tariffs have a positive although
insignificant coefficient estimates. However, if the opportunity cost channel is at work,
the lack of significance of the labor-bias-of-tariffs coefficients could be explained by a
downward bias due to omitted variables as explained in the methodology section.
Table 5. Regressions income growth and conflict measures 1986-2010 Dependent Variable: Average Growth Rate of GDP per capita (employees)
VARIABLES (1) (2) (3) (4) (5) (6) (7) lnGDPpcinitial year of span -0.059*** -0.058*** -0.059*** -0.059*** -0.058*** -0.060*** -0.059***
(0.012) (0.012) (0.012) (0.012) (0.012) (0.012) (0.012)
lnSkt-p -0.009* -0.008 -0.009 -0.010* -0.008 -0.009* -0.008 (0.005) (0.005) (0.005) (0.005) (0.005) (0.005) (0.005)
lnSchoolinitial year of span 0.000 0.004 -0.001 0.001 0.004 -0.001 0.002
(0.012) (0.012) (0.012) (0.012) (0.011) (0.012) (0.011) lnLexpectinitial year of span 0.092*** 0.090*** 0.095*** 0.087*** 0.091*** 0.091*** 0.092***
(0.035) (0.033) (0.035) (0.033) (0.033) (0.034) (0.034) lnht-p -0.263 -0.266 -0.266 -0.266 -0.262 -0.270 -0.268
(0.327) (0.330) (0.330) (0.325) (0.330) (0.327) (0.332)
Statefailcwt -0.015**
(0.006)
Statefailcw Revolutionaryt -0.013
(0.008)
Statefailcw Ethnict
-0.011*
(0.007)
Avemag IACt
-0.008***
(0.003)
Avemag Revolutionaryt -0.005
(0.004)
Avemag Ethnict
-0.009**
(0.004)
Battledeathst
-0.197
(0.288)
Constant 0.223 0.215 0.211 0.250* 0.215 0.244 0.214
(0.154) (0.152) (0.156) (0.150) (0.152) (0.154) (0.155)
Observations 515 515 515 515 515 515 515 R-squared 0.246 0.240 0.237 0.249 0.236 0.245 0.232
Number of Countries 107 107 107 107 107 107 107
*** Significant at 1%, ** significant at 5%, * significant at 5%. Robust standard errors adjusted for
clustering at the country level in parentheses. All specifications include time and fixed effects.
Table 5 above presents the result for the estimates of the partial correlations between
growth and the different indicators for conflict measures for the countries included in
the sample for the five spans between 1986 and 2010. As stated in the literature review,
one common finding is a relatively low effect of conflict on growth if the average
growth rates are calculated on longer periods. Column 1, presents the estimated
coefficient of the incidence of internal armed conflict, which is statistically significant
at 95% confidence. Thus, given the sample, a country affected by conflict has on
average an income growth rate that is 1.46 percentage points lower than a similar
country in peace. The result is similar to the general findings in the literature about the
cost of conflict, but larger than the results Imai & Weinstein (2000) and Blomberg et al.
(2004) obtain using the previous version of the same database for conflicts.

39
With respect to the estimated coefficients for the variables of conflict incidence detailed
by revolutionary and ethnic wars, the point estimates are negative, lower than the total
incidence variable and not significant at the 95% confidence (columns 2 and 3).
Regarding the coefficients for the measures of conflict magnitude; the total magnitude
measure is highly significant and implies that an increase of one unit in the average
magnitude of conflict reduces the average per capita income growth rate by 0.78
percentage points (column 4). Likewise, a country affected by the maximum magnitude
of civil war in the sample (3.4 units) would expect to have a 2.65 percentage points
lower per capita income growth compared to a similar country without conflict.
An intriguing result is the negative but insignificant coefficient estimate for the battle-
related deaths. This result could obey to an improper formulation of the indicator
(Mueller, 2014), or to a decline in the global incidence of civil war and the risk of
deaths attributable to civil strife (Lacina et al., 2006). Given that this result was
relatively frequent, the analysis presented in the remaining of the paper does not include
this variable.
Table 6. Regressions income growth, conflict and labor-bias-of-tariffs measures Dependent Variable: Average Growth Rate of GDP per capita (worker)
VARIABLES (1) (2) (3) (4) (5) (6) ln(1+Tappl)t -0.026 -0.025
(0.045) (0.039)
Diff_Agriculturet
0.013 0.010
(0.040) (0.040)
Diff_Lintensivet
0.134** 0.107*
(0.060) (0.057)
Statefailcwt -0.018**
-0.018**
-0.022***
(0.008)
(0.008)
(0.008)
Avemag IACt -0.007***
-0.007***
-0.008***
(0.003)
(0.003)
(0.003) Constant 0.416* 0.371* 0.369 0.321 0.258 0.226
(0.216) (0.216) (0.226) (0.230) (0.220) (0.231)
Observations 257 257 257 257 257 257 R-squared 0.332 0.322 0.330 0.321 0.343 0.329
Number of Countries 107 107 107 107 107 107
*** Significant at 1%, ** significant at 5%, * significant at 5%. Robust standard errors adjusted for
clustering at the country level in parentheses. All specifications include the baseline regressors (initial
values of GDP, years of education and life expectancy at birth and lags of investment rate and population
growth), as well as time and country effects.
Table 6 presents the results for the inclusion of tariffs and conflict measures
simultaneously. The table is restricted to the overall conflict variables and the labor-
bias-of-tariff measures because of space limitations. However, in all the specifications,
the baseline Solow regressors are included. As expected, the estimated coefficients for
the labor-bias-of-tariffs measures are positive and now more than double relative to
previous point estimates presented in Table 4. This is consistent with the positive

40
association of labor-bias-of-tariffs and income growth via the opportunity cost channel.
Increases in relative prices for labor-intensive goods induced by tariffs should generate
a reduction of appropriation activity, fostering production as proposed by the theoretical
framework. However, only the labor-bias-of-tariffs measure for labor-intensive goods is
significant at 95% confidence for the estimation including conflict incidence and only
marginally significant when included with the intensity measure. The point estimates for
the conflict measures do not show any significant change in value, although there is a
gain in significance.
Next, the interaction terms between the tariffs related variables and conflict indicators
are included in the regressions; the estimation results are presented in Table 7. The
inclusion of average tariff level and the conflict incidence measure show a reduction in
the negative point estimate for the coefficient of average tariffs, but now it is
statistically significant at 95% (column 1 of Table 7). Moreover, the estimate for the
interaction term between average tariffs and the conflict measures is positive and
significant. Thus, for a conflict affected country, the expected negative effect of tariffs
is to some extent reduced. The lack of significance of the tariffs variable without the
interaction term implies that the estimation in Table 6 is not accounting for this apparent
nonlinear effect of tariffs. Hence, it is advisable to include the average tariff measure in
order to control for the average structure of tariffs in the regressions (Nunn & Trefler,
2010).
Table 7. Regressions growth, conflict, labor-bias-of-tariff measures and
interactions Dependent Variable: Average Growth Rate of GDP per capita (worker)
VARIABLES (1) (2) (3) (4) (5) (6) ln(1+Tappl)t -0.146**
-0.135**
(0.058)
(0.061)
Diff_Agriculturet
0.024
0.018
(0.039)
(0.041)
Diff_Lintensivet
0.147
0.114
(0.101)
(0.089)
Statefailcwt -0.038*** -0.019*** -0.021*
(0.013) (0.007) (0.011)
Avemag IACt
-0.019*** -0.008** -0.008***
(0.006) (0.003) (0.003)
Interaction IAC*Trdpol 0.142** -0.301*** -0.026 0.081** -0.057 -0.009 (0.058) (0.098) (0.148) (0.034) (0.053) (0.065)
Constant 0.411* 0.437** 0.269 0.369* 0.351 0.231
(0.208) (0.208) (0.233) (0.215) (0.220) (0.229)
Observations 257 257 257 257 257 257
R-squared 0.357 0.344 0.344 0.347 0.323 0.329
Number of Countries 107 107 107 107 107 107
P-Value (F-test IAC=Trdpol=IAC*Trdpol=0)
0.010 0.005 0.019 0.004 0.065 0.003
P-Value (F-test
Trdpol=IAC*Trdpol=0) 0.041 0.010 0.091 0.057 0.560 0.153
P-Value (F-test
IAC=IAC*Trdpol=0) 0.012 0.002 0.012 0.003 0.029 0.005
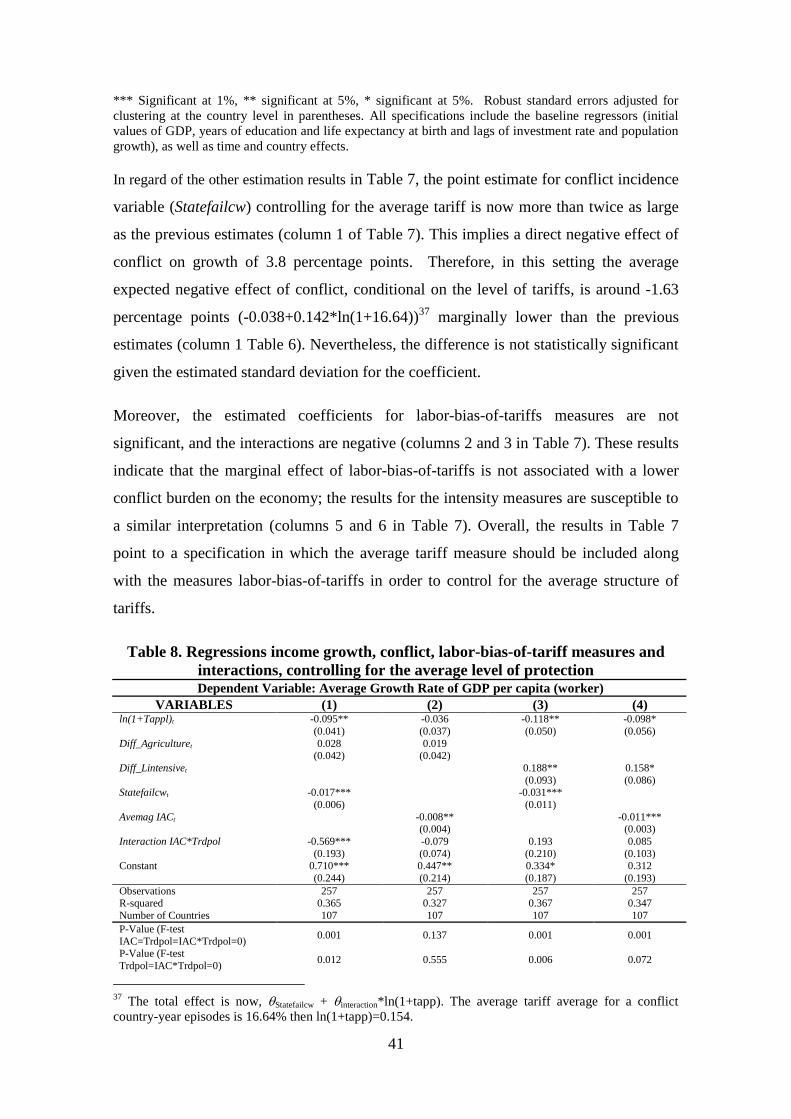
41
*** Significant at 1%, ** significant at 5%, * significant at 5%. Robust standard errors adjusted for
clustering at the country level in parentheses. All specifications include the baseline regressors (initial
values of GDP, years of education and life expectancy at birth and lags of investment rate and population
growth), as well as time and country effects.
In regard of the other estimation results in Table 7, the point estimate for conflict incidence
variable (Statefailcw) controlling for the average tariff is now more than twice as large
as the previous estimates (column 1 of Table 7). This implies a direct negative effect of
conflict on growth of 3.8 percentage points. Therefore, in this setting the average
expected negative effect of conflict, conditional on the level of tariffs, is around -1.63
percentage points (-0.038+0.142*ln(1+16.64))37
marginally lower than the previous
estimates (column 1 Table 6). Nevertheless, the difference is not statistically significant
given the estimated standard deviation for the coefficient.
Moreover, the estimated coefficients for labor-bias-of-tariffs measures are not
significant, and the interactions are negative (columns 2 and 3 in Table 7). These results
indicate that the marginal effect of labor-bias-of-tariffs is not associated with a lower
conflict burden on the economy; the results for the intensity measures are susceptible to
a similar interpretation (columns 5 and 6 in Table 7). Overall, the results in Table 7
point to a specification in which the average tariff measure should be included along
with the measures labor-bias-of-tariffs in order to control for the average structure of
tariffs.
Table 8. Regressions income growth, conflict, labor-bias-of-tariff measures and
interactions, controlling for the average level of protection Dependent Variable: Average Growth Rate of GDP per capita (worker)
VARIABLES (1) (2) (3) (4) ln(1+Tappl)t -0.095** -0.036 -0.118** -0.098*
(0.041) (0.037) (0.050) (0.056)
Diff_Agriculturet 0.028 0.019
(0.042) (0.042)
Diff_Lintensivet 0.188** 0.158*
(0.093) (0.086) Statefailcwt -0.017***
-0.031***
(0.006)
(0.011)
Avemag IACt
-0.008**
-0.011***
(0.004)
(0.003)
Interaction IAC*Trdpol -0.569*** -0.079 0.193 0.085
(0.193) (0.074) (0.210) (0.103) Constant 0.710*** 0.447** 0.334* 0.312
(0.244) (0.214) (0.187) (0.193)
Observations 257 257 257 257 R-squared 0.365 0.327 0.367 0.347
Number of Countries 107 107 107 107
P-Value (F-test
IAC=Trdpol=IAC*Trdpol=0) 0.001 0.137 0.001 0.001
P-Value (F-test
Trdpol=IAC*Trdpol=0) 0.012 0.555 0.006 0.072
37
The total effect is now, Statefailcw + interaction*ln(1+tapp). The average tariff average for a conflict
country-year episodes is 16.64% then ln(1+tapp)=0.154.
42
P-Value (F-test IAC=IAC*Trdpol=0)
0.000 0.066 0.009 0.001
*** Significant at 1%, ** significant at 5%, * significant at 5%. Robust standard errors adjusted for
clustering at the country level in parentheses. All specifications include the baseline regressors (initial
values of GDP, years of education and life expectancy at birth and lags of investment rate and population
growth), as well as time and country effects.
Once controlling for the average level of tariffs (Table 8), the results confirm part of the
previous findings of the association between the bias in the structure of tariffs towards
agriculture in labor-intensive sectors and per capita income growth. The partial
correlation for the average tariffs and income growth is estimated to be negative as
expected. The measure of labor-bias-of-tariffs towards the agricultural sector is not
statistically significant, but the interaction is negative and significant in the specification
presented in column 1 in Table 8. On the other hand, the measure of labor-bias-of-tariffs
based on factor intensity shows a positive and significant estimate, although the
coefficient of the interaction is not significant (column 3 in Table 8)38
.
The previous results would imply that in the sample of countries and periods under
study, increases in labor-bias-of-tariffs towards labor-intensive sectors are associated
with increases in the growth rate directly and indirectly, conditional on the incidence of
conflict. However, in a similar way of the estimations for average tariffs and the
interaction term in column 1 of Table 7 discussed above. The estimated coefficient for
the conflict variable is now higher implying that the total negative effect of conflict,
including the interaction term, is even larger than previously estimated.
To summarize, the results of the proposed estimations only give support for the
hypothesis of a positive and significant partial correlation of the labor-bias-of-tariffs
measures and income growth once the effect of conflict is accounted for. The relation is
stronger when the bias in tariffs is targeted to labor-intensive sectors and not to
agriculture in general. However, the distortions caused by the tariffs or labor-bias-of-
tariff are associated with negative coefficients for the interaction terms or to an
estimated coefficient of the negative partial correlation of conflict that is larger. The
preceding results signal that, on average higher labor-bias-of-tariffs will be associated
with a null change in income growth or even negative in some cases; in other words, the
changes are cancelling each other out.
38
However, the F-Test for the null hypothesis of the total interaction estimated coefficients being zero or
just one of the variables plus de interaction is rejected even at 1%.

43
4.2. Robustness checks and sensitivity analysis:
In order to assess the robustness of the results obtained in the previous section, the usual
robustness checks are applied to the regression models employed. As mentioned in the
data description section, alternative indicators for proximate and fundamental causes for
growth were considered. The proposed variables are the initial value of the index of
legal and security of property rights, the consumer price inflation volatility based on the
deflator of consumption in GDP. Additionally, the controls also include the lagged
value of the Government consumption share over GDP (lnGovtt-1) and the initial level of
trade in goods and services over GDP (lnTradeinitial).
Table 9. Robustness checks: Omitted variables Dependent Variable: Average Growth Rate of GDP per capita (worker)
VARIABLES (1) (2) (3) (4) (9) (10) (11) (12) ln(1+Tappl)t -0.095** -0.087* -0.093* -0.092** -0.114** -0.108** -0.116** -0.115** (0.040) (0.045) (0.048) (0.039) (0.049) (0.053) (0.054) (0.046)
Diff_Agriculturet 0.044 0.032 0.020 0.028
(0.051) (0.043) (0.043) (0.043)
Diff_Lintensivet
0.217** 0.188** 0.170* 0.186**
(0.099) (0.093) (0.101) (0.089)
Statefailcwt -
0.018*** -
0.018*** -
0.017*** -
0.017*** -
0.030*** -
0.031*** -
0.031*** -
0.030***
(0.005) (0.006) (0.006) (0.006) (0.010) (0.011) (0.011) (0.011)
Interaction IAC*Trdpol -
0.580*** -
0.554*** -0.564**
-0.545***
0.155 0.186 0.218 0.186
(0.166) (0.198) (0.226) (0.185) (0.200) (0.211) (0.218) (0.204)
Leg. Str. & Prop. Rights initial
for span -0.004
-0.003
(0.002)
(0.002)
lnTrade initial year of span 0.005
0.006
(0.012)
(0.012)
lnGovtt-p
-0.006
-0.006
(0.007)
(0.007)
Inflation Volatilityt
0.047
0.049
(0.037)
(0.037)
Constant 0.831*** 0.699*** 0.691*** 0.727*** 0.435** 0.328* 0.321* 0.366** (0.275) (0.243) (0.250) (0.235) (0.212) (0.184) (0.185) (0.181)
Observations 237 257 257 257 237 257 257 257
R-squared 0.366 0.366 0.371 0.375 0.368 0.369 0.373 0.379 Number of Countries 93 107 107 107 93 107 107 107
P-Value (F-test
IAC=Trdpol=IAC*Trdpol=0) 0.000 0.001 0.002 0.001 0.000 0.001 0.004 0.001
P-Value (F-test Trdpol=IAC*Trdpol=0)
0.003 0.016 0.044 0.012 0.003 0.008 0.022 0.004
P-Value (F-test
IAC=IAC*Trdpol=0) 0.000 0.000 0.001 0.000 0.003 0.007 0.011 0.011
*** Significant at 1%, ** significant at 5%, * significant at 5%. Robust standard errors adjusted for
clustering at the country level in parentheses. All specifications include the baseline regressors (initial
values of GDP, years of education and life expectancy at birth and lags of investment rate and population
growth), as well as time and country effects.
The results of the robustness checks once controlling for omitted proxies of fundamental
and proximate causes of conflict are presented in Table 9. As expected, given the
inclusion of country and time effects in the regression equations, there are not in general
important changes in the point estimates, signs and statistical significance of the
estimated coefficients for the variables of interest.

44
Additionally, a second robustness check deals with the possible sample bias in the
estimates due to the more likely inclusion of countries consistently reporting tariffs data.
The number of periods and countries included in the main estimation results in Table 8
are determined by the availability of tariff data, especially before 1995.
The estimations results suggest that measurement error is a greater problem that sample
bias in the sample considered, as allowing for lower quality in tariff data does not add to
the efficiency of the estimations. Table 10 presents the estimations without constraining
the number of missing values for the average tariffs calculations39
. The base regressors
like the conditional convergence and the life expectancy at birth turn to be highly
significant; meanwhile none of the tariff related measures is significant. In principle
these results are expected; as the sample bias decreases, the measurement error bias
should be larger. Thus, explaining the bias towards zero in the estimated coefficients for
the tariff related measures.
Table 10. Robustness checks: allowing for missing values in the calculation of
average tariffs
Dependent Variable: Average Growth Rate of GDP per
capita (worker)
VARIABLES (1) (2) (3) (4) lnGDPpcinitial year of span -0.058*** -0.058*** -0.057*** -0.057***
(0.010) (0.010) (0.010) (0.010)
lnSkt-p -0.000 -0.000 -0.000 -0.000 (0.007) (0.007) (0.007) (0.007)
lnSchoolinitial year of span 0.024 0.024 0.025 0.025
(0.017) (0.017) (0.017) (0.017) lnLexpectinitial year of span 0.129*** 0.116*** 0.117*** 0.109***
(0.029) (0.032) (0.031) (0.032)
lnt-p -0.145 -0.181 -0.175 -0.198
(0.218) (0.212) (0.211) (0.208)
ln(1+Tappl)t 0.003 -0.004 -0.014 -0.016
(0.027) (0.023) (0.026) (0.024) Diff_Agriculturet 0.008 0.016
(0.032) (0.035)
Diff_Lintensivet 0.018 0.028 (0.065) (0.073)
Statefailcwt -0.009* -0.011*
(0.005) (0.006) Avemag IACt -0.006** -0.006**
(0.003) (0.003)
Interaction IAC*Trdpol 0.083 0.021 0.028 0.009 (0.062) (0.030) (0.081) (0.043)
Constant -0.002 0.043 0.033 0.065
(0.120) (0.128) (0.133) (0.133)
Observations 467 467 467 467
R-squared 0.270 0.270 0.266 0.269
Number of Countries 131 131 131 131
P-Value (F-test IAC=Trdpol=IAC*Trdpol=0) 0.164 0.045 0.343 0.148 P-Value (F-test Trdpol=IAC*Trdpol=0) 0.278 0.462 0.845 0.803
P-Value (F-test IAC=IAC*Trdpol=0) 0.093 0.020 0.193 0.074
*** Significant at 1%, ** significant at 5%, * significant at 5%. Robust standard errors adjusted for
clustering at the country level in parentheses. All specifications include time and fixed effects.
39
Therefore, if a country only reports tariffs for one year during the span, the average will be equal to that
single observation.

45
As a final robustness check of the results, the regression equations are estimated
excluding specific group of countries. Certainly, it is interesting to evaluate if the results
of the relation between the labor-bias-of-tariffs, conflict and income growth rates are
non-linear on the development level of countries.
For instance, it is possible that conflict technologies change with the level of economic
development of countries and therefore the conditions established by the inequalities in
equation (11) will hold simultaneously in the employed sample. Consequently, the
average effects captured in the estimation of the growth equations will be biased
towards zero because the estimations are picking up positive and negative associations
simultaneously. The Table 11 presents the result of the estimations excluding the
countries classified as “Advanced Economies” according to the World Economic
Outlook 2014 (International Monetary Fund, 2014) 40
and including only the measure of
incidence for civil war.
Table 11. Robustness checks: results excluding Advanced Economies
Dependent Variable: Average Growth Rate of GDP per capita
(worker)
VARIABLES (1) (2) (3) (4) (5) (6) (7) (8)
lnGDPpcinitial year of span -
0.039**
-
0.036**
-
0.041**
-
0.035**
-
0.030** -0.036**
-
0.034*** -0.026*
(0.018) (0.017) (0.019) (0.015) (0.014) (0.014) (0.013) (0.015) lnSkt-p -0.019 -0.021 -0.020* -0.018 -0.020 -0.021* -0.020 -0.021**
(0.012) (0.013) (0.012) (0.012) (0.012) (0.011) (0.012) (0.010)
lnSchoolinitial year of span 0.023 0.014 0.017 0.015 0.003 -0.001 0.021 0.004 (0.020) (0.023) (0.021) (0.021) (0.024) (0.023) (0.028) (0.022)
lnLexpectinitial year of span 0.075 0.043 0.079 0.083 0.045 0.096* -0.022 0.056
(0.068) (0.070) (0.070) (0.059) (0.057) (0.052) (0.071) (0.061)
lnt-p -1.351 -0.952 -1.096 -1.177 -0.672 -0.556 -0.427 -0.140
(0.868) (0.975) (0.937) (0.859) (0.977) (0.983) (1.073) (1.051)
ln(1+Tappl)t -0.041 -0.049 -0.084 -0.029 -0.038 -0.114** -0.106** -0.065 (0.036) (0.038) (0.060) (0.044) (0.045) (0.047) (0.047) (0.054)
Diff_Agriculturet 0.108 0.132* 0.153**
(0.083) (0.078) (0.074) Diff_Lintensivet 0.148 0.309*** 0.540***
(0.136) (0.110) (0.176)
Statefailcwt -
0.015** -
0.016** -
0.023*** -
0.016*** -0.008
(0.007) (0.007) (0.008) (0.005) (0.010)
Interaction IAC*Trdpol -0.485** -0.442* (0.215) (0.253)
Constant 0.129 0.245 0.138 0.065 0.202 0.050 0.486 0.098
(0.294) (0.303) (0.297) (0.267) (0.257) (0.222) (0.310) (0.242)
Observations 135 135 135 135 135 135 135 135
R-squared 0.318 0.334 0.334 0.364 0.388 0.421 0.430 0.446
Number of Countries 73 73 73 73 73 73 73 73
P-Value (F-test IAC=Trdpol=IAC*Trdpol=0) 0.000 0.001
P-Value (F-test
Trdpol=IAC*Trdpol=0) 0.011 0.007
P-Value (F-test
IAC=IAC*Trdpol=0) 0.000 0.001
*** Significant at 1%, ** significant at 5%, * significant at 5%. Robust standard errors adjusted for
clustering at the country level in parentheses. All specifications include time and fixed effects.
40
The Annex 1contains the list of countries included in the sample and classifications criteria.
46
The general results excluding the advanced economies group are consistent with the
ones for the whole sample. The tariffs based measures are not significant without
including conflict, which is the usual result in the literature. Once accounting for the
effects of conflict the point estimates for the labor-bias-of-tariffs measures are larger,
positive and significant. Once again, the latter is consistent for the relation of tariff
induced increases of relative prices for labor-intensive goods and a positive effect on
income growth due to the reduction of conflict activity proposed by the theoretical
framework.
Nevertheless, the preceding result goes hand in hand with an increase in the negative
estimates of the coefficients for the conflict incidence or magnitude variables and a
negative estimate of the interaction terms. These results imply that the effect of conflict
conditional on a positive level of labor-bias-of-tariffs is larger and therefore any
increase in the tariff bias will only have a limited or null effect on overall growth.
The main results are consistent, when the regressions are performed excluding high-
income economies or regions of the world according to the classifications employed
according to the World Development Indicators of the World Bank (see Annex 3).
When the East Asia & Pacific or the Latin American countries are excluded from the
regressions, the estimated coefficient for labor-bias-of-tariffs towards labor-intensive
sector turns non-significant and the estimated coefficients for interactions terms are
positive, although only significant when the East Asia & Pacific countries are excluded.
In both cases the estimate for the direct partial correlation of conflict is twice the
estimated without the interaction terms in line with the main results of Table 8.
5. Conclusions:
This paper analyzes the effects of trade policy in economies affected by internal armed
conflict from a theoretical and empirical point of view. Specifically, it explores the
effects of the imposition of tariffs to labor-intensive products as a second best policy in
economies where markets are distorted by the incidence of armed conflict. The present
research is considered innovative in the sense that it sheds some light on the
mechanisms behind the economic effects of internal conflicts and the conduct of
economic policy in conflict-affected economies.
47
The theoretical framework is based on a modified version of the HOS model of
international trade proposed by Dal Bó & Dal Bó (2011), in which armed conflict could
be considered similar to a distortion in factor markets. Therefore, economic policy
instruments like tariffs and other instruments are susceptible to be used in order to
reduce the negative effects of conflict on the economy. A null hypothesis derived from
this framework is that tariff interventions that bias the structure of tariffs towards the
protection of labor-intensive sectors would reduce the negative effect of conflict on the
overall production of the economy.
A panel of cross-country growth regressions was employed to evaluate this theoretical
possibility, constructing measures of the bias in tariffs towards labor intensive goods the
agriculture sector and towards labor-intensive products. The results only offer evidence
in favor of a positive and significant partial correlation of the labor-bias-of-tariffs
measures and income growth once the variables for internal armed conflicts incidence
or magnitudes are accounted for. This relation is clear when the measure based on labor
intensity of products is used and apparently weak when the tariffs are biased on a
sectorial basis, in this case towards agriculture. This result is consistent with the tariff
induced increase in the opportunity cost of allocating resources (mainly labor) to
appropriation activities as proposed in the theoretical framework.
This result seem a priori inconsistent with the results of Nunn & Trefler, (2010), who
found evidence of a positive correlation of the bias in tariff structures towards skilled
labor sectors on economic growth. However, it is important to stress that the positive
association between labor-bias-of-tariffs and economic growth is only statistically
significant when accounting for conflict. Moreover, the preceding result is always
associated with negative coefficients for the interaction between conflict and the labor-
bias-of-tariffs measures or to an estimated larger negative correlation of conflict and
growth. The latter results are explained by the additional distortions created by tariffs.
Based on the evidence presented in this paper it is possible to conclude that tariffs
cannot be considered second best policies that reduce the distortions created by internal
armed conflicts. The results show that the distortions generated by the tariffs, even for
conflict-affected economies, could cancel out the direct positive effect on growth of a
tariff induced reduction in appropriation activities. The preceding result is consistent
with the structure of analysis of the second best theory (Bhagwati, 1971). Under this
framework, it is possible to conclude that the preferred instrument (the least distorting

48
one) is a direct tax-subsidy intervention in the factor markets as is shown by Dal Bó &
Dal Bó (2012). Thus tariffs will not be the best policy instruments in this case.
Despite this result, it cannot be concluded that the main propositions derived from the
theoretical framework are incorrect or are not fitting the data. On the contrary, the
results favor the idea that increases in the relative price of labor; reduce the economic
effects of conflicts through an increase in the opportunity cost of engaging in conflict
activities.
The research adds to a relatively new field of research in economics that has focused the
attention on explaining the covariates and causes of conflicts rather than on its effects
on the economy (Blattman & Miguel, 2010). Moreover, the present research has
highlighted a number of possible topics that could be valuable in the economic analysis
of conflicts.
In this paper, a presumably exogenous variation in relative prices given by the tariffs
was exploited to investigate the differential effects of internal armed conflicts on the
production of the economy. A similar approach could be used to evaluate the theoretical
implications of the model relative to the changes in relative prices of goods and the
intensity of conflicts in a similar way to Besley & Persson (2008) and Dube & Vargas
(2013). The results presented in this paper are encouraging although the empirical
design does not allow for strong causality statements and more research is needed in this
line.
As discussed in the methodological section, the reverse causality bias originated from
the relation between income growth and civil conflict on one side and the dynamic
panel data bias on the other, is not addressed in this paper. An application of an
estimation procedure that properly addresses the reverse causality bias in dynamic panel
data like the System GMM (Blundell & Bond, 1998) constitutes a prospect for future
research. However, the estimations could be further improved if there is an opportunity
to exploit external instruments for the conflict variable.
An important extension to the present research would be to consider other trade policy
measures affecting the agricultural sector and other labor-intensive sectors in
developing countries. The recently published Estimates of Distortions to Agricultural
Incentives (DAI) 1955-201141
described in Anderson et al. (2008) offers an important
41
Available at http://go.worldbank.org/YAO39F35E0
49
source of information of different instruments employed specifically in the agricultural
sector. This database could allow for the analysis of another one of the policy options
proposed by Dal Bó & Dal Bó (2011), the elimination of the subsidies to agriculture in
developed countries. Those instruments could have a pervasive effect on developing
countries affected by conflict according to the theoretical framework presented in this
paper.
Finally, it is expected that the research presented in this paper has contributed to the
analysis of economic policy in conflict-affected economies. The human suffering and
enormous distortions created by these events go beyond the economic realm and allow
for a rich multidisciplinary approach to the analysis and policy prescriptions for these
countries.

50
References
Acemoglu, D. (2008). Introduction to modern economic growth. Princeton, N.J.:
Princeton University Press.
Acemoglu, D., Johnson, S., & Robinson, J. A. (2001). The colonial origins of
comparative development: An empirical investigation. The American Economic
Review, 91(5), 1369-1401.
Anderson, K., Kurzweil, M., Martin, W., Sandri, D., & Valenzuela, E. (2008).
Measuring distortions to agricultural incentives, revisited. (Policy Research
Working Paper No. WPS4612). Washington, DC.: World Bank.
Angrist, J. D., & Pischke, J. (2009). Mostly harmless econometrics: An empiricist's
companion. Princeton, NJ [etc.]: Princeton University Press.
Arellano, M., & Bond, S. (1991). Some tests of specification for panel data: Monte carlo
evidence and an application to employment equations. The Review of Economic
Studies, 58(2), 277-297.
Barro, R. J. (1997). Determinants of economic growth: A cross-country empirical study.
Cambridge, Mass.: The MIT Press.
Barro, R. J., & Sala-i-Martin, X. (2003). Economic growth (2nd ed.). Cambridge and
London: MIT Press.
Besley, T. J., & Persson, T. (2008). The incidence of civil war: Theory and evidence.
(NBER Working Paper No. w14585). Cambridge, MA: National Bureau of
Economic Research.
Bhagwati, J. N. (1971). The generalized theory of distortions and welfare. In J.
Bhagwati, R. Jones, R. Mundell & J. Vanek (Eds.), Trade, balance of payments
and growth (pp. 69-90). Amsterdam: North Holland.
Blattman, C., & Miguel, E. (2010). Civil war. Journal of Economic Literature, 48(1), 3-
57.
Blomberg, S. B., Hess, G. D., & Orphanides, A. (2004). The macroeconomic
consequences of terrorism. Journal of Monetary Economics, 51(5), 1007-1032.
Ciccone, A. (2013). Estimating the effect of transitory economic shocks on civil
conflict. Review of Economics and Institutions, 4(2), 1-14.

51
Collier, P. (1999). On the economic consequences of civil war. Oxford Economic
Papers, 51(1), 168-183.
Collier, P. (2007). The bottom billion: Why the poorest countries are failing and what
can be done about it. New York, NY, [etc.]: Oxford University Press.
Collier, P., Elliott, V. L., Hegre, H., Hoeffler, A., Reynal-Querol, M., & Sambanis, N.
(Eds.). (2003). Breaking the conflict trap: Civil war and development policy.
Washington, DC: The World Bank. doi:10.1596/0-8213-5481-7
Collier, P., & Hoeffler, A. (2004). Greed and grievance in civil war. Oxford Economic
Papers, 56(4), 563-595.
Collier, P., Hoeffler, A., & Pattillo, C. (2004). Africa's exodus: Capital flight and the
brain drain as portfolio decisions. Journal of African Economies, 13(suppl 2), ii15-
ii54.
Corden, W. M. (1966). The structure of a tariff system and the effective protective rate.
Journal of Political Economy, 74(3), 221-237.
Curtis, M. (2007). Designing conflict-sensitive trade policy. n O. rown, . alle, S.
e a oreno S. Win ler (Eds.), Trade, aid and security: An agenda for peace
and development (pp. 18-40). London [etc.]: Earthscan.
Dal Bó, E., & Dal Bó, P. (2011). Workers, warriors, and criminals: Social conflict in
general equilibrium. Journal of the European Economic Association, 9(4), 646-
677.
--- (2012). Conflict and policy in general equilibrium: Insights from a standard trade
model. In M. R. Garfinkel, & S. Skaperdas (Eds.), The oxford handbook of the
economics of peace and conflict (pp. 611-632). New York, New York: Oxford
University Press.
Dollar, D., & Kraay, A. (2003). Institutions, trade, and growth. Journal of Monetary
Economics, 50(1), 133-162.
Dube, O., & Vargas, J. F. (2013). Commodity price shocks and civil conflict: Evidence
from colombia. The Review of Economic Studies, 80(4), 1384-1421.
52
Durlauf, S. N., Johnson, P. A., & Temple, J. R. W. (2005). Growth econometrics. In P.
Aghion, & S. N. Durlauf (Eds.), Handbook of economic growth (pp. 555-677)
Elsevier.
Durlauf, S. N., Kourtellos, A., & Tan, C. M. (2008). Are any growth theories robust?
The Economic Journal, 118(527), 329-346.
Echeverry, J. C., Salazar, N., & Navas, V. (2001). El conflicto colombiano en el marco
internacional. In A. Martinez Ortiz (Ed.), Economía, crimen y conflicto (pp. 77-
128). Bogotá D.C., Colombia: Universidad Nacional de Colombia.
Elbadawi, I., & Hegre, H. (2008). Globalization, economic shocks, and internal armed
conflict. Defence and Peace Economics, 19(1), 37-60.
Estevadeordal, A., & Taylor, A. M. (2013). Is the washington consensus dead? growth,
openness, and the great liberalization, 1970s-2000s. Review of Economics and
Statistics, 95(5), 1669-1690.
Feenstra, R. C., Inklaar, R., & Timmer, M. (2013). The next generation of the penn
world table. (NBER Working Paper No. 19255).National Bureau of Economic
Research.
Frankel, J. A., & Romer, D. H. (1999). Does trade cause growth? American Economic
Review, 89(3), 379-399.
Gardeazabal, J. (2012). Methods for measuring aggregate costs of conflict. In M. R.
Garfinkel, & S. Skaperdas (Eds.), The oxford handbook of the economics of peace
and conflict (pp. 227-251). New York, New York: Oxford University Press.
Gleditsch, N. P., Wallensteen, P., Eriksson, M., Sollenberg, M., & Strand, H. (2002).
Armed conflict 1946-2001: A new dataset. Journal of Peace Research, 39(5), 615-
637.
Goldstone, J. A., Bates, R. H., Epstein, D. L., Gurr, T. R., Lustik, M. B., Marshall, M.
G., . . . Woodward, M. (2010). A global model for forecasting political instability.
American Journal of Political Science, 54(1), 190-208.
Gwartney, J., Lawson, R., & Hall, J. (2012). 2012 economic freedom dataset, published
in Economic freedom of the world: 2012 Annual report . ().Fraser Institute.

53
Imai, K., & Weinstein, J. M. (2000). Measuring the economic impact of civil war. (CID
Working Papers No. 15).Center for International Development at Harvard
University.
International Monetary Fund. (2014). World economic outlook (WEO):Recovery
strengthens, remains uneven. (World Economic And Financial Surveys No. April
2014). Washington, DC: International Monetary Fund.
Kaufmann, D., Kraay, A., & Mastruzzi, M. (2010). The worldwide governance
indicators : Methodology and analytical issues. (Policy Research Working Paper
Series No. 5430).The World Bank.
Knight, M., Loayza, N., & Villanueva, D. (1996). The peace dividen: Military spending
cuts and economic growth. (Policy Research Working Paper No. 1577).The World
Bank.
Krishna, P., & Panagariya, A. (2000). A unification of second best results in
international trade. Journal of International Economics, 52(2), 235-257.
Lacina, B., Gleditsch, N. P., & Russett, B. (2006). The declining risk of death in battle.
International Studies Quarterly, 50(3), 673-680.
Lipsey, R. G., & Lancaster, K. (1956). The general theory of second best. The Review of
Economic Studies, 24(1), 11-32.
Mankiw, N. G., Romer, D., & Weil, D. N. (1992). A contribution to the empirics of
economic growth. The Quarterly Journal of Economics, 107(2), 407-437.
Marshall, M. G., Gurr, T. R., & Harff, B. (2014). PITF - state failure task
force: Internal wars and failures of governance, 1955-2013. (Dataset and Coding
Guidelines). Vienna, VA: Societal-Systems Research Inc,.
Miguel, E., Satyanath, S., & Sergenti, E. (2004). Economic shocks and civil conflict:
An instrumental variables approach. Journal of Political Economy, 112(4), 725-
753.
Minier, J., & Unel, B. (2013). When is trade protection good for growth? Economic
Inquiry, 51(1), 62-71.
Montalvo, J. G., & Reynal-Querol, M. (2005). Ethnic polarization, potential conflict,
and civil wars. American Economic Review, 95(3), 796-816.

54
Mueller, H. (2014). Growth and violence: Argument for a per capita measure of civil
war. (Working Paper No. 756). Barcelona: Barcelona GSE Working Paper Series.
Murdoch, J. C., & Sandler, T. (2002). Economic growth, civil wars, and spatial
spillovers. Journal of Conflict Resolution, 46(1), 91-110.
Nieman, M. D. (2011). Shocks and turbulence: Globalization and the occurrence of civil
war. International Interactions, 37(3), 263-292.
Nunn, N., & Trefler, D. (2010). The structure of tariffs and long-term growth. American
Economic Journal: Macroeconomics, 2(4), 158-94.
Rigobon, R., & Rodrik, D. (2004). Rule of law, democracy, openness, and income:
Estimating the interrelationships. National Bureau of Economic Research Working
Paper Series, No. 10750
Rodríguez, F. (2007). Openess and growth: What have we learned? In J. A. Ocampo, J.
K. Sundaram & R. Vos (Eds.), Growth divergences: Explaining differences in
economic performance () Zed Books.
Rodrik, D. (2006). Goodbye washington consensus, hello washington confusion? A
review of the world bank's Economic growth in the 1990s: Learning from a decade
of reform. Journal of Economic Literature, 44(4), 973-987.
Rodrik, D., Subramanian, A., & Trebbi, F. (2004). Institutions rule: The primacy of
institutions over geography and integration in economic development. Journal of
Economic Growth, 9(2), 131-165.
Rybczynski, T. M. (1955). Factor endowment and relative commodity prices.
Economica, 22(88), 336-341.
Sachs, J. D. (2003). Institutions don't rule: Direct effects of geography on per capita
income. (NBER Working Paper No. 9490). Cambridge, MA: National Bureau of
Economic Research.
Sachs, J. D., Warner, A., Åslund, A., & Fischer, S. (1995). Economic reform and the
process of global integration. Brookings Papers on Economic Activity, 1995(1, 25th
Anniversary Issue), 1-118.
Shirotori, M., Tumurchudur, B., & Cadot, O. (2010). Revealed factor intensity indices
at the product level. (Policy Issues in International Trade and Commodities Study

55
Series No. 44). New York and Geneva: United Nations Conference on Trade And
Development.
Stolper, W. F., & Samuelson, P. A. (1941). Protection and real wages. The Review of
Economic Studies, 9(1), 58-73.
The World Bank. (2014a). Regional trade agreements.August 19 Retrieved, 2014,
Retrieved from http://www.wto.org/english/tratop_e/region_e/region_e.htm
--- (2014b). World development indicators, the world bank.August 7 Retrieved, 2014,
Retrieved from
http://databank.worldbank.org/data/views/variableSelection/selectvariables.aspx?so
urce=world-development-indicators
Themnér, L., & Wallensteen, P. (2013). Armed conflicts, 1946–2012. Journal of Peace
Research, 50(4), 509-521.

56
Annex 1. Countries included classification and internal conflict incidence
ISO
country
code
Name Income Group
World Bank
Advanced
Economy
According to
IMF (X)
OECD
Member
(X)
Periods of civil war
according to PITF
(Spans 1986-2010)
No war War
ARG Argentina Upper middle
0 5
AUS Australia High: OECD X X 5 0
AUT Austria High: OECD X X 5 0 BDI Burundi Low
1 4
BEL Belgium High: OECD X X 5 0
BEN Benin Low
5 0 BGD Bangladesh Low
4 1
BGR Bulgaria Upper middle
5 0
BHR Bahrain High : nonOECD
5 0 BLZ Belize Upper middle
5 0
BOL Bolivia Lower middle
5 0
BRA Brazil Upper middle
5 0 BRB Barbados High : nonOECD
5 0
BRN Brunei Darussalam High : nonOECD
5 0
BWA Botswana Upper middle
5 0 CAN Canada High: OECD X X 5 0
CHE Switzerland High: OECD X X 5 0
CHL Chile High: OECD
X 5 0 CHN China Upper middle
3 2
CIV Cote d'Ivoire Lower middle
4 1 COD Congo, Dem. Rep. Low
1 4
COL Colombia Upper middle
0 5
CRI Costa Rica Upper middle
5 0 CYP Cyprus High : nonOECD X
5 0
CZE Czech Republic High: OECD X X 5 0
DEU Germany High: OECD X X 5 0 DNK Denmark High: OECD X X 5 0
DOM Dominican Republic Upper middle
5 0
ECU Ecuador Upper middle
5 0 ESP Spain High: OECD X X 5 0
EST Estonia High: OECD X X 5 0
FIN Finland High: OECD X X 5 0 FRA France High: OECD X X 5 0
GBR United Kingdom High: OECD X X 5 0
GRC Greece High: OECD X X 5 0 GTM Guatemala Lower middle
3 2
HKG Hong Kong SAR, China High : nonOECD X
5 0
HND Honduras Lower middle
5 0 HRV Croatia High : nonOECD
4 1
HUN Hungary Upper middle
X 5 0
IDN Indonesia Lower middle
2 3 IND India Lower middle
0 5
IRL Ireland High: OECD X X 5 0
ISL Iceland High: OECD X X 5 0
ISR Israel High: OECD X X 0 5
ITA Italy High: OECD X X 5 0
JOR Jordan Upper middle
5 0 JPN Japan High: OECD X X 5 0
KEN Kenya Low
5 0
KGZ Kyrgyz Republic Low
5 0 KHM Cambodia Low
4 1
KOR Korea, Rep. High: OECD X X 5 0
KWT Kuwait High : nonOECD
5 0 LKA Sri Lanka Lower middle
1 4
LSO Lesotho Lower middle
5 0
LTU Lithuania High : nonOECD
5 0 LUX Luxembourg High: OECD X X 5 0
LVA Latvia High : nonOECD X
5 0
MAC Macao SAR, China High : nonOECD
5 0 MAR Morocco Lower middle
5 0
MDV Maldives Upper middle
5 0
MEX Mexico Upper middle
X 4 1 MLI Mali Low
3 2
MLT Malta High : nonOECD X
5 0
MNG Mongolia Lower middle
5 0 MOZ Mozambique Low
4 1
MUS Mauritius Upper middle
5 0
MWI Malawi Low
5 0 MYS Malaysia Upper middle
5 0
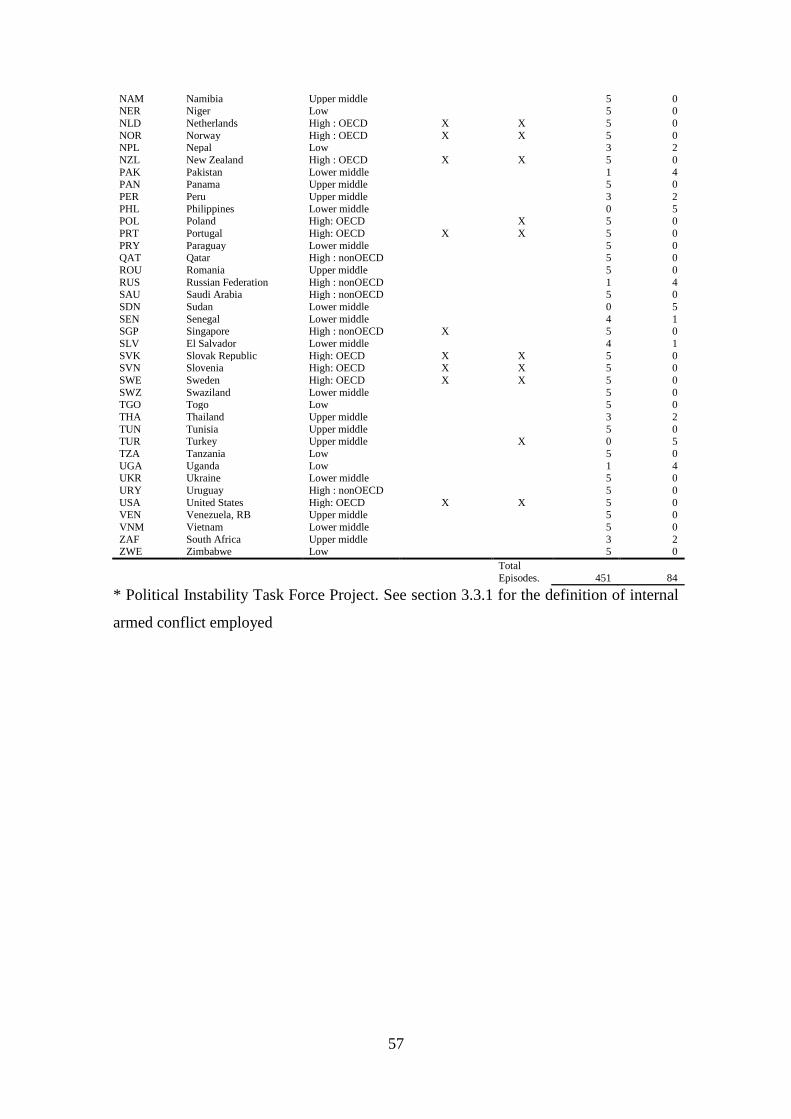
57
NAM Namibia Upper middle
5 0 NER Niger Low
5 0
NLD Netherlands High : OECD X X 5 0
NOR Norway High : OECD X X 5 0 NPL Nepal Low
3 2
NZL New Zealand High : OECD X X 5 0
PAK Pakistan Lower middle
1 4 PAN Panama Upper middle
5 0
PER Peru Upper middle
3 2
PHL Philippines Lower middle
0 5 POL Poland High: OECD
X 5 0
PRT Portugal High: OECD X X 5 0
PRY Paraguay Lower middle
5 0 QAT Qatar High : nonOECD
5 0
ROU Romania Upper middle
5 0
RUS Russian Federation High : nonOECD
1 4 SAU Saudi Arabia High : nonOECD
5 0
SDN Sudan Lower middle
0 5
SEN Senegal Lower middle
4 1 SGP Singapore High : nonOECD X
5 0
SLV El Salvador Lower middle
4 1
SVK Slovak Republic High: OECD X X 5 0 SVN Slovenia High: OECD X X 5 0
SWE Sweden High: OECD X X 5 0
SWZ Swaziland Lower middle
5 0 TGO Togo Low
5 0
THA Thailand Upper middle
3 2
TUN Tunisia Upper middle
5 0 TUR Turkey Upper middle
X 0 5
TZA Tanzania Low
5 0
UGA Uganda Low
1 4 UKR Ukraine Lower middle
5 0
URY Uruguay High : nonOECD
5 0
USA United States High: OECD X X 5 0
VEN Venezuela, RB Upper middle
5 0
VNM Vietnam Lower middle
5 0
ZAF South Africa Upper middle
3 2 ZWE Zimbabwe Low 5 0
Total
Episodes. 451 84
* Political Instability Task Force Project. See section 3.3.1 for the definition of internal
armed conflict employed
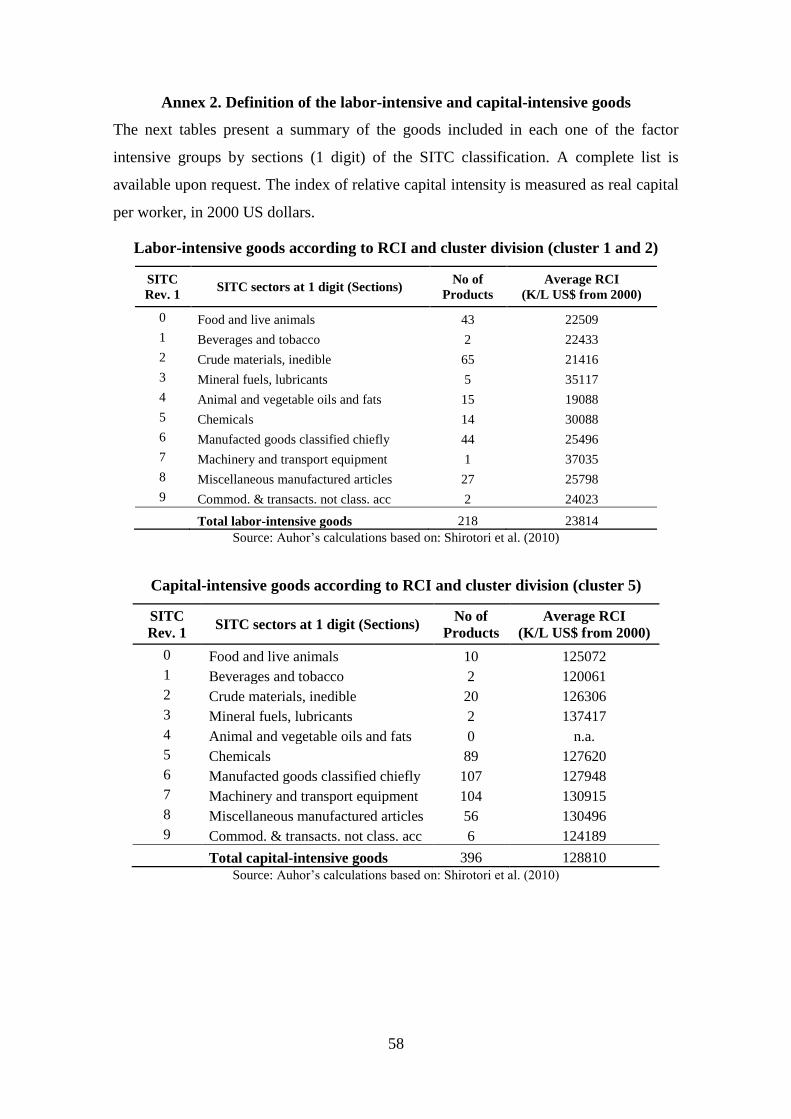
58
Annex 2. Definition of the labor-intensive and capital-intensive goods
The next tables present a summary of the goods included in each one of the factor
intensive groups by sections (1 digit) of the SITC classification. A complete list is
available upon request. The index of relative capital intensity is measured as real capital
per worker, in 2000 US dollars.
Labor-intensive goods according to RCI and cluster division (cluster 1 and 2)
SITC
Rev. 1 SITC sectors at 1 digit (Sections)
No of
Products
Average RCI
(K/L US$ from 2000)
0 Food and live animals 43 22509
1 Beverages and tobacco 2 22433
2 Crude materials, inedible 65 21416
3 Mineral fuels, lubricants 5 35117
4 Animal and vegetable oils and fats 15 19088
5 Chemicals 14 30088
6 Manufacted goods classified chiefly 44 25496
7 Machinery and transport equipment 1 37035
8 Miscellaneous manufactured articles 27 25798
9 Commod. & transacts. not class. acc 2 24023
Total labor-intensive goods 218 23814
Source: Auhor’s calculations based on: Shirotori et al. (2010)
Capital-intensive goods according to RCI and cluster division (cluster 5)
SITC
Rev. 1 SITC sectors at 1 digit (Sections)
No of
Products
Average RCI
(K/L US$ from 2000)
0 Food and live animals 10 125072
1 Beverages and tobacco 2 120061
2 Crude materials, inedible 20 126306
3 Mineral fuels, lubricants 2 137417
4 Animal and vegetable oils and fats 0 n.a.
5 Chemicals 89 127620
6 Manufacted goods classified chiefly 107 127948
7 Machinery and transport equipment 104 130915
8 Miscellaneous manufactured articles 56 130496
9 Commod. & transacts. not class. acc 6 124189
Total capital-intensive goods 396 128810
Source: Auhor’s calculations based on: Shirotori et al. (2010)

59
Annex 3. Robustness Checks: Regressions excluding countries by level of development and regions
*** Significant at 1%, ** significant at 5%, * significant at 5%. Robust standard errors adjusted for clustering at the country level in parentheses. All specifications include
time and fixed effects.
Exclu.-
Advanced
Economies
IMF
Exclu.-High
Income
W.Bank
Exclu.-East
Asia & Pac.
Exclu.-
Europe &
Central
Asia
Exclu.-Latin
America &
Caribbean
Exclu.-
Middle East
& North
Africa
Exclu.-
South Asia
Exclu.-Sub-
Saharan
Africa
Exclu.-
Advanced
Economies
IMF
Exclu.-High
Income
W.Bank
Exclu.-East
Asia & Pac.
Exclu.-
Europe &
Central
Asia
Exclu.-Latin
America &
Caribbean
Exclu.-
Middle East
& North
Africa
Exclu.-
South Asia
Exclu.-Sub-
Saharan
Africa
VARIABLES (1) (2) (3) (4) (5) (6) (7) (8) (9) (10) (11) (12) (13) (14) (15) (16)
lnGDPpc initial year of span -0.034*** -0.025** -0.048*** -0.042*** -0.045** -0.055*** -0.051*** -0.058*** -0.026* -0.014 -0.049*** -0.039** -0.048** -0.060*** -0.053*** -0.065***
(0.013) (0.012) (0.015) (0.014) (0.018) (0.014) (0.013) (0.014) (0.015) (0.012) (0.014) (0.017) (0.020) (0.016) (0.015) (0.016)
lnSk t-p -0.020 -0.027* -0.013 -0.012 0.007 -0.010 -0.007 -0.007 -0.021** -0.025** -0.014 -0.012 0.008 -0.011 -0.009 -0.009
(0.012) (0.014) (0.010) (0.010) (0.006) (0.008) (0.008) (0.009) (0.010) (0.012) (0.010) (0.010) (0.007) (0.009) (0.008) (0.009)
lnSchool initial year of span 0.021 0.001 0.015 0.038* 0.003 0.015 0.018 0.021 0.004 -0.012 -0.002 0.027 -0.008 -0.004 -0.000 0.001
(0.028) (0.026) (0.017) (0.022) (0.014) (0.016) (0.016) (0.022) (0.022) (0.019) (0.018) (0.020) (0.014) (0.016) (0.017) (0.024)
lnLexpect initial year of span -0.022 -0.045 -0.007 -0.048 -0.045 -0.035 -0.047 -0.186 0.056 0.015 0.083** 0.034 0.022 0.076 0.047 -0.177
(0.071) (0.062) (0.075) (0.058) (0.060) (0.061) (0.082) (0.191) (0.061) (0.054) (0.039) (0.048) (0.062) (0.047) (0.048) (0.184)
ln t-p -0.427 0.389 -0.163 0.507 0.218 0.202 0.214 0.259 -0.140 0.868 -0.005 0.583 0.136 0.063 0.173 0.093
(1.073) (1.093) (0.538) (0.788) (0.440) (0.448) (0.441) (0.422) (1.051) (1.004) (0.517) (0.768) (0.447) (0.465) (0.441) (0.439)
ln(1+Tappl) t -0.106** -0.114** -0.097 -0.098*** -0.034 -0.098** -0.133** -0.107** -0.065 -0.068 -0.195*** -0.071 -0.019 -0.117** -0.162*** -0.143***
(0.047) (0.046) (0.063) (0.034) (0.035) (0.046) (0.051) (0.050) (0.054) (0.055) (0.042) (0.050) (0.048) (0.051) (0.043) (0.049)
Diff_Agriculture t 0.153** 0.173** 0.010 0.071 0.023 -0.004 0.021 0.041
(0.074) (0.079) (0.051) (0.060) (0.038) (0.058) (0.044) (0.044)
Diff_Lintensive t 0.540*** 0.598*** 0.143 0.469*** -0.027 0.186* 0.211** 0.244**
(0.176) (0.173) (0.110) (0.125) (0.070) (0.100) (0.100) (0.098)
Statefailcw t -0.016*** -0.016** -0.014* -0.016*** -0.022*** -0.017*** -0.019*** -0.020*** -0.008 -0.005 -0.037*** -0.013 -0.031** -0.031*** -0.021** -0.037***
(0.005) (0.006) (0.009) (0.005) (0.006) (0.006) (0.007) (0.007) (0.010) (0.010) (0.007) (0.011) (0.016) (0.011) (0.009) (0.014)
Interaction IAC*Trdpol -0.485** -0.422** -0.499 -0.559*** -0.357** -0.543*** -0.594** -0.578** -0.442* -0.541** 0.515*** -0.300 0.182 0.198 -0.162 0.164
(0.215) (0.207) (0.354) (0.174) (0.168) (0.207) (0.279) (0.232) (0.253) (0.253) (0.165) (0.245) (0.202) (0.207) (0.203) (0.217)
Constant 0.486 0.525* 0.540 0.599** 0.643** 0.719*** 0.732** 1.386 0.098 0.156 0.220 0.229 0.403 0.338* 0.395** 1.467*
(0.310) (0.270) (0.333) (0.252) (0.246) (0.252) (0.318) (0.840) (0.242) (0.209) (0.170) (0.200) (0.252) (0.193) (0.190) (0.798)
Observations 135 112 218 149 209 244 248 226 135 112 218 149 209 244 248 226
R-squared 0.430 0.469 0.312 0.346 0.535 0.372 0.382 0.388 0.446 0.500 0.361 0.366 0.525 0.375 0.384 0.402
Number of Countries 73 60 91 73 88 98 101 86 73 60 91 73 88 98 101 86
P-Value (F-test IAC=Trdpol=IAC*Trdpol=0) 0.000 0.005 0.253 0.000 0.003 0.002 0.000 0.002 0.001 0.002 0.000 0.000 0.122 0.003 0.000 0.001
P-Value (F-test Trdpol=IAC*Trdpol=0) 0.011 0.020 0.345 0.007 0.108 0.035 0.105 0.028 0.007 0.003 0.000 0.000 0.665 0.014 0.100 0.003
P-Value (F-test IAC=IAC*Trdpol=0) 0.000 0.005 0.133 0.000 0.001 0.001 0.000 0.001 0.001 0.002 0.000 0.001 0.056 0.011 0.001 0.012
Dependent Variable: Growth Rate of GDP per capita (worker)

60
Related Documents