Trade Liberalization and Firm Productivity: The Case of India Petia Topalova ∗ March 2007 Abstract Using a panel of firm-level data, this paper examines the effects of India’s trade reforms in the early 1990s on firm productivity in the manufacturing sector, focusing on the interaction between this policy shock and industry, firm and environment characteristics. The rapid and comprehensive tariff reductions–part of an IMF-supported adjustment program with India in 1991–allow us to establish a causal link between inter-industry and inter-temporal variations in output tariffs, input tariffs, and effective rates of protection and consistently estimated firm productivity. Specifically, reductions in trade protectionism led to higher lev- els of firm productivity, with this effect strongest in industries that were import-competiting and were not subject to excessive domestic regulation. A significant productivity boost was generated by the lower tariffs on intermediate inputs as well. Interestingly, state-level char- acteristics, such as labor regulations, investment climate, and financial development, do not appear to influence the effect of trade liberalization on firm productivity. Finally there is strong suggestive evidence of complementarities between trade liberalization and industrial policies that encourage domestic competition. JEL Classification Numbers: F14, O19, F13, O53. Keywords: Trade liberalization, Tariffs, Inputs, Productivity, India. ∗ International Monetary Fund: [email protected]. I would like to thank Abhijit Banerjee, Shawn Cole, David Cowen, Esther Duflo and Kalpana Kochhar for their guidance and support. This paper has greatly benefited from discussions with Irene Brambilla, Robin Burgess, Rema Hanna and Nina Pavcnik. I am also grateful to the Development lunch participants at MIT, seminar participants at the IMF Asia and Pacific Department and NEUDC for their helpful comments. The Prowess data used in this paper was provided by the Asia and Pacific Department of the International Monetary Fund while the author was a summer intern. 1

Welcome message from author
This document is posted to help you gain knowledge. Please leave a comment to let me know what you think about it! Share it to your friends and learn new things together.
Transcript
Trade Liberalization and Firm Productivity: The Case of India
Petia Topalova∗
March 2007
Abstract
Using a panel of firm-level data, this paper examines the effects of India’s trade reforms in
the early 1990s on firm productivity in the manufacturing sector, focusing on the interaction
between this policy shock and industry, firm and environment characteristics. The rapid
and comprehensive tariff reductions–part of an IMF-supported adjustment program with
India in 1991–allow us to establish a causal link between inter-industry and inter-temporal
variations in output tariffs, input tariffs, and effective rates of protection and consistently
estimated firm productivity. Specifically, reductions in trade protectionism led to higher lev-
els of firm productivity, with this effect strongest in industries that were import-competiting
and were not subject to excessive domestic regulation. A significant productivity boost was
generated by the lower tariffs on intermediate inputs as well. Interestingly, state-level char-
acteristics, such as labor regulations, investment climate, and financial development, do not
appear to influence the effect of trade liberalization on firm productivity. Finally there is
strong suggestive evidence of complementarities between trade liberalization and industrial
policies that encourage domestic competition.
JEL Classification Numbers: F14, O19, F13, O53.
Keywords: Trade liberalization, Tariffs, Inputs, Productivity, India.
∗International Monetary Fund: [email protected]. I would like to thank Abhijit Banerjee, Shawn Cole, David
Cowen, Esther Duflo and Kalpana Kochhar for their guidance and support. This paper has greatly benefited
from discussions with Irene Brambilla, Robin Burgess, Rema Hanna and Nina Pavcnik. I am also grateful to
the Development lunch participants at MIT, seminar participants at the IMF Asia and Pacific Department and
NEUDC for their helpful comments. The Prowess data used in this paper was provided by the Asia and Pacific
Department of the International Monetary Fund while the author was a summer intern.
1
1 Introduction
Over the past two decades, trade liberalization has become an important part of many countries’
development strategies.1 Advocates of liberalization argue that opening up local markets to
foreign competition and foreign direct investment can lead to improvements in the productivity
of domestic industries, resulting in a more efficient allocation of resources and greater overall
output. Critics warn that domestic firms may not be able to realize efficiency gains, because they
are unable to successfully adapt foreign technologies to local methods of production or because
domestic firms face binding credit constraints that prevent expansion of efficient industries as
well as investments in new technology. Which of these two views is closer to the truth has
important implications for trade policy: if the latter holds, benefits of liberalization may not
be realized unless additional policies are devised to facilitate technology transfer or ease credit
constraints.
This paper examines the effects of the recent trade liberalization in India on firm productivity
using a panel of firm-level data. In particular, I address several questions: did India’s sweeping
trade reforms in the early 1990s lead to higher firm-level productivity? Did the potential foreign
competition or access to better inputs spur the rise in productivity? How heterogeneous was
the effect of liberalization across industries, firms, and economic environments? Were industries
that were highly regulated at the onset of the reforms capable of realizing efficiency gains? How
did firm size and ownership affect firms’ response to liberalization? And finally, did institutional
characteristics of the Indian states, such as financial development, investment climate, and labor
laws play a role in the propagation of the trade liberalization shock?
India’s experience is particularly useful in seeking to answer these questions: in 1991, in
response to a severe balance of payments crisis, India turned to the International Monetary
Fund for assistance in solving its external payments problem. Financial assistance from the IMF
1In a recent lecture, Anne Krueger, the First Deputy Managing Director of the International Monetary Fund,
argued that liberalization is essential to growth and poverty reduction: “First, no country has achieved rapid and
sustained growth in living standards without using the international economy and integrating with it. Second,
countries wanting to achieve lasting reductions in poverty will be more successful the sounder are their own
economic policies and the more rapid their economic growth. And third, for countries with a sound domestic
policy framework, poverty reduction and growth will be more rapid the more open is the international economy
and the more rapid the growth of trade in goods and services” (Heinz Arndt Memorial Lecture, August 13, 2003).
2
included an adjustment program, requiring major structural reforms — a key one being trade
liberalization. A massive overall reduction in tariffs and non-tariff barriers, as well as a reduction
in the standard deviation of protection, followed. Coinciding with these tariff reductions were
significant changes in firm-level productivity, as documented by Unel (2003).
A major difficulty in estimating the effects of trade liberalization on productivity is the fact
that trade policies are endogenously determined: there are strong theoretical reasons to believe
that countries will strategically adjust trade policies, for example by reducing tariffs only after
productivity increases by local firms. This will confound estimates of the effect of liberalization
on productivity. As I will argue below, because trade liberalization in India in the early 1990s
was rapid, comprehensive, and externally imposed, it is reasonable to assume that the changes in
level of protectionism were unrelated to firm- and industry-level productivity. Thus, the reforms
initiated in 1991 and completed in the context of the export-import policy announced in the
government’s Eighth Plan (1992-96) comprise an excellent setting to test what effect changes in
tariff protection have on firm productivity.2
In order to estimate the effect of trade liberalization on productivity, I employ an analytic
framework similar to that used in Pavcnik (2002), Muendler (2004), Amiti and Konings (2005)
and Fernandes (2007). First, I obtain consistent estimates of the parameters of the industry-level
production functions in constructing firm level productivity measures, using the methodology
of Levinsohn and Petrin (2003). Next, I examine the correlation between trade policies and
manufacturing productivity in a regression framework. Following the recent work by Fernandes
(2007), I allow for lagged productivity to affect the current level of productivity, an assumption
made for the consistent estimation of the production function in the first stage, but generally
ignored by previous studies. To limit the confounding effect of possible selective protection of
industries, I focus on the pre- and immediately post-reform period, using plausibly exogenous
intertemporal variation in trade protection across industries.
I find that reductions in trade protection led to higher levels of productivity. Both the in-
creased competition, stemming from the reduction in output tariffs and the access to better in-
puts due to the lower input tariffs boosted productivity, with the latter effect being substantially
2 India’s trade policy is developed according to five—year plans. While these plans may be modified during the
implementation phase, they are by and large carried out per the original draft.
3
larger in magnitude. The productivity impact varied across industries, with import-competing
industries showing a much higher responsiveness to the decline in protection. Firms in industries
that were particularly burdened by regulations at the eve of the reforms did not respond to the
competitive pressures with enhanced productivity, as they did not have the freedom to adjust
their production technology. Firms differed in the way they responded to the trade liberalization
shock. Domestic companies significantly increased productivity. However, there is no evidence
that trade liberalization led to productivity improvements for foreign companies, as they were
already exposed to foreign competition and learning opportunities from superior inputs. State-
level characteristics, such as being a coastal state, labor regulations, and financial development,
do not seem to influence the effect of trade liberalization on productivity. Finally, I show that
the estimated effects of tariff reductions are robust to controlling for concurrent industrial pol-
icy changes, namely delicensing and relaxation of entry regulation of foreign direct investment.
If anything, these concurrent reforms seem to have contributed to the productivity growth in
manufacturing, though the correlations do not warrant a causal interpretation. There is also
evidence of strong complementarity between trade reforms, delicensing and FDI liberalization.
The efficiency gains from trade reforms were largest in industries that also experienced the most
deregulation and biggest progress in FDI liberalization.
This study contributes to the literature in a few important ways. First, this is one of
the first studies of the productivity impacts of trade reforms that presents direct evidence of
the endogeneity of trade policies with respect to industrial productivity and accounts for it,
by focusing on a narrow time window before and after the reform when movements in trade
protection are plausibly exogenous. Second, it disentangles the role of import competition versus
access to better and cheaper inputs for productivity improvements as in Amiti and Konings
(2005), and how this role is shaped by industry, firm and environment characteristics. Finally,
it provides micro evidence informing the debate on the effects of policy complementarities on
economic growth.
The rest of the paper proceeds as follows. Section 2 describes the Indian reforms of 1991
focusing on trade liberalization. Section 3 outlines the empirical methodology, the data and
relates the study to the existing literature. Section 4 discusses the empirical estimates of the
relationship between trade reforms and productivity and section 5 concludes.
4
2 Background and the Indian Trade Liberalization
India’s post-independence development strategy was one of national self-sufficiency, and stressed
the importance of government regulation of the economy. Cerra et al. (2000) characterized it
as “both inward looking and highly interventionist, consisting of import protection, complex
industrial licensing requirements, pervasive government intervention in financial intermediation
and substantial public ownership of heavy industry.” In particular, India’s trade regime was
amongst the most restrictive in Asia, with high nominal tariffs and extensive non-tariff barriers,
including a complex import licensing system, an “actual user” policy that restricted imports by
intermediaries, restrictions of certain exports and imports to the public sector (“canalization”),
phased manufacturing programs that mandated progressive import substitution, and government
purchase preferences for domestic producers.
It was only during the second half of the 1980s, when the focus of India’s development strat-
egy gradually shifted toward export led growth, supported by measures to promote exports and
liberalize imports for exporters, that the process of liberalization began. Import and industrial
licensing were eased, and tariffs replaced some quantitative restrictions, although even as late as
1989/90 a mere 12 percent of manufactured products could be imported under an open general
license; still, the average tariff was one of the highest, more than 90 percent. (Cerra et al., 2000)
However, concurrent to the gradual liberalization of the late 1980s was a rise in macroeco-
nomic imbalances–namely fiscal and balance of payments deficits– which increased India’s
vulnerability to shocks. The sudden increase in oil prices due to the Gulf War in 1990, the drop
in remittances from Indian workers in the Middle East, and the slackened demand of important
trading partners, as well as political uncertainty, undermined investor confidence and resulted
in large capital outflows.
To deal with its external payments problems, the government of India requested a Stand-By
Arrangement from the International Monetary Fund (IMF) in August 1991. The IMF support
was conditional on an adjustment program featuring macroeconomic stabilization and structural
reforms. The latter focused on the industrial and import licenses, the financial sector, the
tax system, and trade policy. On trade policy, benchmarks for the first review of the Stand-
By Arrangement included a reduction in the level and dispersion of tariffs, and a removal of
5
quantitative restrictions on imported inputs and capital goods for export production (Chopra et
al., 1995). Specific policy actions in a number of areas — notably industrial deregulation, trade
policy and public enterprise reforms, and some aspects of financial sector reform — also formed
the basis for a World Bank Structural Adjustment Loan, as well as sector loans.
The government’s export-import policy plan (1992-97) ushered in radical changes to the
trade regime by sharply reducing the role of the import and export control system. The share of
products subject to quantitative restrictions decreased from 87 percent in 1987/88 to 45 percent
in 1994/95. The actual user condition on imports was discontinued. All 26 import licensing
lists were eliminated and a “negative” list was established (Hasan et al., 2003). Thus, apart
from goods in the negative list, all goods could be freely imported (subject to import tariffs)
(Goldar, 2002). In addition to easing import and export restrictions, tariffs were drastically
reduced (Figure 1, Panel A and B, Table A1). Average tariffs fell from more than 80 percent in
1990 to 39 percent in 1996, and the standard deviation of tariffs dropped by 50 percent during
the same period. The structure of protection across industries changed (Figure 1 Panel E).
Figure 1 Panel F shows the strikingly linear relationship between the pre-reform tariff levels
and the decline in tariffs the industry experienced. This graph reflects the guidelines according
to which tariff reform took place,3 namely reduction in the general level of tariffs, reduction of
the spread or dispersion of tariff rates, simplification of the tariff system and rationalization of
tariff rates, along with the abolition of numerous exemptions and concessions. There were some
differences in the magnitude of tariff changes (and especially NTBs) according to industry use
type: i.e. Consumer Durables, Consumer Nondurables, Capital goods, Intermediate and Basic
goods (Figure 1, Panel C and D). Indian authorities first liberalized Basic, Intermediates and
Capital goods, while Consumer Nondurables and Consumer Durables were slowly moved from
the “negative” list to the list of freely importable goods only in the second half of the 1990s. The
Indian Rupee was devalued 20 percent against the dollar in July 1991 and further devalued in
February 1992. By 1993, India had adopted a flexible exchange rate regime (Ahluwalia, 2000).
Following the reduction in trade distortions, the ratio of total trade in manufactures to GDP
rose from an average of 13 percent in the 1980s to nearly 19 percent of GDP in 1999/00 (Figure
2, Panel A). Export and import volumes also increased sharply from the early 1990s, outpacing
3The guidelines were outlined in the Chelliah report of The Tax Reform Commission constituted in 1991.
6
growth in real output (Figure 2, Panel B).
India remained committed to further trade liberalization, and since 1997 there have been
further adjustments to import tariffs. However, at the time the government announced the
export-import policy in the Ninth Plan (1997-2002), sweeping reforms outlined in the previous
plan had been undertaken and pressure for further reforms from external sources had abated. In
particular, if policy decisions on tariff changes across industries were indeed based on expected
future productivity or on industry lobbying, the empirical strategy would not be valid. Simply
comparing productivity in liberalized industries to productivity in non liberalized industries
would possibly give a spurious correlation between total factor productivity (TFP) growth and
trade policies. As a simple check of the validity of the empirical strategy, I look for evidence
that output tariffs and effective rates of protection were correlated with past industry-level
performance during two periods: the period before and immediately after the crisis (1989-1996),
when India’s trade policy was significantly affected by externally imposed benchmarks, and the
period 1997—2002, when external pressure was virtually absent.4 In the latter period, there
is some evidence to suggest that trade protection measures may have been used selectively to
protect less efficient industries. I discuss this in detail in the next section.
3 Empirical Strategy, Data, and Related Literature
The theoretical literature on trade and productivity does not provide an unambiguous predic-
tion of the impact of trade liberalization on firm level productivity. Some argue that trade
liberalization in poor economies may have a detrimental effect on growth by preventing a coun-
try’s involvement in certain industries, thus potentially denying it knowledge accumulation and
productivity growth (Young, 1991 and Stiglitz, 2002). Others argue the opposite: trade lib-
eralization can actually increase overall domestic productivity through several channels. In
the presence of imperfectly competitive domestic markets, trade liberalization and concurrently
foreign competition can improve allocative efficiency by forcing firms to lower cost-price mark-
ups (i.e., the pro-competitive effects of trade) and thus to move them down their average cost
4 Ideally, we would like to estimate the production function for the periods before 1991, 1991—1996, and after
1996, but due to the small number of observations before 1991, we combine the pre-reform and immediately
post-reform period.
7
curves, thereby effectively raising firm size and scale efficiency (i.e., scale efficiency gain of trade)
(Krugman, 1979, Helpman and Krugman, 1985, Epifani, 2003). With firm heterogeneity, trade
opening may also induce a reallocation of market shares towards more efficient firms and generate
an aggregate productivity gain, without any productivity change at the firm level (Roberts and
Tybout 1996, Melitz, 2003). Going beyond this reallocation effect of trade liberalization, Aghion
et al. (2005) suggest another mechanism through which liberalization might affect productivity:
the increased threat of competition raises the innovation incentives by domestic producers as
they seek to deter entry by foreign competitors. The higher level of innovation leads to pro-
ductivity growth at the firm level. Finally, the access to superior inputs and technology might
also increase technical efficiency (Ethier, 1982, Markusen, 1989, Grossman and Helpman, 1991,
Rivera-Batiz and Romer, 1991). However, other studies worry that the benefits of trade liber-
alization will not be realized unless complementary policies are in place (Bolaky and Freund,
2004, Hoekman and Javorcik, 2004). For example in a panel of countries, Bolaky and Freund
(2004) find that trade does not stimulate growth in economies with excessive business and labor
regulations, which may prevent resources from moving into the most productive sectors and to
the most efficient firms, or could hinder firm’s technology adoption.
Thus, whether domestic producers can take advantage of increased access to knowledge or
reallocate resources towards more productive industries or firms remains questionable, especially
in developing countries.
Since the theory makes ambiguous predictions, the question of whether trade liberalization
leads to higher productivity remains largely empirical. In the context of developing countries,
several studies have explored the relationship between firm productivity and trade reforms. Ty-
bout et al. (1991) find no evidence of increased productivity following liberalization in Chile.
Harrison (1994), Tybout and Westbrook (1995), Pavcnik (2002), Fernandes (2007) and Muendler
(2004), on the other hand, do observe productivity increases following liberalization in, respec-
tively, Côte d’Ivoire, Mexico, Chile, Colombia and Brazil. The above studies use output tariffs
as a measure of trade reforms, thus estimating the productivity impacts stemming from import
competition. Schor (2004) and Amiti and Konings (2005) extend this research by also looking
at the effect of intermediate input tariffs in the case of Brazil and Indonesia. These studies find
that, in comparison to the competition effect of trade, the access to cheaper intermediates has
8

a larger impact on firm productivity.
I employ the natural experiment of the trade liberalization of India in 1991 to answer the
question of how these reforms affected firm productivity in the Indian context. In particular, I
extend Krishna and Mitra’s (1998) attempt to rigorously estimate the effects of trade liberaliza-
tion on firm performance in Indian manufacturing for the 1986—1993 period and the recent study
by Sivadasan (2006), which measures the productivity impacts of various barriers to entry in the
Indian manufacturing sector. While Krishna and Mitra (1998) and Sivadasan (2006) capture the
effect of liberalization through a post-reform dummy (Sivadasan uses the interaction between
post-reform dummy and a dummy of whether the industry received a large decrease in output
tariffs), I use firm-level panel data, employing intertemporal and across-industry variation in
trade protection to identify the effect of trade policies. In addition, I study not only the effect
of output tariffs on productivity, but also the impact of tariffs on intermediate inputs as well as
effective rates of protection. By looking at how firms across different industries, and different
economic environments responded to the trade liberalization shock, this study contributes to
the debate on the need for complementary domestic policies for the productivity effects of trade
liberalization.
3.1 Productivity Measure
To begin the analysis, I construct measures of firm-level total factor productivity (TFP) fol-
lowing the methodology of Levinsohn and Petrin (2003). Building on Olley and Pakes (1996),5
Levinsohn and Petrin (2003) resolve the fundamental problem of estimating production functions
arising from the fact that a firm’s choice of inputs is likely to be correlated with any unobserved
firm-specific productivity shocks. Levinsohn and Petrin (2003) use a firm’s raw material inputs
as a proxy for the unobservable productivity shocks to correct for the simultaneity in the firm’s
5Olley and Pakes (1996) develop a methodology in which an investment proxy controls for correlation between
input levels and unobserved productivity shocks, allowing for the consistent estimation of the firm’s production
function. However, this methodology can only be applied to plants reporting non-zero investment, usually leading
to a sizable truncation of the available data. The Levinsohn and Petrin (2003) method avoids this problem by
assuming intermediate inputs are strictly monotonic in productivity. As intermediate input demand is typically
much less lumpy than investment, the strict monotonicity assumption is more likely to hold.
9
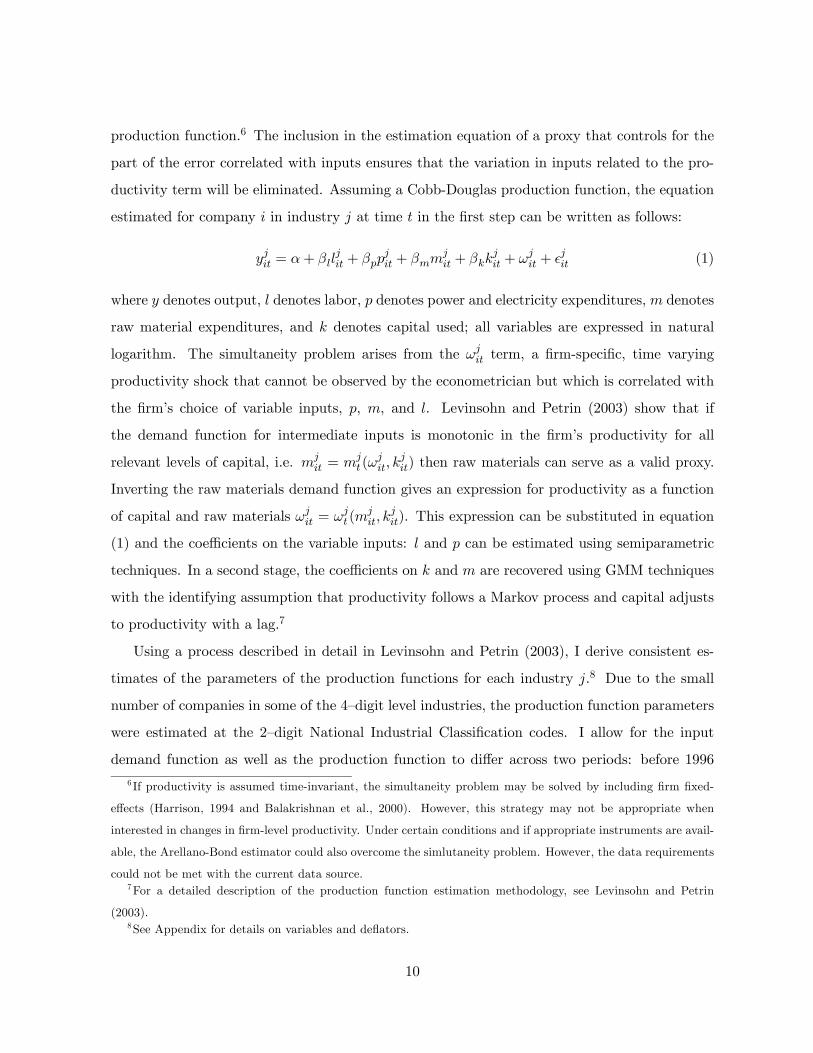
production function.6 The inclusion in the estimation equation of a proxy that controls for the
part of the error correlated with inputs ensures that the variation in inputs related to the pro-
ductivity term will be eliminated. Assuming a Cobb-Douglas production function, the equation
estimated for company i in industry j at time t in the first step can be written as follows:
yjit = α+ βlljit + βpp
jit + βmm
jit + βkk
jit + ωjit +
jit (1)
where y denotes output, l denotes labor, p denotes power and electricity expenditures, m denotes
raw material expenditures, and k denotes capital used; all variables are expressed in natural
logarithm. The simultaneity problem arises from the ωjit term, a firm-specific, time varying
productivity shock that cannot be observed by the econometrician but which is correlated with
the firm’s choice of variable inputs, p, m, and l. Levinsohn and Petrin (2003) show that if
the demand function for intermediate inputs is monotonic in the firm’s productivity for all
relevant levels of capital, i.e. mjit = mj
t (ωjit, k
jit) then raw materials can serve as a valid proxy.
Inverting the raw materials demand function gives an expression for productivity as a function
of capital and raw materials ωjit = ωjt (mjit, k
jit). This expression can be substituted in equation
(1) and the coefficients on the variable inputs: l and p can be estimated using semiparametric
techniques. In a second stage, the coefficients on k and m are recovered using GMM techniques
with the identifying assumption that productivity follows a Markov process and capital adjusts
to productivity with a lag.7
Using a process described in detail in Levinsohn and Petrin (2003), I derive consistent es-
timates of the parameters of the production functions for each industry j.8 Due to the small
number of companies in some of the 4—digit level industries, the production function parameters
were estimated at the 2—digit National Industrial Classification codes. I allow for the input
demand function as well as the production function to differ across two periods: before 1996
6 If productivity is assumed time-invariant, the simultaneity problem may be solved by including firm fixed-
effects (Harrison, 1994 and Balakrishnan et al., 2000). However, this strategy may not be appropriate when
interested in changes in firm-level productivity. Under certain conditions and if appropriate instruments are avail-
able, the Arellano-Bond estimator could also overcome the simlutaneity problem. However, the data requirements
could not be met with the current data source.7For a detailed description of the production function estimation methodology, see Levinsohn and Petrin
(2003).8See Appendix for details on variables and deflators.
10
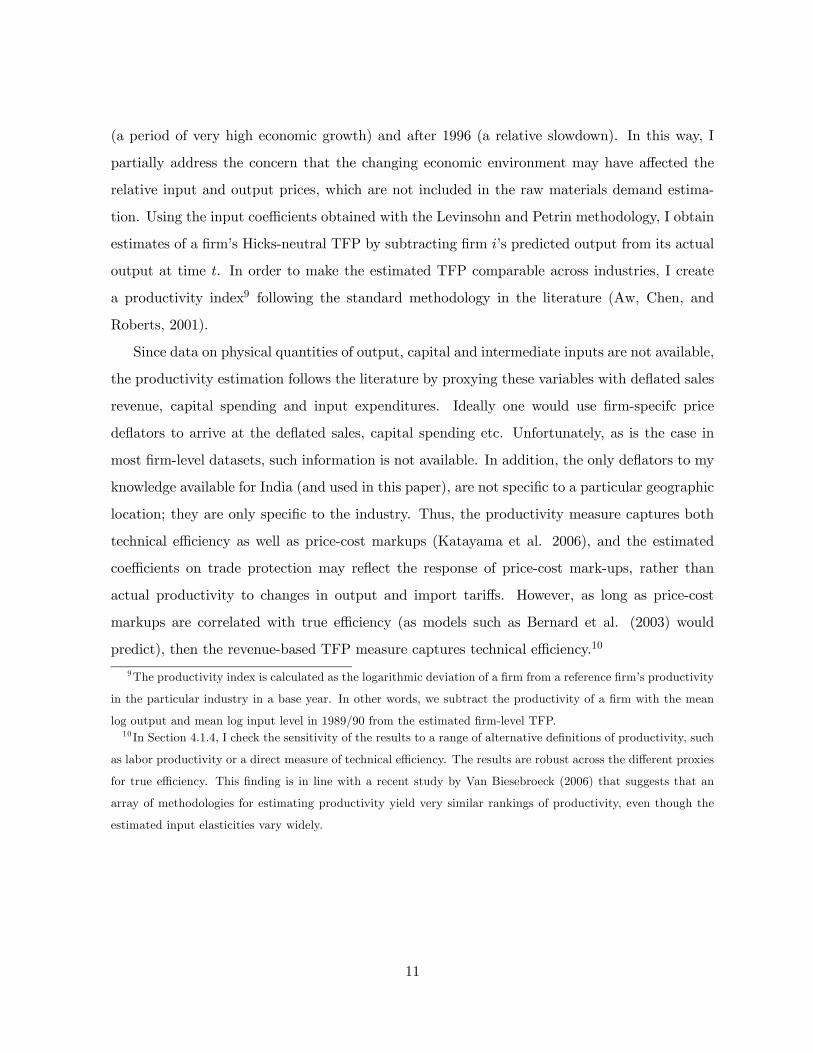
(a period of very high economic growth) and after 1996 (a relative slowdown). In this way, I
partially address the concern that the changing economic environment may have affected the
relative input and output prices, which are not included in the raw materials demand estima-
tion. Using the input coefficients obtained with the Levinsohn and Petrin methodology, I obtain
estimates of a firm’s Hicks-neutral TFP by subtracting firm i’s predicted output from its actual
output at time t. In order to make the estimated TFP comparable across industries, I create
a productivity index9 following the standard methodology in the literature (Aw, Chen, and
Roberts, 2001).
Since data on physical quantities of output, capital and intermediate inputs are not available,
the productivity estimation follows the literature by proxying these variables with deflated sales
revenue, capital spending and input expenditures. Ideally one would use firm-specifc price
deflators to arrive at the deflated sales, capital spending etc. Unfortunately, as is the case in
most firm-level datasets, such information is not available. In addition, the only deflators to my
knowledge available for India (and used in this paper), are not specific to a particular geographic
location; they are only specific to the industry. Thus, the productivity measure captures both
technical efficiency as well as price-cost markups (Katayama et al. 2006), and the estimated
coefficients on trade protection may reflect the response of price-cost mark-ups, rather than
actual productivity to changes in output and import tariffs. However, as long as price-cost
markups are correlated with true efficiency (as models such as Bernard et al. (2003) would
predict), then the revenue-based TFP measure captures technical efficiency.10
9The productivity index is calculated as the logarithmic deviation of a firm from a reference firm’s productivity
in the particular industry in a base year. In other words, we subtract the productivity of a firm with the mean
log output and mean log input level in 1989/90 from the estimated firm-level TFP.10 In Section 4.1.4, I check the sensitivity of the results to a range of alternative definitions of productivity, such
as labor productivity or a direct measure of technical efficiency. The results are robust across the different proxies
for true efficiency. This finding is in line with a recent study by Van Biesebroeck (2006) that suggests that an
array of methodologies for estimating productivity yield very similar rankings of productivity, even though the
estimated input elasticities vary widely.
11
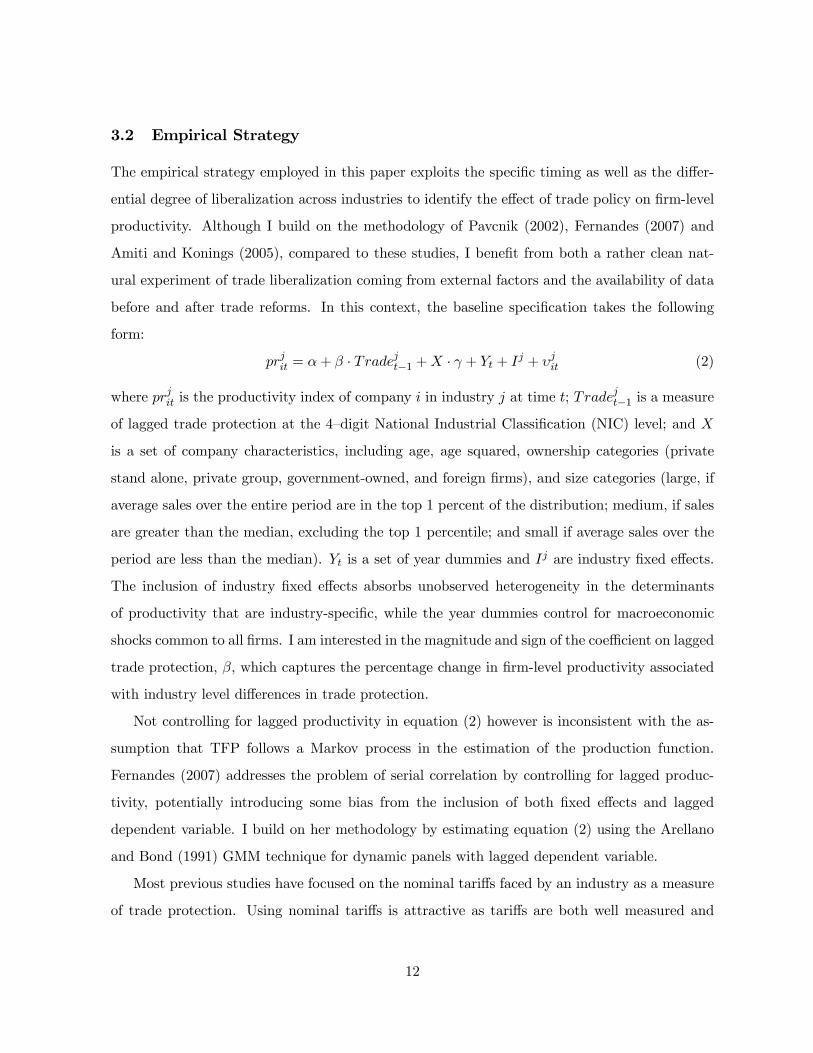
3.2 Empirical Strategy
The empirical strategy employed in this paper exploits the specific timing as well as the differ-
ential degree of liberalization across industries to identify the effect of trade policy on firm-level
productivity. Although I build on the methodology of Pavcnik (2002), Fernandes (2007) and
Amiti and Konings (2005), compared to these studies, I benefit from both a rather clean nat-
ural experiment of trade liberalization coming from external factors and the availability of data
before and after trade reforms. In this context, the baseline specification takes the following
form:
prjit = α+ β · Tradejt−1 +X · γ + Yt + Ij + υjit (2)
where prjit is the productivity index of company i in industry j at time t; Tradejt−1 is a measure
of lagged trade protection at the 4—digit National Industrial Classification (NIC) level; and X
is a set of company characteristics, including age, age squared, ownership categories (private
stand alone, private group, government-owned, and foreign firms), and size categories (large, if
average sales over the entire period are in the top 1 percent of the distribution; medium, if sales
are greater than the median, excluding the top 1 percentile; and small if average sales over the
period are less than the median). Yt is a set of year dummies and Ij are industry fixed effects.
The inclusion of industry fixed effects absorbs unobserved heterogeneity in the determinants
of productivity that are industry-specific, while the year dummies control for macroeconomic
shocks common to all firms. I am interested in the magnitude and sign of the coefficient on lagged
trade protection, β, which captures the percentage change in firm-level productivity associated
with industry level differences in trade protection.
Not controlling for lagged productivity in equation (2) however is inconsistent with the as-
sumption that TFP follows a Markov process in the estimation of the production function.
Fernandes (2007) addresses the problem of serial correlation by controlling for lagged produc-
tivity, potentially introducing some bias from the inclusion of both fixed effects and lagged
dependent variable. I build on her methodology by estimating equation (2) using the Arellano
and Bond (1991) GMM technique for dynamic panels with lagged dependent variable.
Most previous studies have focused on the nominal tariffs faced by an industry as a measure
of trade protection. Using nominal tariffs is attractive as tariffs are both well measured and
12
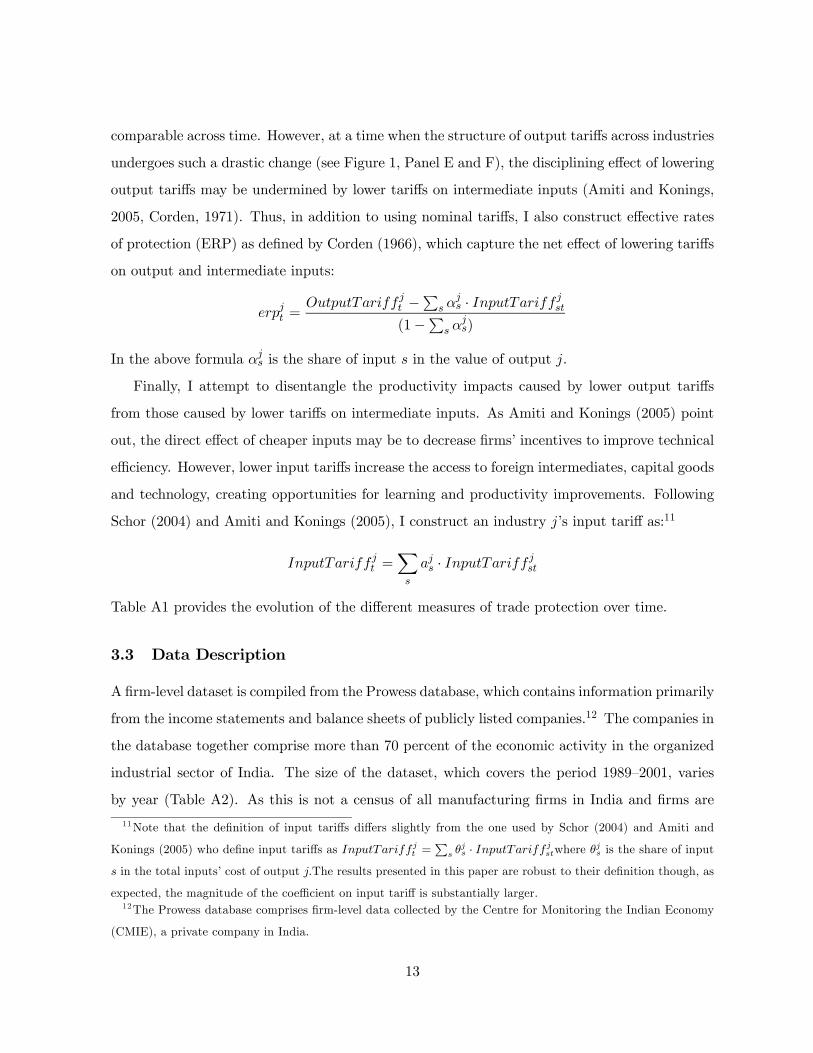
comparable across time. However, at a time when the structure of output tariffs across industries
undergoes such a drastic change (see Figure 1, Panel E and F), the disciplining effect of lowering
output tariffs may be undermined by lower tariffs on intermediate inputs (Amiti and Konings,
2005, Corden, 1971). Thus, in addition to using nominal tariffs, I also construct effective rates
of protection (ERP) as defined by Corden (1966), which capture the net effect of lowering tariffs
on output and intermediate inputs:
erpjt =OutputTariff jt −
Ps α
js · InputTariff jst
(1−P
s αjs)
In the above formula αjs is the share of input s in the value of output j.
Finally, I attempt to disentangle the productivity impacts caused by lower output tariffs
from those caused by lower tariffs on intermediate inputs. As Amiti and Konings (2005) point
out, the direct effect of cheaper inputs may be to decrease firms’ incentives to improve technical
efficiency. However, lower input tariffs increase the access to foreign intermediates, capital goods
and technology, creating opportunities for learning and productivity improvements. Following
Schor (2004) and Amiti and Konings (2005), I construct an industry j’s input tariff as:11
InputTariff jt =Xs
ajs · InputTariffjst
Table A1 provides the evolution of the different measures of trade protection over time.
3.3 Data Description
A firm-level dataset is compiled from the Prowess database, which contains information primarily
from the income statements and balance sheets of publicly listed companies.12 The companies in
the database together comprise more than 70 percent of the economic activity in the organized
industrial sector of India. The size of the dataset, which covers the period 1989—2001, varies
by year (Table A2). As this is not a census of all manufacturing firms in India and firms are
11Note that the definition of input tariffs differs slightly from the one used by Schor (2004) and Amiti and
Konings (2005) who define input tariffs as InputTariff jt = s θjs · InputTariff jstwhere θjs is the share of input
s in the total inputs’ cost of output j.The results presented in this paper are robust to their definition though, as
expected, the magnitude of the coefficient on input tariff is substantially larger.12The Prowess database comprises firm-level data collected by the Centre for Monitoring the Indian Economy
(CMIE), a private company in India.
13

under no legal obligation to report balance sheet and other details to the data collecting agency,
information for some firms for some years is missing. Even though firms that exit and reenter
the database are excluded, the exit from the database may not necessarily indicate that the firm
has exited the industry. Thus, I use an unbalanced panel of companies for estimation purposes. I
verify the robustness of the results by conducting the analysis using only the subset of companies
whose information is available for all years. The dataset contains information on about 4,100
individual manufacturing companies. Firms are categorized by industry according to the 4—
digit 1998 NIC code, and span the industrial composition of the Indian economy. There are 116
industries represented in the sample. The largest sectors, measured by the number of companies,
are chemicals and basic metals, and manufactures of food products, beverages, and textiles. For
the estimation of the production function and TFP, all relevant variables were deflated using
all-India wholesale industry-specific deflators published by the Ministry of Industry. Table A3
provides some summary statistics on the dataset.
The data on firm economic activity are complemented with measures of trade protection. I
construct a database of annual tariff data for 1987-2001 at the six digit level of the Indian Trade
Classification Harmonized System (HS) Code based on various publications of the Ministry of
Finance. I then match about 5,000 product lines to the 116 NIC codes, using the concordance
by Debroy and Santhanam (1993), to calculate average industry-level tariffs. I combine these
industry-level output tariffs with the Input Output Transaction Table from 1993-1994 and cal-
culate industry input tariffs and effective rates of protection. I define input tariff of an industry
as the weighted average of the tariffs of its inputs, where the weights are the value shares. I
calculate effective rates of protection as defined by Corden (1966), which take into account the
effects of tariffs on inputs as well as on outputs.
As trade liberalization was concurrent with other reforms that could potentially generate
productivity gains, I compile industry-specific time-varying measures of delicensing and openness
to foreign direct investment. The source for these series are various publications of the Handbook
of Industrial statistics.
Previous studies have also used volume measures, such as import penetration, in order to
capture the importance of actual exposure to foreign competition. However, import volumes
are endogenously determined; while increased competition is expected to cause firms to become
14
more productive, the Ricardian model of trade predicts that certain goods may be imported
precisely because domestic productivity in that industry is low (Fernandes, 2007). Thus, the
preferred measures of trade policy are lagged nominal tariffs, effective rates of protection and
input tariffs.
3.4 Endogeneity of Trade Policy
Before proceeding with estimating equation (2), I address the concern of the possible endogeneity
of trade policy, which could potentially invalidate the empirical strategy. Specifically, the timing
of trade reform might have reflected Indian authorities’ perception of domestic industries as
mature enough to face foreign competition. The cross-sectional variation in changes of protection
might be related to economic and political factors. The relatively less efficient industries might
have enjoyed higher degree of protection; the political strength of labor as well as business is also
often cited as a determinant of trade protection. If authorities did not liberalize as intensively
the least productive industries, one might observe small decline in tariffs associated with small
increases in productivity and erroneously conclude that trade liberalization boosted productivity.
While several studies of India’s reform argue that the external crisis of 1991 came as a
surprise and opened the way for market-oriented reforms (Hasan et al., 2003, Goyal, 1996,
Varshney, 1999),13 the significant variation in the tariff changes across industries could confound
inference. More precisely, it is important to understand whether the changes in tariffs reflected
authorities’ perceptions of industry’s ability to compete internationally, or the lobbying power
of the industry. Ideally, this question could be answered with a “true” and objective account
of the reform process. Lacking that, I instead look within the data for possible confounding
relationships.
First, I investigate to what extent tariffs moved together. An analysis of the tariff changes
of the 5,000 items in the dataset for 1992-96, the Eighth Plan, and for 1997-2001, the Ninth
Plan, reveals that movements in tariffs were strikingly uniform until 1997 (Figure 3). During
13This view is confirmed in a recent interview with Dr. Chelliah, one of the masterminds of the reforms
“We didn’t have the time to sit down and think exactly what kind of a development model we needed...there
was no systematic attempt to see two things; one, how have the benefits of reforms distributed, and two, ul-
timately what kind of society we want to have, what model of development should we have?,” July 5, 2004
http://in.rediff.com/money/2004/jul/05inter.htm
15
the first 5-year plan that incorporated the economic reforms of 1991, India had to meet certain
externally imposed benchmarks, and the majority of tariff changes across products exhibited
similar behavior (either increased, decreased, or remained constant each year). After 1997,
tariff movements were not as uniform. Policymakers may have been more selective in setting
product tariffs during 1997-2001, and the problem of potential cross-sectional endogenous trade
protection is more pronounced.
A second check uses data from the Annual Survey of Industries to test for “political protec-
tion.” Following the literature, I test whether measures of trade protection are correlated with
politically important characteristics of the industry by regressing the change in output tariffs,
input tariffs and effective rates of protection between 1987 and 1997 on various industrial char-
acteristics in 1987.14 These characteristics include employment size (a larger labor force may
lead to more electoral power and more protection), output size, average wage (policy makers
may protect industries where relatively low skilled/vulnerable workers are employed), concentra-
tion (measured by the average factory size, which captures the ability of producers to organize
political pressure groups to lobby for more protection), share of skilled workers and the growth
of industry output and employment in the 1980s. The results are presented in Table 1. Panel
A shows the correlation between change in output tariffs and industrial characteristics; Panel B
the correlation between change in input tariffs and industrial characteristics; and Panel C the
correlation between change in effective rates of protection and industrial characteristics. Tariff
and ERP changes are not correlated with any of the pre-reform industry characteristics. There
is a statistically significant correlation only between the change in input tariffs and the average
pre-reform wage.
A possible explanation for these results can be found in Gang and Pandey (1996). They
conducted a careful study of the determinants of protection across manufacturing sectors across
three plans, 1979-80, 1984-85 and 1991-92, showing that none of the economic and political fac-
tors are important in explaining industry tariff levels in India.15 They explain this phenomenon
with the hysteresis of policy: trade policy was determined in the Second Five Year Plan and
14The results are robust to using 1988, 1989 or 1990 as the “pre” year.15 In other developing countries, protection tends to be highest for unskilled, labor-intensive sectors. See Gold-
berg and Pavcnik (2005), Hanson and Harrison (1999), Currie and Harrison (1997) for evidence from Colombia,
Mexico and Morocco respectively.
16
never changed, even as the circumstances and natures of the industries evolved.
The evidence presented here suggests that the differential tariff changes across industries
between 1991 and 1997 were as exogenous to the state of the industries as a researcher might
hope for in a real-world setting.
Finally, I investigate whether policy makers adjusted tariffs in response to industry’s pro-
ductivity levels. If this were the case, one should expect current productivity levels to predict
future measures of trade protection. Therefore, I calculate the average industry-level produc-
tivity as the average firm-level TFP, weighted by companies’ sales. I then regress industry-level
output tariffs, input tariffs and ERP in period t+1 on industry-level productivity in period t,
controlling for industry and year fixed effects and weighting each industry by the number of
companies in the industry for the particular year. The results are presented in Table 2. The
correlation between future trade protection and current productivity is indistinguishable from
zero for the 1989—96 period for all three measures used in the study. The 1997—2001 period,
however, is different. The coefficient on current productivity is negative and significant at the 1
percent level, suggesting that trade policy may have been adjusted to reflect industries’ relative
performance.16
This test implies that to correctly identify the effect of trade policies on productivity, one
should restrict attention to the period immediately before and after the major trade reforms
(1989—96). While there is no evidence that variation in tariffs may have been used to selectively
protect the less productive industries during this period, I nevertheless follow Fernandes (2007)
and estimate the effect of lagged rather than contemporaneous tariffs.17 Including industry fixed
effects also absorbs time-invariant political economy factors underlying trade protection across
industries.16 In an alternative specification presented in Appendix Table 4, I also condition on the current tariff, thus
de-facto performing a Granger causality test for panel data. Conditional on current tariffs, current productivity
adds no information to explanation of movements of future tariffs in the 1989-1996 period. However, in 1997-2001,
there is a strong statistically significant relationship between current productivity and future tariffs.17Lagged tariffs are also more appropriate when productivity adjustments do not occur instantaneously.
17
4 Results
4.1 Average Impact of Trade Policy and Robustness
4.1.1 Average Impact of Output Tariffs
The results from estimating equation (2) for the period 1989—96 with output tariffs as a measure
of protection are presented in Table 3 (Panel A). The regression in column (2) includes industry
fixed effects at the 4 digit level. Column (3) includes firm-level fixed effects, and in column
(4) I repeat the analysis on the balanced panel of companies. In column (5) I control for
lagged productivity as Fernandes (2007) to address the problem of serial correlation in equation
(2). However, including the lagged dependent variable in a fixed effects model renders the
estimates inconsistent, thus column (6) and (7) contain the results from the Arellano and Bond
(1991) GMM technique for dynamic panels with lagged dependent variables with one and two
lags respectively. The related specification tests are also presented. Finally in column (8), I
present estimates from the ‘direct approach’ of estimating the productivity impacts of trade
reforms suggested by Fernandes (2007) in which the measures of trade policy are included in
the production function itself.18 In all specifications in columns (1)-(5), the standard errors
are corrected for heteroskedasticity and adjusted for clustering at the firm level to account for
possible serial correlation of the error term. The standard errors in column (8) are bootstrapped
using the block-boostrapping method described in Efron and Tibshirani (1994), which takes into
18This approach corrects for the inconsistency introduced by the assumption that current productivity depends
on lagged trade protection, which is known to the firm, while the Markov process of productivity assumes that
the current productivity realization is a surprise conditional on lagged productivity. Thus, Fernandes (2007)
modifies the Levinsohn and Petrin (2003) estimator by including lagged trade policy directly in the production
function equation, and assuming that firm’s productivity is monotonically increasing in firm’s raw materials, for
all relevant levels of capital and trade policy. The data for all firms across all industries and years are pooled,
the production function is augmented with industry and year fixed effects, and a vector of firm characteristics
(namely age and age squared). Using a process similar to Levinsohn and Petrin (2003), the coefficients on the
variable inputs are estimated using semiparametric techniques, while the coefficient on capital, trade policy and
raw materials are recovered using non-linear least squares. Fernandes (2007)’s correction of the inconsistency in
the two-step approach comes at the expense of estimating one production function for all industries and not being
able to control for firm fixed effects. Thus, I use the direct approach mostly as a robustness check. For a detailed
description of the ‘direct approach,’ see Fernandes (2007).
18
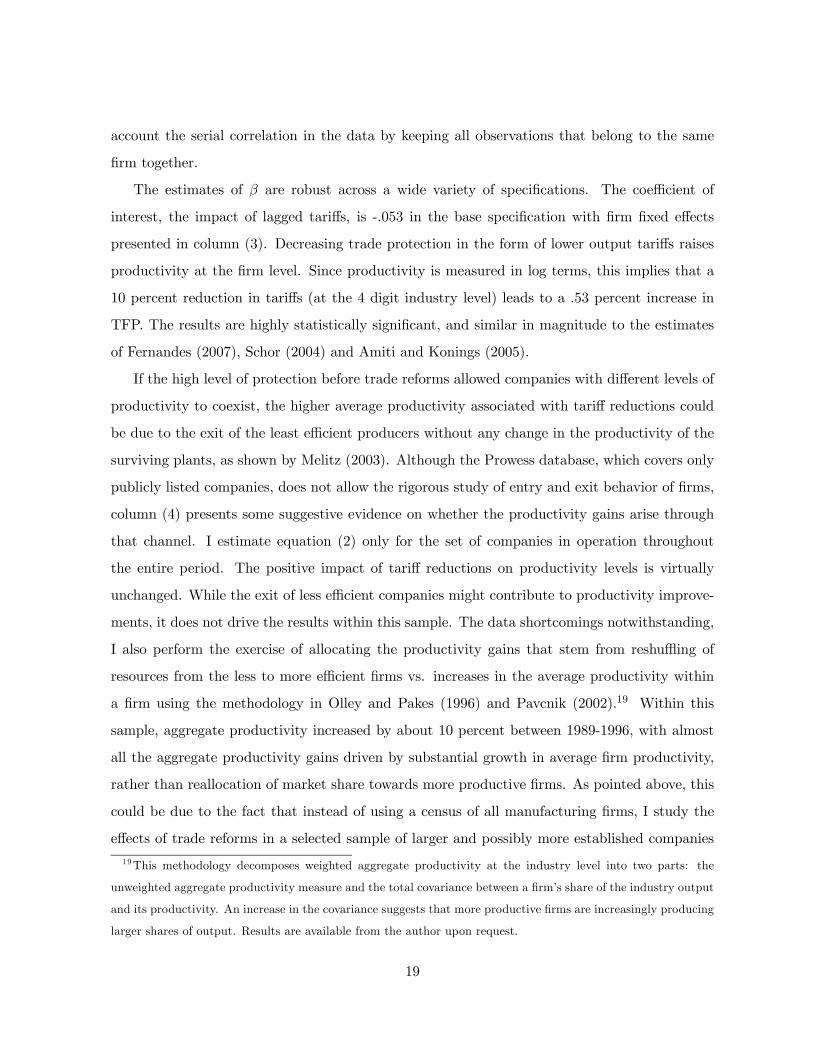
account the serial correlation in the data by keeping all observations that belong to the same
firm together.
The estimates of β are robust across a wide variety of specifications. The coefficient of
interest, the impact of lagged tariffs, is -.053 in the base specification with firm fixed effects
presented in column (3). Decreasing trade protection in the form of lower output tariffs raises
productivity at the firm level. Since productivity is measured in log terms, this implies that a
10 percent reduction in tariffs (at the 4 digit industry level) leads to a .53 percent increase in
TFP. The results are highly statistically significant, and similar in magnitude to the estimates
of Fernandes (2007), Schor (2004) and Amiti and Konings (2005).
If the high level of protection before trade reforms allowed companies with different levels of
productivity to coexist, the higher average productivity associated with tariff reductions could
be due to the exit of the least efficient producers without any change in the productivity of the
surviving plants, as shown by Melitz (2003). Although the Prowess database, which covers only
publicly listed companies, does not allow the rigorous study of entry and exit behavior of firms,
column (4) presents some suggestive evidence on whether the productivity gains arise through
that channel. I estimate equation (2) only for the set of companies in operation throughout
the entire period. The positive impact of tariff reductions on productivity levels is virtually
unchanged. While the exit of less efficient companies might contribute to productivity improve-
ments, it does not drive the results within this sample. The data shortcomings notwithstanding,
I also perform the exercise of allocating the productivity gains that stem from reshuffling of
resources from the less to more efficient firms vs. increases in the average productivity within
a firm using the methodology in Olley and Pakes (1996) and Pavcnik (2002).19 Within this
sample, aggregate productivity increased by about 10 percent between 1989-1996, with almost
all the aggregate productivity gains driven by substantial growth in average firm productivity,
rather than reallocation of market share towards more productive firms. As pointed above, this
could be due to the fact that instead of using a census of all manufacturing firms, I study the
effects of trade reforms in a selected sample of larger and possibly more established companies
19This methodology decomposes weighted aggregate productivity at the industry level into two parts: the
unweighted aggregate productivity measure and the total covariance between a firm’s share of the industry output
and its productivity. An increase in the covariance suggests that more productive firms are increasingly producing
larger shares of output. Results are available from the author upon request.
19

with easier access to credit. Alternatively, this finding may point to substantial barriers to exit
in the Indian economy, as argued in Topalova (2005). Thus, the productivity gains associated
with trade liberalization seem to stem mostly from productivity improvements within the firm,
at least in the sample of publicly listed companies.
Controlling for lagged productivity or using the Arellano Bond estimator (columns 5-7) yield
similar in magnitude and statistically significant estimates. Finally, the impact of trade policy
on productivity when estimated using the direct approach is substantially larger in magnitude
(as in Fernandes, 2007). Note however, that the estimates in the direct and indirect approach
are not really comparable as the direct approach assumes the same production function across
all industries and does not control for company fixed effects.
4.1.2 Average Impact of Effective Rates of Protection
Focusing on nominal output tariffs may give a misleading picture of the impact of the comprehen-
sive trade liberalization in India, if the competitive pressure on the output side was undermined
by the availability of cheaper inputs. To capture the net competition effect of trade reform,
Panel B in Table 3 presents the results from estimating equation (2) using effective rates of
protection as a measure of trade liberalization.20 Lower effective rates of protection increase
firm productivity: a 10 percent reduction in ERP leads to 0.25 percent increase in TFP. The
estimated effects are similar in magnitude and robust across all specifications. The estimations
using this alternative measure of trade protection also suggest that the productivity effect comes
from changes within the firm.
4.1.3 Average Impact of Input Tariffs
While the effective rates of protection reveal the net competition effect of trade liberalization, it is
interesting to separate the impact of lowering output tariffs versus lowering tariffs of intermediate
inputs. I reestimate equation (2) including both output as well as industry input tariffs. The
results are presented in Table 4, which mirrors the specifications in Table 3. The inclusion of the
20Note that unlike output tariffs, ERP suffer from potentially important measurement error as they were
calculated using the input-output matrix from 1993. Thus, I am abstracting from the variation in ERP due to
changes in an industry input mix.
20
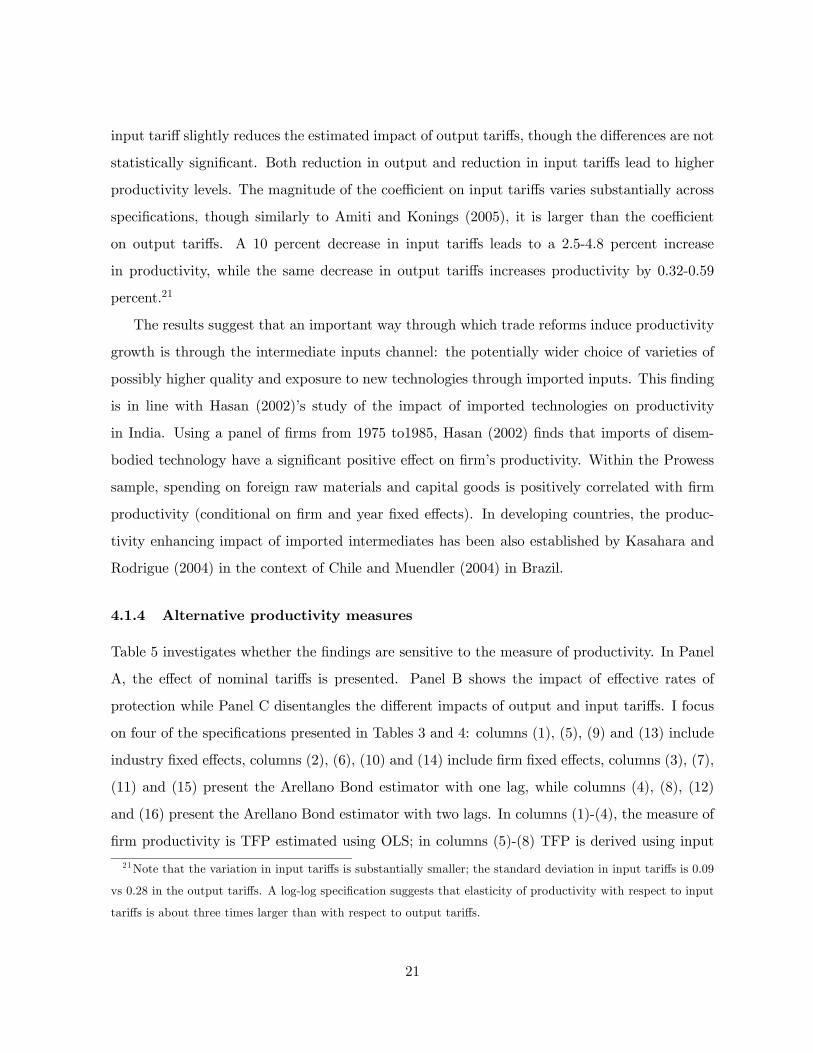
input tariff slightly reduces the estimated impact of output tariffs, though the differences are not
statistically significant. Both reduction in output and reduction in input tariffs lead to higher
productivity levels. The magnitude of the coefficient on input tariffs varies substantially across
specifications, though similarly to Amiti and Konings (2005), it is larger than the coefficient
on output tariffs. A 10 percent decrease in input tariffs leads to a 2.5-4.8 percent increase
in productivity, while the same decrease in output tariffs increases productivity by 0.32-0.59
percent.21
The results suggest that an important way through which trade reforms induce productivity
growth is through the intermediate inputs channel: the potentially wider choice of varieties of
possibly higher quality and exposure to new technologies through imported inputs. This finding
is in line with Hasan (2002)’s study of the impact of imported technologies on productivity
in India. Using a panel of firms from 1975 to1985, Hasan (2002) finds that imports of disem-
bodied technology have a significant positive effect on firm’s productivity. Within the Prowess
sample, spending on foreign raw materials and capital goods is positively correlated with firm
productivity (conditional on firm and year fixed effects). In developing countries, the produc-
tivity enhancing impact of imported intermediates has been also established by Kasahara and
Rodrigue (2004) in the context of Chile and Muendler (2004) in Brazil.
4.1.4 Alternative productivity measures
Table 5 investigates whether the findings are sensitive to the measure of productivity. In Panel
A, the effect of nominal tariffs is presented. Panel B shows the impact of effective rates of
protection while Panel C disentangles the different impacts of output and input tariffs. I focus
on four of the specifications presented in Tables 3 and 4: columns (1), (5), (9) and (13) include
industry fixed effects, columns (2), (6), (10) and (14) include firm fixed effects, columns (3), (7),
(11) and (15) present the Arellano Bond estimator with one lag, while columns (4), (8), (12)
and (16) present the Arellano Bond estimator with two lags. In columns (1)-(4), the measure of
firm productivity is TFP estimated using OLS; in columns (5)-(8) TFP is derived using input
21Note that the variation in input tariffs is substantially smaller; the standard deviation in input tariffs is 0.09
vs 0.28 in the output tariffs. A log-log specification suggests that elasticity of productivity with respect to input
tariffs is about three times larger than with respect to output tariffs.
21

cost shares as proxy of input coefficients; columns (9)-(12) use the log of labor productivity,
which is defined as gross value added divided by labor expenditure (the number of employees
is not reported in the Prowess data). Finally, in columns (13)-(16) I estimate the impact of
trade liberalization on the log of the average days of finished goods stock, a proxy for technical
efficiency that does not suffer from measurement issues from potentially using incorrect deflators,
misspecifying the production function etc.
Across all measures of productivity and in almost all specifications, reductions in output
tariffs and effective rates of protection lead to higher productivity levels. Lowering input tariffs
is also associated with productivity gains. Across all measures, the estimated impact of input
tariffs is substantially larger in magnitude than the competitive effect captured by output tariffs
and effective rates of protection.
4.2 Average Impact of Trade Policy and Industrial Characteristics
Trade liberalization allows us to examine whether the regulatory environment in which different
industries operated shaped how firms in these industries responded to trade liberalization. First,
I study whether the presence of non-tariff barriers (NTB) to trade reduced the competitive
effect of output tariff reductions. I classify the 4-digit industrial codes based on the output of
the industry as Basic, Intermediate, Capital Goods, Consumer Durables and Consumer Non-
Durables (Nouroz, 2001). While the reduction in output tariffs across the different industries was
roughly similar in the 1989-1996 period (Figure 1, Panel C), Figure 1, Panel D reveals that non-
tariff barriers (as measured by the share of product lines that require any license to be imported)
were eased at a slower pace. Only 34 percent of product lines could be imported without any
license by 1996 among the set of Consumer Non-Durables industries, as compared to 93 percent
for the set of Basic industries. As data on non-tariff barriers are not available at a disaggregated
level, especially for the pre-reform period, to implicitly account for the potential impact of NTBs,
I reestimate equation (2) for two groups of industries: Basic, Intermediate and Capital goods,
the group that experienced substantial reduction in NTBs, and Consumer Non-Durables and
Consumer Durables, which remained relatively protected from foreign competition. If NTBs
were an important part of trade protection in India, one would expect the roughly similar tariff
reductions across the broad industry groups to have a differential impact on productivity. Table
22
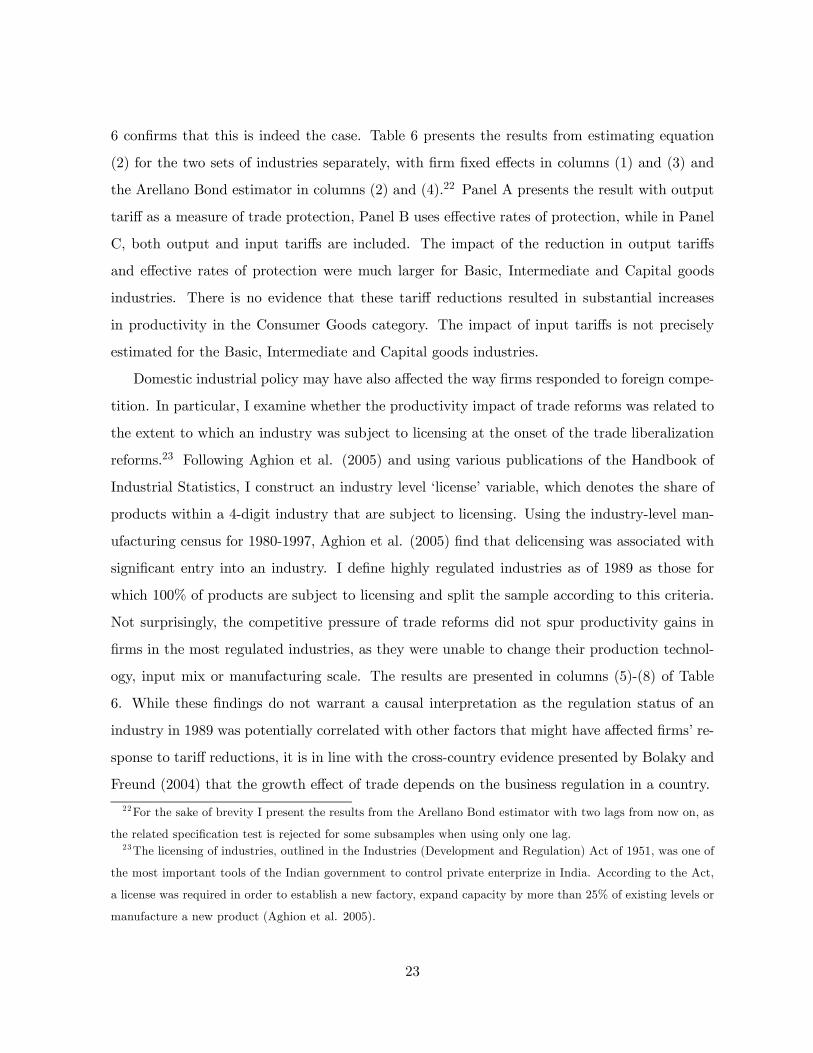
6 confirms that this is indeed the case. Table 6 presents the results from estimating equation
(2) for the two sets of industries separately, with firm fixed effects in columns (1) and (3) and
the Arellano Bond estimator in columns (2) and (4).22 Panel A presents the result with output
tariff as a measure of trade protection, Panel B uses effective rates of protection, while in Panel
C, both output and input tariffs are included. The impact of the reduction in output tariffs
and effective rates of protection were much larger for Basic, Intermediate and Capital goods
industries. There is no evidence that these tariff reductions resulted in substantial increases
in productivity in the Consumer Goods category. The impact of input tariffs is not precisely
estimated for the Basic, Intermediate and Capital goods industries.
Domestic industrial policy may have also affected the way firms responded to foreign compe-
tition. In particular, I examine whether the productivity impact of trade reforms was related to
the extent to which an industry was subject to licensing at the onset of the trade liberalization
reforms.23 Following Aghion et al. (2005) and using various publications of the Handbook of
Industrial Statistics, I construct an industry level ‘license’ variable, which denotes the share of
products within a 4-digit industry that are subject to licensing. Using the industry-level man-
ufacturing census for 1980-1997, Aghion et al. (2005) find that delicensing was associated with
significant entry into an industry. I define highly regulated industries as of 1989 as those for
which 100% of products are subject to licensing and split the sample according to this criteria.
Not surprisingly, the competitive pressure of trade reforms did not spur productivity gains in
firms in the most regulated industries, as they were unable to change their production technol-
ogy, input mix or manufacturing scale. The results are presented in columns (5)-(8) of Table
6. While these findings do not warrant a causal interpretation as the regulation status of an
industry in 1989 was potentially correlated with other factors that might have affected firms’ re-
sponse to tariff reductions, it is in line with the cross-country evidence presented by Bolaky and
Freund (2004) that the growth effect of trade depends on the business regulation in a country.
22For the sake of brevity I present the results from the Arellano Bond estimator with two lags from now on, as
the related specification test is rejected for some subsamples when using only one lag.23The licensing of industries, outlined in the Industries (Development and Regulation) Act of 1951, was one of
the most important tools of the Indian government to control private enterprize in India. According to the Act,
a license was required in order to establish a new factory, expand capacity by more than 25% of existing levels or
manufacture a new product (Aghion et al. 2005).
23
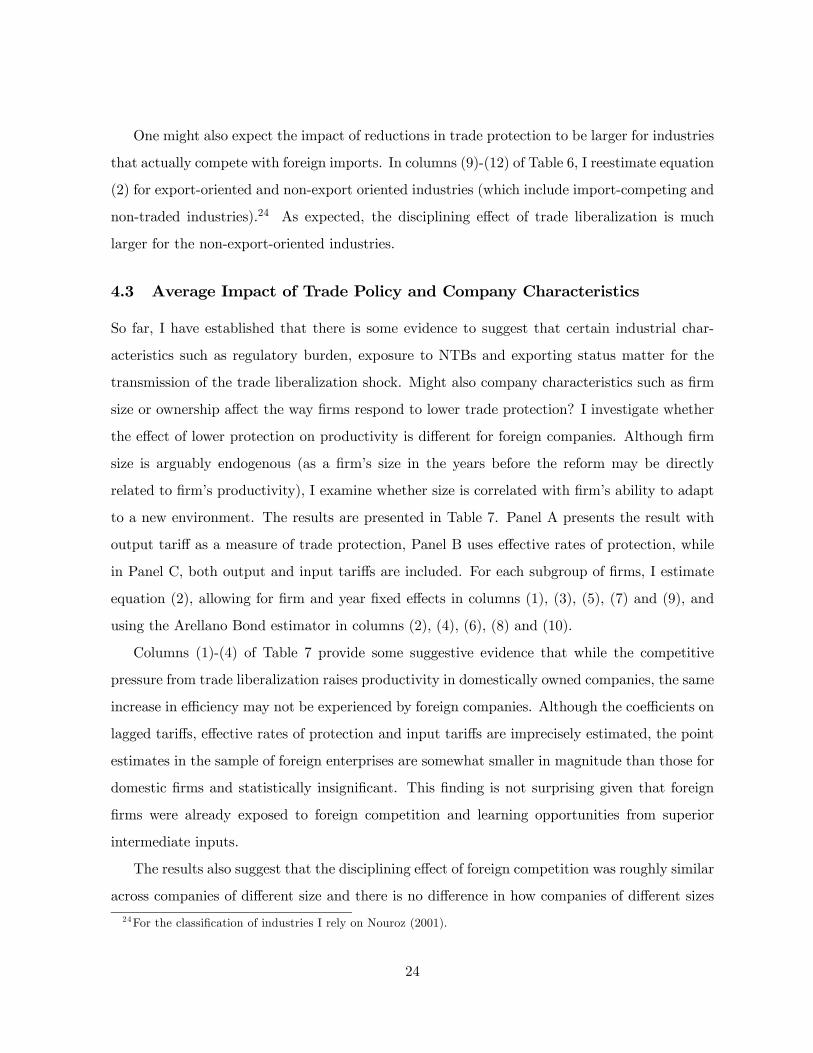
One might also expect the impact of reductions in trade protection to be larger for industries
that actually compete with foreign imports. In columns (9)-(12) of Table 6, I reestimate equation
(2) for export-oriented and non-export oriented industries (which include import-competing and
non-traded industries).24 As expected, the disciplining effect of trade liberalization is much
larger for the non-export-oriented industries.
4.3 Average Impact of Trade Policy and Company Characteristics
So far, I have established that there is some evidence to suggest that certain industrial char-
acteristics such as regulatory burden, exposure to NTBs and exporting status matter for the
transmission of the trade liberalization shock. Might also company characteristics such as firm
size or ownership affect the way firms respond to lower trade protection? I investigate whether
the effect of lower protection on productivity is different for foreign companies. Although firm
size is arguably endogenous (as a firm’s size in the years before the reform may be directly
related to firm’s productivity), I examine whether size is correlated with firm’s ability to adapt
to a new environment. The results are presented in Table 7. Panel A presents the result with
output tariff as a measure of trade protection, Panel B uses effective rates of protection, while
in Panel C, both output and input tariffs are included. For each subgroup of firms, I estimate
equation (2), allowing for firm and year fixed effects in columns (1), (3), (5), (7) and (9), and
using the Arellano Bond estimator in columns (2), (4), (6), (8) and (10).
Columns (1)-(4) of Table 7 provide some suggestive evidence that while the competitive
pressure from trade liberalization raises productivity in domestically owned companies, the same
increase in efficiency may not be experienced by foreign companies. Although the coefficients on
lagged tariffs, effective rates of protection and input tariffs are imprecisely estimated, the point
estimates in the sample of foreign enterprises are somewhat smaller in magnitude than those for
domestic firms and statistically insignificant. This finding is not surprising given that foreign
firms were already exposed to foreign competition and learning opportunities from superior
intermediate inputs.
The results also suggest that the disciplining effect of foreign competition was roughly similar
across companies of different size and there is no difference in how companies of different sizes
24For the classification of industries I rely on Nouroz (2001).
24
reacted to lower input tariffs.
4.4 Average Impact of Trade Policy and Environment Characteristics
I finally investigate whether certain external features of the environment in which firms oper-
ate, such as institutions, geography, and level of development affect the way firms respond to
lower trade protection?25 I test for these differences in Table 8, presenting results using output
tariffs, effective rates of protection and output and input tariffs respectively. The specifications
presented mirror those in Tables 6 and 7.
First, I look at whether firms that are located in coastal states were more affected by the
reform.26 In a country where product markets might not be fully integrated across regions due
to the sheer size of the country as well as poor infrastructure, firms in the heart of the country
or in less accessible regions might not experience the threat of increased foreign competition
or access imported intermediate inputs as much as firms in regions in more immediate contact
with internationally traded goods. However, columns (1)-(4) of Table 8 do not confirm this
hypothesis. If anything, the point estimates of the effect of output tariffs and effective rates of
protection are slightly larger in magnitudes for the set of firms operating in non-coastal states.
I examine the role of institutions, focusing on state labor laws. Using Besley and Burgess
(2003) classification of states’ labor laws as pro-worker, neutral, or pro-employer labor laws, one
can see in columns (5)-(8) that there is little difference in the estimated impact of reduction in
trade protection, and if anything, the firms in states with neutral and pro-worker labor laws
seem to benefit more from the trade reforms.
The level of financial development of the state (measured as credit per capita in 1992,
with states above the median classified as having “high financial development”) also makes
no difference (columns (9)-(12)). This finding is unexpected since a major concern regarding
trade liberalization has been the ability of domestic firms to access sufficient credit to invest in
more efficient technologies and survive in the face of foreign competition.
25See Table A5 for the classification of states by various categories.26Since the Prowess data are at the company rather than plant level, a particular company may report data
from business activity in more than one state. I assign companies to different states based on the location of the
company’s registered office. The registered office is the address each firm of more than 20 persons in India must
submit to the Registrar of Companies as dictated by the Companies Act, 1956.
25
4.5 Trade Liberalization vs Other Reforms
The 1991 trade liberalization was part of a package of reforms, which included further delicensing
and relaxation of foreign direct investment rules. Both of these reforms aimed at increasing
domestic competition, thus potentially enhancing productivity. If reduction in output tariffs
across industries and over time is correlated with the process of delicensing and opening to FDI,
then the empirical strategy could erroneously attribute the impact of these other reforms to
trade liberalization. To control for the concurrent reforms, I compile an industry level data set
on industry-specific time-varying measures of licensing and openness to foreign direct investment
for 1989-1996 from various publications of the Handbook of Industrial Statistics. In Table 9,
I present the results from estimating equation (2) but controlling for lagged openness to FDI
(columns (1), (2)), controlling for lagged licensing (column (3), (4)), and controlling for both
lagged openness to FDI and lagged licensing. Results from a specification with firm fixed effects
and the Arellano Bond estimator are presented. The effect of trade liberalization on productivity
(measured either as TFP (Panel A) or labor productivity (Panel B)) is completely insensitive
to the additional controls. In some specifications, more intensive delicensing is associated with
significantly higher TFP and in all specifications with significantly higher labor productivity.
The correlation with openness to FDI is most often indistinguishable from zero. So while there
is some evidence that the introduction of domestic competition was associated with enhanced
firm productivity, trade liberalization boosted productivity in and of itself.
It is also interesting to examine whether there is complementarity between different industrial
policies, that encourage competition either through entry of domestic firms or imports of final
products. In column (7) and (8) of Table 9, I interact trade policy with openness to FDI and
industrial regulation through licenses. Again, while one should refrain from causal interpretation,
the evidence suggests that there may be strong complementarity between different industrial
policies. The impact of trade reforms appears to be magnified as foreign direct investment was
allowed or restrictive licensing requirements were removed, a finding that is robust across all
specifications and measures of productivity. The increase in productivity from of a 10 percent
reduction in tariffs in a firm, operating in an industry that saw no change in FDI rules, was 0.63
percent. The same reduction in tariffs was associated with a 2.3 percent increase in productivity
for firm, for which FDI was fully liberalized during this time period (i.e. FDI went from 0 to
26
1). Similarly, the increase in productivity from of a 10 percent reduction in tariffs in a firm,
operating in an industry that saw no change in its licensing rules, was 0.63 percent. The same
reduction in tariffs was associated with a 1.6 percent increase in productivity for firm, that was
completely deregulated during this time period (i.e. License went from 1 to 0). This evidence,
though suggestive, points to the need for complementary domestic policies that can help firms’
adjustment to globalization as argued in Hoekman and Javorcik (2004).
5 Conclusion
How trade liberalization affects the productivity of domestic firms is a question of vital impor-
tance for both trade theory and economic policy. Yet, answering this question requires overcom-
ing a severe identification problem: since trade policy is determined by governments that have
and respond to specific interests, changes in trade protection are likely to be correlated with
other important factors, which likely affect firm productivity.
In this paper, I use a unique episode from the early 1990s, when India implemented substan-
tial trade reforms in response to external pressure. The use of inter-temporal and inter-industry
variation from over 5,000 tariff line items, over an eight year time period, allows for a flexible
analysis with substantial power: year fixed effects ensure the effect of liberalization is not con-
founded with other macroeconomic factors, while industry fixed-effects absorb time-invariant
political economy factors underlying trade protectionism across industries. The evidence yields
several important lessons.
First, I demonstrate that the identification is more than a theoretical concern: as indicated
in Section 3.4, when the Indian government had discretion over its liberalization policy, tariff
reductions were highly correlated with current levels of productivity. Thus, empirical studies
measuring the effect of liberalization without paying careful attention to the source of variation
may yield inaccurate results. In contrast, several tests suggest that the changes in tariffs ex-
ploited in this paper, in the early 1990s, were not correlated with standard confounding factors.
Second, trade liberalization causes productivity increases. This gain accrues both from
increased competition, but also from firms’ access to a larger choice of intermediate inputs.
During the 1990s, average output tariffs declined by 63, and average input tariffs declined
27
by 23 percentage points, thus contributing respectively 2-4 and 6-9 percent increase in total
factor productivity. Disaggregate trade and domestic price data point to the source of these
productivity gains. Product-level data on imports and tariffs reveal that trade liberalization
was associated with a significant increase not only in the volume of imports, but also in the
varieties of goods imported. Firms benefited from the access to more and cheaper inputs, and
the superior technology embodied in these. On the other hand, the greater competition from
foreign producers put a downward pressure on domestic prices, thus forcing firms to raise their
technical efficiency. While the available data does not allow disentangling the exact mechanisms
underlying the efficiency gains, there is evidence that the higher competitive pressure led to
more intense use of imported inputs, especially imported capital goods. Within the sample, the
productivity gains seem to be driven by productivity increases in existing firms, rather than the
exit of inefficient firms. There is no evidence that exploiting economies of scale or expanding
export activity were a major factor behind the growth in productivity, though inference is limited
by the nature of the data.
Third, I discover where tariff reductions did (and did not) have heterogeneous effects. First,
I present evidence that non-tariff barriers may play an important role for protecting industries
from foreign competition. The set of industries that remained relatively closed in terms of non-
tariff barriers throughout the period of study did not experience the productivity enhancing
impact of the reductions in output tariffs. Second, the productivity impact of trade reforms
stemming from increased competition were felt more strongly in import-competing industries.
Finally, firms operating in industries that were subject to less regulation at the onset of the
reforms were better able to respond to the competitive pressure and enhance efficiency.
Somewhat surprisingly, within this sample of firms, firm characteristics (other than industrial
affiliation) and the environment in which firms operate (i.e., geography, institutions, financial
development) do not appear to have any effect on the transmission of the trade liberalization
shock. While there is some suggestive evidence that the productivity impact of the tariff reform
was not experienced by foreign firms, as they were already exposed to international competition
and had access to foreign suppliers of intermediate inputs, other firm characteristics, such as
firm size, did not influence the way firms responded to lower levels of protection. This finding,
which is contrary to the Colombian experience (Fernandes, 2007), may stem from the fact that
28
publicly listed firms may already be substantially larger than the average firm in India
Finally, there seems to be substantial complementarity between industrial policies that in-
crease foreign competition (namely tariff reductions) and industrial policies that enhance do-
mestic competition, such as industrial delicensing and relaxation of foreign direct investment.
The impact of trade reforms is magnified as foreign direct investment is allowed or restrictive
licensing requirements are removed.
The finding that liberalization leads to higher firm-level productivity does not mean that
liberalization unambiguously improves welfare, as productivity gains themselves may have costs
(Tybout, 2001). Still, this paper provides strong evidence that liberalization leads to increases
in productivity from both foreign competition and access to superior inputs, especially as re-
strictions to domestic competition were removed. A final lesson is that liberalization may lead
to greater productivity gains when combined with deregulation and delicensing of firms.
6 Appendix: Estimating the Production Function
To estimate the production function, the following variables were used: the value of total output,
gross fixed assets, salaries and wages, raw materials expenses, power and fuel expenses, and
depreciation. The data provided in the Centre for Monitoring the Indian Economy (CMIE)
database are drawn from companies’ balance sheets and income statements. The values of
output and power and fuel expenses were converted in real terms by industry-specific wholesale
price indices. For salaries, wages and raw materials expenses, the wholesale price index was
used.
I closely followed the methodology of Balakrishnan et al. (2000) to measure the capital
employed by the firm in its production process. It applies the Perpetual Inventory Model, while
correcting for the fact that the value of capital is recorded at historic and not replacement cost.
In order to arrive at a measure of the capital stock at its replacement cost for a base year (in the
case assumed to be 1997), I construct a revaluation factor assuming a constant rate of change of
the price of capital and a constant rate of growth of investment throughout the 20 year assumed
lifetime of capital stock. This revaluation factor converts the capital in the base year into capital
at replacement cost at current prices, which is then deflated using a deflator constructed from
29
the series on gross capital formation. To get the capital stock for every time period, I take the
sum of investment in subsequent years. Table A4 provides some descriptive statistics of the
variables used in the estimation of the production function.
7 Bibliography
Aghion, Philippe, Robin Burgess, Stephen Redding and Fabrizio Zilibotti. “Entry Liberaliza-
tion and Inequality in Industrial Performance.” Journal of the European Economic Asso-
ciation, 2005, 3(2-3), pp. 291-302.
Ahluwalia, Montek. “India’s Economic Reforms. An Appraisal” in India in the Era of Eco-
nomic Reforms eds. J. Sachs, A. Varshney, and N. Bajpai, New York: Oxford University
Press, 2000.
Amiti, Mary and Jozef Konings. “Trade Liberalization, Intermediate Inputs, and Productivity:
Evidence from Indonesia.” IMF Working Paper WP/05/146, 2005.
Arellano, Manuel and Stephen Bond. “Some Tests of Specification for Panel Data: Monte Carlo
Evidence and an Application to Employment Equations.” Review of Economic Studies,
1991, 58(2), pp. 277-297.
Aw, Bee W., Xiaomin Chen, and Mark J. Roberts. “Firm-Level Evidence on Productivity Dif-
ferentials and Turnover in Taiwanese Manufacturing.” Journal of Development Economics,
2001, 66(1), pp. 61-86.
Balakrishnan, P., K. Pushpangadan and M.S. Babu. “Trade Liberalization and Productivity
Growth in Manufacturing: Evidence from Firm-Level Panel Data.” Economic and Political
Weekly, 2000, October.
Bernard, Andrew, Jonathan Eaton, J. Bradford Jensen and Samuel Kortum. “Plants and
Productivity in International Trade.” American Economic Review, 2003, 93(4), pp. 1268-
1290.
Besley, Timothy and Robin Burgess. “Can Labor Regulations Hinder Economic Performance?
Evidence From India.” Quarterly Journal of Economics, 2004, 119(1), pp. 91-134.
30
Bolaky, Bineswaree and Caroline Freund. “Trade, Regulations and Growth.” unpublished
manuscript, 2004.
Central Statistical Organization. Input-Output Transactions Table 1993-94. Ministry of Sta-
tistics and Programme Implementation, Government of India, 2000.
Cerra, Valerie and Sweta Saxena. “What Caused the 1991 Currency Crisis in India?” IMF
WP/00/157, 2000, October.
Chopra, Ajai, Charles Collyns, Richard Hemming and Karen Parker. “India: Economic Reform
and Growth.” IMF Occasional Paper No. 134, 1995, December.
Corden, Max W. “The Structure of a Tariff System and the Effective Protective Rate.” Journal
of Political Economy, 1966, 74, (June), pp. 221-237.
Corden, Max W. The Theory of Protection. Oxford University Press, 1971.
Currie, Janet and Ann Harrison. “Sharing the Costs: The Impact of Trade Reform on Capital
and Labor in Morocco.” Journal of Labor Economics, 1997, 15(3), Part 2, pp. 44-71.
Debroy B. and A. T. Santhanam. “Matching Trade Codes with Industrial Codes.” Foreign
Trade Bulletin, 1993, 24(1).
Efron, Bradley and Robert Tibshirani, An Introduction to the Bootstrap, Monograph in Ap-
plied Statistics and Probability, No. 57 (New York, NY: Chapman and Hall, 1994).
Ethier, Wilfred. “National and International Returns to Scale in the Modern Theory of Inter-
national Trade.” American Economic Review, 1982, 72, pp. 389-405.
Epifani, Paolo. “Trade Liberalization, Firm Performance and Labor Market Outcomes in the
Developing World. What Can We Learn from Micro-Level Data?” Rivista Italiana delgi
Economisti, 2003, pp. 113-144.
Fernandes, Ana. “Trade Policy, Trade Volumes and Plant-Level Productivity in Colombian
Manufacturing Industries.” Journal of International Economics, 2007, 71(1), pp. 52-71.
Gang, Ira and Mihir Pandey. “Trade Protection in India: Economics vs. Politics?” University
of Maryland Working Paper No. 27, 1996.
31
Goldar, B. “Trade Liberalization andManufacturing Employment.” Employment Paper 2002/34,
International Labor Organization, 2002.
Goldberg, Pinelopi and Nina Pavcnik. “Trade, Wages, and the Political Economy of Trade
Protection: Evidence from the Colombian Trade Reforms.” Journal of International Eco-
nomics, 2005, 66(1), pp. 75-105.
Goyal, S. K. “Political Economy of India’s Economic Reforms.” ISID Working Paper (New
Delhi, India: Institute for Studies in Industrial Development), 1996.
Grossman, Gene and Elanahan Helpman. Innovation and Growth in the Global economy, MIT
Press, 1991.
Hanson, Gordon and Ann Harrison. “Trade and wage inequality in Mexico.” Industrial and
Labor Relations Review, 1999, 52(2), pp. 271—288.
Harrison, Ann. “Productivity, Imperfect Competition and Trade Reform.” Journal of Interna-
tional Economics, 1994, 36(1), pp. 53-73.
Hasan, Rana. “The Impact of Imported and Domestic Technologies on the Productivity of
Firms: Panel Data Evidence from Indian Manufacturing Firms.” Journal of Development
Economics, 2002, 69(1), pp. 23-49.
Hasan, Rana., Devashish Mitra and K. V. Ramaswamy. “Trade Reforms, Labor Regulations
and Labor-Demand Elasticities: Evidence from India.” NBER Working Paper 9879, 2003.
Helpman, Elhanan and Paul R. Krugman. Market Structure and Foreign Trade. MIT Press,
1985.
Hoekman, Bernard and Beata Smarzynska Javorcik. "Policies Facilitating Firm Adjustment
to Globalization." Oxford Review of Economic Policy, 2004, 20(3), pp. 457-473.
Kasahara, Hiroyuki and Joel Rodrigue. “Does the Use of Imported Intermediates Increase
Productivity?” University of Western Ontario, RBC Financial Group Economic Policy
Research Institute Working Papers 20057, 2004.
32
Katayama, Hajime, Shihua Lu and James R. Tybout. “Firm-level Productivity Studies: Illu-
sions and a Solution,” unpublished manuscript, 2006.
Krishna, Pravin and Devashish Mitra. “Trade Liberalization, Market Discipline and Productiv-
ity Growth: New Evidence from India.” Journal of Development Economics, 1998, 56(2),
pp. 447-462.
Krueger, A. Heinz Arndt Memorial Lecture, (August), 2003.
Krugman, Paul R. “Increasing Returns, Monopolistic Competition and Internation Trade.”
Journal of International Economics, 1979, 9, pp. 469-479.
Levinsohn, James and Amil Petrin. “Estimating Production Functions Using Inputs to Control
for Unobservables.” Review of Economic Studies, 2003, 70(243), pp. 317-341.
Markusen, James R. “Trade in Producer Services and in Other Specialized Intermediate In-
puts.” American Economic Review, 1989, 77, pp. 85-95.
Melitz, Mark J. “The Impact of Trade on Intra-Industry Reallocations and Aggregate Industry
Productivity.” Econometrica, 2003, 71, pp. 1695-1725.
Muendler, Marc-Andreas. “Trade, Technology, and Productivity: A Study of Brazilian Manu-
facturers.” CESifo Working Paper No. 1148, 2004.
Nouroz, H. Protection in Indian Manufacturing: An Empirical Study, MacMillan India Ltd.,
Delhi, 2001.
Olley, G. Steven and Ariel Pakes. “The Dynamics of Productivity in the Telecommunications
Equipment Industry.” Econometrica, 1996, 64(6), pp. 1263-1297.
Pavcnik, Nina. “Trade Liberalization, Exit and Productivity Improvements: Evidence from
Chilean Plans.” Review of Economic Studies, 2002, 69, pp. 245-276.
Rivera-Batiz, Luis and Paul Romer. “Economic integration and endogenous growth.” Quarterly
Journal of Economics, 1991, 106, pp. 531-555.
Roberts, Mark and James Tybout. Industrial Evolution in Developing Countries. Oxford
University Press, 1996.
33
Schor, Adriana. “Heterogeneous Productivity Response to Tariff Reduction: Evidence from
Brazilian Manufacturing Firms.” NBER Working Paper 10544, 2004, June.
Sivadasan, Jagadeesh. “Productivity Consequences of Product Market Liberalization: Micro-
evidence from Indian Manufacturing Sector Reforms.” October 2006.
Stiglitz, Joseph. Globalization and Its Discontents, WW Norton and Co, 2002.
Topalova, Petia. “Trade Liberalization and Firm Productivity: The Case of India.” IMF Work-
ing Paper, WP/04/28, 2004.
Topalova, Petia. “Factor Immobility and Regional Impacts of Trade Liberalization: Evidence
from India.” MIT mimeo, 2005.
Tybout, James “Plant and Firm-Level Evidence on “New” Trade Theories.” NBER Working
Paper 8418, August 2001.
Tybout, James, Jamie De Melo, and Vittorio Corbo. “The Effects of Trade Reforms on Scale
and Technical Efficiency: New Evidence from Chile.” Journal of International Economics,
1991, 31(3), pp. 231-250.
Tybout, James and M. Daniel Westbrook. “Trade Liberalization and the Dimensions of Effi-
ciency Change in the Mexican Manufacturing Industries.” Journal of International Eco-
nomics, 1995, 39(1), pp. 53-78.
Unel, Bulent. “Productivity Trends in India’s Manufacturing Sectors in the Last Two Decades.”
IMF Working Paper, WP/03/22, 2003.
Van Biesebroeck, Johannes. “The Sensitivity of Productivity Estimates: Revisiting Three
Important Debates.” forthcoming Journal of Business and Economic Statistics, 2006.
Varshney, Ashutosh. “Mass Politics or Elite Politics? India’s Economic Reforms in Comparative
Perspective.” in India in the Era of Economic Reforms, eds. J. Sachs, A. Varshney, and
N. Bajpai, New York: Oxford University Press, 2000.
Young, Alwyn. “Learning by Doing and the Dynamics Effects of International Trade.” Quar-
terly Journal of Economics, 1991, 106(2), pp. 369-405.
34

All figures from Topalova (2005).
Figure 1. Evolution of Tariffs in India
Panel E: Correlation of Industry Tariffs in 1997 and 1987 Panel F: Tariff Decline and Industry Tariffs in 1987
Panel A: Average Nominal Tariffs
0
20
40
60
80
100
120
1987 1988 1989 1990 1991 1992 1993 1994 1995 1996 1997 1998 1999 2000 2001
Panel B: Standard Deviation of Nominal Tariffs
0
10
20
30
40
50
60
1987 1988 1989 1990 1991 1992 1993 1994 1995 1996 1997 1998 1999 2000 2001
Panel C: Tariffs by Industrial Use Based Category
0
20
40
60
80
100
120
1987
1989
1991
1993
1995
1997
1999
2001
Basic
Capital
ConsumerDurablesConsumer NonDurablesIntermediate
Panel D: Share of Free HS Lines by Industrial Use Based Category
0
0.2
0.4
0.6
0.8
1
1.2
1989 1996 1998 2001
Basic
Capital
Consumer Durables
Consumer NonDurablesIntermediate
050
100
150
200
1997
tarif
f
0 50 100 150 200 2501987 tarif f
-50
050
100
150
200
chan
ge
0 50 100 150 200 2501987 tarif f
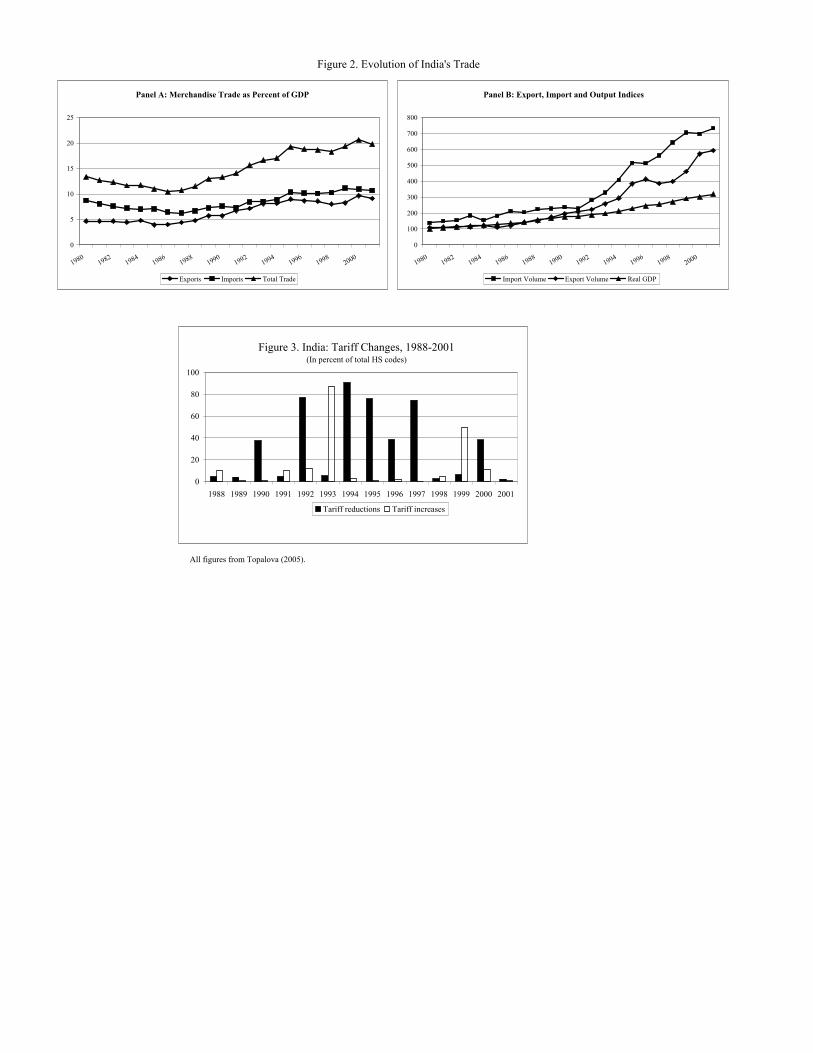
All figures from Topalova (2005).
Figure 2. Evolution of India's Trade
Panel B: Export, Import and Output Indices
0
100
200
300
400
500
600
700
800
19801982
19841986
19881990
19921994
19961998
2000
Import Volume Export Volume Real GDP
Panel A: Merchandise Trade as Percent of GDP
0
5
10
15
20
25
19801982
19841986
19881990
19921994
19961998
2000
Exports Imports Total Trade
0
20
40
60
80
100
1988 1989 1990 1991 1992 1993 1994 1995 1996 1997 1998 1999 2000 2001
Tariff reductions Tariff increases
Figure 3. India: Tariff Changes, 1988-2001(In percent of total HS codes)
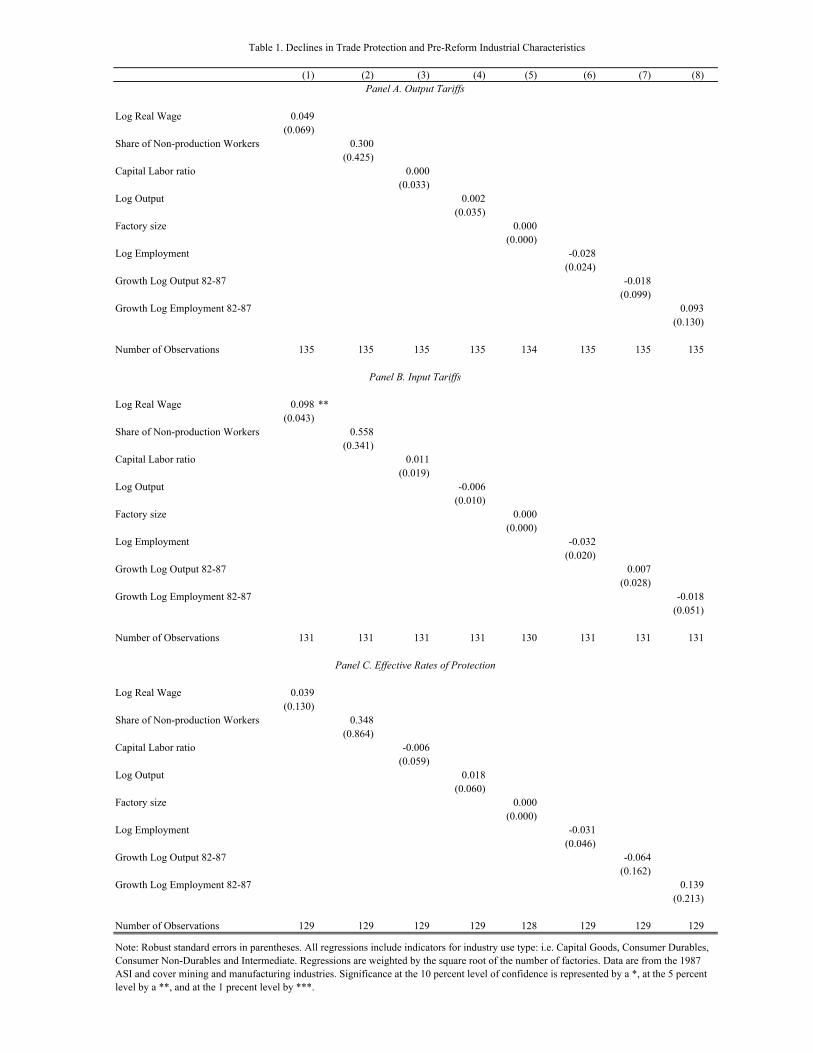
(1) (2) (3) (4) (5) (6) (7) (8)
Log Real Wage 0.049(0.069)
Share of Non-production Workers 0.300(0.425)
Capital Labor ratio 0.000(0.033)
Log Output 0.002(0.035)
Factory size 0.000(0.000)
Log Employment -0.028(0.024)
Growth Log Output 82-87 -0.018(0.099)
Growth Log Employment 82-87 0.093(0.130)
Number of Observations 135 135 135 135 134 135 135 135
Log Real Wage 0.098 **(0.043)
Share of Non-production Workers 0.558(0.341)
Capital Labor ratio 0.011(0.019)
Log Output -0.006(0.010)
Factory size 0.000(0.000)
Log Employment -0.032(0.020)
Growth Log Output 82-87 0.007(0.028)
Growth Log Employment 82-87 -0.018(0.051)
Number of Observations 131 131 131 131 130 131 131 131
Log Real Wage 0.039(0.130)
Share of Non-production Workers 0.348(0.864)
Capital Labor ratio -0.006(0.059)
Log Output 0.018(0.060)
Factory size 0.000(0.000)
Log Employment -0.031(0.046)
Growth Log Output 82-87 -0.064(0.162)
Growth Log Employment 82-87 0.139(0.213)
Number of Observations 129 129 129 129 128 129 129 129
Table 1. Declines in Trade Protection and Pre-Reform Industrial Characteristics
Note: Robust standard errors in parentheses. All regressions include indicators for industry use type: i.e. Capital Goods, Consumer Durables, Consumer Non-Durables and Intermediate. Regressions are weighted by the square root of the number of factories. Data are from the 1987 ASI and cover mining and manufacturing industries. Significance at the 10 percent level of confidence is represented by a *, at the 5 percent level by a **, and at the 1 precent level by ***.
Panel A. Output Tariffs
Panel B. Input Tariffs
Panel C. Effective Rates of Protection

II. L
abor
Pro
duct
ivity
1989
-200
119
89-1
996
1997
-200
119
89-2
001
1989
-199
619
97-2
001
(1)
(2)
(3)
(4)
(5)
(6)
Prod
uctiv
ity-0
.122
**-0
.028
-0.1
65**
-0.0
55**
*-0
.027
-0.0
70**
*[0
.052
][0
.070
][0
.066
][0
.019
][0
.027
][0
.026
]
Num
ber o
f Obs
erva
tions
1425
923
502
1355
878
477
Prod
uctiv
ity-0
.192
**-0
.062
-0.2
09**
-0.0
90**
*-0
.050
-0.1
01**
*[0
.091
][0
.137
][0
.086
][0
.032
][0
.050
][0
.035
]
Num
ber o
f Obs
erva
tions
1359
880
479
1355
878
477
Prod
uctiv
ity-0
.032
**-0
.025
-0.0
47**
-0.0
08-0
.005
-0.0
17**
*[0
.016
][0
.024
][0
.020
][0
.006
][0
.007
][0
.006
]
Num
ber o
f Obs
erva
tions
1371
888
483
1367
886
481
Tabl
e 2.
Tra
de P
olic
y En
doge
neity
: Eff
ect o
f Cur
rent
Pro
duct
ivity
on
Futu
re O
utpu
t Tar
iffs,
Inpu
t Tar
iffs a
nd E
ffec
tive
Rat
es o
f Pr
otec
tion
Not
e: R
obus
t sta
ndar
d er
rors
in p
aren
thes
es. A
ll co
lum
ns in
clud
e in
dust
ry a
nd y
ear f
ixed
eff
ects
and
are
wei
ghte
d by
the
num
ber o
f co
mpa
nies
in th
e in
dust
ry fo
r the
par
ticul
ar y
ear.
Erro
rs a
re c
lust
ered
at t
he in
dust
ry le
vel.
Sign
ifica
nce
at th
e 10
per
cent
leve
l of
conf
iden
ce is
repr
esen
ted
by a
*, a
t the
5 p
erce
nt le
vel b
y a
**, a
nd a
t the
1 p
erce
nt le
vel b
y **
*.
Pane
l A. O
utpu
t Tar
iffs
Pane
l B. E
ffect
ive
Rate
s of P
rote
ctio
n
Pane
l C. I
nput
Tar
iffs
I. TF
P
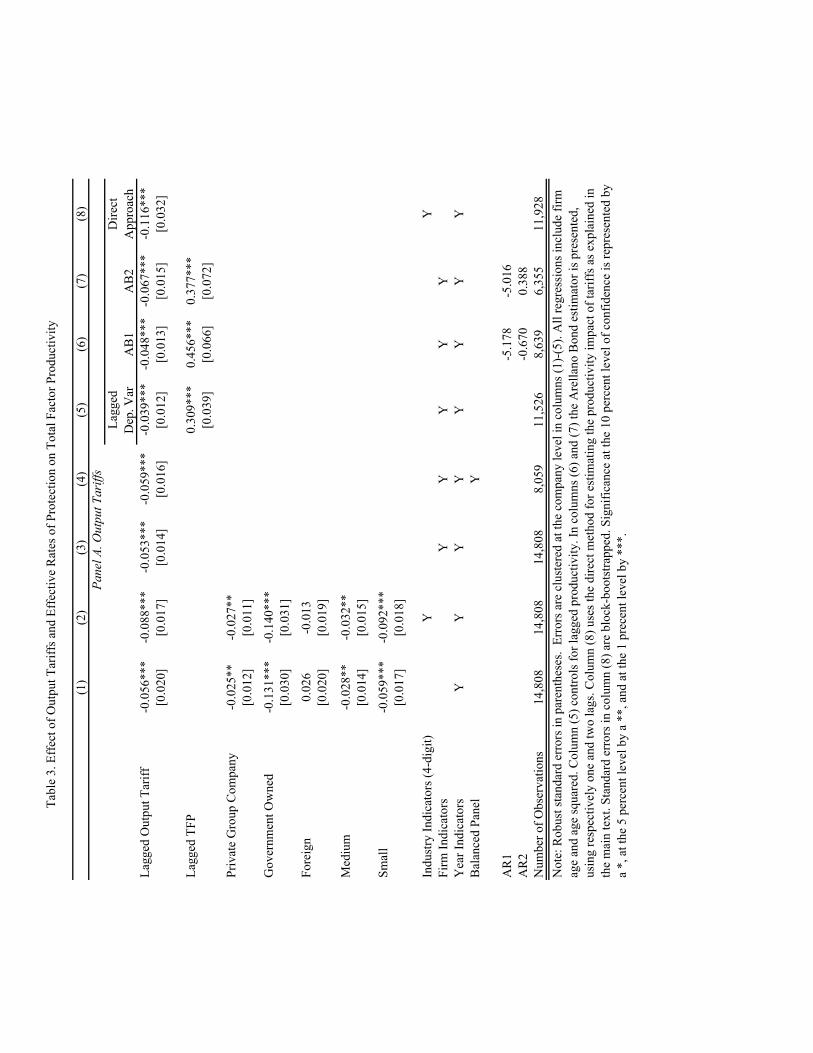
(1)
(2)
(3)
(4)
(5)
(6)
(7)
(8)
Lagg
ed
Dep
. Var
AB
1A
B2
Dire
ct
App
roac
hLa
gged
Out
put T
ariff
-0.0
56**
*-0
.088
***
-0.0
53**
*-0
.059
***
-0.0
39**
*-0
.048
***
-0.0
67**
*-0
.116
***
[0.0
20]
[0.0
17]
[0.0
14]
[0.0
16]
[0.0
12]
[0.0
13]
[0.0
15]
[0.0
32]
Lagg
ed T
FP0.
309*
**0.
456*
**0.
377*
**[0
.039
][0
.066
][0
.072
]
Priv
ate
Gro
up C
ompa
ny-0
.025
**-0
.027
**[0
.012
][0
.011
]
Gov
ernm
ent O
wne
d-0
.131
***
-0.1
40**
*[0
.030
][0
.031
]
Fore
ign
0.02
6-0
.013
[0.0
20]
[0.0
19]
Med
ium
-0.0
28**
-0.0
32**
[0.0
14]
[0.0
15]
Smal
l-0
.059
***
-0.0
92**
*[0
.017
][0
.018
]
Indu
stry
Indi
cato
rs (4
-dig
it)Y
YFi
rm In
dica
tors
YY
YY
YY
ear I
ndic
ator
sY
YY
YY
YY
YB
alan
ced
Pane
lY
AR
1-5
.178
-5.0
16A
R2
-0.6
700.
388
Num
ber o
f Obs
erva
tions
14,8
0814
,808
14,8
088,
059
11,5
268,
639
6,35
511
,928
Tabl
e 3.
Eff
ect o
f Out
put T
ariff
s and
Eff
ectiv
e R
ates
of P
rote
ctio
n on
Tot
al F
acto
r Pro
duct
ivity
Pane
l A. O
utpu
t Tar
iffs
Not
e: R
obus
t sta
ndar
d er
rors
in p
aren
thes
es.
Erro
rs a
re c
lust
ered
at t
he c
ompa
ny le
vel i
n co
lum
ns (1
)-(5
). A
ll re
gres
sion
s inc
lude
firm
ag
e an
d ag
e sq
uare
d. C
olum
n (5
) con
trols
for l
agge
d pr
oduc
tivity
. In
colu
mns
(6) a
nd (7
) the
Are
llano
Bon
d es
timat
or is
pre
sent
ed,
usin
g re
spec
tivel
y on
e an
d tw
o la
gs. C
olum
n (8
) use
s the
dire
ct m
etho
d fo
r est
imat
ing
the
prod
uctiv
ity im
pact
of t
ariff
s as e
xpla
ined
in
the
mai
n te
xt. S
tand
ard
erro
rs in
col
umn
(8) a
re b
lock
-boo
tstra
pped
. Sig
nific
ance
at t
he 1
0 pe
rcen
t lev
el o
f con
fiden
ce is
repr
esen
ted
by
a *,
at t
he 5
per
cent
leve
l by
a **
, and
at t
he 1
pre
cent
leve
l by
***.
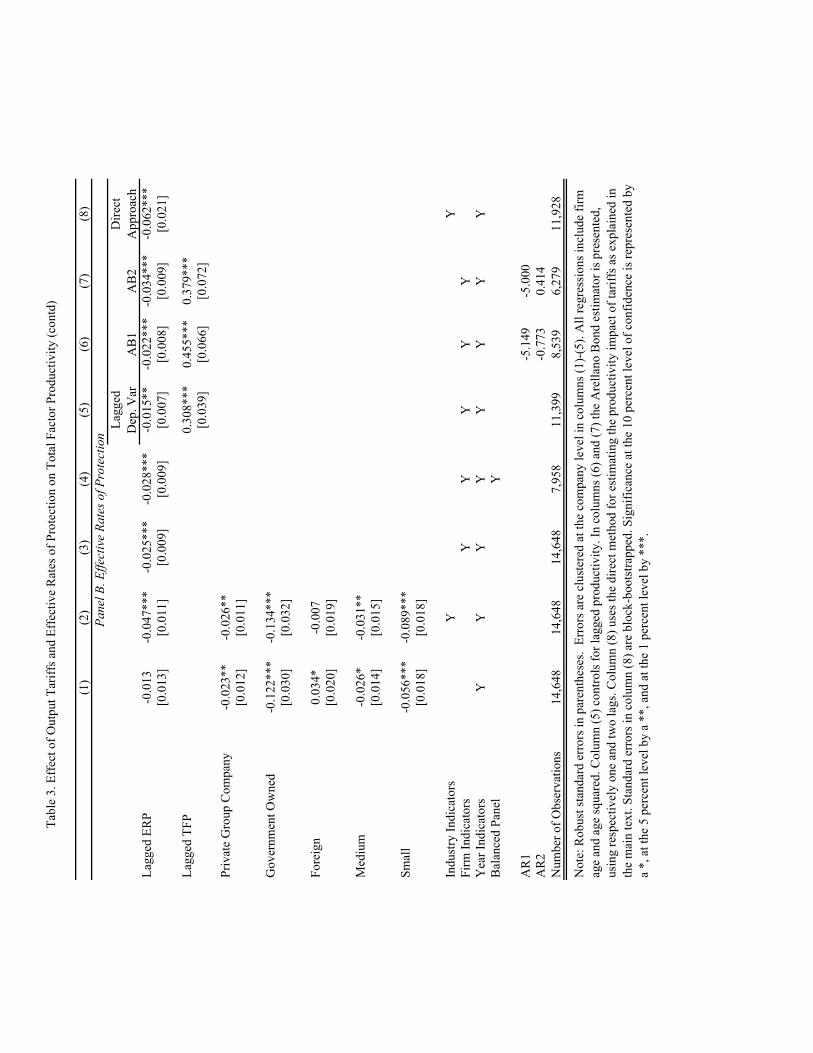
(1)
(2)
(3)
(4)
(5)
(6)
(7)
(8)
Lagg
ed
Dep
. Var
AB
1A
B2
Dire
ct
App
roac
hLa
gged
ER
P-0
.013
-0.0
47**
*-0
.025
***
-0.0
28**
*-0
.015
**-0
.022
***
-0.0
34**
*-0
.062
***
[0.0
13]
[0.0
11]
[0.0
09]
[0.0
09]
[0.0
07]
[0.0
08]
[0.0
09]
[0.0
21]
Lagg
ed T
FP0.
308*
**0.
455*
**0.
379*
**[0
.039
][0
.066
][0
.072
]
Priv
ate
Gro
up C
ompa
ny-0
.023
**-0
.026
**[0
.012
][0
.011
]
Gov
ernm
ent O
wne
d-0
.122
***
-0.1
34**
*[0
.030
][0
.032
]
Fore
ign
0.03
4*-0
.007
[0.0
20]
[0.0
19]
Med
ium
-0.0
26*
-0.0
31**
[0.0
14]
[0.0
15]
Smal
l-0
.056
***
-0.0
89**
*[0
.018
][0
.018
]
Indu
stry
Indi
cato
rsY
YFi
rm In
dica
tors
YY
YY
YY
ear I
ndic
ator
sY
YY
YY
YY
YB
alan
ced
Pane
lY
AR
1-5
.149
-5.0
00A
R2
-0.7
730.
414
Num
ber o
f Obs
erva
tions
14,6
4814
,648
14,6
487,
958
11,3
998,
539
6,27
911
,928
Pane
l B. E
ffect
ive
Rate
s of P
rote
ctio
n
Not
e: R
obus
t sta
ndar
d er
rors
in p
aren
thes
es.
Erro
rs a
re c
lust
ered
at t
he c
ompa
ny le
vel i
n co
lum
ns (1
)-(5
). A
ll re
gres
sion
s inc
lude
firm
ag
e an
d ag
e sq
uare
d. C
olum
n (5
) con
trols
for l
agge
d pr
oduc
tivity
. In
colu
mns
(6) a
nd (7
) the
Are
llano
Bon
d es
timat
or is
pre
sent
ed,
usin
g re
spec
tivel
y on
e an
d tw
o la
gs. C
olum
n (8
) use
s the
dire
ct m
etho
d fo
r est
imat
ing
the
prod
uctiv
ity im
pact
of t
ariff
s as e
xpla
ined
in
the
mai
n te
xt. S
tand
ard
erro
rs in
col
umn
(8) a
re b
lock
-boo
tstra
pped
. Sig
nific
ance
at t
he 1
0 pe
rcen
t lev
el o
f con
fiden
ce is
repr
esen
ted
by
a *,
at t
he 5
per
cent
leve
l by
a **
, and
at t
he 1
per
cent
leve
l by
***.
Tabl
e 3.
Eff
ect o
f Out
put T
ariff
s and
Eff
ectiv
e R
ates
of P
rote
ctio
n on
Tot
al F
acto
r Pro
duct
ivity
(con
td)
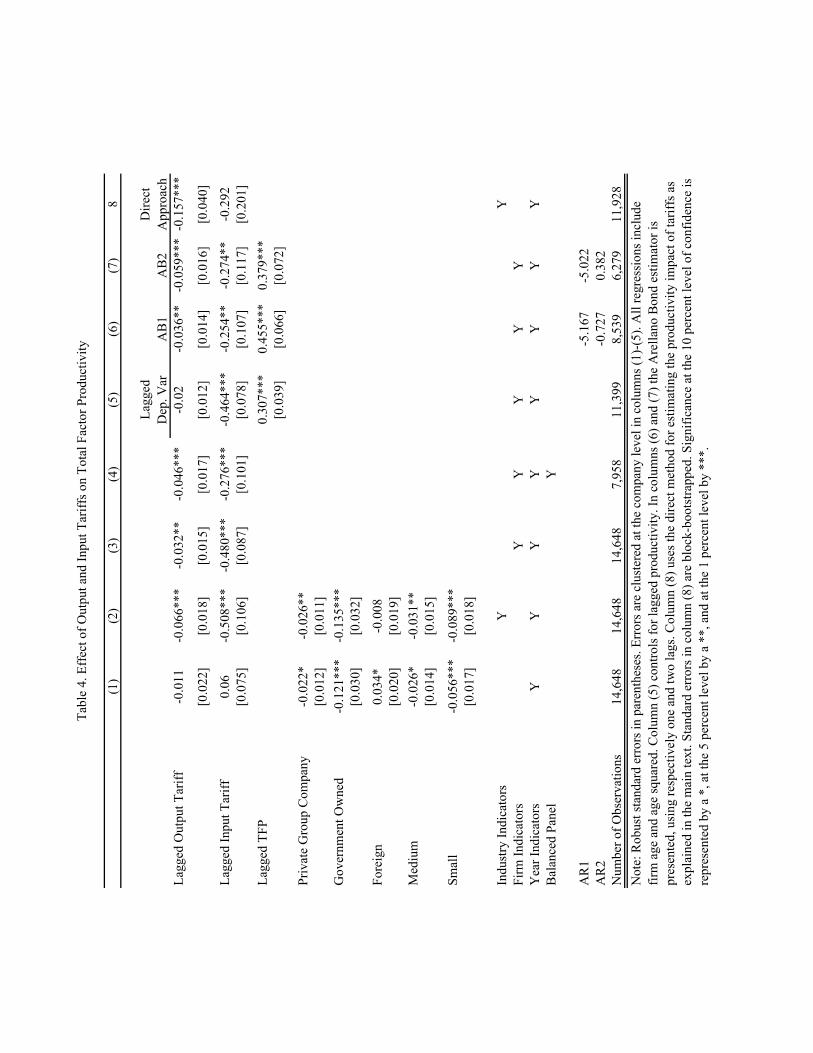
(1)
(2)
(3)
(4)
(5)
(6)
(7)
8
Lagg
ed
Dep
. Var
AB
1A
B2
Dire
ct
App
roac
hLa
gged
Out
put T
ariff
-0.0
11-0
.066
***
-0.0
32**
-0.0
46**
*-0
.02
-0.0
36**
-0.0
59**
*-0
.157
***
[0.0
22]
[0.0
18]
[0.0
15]
[0.0
17]
[0.0
12]
[0.0
14]
[0.0
16]
[0.0
40]
Lagg
ed In
put T
ariff
0.06
-0.5
08**
*-0
.480
***
-0.2
76**
*-0
.464
***
-0.2
54**
-0.2
74**
-0.2
92[0
.075
][0
.106
][0
.087
][0
.101
][0
.078
][0
.107
][0
.117
][0
.201
]La
gged
TFP
0.30
7***
0.45
5***
0.37
9***
[0.0
39]
[0.0
66]
[0.0
72]
Priv
ate
Gro
up C
ompa
ny-0
.022
*-0
.026
**[0
.012
][0
.011
]G
over
nmen
t Ow
ned
-0.1
21**
*-0
.135
***
[0.0
30]
[0.0
32]
Fore
ign
0.03
4*-0
.008
[0.0
20]
[0.0
19]
Med
ium
-0.0
26*
-0.0
31**
[0.0
14]
[0.0
15]
Smal
l-0
.056
***
-0.0
89**
*[0
.017
][0
.018
]
Indu
stry
Indi
cato
rsY
YFi
rm In
dica
tors
YY
YY
YY
ear I
ndic
ator
sY
YY
YY
YY
YB
alan
ced
Pane
lY
AR
1-5
.167
-5.0
22A
R2
-0.7
270.
382
Num
ber o
f Obs
erva
tions
14,6
4814
,648
14,6
487,
958
11,3
998,
539
6,27
911
,928
Tabl
e 4.
Eff
ect o
f Out
put a
nd In
put T
ariff
s on
Tota
l Fac
tor P
rodu
ctiv
ity
Not
e: R
obus
t sta
ndar
d er
rors
in p
aren
thes
es. E
rror
s are
clu
ster
ed a
t the
com
pany
leve
l in
colu
mns
(1)-
(5).
All
regr
essi
ons i
nclu
de
firm
age
and
age
squa
red.
Col
umn
(5) c
ontro
ls fo
r lag
ged
prod
uctiv
ity. I
n co
lum
ns (6
) and
(7) t
he A
rella
no B
ond
estim
ator
is
pres
ente
d, u
sing
resp
ectiv
ely
one
and
two
lags
. Col
umn
(8) u
ses t
he d
irect
met
hod
for e
stim
atin
g th
e pr
oduc
tivity
impa
ct o
f tar
iffs a
s ex
plai
ned
in th
e m
ain
text
. Sta
ndar
d er
rors
in c
olum
n (8
) are
blo
ck-b
oots
trapp
ed. S
igni
fican
ce a
t the
10
perc
ent l
evel
of c
onfid
ence
is
repr
esen
ted
by a
*, a
t the
5 p
erce
nt le
vel b
y a
**, a
nd a
t the
1 p
erce
nt le
vel b
y **
*.
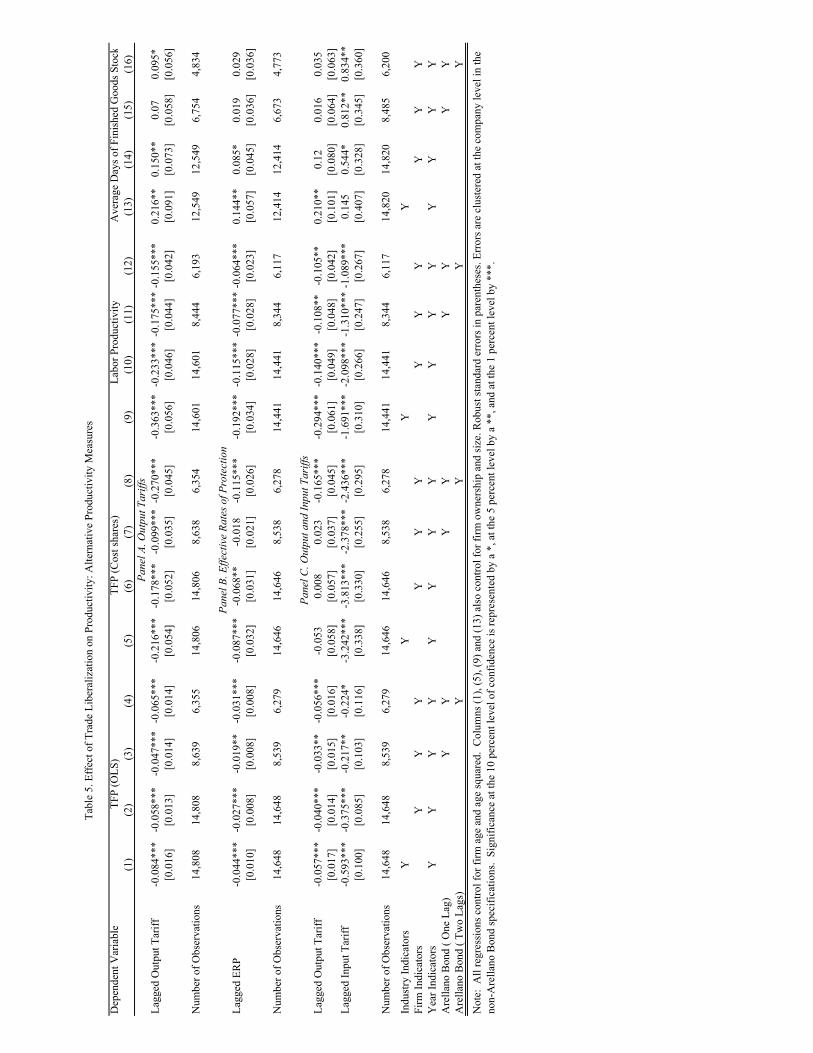
Dep
ende
nt V
aria
ble
(1)
(2)
(3)
(4)
(5)
(6)
(7)
(8)
(9)
(10)
(11)
(12)
(13)
(14)
(15)
(16)
Lagg
ed O
utpu
t Tar
iff-0
.084
***
-0.0
58**
*-0
.047
***
-0.0
65**
*-0
.216
***
-0.1
78**
*-0
.099
***
-0.2
70**
*-0
.363
***
-0.2
33**
*-0
.175
***
-0.1
55**
*0.
216*
*0.
150*
*0.
070.
095*
[0.0
16]
[0.0
13]
[0.0
14]
[0.0
14]
[0.0
54]
[0.0
52]
[0.0
35]
[0.0
45]
[0.0
56]
[0.0
46]
[0.0
44]
[0.0
42]
[0.0
91]
[0.0
73]
[0.0
58]
[0.0
56]
Num
ber o
f Obs
erva
tions
14,8
0814
,808
8,63
96,
355
14,8
0614
,806
8,63
86,
354
14,6
0114
,601
8,44
46,
193
12,5
4912
,549
6,75
44,
834
Lagg
ed E
RP
-0.0
44**
*-0
.027
***
-0.0
19**
-0.0
31**
*-0
.087
***
-0.0
68**
-0.0
18-0
.115
***
-0.1
92**
*-0
.115
***
-0.0
77**
*-0
.064
***
0.14
4**
0.08
5*0.
019
0.02
9[0
.010
][0
.008
][0
.008
][0
.008
][0
.032
][0
.031
][0
.021
][0
.026
][0
.034
][0
.028
][0
.028
][0
.023
][0
.057
][0
.045
][0
.036
][0
.036
]
Num
ber o
f Obs
erva
tions
14,6
4814
,648
8,53
96,
279
14,6
4614
,646
8,53
86,
278
14,4
4114
,441
8,34
46,
117
12,4
1412
,414
6,67
34,
773
Lagg
ed O
utpu
t Tar
iff-0
.057
***
-0.0
40**
*-0
.033
**-0
.056
***
-0.0
530.
008
0.02
3-0
.165
***
-0.2
94**
*-0
.140
***
-0.1
08**
-0.1
05**
0.21
0**
0.12
0.01
60.
035
[0.0
17]
[0.0
14]
[0.0
15]
[0.0
16]
[0.0
58]
[0.0
57]
[0.0
37]
[0.0
45]
[0.0
61]
[0.0
49]
[0.0
48]
[0.0
42]
[0.1
01]
[0.0
80]
[0.0
64]
[0.0
63]
Lagg
ed In
put T
ariff
-0.5
93**
*-0
.375
***
-0.2
17**
-0.2
24*
-3.2
42**
*-3
.813
***
-2.3
78**
*-2
.436
***
-1.6
91**
*-2
.098
***
-1.3
10**
*-1
.089
***
0.14
50.
544*
0.81
2**
0.83
4**
[0.1
00]
[0.0
85]
[0.1
03]
[0.1
16]
[0.3
38]
[0.3
30]
[0.2
55]
[0.2
95]
[0.3
10]
[0.2
66]
[0.2
47]
[0.2
67]
[0.4
07]
[0.3
28]
[0.3
45]
[0.3
60]
Num
ber o
f Obs
erva
tions
14,6
4814
,648
8,53
96,
279
14,6
4614
,646
8,53
86,
278
14,4
4114
,441
8,34
46,
117
14,8
2014
,820
8,48
56,
200
Indu
stry
Indi
cato
rsY
YY
YFi
rm In
dica
tors
YY
YY
YY
YY
YY
YY
Yea
r Ind
icat
ors
YY
YY
YY
YY
YY
YY
YY
YY
Are
llano
Bon
d ( O
ne L
ag)
YY
YY
YY
YY
Are
llano
Bon
d ( T
wo
Lags
)Y
YY
Y
Tabl
e 5.
Eff
ect o
f Tra
de L
iber
aliz
atio
n on
Pro
duct
ivity
: Alte
rnat
ive
Prod
uctiv
ity M
easu
res
TFP
(Cos
t sha
res)
Pane
l B. E
ffect
ive
Rate
s of P
rote
ctio
n
Pane
l A. O
utpu
t Tar
iffs
Not
e: A
ll re
gres
sion
s con
trol f
or fi
rm a
ge a
nd a
ge sq
uare
d. C
olum
ns (1
), (5
), (9
) and
(13)
als
o co
ntro
l for
firm
ow
ners
hip
and
size
. Rob
ust s
tand
ard
erro
rs in
par
enth
eses
. Err
ors a
re c
lust
ered
at t
he c
ompa
ny le
vel i
n th
e no
n-A
rella
no B
ond
spec
ifica
tions
. Si
gnifi
canc
e at
the
10 p
erce
nt le
vel o
f con
fiden
ce is
repr
esen
ted
by a
*, a
t the
5 p
erce
nt le
vel b
y a
**, a
nd a
t the
1 p
erce
nt le
vel b
y **
*.
Labo
r Pro
duct
ivity
TFP
(OLS
)A
vera
ge D
ays o
f Fin
ishe
d G
oods
Sto
ck
Pane
l C. O
utpu
t and
Inpu
t Tar
iffs
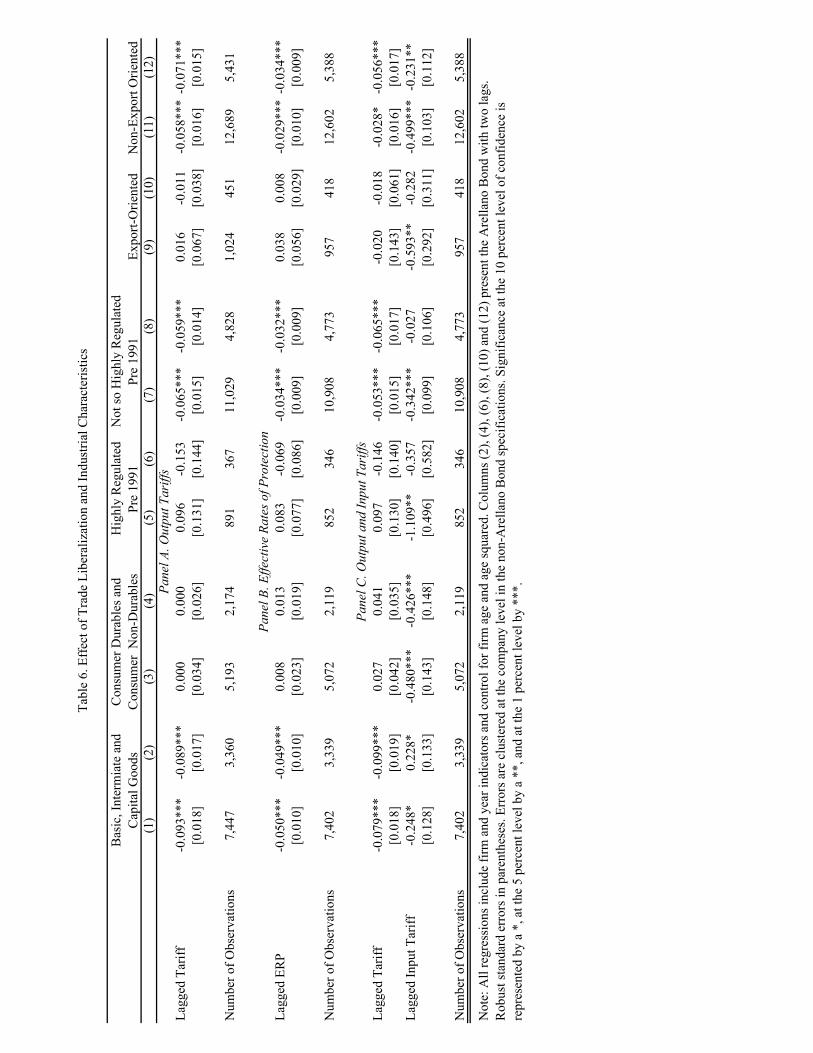
(1)
(2)
(3)
(4)
(5)
(6)
(7)
(8)
(9)
(10)
(11)
(12)
Lagg
ed T
ariff
-0.0
93**
*-0
.089
***
0.00
00.
000
0.09
6-0
.153
-0.0
65**
*-0
.059
***
0.01
6-0
.011
-0.0
58**
*-0
.071
***
[0.0
18]
[0.0
17]
[0.0
34]
[0.0
26]
[0.1
31]
[0.1
44]
[0.0
15]
[0.0
14]
[0.0
67]
[0.0
38]
[0.0
16]
[0.0
15]
Num
ber o
f Obs
erva
tions
7,44
73,
360
5,19
32,
174
891
367
11,0
294,
828
1,02
445
112
,689
5,43
1
Lagg
ed E
RP
-0.0
50**
*-0
.049
***
0.00
80.
013
0.08
3-0
.069
-0.0
34**
*-0
.032
***
0.03
80.
008
-0.0
29**
*-0
.034
***
[0.0
10]
[0.0
10]
[0.0
23]
[0.0
19]
[0.0
77]
[0.0
86]
[0.0
09]
[0.0
09]
[0.0
56]
[0.0
29]
[0.0
10]
[0.0
09]
Num
ber o
f Obs
erva
tions
7,40
23,
339
5,07
22,
119
852
346
10,9
084,
773
957
418
12,6
025,
388
Lagg
ed T
ariff
-0.0
79**
*-0
.099
***
0.02
70.
041
0.09
7-0
.146
-0.0
53**
*-0
.065
***
-0.0
20-0
.018
-0.0
28*
-0.0
56**
*[0
.018
][0
.019
][0
.042
][0
.035
][0
.130
][0
.140
][0
.015
][0
.017
][0
.143
][0
.061
][0
.016
][0
.017
]La
gged
Inpu
t Tar
iff-0
.248
*0.
228*
-0.4
80**
*-0
.426
***
-1.1
09**
-0.3
57-0
.342
***
-0.0
27-0
.593
**-0
.282
-0.4
99**
*-0
.231
**[0
.128
][0
.133
][0
.143
][0
.148
][0
.496
][0
.582
][0
.099
][0
.106
][0
.292
][0
.311
][0
.103
][0
.112
]
Num
ber o
f Obs
erva
tions
7,40
23,
339
5,07
22,
119
852
346
10,9
084,
773
957
418
12,6
025,
388
Non
-Exp
ort O
rient
edH
ighl
y R
egul
ated
Pr
e 19
91N
ot so
Hig
hly
Reg
ulat
ed
Pre
1991
Tabl
e 6.
Eff
ect o
f Tra
de L
iber
aliz
atio
n an
d In
dust
rial C
hara
cter
istic
s
Bas
ic, I
nter
mia
te a
nd
Cap
ital G
oods
Con
sum
er D
urab
les a
nd
Con
sum
er N
on-D
urab
les
Expo
rt-O
rient
ed
Not
e: A
ll re
gres
sion
s inc
lude
firm
and
yea
r ind
icat
ors a
nd c
ontro
l for
firm
age
and
age
squa
red.
Col
umns
(2),
(4),
(6),
(8),
(10)
and
(12)
pre
sent
the
Are
llano
Bon
d w
ith tw
o la
gs.
Rob
ust s
tand
ard
erro
rs in
par
enth
eses
. Err
ors a
re c
lust
ered
at t
he c
ompa
ny le
vel i
n th
e no
n-A
rella
no B
ond
spec
ifica
tions
. Sig
nific
ance
at t
he 1
0 pe
rcen
t lev
el o
f con
fiden
ce is
re
pres
ente
d by
a *
, at t
he 5
per
cent
leve
l by
a **
, and
at t
he 1
per
cent
leve
l by
***.
Pane
l C. O
utpu
t and
Inpu
t Tar
iffs
Pane
l B. E
ffect
ive
Rate
s of P
rote
ctio
n
Pane
l A. O
utpu
t Tar
iffs
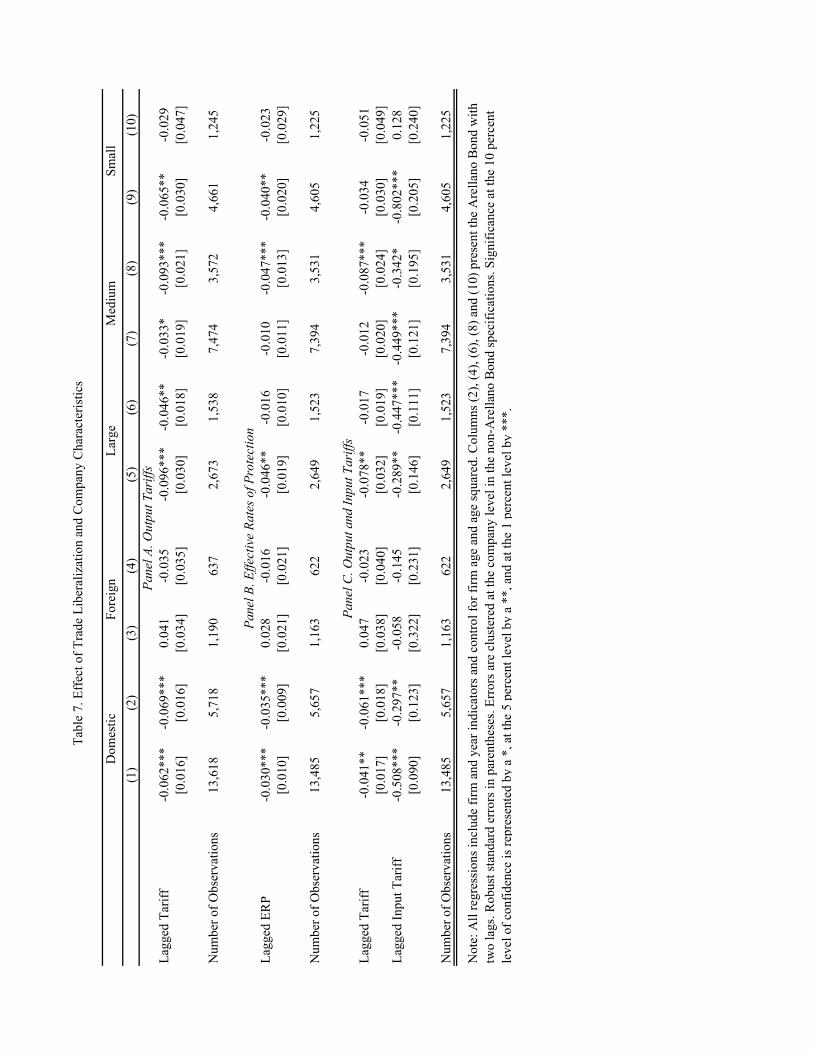
(1)
(2)
(3)
(4)
(5)
(6)
(7)
(8)
(9)
(10)
Lagg
ed T
ariff
-0.0
62**
*-0
.069
***
0.04
1-0
.035
-0.0
96**
*-0
.046
**-0
.033
*-0
.093
***
-0.0
65**
-0.0
29[0
.016
][0
.016
][0
.034
][0
.035
][0
.030
][0
.018
][0
.019
][0
.021
][0
.030
][0
.047
]
Num
ber o
f Obs
erva
tions
13,6
185,
718
1,19
063
72,
673
1,53
87,
474
3,57
24,
661
1,24
5
Lagg
ed E
RP
-0.0
30**
*-0
.035
***
0.02
8-0
.016
-0.0
46**
-0.0
16-0
.010
-0.0
47**
*-0
.040
**-0
.023
[0.0
10]
[0.0
09]
[0.0
21]
[0.0
21]
[0.0
19]
[0.0
10]
[0.0
11]
[0.0
13]
[0.0
20]
[0.0
29]
Num
ber o
f Obs
erva
tions
13,4
855,
657
1,16
362
22,
649
1,52
37,
394
3,53
14,
605
1,22
5
Lagg
ed T
ariff
-0.0
41**
-0.0
61**
*0.
047
-0.0
23-0
.078
**-0
.017
-0.0
12-0
.087
***
-0.0
34-0
.051
[0.0
17]
[0.0
18]
[0.0
38]
[0.0
40]
[0.0
32]
[0.0
19]
[0.0
20]
[0.0
24]
[0.0
30]
[0.0
49]
Lagg
ed In
put T
ariff
-0.5
08**
*-0
.297
**-0
.058
-0.1
45-0
.289
**-0
.447
***
-0.4
49**
*-0
.342
*-0
.802
***
0.12
8[0
.090
][0
.123
][0
.322
][0
.231
][0
.146
][0
.111
][0
.121
][0
.195
][0
.205
][0
.240
]
Num
ber o
f Obs
erva
tions
13,4
855,
657
1,16
362
22,
649
1,52
37,
394
3,53
14,
605
1,22
5
Pane
l A. O
utpu
t Tar
iffs
Pane
l B. E
ffect
ive
Rate
s of P
rote
ctio
n
Pane
l C. O
utpu
t and
Inpu
t Tar
iffs
Not
e: A
ll re
gres
sion
s inc
lude
firm
and
yea
r ind
icat
ors a
nd c
ontro
l for
firm
age
and
age
squa
red.
Col
umns
(2),
(4),
(6),
(8) a
nd (1
0) p
rese
nt th
e A
rella
no B
ond
with
tw
o la
gs. R
obus
t sta
ndar
d er
rors
in p
aren
thes
es. E
rror
s are
clu
ster
ed a
t the
com
pany
leve
l in
the
non-
Are
llano
Bon
d sp
ecifi
catio
ns. S
igni
fican
ce a
t the
10
perc
ent
leve
l of c
onfid
ence
is re
pres
ente
d by
a *
, at t
he 5
per
cent
leve
l by
a **
, and
at t
he 1
per
cent
leve
l by
***.
Smal
l
Tabl
e 7.
Eff
ect o
f Tra
de L
iber
aliz
atio
n an
d C
ompa
ny C
hara
cter
istic
s
Dom
estic
Fore
ign
Larg
eM
ediu
m
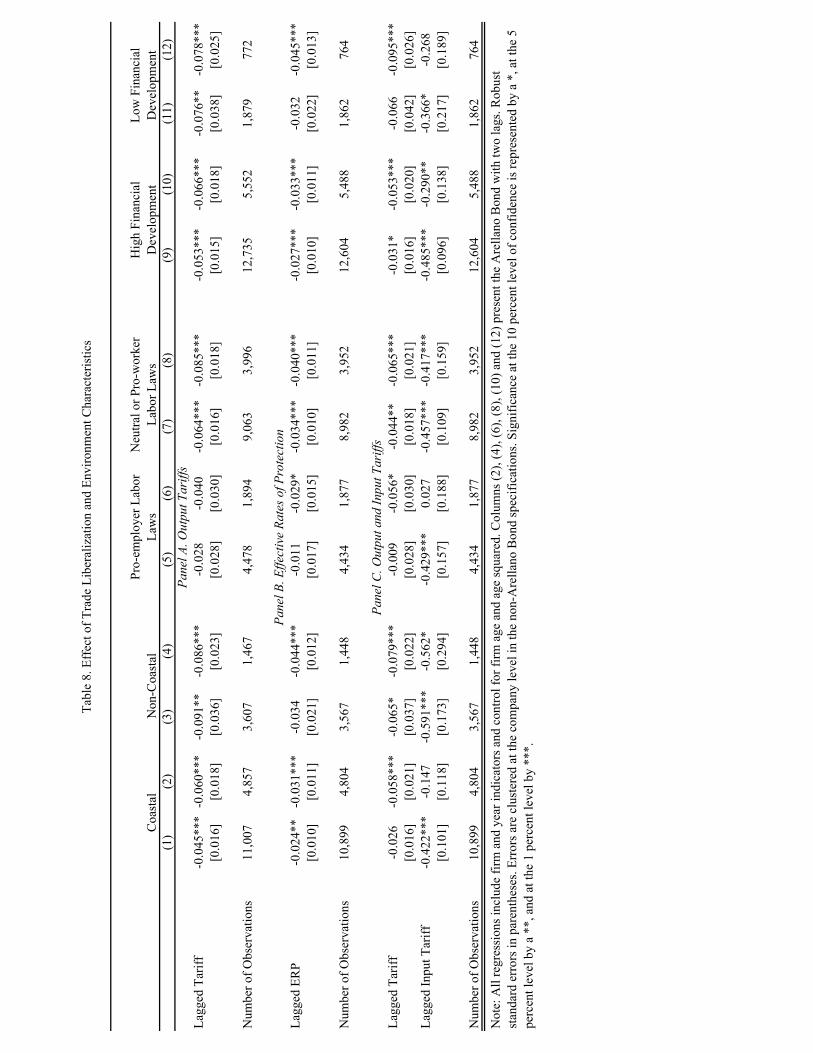
(1)
(2)
(3)
(4)
(5)
(6)
(7)
(8)
(9)
(10)
(11)
(12)
Lagg
ed T
ariff
-0.0
45**
*-0
.060
***
-0.0
91**
-0.0
86**
*-0
.028
-0.0
40-0
.064
***
-0.0
85**
*-0
.053
***
-0.0
66**
*-0
.076
**-0
.078
***
[0.0
16]
[0.0
18]
[0.0
36]
[0.0
23]
[0.0
28]
[0.0
30]
[0.0
16]
[0.0
18]
[0.0
15]
[0.0
18]
[0.0
38]
[0.0
25]
Num
ber o
f Obs
erva
tions
11,0
074,
857
3,60
71,
467
4,47
81,
894
9,06
33,
996
12,7
355,
552
1,87
977
2
Lagg
ed E
RP
-0.0
24**
-0.0
31**
*-0
.034
-0.0
44**
*-0
.011
-0.0
29*
-0.0
34**
*-0
.040
***
-0.0
27**
*-0
.033
***
-0.0
32-0
.045
***
[0.0
10]
[0.0
11]
[0.0
21]
[0.0
12]
[0.0
17]
[0.0
15]
[0.0
10]
[0.0
11]
[0.0
10]
[0.0
11]
[0.0
22]
[0.0
13]
Num
ber o
f Obs
erva
tions
10,8
994,
804
3,56
71,
448
4,43
41,
877
8,98
23,
952
12,6
045,
488
1,86
276
4
Lagg
ed T
ariff
-0.0
26-0
.058
***
-0.0
65*
-0.0
79**
*-0
.009
-0.0
56*
-0.0
44**
-0.0
65**
*-0
.031
*-0
.053
***
-0.0
66-0
.095
***
[0.0
16]
[0.0
21]
[0.0
37]
[0.0
22]
[0.0
28]
[0.0
30]
[0.0
18]
[0.0
21]
[0.0
16]
[0.0
20]
[0.0
42]
[0.0
26]
Lagg
ed In
put T
ariff
-0.4
22**
*-0
.147
-0.5
91**
*-0
.562
*-0
.429
***
0.02
7-0
.457
***
-0.4
17**
*-0
.485
***
-0.2
90**
-0.3
66*
-0.2
68[0
.101
][0
.118
][0
.173
][0
.294
][0
.157
][0
.188
][0
.109
][0
.159
][0
.096
][0
.138
][0
.217
][0
.189
]
Num
ber o
f Obs
erva
tions
10,8
994,
804
3,56
71,
448
4,43
41,
877
8,98
23,
952
12,6
045,
488
1,86
276
4
Neu
tral o
r Pro
-wor
ker
Labo
r Law
sH
igh
Fina
ncia
l D
evel
opm
ent
Low
Fin
anci
al
Dev
elop
men
t
Tabl
e 8.
Eff
ect o
f Tra
de L
iber
aliz
atio
n an
d En
viro
nmen
t Cha
ract
eris
tics
Coa
stal
Non
-Coa
stal
Pro-
empl
oyer
Lab
or
Law
s
Not
e: A
ll re
gres
sion
s inc
lude
firm
and
yea
r ind
icat
ors a
nd c
ontro
l for
firm
age
and
age
squa
red.
Col
umns
(2),
(4),
(6),
(8),
(10)
and
(12)
pre
sent
the
Are
llano
Bon
d w
ith tw
o la
gs. R
obus
t st
anda
rd e
rror
s in
pare
nthe
ses.
Erro
rs a
re c
lust
ered
at t
he c
ompa
ny le
vel i
n th
e no
n-A
rella
no B
ond
spec
ifica
tions
. Sig
nific
ance
at t
he 1
0 pe
rcen
t lev
el o
f con
fiden
ce is
repr
esen
ted
by a
*, a
t the
5
perc
ent l
evel
by
a **
, and
at t
he 1
per
cent
leve
l by
***.
Pane
l A. O
utpu
t Tar
iffs
Pane
l B. E
ffect
ive
Rate
s of P
rote
ctio
n
Pane
l C. O
utpu
t and
Inpu
t Tar
iffs
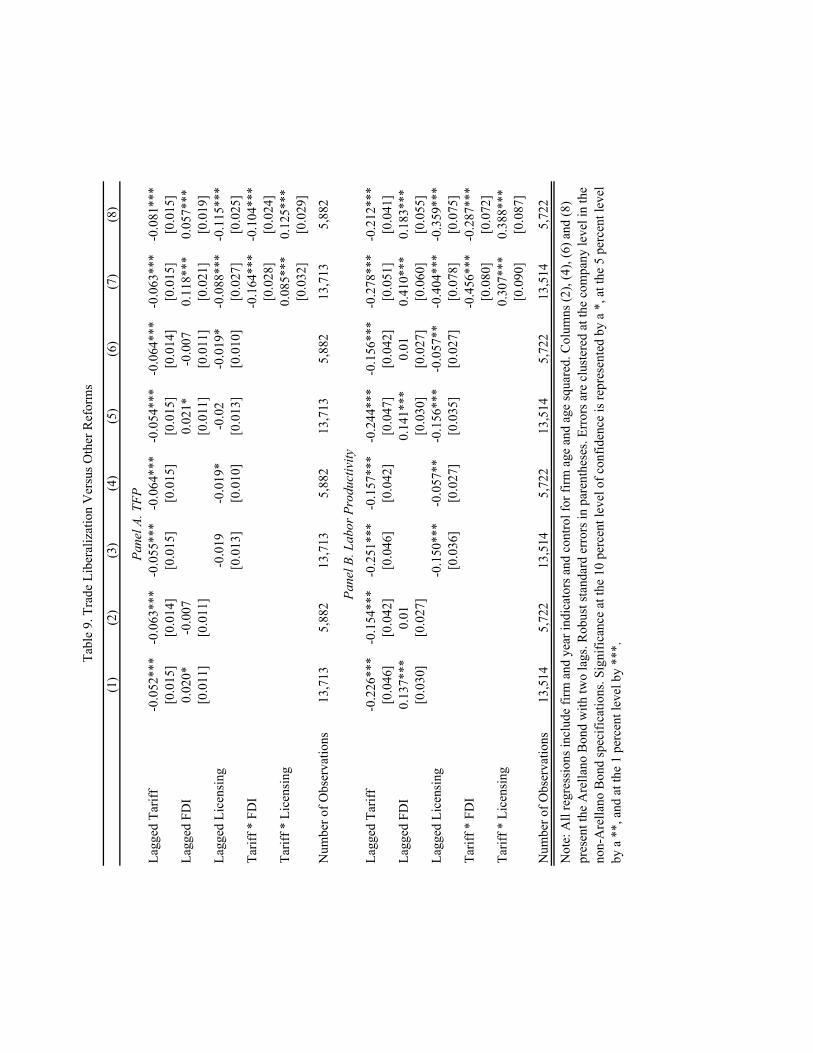
(1)
(2)
(3)
(4)
(5)
(6)
(7)
(8)
Lagg
ed T
ariff
-0.0
52**
*-0
.063
***
-0.0
55**
*-0
.064
***
-0.0
54**
*-0
.064
***
-0.0
63**
*-0
.081
***
[0.0
15]
[0.0
14]
[0.0
15]
[0.0
15]
[0.0
15]
[0.0
14]
[0.0
15]
[0.0
15]
Lagg
ed F
DI
0.02
0*-0
.007
0.02
1*-0
.007
0.11
8***
0.05
7***
[0.0
11]
[0.0
11]
[0.0
11]
[0.0
11]
[0.0
21]
[0.0
19]
Lagg
ed L
icen
sing
-0.0
19-0
.019
*-0
.02
-0.0
19*
-0.0
88**
*-0
.115
***
[0.0
13]
[0.0
10]
[0.0
13]
[0.0
10]
[0.0
27]
[0.0
25]
Tarif
f * F
DI
-0.1
64**
*-0
.104
***
[0.0
28]
[0.0
24]
Tarif
f * L
icen
sing
0.08
5***
0.12
5***
[0.0
32]
[0.0
29]
Num
ber o
f Obs
erva
tions
13,7
135,
882
13,7
135,
882
13,7
135,
882
13,7
135,
882
Lagg
ed T
ariff
-0.2
26**
*-0
.154
***
-0.2
51**
*-0
.157
***
-0.2
44**
*-0
.156
***
-0.2
78**
*-0
.212
***
[0.0
46]
[0.0
42]
[0.0
46]
[0.0
42]
[0.0
47]
[0.0
42]
[0.0
51]
[0.0
41]
Lagg
ed F
DI
0.13
7***
0.01
0.14
1***
0.01
0.41
0***
0.18
3***
[0.0
30]
[0.0
27]
[0.0
30]
[0.0
27]
[0.0
60]
[0.0
55]
Lagg
ed L
icen
sing
-0.1
50**
*-0
.057
**-0
.156
***
-0.0
57**
-0.4
04**
*-0
.359
***
[0.0
36]
[0.0
27]
[0.0
35]
[0.0
27]
[0.0
78]
[0.0
75]
Tarif
f * F
DI
-0.4
56**
*-0
.287
***
[0.0
80]
[0.0
72]
Tarif
f * L
icen
sing
0.30
7***
0.38
8***
[0.0
90]
[0.0
87]
Num
ber o
f Obs
erva
tions
13,5
145,
722
13,5
145,
722
13,5
145,
722
13,5
145,
722
Pane
l A. T
FP
Not
e: A
ll re
gres
sion
s inc
lude
firm
and
yea
r ind
icat
ors a
nd c
ontro
l for
firm
age
and
age
squa
red.
Col
umns
(2),
(4),
(6) a
nd (8
) pr
esen
t the
Are
llano
Bon
d w
ith tw
o la
gs. R
obus
t sta
ndar
d er
rors
in p
aren
thes
es. E
rror
s are
clu
ster
ed a
t the
com
pany
leve
l in
the
non-
Are
llano
Bon
d sp
ecifi
catio
ns. S
igni
fican
ce a
t the
10
perc
ent l
evel
of c
onfid
ence
is re
pres
ente
d by
a *
, at t
he 5
per
cent
leve
l by
a *
*, a
nd a
t the
1 p
erce
nt le
vel b
y **
*.
Tabl
e 9.
Tra
de L
iber
aliz
atio
n V
ersu
s Oth
er R
efor
ms
Pane
l B. L
abor
Pro
duct
ivity
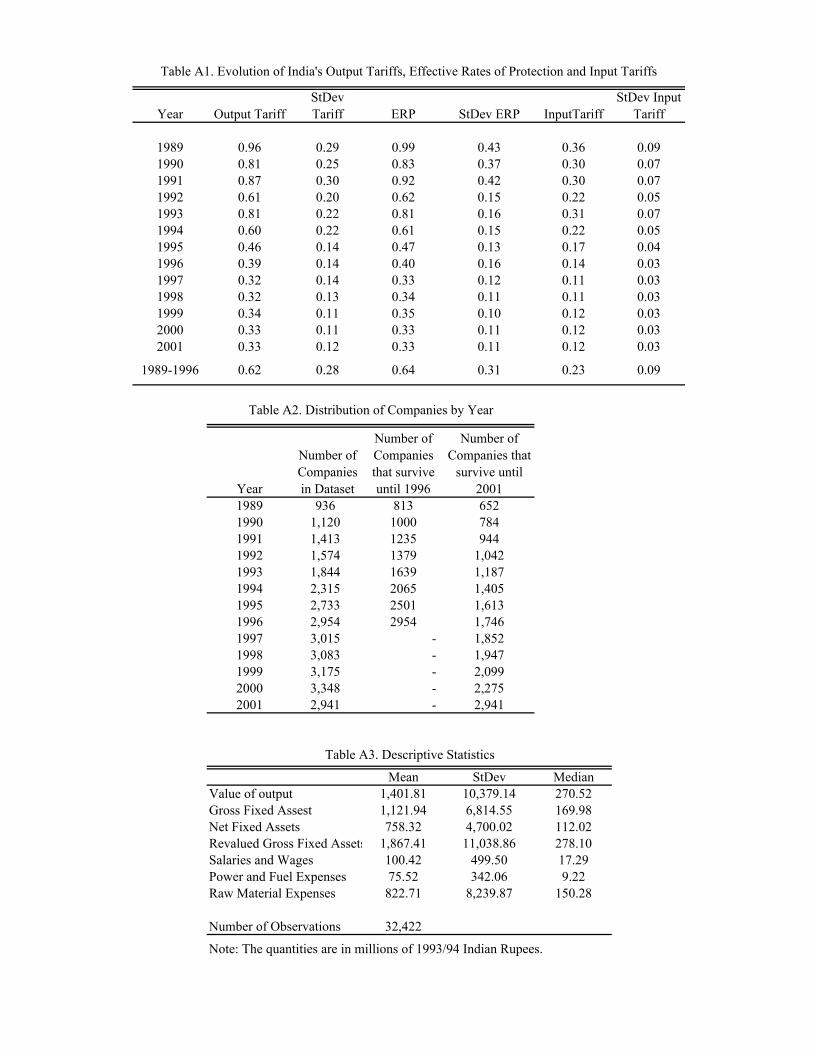
Year Output TariffStDev Tariff ERP StDev ERP InputTariff
StDev Input Tariff
1989 0.96 0.29 0.99 0.43 0.36 0.091990 0.81 0.25 0.83 0.37 0.30 0.071991 0.87 0.30 0.92 0.42 0.30 0.071992 0.61 0.20 0.62 0.15 0.22 0.051993 0.81 0.22 0.81 0.16 0.31 0.071994 0.60 0.22 0.61 0.15 0.22 0.051995 0.46 0.14 0.47 0.13 0.17 0.041996 0.39 0.14 0.40 0.16 0.14 0.031997 0.32 0.14 0.33 0.12 0.11 0.031998 0.32 0.13 0.34 0.11 0.11 0.031999 0.34 0.11 0.35 0.10 0.12 0.032000 0.33 0.11 0.33 0.11 0.12 0.032001 0.33 0.12 0.33 0.11 0.12 0.03
1989-1996 0.62 0.28 0.64 0.31 0.23 0.09
Year
Number of Companies in Dataset
Number of Companies that survive until 1996
Number of Companies that
survive until 2001
1989 936 813 6521990 1,120 1000 7841991 1,413 1235 9441992 1,574 1379 1,0421993 1,844 1639 1,1871994 2,315 2065 1,4051995 2,733 2501 1,6131996 2,954 2954 1,7461997 3,015 - 1,8521998 3,083 - 1,9471999 3,175 - 2,0992000 3,348 - 2,2752001 2,941 - 2,941
Mean StDev MedianValue of output 1,401.81 10,379.14 270.52Gross Fixed Assest 1,121.94 6,814.55 169.98Net Fixed Assets 758.32 4,700.02 112.02Revalued Gross Fixed Assets 1,867.41 11,038.86 278.10Salaries and Wages 100.42 499.50 17.29Power and Fuel Expenses 75.52 342.06 9.22Raw Material Expenses 822.71 8,239.87 150.28
Number of Observations 32,422
Note: The quantities are in millions of 1993/94 Indian Rupees.
Table A1. Evolution of India's Output Tariffs, Effective Rates of Protection and Input Tariffs
Table A2. Distribution of Companies by Year
Table A3. Descriptive Statistics
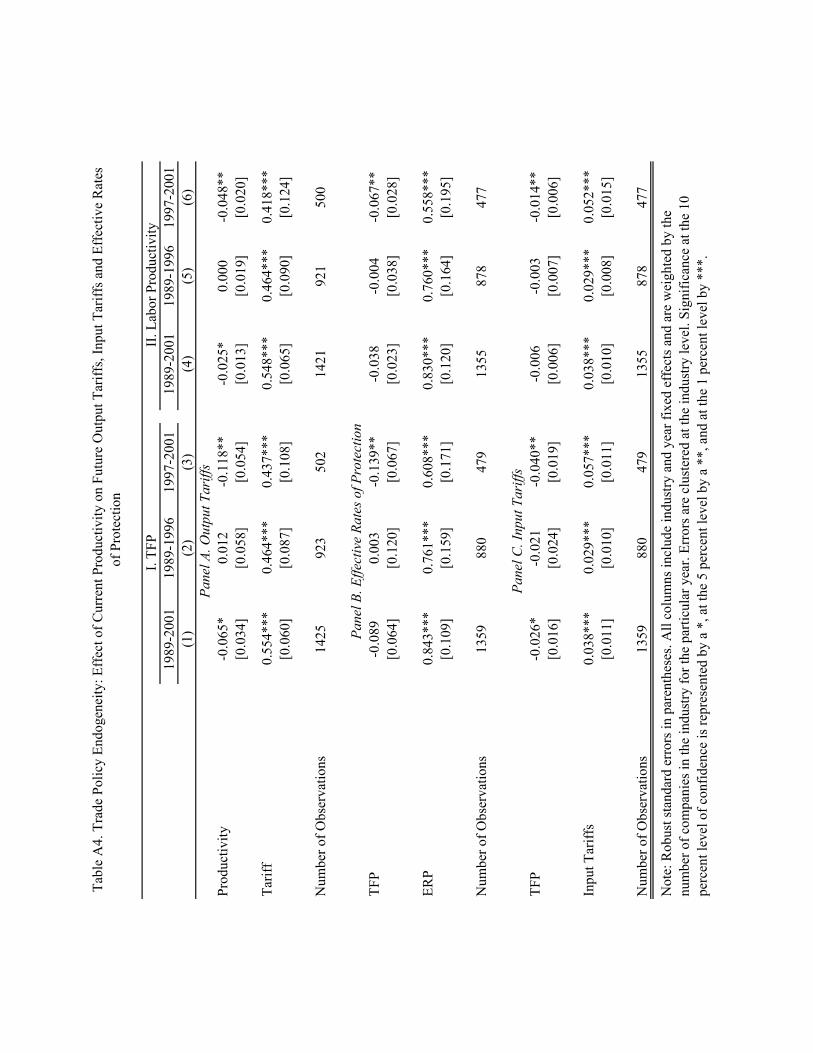
1989
-200
119
89-1
996
1997
-200
119
89-2
001
1989
-199
619
97-2
001
(1)
(2)
(3)
(4)
(5)
(6)
Prod
uctiv
ity-0
.065
*0.
012
-0.1
18**
-0.0
25*
0.00
0-0
.048
**[0
.034
][0
.058
][0
.054
][0
.013
][0
.019
][0
.020
]
Tarif
f0.
554*
**0.
464*
**0.
437*
**0.
548*
**0.
464*
**0.
418*
**[0
.060
][0
.087
][0
.108
][0
.065
][0
.090
][0
.124
]
Num
ber o
f Obs
erva
tions
1425
923
502
1421
921
500
TFP
-0.0
890.
003
-0.1
39**
-0.0
38-0
.004
-0.0
67**
[0.0
64]
[0.1
20]
[0.0
67]
[0.0
23]
[0.0
38]
[0.0
28]
ERP
0.84
3***
0.76
1***
0.60
8***
0.83
0***
0.76
0***
0.55
8***
[0.1
09]
[0.1
59]
[0.1
71]
[0.1
20]
[0.1
64]
[0.1
95]
Num
ber o
f Obs
erva
tions
1359
880
479
1355
878
477
TFP
-0.0
26*
-0.0
21-0
.040
**-0
.006
-0.0
03-0
.014
**[0
.016
][0
.024
][0
.019
][0
.006
][0
.007
][0
.006
]
Inpu
t Tar
iffs
0.03
8***
0.02
9***
0.05
7***
0.03
8***
0.02
9***
0.05
2***
[0.0
11]
[0.0
10]
[0.0
11]
[0.0
10]
[0.0
08]
[0.0
15]
Num
ber o
f Obs
erva
tions
1359
880
479
1355
878
477
Tabl
e A
4. T
rade
Pol
icy
Endo
gene
ity: E
ffec
t of C
urre
nt P
rodu
ctiv
ity o
n Fu
ture
Out
put T
ariff
s, In
put T
ariff
s and
Eff
ectiv
e R
ates
of
Pro
tect
ion
Not
e: R
obus
t sta
ndar
d er
rors
in p
aren
thes
es. A
ll co
lum
ns in
clud
e in
dust
ry a
nd y
ear f
ixed
eff
ects
and
are
wei
ghte
d by
the
num
ber o
f com
pani
es in
the
indu
stry
for t
he p
artic
ular
yea
r. Er
rors
are
clu
ster
ed a
t the
indu
stry
leve
l. Si
gnifi
canc
e at
the
10
perc
ent l
evel
of c
onfid
ence
is re
pres
ente
d by
a *
, at t
he 5
per
cent
leve
l by
a **
, and
at t
he 1
per
cent
leve
l by
***.
Pane
l A. O
utpu
t Tar
iffs
Pane
l B. E
ffect
ive
Rate
s of P
rote
ctio
n
Pane
l C. I
nput
Tar
iffs
I. TF
PII
. Lab
or P
rodu
ctiv
ity

Table A5. State Classifications
Geographical classificationCoastal State Land Locked States
Andhra Pradhesh AssamDaman and Diu BiharDadra and Nagar Haveli ChandigarhGoa ChattisgarhGujarat DelhiKarnataka HaryanaKerala Himachal PradeshMaharashtra Jammu and KashmirOrissa JharkhandPondicherry Madhya PradeshTamil Nadu NagalandWest Bengal Punjab
RajasthanUttar Pradesh
Labor laws (Besley and Burgess, 2002)Employer Friendly Worker Friendly Neutral
Andhra Pradhesh Gujarat AssamKarnataka Maharashtra BiharKerala Orissa Haryana Madhya Pradesh West Bengal PunjabRajasthan Uttar PradeshTamil Nadu Jammu and Kashmir
Financial Development (credit per capita, Reserve Bank of India)Above median Below median
Andhra Pradesh Andaman & Nicobar IslandsChandigarh Arunachal PradeshDaman & Diu AssamDelhi BiharGoa Dadra & Nagar HaveliGujarat LakshadweepHaryana Madhya PradeshHimachal Pradesh ManipurJammu & Kashmir MeghalayaKarnataka MizoramKerala NagalandMaharashtra OrissaPondicherry RajasthanPunjab SikkimTamil Nadu TripuraWest Bengal Uttar Pradesh
Related Documents