Trade Information Service 2005 Section 1-3 Author: Owen Willcox Organisation: Trade & Industrial Policy Strategies (TIPS) Date: August 2005

Welcome message from author
This document is posted to help you gain knowledge. Please leave a comment to let me know what you think about it! Share it to your friends and learn new things together.
Transcript

Trade Information Service 2005
Section 1-3
Author: Owen Willcox
Organisation: Trade & Industrial Policy Strategies (TIPS)
Date: August 2005
lucille
i
Contents
Contents ......................................................................................................................... i
List of tables................................................................................................................. ii List of figures ............................................................................................................... ii
SECTION 1: BACKGROUND.......................................................................................1
SECTION 2: OVERVIEW OF INTERNATIONAL ECONOMIC ACTIVITY AND TRADE PATTERNS.......................................................................................................2
1 World Growth .......................................................................................................2
2 World trade............................................................................................................4 3 Global Trade in Services...................................................................................7
4 South Africa's Merchandise Trade ..................................................................8
4.1 South Africa's Aggregate Merchandise Trade..............................................9
4.2 Regional trade...............................................................................................11
4.2.1 Exports to selected regions ..................................................................11
4.2.2 Imports from selected regions..............................................................12
4.3 SA trade with selected partner countries ....................................................13
4.3.1 Exports to selected partner countries ..................................................13
4.3.2 Imports from selected regions..............................................................14
4.4 Trade by products .........................................................................................16
4.4.1 Imports by products ..............................................................................17
5 Growth rates of Merchandise Trade .............................................................19
5.1.1 Growth in Exports..................................................................................19
5.1.2 Growth in Imports..................................................................................21
5.2 South African Merchandise Trade: Conclusions........................................23
6 South Africa's Trade in Services ...................................................................23
SECTION 3: SOUTH AFRICA'S EXPORT PERFORMANCE.................................25
1 South Africa’s merchandise export performance in 2003 at a broad level .............................................................................................................................25
2 The Trade Performance Index (TPI) ...............................................................28
2.1 TPI General Descriptive Indicators.............................................................30
2.2 Position-related Indicators ...........................................................................32
2.3 Change-related Indicators ............................................................................34
2.4 Final Results .................................................................................................39
3 Revealed Comparative Advantage...............................................................39
4 Potential Trade ...................................................................................................46
5 South African Absence from Global Trade in Dynamic Products ...........48
5.1 Global Trends ...............................................................................................49
5.2 South Africa’s Presence and Performance in Dynamic Product Markets 53
ii
5.2.1 South Africa’s Total Market Share in Top 40 Dynamic Products ......53
5.2.2 Growth of South Africa’s Dynamic Products .......................................54
5.3 Conclusion ....................................................................................................55
6 Export Complementarity ..................................................................................56
7 References to sections 1, 2 and 3.................................................................61
List of tables
Table 1: Real GDP growth rates by regions, annual percentage change .................4
Table 2: Leading 50 exporters and importers in world merchandise trade, US$bn, 2003 ........................................................................................................................5
Table 3: World merchandise exports by product, US$ billion, 2003 ..........................7
Table 4: Top SA HS4 products exported ranked by 2003 US$ value......................20
Table 5: Top SA HS4 products imported ranked by 2003 US$ value......................22
Table 6: TPI General Descriptive Indicators, 1997-2001 (US$ ‘000s).....................31
Table 7: TPI Position-related Indicators, 1997-2001 (US$ ‘000s)............................33
Table 8: Change-related Indicators, 1997-2001 (US$ ‘000s)...................................36
Table 9: RCA at HS4 level of product group detail (2004) for top 50 exports .........42
Table 10: RCA at HS4 level of product group detail (2004) with exports ranked from 50 - 100 ........................................................................................................44
Table 11: South Africa's Potential Trade as Measured by the ITC ..........................47
Table 12: Dynamic products in world exports and South Africa’s share 1985-2000 (US$ million) .........................................................................................................50
Table 13: Countries importing South Africa’s top 50 export products......................57
Table 14: Countries importing South Africa’s top 50 export products......................60
List of figures
Figure 1: World GDP growth, 1994-2004.....................................................................3
Figure 2: SA Total Trade as a % of GDP (in 2000 constant prices) and the REER (1995=100) ...........................................................................................................10
Figure 3: South African merchandise trade Rbn constant 2000 pr, 1994 – 2004...11
Figure 4: South African export shares by regions: 1994-1996 and 2002-2004 ......12
Figure 5: South African import shares by regions: 1994-1996 and 2002-2004 ......13
Figure 6: Top 10 markets for South African exports: 1994-1996 and 2002-2004...14
Figure 7: Top 10 import suppliers of South African imports: 1994-1996 and 2002-2004 ......................................................................................................................15
Figure 8: Top 10 export product groups for South Africa: 1994-1996 and 2002-2004 ......................................................................................................................17
Figure 9: Top 10 import product groups for South Africa: 1994-1996 and 2002-2004 ......................................................................................................................18
Figure 10: South Africa's Services Trade as a % of Total Trade (current prices)...24
iii
Figure 11: South Africa’s export performance in global markets for the year 2003 27
Figure 12: Simplified diagram of the decomposition of the change in world trade shares ...................................................................................................................35
Figure 13: Sectoral Trade Performance Index Rankings for SACU, 2001. .............39
Figure 14: Growth in total imports and imports from South Africa for Belgium-Luxemburg, 1998-2002........................................................................................59
T r a d e I n f o r m a t i o n S e r v i c e 2 0 0 5
1
SECTION 1: BACKGROUND
One of the objectives of the Department of Trade and Industry (the dti) is to develop capacities for improving the export performance of businesses. To do so, the dti/TISA require easily accessible practical strategic and analytical tools for identifying growing markets to which South African firms could export. This report will help the dti/TISA and its target group of South African exporters to analyse aspects of the global market in its various facets. In doing so, the dti/TISA will strengthen its role as a provider of strategic tools to be used as a basis for analysing growing global markets for South African exports. A key objective of the report is to assist TISA to become an important source of strategic market information identifying the most lucrative markets and value chains for South African exports.
The Trade Information Service offers three sets of information:
Overview of International Economic Activity and Trade Patterns
Overview of South Africa’s Trade Performance
Sectoral Trade Analysis.
In the next section, we start with an overview of the recent trends in global economic activity and trade, as this creates a backdrop against which we will discuss South Africa's trade performance in section 3. Subsequently, in section 4 we focus in more detail on specific product groups or clusters. The range of product groups discussed is not exhaustive as it is proposed to create a dynamic system in which not only the broad level global and South African overview can be updated on a regular basis but analyses of further product groups or clusters are added over time. We conclude our presentation with the description of an analytical template that considers trade complementarity between South Africa and its most important trading partners. The trade complementarity template is available on-line and generates a graphical representation of various growth and share dimensions of trade.
T r a d e I n f o r m a t i o n S e r v i c e 2 0 0 5
2
SECTION 2: OVERVIEW OF INTERNATIONAL ECONOMIC ACTIVITY AND TRADE PATTERNS
Expanding or potential exporters will (should) want to undertake a composite analysis of a country before deciding whether or not to export there. Such an analysis would likely consist of a review of the particular country’s wealth status, the growth prospects of the country or region, and the general demand for relevant clusters of products in the country. In support of these needs, this section of the report will attempt to provide a high-level overview of the prospects of major global regions as well as developed and developing countries. We also believe that this section will assist TISA in deciding on the regions or countries it should target for broad, generic marketing activities.
In this section we offer a synopsis of global activities in 2003 and 2004, with a view to look forward to what can be expected in 2005 and 2006. International environment has stimulated economic growth in 2004 to growth rates that were last seen in 2000. This strong performance is linked to the nature of economic upswing that was already evident in the first half of 2004. However, there have been signs that this growth may be slowed down in the subsequent years due to the weakening of the US currency, rising oil prices, low interest rates and the possible slowdown in the Chinese economy. Trade in goods performed well, the fastest rate since the year 2000. The developing country trade was faster than in 2003 and was mainly driven by strong export performance in Asia, particularly China. In general, rising global demand has fed though into rapid import growth.
1 World Growth
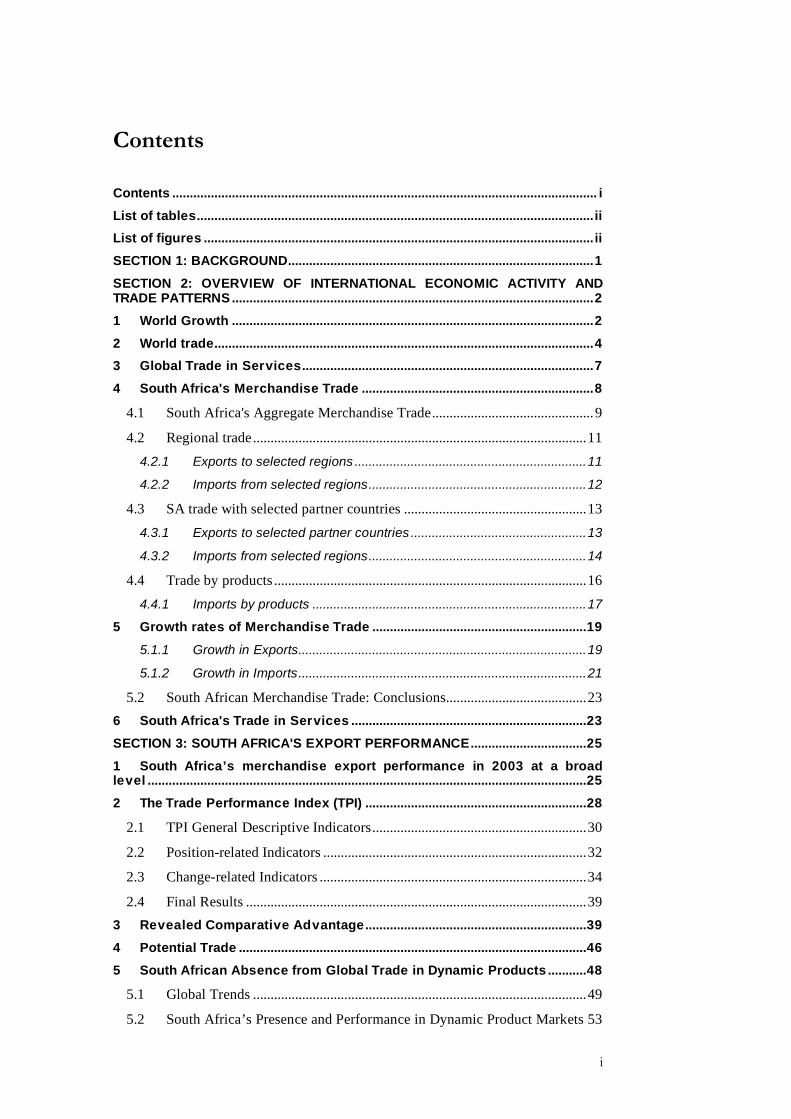
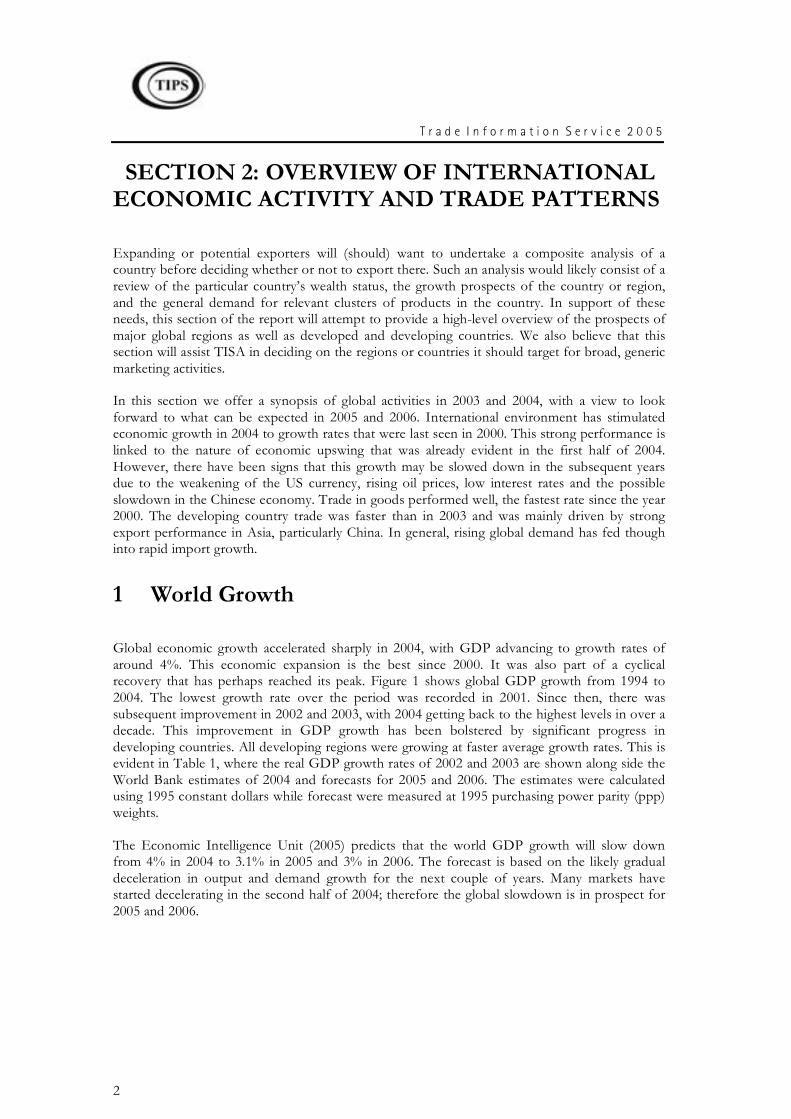
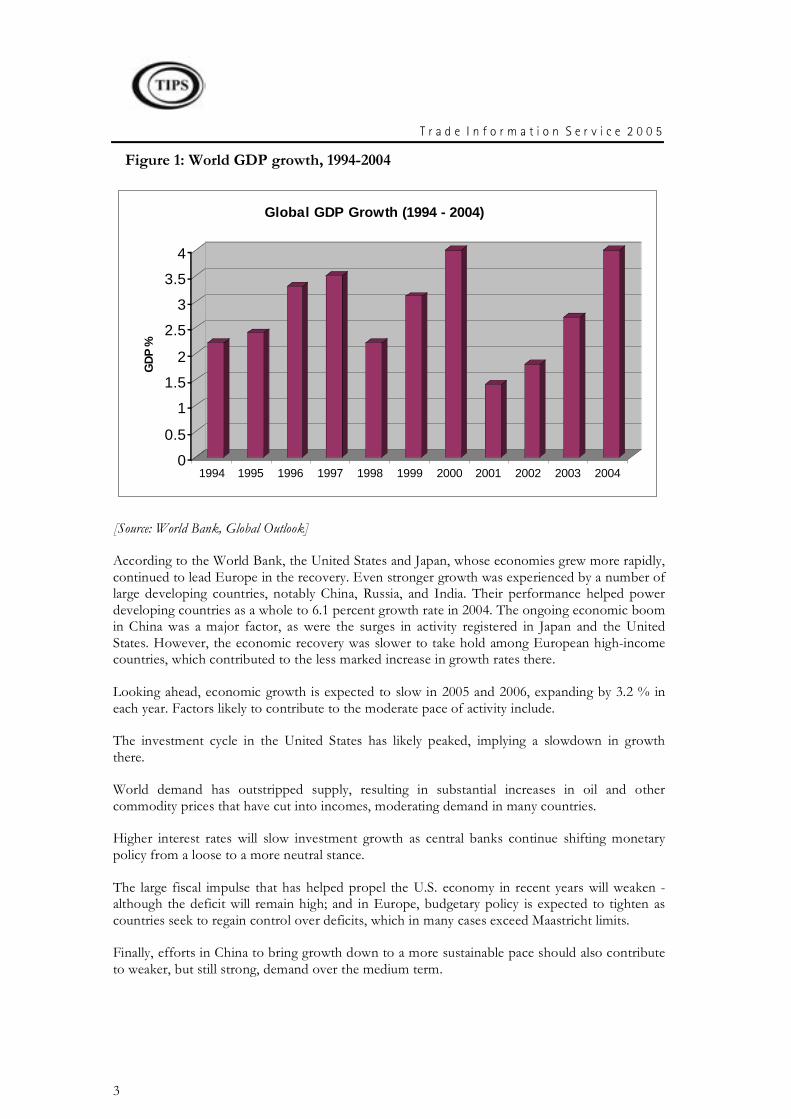
Global economic growth accelerated sharply in 2004, with GDP advancing to growth rates of around 4%. This economic expansion is the best since 2000. It was also part of a cyclical recovery that has perhaps reached its peak. Figure 1 shows global GDP growth from 1994 to 2004. The lowest growth rate over the period was recorded in 2001. Since then, there was subsequent improvement in 2002 and 2003, with 2004 getting back to the highest levels in over a decade. This improvement in GDP growth has been bolstered by significant progress in developing countries. All developing regions were growing at faster average growth rates. This is evident in Table 1, where the real GDP growth rates of 2002 and 2003 are shown along side the World Bank estimates of 2004 and forecasts for 2005 and 2006. The estimates were calculated using 1995 constant dollars while forecast were measured at 1995 purchasing power parity (ppp) weights.
The Economic Intelligence Unit (2005) predicts that the world GDP growth will slow down from 4% in 2004 to 3.1% in 2005 and 3% in 2006. The forecast is based on the likely gradual deceleration in output and demand growth for the next couple of years. Many markets have started decelerating in the second half of 2004; therefore the global slowdown is in prospect for 2005 and 2006.
T r a d e I n f o r m a t i o n S e r v i c e 2 0 0 5
3
Figure 1: World GDP growth, 1994-2004
0
0.5
1
1.5
2
2.5
3
3.5
4
GD
P %
1994 1995 1996 1997 1998 1999 2000 2001 2002 2003 2004
Global GDP Growth (1994 - 2004)
[Source: World Bank, Global Outlook]
According to the World Bank, the United States and Japan, whose economies grew more rapidly, continued to lead Europe in the recovery. Even stronger growth was experienced by a number of large developing countries, notably China, Russia, and India. Their performance helped power developing countries as a whole to 6.1 percent growth rate in 2004. The ongoing economic boom in China was a major factor, as were the surges in activity registered in Japan and the United States. However, the economic recovery was slower to take hold among European high-income countries, which contributed to the less marked increase in growth rates there.
Looking ahead, economic growth is expected to slow in 2005 and 2006, expanding by 3.2 % in each year. Factors likely to contribute to the moderate pace of activity include.
The investment cycle in the United States has likely peaked, implying a slowdown in growth there.
World demand has outstripped supply, resulting in substantial increases in oil and other commodity prices that have cut into incomes, moderating demand in many countries.
Higher interest rates will slow investment growth as central banks continue shifting monetary policy from a loose to a more neutral stance.
The large fiscal impulse that has helped propel the U.S. economy in recent years will weaken -although the deficit will remain high; and in Europe, budgetary policy is expected to tighten as countries seek to regain control over deficits, which in many cases exceed Maastricht limits.
Finally, efforts in China to bring growth down to a more sustainable pace should also contribute to weaker, but still strong, demand over the medium term.
T r a d e I n f o r m a t i o n S e r v i c e 2 0 0 5
4
Table 1: Real GDP growth rates by regions, annual percentage change
Real GDP Growth 2002 2003 2004e1 2005f2 2006f Share of SA exports
World 1.7 2.7 4 3.2 3.2 100 High Income countries 1.3 2.1 3.5 2.7 2.7 49.3 OECD Countries 1.3 2 3.5 2.6 2.6 54.9 Euro Area 0.9 0.5 1.8 2.1 2.3 22.1 Japan -0.3 2.5 4.3 1.8 1.6 7.8 US 1.9 3 4.3 3.2 3.3 9.5 Non-OECD Countries 2.2 3.1 5.9 4.6 4.4 45.1 Developing Countries 3.4 5.2 6.1 5.4 5.1 38.4 East Asia and Pacific 6.7 7.9 7.8 7.1 6.6 15.2 Europe and Central Asia 4.6 5.9 7 5.6 5 36.1 Latin America and Caribbean -0.6 1.6 4.7 3.7 3.7 1.2
Middle East and North Africa 3.2 5.7 4.7 4.7 4.5 100
South Asia 4.6 7.5 6 6.3 6 49.3 Sub-Saharan Africa 3.1 3 3.2 3.6 3.7 54.9
[Source: World Bank, Global Outlook]
2 World trade
World trade growth averaged 10.2 percent in 2004, reflecting rapid increases in industrial production and investment activity. This rapid growth began in 2003 and continued further in 2004. More than 20 percent of the increase in world merchandise trade value was represented by China, where imports are reported to have increased by 32% in 2004, down from 40% in 2003. This is a reflection of both the positive impact of its accession to the WTO and perhaps unsustainable rates of investment and consumption demand.
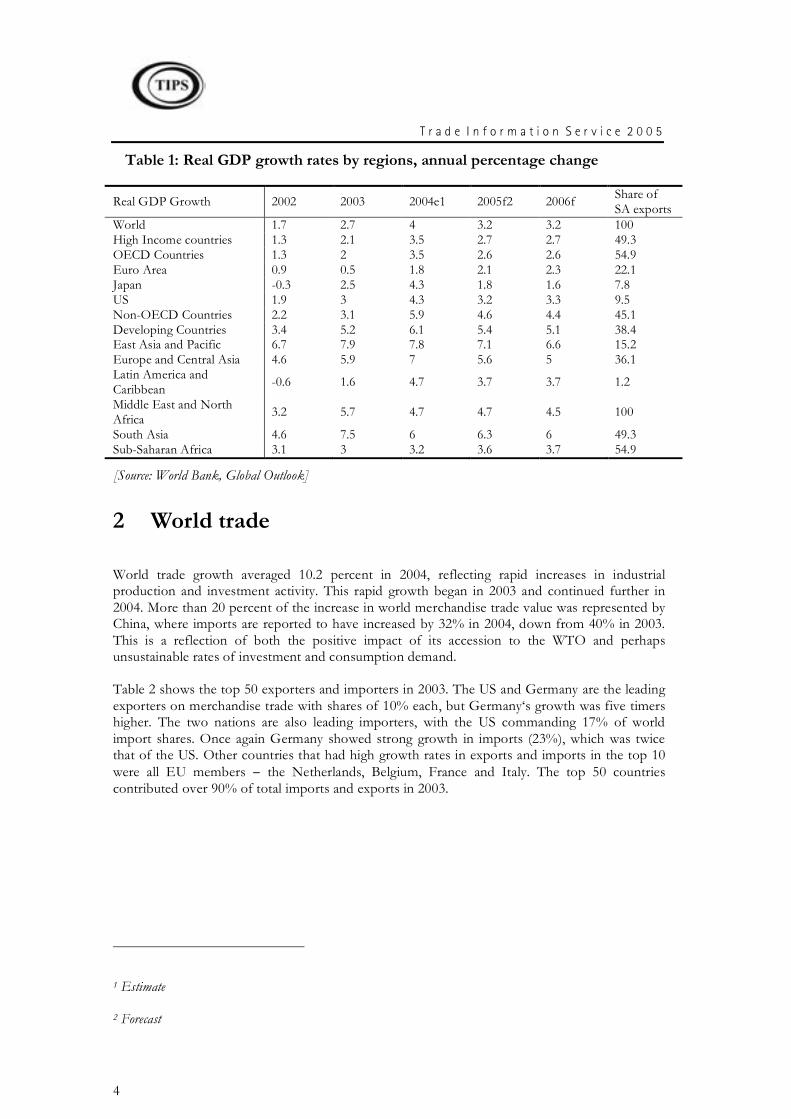
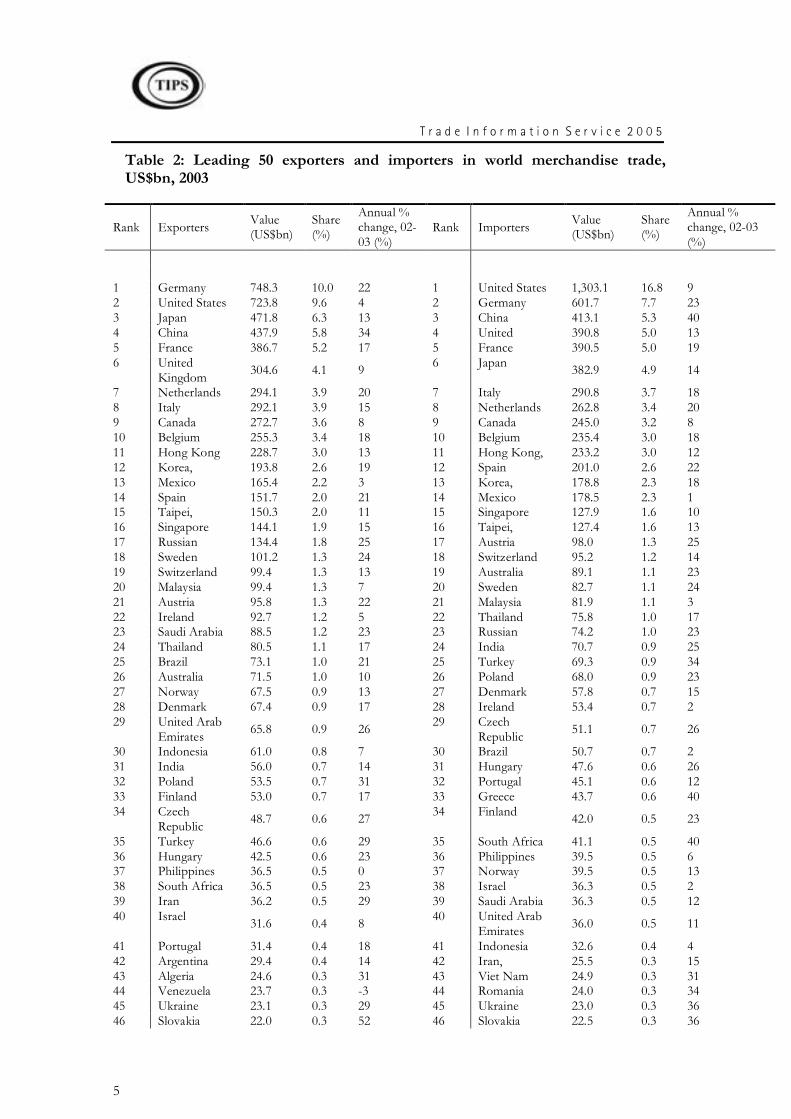
Table 2 shows the top 50 exporters and importers in 2003. The US and Germany are the leading exporters on merchandise trade with shares of 10% each, but Germany‘s growth was five timers higher. The two nations are also leading importers, with the US commanding 17% of world import shares. Once again Germany showed strong growth in imports (23%), which was twice that of the US. Other countries that had high growth rates in exports and imports in the top 10 were all EU members − the Netherlands, Belgium, France and Italy. The top 50 countries contributed over 90% of total imports and exports in 2003.
1 Estimate
2 Forecast
T r a d e I n f o r m a t i o n S e r v i c e 2 0 0 5
5
Table 2: Leading 50 exporters and importers in world merchandise trade, US$bn, 2003
Rank Exporters Value (US$bn)
Share (%)
Annual % change, 02-03 (%)
Rank Importers Value (US$bn)
Share (%)
Annual % change, 02-03 (%)
1 Germany 748.3 10.0 22 1 United States 1,303.1 16.8 9 2 United States 723.8 9.6 4 2 Germany 601.7 7.7 23 3 Japan 471.8 6.3 13 3 China 413.1 5.3 40 4 China 437.9 5.8 34 4 United 390.8 5.0 13 5 France 386.7 5.2 17 5 France 390.5 5.0 19 6 United
Kingdom 304.6 4.1 9 6 Japan 382.9 4.9 14
7 Netherlands 294.1 3.9 20 7 Italy 290.8 3.7 18 8 Italy 292.1 3.9 15 8 Netherlands 262.8 3.4 20 9 Canada 272.7 3.6 8 9 Canada 245.0 3.2 8 10 Belgium 255.3 3.4 18 10 Belgium 235.4 3.0 18 11 Hong Kong 228.7 3.0 13 11 Hong Kong, 233.2 3.0 12 12 Korea, 193.8 2.6 19 12 Spain 201.0 2.6 22 13 Mexico 165.4 2.2 3 13 Korea, 178.8 2.3 18 14 Spain 151.7 2.0 21 14 Mexico 178.5 2.3 1 15 Taipei, 150.3 2.0 11 15 Singapore 127.9 1.6 10 16 Singapore 144.1 1.9 15 16 Taipei, 127.4 1.6 13 17 Russian 134.4 1.8 25 17 Austria 98.0 1.3 25 18 Sweden 101.2 1.3 24 18 Switzerland 95.2 1.2 14 19 Switzerland 99.4 1.3 13 19 Australia 89.1 1.1 23 20 Malaysia 99.4 1.3 7 20 Sweden 82.7 1.1 24 21 Austria 95.8 1.3 22 21 Malaysia 81.9 1.1 3 22 Ireland 92.7 1.2 5 22 Thailand 75.8 1.0 17 23 Saudi Arabia 88.5 1.2 23 23 Russian 74.2 1.0 23 24 Thailand 80.5 1.1 17 24 India 70.7 0.9 25 25 Brazil 73.1 1.0 21 25 Turkey 69.3 0.9 34 26 Australia 71.5 1.0 10 26 Poland 68.0 0.9 23 27 Norway 67.5 0.9 13 27 Denmark 57.8 0.7 15 28 Denmark 67.4 0.9 17 28 Ireland 53.4 0.7 2 29 United Arab
Emirates 65.8 0.9 26 29 Czech Republic 51.1 0.7 26
30 Indonesia 61.0 0.8 7 30 Brazil 50.7 0.7 2 31 India 56.0 0.7 14 31 Hungary 47.6 0.6 26 32 Poland 53.5 0.7 31 32 Portugal 45.1 0.6 12 33 Finland 53.0 0.7 17 33 Greece 43.7 0.6 40 34 Czech
Republic 48.7 0.6 27 34 Finland 42.0 0.5 23
35 Turkey 46.6 0.6 29 35 South Africa 41.1 0.5 40 36 Hungary 42.5 0.6 23 36 Philippines 39.5 0.5 6 37 Philippines 36.5 0.5 0 37 Norway 39.5 0.5 13 38 South Africa 36.5 0.5 23 38 Israel 36.3 0.5 2 39 Iran 36.2 0.5 29 39 Saudi Arabia 36.3 0.5 12 40 Israel 31.6 0.4 8 40 United Arab
Emirates 36.0 0.5 11
41 Portugal 31.4 0.4 18 41 Indonesia 32.6 0.4 4 42 Argentina 29.4 0.4 14 42 Iran, 25.5 0.3 15 43 Algeria 24.6 0.3 31 43 Viet Nam 24.9 0.3 31 44 Venezuela 23.7 0.3 -3 44 Romania 24.0 0.3 34 45 Ukraine 23.1 0.3 29 45 Ukraine 23.0 0.3 36 46 Slovakia 22.0 0.3 52 46 Slovakia 22.5 0.3 36
T r a d e I n f o r m a t i o n S e r v i c e 2 0 0 5
6
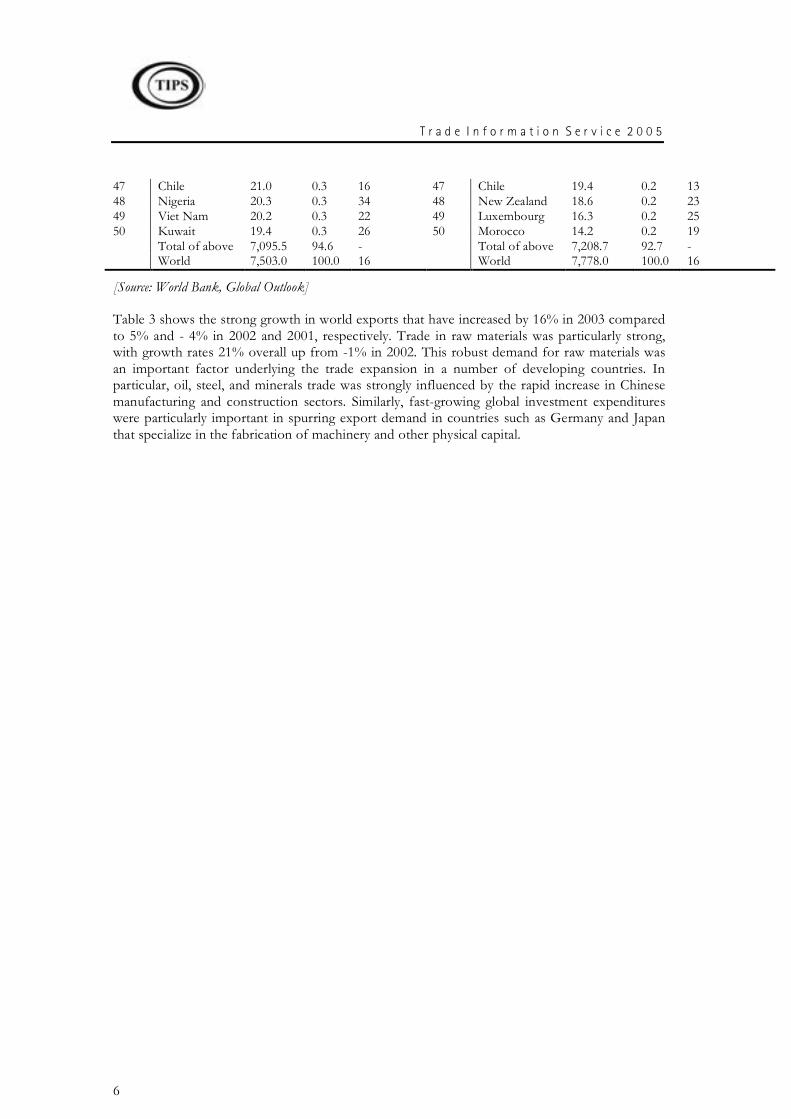
47 Chile 21.0 0.3 16 47 Chile 19.4 0.2 13 48 Nigeria 20.3 0.3 34 48 New Zealand 18.6 0.2 23 49 Viet Nam 20.2 0.3 22 49 Luxembourg 16.3 0.2 25 50 Kuwait 19.4 0.3 26 50 Morocco 14.2 0.2 19 Total of above 7,095.5 94.6 - Total of above 7,208.7 92.7 - World 7,503.0 100.0 16 World 7,778.0 100.0 16
[Source: World Bank, Global Outlook]
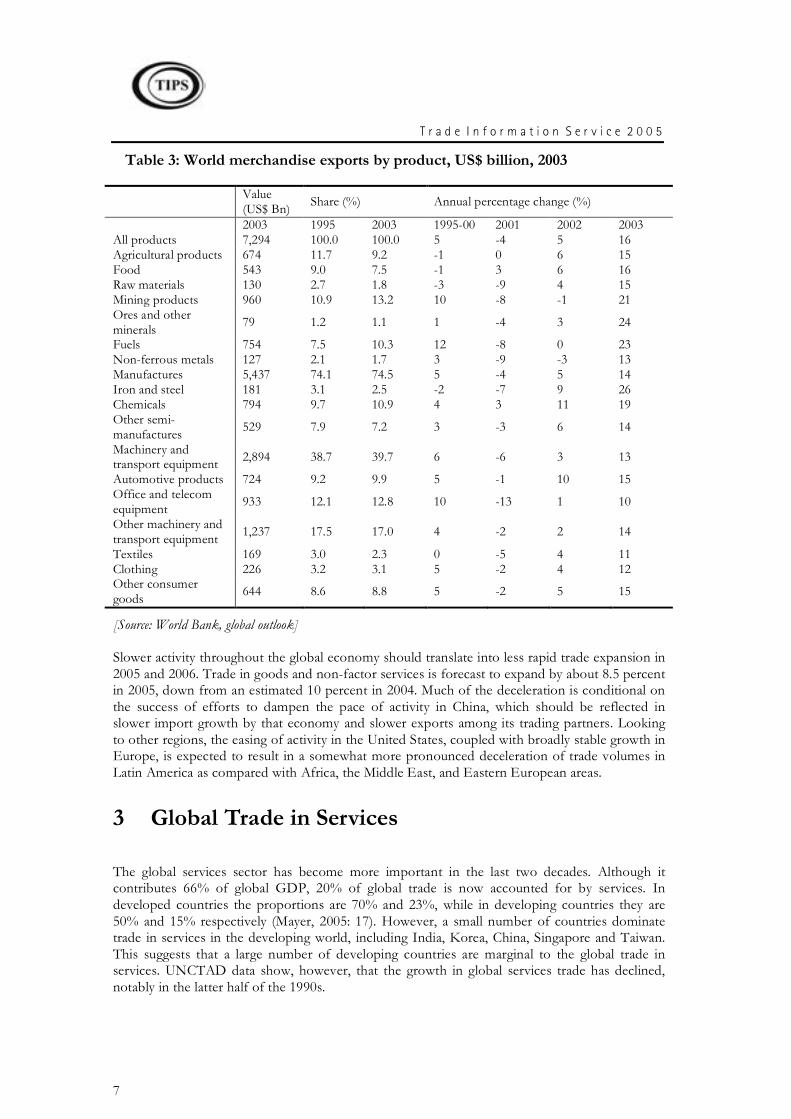
Table 3 shows the strong growth in world exports that have increased by 16% in 2003 compared to 5% and - 4% in 2002 and 2001, respectively. Trade in raw materials was particularly strong, with growth rates 21% overall up from -1% in 2002. This robust demand for raw materials was an important factor underlying the trade expansion in a number of developing countries. In particular, oil, steel, and minerals trade was strongly influenced by the rapid increase in Chinese manufacturing and construction sectors. Similarly, fast-growing global investment expenditures were particularly important in spurring export demand in countries such as Germany and Japan that specialize in the fabrication of machinery and other physical capital.
T r a d e I n f o r m a t i o n S e r v i c e 2 0 0 5
7
Table 3: World merchandise exports by product, US$ billion, 2003
Value (US$ Bn) Share (%) Annual percentage change (%)
2003 1995 2003 1995-00 2001 2002 2003 All products 7,294 100.0 100.0 5 -4 5 16 Agricultural products 674 11.7 9.2 -1 0 6 15 Food 543 9.0 7.5 -1 3 6 16 Raw materials 130 2.7 1.8 -3 -9 4 15 Mining products 960 10.9 13.2 10 -8 -1 21 Ores and other minerals 79 1.2 1.1 1 -4 3 24
Fuels 754 7.5 10.3 12 -8 0 23 Non-ferrous metals 127 2.1 1.7 3 -9 -3 13 Manufactures 5,437 74.1 74.5 5 -4 5 14 Iron and steel 181 3.1 2.5 -2 -7 9 26 Chemicals 794 9.7 10.9 4 3 11 19 Other semi-manufactures 529 7.9 7.2 3 -3 6 14
Machinery and transport equipment 2,894 38.7 39.7 6 -6 3 13
Automotive products 724 9.2 9.9 5 -1 10 15 Office and telecom equipment 933 12.1 12.8 10 -13 1 10
Other machinery and transport equipment 1,237 17.5 17.0 4 -2 2 14
Textiles 169 3.0 2.3 0 -5 4 11 Clothing 226 3.2 3.1 5 -2 4 12 Other consumer goods 644 8.6 8.8 5 -2 5 15
[Source: World Bank, global outlook]
Slower activity throughout the global economy should translate into less rapid trade expansion in 2005 and 2006. Trade in goods and non-factor services is forecast to expand by about 8.5 percent in 2005, down from an estimated 10 percent in 2004. Much of the deceleration is conditional on the success of efforts to dampen the pace of activity in China, which should be reflected in slower import growth by that economy and slower exports among its trading partners. Looking to other regions, the easing of activity in the United States, coupled with broadly stable growth in Europe, is expected to result in a somewhat more pronounced deceleration of trade volumes in Latin America as compared with Africa, the Middle East, and Eastern European areas.
3 Global Trade in Services
The global services sector has become more important in the last two decades. Although it contributes 66% of global GDP, 20% of global trade is now accounted for by services. In developed countries the proportions are 70% and 23%, while in developing countries they are 50% and 15% respectively (Mayer, 2005: 17). However, a small number of countries dominate trade in services in the developing world, including India, Korea, China, Singapore and Taiwan. This suggests that a large number of developing countries are marginal to the global trade in services. UNCTAD data show, however, that the growth in global services trade has declined, notably in the latter half of the 1990s.
T r a d e I n f o r m a t i o n S e r v i c e 2 0 0 5
8
Travel related services remain the most important component of global trade in services followed by other transport and business services. The latter includes computer and software
development. Developing countries appear to be focussing more on the three above mentioned sectors, while developed countries also focus on other services trade such as financial, insurance, communication and royalties and licence fees (Mayer, 2005: 20). Other services sectors that have grown in significance recently are construction services and health services. For both sub-sectors, the share of developing countries is relatively small, although the latter has the potential to be combined with tourism.
In 2004, the value of world services trade rose by 16%, to $2.10 trillion (World Bank).. One major services category, transportation is reported to have recorded an exceptionally strong performance in 2004.. Trade in international tourism seems to be on a rebound. However, the travel and tourism industry is among the most sensitive to external shocks. The Economist Intelligence Unit (2005) expects growth in the sector.
Services trade growth differed across regions in 2004. It is estimated that above global average growth was experienced in the Commonwealth of Independent States (CIS) and Asia (for both exports and imports). North and South America services trade was less dynamic than world trade. However, in all four regions the growth in the dollar value in 2004 exceeded that in 2003, for both exports and imports. In Europe, the world’s largest services trader, however, exports and imports of services expanded less rapidly in 2004 than in the preceding year.
4 South Africa's Merchandise Trade
During the last decade, trade policy in South Africa has undergone several changes. These include multilateral reductions in tariffs and subsidies through the country’s World Trade Organisation (WTO) commitments, the signing of two significant Free Trade Agreements (FTAs), and more recently several negotiations around future commitments to liberalisation both at the multilateral level as well as the regional levels.
The transition from import substitution industrialization to export orientation posed specific challenges for South Africa. The most important was the extent to which the policy environment gave firms incentives to export. The last two decades can be described as a period that was aimed at creating an environment to improve the prices of tradeables relative to non-tradeables. This was achieved primarily through a real reduction in tariffs, to an extent by exchange rate depreciation, a reduction in tariffs, and - in some cases-by sector specific instruments to create incentives beyond tariff liberalisation for exports. Trade liberalisation in pre-1990 South Africa was based primarily on export promotion measures and less on tariff reforms or a competitive real exchange rate. It is essentially in the 1990s that the combination of these three instruments played a role creating an environment conducive to exports.
In relation to subsidies, there were several policies that reduced the anti-export bias that firms faced in the 1990s. Most notable was the General Export Incentive Scheme (GEIS) in April 1990. GEIS was designed as an economy-wide package, based on value added and local content, and offered considerable incentive to export. This was, in accordance with South Africa’s WTO commitment, phased out in 1995. This was turned out to be a significant policy landmark as it meant that the government had to rely, essentially on tariffs as an instrument used in reducing anti-export bias while it phased out most demand side of the subsidy schemes in the economy. The phase-out of price distorting subsidies coincided with the introduction of WTO compatible supply-side incentives. These were essentially grants for research and development, technological innovation and skills development. There, are however, two particular sectors, in the economy
T r a d e I n f o r m a t i o n S e r v i c e 2 0 0 5
9
that are notable for the implicit subsidies which they enjoy, namely:-clothing and textiles; and the motor vehicles and components industry.
The Duty Credit Certificate Scheme (DCCS), which targets the clothing and textile sector, was introduced in 1993 and remains in place until 2005. It offers duty credit certificates to qualifying exporters, and can be used to access imported inputs. DCCS can be claimed for up to 35 % of the value of exports with the highest value for clothing and the lowest for yarn (8 % to 12 %). Other salient features of the DCCS are that they are only eligible for offsetting duties on the importation of similar products to those exported. It gives firms that export the advantage of sourcing inputs at prices close to international levels, while providing high levels of protection thereby placing a limit on the extent to which firms can become efficient. The Motor Industry Development Program (MIDP), introduced in 1995, is a system of incentives based on selective import duty reductions, and which provides substantial subsidies to investment and exports in return for the production and sale of motor vehicles in the protected domestic market. Essentially, the MIDP allows firms using local content in exports to import duty free permits equivalent to local content value exports. The MIDP can be described as an implicit subsidy whereby firms who export are able to source motor-vehicles at internationally competitive prices and sell vehicles in the local market at the international price plus the tariff.3 In addition to all the above mentioned schemes, the DTI offers refund of the duties paid for inputs used in export.
4.1 South Africa's Aggregate Merchandise Trade
Given this trade policy context, we can now proceed with an overview of South Africa's trade performance. An acceleration of South Africa’s trade began in 1994 when the government started to actively pursue a programme of trade liberalization reforms, particularly in dismantling import barriers and phasing out its system of export subsidies. To evaluate the effect of these reforms, we compare South Africa trade flows in the mid-1990s and recent trade data by examining the average shares over three years for both periods, i.e 1994 -1996 and 2002-2004.
But first, we look at South Africa's total trade over the last decade. Total trade, i.e., total imports plus total exports, including merchandise and services, as a proportion of GDP increased rapidly until the late 1990s on the back of considerable exchange rate devaluation. After 1998, the casual relationship between the Real Effective Exchange Rate (REER) and total trade as a proportion of GDP breaks down and other factors appear to be asserting an increasing influence on trade performance.
3 For a critical analysis of these schemes see Flatters (2002) and Kaplan (2003).
T r a d e I n f o r m a t i o n S e r v i c e 2 0 0 5
10
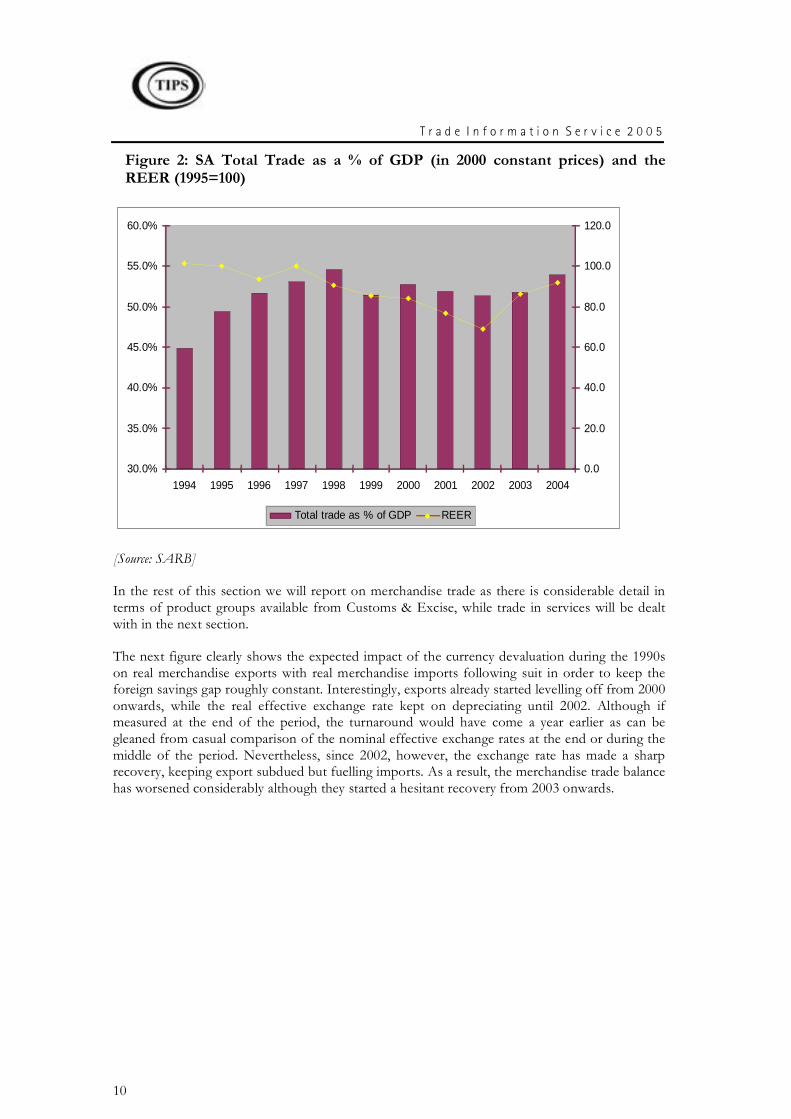
Figure 2: SA Total Trade as a % of GDP (in 2000 constant prices) and the REER (1995=100)
30.0%
35.0%
40.0%
45.0%
50.0%
55.0%
60.0%
1994 1995 1996 1997 1998 1999 2000 2001 2002 2003 2004
0.0
20.0
40.0
60.0
80.0
100.0
120.0
Total trade as % of GDP REER
[Source: SARB]
In the rest of this section we will report on merchandise trade as there is considerable detail in terms of product groups available from Customs & Excise, while trade in services will be dealt with in the next section.
The next figure clearly shows the expected impact of the currency devaluation during the 1990s on real merchandise exports with real merchandise imports following suit in order to keep the foreign savings gap roughly constant. Interestingly, exports already started levelling off from 2000 onwards, while the real effective exchange rate kept on depreciating until 2002. Although if measured at the end of the period, the turnaround would have come a year earlier as can be gleaned from casual comparison of the nominal effective exchange rates at the end or during the middle of the period. Nevertheless, since 2002, however, the exchange rate has made a sharp recovery, keeping export subdued but fuelling imports. As a result, the merchandise trade balance has worsened considerably although they started a hesitant recovery from 2003 onwards.
T r a d e I n f o r m a t i o n S e r v i c e 2 0 0 5
11
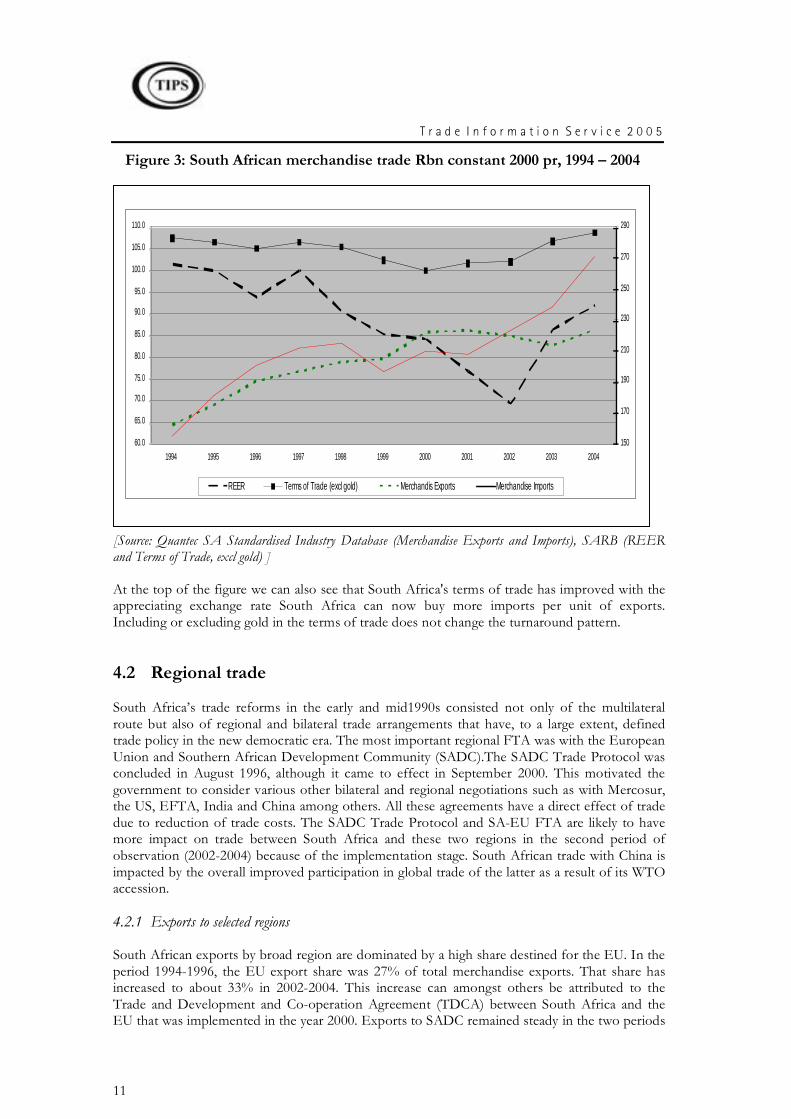
Figure 3: South African merchandise trade Rbn constant 2000 pr, 1994 – 2004
[Source: Quantec SA Standardised Industry Database (Merchandise Exports and Imports), SARB (REER and Terms of Trade, excl gold) ]
At the top of the figure we can also see that South Africa's terms of trade has improved with the appreciating exchange rate South Africa can now buy more imports per unit of exports. Including or excluding gold in the terms of trade does not change the turnaround pattern.
4.2 Regional trade
South Africa’s trade reforms in the early and mid1990s consisted not only of the multilateral route but also of regional and bilateral trade arrangements that have, to a large extent, defined trade policy in the new democratic era. The most important regional FTA was with the European Union and Southern African Development Community (SADC).The SADC Trade Protocol was concluded in August 1996, although it came to effect in September 2000. This motivated the government to consider various other bilateral and regional negotiations such as with Mercosur, the US, EFTA, India and China among others. All these agreements have a direct effect of trade due to reduction of trade costs. The SADC Trade Protocol and SA-EU FTA are likely to have more impact on trade between South Africa and these two regions in the second period of observation (2002-2004) because of the implementation stage. South African trade with China is impacted by the overall improved participation in global trade of the latter as a result of its WTO accession.
4.2.1 Exports to selected regions
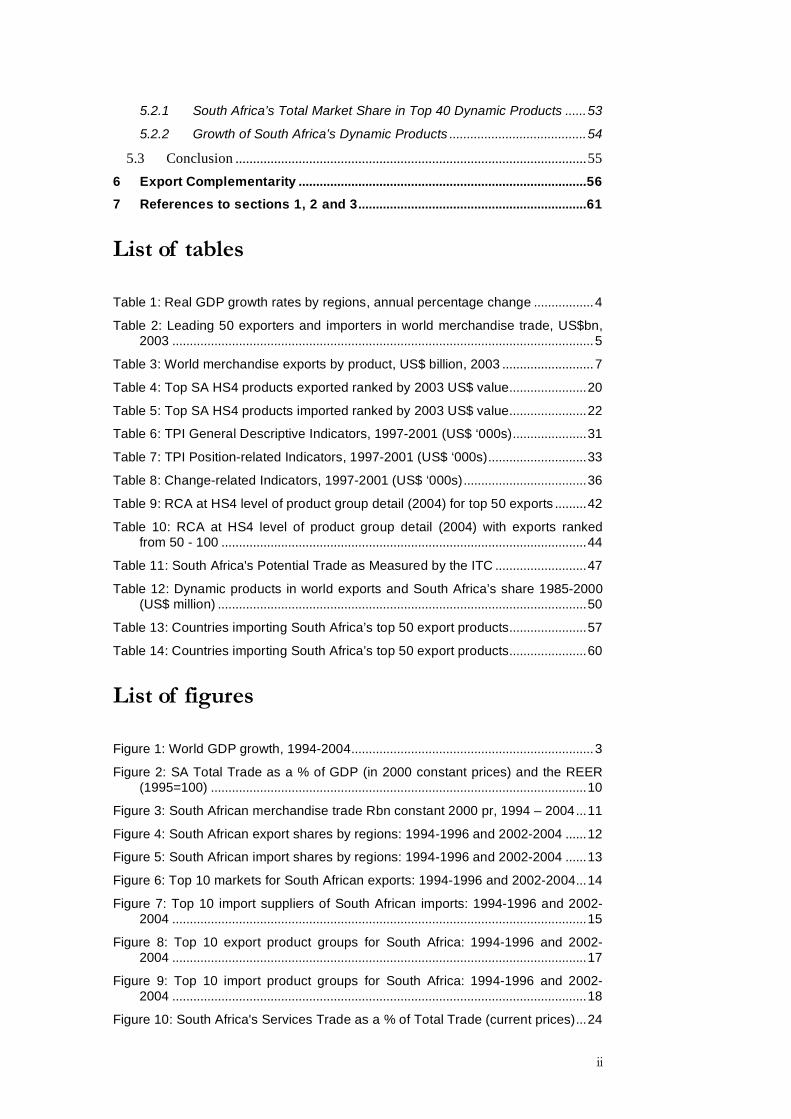
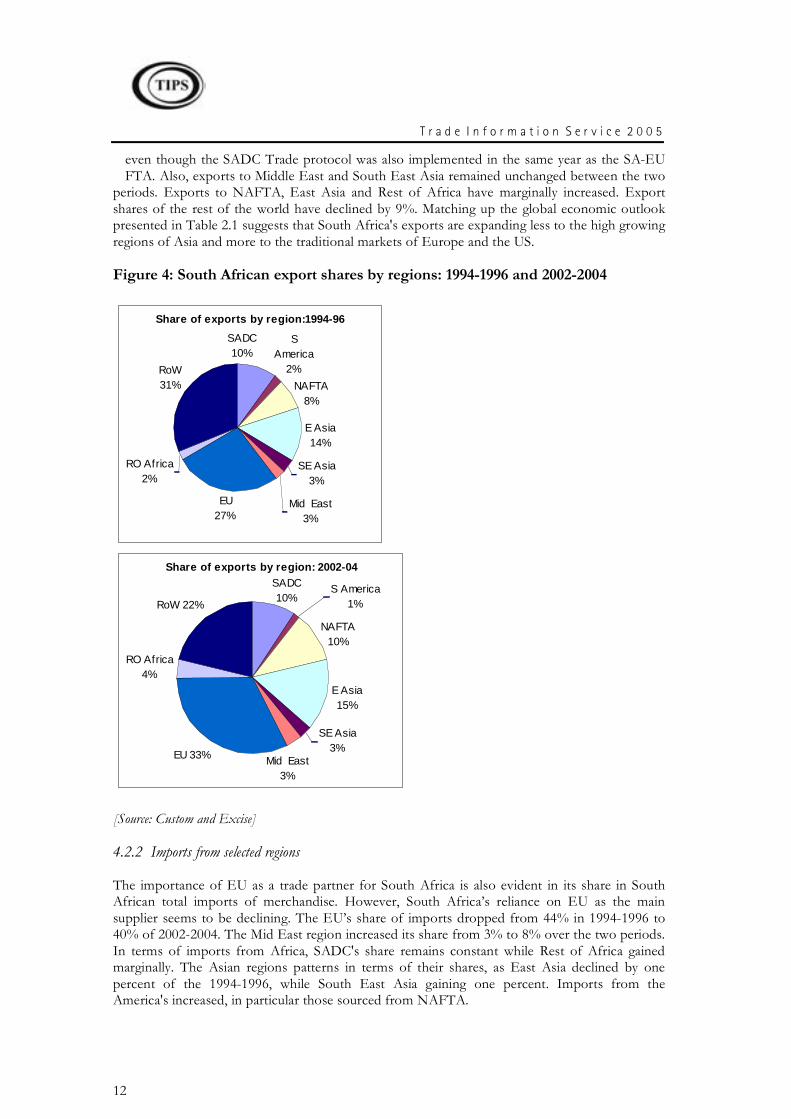
South African exports by broad region are dominated by a high share destined for the EU. In the period 1994-1996, the EU export share was 27% of total merchandise exports. That share has increased to about 33% in 2002-2004. This increase can amongst others be attributed to the Trade and Development and Co-operation Agreement (TDCA) between South Africa and the EU that was implemented in the year 2000. Exports to SADC remained steady in the two periods
60.0
65.0
70.0
75.0
80.0
85.0
90.0
95.0
100.0
105.0
110.0
1994 1995 1996 1997 1998 1999 2000 2001 2002 2003 2004
150
170
190
210
230
250
270
290
REER Terms of Trade (excl gold) Merchandis Exports Merchandise Imports
T r a d e I n f o r m a t i o n S e r v i c e 2 0 0 5
12
even though the SADC Trade protocol was also implemented in the same year as the SA-EU FTA. Also, exports to Middle East and South East Asia remained unchanged between the two
periods. Exports to NAFTA, East Asia and Rest of Africa have marginally increased. Export shares of the rest of the world have declined by 9%. Matching up the global economic outlook presented in Table 2.1 suggests that South Africa's exports are expanding less to the high growing regions of Asia and more to the traditional markets of Europe and the US.
Figure 4: South African export shares by regions: 1994-1996 and 2002-2004
Share of exports by region:1994-96
SE Asia3%
Mid East3%
RoW31%
SADC10%
E Asia 14%
NAFTA 8%
S America
2%
RO Africa2%
EU27%
Share of exports by region: 2002-04
E Asia15%
RO Africa4%
EU 33%
RoW 22%
S America1%
SADC10%
NAFTA10%
Mid East3%
SE Asia 3%
[Source: Custom and Excise]
4.2.2 Imports from selected regions
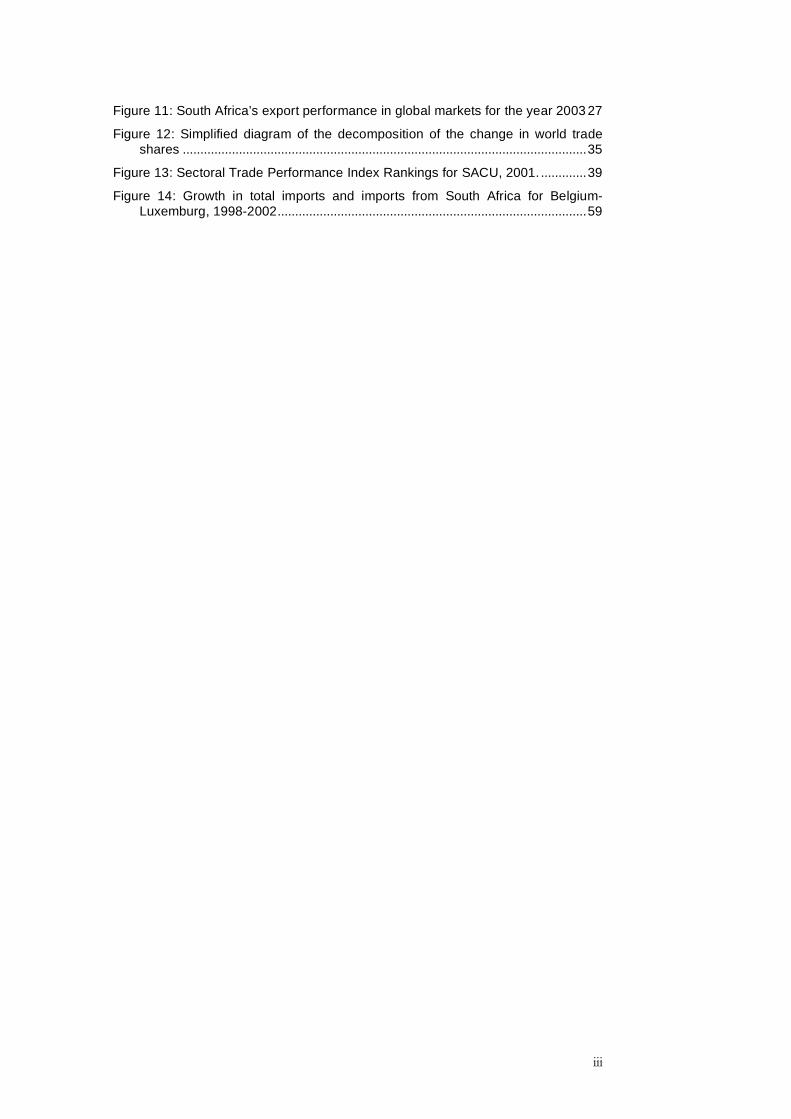
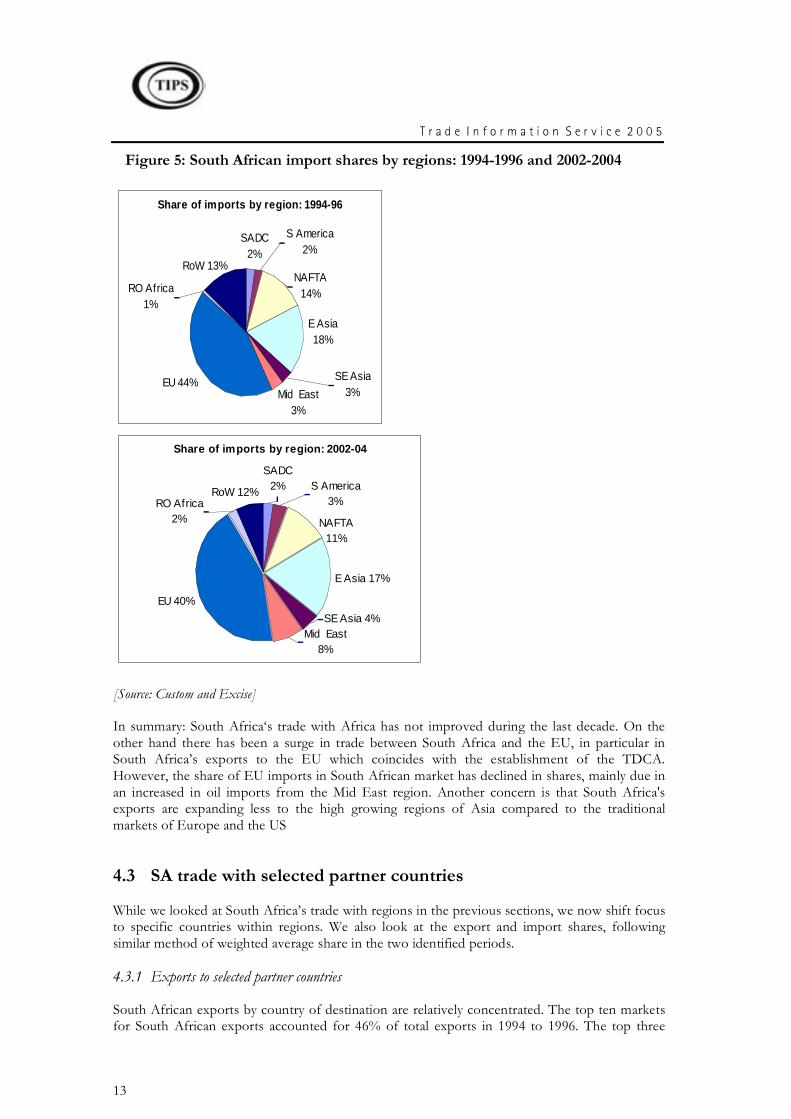
The importance of EU as a trade partner for South Africa is also evident in its share in South African total imports of merchandise. However, South Africa’s reliance on EU as the main supplier seems to be declining. The EU’s share of imports dropped from 44% in 1994-1996 to 40% of 2002-2004. The Mid East region increased its share from 3% to 8% over the two periods. In terms of imports from Africa, SADC's share remains constant while Rest of Africa gained marginally. The Asian regions patterns in terms of their shares, as East Asia declined by one percent of the 1994-1996, while South East Asia gaining one percent. Imports from the America's increased, in particular those sourced from NAFTA.
T r a d e I n f o r m a t i o n S e r v i c e 2 0 0 5
13
Figure 5: South African import shares by regions: 1994-1996 and 2002-2004
Share of imports by region: 1994-96
SADC2%
RO Africa1%
S America 2%
EU 44%
NAFTA 14%
SE Asia 3%Mid East
3%
RoW 13%
E Asia 18%
Share of imports by region: 2002-04
NAFTA11%
S America 3%
SADC2%
EU 40%
RO Africa2%
RoW 12%
Mid East8%
SE Asia 4%
E Asia 17%
[Source: Custom and Excise]
In summary: South Africa‘s trade with Africa has not improved during the last decade. On the other hand there has been a surge in trade between South Africa and the EU, in particular in South Africa’s exports to the EU which coincides with the establishment of the TDCA. However, the share of EU imports in South African market has declined in shares, mainly due in an increased in oil imports from the Mid East region. Another concern is that South Africa's exports are expanding less to the high growing regions of Asia compared to the traditional markets of Europe and the US
4.3 SA trade with selected partner countries
While we looked at South Africa’s trade with regions in the previous sections, we now shift focus to specific countries within regions. We also look at the export and import shares, following similar method of weighted average share in the two identified periods.
4.3.1 Exports to selected partner countries
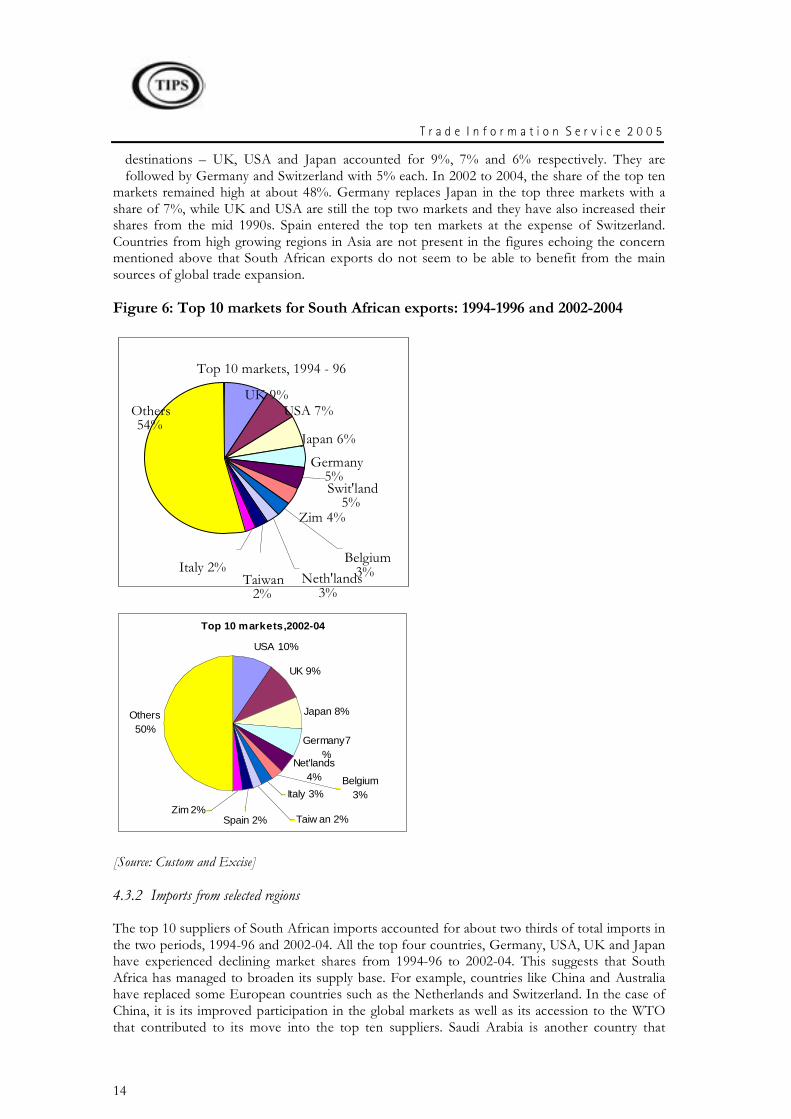
South African exports by country of destination are relatively concentrated. The top ten markets for South African exports accounted for 46% of total exports in 1994 to 1996. The top three
T r a d e I n f o r m a t i o n S e r v i c e 2 0 0 5
14
destinations – UK, USA and Japan accounted for 9%, 7% and 6% respectively. They are followed by Germany and Switzerland with 5% each. In 2002 to 2004, the share of the top ten
markets remained high at about 48%. Germany replaces Japan in the top three markets with a share of 7%, while UK and USA are still the top two markets and they have also increased their shares from the mid 1990s. Spain entered the top ten markets at the expense of Switzerland. Countries from high growing regions in Asia are not present in the figures echoing the concern mentioned above that South African exports do not seem to be able to benefit from the main sources of global trade expansion.
Figure 6: Top 10 markets for South African exports: 1994-1996 and 2002-2004
Top 10 markets,2002-04
Others50%
Germany7%
Japan 8%
UK 9%
USA 10%
Net'lands 4% Belgium
3%Italy 3%
Taiw an 2%Spain 2%Zim 2%
[Source: Custom and Excise]
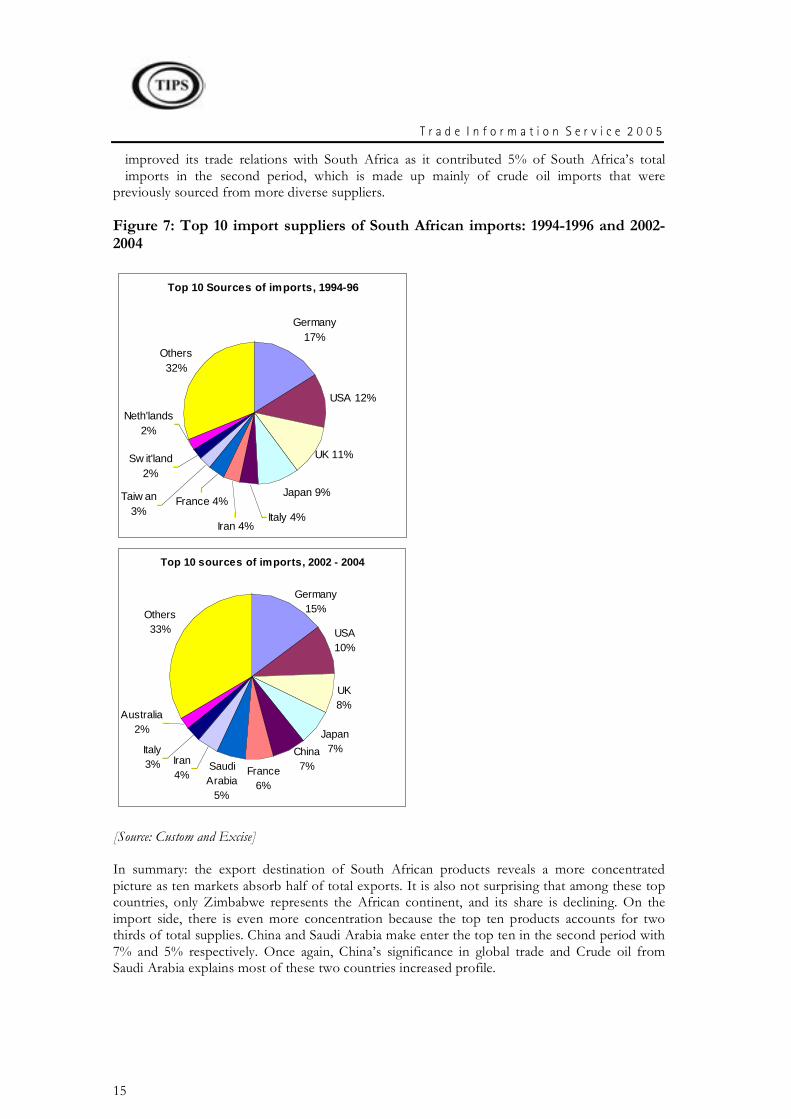
4.3.2 Imports from selected regions
The top 10 suppliers of South African imports accounted for about two thirds of total imports in the two periods, 1994-96 and 2002-04. All the top four countries, Germany, USA, UK and Japan have experienced declining market shares from 1994-96 to 2002-04. This suggests that South Africa has managed to broaden its supply base. For example, countries like China and Australia have replaced some European countries such as the Netherlands and Switzerland. In the case of China, it is its improved participation in the global markets as well as its accession to the WTO that contributed to its move into the top ten suppliers. Saudi Arabia is another country that
Top 10 markets, 1994 - 96
Neth'lands 3%
Taiwan 2%
Italy 2%
Germany 5%
Japan 6%
Belgium 3%
Zim 4%
UK 9% USA 7%
Swit'land 5%
Others 54%
T r a d e I n f o r m a t i o n S e r v i c e 2 0 0 5
15
improved its trade relations with South Africa as it contributed 5% of South Africa’s total imports in the second period, which is made up mainly of crude oil imports that were
previously sourced from more diverse suppliers.
Figure 7: Top 10 import suppliers of South African imports: 1994-1996 and 2002-2004
Top 10 Sources of imports, 1994-96
Japan 9%
USA 12%
Germany 17%
Others 32%
Italy 4%Iran 4%
France 4%Taiw an 3%
Sw it'land2%
Neth'lands2%
UK 11%
Top 10 sources of imports, 2002 - 2004
USA10%
UK8%
Japan7%
France6%
Others33%
China7%
Germany15%
Iran 4%
Italy3%
Australia2%
Saudi Arabia
5%
[Source: Custom and Excise]
In summary: the export destination of South African products reveals a more concentrated picture as ten markets absorb half of total exports. It is also not surprising that among these top countries, only Zimbabwe represents the African continent, and its share is declining. On the import side, there is even more concentration because the top ten products accounts for two thirds of total supplies. China and Saudi Arabia make enter the top ten in the second period with 7% and 5% respectively. Once again, China’s significance in global trade and Crude oil from Saudi Arabia explains most of these two countries increased profile.
T r a d e I n f o r m a t i o n S e r v i c e 2 0 0 5
16
4.4 Trade by products
This section examines South African trade from a product’s perspective. The broad category of HS 2 products will be the focus, while the period of observation is 1994 – 1996 compare with 2002-2004. The weighted average shares of the products are calculated over these two periods. As before, the section is subdivided into exports and imports.
Exports by products
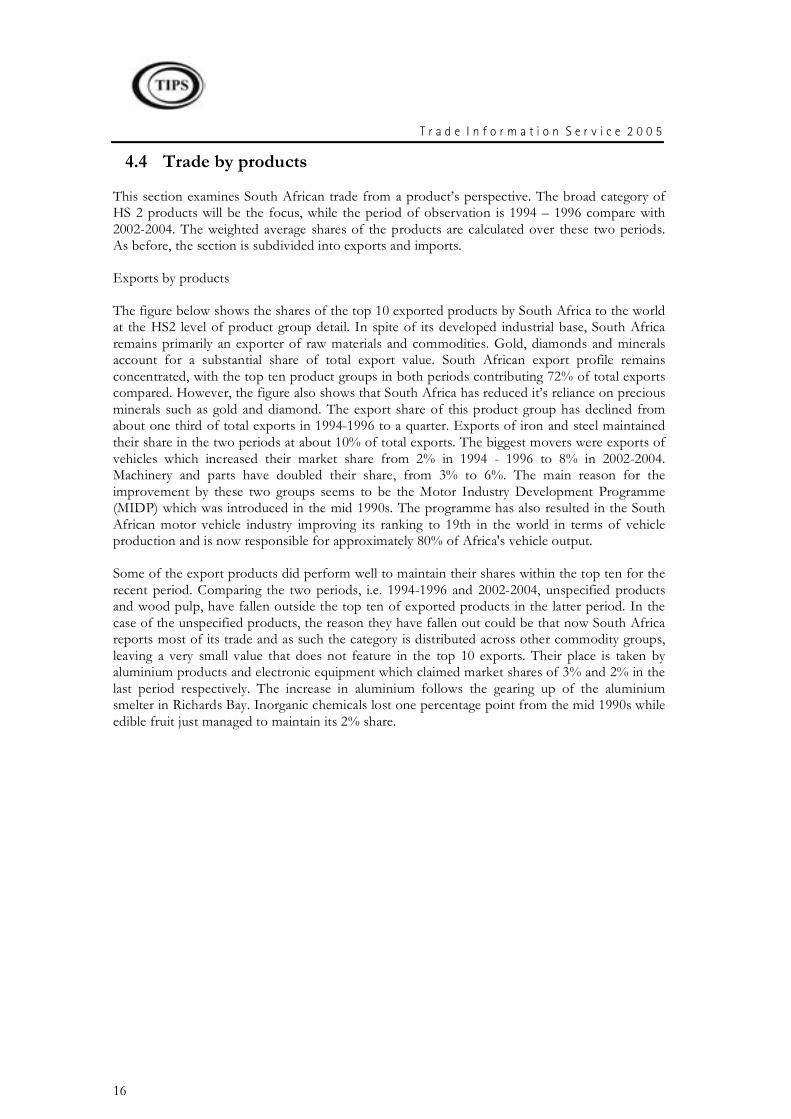
The figure below shows the shares of the top 10 exported products by South Africa to the world at the HS2 level of product group detail. In spite of its developed industrial base, South Africa remains primarily an exporter of raw materials and commodities. Gold, diamonds and minerals account for a substantial share of total export value. South African export profile remains concentrated, with the top ten product groups in both periods contributing 72% of total exports compared. However, the figure also shows that South Africa has reduced it’s reliance on precious minerals such as gold and diamond. The export share of this product group has declined from about one third of total exports in 1994-1996 to a quarter. Exports of iron and steel maintained their share in the two periods at about 10% of total exports. The biggest movers were exports of vehicles which increased their market share from 2% in 1994 - 1996 to 8% in 2002-2004. Machinery and parts have doubled their share, from 3% to 6%. The main reason for the improvement by these two groups seems to be the Motor Industry Development Programme (MIDP) which was introduced in the mid 1990s. The programme has also resulted in the South African motor vehicle industry improving its ranking to 19th in the world in terms of vehicle production and is now responsible for approximately 80% of Africa's vehicle output.
Some of the export products did perform well to maintain their shares within the top ten for the recent period. Comparing the two periods, i.e. 1994-1996 and 2002-2004, unspecified products and wood pulp, have fallen outside the top ten of exported products in the latter period. In the case of the unspecified products, the reason they have fallen out could be that now South Africa reports most of its trade and as such the category is distributed across other commodity groups, leaving a very small value that does not feature in the top 10 exports. Their place is taken by aluminium products and electronic equipment which claimed market shares of 3% and 2% in the last period respectively. The increase in aluminium follows the gearing up of the aluminium smelter in Richards Bay. Inorganic chemicals lost one percentage point from the mid 1990s while edible fruit just managed to maintain its 2% share.
T r a d e I n f o r m a t i o n S e r v i c e 2 0 0 5
17
Figure 8: Top 10 export product groups for South Africa: 1994-1996 and 2002-2004
Top 10 exported products (1994-96)
Iron& steel10%
Fuels & oils9%
Unspec6%
Others 28% Precious metals 32%
Mach & parts 3%
Ores, slag & ash 3%
Inorg chem3%
Fruit 2%
Vehicles 2%
Wood pulp2%
[Source: Custom and Excise]
4.4.1 Imports by products
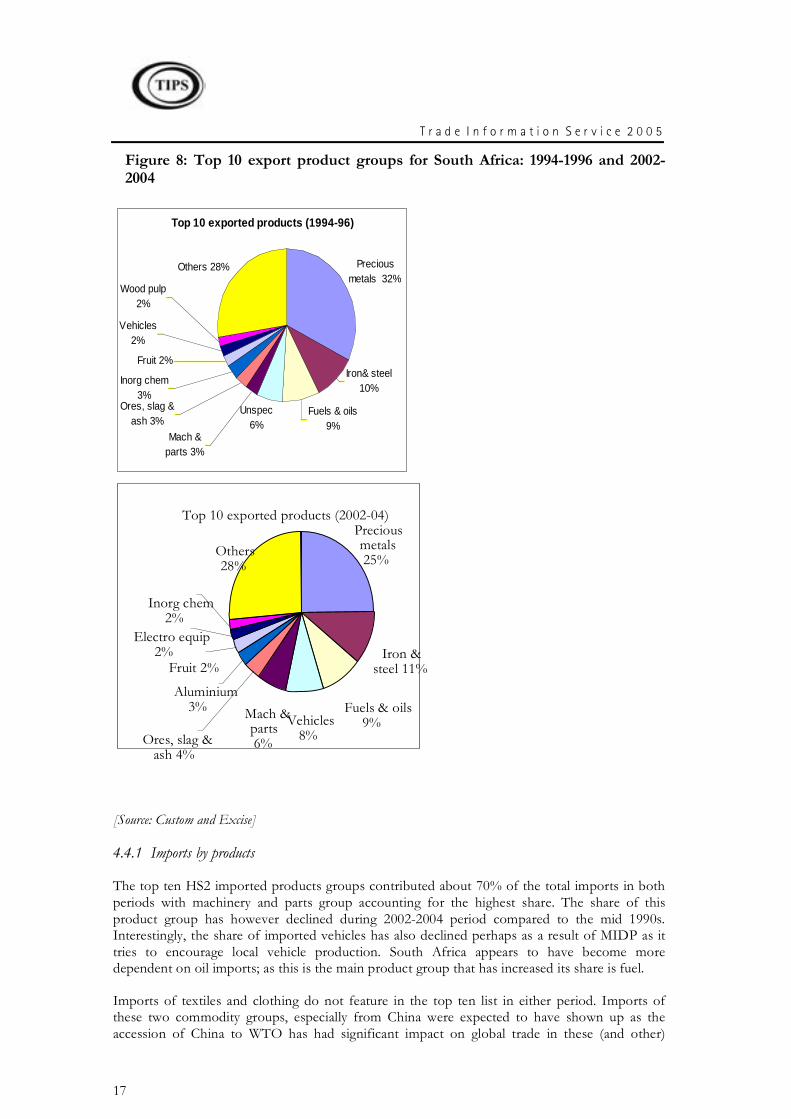
The top ten HS2 imported products groups contributed about 70% of the total imports in both periods with machinery and parts group accounting for the highest share. The share of this product group has however declined during 2002-2004 period compared to the mid 1990s. Interestingly, the share of imported vehicles has also declined perhaps as a result of MIDP as it tries to encourage local vehicle production. South Africa appears to have become more dependent on oil imports; as this is the main product group that has increased its share is fuel.
Imports of textiles and clothing do not feature in the top ten list in either period. Imports of these two commodity groups, especially from China were expected to have shown up as the accession of China to WTO has had significant impact on global trade in these (and other)
Top 10 exported products (2002-04) Precious metals 25%
Fuels & oils 9% Vehicles
8%
Others 28%
Mach & parts 6% Ores, slag &
ash 4%
Aluminium 3%
Fruit 2%
Electro equip 2%
Inorg chem 2%
Iron & steel 11%
T r a d e I n f o r m a t i o n S e r v i c e 2 0 0 5
18
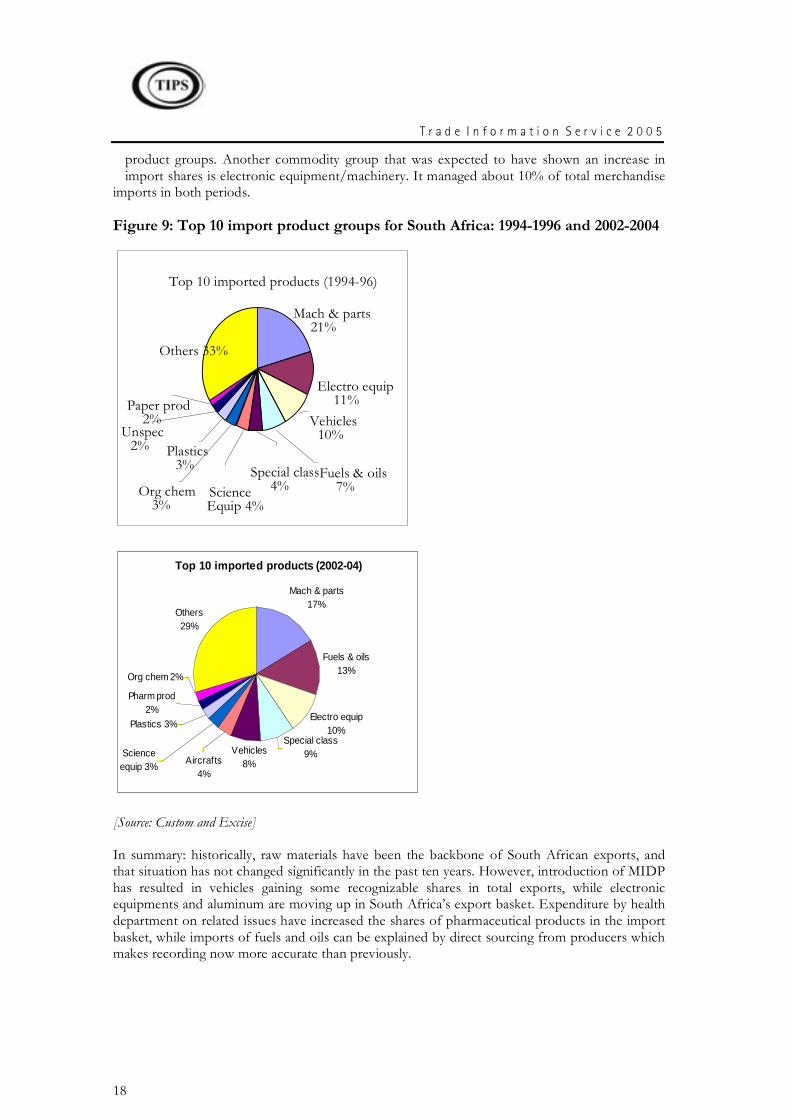
product groups. Another commodity group that was expected to have shown an increase in import shares is electronic equipment/machinery. It managed about 10% of total merchandise
imports in both periods.
Figure 9: Top 10 import product groups for South Africa: 1994-1996 and 2002-2004
Top 10 imported products (2002-04)
Mach & parts17%
Fuels & oils13%
Electro equip10%
Others29%
Vehicles8%
Org chem 2%
Pharm prod 2%
Plastics 3%
Aircrafts4%
Science equip 3%
Special class9%
[Source: Custom and Excise]
In summary: historically, raw materials have been the backbone of South African exports, and that situation has not changed significantly in the past ten years. However, introduction of MIDP has resulted in vehicles gaining some recognizable shares in total exports, while electronic equipments and aluminum are moving up in South Africa’s export basket. Expenditure by health department on related issues have increased the shares of pharmaceutical products in the import basket, while imports of fuels and oils can be explained by direct sourcing from producers which makes recording now more accurate than previously.
Top 10 imported products (1994-96)
Others 33%
Mach & parts 21%
Electro equip 11%
Vehicles 10%
Science Equip 4%
Org chem 3%
Special class 4%
Plastics 3%
Unspec 2%
Paper prod 2%
Fuels & oils 7%
T r a d e I n f o r m a t i o n S e r v i c e 2 0 0 5
19
5 Growth rates of Merchandise Trade
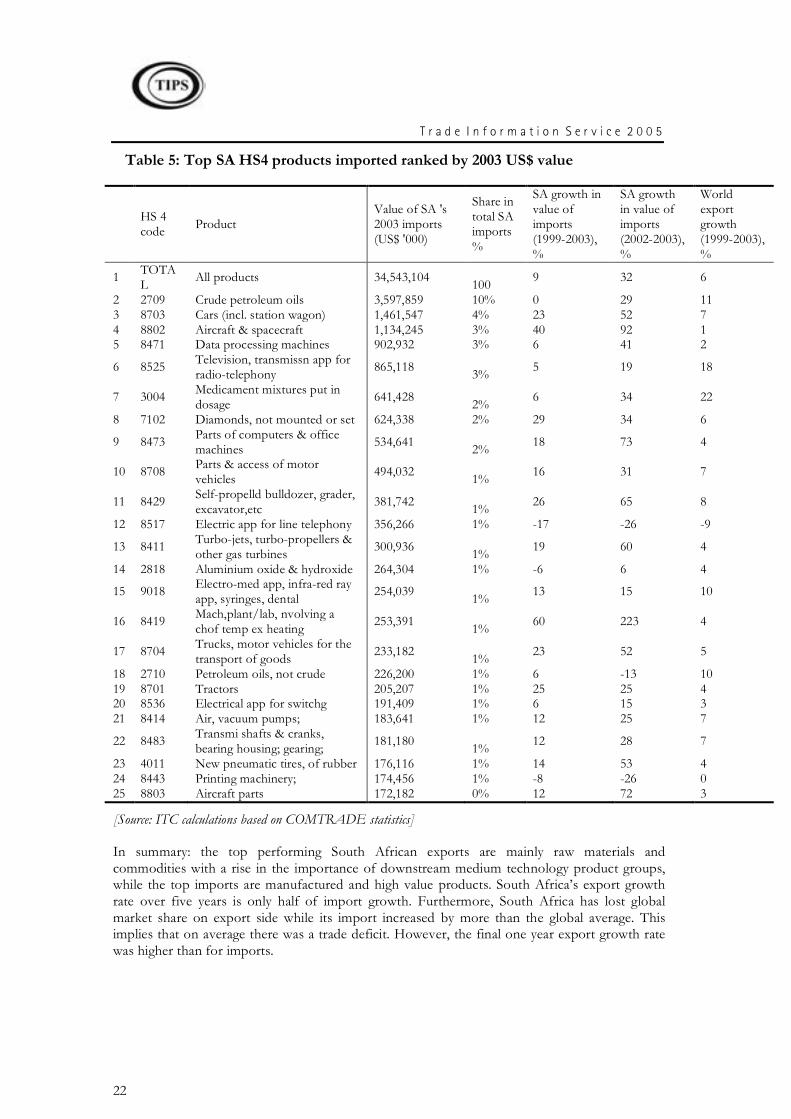
In this section we report on the growth performance of both imported and exported products over the past five years. To evaluate such performance, we examine the growth rates of top exported and imported products at HS 4 level using data from the International Trade Centre (ITC). The growth rates are calculated for five years, 1999- 2003 as well as for a single year year, i.e. 2002 – 2003. The trade values and the share in South Africa’s total that are reflected in Table 2.4 and Table 2.5 are for the year 2003.
5.1.1 Growth in Exports
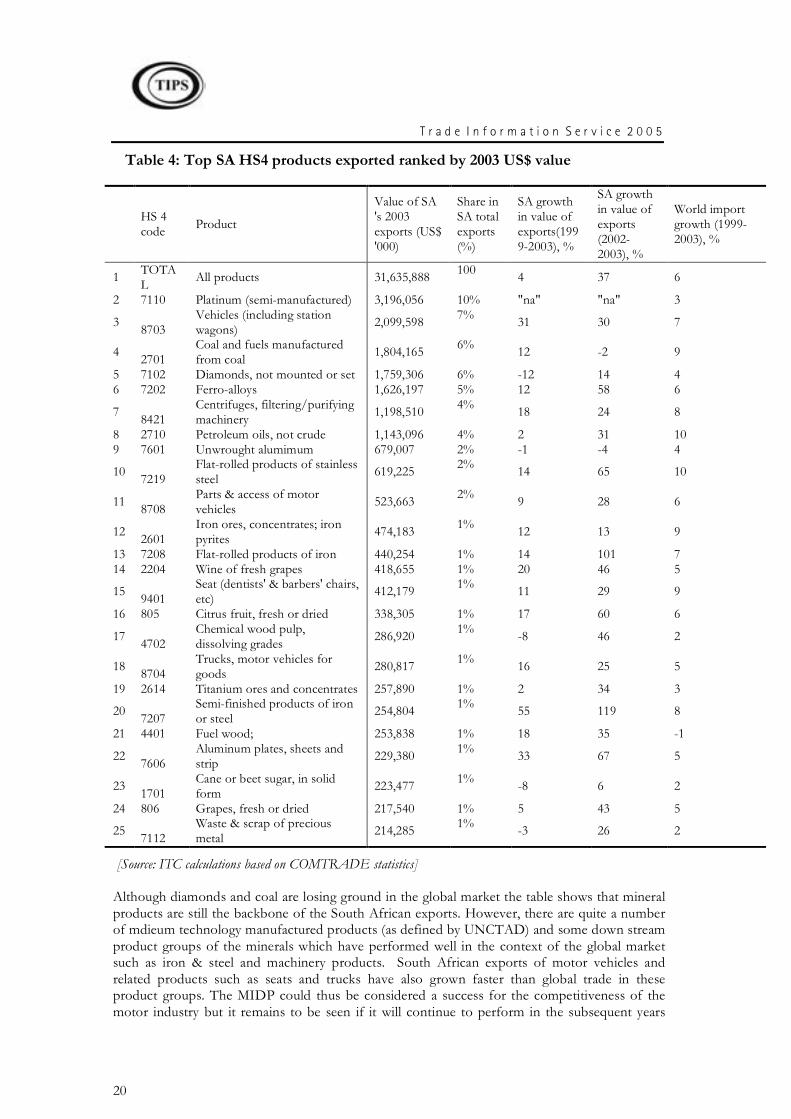
The table below shows the top exported products by South Africa ranked by 2003 value. The total exports in 2003 amounted to US$ 31.6 bn. At the top of commodity list are products that also appeared in the top ten export pie charts mentioned above, i.e. mainly mineral products (platinum, diamond, coal, iron and steel and aluminium). Other products in the list are from the motor industry, agricultural sector (horticultural products) and chemical sector. The first column of the table presents the value of South African exports, while column 2 shows the share of those exports in South Africa’s total exports. Column 3 and 4 present growth rates for the five year period, 1999-2003 and for 2002-2003. The last column shows the five year annual growth rate in global imports so that we can easily benchmark South Africa's export performance.
At 4% South Africa’s annual growth rate from 1999 to 2003 was slower than the global import growth which was 6% . The fact that Global demand exceeded South Africa’s supply of exports over the five year period implies South Africa has lost market share. However, more recently, South African exports seem to be improving its position. The South African exports performance for the last year, 2002-2003 was very impressive, growing at 37%, more than double the growth rates recorded for global trade in Table 2.2.
The year 2003 was overall a good year for South African exports. Most products have performed well judging by nominal exports growth rates in US$ terms. From this list of top 25 products ranked by value, only five products had a negative annual growth rate over the period 1999 – 2003. These products are HS 7102: diamonds, not mounted or set, HS 7601: unwrought aluminium, HS 4702: chemical wood pulp, dissolving grades, HS1701: Cane or beet sugar in solid form and HS7112: waste & scrap of precious metals. On the positive side, all these products have shown potential to recover as their year to year growth rates were all positive, with the exception of HS 7601: unwrought aluminium, which declined by 4% in 2002-2003.
For the products that had a positive growth rates, 15 enjoyed higher growth rates than the world imports. This implies that these products have increased their global market shares. The best performing in this regard were vehicles, which does not surprise given the support from the MIDP. It is these kind of performances by the vehicles and motor components that resulted in the industry ranked 19th in the world. Other products of iron and steel have also been growing at significant rates.
T r a d e I n f o r m a t i o n S e r v i c e 2 0 0 5
20
Table 4: Top SA HS4 products exported ranked by 2003 US$ value
HS 4 code Product
Value of SA 's 2003 exports (US$ '000)
Share in SA total exports (%)
SA growth in value of exports(1999-2003), %
SA growth in value of exports (2002-2003), %
World import growth (1999-2003), %
1 TOTAL All products 31,635,888 100 4 37 6
2 7110 Platinum (semi-manufactured) 3,196,056 10% "na" "na" 3
3 8703 Vehicles (including station wagons) 2,099,598 7% 31 30 7
4 2701 Coal and fuels manufactured from coal 1,804,165 6% 12 -2 9
5 7102 Diamonds, not mounted or set 1,759,306 6% -12 14 4 6 7202 Ferro-alloys 1,626,197 5% 12 58 6
7 8421 Centrifuges, filtering/purifying machinery 1,198,510 4% 18 24 8
8 2710 Petroleum oils, not crude 1,143,096 4% 2 31 10 9 7601 Unwrought alumimum 679,007 2% -1 -4 4
10 7219 Flat-rolled products of stainless steel 619,225 2% 14 65 10
11 8708 Parts & access of motor vehicles 523,663 2% 9 28 6
12 2601 Iron ores, concentrates; iron pyrites 474,183 1% 12 13 9
13 7208 Flat-rolled products of iron 440,254 1% 14 101 7 14 2204 Wine of fresh grapes 418,655 1% 20 46 5
15 9401 Seat (dentists' & barbers' chairs, etc) 412,179 1% 11 29 9
16 805 Citrus fruit, fresh or dried 338,305 1% 17 60 6
17 4702 Chemical wood pulp, dissolving grades 286,920 1% -8 46 2
18 8704 Trucks, motor vehicles for goods 280,817 1% 16 25 5
19 2614 Titanium ores and concentrates 257,890 1% 2 34 3
20 7207 Semi-finished products of iron or steel 254,804 1% 55 119 8
21 4401 Fuel wood; 253,838 1% 18 35 -1
22 7606 Aluminum plates, sheets and strip 229,380 1% 33 67 5
23 1701 Cane or beet sugar, in solid form 223,477 1% -8 6 2
24 806 Grapes, fresh or dried 217,540 1% 5 43 5
25 7112 Waste & scrap of precious metal 214,285 1% -3 26 2
[Source: ITC calculations based on COMTRADE statistics]
Although diamonds and coal are losing ground in the global market the table shows that mineral products are still the backbone of the South African exports. However, there are quite a number of mdieum technology manufactured products (as defined by UNCTAD) and some down stream product groups of the minerals which have performed well in the context of the global market such as iron & steel and machinery products. South African exports of motor vehicles and related products such as seats and trucks have also grown faster than global trade in these product groups. The MIDP could thus be considered a success for the competitiveness of the motor industry but it remains to be seen if it will continue to perform in the subsequent years
T r a d e I n f o r m a t i o n S e r v i c e 2 0 0 5
21
because the program is due to be reviewed in 2005 while the Australians are threatening to challenge it as it is deemed to be against WTO rules.
5.1.2 Growth in Imports
South Africa’s top imported products in 2003 were led by petroleum oils, vehicles, aircrafts and machinery products. These commodity groups form the main composition of the top 25 products as can be seen in the next table. Crude oils is a major single commodity group, as it accounts for 10% of total imports. Outside these four main groups, there were only four other products of relevance.
South Africa's overall imports have grown at an annual rate of 9% per annum between 1999 and 2003. That rate was higher that the annual growth rate of global trade, of about 6% suggesting that the South African economy has performed well in a global context. The highest growth rates over this period were recorded for HS8802: aircrafts and spacecrafts (40%), HS 8419, Machinery,plant/lab,involving a change of temp ex heating (60%), HS8429: Self-propelld bulldozer, grader, excavator,etc (26%) and HS 8701: tractors (25%). Growth in imports of these products appear to be accelerating as all their final one year rates are higher than the five year average annual rates.
The highest annual growth rates from 2002 to 2003 have been recorded in the commodity group of aircraft and air spacecraft as well as aircraft parts. These two sub categories grew at an annual rate of 40% and 12% in 1999-2003 and by 92% and 72%, in 2002-2003 respectively (see rows, 4 and 25). The imports were driven by the commissioning of the production line for South Africa's fleet of multi/swing-role advanced fighter aircraft. This programme was initiated in 1999 when South Africa placed orders for 28 aircrafts, nine dual seat and 19 single-seat versions. The imports of the aircrafts are deemed to be once off and may not be sustained in the future.
On the other hand, imports of products such as HS8517: Electric app for line telephony and HS8443: printing machinery have declined over the final one year as well as the five year period. The electric apparatus for line telephony have also shown a declining global demand, as world trade declined by 9%. In South Africa, this declining import demand may be attributed to the growing cellular telephone industry and saturation of the fixed line telephone market.
T r a d e I n f o r m a t i o n S e r v i c e 2 0 0 5
22
Table 5: Top SA HS4 products imported ranked by 2003 US$ value
HS 4 code Product
Value of SA 's 2003 imports (US$ '000)
Share in total SA imports%
SA growth in value of imports (1999-2003), %
SA growth in value of imports (2002-2003), %
World export growth (1999-2003), %
1 TOTAL All products 34,543,104 100 9 32 6
2 2709 Crude petroleum oils 3,597,859 10% 0 29 11 3 8703 Cars (incl. station wagon) 1,461,547 4% 23 52 7 4 8802 Aircraft & spacecraft 1,134,245 3% 40 92 1 5 8471 Data processing machines 902,932 3% 6 41 2
6 8525 Television, transmissn app for radio-telephony 865,118 3% 5 19 18
7 3004 Medicament mixtures put in dosage 641,428 2% 6 34 22
8 7102 Diamonds, not mounted or set 624,338 2% 29 34 6
9 8473 Parts of computers & office machines 534,641 2% 18 73 4
10 8708 Parts & access of motor vehicles 494,032 1% 16 31 7
11 8429 Self-propelld bulldozer, grader, excavator,etc 381,742 1% 26 65 8
12 8517 Electric app for line telephony 356,266 1% -17 -26 -9
13 8411 Turbo-jets, turbo-propellers & other gas turbines 300,936 1% 19 60 4
14 2818 Aluminium oxide & hydroxide 264,304 1% -6 6 4
15 9018 Electro-med app, infra-red ray app, syringes, dental 254,039 1% 13 15 10
16 8419 Mach,plant/lab, nvolving a chof temp ex heating 253,391 1% 60 223 4
17 8704 Trucks, motor vehicles for the transport of goods 233,182 1% 23 52 5
18 2710 Petroleum oils, not crude 226,200 1% 6 -13 10 19 8701 Tractors 205,207 1% 25 25 4 20 8536 Electrical app for switchg 191,409 1% 6 15 3 21 8414 Air, vacuum pumps; 183,641 1% 12 25 7
22 8483 Transmi shafts & cranks, bearing housing; gearing; 181,180 1% 12 28 7
23 4011 New pneumatic tires, of rubber 176,116 1% 14 53 4 24 8443 Printing machinery; 174,456 1% -8 -26 0 25 8803 Aircraft parts 172,182 0% 12 72 3
[Source: ITC calculations based on COMTRADE statistics]
In summary: the top performing South African exports are mainly raw materials and commodities with a rise in the importance of downstream medium technology product groups, while the top imports are manufactured and high value products. South Africa’s export growth rate over five years is only half of import growth. Furthermore, South Africa has lost global market share on export side while its import increased by more than the global average. This implies that on average there was a trade deficit. However, the final one year export growth rate was higher than for imports.
T r a d e I n f o r m a t i o n S e r v i c e 2 0 0 5
23
5.2 South African Merchandise Trade: Conclusions
The global economy performed well during 2004, the best performance in a decade. Developing countries made meaningful contribution to that performance. However, the growth rates for the subsequent years are forecasted to be slower. The world trade was also on the rise, again with developing countries contributing significantly. The accession of China to the WTO also played a significant role in this regard.
Against this background, for South Africa, 2003 - 2004 has been a good year in terms trade as exports started a hesitant recovery to rise back to its highest levels of 2001 (in constant price Rand terms). South Africa’s trade relations with the EU have been strengthened by the signing of the TDCA which ensured that EU remains the leading trade partner to South Africa. SADC’s share of South Africa trade has not changed over the ten year period, despite South Africa’s membership to SADC and the implementation of the SADC trade protocol. However trade with the rest of Africa is growing steadily, but it remains relatively low. Exports to the Asian regions, where currently the highest GDP growth rates are recorded have not increased in terms of export shares. South Africa has therefore not been able to derive much gain from the most dynamic global region, relative to other regions. Trade with individual countries is still skewed towards US, UK, Japan and Germany. The only African country among South Africa’s trade partners is Zimbabwe, but its recent trade shares are declining.
Trade by products reveals that precious minerals still make a substantial contribution to South African trade. However, some manufacturing exports, amongst others in vehicles and machinery improved significantly (while the share of vehicle imports declined). Reliance on exports of precious metals seems to be declining, which implies that other products are gaining ground as leading export goods. Products such as electronic equipments and aluminum are new products in which South Africa has recently shown capacity to supply global markets. The new products of significance on the import side include pharmaceutical products which seems to be linked to the increase in expenditure on health and related aspects.
The growth rates for the top products have been very impressive, especially in the last year, suggesting that high trade performance is likely to be sustained. Iron and steel, machinery, cars and car parts are some of the best performing export product groups. The export performance of the iron and steel industry may be due to the market structure and competition issues while motor industry is due to the success of MIDP. However, global demand for products in these industries has been increasing and therefore driven the South African counterparts towards export oriented. Overall, South Africa lost market share despite some impressive performance by other products and industries. Therefore, strategic marketing and development of niche markets backed by sustainable growth in productivity to meet global demand need to be encouraged.
6 South Africa's Trade in Services
Services account for about three quarters of South African GDP and employment. There is a high level of government involvement in the sector, about 40% of services output is provided by the public sector it accounts for about a quarter of services employment. The fastest growing services sectors over the period 1999-2003 are transport & storage, communications and construction. However, employment contracted during this period in these sectors. In other services sectors such as financial and business services and trade, catering and accommodation, employment growth has been positive but lower than output growth (Mayer, 2005)
Trade in services has increased from less than 10% in the 1970s to just under 20%. According to Stern (2005) this rise in importance can be attributed to growth in service and not a decline in
T r a d e I n f o r m a t i o n S e r v i c e 2 0 0 5
24
merchandise trade, as the latter recorded significant increases, notably after 1994. Services trade in South Africa is dominated by travel and transport services. Travel services have traditionally
recorded a surplus but this is outweighted by a significant deficit on transport services. Other services have seen an improvement in the trade balance from a deficit up to the mid 1990s to a surplus from the late 1990s onwards. Other services include, amongst others health and construction services,
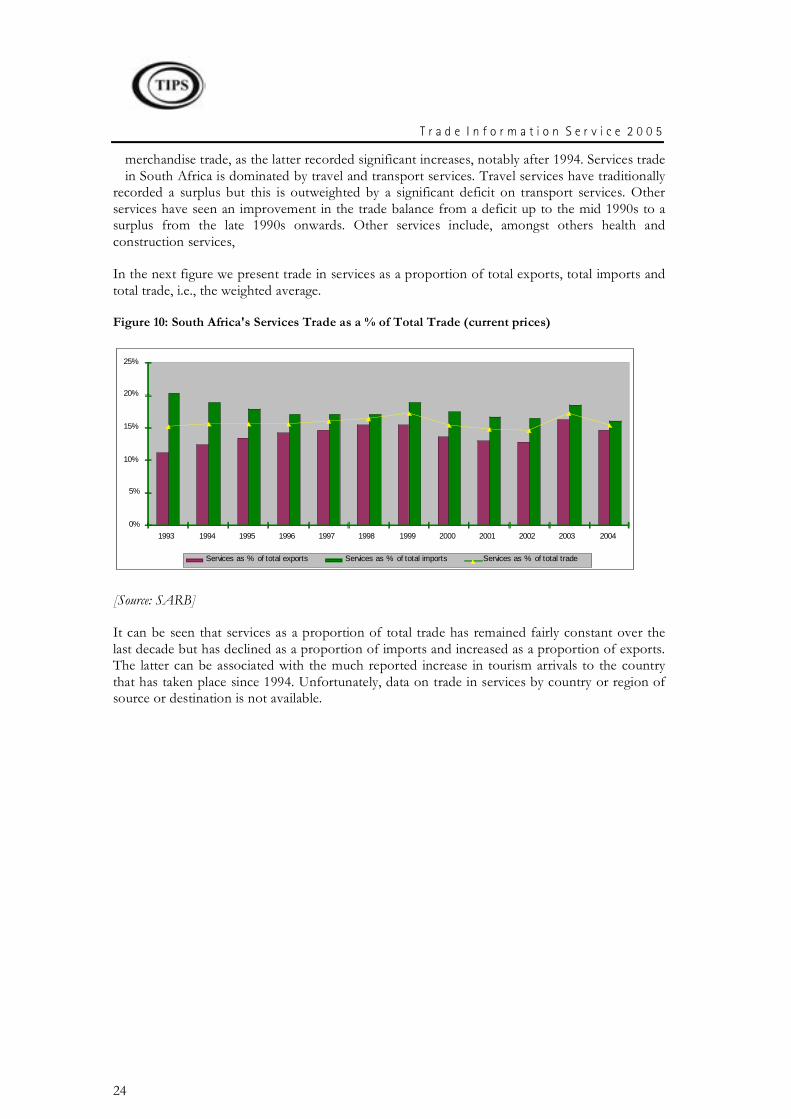
In the next figure we present trade in services as a proportion of total exports, total imports and total trade, i.e., the weighted average.
Figure 10: South Africa's Services Trade as a % of Total Trade (current prices)
0%
5%
10%
15%
20%
25%
1993 1994 1995 1996 1997 1998 1999 2000 2001 2002 2003 2004
Services as % of total exports Services as % of total imports Services as % of total trade
[Source: SARB]
It can be seen that services as a proportion of total trade has remained fairly constant over the last decade but has declined as a proportion of imports and increased as a proportion of exports. The latter can be associated with the much reported increase in tourism arrivals to the country that has taken place since 1994. Unfortunately, data on trade in services by country or region of source or destination is not available.
T r a d e I n f o r m a t i o n S e r v i c e 2 0 0 5
25
SECTION 3: SOUTH AFRICA'S EXPORT PERFORMANCE
In this section we will delve more deeply into various measures of South Africa's export performance. We start with a broad sweep at the aggregate level, after which we will consider a more detailed account. Starting with an evaluation of South Africa's growth performance versus the rest of the world, we introduce in section 2 a number of indicators that have been developed by the International Trade Centre (ITC) which are now widely used to measure export performance in developing countries. This is followed in 3 by the concept of "revealed comparative advantage". We introduce a measure of potential trade using a gravity model in section 4.
1 South Africa’s merchandise export performance in 2003 at a broad level
There are various ways of taking a view on a country's export performance. Here we briefly look at which product groups are performing above average and which are not.
T r a d e I n f o r m a t i o n S e r v i c e 2 0 0 5
26
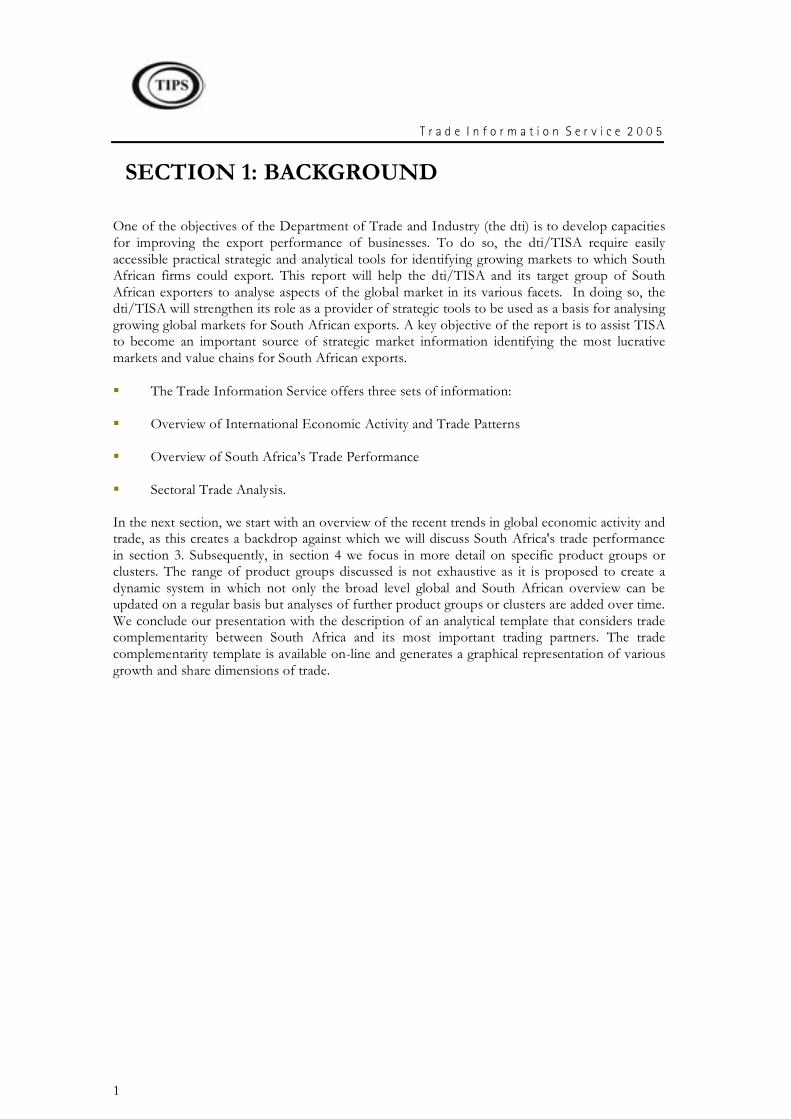
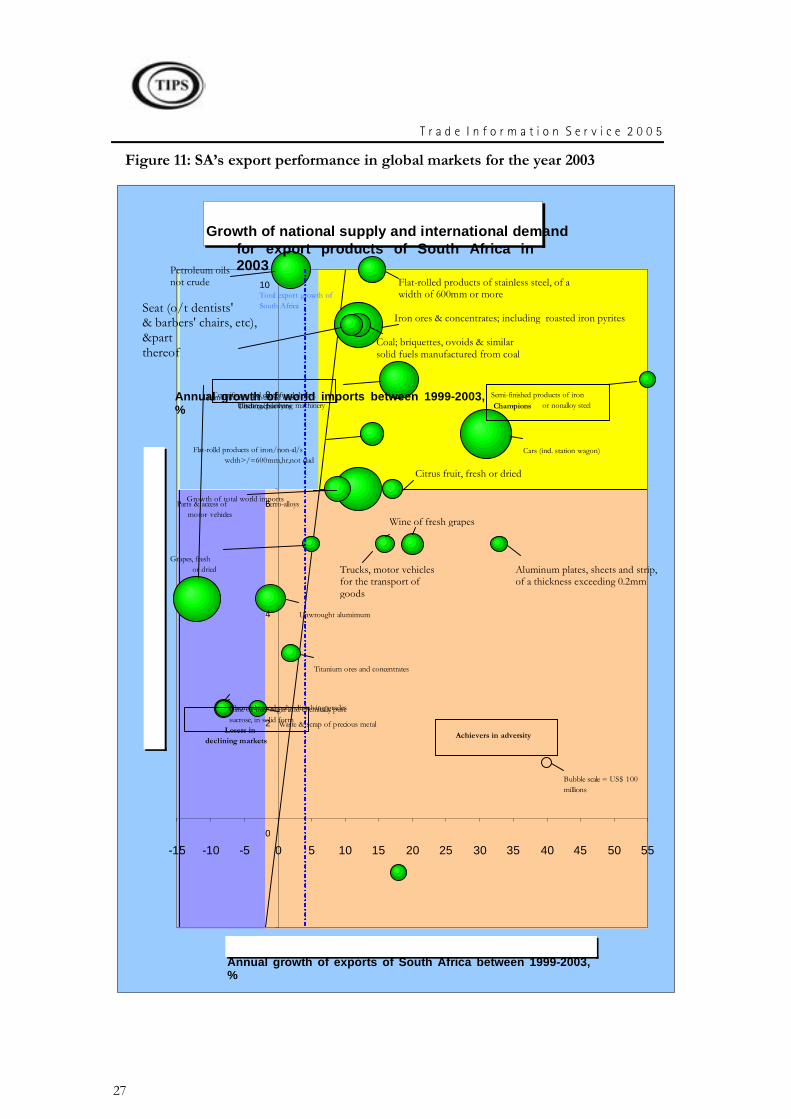
Figure 11 below offers a first cut at such analysis and was generated from the information in Table 2.4. It summarises South Africa’s export performance for HS4 digit product codes. The
figure shows the export value of each product, represented by the size of the bubble. South African export growth, on the horizontal axis is compared with the growth in international demand (vertical axis). There is a diagonal line which represents constant world market shares. South Africa’s exports that are positioned to the right of this diagonal (such as cars (inclu.station wagon)) are growing faster than world imports (world demand), and are therefore increasing their share in world markets. Conversely, products to the left of the diagonal line (unwrought aluminum) have lost ground. The dotted vertical line represents the average growth of South African total exports while the solid horizontal line (not the X-axis) is the average growth in world demand.
The diagonal and horizontal lines divide the chart into four areas based on product performances as follows:
Champions or winners in growth markets: This is the area to the right of the diagonal and above the horizontal line. Products that fall in this category have performed well, such as flat rolld products of iron/non-al/s wdth >/=600mm,hr, not clad. These products are considered dynamic, growing faster than world trade, and therefore have increased their share from the last five years. Focusing trade promotion is therefore a fairly save bet.
Achievers in adversity or winners in declining markets are products falling below the horizontal line and to the right of the diagonal, for example wine of fresh grapes. The world import markets for these products are declining or growing at below average rate but the market share of South Africa’s is growing. Expanding in declining markets may not be a recommended strategy, unless it entails specific niche markets. Trade promotion should therefore focus on developing or finding niche markets.
Underachievers or losers in growth markets fall in the area above the horizontal line but to the left of the diagonal. For these products international demand is not a problem but their growth rate fell below that of world imports. The main constraint in these products is South Africa’s supply capacity. Consequently, South African has been losing international market shares and trade promotion should focus on increasing export supply of the product group or alleviate possible bottlenecks.
Losers in declining markets are those products falling below the national export average growth and the left of the diagonal such as chemical wood pulp, dissolving grades. The export potential of these products is not promising as the world demand for these products have increased below the average rate or actually declined and in addition the market share for South Africa has gone down. To deal with this problem requires addressing both supply bottlenecks and demand issues.
The circle at the bottom right corner that is not shaded serves as a reference for the size of the bubbles. The scale varies from US$10, 000 to US$ 100 million. In this case the circle represents US$ 100 million.
T r a d e I n f o r m a t i o n S e r v i c e 2 0 0 5
27
Figure 11: SA’s export performance in global markets for the year 2003
Growth of national supply and international demand for export products of South Africa in 2003
-2
0
2
4
6
8
10
-15 -10 -5 0 5 10 15 20 25 30 35 40 45 50 55
Annual growth of exports of South Africa between 1999-2003, %
Annual growth of world imports between 1999-2003, % Underachievers
Growth of total world imports
Champions
Achievers in adversity Losers in declining markets
Total export growth of South Africa
Cars (incl. station wagon)
Coal; briquettes, ovoids & similar solid fuels manufactured from coal
Diamonds, not mounted or set
Ferro-alloys
Centrifuges, incl centrifugal dryers; filtering/purifying machinery
Petroleum oils not crude
Unwrought alumimum
Flat-rolled products of stainless steel, of a width of 600mm or more
Parts & access of motor vehicles
Iron ores & concentrates; including roasted iron pyrites
Flat-rolld products of iron/non-al/s wdth>/=600mm,hr,not clad
Seat (o/t dentists' & barbers' chairs, etc), &part thereof
Citrus fruit, fresh or dried
Chemical wood pulp, dissolving grades
Wine of fresh grapes
Trucks, motor vehicles for the transport of goods
Titanium ores and concentrates
Semi-finished products of iron or nonalloy steel
Aluminum plates, sheets and strip, of a thickness exceeding 0.2mm
Cane or beet sugar and chemically pure sucrose, in solid form
Grapes, fresh or dried
Waste & scrap of precious metal
Bubble scale = US$ 100 millions
T r a d e I n f o r m a t i o n S e r v i c e 2 0 0 5
28
Source: [Source: ITC] calculations based on COMTRADE statistics
The graph shows that exports of iron and steel, machinery, cars, car parts and coal represent top performers in global markets. They are currently the champions in the South African export basket. Furthermore, their exports outperformed national average export growth. Trade promotion of these products in international market is less risky. Given the growth in global demand, supply chain should be broadened.
In the achievers in adversity category there are products such as trucks, aluminium plates and wines which have been growing in below average or declining global markets. Export growth of these products to global market outperformed average export growth, and therefore increased market shares. However, it is the growth in market import demand of these products that is a concern. For the period, global demand was slower than total world trade. Some of the approaches to be considered when marketing these products in international markets include niche marketing strategies or isolating positive trade performance in declining markets.
In the category underachievers there is only one significant (by value) representative in the form of petroleum oil (not crude). By definition, these products failed to take advantage of the growing global demand mainly due to supply bottlenecks. The international demand growth was sufficient. The strategy that should be adopted is to try and remove supply constraints in domestic production.
Sugar, chemical wood pulp, aluminum (unwrought) and diamonds (unwrought) exports have lost markets shares while import demand for the also declined. Thus, market import growth fell below average world import growth in product. The problems for these exports are both on the demand and supply sides. There is insufficient international demand and supply factors are also restricting. Exit strategies or the search for niche markets may be an appropriate policy for these product groups.
The market shares of titanium ores and grapes (fresh or dried) have not changed in the last five years. These products are on the diagonal, and that implied that their annual growth rates between 1999 and 2003 were equal to the annual growth rates of world imports.
2 The Trade Performance Index (TPI)
The International Trade Centre (ITC) developed the trade performance index as a means of determining how successful a country has been at exporting in the past and also as a means of inferring what future performance could be. The tool is important because it allows researchers to analyse the sources of growth and thus to infer whether this growth can be sustainable or not. The trade performance index is similar to the ProductMap tool which is available for 72 industries and over 200 countries and territories. The ProducMap tool will be introduced later when we focus on particular product groups that are of interest to thedti/TISA. Here, we use a more aggregated tool in order to get a better understanding of broad trends and patterns. Trade is grouped into 14 sectors. Besides the trade performance index, the ITC also provides other analysis, such as revealed comparative advantage (section 3) and predictions of trade between South Africa and partner countries (section 4). We have added to this analysis, a new tool that evaluates complementarity between South Africa's exports and the top global importers. We end this section with a summary.
T r a d e I n f o r m a t i o n S e r v i c e 2 0 0 5
29
The TPI can be broken down into two main components:
position-related indicators show the structure of trade at the end of the sample period, in this case 20014. The indicators are used to determine the extent of openness of the sector, the degree of market and product diversification, as well as South Africa’s market share in world trade.
change-related indicators review the performance of the sector’s exports over the last four years. The most important indicator is the change in market share and the decomposition of this change into the factors causing the change.
Altogether, the TPI consists of about two dozen quantitative performance indicators. For ease of reference, these indicators are presented in absolute terms and, in addition, as ranking among the 184 countries covered by the TPI. Moreover, two composite rankings are calculated, one for the overall position of the country and sector under review which is, as mentioned above, essentially a static view or snap shot picture of the country’s most recent export performance and another one for the change in performance which capture major trends over the recent past.
The composite ranking on the position is based on five criteria:
the value of net exports
per capita exports
the world market share
the diversification of products
the diversification of markets
The composite ranking of the change in export performance covers the following five criteria:
the change in world market share (and its decomposition)
the trend of the coverage of imports by exports
the specialisation on dynamic products
the change in product diversification
the change in market diversification
In the sections below, we examine the position indicators first, followed by the change indicators. The TPI is based on the COMTRADE data base of the United Nations Statistics Division. Since the coverage of COMTRADE is about 90% of world trade, the TPI is calculated not only for
4 The reason for the considerable lag in our analysis is that during the early years of the new decade, UNComTrade started reporting for all SACU members individually, while it was previously reporting for a single (regional) unit. Consequently, the 5 year period for computing growth rates was interrupted and it will take another few years before a new 5 year period is available and the ITC will be able to report TPI indices for individual SACU members.
T r a d e I n f o r m a t i o n S e r v i c e 2 0 0 5
30
countries which report their own trade data, but also for over one hundred primarily low-income countries which do not report national trade statistics and for which the export
performance has been reconstructed on the basis of partner country data. Although this approach referred to as mirror statistics has its shortcomings (see http://www.intracen.org/countries/structural05/reliability03.pdf) , it does generate a wealth of information which would otherwise not be available. The trade data is reported for the Southern African Customs Union but South Africa dominates this grouping to such a large extent that one can make inferences for South Africa based on the data. The one possible exception is the minerals sector. South Africa gold exports have been removed from the data but not Botswana's diamond exports. Thus Botswana has a significant presence in mineral exports but otherwise most of the data will refer to South Africa.
2.1 TPI General Descriptive Indicators
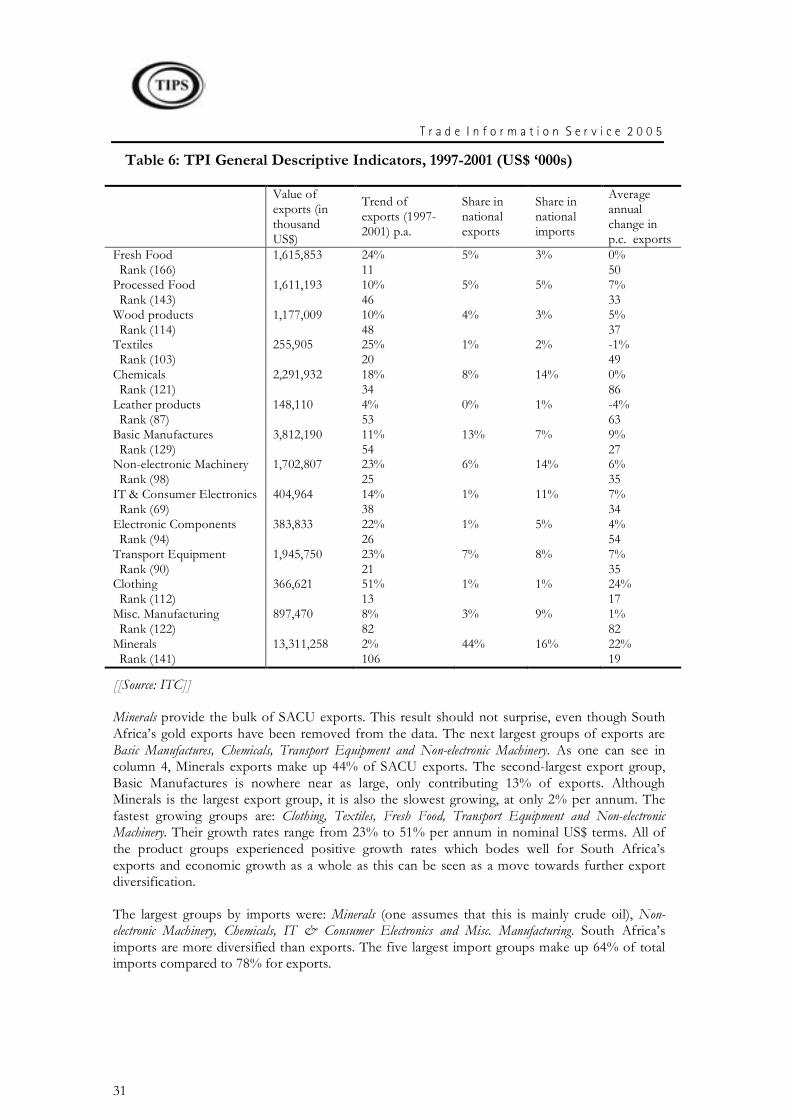
Before we proceed with the analysis of the change-related and position indicators, we start off by reviewing the general descriptive indicators. The five indicators presented in Table 3.1 show the size of exports, the growth of exports (in percentage terms and in terms of change in per capita exports) and the share of the trade in the goods in national trade. The 14 broad categories of goods cover all traded goods but do not include services. The ITC provides ranks for some of the indicators. Not all of the countries in the trade performance index qualify for ratings on all of the goods. Thus, the number of countries for each of the goods varies. In Table 3.1 below the number of countries ranked in each good is found in the row below the one listing the value for the indicator. For example, only 166 countries are rated for the fresh food group.
T r a d e I n f o r m a t i o n S e r v i c e 2 0 0 5
31
Table 6: TPI General Descriptive Indicators, 1997-2001 (US$ ‘000s)
Value of exports (in thousand US$)
Trend of exports (1997-2001) p.a.
Share in national exports
Share in national imports
Average annual change in p.c. exports
Fresh Food 1,615,853 24% 5% 3% 0% Rank (166) 11 50 Processed Food 1,611,193 10% 5% 5% 7% Rank (143) 46 33 Wood products 1,177,009 10% 4% 3% 5% Rank (114) 48 37 Textiles 255,905 25% 1% 2% -1% Rank (103) 20 49 Chemicals 2,291,932 18% 8% 14% 0% Rank (121) 34 86 Leather products 148,110 4% 0% 1% -4% Rank (87) 53 63 Basic Manufactures 3,812,190 11% 13% 7% 9% Rank (129) 54 27 Non-electronic Machinery 1,702,807 23% 6% 14% 6% Rank (98) 25 35 IT & Consumer Electronics 404,964 14% 1% 11% 7% Rank (69) 38 34 Electronic Components 383,833 22% 1% 5% 4% Rank (94) 26 54 Transport Equipment 1,945,750 23% 7% 8% 7% Rank (90) 21 35 Clothing 366,621 51% 1% 1% 24% Rank (112) 13 17 Misc. Manufacturing 897,470 8% 3% 9% 1% Rank (122) 82 82 Minerals 13,311,258 2% 44% 16% 22% Rank (141) 106 19
[[Source: ITC]]
Minerals provide the bulk of SACU exports. This result should not surprise, even though South Africa’s gold exports have been removed from the data. The next largest groups of exports are Basic Manufactures, Chemicals, Transport Equipment and Non-electronic Machinery. As one can see in column 4, Minerals exports make up 44% of SACU exports. The second-largest export group, Basic Manufactures is nowhere near as large, only contributing 13% of exports. Although Minerals is the largest export group, it is also the slowest growing, at only 2% per annum. The fastest growing groups are: Clothing, Textiles, Fresh Food, Transport Equipment and Non-electronic Machinery. Their growth rates range from 23% to 51% per annum in nominal US$ terms. All of the product groups experienced positive growth rates which bodes well for South Africa’s exports and economic growth as a whole as this can be seen as a move towards further export diversification.
The largest groups by imports were: Minerals (one assumes that this is mainly crude oil), Non-electronic Machinery, Chemicals, IT & Consumer Electronics and Misc. Manufacturing. South Africa’s imports are more diversified than exports. The five largest import groups make up 64% of total imports compared to 78% for exports.
T r a d e I n f o r m a t i o n S e r v i c e 2 0 0 5
32
2.2 Position-related Indicators
The first position-related indicator is net exports. The ITC uses net exports for two reasons. Firstly because the indicator eliminates re-exports that introduce a bias in raw data; secondly because the indicator takes into account the international splitting up of production processes, since a large part of imported intermediate products found within exports usually belong to the same sector (e.g. electronic parts and assembled computers). From the latter point of view, net exports introduce a very simple but reliable corrective measure for dealing with the globalisation of the production process and the induced vertical specialisation of countries at various production stages. It is an accurate measure of the amount of value added in South Africa, rather than in other countries.
Once again, Minerals has the highest value for net exports. Other large net exporters are: Basic Manufactures, Fresh Food, Wood Products and Processed Food. The advanced manufactured goods such as Transport Equipment and Non-electronic Machinery no longer feature. One would expect there to be more intra-industry trade in the advanced sectors because branding is important and there are often increasing returns to scale in production. The fact that South Africa is a net importer of these goods implies that South Africa does not have a comparative advantage in the production of these goods. This contradicts the fact that these groups are some of the largest exporters. One could infer from this that South Africa does not have a comparative advantage in the group as a whole but that some niche manufacturing and exporting is taking place.
In the next column of Table 3.2 we report the value of per capita exports which gives an indication as to how outward looking each country is, and to what extent the labour force produces for the world market. Obviously South Africa (and SACU) export the majority of their Minerals production. South Africa’s mining sector is much larger than most other countries so comparing this data against the values for the other groups is probably less meaningful l. A more useful comparison would be to analyse how the South African groups perform world-wide. The best performing groups using this bench-mark are: Minerals, Basic Manufactures, Processed Food, Fresh Food and Wood Products. These groups are all within the top 17% when compared to other countries’ comparative groups. At the other end of the scale, South Africa’s worst performing groups were: IT & Consumer Electronics, Clothing, Electronic Components, Leather Products and Textiles.
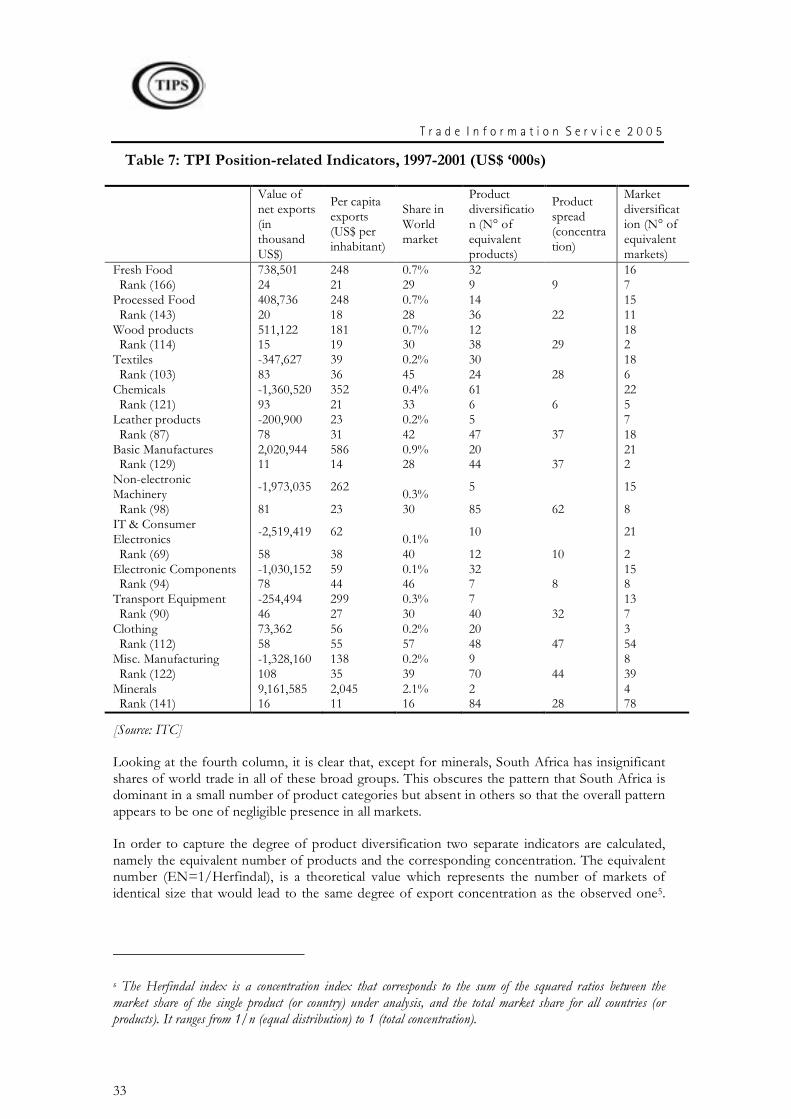
T r a d e I n f o r m a t i o n S e r v i c e 2 0 0 5
33
Table 7: TPI Position-related Indicators, 1997-2001 (US$ ‘000s)
Value of net exports (in thousand US$)
Per capita exports (US$ per inhabitant)
Share in World market
Product diversification (N° of equivalent products)
Product spread (concentration)
Market diversification (N° of equivalent markets)
Fresh Food 738,501 248 0.7% 32 16 Rank (166) 24 21 29 9 9 7 Processed Food 408,736 248 0.7% 14 15 Rank (143) 20 18 28 36 22 11 Wood products 511,122 181 0.7% 12 18 Rank (114) 15 19 30 38 29 2 Textiles -347,627 39 0.2% 30 18 Rank (103) 83 36 45 24 28 6 Chemicals -1,360,520 352 0.4% 61 22 Rank (121) 93 21 33 6 6 5 Leather products -200,900 23 0.2% 5 7 Rank (87) 78 31 42 47 37 18 Basic Manufactures 2,020,944 586 0.9% 20 21 Rank (129) 11 14 28 44 37 2 Non-electronic Machinery -1,973,035 262 0.3% 5 15
Rank (98) 81 23 30 85 62 8 IT & Consumer Electronics -2,519,419 62 0.1% 10 21
Rank (69) 58 38 40 12 10 2 Electronic Components -1,030,152 59 0.1% 32 15 Rank (94) 78 44 46 7 8 8 Transport Equipment -254,494 299 0.3% 7 13 Rank (90) 46 27 30 40 32 7 Clothing 73,362 56 0.2% 20 3 Rank (112) 58 55 57 48 47 54 Misc. Manufacturing -1,328,160 138 0.2% 9 8 Rank (122) 108 35 39 70 44 39 Minerals 9,161,585 2,045 2.1% 2 4 Rank (141) 16 11 16 84 28 78
[Source: ITC]
Looking at the fourth column, it is clear that, except for minerals, South Africa has insignificant shares of world trade in all of these broad groups. This obscures the pattern that South Africa is dominant in a small number of product categories but absent in others so that the overall pattern appears to be one of negligible presence in all markets.
In order to capture the degree of product diversification two separate indicators are calculated, namely the equivalent number of products and the corresponding concentration. The equivalent number (EN=1/Herfindal), is a theoretical value which represents the number of markets of identical size that would lead to the same degree of export concentration as the observed one5.
5 The Herfindal index is a concentration index that corresponds to the sum of the squared ratios between the market share of the single product (or country) under analysis, and the total market share for all countries (or products). It ranges from 1/n (equal distribution) to 1 (total concentration).
T r a d e I n f o r m a t i o n S e r v i c e 2 0 0 5
34
The larger the index value (both for products and markets), the greater the diversification of exports and consequently the better the ranking.
The other diversification indicator that the ITC uses measures the existing spread between the highest and lowest value in a given statistical series. They are calculated using the weighted standard error6. The spread index for products calculates the distribution of export products and compares it to the average export value. The greater the distribution of exports from a country (i.e. the greater the spread) as compared to the average, the higher the value of the index. The increase in rank is a function of the increase in the level of diversification. In other words, the bigger the index value, the greater the diversification of exports and consequently, the better the ranking.
South Africa generally performs quite well on the diversification measures. The groups with the most diversified exports are: Chemicals, Fresh Food, Electronic Components, IT & Consumer Electronics and Textiles. The first three groups have especially well diversified exports. The least diversified products were: Non-electronic Machinery, Minerals, Misc. Manufacturing, Leather Products and Transport Equipment. Concentrated exports are not necessarily bad. For example, in the case of advanced manufactured goods, concentrated exports could mean that South Africa has become a niche exporter of a specific product. The expertise gained in the production of this good could then be extended to other advanced goods. In this case, the concentrated nature of exports of Non-electronic Machinery is due to large exports of catalytic converters. South Africa does not have comparative advantage in other goods in this group but this may develop over time. Similarly, exports of Transport Equipment is confined to small cars. Over time, these exports may extend to other Transport Equipment goods that require similar production processes (e.g. aircraft). While South Africa makes the transition, there is still the risk that exports are heavily dependent on the fortunes of one product.
Similar to the product diversification measure, we can use the same tools to quantify diversification by export markets. The groups with the most diverse export markets are: Wood Products, Basic Manufactures, Fresh Food, Chemicals and IT & Consumer Electronics. These are virtually the same products that we saw for the product diversification indices. Exports are widely dispersed, even by world standards. The groups with concentrated exports are: Minerals, Clothing, Misc. Manufacturing, Leather Products and Electronic Components. The arguments that were presented to contend that exports concentrated in terms of products were not necessarily bad do not apply to geographic concentration. High levels of market concentration carry higher levels of risk if a market turns down. Exports of Mineral and Clothing are very concentrated geographically, ranking in the last quarter globally. The problem is not nearly as severe for the other groups mentioned.
2.3 Change-related Indicators
Where the position-related indicators described a static view of each group’s trade, these next indicators attempt to show how trade is evolving. The most important indicator is the change in market share. The strength of the analysis is in explaining what led to the observed change. These indicators are calculated using a decomposition of changes in a country’s market share in the market for the imported7 product in the destination market, i.e. the combination of destination
6 The weighted average spread is defined as the ratio of the standard deviation, in the numerator, and the number of products (or countries) times the average value of the exports of the product (or exports to a country) in the denominator.
7 The ITC does not consider the breakdown of the market between domestic supply and imports
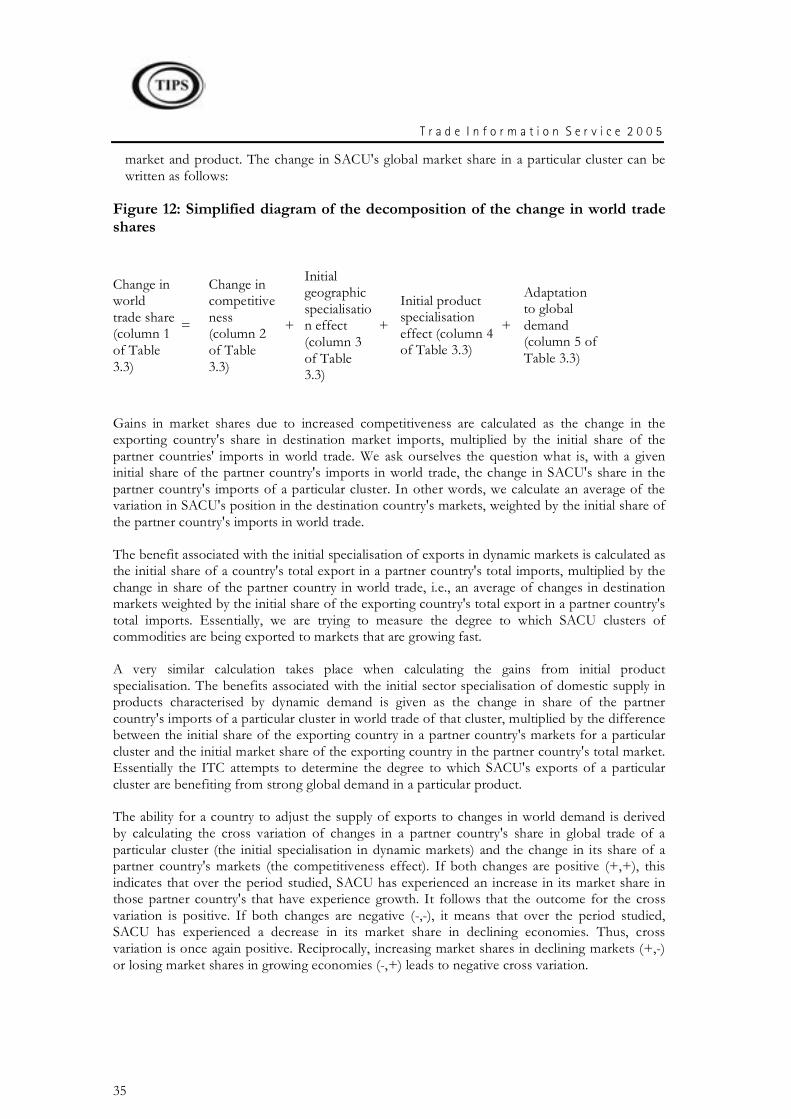
T r a d e I n f o r m a t i o n S e r v i c e 2 0 0 5
35
market and product. The change in SACU's global market share in a particular cluster can be written as follows:
Figure 12: Simplified diagram of the decomposition of the change in world trade shares
Change in world trade share (column 1 of Table 3.3)
=
Change in competitiveness (column 2 of Table 3.3)
+
Initial geographic specialisation effect (column 3 of Table 3.3)
+
Initial product specialisation effect (column 4 of Table 3.3)
+
Adaptation to global demand (column 5 of Table 3.3)
Gains in market shares due to increased competitiveness are calculated as the change in the exporting country's share in destination market imports, multiplied by the initial share of the partner countries' imports in world trade. We ask ourselves the question what is, with a given initial share of the partner country's imports in world trade, the change in SACU's share in the partner country's imports of a particular cluster. In other words, we calculate an average of the variation in SACU's position in the destination country's markets, weighted by the initial share of the partner country's imports in world trade.
The benefit associated with the initial specialisation of exports in dynamic markets is calculated as the initial share of a country's total export in a partner country's total imports, multiplied by the change in share of the partner country in world trade, i.e., an average of changes in destination markets weighted by the initial share of the exporting country's total export in a partner country's total imports. Essentially, we are trying to measure the degree to which SACU clusters of commodities are being exported to markets that are growing fast.
A very similar calculation takes place when calculating the gains from initial product specialisation. The benefits associated with the initial sector specialisation of domestic supply in products characterised by dynamic demand is given as the change in share of the partner country's imports of a particular cluster in world trade of that cluster, multiplied by the difference between the initial share of the exporting country in a partner country's markets for a particular cluster and the initial market share of the exporting country in the partner country's total market. Essentially the ITC attempts to determine the degree to which SACU's exports of a particular cluster are benefiting from strong global demand in a particular product.
The ability for a country to adjust the supply of exports to changes in world demand is derived by calculating the cross variation of changes in a partner country's share in global trade of a particular cluster (the initial specialisation in dynamic markets) and the change in its share of a partner country's markets (the competitiveness effect). If both changes are positive (+,+), this indicates that over the period studied, SACU has experienced an increase in its market share in those partner country's that have experience growth. It follows that the outcome for the cross variation is positive. If both changes are negative (-,-), it means that over the period studied, SACU has experienced a decrease in its market share in declining economies. Thus, cross variation is once again positive. Reciprocally, increasing market shares in declining markets (+,-) or losing market shares in growing economies (-,+) leads to negative cross variation.
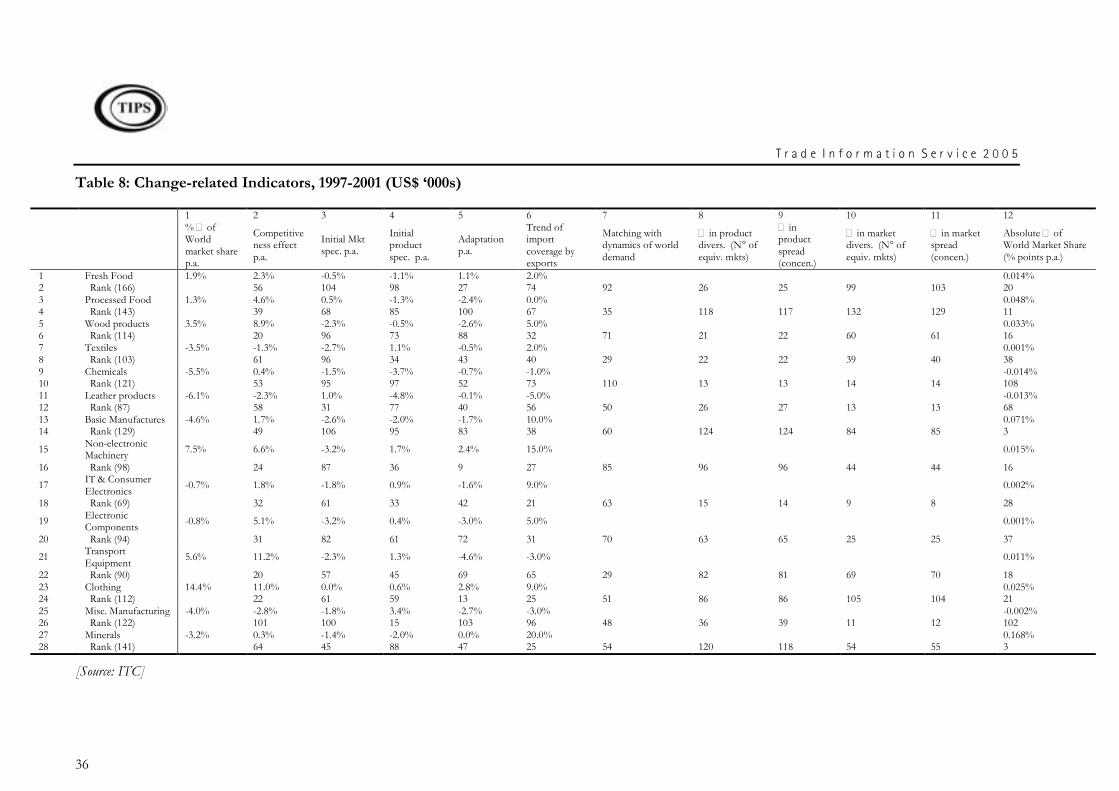
T r a d e I n f o r m a t i o n S e r v i c e 2 0 0 5
36
Table 8: Change-related Indicators, 1997-2001 (US$ ‘000s)
1 2 3 4 5 6 7 8 9 10 11 12
% � of World market share p.a.
Competitiveness effect p.a.
Initial Mkt spec. p.a.
Initial product spec. p.a.
Adaptation p.a.
Trend of import coverage by exports
Matching with dynamics of world demand
� in product divers. (N° of equiv. mkts)
� in product spread (concen.)
� in market divers. (N° of equiv. mkts)
� in market spread (concen.)
Absolute � of World Market Share (% points p.a.)
1 Fresh Food 1.9% 2.3% -0.5% -1.1% 1.1% 2.0% 0.014% 2 Rank (166) 56 104 98 27 74 92 26 25 99 103 20 3 Processed Food 1.3% 4.6% 0.5% -1.3% -2.4% 0.0% 0.048% 4 Rank (143) 39 68 85 100 67 35 118 117 132 129 11 5 Wood products 3.5% 8.9% -2.3% -0.5% -2.6% 5.0% 0.033% 6 Rank (114) 20 96 73 88 32 71 21 22 60 61 16 7 Textiles -3.5% -1.3% -2.7% 1.1% -0.5% 2.0% 0.001% 8 Rank (103) 61 96 34 43 40 29 22 22 39 40 38 9 Chemicals -5.5% 0.4% -1.5% -3.7% -0.7% -1.0% -0.014% 10 Rank (121) 53 95 97 52 73 110 13 13 14 14 108 11 Leather products -6.1% -2.3% 1.0% -4.8% -0.1% -5.0% -0.013% 12 Rank (87) 58 31 77 40 56 50 26 27 13 13 68 13 Basic Manufactures -4.6% 1.7% -2.6% -2.0% -1.7% 10.0% 0.071% 14 Rank (129) 49 106 95 83 38 60 124 124 84 85 3
15 Non-electronic Machinery 7.5% 6.6% -3.2% 1.7% 2.4% 15.0% 0.015%
16 Rank (98) 24 87 36 9 27 85 96 96 44 44 16
17 IT & Consumer Electronics
-0.7% 1.8% -1.8% 0.9% -1.6% 9.0% 0.002%
18 Rank (69) 32 61 33 42 21 63 15 14 9 8 28
19 Electronic Components -0.8% 5.1% -3.2% 0.4% -3.0% 5.0% 0.001%
20 Rank (94) 31 82 61 72 31 70 63 65 25 25 37
21 Transport Equipment
5.6% 11.2% -2.3% 1.3% -4.6% -3.0% 0.011%
22 Rank (90) 20 57 45 69 65 29 82 81 69 70 18 23 Clothing 14.4% 11.0% 0.0% 0.6% 2.8% 9.0% 0.025% 24 Rank (112) 22 61 59 13 25 51 86 86 105 104 21 25 Misc. Manufacturing -4.0% -2.8% -1.8% 3.4% -2.7% -3.0% -0.002% 26 Rank (122) 101 100 15 103 96 48 36 39 11 12 102 27 Minerals -3.2% 0.3% -1.4% -2.0% 0.0% 20.0% 0.168% 28 Rank (141) 64 45 88 47 25 54 120 118 54 55 3
[Source: ITC]
T r a d e I n f o r m a t i o n S e r v i c e 2 0 0 5
37
Even though all the SACU groups experienced growing exports, not all of them have increased the share of their world market. The only groups which have increased their share of the global export market are: Clothing, Non-electronic Machinery, Transport Equipment¸ Wood Products, Fresh Food and Processed Food. Clothing (row 23) was the best performer,
increasing market share by an astonishing 14% per annum. South Africa’s share of the world market is so small that this only translated into a 0.3 percentage point increase per annum (see column 11). This performance is unlikely to be sustained in the future as China and India come to dominate the post-MFA clothing trade. The success of South African clothing exports has been chiefly due to an increase in competitiveness. A large part of this may be due to AGOA-related exports. South African exports also adapted well to changing patterns of global demand.
Non-electronic Machinery (row 15) also performed well, boosting its share of the world market by an average of 8% per annum. Once again, the main reason behind the growth was the increase in competitiveness. Growth would have been even higher had South African exporters targeted the best markets initially. Once the mistake was made though, exporters were quick to move to quicker growing markets. The ranking for adaptation is very high at 9th.
Transport Equipment (row 21) has been targeted by the government as a strategic sector, important for attracting investment into South Africa and technology spill-overs. The rapid growth of this group shows that the Motor Industry Development Plan (MIDP) has been quite successful. The major driver of growth has been competitiveness, which is a great sign, given the global over-capacity in the world market. Unfortunately, South African exporters have been quite bad at targeting their exports, both in terms of initial specialisation and in changing target markets. There is probably little that the South African exporters can do about this due to the structure of the market and being locked into supplier contracts. The South African producers are local subsidiaries of multinational corporations. The decisions about which markets to export to are not made by the local management but are dictated by the foreign headquarters.
The two worst performing groups have been Leather Products (row 11) and Chemicals (row 9). In both cases, the main challenge that exporters face is to specialise in a more appropriate product. Neither group adapted well. Chemicals should be able to improve its performance because South Africa produces a wide variety of chemicals. The outlook for Leather Products is probably less positive.
Column 6 in Table 3.3 shows the export coverage of imports. A positive value for this indicator shows that exports are growing quicker than imports and therefore that the balance of trade for this good is moving in South Africa’s favour. Only four of the fourteen groups have negative values for this indicator. More up to date values would probably be less positive for South Africa, given the decline in exports in 2003. The four declining groups were: Chemicals, Transport Equipment, Misc. Manufacturing and Leather Products. South Africa’s trade balance in Transport Equipment remains firmly negative and is getting more negative, despite government’s efforts. Minerals (row 27) had the fastest growing export coverage over imports.
In order to rank countries according to their ability to adapt to the dynamics of world demand we use Spearman’s rank correlation between the ranking of SACU's share of export products in its world trade, and the ranking of weighted average growth trends in global exports of those products. For each country a correlation coefficient is calculated that takes a value between 1 and –1. A value of 1 reveals that, for the country under analysis, the relative importance of its exported goods is in full accordance with the ranking of world export growth rates for the same goods. The closer the index is to 1, the better the country ranking
T r a d e I n f o r m a t i o n S e r v i c e 2 0 0 5
38
under analysis. Just glancing at column 7 of Table 3.3, it is clear that South African exports have not done well in matching world demand. The highest ranking groups were: Processed Food, Textiles, Transport Equipment, Minerals and Misc. Manufacturing. Only 7 groups are ranked inside the top half compared to other countries’ exports.
Columns 8 and 9 measure the change in the product diversification measures introduced in the position-related indicators. South Africa’s performance varies widely in this respect. The groups which managed to record the best change in product diversification were: Chemicals, Fresh Food, Wood Products, IT & Consumer Electronics and Textiles. At the other end of the scale, Non-electronic Machinery, Basic Manufactures, Transport Equipment, Minerals, Processed Food and Clothing all performed poorly. The ITC only supplies a ranking for this particular indicator so it is not possible to know whether these groups just diversified their exports more slowly than other comparison countries or whether exports became more concentrated in terms of products.
Similarly to the above, columns 10 and 11 report on the change in market diversification. As before, the performance by South African exporters varies considerably but in this case, the performance is mostly poor. The sectors which were somewhat successful in diversifying their target markets were: Misc. Manufacturing, Chemicals, IT & Consumer Electronics, Leather Products and Electronic Components. The worst diversifiers were: Clothing, Processed Food, Transport Equipment, Basic Manufactures and Fresh Food.
It is interesting to note that many of the same groups that were leaders in diversifying their products, also led in diversifying markets. The same can be said of the groups that fared worse on both indicators. Thus, by the measures that ITC has supplied it would appear that some of South Africa’s exports could be easily classified as dynamic and others as stagnant. The “dynamic” groups would be Chemicals, IT & Consumer Electronics while Clothing Processed Food, Transport Equipment and Basic Manufactures would be stagnant. Unfortunately this classification collapses when one examines how the groups fared in increasing their global market share. The two “dynamic” groups reported a declining market share while some of South Africa’s best performers were classified as “stagnant”. This may mean that the key to South African export success is focussing on core markets and products. Another alternative explanation is that diversification may or may not lead to export growth, depending on the structure of the particular industry and should rather be seen as a hedge against overexposure to a small number of markets
The last column of Table 3.3 shows the absolute percentage point change in world market share. The changes are extremely small, illustrating South Africa’s small presence in the global market. The percentage point change in market share will vary widely from year to year because it is the result of two processes, namely the growth of South African exports and the growth in the world market. The method that the ITC uses to calculate growth rates is very sensitive to the stability of the series. In addition, there are only 5 observations and consequently it is possible that wild swings are reported. For this reason the results shown in this column may contradict the results in column 1.
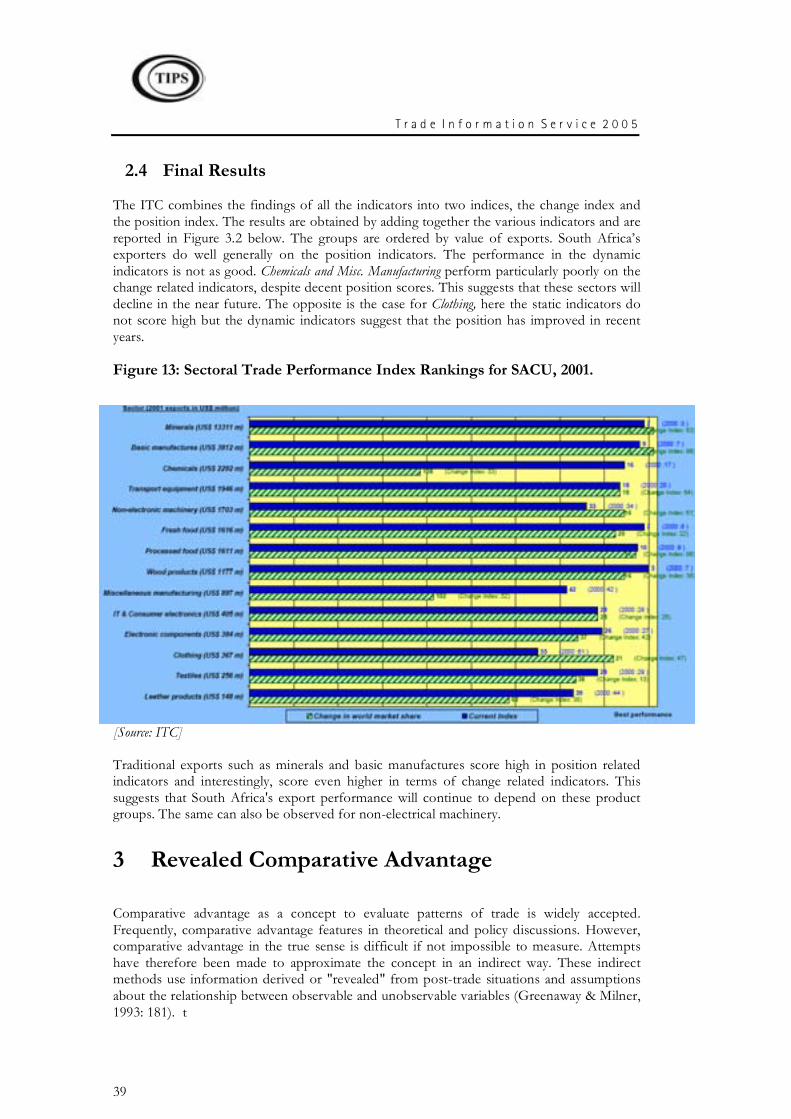
T r a d e I n f o r m a t i o n S e r v i c e 2 0 0 5
39
2.4 Final Results
The ITC combines the findings of all the indicators into two indices, the change index and the position index. The results are obtained by adding together the various indicators and are reported in Figure 3.2 below. The groups are ordered by value of exports. South Africa’s exporters do well generally on the position indicators. The performance in the dynamic indicators is not as good. Chemicals and Misc. Manufacturing perform particularly poorly on the change related indicators, despite decent position scores. This suggests that these sectors will decline in the near future. The opposite is the case for Clothing, here the static indicators do not score high but the dynamic indicators suggest that the position has improved in recent years.
Figure 13: Sectoral Trade Performance Index Rankings for SACU, 2001.
[Source: ITC]
Traditional exports such as minerals and basic manufactures score high in position related indicators and interestingly, score even higher in terms of change related indicators. This suggests that South Africa's export performance will continue to depend on these product groups. The same can also be observed for non-electrical machinery.
3 Revealed Comparative Advantage
Comparative advantage as a concept to evaluate patterns of trade is widely accepted. Frequently, comparative advantage features in theoretical and policy discussions. However, comparative advantage in the true sense is difficult if not impossible to measure. Attempts have therefore been made to approximate the concept in an indirect way. These indirect methods use information derived or "revealed" from post-trade situations and assumptions about the relationship between observable and unobservable variables (Greenaway & Milner, 1993: 181). t
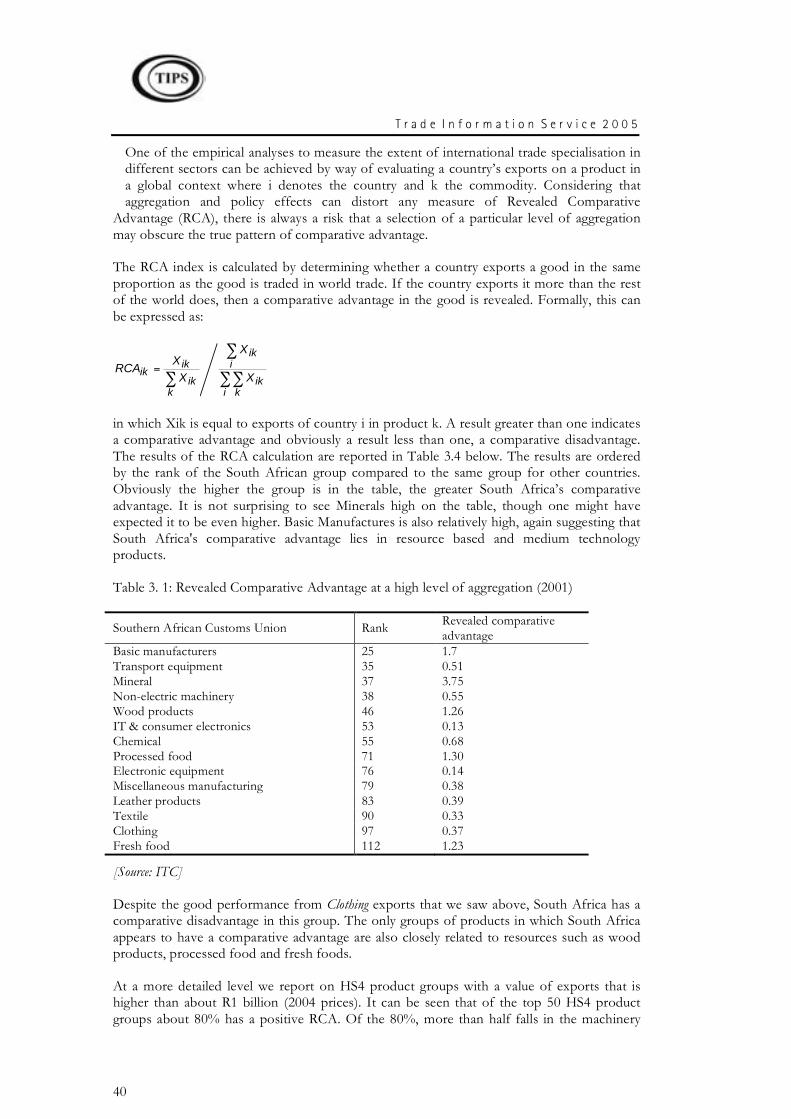
T r a d e I n f o r m a t i o n S e r v i c e 2 0 0 5
40
One of the empirical analyses to measure the extent of international trade specialisation in different sectors can be achieved by way of evaluating a country’s exports on a product in a global context where i denotes the country and k the commodity. Considering that aggregation and policy effects can distort any measure of Revealed Comparative
Advantage (RCA), there is always a risk that a selection of a particular level of aggregation may obscure the true pattern of comparative advantage.
The RCA index is calculated by determining whether a country exports a good in the same proportion as the good is traded in world trade. If the country exports it more than the rest of the world does, then a comparative advantage in the good is revealed. Formally, this can be expressed as:
!!
!
!=
i kik
iik
kik
ikik X
X
X
XRCA
in which Xik is equal to exports of country i in product k. A result greater than one indicates a comparative advantage and obviously a result less than one, a comparative disadvantage. The results of the RCA calculation are reported in Table 3.4 below. The results are ordered by the rank of the South African group compared to the same group for other countries. Obviously the higher the group is in the table, the greater South Africa’s comparative advantage. It is not surprising to see Minerals high on the table, though one might have expected it to be even higher. Basic Manufactures is also relatively high, again suggesting that South Africa's comparative advantage lies in resource based and medium technology products.
Table 3. 1: Revealed Comparative Advantage at a high level of aggregation (2001)
Southern African Customs Union Rank Revealed comparative advantage
Basic manufacturers 25 1.7 Transport equipment 35 0.51 Mineral 37 3.75 Non-electric machinery 38 0.55 Wood products 46 1.26 IT & consumer electronics 53 0.13 Chemical 55 0.68 Processed food 71 1.30 Electronic equipment 76 0.14 Miscellaneous manufacturing 79 0.38 Leather products 83 0.39 Textile 90 0.33 Clothing 97 0.37 Fresh food 112 1.23
[Source: ITC]
Despite the good performance from Clothing exports that we saw above, South Africa has a comparative disadvantage in this group. The only groups of products in which South Africa appears to have a comparative advantage are also closely related to resources such as wood products, processed food and fresh foods.
At a more detailed level we report on HS4 product groups with a value of exports that is higher than about R1 billion (2004 prices). It can be seen that of the top 50 HS4 product groups about 80% has a positive RCA. Of the 80%, more than half falls in the machinery
T r a d e I n f o r m a t i o n S e r v i c e 2 0 0 5
41
category, while the rest is diversified across a range of product groups including food & beverages, plastic products, chemicals, paper products, specialised equipment and transport equipment. Minerals is represented by coal, the largest products groups in terms of HS4 level exports. Note that the top RCAs are claimed by some unusual product
groups such as rice, footwear, vessels, soybeans and photocopy & thermocopy equipment.
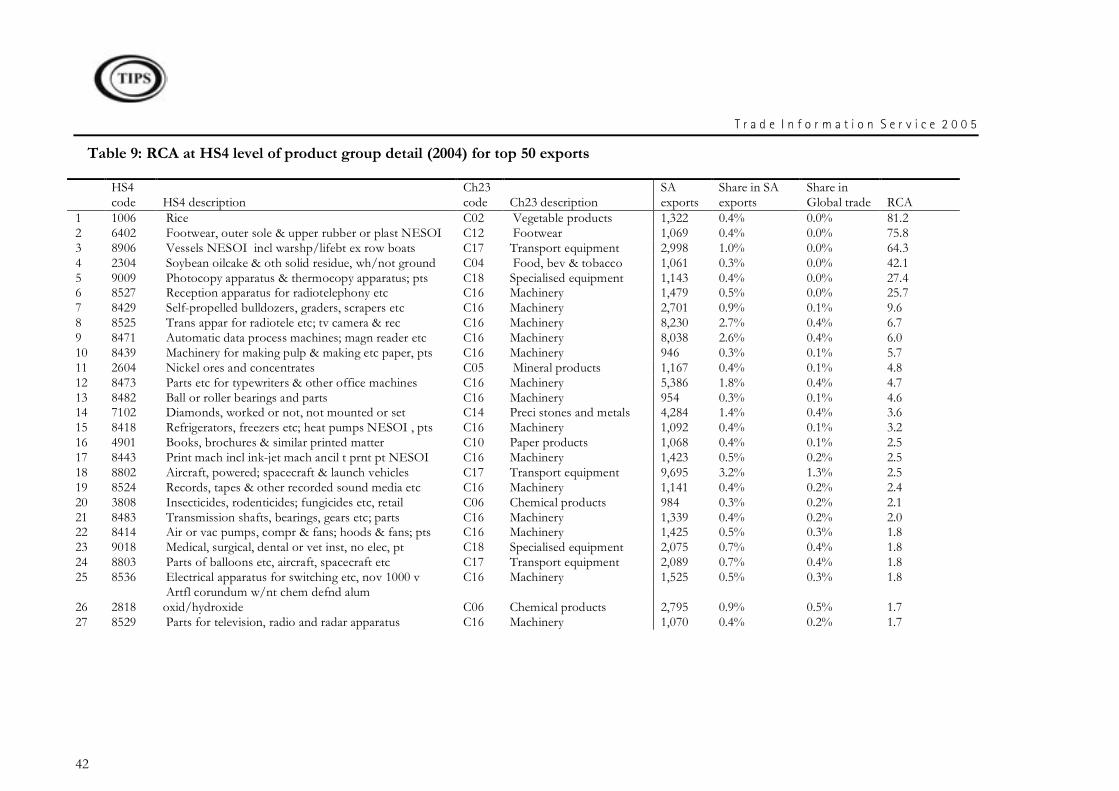
T r a d e I n f o r m a t i o n S e r v i c e 2 0 0 5
42
Table 9: RCA at HS4 level of product group detail (2004) for top 50 exports
HS4 code HS4 description
Ch23 code Ch23 description
SA exports
Share in SA exports
Share in Global trade RCA
1 1006 Rice C02 Vegetable products 1,322 0.4% 0.0% 81.2 2 6402 Footwear, outer sole & upper rubber or plast NESOI C12 Footwear 1,069 0.4% 0.0% 75.8 3 8906 Vessels NESOI incl warshp/lifebt ex row boats C17 Transport equipment 2,998 1.0% 0.0% 64.3 4 2304 Soybean oilcake & oth solid residue, wh/not ground C04 Food, bev & tobacco 1,061 0.3% 0.0% 42.1 5 9009 Photocopy apparatus & thermocopy apparatus; pts C18 Specialised equipment 1,143 0.4% 0.0% 27.4 6 8527 Reception apparatus for radiotelephony etc C16 Machinery 1,479 0.5% 0.0% 25.7 7 8429 Self-propelled bulldozers, graders, scrapers etc C16 Machinery 2,701 0.9% 0.1% 9.6 8 8525 Trans appar for radiotele etc; tv camera & rec C16 Machinery 8,230 2.7% 0.4% 6.7 9 8471 Automatic data process machines; magn reader etc C16 Machinery 8,038 2.6% 0.4% 6.0 10 8439 Machinery for making pulp & making etc paper, pts C16 Machinery 946 0.3% 0.1% 5.7 11 2604 Nickel ores and concentrates C05 Mineral products 1,167 0.4% 0.1% 4.8 12 8473 Parts etc for typewriters & other office machines C16 Machinery 5,386 1.8% 0.4% 4.7 13 8482 Ball or roller bearings and parts C16 Machinery 954 0.3% 0.1% 4.6 14 7102 Diamonds, worked or not, not mounted or set C14 Preci stones and metals 4,284 1.4% 0.4% 3.6 15 8418 Refrigerators, freezers etc; heat pumps NESOI , pts C16 Machinery 1,092 0.4% 0.1% 3.2 16 4901 Books, brochures & similar printed matter C10 Paper products 1,068 0.4% 0.1% 2.5 17 8443 Print mach incl ink-jet mach ancil t prnt pt NESOI C16 Machinery 1,423 0.5% 0.2% 2.5 18 8802 Aircraft, powered; spacecraft & launch vehicles C17 Transport equipment 9,695 3.2% 1.3% 2.5 19 8524 Records, tapes & other recorded sound media etc C16 Machinery 1,141 0.4% 0.2% 2.4 20 3808 Insecticides, rodenticides; fungicides etc, retail C06 Chemical products 984 0.3% 0.2% 2.1 21 8483 Transmission shafts, bearings, gears etc; parts C16 Machinery 1,339 0.4% 0.2% 2.0 22 8414 Air or vac pumps, compr & fans; hoods & fans; pts C16 Machinery 1,425 0.5% 0.3% 1.8 23 9018 Medical, surgical, dental or vet inst, no elec, pt C18 Specialised equipment 2,075 0.7% 0.4% 1.8 24 8803 Parts of balloons etc, aircraft, spacecraft etc C17 Transport equipment 2,089 0.7% 0.4% 1.8 25 8536 Electrical apparatus for switching etc, nov 1000 v C16 Machinery 1,525 0.5% 0.3% 1.8
26 2818 Artfl corundum w/nt chem defnd alum oxid/hydroxide C06 Chemical products 2,795 0.9% 0.5% 1.7
27 8529 Parts for television, radio and radar apparatus C16 Machinery 1,070 0.4% 0.2% 1.7
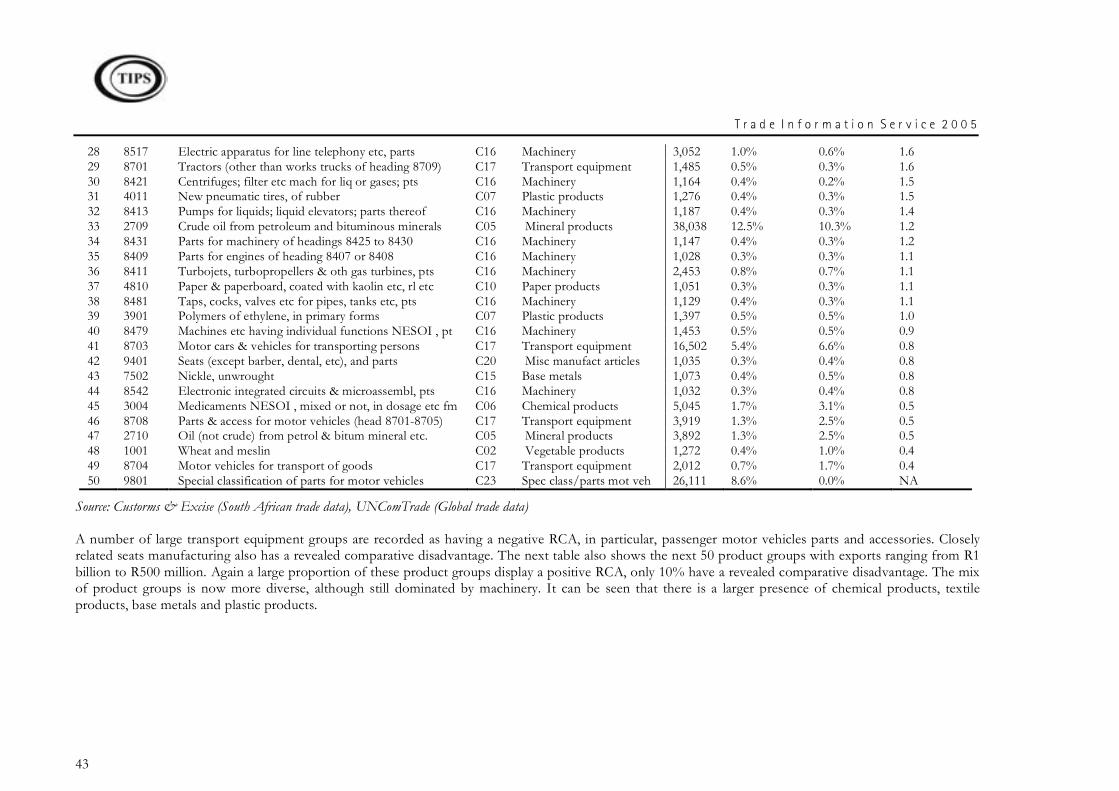
T r a d e I n f o r m a t i o n S e r v i c e 2 0 0 5
43
28 8517 Electric apparatus for line telephony etc, parts C16 Machinery 3,052 1.0% 0.6% 1.6 29 8701 Tractors (other than works trucks of heading 8709) C17 Transport equipment 1,485 0.5% 0.3% 1.6 30 8421 Centrifuges; filter etc mach for liq or gases; pts C16 Machinery 1,164 0.4% 0.2% 1.5 31 4011 New pneumatic tires, of rubber C07 Plastic products 1,276 0.4% 0.3% 1.5 32 8413 Pumps for liquids; liquid elevators; parts thereof C16 Machinery 1,187 0.4% 0.3% 1.4 33 2709 Crude oil from petroleum and bituminous minerals C05 Mineral products 38,038 12.5% 10.3% 1.2 34 8431 Parts for machinery of headings 8425 to 8430 C16 Machinery 1,147 0.4% 0.3% 1.2 35 8409 Parts for engines of heading 8407 or 8408 C16 Machinery 1,028 0.3% 0.3% 1.1 36 8411 Turbojets, turbopropellers & oth gas turbines, pts C16 Machinery 2,453 0.8% 0.7% 1.1 37 4810 Paper & paperboard, coated with kaolin etc, rl etc C10 Paper products 1,051 0.3% 0.3% 1.1 38 8481 Taps, cocks, valves etc for pipes, tanks etc, pts C16 Machinery 1,129 0.4% 0.3% 1.1 39 3901 Polymers of ethylene, in primary forms C07 Plastic products 1,397 0.5% 0.5% 1.0 40 8479 Machines etc having individual functions NESOI , pt C16 Machinery 1,453 0.5% 0.5% 0.9 41 8703 Motor cars & vehicles for transporting persons C17 Transport equipment 16,502 5.4% 6.6% 0.8 42 9401 Seats (except barber, dental, etc), and parts C20 Misc manufact articles 1,035 0.3% 0.4% 0.8 43 7502 Nickle, unwrought C15 Base metals 1,073 0.4% 0.5% 0.8 44 8542 Electronic integrated circuits & microassembl, pts C16 Machinery 1,032 0.3% 0.4% 0.8 45 3004 Medicaments NESOI , mixed or not, in dosage etc fm C06 Chemical products 5,045 1.7% 3.1% 0.5 46 8708 Parts & access for motor vehicles (head 8701-8705) C17 Transport equipment 3,919 1.3% 2.5% 0.5 47 2710 Oil (not crude) from petrol & bitum mineral etc. C05 Mineral products 3,892 1.3% 2.5% 0.5 48 1001 Wheat and meslin C02 Vegetable products 1,272 0.4% 1.0% 0.4 49 8704 Motor vehicles for transport of goods C17 Transport equipment 2,012 0.7% 1.7% 0.4 50 9801 Special classification of parts for motor vehicles C23 Spec class/parts mot veh 26,111 8.6% 0.0% NA
Source: Custorms & Excise (South African trade data), UNComTrade (Global trade data)
A number of large transport equipment groups are recorded as having a negative RCA, in particular, passenger motor vehicles parts and accessories. Closely related seats manufacturing also has a revealed comparative disadvantage. The next table also shows the next 50 product groups with exports ranging from R1 billion to R500 million. Again a large proportion of these product groups display a positive RCA, only 10% have a revealed comparative disadvantage. The mix of product groups is now more diverse, although still dominated by machinery. It can be seen that there is a larger presence of chemical products, textile products, base metals and plastic products.
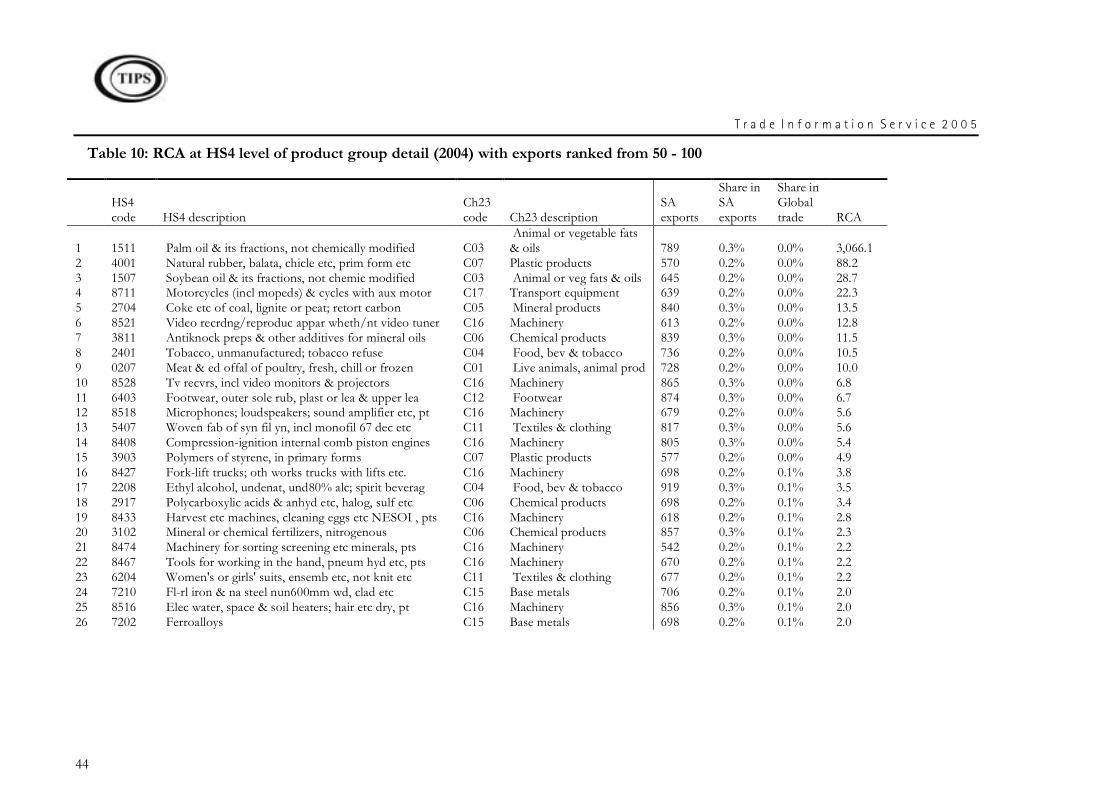
T r a d e I n f o r m a t i o n S e r v i c e 2 0 0 5
44
Table 10: RCA at HS4 level of product group detail (2004) with exports ranked from 50 - 100
HS4 code HS4 description
Ch23 code Ch23 description
SA exports
Share in SA exports
Share in Global trade RCA
1 1511 Palm oil & its fractions, not chemically modified C03 Animal or vegetable fats & oils 789 0.3% 0.0% 3,066.1
2 4001 Natural rubber, balata, chicle etc, prim form etc C07 Plastic products 570 0.2% 0.0% 88.2 3 1507 Soybean oil & its fractions, not chemic modified C03 Animal or veg fats & oils 645 0.2% 0.0% 28.7 4 8711 Motorcycles (incl mopeds) & cycles with aux motor C17 Transport equipment 639 0.2% 0.0% 22.3 5 2704 Coke etc of coal, lignite or peat; retort carbon C05 Mineral products 840 0.3% 0.0% 13.5 6 8521 Video recrdng/reproduc appar wheth/nt video tuner C16 Machinery 613 0.2% 0.0% 12.8 7 3811 Antiknock preps & other additives for mineral oils C06 Chemical products 839 0.3% 0.0% 11.5 8 2401 Tobacco, unmanufactured; tobacco refuse C04 Food, bev & tobacco 736 0.2% 0.0% 10.5 9 0207 Meat & ed offal of poultry, fresh, chill or frozen C01 Live animals, animal prod 728 0.2% 0.0% 10.0 10 8528 Tv recvrs, incl video monitors & projectors C16 Machinery 865 0.3% 0.0% 6.8 11 6403 Footwear, outer sole rub, plast or lea & upper lea C12 Footwear 874 0.3% 0.0% 6.7 12 8518 Microphones; loudspeakers; sound amplifier etc, pt C16 Machinery 679 0.2% 0.0% 5.6 13 5407 Woven fab of syn fil yn, incl monofil 67 dec etc C11 Textiles & clothing 817 0.3% 0.0% 5.6 14 8408 Compression-ignition internal comb piston engines C16 Machinery 805 0.3% 0.0% 5.4 15 3903 Polymers of styrene, in primary forms C07 Plastic products 577 0.2% 0.0% 4.9 16 8427 Fork-lift trucks; oth works trucks with lifts etc. C16 Machinery 698 0.2% 0.1% 3.8 17 2208 Ethyl alcohol, undenat, und80% alc; spirit beverag C04 Food, bev & tobacco 919 0.3% 0.1% 3.5 18 2917 Polycarboxylic acids & anhyd etc, halog, sulf etc C06 Chemical products 698 0.2% 0.1% 3.4 19 8433 Harvest etc machines, cleaning eggs etc NESOI , pts C16 Machinery 618 0.2% 0.1% 2.8 20 3102 Mineral or chemical fertilizers, nitrogenous C06 Chemical products 857 0.3% 0.1% 2.3 21 8474 Machinery for sorting screening etc minerals, pts C16 Machinery 542 0.2% 0.1% 2.2 22 8467 Tools for working in the hand, pneum hyd etc, pts C16 Machinery 670 0.2% 0.1% 2.2 23 6204 Women's or girls' suits, ensemb etc, not knit etc C11 Textiles & clothing 677 0.2% 0.1% 2.2 24 7210 Fl-rl iron & na steel nun600mm wd, clad etc C15 Base metals 706 0.2% 0.1% 2.0 25 8516 Elec water, space & soil heaters; hair etc dry, pt C16 Machinery 856 0.3% 0.1% 2.0 26 7202 Ferroalloys C15 Base metals 698 0.2% 0.1% 2.0
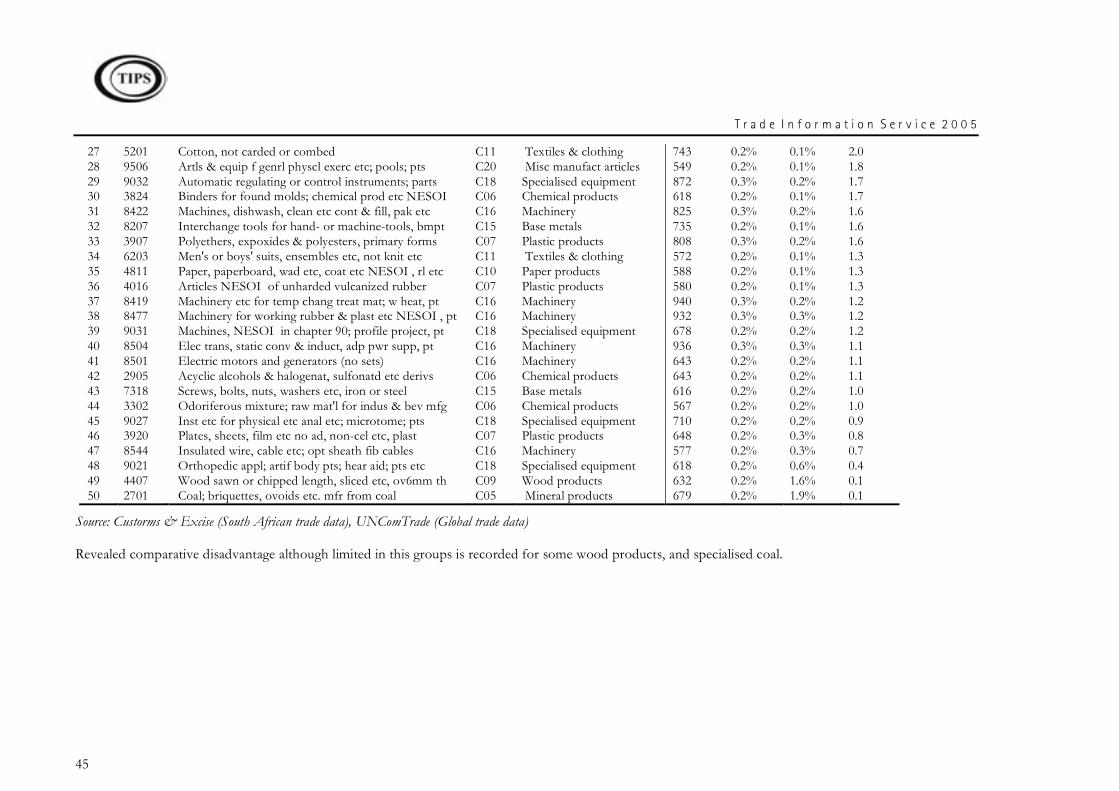
T r a d e I n f o r m a t i o n S e r v i c e 2 0 0 5
45
27 5201 Cotton, not carded or combed C11 Textiles & clothing 743 0.2% 0.1% 2.0 28 9506 Artls & equip f genrl physcl exerc etc; pools; pts C20 Misc manufact articles 549 0.2% 0.1% 1.8 29 9032 Automatic regulating or control instruments; parts C18 Specialised equipment 872 0.3% 0.2% 1.7 30 3824 Binders for found molds; chemical prod etc NESOI C06 Chemical products 618 0.2% 0.1% 1.7 31 8422 Machines, dishwash, clean etc cont & fill, pak etc C16 Machinery 825 0.3% 0.2% 1.6 32 8207 Interchange tools for hand- or machine-tools, bmpt C15 Base metals 735 0.2% 0.1% 1.6 33 3907 Polyethers, expoxides & polyesters, primary forms C07 Plastic products 808 0.3% 0.2% 1.6 34 6203 Men's or boys' suits, ensembles etc, not knit etc C11 Textiles & clothing 572 0.2% 0.1% 1.3 35 4811 Paper, paperboard, wad etc, coat etc NESOI , rl etc C10 Paper products 588 0.2% 0.1% 1.3 36 4016 Articles NESOI of unharded vulcanized rubber C07 Plastic products 580 0.2% 0.1% 1.3 37 8419 Machinery etc for temp chang treat mat; w heat, pt C16 Machinery 940 0.3% 0.2% 1.2 38 8477 Machinery for working rubber & plast etc NESOI , pt C16 Machinery 932 0.3% 0.3% 1.2 39 9031 Machines, NESOI in chapter 90; profile project, pt C18 Specialised equipment 678 0.2% 0.2% 1.2 40 8504 Elec trans, static conv & induct, adp pwr supp, pt C16 Machinery 936 0.3% 0.3% 1.1 41 8501 Electric motors and generators (no sets) C16 Machinery 643 0.2% 0.2% 1.1 42 2905 Acyclic alcohols & halogenat, sulfonatd etc derivs C06 Chemical products 643 0.2% 0.2% 1.1 43 7318 Screws, bolts, nuts, washers etc, iron or steel C15 Base metals 616 0.2% 0.2% 1.0 44 3302 Odoriferous mixture; raw mat'l for indus & bev mfg C06 Chemical products 567 0.2% 0.2% 1.0 45 9027 Inst etc for physical etc anal etc; microtome; pts C18 Specialised equipment 710 0.2% 0.2% 0.9 46 3920 Plates, sheets, film etc no ad, non-cel etc, plast C07 Plastic products 648 0.2% 0.3% 0.8 47 8544 Insulated wire, cable etc; opt sheath fib cables C16 Machinery 577 0.2% 0.3% 0.7 48 9021 Orthopedic appl; artif body pts; hear aid; pts etc C18 Specialised equipment 618 0.2% 0.6% 0.4 49 4407 Wood sawn or chipped length, sliced etc, ov6mm th C09 Wood products 632 0.2% 1.6% 0.1 50 2701 Coal; briquettes, ovoids etc. mfr from coal C05 Mineral products 679 0.2% 1.9% 0.1
Source: Custorms & Excise (South African trade data), UNComTrade (Global trade data)
Revealed comparative disadvantage although limited in this groups is recorded for some wood products, and specialised coal.
T r a d e I n f o r m a t i o n S e r v i c e 2 0 0 5
46
4 Potential Trade
The ITC estimates potential trade by using a socalled gravity model, because the computations have a passing resemblance to Newton’s universal gravity equation. Where Newton calculates the gravity between two bodies based on their mass and the distance between them, a gravity model predicts trade between two countries based on their incomes and the distance separating them. Gravity models have become a lot more sophisticated, however, in recent times. They now consider also other explanatory variables such as language or culture, transport costs, FDI and historical factors.
The ITC have named this version of their gravity model, TradeSim 2, following on from TradeSim 1 which was developed in the late-1990s. The ultimate aim of TradeSim is to estimate potential trade for developing economies. Most gravity models are used to predict trade at the aggregate level but TradeSim is different in that it operates at the sectoral level too. The formula used is as follows:
logXij=-9.01 + 1.54 logYi + 1.04 logYj + 0.11 logDensi – 0.07 logConflictij + 0.27 logFDIi + 0.85 logLiteracyi + 0.25 logLangdivi + 0.11 logTelei – 1.01 logDij + 0.9Borderij – 0.21 logTariffj + 1.18 Cultureij + uij
In which:
i : the exporting country j: the importing country Xij : trade from country i to country j Yi : GDP of country i FDIi : Per capita inward FDI stock in country i Densi : population density in country i Literacyi : literacy rate in country i Langdivi: language diversity in country i Teleij: product of telephone densities in countries i and j Dij: distance between i and j Borderij: i and j are neighbouring countries (=1) or not (=0) Tariffij: bilateral market access measure (for trade from i to j) Cultureij: bilateral measure of common culture
It is sufficient to note here that stepwise estimates have been extensively ran and all statistical tests performed, including multicollinearity diagnosis. Some variables (like arable land per capita), not reported here, were dropped given their low contribution. The data used is for trade in 1999 and 2000 but the long term structural relationships are not expected to change quickly so the delays in the data is not considered to be a problem. Total trade data is used but mineral and petrochemical exports are excluded. The reason is that these exports are based upon absolute advantage. Not all countries have these resources so any model which predicts that such countries should export minerals or oil must be questioned on its reliability.
In order to make sense of the predictions, ITC compares predicted trade against actual trade. This allows us to determine which countries SACU should theoretically be exporting more to. The results are reported in Table 3.5 below. Countries highlighted in the light shade are receiving more South African exports than one would expect given the values of the various variables. In some cases, the model accurately predicted the amount of trade taking place, these countries are not highlighted. The countries highlighted in dark shade should be
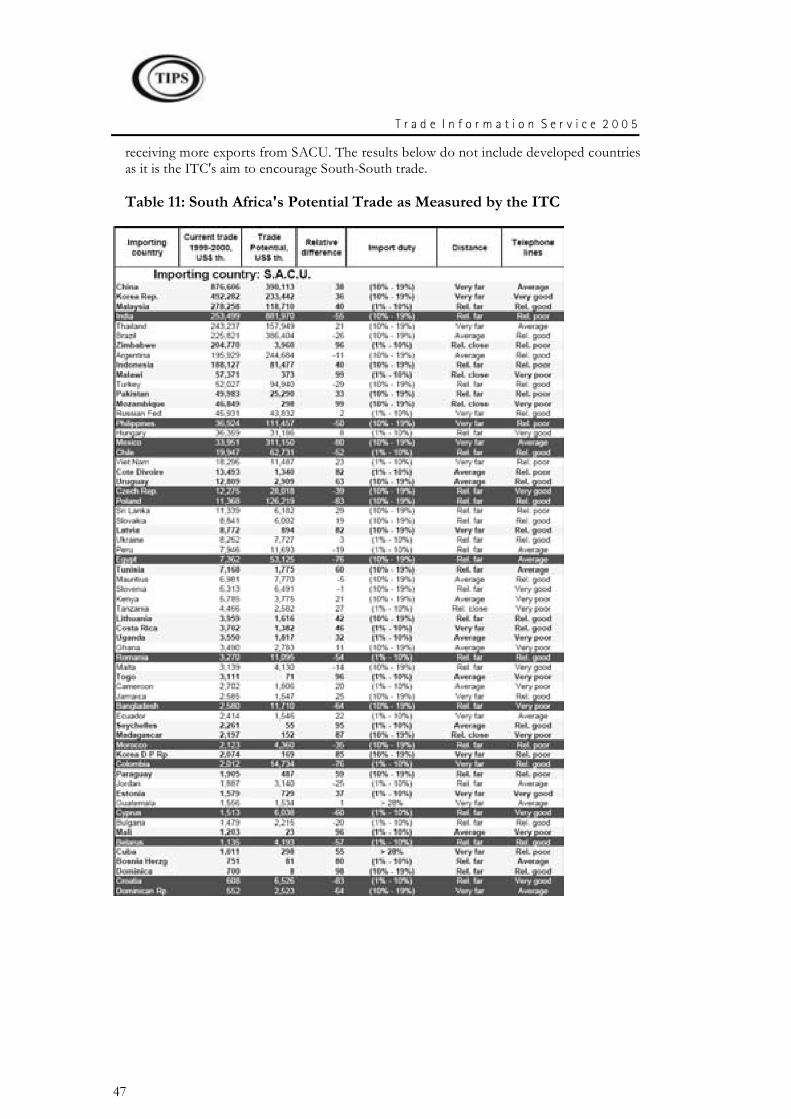
T r a d e I n f o r m a t i o n S e r v i c e 2 0 0 5
47
receiving more exports from SACU. The results below do not include developed countries as it is the ITC's aim to encourage South-South trade.
Table 11: South Africa's Potential Trade as Measured by the ITC
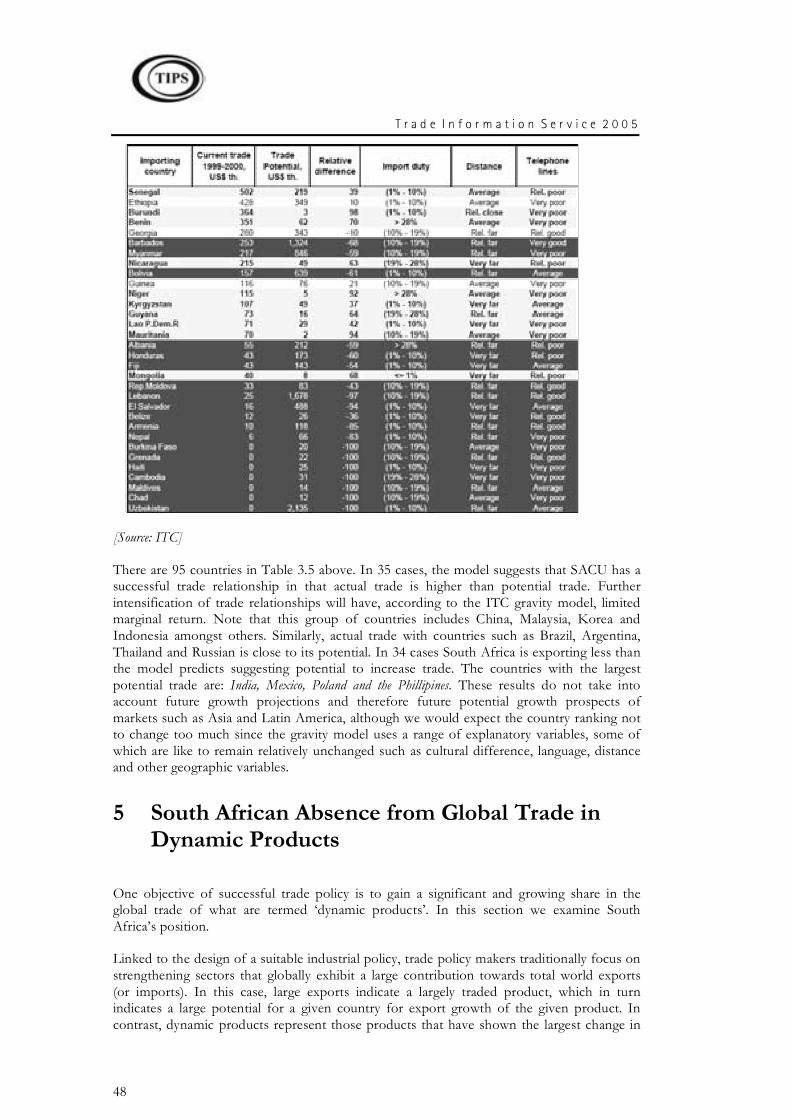
T r a d e I n f o r m a t i o n S e r v i c e 2 0 0 5
48
[Source: ITC]
There are 95 countries in Table 3.5 above. In 35 cases, the model suggests that SACU has a successful trade relationship in that actual trade is higher than potential trade. Further intensification of trade relationships will have, according to the ITC gravity model, limited marginal return. Note that this group of countries includes China, Malaysia, Korea and Indonesia amongst others. Similarly, actual trade with countries such as Brazil, Argentina, Thailand and Russian is close to its potential. In 34 cases South Africa is exporting less than the model predicts suggesting potential to increase trade. The countries with the largest potential trade are: India, Mexico, Poland and the Phillipines. These results do not take into account future growth projections and therefore future potential growth prospects of markets such as Asia and Latin America, although we would expect the country ranking not to change too much since the gravity model uses a range of explanatory variables, some of which are like to remain relatively unchanged such as cultural difference, language, distance and other geographic variables.
5 South African Absence from Global Trade in Dynamic Products
One objective of successful trade policy is to gain a significant and growing share in the global trade of what are termed ‘dynamic products’. In this section we examine South Africa’s position.
Linked to the design of a suitable industrial policy, trade policy makers traditionally focus on strengthening sectors that globally exhibit a large contribution towards total world exports (or imports). In this case, large exports indicate a largely traded product, which in turn indicates a large potential for a given country for export growth of the given product. In contrast, dynamic products represent those products that have shown the largest change in
T r a d e I n f o r m a t i o n S e r v i c e 2 0 0 5
49
proportion of total world exports (or imports) and thereby reflect sectors that are not only of considerable size, but are also growing at the most rapid rate.
The United Nations Conference on Trade and Development (UNCTAD) identifies two forms of product dynamism: demand or market dynamism and supply side dynamism (UNCTAD: 2002a). Where the former indicates products that reflect high, stable and sustained growth rates in world trade, the latter indicates products that reflect the highest potential for increases in productivity, and thus for increases in income accrued from the production of such products. The following discussion assesses demand dynamism only. In this regard, note that the WIR report calculates product demand dynamism as the increment in world market share that individual products have displayed over the period under scrutiny.
5.1 Global Trends
According to the World Investment Report (WIR, UNCTAD: 2002a) the 40 most dynamic products in world exports comprise only 5% of the 786 products identified at the SITC rev. 2 4-digit level, yet by 2000 accounted for close to 40% of total export value, and as a group grew at 12% annually over the 1985 to 2000 period (in nominal US$ terms), considerably more impressive than overall export growth of approximately 8.5% over the same period. In addition, these 40 product groups raised their market shares by a notable 15 percentage points. The methodology adopted by the WIR is similar to that implemented by UNCTAD in their report entitled ‘Trade and Development 2002 (UNCTAD, 2002b), which selected dynamic products on the basis of average annual export value growth (at the SITC rev. 2 3-digit level) between 1980 and 1998.
In a relatively more straightforward approach, the WIR selects from all world imports only those products (at 4 digits of the SITC, rev. 2) that accounted for at least 0.33% of total world trade in 2000, and ranks them according to their increase in market shares between 1985 and 2000.8 Of these, shares and values of the top 40 dynamic products, according to the WIR, are presented in column 1 to 6 of Table 1. Three manufacturing industries stand out: electronics (SITC 2-digit classifications 75 to 77), automotive and related components (SITC 2-digit classifications 71 and 78), and apparel (SITC 2-digit classifications 84). According to the WIR, in 2000 these product groups combined accounted for 23 of the 40 most dynamic products, and for almost 25% of global trade. (UNCTAD, 2002a: 147). These sectors also accounted for approximately 10 percentage points of growth in world trade over the 1985 to 2000 period.
8 For a full description of both the UNCTAD and WIR methodology see UNCTAD (2002a and 2002b)
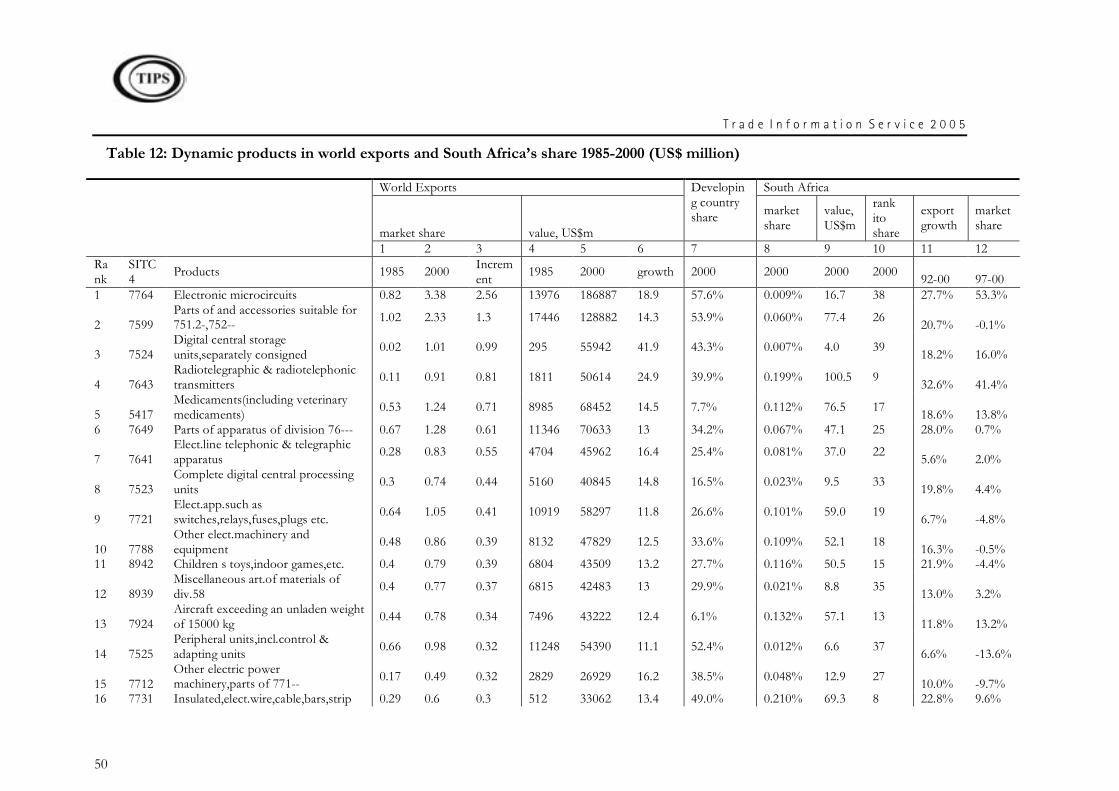
T r a d e I n f o r m a t i o n S e r v i c e 2 0 0 5
50
Table 12: Dynamic products in world exports and South Africa’s share 1985-2000 (US$ million)
World Exports South Africa
market share value, US$m
Developing country share market
share value, US$m
rank ito share
export growth
market share
1 2 3 4 5 6 7 8 9 10 11 12 Rank
SITC4 Products 1985 2000 Increm
ent 1985 2000 growth 2000 2000 2000 2000 92-00 97-00 1 7764 Electronic microcircuits 0.82 3.38 2.56 13976 186887 18.9 57.6% 0.009% 16.7 38 27.7% 53.3%
2 7599 Parts of and accessories suitable for 751.2-,752-- 1.02 2.33 1.3 17446 128882 14.3 53.9% 0.060% 77.4 26 20.7% -0.1%
3 7524 Digital central storage units,separately consigned 0.02 1.01 0.99 295 55942 41.9 43.3% 0.007% 4.0 39 18.2% 16.0%
4 7643 Radiotelegraphic & radiotelephonic transmitters 0.11 0.91 0.81 1811 50614 24.9 39.9% 0.199% 100.5 9 32.6% 41.4%
5 5417 Medicaments(including veterinary medicaments) 0.53 1.24 0.71 8985 68452 14.5 7.7% 0.112% 76.5 17 18.6% 13.8%
6 7649 Parts of apparatus of division 76--- 0.67 1.28 0.61 11346 70633 13 34.2% 0.067% 47.1 25 28.0% 0.7%
7 7641 Elect.line telephonic & telegraphic apparatus 0.28 0.83 0.55 4704 45962 16.4 25.4% 0.081% 37.0 22 5.6% 2.0%
8 7523 Complete digital central processing units 0.3 0.74 0.44 5160 40845 14.8 16.5% 0.023% 9.5 33 19.8% 4.4%
9 7721 Elect.app.such as switches,relays,fuses,plugs etc. 0.64 1.05 0.41 10919 58297 11.8 26.6% 0.101% 59.0 19 6.7% -4.8%
10 7788 Other elect.machinery and equipment 0.48 0.86 0.39 8132 47829 12.5 33.6% 0.109% 52.1 18 16.3% -0.5%
11 8942 Children s toys,indoor games,etc. 0.4 0.79 0.39 6804 43509 13.2 27.7% 0.116% 50.5 15 21.9% -4.4%
12 8939 Miscellaneous art.of materials of div.58 0.4 0.77 0.37 6815 42483 13 29.9% 0.021% 8.8 35 13.0% 3.2%
13 7924 Aircraft exceeding an unladen weight of 15000 kg 0.44 0.78 0.34 7496 43222 12.4 6.1% 0.132% 57.1 13 11.8% 13.2%
14 7525 Peripheral units,incl.control & adapting units 0.66 0.98 0.32 11248 54390 11.1 52.4% 0.012% 6.6 37 6.6% -13.6%
15 7712 Other electric power machinery,parts of 771-- 0.17 0.49 0.32 2829 26929 16.2 38.5% 0.048% 12.9 27 10.0% -9.7%
16 7731 Insulated,elect.wire,cable,bars,strip 0.29 0.6 0.3 512 33062 13.4 49.0% 0.210% 69.3 8 22.8% 9.6%
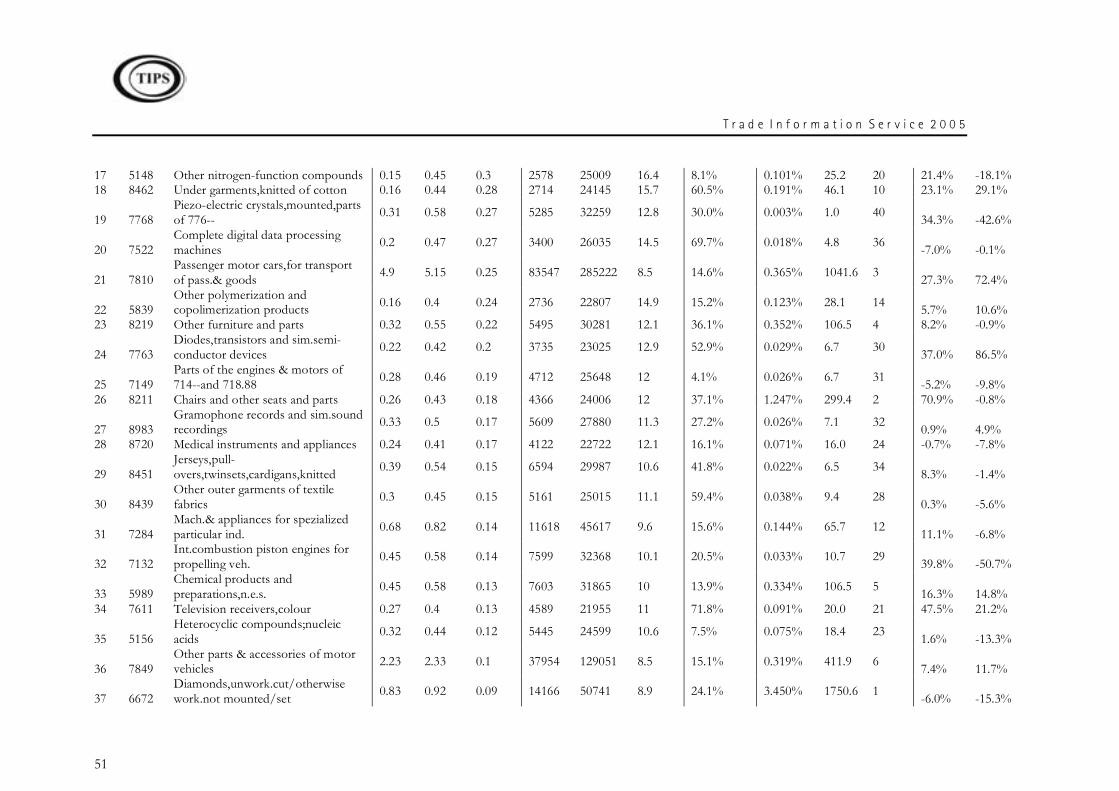
T r a d e I n f o r m a t i o n S e r v i c e 2 0 0 5
51
17 5148 Other nitrogen-function compounds 0.15 0.45 0.3 2578 25009 16.4 8.1% 0.101% 25.2 20 21.4% -18.1% 18 8462 Under garments,knitted of cotton 0.16 0.44 0.28 2714 24145 15.7 60.5% 0.191% 46.1 10 23.1% 29.1%
19 7768 Piezo-electric crystals,mounted,parts of 776-- 0.31 0.58 0.27 5285 32259 12.8 30.0% 0.003% 1.0 40 34.3% -42.6%
20 7522 Complete digital data processing machines 0.2 0.47 0.27 3400 26035 14.5 69.7% 0.018% 4.8 36 -7.0% -0.1%
21 7810 Passenger motor cars,for transport of pass.& goods 4.9 5.15 0.25 83547 285222 8.5 14.6% 0.365% 1041.6 3 27.3% 72.4%
22 5839 Other polymerization and copolimerization products 0.16 0.4 0.24 2736 22807 14.9 15.2% 0.123% 28.1 14 5.7% 10.6%
23 8219 Other furniture and parts 0.32 0.55 0.22 5495 30281 12.1 36.1% 0.352% 106.5 4 8.2% -0.9%
24 7763 Diodes,transistors and sim.semi-conductor devices 0.22 0.42 0.2 3735 23025 12.9 52.9% 0.029% 6.7 30 37.0% 86.5%
25 7149 Parts of the engines & motors of 714--and 718.88 0.28 0.46 0.19 4712 25648 12 4.1% 0.026% 6.7 31 -5.2% -9.8%
26 8211 Chairs and other seats and parts 0.26 0.43 0.18 4366 24006 12 37.1% 1.247% 299.4 2 70.9% -0.8%
27 8983 Gramophone records and sim.sound recordings 0.33 0.5 0.17 5609 27880 11.3 27.2% 0.026% 7.1 32 0.9% 4.9%
28 8720 Medical instruments and appliances 0.24 0.41 0.17 4122 22722 12.1 16.1% 0.071% 16.0 24 -0.7% -7.8%
29 8451 Jerseys,pull-overs,twinsets,cardigans,knitted 0.39 0.54 0.15 6594 29987 10.6 41.8% 0.022% 6.5 34 8.3% -1.4%
30 8439 Other outer garments of textile fabrics 0.3 0.45 0.15 5161 25015 11.1 59.4% 0.038% 9.4 28 0.3% -5.6%
31 7284 Mach.& appliances for spezialized particular ind. 0.68 0.82 0.14 11618 45617 9.6 15.6% 0.144% 65.7 12 11.1% -6.8%
32 7132 Int.combustion piston engines for propelling veh. 0.45 0.58 0.14 7599 32368 10.1 20.5% 0.033% 10.7 29 39.8% -50.7%
33 5989 Chemical products and preparations,n.e.s. 0.45 0.58 0.13 7603 31865 10 13.9% 0.334% 106.5 5 16.3% 14.8%
34 7611 Television receivers,colour 0.27 0.4 0.13 4589 21955 11 71.8% 0.091% 20.0 21 47.5% 21.2%
35 5156 Heterocyclic compounds;nucleic acids 0.32 0.44 0.12 5445 24599 10.6 7.5% 0.075% 18.4 23 1.6% -13.3%
36 7849 Other parts & accessories of motor vehicles 2.23 2.33 0.1 37954 129051 8.5 15.1% 0.319% 411.9 6 7.4% 11.7%
37 6672 Diamonds,unwork.cut/otherwise work.not mounted/set 0.83 0.92 0.09 14166 50741 8.9 24.1% 3.450% 1750.6 1 -6.0% -15.3%
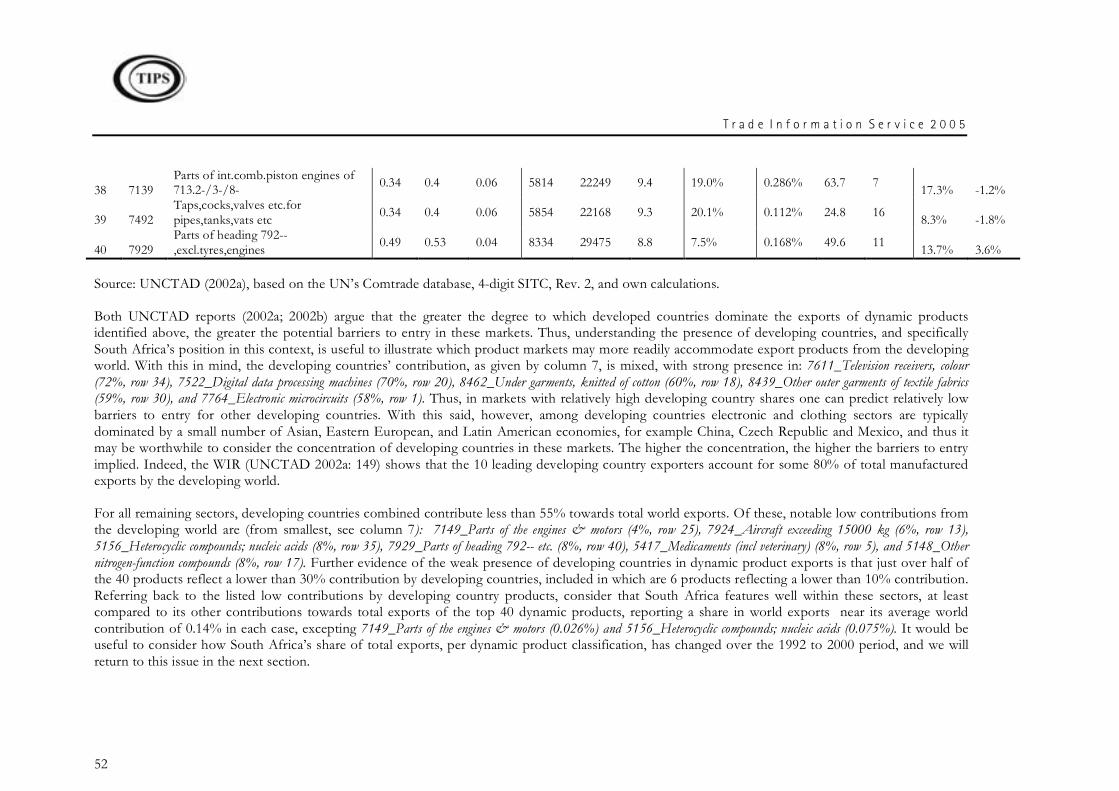
T r a d e I n f o r m a t i o n S e r v i c e 2 0 0 5
52
38 7139 Parts of int.comb.piston engines of 713.2-/3-/8- 0.34 0.4 0.06 5814 22249 9.4 19.0% 0.286% 63.7 7 17.3% -1.2%
39 7492 Taps,cocks,valves etc.for pipes,tanks,vats etc 0.34 0.4 0.06 5854 22168 9.3 20.1% 0.112% 24.8 16 8.3% -1.8%
40 7929 Parts of heading 792--,excl.tyres,engines 0.49 0.53 0.04 8334 29475 8.8 7.5% 0.168% 49.6 11 13.7% 3.6%
Source: UNCTAD (2002a), based on the UN’s Comtrade database, 4-digit SITC, Rev. 2, and own calculations.
Both UNCTAD reports (2002a; 2002b) argue that the greater the degree to which developed countries dominate the exports of dynamic products identified above, the greater the potential barriers to entry in these markets. Thus, understanding the presence of developing countries, and specifically South Africa’s position in this context, is useful to illustrate which product markets may more readily accommodate export products from the developing world. With this in mind, the developing countries’ contribution, as given by column 7, is mixed, with strong presence in: 7611_Television receivers, colour (72%, row 34), 7522_Digital data processing machines (70%, row 20), 8462_Under garments, knitted of cotton (60%, row 18), 8439_Other outer garments of textile fabrics (59%, row 30), and 7764_Electronic microcircuits (58%, row 1). Thus, in markets with relatively high developing country shares one can predict relatively low barriers to entry for other developing countries. With this said, however, among developing countries electronic and clothing sectors are typically dominated by a small number of Asian, Eastern European, and Latin American economies, for example China, Czech Republic and Mexico, and thus it may be worthwhile to consider the concentration of developing countries in these markets. The higher the concentration, the higher the barriers to entry implied. Indeed, the WIR (UNCTAD 2002a: 149) shows that the 10 leading developing country exporters account for some 80% of total manufactured exports by the developing world.
For all remaining sectors, developing countries combined contribute less than 55% towards total world exports. Of these, notable low contributions from the developing world are (from smallest, see column 7): 7149_Parts of the engines & motors (4%, row 25), 7924_Aircraft exceeding 15000 kg (6%, row 13), 5156_Heterocyclic compounds; nucleic acids (8%, row 35), 7929_Parts of heading 792-- etc. (8%, row 40), 5417_Medicaments (incl veterinary) (8%, row 5), and 5148_Other nitrogen-function compounds (8%, row 17). Further evidence of the weak presence of developing countries in dynamic product exports is that just over half of the 40 products reflect a lower than 30% contribution by developing countries, included in which are 6 products reflecting a lower than 10% contribution. Referring back to the listed low contributions by developing country products, consider that South Africa features well within these sectors, at least compared to its other contributions towards total exports of the top 40 dynamic products, reporting a share in world exports near its average world contribution of 0.14% in each case, excepting 7149_Parts of the engines & motors (0.026%) and 5156_Heterocyclic compounds; nucleic acids (0.075%). It would be useful to consider how South Africa’s share of total exports, per dynamic product classification, has changed over the 1992 to 2000 period, and we will return to this issue in the next section.
T r a d e I n f o r m a t i o n S e r v i c e 2 0 0 5
53
5.2 South Africa’s Presence and Performance in Dynamic Product Markets
We turn now to assess South Africa’s presence in dynamic products in world trade, laying the foundation for identifying the types of products that South Africa might seek to gain entry, or increase its market share. In principal, South Africa should seek a judicious mixture of products with high productivity potential and labour intensity to address the twin challenges of industrial upgrading and unemployment. These considerations are not applied in this paper, and accordingly pave the way for future research to expand upon the present findings.
5.2.1 South Africa’s Total Market Share in Top 40 Dynamic Products
Columns 8 through 10 of Table 1 give South Africa’s value of exports, and implied market share, per dynamic product category in 2000, as well as ranking the size of the market share from 1 through 40. Overall, South Africa’s market share per dynamic product group is low, with most sectors examined exhibiting a market share around the average (calculated excluding diamonds) of 0.14%, albeit with a few exceptions.9 Product groups exhibiting the largest market share for South Africa are (from highest): 6672_Diamonds etc. (3.45%, row 37), 8211_Chairs and other seats and parts (1.25%, row 26), 7810-_Passenger motor car etc. (0.37%, row 21), 8219_Other furniture and parts (0.35%, row 23), and 5989_Chemical products and preparations (0.33%, row 33). As expected, natural resources (in the form of diamonds) as well as motor vehicles and associated seats are of the most impressive dynamic sectors for South Africa. While the latter two can be related back to the Motor Industry Development Program (MIDP), it is interesting that another furniture classification features strongly, as this is not likely to be associated with the MIDP. Of importance is that developing countries together contribute less than 38% towards total export market for each of these sectors. Thus, South Africa is arguably fairing well relative to other developing economies, particularly in the case of 7810_Passenger motorcar etc., for which developing countries supply only 15% of total exports, although one could argue that South Africa is expanding exports into a market dominated and protected by developed countries. With this said, however, there is considerable scope for South Africa to expand supply into each of these five sectors.
Turning to the growth performance of the top ten SA products by market share, a worrying picture emerges. Of these top ten products, just more than half have either experienced a fall in their growth rate in the later period of 1997-00 or even worse have gone into full-blown decline in the later period. Thus, for example the insulated wire products cluster has gone from strong annual growth of 22.8% to significantly weaker growth of 9.6%. For products such as parts of engines and pistons, the performance is even worse where annual growth has gone from a healthy 17.3% to negative growth of 1.2% in the later period. What is of particular concern is that these products are already established in the export market, in many cases the branding and more generally, the export entry
9 The classification 6672_diamonds etc. exhibits a world share which more than doubles the next highest South African world share. It is thereby excluded from the average calculation to avoid incorrectly distorting the average upwards to yield a misleading result.
T r a d e I n f o r m a t i o n S e r v i c e 2 0 0 5
54
costs will have already been amortized and one would therefore expect continued strong growth in SA exports of these.
As world market growth in these products continues to be strong, we can assume that SA is losing crucial market share for these products. This should be of great concern to policymakers as it suggests that companies, having made the necessary investments in order to penetrate these export markets, are not able to grow their share or indeed in some cases, even maintain their current market share. Whilst further case-study analysis is ideally required to confirm our inferences, we believe that supply side problems are likely to be the key explanatory factor. If this is correct then an important role emerges for the dti. Generally, less resources are required to address the supply side problems of existing exporters who have already established themselves in the world market compared to trying to prepare ‘new’ exporters for competition on the world market. It may therefore be appropriate for policymakers to consider targeting or prioritising government supply side measures in favour of some of the sectors highlighted above as the cost of assisting these sectors is likely to be relatively low whilst the speed and overall benefit of having these existing exporters winning further market share is likely to be high.
The worst performers for South Africa in terms of market share of total exports are (from weakest): 7768_Piezo-electric crystals etc. (0.003%, row 19), 7524_Digital central storage units etc. (0.007%, row 3), and 7764_Electronic microcircuits (0.009%, row 1). Unfortunately for South Africa, these are higher value added products than those that South Africa appears to be more competitive in, and typically require a highly skilled labour force, something South Africa is strained for.
5.2.2 Growth of South Africa’s Dynamic Products
To benchmark the growth rates of South African exports to global exports in dynamic products, consider the last two columns of Table 1. South African export growth (per dynamic product) for the periods 1992 through 2000, as well as 1997 through 2000, are given in columns 11 and 12 respectively. We include South African product growth over both periods to determine if the average growth rate calculated is stronger towards the earlier or later period, with preference being given to those sectors exhibiting stronger than average growth over the final three years reviewed. A criticism of comparing an average annual growth rate for global exports for the period 1985 to 2000 with an average annual growth rate for SA exports for the period 1992 to 2000 is that we are not comparing like with like. However, South Africa is lacking pre-1992 data series, and thus we are compelled to use the shorter series.
Dynamic products exhibiting a stronger growth rate for South African exports than total exports, and which show even greater growth in the more recent, 1997 to 2000, period include (see columns 3 to 5): 7764_Electronic microcircuits (row 1), 7643_Radiotelegraphic & radiotelephonic transmitters (row 4), 8462_Under garments, knitted of cotton (row 18), 7810_Passenger motor cars etc. (row 21), and 7763_Diodes, transistors etc. (row 24). While one would expect these growth rates observed, of up to 37% over the full period and 86% over the later three-year period, to come off a very low base, of importance is
T r a d e I n f o r m a t i o n S e r v i c e 2 0 0 5
55
that the products associated with the 2-digit 76, 84, and 78 classifications show exports in 2000 each exceeding US$ 45m, by South African standards a relatively strong base.10
Products for which South African 1992-2000 export growth is greater than the average annual growth in world exports, but over the later 1997 to 2000 period is less, are predominantly from the SITC 2-digit 75, 76 and 77 classifications, such as: 7599_Parts of and accessories suitable for 751.2, 752-- (row 2), 5417_Medicaments (incl. veterinary) (row 5), 7649_Parts of apparatus of division 76 (row 6), 7523_Complete digital central processing units (row 8), 7788_Other elect. machinery and equipment (row 10), 8942_Childrens’ toys etc. (row 11), 7731_Insulated,elect.wire etc. (row 16), 5148_Other nitrogen-function compounds (row 17), 7768_Piezo-electric crystals etc. (row 19), 8211_Chairs and other seats and parts (row 26), 7132_Int. combustion piston engines for propelling veh. (row 32), 7611_Television receivers, colour (row 34), 7139_Parts of int. comb. piston engines etc. (row 38), and 7929_Parts of heading 792-- etc. (row 40). In these cases we may infer that sustained high growth is less likely, perhaps due to supply-side constraints given that global demand for these products is steady. We can make this presumption on the basis that these sectors are the leading demand dynamic products. Thus, we expect that only through policy interventions in the form of supply side measures will South Africa be able to increase its share in these sectors.
5.3 Conclusion
It is considered to be an important objective of South African trade policy to move away from a strictly resource based export earner to a more diversified export basket. Other countries have shown that capturing a share of global trade in dynamic products can make an important contribution to GDP and employment. We have examined various aspects of South African exports in dynamic products as defined by UNCTAD’s Trade and Development Report and the World Investment Report (UNCTAD 2002a, 2002b). The overwhelming observation is that South Africa currently has a small, unimpressive presence in the global market of dynamic products, the most significant being: diamonds, motor vehicles, car seats, other furniture and some chemicals. The shares of South African exports in this regards range from 3.5% for diamonds, to just over 1% for car seats to around 0.3% for the others.
Apart from motor vehicles, South Africa’s presence in important dynamic products such as broad commodity groups electronics and clothing is very small. According to UNCTAD and the WIR, these commodity groups do not necessarily suffer from major trade barriers, as measured by the developing countries’ share in global trade of these products.
Although South Africa’s share in dynamic products may be very small, some detailed products groups are growing at a high rate, including electronics, clothing and motor vehicles. However, within the more detailed electronics and electrical machinery product groups, the higher growth rates observed have started to fall behind global trends. Supply side measures may be called for as there appears to be sufficient demand for such products.
10 Compare to the mean South African dynamic product export amount (excluding diamonds in the calculation) of US$78.5m and the median (including diamonds) of US$32.5m.
T r a d e I n f o r m a t i o n S e r v i c e 2 0 0 5
56
We concluded our analysis by combining growth and share analysis. The latter dimension was gauged in the global as well as the South African context. In the global context we can then add certain chemical products to our list, as they display a combination of relative medium high growth and share. In the South African context we looked at the relevance of dynamic products in its export basket and identified aircrafts as a further important product group.
Improving South Africa’s performance in global trade of dynamic product is, however, an entirely different question. At least we have managed to map those products for which there appears to be some production capacity, and industry specific measures can now be considered in more detail.
6 Export Complementarity
When considering which countries to target for generic export promotion, it is important to assess the growth rates of these ‘target’ countries’ imports. However, this tells us little about the potential South African exports to this country. To assess whether South African exports are likely to be demanded by specific importing countries, we need a measure of the complementarity of South Africa’s export basket in relation to the import basket of a range of countries. Table 3.6 below thus shows the complementarity of South Africa’s top 50 exports in relation to the imports of the 50 largest importing countries. The 20 countries listed are those where South Africa’s top 50 export products are commonly imported by a particular country. For example, according to the table, both Belgium and Thailand import 24 products, which also appear in South Africa’s top 50 exports. This table assists in narrowing the list of potential target countries, but it does not tell us whether South Africa has the potential to be competitive in the particular destination market.
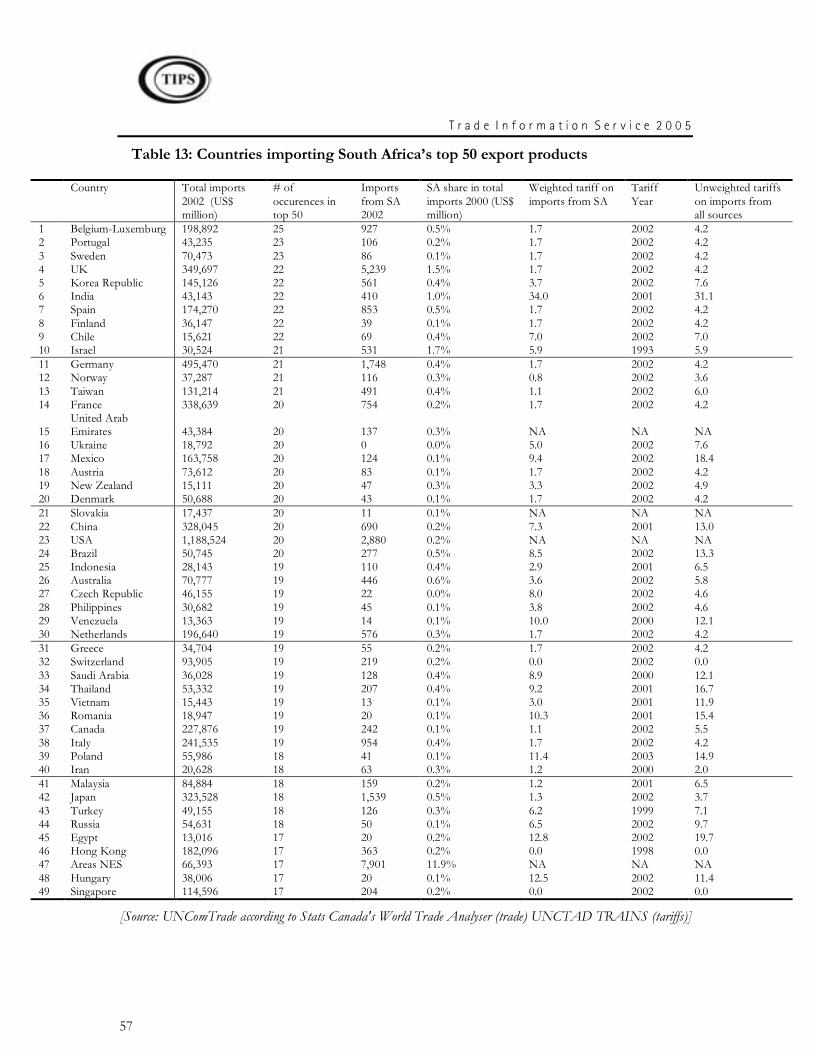
T r a d e I n f o r m a t i o n S e r v i c e 2 0 0 5
57
Table 13: Countries importing South Africa’s top 50 export products
Country Total imports 2002 (US$ million)
# of occurences in top 50
Imports from SA 2002
SA share in total imports 2000 (US$ million)
Weighted tariff on imports from SA
Tariff Year
Unweighted tariffs on imports from all sources
1 Belgium-Luxemburg 198,892 25 927 0.5% 1.7 2002 4.2 2 Portugal 43,235 23 106 0.2% 1.7 2002 4.2 3 Sweden 70,473 23 86 0.1% 1.7 2002 4.2 4 UK 349,697 22 5,239 1.5% 1.7 2002 4.2 5 Korea Republic 145,126 22 561 0.4% 3.7 2002 7.6 6 India 43,143 22 410 1.0% 34.0 2001 31.1 7 Spain 174,270 22 853 0.5% 1.7 2002 4.2 8 Finland 36,147 22 39 0.1% 1.7 2002 4.2 9 Chile 15,621 22 69 0.4% 7.0 2002 7.0 10 Israel 30,524 21 531 1.7% 5.9 1993 5.9 11 Germany 495,470 21 1,748 0.4% 1.7 2002 4.2 12 Norway 37,287 21 116 0.3% 0.8 2002 3.6 13 Taiwan 131,214 21 491 0.4% 1.1 2002 6.0 14 France 338,639 20 754 0.2% 1.7 2002 4.2
15 United Arab Emirates 43,384 20 137 0.3% NA NA NA
16 Ukraine 18,792 20 0 0.0% 5.0 2002 7.6 17 Mexico 163,758 20 124 0.1% 9.4 2002 18.4 18 Austria 73,612 20 83 0.1% 1.7 2002 4.2 19 New Zealand 15,111 20 47 0.3% 3.3 2002 4.9 20 Denmark 50,688 20 43 0.1% 1.7 2002 4.2 21 Slovakia 17,437 20 11 0.1% NA NA NA 22 China 328,045 20 690 0.2% 7.3 2001 13.0 23 USA 1,188,524 20 2,880 0.2% NA NA NA 24 Brazil 50,745 20 277 0.5% 8.5 2002 13.3 25 Indonesia 28,143 19 110 0.4% 2.9 2001 6.5 26 Australia 70,777 19 446 0.6% 3.6 2002 5.8 27 Czech Republic 46,155 19 22 0.0% 8.0 2002 4.6 28 Philippines 30,682 19 45 0.1% 3.8 2002 4.6 29 Venezuela 13,363 19 14 0.1% 10.0 2000 12.1 30 Netherlands 196,640 19 576 0.3% 1.7 2002 4.2 31 Greece 34,704 19 55 0.2% 1.7 2002 4.2 32 Switzerland 93,905 19 219 0.2% 0.0 2002 0.0 33 Saudi Arabia 36,028 19 128 0.4% 8.9 2000 12.1 34 Thailand 53,332 19 207 0.4% 9.2 2001 16.7 35 Vietnam 15,443 19 13 0.1% 3.0 2001 11.9 36 Romania 18,947 19 20 0.1% 10.3 2001 15.4 37 Canada 227,876 19 242 0.1% 1.1 2002 5.5 38 Italy 241,535 19 954 0.4% 1.7 2002 4.2 39 Poland 55,986 18 41 0.1% 11.4 2003 14.9 40 Iran 20,628 18 63 0.3% 1.2 2000 2.0 41 Malaysia 84,884 18 159 0.2% 1.2 2001 6.5 42 Japan 323,528 18 1,539 0.5% 1.3 2002 3.7 43 Turkey 49,155 18 126 0.3% 6.2 1999 7.1 44 Russia 54,631 18 50 0.1% 6.5 2002 9.7 45 Egypt 13,016 17 20 0.2% 12.8 2002 19.7 46 Hong Kong 182,096 17 363 0.2% 0.0 1998 0.0 47 Areas NES 66,393 17 7,901 11.9% NA NA NA 48 Hungary 38,006 17 20 0.1% 12.5 2002 11.4 49 Singapore 114,596 17 204 0.2% 0.0 2002 0.0
[Source: UNComTrade according to Stats Canada's World Trade Analyser (trade) UNCTAD TRAINS (tariffs)]
T r a d e I n f o r m a t i o n S e r v i c e 2 0 0 5
58
To evaluate the potential of South Africa’s exports to a particular country, we can assess the level of protection which the country offers its local manufacturers for imports from the world and imports from South Africa. The table below suggests that for many ‘target’ countries, South African producers face significantly lower trade tariffs than goods from the rest of the world. For example, we can deduce from the data that:
Belgium and South Africa have high trade complementarity (25 common products);
Belgium imports significant quantities of goods from the world (US$198bn);
South Africa has a small share of Belgium’s total imports (0.5%); and
While South African products are subjected to a tariff of only 1.7%, products from the rest of the world are subjected to an average tariff of 4.2%.
The conclusion to be drawn from this is that Belgium ranks as a high potential ‘target’ country for generic export marketing.
Countries with a relatively high level of complementarity and relatively high level of tariff protection include India, China, Brazil, Egypt, Thailand, Venezuela, Mexico and a number of Eastern European countries such as Hungary, Poland and Romania some of whose tariff have changed recently with the expansion of the EU.
Further analysis can be undertaken on a country by country basis using a menu driven system that presents three dimensions in a single graphic facility. In the case of Belgium-Luxemburg the results are shown in the next figure where growth of South African to this market are shown on the horizontal axis and growth of the relevant market's imports are shown on the vertical axis. The value of imports is represented by the size of the bubble.
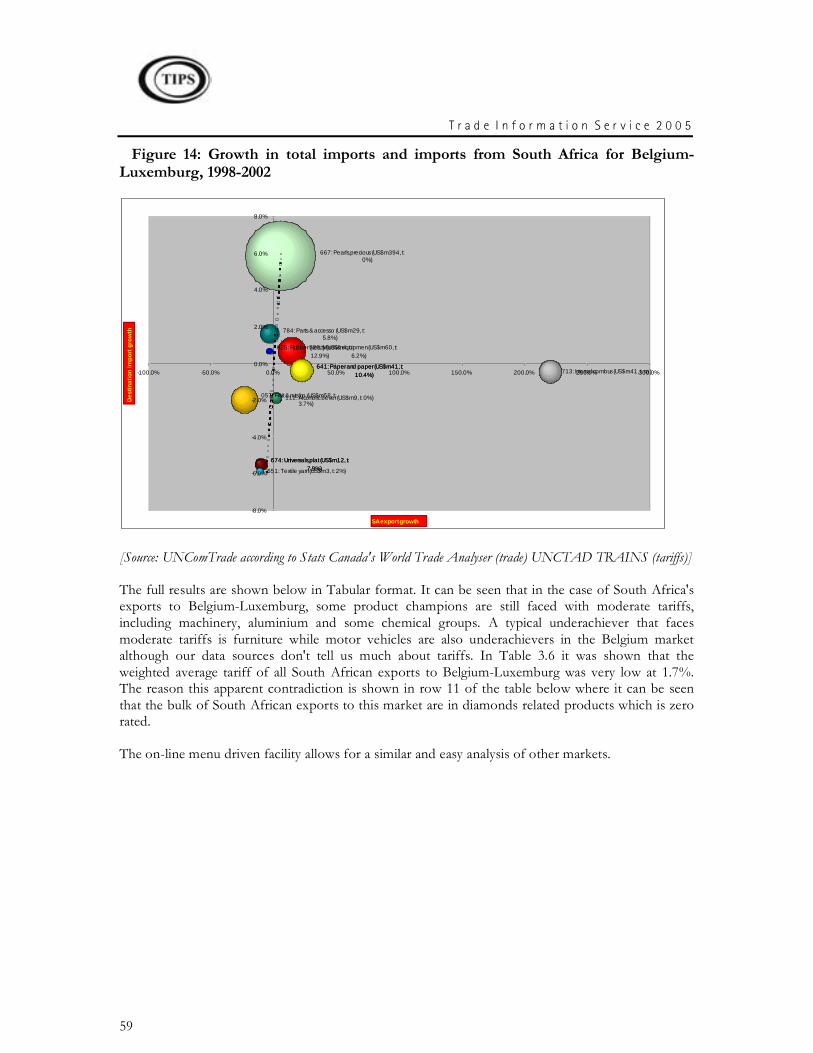
T r a d e I n f o r m a t i o n S e r v i c e 2 0 0 5
59
Figure 14: Growth in total imports and imports from South Africa for Belgium-Luxemburg, 1998-2002
057: Fruit & nuts(no (US$m58, t: 3.7%)
667: Pearls,precious (US$m394, t: 0%)
728: Mach.& equipmen (US$m60, t: 6.2%)
641: Paper and paper (US$m41, t: 10.4%)
713: Internal combus (US$m41, t: na)
112: Alcoholic bever (US$m9, t: 0%)
674: Universals,plat (US$m12, t: 7.9%)
641: Paper and paper (US$m41, t: 10.4%)
674: Universals,plat (US$m12, t: 7.9%)
784: Parts & accesso (US$m29, t: 5.8%)
625: Rubber tyres,ty (US$m4, t: 12.9%)
651: Textile yarn (US$m3, t: 2%)
-8.0%
-6.0%
-4.0%
-2.0%
0.0%
2.0%
4.0%
6.0%
8.0%
-100.0% -50.0% 0.0% 50.0% 100.0% 150.0% 200.0% 250.0% 300.0%
SA export growth
Des
tin
atio
n im
po
rt g
row
th
[Source: UNComTrade according to Stats Canada's World Trade Analyser (trade) UNCTAD TRAINS (tariffs)]
The full results are shown below in Tabular format. It can be seen that in the case of South Africa's exports to Belgium-Luxemburg, some product champions are still faced with moderate tariffs, including machinery, aluminium and some chemical groups. A typical underachiever that faces moderate tariffs is furniture while motor vehicles are also underachievers in the Belgium market although our data sources don't tell us much about tariffs. In Table 3.6 it was shown that the weighted average tariff of all South African exports to Belgium-Luxemburg was very low at 1.7%. The reason this apparent contradiction is shown in row 11 of the table below where it can be seen that the bulk of South African exports to this market are in diamonds related products which is zero rated.
The on-line menu driven facility allows for a similar and easy analysis of other markets.
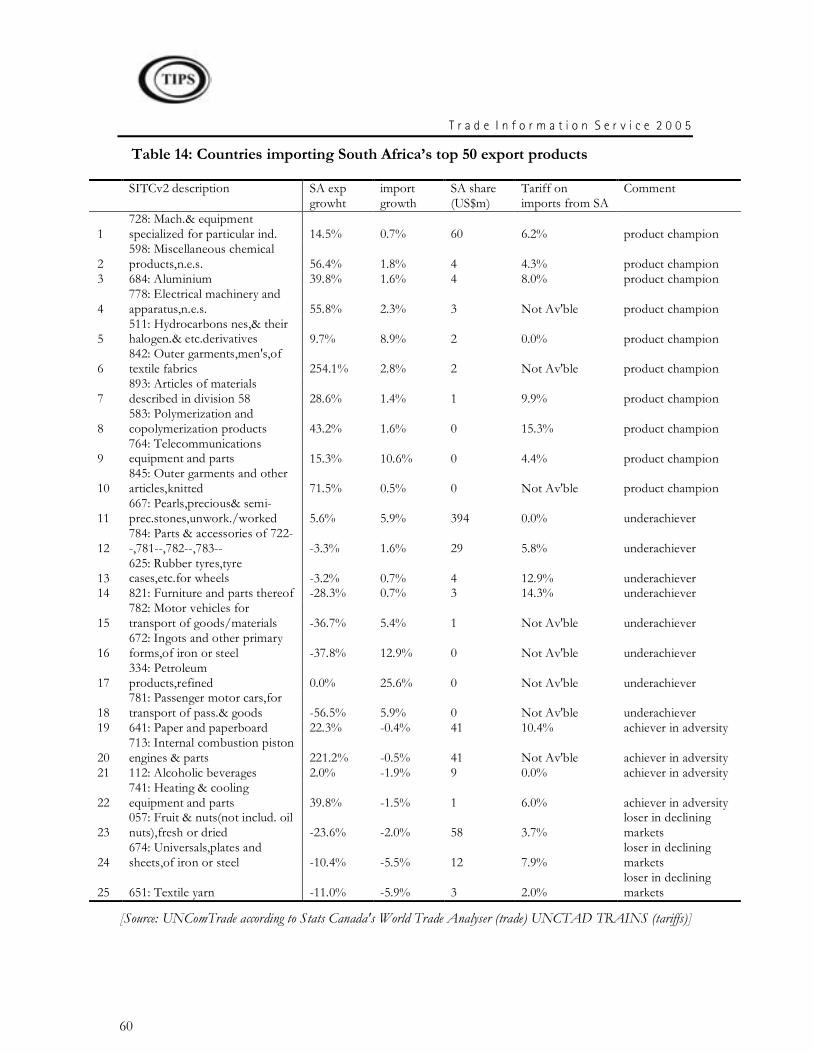
T r a d e I n f o r m a t i o n S e r v i c e 2 0 0 5
60
Table 14: Countries importing South Africa’s top 50 export products
SITCv2 description SA exp
growht import growth
SA share (US$m)
Tariff on imports from SA
Comment
1 728: Mach.& equipment specialized for particular ind. 14.5% 0.7% 60 6.2% product champion
2 598: Miscellaneous chemical products,n.e.s. 56.4% 1.8% 4 4.3% product champion
3 684: Aluminium 39.8% 1.6% 4 8.0% product champion
4 778: Electrical machinery and apparatus,n.e.s. 55.8% 2.3% 3 Not Av'ble product champion
5 511: Hydrocarbons nes,& their halogen.& etc.derivatives 9.7% 8.9% 2 0.0% product champion
6 842: Outer garments,men's,of textile fabrics 254.1% 2.8% 2 Not Av'ble product champion
7 893: Articles of materials described in division 58 28.6% 1.4% 1 9.9% product champion
8 583: Polymerization and copolymerization products 43.2% 1.6% 0 15.3% product champion
9 764: Telecommunications equipment and parts 15.3% 10.6% 0 4.4% product champion
10 845: Outer garments and other articles,knitted 71.5% 0.5% 0 Not Av'ble product champion
11 667: Pearls,precious& semi-prec.stones,unwork./worked 5.6% 5.9% 394 0.0% underachiever
12 784: Parts & accessories of 722--,781--,782--,783-- -3.3% 1.6% 29 5.8% underachiever
13 625: Rubber tyres,tyre cases,etc.for wheels -3.2% 0.7% 4 12.9% underachiever
14 821: Furniture and parts thereof -28.3% 0.7% 3 14.3% underachiever
15 782: Motor vehicles for transport of goods/materials -36.7% 5.4% 1 Not Av'ble underachiever
16 672: Ingots and other primary forms,of iron or steel -37.8% 12.9% 0 Not Av'ble underachiever
17 334: Petroleum products,refined 0.0% 25.6% 0 Not Av'ble underachiever
18 781: Passenger motor cars,for transport of pass.& goods -56.5% 5.9% 0 Not Av'ble underachiever
19 641: Paper and paperboard 22.3% -0.4% 41 10.4% achiever in adversity
20 713: Internal combustion piston engines & parts 221.2% -0.5% 41 Not Av'ble achiever in adversity
21 112: Alcoholic beverages 2.0% -1.9% 9 0.0% achiever in adversity
22 741: Heating & cooling equipment and parts 39.8% -1.5% 1 6.0% achiever in adversity
23 057: Fruit & nuts(not includ. oil nuts),fresh or dried -23.6% -2.0% 58 3.7%
loser in declining markets
24 674: Universals,plates and sheets,of iron or steel -10.4% -5.5% 12 7.9%
loser in declining markets
25 651: Textile yarn -11.0% -5.9% 3 2.0% loser in declining markets
[Source: UNComTrade according to Stats Canada's World Trade Analyser (trade) UNCTAD TRAINS (tariffs)]
T r a d e I n f o r m a t i o n S e r v i c e 2 0 0 5
61
7 References to sections 1, 2 and 3
Greenaway, D & Milner, C, 1993: Trade and inustrial policy in developing countries: a manual of policy analysis, MacMillan, London.
Mayer, M, 2005: Trade in Services - Synthesis of Research Findings, Feb05, HSRC unpublished document.
Stern, M, 2005: Botox & Bridges: South Africa's Exports of Health & Construction Services, HSRC unpublished document.
United Nations Conference on Trade and Development, 2002a. World Investment Report: Transnational Corporations and Export Competitiveness. New York and Geneva
United Nations Conference on Trade and Development 2002b. Trade and Development Report, New York and Geneva
Trade Information Service 2005
Section 4
Author: Owen Willcox
Organisation: Trade & Industrial Policy Strategies (TIPS)
Date: August 2005
lucille
T r a d e I n f o r m a t i o n S e r v i c e 2 0 0 5
1
CONTENTS
SECTION 4: AGRO-PROCESSING TRADE INFORMATION .............................................. 6 1 Review of Global Agro-Processing and Analysis of Trends .................................... 6 2 Review of South African Agro-Processing and Analysis of Trends......................... 7
3 The Domestic Sector – Trade Trends....................................................................... 9 4 Review of Agro-Processing Sub -Sectors...............................................................12
4.1 Wine ................................................................................................................12
4.1.1 Global industry analysis................................ ................................ ..............12
4.1.2 Local industry analysis................................................................................15 4.1.3 Trade Trends .............................................................................................15 4.1.4 Opportunities in the Wine Industry...............................................................16 4.1.5 The Beverages Map in the Global Context ...................................................16 4.1.6 Product Champions ....................................................................................24 4.1.7 The Beverages Map in the South African Context .........................................26
4.2 Fruits................................................................................................................31
4.2.1 Global industry analysis................................ ................................ ..............31 4.2.2 Local industry analysis................................................................................32 4.2.3 Trade Trends .............................................................................................33 4.2.4 Opportunities and Challenges for the Fruit Industry.......................................33 4.2.5 Fruit and Vegetable Map in the Global Context .............................................33 4.2.6 The Fruit and Vegetables Map Product Champions ................................ ......38 4.2.7 The Fruit and Vegetables Map in the South African Context ..........................40
4.3 Meat Products...................................................................................................42
4.3.1 Trade Trends .............................................................................................42 4.3.2 Meat Products Map in the Global Context ....................................................43 4.3.3 The Meat and Animal Products Map Product Champions ..............................45 4.3.4 The Meat Map in the South African Context .................................................47
4.4 Floriculture.......................................................................................................49
T r a d e I n f o r m a t i o n S e r v i c e 2 0 0 5
2
4.4.1 Trade Trends .............................................................................................49 4.4.2 Opportunities in the Floriculture Industry................................ ......................50 4.4.3 Floriculture Map in the Global Context .........................................................50 4.4.4 Cut Flowers and Ornamental Plants Map Product Champions .......................54 4.4.5 Floriculture Map in the South African Context ...............................................56
4.5 Aquaculture................................ ................................ ................................ ......58
4.5.1 Characteristics of the Aquaculture Industry...................................................58 4.5.2 Trade Trends .............................................................................................59 4.5.3 Fishery Products Map in the Global Context .................................................59 4.5.4 Fishery Products Product Champions ..........................................................62 4.5.5 Fishery Products Map in the South African Context ................................ ......64
4.6 Sugar Beneficiation ...........................................................................................66
4.6.1 Trade Trends .............................................................................................66 4.6.2 The Promotion of Value-Added Products and Exports...................................67 4.6.3 Sugar Products Map in Global & South African Context ................................67 4.6.4 The Sugar Map Product Champions ............................................................70 4.6.5 The Sugar Map in the South African Context ................................................73
5 Conclusions...........................................................................................................75 6 References.............................................................................................................77 7 Appendix A: HS 6 Lines Contained in the ProductMaps........................................78
T r a d e I n f o r m a t i o n S e r v i c e 2 0 0 5
3
TABLES
Table 1: General Profile of the PPI for SA's Beverages ProductMap and Selected Countries (US$’000, 1997-2001)................................ ................................ ..............................19
Table 2: Position related indicators for SA’s Beverages ProductMap and Selected Countries (US$’000, 1997-2001)................................ ................................ ..............................19
Table 3: Change related indicators for SA’s Beverages ProductMap and selected countries (US$’000, 1997-2001). .............................................................................................23
Table 4: Product Champions for the Beverages ProductMap (US$m, 1999-2003)...............25 Table 5: Exports of all ProductMaps (R'000 2003 current prices and their nominal growth over
the preceding five years) ..........................................................................................26 Table 6: Industries Supplying the Beverages Map, 2003. ..................................................28 Table 7: Direct and Indirect Contributions to GDP and Employment by the Beverages Map,
2003.......................................................................................................................30 Table 8: General Descriptive Indicators (Fruit and Vegetables) Map ..................................36 Table 9: Position Related Indicators (Fruit and Vegetables)...............................................36 Table 10: Change Related Indicators (Fruit and Vegetables) Map................................ ......37 Table 11: Product Champions for the Fruit and Vegetables ProductMap (US$m, 1999-2003)
...............................................................................................................................39 Table 12: Industries Supplying the Fruit and Vegetable Map, 2003. ...................................40 Table 13: Direct and Indirect Contributions to GDP and Employment by the Fruit and
Vegetables Map, 2003. ............................................................................................41 Table 14: General Descriptive Indicators (Meat) Map........................................................43 Table 15: Position Related Indicators (Meat) Map .............................................................44 Table 16: Change Related Indicators (Meat) Map .............................................................45 Table 17: Product Champions for the Meat ProductMap (US$m, 1999-2003) .....................46 Table 18: Industries Supplying the Meat Map, 2003. .........................................................47 Table 19: Direct and Indirect Contributions to GDP and Employment by the Meat Map, 2003
...............................................................................................................................48 Table 20: General Descriptive Indicators (Cut Flowers) Map................................ ..............51 Table 21: Position Related Indicators (Cut Flowers) Map...................................................51 Table 22: Change Related Indicators (Cut Flowers) Map...................................................53 Table 23: Product Champions for the Cut Flower and Ornamental Plants ProductMap (US$m,
1999-2003) ................................ ................................ ................................ ..............55 Table 24: Industries Supplying the Cut Flowers Map, 2003................................................56
T r a d e I n f o r m a t i o n S e r v i c e 2 0 0 5
4
Table 25: Direct and Indirect Contributions to GDP and Employment by the Cut Flowers Map, 2003. ................................ ................................ ................................ ......................57
Table 26: General Descriptive Indicators (Fisheries’ Products) Map ...................................60 Table 27: Position Related Indicators (Fisheries’ Products) Map ........................................60 Table 28: Change Related Indicators (Fisheries’ Products) Map ........................................61 Table 29: Product Champions for the Fisheries’ Products ProductMap (US$m, 1999-2003) 63 Table 30: Industries Supplying the Fisheries’ Products Map, 2003 .....................................64 Table 31: Direct and Indirect Contributions to GDP and Employment by the Fisheries’
Produc ts Map, 2003. ................................................................................................65 Table 32: General Descriptive Indicators (Sugar) Map ................................ ......................67 Table 33: Position Related Indicators (Sugar) Map ...........................................................69 Table 34: Change Related Indicators (Sugar) Map ............................................................69 Table 35: Product Champions for the Sugar ProductMap (US$m, 1999-2003). ...................71 Table 36: Industries Supplying the Sugar Map, 2003 ........................................................73 Table 37: Direct and Indirect Contributions to GDP and Employment by the Sugar Map, 2003.
...............................................................................................................................74 Table 38: HS 6 Lines Contained in the Beverages ProductMap .........................................78 Table 39: HS 6 Lines Contained in the Fruit and Vegetable ProductMap ............................79 Table 40: HS 6 Lines Contained in the Meat and Animal Products ProductMap ..................82 Table 41: HS 6 Lines Contained in the Cut Flowers ProductMap .......................................85 Table 42: HS 6 Lines Contained in the Fisheries Products ProductMap..............................86 Table 43: HS 6 Lines Contained in the Sugar, Molasses and Sugar Confectionary
ProductMap .............................................................................................................88
T r a d e I n f o r m a t i o n S e r v i c e 2 0 0 5
5
FIGURES
Figure 1: Employment by major economic sectors .............................................................. 8
Figure 2: South African Exports of Agro-processing Products, 1994-2003 (Rm)..................10 Figure 3: Revealed Comparative Advantage for Agro-Processed Goods, 1998-2003 ..........11 Figure 4: Global wine market share by country .................................................................13 Figure 5: TIPS Trade at a Glance (Wine)..........................................................................15 Figure 6: Simplified diagram of the decomposition of the change in world trade shares .......21 Figure 7: TIPS Trade at a Glance (Fruit) ..........................................................................33 Figure 8: TIPS Trade at a Glance (Meat)..........................................................................42 Figure 9: TIPS Trade at a Glance (Floriculture)…………………………………………………..49
Figure 10: TIPS Trade at a Glance (Aquaculture) .............................................................59 Figure 11: TIPS Trade at a Glance (Sugar) ................................ ................................ ......66
T r a d e I n f o r m a t i o n S e r v i c e 2 0 0 5
6
SECTION 4: AGRO-PROCESSING TRADE INFORMATION
After the broad scan of global and South African trade trends and patterns we will now continue with more in-depth survey of export performance for selected product groups or clusters. The choice of product groups is not exhaustive as it is the aim no only to update the analysis but also to expand and add product groups or clusters that are deemed to be relevant. In this section we start off with an overview of the export performance of Agro-Processing, which is one of the four following broad product groups identified in the 2005 edition of the TISA Trade Information Service. The other product groups are
§§ Chemicals
§§ Machinery
§§ Motor vehicles
and will be discussed in sections elsewhere. As it is the intention for the reader to inspect each section on its own without having to read the other sections, a degree of repetition in describing the methodologies was inevitable.
1 Review of Global Agro-Processing and Analysis of Trends
Current world trade in agricultural primary products and value added products is US$ 547bn (WTO: 2001). Africa’s export shares of total world trade in value added and primary products are 14.7% and 20.5% respectively.
Past trends in trade show that primary products have been beneficiated in the client country rather than in the supplier country. This situation has slowly begun to change, allowing for a global geographic spread of the sector value-chain. This trend has been driven by the need to produce more for less as well as the recent developments in transportation technology, which now ensures the timely delivery of quality products. In recent years developing countries have increased their share of world trade but are still struggling to increase their share of value added products in a more meaningful way. This is mainly due to the continued subsidization of agricultural production in developed countries such as the USA, EU, Canada and Japan.
Despite the Doha agreement, which provides a statement of intent by the signatories, including the countries referred to above, to liberalize their markets and reduce protective policies, very little has been done to reduce subsidies. The continuing practice of agricultural subsidies in the US and EU is effectively maintaining a balance of trade favourable to the developed nations and making it difficult for developing countries to compete.
T r a d e I n f o r m a t i o n S e r v i c e 2 0 0 5
7
Changes in global demand trends have been driven through a number of changes in consumer preferences and government trends:
§§ The increasing awareness by the public of the benefits of preventative personal health care.
§§ Governments’ growing need to reduce costs associated with health care.
§§ Food safety issues such as Mad Cow Disease, Foot & Mouth and Genetically Modified Organisms.
§§ Consumer awareness on the right to quality products.
§§ Increasing use of non-tariff barriers by governments to protect domestic producers.
These trends have given rise to increasing demands for “health” products. Products once sold in niche/specialist retailers are now found on the shelves of well known supermarket chains e.g. the shift from white wine to red wine drinking, the increase in the drink ing of teas, especially health teas in place of coffee.
Global supply trends have been driven by globalisation and the increasing ease of communication. Supermarket chains have been driving prices lower and this has been influential in the shift of production and manufacturing from the higher cost developed world producers to areas of lower cost in the developing world. Primary producers are becoming smaller and the trend in emerging supplier countries such as those in Eastern Europe is for governments to support the move from large scale farming to medium and small scale farming providing flexibility to market demands.
Demand for transparency in the supply chain is increasing producers’ costs, as even farmers must now conform to more rigorous food safety requirements and traceability requirements.
Product quality demand has increased as consumers move from processed (canned, etc) products to fresh produce, often flown overnight from the supplier country direct to the retailer country.
2 Review of South African Agro-Processing and Analysis of Trends
In South Africa, large conglomerates such as Tiger Brands, currently dominate the agro-food complex, or the manufacturing stage of processing where the most value is added. The agricultural processing industry has a current turnover of R107bn, which is about 17% of the total manufacturing sector. Products in the agro-food processed sector are complex and vary significantly. The sector employs 12% of South Africa’s economically active population. Primary
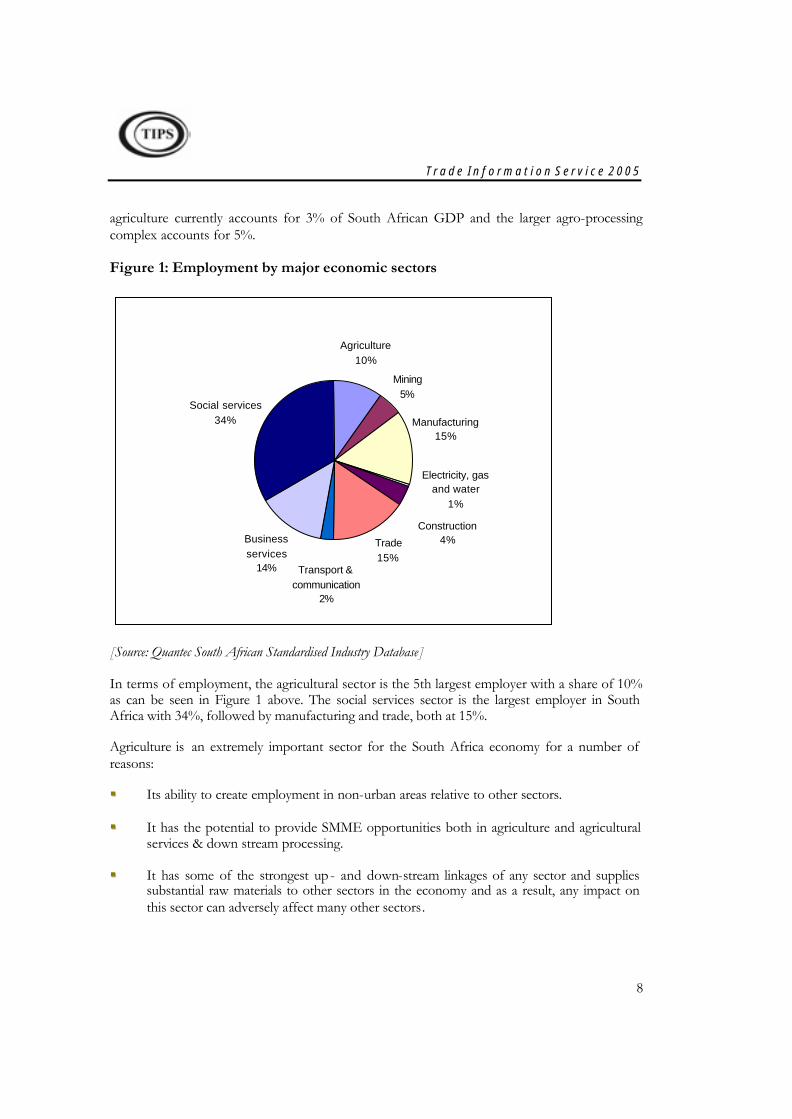
T r a d e I n f o r m a t i o n S e r v i c e 2 0 0 5
8
agriculture currently accounts for 3% of South African GDP and the larger agro-processing complex accounts for 5%.
Figure 1: Employment by major economic sectors
Mining5%
Electricity, gas and water
1%
Construction 4%Trade
15%
Business services
14%
Social services 34%
Transport & communication
2%
Agriculture10%
Manufacturing 15%
[Source: Quantec South African Standardised Industry Database]
In terms of employment, the agricultural sector is the 5th largest employer with a share of 10% as can be seen in Figure 1 above. The social services sector is the largest employer in South Africa with 34%, followed by manufacturing and trade, both at 15%.
Agriculture is an extremely important sector for the South Africa economy for a number of reasons:
§§ Its ability to create employment in non-urban areas relative to other sectors.
§§ It has the potential to provide SMME opportunities both in agriculture and agricultural services & down stream processing.
§§ It has some of the strongest up - and down-stream linkages of any sector and supplies substantial raw materials to other sectors in the economy and as a result, any impact on this sector can adversely affect many other sectors.
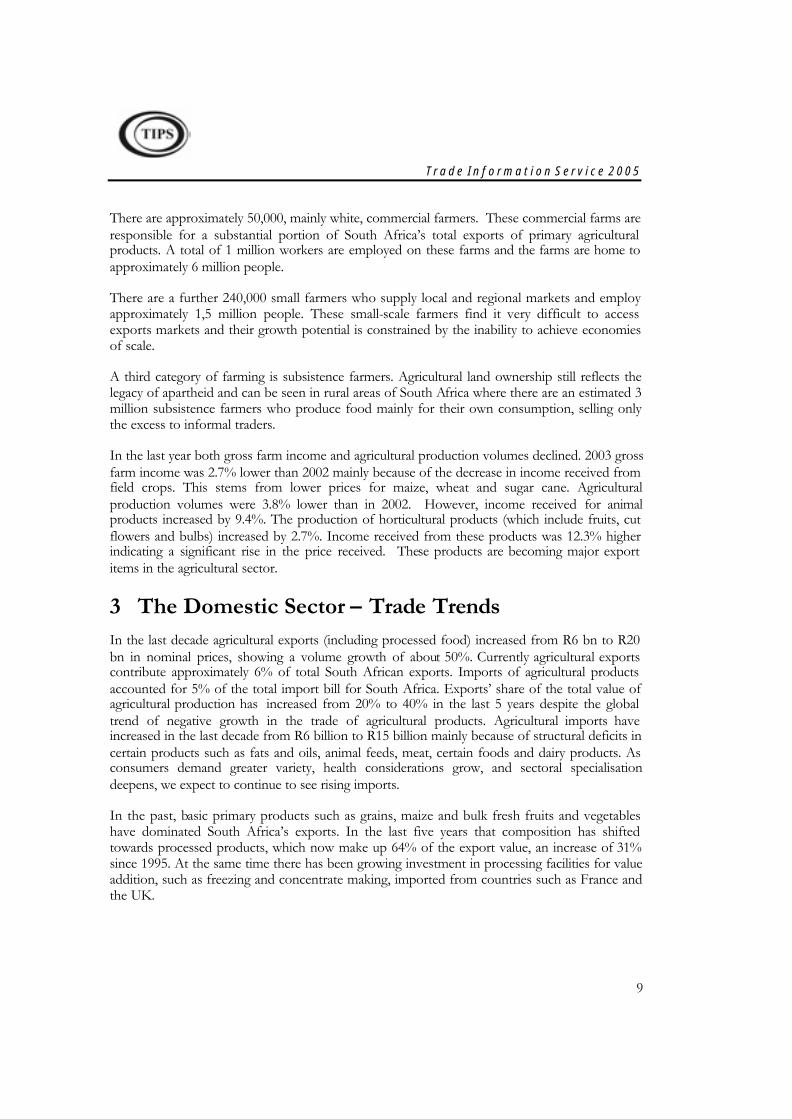
T r a d e I n f o r m a t i o n S e r v i c e 2 0 0 5
9
There are approximately 50,000, mainly white, commercial farmers. These commercial farms are responsible for a substantial portion of South Africa’s total exports of primary agricultural products. A total of 1 million workers are employed on these farms and the farms are home to approximately 6 million people.
There are a further 240,000 small farmers who supply local and regional markets and employ approximately 1,5 million people. These small-scale farmers find it very difficult to access exports markets and their growth potential is constrained by the inability to achieve economies of scale.
A third category of farming is subsistence farmers. Agricultural land ownership still reflects the legacy of apartheid and can be seen in rural areas of South Africa where there are an estimated 3 million subsistence farmers who produce food mainly for their own consumption, selling only the excess to informal traders.
In the last year both gross farm income and agricultural production volumes declined. 2003 gross farm income was 2.7% lower than 2002 mainly because of the decrease in income received from field crops. This stems from lower prices for maize, wheat and sugar cane. Agricultural production volumes were 3.8% lower than in 2002. However, income received for animal products increased by 9.4%. The production of horticultural products (which include fruits, cut flowers and bulbs) increased by 2.7%. Income received from these products was 12.3% higher indicating a significant rise in the price received. These products are becoming major export items in the agricultural sector.
3 The Domestic Sector – Trade Trends In the last decade agricultural exports (including processed food) increased from R6 bn to R20 bn in nominal prices, showing a volume growth of about 50%. Currently agricultural exports contribute approximately 6% of total South African exports. Imports of agricultural products accounted for 5% of the total import bill for South Africa. Exports’ share of the total value of agricultural production has increased from 20% to 40% in the last 5 years despite the global trend of negative growth in the trade of agricultural products. Agricultural imports have increased in the last decade from R6 billion to R15 billion mainly because of structural deficits in certain products such as fats and oils, animal feeds, meat, certain foods and dairy products. As consumers demand greater variety, health considerations grow, and sectoral specialisation deepens, we expect to continue to see rising imports.
In the past, basic primary products such as grains, maize and bulk fresh fruits and vegetables have dominated South Africa’s exports. In the last five years that composition has shifted towards processed products, which now make up 64% of the export value, an increase of 31% since 1995. At the same time there has been growing investment in processing facilities for value addition, such as freezing and concentrate making, imported from countries such as France and the UK.
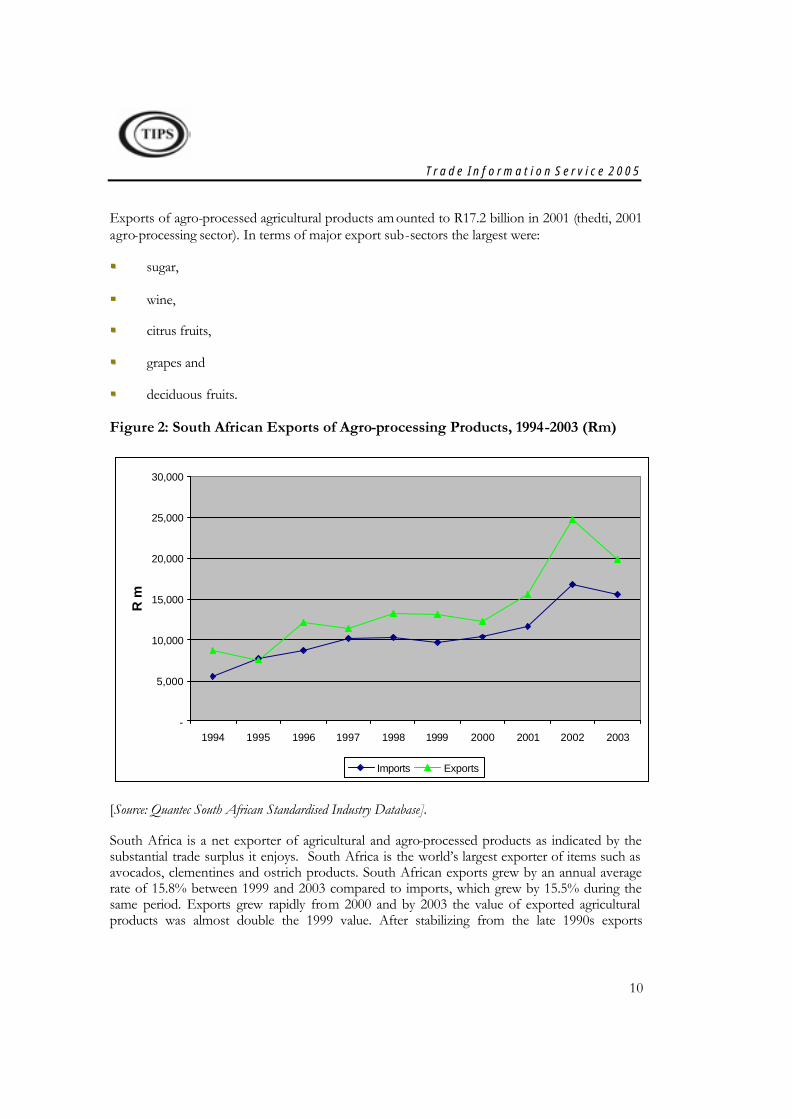
T r a d e I n f o r m a t i o n S e r v i c e 2 0 0 5
10
Exports of agro-processed agricultural products am ounted to R17.2 billion in 2001 (thedti, 2001 agro-processing sector). In terms of major export sub-sectors the largest were:
§§ sugar,
§§ wine,
§§ citrus fruits,
§§ grapes and
§§ deciduous fruits.
Figure 2: South African Exports of Agro-processing Products, 1994-2003 (Rm)
-
5,000
10,000
15,000
20,000
25,000
30,000
1994 1995 1996 1997 1998 1999 2000 2001 2002 2003
R m
Imports Exports
[Source: Quantec South African Standardised Industry Database].
South Africa is a net exporter of agricultural and agro-processed products as indicated by the substantial trade surplus it enjoys. South Africa is the world’s largest exporter of items such as avocados, clementines and ostrich products. South African exports grew by an annual average rate of 15.8% between 1999 and 2003 compared to imports, which grew by 15.5% during the same period. Exports grew rapidly from 2000 and by 2003 the value of exported agricultural products was almost double the 1999 value. After stabilizing from the late 1990s exports
T r a d e I n f o r m a t i o n S e r v i c e 2 0 0 5
11
continue to increase rapidly from 2001 until showing signs of slump from 2002 after the Rand depreciated.
Europe is still the main destination of South Africa’s agricultural products but its importance is diminishing as exporters spread their risk profiles and take advantage of new, faster growing markets becoming accessible. The top five destination countries are the UK, the Netherlands, Belgium, Japan and Mozambique. Mozambique is the only African country in the top five which is not surprising since in general it is South Africa’s number one trading partner in Africa. Japan is the fourth largest consumer of South African agro-processed products. Recent new markets in which South Africa exporters have diversified are the Middle East, some parts of Asia other than Japan, North America, SADC and West Africa. Despite this progress South African exports are still under-represented in the fastest growing priority markets.
Figure 3: Revealed Comparative Advantage for Agro-Processed Goods, 1998-2003
1.2
1.3
1.3
1.4
1.4
1.5
1.5
1.6
1998 1999 2000 2001 2002 2003
[Source: UNComTrade through WITS and own calculations]
Figure 3 above shows the results of revealed comparative advantage calculations. Revealed comparative advantage argues that a country reveals a comparative advantage in a good if its role in the country’s exports is greater than the role of the product in world trade. A value greater than one implies a comparative advantage. This is exactly what we observe in the figure above for the whole agro-processing sector. The decline in comparative advantage in 2003 is quite clear but the level does not fall below 1. It is highly unlikely that a country would lose a comparative advantage in one year. The large decline in comparative advantage is probably due to the appreciation of the exchange rate.
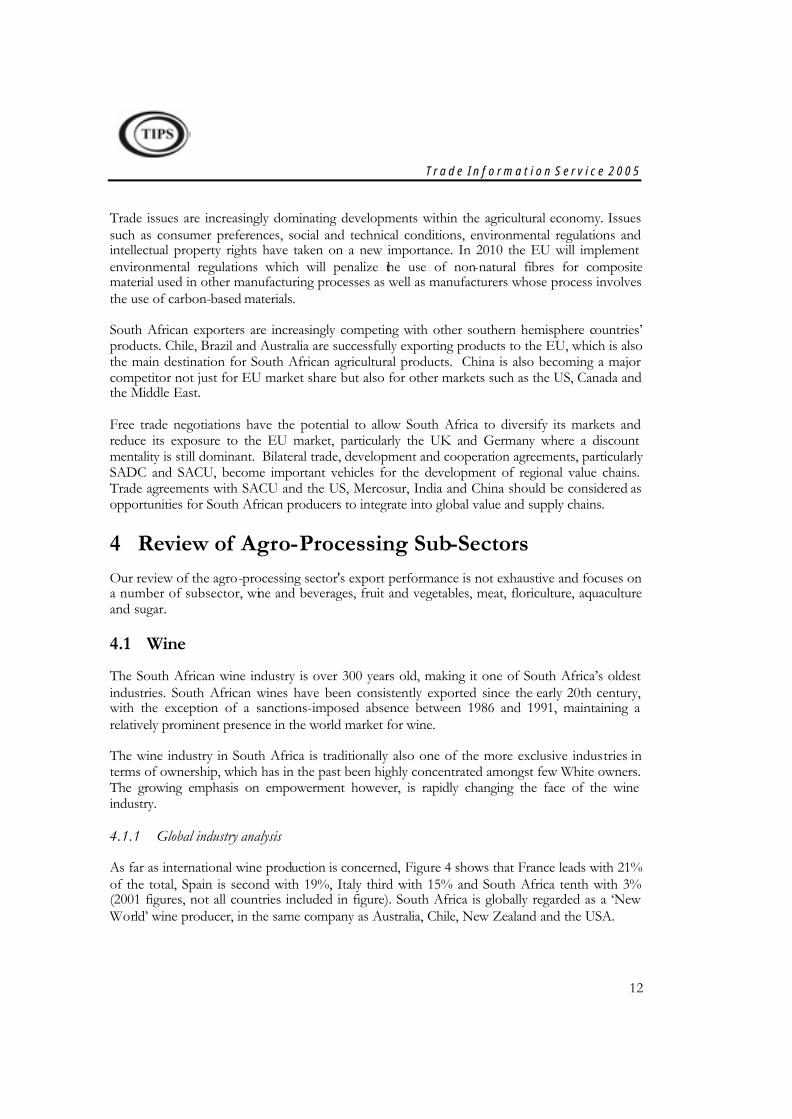
T r a d e I n f o r m a t i o n S e r v i c e 2 0 0 5
12
Trade issues are increasingly dominating developments within the agricultural economy. Issues such as consumer preferences, social and technical conditions, environmental regulations and intellectual property rights have taken on a new importance. In 2010 the EU will implement environmental regulations which will penalize the use of non-natural fibres for composite material used in other manufacturing processes as well as manufacturers whose process involves the use of carbon-based materials.
South African exporters are increasingly competing with other southern hemisphere countries’ products. Chile, Brazil and Australia are successfully exporting products to the EU, which is also the main destination for South African agricultural products. China is also becoming a major competitor not just for EU market share but also for other markets such as the US, Canada and the Middle East.
Free trade negotiations have the potential to allow South Africa to diversify its markets and reduce its exposure to the EU market, particularly the UK and Germany where a discount mentality is still dominant. Bilateral trade, development and cooperation agreements, particularly SADC and SACU, become important vehicles for the development of regional value chains. Trade agreements with SACU and the US, Mercosur, India and China should be considered as opportunities for South African producers to integrate into global value and supply chains.
4 Review of Agro-Processing Sub-Sectors Our review of the agro-processing sector's export performance is not exhaustive and focuses on a number of subsector, wine and beverages, fruit and vegetables, meat, floriculture, aquaculture and sugar.
4.1 Wine
The South African wine industry is over 300 years old, making it one of South Africa’s oldest industries. South African wines have been consistently exported since the early 20th century, with the exception of a sanctions-imposed absence between 1986 and 1991, maintaining a relatively prominent presence in the world market for wine.
The wine industry in South Africa is traditionally also one of the more exclusive industries in terms of ownership, which has in the past been highly concentrated amongst few White owners. The growing emphasis on empowerment however, is rapidly changing the face of the wine industry.
4.1.1 Global industry analysis
As far as international wine production is concerned, Figure 4 shows that France leads with 21% of the total, Spain is second with 19%, Italy third with 15% and South Africa tenth with 3% (2001 figures, not all countries included in figure). South Africa is globally regarded as a ‘New World’ wine producer, in the same company as Australia, Chile, New Zealand and the USA.
T r a d e I n f o r m a t i o n S e r v i c e 2 0 0 5
13
Figure 4: Global wine market share by country
0
5
10
15
20
25
France Italy Spain USA Argentina Australia SouthAfrica
Chile
% s
har
e
[Source: SAWIS (2004) ]
According to Rabobank, the global supply of wine grapes is expected to continue outstripping demand. The Organisation Internationale de la Vigne et du Vin (OIV) estimates that the world is currently producing about 50 million hectolitres more wine that it can consume annually, which is equivalent to around 18% of world production.
A more recent development, however, is the fear that the premium segment could be oversupplied, as a result of the heavy investments, both in the new wine countries as well as by innovators within the EU. The premium segment will be the main battleground in the wine industry over the years to come. Large retailers have the lion’s share of distribution, even in the premium wine market.
In Europe the trend towards new -world wines continues, with France and Germany being the major losers. In the UK New-World Wines claimed a 44% share of volume in the period January to June 2002. Today’s wine consumers buy more and more of their wine at supermarkets, and spend very little time buying it. Rabobank quotes figures that indicate 30% of consumers spend up to 2 minutes selecting wine, 45% between 3 and 5 minutes.
Red wine accounted for 42% of volume and 36% of value sales globally. Demand for red wine has risen consistently over the past five years driven by the perceived, widely publicized health
T r a d e I n f o r m a t i o n S e r v i c e 2 0 0 5
14
benefits as well as red wine’s fashionable status amongst younger consumers in Western European.
Euromonitor predicts continued growth for red wine with volumes increasing by 33% between 2001 and 2006. Looking ahead, Euromonitor forecasts the global wine market in 2006 will reach a total of 30,2 billion litres valued at US$194 billion and it believes that the global wine market has a number of significant growth opportunities around:
§§ Distribution through alternative channels such as the internet.
§§ Brand Development.
Global wine consumption per capita of 4.2 litres in 2001 increased by 2,4% from the previous year, recovering from a fall of the same amount in 2000. Western Europe will continue to dominate and will still account for 49% of volume and almost 48% of value sales in 2006. The significant potential (54.6% growth by value, 1997-2001) of the Chinese market will drive growth in the Asia – Pacific region.
Currently the US is the fourth largest market by volume and the second by value. US imports were also the fastest growing in 2001/2, with a recorded growth of 10.4%. This makes the US an attractive export market, especially for new world wines. However, the US has a three-tier distribution system and thus often proves a difficult market to enter. Changes in drinking habits and recovery from recession will drive growth in Eastern Europe in particular Poland, the Czech Republic and Hungary. Scandinavian countries have also increased their wine consumption and Sweden recorded the second largest growth in imports next to the US.
Global supermarket chains such as Wal-Mart, Carrefour, Ahold and Tesco have continued their expansion across continents and are continuing to drive down prices and increase competition through increasing economies of scale and more efficient category management. They are demanding fewer suppliers and bigger and better supported brands, seeking to pass responsibility all the way back down the supply chain by enforcing codes of conduct with respect to labour standards and the environment onto suppliers, while at the same time keeping costs as low as possible.
Key global industry drivers are:
§§ Shifting demand
§§ Increasing retail power
§§ Increasing competition
§§ Creating brand value
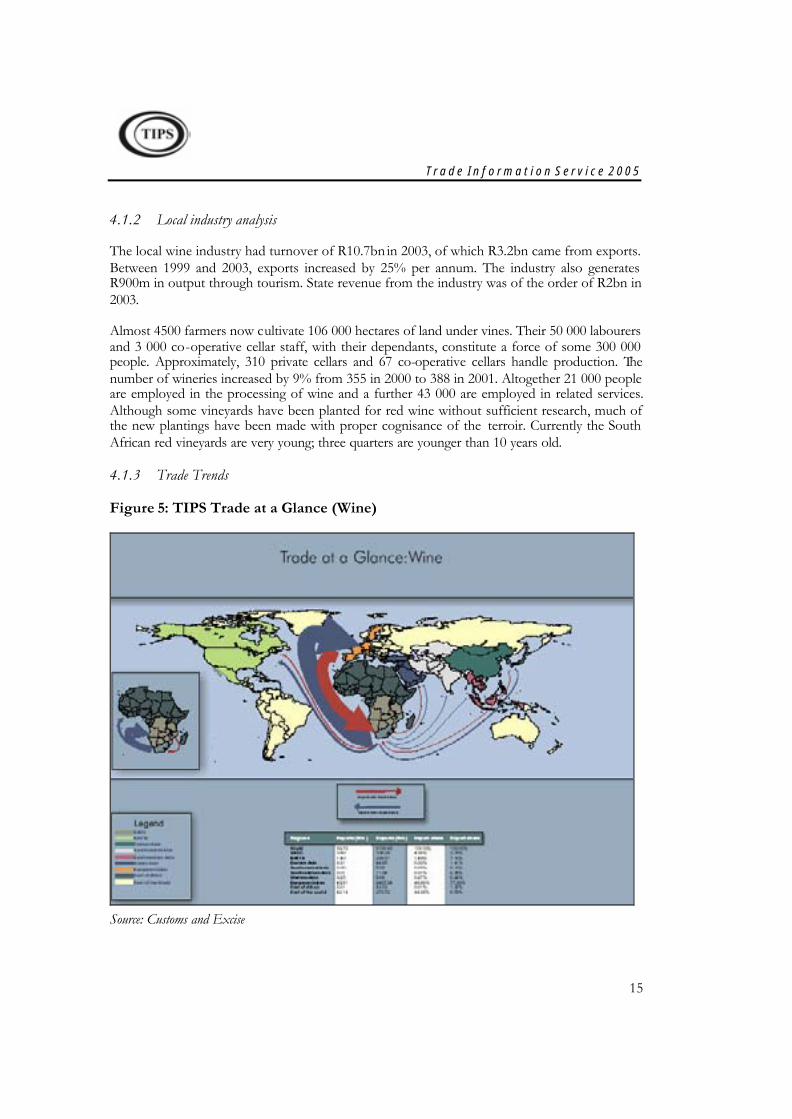
T r a d e I n f o r m a t i o n S e r v i c e 2 0 0 5
15
4.1.2 Local industry analysis
The local wine industry had turnover of R10.7bn in 2003, of which R3.2bn came from exports. Between 1999 and 2003, exports increased by 25% per annum. The industry also generates R900m in output through tourism. State revenue from the industry was of the order of R2bn in 2003.
Almost 4500 farmers now cultivate 106 000 hectares of land under vines. Their 50 000 labourers and 3 000 co-operative cellar staff, with their dependants, constitute a force of some 300 000 people. Approximately, 310 private cellars and 67 co-operative cellars handle production. The number of wineries increased by 9% from 355 in 2000 to 388 in 2001. Altogether 21 000 people are employed in the processing of wine and a further 43 000 are employed in related services. Although some vineyards have been planted for red wine without sufficient research, much of the new plantings have been made with proper cognisance of the terroir. Currently the South African red vineyards are very young; three quarters are younger than 10 years old.
4.1.3 Trade Trends
Figure 5: TIPS Trade at a Glance (Wine)
Source: Customs and Excise
T r a d e I n f o r m a t i o n S e r v i c e 2 0 0 5
16
4.1.4 Opportunities in the Wine Industry
Exports have in the past decade been constrained by a lack of red wine. The growth of red wine exports is currently 50% higher than that of white wine. In South Africa, nine companies make up 50% of exports sales, with the biggest holding about 10%. The other 50% is made up of many small and medium sized enterprises.
Changes needed include:
§§ changes in the varieties produced,
§§ a stronger market orientation supported by a sound marketing strategy,
§§ site – specific winemaking for niche markets,
§§ development style based country–branding, and
§§ an industry marketing research capability, which will provide generic marketing services to the whole industry.
Historically, previously disadvantaged individuals have provided the labour on which the industry is based. Currently, over 100 000 people from historically disadvantaged groups are employed directly in the industry, which supports a total of over 215 000 jobs in the wider economy. The wine industry is in the process of transforming both in terms of wine farm management as well as winemaking. The South African Wine Industry Trust has also piloted a scheme designed to advance black ownership in wine ventures by taking equity in potentially viable projects and warehousing shares on behalf of wine-farm worker communities. There have also been a number of private initiatives to extend vineyard ownership to communities living in winemaking regions, where proceeds from wine sales are used to improve the quality of life of residents. While these initiatives are commendable it is crucial that such a process does not take place haphazardly but that new entrants to the industry are trained adequately and provided with genuine and sustainable support.
4.1.5 The Beverages Map in the Global Context
In this section we look in more detailed at the “beverage industry” in a global context. We assume that the “beverage industry” is representative for the wine industry in this regard as the latter represents the largest part of South Africa’s “Beverages” exports. Other product groups included under “Beverages” are waters, cordials, liqueurs, whisky, rum and vodka but exports of wine and its associated products make up about three quarters of the map’s trade for South Africa. The next largest contributors are mineral water (12%) and beer (8%). Fruit juices are dealt with elsewhere. As with all of the ProductMap groups, a full listing of the HS 6 groups in the ProductMap can be found in Appendix A, in this case in Table 38.
T r a d e I n f o r m a t i o n S e r v i c e 2 0 0 5
17
We use the Product Performance Index (PPI), a tool developed by the International Trade Centre (ITC) for assessing and monitoring the multi-faceted dimensions of export performance and competitiveness of countries and their principal export sectors. At present, the PPI covers 184 countries and 72 different sectors. It reveals how competitive and diversified a particular export sector is in comparison to those of other countries. The PPI covers basic performance characteristics. It brings out gains and losses in world market shares and sheds light on the factors behind these changes. Moreover, it monitors the diversification of export products and markets. The PPI provides a systematic overview of sectoral export performance and comparative and competitive advantages.
The PPI is derived from Trade Performance Index (TPI) methodology, developed by the ITC (see http://www.intracen.org/services/mas). This section is therefore drawn and adapted from the ITC's explanatory notes on the TPI.
The PPI identifies three main components, each containing a number of indices. Some of these indices are taken along in a ranking system while others are not. The components are:
§§ A general profile of a country's trade in a particular product group (or “map”)
§§ Indicators on the position and what is essentially a static view of the country’s most recent export performance
§§ Indicators on changes in the export performance which capture major trends over the recent past.
Countries are ranked amongst the 184 participants in the database although the ProductMap for each country may not have all 184 countries participating. The PPI is based on the COMTRADE database of the UN Statistics Division. Altogether, the TPI and therefore the PPI consists of about two dozen quantitative performance indicators. For ease of reference, these indicators are presented in absolute terms and, in addition, as ranked among the 184 countries covered by the TPI and PPI where possible. Moreover, two composite rankings are calculated, one for the overall position of the country and sector under review which is essentially a static view of the country’s most recent export performance, and another for the change in performance, which captures major trends over the recent past (5 years).
The PPI system also allows a comparison with other countries. We benchmark the beverage export performance against the world leaders and a couple of arbitrarily chosen other countries, at least one with developing economy characteristics. As mentioned above, there is no ProductMap available for the wine industry as such and we use the Beverages ProductMap as a proxy. Although we can thus assume that the Beverages ProductMap is a reasonable proxy for the South Africa’s wine industry this may not be the case for the other countries examined.
Table 1 reports on the results of the ProductMap survey. We use Australia and Chile as our reference points because they are both new world wine producers, as is South Africa, and hence they are competitors. Italy and France are the industry leaders. Row G1 shows the value of 2001 export in US Dollars. South African exports are considerably lower than both Australia and
T r a d e I n f o r m a t i o n S e r v i c e 2 0 0 5
18
Chile. France is the market leader by quite some distance. South Africa lags the new world producers in terms of export growth, in particular Australia but also, to a lesser degree, Chile. 46 countries are included in the Beverages ProductMap so a ranking of fourteenth is well above the average while not being one of the leaders either. At 1.4% of total exports, the Beverages ProductMap is virtually as important to South Africa as it is to Australia and Italy but its share is a lot bigger in the exports of Chile and France. South Africa’s performance in terms of the growth of per capita exports is poor, especially when compared to the new world producers. Information on the relative unit value of South Africa’s exports, and the change therein, is unavailable, as countries appear to report quantities in various ways. It is unclear how useful this information is in any event, because this ProductMap is quite heterogeneous.
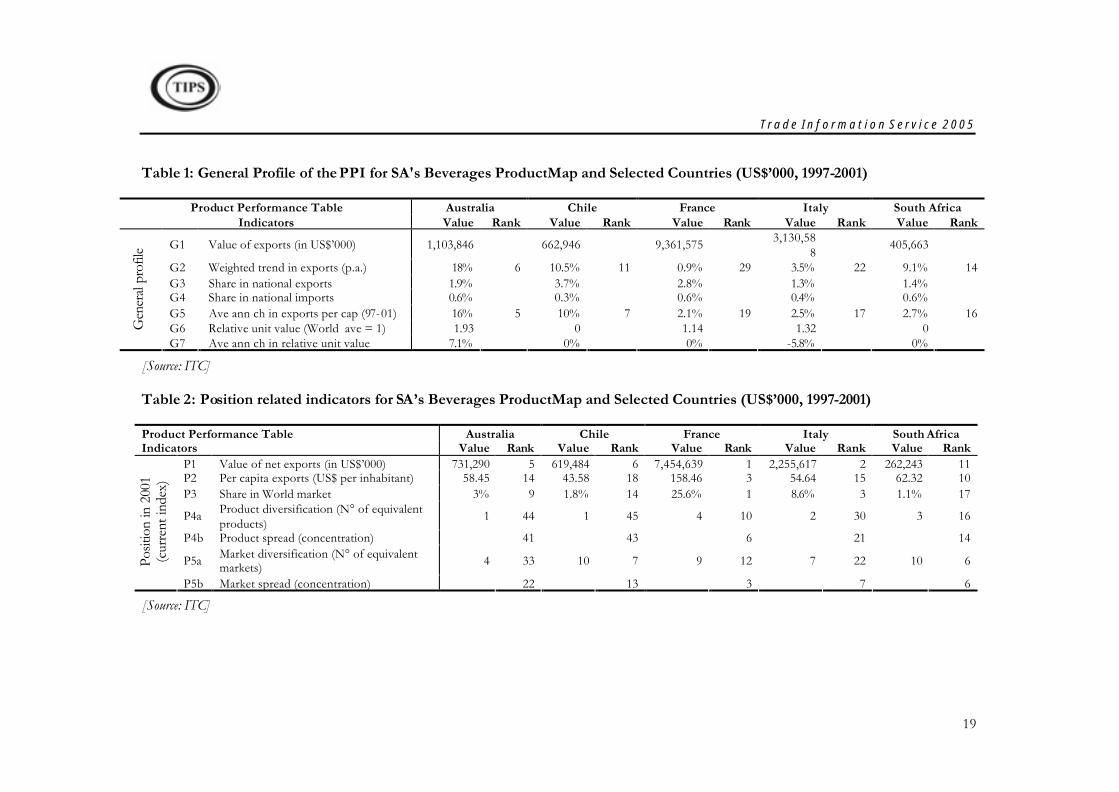
T r a d e I n f o r m a t i o n S e r v i c e 2 0 0 5
19
Table 1: General Profile of the PPI for SA's Beverages ProductMap and Selected Countries (US$’000, 1997-2001)
Product Performance Table Australia Chile France Italy South Africa Indicators Value Rank Value Rank Value Rank Value Rank Value Rank
G1 Value of exports (in US$’000) 1,103,846 662,946 9,361,575 3,130,588
405,663
G2 Weighted trend in exports (p.a.) 18% 6 10.5% 11 0.9% 29 3.5% 22 9.1% 14 G3 Share in national exports 1.9% 3.7% 2.8% 1.3% 1.4% G4 Share in national imports 0.6% 0.3% 0.6% 0.4% 0.6% G5 Ave ann ch in exports per cap (97-01) 16% 5 10% 7 2.1% 19 2.5% 17 2.7% 16 G6 Relative unit value (World ave = 1) 1.93 0 1.14 1.32 0 G
ener
al pr
ofile
G7 Ave ann ch in relative unit value 7.1% 0% 0% -5.8% 0%
[Source: ITC]
Table 2: Position related indicators for SA’s Beverages ProductMap and Selected Countries (US$’000, 1997-2001)
Product Performance Table Australia Chile France Italy South Africa Indicators Value Rank Value Rank Value Rank Value Rank Value Rank
P1 Value of net exports (in US$’000) 731,290 5 619,484 6 7,454,639 1 2,255,617 2 262,243 11 P2 Per capita exports (US$ per inhabitant) 58.45 14 43.58 18 158.46 3 54.64 15 62.32 10 P3 Share in World market 3% 9 1.8% 14 25.6% 1 8.6% 3 1.1% 17
P4a Product diversification (N° of equivalent products)
1 44 1 45 4 10 2 30 3 16
P4b Product spread (concentration) 41 43 6 21 14
P5a Market diversification (N° of equivalent markets) 4 33 10 7 9 12 7 22 10 6 Po
sitio
n in
200
1 (c
urre
nt in
dex)
P5b Market spread (concentration) 22 13 3 7 6
[Source: ITC]
T r a d e I n f o r m a t i o n S e r v i c e 2 0 0 5
20
Table 2 above reports on the position related indicators from the ITC’s ProductMap. These indicators provide a more in depth analysis of the current state of exports. Row P1 reports the value of net exports, i.e. exports less imports. Net exports are used as an indicator because they eliminate re-exports. The importing of intermediate goods and exporting of final goods in the same category makes analysis more complex. However, the role of re-exports in Beverages is probably quite small. South Africa has a healthy positive trade balance for the Beverages ProductMap, as do all of the countries in the table. Per capita exports are a measure of outward orientation. South Africa is more orientated towards exports than any of the reference countries, with the exception of France. The ranking however, is only tenth. In terms of world market share, South Africa is a very small player
To capture the degree of product diversification, two separate indicators are calculated – the equivalent number of products and the corresponding concentration. In rows P4a we show the equivalent number (EN=1/Herfindal), a theoretical value which represents the number of markets of identical size that would lead to the same degree of export concentration as the observed one1The rank is a function of the level of diversification (both for products and markets): the larger the index value, the greater the diversification of exports and consequently the better the ranking. These calculations can be compared to a similar indicator shown in row P4b, which measures the existing spread between the highest and lowest value in a given statistical series, calculated using the weighted standard error2. The greater the distribution of exports from a country (that is, the greater the spread) as compared to the average, the higher the value of the index.
On both measures of product diversification, South Africa does significantly better than all of the reference countries with the exception of France. Australia and Chile are very focussed in terms of their products. South Africa even leads France when one looks at the number of equivalent markets measure of market diversification. These positions are reversed for the market spread indicator but once again South Africa is shown to have much more diverse exports than the other countries in the table. This diversification in terms of both products and destination markets means South Africa is less susceptible to the risk of a downturn in one market or product.
Turning to change-related indicators of trade performance for South Africa’s beverage ProductMap, the ITC starts the analysis with a decomposition of the change in the world market share, which provides information on the competitiveness of the sector and country considered. The ranking of the change in market share can be tabulated as the unweighted average of the rankings of four items: competitiveness, initial geographic specialisation, initial product specialisation and responsiveness to changes in world demand. These indicators are calculated using a decomposition of the change in a country’s market share in the market for the
1 The Herfindal index is a concentration index that corresponds to the sum of the squared ratios between the market share of the single product (or country) under analysis, and the total market share for all countries (or products). It ranges from 1/n (equal distribution) to 1 (total concentration). Calculating product differentiation by means of the equivalent number, distinguishes, for each country, the equivalent number of exported goods of equal importance (either within each sector or in the whole national economy) leading to the same concentration of exports.
2 The weighted average spread is defined as the ratio of the standard deviation, in the numerator, and the number of products (or countries) times the average value of the exports of the product (or exports to a country) in the denominator. The spread index for products calculates for each country the distribution of export products and compares it to the average export value.
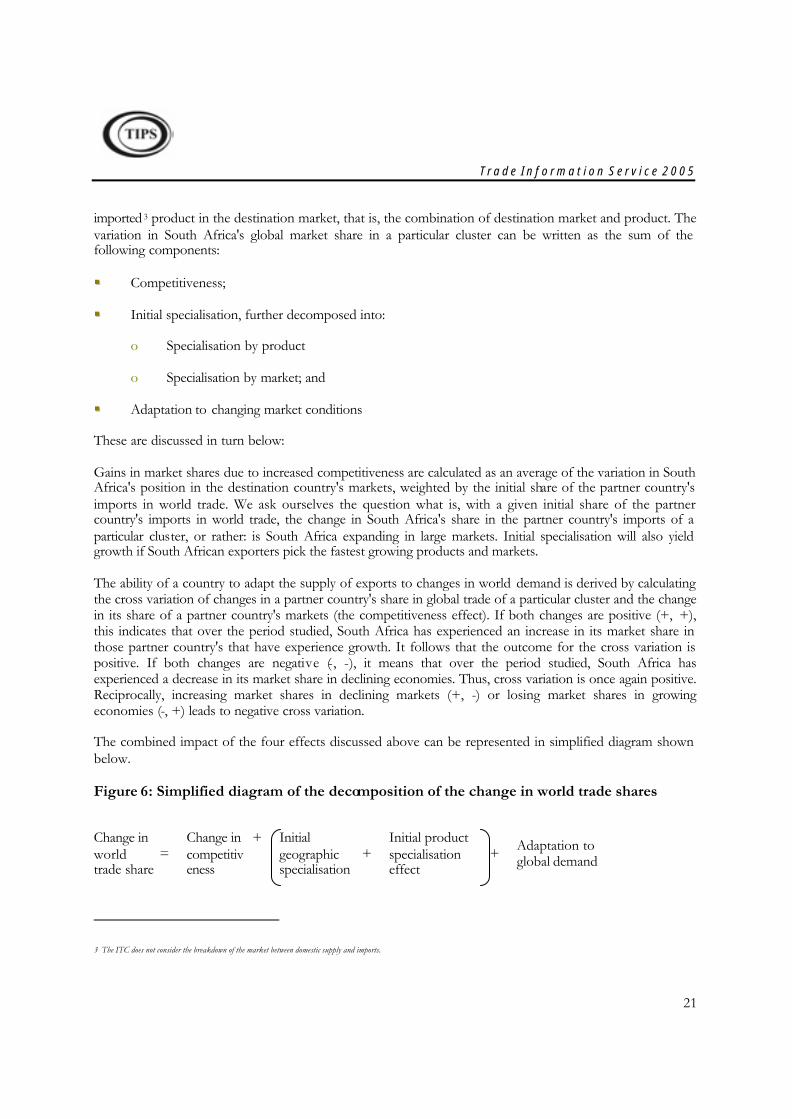
T r a d e I n f o r m a t i o n S e r v i c e 2 0 0 5
21
imported 3 product in the destination market, that is, the combination of destination market and product. The variation in South Africa's global market share in a particular cluster can be written as the sum of the following components:
§§ Competitiveness;
§§ Initial specialisation, further decomposed into:
o Specialisation by product
o Specialisation by market; and
§§ Adaptation to changing market conditions
These are discussed in turn below:
Gains in market shares due to increased competitiveness are calculated as an average of the variation in South Africa's position in the destination country's markets, weighted by the initial share of the partner country's imports in world trade. We ask ourselves the question what is, with a given initial share of the partner country's imports in world trade, the change in South Africa's share in the partner country's imports of a particular cluster, or rather: is South Africa expanding in large markets. Initial specialisation will also yield growth if South African exporters pick the fastest growing products and markets.
The ability of a country to adapt the supply of exports to changes in world demand is derived by calculating the cross variation of changes in a partner country's share in global trade of a particular cluster and the change in its share of a partner country's markets (the competitiveness effect). If both changes are positive (+, +), this indicates that over the period studied, South Africa has experienced an increase in its market share in those partner country's that have experience growth. It follows that the outcome for the cross variation is positive. If both changes are negative (-, -), it means that over the period studied, South Africa has experienced a decrease in its market share in declining economies. Thus, cross variation is once again positive. Reciprocally, increasing market shares in declining markets (+, -) or losing market shares in growing economies (-, +) leads to negative cross variation.
The combined impact of the four effects discussed above can be represented in simplified diagram shown below.
Figure 6: Simplified diagram of the decomposition of the change in world trade shares
Change in world trade share
= Change in competitiveness
+ Initial geographic specialisation
+ Initial product specialisation effect
+ Adaptation to global demand
3 The ITC does not consider the breakdown of the market between domestic supply and imports.
T r a d e I n f o r m a t i o n S e r v i c e 2 0 0 5
22
We can apply this analysis to the results contained in Table 3. As can be seen in row C1 Australia and Chile have been very successful at increasing their share of the world market. South Africa’s share has declined, though very slowly. France and Italy have experienced mild increases. There are two main reasons why South Africa experienced a decline in market share. Firstly the initial geographical specialisation change was -1.7%. This means that South Africa exports a large share of its exports to countries whose share of global consumption is falling. These markets may be growing but they will be growing at a rate less than that of the rest of the global market. Secondly, South Africa lost ground on the initial product specialisation measure which declined by 1.2%. This is very difficult to remedy because the lead time between switching products and the first production of the new product is measured in years, rather than in weeks and months as in other products. In effect, one has to predict changes in consumer demand a few years ahead of the change. South Africa did gain according to the competitiveness measure but not by enough to undo the effects of initial specialisation in geography and products.
South Africa could learn from Australia. The majority of its gain in world share was due to competitiveness but Australia has also fared better in terms of which products to produce and which markets to sell them in. No country appeared to do exceptionally well in switching its products to the fastest growing markets.
Row C2 shows the rate at which net exports is growing. All of the new world producers have rapidly increasing trade surpluses for the beverage ProductMap. The developed producers’ trade balances seem to be remaining fairly constant. Row C3 confirms our earlier observation that no country was successful at switching its sales to the fastest growing markets.
To rank countries according to their ability to adapt to the dynamics of world demand the ITC also uses the Spearman’s rank correlation measure between the ranking of South Africa's share of export products in its world trade, and the ranking of weighted average growth trends in global exports of those products. For each country a correlation coefficient is calculated that takes a value between 1 and -1. A value of 1 reveals that, for the country under analysis, the relative importance of its exported goods is in full accordance with the ranking of world export growth rates for the same goods. The closer the index is to 1, the better the country ranking under analysis. As can be seen in row C3, South Africa does not fair well on this measure.
Rows C4a to C5b represent the change in the indices we noted earlier in the position related indicators. South Africa is producing more diverse products and it is diversifying at a quicker rate than its new world competitors and Italy. However, the ranking for the change in diversification is very low and may indicate that South Africa may face new competition from other small wine producers. In terms of diversifying export markets, South Africa is only doing better than Australia in the table. Chile has been far more successful at this measure.
After considering the different measures, the ITC ranks each country on how they are performing on a current index and a change index. South Africa does very well in the current index, one would assume principally due to very diverse product markets. South Africa does not do very well on the change index but this not surprising, given that South Africa’s global market share is contracting. South Africa does significantly worse on the change index than Australia and Chile.
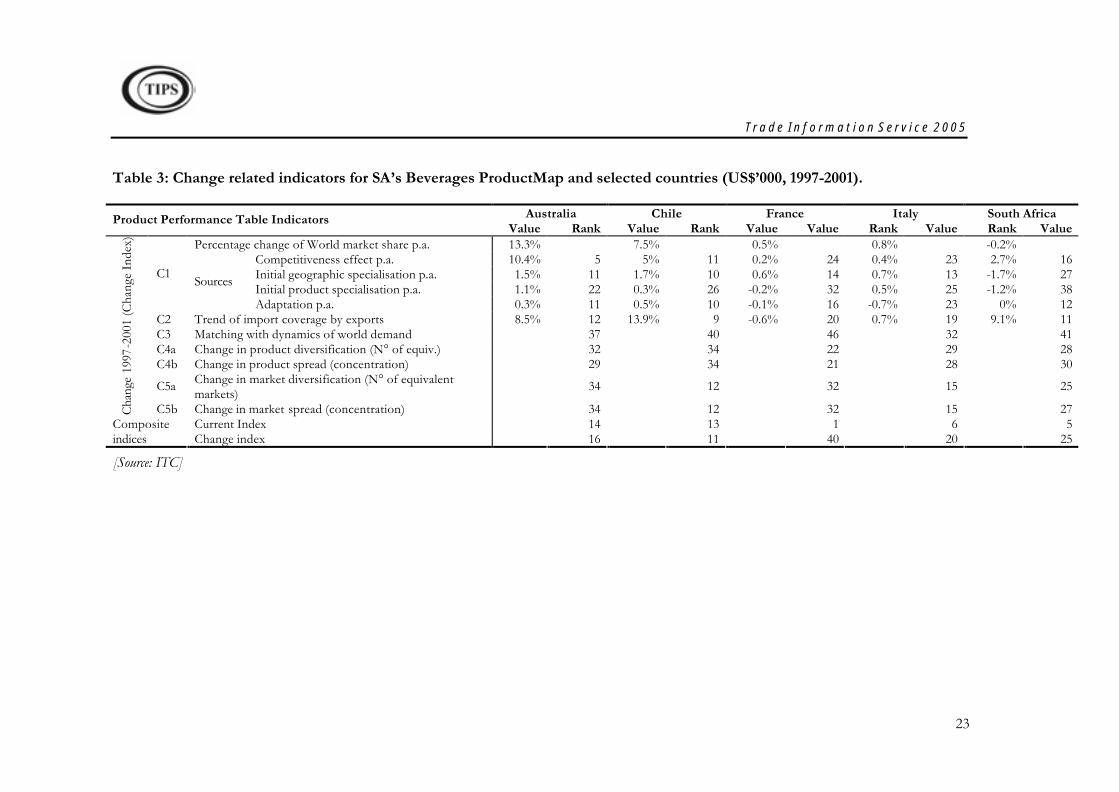
T r a d e I n f o r m a t i o n S e r v i c e 2 0 0 5
23
Table 3: Change related indicators for SA’s Beverages ProductMap and selected countries (US$’000, 1997-2001).
Australia Chile France Italy South Africa Product Performance Table Indicators Value Rank Value Rank Value Value Rank Value Rank Value
Percentage change of World market share p.a. 13.3% 7.5% 0.5% 0.8% -0.2% Competitiveness effect p.a. 10.4% 5 5% 11 0.2% 24 0.4% 23 2.7% 16 Initial geographic specialisation p.a. 1.5% 11 1.7% 10 0.6% 14 0.7% 13 -1.7% 27 Initial product specialisation p.a. 1.1% 22 0.3% 26 -0.2% 32 0.5% 25 -1.2% 38
C1 Sources
Adaptation p.a. 0.3% 11 0.5% 10 -0.1% 16 -0.7% 23 0% 12 C2 Trend of import coverage by exports 8.5% 12 13.9% 9 -0.6% 20 0.7% 19 9.1% 11 C3 Matching with dynamics of world demand 37 40 46 32 41 C4a Change in product diversification (N° of equiv.) 32 34 22 29 28 C4b Change in product spread (concentration) 29 34 21 28 30
C5a Change in market diversification (N° of equivalent markets)
34 12 32 15 25
Cha
nge
1997
-200
1 (C
hang
e In
dex)
C5b Change in market spread (concentration) 34 12 32 15 27 Current Index 14 13 1 6 5 Composite
indices Change index 16 11 40 20 25
[Source: ITC]
T r a d e I n f o r m a t i o n S e r v i c e 2 0 0 5
24
4.1.6 Product Champions
The final ProductMap analysis is known as product champions. Here we consider the ten largest HS6 commodity groups in each product map and analyse the performance of developing countries for each product. A good is defined as a product champion if global exports of the good are growing and developing countries are increasing their share of these exports. Under achievers have growing exports but developing countries’ share of exports is declining. Achievers in adversity show an increase in developing countries’ market share of the global market, even though the market itself is contracting. The Product Champions for the Beverages ProductMap are reported in Table 4. Developing countries are increasing their share of the global market in all of the products. South Africa’s exports are growing more quickly than global exports in all of the products, except for HS 220110: Mineral & aerated waters, not containing sugar or sweetening matter nor flavoured and HS 220890: Undenatured ethyl alcohol <80% alcohol cont by volume & spirit, liqueur & spirit bev nesoi. South Africa’s export growth in the Product Champions products is quite strong, except in the case of HS 220110: Mineral & aerated waters, not containing sugar or sweetening matter nor flavoured, where exports in US Dollar terms declined.
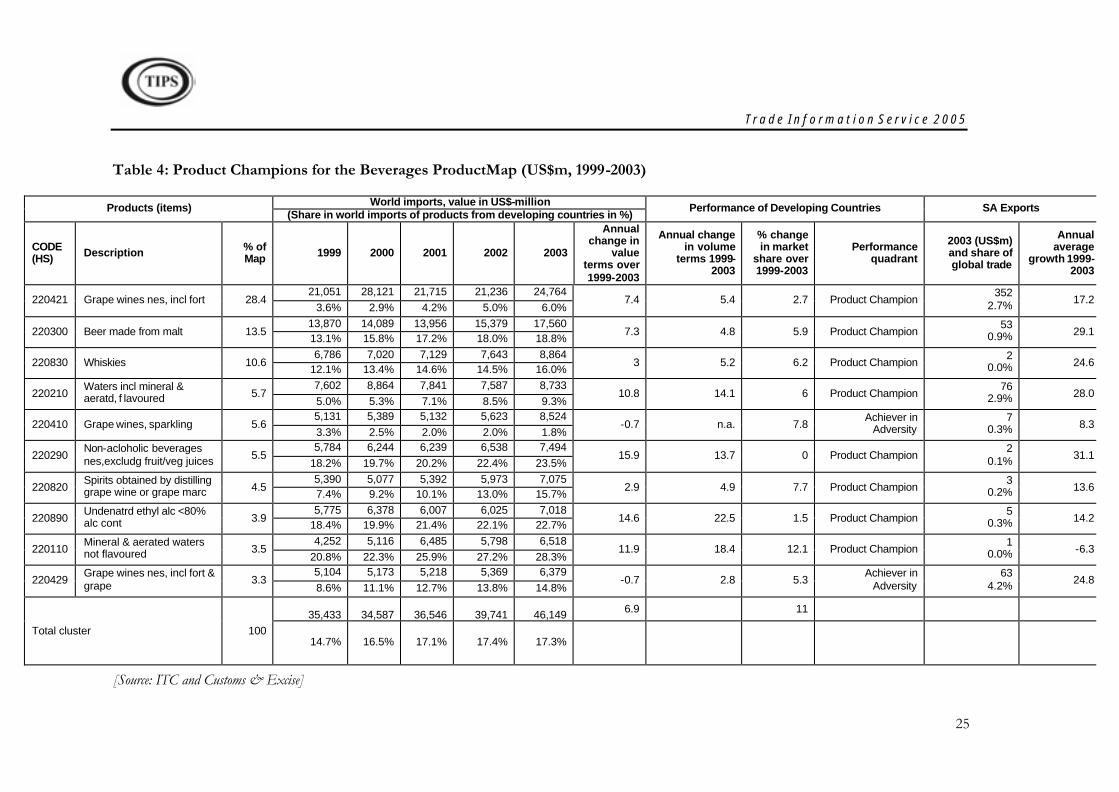
T r a d e I n f o r m a t i o n S e r v i c e 2 0 0 5
25
Table 4: Product Champions for the Beverages ProductMap (US$m, 1999-2003)
World imports, value in US$-million Products (items) (Share in world imports of products from developing countries in %)
Performance of Developing Countries SA Exports
CODE (HS) Description % of
Map 1999 2000 2001 2002 2003
Annual change in
value terms over 1999-2003
Annual change in volume
terms 1999-2003
% change in market
share over 1999-2003
Performance quadrant
2003 (US$m) and share of global trade
Annual average
growth 1999-2003
21,051 28,121 21,715 21,236 24,764 220421 Grape wines nes, incl fort 28.4
3.6% 2.9% 4.2% 5.0% 6.0% 7.4 5.4 2.7 Product Champion
352 2.7% 17.2
13,870 14,089 13,956 15,379 17,560 220300 Beer made from malt 13.5
13.1% 15.8% 17.2% 18.0% 18.8% 7.3 4.8 5.9 Product Champion
53 0.9% 29.1
6,786 7,020 7,129 7,643 8,864 220830 Whiskies 10.6
12.1% 13.4% 14.6% 14.5% 16.0% 3 5.2 6.2 Product Champion
2 0.0% 24.6
7,602 8,864 7,841 7,587 8,733 220210
Waters incl mineral & aeratd, f lavoured 5.7
5.0% 5.3% 7.1% 8.5% 9.3% 10.8 14.1 6 Product Champion
76 2.9% 28.0
5,131 5,389 5,132 5,623 8,524 220410 Grape wines, sparkling 5.6
3.3% 2.5% 2.0% 2.0% 1.8% -0.7 n.a. 7.8
Achiever in Adversity
7 0.3% 8.3
5,784 6,244 6,239 6,538 7,494 220290
Non-acloholic beverages nes,excludg fruit/veg juices 5.5
18.2% 19.7% 20.2% 22.4% 23.5% 15.9 13.7 0 Product Champion
2 0.1% 31.1
5,390 5,077 5,392 5,973 7,075 220820
Spirits obtained by distilling grape wine or grape marc 4.5
7.4% 9.2% 10.1% 13.0% 15.7% 2.9 4.9 7.7 Product Champion
3 0.2% 13.6
5,775 6,378 6,007 6,025 7,018 220890
Undenatrd ethyl alc <80% alc cont 3.9
18.4% 19.9% 21.4% 22.1% 22.7% 14.6 22.5 1.5 Product Champion
5 0.3% 14.2
4,252 5,116 6,485 5,798 6,518 220110
Mineral & aerated waters not flavoured 3.5
20.8% 22.3% 25.9% 27.2% 28.3% 11.9 18.4 12.1 Product Champion
1 0.0% -6.3
5,104 5,173 5,218 5,369 6,379 220429
Grape wines nes, incl fort & grape 3.3
8.6% 11.1% 12.7% 13.8% 14.8% -0.7 2.8 5.3
Achiever in Adversity
63 4.2% 24.8
35,433
34,587
36,546
39,741
46,149 6.9 11
Total cluster 100 14.7% 16.5% 17.1% 17.4% 17.3%
[Source: ITC and Customs & Excise]
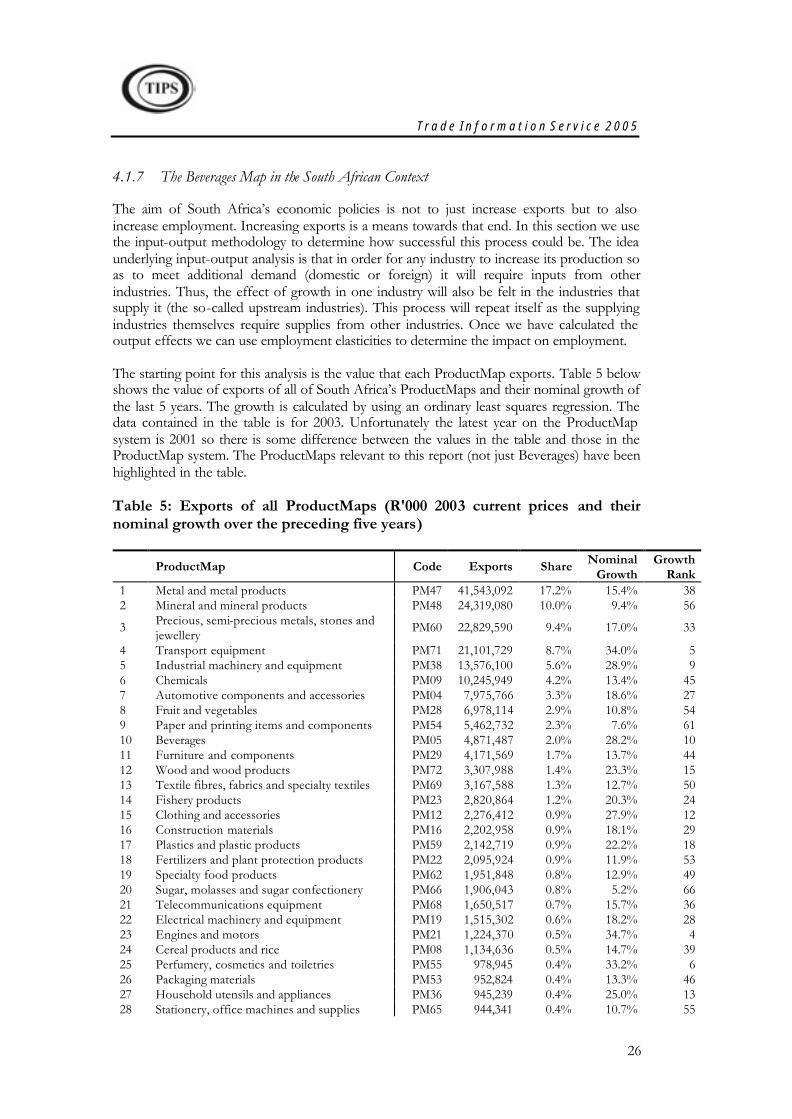
T r a d e I n f o r m a t i o n S e r v i c e 2 0 0 5
26
4.1.7 The Beverages Map in the South African Context
The aim of South Africa’s economic policies is not to just increase exports but to also increase employment. Increasing exports is a means towards that end. In this section we use the input-output methodology to determine how successful this process could be. The idea underlying input-output analysis is that in order for any industry to increase its production so as to meet additional demand (domestic or foreign) it will require inputs from other industries. Thus, the effect of growth in one industry will also be felt in the industries that supply it (the so-called upstream industries). This process will repeat itself as the supplying industries themselves require supplies from other industries. Once we have calculated the output effects we can use employment elasticities to determine the impact on employment.
The starting point for this analysis is the value that each ProductMap exports. Table 5 below shows the value of exports of all of South Africa’s ProductMaps and their nominal growth of the last 5 years. The growth is calculated by using an ordinary least squares regression. The data contained in the table is for 2003. Unfortunately the latest year on the ProductMap system is 2001 so there is some difference between the values in the table and those in the ProductMap system. The ProductMaps relevant to this report (not just Beverages) have been highlighted in the table.
Table 5: Exports of all ProductMaps (R'000 2003 current prices and their nominal growth over the preceding five years)
ProductMap Code Exports Share Nominal Growth
Growth Rank
1 Metal and metal products PM47 41,543,092 17.2% 15.4% 38 2 Mineral and mineral products PM48 24,319,080 10.0% 9.4% 56
3 Precious, semi-precious metals, stones and jewellery PM60 22,829,590 9.4% 17.0% 33
4 Transport equipment PM71 21,101,729 8.7% 34.0% 5 5 Industrial machinery and equipment PM38 13,576,100 5.6% 28.9% 9 6 Chemicals PM09 10,245,949 4.2% 13.4% 45 7 Automotive components and accessories PM04 7,975,766 3.3% 18.6% 27 8 Fruit and vegetables PM28 6,978,114 2.9% 10.8% 54 9 Paper and printing items and components PM54 5,462,732 2.3% 7.6% 61 10 Beverages PM05 4,871,487 2.0% 28.2% 10 11 Furniture and components PM29 4,171,569 1.7% 13.7% 44 12 Wood and wood products PM72 3,307,988 1.4% 23.3% 15 13 Textile fibres, fabrics and specialty textiles PM69 3,167,588 1.3% 12.7% 50 14 Fishery products PM23 2,820,864 1.2% 20.3% 24 15 Clothing and accessories PM12 2,276,412 0.9% 27.9% 12 16 Construction materials PM16 2,202,958 0.9% 18.1% 29 17 Plastics and plastic products PM59 2,142,719 0.9% 22.2% 18 18 Fertilizers and plant protection products PM22 2,095,924 0.9% 11.9% 53 19 Specialty food products PM62 1,951,848 0.8% 12.9% 49 20 Sugar, molasses and sugar confectionery PM66 1,906,043 0.8% 5.2% 66 21 Telecommunications equipment PM68 1,650,517 0.7% 15.7% 36 22 Electrical machinery and equipment PM19 1,515,302 0.6% 18.2% 28 23 Engines and motors PM21 1,224,370 0.5% 34.7% 4 24 Cereal products and rice PM08 1,134,636 0.5% 14.7% 39 25 Perfumery, cosmetics and toiletries PM55 978,945 0.4% 33.2% 6 26 Packaging materials PM53 952,824 0.4% 13.3% 46 27 Household utensils and appliances PM36 945,239 0.4% 25.0% 13 28 Stationery, office machines and supplies PM65 944,341 0.4% 10.7% 55
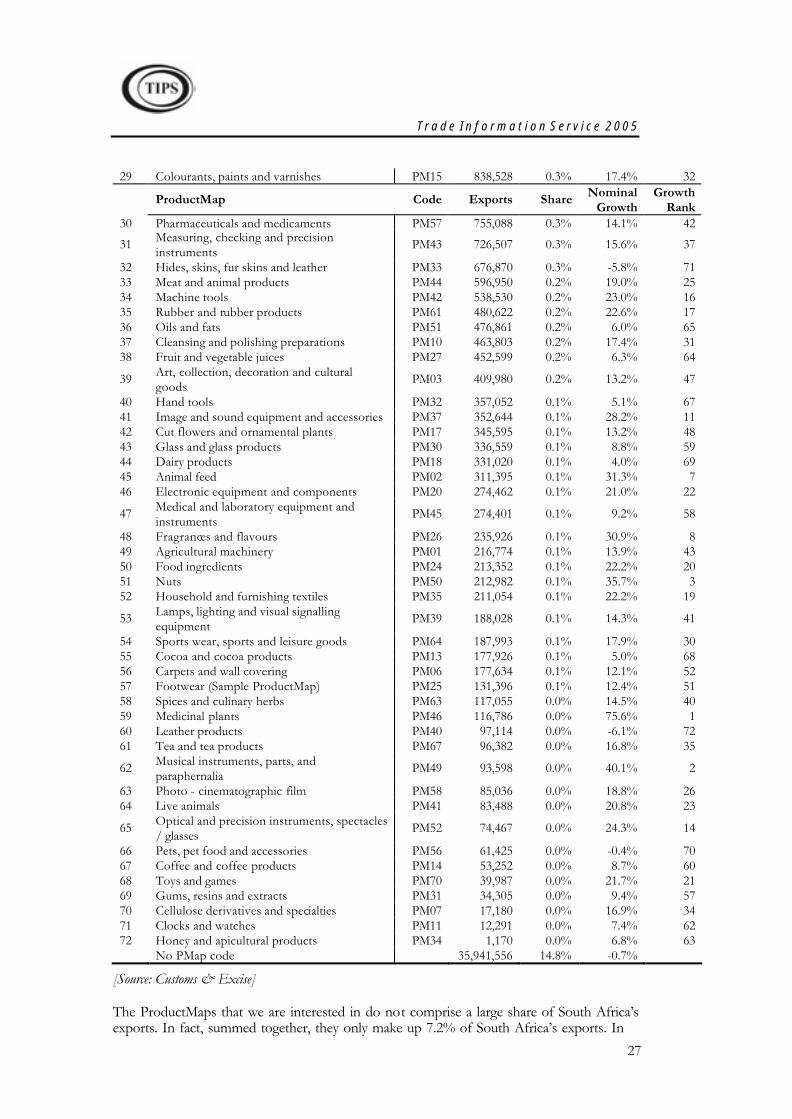
T r a d e I n f o r m a t i o n S e r v i c e 2 0 0 5
27
29 Colourants, paints and varnishes PM15 838,528 0.3% 17.4% 32
ProductMap Code Exports Share Nominal Growth
Growth Rank
30 Pharmaceuticals and medicaments PM57 755,088 0.3% 14.1% 42
31 Measuring, checking and precision instruments PM43 726,507 0.3% 15.6% 37
32 Hides, skins, fur skins and leather PM33 676,870 0.3% -5.8% 71 33 Meat and animal products PM44 596,950 0.2% 19.0% 25 34 Machine tools PM42 538,530 0.2% 23.0% 16 35 Rubber and rubber products PM61 480,622 0.2% 22.6% 17 36 Oils and fats PM51 476,861 0.2% 6.0% 65 37 Cleansing and polishing preparations PM10 463,803 0.2% 17.4% 31 38 Fruit and vegetable juices PM27 452,599 0.2% 6.3% 64
39 Art, collection, decoration and cultural goods PM03 409,980 0.2% 13.2% 47
40 Hand tools PM32 357,052 0.1% 5.1% 67 41 Image and sound equipment and accessories PM37 352,644 0.1% 28.2% 11 42 Cut flowers and ornamental plants PM17 345,595 0.1% 13.2% 48 43 Glass and glass products PM30 336,559 0.1% 8.8% 59 44 Dairy products PM18 331,020 0.1% 4.0% 69 45 Animal feed PM02 311,395 0.1% 31.3% 7 46 Electronic equipment and components PM20 274,462 0.1% 21.0% 22
47 Medical and laboratory equipment and instruments PM45 274,401 0.1% 9.2% 58
48 Fragrances and flavours PM26 235,926 0.1% 30.9% 8 49 Agricultural machinery PM01 216,774 0.1% 13.9% 43 50 Food ingredients PM24 213,352 0.1% 22.2% 20 51 Nuts PM50 212,982 0.1% 35.7% 3 52 Household and furnishing textiles PM35 211,054 0.1% 22.2% 19
53 Lamps, lighting and visual signalling equipment PM39 188,028 0.1% 14.3% 41
54 Sports wear, sports and leisure goods PM64 187,993 0.1% 17.9% 30 55 Cocoa and cocoa products PM13 177,926 0.1% 5.0% 68 56 Carpets and wall covering PM06 177,634 0.1% 12.1% 52 57 Footwear (Sample ProductMap) PM25 131,396 0.1% 12.4% 51 58 Spices and culinary herbs PM63 117,055 0.0% 14.5% 40 59 Medicinal plants PM46 116,786 0.0% 75.6% 1 60 Leather products PM40 97,114 0.0% -6.1% 72 61 Tea and tea products PM67 96,382 0.0% 16.8% 35
62 Musical instruments, parts, and paraphernalia PM49 93,598 0.0% 40.1% 2
63 Photo - cinematographic film PM58 85,036 0.0% 18.8% 26 64 Live animals PM41 83,488 0.0% 20.8% 23
65 Optical and precision instruments, spectacles / glasses PM52 74,467 0.0% 24.3% 14
66 Pets, pet food and accessories PM56 61,425 0.0% -0.4% 70 67 Coffee and coffee products PM14 53,252 0.0% 8.7% 60 68 Toys and games PM70 39,987 0.0% 21.7% 21 69 Gums, resins and extracts PM31 34,305 0.0% 9.4% 57 70 Cellulose derivatives and specialties PM07 17,180 0.0% 16.9% 34 71 Clocks and watches PM11 12,291 0.0% 7.4% 62 72 Honey and apicultural products PM34 1,170 0.0% 6.8% 63 No PMap code 35,941,556 14.8% -0.7%
[Source: Customs & Excise]
The ProductMaps that we are interested in do not comprise a large share of South Africa’s exports. In fact, summed together, they only make up 7.2% of South Africa’s exports. In
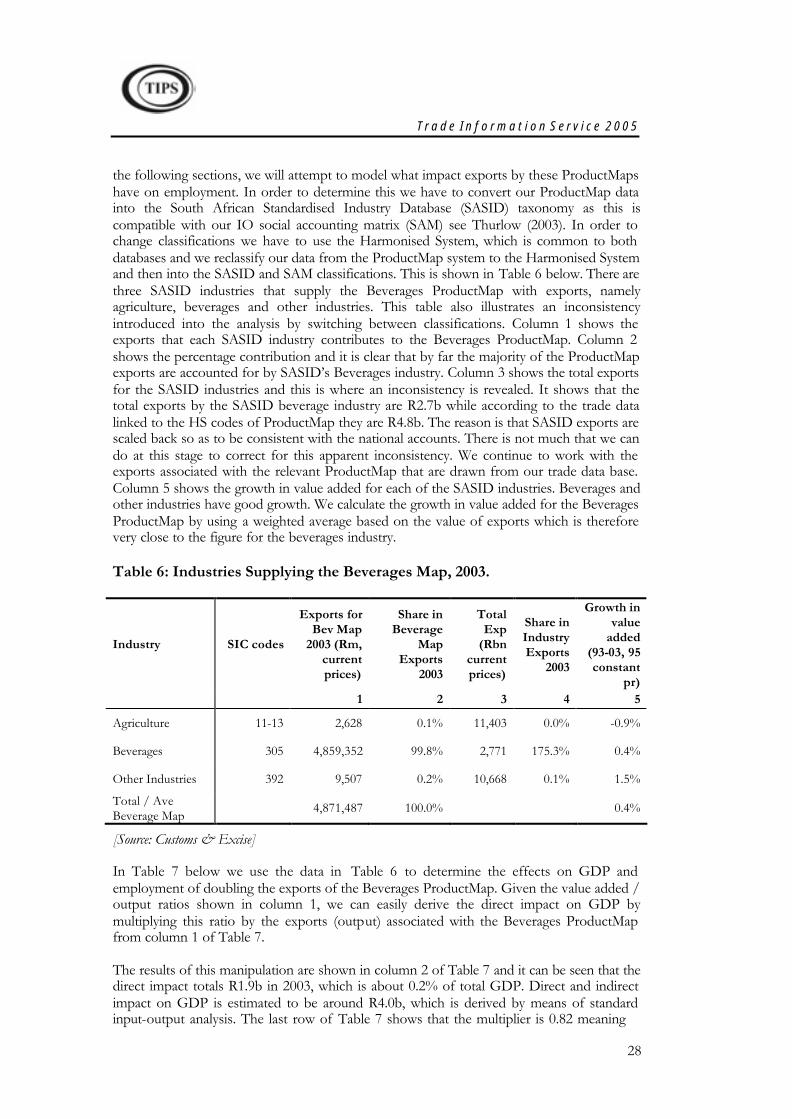
T r a d e I n f o r m a t i o n S e r v i c e 2 0 0 5
28
the following sections, we will attempt to model what impact exports by these ProductMaps have on employment. In order to determine this we have to convert our ProductMap data into the South African Standardised Industry Database (SASID) taxonomy as this is compatible with our IO social accounting matrix (SAM) see Thurlow (2003). In order to change classifications we have to use the Harmonised System, which is common to both databases and we reclassify our data from the ProductMap system to the Harmonised System and then into the SASID and SAM classifications. This is shown in Table 6 below. There are three SASID industries that supply the Beverages ProductMap with exports, namely agriculture, beverages and other industries. This table also illustrates an inconsistency introduced into the analysis by switching between classifications. Column 1 shows the exports that each SASID industry contributes to the Beverages ProductMap. Column 2 shows the percentage contribution and it is clear that by far the majority of the ProductMap exports are accounted for by SASID’s Beverages industry. Column 3 shows the total exports for the SASID industries and this is where an inconsistency is revealed. It shows that the total exports by the SASID beverage industry are R2.7b while according to the trade data linked to the HS codes of ProductMap they are R4.8b. The reason is that SASID exports are scaled back so as to be consistent with the national accounts. There is not much that we can do at this stage to correct for this apparent inconsistency. We continue to work with the exports associated with the relevant ProductMap that are drawn from our trade data base. Column 5 shows the growth in value added for each of the SASID industries. Beverages and other industries have good growth. We calculate the growth in value added for the Beverages ProductMap by using a weighted average based on the value of exports which is therefore very close to the figure for the beverages industry.
Table 6: Industries Supplying the Beverages Map, 2003.
Industry SIC codes
Exports for Bev Map
2003 (Rm, current prices)
Share in Beverage
Map Exports
2003
Total Exp
(Rbn current prices)
Share in Industry Exports
2003
Growth in value
added (93-03, 95 constant
pr) 1 2 3 4 5
Agriculture 11-13 2,628 0.1% 11,403 0.0% -0.9%
Beverages 305 4,859,352 99.8% 2,771 175.3% 0.4%
Other Industries 392 9,507 0.2% 10,668 0.1% 1.5%
Total / Ave Beverage Map 4,871,487 100.0% 0.4%
[Source: Customs & Excise]
In Table 7 below we use the data in Table 6 to determine the effects on GDP and employment of doubling the exports of the Beverages ProductMap. Given the value added / output ratios shown in column 1, we can easily derive the direct impact on GDP by multiplying this ratio by the exports (output) associated with the Beverages ProductMap from column 1 of Table 7.
The results of this manipulation are shown in column 2 of Table 7 and it can be seen that the direct impact totals R1.9b in 2003, which is about 0.2% of total GDP. Direct and indirect impact on GDP is estimated to be around R4.0b, which is derived by means of standard input-output analysis. The last row of Table 7 shows that the multiplier is 0.82 meaning
T r a d e I n f o r m a t i o n S e r v i c e 2 0 0 5
29
that that for every R1 of exports generated by the Beverages ProductMap, R0.82 of upstream value added is generated.4
Column 3 shows the current output of each of the SASID industries. In column 4, we report the percentage increase in output associated with doubling Beverage ProductMap exports. In order to calculate what the effect on employment will be, we need to use employment output elasticities. The elasticities in column 5 are long-run sector specific (Moolman, 2002). These elasticities determine what the employment effect of output changes will be. The direct employment effects in column 8 are merely the percentage increases in employment multiplied by the base employment in each industry. The one exception to this is the elasticity used for agriculture. Moolman (2002) estimated an elasticity of 0.08.
Although it makes sense to use employment - output elasticities for marginal changes, it is more appropriate to use the industry average employment - output ratio, implying a unit elasticity, in our case. We only use this unit elasticity for direct changes in output and employment. Indirect effects use the elasticity of 0.08 because the changes are not likely to be as large.
The direct effects of the beverage map doubling its exports would be nearly 2 000 new jobs. In order to double exports, inputs will be drawn from other sectors, leading to greater output and employment in those industries. Input-output analysis shows that these upstream effects result in the creation of 17 145 jobs in total, which is equivalent to 0.2% of labour demand in 2003. One of the properties of input-output analysis is its strict linearity, a 10% increase would therefore lead to a creation of 1 714 jobs.
4 The average GDP multiplier for South Africa is much higher at around 1.2 and the reason for the relatively low beverages multiplier is the high leakages through excise duties, which siphon about 20% off sales (gross value of production). Excise duties are only applicable to domestic sales but by ignoring them, the multiplier still only reaches 0.78 as the excise duty leakage still has an impact through the relatively high interindustry interaction.

T r a d e I n f o r m a t i o n S e r v i c e 2 0 0 5
30
Table 7: Direct and Indirect Contributions to GDP and Employment by the Beverages Map, 2003
Industry SIC codes
VA / Output
ratio
Impact on GDP (R’000
current prices)
Output (Rm current prices)
Direct % impact on
output
Employment / X elasticity
Direct % impact on
employment
Base employment
Absolute impact
employment
1 2 3 5 4 6 7 8 Agriculture 11-13 3.9% 103 1,075,629 0.0% 0.08 0.0% 783,235 1 Beverages 305 39.2% 1,905,419 23,814 20.4% 0.31 6.3% 30,537 1,931 Oth industr 392 52.5% 4,993 32,591 0.0% 0.82 0.0% 64,395 15 Total / Ave Beverages Map
39.2% 1,910,515 1,132,034 0.4% 878,166 1,947
Direct & Indirect Total
3,975,810 17,145
Multiplier 0.82 0.2%
[Source: Customs & Excise]
T r a d e I n f o r m a t i o n S e r v i c e 2 0 0 5
31
4.2 Fruits
South Africa has a highly developed deciduous fruit industry, geared for the export of a large percentage of its products. In terms of shares, apples rank first, followed by table grapes, pears, peaches, plums and apricots. In addition, many smaller crops such as kiwi fruit, almonds, strawberries and olives are cultivated. Citrus and many other crops including pineapples, bananas, avocados, mangos, litchis, papayas, granadillas, and guavas constitute another of South Africa's major horticultural industries. The citrus industry is still by far the largest in this group, while pineapples, bananas and avocados are the three most important fruits. The production of many (sub) tropical fruits, such as avocado and mango has experienced a rapid growth rate in recent years.
South African fruit production is spread throughout the country. The south-western and southern regions of the Western Cape are the main areas for the production of deciduous fruit while the low lying; sub-tropical areas of Mpumalanga and Limpopo produce most of the sub-tropical crops and some of the citrus. The Eastern Cape is also an important location for citrus and pineapple production. Exports of vegetables are significantly smaller than those of fruit but vegetable exports appear to be growing more quickly. In 2000, total fruit & vegetable exports were R4 billion, of which vegetables were R310 million or 7%. By 2003, the map’s export had grown to R7 billion and vegetable exports were R734 million, 10% of the total.
4.2.1 Global industry analysis
World fruit production has levelled off between 2000 and 2003 at 380 million tons, after growing by 3% a year between 1995 and 2000. The largest producers are China, the EU, India and the US but China and India consume most of their own production. In terms of exports, the dominant countries are the US, the EU, Chile, Mexico and South Africa. Chile is probably South Africa’s greatest competitor out of these countries because of the similar climates and global location. Most of South Africa’s fruit goes to European markets and South Africa is the EU’s largest supplier. Most countries in the EU have extensive domestic production of fruit as well. EU production is substantial for some products like citrus fruit and apples. However, the climate of Northern Europe limits the production of some fruit varieties. There is a large and growing market for a wide range of tropical and subtropical fruits .
Germany is the major market for fresh fruit accounting for 24% of total imports (in value) by EU member countries in 2000, followed by the United Kingdom (17%) and France (14%). Bananas are the major imported items followed by citrus (21%), apples (10%) and grapes (10%). In 2000, the leading supplier of fresh fruit in the EU was Spain, supplying 21% of imports (in value) by EU member countries, followed by Italy with 10%, the Netherlands with 10% and France supplying 8%.
South Africa is an important fruit supplier in the world market. More than 38% of total fruit production is being exported and exports are growing at 7% per year. The EU is the most important export destination, with the UK, Belgium and the Netherlands functioning as important transit markets. Approximately 65% of total South African exports go to the EU, making up 11% of EU imports from non-European countries. Exports to the EU have grown considerably over the past 5 years, resulting in South Africa becoming the largest non-European supplier of fruit. Future exports, however, will depend on the degree South African growers and exporters manage to comply with European standards such as EUREP-GAP.
T r a d e I n f o r m a t i o n S e r v i c e 2 0 0 5
32
The EU market for vegetables is a smaller than that for fruit but was still a sizeable US$ 8 billion in 2002. Vegetable consumption in the EU grew by 11% between 2000 and 2002. Most of the EU’s vegetables are supplied by the EU itself.
4.2.2 Local industry analysis
Fruit, with a value of approximately R 7,5 billion (US$ 1 billion), accounts for 20% of total agricultural production in South Africa. The basic conditions for further growth are good: low wages, labour and land in abundance, subtropical climate, cheap energy and sufficient infrastructure. A production season opposite to the European season makes South Africa an interesting sourcing country for European marketing organisations. The fact that the country is in the same time zone gives practical advantages with regard to doing business. Not withstanding significant exclusions, the free trade agreement with the European Union and the relatively weak Rand ensures a promising future for the South African fruit sector, although the recent appreciation has counteracted this to some degree. The potential is big, with opportunities on the local markets as well as on the export markets. South Africa also exports to the United Arab Emirates, Russia and Japan.
The fruit sector is well developed with an annual yield of 4 million tons. Deciduous fruit and citrus fruit are the main products, both accounting for 40% of total production value. Production of (sub) tropical fruit is on the increase, as well as production of specialties such as berries and olives. Government is gradually withdrawing from the sector, which makes future co-operation between partners of the supply chain extremely important. The local market remains important, but consumption is being restrained by the limited purchasing power of the majority of the population. Distribution primarily takes place through the National Fresh Produce Markets, which are still regulated by government. The informal sector is gaining importance.
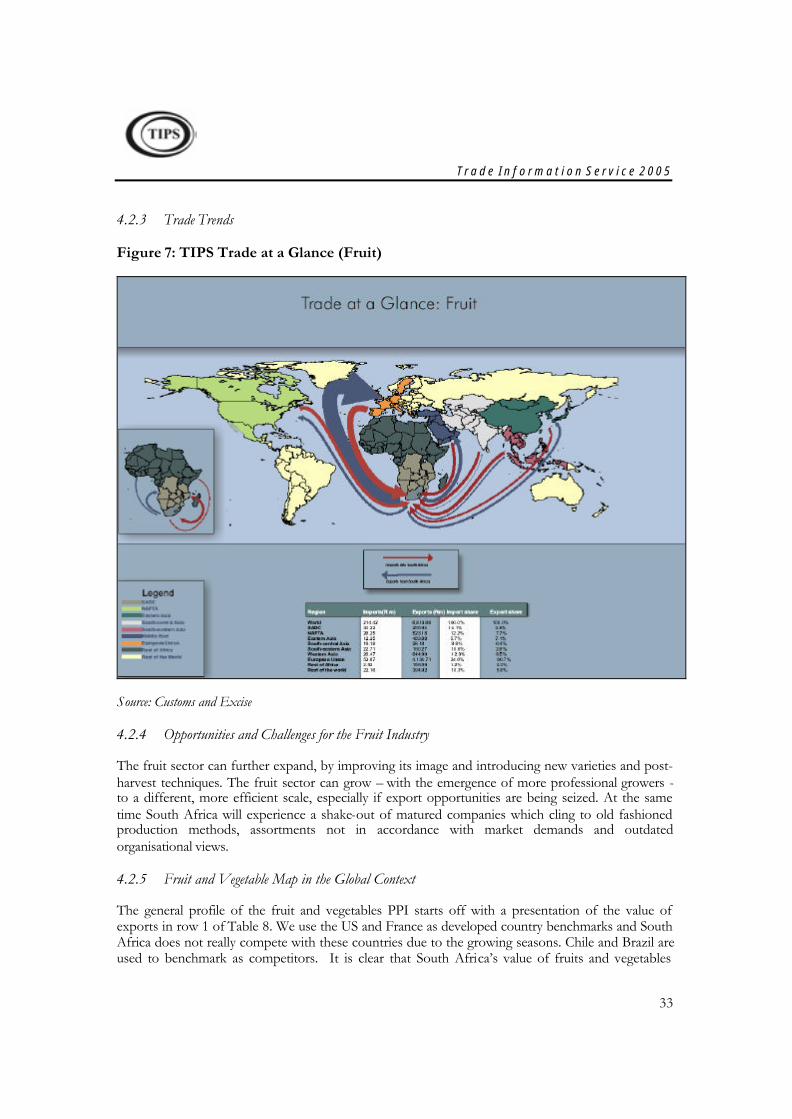
T r a d e I n f o r m a t i o n S e r v i c e 2 0 0 5
33
4.2.3 Trade Trends
Figure 7: TIPS Trade at a Glance (Fruit)
Source: Customs and Excise
4.2.4 Opportunities and Challenges for the Fruit Industry
The fruit sector can further expand, by improving its image and introducing new varieties and post-harvest techniques. The fruit sector can grow – with the emergence of more professional growers - to a different, more efficient scale, especially if export opportunities are being seized. At the same time South Africa will experience a shake-out of matured companies which cling to old fashioned production methods, assortments not in accordance with market demands and outdated organisational views.
4.2.5 Fruit and Vegetable Map in the Global Context
The general profile of the fruit and vegetables PPI starts off with a presentation of the value of exports in row 1 of Table 8. We use the US and France as developed country benchmarks and South Africa does not really compete with these countries due to the growing seasons. Chile and Brazil are used to benchmark as competitors. It is clear that South Africa’s value of fruits and vegetables
T r a d e I n f o r m a t i o n S e r v i c e 2 0 0 5
34
exports is lower than that of developed countries and Chile, but higher than Brazil’s. In terms of growth over the last five years, South Africa’s performance is ranked 43 out of the 59 countries that produce enough fruit and vegetables to be included in ProductMap. Brazil appears to be the leader in export growth but this is presumably off a low base, as can be seen in the previous row. South Africa’s exports of this ProductMap declined between 1997 and 2001. Our analysis is currently severely affected by the fact that the ProductMap data has not been updated and other evidence (not shown here) suggests that South African exports of this map grew by 41% between 2001 and 2003. Thus, although the ProductMap data does not paint the brightest picture, one must bear in mind that conditions have improved significantly. A full list of the HS 6 commodities contained in the Fruit and Vegetable ProductMap can be found in Table 39 in Appendix A.
From row G3 it can be seen that the South African fruit and vegetable group accounts for 2% of South Africa’s export basket – the second highest share among the countries in the sample, while Chile has the highest share of 8%. The growth rates of per capita exports are useful in that it shows how outward looking a country is. Hence the change in per capita exports reflects changes in a country’s outward orientation and performance for the group of products considered. South Africa ranks quite low in annual change in exports, as can be seen in row G5 due to the fact that South Africa’s exports were decreasing.
The absolute value of net trade (exports less imports) is presented as the first-position indicator in row P1 of the next table. The developed countries in our sample (US and France) are all net importers of fruit and vegetable products. Surprisingly, this is also the case for Brazil. However, as one would expect, Chile and South Africa are net exporters of fruits and vegetables.
In the next row we show the value of per capita exports, which gives an indication as to how outward looking each country is, and to what extent the labour force produces for the world market. Benchmarked on our sample, South Africa is ranked quite high (seventh) and is just one place behind Chile, which scores highest in the sample.
The product diversification results shown in rows P4a and P4b5 suggest that South Africa has a slightly more diversified basket of fruits and vegetables than Chile and a less diversified basket than Brazil. As would be expected, all developing countries in our sample trail the measure of diversification of products of the world leaders France and the US. Similar to the product diversification, it is possible to capture the degree of market diversification by means of two separate indicators – the equivalent number of markets and the corresponding concentration.
In rows P5a and P5b, it can be seen that South Africa’s market diversification is better relative to product diversification, with a higher ranking than all countries, including developed countries. This measure may be somewhat flattering since the individual EU countries are considered to be separate geographic markets. Brazil and Chile do not have this advantage, but could score much higher if each state of the US would be considered a separate market.
5 For a detailed exposition of these measures see previous section.
T r a d e I n f o r m a t i o n S e r v i c e 2 0 0 5
35
Finally, given the weights of each measure discussed and shown in Table 9, the ITC has calculated a composite ranking of the position of South Africa’s exports. The position-based composite ranking is essentially a ‘snapshot’ of South Africa’s export competitiveness performance. It can be seen that, given the weights assigned by the ITC, South Africa has a higher static competitiveness ranking than some of the countries in the sample. With a ranking of seventh out of the 59 countries, the current position of the Fruits and Vegetables ProductMap in the global market can be considered as relatively high.
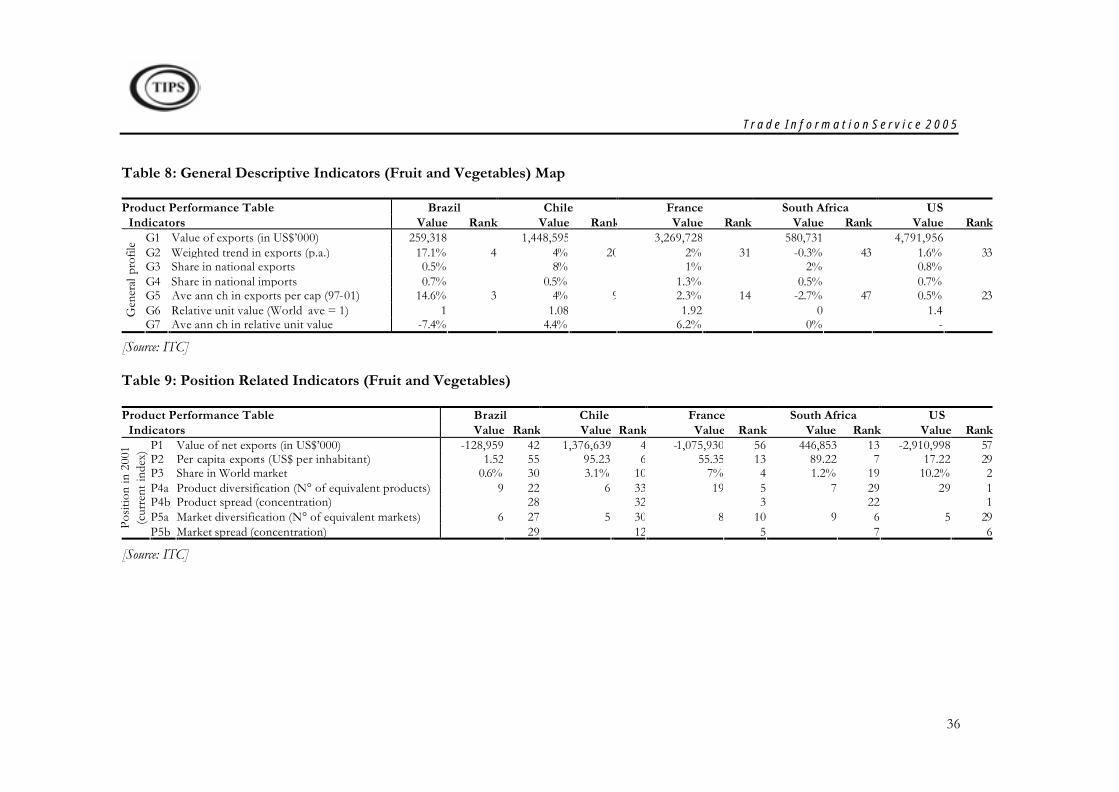
T r a d e I n f o r m a t i o n S e r v i c e 2 0 0 5
36
Table 8: General Descriptive Indicators (Fruit and Vegetables) Map
Product Performance Table Brazil Chile France South Africa US Indicators Value Rank Value Rank Value Rank Value Rank Value Rank
G1 Value of exports (in US$’000) 259,318 1,448,595 3,269,728 580,731 4,791,956 G2 Weighted trend in exports (p.a.) 17.1% 4 4% 20 2% 31 -0.3% 43 1.6% 33G3 Share in national exports 0.5% 8% 1% 2% 0.8% G4 Share in national imports 0.7% 0.5% 1.3% 0.5% 0.7% G5 Ave ann ch in exports per cap (97-01) 14.6% 3 4% 9 2.3% 14 -2.7% 47 0.5% 23G6 Relative unit value (World ave = 1) 1 1.08 1.92 0 1.4 G
ener
al p
rofil
e
G7 Ave ann ch in relative unit value -7.4% 4.4% 6.2% 0% -
[Source: ITC]
Table 9: Position Related Indicators (Fruit and Vegetables)
Product Performance Table Brazil Chile France South Africa US Indicators Value Rank Value Rank Value Rank Value Rank Value Rank
P1 Value of net exports (in US$’000) -128,959 42 1,376,639 4 -1,075,930 56 446,853 13 -2,910,998 57P2 Per capita exports (US$ per inhabitant) 1.52 55 95.23 6 55.35 13 89.22 7 17.22 29P3 Share in World market 0.6% 30 3.1% 10 7% 4 1.2% 19 10.2% 2P4a Product diversification (N° of equivalent products) 9 22 6 33 19 5 7 29 29 1P4b Product spread (concentration) 28 32 3 22 1P5a Market diversification (N° of equivalent markets) 6 27 5 30 8 10 9 6 5 29
Posit
ion
in 2
001
(cur
rent
inde
x)
P5b Market spread (concentration) 29 12 5 7 6
[Source: ITC]
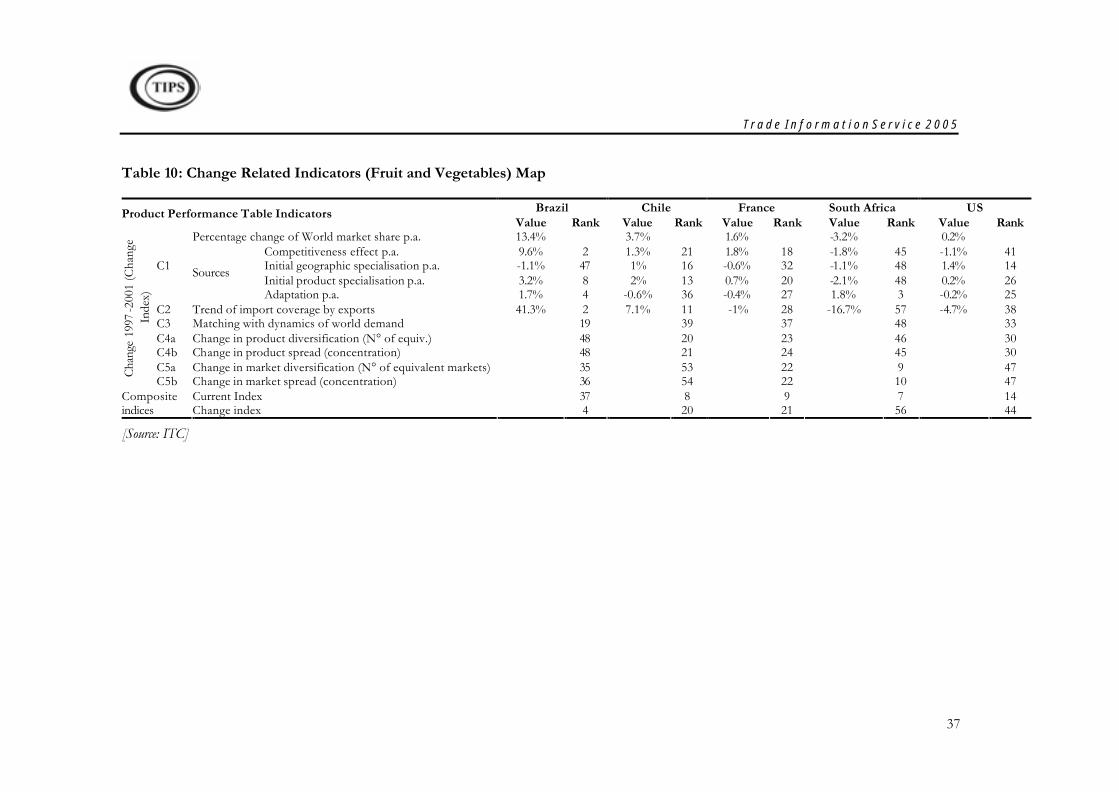
T r a d e I n f o r m a t i o n S e r v i c e 2 0 0 5
37
Table 10: Change Related Indicators (Fruit and Vegetables) Map
Brazil Chile France South Africa US Product Performance Table Indicators Value Rank Value Rank Value Rank Value Rank Value Rank
Percentage change of World market share p.a. 13.4% 3.7% 1.6% -3.2% 0.2%
Competitiveness effect p.a. 9.6% 2 1.3% 21 1.8% 18 -1.8% 45 -1.1% 41 Initial geographic specialisation p.a. -1.1% 47 1% 16 -0.6% 32 -1.1% 48 1.4% 14 Initial product specialisation p.a. 3.2% 8 2% 13 0.7% 20 -2.1% 48 0.2% 26
C1 Sources
Adaptation p.a. 1.7% 4 -0.6% 36 -0.4% 27 1.8% 3 -0.2% 25 C2 Trend of import coverage by exports 41.3% 2 7.1% 11 -1% 28 -16.7% 57 -4.7% 38 C3 Matching with dynamics of world demand 19 39 37 48 33 C4a Change in product diversification (N° of equiv.) 48 20 23 46 30 C4b Change in product spread (concentration) 48 21 24 45 30 C5a Change in market diversification (N° of equivalent markets) 35 53 22 9 47 Ch
ange
199
7-20
01 (C
hang
e In
dex)
C5b Change in market spread (concentration) 36 54 22 10 47 Current Index 37 8 9 7 14 Composite
indices Change index 4 20 21 56 44
[Source: ITC]
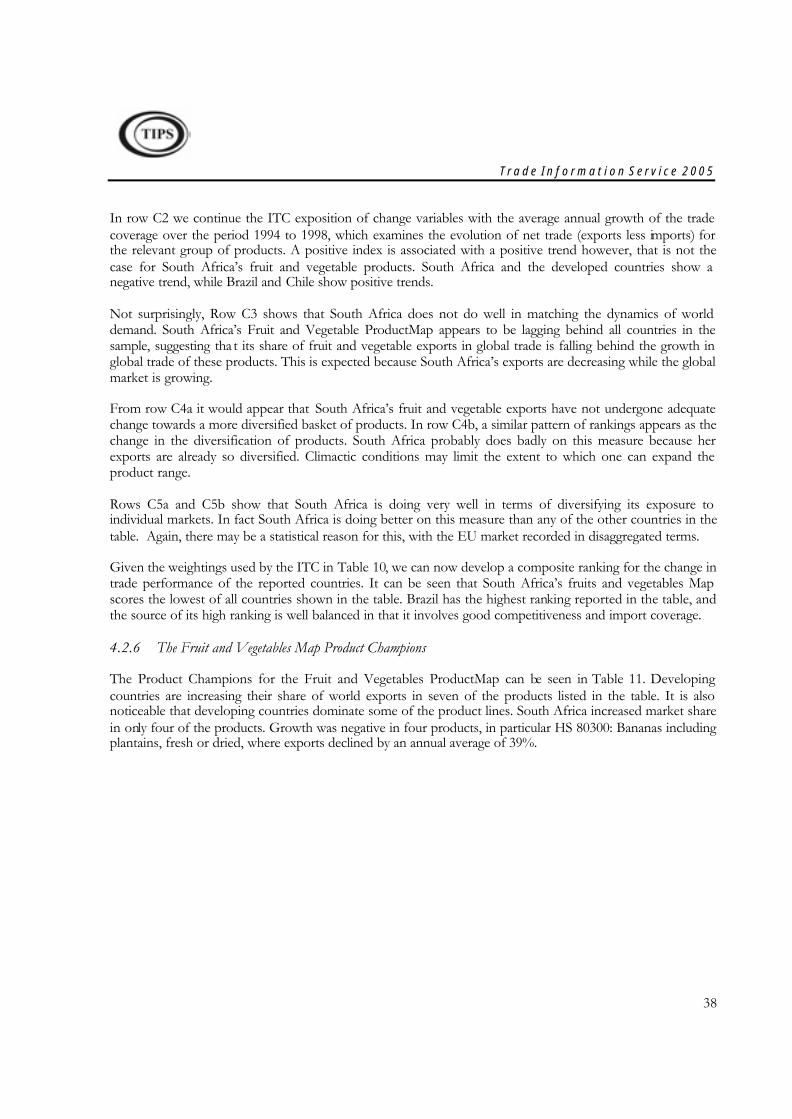
T r a d e I n f o r m a t i o n S e r v i c e 2 0 0 5
38
In row C2 we continue the ITC exposition of change variables with the average annual growth of the trade coverage over the period 1994 to 1998, which examines the evolution of net trade (exports less imports) for the relevant group of products. A positive index is associated with a positive trend however, that is not the case for South Africa’s fruit and vegetable products. South Africa and the developed countries show a negative trend, while Brazil and Chile show positive trends.
Not surprisingly, Row C3 shows that South Africa does not do well in matching the dynamics of world demand. South Africa’s Fruit and Vegetable ProductMap appears to be lagging behind all countries in the sample, suggesting tha t its share of fruit and vegetable exports in global trade is falling behind the growth in global trade of these products. This is expected because South Africa’s exports are decreasing while the global market is growing.
From row C4a it would appear that South Africa’s fruit and vegetable exports have not undergone adequate change towards a more diversified basket of products. In row C4b, a similar pattern of rankings appears as the change in the diversification of products. South Africa probably does badly on this measure because her exports are already so diversified. Climactic conditions may limit the extent to which one can expand the product range.
Rows C5a and C5b show that South Africa is doing very well in terms of diversifying its exposure to individual markets. In fact South Africa is doing better on this measure than any of the other countries in the table. Again, there may be a statistical reason for this, with the EU market recorded in disaggregated terms.
Given the weightings used by the ITC in Table 10, we can now develop a composite ranking for the change in trade performance of the reported countries. It can be seen that South Africa’s fruits and vegetables Map scores the lowest of all countries shown in the table. Brazil has the highest ranking reported in the table, and the source of its high ranking is well balanced in that it involves good competitiveness and import coverage.
4.2.6 The Fruit and Vegetables Map Product Champions
The Product Champions for the Fruit and Vegetables ProductMap can be seen in Table 11. Developing countries are increasing their share of world exports in seven of the products listed in the table. It is also noticeable that developing countries dominate some of the product lines. South Africa increased market share in only four of the products. Growth was negative in four products, in particular HS 80300: Bananas including plantains, fresh or dried, where exports declined by an annual average of 39%.
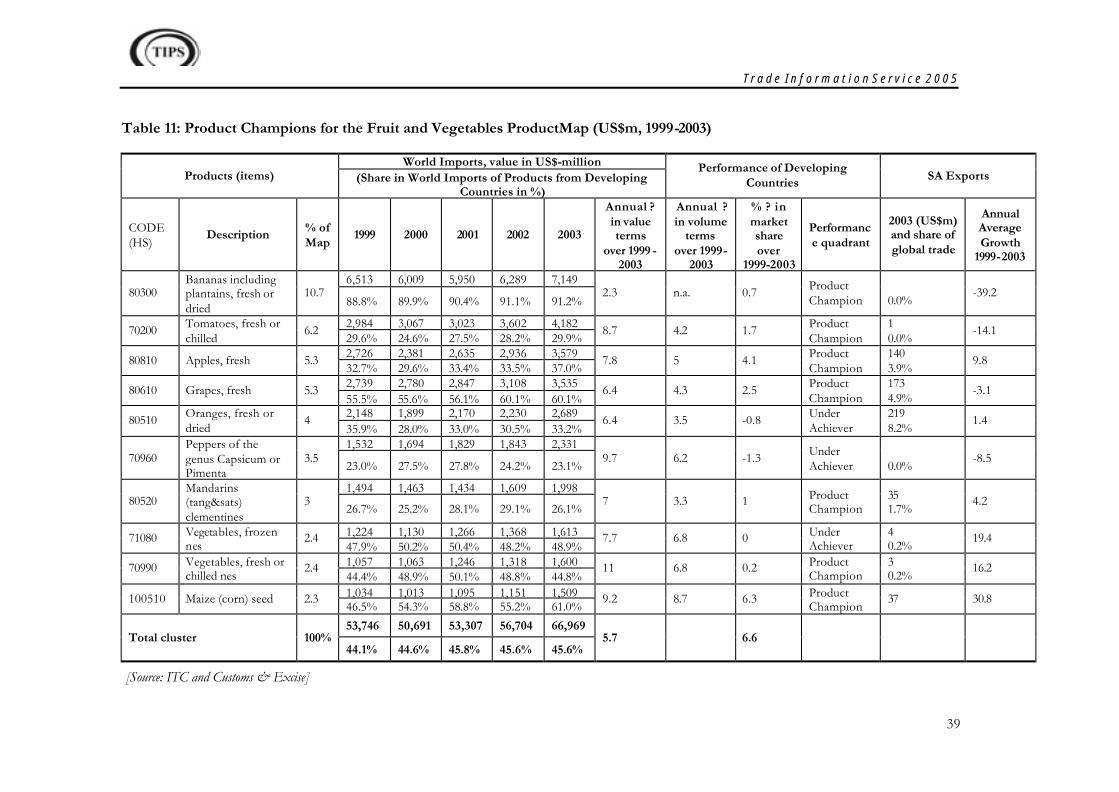
T r a d e I n f o r m a t i o n S e r v i c e 2 0 0 5
39
Table 11: Product Champions for the Fruit and Vegetables ProductMap (US$m, 1999-2003)
World Imports, value in US$-million Products (items) (Share in World Imports of Products from Developing
Countries in %)
Performance of Developing Countries SA Exports
CODE (HS)
Description % of Map
1999 2000 2001 2002 2003
Annual ? in value terms
over 1999 -2003
Annual ? in volume
terms over 1999-
2003
% ? in market share over
1999-2003
Performance quadrant
2003 (US$m) and share of global trade
Annual Average Growth
1999-2003
6,513 6,009 5,950 6,289 7,149 80300
Bananas including plantains, fresh or dried
10.7 88.8% 89.9% 90.4% 91.1% 91.2%
2.3 n.a. 0.7 Product Champion
0.0%
-39.2
2,984 3,067 3,023 3,602 4,182 70200 Tomatoes, fresh or chilled
6.2 29.6% 24.6% 27.5% 28.2% 29.9%
8.7 4.2 1.7 Product Champion
1 0.0%
-14.1
2,726 2,381 2,635 2,936 3,579 80810 Apples, fresh 5.3 32.7% 29.6% 33.4% 33.5% 37.0%
7.8 5 4.1 Product Champion
140 3.9%
9.8
2,739 2,780 2,847 3,108 3,535 80610 Grapes, fresh 5.3 55.5% 55.6% 56.1% 60.1% 60.1%
6.4 4.3 2.5 Product Champion
173 4.9%
-3.1
2,148 1,899 2,170 2,230 2,689 80510 Oranges, fresh or dried
4 35.9% 28.0% 33.0% 30.5% 33.2%
6.4 3.5 -0.8 Under Achiever
219 8.2%
1.4
1,532 1,694 1,829 1,843 2,331 70960
Peppers of the genus Capsicum or Pimenta
3.5 23.0% 27.5% 27.8% 24.2% 23.1%
9.7 6.2 -1.3 Under Achiever
0.0%
-8.5
1,494 1,463 1,434 1,609 1,998 80520
Mandarins (tang&sats) clementines
3 26.7% 25.2% 28.1% 29.1% 26.1%
7 3.3 1 Product Champion
35 1.7%
4.2
1,224 1,130 1,266 1,368 1,613 71080 Vegetables, frozen nes
2.4 47.9% 50.2% 50.4% 48.2% 48.9%
7.7 6.8 0 Under Achiever
4 0.2%
19.4
1,057 1,063 1,246 1,318 1,600 70990 Vegetables, fresh or chilled nes
2.4 44.4% 48.9% 50.1% 48.8% 44.8%
11 6.8 0.2 Product Champion
3 0.2%
16.2
1,034 1,013 1,095 1,151 1,509 100510 Maize (corn) seed 2.3 46.5% 54.3% 58.8% 55.2% 61.0%
9.2 8.7 6.3 Product Champion
37 30.8
53,746 50,691 53,307 56,704 66,969 Total cluster 100%
44.1% 44.6% 45.8% 45.6% 45.6% 5.7 6.6
[Source: ITC and Customs & Excise]
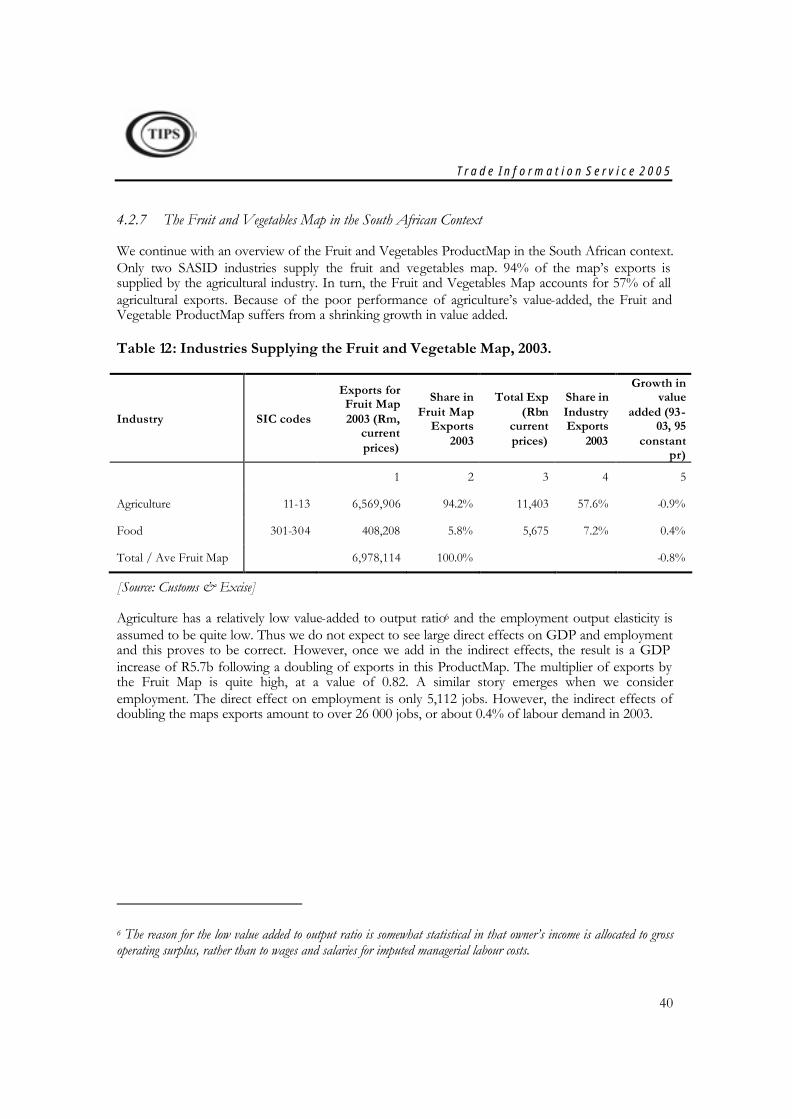
T r a d e I n f o r m a t i o n S e r v i c e 2 0 0 5
40
4.2.7 The Fruit and Vegetables Map in the South African Context
We continue with an overview of the Fruit and Vegetables ProductMap in the South African context. Only two SASID industries supply the fruit and vegetables map. 94% of the map’s exports is supplied by the agricultural industry. In turn, the Fruit and Vegetables Map accounts for 57% of all agricultural exports. Because of the poor performance of agriculture’s value-added, the Fruit and Vegetable ProductMap suffers from a shrinking growth in value added.
Table 12: Industries Supplying the Fruit and Vegetable Map, 2003.
Industry SIC codes
Exports for Fruit Map 2003 (Rm,
current prices)
Share in Fruit Map
Exports 2003
Total Exp (Rbn
current prices)
Share in Industry Exports
2003
Growth in value
added (93-03, 95
constant pr)
1 2 3 4 5
Agriculture 11-13 6,569,906 94.2% 11,403 57.6% -0.9%
Food 301-304 408,208 5.8% 5,675 7.2% 0.4%
Total / Ave Fruit Map 6,978,114 100.0% -0.8%
[Source: Customs & Excise]
Agriculture has a relatively low value-added to output ratio6 and the employment output elasticity is assumed to be quite low. Thus we do not expect to see large direct effects on GDP and employment and this proves to be correct. However, once we add in the indirect effects, the result is a GDP increase of R5.7b following a doubling of exports in this ProductMap. The multiplier of exports by the Fruit Map is quite high, at a value of 0.82. A similar story emerges when we consider employment. The direct effect on employment is only 5,112 jobs. However, the indirect effects of doubling the maps exports amount to over 26 000 jobs, or about 0.4% of labour demand in 2003.
6 The reason for the low value added to output ratio is somewhat statistical in that owner’s income is allocated to gross operating surplus, rather than to wages and salaries for imputed managerial labour costs.
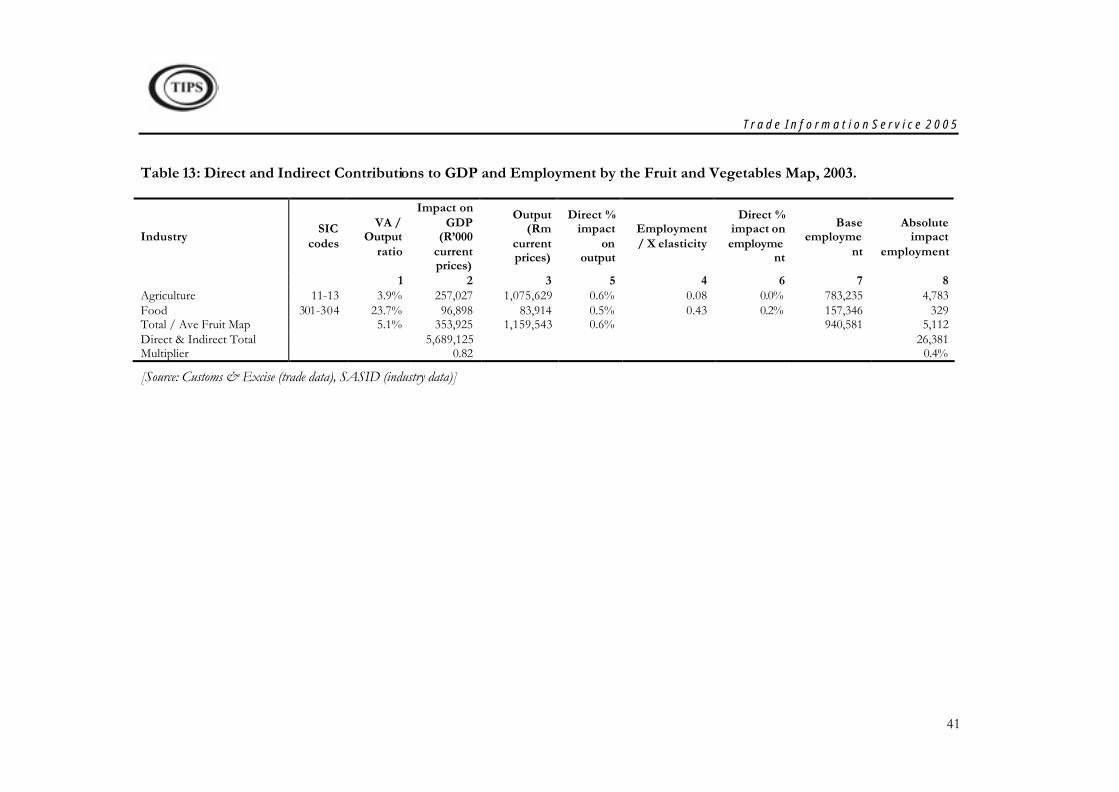
T r a d e I n f o r m a t i o n S e r v i c e 2 0 0 5
41
Table 13: Direct and Indirect Contributions to GDP and Employment by the Fruit and Vegetables Map, 2003.
Industry SIC
codes
VA / Output
ratio
Impact on GDP
(R’000 current prices)
Output (Rm
current prices)
Direct % impact
on output
Employment / X elasticity
Direct % impact on employme
nt
Base employme
nt
Absolute impact
employment
1 2 3 5 4 6 7 8 Agriculture 11-13 3.9% 257,027 1,075,629 0.6% 0.08 0.0% 783,235 4,783 Food 301-304 23.7% 96,898 83,914 0.5% 0.43 0.2% 157,346 329 Total / Ave Fruit Map 5.1% 353,925 1,159,543 0.6% 940,581 5,112 Direct & Indirect Total 5,689,125 26,381 Multiplier 0.82 0.4%
[Source: Customs & Excise (trade data), SASID (industry data)]
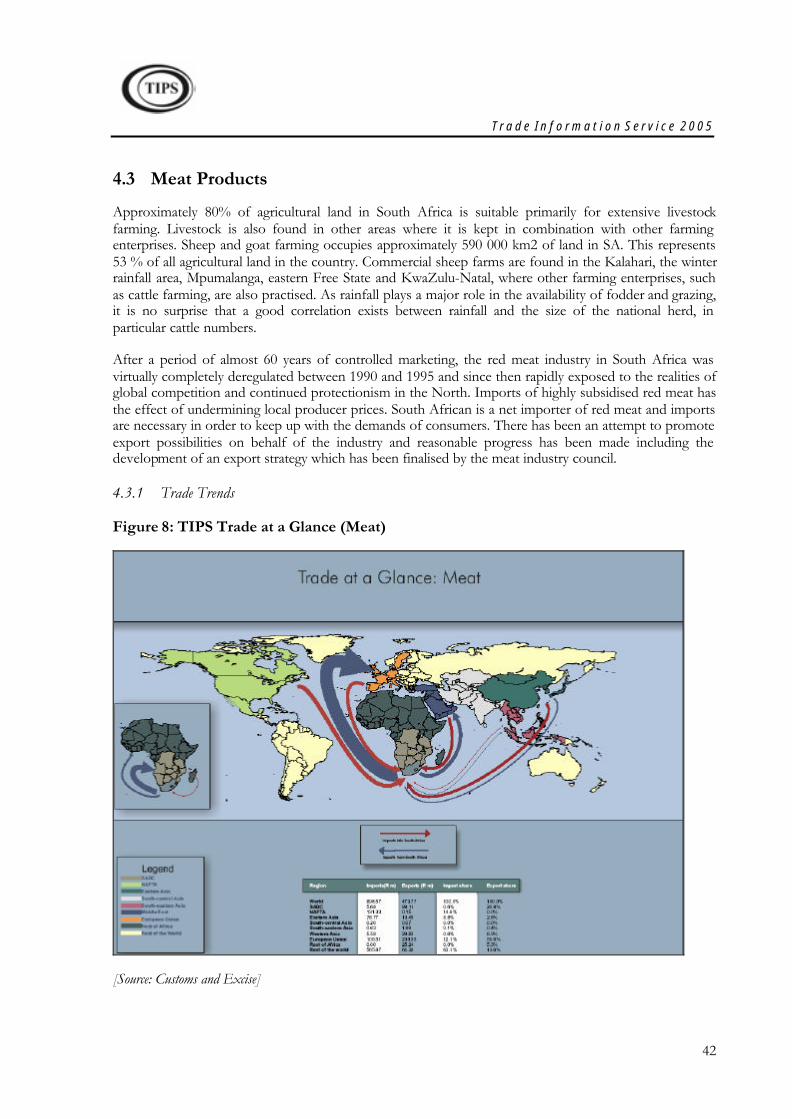
T r a d e I n f o r m a t i o n S e r v i c e 2 0 0 5
42
4.3 Meat Products
Approximately 80% of agricultural land in South Africa is suitable primarily for extensive livestock farming. Livestock is also found in other areas where it is kept in combination with other farming enterprises. Sheep and goat farming occupies approximately 590 000 km2 of land in SA. This represents 53 % of all agricultural land in the country. Commercial sheep farms are found in the Kalahari, the winter rainfall area, Mpumalanga, eastern Free State and KwaZulu-Natal, where other farming enterprises, such as cattle farming, are also practised. As rainfall plays a major role in the availability of fodder and grazing, it is no surprise that a good correlation exists between rainfall and the size of the national herd, in particular cattle numbers.
After a period of almost 60 years of controlled marketing, the red meat industry in South Africa was virtually completely deregulated between 1990 and 1995 and since then rapidly exposed to the realities of global competition and continued protectionism in the North. Imports of highly subsidised red meat has the effect of undermining local producer prices. South African is a net importer of red meat and imports are necessary in order to keep up with the demands of consumers. There has been an attempt to promote export possibilities on behalf of the industry and reasonable progress has been made including the development of an export strategy which has been finalised by the meat industry council.
4.3.1 Trade Trends
Figure 8: TIPS Trade at a Glance (Meat)
[Source: Customs and Excise]
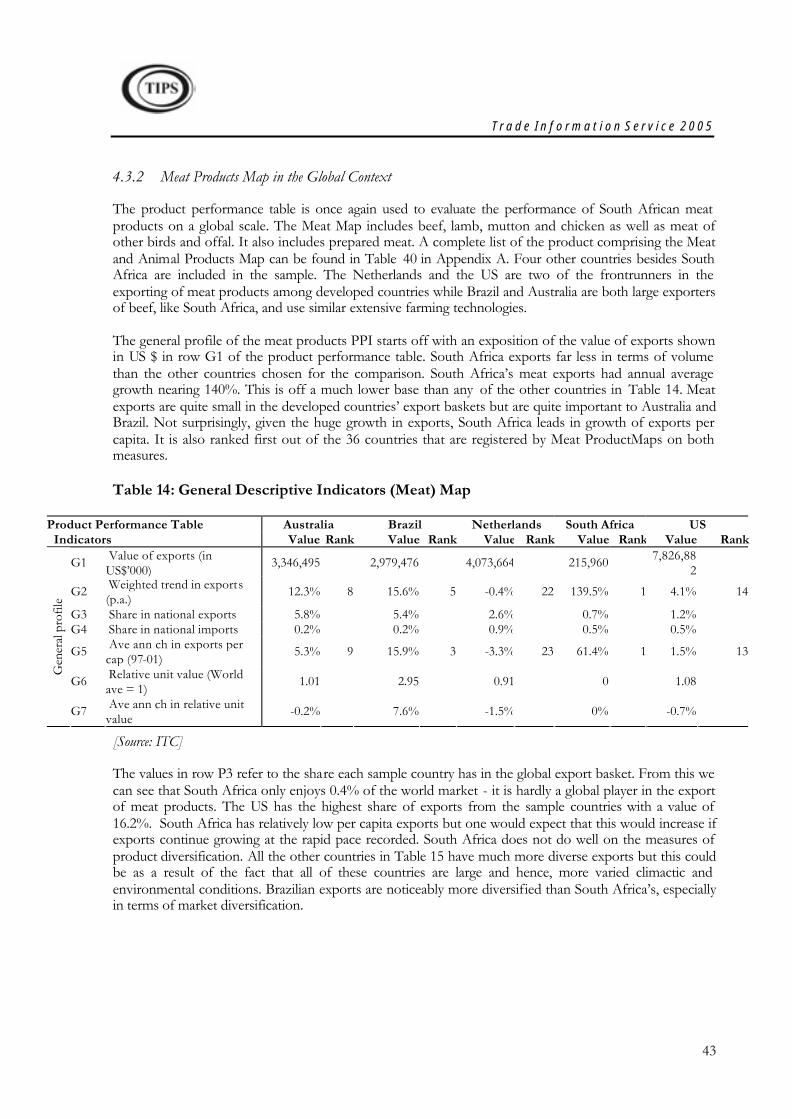
T r a d e I n f o r m a t i o n S e r v i c e 2 0 0 5
43
4.3.2 Meat Products Map in the Global Context
The product performance table is once again used to evaluate the performance of South African meat products on a global scale. The Meat Map includes beef, lamb, mutton and chicken as well as meat of other birds and offal. It also includes prepared meat. A complete list of the product comprising the Meat and Animal Products Map can be found in Table 40 in Appendix A. Four other countries besides South Africa are included in the sample. The Netherlands and the US are two of the frontrunners in the exporting of meat products among developed countries while Brazil and Australia are both large exporters of beef, like South Africa, and use similar extensive farming technologies.
The general profile of the meat products PPI starts off with an exposition of the value of exports shown in US $ in row G1 of the product performance table. South Africa exports far less in terms of volume than the other countries chosen for the comparison. South Africa’s meat exports had annual average growth nearing 140%. This is off a much lower base than any of the other countries in Table 14. Meat exports are quite small in the developed countries’ export baskets but are quite important to Australia and Brazil. Not surprisingly, given the huge growth in exports, South Africa leads in growth of exports per capita. It is also ranked first out of the 36 countries that are registered by Meat ProductMaps on both measures.
Table 14: General Descriptive Indicators (Meat) Map
Product Performance Table Australia Brazil Netherlands South Africa US Indicators Value Rank Value Rank Value Rank Value Rank Value Rank
G1 Value of exports (in US$’000) 3,346,495 2,979,476 4,073,664 215,960 7,826,88
2
G2 Weighted trend in exports (p.a.) 12.3% 8 15.6% 5 -0.4% 22 139.5% 1 4.1% 14
G3 Share in national exports 5.8% 5.4% 2.6% 0.7% 1.2% G4 Share in national imports 0.2% 0.2% 0.9% 0.5% 0.5%
G5 Ave ann ch in exports per cap (97-01) 5.3% 9 15.9% 3 -3.3% 23 61.4% 1 1.5% 13
G6 Relative unit value (World ave = 1) 1.01 2.95 0.91 0 1.08
Gen
eral
pro
file
G7 Ave ann ch in relative unit value -0.2% 7.6% -1.5% 0% -0.7%
[Source: ITC]
The values in row P3 refer to the share each sample country has in the global export basket. From this we can see that South Africa only enjoys 0.4% of the world market - it is hardly a global player in the export of meat products. The US has the highest share of exports from the sample countries with a value of 16.2%. South Africa has relatively low per capita exports but one would expect that this would increase if exports continue growing at the rapid pace recorded. South Africa does not do well on the measures of product diversification. All the other countries in Table 15 have much more diverse exports but this could be as a result of the fact that all of these countries are large and hence, more varied climactic and environmental conditions. Brazilian exports are noticeably more diversified than South Africa’s, especially in terms of market diversification.
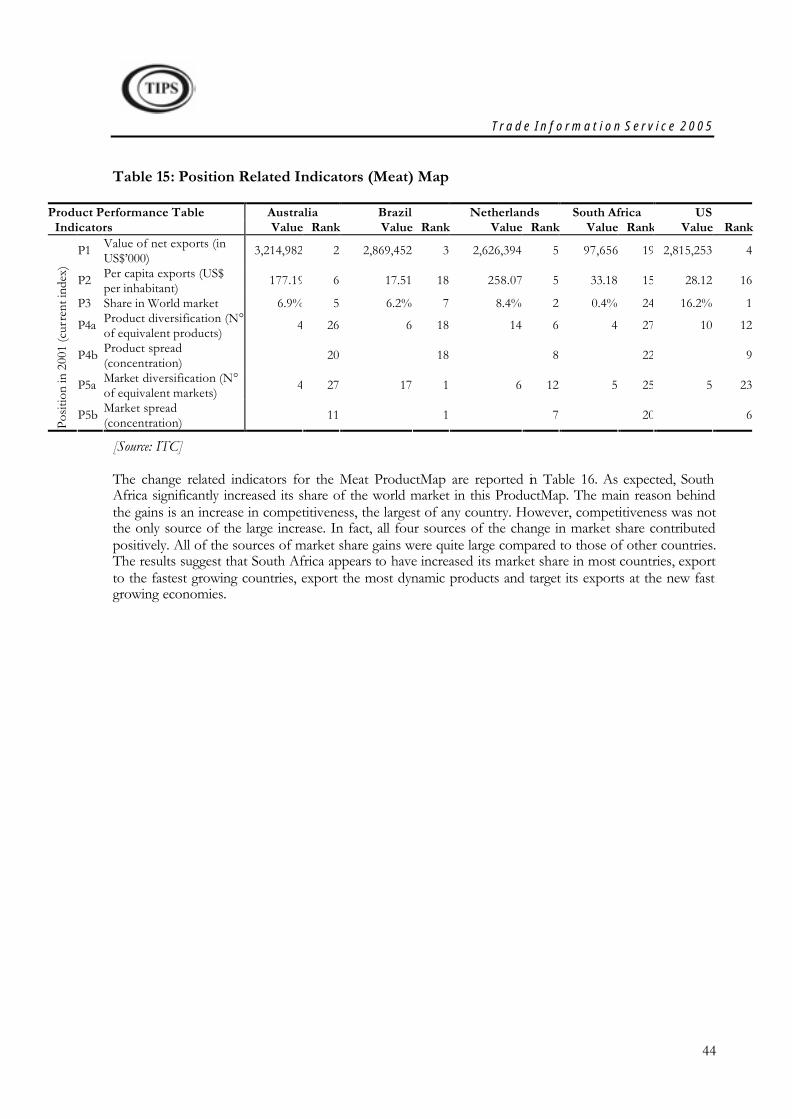
T r a d e I n f o r m a t i o n S e r v i c e 2 0 0 5
44
Table 15: Position Related Indicators (Meat) Map
Product Performance Table Australia Brazil Netherlands South Africa US Indicators Value Rank Value Rank Value Rank Value Rank Value Rank
P1 Value of net exports (in US$’000) 3,214,982 2 2,869,452 3 2,626,394 5 97,656 19 2,815,253 4
P2 Per capita exports (US$ per inhabitant) 177.19 6 17.51 18 258.07 5 33.18 15 28.12 16
P3 Share in World market 6.9% 5 6.2% 7 8.4% 2 0.4% 24 16.2% 1
P4a Product diversification (N° of equivalent products) 4 26 6 18 14 6 4 27 10 12
P4b Product spread (concentration) 20 18 8 22 9
P5a Market diversification (N° of equivalent markets) 4 27 17 1 6 12 5 25 5 23
Posit
ion
in 2
001
(cur
rent
inde
x)
P5b Market spread (concentration) 11 1 7 20 6
[Source: ITC]
The change related indicators for the Meat ProductMap are reported in Table 16. As expected, South Africa significantly increased its share of the world market in this ProductMap. The main reason behind the gains is an increase in competitiveness, the largest of any country. However, competitiveness was not the only source of the large increase. In fact, all four sources of the change in market share contributed positively. All of the sources of market share gains were quite large compared to those of other countries. The results suggest that South Africa appears to have increased its market share in most countries, export to the fastest growing countries, export the most dynamic products and target its exports at the new fast growing economies.
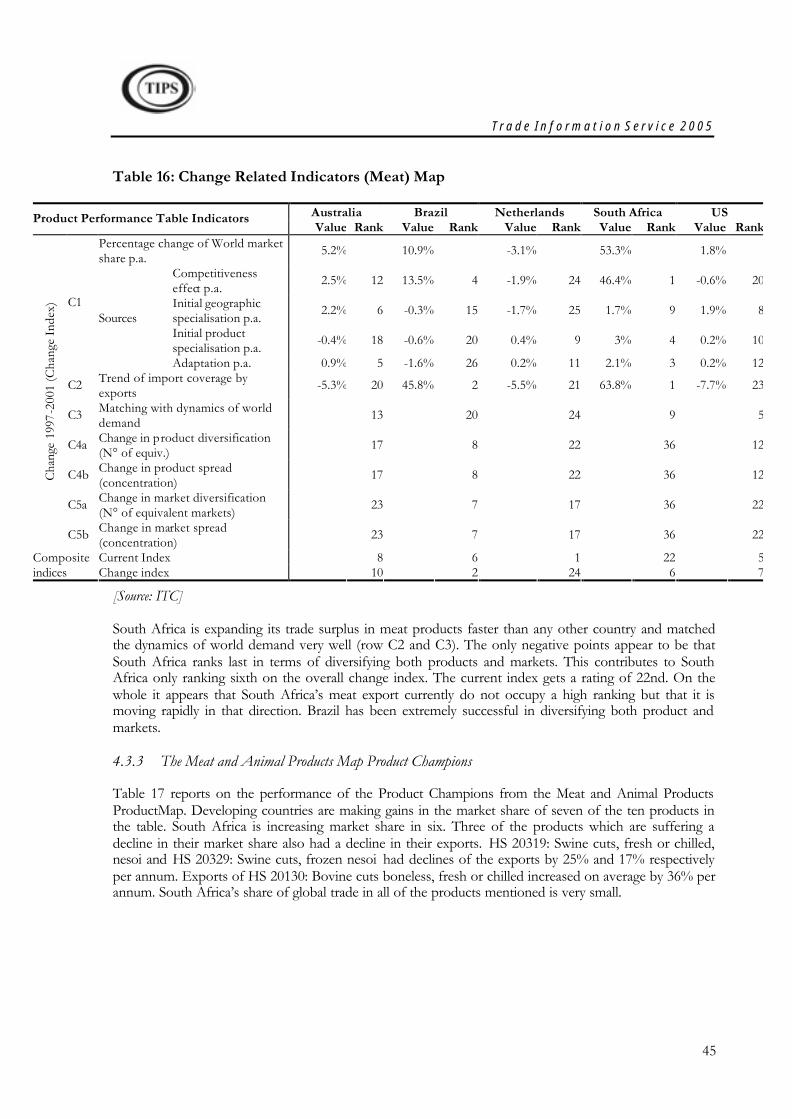
T r a d e I n f o r m a t i o n S e r v i c e 2 0 0 5
45
Table 16: Change Related Indicators (Meat) Map
Australia Brazil Netherlands South Africa US Product Performance Table Indicators Value Rank Value Rank Value Rank Value Rank Value Rank
Percentage change of World market share p.a. 5.2% 10.9% -3.1% 53.3% 1.8%
Competitiveness effect p.a. 2.5% 12 13.5% 4 -1.9% 24 46.4% 1 -0.6% 20
Initial geographic specialisation p.a. 2.2% 6 -0.3% 15 -1.7% 25 1.7% 9 1.9% 8
Initial product specialisation p.a. -0.4% 18 -0.6% 20 0.4% 9 3% 4 0.2% 10
C1 Sources
Adaptation p.a. 0.9% 5 -1.6% 26 0.2% 11 2.1% 3 0.2% 12
C2 Trend of import coverage by exports -5.3% 20 45.8% 2 -5.5% 21 63.8% 1 -7.7% 23
C3 Matching with dynamics of world demand 13 20 24 9 5
C4a Change in product diversification (N° of equiv.) 17 8 22 36 12
C4b Change in product spread (concentration) 17 8 22 36 12
C5a Change in market diversification (N° of equivalent markets) 23 7 17 36 22
Cha
nge
1997
-200
1 (C
hang
e In
dex)
C5b Change in market spread (concentration) 23 7 17 36 22
Current Index 8 6 1 22 5Composite indices Change index 10 2 24 6 7
[Source: ITC]
South Africa is expanding its trade surplus in meat products faster than any other country and matched the dynamics of world demand very well (row C2 and C3). The only negative points appear to be that South Africa ranks last in terms of diversifying both products and markets. This contributes to South Africa only ranking sixth on the overall change index. The current index gets a rating of 22nd. On the whole it appears that South Africa’s meat export currently do not occupy a high ranking but that it is moving rapidly in that direction. Brazil has been extremely successful in diversifying both product and markets.
4.3.3 The Meat and Animal Products Map Product Champions
Table 17 reports on the performance of the Product Champions from the Meat and Animal Products ProductMap. Developing countries are making gains in the market share of seven of the ten products in the table. South Africa is increasing market share in six. Three of the products which are suffering a decline in their market share also had a decline in their exports. HS 20319: Swine cuts, fresh or chilled, nesoi and HS 20329: Swine cuts, frozen nesoi had declines of the exports by 25% and 17% respectively per annum. Exports of HS 20130: Bovine cuts boneless, fresh or chilled increased on average by 36% per annum. South Africa’s share of global trade in all of the products mentioned is very small.
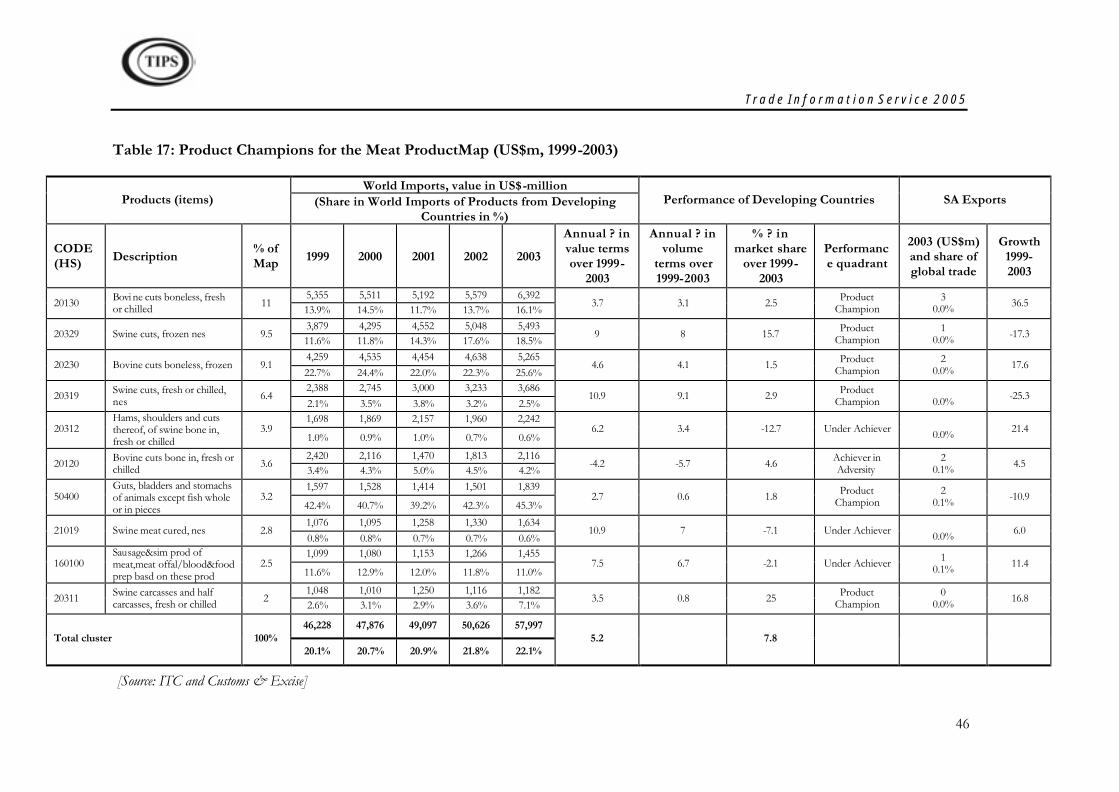
T r a d e I n f o r m a t i o n S e r v i c e 2 0 0 5
46
Table 17: Product Champions for the Meat ProductMap (US$m, 1999-2003)
World Imports, value in US$-million Products (items) (Share in World Imports of Products from Developing
Countries in %) Performance of Developing Countries SA Exports
CODE (HS) Description % of
Map 1999 2000 2001 2002 2003
Annual ? in value terms over 1999-
2003
Annual ? in volume
terms over 1999-2003
% ? in market share
over 1999-2003
Performance quadrant
2003 (US$m) and share of global trade
Growth 1999-2003
5,355 5,511 5,192 5,579 6,392 20130 Bovi ne cuts boneless, fresh
or chilled 11 13.9% 14.5% 11.7% 13.7% 16.1%
3.7 3.1 2.5 Product Champion
3 0.0% 36.5
3,879 4,295 4,552 5,048 5,493 20329 Swine cuts, frozen nes 9.5
11.6% 11.8% 14.3% 17.6% 18.5% 9 8 15.7 Product
Champion 1
0.0% -17.3
4,259 4,535 4,454 4,638 5,265 20230 Bovine cuts boneless, frozen 9.1
22.7% 24.4% 22.0% 22.3% 25.6% 4.6 4.1 1.5 Product
Champion 2
0.0% 17.6
2,388 2,745 3,000 3,233 3,686 20319 Swine cuts, fresh or chilled,
nes 6.4 2.1% 3.5% 3.8% 3.2% 2.5%
10.9 9.1 2.9 Product Champion
0.0% -25.3
1,698 1,869 2,157 1,960 2,242 20312
Hams, shoulders and cuts thereof, of swine bone in, fresh or chilled
3.9 1.0% 0.9% 1.0% 0.7% 0.6%
6.2 3.4 -12.7 Under Achiever 0.0% 21.4
2,420 2,116 1,470 1,813 2,116 20120 Bovine cuts bone in, fresh or
chilled 3.6 3.4% 4.3% 5.0% 4.5% 4.2%
-4.2 -5.7 4.6 Achiever in Adversity
2 0.1% 4.5
1,597 1,528 1,414 1,501 1,839 50400
Guts, bladders and stomachs of animals except fish whole or in pieces
3.2 42.4% 40.7% 39.2% 42.3% 45.3%
2.7 0.6 1.8 Product Champion
2 0.1% -10.9
1,076 1,095 1,258 1,330 1,634 21019 Swine meat cured, nes 2.8
0.8% 0.8% 0.7% 0.7% 0.6% 10.9 7 -7.1 Under Achiever
0.0% 6.0
1,099 1,080 1,153 1,266 1,455 160100
Sausage&sim prod of meat,meat offal/blood&food prep basd on these prod
2.5 11.6% 12.9% 12.0% 11.8% 11.0%
7.5 6.7 -2.1 Under Achiever 1 0.1% 11.4
1,048 1,010 1,250 1,116 1,182 20311 Swine carcasses and half
carcasses, fresh or chilled 2 2.6% 3.1% 2.9% 3.6% 7.1%
3.5 0.8 25 Product Champion
0 0.0% 16.8
46,228 47,876 49,097 50,626 57,997 Total cluster 100%
20.1% 20.7% 20.9% 21.8% 22.1% 5.2 7.8
[Source: ITC and Customs & Excise]
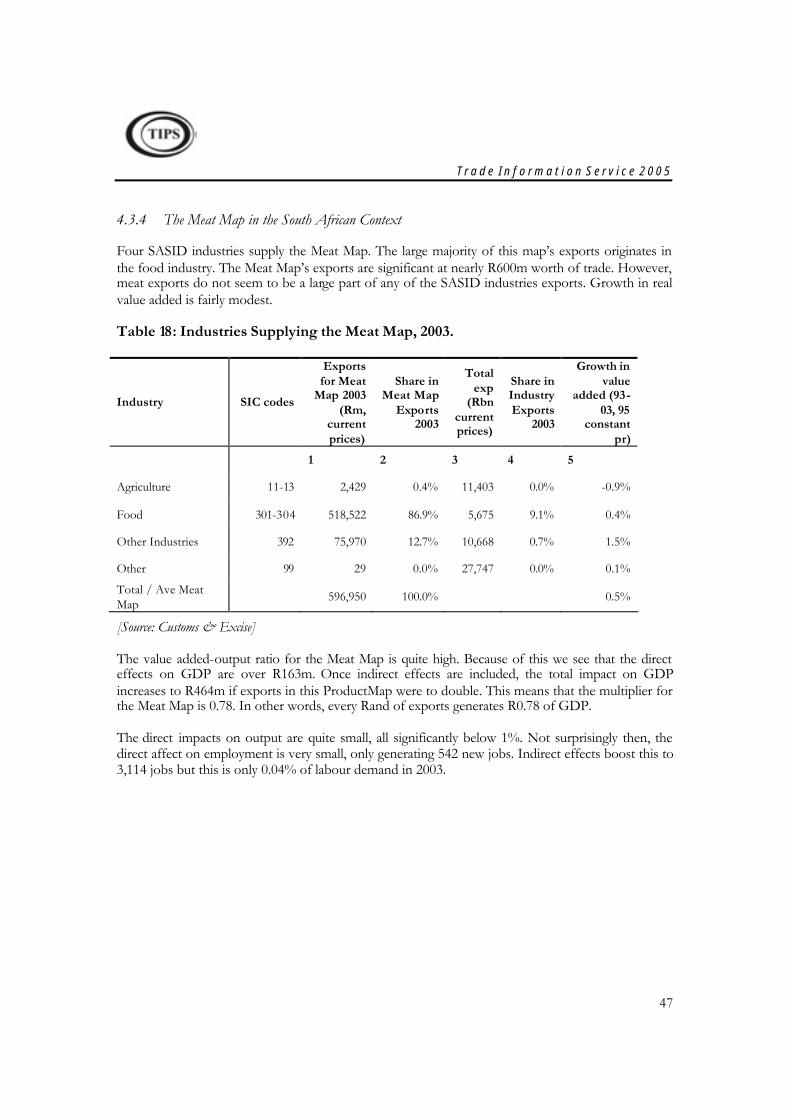
T r a d e I n f o r m a t i o n S e r v i c e 2 0 0 5
47
4.3.4 The Meat Map in the South African Context
Four SASID industries supply the Meat Map. The large majority of this map’s exports originates in the food industry. The Meat Map’s exports are significant at nearly R600m worth of trade. However, meat exports do not seem to be a large part of any of the SASID industries exports. Growth in real value added is fairly modest.
Table 18: Industries Supplying the Meat Map, 2003.
Industry SIC codes
Exports for Meat
Map 2003 (Rm,
current prices)
Share in Meat Map
Exports 2003
Total exp
(Rbn current prices)
Share in Industry Exports
2003
Growth in value
added (93-03, 95
constant pr)
1 2 3 4 5
Agriculture 11-13 2,429 0.4% 11,403 0.0% -0.9%
Food 301-304 518,522 86.9% 5,675 9.1% 0.4%
Other Industries 392 75,970 12.7% 10,668 0.7% 1.5%
Other 99 29 0.0% 27,747 0.0% 0.1%
Total / Ave Meat Map
596,950 100.0% 0.5%
[Source: Customs & Excise]
The value added-output ratio for the Meat Map is quite high. Because of this we see that the direct effects on GDP are over R163m. Once indirect effects are included, the total impact on GDP increases to R464m if exports in this ProductMap were to double. This means that the multiplier for the Meat Map is 0.78. In other words, every Rand of exports generates R0.78 of GDP.
The direct impacts on output are quite small, all significantly below 1%. Not surprisingly then, the direct affect on employment is very small, only generating 542 new jobs. Indirect effects boost this to 3,114 jobs but this is only 0.04% of labour demand in 2003.
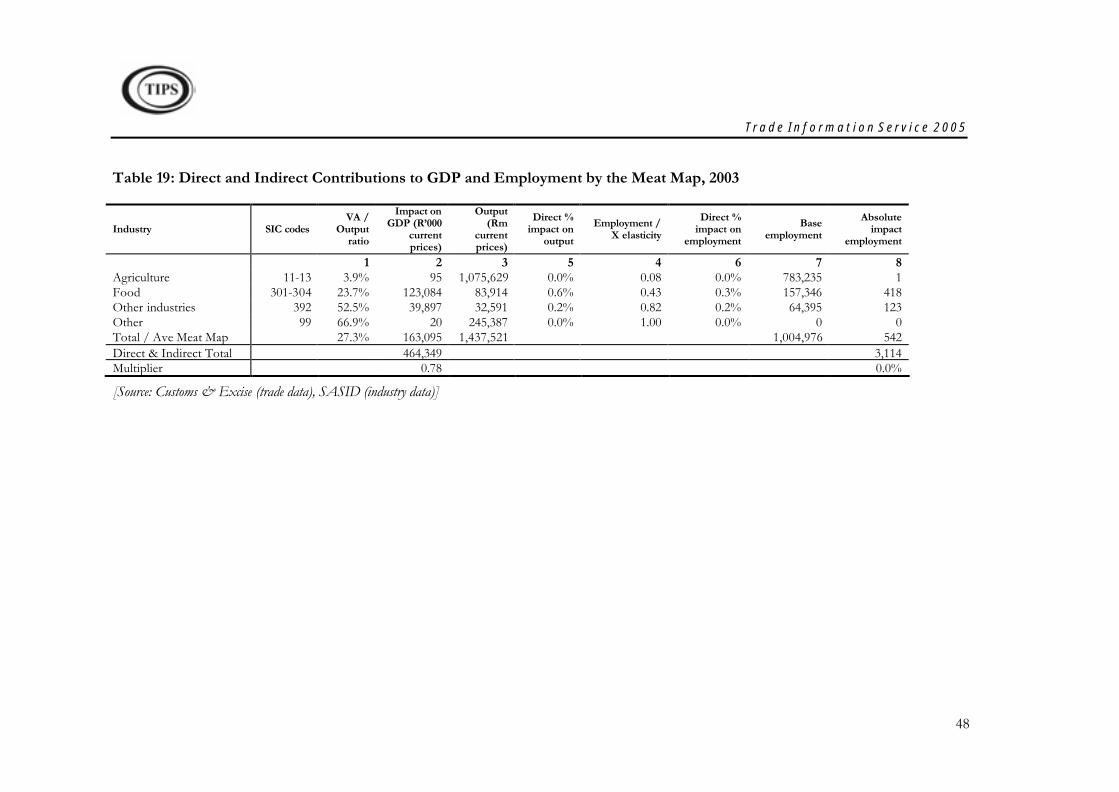
T r a d e I n f o r m a t i o n S e r v i c e 2 0 0 5
48
Table 19: Direct and Indirect Contributions to GDP and Employment by the Meat Map, 2003
Industry SIC codes VA /
Output ratio
Impact on GDP (R’000
current prices)
Output (Rm
current prices)
Direct % impact on
output
Employment / X elasticity
Direct % impact on
employment
Base employment
Absolute impact
employment
1 2 3 5 4 6 7 8 Agriculture 11-13 3.9% 95 1,075,629 0.0% 0.08 0.0% 783,235 1 Food 301-304 23.7% 123,084 83,914 0.6% 0.43 0.3% 157,346 418 Other industries 392 52.5% 39,897 32,591 0.2% 0.82 0.2% 64,395 123 Other 99 66.9% 20 245,387 0.0% 1.00 0.0% 0 0 Total / Ave Meat Map 27.3% 163,095 1,437,521 1,004,976 542 Direct & Indirect Total 464,349 3,114 Multiplier 0.78 0.0%
[Source: Customs & Excise (trade data), SASID (industry data)]
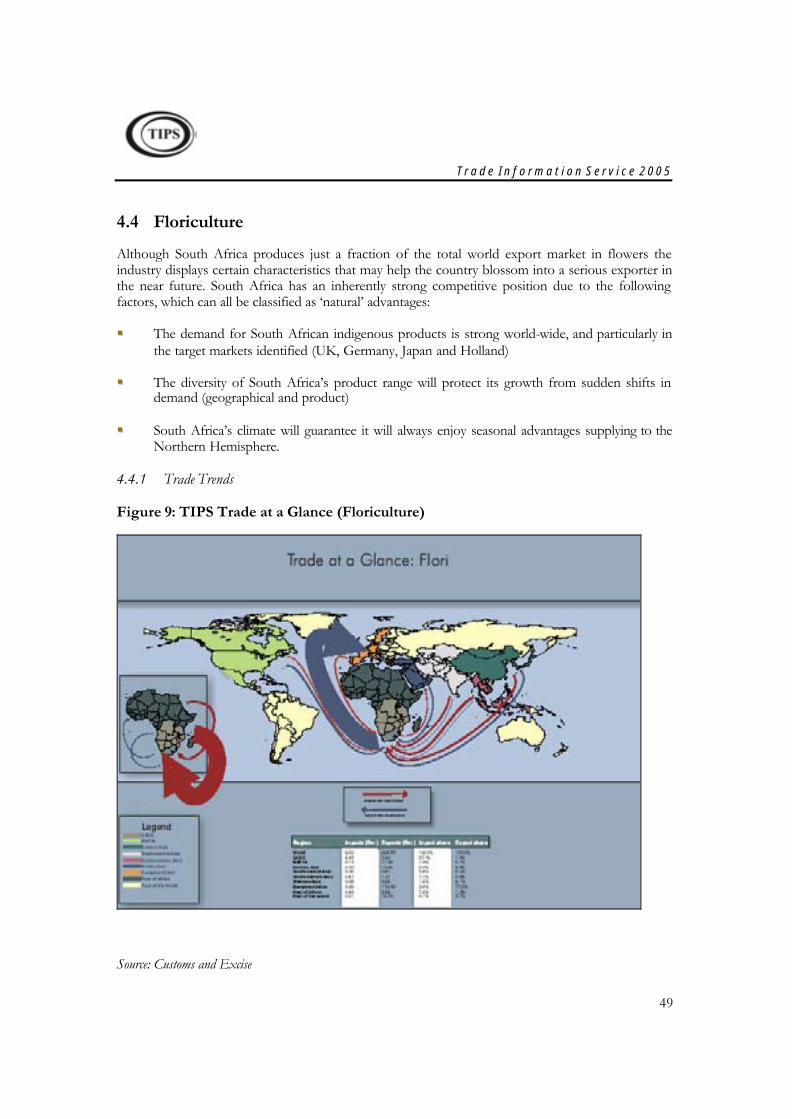
T r a d e I n f o r m a t i o n S e r v i c e 2 0 0 5
49
4.4 Floriculture
Although South Africa produces just a fraction of the total world export market in flowers the industry displays certain characteristics that may help the country blossom into a serious exporter in the near future. South Africa has an inherently strong competitive position due to the following factors, which can all be classified as ‘natural’ advantages:
§§ The demand for South African indigenous products is strong world-wide, and particularly in the target markets identified (UK, Germany, Japan and Holland)
§§ The diversity of South Africa’s product range will protect its growth from sudden shifts in demand (geographical and product)
§§ South Africa’s climate will guarantee it will always enjoy seasonal advantages supplying to the Northern Hemisphere.
4.4.1 Trade Trends
Figure 9: TIPS Trade at a Glance (Floriculture)
Source: Customs and Excise
T r a d e I n f o r m a t i o n S e r v i c e 2 0 0 5
50
4.4.2 Opportunities in the Floriculture Industry
The South African floriculture industry has the opportunity to grow into a significant player on the international stage. Whilst the industry currently employs 17,500 people with export revenues of $30m, over the next 10 years, with the appropriate focus and investment, the industry can expect to attract over $250m in foreign exchange and create over 80,000 further jobs. In terms of products and markets, there is exceptionally strong demand for South African floriculture across the world. In particular, Germany, the UK, Japan and the Netherlands represent the greatest opportunities in the short term.
South Africa produces mainly roses, Proteas and Cape foliage, but it's in the chrysanthemum where its strength lies. Local producers have tied up contracts to supply their Kenyan counterparts with chrysanthemums, which the Kenyans will include in bouquets destined for export to UK chain stores such as Tesco and Sainsbury. Similar deals have been sealed with Dutch producers, who have traditionally supplied the European market. While Kenya exports nine times more flowers than South Africa, the country is unable to grow chrysanthemums. Also, it is not economically viable for South Africa to export the chrysanthemums it produces because of a low price-to-weight ratio. Mining company Gold Fields has also started a rose-growing project to ensure continuation of employment once its gold reserves are eventually depleted.
The increase in the production of chrysanthemums and roses is likely to boost export volumes and reduce freight costs. However, the lack of co-operation between highly competitive flower producers in the pooling of cargo may hamper exports. Another obstacle to the country's export ambitions is the high demand for flowers on the local market. South Africa consumes about half of its flower production, while the other half is exported. This means that when the global market gets tough, producers can simply fall back on the domestic market.
4.4.3 Floriculture Map in the Global Context
Although The Netherlands is the leading exporter of cutters by far, commanding about 45% of the world market share, this industry is one in which South Africa seems to have great potential with high growth rates over the past few years. For comparison purposes, The Netherlands, Colombia and Kenya were used as the other countries in the sample. The Netherlands and Colombia were chosen by virtue of their being the top two net exporters worldwide, while Kenya, which seems to be relatively ahead of South Africa, offers interesting insights as an African country. A comprehensive list of the HS 6 commodities contained in the Cut Flowers Map can be found in Appendix A in Table 41.
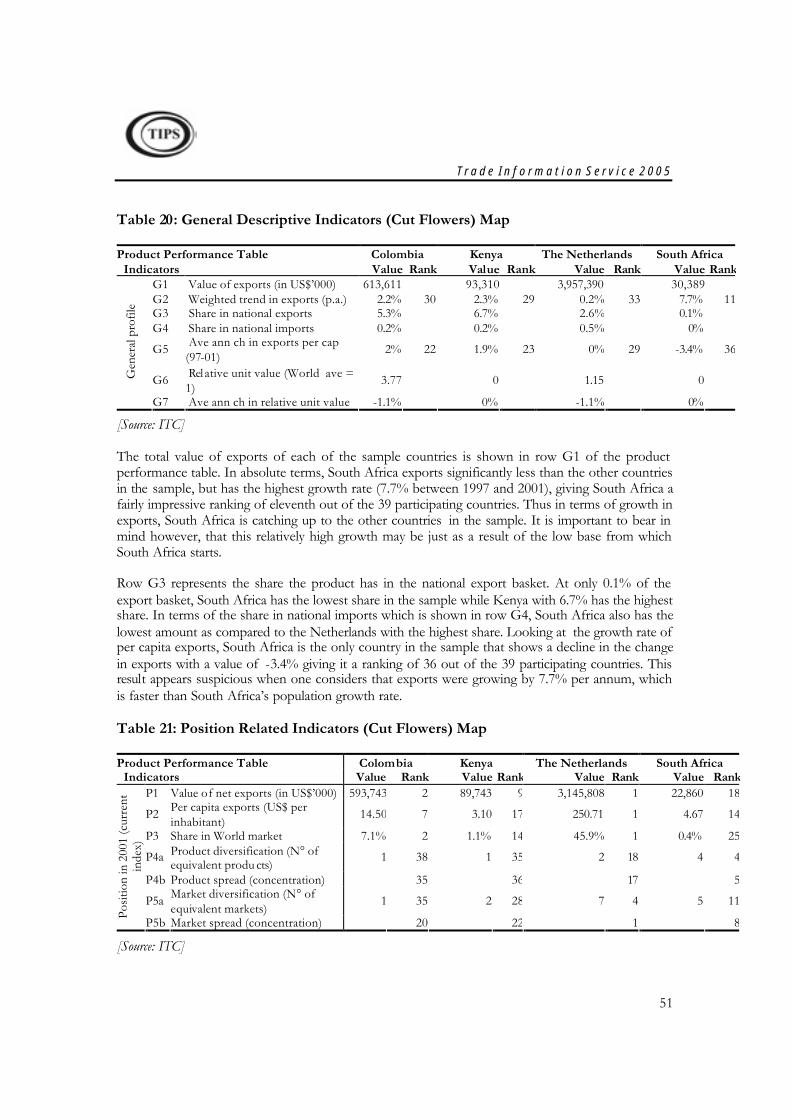
T r a d e I n f o r m a t i o n S e r v i c e 2 0 0 5
51
Table 20: General Descriptive Indicators (Cut Flowers) Map
Product Performance Table Colombia Kenya The Netherlands South Africa Indicators Value Rank Value Rank Value Rank Value Rank
G1 Value of exports (in US$’000) 613,611 93,310 3,957,390 30,389 G2 Weighted trend in exports (p.a.) 2.2% 30 2.3% 29 0.2% 33 7.7% 11G3 Share in national exports 5.3% 6.7% 2.6% 0.1% G4 Share in national imports 0.2% 0.2% 0.5% 0%
G5 Ave ann ch in exports per cap (97-01)
2% 22 1.9% 23 0% 29 -3.4% 36
G6 Relative unit value (World ave = 1)
3.77 0 1.15 0 Gen
eral
pro
file
G7 Ave ann ch in relative unit value -1.1% 0% -1.1% 0%
[Source: ITC]
The total value of exports of each of the sample countries is shown in row G1 of the product performance table. In absolute terms, South Africa exports significantly less than the other countries in the sample, but has the highest growth rate (7.7% between 1997 and 2001), giving South Africa a fairly impressive ranking of eleventh out of the 39 participating countries. Thus in terms of growth in exports, South Africa is catching up to the other countries in the sample. It is important to bear in mind however, that this relatively high growth may be just as a result of the low base from which South Africa starts.
Row G3 represents the share the product has in the national export basket. At only 0.1% of the export basket, South Africa has the lowest share in the sample while Kenya with 6.7% has the highest share. In terms of the share in national imports which is shown in row G4, South Africa also has the lowest amount as compared to the Netherlands with the highest share. Looking at the growth rate of per capita exports, South Africa is the only country in the sample that shows a decline in the change in exports with a value of -3.4% giving it a ranking of 36 out of the 39 participating countries. This result appears suspicious when one considers that exports were growing by 7.7% per annum, which is faster than South Africa’s population growth rate.
Table 21: Position Related Indicators (Cut Flowers) Map
Product Performance Table Colombia Kenya The Netherlands South Africa Indicators Value Rank Value Rank Value Rank Value Rank
P1 Value of net exports (in US$’000) 593,743 2 89,743 9 3,145,808 1 22,860 18
P2 Per capita exports (US$ per inhabitant)
14.50 7 3.10 17 250.71 1 4.67 14
P3 Share in World market 7.1% 2 1.1% 14 45.9% 1 0.4% 25
P4a Product diversification (N° of equivalent produ cts)
1 38 1 35 2 18 4 4
P4b Product spread (concentration) 35 36 17 5
P5a Market diversification (N° of equivalent markets)
1 35 2 28 7 4 5 11
Posit
ion
in 2
001
(cur
rent
in
dex)
P5b Market spread (concentration) 20 22 1 8
[Source: ITC]
T r a d e I n f o r m a t i o n S e r v i c e 2 0 0 5
52
The absolute value of net trade (exports less imports) which can also be interpreted as the measure of a commodity’s position in the world market is represented in row P1. All the countries in the sample are net exporters of cut flowers with the Netherlands emerging not just as the leader in the sample but as the world leader. Colombia is ranked second in the world, Kenya is ranked ninth while South Africa only has a ranking of eighteen. The value of per capita exports (row P2) for South Africa is 4.67 US$ giving it a ranking of 14th out of 39 countries for this ProductMap and third in the sample behind the Netherlands and Colombia but ahead of Kenya. Row P3 gives an indication of the share South Africa enjoys in the world market. South Africa is ranked 25th with a market share of 0.4%. The Netherlands is the world leader by far enjoying a share of 45.9%. Colombia and Kenya are ranked 2nd and 17th respectively.
Row P4 shows the degree of product diversification for the sample countries. In the sample, South Africa scores highest both in terms of product diversification and product spread / concentration with rankings of 4 and 5 respectively. This indicates that South Africa has a more diversified basket of cut flowers than the Netherlands and Colombia.
In terms of market diversification South Africa rates second behind the Netherlands but ahead of Colombia and Kenya in the sample with a ranking of 11 overall. The measure of the market spread / concentration shows similar results with South Africa again second in the sample behind the Netherlands. South Africa’s ranking in this instance is 8th.
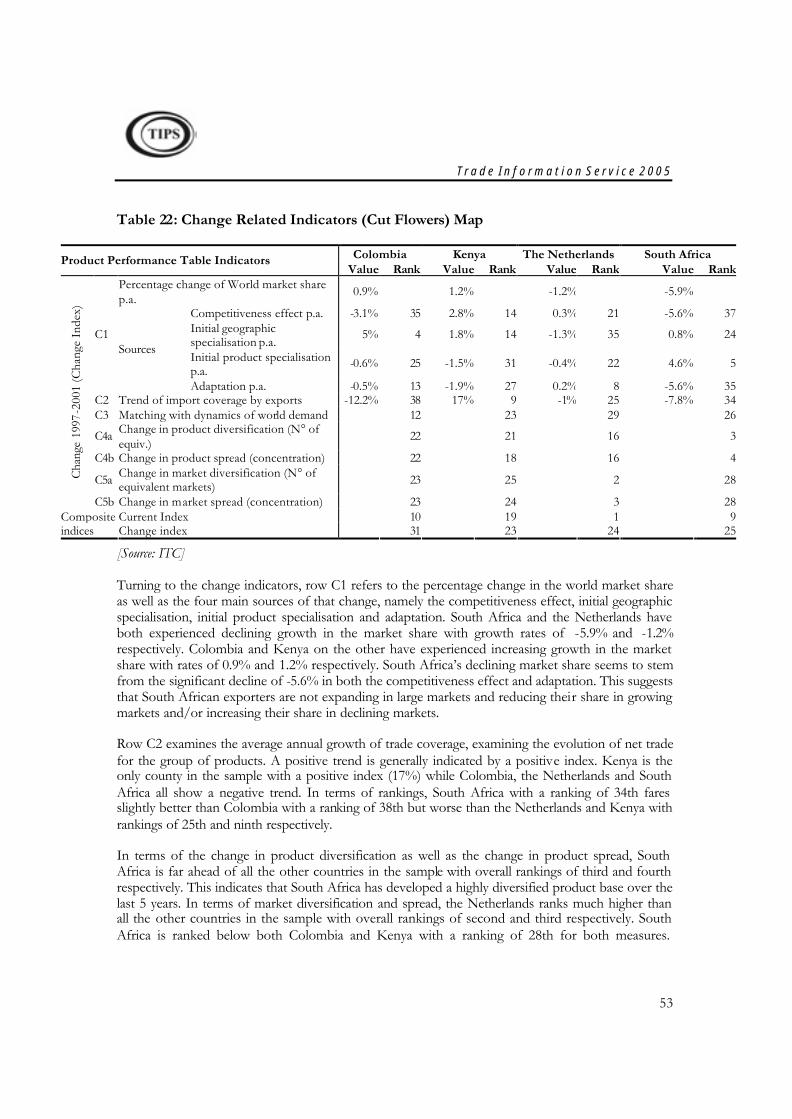
T r a d e I n f o r m a t i o n S e r v i c e 2 0 0 5
53
Table 22: Change Related Indicators (Cut Flowers) Map
Colombia Kenya The Netherlands South Africa Product Performance Table Indicators Value Rank Value Rank Value Rank Value Rank
Percentage change of World market share p.a.
0.9% 1.2% -1.2% -5.9%
Competitiveness effect p.a. -3.1% 35 2.8% 14 0.3% 21 -5.6% 37Initial geographic specialisation p.a.
5% 4 1.8% 14 -1.3% 35 0.8% 24
Initial product specialisation p.a.
-0.6% 25 -1.5% 31 -0.4% 22 4.6% 5
C1 Sources
Adaptation p.a. -0.5% 13 -1.9% 27 0.2% 8 -5.6% 35C2 Trend of import coverage by exports -12.2% 38 17% 9 -1% 25 -7.8% 34C3 Matching with dynamics of world demand 12 23 29 26
C4a Change in product diversification (N° of equiv.)
22 21 16 3
C4b Change in product spread (concentration) 22 18 16 4
C5a Change in market diversification (N° of equivalent markets) 23 25 2 28Ch
ange
199
7-20
01 (C
hang
e In
dex)
C5b Change in market spread (concentration) 23 24 3 28Current Index 10 19 1 9Composite
indices Change index 31 23 24 25
[Source: ITC]
Turning to the change indicators, row C1 refers to the percentage change in the world market share as well as the four main sources of that change, namely the competitiveness effect, initial geographic specialisation, initial product specialisation and adaptation. South Africa and the Netherlands have both experienced declining growth in the market share with growth rates of -5.9% and -1.2% respectively. Colombia and Kenya on the other have experienced increasing growth in the market share with rates of 0.9% and 1.2% respectively. South Africa’s declining market share seems to stem from the significant decline of -5.6% in both the competitiveness effect and adaptation. This suggests that South African exporters are not expanding in large markets and reducing their share in growing markets and/or increasing their share in declining markets.
Row C2 examines the average annual growth of trade coverage, examining the evolution of net trade for the group of products. A positive trend is generally indicated by a positive index. Kenya is the only county in the sample with a positive index (17%) while Colombia, the Netherlands and South Africa all show a negative trend. In terms of rankings, South Africa with a ranking of 34th fares slightly better than Colombia with a ranking of 38th but worse than the Netherlands and Kenya with rankings of 25th and ninth respectively.
In terms of the change in product diversification as well as the change in product spread, South Africa is far ahead of all the other countries in the sample with overall rankings of third and fourth respectively. This indicates that South Africa has developed a highly diversified product base over the last 5 years. In terms of market diversification and spread, the Netherlands ranks much higher than all the other countries in the sample with overall rankings of second and third respectively. South Africa is ranked below both Colombia and Kenya with a ranking of 28th for both measures.
T r a d e I n f o r m a t i o n S e r v i c e 2 0 0 5
54
Although South Africa’s market diversification is generally high according to the static measures it has not improved over the recent past.
In terms of the current composite index, as calculated by the ITC, South Africa ranks ninth overall behind the Netherlands which is ranked first, but ahead of Colombia and Kenya with rankings of tenth and 19th respectively. All countries in the sample do not fair well in terms of the change indicator, suggesting that there are other countries, not shown in the sample used here, that have recently improved their position.
4.4.4 Cut Flowers and Ornamental Plants Map Product Champions
The developing countries only increased their share of exports in five of the ten products listed as Product Champions in Table 23 below. South Africa performed less impressive, losing market share in six categories, all of which also experienced a decline in exports between 1999 and 2003. South Africa has a very small market share in virtually all of the products. One positive point for South Africa is that exports of HS 060491: Foliage, branch& pts of plant w/o flo/bud, grass, for bouquets grew by an average of 86% per annum, which may include proteas.
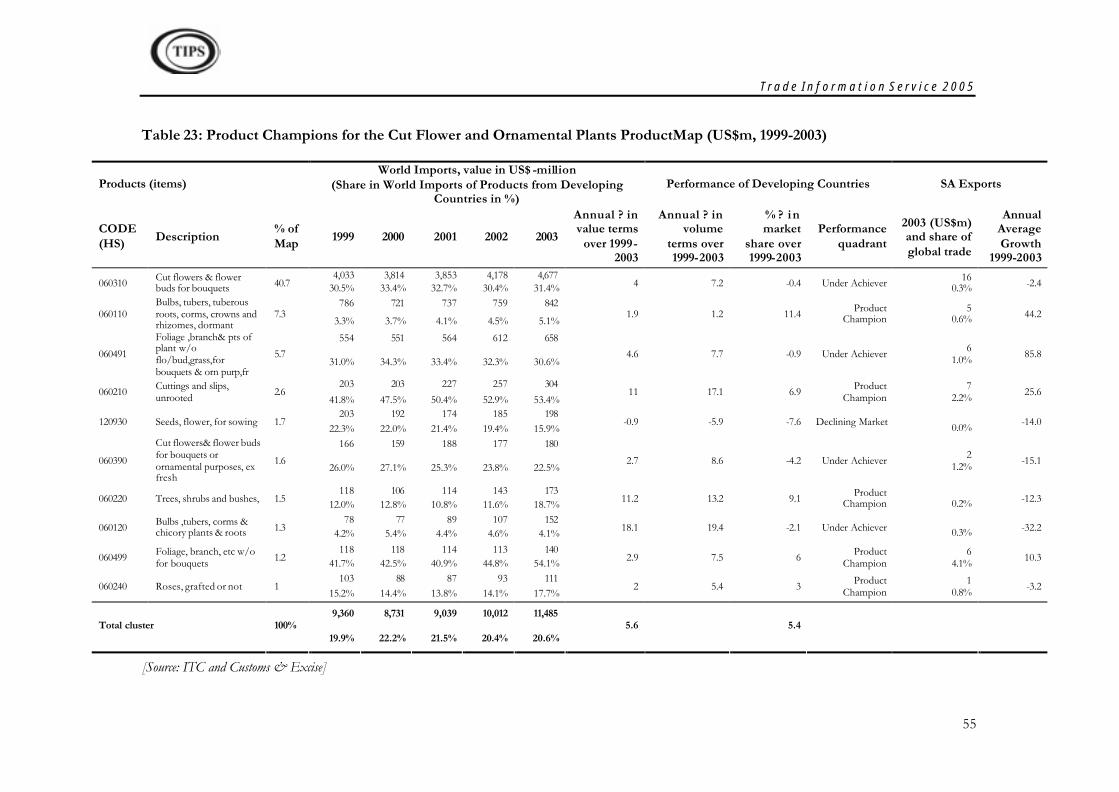
T r a d e I n f o r m a t i o n S e r v i c e 2 0 0 5
55
Table 23: Product Champions for the Cut Flower and Ornamental Plants ProductMap (US$m, 1999-2003)
World Imports, value in US$ -million Products (items) (Share in World Imports of Products from Developing
Countries in %) Performance of Developing Countries SA Exports
CODE (HS) Description
% of Map 1999 2000 2001 2002 2003
Annual ? in value terms
over 1999-2003
Annual ? in volume
terms over 1999-2003
% ? in market
share over 1999-2003
Performance quadrant
2003 (US$m) and share of global trade
Annual Average Growth
1999-2003 4,033 3,814 3,853 4,178 4,677
060310 Cut flowers & flower buds for bouquets 40.7 30.5% 33.4% 32.7% 30.4% 31.4% 4 7.2 -0.4 Under Achiever 16
0.3% -2.4
786 721 737 759 842 060110
Bulbs, tubers, tuberous roots, corms, crowns and rhizomes, dormant
7.3 3.3% 3.7% 4.1% 4.5% 5.1%
1.9 1.2 11.4 Product Champion
5 0.6% 44.2
554 551 564 612 658 060491
Foliage ,branch& pts of plant w/o flo/bud,grass,for bouquets & orn purp,fr
5.7 31.0% 34.3% 33.4% 32.3% 30.6%
4.6 7.7 -0.9 Under Achiever 6 1.0% 85.8
203 203 227 257 304 060210 Cuttings and slips,
unrooted 2.6 41.8% 47.5% 50.4% 52.9% 53.4%
11 17.1 6.9 Product Champion
7 2.2% 25.6
203 192 174 185 198 120930 Seeds, flower, for sowing 1.7
22.3% 22.0% 21.4% 19.4% 15.9% -0.9 -5.9 -7.6 Declining Market
0.0% -14.0
166 159 188 177 180
060390
Cut flowers& flower buds for bouquets or ornamental purposes, ex fresh
1.6 26.0% 27.1% 25.3% 23.8% 22.5%
2.7 8.6 -4.2 Under Achiever 2 1.2% -15.1
118 106 114 143 173 060220 Trees, shrubs and bushes, 1.5 12.0% 12.8% 10.8% 11.6% 18.7% 11.2 13.2 9.1 Product
Champion
0.2% -12.3
78 77 89 107 152 060120 Bulbs ,tubers, corms &
chicory plants & roots 1.3 4.2% 5.4% 4.4% 4.6% 4.1% 18.1 19.4 -2.1 Under Achiever 0.3% -32.2
118 118 114 113 140 060499 Foliage, branch, etc w/o
for bouquets 1.2 41.7% 42.5% 40.9% 44.8% 54.1% 2.9 7.5 6 Product Champion
6 4.1% 10.3
103 88 87 93 111 060240 Roses, grafted or not 1
15.2% 14.4% 13.8% 14.1% 17.7% 2 5.4 3 Product
Champion 1
0.8% -3.2
9,360 8,731 9,039 10,012 11,485 Total cluster 100%
19.9% 22.2% 21.5% 20.4% 20.6% 5.6 5.4
[Source: ITC and Customs & Excise]
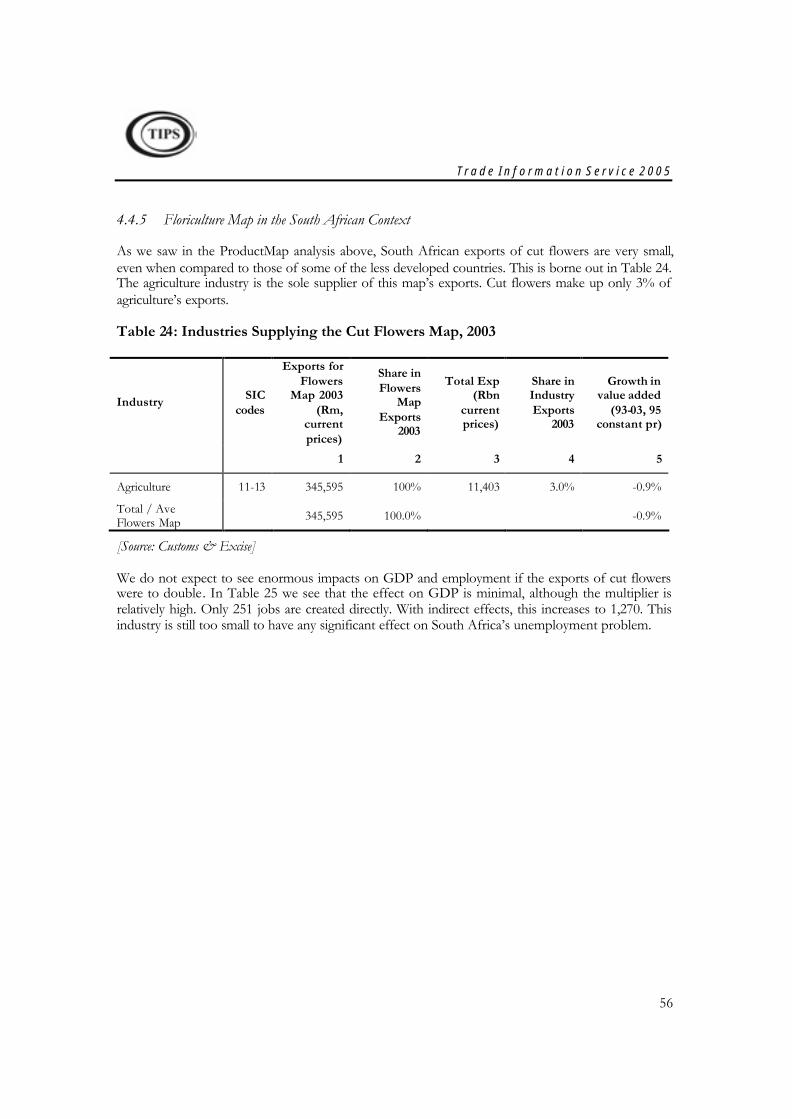
T r a d e I n f o r m a t i o n S e r v i c e 2 0 0 5
56
4.4.5 Floriculture Map in the South African Context
As we saw in the ProductMap analysis above, South African exports of cut flowers are very small, even when compared to those of some of the less developed countries. This is borne out in Table 24. The agriculture industry is the sole supplier of this map’s exports. Cut flowers make up only 3% of agriculture’s exports.
Table 24: Industries Supplying the Cut Flowers Map, 2003
Industry SIC codes
Exports for Flowers
Map 2003 (Rm,
current prices)
Share in Flowers
Map Exports
2003
Total Exp (Rbn
current prices)
Share in Industry Exports
2003
Growth in value added
(93-03, 95 constant pr)
1 2 3 4 5
Agriculture 11-13 345,595 100% 11,403 3.0% -0.9%
Total / Ave Flowers Map
345,595 100.0% -0.9%
[Source: Customs & Excise]
We do not expect to see enormous impacts on GDP and employment if the exports of cut flowers were to double. In Table 25 we see that the effect on GDP is minimal, although the multiplier is relatively high. Only 251 jobs are created directly. With indirect effects, this increases to 1,270. This industry is still too small to have any significant effect on South Africa’s unemployment problem.
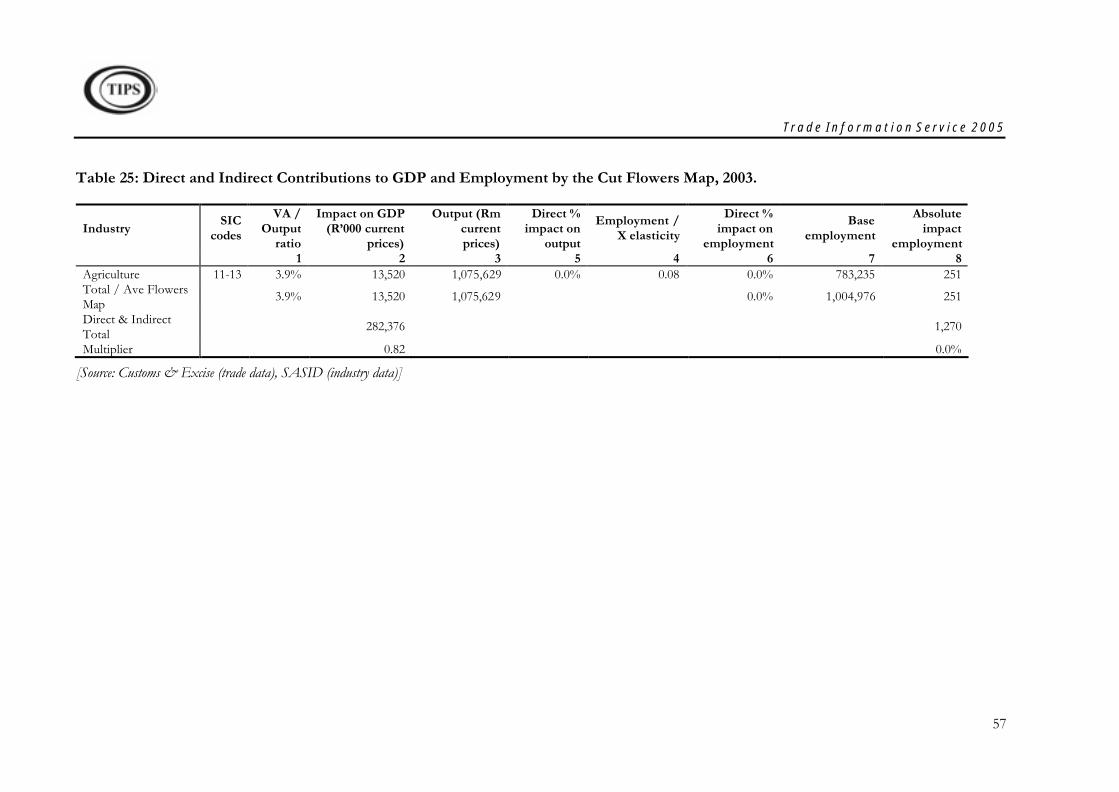
T r a d e I n f o r m a t i o n S e r v i c e 2 0 0 5
57
Table 25: Direct and Indirect Contributions to GDP and Employment by the Cut Flowers Map, 2003.
Industry SIC codes
VA / Output
ratio
Impact on GDP (R’000 current
prices)
Output (Rm current prices)
Direct % impact on
output
Employment / X elasticity
Direct % impact on
employment
Base employment
Absolute impact
employment 1 2 3 5 4 6 7 8 Agriculture 11-13 3.9% 13,520 1,075,629 0.0% 0.08 0.0% 783,235 251 Total / Ave Flowers Map
3.9% 13,520 1,075,629 0.0% 1,004,976 251
Direct & Indirect Total
282,376 1,270
Multiplier 0.82 0.0%
[Source: Customs & Excise (trade data), SASID (industry data)]
T r a d e I n f o r m a t i o n S e r v i c e 2 0 0 5
58
4.5 Aquaculture
The South African aquaculture sector can be broadly categorised into freshwater – and marine aquaculture (or mariculture). While mariculture is expanding rapidly both in South Africa and internationally, freshwater aquaculture still contributes to at least 50 % of the global production and 48 % of the South African production. The key freshwater aquaculture species found in South Africa are trout, ornamental fish, crocodile, tilapia, catfish and shrimp.
4.5.1 Characteristics of the Aquaculture Industry
With the increasing global demand for a variety of products, aquaculture has become a well-established and economically important sector during the past two decades. South African aquaculture production, though limited in its contribution to global production, has shown significant growth in the past decade. Total production and value has increased from 3 000 tons (R51 million) in 1997 to 4 030 tons (R146 million) in 2000 and to just under 6 000 tons (R239 million) in 2003. This reflects a doubling in mass, while the product value has more than quadrupled from 1997 to 2003.
Before 1995 the South African aquaculture sector was isolated from world markets and technology, leading to the predominance of small-scale enterprises which were often not successful. Since 1995, because of increased access, the South African aquaculture industry has started a rapid transformation to a market and resource driven industry, creating more medium sized enterprises. Initially, much emphasis was placed on the development of industrial type production for export markets but recently, more attention has been given to aspects of socio-economic development and food security. The South African aquaculture sector is poised to contribute not only to rural development and poverty relief, but also to large-scale development and export opportunities.
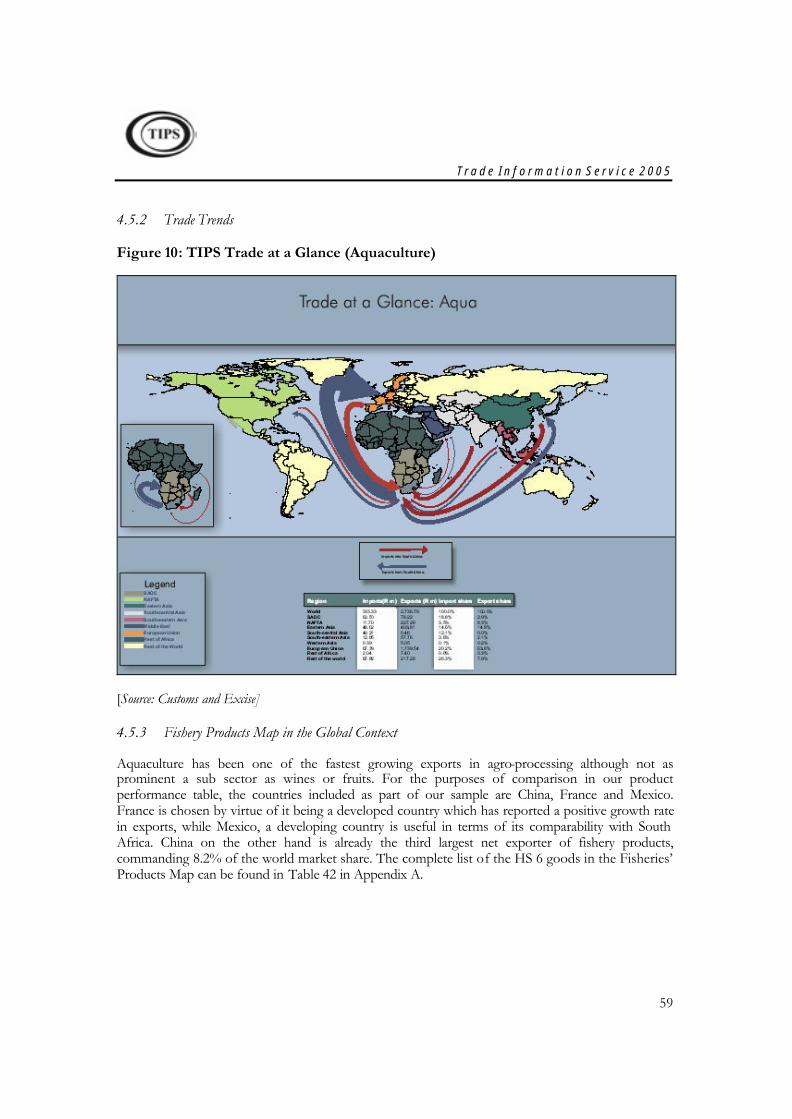
T r a d e I n f o r m a t i o n S e r v i c e 2 0 0 5
59
4.5.2 Trade Trends
Figure 10: TIPS Trade at a Glance (Aquaculture)
[Source: Customs and Excise]
4.5.3 Fishery Products Map in the Global Context
Aquaculture has been one of the fastest growing exports in agro-processing although not as prominent a sub sector as wines or fruits. For the purposes of comparison in our product performance table, the countries included as part of our sample are China, France and Mexico. France is chosen by virtue of it being a developed country which has reported a positive growth rate in exports, while Mexico, a developing country is useful in terms of its comparability with South Africa. China on the other hand is already the third largest net exporter of fishery products, commanding 8.2% of the world market share. The complete list of the HS 6 goods in the Fisheries’ Products Map can be found in Table 42 in Appendix A.
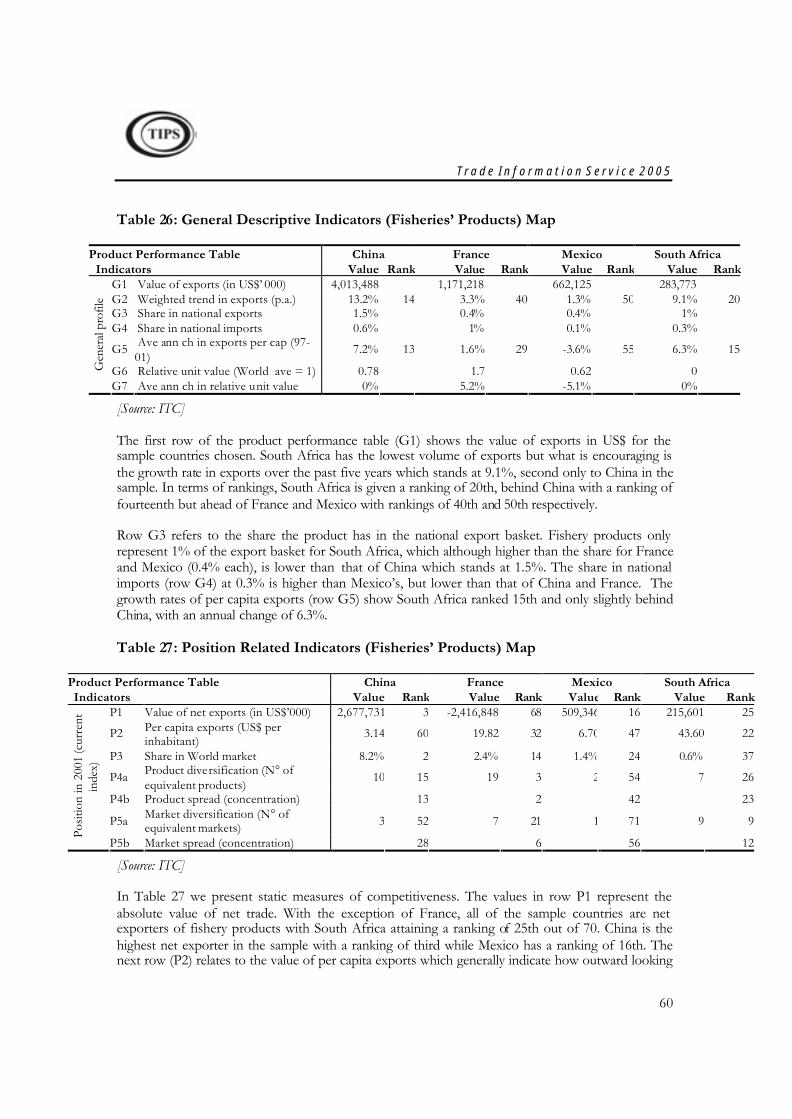
T r a d e I n f o r m a t i o n S e r v i c e 2 0 0 5
60
Table 26: General Descriptive Indicators (Fisheries’ Products) Map
Product Performance Table China France Mexico South Africa Indicators Value Rank Value Rank Value Rank Value Rank
G1 Value of exports (in US$’ 000) 4,013,488 1,171,218 662,125 283,773G2 Weighted trend in exports (p.a.) 13.2% 14 3.3% 40 1.3% 50 9.1% 20G3 Share in national exports 1.5% 0.4% 0.4% 1%G4 Share in national imports 0.6% 1% 0.1% 0.3%
G5 Ave ann ch in exports per cap (97-01)
7.2% 13 1.6% 29 -3.6% 55 6.3% 15
G6 Relative unit value (World ave = 1) 0.78 1.7 0.62 0Gen
eral
prof
ile
G7 Ave ann ch in relative unit value 0% 5.2% -5.1% 0%
[Source: ITC]
The first row of the product performance table (G1) shows the value of exports in US$ for the sample countries chosen. South Africa has the lowest volume of exports but what is encouraging is the growth rate in exports over the past five years which stands at 9.1%, second only to China in the sample. In terms of rankings, South Africa is given a ranking of 20th, behind China with a ranking of fourteenth but ahead of France and Mexico with rankings of 40th and 50th respectively.
Row G3 refers to the share the product has in the national export basket. Fishery products only represent 1% of the export basket for South Africa, which although higher than the share for France and Mexico (0.4% each), is lower than that of China which stands at 1.5%. The share in national imports (row G4) at 0.3% is higher than Mexico’s, but lower than that of China and France. The growth rates of per capita exports (row G5) show South Africa ranked 15th and only slightly behind China, with an annual change of 6.3%.
Table 27: Position Related Indicators (Fisheries’ Products) Map
Product Performance Table China France Mexico South Africa Indicators Value Rank Value Rank Value Rank Value Rank
P1 Value of net exports (in US$’000) 2,677,731 3 -2,416,848 68 509,346 16 215,601 25
P2 Per capita exports (US$ per inhabitant)
3.14 60 19.82 32 6.70 47 43.60 22
P3 Share in World market 8.2% 2 2.4% 14 1.4% 24 0.6% 37
P4a Product diversification (N° of equivalent products)
10 15 19 3 2 54 7 26
P4b Product spread (concentration) 13 2 42 23
P5a Market diversification (N° of equivalent markets) 3 52 7 21 1 71 9 9
Posit
ion
in 2
001
(cur
rent
in
dex)
P5b Market spread (concentration) 28 6 56 12
[Source: ITC]
In Table 27 we present static measures of competitiveness. The values in row P1 represent the absolute value of net trade. With the exception of France, all of the sample countries are net exporters of fishery products with South Africa attaining a ranking of 25th out of 70. China is the highest net exporter in the sample with a ranking of third while Mexico has a ranking of 16th. The next row (P2) relates to the value of per capita exports which generally indicate how outward looking
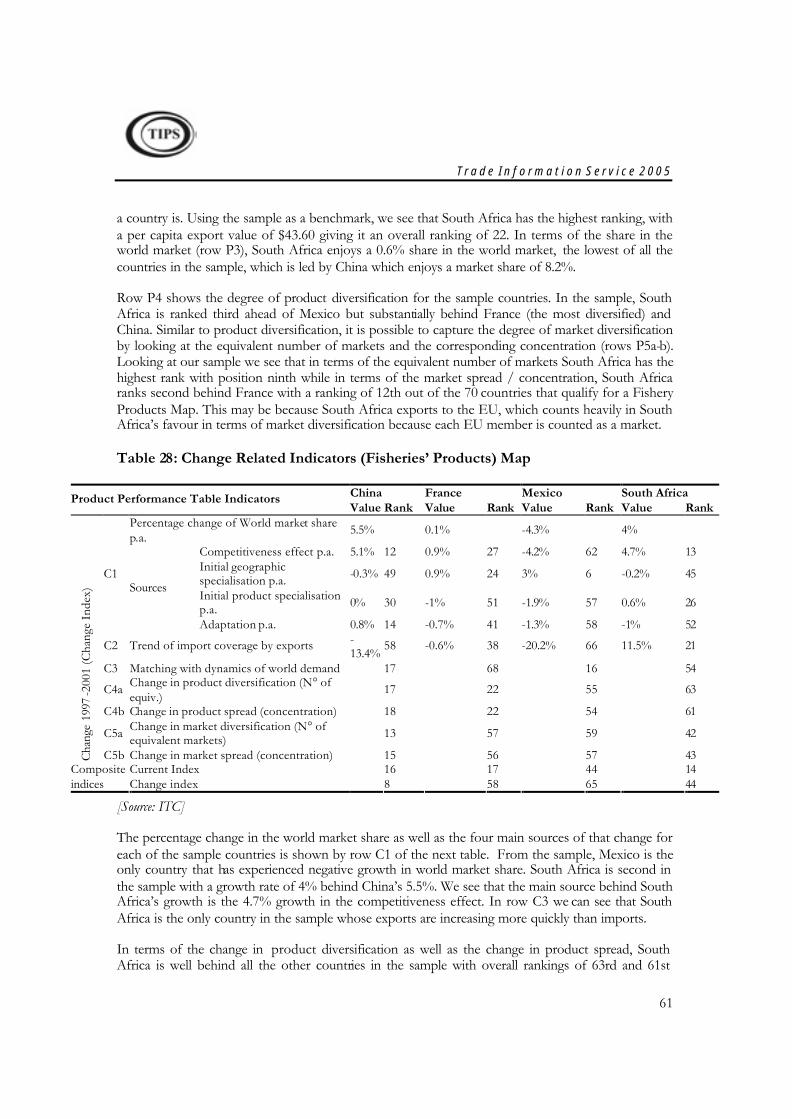
T r a d e I n f o r m a t i o n S e r v i c e 2 0 0 5
61
a country is. Using the sample as a benchmark, we see that South Africa has the highest ranking, with a per capita export value of $43.60 giving it an overall ranking of 22. In terms of the share in the world market (row P3), South Africa enjoys a 0.6% share in the world market, the lowest of all the countries in the sample, which is led by China which enjoys a market share of 8.2%.
Row P4 shows the degree of product diversification for the sample countries. In the sample, South Africa is ranked third ahead of Mexico but substantially behind France (the most diversified) and China. Similar to product diversification, it is possible to capture the degree of market diversification by looking at the equivalent number of markets and the corresponding concentration (rows P5a-b). Looking at our sample we see that in terms of the equivalent number of markets South Africa has the highest rank with position ninth while in terms of the market spread / concentration, South Africa ranks second behind France with a ranking of 12th out of the 70 countries that qualify for a Fishery Products Map. This may be because South Africa exports to the EU, which counts heavily in South Africa’s favour in terms of market diversification because each EU member is counted as a market.
Table 28: Change Related Indicators (Fisheries’ Products) Map
China France Mexico South Africa Product Performance Table Indicators Value Rank Value Rank Value Rank Value Rank
Percentage change of World market share p.a.
5.5% 0.1% -4.3% 4%
Competitiveness effect p.a. 5.1% 12 0.9% 27 -4.2% 62 4.7% 13 Initial geographic specialisation p.a. -0.3% 49 0.9% 24 3% 6 -0.2% 45
Initial product specialisation p.a. 0% 30 -1% 51 -1.9% 57 0.6% 26
C1 Sources
Adaptation p.a. 0.8% 14 -0.7% 41 -1.3% 58 -1% 52
C2 Trend of import coverage by exports -13.4%
58 -0.6% 38 -20.2% 66 11.5% 21
C3 Matching with dynamics of world demand 17 68 16 54
C4a Change in product diversification (N° of equiv.)
17 22 55 63
C4b Change in product spread (concentration) 18 22 54 61
C5a Change in market diversification (N° of equivalent markets)
13 57 59 42
Chan
ge 1
997-
2001
(Cha
nge
Inde
x)
C5b Change in market spread (concentration) 15 56 57 43 Current Index 16 17 44 14 Composite
indices Change index 8 58 65 44
[Source: ITC]
The percentage change in the world market share as well as the four main sources of that change for each of the sample countries is shown by row C1 of the next table. From the sample, Mexico is the only country that has experienced negative growth in world market share. South Africa is second in the sample with a growth rate of 4% behind China’s 5.5%. We see that the main source behind South Africa’s growth is the 4.7% growth in the competitiveness effect. In row C3 we can see that South Africa is the only country in the sample whose exports are increasing more quickly than imports.
In terms of the change in product diversification as well as the change in product spread, South Africa is well behind all the other countries in the sample with overall rankings of 63rd and 61st
T r a d e I n f o r m a t i o n S e r v i c e 2 0 0 5
62
respectively. This indicates that South Africa, although it started off from a high level (see Table 28) has not developed a further diversified product base of fishery products over the last 5 years compared to the other countries in the sample. In terms of changes in market diversification and spread, China ranks much higher than all the other countries in the sample with overall rankings of 13th and 15th respectively. South Africa however, is ranked above both France and Mexico at 42 and 43 for both measures respectively. South Africa does not perform very well in terms of the composite change index, principally because of the low relative performance in terms of diversifying both products and markets. The current index is, however, much better, suggesting a stalling in progress over the last 5 years.
4.5.4 Fishery Products Product Champions
Developing countries play a large role in the HS 6 commodity groups listed as the Product Champions for the Fishery Products Map in Table 29 below. Over half of the Map’s exports in 2003 were from developing countries. In terms of growth, developing countries could only increase their share of exports in five of these products. South Africa did slightly better by increasing the export share in seven products. South African exports of HS 30410: Fish fillets and other fish meat, minced or not, fresh or chilled increased by an average of 163% per annum between 1999 and 2003, while those of HS 160520: Shrimps and prawns, prepared or preserved increased by 62% per annum. South Africa’s share of the world market is still very small in all of the products in the table, never rising above 3.8%.
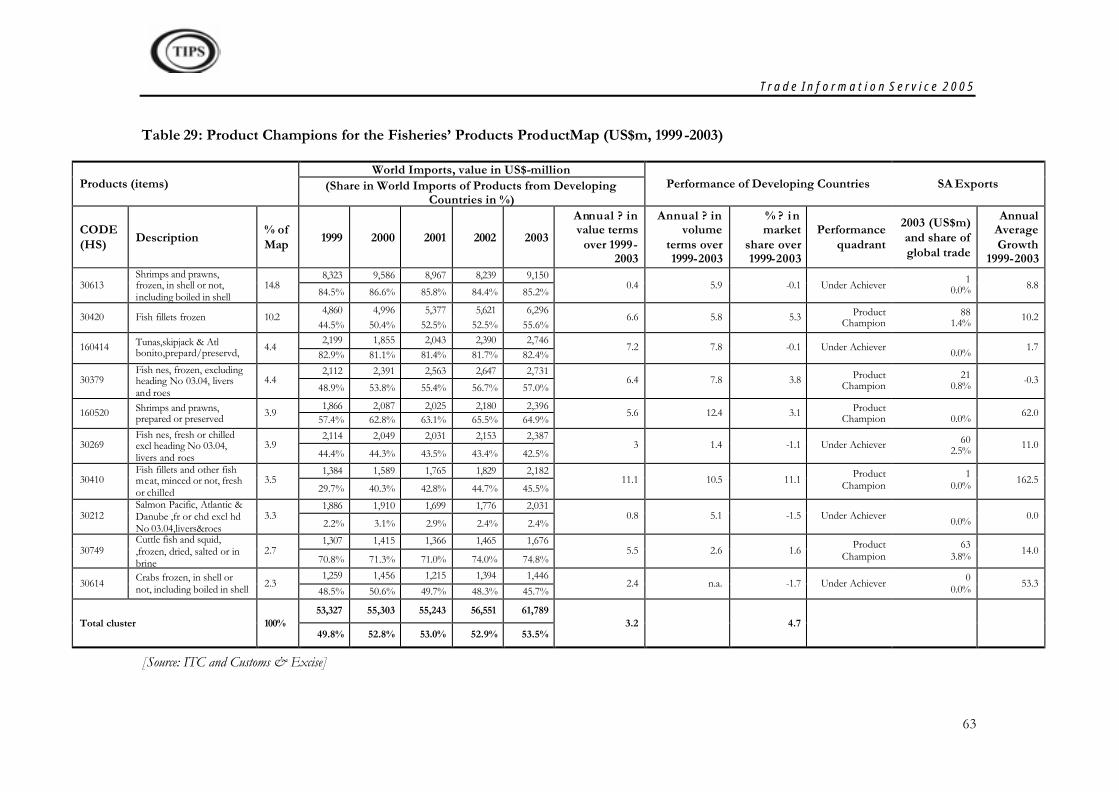
T r a d e I n f o r m a t i o n S e r v i c e 2 0 0 5
63
Table 29: Product Champions for the Fisheries’ Products ProductMap (US$m, 1999-2003)
World Imports, value in US$-million Products (items) (Share in World Imports of Products from Developing
Countries in %) Performance of Developing Countries SA Exports
CODE (HS) Description
% of Map 1999 2000 2001 2002 2003
Annual ? in value terms
over 1999-2003
Annual ? in volume
terms over 1999-2003
% ? in market
share over 1999-2003
Performance quadrant
2003 (US$m) and share of global trade
Annual Average Growth
1999-2003 8,323 9,586 8,967 8,239 9,150
30613 Shrimps and prawns, frozen, in shell or not, including boiled in shell
14.8 84.5% 86.6% 85.8% 84.4% 85.2%
0.4 5.9 -0.1 Under Achiever 1 0.0% 8.8
4,860 4,996 5,377 5,621 6,296 30420 Fish fillets frozen 10.2
44.5% 50.4% 52.5% 52.5% 55.6% 6.6 5.8 5.3 Product
Champion 88
1.4% 10.2
2,199 1,855 2,043 2,390 2,746 160414 Tunas,skipjack & Atl
bonito,prepard/preservd, 4.4 82.9% 81.1% 81.4% 81.7% 82.4%
7.2 7.8 -0.1 Under Achiever 0.0% 1.7
2,112 2,391 2,563 2,647 2,731 30379
Fish nes, frozen, excluding heading No 03.04, livers and roes
4.4 48.9% 53.8% 55.4% 56.7% 57.0%
6.4 7.8 3.8 Product Champion
21 0.8% -0.3
1,866 2,087 2,025 2,180 2,396 160520 Shrimps and prawns,
prepared or preserved 3.9 57.4% 62.8% 63.1% 65.5% 64.9%
5.6 12.4 3.1 Product Champion
0.0% 62.0
2,114 2,049 2,031 2,153 2,387 30269
Fish nes, fresh or chilled excl heading No 03.04, livers and roes
3.9 44.4% 44.3% 43.5% 43.4% 42.5%
3 1.4 -1.1 Under Achiever 60 2.5% 11.0
1,384 1,589 1,765 1,829 2,182 30410
Fish fillets and other fish meat, minced or not, fresh or chilled
3.5 29.7% 40.3% 42.8% 44.7% 45.5%
11.1 10.5 11.1 Product Champion
1 0.0% 162.5
1,886 1,910 1,699 1,776 2,031 30212
Salmon Pacific, Atlantic & Danube ,fr or chd excl hd No 03.04,livers&roes
3.3 2.2% 3.1% 2.9% 2.4% 2.4%
0.8 5.1 -1.5 Under Achiever 0.0% 0.0
1,307 1,415 1,366 1,465 1,676 30749
Cuttle fish and squid, ,frozen, dried, salted or in brine
2.7 70.8% 71.3% 71.0% 74.0% 74.8%
5.5 2.6 1.6 Product Champion
63 3.8% 14.0
1,259 1,456 1,215 1,394 1,446 30614 Crabs frozen, in shell or
not, including boiled in shell 2.3 48.5% 50.6% 49.7% 48.3% 45.7%
2.4 n.a. -1.7 Under Achiever 0 0.0% 53.3
53,327 55,303 55,243 56,551 61,789 Total cluster 100%
49.8% 52.8% 53.0% 52.9% 53.5% 3.2 4.7
[Source: ITC and Customs & Excise]
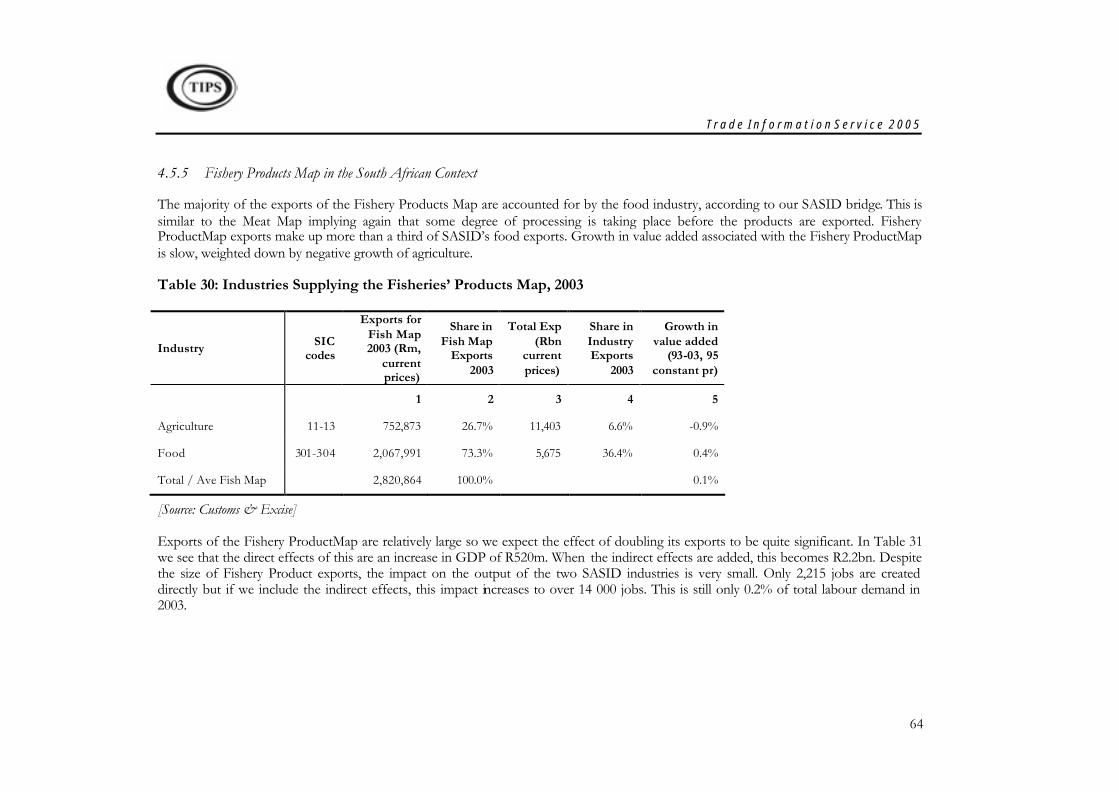
T r a d e I n f o r m a t i o n S e r v i c e 2 0 0 5
64
4.5.5 Fishery Products Map in the South African Context
The majority of the exports of the Fishery Products Map are accounted for by the food industry, according to our SASID bridge. This is similar to the Meat Map implying again that some degree of processing is taking place before the products are exported. Fishery ProductMap exports make up more than a third of SASID’s food exports. Growth in value added associated with the Fishery ProductMap is slow, weighted down by negative growth of agriculture.
Table 30: Industries Supplying the Fisheries’ Products Map, 2003
Industry SIC codes
Exports for Fish Map 2003 (Rm,
current prices)
Share in Fish Map
Exports 2003
Total Exp (Rbn
current prices)
Share in Industry Exports
2003
Growth in value added
(93-03, 95 constant pr)
1 2 3 4 5
Agriculture 11-13 752,873 26.7% 11,403 6.6% -0.9%
Food 301-304 2,067,991 73.3% 5,675 36.4% 0.4%
Total / Ave Fish Map 2,820,864 100.0% 0.1%
[Source: Customs & Excise]
Exports of the Fishery ProductMap are relatively large so we expect the effect of doubling its exports to be quite significant. In Table 31 we see that the direct effects of this are an increase in GDP of R520m. When the indirect effects are added, this becomes R2.2bn. Despite the size of Fishery Product exports, the impact on the output of the two SASID industries is very small. Only 2,215 jobs are created directly but if we include the indirect effects, this impact increases to over 14 000 jobs. This is still only 0.2% of total labour demand in 2003.
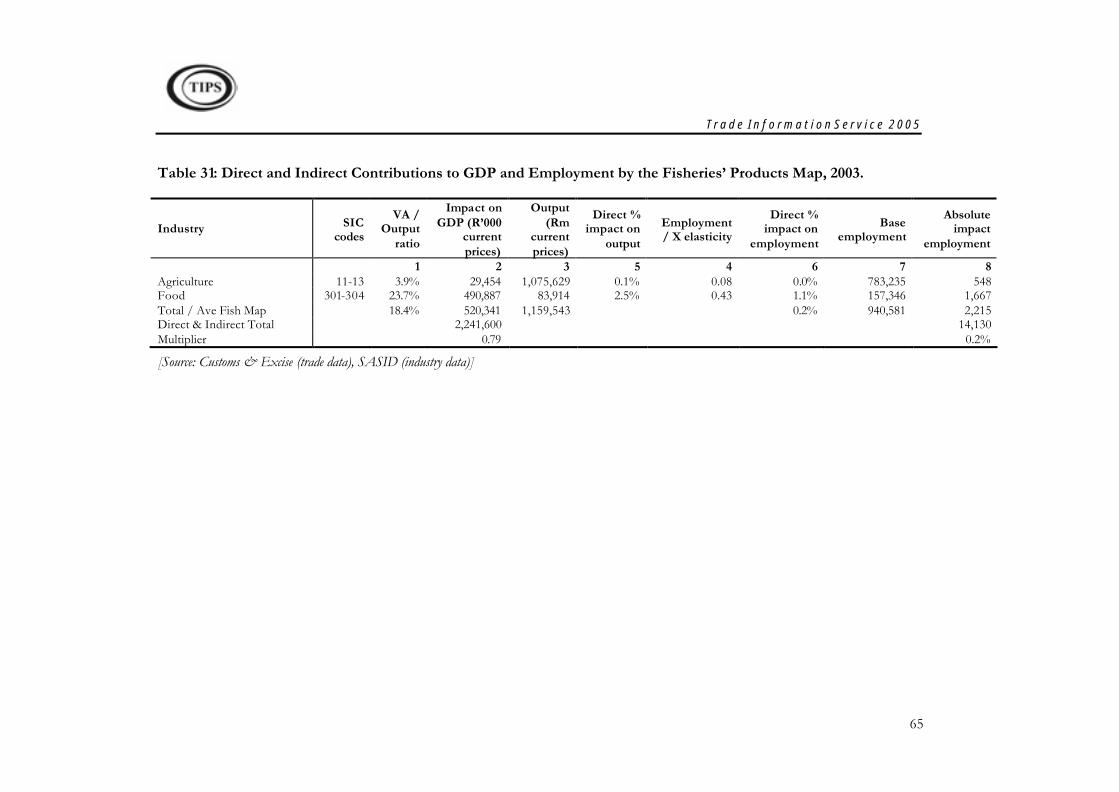
T r a d e I n f o r m a t i o n S e r v i c e 2 0 0 5
65
Table 31: Direct and Indirect Contributions to GDP and Employment by the Fisheries’ Products Map, 2003.
Industry SIC codes
VA / Output
ratio
Impact on GDP (R’000
current prices)
Output (Rm
current prices)
Direct % impact on
output
Employment / X elasticity
Direct % impact on
employment
Base employment
Absolute impact
employment
1 2 3 5 4 6 7 8 Agriculture 11-13 3.9% 29,454 1,075,629 0.1% 0.08 0.0% 783,235 548 Food 301-304 23.7% 490,887 83,914 2.5% 0.43 1.1% 157,346 1,667 Total / Ave Fish Map 18.4% 520,341 1,159,543 0.2% 940,581 2,215 Direct & Indirect Total 2,241,600 14,130 Multiplier 0.79 0.2%
[Source: Customs & Excise (trade data), SASID (industry data)]
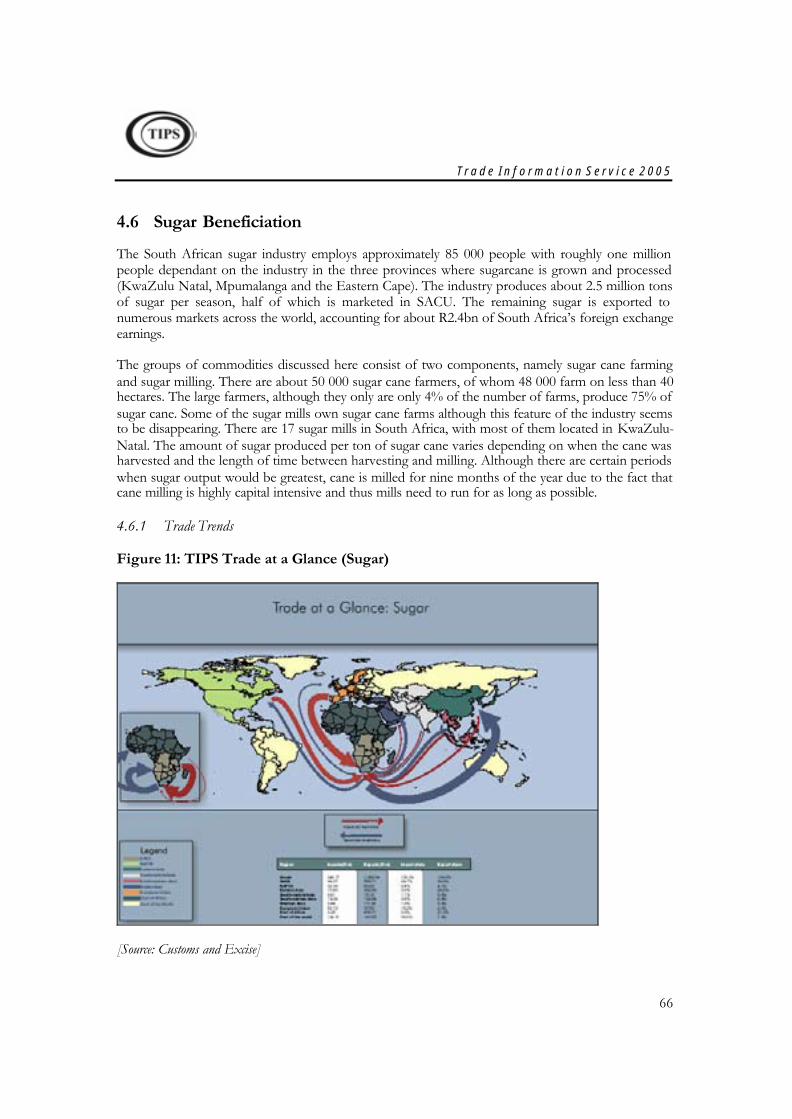
T r a d e I n f o r m a t i o n S e r v i c e 2 0 0 5
66
4.6 Sugar Beneficiation
The South African sugar industry employs approximately 85 000 people with roughly one million people dependant on the industry in the three provinces where sugarcane is grown and processed (KwaZulu Natal, Mpumalanga and the Eastern Cape). The industry produces about 2.5 million tons of sugar per season, half of which is marketed in SACU. The remaining sugar is exported to numerous markets across the world, accounting for about R2.4bn of South Africa’s foreign exchange earnings.
The groups of commodities discussed here consist of two components, namely sugar cane farming and sugar milling. There are about 50 000 sugar cane farmers, of whom 48 000 farm on less than 40 hectares. The large farmers, although they only are only 4% of the number of farms, produce 75% of sugar cane. Some of the sugar mills own sugar cane farms although this feature of the industry seems to be disappearing. There are 17 sugar mills in South Africa, with most of them located in KwaZulu-Natal. The amount of sugar produced per ton of sugar cane varies depending on when the cane was harvested and the length of time between harvesting and milling. Although there are certain periods when sugar output would be greatest, cane is milled for nine months of the year due to the fact that cane milling is highly capital intensive and thus mills need to run for as long as possible.
4.6.1 Trade Trends
Figure 11: TIPS Trade at a Glance (Sugar)
[Source: Customs and Excise]
T r a d e I n f o r m a t i o n S e r v i c e 2 0 0 5
67
4.6.2 The Promotion of Value-Added Products and Exports
Tariffs on sugar have been relatively high in South Africa ranging up to 50% (based on ad valorem equivalent calculations from the 2004 schedule and 2003 import quantities) and preferences given to imports from the EU and SADC. A range of local market rebate schemes on import duties have been designed with the express purpose of encouraging the use of sugar for products other than the traditional uses i.e. glucose and sweeteners. In line with government’s policy of promoting the beneficiation of commodities such as sugar for local consumption and export, the South African Sugar Association has introduced three categories of rebates according to customer specifications:
§§ a rebate of the sugar price for sugar contained in exported products
§§ a rebate of the sugar price for South African manufacturers who produce beneficiated sugar products for local consumption
§§ a rebate of the sugar price to purchasers of sugar in Namibia, Botswana and Lesotho.
4.6.3 Sugar Products Map in Global & South African Context
The sugar industry in South Africa has traditionally been highly organised, even collusive, as well as highly protected. Sugar remains one of our best performing products in the agro-processing market and therefore a sector that should be prioritised in terms of future growth prospects. The US, Brazil, Australia and India are used as sample countries along with South Africa in this product performance table analysis. The full list of the goods in this ProductMap can be found in Table 43 in Appendix A.
Table 32: General Descriptive Indicators (Sugar) Map
Product Performance Table Australia Brazil India South Africa US Indicators Value Rank Value Rank Value Rank Value Rank Value Rank
G1 Value of exports (in US$’000) 97,063 2,401,043 11,590 445,931 781,300 G2 Weighted trend in exports (p.a.) 2.4% 20 0.4% 27 -0.5% 33 3.5% 18 2% 22G3 Share in national exports 0.2% 4.4% 0% 1.5% 0.1% G4 Share in national imports 0.1% 0.1% 0.2% 0.3% 0.1%
G5 Ave ann ch in exports per cap (97-01)
-18.5% 63 5.6% 10 -17% 62 10.3% 4 1.4% 15
G6 Relative unit value (World ave = 1) 0.74 1.1 0 0 1.26 Gen
eral
pro
file
G7 Ave ann ch in relative unit value 5.3% 9.8% 0% 0% 3.8%
[Source: ITC]
In terms of the total value of exports, South Africa exports a large volume of sugar, third in the sample behind Brazil and the United States. South Africa has experienced the fastest growth in exports in the sample, maintaining a 3.5% growth rate ahead of the United States with a 2% growth rate per annum. India experienced negative growth rates over this period. South Africa is ranked 18th in this category on the current index. As of 2001, sugar occupied a 1.5% share in South Africa’s national exports and a 0.3% share in national imports. South Africa is once again impressive in terms of the growth it shows in per capita exports. With growth of 10.3% per annum, South Africa is not only the best performing among the sample countries by far; it is also ranked fourth in the world.
T r a d e I n f o r m a t i o n S e r v i c e 2 0 0 5
68
Turning to the position indicators, it can be seen that South Africa is a net exporter of sugar to the value of about $370 million. In terms of the sample, the only larger net exporter of sugar is Brazil, the largest net exporter in the world. South Africa’s value of exports per capita, at $68, is the highest in the sample. Although South Africa is consistently ranked higher than the other sample countries in most of the categories, it is only third, behind Brazil and the United States in terms of its share in the world market. South Africa also attains a low ranking in terms of product diversification, where it ranks last out of the four countries. However, there is a better position in terms of market diversification where we see that South Africa is ranked higher than the United States and India both in terms of the number of equivalent markets as well as the market concentration.
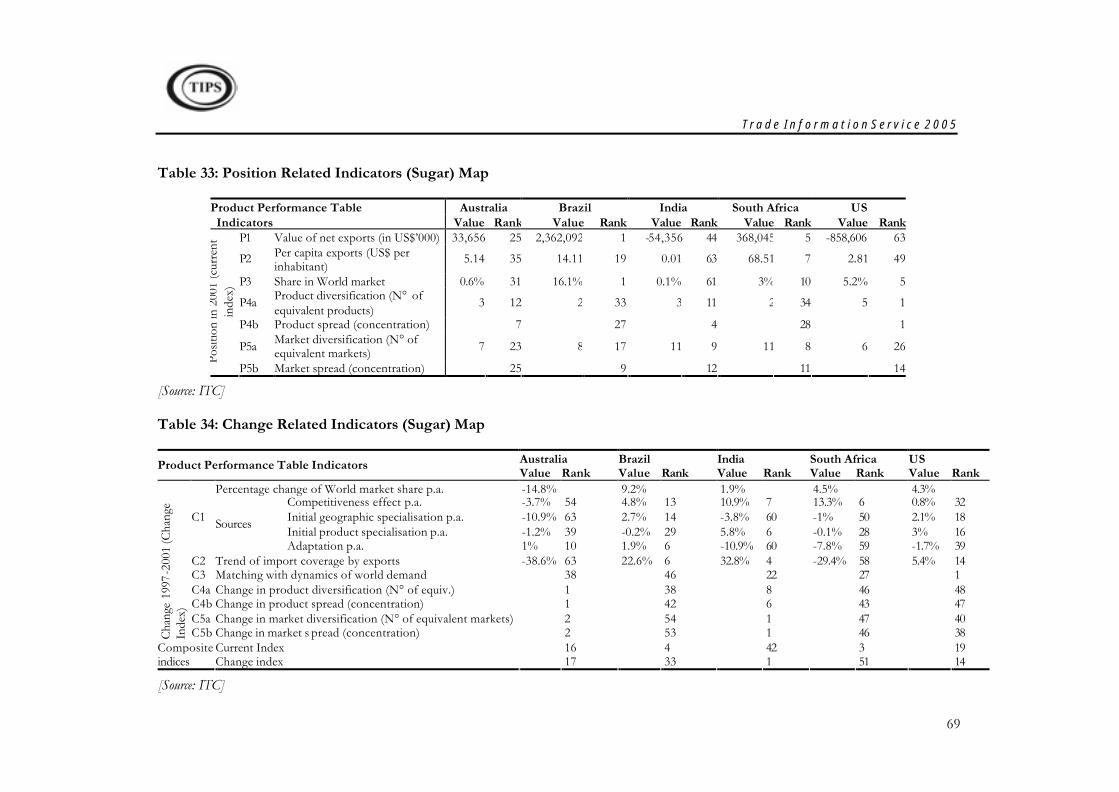
T r a d e I n f o r m a t i o n S e r v i c e 2 0 0 5
69
Table 33: Position Related Indicators (Sugar) Map
Product Performance Table Australia Brazil India South Africa US Indicators Value Rank Value Rank Value Rank Value Rank Value Rank
P1 Value of net exports (in US$’000) 33,656 25 2,362,092 1 -54,356 44 368,045 5 -858,606 63
P2 Per capita exports (US$ per inhabitant)
5.14 35 14.11 19 0.01 63 68.51 7 2.81 49
P3 Share in World market 0.6% 31 16.1% 1 0.1% 61 3% 10 5.2% 5
P4a Product diversification (N° of equivalent products)
3 12 2 33 3 11 2 34 5 1
P4b Product spread (concentration) 7 27 4 28 1
P5a Market diversification (N° of equivalent markets) 7 23 8 17 11 9 11 8 6 26
Posit
ion
in 2
001
(cur
rent
in
dex)
P5b Market spread (concentration) 25 9 12 11 14
[Source: ITC]
Table 34: Change Related Indicators (Sugar) Map
Australia Brazil India South Africa US Product Performance Table Indicators Value Rank Value Rank Value Rank Value Rank Value Rank
Percentage change of World market share p.a. -14.8% 9.2% 1.9% 4.5% 4.3% Competitiveness effect p.a. -3.7% 54 4.8% 13 10.9% 7 13.3% 6 0.8% 32 Initial geographic specialisation p.a. -10.9% 63 2.7% 14 -3.8% 60 -1% 50 2.1% 18 Initial product specialisation p.a. -1.2% 39 -0.2% 29 5.8% 6 -0.1% 28 3% 16
C1 Sources
Adaptation p.a. 1% 10 1.9% 6 -10.9% 60 -7.8% 59 -1.7% 39 C2 Trend of import coverage by exports -38.6% 63 22.6% 6 32.8% 4 -29.4% 58 5.4% 14 C3 Matching with dynamics of world demand 38 46 22 27 1 C4a Change in product diversification (N° of equiv.) 1 38 8 46 48 C4b Change in product spread (concentration) 1 42 6 43 47 C5a Change in market diversification (N° of equivalent markets) 2 54 1 47 40
Chan
ge 1
997-
2001
(Cha
nge
Inde
x)
C5b Change in market s pread (concentration) 2 53 1 46 38 Current Index 16 4 42 3 19 Composite
indices Change index 17 33 1 51 14
[Source: ITC]
T r a d e I n f o r m a t i o n S e r v i c e 2 0 0 5
70
In terms of the change in the world market share, South Africa displays the second-best growth in global market share out of the sample countries, just ahead of the United States but behind Brazil. Australia, a significant competitor, has had a negative growth rate. The competitiveness effect comes out very clearly as the factor most responsible for South Africa’s positive growth rate, increasing by 13.3%, which suggests that exporters are expanding in larger markets. However, the adaptation to changing market condition drags the change in world market share down in that these markets are probably declining markets. Looking at the average annual growth of trade coverage, which examines the evolution of net trade for the group of products, we see that South Africa has a disappointing ranking of 58 out of the 63 countries qualifying for the Sugar ProductMap, the lowest ranking in the sample by quite a large margin. This suggests that net exports have not evolved favourably over the past 5 years. South Africa’s rankings in terms of changes in both product and market diversification are low, as were their static counterpart, notably in comparison to the United States, but far behind Australia and India. South Africa does slightly better than Brazil in terms of the change in market diversification. Continual progress in terms of improving product and market diversity is an important factor for competitiveness in world markets and perhaps this is an area where South Africa currently lacks focus.
In terms of the composite indices, South Africa is ranked third out of the 63 countries in the ProductMap in the current index. While this is an admirable position, we are only ranked 51st in terms of the change index, suggesting that export competitiveness has slipped up in the last 5 years. In the years ahead, South Africa may face increasing competition from Australia, which specialised in the wrong markets between 1997 and 2001 but has diversified market and products so that Australian sugar exports are well placed for strong growth.
4.6.4 The Sugar Map Product Champions
Developing countries saw their share of exports decline in four of the Product Champions in Table 35 but in two cases this was in the context of declining exports for the product as a whole. South Africa’s market share fell in five products but interestingly South Africa was able to increase exports and hence market share in the product lines with declining exports. South Africa’s market share in most of the products is small or zero. The exception to this is HS 170111: Raw sugar, cane, the largest HS 6 commodity group in this ProductMap.
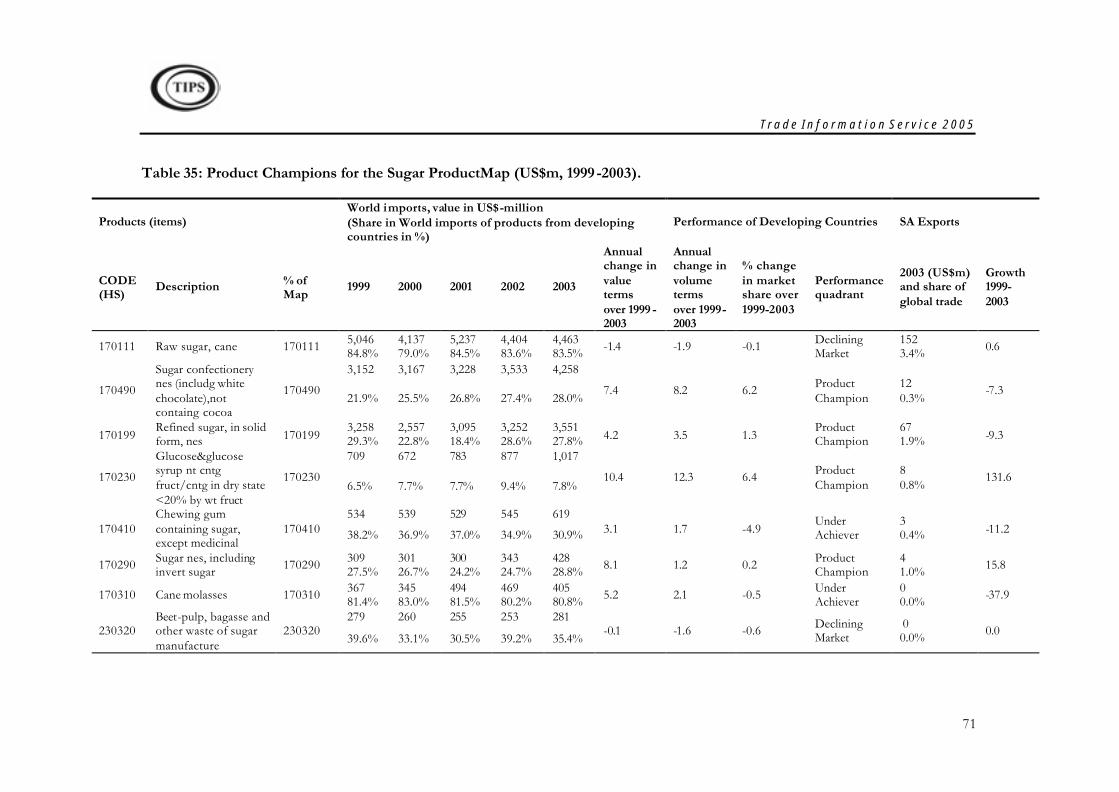
T r a d e I n f o r m a t i o n S e r v i c e 2 0 0 5
71
Table 35: Product Champions for the Sugar ProductMap (US$m, 1999 -2003).
World imports, value in US$-million Products (items) (Share in World imports of products from developing
countries in %) Performance of Developing Countries SA Exports
CODE (HS)
Description % of Map
1999 2000 2001 2002 2003
Annual change in value terms over 1999 -2003
Annual change in volume terms over 1999-2003
% change in market share over 1999-2003
Performance quadrant
2003 (US$m) and share of global trade
Growth 1999-2003
5,046 4,137 5,237 4,404 4,463 170111 Raw sugar, cane 170111 84.8% 79.0% 84.5% 83.6% 83.5% -1.4 -1.9 -0.1 Declining Market
152 3.4%
0.6
3,152 3,167 3,228 3,533 4,258
170490
Sugar confectionery nes (includg white chocolate),not containg cocoa
170490 21.9% 25.5% 26.8% 27.4% 28.0%
7.4 8.2 6.2 Product Champion
12 0.3%
-7.3
3,258 2,557 3,095 3,252 3,551 170199
Refined sugar, in solid form, nes 170199 29.3% 22.8% 18.4% 28.6% 27.8% 4.2 3.5 1.3
Product Champion
67 1.9%
-9.3
709 672 783 877 1,017
170230
Glucose&glucose syrup nt cntg fruct/cntg in dry state <20% by wt fruct
170230 6.5% 7.7% 7.7% 9.4% 7.8%
10.4 12.3 6.4 Product Champion
8 0.8%
131.6
534 539 529 545 619 170410
Chewing gum containing sugar, except medicinal
170410 38.2% 36.9% 37.0% 34.9% 30.9% 3.1 1.7 -4.9 Under Achiever
3 0.4%
-11.2
309 301 300 343 428 170290 Sugar nes, including invert sugar 170290 27.5% 26.7% 24.2% 24.7% 28.8% 8.1 1.2 0.2 Product
Champion 4 1.0%
15.8
367 345 494 469 405 170310 Cane molasses 170310 81.4% 83.0% 81.5% 80.2% 80.8% 5.2 2.1 -0.5 Under Achiever
0 0.0%
-37.9
279 260 255 253 281 230320
Beet-pulp, bagasse and other waste of sugar manufacture
230320 39.6% 33.1% 30.5% 39.2% 35.4%
-0.1 -1.6 -0.6 Declining Market
0 0.0%
0.0
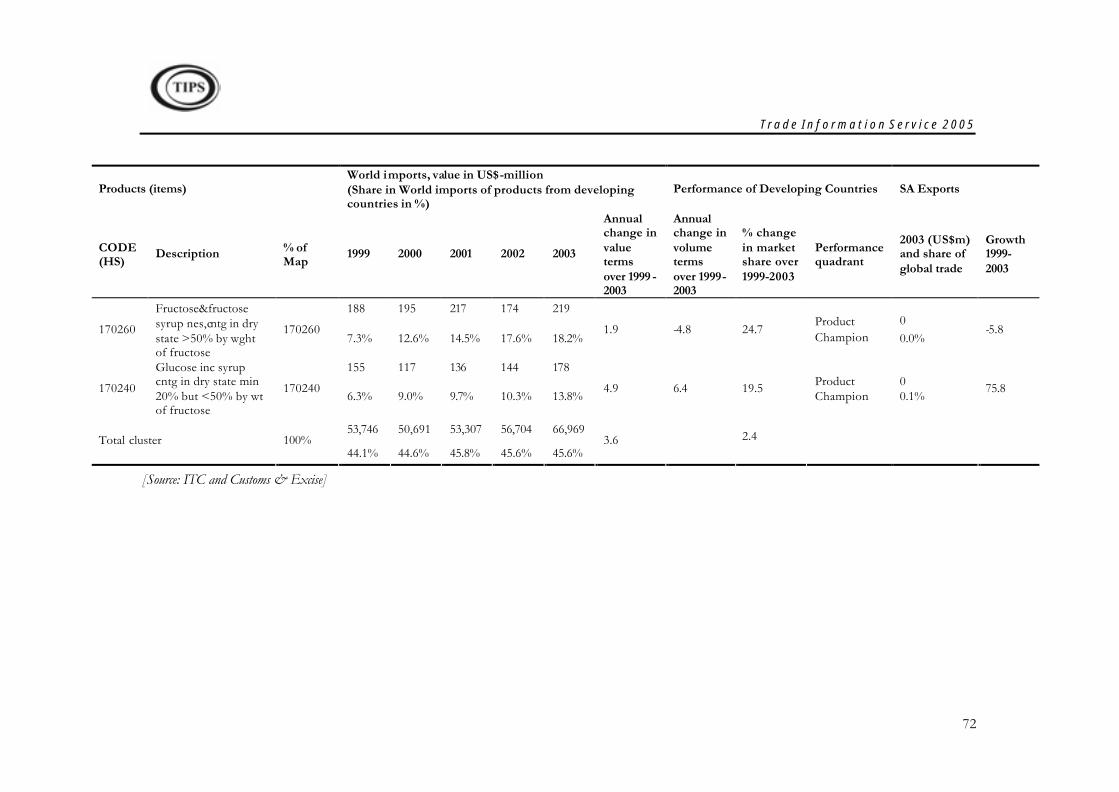
T r a d e I n f o r m a t i o n S e r v i c e 2 0 0 5
72
World imports, value in US$-million Products (items) (Share in World imports of products from developing
countries in %) Performance of Developing Countries SA Exports
CODE (HS)
Description % of Map
1999 2000 2001 2002 2003
Annual change in value terms over 1999 -2003
Annual change in volume terms over 1999-2003
% change in market share over 1999-2003
Performance quadrant
2003 (US$m) and share of global trade
Growth 1999-2003
188 195 217 174 219
170260
Fructose&fructose syrup nes,cntg in dry state >50% by wght of fructose
170260 7.3% 12.6% 14.5% 17.6% 18.2%
1.9 -4.8 24.7 Product Champion
0 0.0%
-5.8
155 117 136 144 178
170240
Glucose inc syrup cntg in dry state min 20% but <50% by wt of fructose
170240 6.3% 9.0% 9.7% 10.3% 13.8%
4.9 6.4 19.5 Product Champion
0 0.1%
75.8
53,746 50,691 53,307 56,704 66,969 Total cluster 100%
44.1% 44.6% 45.8% 45.6% 45.6% 3.6 2.4
[Source: ITC and Customs & Excise]
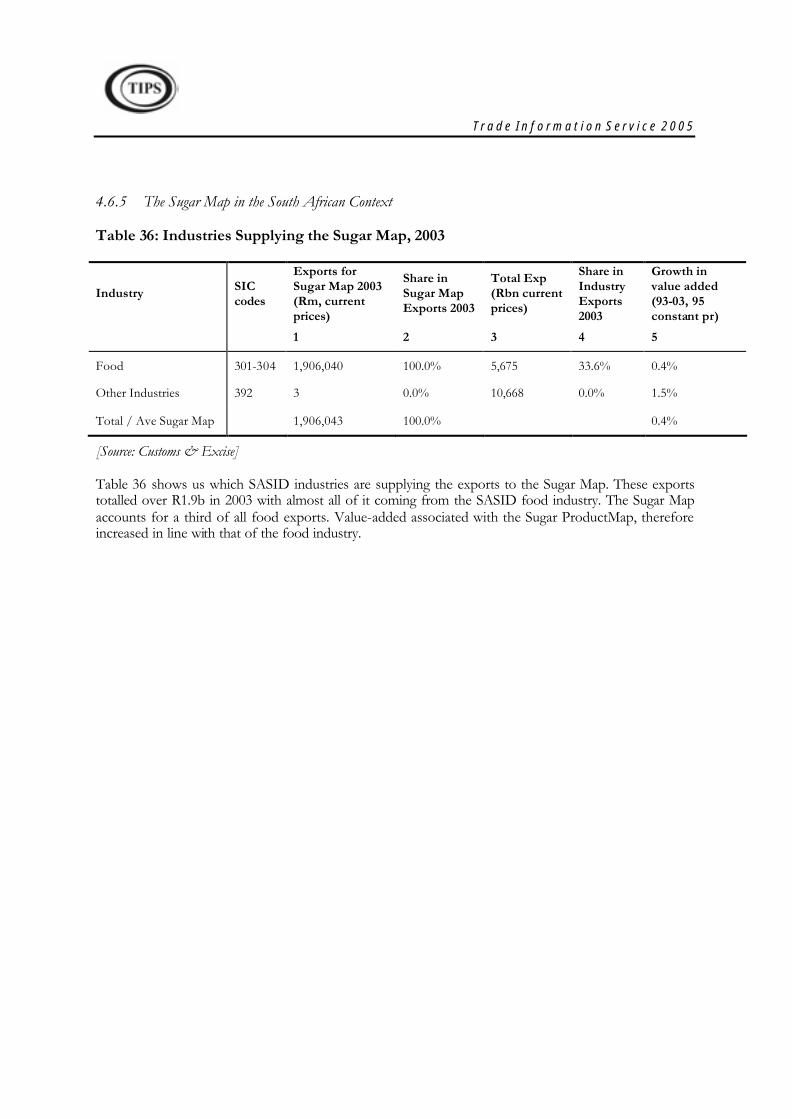
T r a d e I n f o r m a t i o n S e r v i c e 2 0 0 5
4.6.5 The Sugar Map in the South African Context
Table 36: Industries Supplying the Sugar Map, 2003
Industry SIC codes
Exports for Sugar Map 2003 (Rm, current prices)
Share in Sugar Map Exports 2003
Total Exp (Rbn current prices)
Share in Industry Exports 2003
Growth in value added (93-03, 95 constant pr)
1 2 3 4 5
Food 301-304 1,906,040 100.0% 5,675 33.6% 0.4%
Other Industries 392 3 0.0% 10,668 0.0% 1.5%
Total / Ave Sugar Map 1,906,043 100.0% 0.4%
[Source: Customs & Excise]
Table 36 shows us which SASID industries are supplying the exports to the Sugar Map. These exports totalled over R1.9b in 2003 with almost all of it coming from the SASID food industry. The Sugar Map accounts for a third of all food exports. Value-added associated with the Sugar ProductMap, therefore increased in line with that of the food industry.
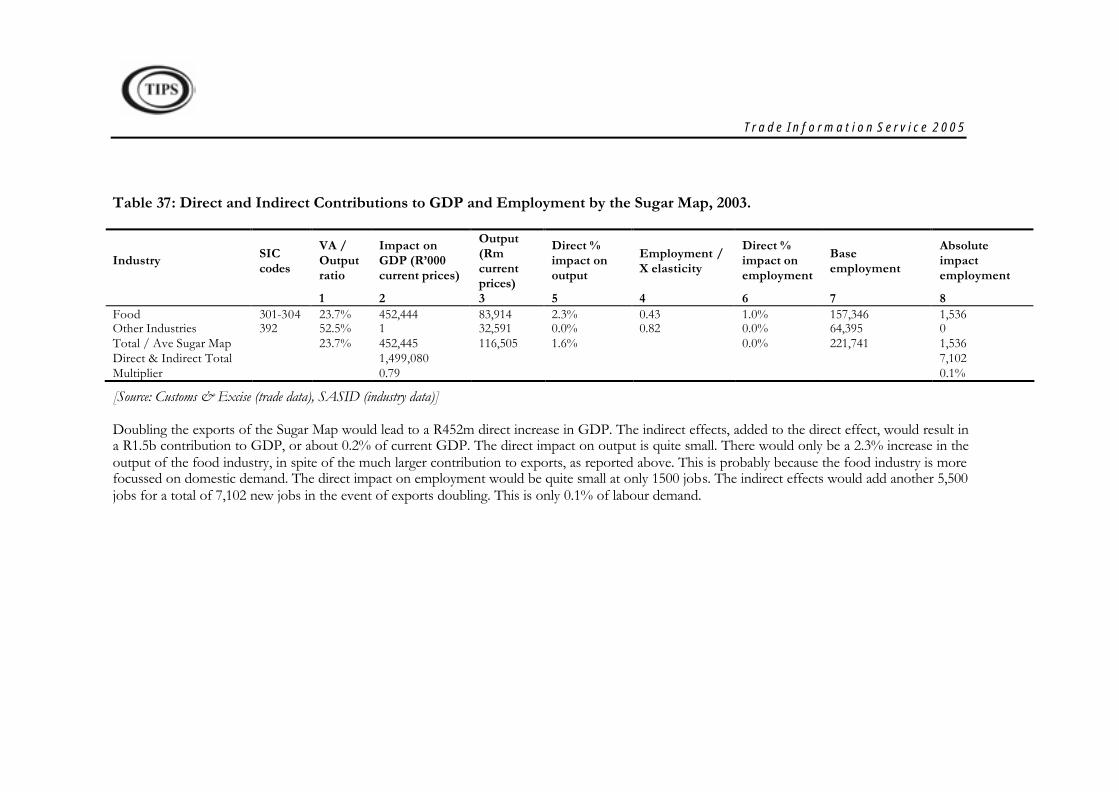
T r a d e I n f o r m a t i o n S e r v i c e 2 0 0 5
Table 37: Direct and Indirect Contributions to GDP and Employment by the Sugar Map, 2003.
Industry SIC codes
VA / Output ratio
Impact on GDP (R’000 current prices)
Output (Rm current prices)
Direct % impact on output
Employment / X elasticity
Direct % impact on employment
Base employment
Absolute impact employment
1 2 3 5 4 6 7 8 Food 301-304 23.7% 452,444 83,914 2.3% 0.43 1.0% 157,346 1,536 Other Industries 392 52.5% 1 32,591 0.0% 0.82 0.0% 64,395 0 Total / Ave Sugar Map 23.7% 452,445 116,505 1.6% 0.0% 221,741 1,536 Direct & Indirect Total 1,499,080 7,102 Multiplier 0.79 0.1%
[Source: Customs & Excise (trade data), SASID (industry data)]
Doubling the exports of the Sugar Map would lead to a R452m direct increase in GDP. The indirect effects, added to the direct effect, would result in a R1.5b contribution to GDP, or about 0.2% of current GDP. The direct impact on output is quite small. There would only be a 2.3% increase in the output of the food industry, in spite of the much larger contribution to exports, as reported above. This is probably because the food industry is more focussed on domestic demand. The direct impact on employment would be quite small at only 1500 jobs. The indirect effects would add another 5,500 jobs for a total of 7,102 new jobs in the event of exports doubling. This is only 0.1% of labour demand.
T r a d e I n f o r m a t i o n S e r v i c e 2 0 0 5
5 Conclusions The (primary) Agriculture and Agro-processing sectors currently contribute 3.9% and 3% of GDP, respectively. These sectors play a critical role in the economy of South Africa as a source of food security as well as providing employment for a large number of people through backward and forward linkages with the rest of the economy. The sector as a whole provides raw materials not only for the processing and manufacture of food and beverage products but also for the automotives, textile and chemical sectors. Moreover, the sector has the potential to provide employment and equity opportunities in areas that are currently economically underdeveloped.
Greater international competition has brought increased pressure to produce high-quality goods at lower prices. Because of this, processing companies have had to restructure their operations from point of location through to new technologies both in product innovation as well as product methods. This is witnessed in the move of traditional processing centres away from economically strong provinces such as Gauteng, Western Cape and KwaZulu Natal. The other main trend in the global market has been the increasing awareness by consumers of their own health. Hence, the trend towards organic food and “health” products
The agro-processing sector is integral to the South African economy. It has strong GDP and employment multipliers. In total, the sector accounts for 12% of labour demand. Exports and imports of agro-processed goods grew by 15% between 1999 and 2003.
The global wine industry is beset by the problem of over-capacity. Supply currently outstrips demand by about 18%. This has led to prices falling, especially at the lower end of the market. In the near future the same is likely to occur in the premium markets as the new world producers begin to compete with the best wine that Europe produces. South African wines exports are not doing as well as they could because not enough red wine is being produced. Red wine exports are growing 50% faster than white wine.
The ProductMap analysis for wines shows that South Africa is a very small player in the world market, although the local industry is relatively well export orientated. South Africa does well on the measures of product and especially geographical diversification. The change-related indicators show that South Africa is losing market share. The principal cause of this appears to be that South Africa is not producing the fastest growing products and not selling in the fastest growing markets. The indicators also show that South African wines are not diversifying enough in terms of markets and products. The Beverages map is the tenth largest in South African exports but it only has a 2% share of exports. The direct and indirect effect of doubling these exports would result in R4b, or 0.4%, being added to GDP. The direct effects would only lead to just less than 1 200 new jobs being created but the indirect effects would increase this number to 17 145.
Fruit is one of South Africa’s largest agricultural exports. South Africa is blessed with an ideal climate for a range of fruits and is also ideally suited to export to Europe because the seasons are opposites. South Africa is the biggest non-European supplier to the EU. The ProductMap data shows that South Africa is a considerable exporter of fruit but that exports are declining. South Africa’s fruit industry is very outwardly orientated. South Africa’s product diversification is not good but market diversification is better. Unfortunately, South Africa’s share of the global market is declining. South African exports are not of the most dynamic products or to the fastest growing markets although there is some evidence that this is changing. South Africa does not fair well on the measure of change in product diversification, which is an issue of concern because its already has quite concentrated exports. The change in market concentration is much better. The multipliers associated with the fruit industry are large. Doubling
T r a d e I n f o r m a t i o n S e r v i c e 2 0 0 5
76
exports would add about R350m to GDP directly but the indirect effects would take this up to R5.2b, about 0.5% of GDP. The direct benefit to employment would be only 5112 jobs but indirect effects would increase this figure to over 26,381.
80% of South Africa’s land is suitable for livestock cultivation but currently only 53% of South Africa’s farming land is used for this purpose, so there is still scope to increase production. South Africa only has 0.4% of the global meat market. However, ProductMap records South Africa as a fast growing exporter, averaging 140% growth per annum over the last 5 years (in nominal US$ terms). South Africa’s meat products exports are relatively concentrated in terms of both products and markets. South Africa had the fastest growing share in the world market between 1997 and 2001. The main reason for this was a significant increase in competitiveness as South Africa’s exporters increased their market share in large markets. The value added-output ratio for the Meat Map is high and we see that the direct effects on GDP are over R163m. Once indirect effects are included, the total impact on GDP increases to R464m and the GDP multiplier for the Meat Map is 0.78. In other words, every Rand of exports generates R0.78 of GDP. The direct affect on employment is very small, only generating 542 new jobs. Indirect effects boost this to 3,114 jobs but this is only 0.04% of labour demand in 2003.
South Africa’s exports of flowers are very small but the potential to expand is quite large because of strong demand for indigenous South African products. The future for chrysanthemum exports looks particularly rosy. In global terms, South Africa’s exports are still minimal, even less than those of Kenya. Despite this, South African exports are well diversified in both products and markets. However, South Africa’s already small share of the world market declined between 1997 and 2001. The main reason for this was a lack of competitiveness and adapting poorly to world demand trends. South Africa did specialise in the right products but in the wrong markets. South Africa did very well in further diversifying products but not so well in diversifying markets. Because the cut flowers industry is still so small, the effect on the local economy is minimal. Doubling exports would only add 1,270 jobs even once indirect effects are accounted for. The total contribution to GDP would be only R282m.
Between 1997 and 2003, the quantity of South African fish exports doubled but the value quadrupled. Depending on sustainability of fish stocks, this industry could be a significant creator of employment. South Africa has only a 0.4% share in the world market but this is growing. The industry is becoming rapidly more outwardly-orientated and has a good spread of markets but product diversification is poor although this is limited by a country’s natural resource. Nevertheless, South Africa is increasing its share of the global market. The main driver behind this growth is a rise in competitiveness. South Africa does very poorly in terms of diversifying markets and especially products, though as mentioned earlier, this is probably limited by South Africa’s natural endowment. Doubling the exports of the fishing industry would lead to the creation of 14,130 jobs after indirect effects have been taken into account. The benefit to GDP would be almost R2b, or 0.2% of current GDP.
Moving onto sugar, South Africa is the tenth largest exporter with a global market share of 5.2%, due in part to the fact that the local industry is relatively outward-orientated. South Africa’s net exports are the fifth largest. The lack of product differentiation is a problem but the markets that are exported to are relatively diverse. South Africa is expanding its market share although the pace could be a lot faster except for the fact that South Africa has not proven to be very good at switching supplies to the fastest growing markets. South Africa’s competitiveness has been increasing considerably. The effects of doubling sugar exports are not that large. The total effect on employment would be about 7,102 new jobs but this is only 0.1% of labour demand in 2003. The direct and indirect effect on GDP would be about 0.7% of GDP or R1.5b. It is possible that our employment multiplier analysis ignores part of the small scale farming activities due to lack of data.
T r a d e I n f o r m a t i o n S e r v i c e 2 0 0 5
77
6 References Thurlow, J, 2003: A Dynamic Computable General Equilibrium (CGE) Model for South Africa: Extending the Static IFPRI Model, TIPS working paper 1/2004, http://www.tips.org.za/research/papers/showpaper.asp?id=707.
South African Wine Industry Information and Systems (2004). 2004 Annual Booklet. http://www.sawis.co.za/SAWISPortal/uploads/Book_2004_web.pdf
T r a d e I n f o r m a t i o n S e r v i c e 2 0 0 5
78
7 Appendix A: HS 6 Lines Contained in the ProductMaps Table 38: HS 6 Lines Contained in the Beverages ProductMap
HS Code Description 121010 Hop cones frsh/dried, not ground powdrd or pellets 121020 Hop cones, ground, powdered or in pellets; lupulin 121099 Hop cones, fresh or dried; lupulin - unallocatable 220110 Water, mineral & aerated natrl/artfcl nt swtn/flav 220190 Waters not sweetnd or flavored nesoi; ice and snow 220199 Waters, natural etc, not sweetened etc; ice & snow - unallocatable 220210 Waters, incl mineral & aerated, sweetnd or flavord 220290 Nonalcoholic beverages, nesoi 220299 Waters, sweetened etc & oth nonalc beverages NESOI - unallocatable 220300 Beer made from malt 220399 Beer made from malt - unallocatable 220410 Sparkling wine of fresh grapes 220421 Wine, fr grape nesoi & gr must w alc, nov 2 liters 220429 Wine, fr grape nesoi & gr must with alc, nesoi 220430 Grape must partly ferment, ov .5% alcohol, nesoi 220499 Wine of fresh grapes; grape must NESOI - unallocatable 220510 Vermouth/grpe wine flavored wth plants etc ctr 2l< 220590 Vermouth/grape wine flavored wth plants etc ov 2ls 220599 Vermouth & oth wine of fresh grapes spec flavored - unallocatable 220600 Fermented beverages nesoi (cider, perry, mead etc) 220710 Ethyl alcohol, undenat, alchol not un 80% by volum 220720 Ethyl alcohol & oth spirits denatured any strength 220810 Compound alcoholic preparations of a kind used for the manufacture of beverages 220820 Grape brandy 220830 Whiskies 220840 Rum and tafia 220850 Gin and geneva 220860 Vodka 220870 Liqueurs and cordials 220890 Cordials, liqueurs, kirschwasser, ratafia, etc. 220899 Ethyl alcohol, undenat, und80% alc; spirit beverag - unallocatable 230330 Brewing or distilling dregs and waste, w/nt pellet 230700 Wine lees; argol
[Source: ITC]
T r a d e I n f o r m a t i o n S e r v i c e 2 0 0 5
79
Table 39: HS 6 Lines Contained in the Fruit and Vegetable ProductMap
HS Code Description 070110 Potatoes, seed, fresh or chilled 070190 Potatoes, except seed, fresh or chilled, nesoi 070199 Potatoes (except sweet potatoes), fresh or chilled - unallocatable 070200 Tomatoes, fresh or chilled 070310 Onions and shallots, fresh or chilled 070320 Garlic, fresh or chilled 070390 Leeks & other alliaceous vegetables, fresh, chilld 070399 Onions, shallots, garlic, leeks etc, fr or chilled - unallocatable 070410 Cauliflower and headed broccoli, fresh or chilled 070420 Brussels sprouts, fresh or chilled 070490 Edible brassicas (cabbages etc) nesoi, fr or chill 070499 Cabbages, cauliflower, kale etc, fresh or chilled - unallocatable 070511 Head lettuce (cabbage lettuce), fresh or chilled 070519 Lettuce, except head lettuce, fresh or chilled 070521 Witloof chicory, fresh or chilled 070529 Chicory, except witloof, fresh or chilled 070599 Lettuce and chicory, fresh or chilled - unallocatable 070610 Carrots and turnips, fresh or chilled 070690 Salad beets, radishes, etc nesoi, fresh or chilled 070699 Carrots, turnips & other edible roots, fr or chill - unallocatable 070700 Cucumbers and gherkins, fresh or chilled 070810 Peas (pisum sativum), fresh or chilled 070820 Beans (vigna spp., phaseolus spp.) fresh or chilld 070890 Leguminous vegetables, nesoi, fresh or chilled 070910 Globe artichokes, fresh or chilled 070920 Asparagus, fresh or chilled 070930 Eggplants (aubergines), fresh or chilled 070940 Celery other than celeriac, fresh or chilled 070951 Mushrooms, fresh or chilled 070952 Truffles, fresh or chilled 070960 Fruits of genus capsicum or pimenta, fresh/chilled 070970 Spinach, new zealand & orache (garden), frsh/chld 070990 Vegetables, nesoi, fresh or chilled 071010 Potatoes uncookd/cooked by boiling in water, frozn 071021 Peas, raw cooked in boiling water, frozen 071022 Beans, raw cooked in boiling water, frozen 071029 Leguminous veg raw/cooked by boiling, frozen nesoi 071030 Spinach raw/cooked by steaming/boiling in water fz 071040 Sweet corn raw/cooked by steam/boiling in water fz 071080 Vegetables, nesoi raw/cooked by boiling, frozen 071090 Vegetables mixtures, raw/cooked by boiling, frozen 071099 Vegetables (raw or cooked by steam etc), frozen - unallocatable 071110 Onions, provisionally preserved, inedible 071120 Olives, provisionally preserved, inedible 071130 Capers, provisionally preserved, inedible 071140 Cucumbers/gherkins provisionally pres, inedible 071190 Veg nesoi, veg mix, provisionally pres, inedible 071199 Vegetables, temporarily preserved, not now edible - unallocatable 071210 Potatoes whether or not cut or sliced but not further prepared 071310 Peas, dried shelled, including seed 071320 Chickpeas (garbanzos), dried shelled, include seed 071331 Beans (vigna mungo (l.) hepper etc), dried shelled 071332 Beans, small red (adzuki), dried shelled, inc seed
T r a d e I n f o r m a t i o n S e r v i c e 2 0 0 5
80
HS Code Description 071333 Kidney beans & white pea beans, dri shel, inc seed 071339 Beans nesoi, dried shelled, including seed 071340 Lentils, dried shelled, including seed 071350 Broad beans & horse beans, dried shelled, inc seed 071390 Leguminous vegetables nesoi, dried shell, inc seed 071399 Leguminous vegetables, dried shelled - unallocatable 071410 Cassava (manioc) fresh or dried, w/nt pellet 071420 Sweet potatoes, fresh or dried, whether/nt pellets 071490 Roots & tubers neso, fresh or dried; sago pitch 071499 Cassava, arrowroot etc, fresh or dry; sago pith - unallocatable 080110 Coconuts 080111 Coconuts, dessicated 080119 Coconuts, other than dessicated 080300 Bananas and plantains, fresh or dried 080410 Dates, fresh or dried 080420 Figs, fresh or dried 080430 Pineapples, fresh or dried 080440 Avocados, fresh or dried 080450 Guavas, mangoes and mangosteens, fresh or dried 080499 Dates, figs, pineapples, avocados etc, fr or dried - unallocatable 080510 Oranges, fresh 080520 Mandarins (inc tanger etc) & citrus hybr fr or dri 080530 Lemons and limes, fresh or dried 080540 Grapefruit, fresh or dried 080590 Citrus fruits, inc kumquats, nesoi, fresh or dried 080599 Citrus fruit, fresh or dried - unallocatable 080610 Grapes, fresh 080620 Grapes, dried (including raisins) 080699 Grapes, fresh or dried - unallocatable 080710 Melons (including watermelons) melons (including watermelons) 080711 Watermelons, fresh 080719 Melons(except watermelons) and papayas, fresh 080720 Papayas (papaws), fresh 080799 Melons and papayas, fresh - unallocatable 080810 Apples, fresh 080820 Pears and quinces, fresh 080899 Apples, pears and quinces, fresh - unallocatable 080910 Apricots, fresh 080920 Cherries, sweet or tart, fresh 080930 Peaches, including nectarines, fresh 080940 Plums, prune plums and sloes, fresh 081010 Strawberries, fresh 081020 Raspberries/blckberries/mulberries/loganberrs frsh 081030 Currants, blck,white/red & gooseberries ex kiwi, f 081040 Cranberries, blueberries, etc, fresh 081050 Kiwi fruit (chinese gooseberries) fresh 081090 Fruit nesoi, fresh 081099 Fruit NESOI , fresh - unallocatable 081110 Strawberries, uncooked/cooked by water, frozen 081120 Raspberries/blckberries/etc uncookd/cookd water fz 081190 Fruit nesoi & nuts, sweetened etc or not, frozen 081199 Fruit & nuts (raw or cooked by steam etc), frozen - unallocatable 081210 Cherries, provisionally preserved, inedible 081220 Strawberries, provisionally preserved, inedible 081290 Fruit & nuts provisionally preserved inedible neso
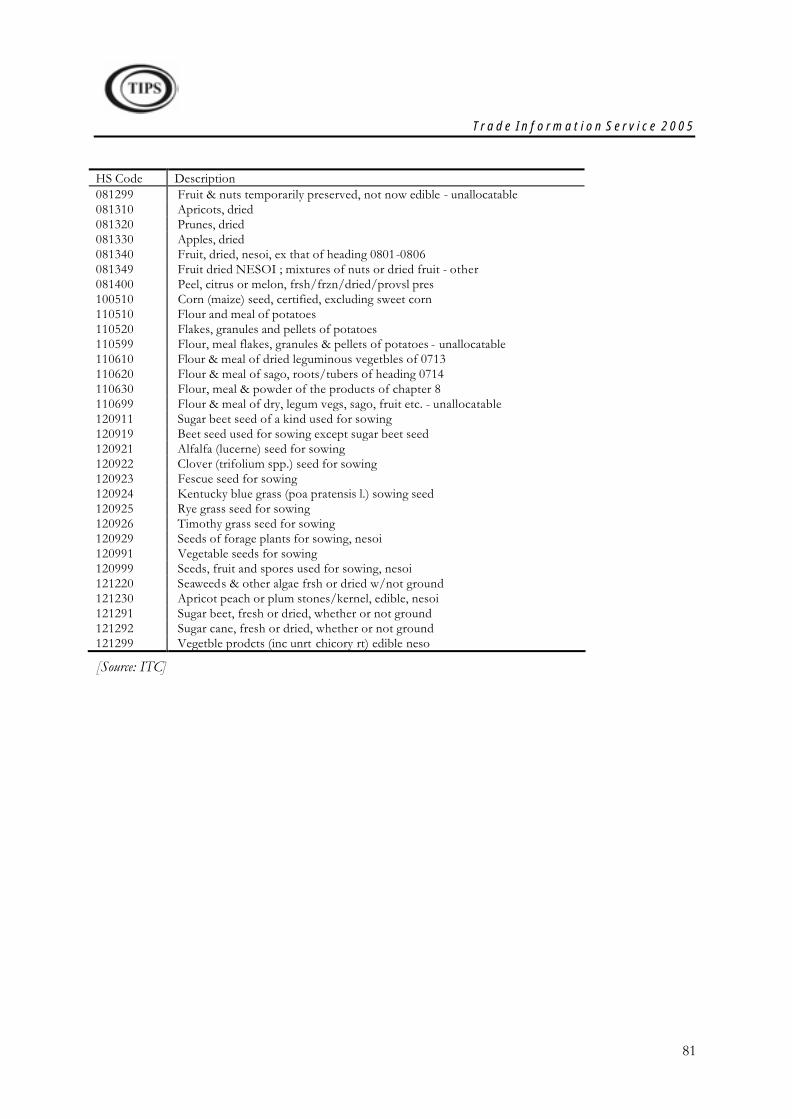
T r a d e I n f o r m a t i o n S e r v i c e 2 0 0 5
81
HS Code Description 081299 Fruit & nuts temporarily preserved, not now edible - unallocatable 081310 Apricots, dried 081320 Prunes, dried 081330 Apples, dried 081340 Fruit, dried, nesoi, ex that of heading 0801-0806 081349 Fruit dried NESOI ; mixtures of nuts or dried fruit - other 081400 Peel, citrus or melon, frsh/frzn/dried/provsl pres 100510 Corn (maize) seed, certified, excluding sweet corn 110510 Flour and meal of potatoes 110520 Flakes, granules and pellets of potatoes 110599 Flour, meal flakes, granules & pellets of potatoes - unallocatable 110610 Flour & meal of dried leguminous vegetbles of 0713 110620 Flour & meal of sago, roots/tubers of heading 0714 110630 Flour, meal & powder of the products of chapter 8 110699 Flour & meal of dry, legum vegs, sago, fruit etc. - unallocatable 120911 Sugar beet seed of a kind used for sowing 120919 Beet seed used for sowing except sugar beet seed 120921 Alfalfa (lucerne) seed for sowing 120922 Clover (trifolium spp.) seed for sowing 120923 Fescue seed for sowing 120924 Kentucky blue grass (poa pratensis l.) sowing seed 120925 Rye grass seed for sowing 120926 Timothy grass seed for sowing 120929 Seeds of forage plants for sowing, nesoi 120991 Vegetable seeds for sowing 120999 Seeds, fruit and spores used for sowing, nesoi 121220 Seaweeds & other algae frsh or dried w/not ground 121230 Apricot peach or plum stones/kernel, edible, nesoi 121291 Sugar beet, fresh or dried, whether or not ground 121292 Sugar cane, fresh or dried, whether or not ground 121299 Vegetble prodcts (inc unrt chicory rt) edible neso
[Source: ITC]
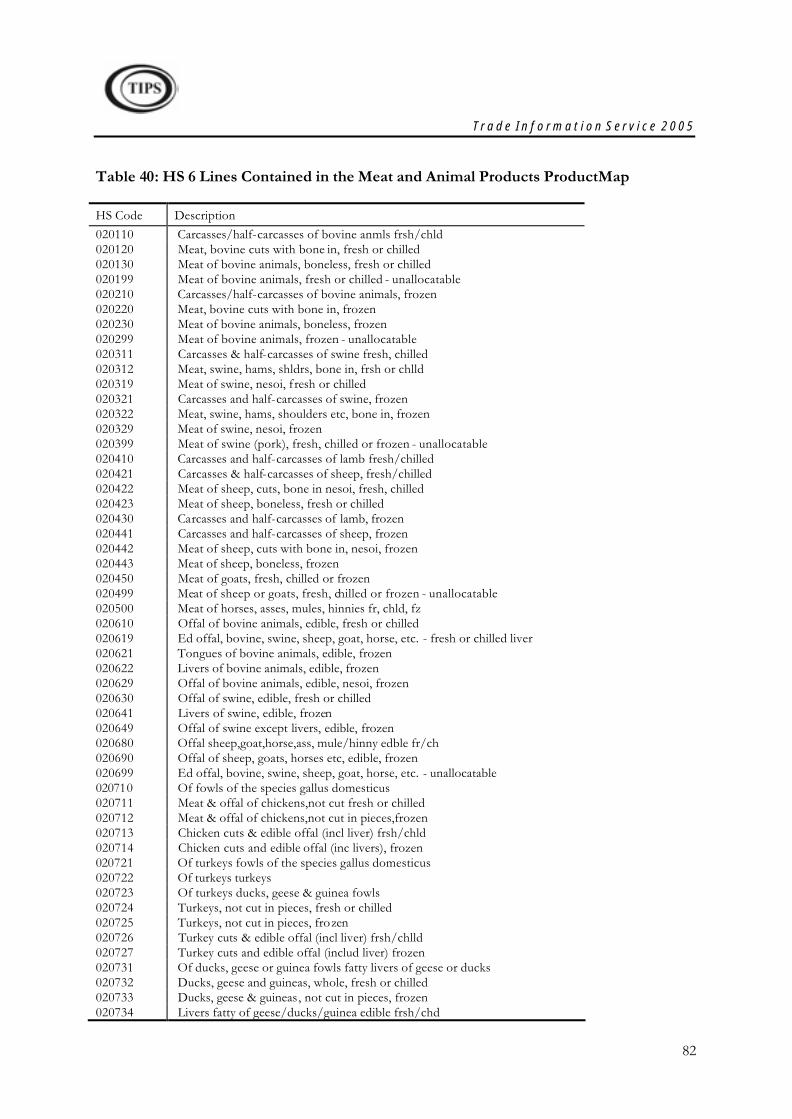
T r a d e I n f o r m a t i o n S e r v i c e 2 0 0 5
82
Table 40: HS 6 Lines Contained in the Meat and Animal Products ProductMap
HS Code Description 020110 Carcasses/half-carcasses of bovine anmls frsh/chld 020120 Meat, bovine cuts with bone in, fresh or chilled 020130 Meat of bovine animals, boneless, fresh or chilled 020199 Meat of bovine animals, fresh or chilled - unallocatable 020210 Carcasses/half-carcasses of bovine animals, frozen 020220 Meat, bovine cuts with bone in, frozen 020230 Meat of bovine animals, boneless, frozen 020299 Meat of bovine animals, frozen - unallocatable 020311 Carcasses & half-carcasses of swine fresh, chilled 020312 Meat, swine, hams, shldrs, bone in, frsh or chlld 020319 Meat of swine, nesoi, fresh or chilled 020321 Carcasses and half-carcasses of swine, frozen 020322 Meat, swine, hams, shoulders etc, bone in, frozen 020329 Meat of swine, nesoi, frozen 020399 Meat of swine (pork), fresh, chilled or frozen - unallocatable 020410 Carcasses and half-carcasses of lamb fresh/chilled 020421 Carcasses & half-carcasses of sheep, fresh/chilled 020422 Meat of sheep, cuts, bone in nesoi, fresh, chilled 020423 Meat of sheep, boneless, fresh or chilled 020430 Carcasses and half-carcasses of lamb, frozen 020441 Carcasses and half-carcasses of sheep, frozen 020442 Meat of sheep, cuts with bone in, nesoi, frozen 020443 Meat of sheep, boneless, frozen 020450 Meat of goats, fresh, chilled or frozen 020499 Meat of sheep or goats, fresh, chilled or frozen - unallocatable 020500 Meat of horses, asses, mules, hinnies fr, chld, fz 020610 Offal of bovine animals, edible, fresh or chilled 020619 Ed offal, bovine, swine, sheep, goat, horse, etc. - fresh or chilled liver 020621 Tongues of bovine animals, edible, frozen 020622 Livers of bovine animals, edible, frozen 020629 Offal of bovine animals, edible, nesoi, frozen 020630 Offal of swine, edible, fresh or chilled 020641 Livers of swine, edible, frozen 020649 Offal of swine except livers, edible, frozen 020680 Offal sheep,goat,horse,ass, mule/hinny edble fr/ch 020690 Offal of sheep, goats, horses etc, edible, frozen 020699 Ed offal, bovine, swine, sheep, goat, horse, etc. - unallocatable 020710 Of fowls of the species gallus domesticus 020711 Meat & offal of chickens,not cut fresh or chilled 020712 Meat & offal of chickens,not cut in pieces,frozen 020713 Chicken cuts & edible offal (incl liver) frsh/chld 020714 Chicken cuts and edible offal (inc livers), frozen 020721 Of turkeys fowls of the species gallus domesticus 020722 Of turkeys turkeys 020723 Of turkeys ducks, geese & guinea fowls 020724 Turkeys, not cut in pieces, fresh or chilled 020725 Turkeys, not cut in pieces, frozen 020726 Turkey cuts & edible offal (incl liver) frsh/chlld 020727 Turkey cuts and edible offal (includ liver) frozen 020731 Of ducks, geese or guinea fowls fatty livers of geese or ducks 020732 Ducks, geese and guineas, whole, fresh or chilled 020733 Ducks, geese & guineas, not cut in pieces, frozen 020734 Livers fatty of geese/ducks/guinea edible frsh/chd
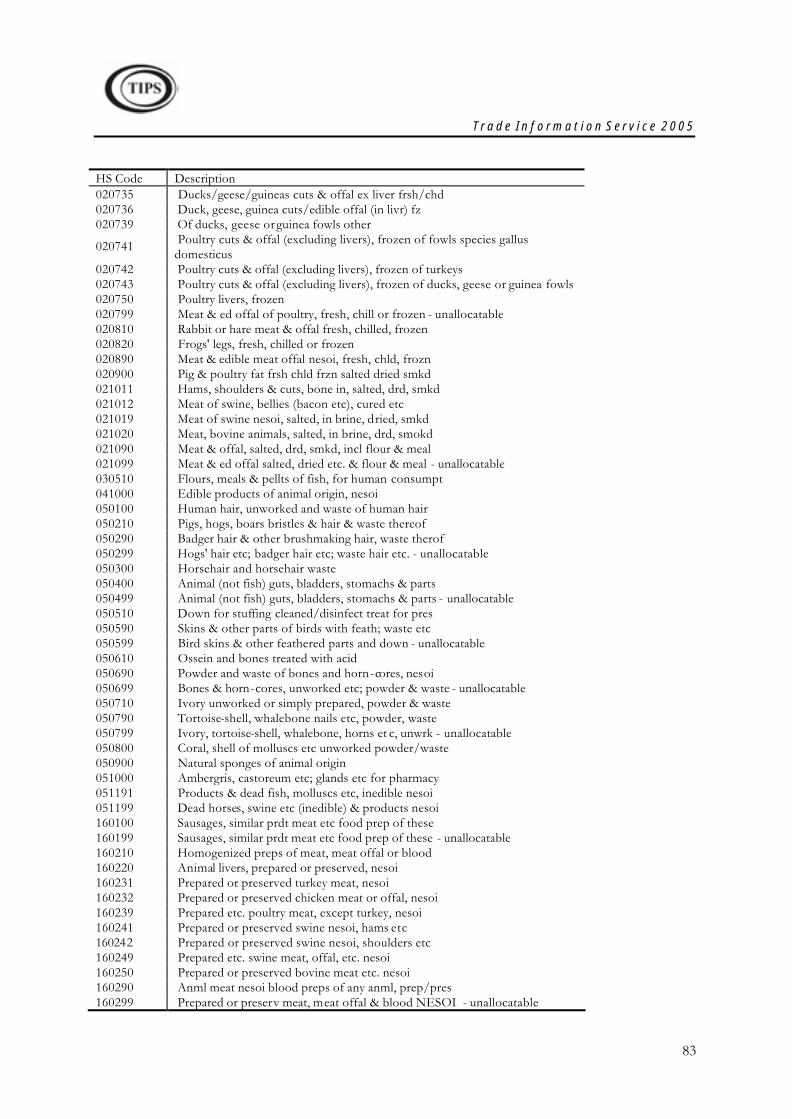
T r a d e I n f o r m a t i o n S e r v i c e 2 0 0 5
83
HS Code Description 020735 Ducks/geese/guineas cuts & offal ex liver frsh/chd 020736 Duck, geese, guinea cuts/edible offal (in livr) fz 020739 Of ducks, geese or guinea fowls other
020741 Poultry cuts & offal (excluding livers), frozen of fowls species gallus domesticus
020742 Poultry cuts & offal (excluding livers), frozen of turkeys 020743 Poultry cuts & offal (excluding livers), frozen of ducks, geese or guinea fowls 020750 Poultry livers, frozen 020799 Meat & ed offal of poultry, fresh, chill or frozen - unallocatable 020810 Rabbit or hare meat & offal fresh, chilled, frozen 020820 Frogs' legs, fresh, chilled or frozen 020890 Meat & edible meat offal nesoi, fresh, chld, frozn 020900 Pig & poultry fat frsh chld frzn salted dried smkd 021011 Hams, shoulders & cuts, bone in, salted, drd, smkd 021012 Meat of swine, bellies (bacon etc), cured etc 021019 Meat of swine nesoi, salted, in brine, dried, smkd 021020 Meat, bovine animals, salted, in brine, drd, smokd 021090 Meat & offal, salted, drd, smkd, incl flour & meal 021099 Meat & ed offal salted, dried etc. & flour & meal - unallocatable 030510 Flours, meals & pellts of fish, for human consumpt 041000 Edible products of animal origin, nesoi 050100 Human hair, unworked and waste of human hair 050210 Pigs, hogs, boars bristles & hair & waste thereof 050290 Badger hair & other brushmaking hair, waste therof 050299 Hogs' hair etc; badger hair etc; waste hair etc. - unallocatable 050300 Horsehair and horsehair waste 050400 Animal (not fish) guts, bladders, stomachs & parts 050499 Animal (not fish) guts, bladders, stomachs & parts - unallocatable 050510 Down for stuffing cleaned/disinfect treat for pres 050590 Skins & other parts of birds with feath; waste etc 050599 Bird skins & other feathered parts and down - unallocatable 050610 Ossein and bones treated with acid 050690 Powder and waste of bones and horn-cores, nesoi 050699 Bones & horn-cores, unworked etc; powder & waste - unallocatable 050710 Ivory unworked or simply prepared, powder & waste 050790 Tortoise-shell, whalebone nails etc, powder, waste 050799 Ivory, tortoise-shell, whalebone, horns et c, unwrk - unallocatable 050800 Coral, shell of molluscs etc unworked powder/waste 050900 Natural sponges of animal origin 051000 Ambergris, castoreum etc; glands etc for pharmacy 051191 Products & dead fish, molluscs etc, inedible nesoi 051199 Dead horses, swine etc (inedible) & products nesoi 160100 Sausages, similar prdt meat etc food prep of these 160199 Sausages, similar prdt meat etc food prep of these - unallocatable 160210 Homogenized preps of meat, meat offal or blood 160220 Animal livers, prepared or preserved, nesoi 160231 Prepared or preserved turkey meat, nesoi 160232 Prepared or preserved chicken meat or offal, nesoi 160239 Prepared etc. poultry meat, except turkey, nesoi 160241 Prepared or preserved swine nesoi, hams etc 160242 Prepared or preserved swine nesoi, shoulders etc 160249 Prepared etc. swine meat, offal, etc. nesoi 160250 Prepared or preserved bovine meat etc. nesoi 160290 Anml meat nesoi blood preps of any anml, prep/pres 160299 Prepared or preserv meat, meat offal & blood NESOI - unallocatable
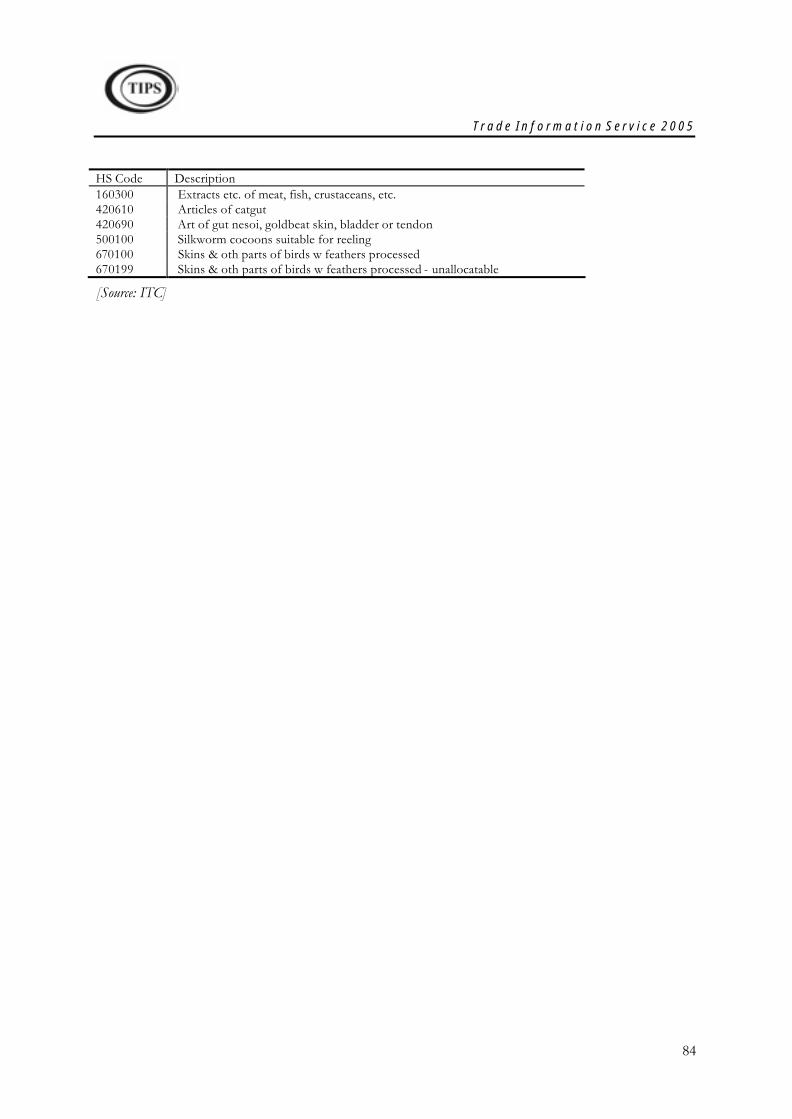
T r a d e I n f o r m a t i o n S e r v i c e 2 0 0 5
84
HS Code Description 160300 Extracts etc. of meat, fish, crustaceans, etc. 420610 Articles of catgut 420690 Art of gut nesoi, goldbeat skin, bladder or tendon 500100 Silkworm cocoons suitable for reeling 670100 Skins & oth parts of birds w feathers processed 670199 Skins & oth parts of birds w feathers processed - unallocatable
[Source: ITC]
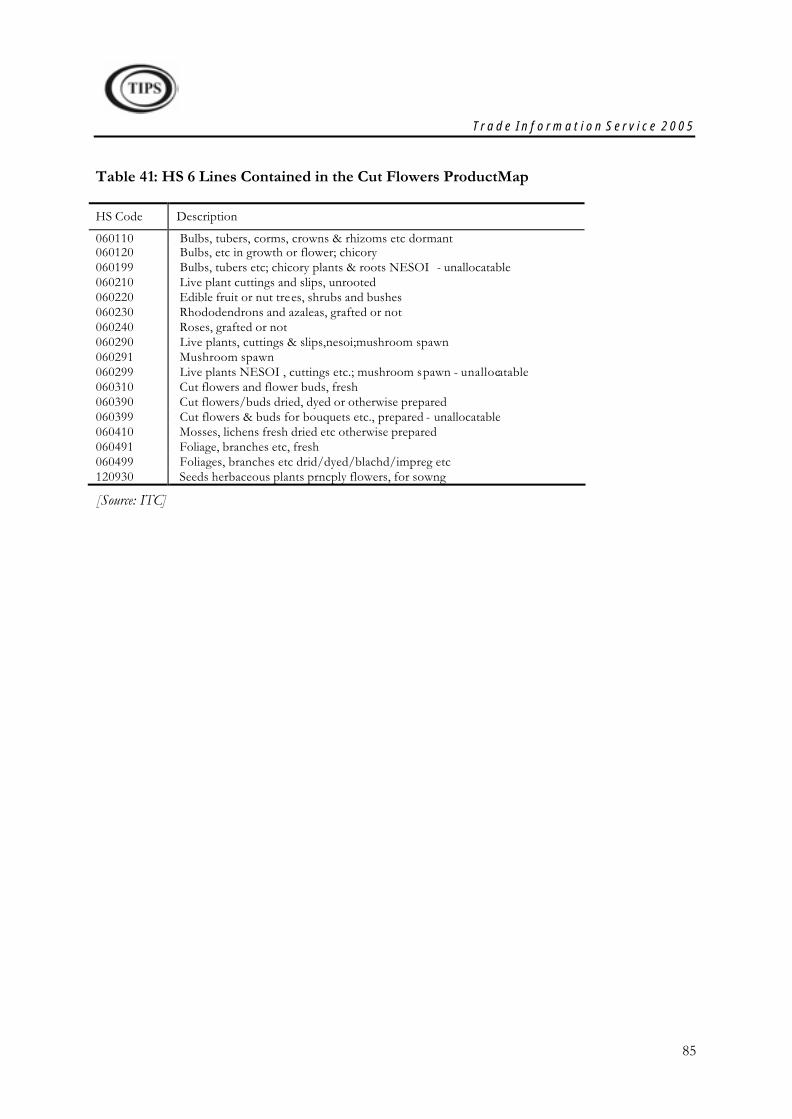
T r a d e I n f o r m a t i o n S e r v i c e 2 0 0 5
85
Table 41: HS 6 Lines Contained in the Cut Flowers ProductMap
HS Code Description
060110 Bulbs, tubers, corms, crowns & rhizoms etc dormant 060120 Bulbs, etc in growth or flower; chicory 060199 Bulbs, tubers etc; chicory plants & roots NESOI - unallocatable 060210 Live plant cuttings and slips, unrooted 060220 Edible fruit or nut trees, shrubs and bushes 060230 Rhododendrons and azaleas, grafted or not 060240 Roses, grafted or not 060290 Live plants, cuttings & slips,nesoi;mushroom spawn 060291 Mushroom spawn 060299 Live plants NESOI , cuttings etc.; mushroom spawn - unallocatable 060310 Cut flowers and flower buds, fresh 060390 Cut flowers/buds dried, dyed or otherwise prepared 060399 Cut flowers & buds for bouquets etc., prepared - unallocatable 060410 Mosses, lichens fresh dried etc otherwise prepared 060491 Foliage, branches etc, fresh 060499 Foliages, branches etc drid/dyed/blachd/impreg etc 120930 Seeds herbaceous plants prncply flowers, for sowng
[Source: ITC]
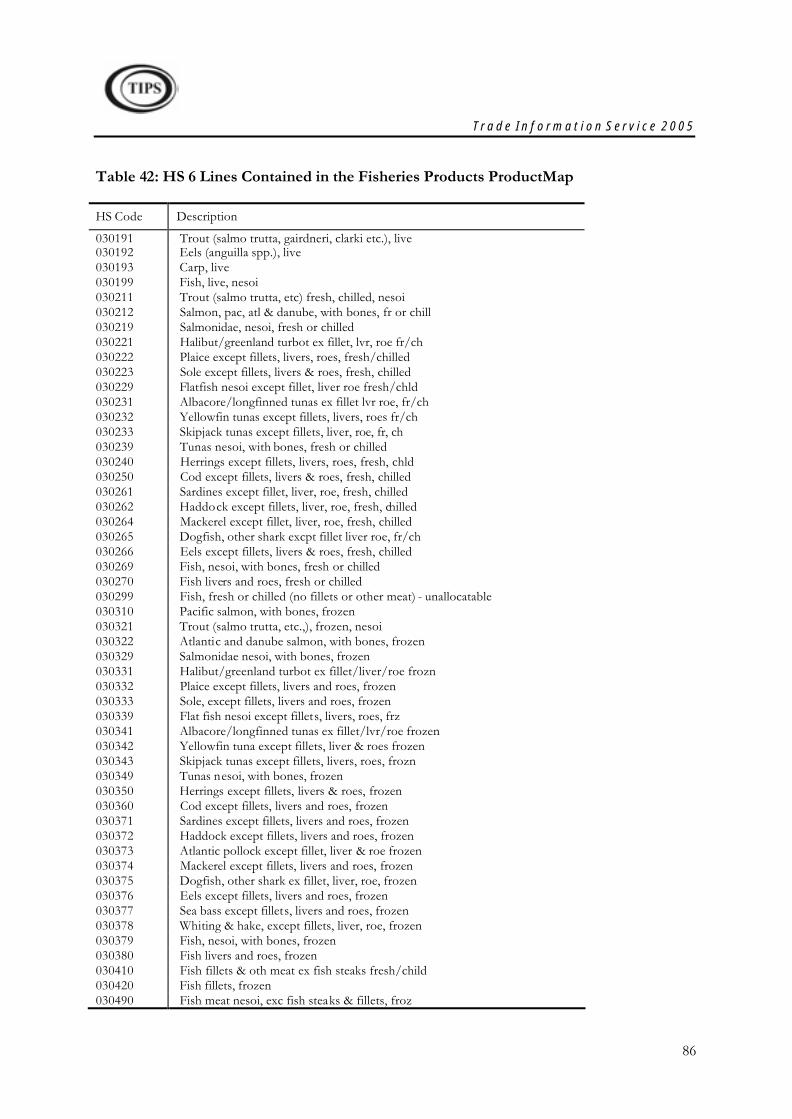
T r a d e I n f o r m a t i o n S e r v i c e 2 0 0 5
86
Table 42: HS 6 Lines Contained in the Fisheries Products ProductMap
HS Code Description
030191 Trout (salmo trutta, gairdneri, clarki etc.), live 030192 Eels (anguilla spp.), live 030193 Carp, live 030199 Fish, live, nesoi 030211 Trout (salmo trutta, etc) fresh, chilled, nesoi 030212 Salmon, pac, atl & danube, with bones, fr or chill 030219 Salmonidae, nesoi, fresh or chilled 030221 Halibut/greenland turbot ex fillet, lvr, roe fr/ch 030222 Plaice except fillets, livers, roes, fresh/chilled 030223 Sole except fillets, livers & roes, fresh, chilled 030229 Flatfish nesoi except fillet, liver roe fresh/chld 030231 Albacore/longfinned tunas ex fillet lvr roe, fr/ch 030232 Yellowfin tunas except fillets, livers, roes fr/ch 030233 Skipjack tunas except fillets, liver, roe, fr, ch 030239 Tunas nesoi, with bones, fresh or chilled 030240 Herrings except fillets, livers, roes, fresh, chld 030250 Cod except fillets, livers & roes, fresh, chilled 030261 Sardines except fillet, liver, roe, fresh, chilled 030262 Haddock except fillets, liver, roe, fresh, chilled 030264 Mackerel except fillet, liver, roe, fresh, chilled 030265 Dogfish, other shark excpt fillet liver roe, fr/ch 030266 Eels except fillets, livers & roes, fresh, chilled 030269 Fish, nesoi, with bones, fresh or chilled 030270 Fish livers and roes, fresh or chilled 030299 Fish, fresh or chilled (no fillets or other meat) - unallocatable 030310 Pacific salmon, with bones, frozen 030321 Trout (salmo trutta, etc.,), frozen, nesoi 030322 Atlantic and danube salmon, with bones, frozen 030329 Salmonidae nesoi, with bones, frozen 030331 Halibut/greenland turbot ex fillet/liver/roe frozn 030332 Plaice except fillets, livers and roes, frozen 030333 Sole, except fillets, livers and roes, frozen 030339 Flat fish nesoi except fillets, livers, roes, frz 030341 Albacore/longfinned tunas ex fillet/lvr/roe frozen 030342 Yellowfin tuna except fillets, liver & roes frozen 030343 Skipjack tunas except fillets, livers, roes, frozn 030349 Tunas nesoi, with bones, frozen 030350 Herrings except fillets, livers & roes, frozen 030360 Cod except fillets, livers and roes, frozen 030371 Sardines except fillets, livers and roes, frozen 030372 Haddock except fillets, livers and roes, frozen 030373 Atlantic pollock except fillet, liver & roe frozen 030374 Mackerel except fillets, livers and roes, frozen 030375 Dogfish, other shark ex fillet, liver, roe, frozen 030376 Eels except fillets, livers and roes, frozen 030377 Sea bass except fillets, livers and roes, frozen 030378 Whiting & hake, except fillets, liver, roe, frozen 030379 Fish, nesoi, with bones, frozen 030380 Fish livers and roes, frozen 030410 Fish fillets & oth meat ex fish steaks fresh/child 030420 Fish fillets, frozen 030490 Fish meat nesoi, exc fish steaks & fillets, froz
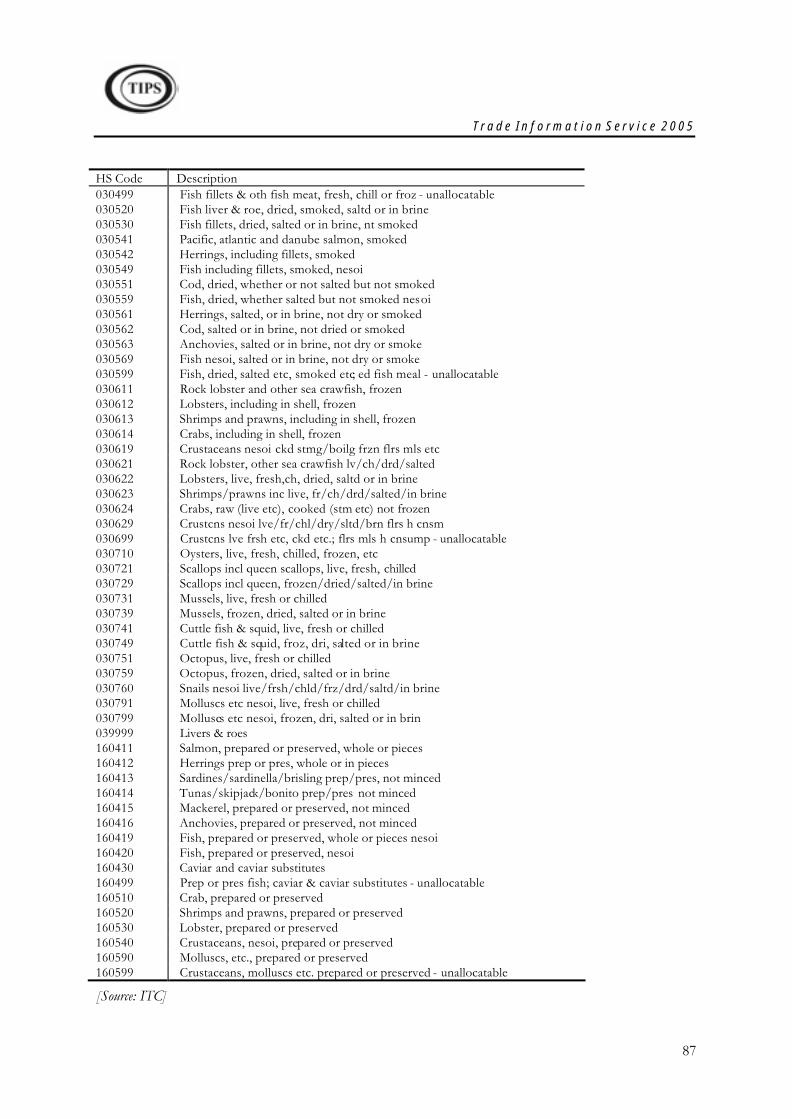
T r a d e I n f o r m a t i o n S e r v i c e 2 0 0 5
87
HS Code Description 030499 Fish fillets & oth fish meat, fresh, chill or froz - unallocatable 030520 Fish liver & roe, dried, smoked, saltd or in brine 030530 Fish fillets, dried, salted or in brine, nt smoked 030541 Pacific, atlantic and danube salmon, smoked 030542 Herrings, including fillets, smoked 030549 Fish including fillets, smoked, nesoi 030551 Cod, dried, whether or not salted but not smoked 030559 Fish, dried, whether salted but not smoked nesoi 030561 Herrings, salted, or in brine, not dry or smoked 030562 Cod, salted or in brine, not dried or smoked 030563 Anchovies, salted or in brine, not dry or smoke 030569 Fish nesoi, salted or in brine, not dry or smoke 030599 Fish, dried, salted etc, smoked etc; ed fish meal - unallocatable 030611 Rock lobster and other sea crawfish, frozen 030612 Lobsters, including in shell, frozen 030613 Shrimps and prawns, including in shell, frozen 030614 Crabs, including in shell, frozen 030619 Crustaceans nesoi ckd stmg/boilg frzn flrs mls etc 030621 Rock lobster, other sea crawfish lv/ch/drd/salted 030622 Lobsters, live, fresh,ch, dried, saltd or in brine 030623 Shrimps/prawns inc live, fr/ch/drd/salted/in brine 030624 Crabs, raw (live etc), cooked (stm etc) not frozen 030629 Crustcns nesoi lve/fr/chl/dry/sltd/brn flrs h cnsm 030699 Crustcns lve frsh etc, ckd etc.; flrs mls h cnsump - unallocatable 030710 Oysters, live, fresh, chilled, frozen, etc 030721 Scallops incl queen scallops, live, fresh, chilled 030729 Scallops incl queen, frozen/dried/salted/in brine 030731 Mussels, live, fresh or chilled 030739 Mussels, frozen, dried, salted or in brine 030741 Cuttle fish & squid, live, fresh or chilled 030749 Cuttle fish & squid, froz, dri, salted or in brine 030751 Octopus, live, fresh or chilled 030759 Octopus, frozen, dried, salted or in brine 030760 Snails nesoi live/frsh/chld/frz/drd/saltd/in brine 030791 Molluscs etc nesoi, live, fresh or chilled 030799 Molluscs etc nesoi, frozen, dri, salted or in brin 039999 Livers & roes 160411 Salmon, prepared or preserved, whole or pieces 160412 Herrings prep or pres, whole or in pieces 160413 Sardines/sardinella/brisling prep/pres, not minced 160414 Tunas/skipjack/bonito prep/pres not minced 160415 Mackerel, prepared or preserved, not minced 160416 Anchovies, prepared or preserved, not minced 160419 Fish, prepared or preserved, whole or pieces nesoi 160420 Fish, prepared or preserved, nesoi 160430 Caviar and caviar substitutes 160499 Prep or pres fish; caviar & caviar substitutes - unallocatable 160510 Crab, prepared or preserved 160520 Shrimps and prawns, prepared or preserved 160530 Lobster, prepared or preserved 160540 Crustaceans, nesoi, prepared or preserved 160590 Molluscs, etc., prepared or preserved 160599 Crustaceans, molluscs etc. prepared or preserved - unallocatable
[Source: ITC]
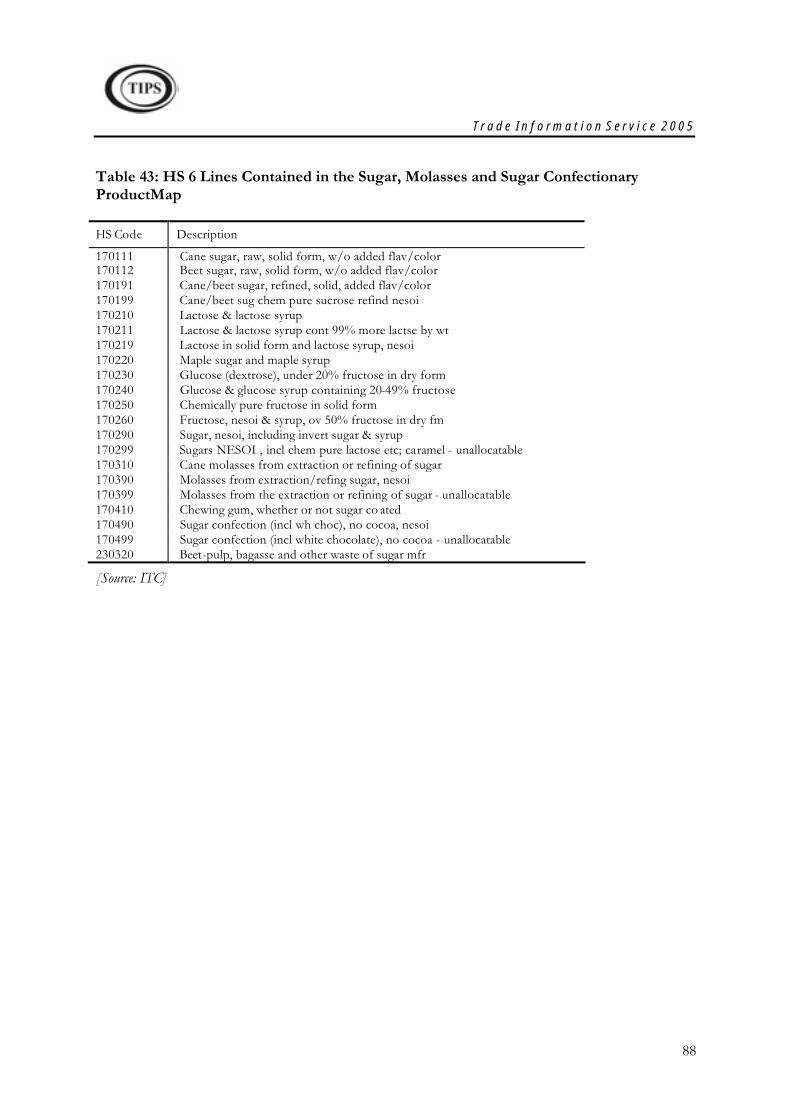
T r a d e I n f o r m a t i o n S e r v i c e 2 0 0 5
88
Table 43: HS 6 Lines Contained in the Sugar, Molasses and Sugar Confectionary ProductMap
HS Code Description
170111 Cane sugar, raw, solid form, w/o added flav/color 170112 Beet sugar, raw, solid form, w/o added flav/color 170191 Cane/beet sugar, refined, solid, added flav/color 170199 Cane/beet sug chem pure sucrose refind nesoi 170210 Lactose & lactose syrup 170211 Lactose & lactose syrup cont 99% more lactse by wt 170219 Lactose in solid form and lactose syrup, nesoi 170220 Maple sugar and maple syrup 170230 Glucose (dextrose), under 20% fructose in dry form 170240 Glucose & glucose syrup containing 20-49% fructose 170250 Chemically pure fructose in solid form 170260 Fructose, nesoi & syrup, ov 50% fructose in dry fm 170290 Sugar, nesoi, including invert sugar & syrup 170299 Sugars NESOI , incl chem pure lactose etc; caramel - unallocatable 170310 Cane molasses from extraction or refining of sugar 170390 Molasses from extraction/refing sugar, nesoi 170399 Molasses from the extraction or refining of sugar - unallocatable 170410 Chewing gum, whether or not sugar co ated 170490 Sugar confection (incl wh choc), no cocoa, nesoi 170499 Sugar confection (incl white chocolate), no cocoa - unallocatable 230320 Beet-pulp, bagasse and other waste of sugar mfr
[Source: ITC]
Related Documents