Trade Flow of U.S. Recalled Consumer Products: A Gravity Model Analysis A Thesis SUBMITTED TO THE FACULTY OF UNIVERSITY OF MINNESOTA BY Brian James Swanson Lindgren IN PARTIAL FULFILLMENT OF THE REQUIREMENTS FOR THE DEGREE OF MASTER OF SCIENCE IN APPLIED ECONOMICS Pamela J. Smith September 2014

Welcome message from author
This document is posted to help you gain knowledge. Please leave a comment to let me know what you think about it! Share it to your friends and learn new things together.
Transcript

Trade Flow of U.S. Recalled Consumer Products: A Gravity Model Analysis
A Thesis SUBMITTED TO THE FACULTY OF
UNIVERSITY OF MINNESOTA BY
Brian James Swanson Lindgren
IN PARTIAL FULFILLMENT OF THE REQUIREMENTS FOR THE DEGREE OF
MASTER OF SCIENCE IN APPLIED ECONOMICS
Pamela J. Smith
September 2014

© Brian James Swanson Lindgren 2014

i
Acknowledgements
I would like to express many thanks to my advisor Pamela J. Smith for her guidance in
helping the thesis to find direction and her time reviewing its many iterations.
I would also like to thank both Jay S. Coggins and Robert T. Kudrle for their time spent
helping to improve my paper and taking the time to sit on my thesis committee.

ii
Dedication
This thesis is dedicated to my wife, Andrea K. S. Lindgren, whose patience allowed me
the time to work on the thesis and for helping me to keep pushing forward towards its
completion.
iii
Abstract
This paper examines the hypothesis that the trade flow of recalled products and harm
caused by recalled products will conform to economic theory in a similar way as the flow
of goods in general. A Bergstrand-based gravity model is used in the analysis. My
application uses a novel data set that includes measures of U.S. consumer product recalls
from 2006 and 2007. The results of the analysis show that the flow of recalled goods
corresponds to theory. The type of consumer products imported into the U.S., as well as
those later recalled, are found to tend to be labor intensive. Better exporting country
institutions corresponded to a relatively greater amount of goods later recalled.

iv
Table of Contents
Acknowledgements i
Dedication ii
Abstract iii
Table of Contents iv
List of Tables v
1. Introduction 1
2. Literature Review 2
3. Model and Specifications 7
4. Method and Data 11
5. Results 19
6. Concluding Remarks 23
Bibliography 26
Appendix A 32
Appendix B 34
Appendix C 35
Appendix D 36
Appendix E 38
Appendix F 39
Appendix G 40
Appendix H 41

v
List of Tables
Table 1 Expected Signs of Coefficient Estimates for Equation (3) for
the Trade Flows to the U.S. of Imports, Recalled Value, and
Number of Cases of Harm
29
Table 2 Description of the Variables Used to Estimate Equation (3)
30
Table 3 Estimates of Equation (3) for the Trade Flows to the U.S. of
Imports, Recalled Value, and Number of Cases of Harm
31

1
1. Introduction
For consumer product safety, the year 2007 was an important one. It marked the
start of a period of increased public, legislative and academic attention to consumer
product safety. This was due to high profile recalls of products manufactured in China.
Large numbers of children’s toys were recalled due to above limit lead content. The
largest such case involved multiple types of toys manufactured for Mattel. The Mattel
case culminated in the CEO of the Chinese manufacturing firm committing suicide and
high profile apologies being made by Mattel to the Chinese government over its
statements regarding the case. In the U.S., laws and regulations were changed as a result
of the increased number of recalls. Calls were made by legislators to restrict trade until
the issues regarding the recalls could be solved. The issue of product safety is clearly
important from the standpoint of the consumer, but it is also important in regards to
international trade. Restrictions placed on trade need to be made from an informed point
of view to create appropriate public policy.
This paper examines the hypothesis that the trade flow of recalled products and
harm caused by recalled product will conform to economic theory in a similar way as the
flow of goods in general. The gravity model can be used to estimate the flow of imports
of consumer goods into the U.S. and allows a comparison to the value and harm caused
by products that are subsequently recalled due to safety concerns. A better understanding
the flow of unsafe products is important in crafting trade policy, managing consumer
product safety regulations, choices where a firm sources products, and the country of
origin a consumer chooses to purchase a product from. The types of consumer goods

2
analyzed in this paper are ones that were overseen by the U.S. Consumer Product Safety
Commission (CPSC) during 2006 and 2007. The CPSC manages all consumer product
safety recalls except for those involving food, drugs, highway automobiles, boats,
aircraft, or firearms which are managed by other U.S. agencies.
This paper makes several novel contributions. The consumer product recall data
set constructed is at a much greater detail than currently available and for the first time
relates product recalls to the price information and country of manufacturing data
available in the recall notices. This type of data should help aid in the tracking and
regulation of consumer safety beyond looking at just specific product category safety
trends over time. An import data set was created from U.S. Census Bureau data that
focuses on U.S. imports regulated by the CPSC. In the economics literature, product
quality is difficult to measure directly. This paper provides an empirical measurement of
one aspect of product quality, which is product safety. Using this measurement, product
safety is modeled for the first time using the gravity model, which allows various policy
variables to be analyzed within a theory-based economic framework.
2. Literature Review
This paper contributes to two areas of literature and helps to inform a third. The
first area is on the effect of product recalls on: shareholder wealth, imports to the U.S.,
and firm sales. This wide-ranging area of literature does not include the use of trade
models but does represent the prior work that has been done examining the impacts of
product recalls. This paper contributes to this area of literature by examining what
3
factors may play a role in the flow of unsafe products and lays the ground work for being
able to predict the relative likelihood of recalls occurring by country of manufacturing.
Being able to better predict this risk would be a benefit to both firms and investors.
The literature on shareholder wealth begins with an examination of automotive
and drug recalls on shareholder wealth by Jarrell and Peltzman (1985) which shows that
shareholder wealth is negatively affected by recall announcements. A similar conclusion
is reached by Pruitt and Peterson (1986) on the examination on the effect of drug and
other consumer product recalls on shareholder value. Hoffer, Pruitt and Reilly (1988)
make corrections to the methodology of Jarrel and Peltzman and find that after these
corrections that no significant impact of recalls on shareholder wealth can be found.
Davidson and Worrell (1992) examine automotive recalls and find that when recalls are
divided into repairable and replaceable categories that recalls which required replacement
had significant greater effects on shareholder wealth. Dranove and Olsen (1994) examine
drug recalls and their effect on shareholder value and spillover to other pharmaceutical
firms. They find that individual firms suffered a loss in shareholder value from recalls
and that spillover effects occurred when it was expected that the cost of similar safety
compliance would be borne by competing firms. Barber and Darrough (1996) expand on
the work by Pruitt and Peterson by increasing the number of years in the data set and
including Japanese automotive manufacturing firm in addition to U.S. firms. They find
that shareholder wealth for individual firms is negatively affected by recalls but find no
evidence of a spillover effect to competing firms. Chu, Lin and Prather (2005) examine
non-automotive consumer product recalls from 1983 to 2005 and the effects on

4
shareholder wealth and find that for responsible firms markets react negatively and
quickly to the release of product recall announcements. For most of these papers the
recall announcements in the Wall Street Journal was the main source of data on U.S.
product recalls. The types of product recalls analyzed were limited by the nature of
research to only include publicly traded firms.
One paper was found that examines the effect of recalls on imports to the U.S.
Candelaria and Hale (2008) examine the impact of consumer product recalls on the
subsequent volume of U.S. imports originating from China. In their paper they divide
consumer products that were imported into the U.S. into two groups, a recall and non-
recall group. Inclusion in the recall group was based on a product having a recall
occurring in the third quarter of 2007. They then forecast the value U.S. imports for the
second half of 2007 for the two groups using lagged monthly data from 2000 through the
first half of 2007. This data is adjusted for seasonality and holidays. They find that
imports for recalled group were 5.1% lower than would be predicted. The authors state
they have no reason to believe that the difference between the predicted and actual results
is due to anything other than the impact of the recalls themselves.
A wide-ranging working paper by Freedman, Kearney, Lederman (2009)
examines recall effects on firms’ sales and shareholder wealth. The impetus for their
paper was the major jump in the number of toy and children’s products recalled in 2007
and their investigation follows along that line. They find that the grouping of similar toys
recalled in 2007 had lowered sales in Christmas of 2007 and that there was a spillover
effect to manufactures of infant/preschool toys that were not involved in a recall. They
5
also found that the recall of one type of toy did not affect the sales in other similar toy
groupings by that same manufacture. In examining the effect of a recall on a toy’s brand,
they found that there were negative spillovers to the competitors’ sales if the branded
items were in a similar toy grouping, but the effect was positive if the branded items were
in different toy groupings. A plausible explanation for this is that consumers associate
the brand and toy type to an associated recall, but since they still want to purchase a toy
with the desired brand, they will choose to purchase a branded toy that they believe to be
safe since it is dissimilar from the recalled toys grouping. Finally, they examine the stock
market performance of publically traded toy firms and find that the recalling firms are
negatively impacted and that there are spillover effects to non-recalling toy firms.
The second area of literature is related to product complexity and product quality.
Product quality and product safety would seemingly share much in common as product
safety would be a natural inclusion as an aspect of product quality. Other aspects of
product quality would include: complexity, durability, and a wide variety of features that
are specific to consumer preferences. Much of the difficulty in this literature is in trying
to estimate values for product quality. Faruq (2010) states that indication of product
quality does not exist in trade data and the common method to identify quality is by using
a price index as a proxy. This assumes that a similar-type motorcycle produced in one
country that is twice as expensive as one produced in another must solely be due to
quality. This approach has been refined and improved over the years, recently by Hallak
(2006). Hallak and Schott (2011) state that some of the problems of using a price

6
equation to determine quality are due to currency misalignment or comparative advantage
between countries. They devise a method that allows for other factors besides quality to
account for a price difference in a differentiated product. They identify a product’s brand
as being one such aspect of price that is not necessary related to quality. Since it is
assumed that some measure of quality is contained within a price differential, any
methods that control for other aspects of the price differential help to make the price
differential closer to an isolated measure of quality.
Reitzes (1992) put forth a theory that firms will only use a “quality commitment”
to secure pricing power. As a result, the difference in price between two similar goods
will not be proportional to the difference in quality between those goods. The pricing
power can be used to increase the price of the good beyond its increase in quality. Chu
and Chu (1994) argue for a theory in which a manufacturer of high quality products with
no brand recognition for quality can signal quality by selling through a retailer with a
strong reputation. They find that doing so allows for equilibrium profits above zero.
This further supports the argument that price differences in similar goods are due to more
than just quality differences.
In the present paper, the focus is on an aspect of product quality which is product
safety. Prior literature has found difficulty in trying to obtain an isolated measure of
product quality. Since data are available on product safety in the form of product recall
data, no estimation or derivation of safety is needed. The present paper contributes to
this area of literature by examining and providing empirical measurements of product
safety, an aspect of product quality.

7
The third area of literature this paper helps to inform is product safety law,
regulation, and supply chain management. The present paper does not purpose new law
or regulation but a review of the literature in this area finds that there is a lack of a good
analytical basis for comparing and explaining the relative level of product safety between
countries of manufacturing. A review of this literature is given in Appendix A.
3. Model and Specifications
The gravity model of economics was introduced by Tinbergen in 1962. It was
based on an analogy to the concept of gravitational force. In its simplest form, the model
relates the flow of trade between two countries as the economic mass of the two countries
divided by the distance between the two countries. The gravity model has found much
empirical success, but did not have a theoretical underpinning until Anderson (1979).
Other literature addressing the theoretical roots of the gravity model followed such as:
Bergstrand (1985); Bergstrand (1989); Feenstra, Markusen, and Rose (2001); and
Haveman and Hummels (2004). Each work sets up a different set of assumptions that
give rise to the gravity model in full or partial form.
A commonly used gravity model with solid theoretical underpinnings is described
by Bergstrand (1989) and is summarized as follows:
PXij = 0(GDPi)1
(GDPi/POPi)2
(GDPj)3
(GDPj/POPj)4
(Dij)5
(Aij)6
eij (1)

8
where PXij is the U.S. dollar value for the flow from country i to country j, GDPi and
GDPj is GDP in nominal U.S. dollars for country i and j respectively, POPi and POPj is
population for country i and j respectively, Dij is the distance from the economic center of
country i to country j, Aij is the distortionary term that represents any factor that distorts
trade flows from country i to country j by aiding or restricting it, and eij is the error term
for the flow of trade from country i to country j. The log form of equation (1) is typically
used in regression analysis.
Bergstrand goes on to show the theoretic framework that can explain this model.
A 2-firm, 2-good, N-country monopolistic competition model is created to show how the
gravity model relates to the Heckscher-Ohlin model of inter-industry trade and the
Helpman-Krugman-Markusen models of inter-industry trade. The firms produce
uniquely differentiated goods which is the same type of goods of interest in the present
paper.
The flow of goods later subject to recall would not be expected to differ markedly
from that of the general flow of goods for most of the terms in the model. In this regard,
Equation (1) is used to explain both the flow of recalled goods as well as the total flow of
goods. The harm caused by recalled products is also of interest. In this paper, Equation
(1) is also adapted by substituting for the flow of recalled goods with the flow of harm
caused by recalled goods. This substitution allows for the flow of harm caused by
recalled product to be quantified and compared to the flow of total goods and recalled

9
goods. The construction of the harm measurement is based on a count of deaths and
injuries listed in product recall notices. This measure of harm is not monetary so the
price of a product is not considered in this flow measurement. Additionally, since the
monetary cost of the harm caused to consumers is not measured, everything from minor
injuries to deaths was given equal weight in construction of the flow measurement. This
is a limitation to the usefulness of the measurement.
Since only consumer product recall data within the U.S. is available, only the one-
way flow of consumer goods into the U.S. is analyzed for comparison. Since there is
only a single country j, all of the j terms become part of the constant 0. This gives the
following equation:
PXij = 0(GDPi)1
(GDPi/POPi)2
(Dij)5
(Aij)6
eij (2)
The expected signs of the coefficients are explained by Bergstrand (1989). 1 is
expected to be positive since GDP serves as a proxy for country i’s national output. A
higher national output should tend to produce higher levels of exports. The expected sign
of 2 is more ambiguous since GDP per capita tends to serve as a proxy for exporting
country i’s labor to capital endowment ratio. As a result the expected sign of 2 would be
tend to be dependent on the type of goods in question. With an elasticity of substitution
in consumption greater than one, 2 would tend to be positive if the flow of goods are
capital intensive and negative if labor intensive. Since the flow is of general consumer
products towards the U.S., the expectation is that the elasticity of substitution in

10
consumption will be greater than one and the flow of goods will tend to be labor
intensive. As a result, the expected sign for this case is negative. 5 is expected to be
negative as distance serves as a proxy for shipping related costs between country i and
country j. Higher cost due to increased trading partner distance should tend to reduce the
relative amount of trade between countries.
Taking the natural log of Equation (2) and then substituting the variables Contigij,
Institutionsi, and Linksij for distortionary term lnAij gives the following equation:
lnPXij = 1 ln(GDPi) + 2 ln(GDPi/POPi)+ 5 lnDij
+ 6C Contigij + 6I Institutionsi + 6L Linksij + eij (3)
where Contigij is a binary variable equal to one if the exporting country i shares a border
with the importing country (i.e., the U.S.). In general a shared border should reduce
barriers to trade with an effect that is similar but distinct from trading partner distance.
As a result, the expected sign 6C of would be positive.
Institutionsi represents the quality of the exporting country i’s institutions. 6I is
expected to be positive since higher quality institutions in the exporting country are
expected to reduce transaction costs due to the reduction in the exporter’s incentive to
breach contracts as argued by Berkowitz, Moenius, and Pistor (2006). They investigated
the effects of an importer’s quality of institutions on trade of complex and simple

11
products, which are typically called differentiated and homogenous goods in related
literature. Drawing on the theory of incomplete contracts, they argue that good legal
institutions in the country of export increase trade in complex products since they reduce
the exporter’s incentive to breach contracts. They find empirical evidence that increased
quality of the exporter’s institutions results in the export of more complex products and
import of more simple products. Complex products are the type of products regulated by
the CPSC, so the use of qualities of institutions should similarly be an important factor in
explaining a manufacturer’s incentive to produce safe products.
Linksi is a binary variable that represents the cultural and linguistic ties between
exporting country i and the importing country (i.e., the U.S.). 6L is expected to be
positive since common language and cultural ties should increase the flow of trade as
shown by Rauch (1999) and Frankel et al. (1993).
4. Method and Data
Using equation (3), the following flows are estimated: (a) Value of Consumer
Products Imported by the U.S.; (b) Value of Recalled Consumer Products Imported by
the U.S.; and (c) Harm Caused by Recalled Consumer Products Imported by the U.S.
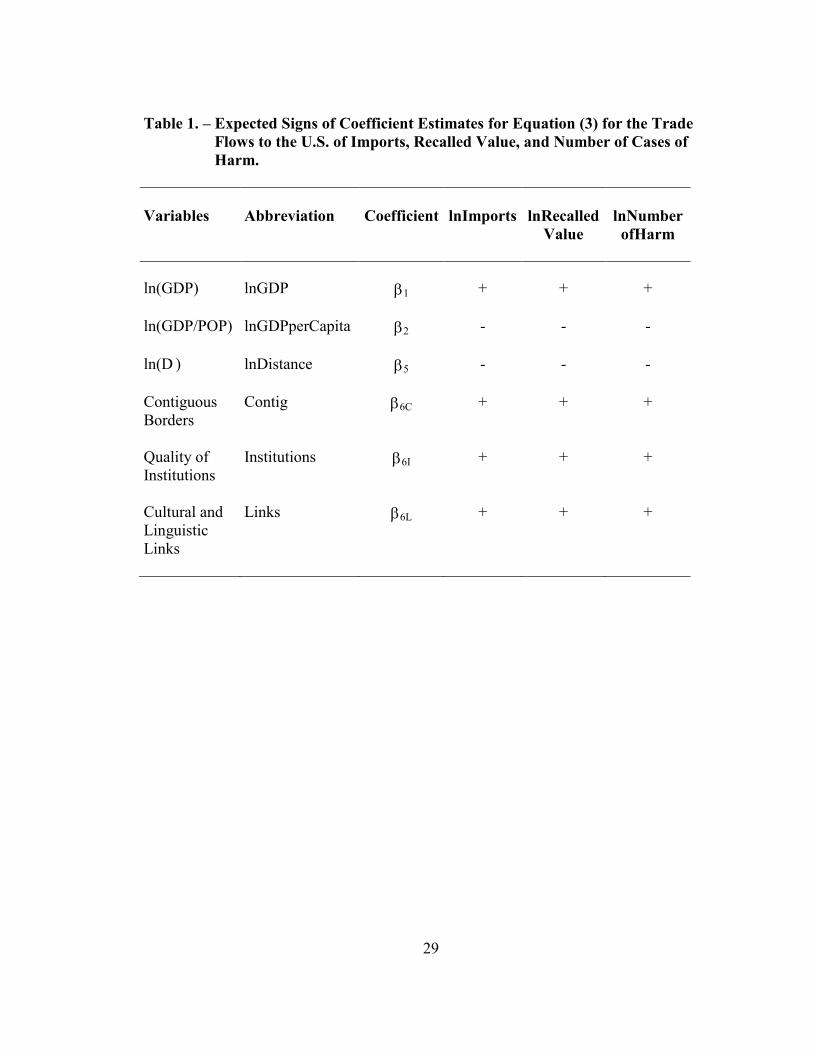
Table 1 lists the expected signs for each of the three estimated flows. The
reasoning behind these expectations is given in the previous section. The expected values
are the same for all the estimated flows. A description of the variables used to estimate
12
Equation (3) is listed in Table 2. Details on the data used are given in the following
subsections.
4.1. Recall Data
There are many U.S. agencies that regulate products consumers use: Food and
Drug Administration, the U.S. Department of Agriculture’s Food Safety and Inspection
Service, National Highway Traffic Safety Administration, Environmental Protection
Agency, U.S. Coast Guard, Bureau of Alcohol, Tobacco, Firearms, and Explosives and
the Consumer Product Safety Commission (CPSC). Each of these agencies is responsible
for issuing recalls within its area of jurisdiction. Consumer products that the CPSC
regulates were chosen for use in this paper since they account for the widest class of
consumer product of any of the agencies and the CPSC regulates many of the products
involved in high profile cases that grab the public’s attention (often cases involving
children).
The Consumer Product Safety Improvement Act of 2008 mandates that the CPSC
create a searchable public database. This new database allows the user to search for
product recall notices by means of a variety of criteria, but does not present the notices
together in an analyzable format. Further, the database does not report the full amount of
information reported in an individual notice. The CPSC was contacted by way of the
Freedom of Information Act to determine if they had created an analyzable dataset based
on their recall notices. They replied that they did not have recall information in an
analyzable format. As a result, individual recall notices were analyzed one-by-one in

13
order to create the novel data set used in this paper. Appendix B shows a typical recall
notice issued by the CPSC.
The public notices the CPSC issues in the event of a recall carry information on:
product name, recalling party (manufacturer, importer, distributor and/or retailer),
number of units recalled, description of hazard, number of injuries/incidents, description
of the product, where it was sold, how long it was sold, where it was manufactured, and
the remedy purposed to resolve the hazard.
Data covering 2006 and 2007 was chosen for inclusion and pooled to create a
larger data set than just one year would provide. This represented 757 recall notices from
43 countries of manufacturing. For each year covered, the number of recalls was 310 and
447 for 2006 and 2007, respectively. There was also one public safety notice and one
voluntary replacement notice. Information from these two cases was not included in the
analyzed data set.
A statistical characterization of the data is given in Appendix C. The data from
2006 and 2007 was pooled and divided by two in order to annualize the data. The data
shown includes the U.S. as country of manufacturing. Of note in this data is the mean
time between when a product is first for sale and when a recall notice was issued. At
close to 20 months this represents a significant time lag. One potential source of error in
the data is that time at which a product is recalled does not match the time at when it was
imported. Product recalls in the data set are from 2006 and 2007, but some of these
products could have been on sale for 10 years or 10 weeks. As a result a flow that is
assumed to be just for 2006 and 2007 is actually for a period that starts 20 months earlier
14
on average. The corresponding right hand side variables in equation (3) are for the
2006/2007 time-frame. However, many products are likely to be continually imported in
batches at dates after the initial import date. For example a recalled product may have
had a first shipment of 10,000 units to the U.S. in 2005 and a second shipment of the
same amount in 2006. This should help to mitigate any error effect of the mean 20 month
time lag by putting more of the product flow closer to the intended 2006/2007 timeframe.
Using the information on the recall notices, the value of the products being
recalled by country of manufacturing could be determined, as shown in Appendix D. For
cases where multiple countries were listed as manufactures, the value of the recall was
divided equally among the countries of manufacturing. This assumption was made to
allow for analytic feasibility, but could lead to error in the results.
Incidents and injuries could be broken down into: general reports, injuries,
permanent injuries, deaths, minor damage, and major damage to property. A value for
harm to consumers was created by adding up the incidents of all injuries and damage to
property. For cases where multiple countries were listed as manufactures, the value of
the harm caused was divided equally among the countries of manufacturing. Zero data
was treated by assigning an arbitrarily small positive number in place of a value of zero;
this method has been used in previous literature (Linder and de Groot, 2006). To handle
zero-data, a Tobit regression would be a more solid statistical technique to use compared
to the OLS regression. OLS was chosen for simplicity and ease of obtaining coefficient
results that are elasticities.

15
Using the information in the individual product recall notices, additional
descriptive data was added to the novel dataset. While not directly used in the analysis of
this paper they did inform the discussion in this paper and the direction of analysis. The
following description of the recall data in Appendices E, F and G is based on all countries
of manufacturing listed in the recall notices, including the U.S. The U.S. values were not
excluded in these appendices since they are an important part of the overall nature of U.S.
consumer product recalls.
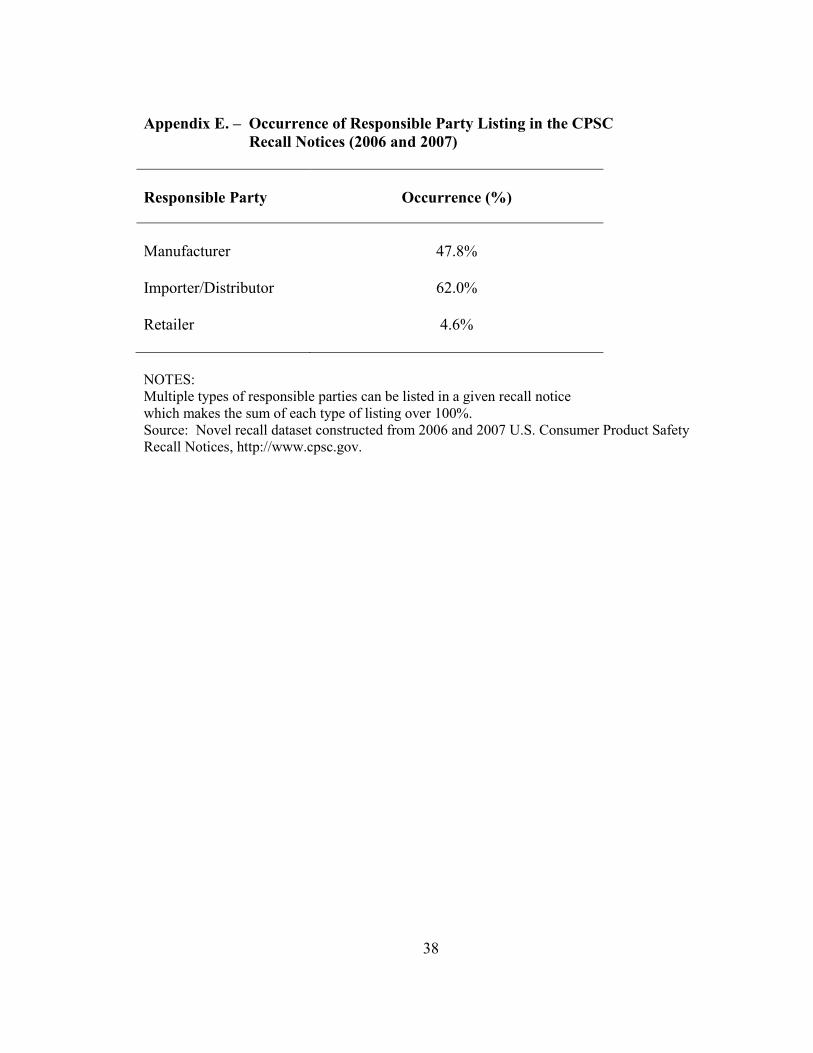
The product recall notices indicate firms responsible for the recall by name and if
they are a Manufacturer, Importer/Distributor, or Retailer. In some cases multiple types
of firms are listed. Appendix E shows the occurrence of the type of firm listed in a
product recall notice. As indicated in the table, retailers are rarely the responsible party
listed in a recall notice.
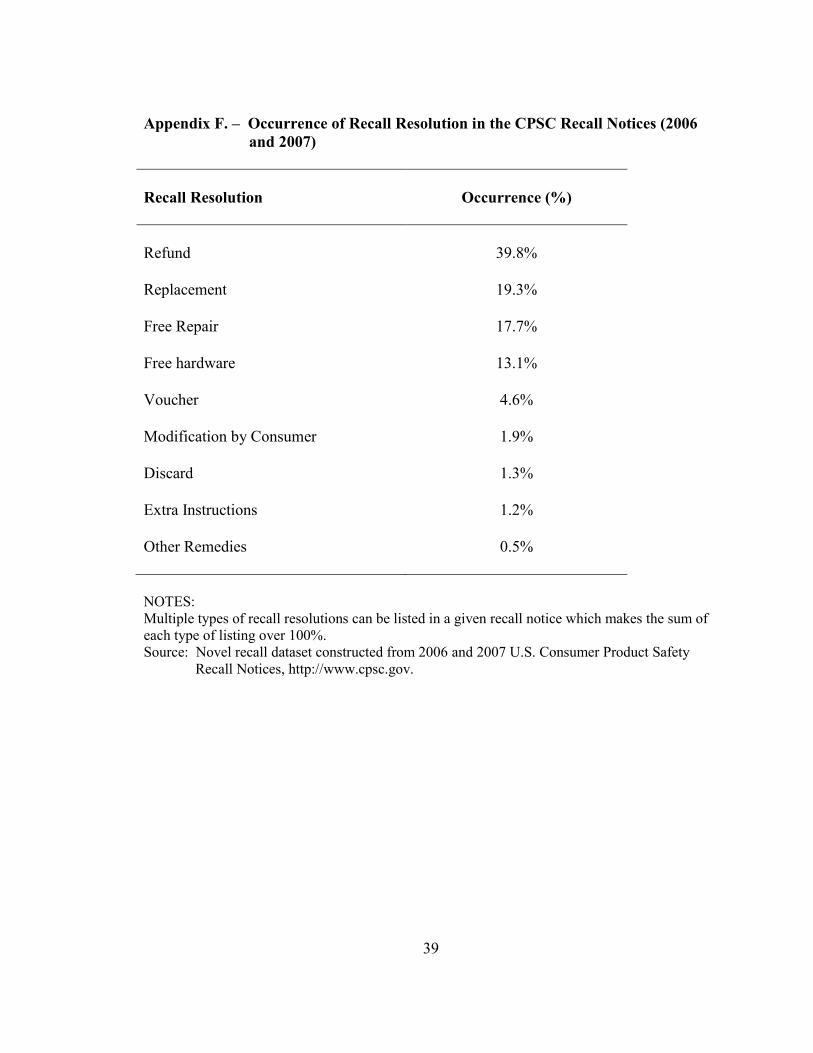
Product recall notices list a resolution to the recall: refund, replacement, free
repair, free hardware (for the consumer to make the repair), a voucher for use towards the
purchase of a different product sold by the recalling firm, modification of the recalled
product by the consumer, direction to discard the recalled product, extra instruction on
the use of the product, or some other remedy. Appendix F shows the occurrence of each
type of recall remedy. At an occurrence of nearly 40%, a refund is the most frequent
remedy method employed.
It was possible to further categorize the recalled products as: dangers to children,
dangers due to lead, dangers due to magnets, power tools, sports and recreation,
electronics, appliances, and counterfeits. Appendix G shows the occurrence of recalls by
16
these general categories. For some recalls, inclusion in these categories can be
overlapping, such as in the case of a children’s’ toy that is recalled to the use of leaded
paint. This categorization allows the nature of products recalls to be seen more clearly.
Recalls due to a product posing a danger to children accounted for 37% of the cases, and
recalls due to lead in products accounted for 17% of cases. As a product category, recalls
of sports and recreation products accounted for nearly 17% of all recalls issued. This was
followed by appliances, electronics, and power tools at 11%, 7%, and 6%, respectively.
4.2. U.S. Import Data
Since the recall data being used was only from the CPSC, is was desirable to use
only the value of imports that had the potential of being recalled by the CPSC. Product
codes are available for imports into the U.S. such that it was possible to attempt to select
only the imports that fell under the purview of the CPSC. For example, Food
Manufacturing was an easy choice of an import type to exclude since it would fall under
the U.S. Department of Agriculture’s Food Safety and Inspection Service purview. The
import data used for this paper was from the U.S. Census Bureau. The product codes used
were classified under North American Industry Classification System (NAICS).
Data for imports into the U.S. for 2006 and 2007 were available from the U.S.
Census Bureau at http://censtats.census.gov/naic3_6/naics3_6.shtml. The data are
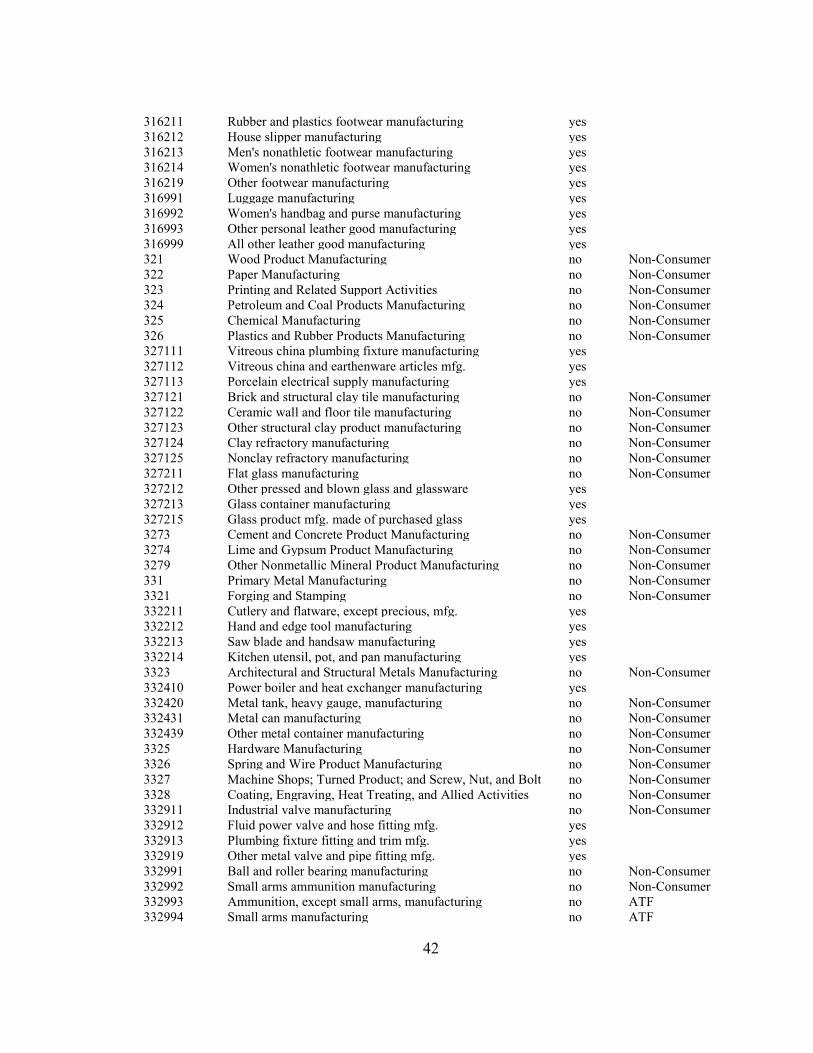
available on a country basis down to the 6 digit NAICS product code level. Appendix H
lists manufacturing product codes included in the import data and codes not included in
the data. Codes for data not included are listed at the highest level possible for

17
conciseness. Product codes that are handled by another U.S. government agency besides
the CPSC were not included, nor were product codes that do not typically include
finished consumer products. The table indicates the reason for inclusion or exclusion by
listing the responsible recalling agency other than the CPSC. Product codes that are not
primarily consumer products are indicated as “non-consumer”. Product codes that need
further explanation for inclusion as a consumer product indicate examples of consumer
products that are included under the code. Many product codes are not composed strictly
of consumer products. This is a potential source of error in the later analysis.
It was not immediately clear how many countries to include in the analysis.
There were 43 countries of manufacturing listed on recall notices during 2006 and 2007,
but there were many countries that were not listed on recall notices during that time
period. When listed by imports into the U.S. the 43rd
recalling county of manufacturing
would rank 73rd
, so clearly the countries without recalls needed to be included in the
analysis. Ninety-five countries were chosen for inclusion by using a cut-off of 5 million
U.S. dollars for country-level imports into the U.S. Appendix D shows the imports and
recalls by country of manufacturing in more detail.
4.3. Data for Explanatory Variables
The data sources for the remaining explanatory variables are summarized below.
GDP data for 2006 and 2007 in 2012 U.S. dollars was available from the World
Bank.

18
GDP per Capita data for 2006 and 2007 in 2012 U.S. dollars was available from
the World Bank.
Distance data are from CEPII’s GeoDist No. 2011-25 database and the weighted
distance measure distwces is used. This value is the distance between countries’ largest
cities weighted by geographic population distribution within each country.
The binary variable contig was created to indicate whether the exporting and
importing country (i.e., U.S.) shared a border. The value of one was assigned in the case
of a shared border and the value of zero was assigned if there was no shared border. This
value was simple to assign as the U.S. is the only importing country. As such only the
exporting countries, Canada and Mexico were assigned a value of one. This corresponds
to the contiguity data listed in the CEPII’s GeoDist No. 2011-25 database.
Following the methodology of Berkowitz, Moenius, and Pistor (2006) the
following data from 2010 from the International Country Risk Guide are averaged to
create an index for the Quality of Exporter Institutions: Law and Order, Contract
Viability, Corruption, and Bureaucratic Quality. The index rating is from one to five,
with five indicating a higher quality of institutions. This index value is used for part of
the distortionary term, Aij, first introduced in equation (1).

19
Following Rauch (1999) and Frankel et al. (1993) a variable called Link can be
created that has the value of one if the U.S. and the country of manufacturing share a
language. Rauch and Frankel also use colonial ties to assign a value of one. For the U.S.
this would only include the Philippines, which already has a relatively high degree of
English speakers. A country was deemed to share a language with the U.S. if English
was an official language or half of the population was estimated to be able to have a
simple conversation in English. The language survey from TNS Opinion & Social (2006)
was used for most of the determinations. This binary variable is used for part of the
distortionary term, Aij, first introduced in equation (1). The following countries were
assigned a value of one in the data: Australia, Austria, Bahamas, Belgium, Canada,
Denmark, Finland, Germany, Hong Kong, India, Ireland, Israel, Luxembourg,
Netherlands, Netherlands Antilles, New Zealand, Nigeria, Norway, Pakistan, Philippines,
Singapore, Slovenia, South Africa, Sweden, Switzerland, Trinidad and Tobago, and
United Kingdom.
5. Results
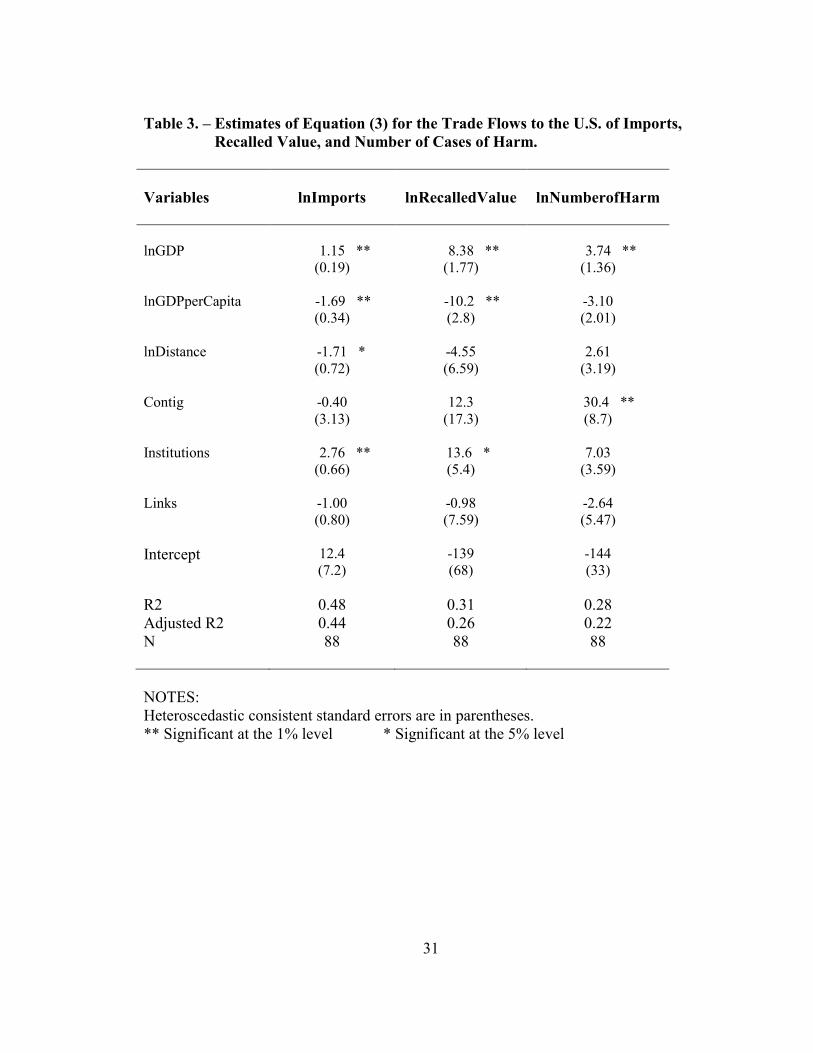
The estimations of Equation (3) for the natural log flow into the U.S. of:
consumer goods, recalled consumer goods and harm caused by recalled consumer goods
are respectively shown in Table 3 as: Imports to the U.S., Value of Recalled Products,
and Number of Cases of Harm. The independent variables used in each case are: lnGDP,
lnGDPperCapita, lnDistance, Contig, Institutions, and Links. Heteroscedastic consistent
standard errors are shown in all cases.
20
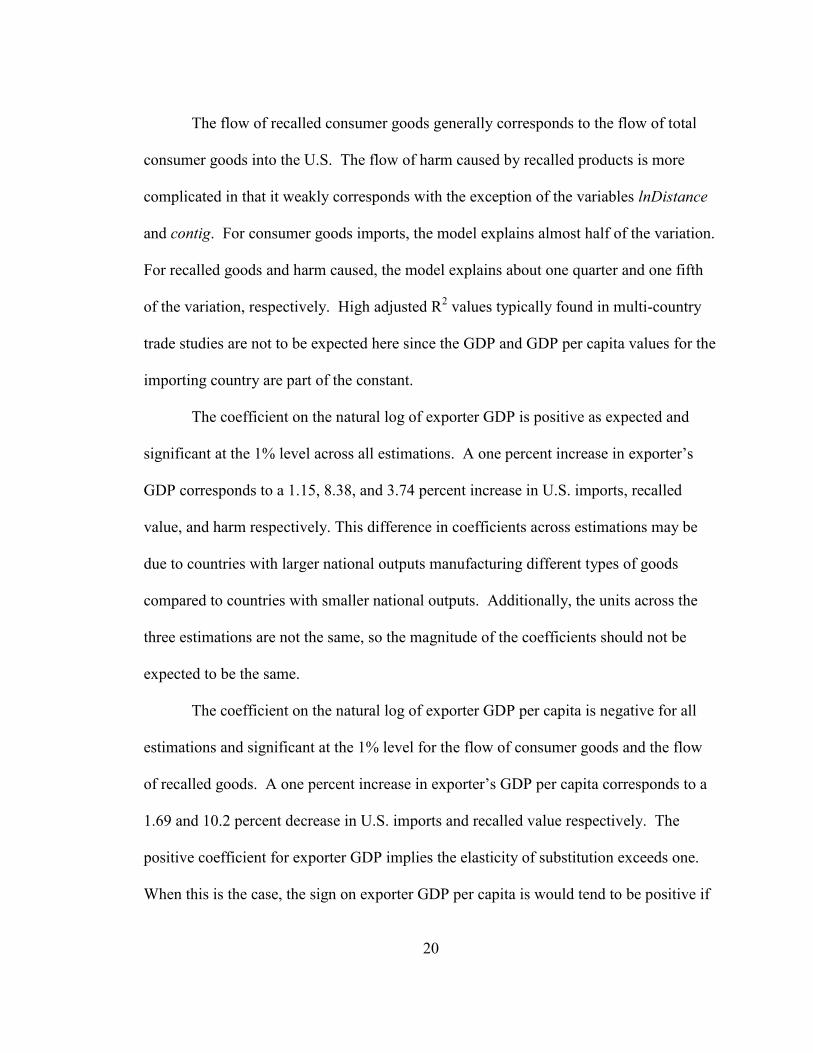
The flow of recalled consumer goods generally corresponds to the flow of total
consumer goods into the U.S. The flow of harm caused by recalled products is more
complicated in that it weakly corresponds with the exception of the variables lnDistance
and contig. For consumer goods imports, the model explains almost half of the variation.
For recalled goods and harm caused, the model explains about one quarter and one fifth
of the variation, respectively. High adjusted R2 values typically found in multi-country
trade studies are not to be expected here since the GDP and GDP per capita values for the
importing country are part of the constant.
The coefficient on the natural log of exporter GDP is positive as expected and
significant at the 1% level across all estimations. A one percent increase in exporter’s
GDP corresponds to a 1.15, 8.38, and 3.74 percent increase in U.S. imports, recalled
value, and harm respectively. This difference in coefficients across estimations may be
due to countries with larger national outputs manufacturing different types of goods
compared to countries with smaller national outputs. Additionally, the units across the
three estimations are not the same, so the magnitude of the coefficients should not be
expected to be the same.
The coefficient on the natural log of exporter GDP per capita is negative for all
estimations and significant at the 1% level for the flow of consumer goods and the flow
of recalled goods. A one percent increase in exporter’s GDP per capita corresponds to a
1.69 and 10.2 percent decrease in U.S. imports and recalled value respectively. The
positive coefficient for exporter GDP implies the elasticity of substitution exceeds one.
When this is the case, the sign on exporter GDP per capita is would tend to be positive if
21
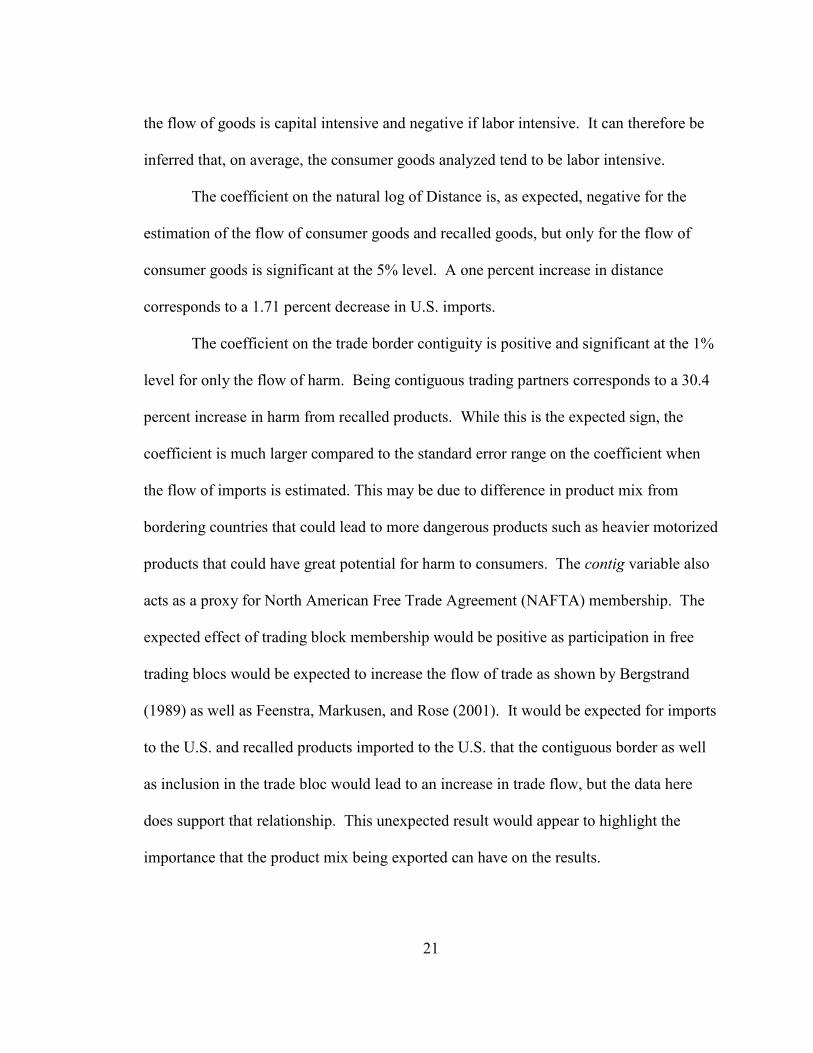
the flow of goods is capital intensive and negative if labor intensive. It can therefore be
inferred that, on average, the consumer goods analyzed tend to be labor intensive.
The coefficient on the natural log of Distance is, as expected, negative for the
estimation of the flow of consumer goods and recalled goods, but only for the flow of
consumer goods is significant at the 5% level. A one percent increase in distance
corresponds to a 1.71 percent decrease in U.S. imports.
The coefficient on the trade border contiguity is positive and significant at the 1%
level for only the flow of harm. Being contiguous trading partners corresponds to a 30.4
percent increase in harm from recalled products. While this is the expected sign, the
coefficient is much larger compared to the standard error range on the coefficient when
the flow of imports is estimated. This may be due to difference in product mix from
bordering countries that could lead to more dangerous products such as heavier motorized
products that could have great potential for harm to consumers. The contig variable also
acts as a proxy for North American Free Trade Agreement (NAFTA) membership. The
expected effect of trading block membership would be positive as participation in free
trading blocs would be expected to increase the flow of trade as shown by Bergstrand
(1989) as well as Feenstra, Markusen, and Rose (2001). It would be expected for imports
to the U.S. and recalled products imported to the U.S. that the contiguous border as well
as inclusion in the trade bloc would lead to an increase in trade flow, but the data here
does support that relationship. This unexpected result would appear to highlight the
importance that the product mix being exported can have on the results.

22
The coefficient on quality of institutions is positive for all estimations as expected
and significant at the 5% level for the flow of consumer goods and the flow of recalled
goods. A one point increase in quality of institutions index corresponds to a 2.76 and
13.6 percent increase in U.S. imports and recalled value, respectively. This indicates that
all other things being equal, countries with better institutions export a relatively greater
amount of goods later recalled. This could also reflect that strong institutions result in
greater accountability. This is compatible with the findings of Berkowitz et al. (2006)
that increased quality of the exporter’s institutions result in the export of more complex
products.
The coefficient on Links was negative across all estimations, but was not found to
be significant at the 5% level in any estimation. The inclusion of the variable did not
affect other results with the exception of the case of the coefficient of quality of
institution for the flow of harm caused by recalled goods. Without including the Link
variable, the coefficient for Institutions is significant at the 5% level with a one point
index increase corresponding to a 6.07 percent increase in the flow of harm caused.
The hypothesis that the flow of recalled goods would conform to economic theory
as laid out in the Bergstrand-based gravity model is confirmed for the core variables of
exporter GDP and exporter GDP per capita. The results for the flow of recalled
consumer products match the predicted economic theory for the flow of consumer
products. However, this cannot be said for the variable of distance between trading
partners. The expected sign was negative, but the results do not support this with a
23
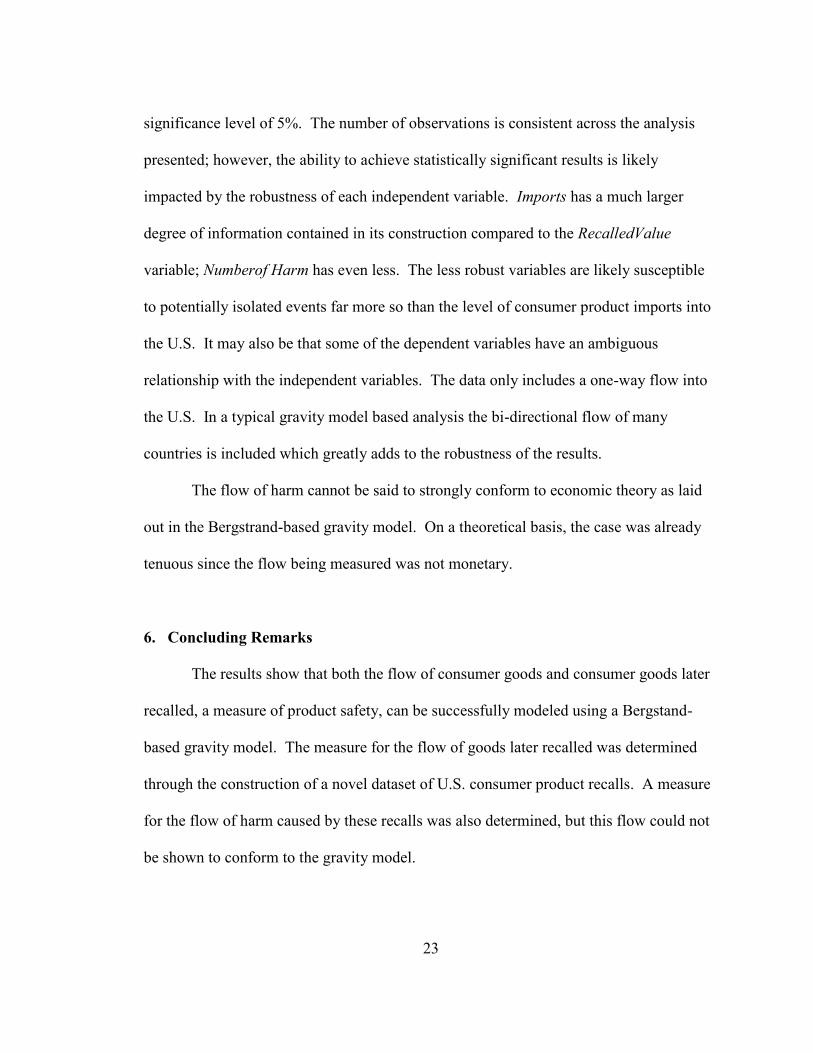
significance level of 5%. The number of observations is consistent across the analysis
presented; however, the ability to achieve statistically significant results is likely
impacted by the robustness of each independent variable. Imports has a much larger
degree of information contained in its construction compared to the RecalledValue
variable; Numberof Harm has even less. The less robust variables are likely susceptible
to potentially isolated events far more so than the level of consumer product imports into
the U.S. It may also be that some of the dependent variables have an ambiguous
relationship with the independent variables. The data only includes a one-way flow into
the U.S. In a typical gravity model based analysis the bi-directional flow of many
countries is included which greatly adds to the robustness of the results.
The flow of harm cannot be said to strongly conform to economic theory as laid
out in the Bergstrand-based gravity model. On a theoretical basis, the case was already
tenuous since the flow being measured was not monetary.
6. Concluding Remarks
The results show that both the flow of consumer goods and consumer goods later
recalled, a measure of product safety, can be successfully modeled using a Bergstand-
based gravity model. The measure for the flow of goods later recalled was determined
through the construction of a novel dataset of U.S. consumer product recalls. A measure
for the flow of harm caused by these recalls was also determined, but this flow could not
be shown to conform to the gravity model.
24
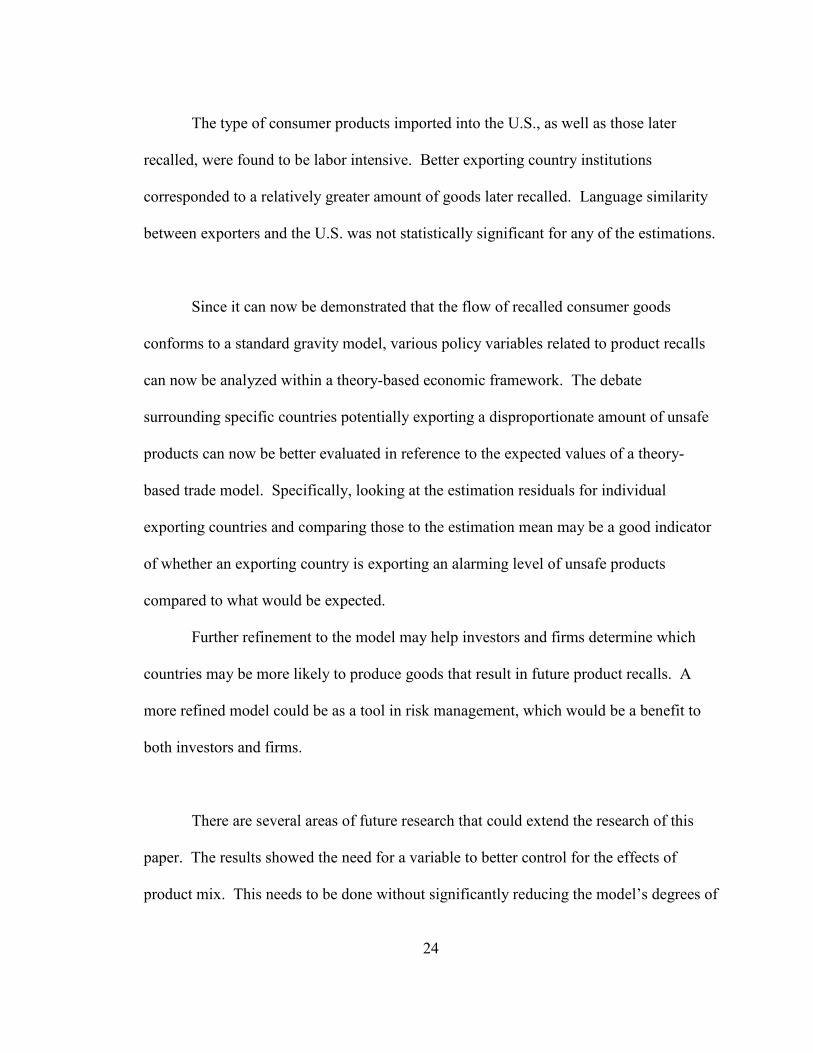
The type of consumer products imported into the U.S., as well as those later
recalled, were found to be labor intensive. Better exporting country institutions
corresponded to a relatively greater amount of goods later recalled. Language similarity
between exporters and the U.S. was not statistically significant for any of the estimations.
Since it can now be demonstrated that the flow of recalled consumer goods
conforms to a standard gravity model, various policy variables related to product recalls
can now be analyzed within a theory-based economic framework. The debate
surrounding specific countries potentially exporting a disproportionate amount of unsafe
products can now be better evaluated in reference to the expected values of a theory-
based trade model. Specifically, looking at the estimation residuals for individual
exporting countries and comparing those to the estimation mean may be a good indicator
of whether an exporting country is exporting an alarming level of unsafe products
compared to what would be expected.
Further refinement to the model may help investors and firms determine which
countries may be more likely to produce goods that result in future product recalls. A
more refined model could be as a tool in risk management, which would be a benefit to
both investors and firms.
There are several areas of future research that could extend the research of this
paper. The results showed the need for a variable to better control for the effects of
product mix. This needs to be done without significantly reducing the model’s degrees of

25
freedom. Using a few well-chosen product-type dummy variables or making separate
model estimations of the recall dataset disaggregated by similar product type may be
beneficial.
Construction of harm values would be improved by using monetary values such
as from liability court cases. If this type of data is unavailable, assigning a typical
monetary reward to the categories of injuries, permanent injuries, and deaths, may be an
improvement over treating them equally. The benefit of the liability court case results
would be that a specific level of damage is assigned based on the details of the case.
The addition of more years to the dataset should be beneficial. Potentially
increasing the number of years for the data pooling would increase the model’s predictive
ability. Additionally, comparing these results to the time frame after the Consumer
Product Safety Act of 2008 would be of interest in evaluating the impact of the changes
in consumer product regulation.
The same approached used in this paper could be extended to other product areas.
Pharmaceutical and food safety based recalls datasets may be available or readily
constructed. They would likely not suffer from the product mix problem that is faced
when using a category as broad as consumer products.

26
References
Anderson, James E. 1979. A Theoretical Foundation for the Gravity Equation. The
American Economic Review 69, no. 1 (March): 106-116.
Bamberger, Kenneth A., and Andrew T. Guzman. 2008. Keeping Imports Safe: A
Proposal for Discriminatory Regulation of international Trade. California Law
Review 96, no. 6 (December): 1405-1445.
Barber, Brad M., and Masako N. Darrough. 1996. Product Reliability and Firm Value:
The Experience of American and Japanese Automakers, 1973-1992. The Journal
of Political Economy 104, no. 5 (October): 1084-1099.
Bergstrand, Jeffrey H. 1985. The Gravity Equation in International Trade: Some
Microeconomic Foundations and Empirical Evidence. The Review of Economics
and Statistics 67, no. 3 (August): 474-481.
Bergstrand, Jeffrey H. 1989. The Generalized Gravity Equation, Monopolistic
Competition, and the Facto-Proportions Theory in International Trade. The
Review of Economics and Statistics 71, no. 1 (February): 143-153.
Berkowitz, Daniel, and Johannes Moenius, and Katharina Pistor. 2006. Trade, Law, and
Product Complexity. The Review of Economics and Statistics 88, no. 2 (May):
363–373.
Candelaria, Christopher, and Galina Hale. 2008. Did Large Recalls of Chinese Consumer
Goods Lower U.S. Imports from China? FRBSF Economic Letter, no. 17 (June
13).
Cortez, Elvira. 2007. Total Recall on Chinese Imports: Pursuing an End to Unsafe Health
and Safety Standards Through Article XX of GATT. American University
International Law Review 23 (5): 915-942.
Chu, Wujin, and Woosik Chu. 1994. Signaling Quality by Selling through a Reputable
Retailer: An Example of Renting the Reputation of Another. Marketing Science
13, no. 2 (Spring): 177-189.
Chu, Ting-Heng, Che-Chun Lin, and Larry J. Prather. 2005. An Extension of Security
Price Reactions around Product Recall Announcements. Quarterly Journal of
Business and Economics 44, no. 3/4 (Summer - Autumn): 33-48.
Davidson III, Wallace N., and Dan L. Worrell. 1992. The Effect of Product Recall
Announcements on Shareholder Wealth. Strategic Management Journal 13, no. 6.
(September): 467-473.

27
Dranove, David, and Chris Olsen. 1994. The Economic Side Effects of Dangerous Drug
Announcements. Journal of Law & Economics 37 (2): 323-348.
Echazu, Luciana. 2010. Manufacturer vs. supplier. Industrial Engineer (March): 16.
Faruq, Hasan A. 2010. Impact of Technology and Physical Capital on Export Quality.
The Journal of Developing Areas 44, no. 1 (Fall): 167-185.
Frankel, Jeffrey, Ernesto Stein, and Shang-jin Wei. 1993. Continental Trading Blocs: Are
they Natural, or Super-Natural? National Bureau of Economic Research, Working
Paper 4588 (December).
Freedman, Seth M., Melissa Schettini Kearney, and Mara Lederman. 2009. Product
Recalls, Imperfect Information, and Spillover Effects: Lessons from the
Consumer Response to the 2007 Toy Recalls. National Bureau of Economic
Research, Working Paper 15183 (July).
Feenstra, Robert C., James R. Markusen, and Andrew K. Rose. 2001. Using the Gravity
Equation to Differentiate among Alternative Theories of Trade. The Canadian
Journal of Economics / Revue canadienne d’Economique 34, no. 2 (May): 430-
447.
Hallak, Jaun Carlos. 2006. Product Quality and the Direction of Trade. Journal of
International Economics 68 (1): 238-265.
Hallak, Jaun Carlos, and Peter K. Schott. 2011. Estimating Cross-Country Differences in
Product Quality. The Quarterly Journal of Economics 126 (1): 417-474.
Haveman, Jon, and David Hummels. 2004. Alternative Hypothese and the Volume of
Trade: The Gravity Equation and the Extent of Specialization. The Canadian
Journal of Economics / Revue canadienne d’Economique 37, no. 1 (February):
199-218.
Hoffer, George E., Stephen W. Pruitt, and Robert J. Reilly. 1988. The Impact of Product
Recalls on the Wealth of Sellers: A Reexamination. The Journal of Political
Economy 96, no. 3. (June): 663-670.
Huang, Hao. 2008. Maximizing Chinese Imports’ Compliance with United States Safety
and Quality Standards: Carrot and Stick From Whom? Southern California
Interdisciplinary Law Journal 18, no. 1 (Fall): 131-160.
Jarrell, Gregg, and Sam Peltzman. 1985. The Impact of Product Recalls on the Wealth of
Sellers. The Journal of Political Economy 93, no. 3 (June): 512-536.

28
Kinsey, Jean. 1993. GATT and the Economics of Food Safety. Food Policy 18 (2): 163-
176.
Linders, Gert-Jan M., and Henri L.F de Groot. 2006. Estimation of the Gravity Equation
in the Presence of Zero Flow. Tinbergen Institute Discussion Paper, TI 2006-
072/3.
Mitchell, Lorraine. 2003. Economic Theory and Conceptual Relationships Between Food
Safety and International Trade. Agricultural Economic Report No 828,
International Trade and Food Safety: Economic Theory and Case Studies. Chapter
2 (November): 10-27.
Pruitt, Stephen W., and David R. Peterson. 1986. Security Price Reactions around
Product Recall Announcements. The Journal of Financial Research 9, no. 2
(Summer): 113-122.
Rauch, James E. 1999. Networks versus Markets in International Trade. Journal of
International Economics 48 (1): 7-35.
Reitzes, James D. 1992. Quality Choice, Trade Policy, and Firm Incentives.
International Economic Review 33, no. 4 (November): 816-835.
Riswadkar, A.V., and David Jewell. 2007. Strategies for Managing Risks from Imported
Products. Professional Safety (November): 44-47.
Summary, Rebecca M. 1989. A Political-Economic Model of U.S. Bilateral Trade. The
Review of Economics and Statistics 71, no. 1 (February): 179-182.
Tinbergen, Jan. 1962. Shaping the World Economy: Suggestions for an International
Economic Policy. New York: Twentieth Century Fund.
TNS Opinion & Social. 2006. Europeans and their Languages. Special Eurobarometer
243, Wave 64.3 (February).
110th
Congress H.R. 4040. 2008. Consumer Product Safety Improvement Act of 2008.
Public Law 110-314, August 14, 122 STAT. 301.
29
Table 1. – Expected Signs of Coefficient Estimates for Equation (3) for the Trade
Flows to the U.S. of Imports, Recalled Value, and Number of Cases of
Harm.
Variables
Abbreviation
Coefficient
lnImports
lnRecalled
Value
lnNumber
ofHarm
ln(GDP) lnGDP 1 + + +
ln(GDP/POP) lnGDPperCapita 2 - - -
ln(D ) lnDistance 5 - - -
Contiguous
Borders
Contig 6C + + +
Quality of
Institutions
Institutions 6I + + +
Cultural and
Linguistic
Links
Links 6L + + +

30
Table 2. – Description of the Variables Used to Estimate Equation (3)
Variable N Mean StdDev Median Min Max
lnGDP 92 25.5 1.66 25.6 22.4 29.1
lnGDPperCapita 92 9.01 1.37 9.02 6.12 11.5
lnDistance 95 8.97 0.531 9.06 7.05 9.65
Contig 95 0.0211 0.144 0 0 1
Institutions 89 3.10 0.923 3 0.875 5
Links 95 0.284 0.453 0 0 1
NOTES:
GDP: Units are 2012 USD, data from the World Bank
GDPperCapita: Units are 2012 USD, data from the World Bank
Distance: Units are kilometers, data from CEPII’s GeoDist No. 2011-25 database and the
weighted distance measure distwces is used. The distwces value is the distance between
countries’ largest cities weighted by geographic population distribution within each
country.
Contig: Units are binary with one indicating a shared border between two trading partners
and zero indicating no shared border. The data used corresponds to the contiguity data
listed in the CEPII’s GeoDist No. 2011-25 database.
Institutions: Units are a one to five index rating, with five indicating higher quality
institutions. The data is from the 2010 International Country Risk Guide and was
compiled using the methodology of Berkowitz, Moenius, and Pistor (2006).
Links: Units are binary with one indicating a shared language or colonial tie and zero
indicating the absence. The data was from the 2006 TNS Opinion & Social survey and a
50% threshold for shared simple conversational language was used to indicate a linkage
between two countries.
31
Table 3. – Estimates of Equation (3) for the Trade Flows to the U.S. of Imports,
Recalled Value, and Number of Cases of Harm.
Variables
lnImports
lnRecalledValue
lnNumberofHarm
lnGDP 1.15 **
(0.19)
8.38 **
(1.77)
3.74 **
(1.36)
lnGDPperCapita -1.69 **
(0.34)
-10.2 **
(2.8)
-3.10
(2.01)
lnDistance -1.71 *
(0.72)
-4.55
(6.59)
2.61
(3.19)
Contig -0.40
(3.13)
12.3
(17.3)
30.4 **
(8.7)
Institutions 2.76 **
(0.66)
13.6 *
(5.4)
7.03
(3.59)
Links -1.00
(0.80)
-0.98
(7.59)
-2.64
(5.47)
Intercept 12.4
(7.2)
-139
(68)
-144
(33)
R2
Adjusted R2
N
0.48
0.44
88
0.31
0.26
88
0.28
0.22
88
NOTES:
Heteroscedastic consistent standard errors are in parentheses.
** Significant at the 1% level * Significant at the 5% level
32
Appendix A. – Literature Review of Product Safety Law, Regulation, and Supply
Chain Management.
Often China is cited as being a problem just by the sheer number of recalls of products
manufactured there; a policy analysis of recalls by country of manufacturing that takes
into account the relative economic size of each country will help improve this area of
literature.
Cortez (2007) makes the case that a temporary ban on toy imports from China
would be permissible under international trade rules. It is argued that the temporary ban
would give the Chinese government the appropriate motivation to enter into strong
bilateral safety agreements with the U.S. and to set up credible enforcement mechanisms.
Huang (2008) gives a strong overview of Chinese product safety regulatory
systems, Chinese exporter behavior, the mechanics of the legal process involved in
settling disputes between Chinese exporters and U.S. importers, and the problems a firm
faces in winning and enforcing legal claims. Huang advocates both increased rewards for
meeting product specifications as well as increased penalties for failure to meet
specifications. One method of rewards that is suggested is in the form of increased
payment for meeting product specifications. Increased help from U.S. importers on
translation and explanation of applicable U.S. safety standards is also recommended. The
use of penalties would require increased government to government cooperation on
regulation and enforcement of claims. Short of this Huang advises U.S. importers to
require Chinese firms to obtain sufficient and reputable liability insurance.
Bamberger and Guzman (2008) review various methods of achieving product
safety. They argue that since it is difficult for U.S. regulators to monitor the production
processes of firms abroad and for a plaintiff in the U.S. to seek appropriate recourse, laws
should be enacted that would hold U.S. importing firms responsible for the actions of the
foreign firms. This is argued to be a better method of achieving product safety than
laboring to get governments to create good regulatory systems or through product
certification by third-party organizations. Under their proposal, U.S. importing firms
should face stronger penalties for safety violations compared to firms that produce
domestically. Bamberger and Guzman note that while the Food and Drug Administration
(FDA) conducts production level inspections abroad, the FDA is hindered by lack of
funds and the requirement that they must notify foreign producers before an inspection.
The Consumer Product Safety Commission (CPSC) lacks the authority to test products,
foreign or domestic, before they reach market. Self-regulation and third party regulation
as well as foreign government regulation were argued by Bamberger and Guzman to not
be the best way to obtain a situation where U.S. firms internalize the cost of unsafe
products produced abroad. They argue that while their plan sets up a discriminatory
regulation scheme, it is the current system that subjects firms manufacturing in the U.S.
to a higher regulatory standard that is really discriminatory. While a strong argument is
made that their proposal would be legal under international trade rules, it is unclear how
that would be viewed by the U.S. trading partners and what their response would be.
33
Echazu (2010) purposed a new method of writing contracts to ensure a firm’s
suppliers are accountable for supplying unsafe products. The contracts would specify
that the supplier would accept less money if a recall occurred due to the supplied product.
Also, the supplier would be required to hold risk insurance in the event of a future recall.
Since the supplier is liable they would have incentive to supply the product that is agreed
upon by the manufacturer. Insurance firms would be required to determine the risk for
these contracts.
Literature on food safety is comparatively well developed compared to that for
general consumer products. Specifically the in areas of trade, food safety regulation has a
special place in being used as a non-tariff barrier to trade. Kinsey (1993) provided an
overview of the economics of food safety in relation to international trade agreements.
Relative to food, consumer products do not have as many stringent regulations; although
recent strengthening of lead content in children’s products and the positioning of CPSC
personnel to U.S. ports of entry as front line inspectors may indicate that some consumer
products may be inching towards comparatively stringent regulation. In regards to the
various legal proposals to address unsafe food imports to the U.S., Mitchell (2003)
provides an overview of the economic consequences of trade conflict. While these are in
the area of food safety, they inform the discussion on potential new regulations affecting
the trade of consumer products. A major difference between food products and products
reviewed by the CPSC is that many food products are homogenous goods, while products
reviewed by the CPSC are generally all differentiated goods.

34
Appendix B. – Example of U.S. Consumer Product Safety Commission Recall Notice
U.S. Consumer Product Safety Commission Office of Information and Public Affairs Washington, DC 20207
FOR IMMEDIATE RELEASE
January 25, 2007
Release #07-090
Firm's Recall Hotline: (866) 723-0925 CPSC Recall Hotline: (800) 638-2772
CPSC Media Contact: (301) 504-7908
Sally Foster Inc. Recalls Tea Lights Candles for Fire Hazard WASHINGTON, D.C. - The U.S. Consumer Product Safety Commission, in cooperation with the firm named below, today announced a voluntary recall of the following consumer product. Consumers should stop using recalled products immediately unless otherwise instructed. It is illegal to resell or attempt to resell a recalled consumer product. Name of product: Tea Lights Sold with Votive Candle Holders Units: About 46,800 sets Retailer: Sally Foster, Inc., of Troy, Mich. Importer: Innovage Distribution, Inc., of Los Angeles, Calif. Hazard: The tea light candles have a clear, plastic shell that can melt or ignite, posing a fire or burn hazard to consumers. Incidents/Injuries: Sally Foster has received two reports of the plastic shells of these tea light candles igniting, causing minor property damage. No injuries have been reported. Description: The recalled tea lights were sold as part of the three-piece Glass Candle Holders with Tea Lights Set, item number S106 in the Sally Foster catalog and Web site. The product's packaging was marked "Votive Holders with Tealights-Set of 3" and "Item Number 2006 157." Only the white tea light candles with clear plastic shells are affected. Products delivered after December 8, 2006 included tea lights with metal shells and are not included in this recall. The glass candle holders sold with these tea lights are not subject to the recall and consumers may continue to use them. Sold through: Sally Foster's Web site from July 2006 through December 2006 and in Sally Foster catalogs from August 2006 through December 2006 for about $15. Manufactured in: China Remedy: Consumers should immediately stop using the tea light candles and contact Sally Foster for a set of six free replacement tea light candles with metal shells. Consumers who purchased the item online will be directly notified by Sally Foster and will receive the free set of six replacement tea light candles. Consumer Contact: Call Sally Foster toll-free at (866) 723-0925 between 8 a.m. and 11 p.m. ET Monday through Friday, and between 9 a.m. and 6 p.m. Saturday through Sunday, or visit the firm's Web site at www.sallyfoster.com Media Contact at Sally Foster: Tamara Oliverio, (248) 404-2142
NOTES:
Source: U.S. Consumer Product Safety, Release #07-090, http://www.cpsc.gov.

35
Appendix C. – Recall Data Set Select Statistics (2006 and 2007)
Descriptive Data Mean Missing Values
Months Sold Before Recall 19.8 1
Number of Units Recalled 149352 0
Number of Reports per Recall 24.5 -
Number of Foreign Reports per Recall 0.39 -
Number of Injuries per Recall 1.65 -
Number of Permanent Injuries per Recall 0.0528 -
Number of Deaths per Recall 0.0159 -
Number of Cases of Minor Damage per Recall 0.814 -
Number of Cases of Major Damage per Recall 0.0436 -
Cases of Harm per Recall 2.58 -
Recalled Unit Price (Mean) $607 27
Total Value of Recalled Products Per Recall $22,400,000 27
NOTES:
Source: Novel recall dataset constructed from U.S. Consumer Product Safety Recall Notices from
2006 to 2007, http://www.cpsc.gov.

36
Appendix D. – Mean 2006 and 2007 U.S. Import and Recalled Value by Country of
Manufacturing
Country
Imports into the U.S. ($)
Recalled Value ($)
Recalled Value Fraction
1 China 206,787,959,000 1,307,469,761 0.00632 2 Mexico 61,399,025,500 621,478,650 0.01012 3 Japan 27,030,013,500 1,006,512,708 0.03724 4 Malaysia 19,826,790,000 9,055,000 0.00046 5 Canada 17,514,557,000 291,631,025 0.01665 6 Taiwan 14,581,633,000 66,267,146 0.00454 7 South Korea 14,077,450,500 151,633,000 0.01077 8 Thailand 12,094,623,000 380,195,000 0.03144 9 Germany 9,616,127,000 42,000 0.0000
10 India 9,613,088,500 4,358,435 0.00045 11 Vietnam 8,714,375,500 1,354,760 0.00016 12 Italy 8,587,479,000 6,434,225 0.00075 13 Singapore 7,019,653,000 0 0 14 Indonesia 6,647,929,500 13,041,750 0.00196 15 Hong Kong 4,843,521,500 10,460,575 0.00216 16 United Kingdom 4,652,532,000 0 0 17 Philippines 3,975,476,000 1,402,500 0.00035 18 France 3,884,027,500 2,643,150 0.00068 19 Switzerland 3,718,444,000 14,815,000 0.00398 20 Pakistan 3,326,428,500 1,117,360 0.00034 21 Bangladesh 3,129,539,500 3,484,000 0.00111 22 Brazil 3,071,675,500 0 0 23 Honduras 2,605,665,000 969,000 0.00037 24 Cambodia 2,296,421,500 0 0 25 Israel 2,274,193,000 0 0 26 Dominican Republic 2,144,429,000 9,939,500 0.00464 27 Turkey 1,793,802,500 30,875 0.00002 28 Sri Lanka 1,724,494,000 0 0 29 Ireland 1,685,256,000 0 0 30 Sweden 1,651,113,000 225,001,850 0.13627 31 Guatemala 1,642,800,000 3,097,500 0.00189 32 El Salvador 1,488,915,500 0 0 33 Hungary 1,383,841,000 0 0 34 Spain 1,376,099,000 3,509,583 0.00255 35 Jordan 1,312,511,000 0 0 36 Macau 1,128,562,500 614,000 0.00054 37 Austria 995,075,000 67,201,500 0.06753 38 Netherlands 975,815,000 0 0 39 Belgium 950,733,500 11,800,000 0.01241 40 Peru 939,878,000 215,250 0.00023 41 Nicaragua 936,961,000 0 0 42 Denmark 855,391,500 1,006,000 0.00118 43 Egypt 839,331,000 28,200 0.00003 44 Colombia 692,911,500 0 0 45 Costa Rica 646,862,500 0 0 46 Czech Republic 576,834,000 0 0 47 Australia 574,422,500 0 0 48 Portugal 565,429,000 1,395,000 0.00247 49 Poland 534,462,000 2,470,000 0.00462 50 Norway 498,082,500 770,000 0.00155

37
51 Haiti 455,353,000 0 0 52 Finland 424,293,000 2,121,600 0.005 53 Romania 315,917,500 812,500 0.00257 54 SouthAfrica 248,845,500 20,430,000 0.0821 55 New Zealand 230,573,000 1,054,105 0.00457 56 United Arab Emirates 229,994,000 0 0 57 Slovakia 188,606,000 0 0 58 Slovenia 163,578,000 0 0 59 Greece 129,045,500 2,750 0.00002 60 Bulgaria 126,214,500 812,500 0.00644 61 Argentina 123,021,000 0 0 62 Tunisia 121,326,500 0 0 63 Morocco 121,013,500 0 0 64 Bahrain 118,732,500 0 0 65 Brunei 114,573,000 0 0 66 Russia 93,132,500 0 0 67 Oman 84,123,500 0 0 68 Chile 74,661,500 0 0 69 Ukraine 53,282,500 0 0 70 Ecuador 50,650,500 0 0 71 Estonia 50,357,000 266,000 0.00528 72 Jamaica 44,522,000 0 0 73 Venezuela 32,943,000 0 0 74 Lithuania 30,681,000 0 0 75 Saudi Arabia 27,717,500 0 0 76 Luxembourg 25,377,000 0 0 77 Belarus 22,822,000 0 0 78 Uruguay 17,045,000 0 0 79 Netherlands Antilles 10,794,000 0 0 80 Kazakhstan 9,667,000 0 0 81 Trinidad and Tobago 8,328,500 0 0 82 Bahamas 2,527,500 0 0 83 Kuwait 1,739,000 0 0 84 Ivory Coast 1,136,000 0 0 85 Nigeria 862,500 0 0 86 Azerbaijan 466,000 0 0 87 Iraq 429,500 0 0 88 Aruba 367,500 0 0 89 Gabon 270,500 0 0 90 Angola 268,000 0 0 91 Equatorial Guinea 194,000 0 0 92 Algeria 81,500 0 0 93 Chad 50,000 0 0 94 Congo 49,500 0 0 95 Libya 5,500 0 0
NOTES:
Source 1: Novel recall dataset constructed from 2006 and 2007 U.S. Consumer Product Safety
Recall Notices, http://www.cpsc.gov.
Source 2: Novel U.S. import dataset constructed from 2006 and 2007 U.S. Census Bureau data,
http://censtats.census.gov/naic3_6/naics3_6.shtml.
38
Appendix E. – Occurrence of Responsible Party Listing in the CPSC
Recall Notices (2006 and 2007)
Responsible Party
Occurrence (%)
Manufacturer 47.8%
Importer/Distributor 62.0%
Retailer 4.6%
NOTES:
Multiple types of responsible parties can be listed in a given recall notice
which makes the sum of each type of listing over 100%.
Source: Novel recall dataset constructed from 2006 and 2007 U.S. Consumer Product Safety
Recall Notices, http://www.cpsc.gov.
39
Appendix F. – Occurrence of Recall Resolution in the CPSC Recall Notices (2006
and 2007)
Recall Resolution Occurrence (%)
Refund 39.8%
Replacement 19.3%
Free Repair 17.7%
Free hardware 13.1%
Voucher 4.6%
Modification by Consumer 1.9%
Discard 1.3%
Extra Instructions 1.2%
Other Remedies 0.5%
NOTES:
Multiple types of recall resolutions can be listed in a given recall notice which makes the sum of
each type of listing over 100%.
Source: Novel recall dataset constructed from 2006 and 2007 U.S. Consumer Product Safety
Recall Notices, http://www.cpsc.gov.

40
Appendix G. – General Categories of Recalls in the CPSC Recall Notices From 2006
and 2007
Nature of Recall Occurrence (%)
Danger to Children 37.0%
Danger due to Lead 17.0%
Danger due to Magnets 1.9%
Power Tool Product 5.9%
Sports and Recreation Product 16.8%
Electronics Product 6.7%
Appliance Product 11.2%
Counterfeit Product 0.8%
NOTES:
Multiple types, or no types, of classification were possible for a given recall notice.
Source: Novel recall dataset constructed from 2006 and 2007 U.S. Consumer Product Safety
Recall Notices, http://www.cpsc.gov.

41
Appendix H. – U.S. Import Dataset Product Code Inclusion Details
NAICS
Product code
Meaning of Products and services code Import
Data
Reason
311 Food Manufacturing no FDA
312 Beverage and Tobacco Product Manufacturing no FDA/ATF
3131 Fiber, Yarn, and Thread Mills no Non-Consumer
313210 Broadwoven fabric mills yes Blankets and
Bedspreads 313221 Narrow fabric mills no Non-Consumer
313222 Schiffli machine embroidery no Non-Consumer
313230 Nonwoven fabric mills no Non-Consumer
313241 Weft knit fabric mills no** Non-Consumer
313249 Other knit fabric and lace mills yes Bedspreads and
Tablecloths 3133 Textile and Fabric Finishing and Fabric Coating Mills no Non-Consumer
314110 Carpet and rug mills yes
314121 Curtain and drapery mills yes
314129 Other household textile product mills yes Home
Furnishings 314911 Textile bag mills yes Consumer Bags
314912 Canvas and related product mills yes Tents and Sails
314991 Rope, cordage, and twine mills no Non-Consumer
314992 Tire cord and tire fabric mills no Non-Consumer
314999 All other miscellaneous textile product mills yes
31511X Hosiery and Socks yes *
315111 Sheer hosiery mills yes
315119 Other hosiery and sock mills yes
315191 Outerwear knitting mills no**
315192 Underwear and nightwear knitting mills no**
315211 Men's cut and sew apparel contractors no**
315212 Women's cut and sew apparel contractors no**
315221 Men's underwear and nightwear manufacturing yes
315222 Men's suit, coat, and overcoat manufacturing yes
315223 Men's shirt, except work shirt, manufacturing yes
315224 Men's pants, except work pants, manufacturing yes
315225 Men's work clothing manufacturing no**
315228 Other men's outerwear manufacturing yes
315229 All other cut and sew apparel manufacturing no**
315231 Women's lingerie and nightwear mfg yes
315232 Women's blouse and shirt manufacturing yes
315233 Women's dress manufacturing yes
315234 Women's suit, tailored jacket, and skirt mfg. yes
315239 Other women's outerwear manufacturing yes
315291 Infants' cut and sew apparel manufacturing yes
315292 Fur and leather apparel manufacturing yes
315299 All other cut and sew apparel manufacturing yes
315991 Hat, cap, and millinery manufacturing yes
315992 Glove and mitten manufacturing yes
315993 Men's and boys' neckwear manufacturing yes
315999 All other accessory and apparel manufacturing yes
316110 Leather and hide tanning and finishing no Non-Consumer
42
316211 Rubber and plastics footwear manufacturing yes
316212 House slipper manufacturing yes
316213 Men's nonathletic footwear manufacturing yes
316214 Women's nonathletic footwear manufacturing yes
316219 Other footwear manufacturing yes
316991 Luggage manufacturing yes
316992 Women's handbag and purse manufacturing yes
316993 Other personal leather good manufacturing yes
316999 All other leather good manufacturing yes
321 Wood Product Manufacturing no Non-Consumer
322 Paper Manufacturing no Non-Consumer
323 Printing and Related Support Activities no Non-Consumer
324 Petroleum and Coal Products Manufacturing no Non-Consumer
325 Chemical Manufacturing no Non-Consumer
326 Plastics and Rubber Products Manufacturing no Non-Consumer
327111 Vitreous china plumbing fixture manufacturing yes
327112 Vitreous china and earthenware articles mfg. yes
327113 Porcelain electrical supply manufacturing yes
327121 Brick and structural clay tile manufacturing no Non-Consumer
327122 Ceramic wall and floor tile manufacturing no Non-Consumer
327123 Other structural clay product manufacturing no Non-Consumer
327124 Clay refractory manufacturing no Non-Consumer
327125 Nonclay refractory manufacturing no Non-Consumer
327211 Flat glass manufacturing no Non-Consumer
327212 Other pressed and blown glass and glassware yes
327213 Glass container manufacturing yes
327215 Glass product mfg. made of purchased glass yes
3273 Cement and Concrete Product Manufacturing no Non-Consumer
3274 Lime and Gypsum Product Manufacturing no Non-Consumer
3279 Other Nonmetallic Mineral Product Manufacturing no Non-Consumer
331 Primary Metal Manufacturing no Non-Consumer
3321 Forging and Stamping no Non-Consumer
332211 Cutlery and flatware, except precious, mfg. yes
332212 Hand and edge tool manufacturing yes
332213 Saw blade and handsaw manufacturing yes
332214 Kitchen utensil, pot, and pan manufacturing yes
3323 Architectural and Structural Metals Manufacturing no Non-Consumer
332410 Power boiler and heat exchanger manufacturing yes
332420 Metal tank, heavy gauge, manufacturing no Non-Consumer
332431 Metal can manufacturing no Non-Consumer
332439 Other metal container manufacturing no Non-Consumer
3325 Hardware Manufacturing no Non-Consumer
3326 Spring and Wire Product Manufacturing no Non-Consumer
3327 Machine Shops; Turned Product; and Screw, Nut, and Bolt
Manufacturing
no Non-Consumer
3328 Coating, Engraving, Heat Treating, and Allied Activities no Non-Consumer
332911 Industrial valve manufacturing no Non-Consumer
332912 Fluid power valve and hose fitting mfg. yes
332913 Plumbing fixture fitting and trim mfg. yes
332919 Other metal valve and pipe fitting mfg. yes
332991 Ball and roller bearing manufacturing no Non-Consumer
332992 Small arms ammunition manufacturing no Non-Consumer
332993 Ammunition, except small arms, manufacturing no ATF
332994 Small arms manufacturing no ATF

43
332995 Other ordnance and accessories manufacturing no ATF
332996 Fabricated pipe and pipe fitting mfg. no Non-Consumer
332997 Industrial pattern manufacturing no Non-Consumer
332998 Enameled iron and metal sanitary ware mfg. yes Bathtubs and
Sinks 332999 Miscellaneous fabricated metal product mfg. no Non-Consumer
333111 Farm machinery and equipment manufacturing no Non-Consumer
333112 Lawn and garden equipment manufacturing no**
333120 Construction machinery manufacturing no Non-Consumer
333131 Mining machinery and equipment manufacturing no Non-Consumer
333132 Oil and gas field machinery and equipment no Non-Consumer
3332 Industrial Machinery Manufacturing no Non-Consumer
3333 Commercial and Service Industry Machinery Manufacturing no Non-Consumer
333411 Air purification equipment manufacturing yes
333412 Industrial and commercial fan and blower mfg. no Non-Consumer
333414 Heating equipment (except warm air furnaces) manufacturing yes
333415 AC, refrigeration, and forced air heating yes
3335 Metalworking Machinery Manufacturing no Non-Consumer
3336 Engine, Turbine, and Power Transmission Equipment
Manufacturing
no Non-Consumer
333911 Pump and pumping equipment manufacturing yes
333912 Air and gas compressor manufacturing yes
333913 Measuring and dispensing pump manufacturing no Non-Consumer
333921 Elevator and moving stairway manufacturing no Non-Consumer
333922 Conveyor and conveying equipment mfg. no Non-Consumer
333923 Overhead cranes, hoists, and monorail systems no Non-Consumer
333924 Industrial truck, trailer, and stacker mfg. no Non-Consumer
333991 Power-driven handtool manufacturing yes Small Power
Tools 333992 Welding and soldering equipment manufacturing no Non-Consumer
333993 Packaging machinery manufacturing no Non-Consumer
333994 Industrial process furnace and oven mfg. no Non-Consumer
333995 Fluid power cylinder and actuator mfg. no Non-Consumer
333996 Fluid power pump and motor manufacturing no Non-Consumer
333997 Scale and balance, except laboratory, mfg. no Non-Consumer
333999 Miscellaneous general purpose machinery mfg. no Non-Consumer
334111 Electronic computer manufacturing yes
334112 Computer storage device manufacturing yes
334113 Computer terminal manufacturing no**
334119 Other computer peripheral equipment mfg. yes
334210 Telephone apparatus manufacturing yes
334220 Broadcast and wireless communications equip. yes
334290 Other communications equipment manufacturing yes
334310 Audio and video equipment manufacturing yes
334411 Electron tube manufacturing no Non-Consumer
334412 Bare printed circuit board manufacturing no Non-Consumer
334413 Semiconductors and related device mfg. no Non-Consumer
334414 Electronic capacitor manufacturing no Non-Consumer
334415 Electronic resistor manufacturing no Non-Consumer
334416 Electronic coils, transformers, and inductors no Non-Consumer
334417 Electronic connector manufacturing yes Extension
Cords and
Powerstrips
334418 Printed circuit assembly manufacturing no Non-Consumer
334419 Other electronic component manufacturing no Non-Consumer
334510 Electromedical apparatus manufacturing no Non-Consumer
334511 Search, detection, and navigation instruments no Non-Consumer
334512 Automatic environmental control manufacturing yes Thermostats

44
334513 Industrial process variable instruments no Non-Consumer
334514 Totalizing fluid meters and counting devices no Non-Consumer
334515 Electricity and signal testing instruments yes Home and
Auto-Repair
Measurement
334516 Analytical laboratory instrument mfg. no Non-Consumer
334517 Irradiation apparatus manufacturing no Non-Consumer
334518 Watch, clock, and part manufacturing yes
334519 Other measuring and controlling device mfg. yes
334611 Software reproducing no**
334612 Audio and video media reproduction yes
334613 Magnetic and optical recording media mfg. yes
335110 Electric lamp bulb and part manufacturing yes
335121 Residential electric lighting fixture mfg. yes
335122 Nonresidential electric lighting fixture mfg. no Non-Consumer
335129 Other lighting equipment manufacturing yes
335211 Electric housewares and household fan mfg. yes
335212 Household vacuum cleaner manufacturing yes
335221 Household cooking appliance manufacturing yes
335222 Household refrigerator and home freezer mfg. yes
335224 Household laundry equipment manufacturing yes
335228 Other major household appliance manufacturing yes
335311 Electric power and specialty transformer mfg. yes
335312 Motor and generator manufacturing yes
335313 Switchgear and switchboard apparatus mfg. yes
335314 Relay and industrial control manufacturing no Non-Consumer
335911 Storage battery manufacturing yes
335912 Primary battery manufacturing yes
335921 Fiber optic cable manufacturing no Non-Consumer
335929 Other communication and energy wire mfg. no Non-Consumer
335931 Current-carrying wiring device manufacturing yes
335932 Noncurrent-carrying wiring device mfg. yes
335991 Carbon and graphite product manufacturing no Non-Consumer
335999 Miscellaneous electrical equipment mfg. yes
3361 Motor Vehicle Manufacturing no NHTSA
3362 Motor Vehicle Body and Trailer Manufacturing no NHTSA
3363 Motor Vehicle Parts Manufacturing no NHTSA
3364 Aerospace Product and Parts Manufacturing no Non-Consumer
3365 Railroad Rolling Stock Manufacturing no Non-Consumer
3366 Ship and Boat Building no USCG
336991 Motorcycle, bicycle, and parts manufacturing yes
336992 Military armored vehicles and tank parts mfg. no Non-Consumer
336999 All other transportation equipment mfg. no**
337110 Wood kitchen cabinet and countertop mfg. yes
337121 Upholstered household furniture manufacturing yes
337122 Nonupholstered wood household furniture mfg. no**
337124 Metal household furniture manufacturing yes
337125 Household furniture, exc. wood or metal, mfg. no**
337127 Institutional furniture manufacturing no Non-Consumer
337129 Wood TV, radio, and sewing machine housings yes
337211 Wood office furniture manufacturing yes
337212 Custom architectural woodwork and millwork no**
337214 Office furniture, except wood, manufacturing yes
337215 Showcases, partitions, shelving, and lockers yes
337910 Mattress manufacturing yes
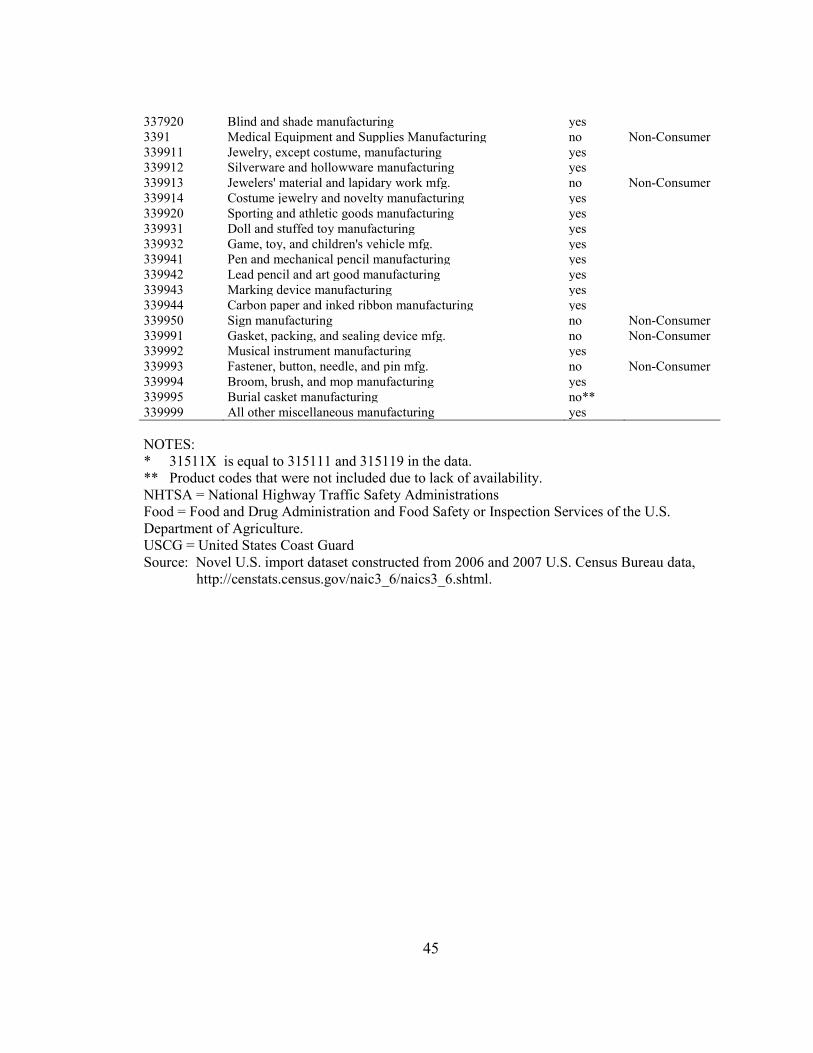
45
337920 Blind and shade manufacturing yes
3391 Medical Equipment and Supplies Manufacturing no Non-Consumer
339911 Jewelry, except costume, manufacturing yes
339912 Silverware and hollowware manufacturing yes
339913 Jewelers' material and lapidary work mfg. no Non-Consumer
339914 Costume jewelry and novelty manufacturing yes
339920 Sporting and athletic goods manufacturing yes
339931 Doll and stuffed toy manufacturing yes
339932 Game, toy, and children's vehicle mfg. yes
339941 Pen and mechanical pencil manufacturing yes
339942 Lead pencil and art good manufacturing yes
339943 Marking device manufacturing yes
339944 Carbon paper and inked ribbon manufacturing yes
339950 Sign manufacturing no Non-Consumer
339991 Gasket, packing, and sealing device mfg. no Non-Consumer
339992 Musical instrument manufacturing yes
339993 Fastener, button, needle, and pin mfg. no Non-Consumer
339994 Broom, brush, and mop manufacturing yes
339995 Burial casket manufacturing no**
339999 All other miscellaneous manufacturing yes
NOTES:
* 31511X is equal to 315111 and 315119 in the data.
** Product codes that were not included due to lack of availability.
NHTSA = National Highway Traffic Safety Administrations
Food = Food and Drug Administration and Food Safety or Inspection Services of the U.S.
Department of Agriculture.
USCG = United States Coast Guard
Source: Novel U.S. import dataset constructed from 2006 and 2007 U.S. Census Bureau data,
http://censtats.census.gov/naic3_6/naics3_6.shtml.
Related Documents