JF ARVIS INTERNATIONAL TRADE DEPARTMENT TRADE FACILITATION/LOGISTICS PERFORMANCE INDICATORS

Welcome message from author
This document is posted to help you gain knowledge. Please leave a comment to let me know what you think about it! Share it to your friends and learn new things together.
Transcript
JF ARVIS
INTERNATIONAL TRADE DEPARTMENT
TRADE FACILITATION/LOGISTICS
PERFORMANCE INDICATORS
Agenda
What to measure: Categories of indicators
Why we need indicators
Comprehensive cross-country TFL
indicators: LPI, DB.
Measuring logistics costs?
Gateway corridor monitoring.
Before the border and connectivity.

What to measure?
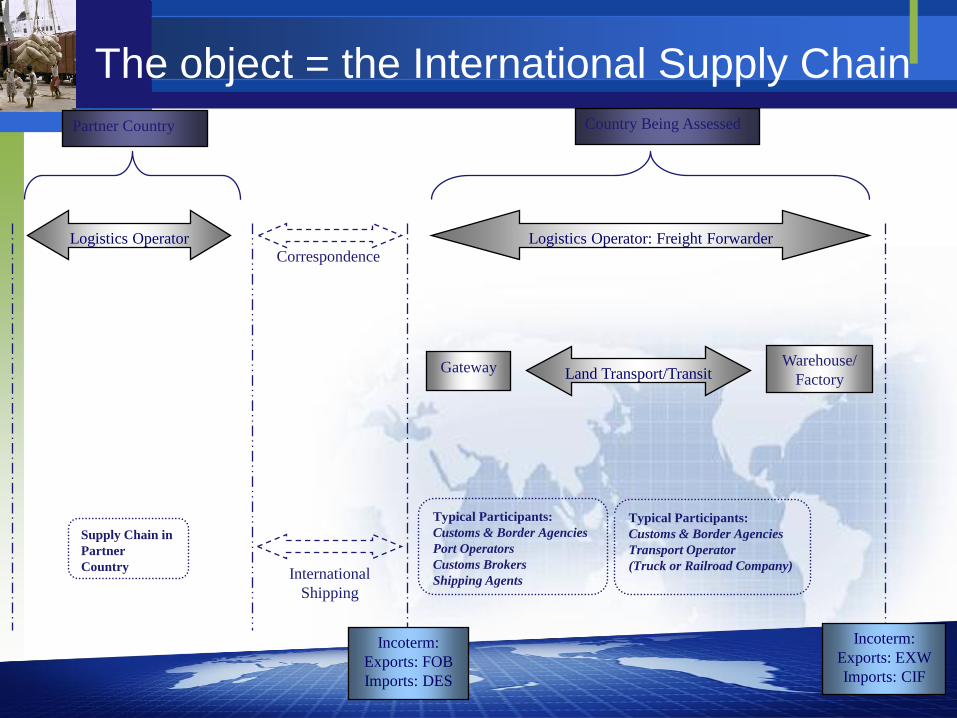
The object = the International Supply Chain
Partner Country Country Being Assessed
Typical Participants:
Customs & Border Agencies
Port Operators
Customs Brokers
Shipping Agents
Supply Chain in
Partner
Country
Typical Participants:
Customs & Border Agencies
Transport Operator
(Truck or Railroad Company)
Gateway Warehouse/
Factory
Logistics Operator: Freight ForwarderLogistics Operator
International
Shipping
Correspondence
Land Transport/Transit
Incoterm:
Exports: EXW
Imports: CIF
Incoterm:
Exports: FOB
Imports: DES
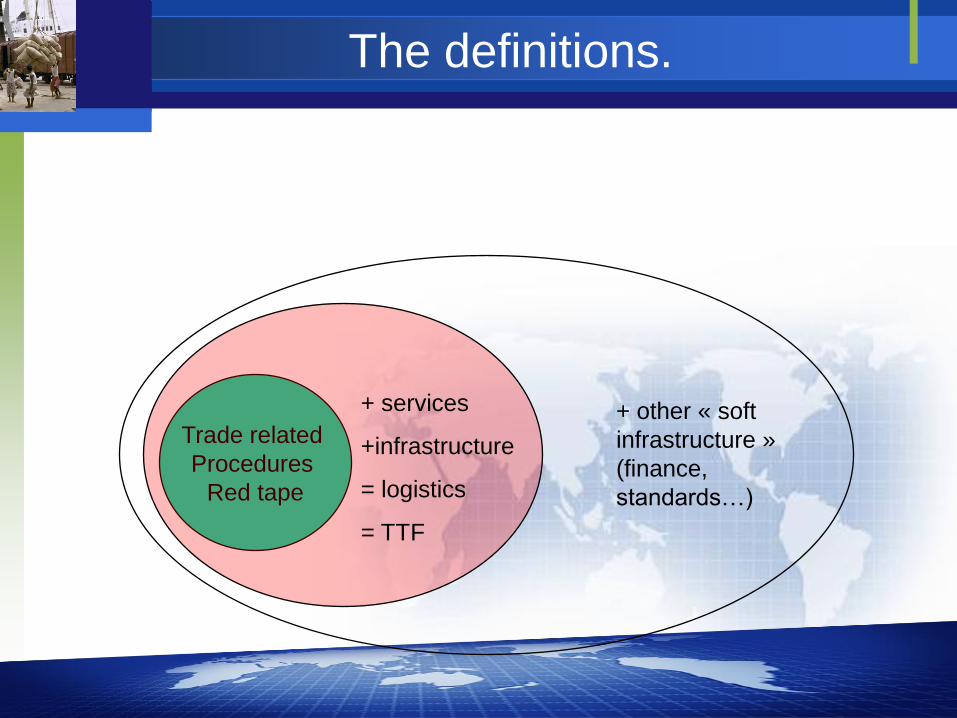
The definitions.
Trade related
Procedures
Red tape
+ services
+infrastructure
= logistics
= TTF
+ other « soft
infrastructure »
(finance,
standards…)
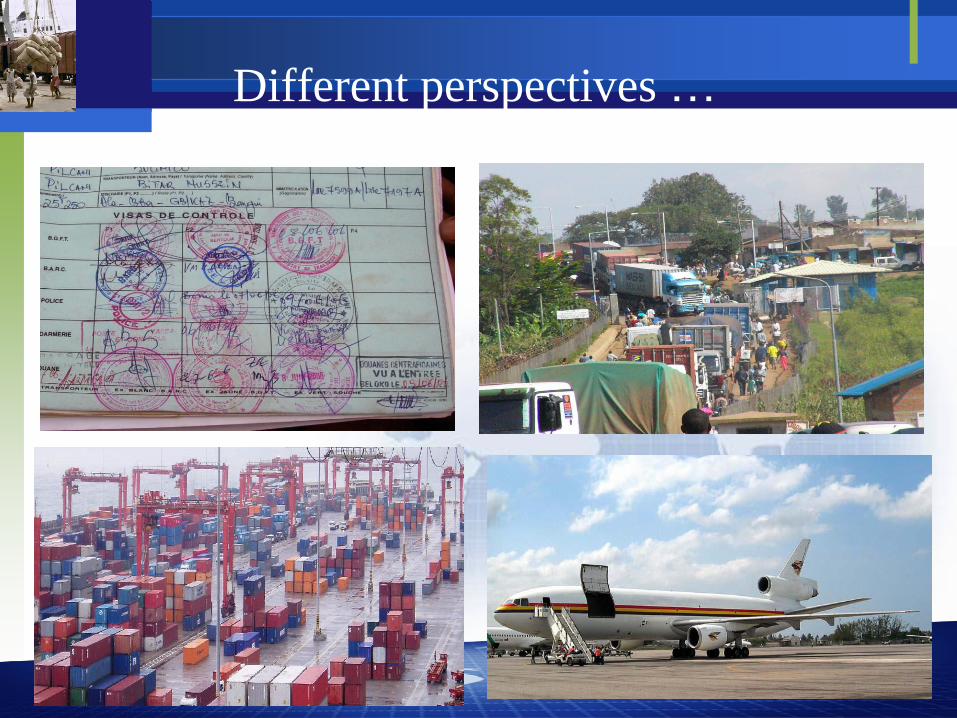
Different perspectives …
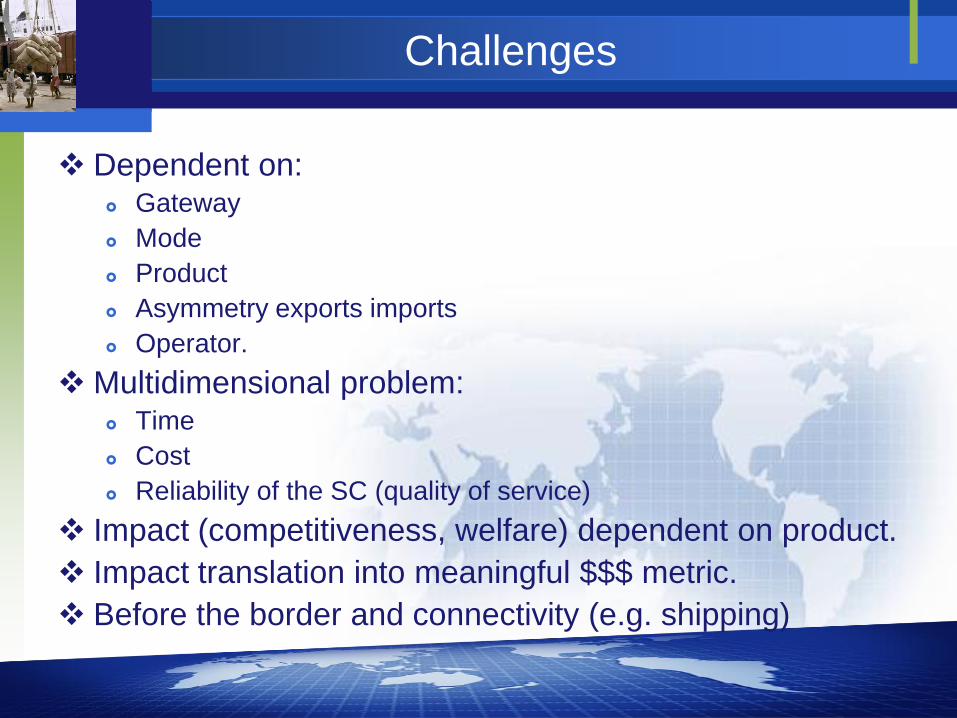
Challenges
Dependent on: Gateway
Mode
Product
Asymmetry exports imports
Operator.
Multidimensional problem: Time
Cost
Reliability of the SC (quality of service)
Impact (competitiveness, welfare) dependent on product.
Impact translation into meaningful $$$ metric.
Before the border and connectivity (e.g. shipping)
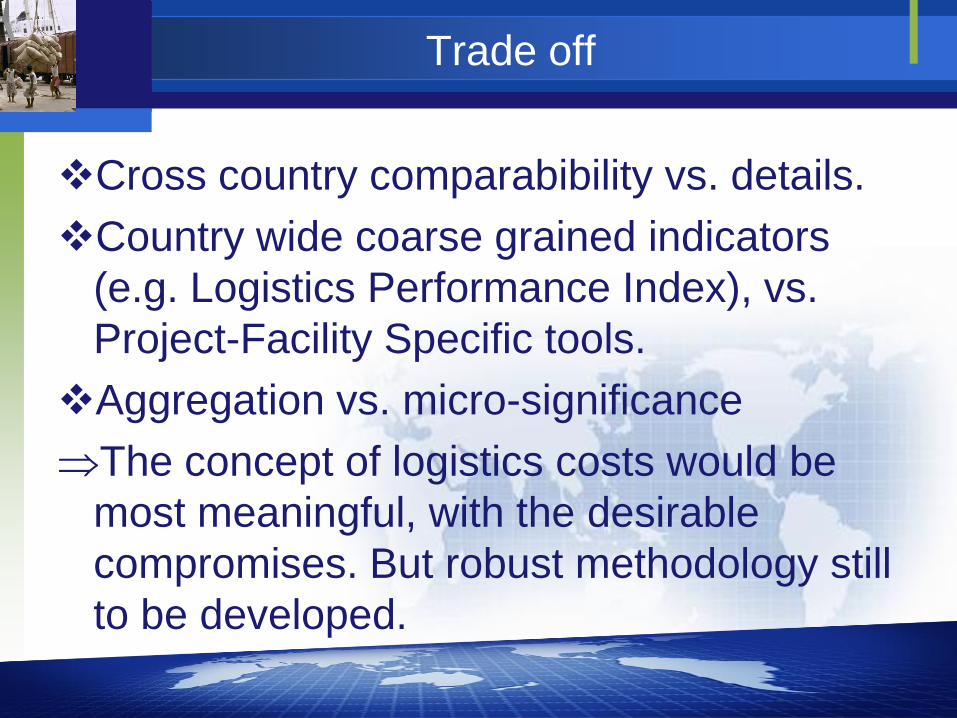
Trade off
Cross country comparabibility vs. details.
Country wide coarse grained indicators
(e.g. Logistics Performance Index), vs.
Project-Facility Specific tools.
Aggregation vs. micro-significance
The concept of logistics costs would be
most meaningful, with the desirable
compromises. But robust methodology still
to be developed.

Trade off (2)
=>All depends on the use
Research is least demanding and can use coarse grained indicators irrespective of scale.
Awareness raising, high level policy dialogue, requires synthetic tools with cross-country comparability(e.g. LPI)
Implementation needs very specific tools with lot of details and time series for monitoring impact.

Broad category
Comprehensive coarse grained indicators
(LPI), available
Aggregated logistics costs. (concept)
Ad hoc TFL monitoring indicators. Better
methodologies being available
Before the border and connectivity (air and
sea).
Why we need indicators
What the Bank does in this area
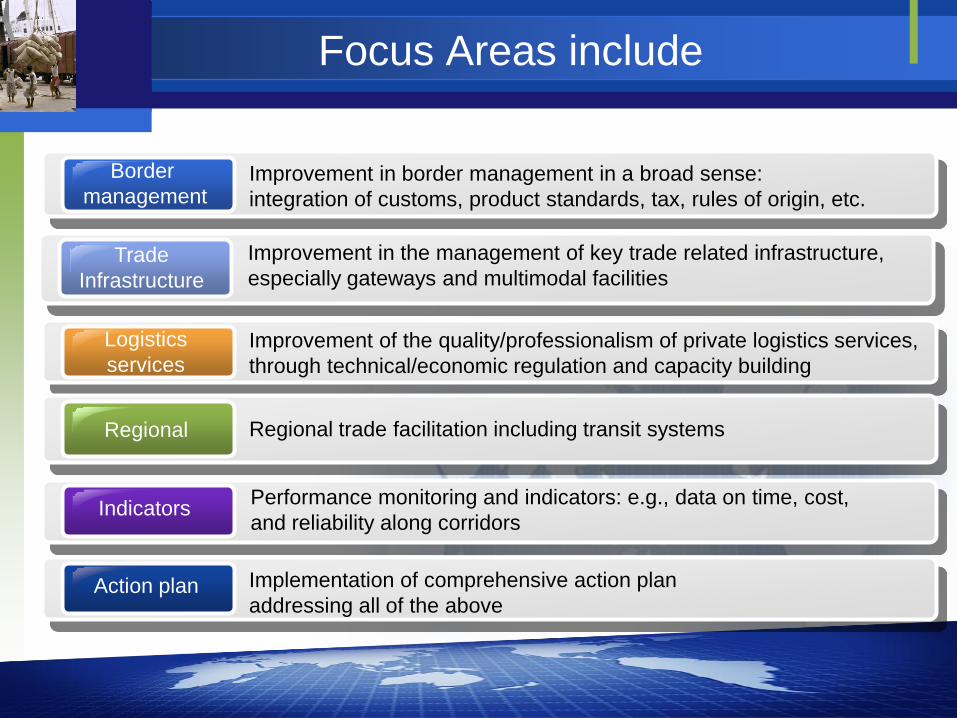
Focus Areas include
Border
managementImprovement in border management in a broad sense:
integration of customs, product standards, tax, rules of origin, etc.
Trade
Infrastructure
Improvement in the management of key trade related infrastructure,
especially gateways and multimodal facilities
Logistics
servicesImprovement of the quality/professionalism of private logistics services,
through technical/economic regulation and capacity building
Regional Regional trade facilitation including transit systems
IndicatorsPerformance monitoring and indicators: e.g., data on time, cost,
and reliability along corridors
Action plan Implementation of comprehensive action plan
addressing all of the above
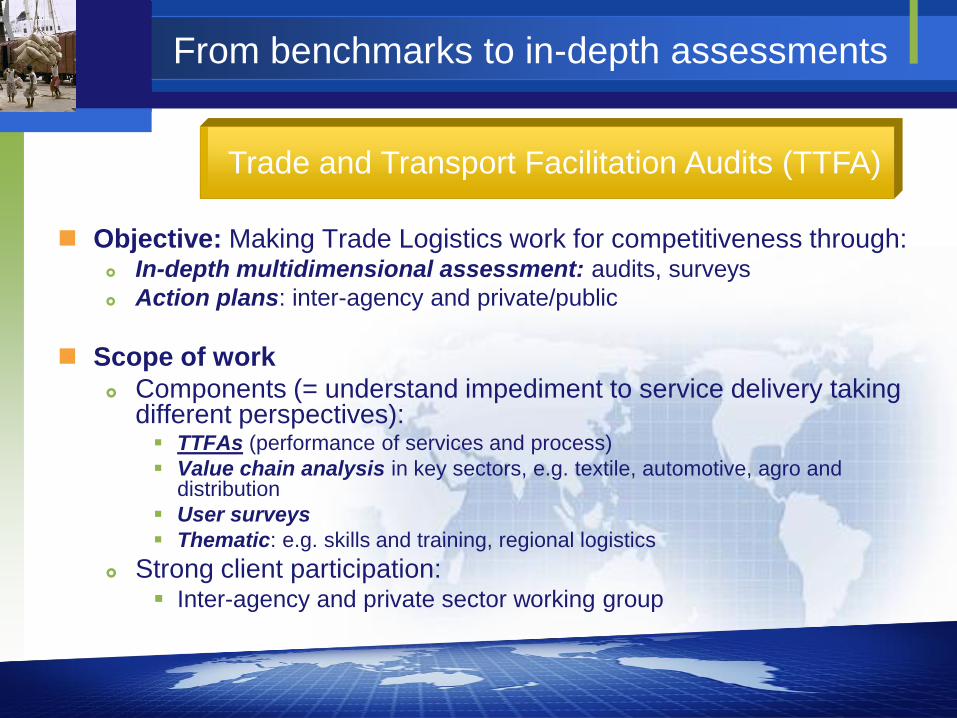
Objective: Making Trade Logistics work for competitiveness through: In-depth multidimensional assessment: audits, surveys
Action plans: inter-agency and private/public
Scope of work
Components (= understand impediment to service delivery taking different perspectives): TTFAs (performance of services and process)
Value chain analysis in key sectors, e.g. textile, automotive, agro and distribution
User surveys
Thematic: e.g. skills and training, regional logistics
Strong client participation: Inter-agency and private sector working group
From benchmarks to in-depth assessments
Trade and Transport Facilitation Audits (TTFA)
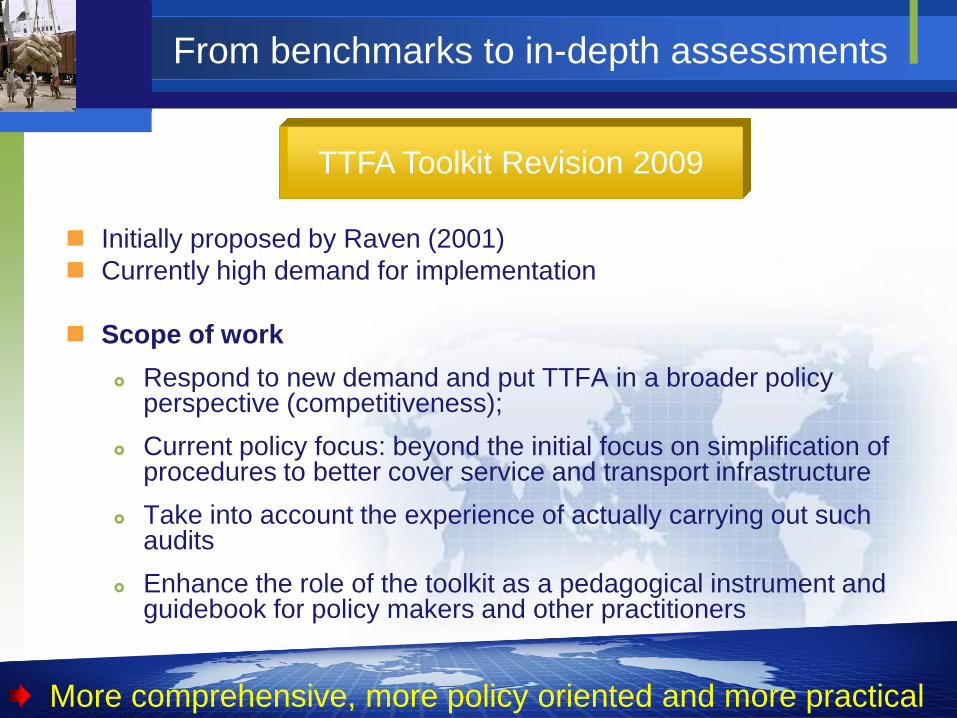
Initially proposed by Raven (2001)
Currently high demand for implementation
Scope of work
Respond to new demand and put TTFA in a broader policy perspective (competitiveness);
Current policy focus: beyond the initial focus on simplification of procedures to better cover service and transport infrastructure
Take into account the experience of actually carrying out such audits
Enhance the role of the toolkit as a pedagogical instrument and guidebook for policy makers and other practitioners
From benchmarks to in-depth assessments
TTFA Toolkit Revision 2009
More comprehensive, more policy oriented and more practical
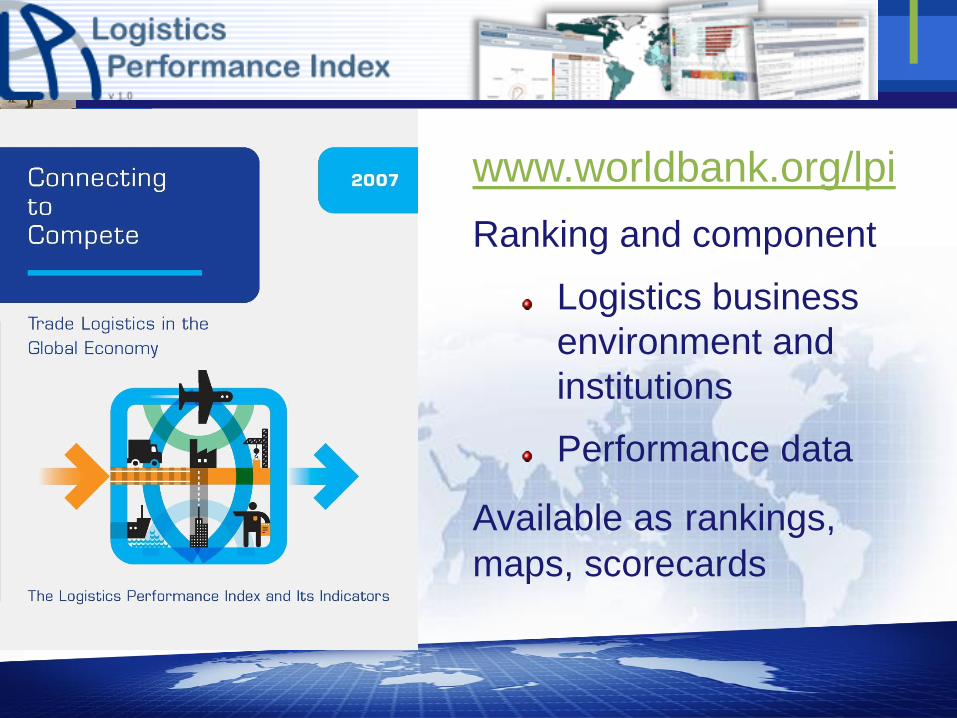
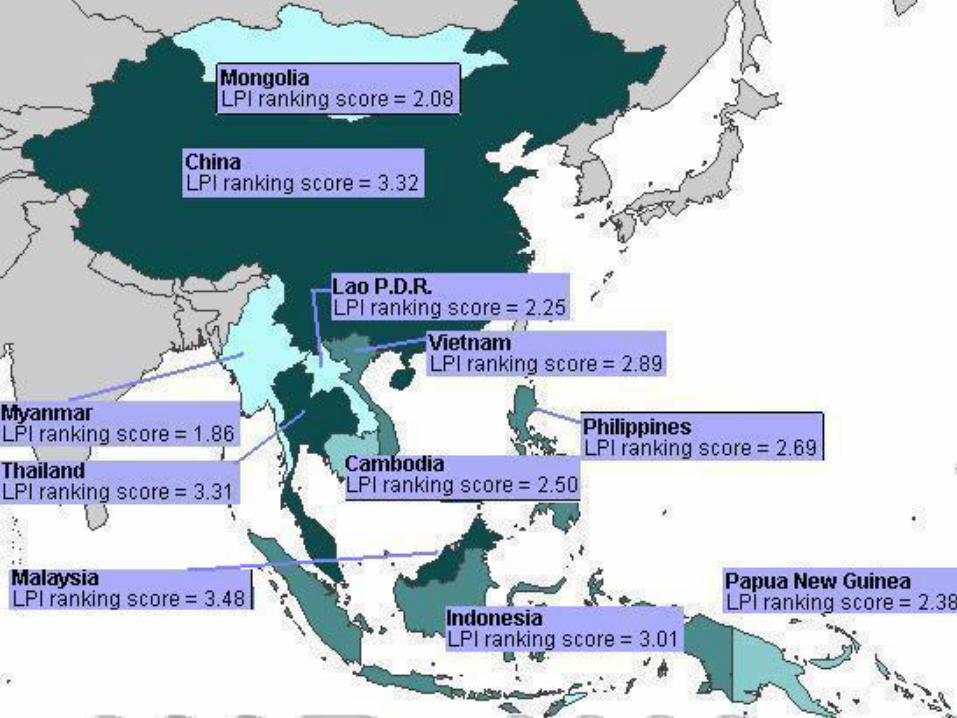
www.worldbank.org/lpi
Ranking and component
Logistics business
environment and
institutions
Performance data
Available as rankings,
maps, scorecards
Comprehensive Indicators
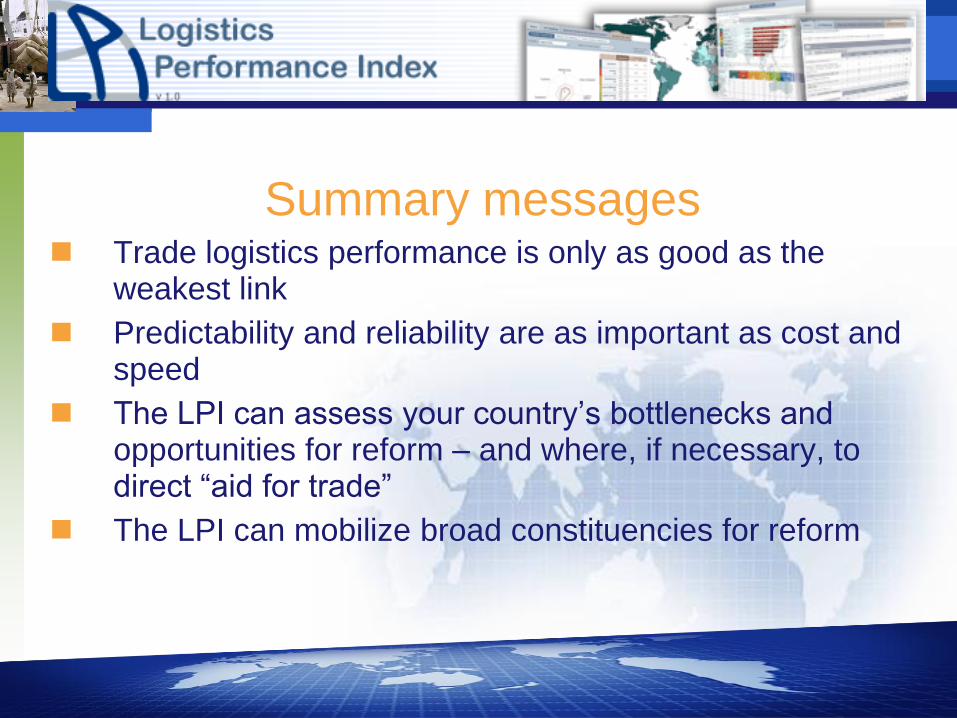
Summary messages Trade logistics performance is only as good as the
weakest link
Predictability and reliability are as important as cost and speed
The LPI can assess your country’s bottlenecks and opportunities for reform – and where, if necessary, to direct “aid for trade”
The LPI can mobilize broad constituencies for reform
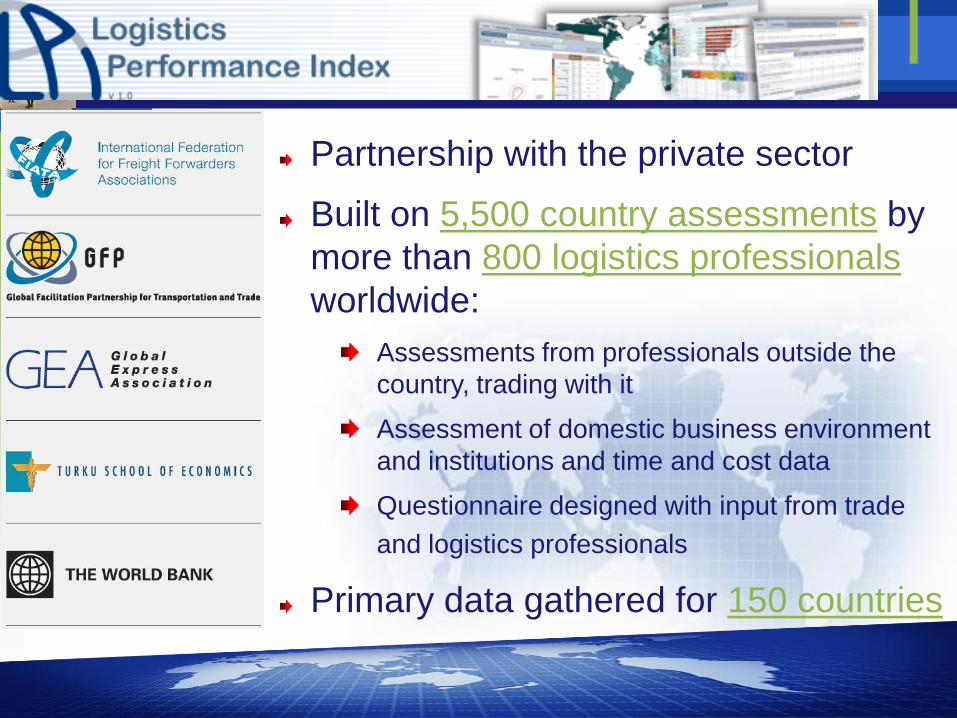
Partnership with the private sector
Built on 5,500 country assessments by
more than 800 logistics professionals
worldwide:
Assessments from professionals outside the
country, trading with it
Assessment of domestic business environment
and institutions and time and cost data
Questionnaire designed with input from trade
and logistics professionals
Primary data gathered for 150 countries
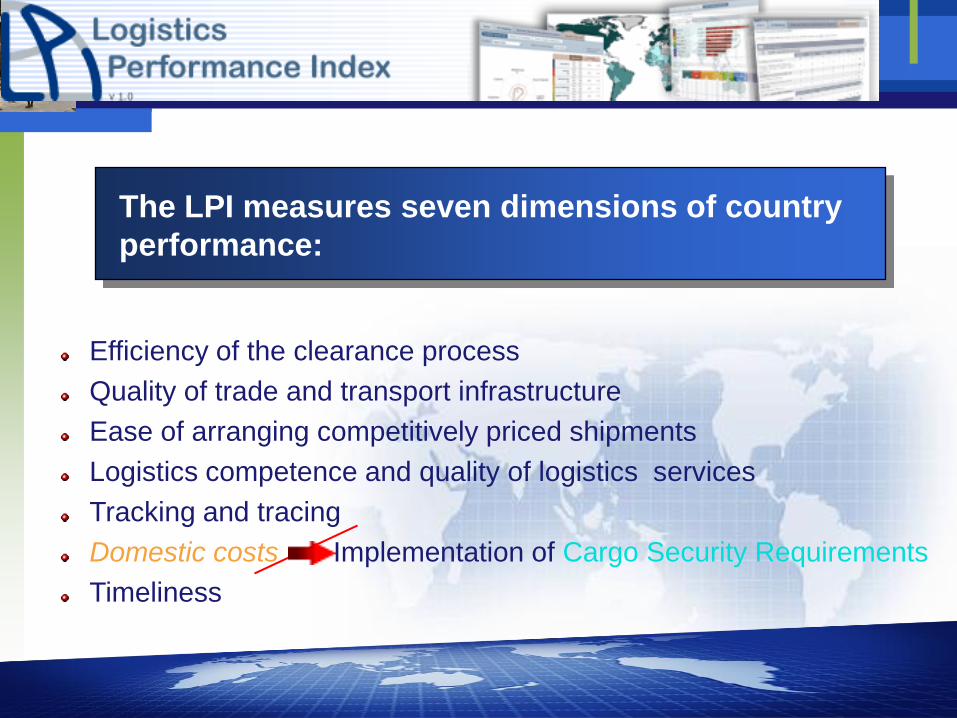
Efficiency of the clearance process
Quality of trade and transport infrastructure
Ease of arranging competitively priced shipments
Logistics competence and quality of logistics services
Tracking and tracing
Domestic costs Implementation of Cargo Security Requirements
Timeliness
The LPI measures seven dimensions of country
performance:
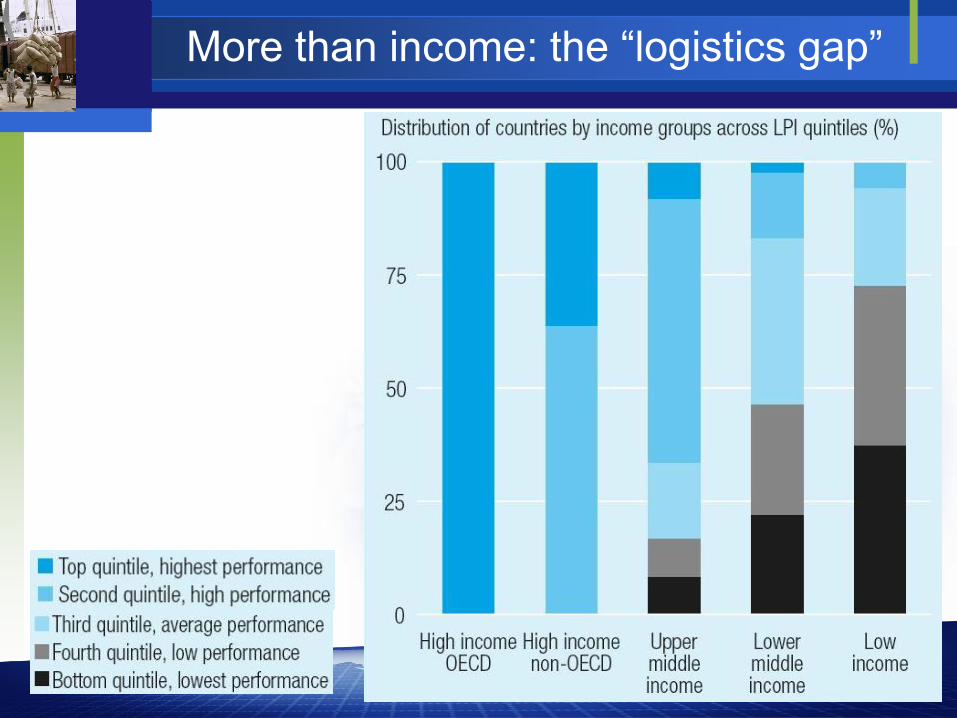
More than income: the “logistics gap”
New survey: ongoingfirst results in November
New improved questionnairebalance between quantitative and perception data
inclusion of a Customs module
Notoriety of pilot surveysupport participation of professional bodies
Summary and Revisions
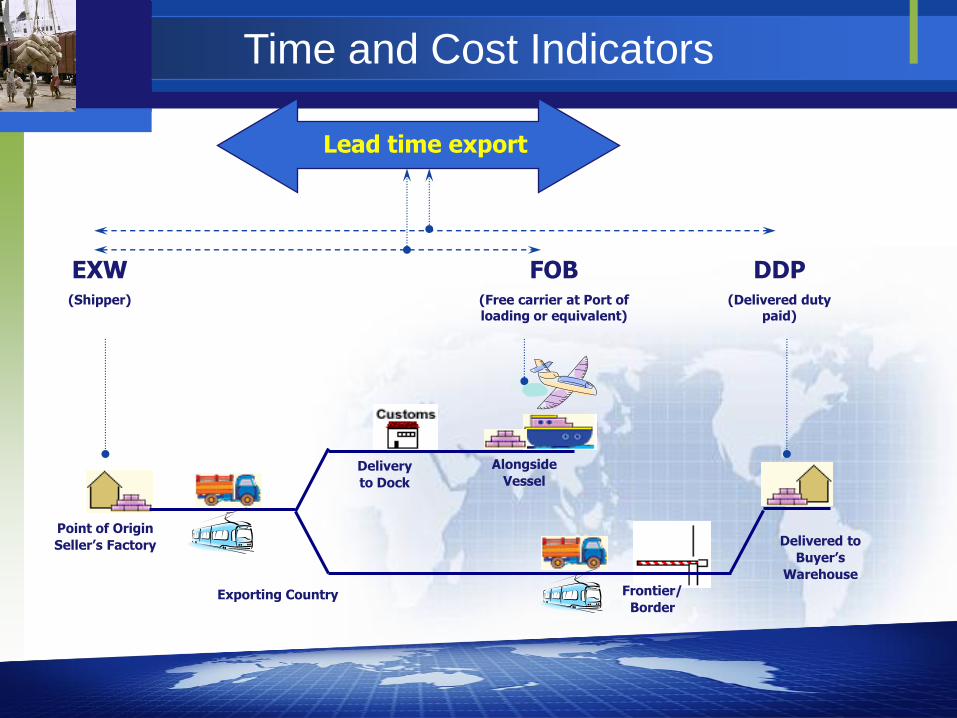
EXW(Shipper)
FOB(Free carrier at Port of loading or equivalent)
DDP(Delivered duty
paid)
Lead time export
Point of Origin
Seller’s Factory
Alongside
VesselDelivery
to Dock
Exporting Country
Delivered to
Buyer’s
Warehouse
Frontier/
Border
Time and Cost Indicators
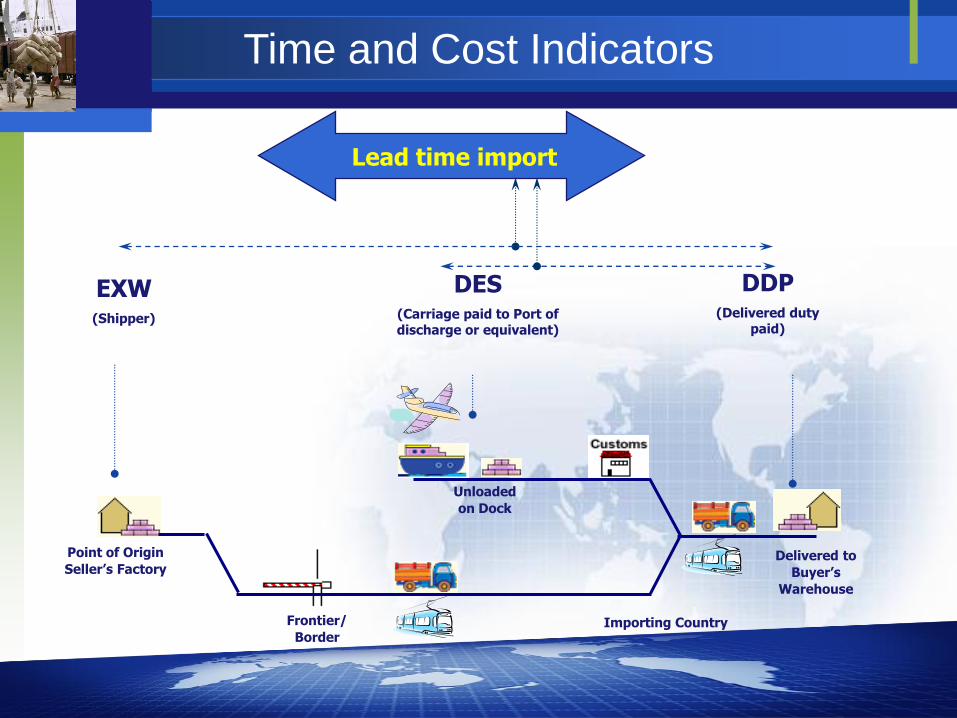
DES(Carriage paid to Port of discharge or equivalent)
Lead time import
Point of Origin
Seller’s Factory
Unloaded
on Dock
Importing Country
Delivered to
Buyer’s
Warehouse
Frontier/
Border
EXW(Shipper)
DDP(Delivered duty
paid)
Time and Cost Indicators
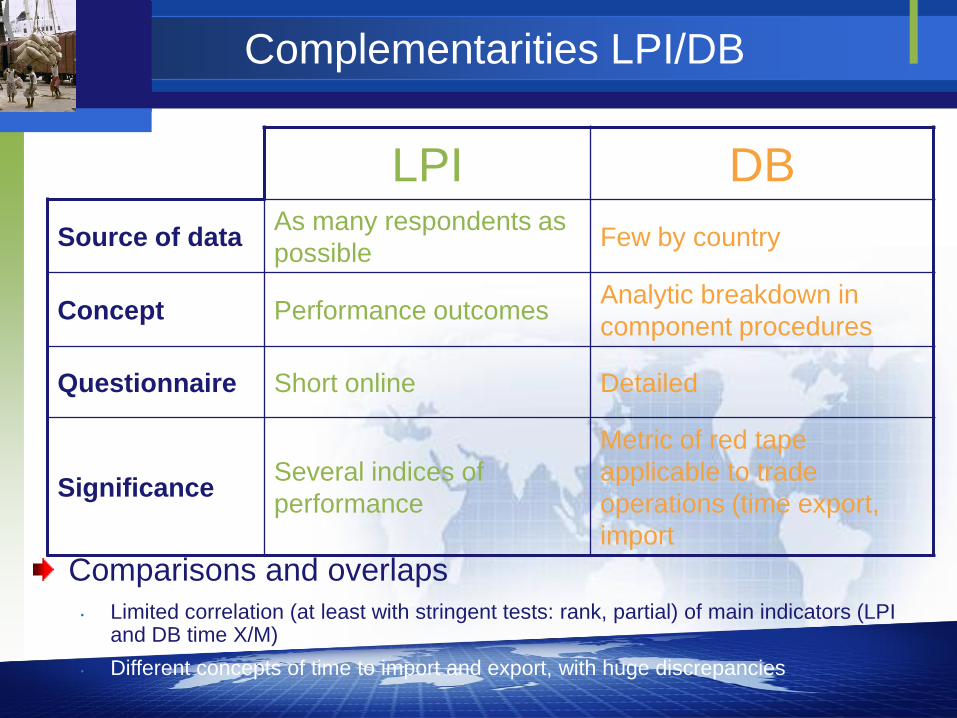
Complementarities LPI/DB
LPI DB
Source of dataAs many respondents as
possibleFew by country
Concept Performance outcomesAnalytic breakdown in
component procedures
Questionnaire Short online Detailed
SignificanceSeveral indices of
performance
Metric of red tape
applicable to trade
operations (time export,
import
Comparisons and overlaps
• Limited correlation (at least with stringent tests: rank, partial) of main indicators (LPI and DB time X/M)
• Different concepts of time to import and export, with huge discrepancies

LPI Ranking presents performance scores of all countries on the LPI index,
as well as on the seven key dimensions, in a sortable format

Country LPI Rank
South Africa 24
Malaysia 27
Chile 32
Turkey 34
Hungary 35
Czech Republic 38
Poland 40
Latvia 42
Argentina 45
Estonia 47
TOP 10 COUNTRIES
LOWER MIDDLE INCOME
Country LPI Rank
China 30
Thailand 31
Indonesia 43
Jordan 52
Bulgaria 55
Peru 59
Tunisia 60
Brazil 61
Philippines 65
El Salvador 66
TOP 10 COUNTRIES
LOW INCOME
Country LPI Rank
India 39
Vietnam 53
Sao Tome and Principe 57
Guinea 62
Sudan 64
Mauritania 67
Pakistan 68
Kenya 76
Gambia, The 77
Cambodia 81
TOP 10 COUNTRIES
UPPER MIDDLE INCOME
LPI Ranks
The LPI, on a 1 (worst) to 5 (best) scale) is aggregated by standard techniques (PCA), so as to reduce noise and improve confidence intervals
Confidence interval (+/- 10 %) provided, on average 8 places in the ranking
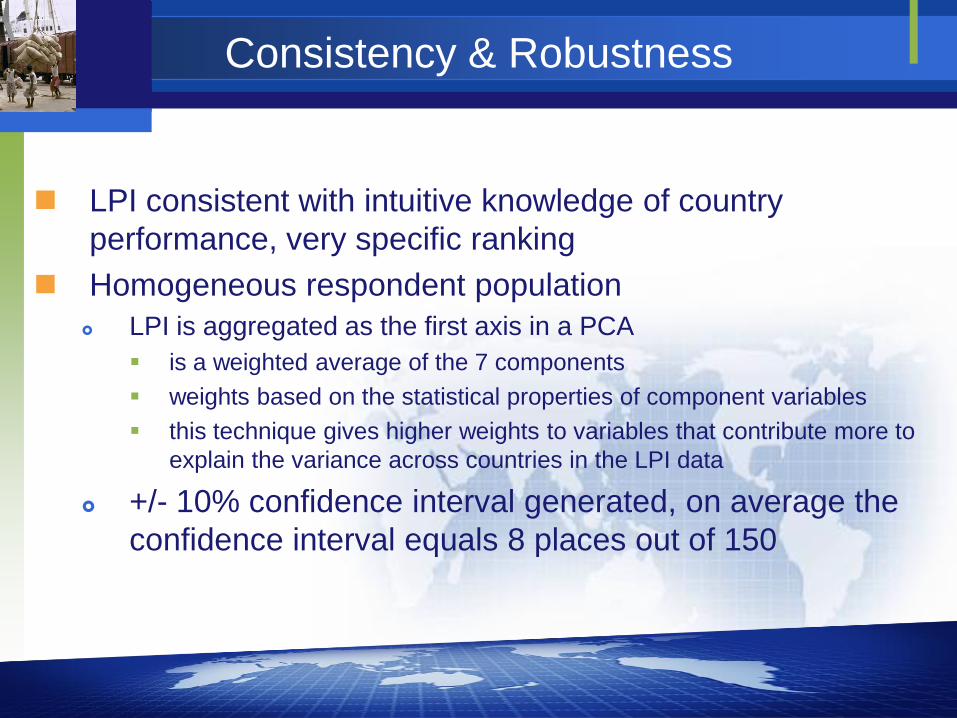
Consistency & Robustness
LPI consistent with intuitive knowledge of country
performance, very specific ranking
Homogeneous respondent population
LPI is aggregated as the first axis in a PCA
is a weighted average of the 7 components
weights based on the statistical properties of component variables
this technique gives higher weights to variables that contribute more to
explain the variance across countries in the LPI data
+/- 10% confidence interval generated, on average the
confidence interval equals 8 places out of 150
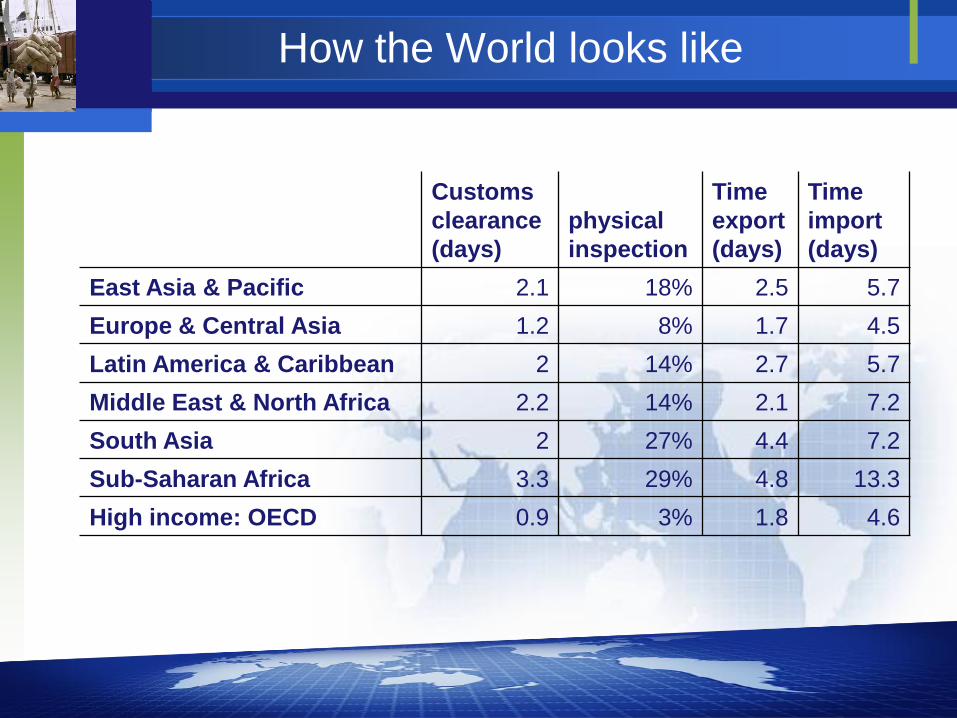
How the World looks like
Customs
clearance
(days)
physical
inspection
Time
export
(days)
Time
import
(days)
East Asia & Pacific 2.1 18% 2.5 5.7
Europe & Central Asia 1.2 8% 1.7 4.5
Latin America & Caribbean 2 14% 2.7 5.7
Middle East & North Africa 2.2 14% 2.1 7.2
South Asia 2 27% 4.4 7.2
Sub-Saharan Africa 3.3 29% 4.8 13.3
High income: OECD 0.9 3% 1.8 4.6

Respondents from 14 countries evaluated Indonesia
Number of international assessments (hits)
Confidence Interval = 0.13
22
Number of Indonesian respondents
(from 16 companies)
20
Looking at Indonesia using the LPI

0% 10% 20% 30% 40% 50% 60%
Other border crossing-related government
agencies
Rail transport service providers
Customs brokers
Trade and transport related associations
Consignees or shippers
Road transport service providers
Customs agencies
Warehousing and distribution operators
Freight forwarders
Air transport service providers
Indonesia
East Asia and PacificRespondents answering high/very high
Competence, domestic logistics industry
Logistics Costs
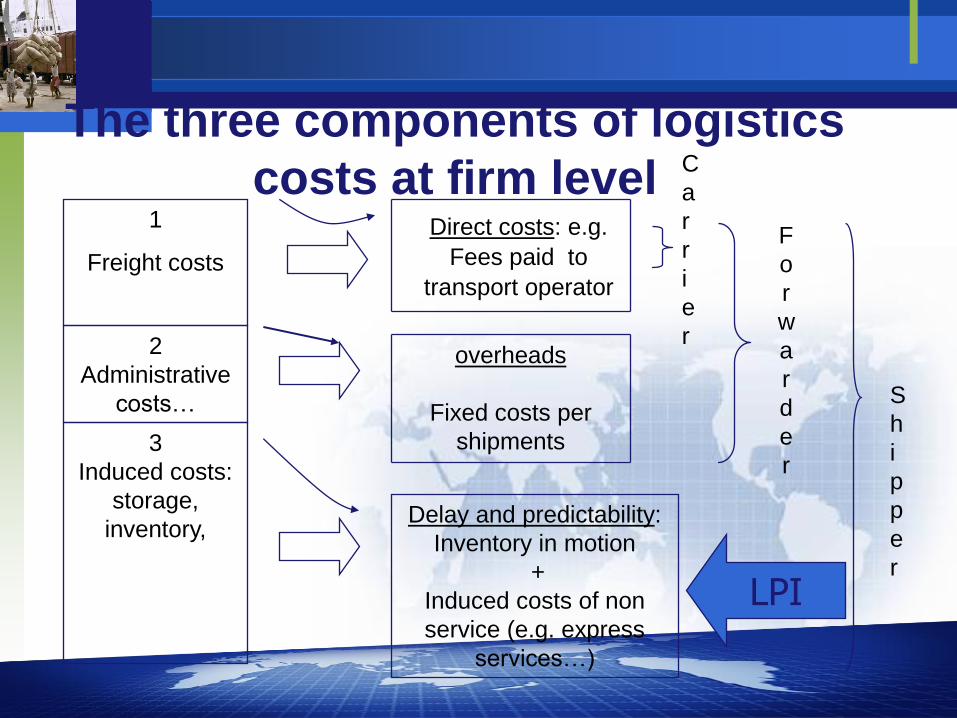
The three components of logistics
costs at firm level1
Freight costs
2
Administrative
costs…
3
Induced costs:
storage,
inventory,
Direct costs: e.g.
Fees paid to
transport operator
overheads
Fixed costs per
shipments
Delay and predictability:
Inventory in motion
+
Induced costs of non
service (e.g. express
services…)
S
h
i
p
p
e
r
F
o
r
w
a
r
d
e
r
C
a
r
r
i
e
r
LPI
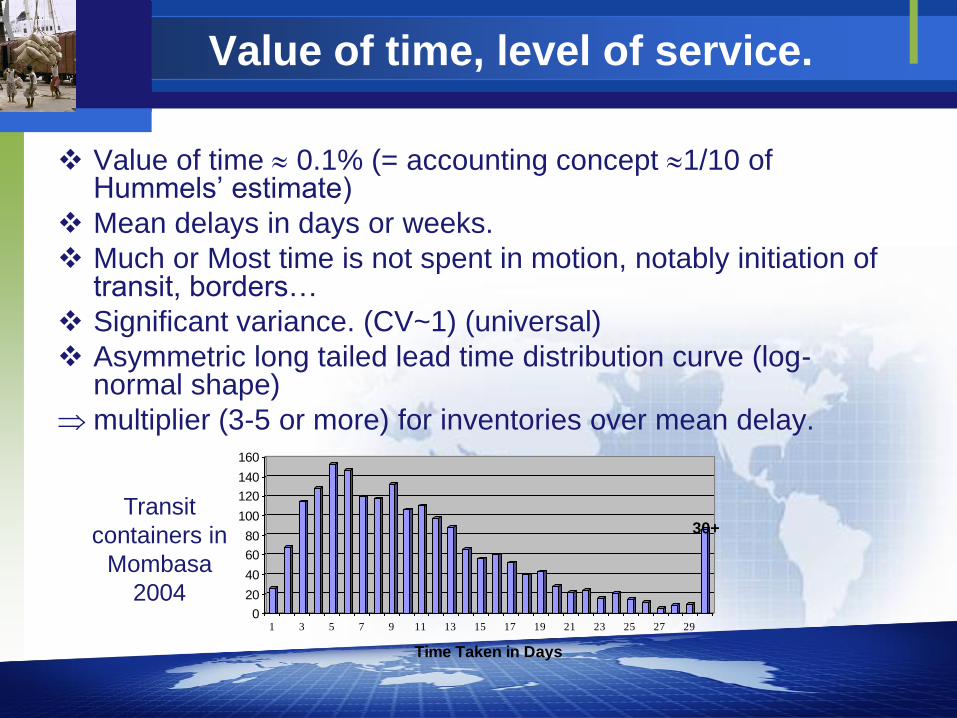
Value of time, level of service.
Value of time 0.1% (= accounting concept 1/10 of Hummels’ estimate)
Mean delays in days or weeks.
Much or Most time is not spent in motion, notably initiation of transit, borders…
Significant variance. (CV~1) (universal)
Asymmetric long tailed lead time distribution curve (log-normal shape)
multiplier (3-5 or more) for inventories over mean delay.
30+
0
20
40
60
80
100
120
140
160
1 3 5 7 9 11 13 15 17 19 21 23 25 27 29
Time Taken in Days
Transit
containers in
Mombasa
2004
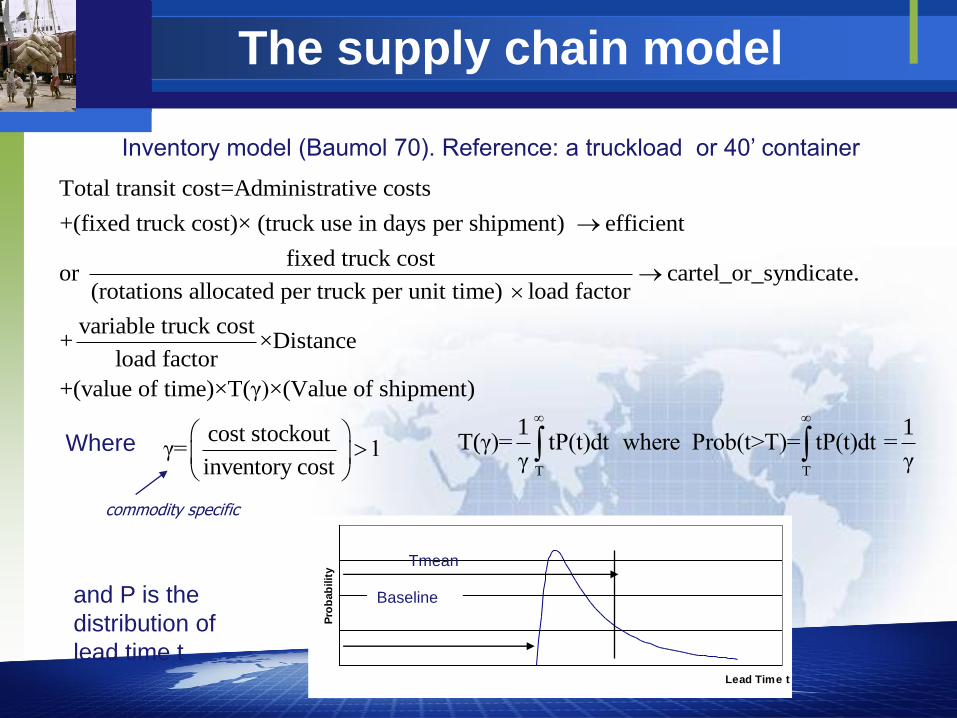
The supply chain model
Total transit cost=Administrative costs
+(fixed truck cost)× (truck use in days per shipment) efficient
fixed truck costor cartel_or_syndicate
(rotations allocated per truck per unit time) load factor
.
variable truck cost+ ×Distance
load factor
+(value of time)×T(γ)×(Value of shipment)
Inventory model (Baumol 70). Reference: a truckload or 40’ container
Where cost stockoutγ= 1
inventory cost
and P is the
distribution of
lead time t
T T
1 1T(γ)= tP(t)dt where Prob(t>T)= tP(t)dt =
γ γ
Lead Time t
Pro
bab
ilit
y
Tmean
Baseline
commodity specific
In practice
Not so easy to measure (availability of data)
Definition not universal (where you start and stop on the supply chain…)
Micro-level Model feasible based on supply chain model using shipment level data (Arvis 2007).
Evidence from survey or corridor analysis point that the third category of costs is the primary problem in developing countries in the form of: loss shipments or excessive inventory. (transport = 1/3)
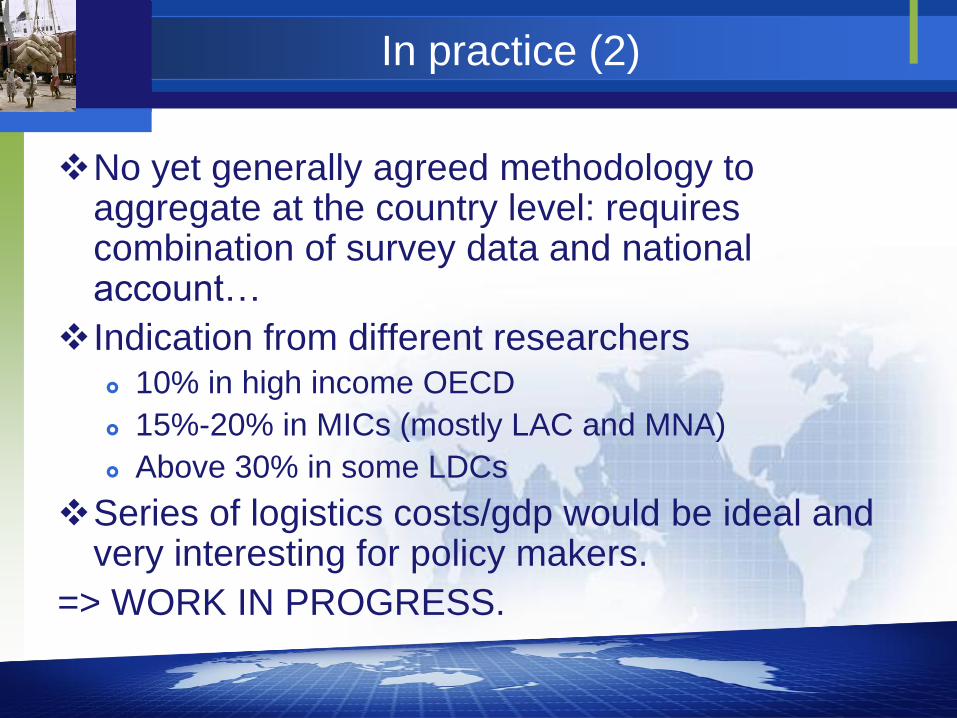
In practice (2)
No yet generally agreed methodology to aggregate at the country level: requires combination of survey data and national account…
Indication from different researchers 10% in high income OECD
15%-20% in MICs (mostly LAC and MNA)
Above 30% in some LDCs
Series of logistics costs/gdp would be ideal and very interesting for policy makers.
=> WORK IN PROGRESS.

Project Specific indicators

Narrow objectives
Monitor performance over time (not
necessarily compare with other) for a
specific gateway (port) or corridor.
Focus on time, and increasingly variability
of time at shipment level
Provide a breakdown of the time: e.g.
dwell time in ports.

Trade « simplified »
Vessel
arrival
Manifest
Submission of an
accepted
declaration
Clearance Exit
Delivery
Customs control
agencies
Forwarder
Bank
Port
Shipping agents
ForwarderTransit
Port
Forwarder
Shipper
Transporter
Handling
TransitClearance Removal
References
WCO TRS methodology (ports)
Bank Trade and Transport Facilitation in
Eastern Europe (TTFSE) methodology
USAID, Nathan FastPath (for corridor)
=> World Bank Nathan FastPath Lite.

Exemple (Rades Tunisia)
0.00
2.00
4.00
6.00
8.00
10.00
12.00
14.00
16.00
18.00
20.00
Dec 05
Dec 05
Fev 06
Fev 06
Avr 06 Mai 06
Jun 06
Jul 06 Aug 06
Sep 06
Oct 06
Nov 06
Dec 06
Jan 07
Fev 07
Mar 07
Apr 07
Mai 07
Jun 07
Jul 07 Aug 07
Sep 07
Oct 07
Navire-Dec Dec-BAE BAE - Enlvt
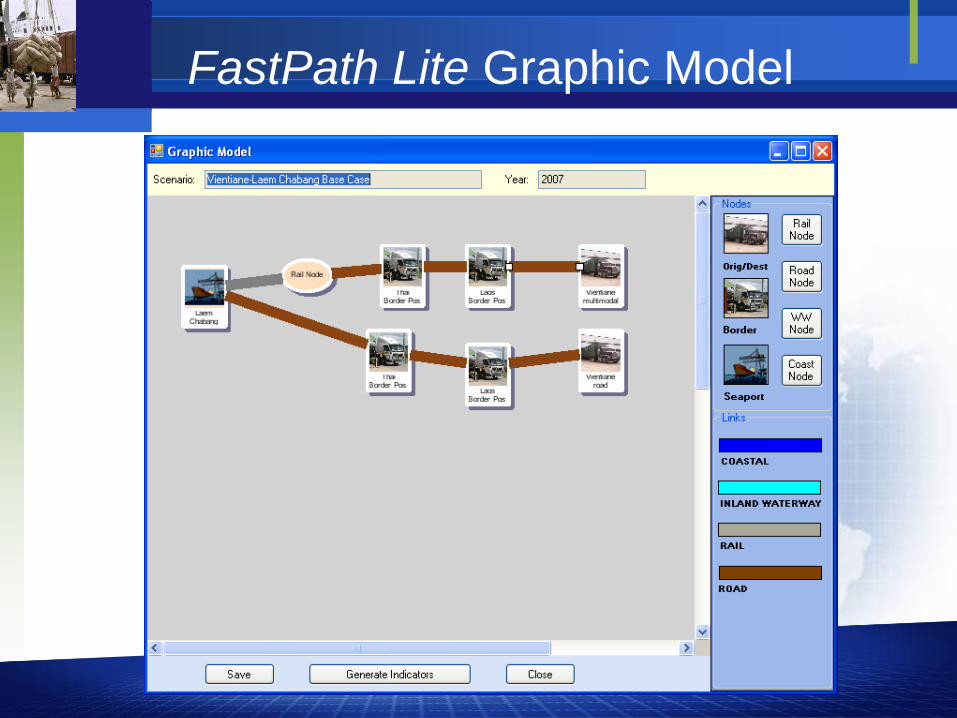
FastPath Lite Graphic Model
Connectivity indicators
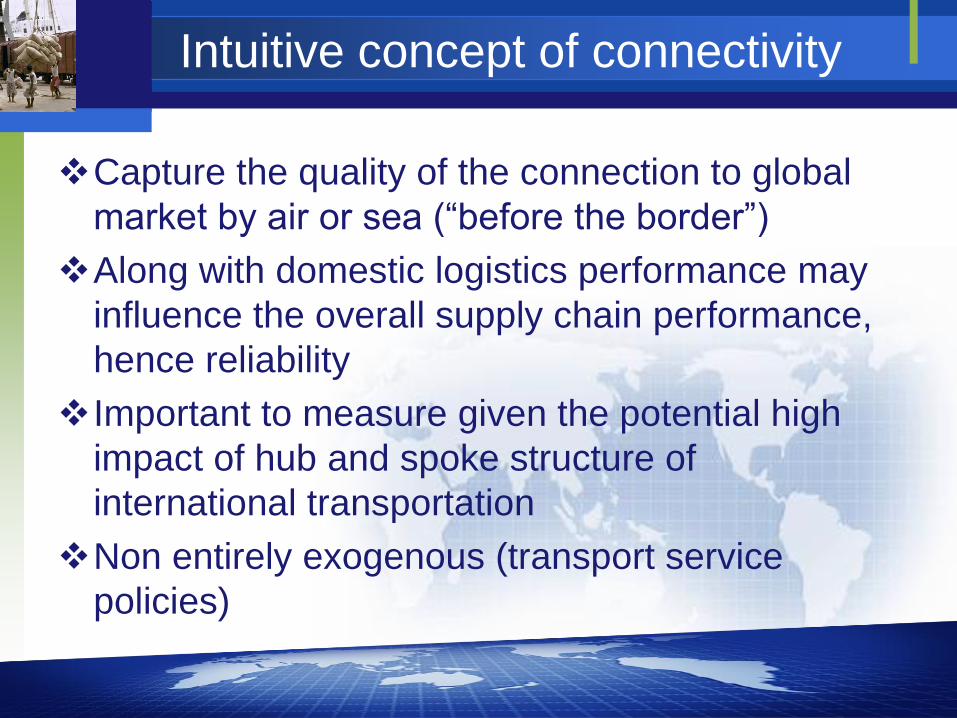
Intuitive concept of connectivity
Capture the quality of the connection to global
market by air or sea (“before the border”)
Along with domestic logistics performance may
influence the overall supply chain performance,
hence reliability
Important to measure given the potential high
impact of hub and spoke structure of
international transportation
Non entirely exogenous (transport service
policies)
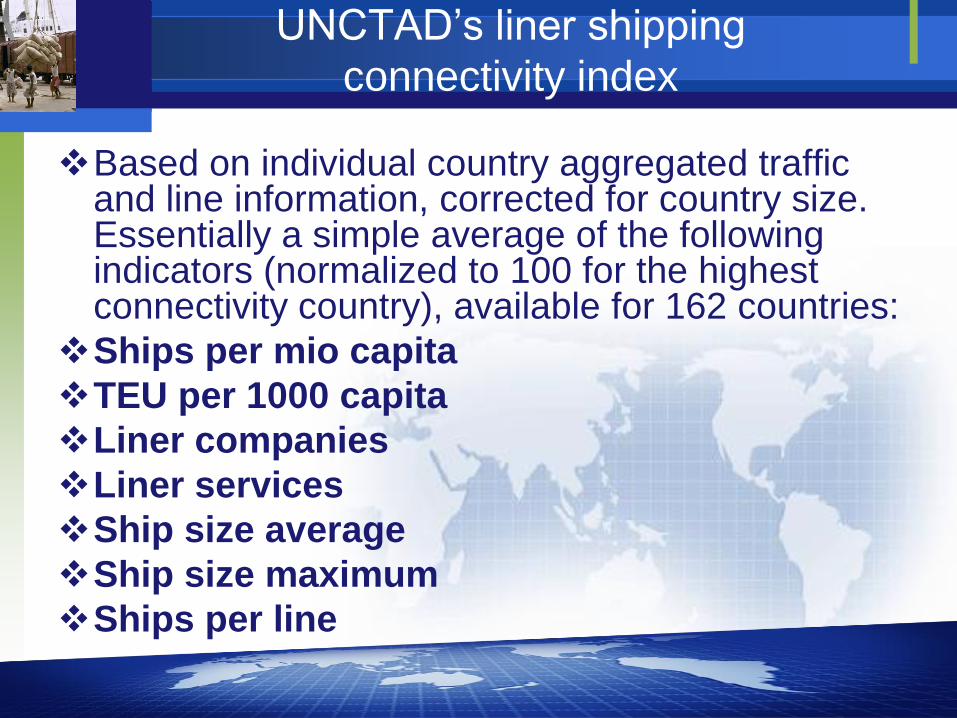
UNCTAD’s liner shipping
connectivity index
Based on individual country aggregated traffic and line information, corrected for country size. Essentially a simple average of the following indicators (normalized to 100 for the highest connectivity country), available for 162 countries:
Ships per mio capita
TEU per 1000 capita
Liner companies
Liner services
Ship size average
Ship size maximum
Ships per line
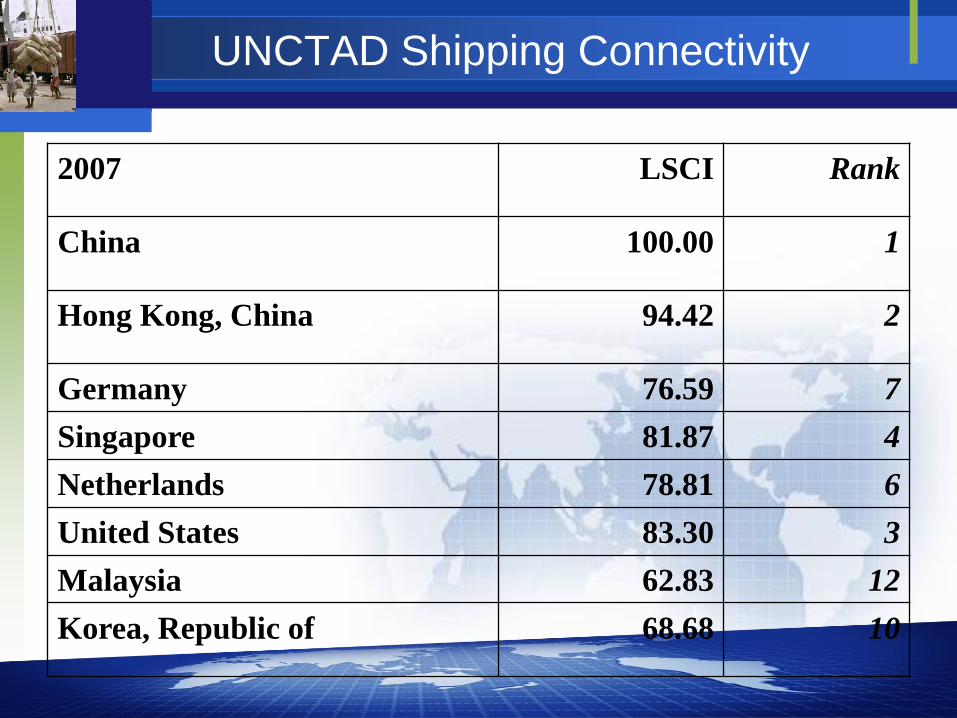
UNCTAD Shipping Connectivity
2007 LSCI Rank
China 100.00 1
Hong Kong, China 94.42 2
Germany 76.59 7
Singapore 81.87 4
Netherlands 78.81 6
United States 83.30 3
Malaysia 62.83 12
Korea, Republic of 68.68 10
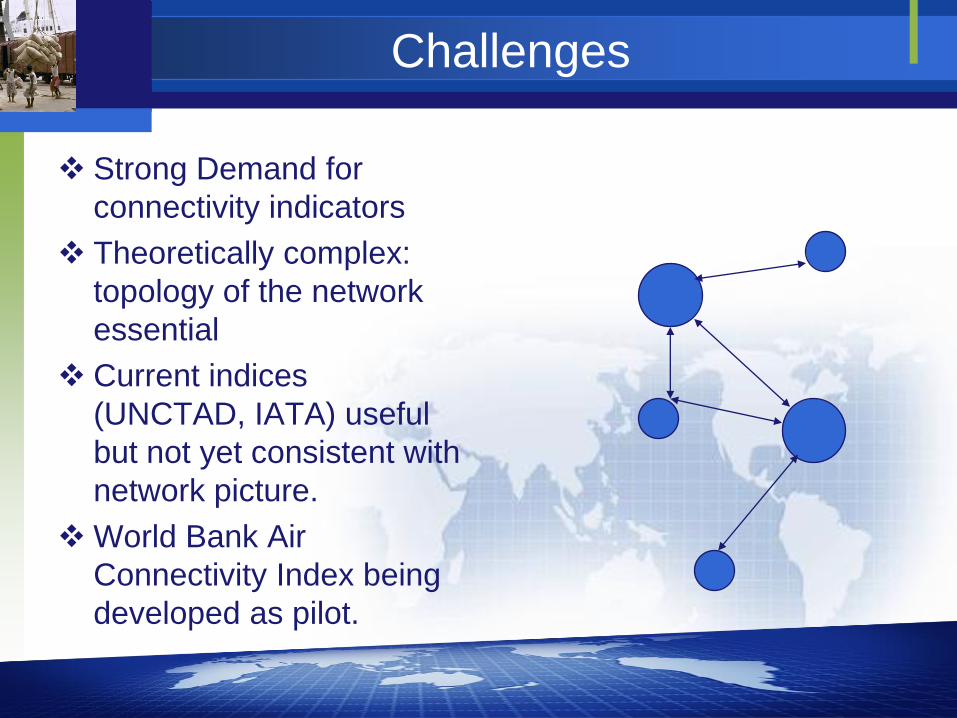
Challenges
Strong Demand for
connectivity indicators
Theoretically complex:
topology of the network
essential
Current indices
(UNCTAD, IATA) useful
but not yet consistent with
network picture.
World Bank Air
Connectivity Index being
developed as pilot.
Contact Us
www.worldbank.org/lpi
www.worldbank.org/trade
www.worldbank.org/tradefacilitation
www.worldbank.org/tradelogistics
Washington Office
1818 H Street NW
Washington DC 20433
Contact: [email protected]
The World Bank GroupInternational Trade Department
Related Documents