P D UN TRADE FACILITATION BEYOND THE MULTILATERAL TRADE NEGOTIATIONS: REGIONAL PRACTICES, CUSTOMS VALUATION AND OTHER EMERGING ISSUES A study by the Asia-Pacific Research and Training Network on Trade

Welcome message from author
This document is posted to help you gain knowledge. Please leave a comment to let me know what you think about it! Share it to your friends and learn new things together.
Transcript
PDU N
TRADE FACILITATION BEYOND THEMULTILATERAL TRADE NEGOTIATIONS:
REGIONAL PRACTICES, CUSTOMSVALUATION AND OTHER
EMERGING ISSUES
A study by the Asia-Pacific Research andTraining Network on Trade

Cover page photo: Mike Martin Wong
What is ARTNeT? The Asia-Pacific Research and Training Network on Trade(ARTNeT) is an open regional network of research and academic institutions
specializing in international trade policy and facilitation issues. Networkmembers currently include over 20 leading national trade research andacademic institutions from as many developing countries from East,South, and Southeast Asia and the Pacific. IDRC, UNCTAD, UNDP,UNESCAP and the WTO, as core network partners, provide substantiveand/or financial support to the network. The Trade and Investment Division
of UNESCAP, the regional branch of the United Nations for Asia and the Pacific, provides theSecretariat of the network and a direct regional link to trade policymakers and other internationalorganizations.
ARTNeT aims at increasing the amount of policy-oriented trade research in the regionby harnessing the research capacity already available and developing additional capacitythrough regional team research projects, enhanced research dissemination mechanisms, increasedinteractions between trade policymakers and researchers, and specific capacity-building activitiescatering to researchers and research institutions from least developed countries. A key featureof the network s operation is that its research programme is discussed and approved on anannual basis during a Consultative Meeting of Policymakers and Research Institutions. Formore information, please contact the ARTNeT Secretariat or visit www.artnetontrade.org.

TRADE FACILITATION BEYOND THEMULTILATERAL TRADE NEGOTIATIONS:
REGIONAL PRACTICES, CUSTOMSVALUATION AND OTHER
EMERGING ISSUES
A study by the Asia-Pacific Research andTraining Network on Trade
PDU N
New York, 2007
United NationsE S C A P

TRADE FACILITATION BEYOND THE MULTILATERAL
TRADE NEGOTIATIONS: REGIONAL PRACTICES,
CUSTOMS VALUATION AND OTHER EMERGING ISSUES
A study by the Asia-Pacific Research and
Training Network on Trade
The views presented in this publication are those of the authors and do not
necessarily reflect the views of the authors’ organizations, ARTNeT members, partners
and the Secretariat of the United Nations. This study was conducted as part of an
ESCAP/UNDP Joint ARTNeT research project on Trade Facilitation and Regional Integration.
It was carried out with the aid of a grant from the UNDP Asia-Pacific Trade and Investment
Initiative (APTII), Regional Centre in Colombo. The technical support of ESCAP is gratefully
acknowledged. Any remaining errors are the responsibility of the authors.
Mention of firm names and commercial products does not imply the endorsement
of the United Nations.
All material in this publication may be freely quoted or reprinted, but acknowledgement
is required, together with a copy of the publication containing the quotation or reprint.
The use of this publication for any commercial purpose, including resale, is prohibited
unless permission is first obtained from the Secretary of the Publications Board, United
Nations, New York. Requests for permission should state the purpose and the extent of
reproduction.
This publication has been issued without formal editing.
United Nations publication
Sales No. E.08.II.F.9
Copyright © United Nations 2008
All rights reserved
Manufactured in Thailand
ISBN: 978-92-1-120539-8
ST/ESCAP/2466
iii
Preface
This publication brings together the main research outputs produced by the
Asia-Pacific Research and Training Network on Trade (ARTNeT), and its members and
partners, between April 2006 and January 2007. ARTNeT is an open network of
national-level research institutions in the region launched by ESCAP and the International
Development Research Centre (IDRC), Canada in October 2004, and supported by the
United Nations Development Programme (UNDP), the United Nations Conference on
Trade and Development (UNCTAD), the World Trade Organization (WTO) as core partners.
The ESCAP Trade and Investment Division (TID) serves as the Secretariat of the network.
This book includes 10 chapters. The first chapter introduces the concept of trade
facilitation beyond the ongoing multilateral trade negotiations, and it serves both as an
introduction and a synthesis of the studies presented in the remaining chapters. Chapters
II and III provide an analysis of regional trade facilitation initiatives and the link between
trade facilitation and preferential trade agreements (PTAs). Chapter IV is dedicated to
rules of origin in PTAs, whose complexity and lack of harmonization across a growing
number of overlapping agreements in the Asia-Pacific region is seen as an increasingly
significant impediment to trade.
Chapters V and VI focus on customs valuation in developing countries, an issue
that remains of key concern among importers and exporters but which is not part of the
ongoing WTO negotiations on trade facilitation. These chapters are complemented by
chapter VII, which provides a comparative analysis of the broader trade facilitation needs
of Fiji and a selection of Asian developing countries, building on earlier work of the
network.
Chapters VIII and IX provide a broader perspective of trade facilitation. The first of
these chapters examines the linkages between trade facilitation and trade logistics services
liberalization, as an initial effort to understand the interplay and level of priority that should
be accorded to border trade facilitation measures, as opposed to measures that would
facilitate the development of trade facilitation-related infrastructure and services. Chapter
IX looks at trade facilitation in a trade (transaction) cost framework, and evaluates the
impact of transport costs and underdeveloped infrastructure on bilateral trade flows of
10 Asian developing countries. In conclusion, chapter X provides recommendations on
arriving at a meaningful multilateral agreement on trade facilitation.
The studies presented here were undertaken as a follow-up to ARTNeT’s earlier
work on the need, priorities and costs of trade facilitation measures under consideration by
the WTO Negotiating Group on Trade Facilitation, as mandated by the ARTNeT Consultative
Meeting of Policy Makers and Research Institutions held on 6 and 7 October 2005 in
iv
Macao, China.1 Implementation of the trade facilitation component of the research programme
approved during that meeting was made possible by the close collaboration between the
Asia-Pacific Trade and Investment Initiative of the UNDP Regional Centre in Colombo,
which provided financial and administrative support, and TID, ESCAP which coordinated
and guided the overall research effort. The generous support of IDRC, Canada, without
which ARTNeT would not exist, is also gratefully acknowledged.
The research and preparation of this publication was coordinated by Mr. Yann
Duval, Economic Affairs Officer, Trade Policy Section, TID, ESCAP under the general
guidance of Mr. Xuan Zengpei, Director, TID and Ms. Tiziana Bonapace, Chief, Trade
Policy Section, TID, in collaboration with Mr. Manuel Montes and Mr. Swarnim Wagle,
both formerly with the UNDP Regional Centre in Colombo. Ms. Mia Mikic, Economic
Affairs Officer, Trade Policy Section, TID, assisted in the preparation of Chapter IV. The
authors of the individual chapters received valuable guidance and comments from
Florian Alburo, Professor of Economics at the University of the Philippines and ARTNeT
Advisor on Trade Facilitation. The authors also benefited from comments and suggestions
by participants in the UNDP/ESCAP ARTNeT Consultative Meeting on Trade Facilitation
and Regional Integration,2 held on 17 and 18 August 2006 in Bangkok, Thailand, during
which preliminary drafts of the studies were presented to policy makers and negotiators.
1 The research programme endorsed at the meeting is available at http://www.unescap.org/tid/
artnet/res/research0506.pdf.
2 Summary of the meeting and other meeting documents are available at http://www.unescap.org/
tid/artnet/mtg/tfri.asp.

v
CONTENTS
Page
Preface ..................................................................................................................... iii
Acronyms and abbreviations ................................................................................ xii
I. Trade facilitation beyond the Doha round of negotiations ..................... 1
Introduction .................................................................................................... 1
A. Trade facilitation: Increasing the efficiency of trading processes ...... 2
B. Trade facilitation and the WTO ............................................................ 4
C. Trade facilitation, and regional/bilateral trade initiatives and
agreements .......................................................................................... 6
D. Trade facilitation and customs valuation ............................................. 9
E. Trade facilitation and services ............................................................. 11
F. Trade facilitation in a broader context ................................................. 12
G. Conclusion ............................................................................................ 19
Annex: List of bilateral and regional trade agreements covering trade
facilitation ..................................................................................... 21
References ..................................................................................................... 24
II. A comparative analysis of trade facilitation in selected regional and
bilateral trade agreements and initiatives ................................................ 27
Introduction .................................................................................................... 27
A. Trade facilitation in selected regional and bilateral trade agreements
in the Asia-Pacific region ...................................................................... 28
B. A template for trade facilitation in future agreements .......................... 47
C. Some implications for developing countries ........................................ 76
References ..................................................................................................... 80
III. Trade facilitation measures in South Asian FTAs: An overview of
initiatives and policy approaches .............................................................. 83
Introduction .................................................................................................... 83
A. Intraregional trade in South Asia ......................................................... 84
B. Status of WTO-related trade facilitation measures in South Asia ....... 87
C. Trade facilitation in South Asian FTAs ................................................. 93
D. Implications and conclusion ................................................................. 113
Annex: Assessment checklist of measures related to GATT Articles V,
VIII and X – South Asia ................................................................ 115
References ..................................................................................................... 134

vi
IV. Rules of origin in emerging Asia-Pacific preferential trade
agreements: Will PTAs promote trade and development? .................... 137
Introduction .................................................................................................... 137
A. WTO requirements for preferential trade agreements ........................ 138
B. Proliferation of PTAs in Asia and the Pacific, and rules of origin ........ 140
C. Tariff discrimination resulting from PTAs: Some examples from
industries of interest to developing countries ...................................... 148
D. Impact of rules of origin on utilization of PTAs by developing
countries – the case of the United States ............................................ 153
E. Proposals for disciplines and reform in use of rules of origin ............. 159
References ..................................................................................................... 162
V. Customs valuation in India: Identifying trade facilitation-related
concerns ....................................................................................................... 163
Introduction .................................................................................................... 163
A. Institutional and policy framework ....................................................... 164
B. Private sector perception and key concerns ....................................... 173
C. Policy recommendations and conclusion ............................................ 186
References ..................................................................................................... 192
VI. Implementation of the WTO Customs Valuation Agreement in
Nepal: An ex ante impact assessment ..................................................... 195
Introduction .................................................................................................... 195
A. Review of literature on customs valuation ........................................... 196
B. Customs valuation in Nepal ................................................................. 200
C. Impact of changes in customs valuation practice ................................ 211
D. Policy recommendations and conclusion ............................................ 214
Annex: World Trade Organization customs valuation methods .............. 220
References ..................................................................................................... 222
VII. Trade facilitation and customs valuation in Fiji: A comparative
analysis of needs and priorities ................................................................. 223
Introduction .................................................................................................... 223
A. Trade facilitation needs, priorities and impact in Fiji ........................... 224
B. Implementation by Fiji of the WTO Customs Valuation Agreement .... 238
CONTENTS (continued)
Page

vii
CONTENTS (continued)
Page
C. Policy recommendations and conclusion ............................................ 241
Bibliography ................................................................................................... 243
VIII. Relationship between liberalization in the logistics sector and
trade facilitation ........................................................................................... 245
Introduction .................................................................................................... 245
A. Trends in the Australian market for logistics services ......................... 246
B. Governmental measures that may have an impact on the supply
of logistics services .............................................................................. 261
C. Relationship between logistics liberalization and trade facilitation:
An illustrative example from the seafood industry of South Australia 263
D. Implications for developing countries and policymakers ..................... 273
E. Conclusion and research implications ................................................. 276
Bibliography ................................................................................................... 278
IX. Impact of trade costs on trade: Empirical evidence from Asian
countries ....................................................................................................... 281
Introduction .................................................................................................... 281
A. Trade costs and their relevance .......................................................... 283
B. Barriers to trade: Ocean freight and auxiliary shipping charges ........ 288
C. Estimating the effects of trade costs on trade ..................................... 294
D. Conclusion ............................................................................................ 299
Annexes: I. Methodology ......................................................................... 301
A. Bilateral transportation cost estimation ......................... 301
B. Infrastructure index ....................................................... 303
C. Gravity Model ................................................................ 304
II. Discrepancies in transportation cost estimations at 4-digit
HS, and data classification ................................................... 307
References ..................................................................................................... 308
X. Prioritizing Trade Facilitation Measures: A note ..................................... 311
Introduction .................................................................................................... 311
A. Trade facilitation proposals .................................................................. 312
B. Trade facilitation priorities of traders and stakeholders ...................... 314
C. From measures to binding commitments and agreement ................... 316
D. Conclusion ............................................................................................ 318
References ..................................................................................................... 319

viii
CONTENTS (continued)
Page
List of Tables
Chapter I
1. List of WTO provisions related to trade facilitation ....................................... 4
2. Subregional rankings of selected Asia-Pacific countries in terms of ease
of trading and other ease of doing business indicators (fiscal year 2007) ... 13
Chapter II
1. General comparison of regional trade agreements in the Asia-Pacific
region ............................................................................................................. 30
2. Comparison of trade facilitation measures .................................................... 48
3. Overview of proposed trade facilitation model measures ............................. 66
Chapter III
1. Intraregional trade in South Asia, 1980-2004 ................................................ 84
2. Percentage of growth in intraregional flow of exports, 2003-2005 ............... 85
3. Percentage of growth in intraregional flow of imports, 2004-2005 ............... 85
4. Number of truck movements ......................................................................... 86
5. India’s formal and informal trade with South Asia ......................................... 87
6. Preferential Trade Arrangements in South Asia ............................................ 94
7. Overview of selected South Asian FTAs ....................................................... 95
8. Provisions related to publication and availability of information in South
Asian FTAs ..................................................................................................... 100
9. Provisions related to imports and exports fees, formalities and procedures
in South Asian FTAs ...................................................................................... 103
Chapter IV
1. Bilateral FTAs of Japan ................................................................................. 143
2. Bilateral FTAs of the Republic of Korea ........................................................ 145
3. Bilateral FTAs of China .................................................................................. 146
4. Singapore’s preferential trade agreements ................................................... 146
5. Thailand’s bilateral free trade agreements .................................................... 149
6. Import duty paid on shipments of clothing to the United States in the
post-quota era ................................................................................................ 151
7. Import duty paid on shipments of textiles to the United States in the
post-quota era ................................................................................................ 153
8. Import duty paid on shipments of footwear to the United States .................. 154
9. GSP utilization ratios in developing Asia-Pacific countries ........................... 155
ix
CONTENTS (continued)
Page
Chapter V
1. Sources of tax revenue in India ..................................................................... 167
2. Compatibility in GATT valuation methods and the Indian Customs Act,
1988 ............................................................................................................... 169
3. Extra duty realized from enhancement in valuation ...................................... 173
4. Coverage, distribution and magnitude of undervaluation at the company
level ................................................................................................................ 181
5. Customs refunds by customs stations from 2000/01 to 2004/05.................. 184
Chapter VI
1. Problem identification and methods used ..................................................... 207
2. Current ASYCUDA skilled manpower situation ............................................. 207
3. Current problems in the implementation of ACV ........................................... 208
4. Declared and reviewed value of imported goods .......................................... 213
5. Declared and deducted value of imported goods ......................................... 213
Chapter VII
1. Percentages share of individual commodity groups in Fiji’s total domestic
exports ........................................................................................................... 225
2. Sample size and number of responses received .......................................... 226
3. Comparison of survey results and the government sector ........................... 227
4. Perceived level of implementation of GATT Articles V, VIII and X by the
private sector in selected countries ............................................................... 229
5. Survey results from the private sector: identifying trade facilitation needs
and priorities .................................................................................................. 231
6. Private sector priority ranking of selected trade facilitation measures in
selected countries .......................................................................................... 233
7. Comparison of the most problematic areas in conducting trade in selected
countries ........................................................................................................ 237
Chapter VIII
1. Foreign and Australian players in the Australian market for logistics
services .......................................................................................................... 250
2. Summary of main reforms in Australia that have had an impact upon the
logistics sector ............................................................................................... 256
3. Summary of main Australian governmental measures that may have an
impact on the logistics sector ........................................................................ 263
x
CONTENTS (continued)
Page
Chapter IX
1. Estimates of total freight costs for imports .................................................... 283
2. Trends in freight costs in selected Asian countries ....................................... 284
3. Components of total ocean freight in Asia .................................................... 289
4. Ocean freight and auxiliary charges in Asia, 2004 ........................................ 291
5. OLS (log linear) results at the 4-digit HS level for 2004 ............................... 295
6. 2SLS (log linear) results at the 4-digit HS level for 2004 .............................. 298
Annexes Table I.A. Estimated weights ............................................................. 303
Table I.B. Infrastructure index and ranks in 2004 ............................. 303
Table II.A. Discrepancies in transportation cost estimations at
4-digit HS .......................................................................... 307
Table II.B. Data classification ............................................................. 307
Chapter X
1. Proposed trade facilitation measures ............................................................ 312
List of Figures
Chapter I
I. An extended trade efficiency model .............................................................. 3
II. Most problematic areas in conducting trade in selected developing
countries in Asia and the Pacific ................................................................... 5
III. Average applied tariffs and number of technical barriers to trade,
1996-2005 ...................................................................................................... 6
IV. Asia-Pacific “noodle bowl” of preferential trade agreements ........................ 7
V. The three flows of international trade ............................................................ 11
VI. Time and documentary requirements for imports and exports in South
Asian countries (fiscal year 2007) ................................................................. 15
VII. Time and documents requirements for imports and exports in East Asian
countries (fiscal year 2007) ........................................................................... 16
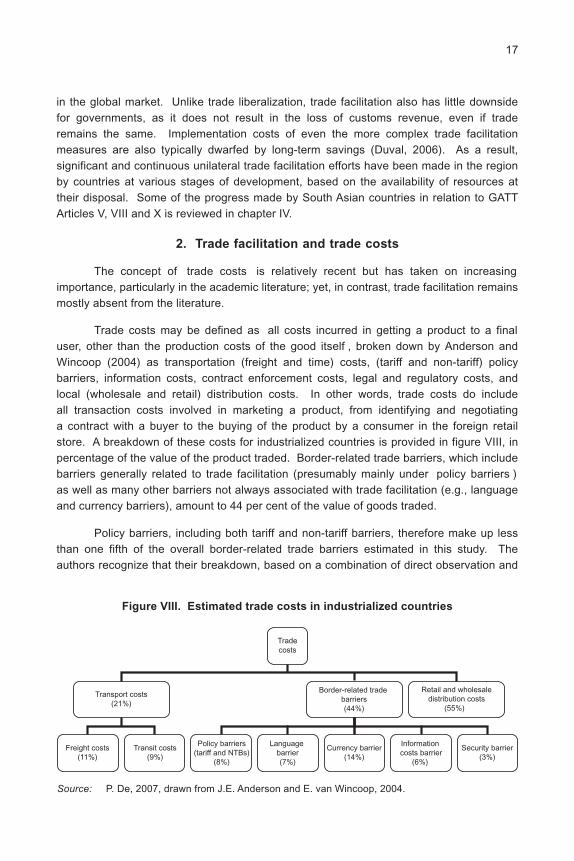
VIII. Estimated trade costs in industrialized countries .......................................... 17
IX. Changes in inequality within selected Asian Countries, 1990s-2000s ......... 19
Chapter IV
I. Percentage of imports covered by United States non-reciprocal PTAs ........ 156

xi
CONTENTS (continued)
Page
Chapter V
I. Decline in the average tariff rate in India, 1991-2006 ................................... 166
II. Problems faced by the private sector in India ............................................... 174
III. Major concerns over customs valuation ........................................................ 177
Chapter VII
Major problems faced by the Fijian private sector ........................................ 236
Chapter VIII
I. Overview of the logistics supply chain .......................................................... 248
II. Road freight trends ........................................................................................ 257
III. Rail freight trends........................................................................................... 258
IV. Sea freight trends .......................................................................................... 259
V. Airfreight trends ............................................................................................. 260
VI. Logistics supply chain for chilled tuna prior to export to Japan .................... 266
VII. Logistics supply chain for frozen tuna prior to export to Japan .................... 268
VIII. Pre-arrival examination system in Japan ...................................................... 271
Chapter IX
I. Estimated trade costs in industrialized countries .......................................... 285
II. Relative importance of trade transaction costs in Asia ................................. 287
III. Broad overview of total ocean freight in Asia ................................................ 289
IV. Trade costs and its components .................................................................... 294
List of Boxes
Chapter V
1. The case of Eicher Tractor Limited ............................................................... 172
2. Nature of under-invoicing in different cases .................................................. 185
xii
Acronyms and abbreviations
ACP Accredited Clients Programme
ACS Australian Customs Service
ACV Agreement on Customs Valuation
AEC ASEAN Economic Community
AFTA ASEAN Free Trade Area
AGOA African Growth and Opportunity Act
AHTN ASEAN Harmonized Tariff Nomenclature
AIMS AQIS Import Management System
APEC Asia-Pacific Economic Cooperation
APLAC Asia Pacific Laboratory Accreditation Cooperation
APTIAD Asia-Pacific Trade and Investment Agreement Database
AQIS Australian Quarantine and Inspection Service
ARTNeT Asia-Pacific Research and Training Network on Trade
ASEAN Association of Southeast Asian Nations
ASEAN 6 Indonesia, Malaysia, Philippines, Singapore, Thailand, Brunei Darussalam
ASFTA Australia-Singapore Free Trade Agreement
ASW ASEAN Single Window
ASYCUDA Automated System for Customs Data
ATPDA Andean Trade Promotion and Drug Eradication Act (also referred to as
ANDEAN)
BDV Brussels Definition of Value
BIMSTEC Bengal Initiative for Multisectoral Techno-Economic Cooperation
BIST-EC Bangladesh-India-Sri Lanka-Thailand Economic Co-operation
CAFTA-DR Central American Free Trade Agreement-Dominican Republic
CBEC Central Board of Excise and Customs
CBI Caribbean Basin Initiative
CCC Customs Cooperation Council
CECA Comprehensive Economic Cooperation Agreement
CEPT Common Effective Preferential Tariff
CER closer economic relationship
CESTAT Customs, Excise and Service Tax Appellate Tribunal
CHA Customs Handling Agents
COE Committee of Experts
CRD Central Registry Database
CTH or CTSH change in tariff heading (or sub-heading)
CU Currency Unit
CVA Customs Valuation Agreement
DOV Directorate of Valuation
DRP Duty Refund Procedure

xiii
EDI Electronic Data Interchange
EMC electromagnetic compatibility
EPA Economic Partnership Agreement
ESCAP Economic and Social Commission for Asia and the Pacific
EXDOC Export Documentation System
EXIT Export Integration System
FIRCA Fiji Islands Revenue and Customs Authority
FTA free trade agreement
GATS General Agreement on Trade in Services
GATT General Agreement on Tariffs and Trade
GSP Generalized System of Preferences
HPA Hanoi Plan of Action, 1998
HS WCO Harmonized Commodity Description and Coding System
IAI Initiative for ASEAN Integration (2000)
IAP Individual Action Plan
ICC International Chamber of Commerce
ICES Indian Customs EDI System
ICENET dedicated Indian Customs network
ICON Import Conditions Database
ICS Integrated Cargo System
ICT information and communications technology
IPRs intellectual property rights
ISO International Standardization Organization
JEMS Joint Entry Management System
LCS land customs stations
LDC Least Developed Country
MAPA Manila Action Plan for APEC
MFN most favoured nation
MRAs Mutual Recognition Arrangements
NAFTA North American Free Trade Agreement
NAMA Non-Agricultural Market Access
NGTF Negotiating Group on Trade Facilitation
NIDB National Import Database
NTBs non-tariff barriers
OECD Organisation for Economic Co-operation and Development
PACCS Pakistan Customs Computerized System
PACER Pacific Agreement on Closer Economic Relations
xiv
PCA post-clearance audit
PICTA Pacific Island Country Trade Agreement
PSI pre-shipment inspection
PTA preferential trade agreement
QIZ Qualified Industrial Zones
RMS risk management system
RTA regional trade agreement
SAARC South Asian Association for Regional Cooperation
SAEU South Asian Economic Union
SAFTA South Asian Free Trade Agreement
SAPTA SAARC Preferential Trading Arrangement
SDT special and differential treatment
SEP Special Economic Partnership
SMC SAFTA Ministerial Council
SNFPs Single National Focal Points
SP specified process
SPARTECA South Pacific Regional Trade and Economic Cooperation Agreement
SPS sanitary and phytosanitary measures
SVB Special Valuation Branch
TBT technical barriers to trade
TFAP Trade Facilitation Action Plan
TIFA Trade and Investment Framework Agreement
TVM transaction value method
UN/CEFACT United Nations Centre for Trade Facilitation and Electronic Business
UN/EDIFACT United Nations/Electronic Data Interchange For Administration,
Commerce and Transport
UNCITRAL United Nations Commission on International Trade Law
UNCTAD United Nations Conference on Trade and Development
USITC United States International Trade Commission
VA value-added
VAP Vientiane Action Programme
VRAM Valuation Risk Assessment Module
WCO World Customs Organization
WTO World Trade Organization

1
I. TRADE FACILITATION BEYOND THE DOHA
ROUND OF NEGOTIATIONS
By Yann Duval*
Introduction
The 147 member governments of WTO agreed on 1 August 2004 to commencenegotiations on trade facilitation. This decision followed a heated and protracted debateon trade facilitation among WTO member countries that started after the SingaporeMinisterial Meeting in 1996 and contributed, together with three other so-called Singaporeissues , to the failure of the WTO Ministerial Meeting in Cancun in 2003.
The 1 August 2004 decision of the WTO General Council, often referred to as theJuly Package , was seen as a significant breakthrough by many as well as a sign of the
multilateral trading system s recognition of the importance of trade facilitation issues andits increased readiness to tackle non-tariff barriers. While some developing countries hadinitially objected to negotiations on trade facilitation, the Negotiating Group on TradeFacilitation was ultimately found to be one of the most productive WTO negotiating groups,resulting in a significant number of joint proposals by developed countries and developingcountries, and thus clearly making progress toward a consensus.
That being said, the current WTO trade facilitation negotiations1 have limitedthe negotiation agenda to mainly clarifying and improving relevant aspects of Article V(freedom of transit), Article VIII (fees and formalities) and Article X (publication andadministration of trade regulations) of GATT 1994.2 While it seems reasonable thatnegotiations at the multilateral level on this new and complex issue be kept limited andfocused to increase the probability of a timely consensus, at least at first, it is importantthat trade policy makers keep a broader perspective on trade facilitation, as a significantnumber of the priority issues raised by those actually involved in trade transactions (i.e.,the traders) are not covered by the current multilateral trade negotiations.
* Yann Duval is Economic Affairs Officer, Trade Policy Section, Trade and Investment Division,ESCAP. The views expressed do not necessarily reflect those of the United Nations. Helpful commentsfrom Peng Bin are gratefully acknowledged. The author may be contacted at [email protected].
1 The negotiating agenda also included enhancing technical assistance and support forcapacity-building as well as effective cooperation between customs or any other appropriate authoritieson trade facilitation and customs compliance issues. See Annex D of the WTO General Council sdecision at: http://www.wto.org/english/tratop_e/dda_e/ddadraft_31jul04_e.pdf.
2 It is currently unclear as to when (or whether) the negotiations on this restricted agenda will cometo fruition since they are part of the single undertaking of the Doha Round of negotiations, in whichagreements on agriculture and a number of other issues remain elusive.
2
After defining trade facilitation and highlighting the linkages between trade facilitationand WTO beyond the three GATT Articles under negotiation, this chapter succinctly exploresthree emerging (in the case of customs valuation, re-emerging) issues, drawing from otherchapters in this book as well as other relevant literature: (a) trade facilitation and regionaltrade agreements and initiatives; (b) trade facilitation and customs valuation; and (c) tradefacilitation and services. The chapter then briefly discusses trade facilitation in the broadercontexts of business facilitation and trade costs, before concluding with some thoughts onthe linkages between trade facilitation, infrastructure and poverty reduction.
A. Trade facilitation: Increasing the efficiency
of trading processes
There is no agreed definition of trade facilitation. In fact, trade facilitation has beenreferred to as the plumbing of international trade as it focuses on the efficient implementationof trade rules and regulations. Indeed, what appears to differentiate trade facilitation fromother trade issues is its focus on efficient processes, e.g., how to efficiently implementpolicies or regulations, or how to efficiently exchange goods and services across nationalborders, and related documentation. As such, tariff barriers are not covered by tradefacilitation, but customs valuation generally is covered.3
The International Chamber of Commerce (ICC) also emphasizes process efficiencyin its definition of trade facilitation: To improve the efficiency of the processes associatedwith trading in goods across national borders .4 This definition is also reminiscent of theconcept of trade efficiency as outlined in the Colombus Ministerial Declaration of 1994.5
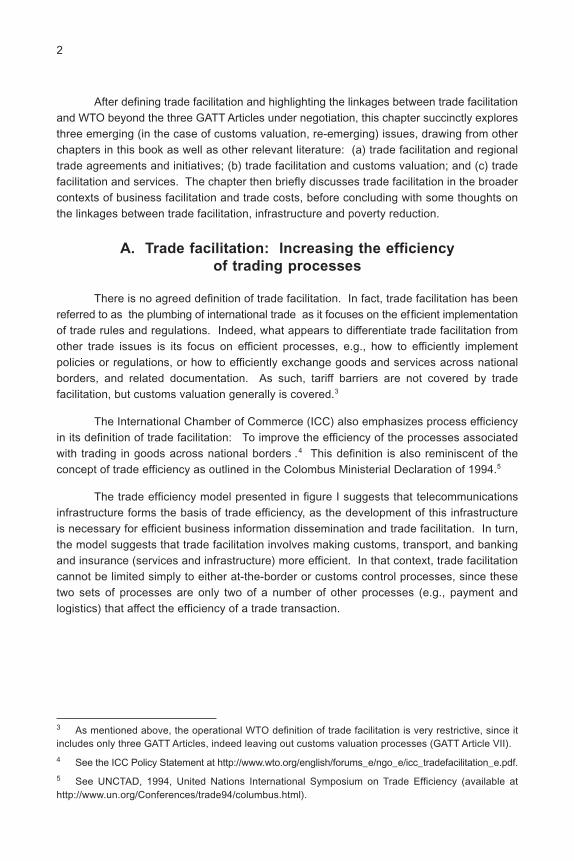
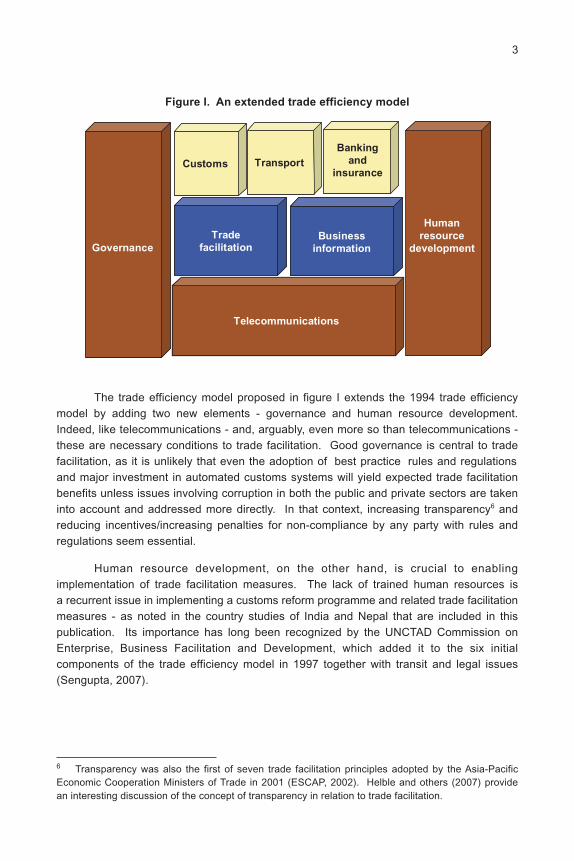
The trade efficiency model presented in figure I suggests that telecommunicationsinfrastructure forms the basis of trade efficiency, as the development of this infrastructureis necessary for efficient business information dissemination and trade facilitation. In turn,the model suggests that trade facilitation involves making customs, transport, and bankingand insurance (services and infrastructure) more efficient. In that context, trade facilitationcannot be limited simply to either at-the-border or customs control processes, since thesetwo sets of processes are only two of a number of other processes (e.g., payment andlogistics) that affect the efficiency of a trade transaction.
3 As mentioned above, the operational WTO definition of trade facilitation is very restrictive, since itincludes only three GATT Articles, indeed leaving out customs valuation processes (GATT Article VII).
4 See the ICC Policy Statement at http://www.wto.org/english/forums_e/ngo_e/icc_tradefacilitation_e.pdf.
5 See UNCTAD, 1994, United Nations International Symposium on Trade Efficiency (available athttp://www.un.org/Conferences/trade94/columbus.html).
3
The trade efficiency model proposed in figure I extends the 1994 trade efficiencymodel by adding two new elements - governance and human resource development.Indeed, like telecommunications - and, arguably, even more so than telecommunications -these are necessary conditions to trade facilitation. Good governance is central to tradefacilitation, as it is unlikely that even the adoption of best practice rules and regulationsand major investment in automated customs systems will yield expected trade facilitationbenefits unless issues involving corruption in both the public and private sectors are takeninto account and addressed more directly. In that context, increasing transparency6 andreducing incentives/increasing penalties for non-compliance by any party with rules andregulations seem essential.
Human resource development, on the other hand, is crucial to enablingimplementation of trade facilitation measures. The lack of trained human resources isa recurrent issue in implementing a customs reform programme and related trade facilitationmeasures - as noted in the country studies of India and Nepal that are included in thispublication. Its importance has long been recognized by the UNCTAD Commission onEnterprise, Business Facilitation and Development, which added it to the six initialcomponents of the trade efficiency model in 1997 together with transit and legal issues(Sengupta, 2007).
Figure I. An extended trade efficiency model
6 Transparency was also the first of seven trade facilitation principles adopted by the Asia-PacificEconomic Cooperation Ministers of Trade in 2001 (ESCAP, 2002). Helble and others (2007) providean interesting discussion of the concept of transparency in relation to trade facilitation.
Transport
Banking
and
insurance
Trade
facilitationBusiness
information
Telecommunications
Customs
Governance
Human
resource
development

4
B. Trade facilitation and the WTO
The limited scope of trade facilitation in the ongoing multilateral trade negotiationswas noted earlier. However, increasing the efficiency of trade-related processes has longbeen on the agenda of the multilateral trading system, as shown by the already long list ofWTO provisions and agreements that are related to trade facilitation (table 1).
Table 1. List of WTO provisions related to trade facilitation
Article/Agreement Subject
GATT 1994, Article V Freedom of transit
GATT 1994, Article VII Valuation for customs purposes
GATT 1994, Article VIII Fees and formalities connected with importsand exports
GATT 1994, Article IX Marks of origin
GATT 1994, Article X Publications and administration of traderegulations
Agreement on Implementation of Article VII Customs valuationof the GATT 1994
Agreement on Rules of Origin Rules of origin
Agreement on Import Licensing Procedures Import licensing
Agreement on Pre-shipment Inspection Pre-shipment inspection procedures
Agreement on Technical Barriers to Trade Rules related to technical standards
Agreement on the Application of Sanitary Rules related to application of SPSand Phytosanitary Measures measures
General Agreement on Trade in Services Rules related to facilitation trade in services
Source: Compiled based on World Trade Organization, G/L/244, 1998.
Negotiating trade facilitation issues at the multilateral level appears mostappropriate when the issues are of concern to a large number of participants, and whenthey involve the development of common standards and procedures. While there area number of other international organizations involved in trade facilitation, in particular theWorld Customs Organization (WCO), WTO is the only organization providing a credibleframework for binding commitments in trade facilitation. In addition to the technicalassistance/capacity-building implications, one important benefit from negotiating tradefacilitation at WTO for developing country national governments may also be that it providesthem with the external mandate necessary to advance often very sensitive trade facilitationreforms at home.
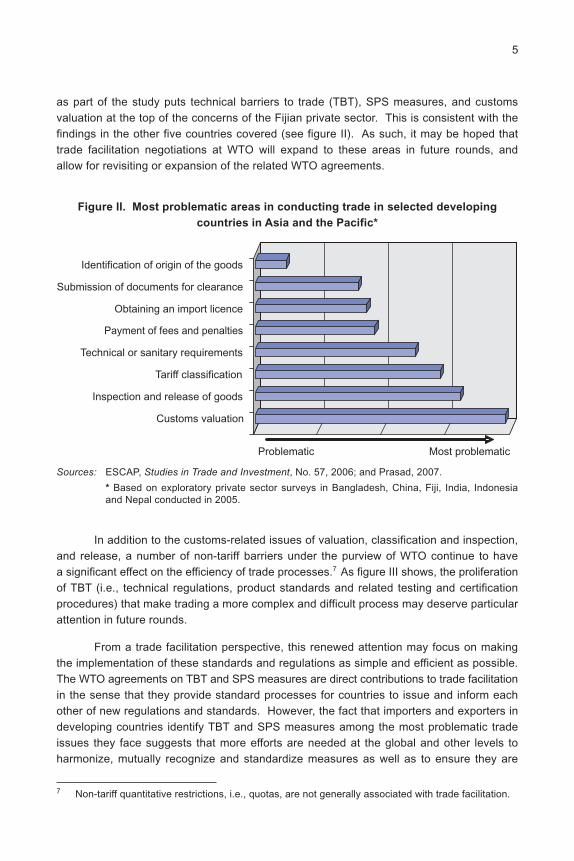
In chapter VII of this publication, B.C. Prasad builds on ESCAP (2006) in order topresent a comparative analysis of the trade facilitation needs of the private sector in Fijiand a number of other developing countries in Asia. The private sector survey conducted
5
as part of the study puts technical barriers to trade (TBT), SPS measures, and customsvaluation at the top of the concerns of the Fijian private sector. This is consistent with thefindings in the other five countries covered (see figure II). As such, it may be hoped thattrade facilitation negotiations at WTO will expand to these areas in future rounds, andallow for revisiting or expansion of the related WTO agreements.
Figure II. Most problematic areas in conducting trade in selected developing
countries in Asia and the Pacific*
Sources: ESCAP, Studies in Trade and Investment, No. 57, 2006; and Prasad, 2007.
* Based on exploratory private sector surveys in Bangladesh, China, Fiji, India, Indonesiaand Nepal conducted in 2005.
Customs valuation
Inspection and release of goods
Tariff classification
Technical or sanitary requirements
Payment of fees and penalties
Obtaining an import licence
Submission of documents for clearance
Identification of origin of the goods
Problematic Most problematic
In addition to the customs-related issues of valuation, classification and inspection,and release, a number of non-tariff barriers under the purview of WTO continue to havea significant effect on the efficiency of trade processes.7 As figure III shows, the proliferationof TBT (i.e., technical regulations, product standards and related testing and certificationprocedures) that make trading a more complex and difficult process may deserve particularattention in future rounds.
From a trade facilitation perspective, this renewed attention may focus on makingthe implementation of these standards and regulations as simple and efficient as possible.The WTO agreements on TBT and SPS measures are direct contributions to trade facilitationin the sense that they provide standard processes for countries to issue and inform eachother of new regulations and standards. However, the fact that importers and exporters indeveloping countries identify TBT and SPS measures among the most problematic tradeissues they face suggests that more efforts are needed at the global and other levels toharmonize, mutually recognize and standardize measures as well as to ensure they are
7 Non-tariff quantitative restrictions, i.e., quotas, are not generally associated with trade facilitation.

6
Figure III. Average applied tariffs and number of technical barriers to trade,
1996-2005
Source: Duval, 2007, based on Ng, 2006, and Dhar and Kallumal, 2007.
0
2
4
6
8
10
12
14
16
18
20
1996 1997 1998 1999 2000 2001 2002 2003 2004 2005
Avera
ge a
pp
lied
tari
ffs (
%)
0
1 000
2 000
3 000
4 000
5 000
6 000
7 000
8 000
Nu
mb
er
of
TB
Ts
Tariff high-income, OECD Tariff, developing countriesCumulative TBTs, OECD Cumulative TBTs, developing countries
Cumulative TBTs, total
not unnecessarily restrictive. A very practical approach to the measures would helpimmensely in this respect, e.g., not setting the authorized level of a particular chemicalbeyond the capacity of standard testing equipment available at the time the measure ispublished.8
C. Trade facilitation, and regional/bilateral trade initiatives
and agreements
The number of bilateral and regional trade agreements and related initiatives hasexploded in recent years (figure IV).9 Of the 133 trade agreements recorded in theAsia-Pacific Trade and Investment Agreement Database (APTIAD), only 35 (26 per cent)cover trade facilitation.10 However, seven (70 per cent) of the 10 trade agreements thathave come into force since 2004 in the ESCAP region include trade facilitation. A closerlook at how trade facilitation issues may be addressed through preferential trade agreementsand other bilateral and regional initiatives is therefore warranted.
8 Setting the authorized level of a chemical to zero rather than to a scientifically determined andmeasurable value will lead to situations where shipments initially accepted may suddenly be rejectedas testing facilities or equipment are being upgraded.
9 See also Mikic, 2007, and Bonapace and Mikic, 2007.
10 The list of trade agreements that cover trade facilitation is provided in the annex to this chapter.

7
In chapter II of this publication, P. Wille and J. Redden compare the treatment oftrade facilitation in four selected regional trade initiatives - the ASEAN free trade area(AFTA), Asia-Pacific Economic Cooperation (APEC), South Asian Free Trade Area (SAFTA)and the Pacific Agreement for Closer Economic Relations (PACER) - as well as in onebilateral free trade agreement, the Australia-Singapore Free Trade Agreement (ASFTA).On the basis of these trade initiatives and ASFTA, they develop model trade facilitationprinciples and measures that may be instructive for developing country negotiators andpolicy makers.
Given the varying degrees of progress in trade facilitation reform in the agreements,the comparative analysis provided in chapter II of this publication reinforces the importanceof clearly formulated, specific trade facilitation principles and measures if trade facilitationreform is to be successful. The effectiveness of specific measures implemented by partiesto APEC, ASFTA and, to a lesser extent, AFTA suggest clearly designed trade facilitationprinciples and measures that, if not binding, at least require a commitment to quantitativeoutcomes are more likely to succeed than purely aspirational approaches.
Wille and Redden find that each initiative or agreement appears to have playeda positive role in accelerating the reform process and, to some extent, in driving reform at
Figure IV. Asia-Pacific noodle bowl of preferential trade agreements
Source: ESCAP APTIAD, February 2007.
The Asia-Pacific noodle bowl
8
the multilateral level. However, they note that while some of the costs associated withtrade can be reduced by bilateral initiatives, many current trade facilitation initiatives at thebilateral or plurilateral level address essentially multilateral issues. Pressure from a majortrading partner, promises of reciprocity or of commitments to trade-related capacity-building,as in PACER, may contribute to the attractiveness of implementing trade facilitationmeasures. However, as APEC members and others have recognized, it is crucial tocoordinate trade facilitation with multilateral trade facilitation negotiations or at least withthe major regional trading partners.
While some trade facilitation priorities will undoubtedly be based on cost and easeof implementation, the study stresses the need for each country to assess its particularneeds, to harmonize and sequence reforms in cooperation with key trading partners, andto link capacity-building, technical assistance, and special and differential needs witha specific and detailed trade facilitation reform programme.
In chapter III, S. Chaturvedi finds in his analysis of trade facilitation provisions inSouth Asian free trade areas that coverage of trade facilitation issues is minimal in all butone of the five trade agreements (two regional and three bilateral) reviewed against the listof trade facilitation measures relevant to GATT Articles V, VIII and X, and which are undernegotiation at WTO. On the basis of a review of intraregional trade flows and unilateraltrade facilitation initiatives by South Asian countries, Chaturvedi finds that transit facilitationmeasures, including the development of infrastructure at land customs stations (LCS) aswell as border agency coordination, are of particular importance to the region and thedevelopment of intraregional trade. These issues could be tackled in part through theinclusion of relevant provisions in regional and bilateral trade agreements.
1. The issue of rules of origin
Although an increasing number of preferential trade agreements contain rathergeneral and customs-focused trade facilitation provisions, these agreements may notultimately contribute to the efficiency of trading processes, mainly due to the rules oforigins they contain. Rules of origin are necessary for determining which products willenjoy reduced bilateral tariffs and which will not, and to prevent trans-shipment of goodsthrough the customs territory in a bloc with the lowest tariff.
In chapter IV, W.E. James explains that while many of the emerging FTAs appearto be consistent with Article XXIV of GATT and Article V of GATS in principle, the complexand idiosyncratic rules of origin in these agreements threaten to complicate internationalcommerce and divert trade rather than create it. Preferential trade agreements amongdeveloping countries (e.g., AFTA) have vague rules and high administrative costs that(together with small margins of preference) deter business from seeking to take advantageof preferences, thus limiting the amount of trade these agreements create.
His review of newly emerging FTAs involving key Asian hubs (China, Japan, theRepublic of Korea, Singapore and Thailand) reveals that rules of origin not only differbetween hubs but also within them, suggesting that rules of origin have been framed with

9
the interests of industrial lobbies in mind rather than with trade facilitation as the goal. Asa result, countries that enter into agreements with hubs may find that their exporters willshift purchases of intermediate goods away from the lowest cost suppliers in order tocomply with rules of origin in gaining preferential access to the hub. Thus, their productsmay become less competitive in third country markets, and efficient existing productionnetworks may be displaced by less efficient ones that thrive on tariff discrimination ratherthan on low production costs. This encourages closed as opposed to open regional blocs,and is of particular concern since less developed and small countries are less able thandeveloped countries to partake of preferential treatment. James concludes that harmonizationof preferential rules of origin may be unrealistic, however, and a less ambitious solutionmay instead be feasible, such as gradually lowering value-added content rules for lessdeveloped countries, or allowing averaging over time.
D. Trade facilitation and customs valuation
Customs valuation refers to the process and method(s) used by customs authoritiesto determine the value of a particular good. Since tariffs are usually calculated asa percentage of the value of the goods (i.e., ad valorem), the particular method used todetermine value will directly affect the amount of tariff duties collected on a particularshipment.11 This is therefore of great concern to traders, as non-transparent valuationmechanisms - typically combined with inefficient or even absent advance ruling mechanisms- lead to uncertainties regarding the profitability of each trade transaction.
The importance of efficient and transparent customs valuation processes has longbeen recognized and has led WTO members to sign a separate agreement on theimplementation of GATT Article VII, commonly referred to as the WTO Customs ValuationAgreement (CVA). The CVA is based primarily on the transaction value method (TVM),i.e., value is assessed based on the value indicated in the invoice provided by the trader.12
As such, the CVA is clearly aimed at facilitating trade, considering information provided bythe trader as the basis for valuation. However, the CVA allows for five other methods to beconsidered in a hierarchical order, should Customs have doubt about the invoice valueprovided. It is therefore interesting to see that, at a time when most WTO members aresupposed to have fully implemented the CVA, private sector surveys in developing countries(see, for example, ESCAP, 2006) still identify customs valuation as a key issue.
To shed some light on the issue, customs valuation is examined in India, Nepal,and Fiji in chapters V, VI and VII, respectively. In chapter V, Chaturvedi reviews effortsmade by India in making customs valuation more efficient and in implementing the CVA.
11 This amount is also affected by the tariff rate applicable to the good, which will depend on howa particular good is classified. Tariff classification is one of the measures being negotiated at WTO,although most countries already rely on the WCO HS system for classification purposes. Whilemis-classification is identified as a problematic issue, the customs valuation procedure appears to beof relatively greater concern to traders (see figure II).
12 A number of adjustments are, however, authorized as per CVA Article VIII.

10
Some of the major issues identified by traders in India regarding customs valuation arefrequent rejections of transaction value, the lack of transparency, the slow processing ofvaluation cases by the special valuation branch and the lack of expertise among fieldofficers. The Indian case study reveals that customs revenue declined continuously between1999 and 2002, but has consistently increased since then. Several measures were introducedto minimize revenue loss and to tackle under-evaluation, resulting in a remarkable increasein additional revenue from the enhancement of declared transaction values. Many privatesector companies indicated, however, that the additional measures imposed by the CustomsDepartment are the results of misdeeds of a few traders - accounting for less than 18 percent of the transactions - and that those traders should therefore be specifically targeted.
In chapter VI, P.R. Rajkarnikar examines the case of Nepal, a country that had yetto fully implement the CVA at the time of the study (June 2006), but that had alreadyadopted TVM as the primary valuation method. He finds that legislative and otherimprovements being made as part of the implementation of the CVA will have no significantimpact on the volume of trade and import prices; changes in valuation practices areexpected to slightly increase (2.1 per cent) the cost of imported goods and exert a negativeeffect on the demand for imports (-1.9 per cent). On the other hand, the improvedvaluation system may be expected to help reduce under-invoicing and informal trade, thusexerting a positive impact on customs revenue. Importantly, the case study highlights theneed for implementing TVM (and, by extension, the CVA) in conjunction with other tradefacilitation measures - notably post-clearance audit - to avoid revenue linkage.
All the case studies, including that of Fiji by Prasad in chapter VII, point to the limitsof the CVA, which can be abused by both traders and customs officers for their ownbenefit, depending on the way and the environment in which it is implemented. Togetherwith advance rulings, risk management, post-clearance audit and independent appealmechanisms, measures to develop trust and cooperation between customs officers andthe private sector are the key to resolving potential undervaluation issues while notunnecessarily impeding trade.
Meaningful commitments by WTO members on trade facilitation in the ongoinground would likely make the CVA more effective, since many of the measures beingdiscussed under Articles VIII and X are linked to the CVA. At the same time, one mayquestion the rationale for recognizing, on the one hand, the need to fully take into accountthe individual capacity of countries to implement measures under these two articles and,on the other hand, for making CVA implementation mandatory - even after a delay of fouryears, a period that has expired for most members.13
13 The issue of implementation cost arises here. J.M. Finger (2000) pointed to the unwillingness ofWTO to fully take into account the costs involved in the reforms linked to implementation of the WTOagreement. In particular, he noted that a customs reform project alone at that time could easily costUS$ 20 million for buildings, equipment and staff training.

11
E. Trade facilitation and services
The trade efficiency model presented above highlights the linkages between tradefacilitation and key service sectors, i.e., telecommunication, transport and logistics, andthe banking and insurance sectors. As shown in figure V, trade transactions involve flowsof goods, documents and information as well as financial flows, the efficiency of whichdepends at least as much on (private sector) service providers as it does on governmentagencies. Comprehensive trade facilitation frameworks and strategies therefore wouldneed to address the issue of how to develop these key sectors, including through servicestrade liberalization.
Figure V. The three flows of international trade
Source: Duval, ITC Regional Business Forum on e-Finance, August 2006.
The relationship between liberalization in the logistics sector and trade facilitationis explored in some depth by D. De Sousa and C. Findlay in chapter IX of this publication.Using exports of tuna from South Australia to Japan as an illustrative example, their studydemonstrates that the improvement of the performance of logistics services throughdomestic liberalization may generate a virtuous cycle, whereby international trade is increased,and that this, in turn, may increase the demand for logistics services. Their study furthersupports the view that benefits of improved performance of logistics services could beenhanced through governmental measures that assist the flow of trade across nationalborders. The extent and pace of measures taken by governments to liberalize the supplyof logistics services as well as facilitate trade will determine whether or not a virtuous cyclewill be generated and the extent of the benefits that will accrue from that cycle.
A supply-chain approach to trade facilitation, whereby bottlenecks would be identifiedalong the chain, and relevant private and public entities would take concerted action toremove them, would be most effective. Indeed, improving the customs clearance time forshipments of fresh food products by an additional 20 minutes may ultimately not facilitate
Trade documents
flow
Goods
flow
Financial
flow
Country of the sellerCountry of the buyer
Buyer
Banks
Customs
Othergovernmentagencies
Shipper Buyer
Banks
Customs
Othergovernmentagencies
Shipper
12
trade as much as the issuance of policies or regulations that would facilitate the constructionof cold storage and logistics facilities at airports.
Relatively little research has been conducted so far on how governments in developingcountries can support the development of supply-chain efficiency-enhancing services. Thesequencing of policy reforms as well as the level at which underlying measures need to benegotiated (global, regional, bilateral and domestic) appear to be particularly relevant.
F. Trade facilitation in a broader context
Globalization has blurred the frontiers between domestic and international issues.Coherence and coordination between policies has become the key to offering domesticfirms a national environment in which they can strive - and develop the capacity to competeand benefit from globalization - while at the same time ensuring the sustainable developmentof the country as a whole. As such, it is important to remember that trade facilitation isone element of a complex set of interrelated issues. Given the often limited resourcesavailable in developing countries, it may be desirable to see trade facilitation (and thespecific measures commonly associated with it) as a component of broader frameworksaimed at facilitating business development and reducing transaction costs.
1. Trade facilitation and business facilitation
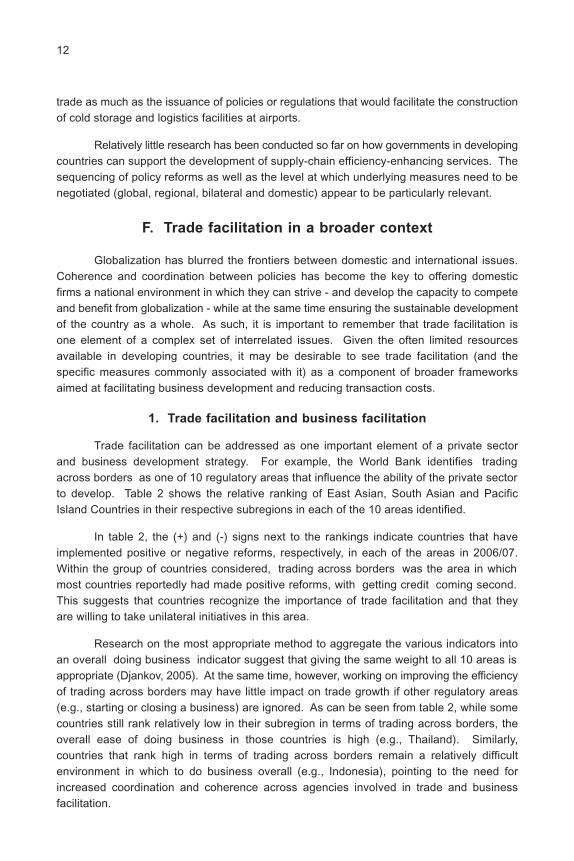
Trade facilitation can be addressed as one important element of a private sectorand business development strategy. For example, the World Bank identifies tradingacross borders as one of 10 regulatory areas that influence the ability of the private sectorto develop. Table 2 shows the relative ranking of East Asian, South Asian and PacificIsland Countries in their respective subregions in each of the 10 areas identified.
In table 2, the (+) and (-) signs next to the rankings indicate countries that haveimplemented positive or negative reforms, respectively, in each of the areas in 2006/07.Within the group of countries considered, trading across borders was the area in whichmost countries reportedly had made positive reforms, with getting credit coming second.This suggests that countries recognize the importance of trade facilitation and that theyare willing to take unilateral initiatives in this area.
Research on the most appropriate method to aggregate the various indicators intoan overall doing business indicator suggest that giving the same weight to all 10 areas isappropriate (Djankov, 2005). At the same time, however, working on improving the efficiencyof trading across borders may have little impact on trade growth if other regulatory areas(e.g., starting or closing a business) are ignored. As can be seen from table 2, while somecountries still rank relatively low in their subregion in terms of trading across borders, theoverall ease of doing business in those countries is high (e.g., Thailand). Similarly,countries that rank high in terms of trading across borders remain a relatively difficultenvironment in which to do business overall (e.g., Indonesia), pointing to the need forincreased coordination and coherence across agencies involved in trade and businessfacilitation.

13
Ta
ble
2.
Su
bre
gio
na
l ra
nk
ing
s o
f s
ele
cte
d A
sia
-Pa
cif
ic c
ou
ntr
ies
in
te
rms
of
ea
se
of
tra
din
g a
nd
oth
er
ea
se
of
do
ing
bu
sin
es
s i
nd
ica
tors
(fi
sc
al
ye
ar
20
07
)
Ea
se
of
do
ing
Tra
din
gS
tart
ing
De
ali
ng
Em
plo
yin
gR
eg
iste
rin
gG
ett
ing
Pro
tec
tin
gP
ay
ing
En
forc
ing
Clo
sin
g
bu
sin
es
sa
cro
ss
a b
us
ine
ss
wit
hw
ork
ers
pro
pe
rty
cre
dit
inv
es
tors
tax
es
co
ntr
ac
ts a
bu
sin
es
s
ran
kin
gb
ord
ers
lic
en
ce
s
Ea
st
an
d S
ou
th-E
as
t A
sia
n e
co
no
mie
s
Sin
gapo
re1
[1
]1
[1
]1
11
13
11
21
Hon
g K
ong,
Chi
na2
[4
]2
[3
]2
52
71
22
14
Rep
ublic
of K
orea
5 [
30
]3
[1
3]
93
119
57
93
2
Mal
aysi
a4
[2
4]
4 [
21
]5(
+)
103
82
34(
+)
86
Taiw
an P
rovi
nce
of C
hina
6 [
50
]5
[2
9]
812
134
68
89
3
Indo
nesi
a1
0 [
12
3]
6 [
41
]14
(-)
8(+
)14
129(
+)
6(+
)10
1310
Chi
na8
[8
3]
7 [
42
]10
14(+
)9
510
(+)
1014
47(
+)
Tha
iland
3 [
15
]8
(+)
[50
]3
24
34
56
55
Phi
lippi
nes
11
[1
33
]9
[5
7]
127
1010
1112
1211
11
Vie
t Nam
9 [
91
]1
0 [
63
]7
67
67(
+)
13(+
)13
79
Tim
or-L
este
14
[1
68
]11
[7
8]
11(+
)9
614
1311
514
13
Cam
bodi
a1
2 [
14
5]
12
(+)
[13
9]
1313
1211
149(
+)
3 (+
)12
14
Lao
PD
R1
3 [
16
4]
13
(+)
[15
8]
6(+
)11
813
1214
1110
12
Mon
golia
7 [
52
]1
4 [
16
8]
44
52
84
7(+
)6
8

14Ta
ble
2.
(co
nti
nu
ed)
Ea
se
of
do
ing
Tra
din
gS
tart
ing
De
ali
ng
Em
plo
yin
gR
eg
iste
rin
gG
ett
ing
Pro
tec
tin
gP
ay
ing
En
forc
ing
Clo
sin
g
bu
sin
es
sa
cro
ss
a b
us
ine
ss
wit
hw
ork
ers
pro
pe
rty
cre
dit
inv
es
tors
tax
es
co
ntr
ac
ts a
bu
sin
es
s
ran
kin
gb
ord
ers
lic
en
ce
s
Pa
cif
ic I
sla
nd
ec
on
om
ies
Tong
a2
[4
7]
1 [
44
]2
52
68
73
1(+
)3
Mar
shal
l Isl
ands
9 [
89
]2
[4
6]
11
19
10(+
)8
92
7
Sol
omon
Isla
nds
6 [
79
]3
[7
4]
86
98
65
47
5
Pap
ua N
ew G
uine
a8
[8
4]
4 [
82
]7
108
43
310
104
Mic
rone
sia
10
[11
2]
5 [
85
]3
24
102
97
89
Kiri
bati
5 [
73
]6
[9
7]
99
73
74
15
10
Sam
oa3
[6
1]
7 [
10
8]
107
52
41
66
8
Fij i
1 [
36
]8
[111
]5
46
51
25
3(+
)6
Pal
au7
[8
2]
9 [
12
1]
48
31
910
89
2
Van
uatu
4 [
62
]1
0 [
14
2]
63
107(
-)5
62
41
So
uth
As
ian
ec
on
om
ies
Sri
Lank
a3
[1
01
]1
(+)
[60
]2(
+)
85
54(
-)4
74
1
Indi
a7
[1
20
]2
(+)
[79
]8
64
41(
+)
38
86
Pak
ista
n2
[7
6]
3 [
94
]5
27(
+)
33(
+)
26
52
Mal
dive
s1
[6
0]
4 [
11
0]
31
18
64
12
5
Ban
glad
esh
4 [
10
7]
5 [
11
2]
7(-)
36
72
14(
-)7
4
Bhu
tan
6 [
11
9]
6 [
14
9]
4(+
)4
2(+
)2(
+)
77
31
7
Nep
al5
[111
]7
[1
51
]6
58
14
45
33
Afg
hani
stan
8 [
15
9]
8 [
17
4]
17
36(
+)
88
26
7
Sou
rce:
Cal
cula
ted
base
d on
Eas
e of
Doi
ng B
usin
ess
data
base
, at w
ww
.doi
ngbu
sine
ss.o
rg.
Not
e:(+
) an
d (-
) de
note
s po
sitiv
e or
neg
ativ
e re
form
s in
200
6/07
; ran
ks in
[ ] a
re g
loba
l ran
king
s ou
t of 1
78 e
cono
mie
s.

15
Figures VI and VII show, for a selection of South and East Asian countries,the number of documents required for imports and exports as well as the time it takes fora 20-foot container of an identical good to be transported from a factory in the largestbusiness city to a ship in the most accessible port (or vice versa). These are four of thesix indicators used in determining the ease of trading across borders rankings. The othertwo indicators are costs associated with import or export procedures, respectively, whichare calculated as the sum of all fees associated with completing the procedures forexporting or importing the goods (including costs for documents, administrative fees forcustoms clearance and technical control, terminal handling charges and inland transport).14
Figures VI and VII reveal that the number of documents for imports - generallyhigher than those required for exports - range widely across countries in the region, from 4in Hong Kong, China to 11 in Cambodia and Bhutan. A casual observation of the datareveals that time required for imports and exports is highly correlated with the number ofdocuments required as well as with the costs of import and exports. This is explained bythe fact that 75 per cent of the time/delays are attributable to administrative hurdles suchas customs and tax procedures, clearances and cargo inspections, and only 25 per cent topoor road and port infrastructure (Djankov and others, 2007).
14 For methodological details, please see http://www.doingbusiness.org/MethodologySurveys/TradingAcrossBorders.aspx.
Figure VI. Time and documentary requirements for imports and exports
in South Asian countries (fiscal year 2007)
Source: Doing Business Database.
0
2
4
6
8
10
12
Bangladesh Bhutan India Maldives Nepal Pakistan Sri Lanka
Nu
mb
er
of
do
cu
me
nts
0
10
20
30
40
50
60
70
Da
ys
Documents for exports (number) Documents for imports (number)
Time for exports (days) Time for imports (days)

16
Looking at the four above-mentioned indicators is particularly useful as ithighlights the fact that trade facilitation really begins at home - the indicators are essentiallybased on domestic regulations and policies, except for landlocked countries. Importersand exporters in many developing countries often point to domestic, rather than foreign,regulations and processes as the main sources of trade in inefficiencies (e.g., Bhattacharyaand Hossain, 2006). In that context, global and regional trade facilitation initiatives areimportant but will only be useful in support of wider ranging domestic initiatives. Thissupport role may include:
(a) Strengthening the mandate for trade facilitation reforms at home to facilitateimplementation of measures that will negatively affect the welfare of a smallbut politically significant group of individuals (e.g., officials in charge of customsand enforcement of related regulations);
(b) The development of harmonized documents, processes and standards to beadopted and implemented in each country, further facilitating cross-bordertrade (this function has been performed by WCO and UN/CEFACT as well asWTO, among others);
(c) Facilitating the provision of technical assistance and capacity-building fortrade facilitation - this function may be served by a future WTO trade facilitationagreement - as well as the sharing of knowledge and experience (includingthrough voluntary peer review mechanisms).
Governments in Asia are aware that enhancing trade-related domestic processesis one way to help their producers and traders gain, or at least maintain, competitiveness
Source: Doing Business Database.
Figure VII. Time and documentary requirements for imports and exports
in East Asian countries (fiscal year 2007)
0
2
4
6
8
10
12
Cambo
dia
China
Hong
Kong,
Chin
a
Taiw
an, P
rovin
ce o
f Chin
a
Indo
nesia
Rep. o
f Kor
ea
Lao
PDR
Mala
ysia
Mon
golia
Philipp
ines
Singap
ore
Thaila
nd
Timor
-Les
te
Viet N
am
Nu
mb
er
of
do
cu
men
ts
010203040506070
Days
Documents for exports (number) Documents for imports (number)
Time for exports (days) Time for imports (days)
17
in the global market. Unlike trade liberalization, trade facilitation also has little downsidefor governments, as it does not result in the loss of customs revenue, even if traderemains the same. Implementation costs of even the more complex trade facilitationmeasures are also typically dwarfed by long-term savings (Duval, 2006). As a result,significant and continuous unilateral trade facilitation efforts have been made in the regionby countries at various stages of development, based on the availability of resources attheir disposal. Some of the progress made by South Asian countries in relation to GATTArticles V, VIII and X is reviewed in chapter IV.
2. Trade facilitation and trade costs
The concept of trade costs is relatively recent but has taken on increasingimportance, particularly in the academic literature; yet, in contrast, trade facilitation remainsmostly absent from the literature.
Trade costs may be defined as all costs incurred in getting a product to a finaluser, other than the production costs of the good itself , broken down by Anderson andWincoop (2004) as transportation (freight and time) costs, (tariff and non-tariff) policybarriers, information costs, contract enforcement costs, legal and regulatory costs, andlocal (wholesale and retail) distribution costs. In other words, trade costs do includeall transaction costs involved in marketing a product, from identifying and negotiatinga contract with a buyer to the buying of the product by a consumer in the foreign retailstore. A breakdown of these costs for industrialized countries is provided in figure VIII, inpercentage of the value of the product traded. Border-related trade barriers, which includebarriers generally related to trade facilitation (presumably mainly under policy barriers )as well as many other barriers not always associated with trade facilitation (e.g., languageand currency barriers), amount to 44 per cent of the value of goods traded.
Policy barriers, including both tariff and non-tariff barriers, therefore make up lessthan one fifth of the overall border-related trade barriers estimated in this study. Theauthors recognize that their breakdown, based on a combination of direct observation and
Source: P. De, 2007, drawn from J.E. Anderson and E. van Wincoop, 2004.
Figure VIII. Estimated trade costs in industrialized countries
Trade costs
Transport costs(21%)
Border-related trade barriers(44%)
Retail and wholesaledistribution costs
(55%)
Freight costs(11%)
Transit costs(9%)
Policy barriers(tariff and NTBs)
(8%)
Languagebarrier(7%)
Currency barrier(14%)
Informationcosts barrier
(6%)
Security barrier(3%)
18
inferred costs, is only approximate. Nonetheless, it provides an interesting perspective ontrade facilitation and transaction costs, and suggests, in particular, that a large number ofalternative measures may assist in the facilitation of trade in its broadest sense, i.e., thereduction of trade transaction costs.
In chapter X of this publication, P. De elaborates on trade costs in Asian countries,focusing particularly on direct transport costs. His analysis shows, inter alia, that a reductionin tariffs and transport costs by 10 per cent each would increase bilateral trade by about2 per cent and 6 per cent, respectively. Therefore, the propensity to increase the trade islikely to be higher with a reduction of transport costs, rather than tariff reduction in thepresent context. The chapter also discusses freight costs in some detail, indicating thatfreight costs for imports by developing countries continue to be significantly higher thanthose of developed countries, with freight costs in developing Asia being on average116 per cent higher than in developed countries. At the same time, while ocean freightprices have fallen over time for the movement of vessels among some selected Asiancountries, auxiliary shipping charges have gone up, thereby offsetting some of the gainsarising from technological advancement in shipping and navigation, and trade liberalization.
Although some of the auxiliary shipping charges (e.g., documentation fees, congestionsurcharges and electronic data interchange fees) can be linked to core trade facilitationmeasures and issues, De (2007) and most of the literature on trade costs go well beyondtrade facilitation as defined in this publication. At the same time, however, the broadperspective on trade transaction costs that the trade cost concept provides is important fortrade policy makers when investing their limited resources in trade cost components thatwill provide the highest return.
3. Trade facilitation and trade infrastructure
The importance and direct linkage between trade facilitation and telecommunicationsinfrastructure has long been acknowledged (see figure I above). While some have arguedthat trade facilitation does not cover physical infrastructure, it has become increasinglyevident that many trade-related processes involve availability of specialized infrastructurein addition to the basic infrastructure that is often not available in many LDCs.
A number of trade facilitation measures, particularly those related to transparencyand publication of trade regulations, do not require significant infrastructure investment.However, increasing port efficiency and e-business usage/service sector infrastructure -two of four indicators used by World Bank economists to measure the potential benefitsfrom trade facilitation and found to be most important in realizing trade facilitation benefits(e.g., Wilson and others, 2003 and 2005)15 - do involve potentially significant investment ininfrastructure.
15 Interestingly, the most recent World Bank trade facilitation research appears to have focused ontransparency issues and does not emphasize trade or transport infrastructure factors (see Helble andothers, 2007). This de-emphasizing of infrastructure issues related to trade facilitation is consistentwith the scope of the WTO trade facilitation negotiations, which have focused heavily on transparencyissues with arguably limited infrastructure investment implications.
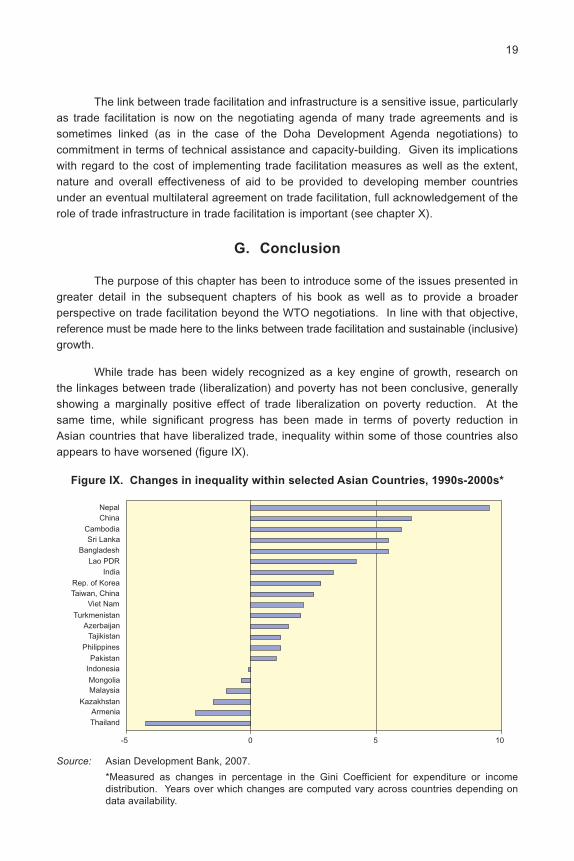
19
The link between trade facilitation and infrastructure is a sensitive issue, particularlyas trade facilitation is now on the negotiating agenda of many trade agreements and issometimes linked (as in the case of the Doha Development Agenda negotiations) tocommitment in terms of technical assistance and capacity-building. Given its implicationswith regard to the cost of implementing trade facilitation measures as well as the extent,nature and overall effectiveness of aid to be provided to developing member countriesunder an eventual multilateral agreement on trade facilitation, full acknowledgement of therole of trade infrastructure in trade facilitation is important (see chapter X).
G. Conclusion
The purpose of this chapter has been to introduce some of the issues presented ingreater detail in the subsequent chapters of his book as well as to provide a broaderperspective on trade facilitation beyond the WTO negotiations. In line with that objective,reference must be made here to the links between trade facilitation and sustainable (inclusive)growth.
While trade has been widely recognized as a key engine of growth, research onthe linkages between trade (liberalization) and poverty has not been conclusive, generallyshowing a marginally positive effect of trade liberalization on poverty reduction. At thesame time, while significant progress has been made in terms of poverty reduction inAsian countries that have liberalized trade, inequality within some of those countries alsoappears to have worsened (figure IX).
Figure IX. Changes in inequality within selected Asian Countries, 1990s-2000s*
Source: Asian Development Bank, 2007.
*Measured as changes in percentage in the Gini Coefficient for expenditure or incomedistribution. Years over which changes are computed vary across countries depending ondata availability.
-5 0 5 10
NepalChina
CambodiaSri Lanka
BangladeshLao PDR
IndiaRep. of KoreaTaiwan, China
Viet Nam
TurkmenistanAzerbaijan
TajikistanPhilippines
PakistanIndonesia
MongoliaMalaysia
KazakhstanArmeniaThailand

20
Increasing inequality is of some concern because it can dampen the effect ofgrowth on poverty reduction and hinder future growth prospects, i.e., sustainable development.The slow growth of agriculture relative to other sectors, and the interactions betweenmarket-oriented reforms, global integration and technology, have been identified amongthe key drivers of inequality (Asian Development Bank, 2007).
In that context, how might trade facilitation contribute to resolving distributionalissues? One of the key principles of trade facilitation is transparency. Making traderegulations and related processes more transparent involves simplifying and clarifyingthem, and making them accessible to the greatest possible number of firms and individuals,thereby increasing their opportunity to trade and take advantage of global market opportunities.While inefficient and complex trade and business procedures can be overcome by largecompanies, who can more easily allocate time and human resources for that purposethrough economies of scale, this is not the case with small and medium-sized enterprises.Trade facilitation can therefore be seen as a way to change the circumstances of tradewithin a country that give rise to inequalities in opportunities to trade.16
Relatively little research has been carried out into how trade facilitation measuresthat are commonly advocated17 (for example, risk management systems) affect firms ofvarious sizes, but particularly small and medium-sized firms. Keeping in mind the overridingaim of poverty reduction and inclusive growth, future research into trade facilitation mayneed to examine this issue more closely.
16 Trade facilitation may also benefit women, therefore contributing to gender equality. Indeed,countries with higher scores on the ease of doing business have large shares of women in the ranks ofboth entrepreneurs and workers. The reduction of bribery in connection with trade processes appearsto be particularly important in that context, as studies have shown that women are seen as easytargets for this kind of practice (World Bank, 2007).
17 See United Nations/CEFACT, 2001 for a list of measures.
affect

21
Annex
LIST OF BILATERAL AND REGIONAL TRADE AGREEMENTS
COVERING TRADE FACILITATION
Title of agreement Type* Status Trade facilitation (others)
South Pacific Regional Trade and PTA In force since 1981 YesEconomic Co-operation Agreement
Australia-New Zealand Closer FTA In force since 1983 YesEconomic Relations Trade Agreement
ASEAN Free Trade Area FTA In force since 1993 Yes. separate agreementshttp://www.aseansec.org/19046.htm
Agreement on Free Trade between FTA In force since 1994 Yesthe Government of the Republicof Georgia and the Government ofthe Russian Federation
Agreement between the Government FTA In force since 1995 Yes. Only to the extend ofof Republic of Armenia and the customs-related aspects of theGovernment of Republic of Moldova rules of originon Free Trade
Customs Union between Turkey CU In force since 1996 Yesand the European Community
Bay of Bengal Initiative for FA In force since 1997 YesMulti-Sectorial Technical andEconomic Cooperation
The European Union and the FA In force since 1999 Yes. Protocol on mutual assistanceRepublic of Armenia Partnership between administrative authoritiesand Cooperation Agreement in customs matters
Agreement between New Zealand FTA In force since 2001 Yesand Singapore on a Closer EconomicPartnership
Agreement between Japan and the FTA In force since 2002 YesRepublic of Singapore for a New-AgeEconomic Partnership
Singapore-Australia Free Trade FTA In force since 2003 YesAgreement
ASEAN-Japan Comprehensive FA In force since 2004 YesEconomic Partnership
ASEAN-India Framework Agreement FA In force since 2004 Yeson Comprehensive EconomicCooperation
Mainland and Hong Kong Closer FTA In force since 2004 YesEconomic Partnership Agreement
Mainland and Macao Closer FTA In force since 2004 YesEconomic Partnership Agreement

22
India-Thailand Framework Agreement FA In force since 2004 Yesfor Establishing a FTA
Free Trade Agreement between the FTA In force since 2004 YesRepublic of Korea and Chile
United States-Singapore Free Trade FTA In force since 2004 YesAgreement
United States-Australia Free Trade FTA In force since 2004 YesAgreement
Thailand-Australia Free Trade FTA In force since 2004 YesAgreement
India-Singapore Comprehensive FTA In force since 2005 YesEconomic Cooperation Agreement
Agreement between Japan and the FTA In force since 2005 YesUnited Mexican States for theStrengthening of the EconomicPartnership
New Zealand-Thailand Closer FTA In force since 2005 YesEconomic Partnership Agreement
The Association Agreement FTA In force since 2005 YesEstablishing the Free Trade Areabetween the Republic of Turkeyand the Republic of Tunisia
Free Trade Agreement between the FTA In force since 2006 YesGovernment of the Republic ofKorea and the Government of theRepublic of Singapore
Pacific Island Countries Trade FTA In force since 2006 Yes. Article 18 -parties willAgreement Endeavour to implement measures
which facilitate trade within theFTA; trade facilitation coordinatedwith wider region
South Asian Free Trade Area FTA In force since 2006 Yes
Trans-Pacific Strategic Economic FTA In force since 2006 YesPartnership Agreement(Brunei Darussalam, Singapore,New Zealand and Chile)
India-Mercosur Preferential Trade FA Pending ratification YesAgreement
Free Trade Agreement between FTA Pending ratification Yes. Article 10 on borderthe Government of the People s measuresRepublic of China and theGovernment of the IslamicRepublic of Pakistan
Preferential Trade Agreement PTA Pending ratification Yes. Article XIV on customsbetween the Republic of India and valuation, Article XV on Customsthe Republic of Chile Cooperation

23
Agreement between Japan and the FA Pending ratification Yes. Chapter 4 on CustomsRepublic of the Philippines on an procedures, Chapter 5 oneconomic partnership Paperless trading and Chapter 6
on Mutual recognition
Agreement between Japan and the FTA Pending ratification Yes. Customs procedures,Kingdom of Thailand on an Economic chapter 4Partnership
Republic of Korea-United States Free FTA Pending ratification Yes. customs proceduresTrade Agreement
Protocol between the Republic of FA Pending ratification Yes. Article 6 of the Protocol onPeru and the Kingdom of Thailand Customs Proceduresto Accelerate the Liberalization ofTrade in Goods and Trade Facilitation
Source: ESCAP APTIAD Database, http://www.unescap.org/tid/aptiad/, September 2007.
*Preferential Trade Agreement (PTA); Free Trade Agreement (FTA); Framework Agreement(FA); Customs Union (CU)

24
References
Asian Development Bank, 2007. Inequality in Asia. Manila.
Anderson, J.E. and E. van Wincoop, 2004. Trade costs , Journal of Economic Literature,vol. 42, No. 3; pp. 691-751.
Bhattacharya, D. and S.S. Hossain, 2006. An evaluation of the need and cost of selectedtrade facilitation measures in Bangladesh: Implications for the WTO negotiationsof trade facilitation , ARTNeT Working Paper No. 9, in ESCAP, An exploration ofthe need for and cost of selected trade facilitation measures in Asia and the Pacificin the context of the WTO negotiations , Studies in Trade and Investment, No. 57,United Nations, New York.
Bonapace, T. and M. Mikic, 2007. Asia-Pacific regionalism quo vadis? Charting theterritory for new integration routes , in De Lomaerde (ed.), Multilateralism, regionalismand bilateralism in trade and investment , United Nations University Series onRegionalism, No. 1, Springer.
De P., 2007. Impact of trade costs on trade: Empirical evidence from Asian countries ,ARTNeT Working Paper Series, No. 27. Available at http://www.unescap.org/tid/artnet/pub/wp2707.pdf (accessed in January 2007).
Dhar, B. and M. Kallumal, 2007. Taming non-tariff barriers: Can WTO find a solution? , inESCAP, Future trade research areas that matter to developing country policymakers - A regional perspective on the Doha Development Agenda and beyond ,Studies in Trade and Investment, No. 61, United Nations, New York.
Djankov S., Freund, C. and Cong S. Pham, 2007. Trading on time , working paper.Available at http://www.doingbusiness.org/MethodologySurveys/ (accessed on1 October 2007).
Djankov, S., 2005. Doing Business Indicators: Why aggregate, and how to do it in DoingBusiness 2006, World Bank, Washington, D.C.
Duval, Y., 2007. Can non-tariff barriers be tamed? , in ESCAP, Future trade researchareas that matter to developing country policy makers - A regional perspective onthe Doha Development Agenda and Beyond , Studies in Trade and Investment,No. 61, United Nations, New York.
, 2006. Cost and benefits of implementing trade facilitation measures undernegotiations at the WTO: An exploratory survey , ARTNeT Working Paper No. 3, inESCAP, An exploration of the need for and cost of selected trade facilitationmeasures in Asia and the Pacific in the context of the WTO negotiations , Studiesin Trade and Investment, No. 57, United Nations, New York.
ESCAP, 2002. Trade Facilitation Handbook for the Greater Mekong Subregion, UnitedNations, New York.
25
ESCAP, 2006. An exploration of the need for and cost of selected trade facilitationmeasures in Asia and the Pacific in the context of the WTO negotiations , Studiesin Trade and Investment, No. 57, United Nations, New York.
Finger, J.M., 2000. The WTO s special burden on less developed countries , Cato Journal,vol. 19, No. 3. Cato Institute, Washington, D.C.
Helble, M., B. Shepherd and J.S. Wilson, 2007. Transparency and Trade Facilitation in theAsia Pacific: Estimating the Gains from Reform, Department of Foreign Affairs andTrade, Australia.
Mikic, M., 2007. Trends in preferential trade liberalization in Asia and the Pacific , inESCAP, Agricultural trade: Planting the seeds of regional liberalization in Asia - Astudy by the Asia-Pacific Research and Training Network on Trade , Studies inTrade and Investment, No. 60, United Nations, New York.
Ng, F., 2006. Data on Trade and Import Barriers. Available at http://go.worldbank.org/LGOXFTV550.
Sengupta, N., 2007. The Economics of Trade Facilitation, Oxford University Press.
United Nations/CEFACT, 2001. Compendium of Trade Facilitation Recommendations,United Nations, New York.
UNCTAD, 1994. United Nations International Symposium on Trade Efficiency , Columbus,17-21 October. Available at www.un.org/Conferences/trade94/columbus.html.
Wilson, J.S., C.L. Mann and T. Otsuki, 2003. Trade facilitation and economic development:A new approach to quantifying the impact , World Bank Economic Review, vol. 17,No. 3; pp. 367-389.
, 2005. Assessing the potential benefit of trade facilitation: A global perspective ,in Dee and Ferrantino (eds.), Quantitative Methods for Assessing the Effects ofNon-tariff Measures and Trade Facilitation, pp. 121-160. Singapore, APEC Secretariat.
World Bank, 2007. Doing Business 2008. Available at www.doingbusiness.org.
World Trade Organization, 1998. WTO rules relevant to Trade Facilitation, G/L/244. Geneva.

27
II. A COMPARATIVE ANALYSIS OF TRADE FACILITATION
IN SELECTED REGIONAL AND BILATERAL TRADE
AGREEMENTS AND INITIATIVES*
By Patrick Wille and Jim Redden
Introduction
Trade facilitation has become a major concern for policy makers wishing to increasethe gains from trade. Reduction of trade barriers such as tariffs and quantitative restrictions,which had been achieved in the General Agreement on Tariffs and Trade (GATT) rounds ofmultilateral trade negotiations, raised the profile of the remaining behind- and at-the-border trade costs. At the same time, technological developments have raised prospectsfor a paperless customs clearance environment and exchange of trade-related information,often discussed under the rubric of Electronic Data Interchange (EDI), which increases thepotential gains from trade facilitation and suggests a need for common standards. Theincreased attention that has been given to trade facilitation in recent years is evident notonly in regional trading arrangements around the world but also in specific Asia-Pacificregional agreements and initiatives.
This chapter provides an analysis of how trade facilitation issues are addressed insome of the principle trade agreements and initiatives in the Asia-Pacific region in order toidentify best practices and implications for the World Trade Organization (WTO) negotiations.The Association of Southeast Asian Nations (ASEAN), Asia-Pacific Economic Cooperation(APEC), the South Asian Free Trade Agreement (SAFTA) and the Pacific Agreement onCloser Economic Relations (PACER) were chosen for their geographical spread acrossthe region and for the diverse nature of measures incorporated in them. The comparativeanalysis also includes the Australia-Singapore Free Trade Agreement for its articulation ofspecific and effective trade facilitation measures.
A review and comparative analysis of the selected agreements are given in sectionA. In addition, a template of model measures for trade facilitation negotiators is developedin section B, followed in section C by a discussion of some implications for developingcountries.
In terms of relevant literature on this topic to date, several papers have beenpublished that analyse the general implications of major trade agreements in theAsia-Pacific region. For example, Feridhanusetyawan (2005) gives a useful overview on
* This chapter was prepared by the Institute for International Trade, University of Adelaide, Australia,with Patrick Wille and Jim Redden as the primary authors. Thanks are due to Christopher Findlay andAndrew Stoler for their input and editing suggestions, and to Richard Pomfret for his initial researchand input. The authors can be contacted by e-mail at [email protected].

28
the recent proliferation of preferential trade agreements (PTAs) in the Asia-Pacific region,and he discusses key characteristics of some of these PTAs. However his observationsregarding trade facilitation remain rather general and do not include PACER or SAFTA.
In the more recent past, a number of papers have been produced that discussspecific aspects of trade facilitation. Most of those papers have dealt with either theeconomic impact of trade facilitation, such as expected costs and benefits (e.g., Engman2005; Wilson and others, 2004; and Freud and others, 2006), or were case studies analysingthe trade facilitation capacity-building needs and initiatives of particular countries (e.g.,ESCAP, 2006).
Mo s (2002) analysed the relationship between regional trade agreements (R TAs)and the multilateral trading system with regard to trade facilitation. The study found thatthe degree of facilitation in RTAs was influenced by various factors, such as the date of theconclusion of the agreement, the relative level of development of participating countriesand the type of agreement reached. The legal framework and the scope of APEC tradefacilitation measures are discussed in a number of publications produced by APEC itselfand by others.1 Similarly, several works address some trade facilitation initiatives in SouthAsia.2 However, there is scant literature analysing how trade facilitation is addressed inthe context of PACER.3
Overall, the existing literature is useful and important. However, it does not providea comprehensive comparison of how trade facilitation is addressed across major RTAs inthe Asia-Pacific region.
A. Trade facilitation in selected regional and bilateral trade
agreements in the Asia-Pacific region
This section analyses and compares the way in which trade facilitation is addressedin the four regional agreements of ASEAN, APEC, South Asian Association for RegionalCooperation/South Asian Free Trade Agreement (SAARC/SAFTA) and PACER as well asin the Australia-Singapore Free Trade Agreement (ASFTA).
The term trade facilitation has been defined in multiple ways by dif ferentorganizations and trade agreements. For example, in the context of WTO and theOrganisation for Economic Co-operation and Development (OECD), trade facilitation means:
1 See, for example, APEC, 2002; Assanie, Woo and Brotherston, 2002; Baysan, Panagariya andPitigala, 2006; and Woo, 2004.
2 See, for example, Wilson and Ostuki, 2004; and Weerakoon and others, 2005.
3 See, for example, Narsey, 2004; and McMaster, 2003.

29
The simplification and harmonization of international trade procedures includingthe activities, practices and formalities involved in collecting, presenting,communicating and processing data and other information required for themovement of goods in international trade. 4
This definition excludes non-tariff barriers (NTBs) to trade, such as sanitary andphytosanitary measures (SPS), or measures to protect social or environmental standards.According to the negotiation mandate of the July Package , 5 the current WTO negotiationson trade facilitation are limited to the improvement and clarification of GATT Articles V(Freedom of Transit), VIII (Fees and Formalities Connected with Importation and Exportation)and X (Publication and Administration of Trade Regulations).
In comparison, many bilateral and regional trade agreements have a broaderunderstanding of trade facilitation as including any procedures, processes or policiescapable of reducing transaction costs and facilitating the flow of goods in internationaltrade.6 Trade facilitation in this broader sense can affect a wide range of activities such asimport or export procedures, transportation formalities, logistics services, payment, insuranceand other financial requirements. However, trade facilitation even in its wider sense, isgenerally distinguished from tariff negotiations and the development of physical infrastructurefor trade (such as ports, roads and railways) that also influence the flow of traded goods.7
Table 1 gives a comparative overview of the membership, structure and scope ofthese agreements.
1. Association of South East Asian Nations
(a) General remarks on ASEAN and AFTA
ASEAN is one of the oldest regional trading arrangements in the Asia-Pacificregion. It was formed in 1967 by Indonesia, Malaysia, the Philippines, Singapore andThailand, and joined by Brunei Darussalam in 1985. ASEAN had little impact on tradepolicy before the establishment of the ASEAN Free Trade Area (AFTA) in 1992. Duringthe 1990s ASEAN expanded its membership to 10 as Viet Nam acceded in 1995, the LaoPeople s Democratic Republic and Myanmar in 1997, and Cambodia in 1998. ASEAN hasa permanent Secretariat in Indonesia, but this supranational institution has relatively limitedcapacity at this stage. There is no separate supranational institution for AFTA.
In AFTA, members retain their national trade policies towards non-members andliberalize intra-ASEAN trade by reducing tariffs to 5 per cent or less on goods with at least
4 OECD, 2005.
5 http://www.wto.org/english/tratop_e/dda_e/ddadraft_31jul04_e.pdf.
6 Impediments to international trade in particular complex and numerous formalities are also referredto as red tape . Trade facilitation aims to cut such red tape (see, for example, Woo and Wilson,2000).
7 ESCAP, 2002.

30Ta
ble
1.
Ge
ne
ral
co
mp
ari
so
n o
f re
gio
na
l tr
ad
e a
gre
em
en
ts i
n t
he
As
ia-P
ac
ific
re
gio
n
Org
an
iza
tio
n/
AS
EA
N/A
FTA
AP
EC
SA
AR
C/S
AF
TA
PA
CE
RA
SF
TA
ag
ree
me
nt
Me
mb
ers
Mem
ber
coun
trie
s:M
embe
r ec
onom
ies:
Afg
hani
stan
, Ban
glad
esh,
Aus
tral
ia, C
ook
Isla
nds,
Sin
gapo
re, A
ustr
alia
.B
rune
i Dar
ussa
lam
,A
ustr
alia
, Bru
nei
Bhu
tan,
Indi
a, M
aldi
ves,
Fed
erat
ed S
tate
s of
Cam
bodi
a, In
done
sia,
Dar
ussa
lam
, Can
ada,
Nep
al, P
akis
tan,
Mic
rone
sia,
Fiji
, Kiri
bati,
Lao
Peo
ple
sC
hile
, Chi
na,
Sri
Lank
a.M
arsh
all I
slan
ds, N
auru
,D
emoc
ratic
Rep
ublic
,H
ong
Kon
g, C
hina
,N
ew Z
eala
nd, N
iue,
Mal
aysi
a, M
yanm
ar,
Indo
nesi
a, J
apan
,P
alau
, Pap
ua N
ewP
hil ip
pine
s, S
inga
pore
,M
alay
sia,
Mex
ico,
Gui
nea,
Sam
oa,
Tha
iland
, Vie
t Nam
.N
ew Z
eala
nd,
Sol
omon
Isla
nds,
Ton
ga,
Pap
ua N
ew G
uine
a,Tu
valu
and
Van
uatu
.P
eru,
Phi
l ippi
nes,
Rus
sian
Fed
erat
ion,
Sin
gapo
re, R
epub
lic o
fK
orea
, Tai
wan
Pro
vinc
eof
Chi
na, T
haila
nd,
Uni
ted
Sta
tes,
Vie
t Nam
.
Ye
ar
of
sig
nin
g,
1992
, 199
319
8920
04, 1
Jan
uary
200
620
01, 2
002
17 F
ebru
ary
2003
,e
ntr
y i
nto
fo
rce
28 J
uly
2003
.
Ty
pe
of
ag
ree
me
nt
Fre
e tr
ade
agre
emen
tP
ublic
sec
tor,
mul
tilat
eral
FTA
Fra
mew
ork
agre
emen
t for
Com
preh
ensi
ve F
TA(F
TA).
econ
omic
foru
m.
the
grad
ual t
rade
and
(incl
udin
g go
ods,
ser
vice
sec
onom
ic in
tegr
atio
n.an
d in
vest
men
t).
Inte
gra
tio
nC
urre
ntly
sec
tora
lA
PE
C s
uppo
rts
trad
e an
dC
urre
ntly
tarif
f red
uctio
ns.
Cur
rent
ly fr
amew
ork
inte
grat
ion.
Lon
g-te
rmin
vest
men
t lib
eral
izat
ion
Long
-ter
m g
oal:
free
only
, var
ious
initi
ativ
es,
goal
: in
tegr
ated
sin
gle
thro
ugh
mul
tilat
eral
and
trad
e ar
ea b
y 20
16.
e.g.
, cap
acity
-bui
ldin
g,m
arke
t by
2020
.hi
gh-q
ualit
y re
gion
alE
arly
har
vest
pro
gram
me:
tech
nica
l ass
ista
nce
and
and
bila
tera
l tra
deno
n-le
ast d
evel
oped
trad
e fa
cilit
atio
nag
reem
ents
. B
ogor
coun
trie
s (I
ndia
, Pak
ista
n,pr
ogra
mm
es.
Long
-ter
mG
oals
: fr
ee a
nd o
pen
Sri
Lank
a) p
hase
out
goal
: ev
entu
al fu
ll an
dtr
ade
and
inve
stm
ents
tarif
fs b
y 20
09 w
hile
com
plet
e in
tegr
atio
n of
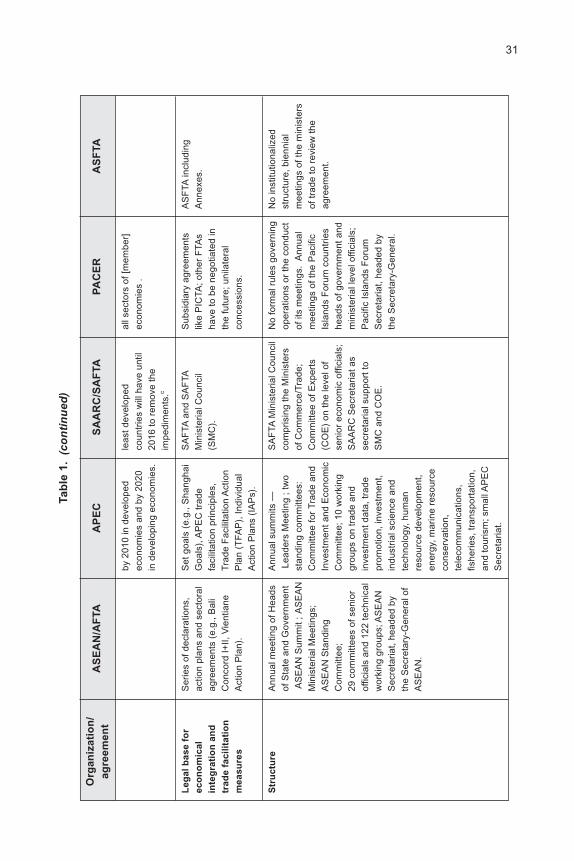
31Ta
ble
1.
(co
nti
nu
ed)
Org
an
iza
tio
n/
AS
EA
N/A
FTA
AP
EC
SA
AR
C/S
AF
TA
PA
CE
RA
SF
TA
ag
ree
me
nt
by 2
010
in d
evel
oped
leas
t dev
elop
edal
l sec
tors
of [
mem
ber]
econ
omie
s an
d by
202
0co
untr
ies
will
hav
e un
tilec
onom
ies
.in
dev
elop
ing
econ
omie
s.20
16 to
rem
ove
the
impe
dim
ents
.c
Le
ga
l b
as
e f
or
Ser
ies
of d
ecla
ratio
ns,
Set
goa
ls (
e.g.
, Sha
ngha
iS
AF
TA a
nd S
AF
TAS
ubsi
diar
y ag
reem
ents
AS
FTA
incl
udin
ge
co
no
mic
al
actio
n pl
ans
and
sect
oral
Goa
ls),
AP
EC
trad
eM
inis
teria
l Cou
nci l
l ike
PIC
TA; o
ther
FTA
sA
nnex
es.
inte
gra
tio
n a
nd
agre
emen
ts (
e.g.
, Bal
ifa
cil i t
atio
n pr
inci
ples
,(S
MC
).ha
ve to
be
nego
tiate
d in
tra
de
fa
cil
ita
tio
nC
onco
rd I+
II, V
ient
iane
Trad
e F
aci l i
tatio
n A
ctio
nth
e fu
ture
; uni
late
ral
me
as
ure
sA
ctio
n P
lan)
.P
lan
(TFA
P),
Indi
vidu
alco
nces
sion
s.A
ctio
n P
lans
(IA
Ps)
.
Str
uc
ture
Ann
ual m
eetin
g of
Hea
dsA
nnua
l sum
mits
—S
AF
TA M
inis
teria
l Cou
nci l
No
form
al r
ules
gov
erni
ngN
o in
stitu
tiona
lized
of S
tate
and
Gov
ernm
ent
Lead
ers
Mee
ting
; tw
oco
mpr
isin
g th
e M
inis
ters
oper
atio
ns o
r th
e co
nduc
tst
ruct
ure,
bie
nnia
lA
SE
AN
Sum
mit
; A
SE
AN
stan
ding
com
mitt
ees:
of C
omm
erce
/Tra
de;
of it
s m
eetin
gs.
Ann
ual
mee
tings
of t
he m
inis
ters
Min
iste
rial M
eetin
gs;
Com
mitt
ee fo
r Tr
ade
and
Com
mitt
ee o
f Exp
erts
mee
tings
of t
he P
acifi
cof
trad
e to
rev
iew
the
AS
EA
N S
tand
ing
Inve
stm
ent a
nd E
cono
mic
(CO
E)
on th
e le
vel o
fIs
land
s F
orum
cou
ntrie
sag
reem
ent.
Com
mitt
ee;
Com
mitt
ee; 1
0 w
orki
ngse
nior
eco
nom
ic o
ffici
als;
head
s of
gov
ernm
ent a
nd29
com
mitt
ees
of s
enio
rgr
oups
on
trad
e an
dS
AA
RC
Sec
reta
riat a
sm
inis
teria
l lev
el o
ffici
als;
offic
ials
and
122
tech
nica
lin
vest
men
t dat
a, tr
ade
secr
etar
ial s
uppo
rt to
Pac
ific
Isla
nds
For
umw
orki
ng g
roup
s; A
SE
AN
prom
otio
n, in
vest
men
t,S
MC
and
CO
E.
Sec
reta
riat,
head
ed b
yS
ecre
taria
t, he
aded
by
indu
stria
l sci
ence
and
the
Sec
reta
ry-G
ener
al.
the
Sec
reta
ry-G
ener
al o
fte
chno
logy
, hum
anA
SE
AN
.re
sour
ce d
evel
opm
ent,
ener
gy, m
arin
e re
sour
ceco
nser
vatio
n,te
leco
mm
unic
atio
ns,
fishe
ries,
tran
spor
tatio
n,an
d to
uris
m; s
mal
l AP
EC
Sec
reta
riat.
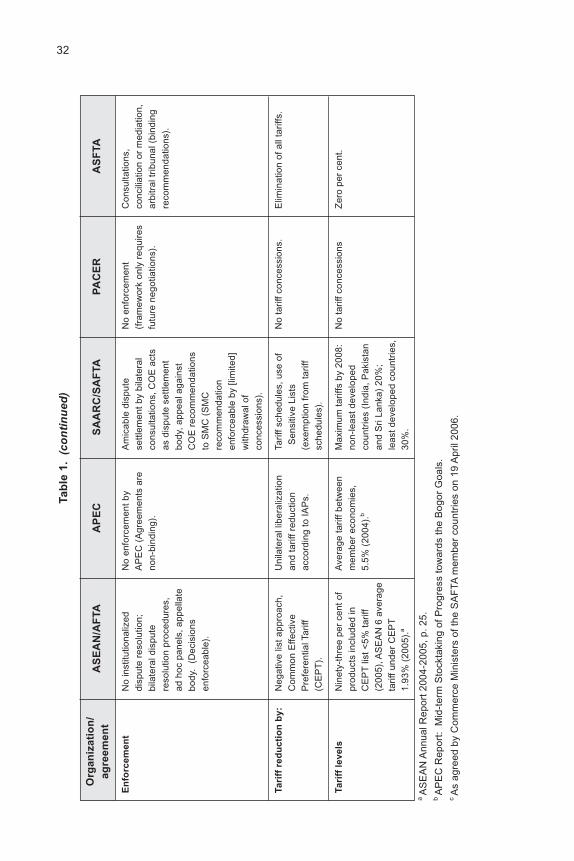
32Ta
ble
1.
(co
nti
nu
ed)
Org
an
iza
tio
n/
AS
EA
N/A
FTA
AP
EC
SA
AR
C/S
AF
TA
PA
CE
RA
SF
TA
ag
ree
me
nt
En
forc
em
en
tN
o in
stitu
tiona
lized
No
enfo
rcem
ent b
yA
mic
able
dis
pute
No
enfo
rcem
ent
Con
sulta
tions
,di
sput
e re
solu
tion;
AP
EC
(A
gree
men
ts a
rese
ttlem
ent b
y bi
late
ral
(fra
mew
ork
only
req
uire
sco
ncili
atio
n or
med
iatio
n,bi
late
ral d
ispu
teno
n-bi
ndin
g).
cons
ulta
tions
, CO
E a
cts
futu
re n
egot
iatio
ns).
arbi
tral
trib
unal
(bi
ndin
gre
solu
tion
proc
edur
es,
as d
ispu
te s
ettle
men
tre
com
men
datio
ns).
ad h
oc p
anel
s, a
ppel
late
body
, app
eal a
gain
stbo
dy.
(Dec
isio
nsC
OE
rec
omm
enda
tions
enfo
rcea
ble)
.to
SM
C (
SM
Cre
com
men
datio
nen
forc
eabl
e by
[lim
ited]
with
draw
al o
fco
nces
sion
s).
Ta
riff
re
du
cti
on
by
:N
egat
ive
l ist a
ppro
ach,
Uni
late
ral l
iber
aliz
atio
nTa
riff s
ched
ules
, use
of
No
tarif
f con
cess
ions
.E
l imin
atio
n of
al l
tarif
fs.
Com
mon
Effe
ctiv
ean
d ta
riff r
educ
tion
Sen
sitiv
e Li
sts
Pre
fere
ntia
l Tar
iffac
cord
ing
to IA
Ps.
(exe
mpt
ion
from
tarif
f(C
EP
T).
sche
dule
s).
Ta
riff
le
ve
lsN
inet
y-th
ree
per
cent
of
Ave
rage
tarif
f bet
wee
nM
axim
um ta
riffs
by
2008
:N
o ta
riff c
once
ssio
nsZ
ero
per
cent
.pr
oduc
ts in
clud
ed in
mem
ber
econ
omie
s,no
n-le
ast d
evel
oped
CE
PT
list
<5%
tarif
f5.
5% (
2004
).b
coun
trie
s (I
ndia
, Pak
ista
n(2
005)
, AS
EA
N 6
ave
rage
and
Sri
Lank
a) 2
0%;
tarif
f und
er C
EP
Tle
ast d
evel
oped
cou
ntrie
s,1.
93%
(20
05).
a30
%.
aA
SE
AN
Ann
ual R
epor
t 200
4-20
05, p
. 25.
bA
PE
C R
epor
t: M
id-t
erm
Sto
ckta
king
of P
rogr
ess
tow
ards
the
Bog
or G
oals
.cA
s ag
reed
by
Com
mer
ce M
inis
ters
of t
he S
AF
TA m
embe
r co
untr
ies
on 1
9 A
pril
2006
.

33
40 per cent ASEAN content. The original six members (ASEAN 6) committed to fullimplementation of AFTA by 2002, with exemptions until 2010 only for a small number ofsensitive agricultural products, while the four newest members have extended transitionperiods (until 2006 for Viet Nam, 2008 for the Lao People s Democratic Republic andMyanmar, and 2010 for Cambodia).
There is no institutionalized dispute resolution mechanism, and in practice (despitea 2004 ASEAN Protocol on Enhanced Dispute Settlement Mechanism) the process isbilateral.
Since 2000, the integrity of AFTA has been threatened by the willingness of somemembers, Singapore and Thailand in particular, to negotiate bilateral trade agreementswith non-ASEAN countries, such as Japan, the United States of America and Australia.8
The ASEAN framework, like a number of other RTAs in Asia, has developed overa prolonged period. It consists of several layers of agreements and declarations, eachbuilding on and reinforcing the trust gained by the previous one. A serious understandingof the current ASEAN trade facilitation efforts therefore requires awareness of the evolutionof trade facilitation issues within ASEAN and justifies a brief summary of the backgroundto this agreement.
(b) Trade facilitation within the ASEAN framework
(i) AFTA and CEPT
Initially, AFTA focused on a reduction of tariffs by implementing a Common EffectivePreferential Tariff (CEPT). Neither of the 1992 agreements explicitly referred to the issueof trade facilitation. However, some general provisions contain aspects that can be subsumedunder a broad definition of trade facilitation. For example, the Framework Agreement onEnhancing ASEAN Economic Cooperation establishing AFTA urges members to reduce oreliminate non-tariff barriers between and among each other on the import and export ofproducts 9 and the CEPT agreement provides that members shall explore further measureson border and non-border areas of cooperation to supplement and complement theliberalization of trade. These may include, among others, the harmonization of standards,reciprocal recognition of tests and certification of products (...) .10
8 Relations with the United States are especially hierarchical, as the United States has signed Tradeand Investment Framework Agreements (TIFAs) with Brunei Darussalam, Indonesia, Malaysia and thePhilippines. TIFAs, described by the United States as a prerequisite to a subsequent FTA or bilateralinvestment treaty, are of lesser standing than the United States-Singapore FTA or the United Statesagreement with Thailand, but a step ahead of the United States relations with the four newest ASEANmembers.
9 See Article 2(A), Section 3 of the Framework Agreement on Enhancing ASEAN Economic Cooperation,signed in Singapore on 28 January 1992.
10 Article 5(C) of the Agreement on the Common Effective Preferential Tariff Scheme for AFTA, whichwas signed in Singapore on 28 January 1992.
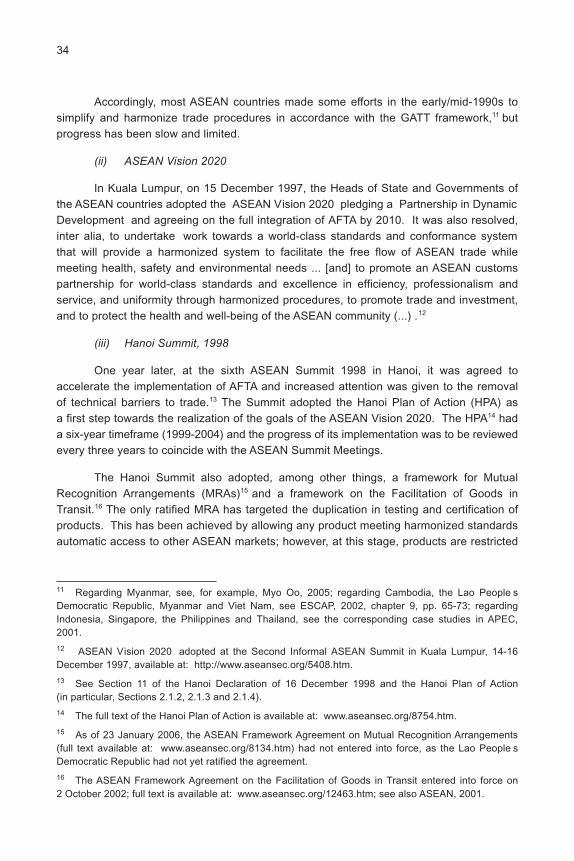
34
Accordingly, most ASEAN countries made some efforts in the early/mid-1990s tosimplify and harmonize trade procedures in accordance with the GATT framework,11 butprogress has been slow and limited.
(ii) ASEAN Vision 2020
In Kuala Lumpur, on 15 December 1997, the Heads of State and Governments ofthe ASEAN countries adopted the ASEAN Vision 2020 pledging a Partnership in DynamicDevelopment and agreeing on the full integration of AFTA by 2010. It was also resolved,inter alia, to undertake work towards a world-class standards and conformance systemthat will provide a harmonized system to facilitate the free flow of ASEAN trade whilemeeting health, safety and environmental needs ... [and] to promote an ASEAN customspartnership for world-class standards and excellence in efficiency, professionalism andservice, and uniformity through harmonized procedures, to promote trade and investment,and to protect the health and well-being of the ASEAN community (...) .12
(iii) Hanoi Summit, 1998
One year later, at the sixth ASEAN Summit 1998 in Hanoi, it was agreed toaccelerate the implementation of AFTA and increased attention was given to the removalof technical barriers to trade.13 The Summit adopted the Hanoi Plan of Action (HPA) asa first step towards the realization of the goals of the ASEAN Vision 2020. The HPA14 hada six-year timeframe (1999-2004) and the progress of its implementation was to be reviewedevery three years to coincide with the ASEAN Summit Meetings.
The Hanoi Summit also adopted, among other things, a framework for MutualRecognition Arrangements (MRAs)15 and a framework on the Facilitation of Goods inTransit.16 The only ratified MRA has targeted the duplication in testing and certification ofproducts. This has been achieved by allowing any product meeting harmonized standardsautomatic access to other ASEAN markets; however, at this stage, products are restricted
11 Regarding Myanmar, see, for example, Myo Oo, 2005; regarding Cambodia, the Lao People sDemocratic Republic, Myanmar and Viet Nam, see ESCAP, 2002, chapter 9, pp. 65-73; regardingIndonesia, Singapore, the Philippines and Thailand, see the corresponding case studies in APEC,2001.
12 ASEAN Vision 2020 adopted at the Second Informal ASEAN Summit in Kuala Lumpur, 14-16December 1997, available at: http://www.aseansec.org/5408.htm.
13 See Section 11 of the Hanoi Declaration of 16 December 1998 and the Hanoi Plan of Action(in particular, Sections 2.1.2, 2.1.3 and 2.1.4).
14 The full text of the Hanoi Plan of Action is available at: www.aseansec.org/8754.htm.
15 As of 23 January 2006, the ASEAN Framework Agreement on Mutual Recognition Arrangements(full text available at: www.aseansec.org/8134.htm) had not entered into force, as the Lao People sDemocratic Republic had not yet ratified the agreement.
16 The ASEAN Framework Agreement on the Facilitation of Goods in Transit entered into force on2 October 2002; full text is available at: www.aseansec.org/12463.htm; see also ASEAN, 2001.

35
to electronic17 and cosmetic products.18 The e-ASEAN agreement, which provides tradefacilitation measures for information and communications technology (ICT) products, hasyet to enter into force.19
The Framework Agreement on Facilitation of Goods in Transit reflects commoninternational principles such as the Most Favoured Nation (MFN) treatment, and is aimedat simplifying and harmonizing transport, trade and customs regulations for goods intransit by applying principles such as consistency, simplicity, transparency and efficiency.However, out of the nine Protocols20 detailing the framework agreement, only the ASEANScheme of Compulsory Motor Vehicle Third-Party Liability Insurance (Protocol 5) has beenratified and has entered into force.
(iv) Initiative for ASEAN Integration
In November 2000, at the fourth Informal Summit in Singapore, the ASEAN leaderslaunched the Initiative for ASEAN Integration (IAI), which gave direction to and sharpenedthe focus of collective efforts in ASEAN to narrow the development gap among its membercountries.21 The subsequent 2001 Hanoi Declaration on Narrowing the Development Gapcalled for the conclusion of the remaining protocols necessary to implement the 1998Agreement on Goods in Transit, in order to facilitate land transport in South-East Asia andlower its cost.22 It contained other declarations that could be considered as trade facilitationmeasures, such as the facilitation of trade and investment in the ICT sector.23 However,once again the 2001 Hanoi Declaration remained largely aspirational.
17 ASEAN Sectoral MRA for Electrical and Electronic Equipment, adopted in Bangkok, entered intoforce on 5 April 2002.
18 The Agreement on the ASEAN Harmonized Cosmetic Regulatory Scheme, adopted in PhnomPenh, entered into force on 2 September 2003.
19 See the e-ASEAN Framework Agreement, signed in Singapore on 24 November 2000.
20 According to Article 25, various Working Groups will be established to conclude the followingprotocols, which form an integral part of the agreement: Protocol 1 — Designation of Transit TransportRoutes and Facilities; Protocol 2 — Designation of Frontier Posts; Protocol 3 — Types and Quantity ofRoad Vehicles (signed in Hanoi on 15 September 1999); Protocol 4 — Technical Requirements ofVehicles (signed in Hanoi on 15 September 1999); Protocol 5 — ASEAN Scheme of Compulsory MotorVehicle Third-Party Liability Insurance (signed in Kuala Lumpur on 8 April 2001, entered into force on16 October 2003); Protocol 6 — Railways Border and Interchange Stations; Protocol 7 — CustomsTransit System; Protocol 8 — Sanitary and Phytosanitary Measures (signed in Phnom Penh on27 October 2000); and Protocol 9 — Dangerous Goods (signed in Jakarta on 20 September 2002).
21 See Hanoi Declaration on Narrowing the Development Gap for Closer ASEAN Integration,23 July 2001.
22 Ibid, para. 20.
23 Ibid, para. 16.
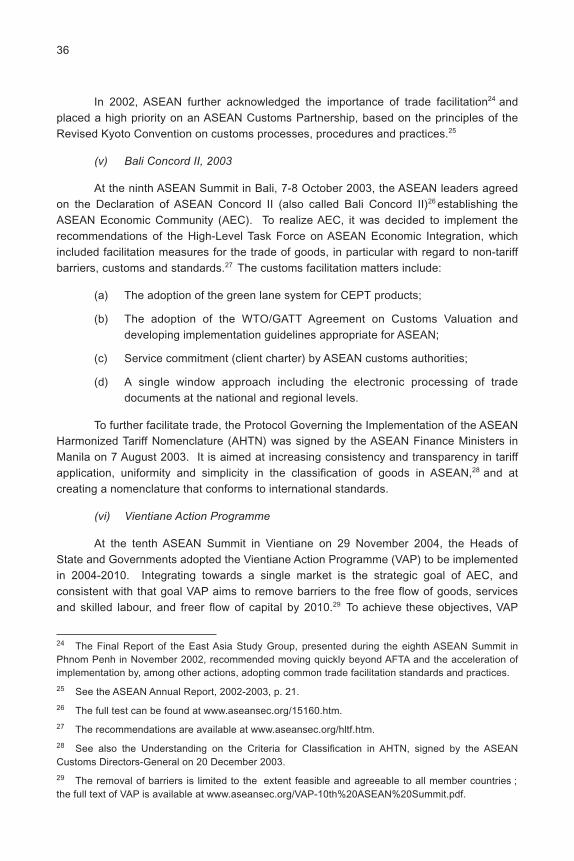
36
In 2002, ASEAN further acknowledged the importance of trade facilitation24 andplaced a high priority on an ASEAN Customs Partnership, based on the principles of theRevised Kyoto Convention on customs processes, procedures and practices.25
(v) Bali Concord II, 2003
At the ninth ASEAN Summit in Bali, 7-8 October 2003, the ASEAN leaders agreedon the Declaration of ASEAN Concord II (also called Bali Concord II)26 establishing theASEAN Economic Community (AEC). To realize AEC, it was decided to implement therecommendations of the High-Level Task Force on ASEAN Economic Integration, whichincluded facilitation measures for the trade of goods, in particular with regard to non-tariffbarriers, customs and standards.27 The customs facilitation matters include:
(a) The adoption of the green lane system for CEPT products;
(b) The adoption of the WTO/GATT Agreement on Customs Valuation anddeveloping implementation guidelines appropriate for ASEAN;
(c) Service commitment (client charter) by ASEAN customs authorities;
(d) A single window approach including the electronic processing of tradedocuments at the national and regional levels.
To further facilitate trade, the Protocol Governing the Implementation of the ASEANHarmonized Tariff Nomenclature (AHTN) was signed by the ASEAN Finance Ministers inManila on 7 August 2003. It is aimed at increasing consistency and transparency in tariffapplication, uniformity and simplicity in the classification of goods in ASEAN,28 and atcreating a nomenclature that conforms to international standards.
(vi) Vientiane Action Programme
At the tenth ASEAN Summit in Vientiane on 29 November 2004, the Heads ofState and Governments adopted the Vientiane Action Programme (VAP) to be implementedin 2004-2010. Integrating towards a single market is the strategic goal of AEC, andconsistent with that goal VAP aims to remove barriers to the free flow of goods, servicesand skilled labour, and freer flow of capital by 2010.29 To achieve these objectives, VAP
24 The Final Report of the East Asia Study Group, presented during the eighth ASEAN Summit inPhnom Penh in November 2002, recommended moving quickly beyond AFTA and the acceleration ofimplementation by, among other actions, adopting common trade facilitation standards and practices.
25 See the ASEAN Annual Report, 2002-2003, p. 21.
26 The full test can be found at www.aseansec.org/15160.htm.
27 The recommendations are available at www.aseansec.org/hltf.htm.
28 See also the Understanding on the Criteria for Classification in AHTN, signed by the ASEANCustoms Directors-General on 20 December 2003.
29 The removal of barriers is limited to the extent feasible and agreeable to all member countries ;the full text of VAP is available at www.aseansec.org/VAP-10th%20ASEAN%20Summit.pdf.

37
demands the implementation of measures such as improving trade and businessfacilitation and reducing trade transaction costs and the accelerated integration of 11priority sectors such as automotive, electronics, rubber or wood-based products.
The framework agreement for the integration of these priority sectors contains, inPart III, several provisions regarding trade facilitation and should have entered into forceby 31 August 2005. However, it was - like the protocols regarding the priority sectors -only ratified by Thailand.30
At the eleventh ASEAN Summit in Kuala Lumpur in December 2005, the leadersagreed to implement an ASEAN Single Window (ASW) by December 2006, which enablesa single submission of data and information, the single and synchronous processing ofdata and information, and single decision-making for customs release and clearance.31
The initial implementation is, however, on a bilateral basis. Thailand and the Philippinesare establishing a pilot ASW programme while Thailand and Malaysia are negotiatingspecific measures to reduce customs clearance times.
(c) How trade facilitation is addressed in ASEAN
ASEAN has a fairly wide and sometimes inconsistent understanding of trade facilitationthat includes issues such as customs valuation and aspects of non-tariff barriers to trade,which would not normally fall under the WTO definition of trade facilitation. Nevertheless,ASEAN trade facilitation initiatives are designed to comply with WTO/GATT rules.
The ASEAN approach is based on a framework of declarations and action plansthat are aimed at creating a single market in the long term; however, currently onlya limited number of priority sectors are integrated. Accordingly, trade facilitation measureswithin ASEAN are based on a variety of agreements and remain sectoral, and implementationis largely dependent on progress at the national level. When it comes to trade facilitation,the ASEAN framework agreements and declarations tend to be more general or aspirational.
However, it should be acknowledged that ASEAN countries have made significantprogress in recent years, particularly with regard to customs procedures, namely thestandardization of information for customs purposes adopting best practices and provisionsas set forth in the Revised Kyoto Convention32 as well as the harmonization of practices
30 The ASEAN Framework Agreement for the Integration of Priority Sectors, signed in Vientiane on29 November 2004, is available at: www.aseansec.org/16659.htm.
31 The Agreement to establish and Implement the ASEAN Single Window, signed in Kuala Lumpuron 9 December 2005, is available at www.aseansec.org/18005.htm. This agreement followed sevenyears of ad hoc initiatives sponsored by the ASEAN Secretariat but implemented unilaterally (e.g., theGold Card Programme in Indonesia, the Super Green Lane in the Philippines, and the Single Windowin Singapore), which reduced customs clearance times from several days to several hours.
32 The majority of the ASEAN members adopted the ASEAN Customs Declaration Document, whichcontains 48 information parameters and which was developed on the basis of the Single AdministrativeDocument recommended by the World Customs Organization.
38
related to customs valuation, which in most ASEAN countries are now in accordancewith the WTO/GATT Agreement on Customs Valuation.33 Most ASEAN countries haveimplemented AHTN and procedures for post-clearance audit (PCA).34
From an initial analysis, it appears that a number of the VAP initiatives and measuresare being processed or implemented. Further research is necessary, however, to determinethe exact implementation status of trade facilitation implementation in each of the ASEANmembers.
2. Asia-Pacific Economic Cooperation
(a) General remarks on APEC
The APEC Agreement was constituted in 1989 in Canberra. The current APECmembership consists of Australia, Brunei Darussalam, Canada, Chile, China, Hong Kong,China, Indonesia, Japan, Malaysia, Mexico, New Zealand, Papua New Guinea, Peru, thePhilippines, the Russian Federation, Singapore, Republic of Korea, Taiwan Province ofChina, Thailand, the United States and Viet Nam.
The distinguishing feature of APEC is its commitment to open regionalism, ratherthan the reciprocal exclusive arrangements characteristic of most RTAs. As such, APEC isnot a typical trade agreement. In fact, APEC is the only intergovernmental grouping in theworld operating on the basis of non-binding commitments.
It operates as a cooperative, multilateral economic and trade forum without requiringits members to enter into legally binding obligations. Decisions made within APEC arereached by consensus and commitments are undertaken on a voluntary basis. APECdoes not aim to establish a free trade area or customs union, but aims in a coordinatedregional manner to liberalize trade on an MFN basis.
APEC member economies take individual and collective actions to open theirmarkets and promote economic growth. APEC maintains a small Secretariat in Singaporethat essentially provides coordination and information services and has a projectmanagement role in overseeing some APEC projects. However, there are no supranationalinstitutions or structures in APEC and there is no institutionalised dispute settlementmechanism.
APEC members strongly support WTO multilateral negotiations and the successfulconclusion to the Doha Development Agenda. Accordingly, APEC initiatives always seekcompatibility with multilateral approaches.
33 ASEAN has published its own ASEAN Customs Valuation Implementation Guide to provideuniform understanding and interpretation of the WTO Agreement on Customs Valuation for operationalapplication by frontline customs officers
34 See ASEAN Annual Report, 2004-2005, p. 29

39
(b) Trade facilitation within the APEC framework
Trade facilitation has been explicitly on the APEC agenda since the mid-1990s.The APEC Committee on Trade and Investment was established in 1993 and the 1995Osaka Action Agenda expanded its scope. The Committee s four priority areas are:support for the multilateral trade system, trade facilitation, transparency and anti-corruption,as well as digital economy and intellectual property rights (IPRs).
In 1994, APEC economic leaders committed in Bogor, Indonesia, to strengtheningthe open multilateral trading system and set the Bogor Goals of free and open trade andinvestment in the Asia-Pacific by 2010 for developed economies and 2020 for developingeconomies. 35 The ultimate nature of free and open trade and investment , however, wasnot fully defined either in the Bogor Declaration or the Osaka Agenda.36
Two years later, the Manila Action Plan for APEC (MAPA) was adopted, outliningthe trade and investment liberalization and facilitation measures to reach the Bogor Goals.In 1997, APEC leaders supported a proposal for early voluntary sectoral liberalization in15 sectors.
In 2001, APEC adopted the Shanghai Accord, which focuses on broadening theAPEC Vision, clarifying the roadmap to Bogor and strengthening implementation. TheShanghai Accord stresses the significance of trade facilitation and endorses a (voluntary)set of principles on trade facilitation as part of the Collective Action Plan (APEC Principleson Trade Facilitation).37 The APEC leaders agreed to reduce cross-border trade transactioncosts by 5 per cent by 2006. In addition, an APEC Business Travel Card scheme and anMRA on electrical equipment were approved.
In Mexico in 2002, APEC adopted a Trade Facilitation Action Plan (TFAP), whichshould identify suitable trade facilitation measures, estimate the cost of implementingsuch measures and provide capacity-building programmes. Starting in 2002, each APECmember was expected to submit annual IAPs, which would achieve the 5 per cent targetand report on their progress. By 2004, around 1,300 items had been selected in IAPs,mainly in the subcategory of customs procedures; more than 50 per cent of these hadbeen completed and a further 25 per cent were in progress.38
35 See the APEC Economic Leaders Declaration of Common Resolve, adopted in Bogor, Indonesiaon 15 November 1994. The full text is available at www.apec.org/apec/leaders_declarations/1994.html.
36 In his 2005 paper, The mid-term review of the Bogor Goal — strategic issues and options , A. Elekcalled this lack of definition a constructive ambiguity and suggested that APEC leaders should clarifythis term.
37 See Section 18 of the Joint Statement of the thirteenth Ministerial Meeting in Shanghai on 17 and18 October 2001, Section 21 and Annex B (containing the APEC Principles on Trade Facilitation) ofthe Chair s Statement of the Meeting of APEC Ministers Responsible for Trade, 6-7 June 2001.
38 This is the Overall Quantitative Assessment given by Y.P. Woo in his 2004 report, APEC s TradeFacilitation Action Plan: A mid-term assessment , prepared for the APEC Committee on Trade andInvestment. However, Woo advised great caution in interpreting such data, because the quality andeffectiveness of these initiatives is not clear from the national reports (p. 17). He devoted the vastmajority of the report to qualitative assessments.

40
(c) How trade facilitation is addressed in APEC
The APEC trade facilitation principles are similar to those of ASEAN. There isa common emphasis on simplifying customs procedures, promoting transparency as wellas on alignment with international standards, but there is a distinctive emphasis in APECon paperless trading, e-commerce, and on facilitating and promoting business people smobility.39
At their 2001 Shanghai meeting, the APEC Trade Ministers adopted the followingnine trade facilitation principles that are applicable to the trading of goods and services:40
(a) Transparency
(b) Communication and consultation
(c) Simplification, practicability and efficiency
(d) Non-discrimination
(e) Consistency and predictability
(f) Harmonization, standardization and recognition
(g) Modernization and the use of new technology
(h) Due process
(i) Cooperation.
The transparency principle targets the availability and accessibility of informationrelevant to the trading of goods and services. This comprises laws and regulations aswell as information on licensing, certification, qualification and registration requirements,technical standards, guidelines and procedures. According to APEC, these rules andprocedures related to trade should be made available to all interested parties, consistentlyand in a timely manner, through a widely available medium at no, or at least reasonable,cost (e.g., by publishing information on the Internet).41
The communication and consultations principle embraces mechanisms forexchanges between authorities and stakeholders, especially between a government,businesses and the trading community.
39 Seventeen of APEC s 21 members participate in, or have announced their intention of participatingin, the APEC Business Travel Card scheme. Qualified businesspeople can obtain the Travel Card intheir home countries, which facilitates the issue of multiple short-term entry visits from other APECmember countries and provides entitlement to fast-track procedures for entry and exit at participatinginternational airports.
40 The full text of the APEC Trade Facilitation Principles (Annex B) is available at www.apec.org/apec/ministerial_statements/sectoral_ministerial/trade/2001_trade/annex_b.html.
41 See the Leader s Statement to Implement APEC Transparency Standards, Los Cabos, Mexico,27 October 2002.
41
The simplification of rules and procedures seeks to ensure that the rules are nomore trade burdensome or restrictive than necessary in achieving their legitimate objectives.APEC principles also state that rules and procedures related to trade should be applied ina consistent, predictable, uniform and non-discretionary manner to minimize uncertainty(e.g., by establishing codes of conduct).
The APEC harmonization and standardization principle is aimed at the acceptanceof international standards such as the revised International Convention on the Simplificationand Harmonization of Customs Procedures (revised Kyoto Convention of the WCO), theWTO Customs Valuation Agreement or International Standardization Organization (ISO)norms. The recognition of standards is fostered by sectoral MRAs (e.g., the MRA forelectrical and electronic equipment).
APEC is open to new business practices and new technology. Member economiesare urged to implement the use of Internet technology, electronic data interchange ande-commerce, not only for the publication of information (e.g., the APEC Electronic IndividualAction Plan) but also for submitting documents for payment. APEC recommends theimplementation of risk management techniques as well as pre-arrival and post clearanceaudits.
The cooperation principle acknowledges that trade facilitation measures are bestimplemented through a working partnership between government authorities and businesscommunities, and that trade facilitation requires technical assistance, capacity-buildingand the sharing of best practices between governments.
(d) Implementation of APEC trade facilitation principles
The development and implementation of trade facilitation measures compliant withthe rather general APEC trade facilitation principles are left to the member economiesalthough, as stated above, APEC has set a goal of reducing transaction costs by 5 percent by 2006 and plans to reduce those costs by a further 5 per cent by 2010. Accordingly,there is a variety of trade facilitation measures that are at different stages of implementation.There is no uniform set of measures that has to be implemented within a specific timeframe.42
It should also be noted that there is considerable overlap of membershipbetween APEC and other RTAs such as AFTA, the North American Free Trade Agreement(NAFTA) or the Australia New Zealand Closer Economic Relations Trade Agreement(ANZCERTA or CER). The issue of diverse commitments has become more acute in thepast few years, with most APEC members having negotiated bilateral and plurilateral
42 For the status of implementation, fore example, see the case studies of Indonesia, Singapore, thePhilippines and Thailand in APEC, 2001 and APEC, 2006, which state that 62 per cent of the TFAPinitiatives have been completed and 24 per cent are in progress.

42
preferential trading arrangements, which increases the potential for the spaghetti bowleffect, including conflicting trade facilitation arrangements.43
However, APEC and its member economies have contributed significantly to WTOtrade facilitation negotiations by establishing an inventory of trade facilitation measures44
and by developing some useful examples of best practice.45
3. South Asian Association for Regional Cooperation
(a) General remarks on SAARC
In 1985, Bangladesh, Bhutan, India, Maldives, Nepal, Pakistan and Sri Lankaestablished SAARC. This was followed by the signing and introduction of the SAARCPreferential Trading Arrangement (SAPTA) in 1993 and 1995, respectively. However, inthe four rounds of trade negotiations already held, progress in product-by-product agreementshas been slow.
In 1995, the SAARC Council of Ministers agreed on the need to establish a SouthAsian Free Trade Area. In January 2004, during the twelfth SAARC Summit in Islamabad,it was agreed to move towards a more integrated South Asian Economic Union (SAEU);subsequently, SAFTA46 was signed and entered into force on 1 January 2006. The firstround of tariff reductions was scheduled for July and August 2006, with establishment ofthe Free Trade Area by January 2016.
(b) Trade facilitation within the SAARC framework
In SAPTA, the contracting parties agreed under Article 6 (Additional Measures) toconsider trade facilitation measures to complement SAPTA s Article 4 on reducing tariffsand para-tariffs, and liberalization of trade generally.
In 1996, a Group on Customs Cooperation was established with a mandate toharmonize customs rules and regulations, simplify documentation and proceduralrequirements, upgrade infrastructure and provide training. In 1998, a Standing Group onStandards, Quality Control and Measurements was established. The Standing Groupagreed on the Key Elements of a Regional Action Plan on standards, quality control andmeasurement.
43 Scollay and Gilbert (2001) highlighted the cost-increasing potential of the spaghetti bowlphenomenon , which was popularized by Bhagwati in the 1990s (see, for example, Bhagwati, 1995and Bhagwati, Greenaway and Panagariya, 1998). Spaghetti bowl diagrams of the regionaland bilateral trade agreements in the Asia-Pacific region can be found in Feridhanusetyawan, 2005,pp. 10-11.
44 See contributions in TN/TF/W/6-15, 17-26, 28, 30-34, 36, 38, 42, 44, 47, 49, 62, 67, 70, 80, 83-94.
45 See national experience papers TN/TF/W/50, 53, 55, 58, 61, 66.
46 The SAFTA text is available at www.saarc-sec.org/data/agenda/economic/safta/safta%20agreement.pdf.

43
A draft Regional Agreement on Promotion and Protection of Investment within theSAARC region is under the consideration of member States and is meant to createconditions favourable for promoting and protecting investments in each member State byinvestors from other member States. In 2004, an Intergovernmental Expert Group wasconstituted to consider the Agreement on Promotion and Protection of Investment, theestablishment of a SAARC Arbitration Council, and a multilateral tax treaty with a scopelimited to avoidance of double taxation. The SAARC Secretariat lists all these initiativeson its website under the heading Trade Facilitation Measures ,47 which indicates thatSAARC has a very broad understanding of trade facilitation.
One of the main objectives of SAFTA is the elimination of barriers to trade and thefacilitation of cross-border movement of goods; to achieve this objective, SAFTA hasindicated its commitment to adopting trade facilitation and related measures.48 However,despite some institutional developments in trade facilitation areas within the SAARCframework, it is still early days in terms of implementing specific measures.
(c) How trade facilitation is addressed in SAARC
As explained above, SAFTA only suggests possible trade facilitation measures.These suggestions touch on a variety of issues without being specific. Unlike APEC, thereare no consistent trade facilitation principles or action plans that would help to clarify andimplement the SAFTA trade facilitation measures.
However, even if trade facilitation is not yet addressed in a binding form, the focuson trade facilitation clearly signals the intention of SAFTA with regard to the simplificationand harmonization of customs procedures and product standards in accordance withinternational standardization and, as in APEC, on the simplification of procedures forbusiness visas.
4. Pacific Agreement for Closer Economic Relations
(a) PACER in general
The Pacific Island Forum countries have had duty-free access to the markets ofAustralia and New Zealand since the 1981 non-reciprocal South Pacific Regional Tradeand Economic Cooperation Agreement (SPARTECA).
47 See SAARC website at www.saarc-sec.org.
48 See SAFTA Articles 3.1.a, 3.2.e and 8. Article 8 lists as possible trade facilitation measures theharmonization of standards, reciprocal recognition of tests and product certification, simplification andharmonization of customs clearance procedures, harmonization of customs classification, customscooperation, simplification and harmonization of import licensing, simplification of banking procedures,transit facilities, removal of barriers to intra-SAARC investments, macroeconomic consultations, ruleson fair competition, development of communication systems and transport infrastructure, exceptions toforeign exchange restrictions and simplification of procedures for business visas.
44
PACER, which was signed in Nauru on 18 August 2001 and which entered intoforce on 3 October 2002, is a trade and economic cooperation umbrella agreement thatapplies to all 16 Forum members.49 Its overall objective is to establish a framework for thegradual trade and economic integration of its members in a way that is supportive ofsustainable development among the Pacific island countries. The framework allows theestablishment of subsidiary agreements for the creation of free trade areas betweenmembers, such as the Pacific Island Country Trade Agreement (PICTA). However, theinitial and primary focus of PACER is on development, cooperation and trade facilitation,with a current work programme in the areas of customs, quarantine, standards andconformance.
A significant proportion of the PACER document (Part 3 of the Agreement andAnnex 1) relates to trade facilitation. For the Pacific small island countries, a distinctiveelement beyond the usual trade facilitation goals is the issue of technical assistance andcapacity-building. Australia and New Zealand agreed to partially fund a trade facilitationprogramme, and all signatories agreed that their national programmes should be consistentwith other regional and international agreements.
(b) How trade facilitation is addressed in PACER
PACER Article 9 requests all parties to establish detailed programmes for thedevelopment, establishment and implementation of trade facilitation measures, which mustbe consistent with other regional and international agreements and must account for thespecial needs and resource constraints of the LDCs and small island countries.
PACER Article 10 obliges parties that are WTO members to apply at least thesame favourable treatment to all other parties that they are required to provide to WTOmembers in relation to customs procedures, standards and conformance.50
PACER Article 11 deals with financial and technical assistance for developing andimplementing - among others - trade facilitation measures. The Pacific Islands ForumSecretariat, which is based in Suva, Fiji, administers the work programme. Australia andNew Zealand pledged to support technical assistance with an adequate level of funding toensure that the Secretariat does not have to divert resources from its other programmes.51
PACER also requires that each trade facilitation programme contains objectives,a detailed action plan, a time frame and a sufficient annual budget. To avoid unnecessary
49 Australia, Cook Islands, Federated States of Micronesia, Fiji, Kiribati, Marshall Islands, Nauru,New Zealand, Niue, Palau, Papua New Guinea, Samoa, Solomon Islands, Tonga, Tuvalu and Vanuatu.
50 PACER Article 10 includes the same provision regarding sanitary and phytosanitary matters,which, together with some provisions in Annex 1, suggests that PACER has a broader understandingof trade facilitation than WTO.
51 The amount actually contributed by Australia and New Zealand has been criticized as insufficientby some observers, such as J. Kelsey, 2005, A People s Guide to the Pacific s Economic PartnershipAgreement, World Council of Churches — Office in the Pacific, Suva, Fiji.

45
duplication of work, the trade facilitation programmes must be coordinated and integratedwith the work of other regional and international organizations, and must use the expertiseand standards of such organizations and their members.52 The Pacific Islands ForumSecretariat has to review the trade facilitation programmes and prepare reports to identifythe most beneficial areas for trade facilitation and to ensure consistency.53 The tradefacilitation programmes have to be revised at periodical meetings, which should lead toa formalization of trade facilitation programmes and the conclusion of Memoranda ofUnderstanding between parties.54 However, the Pacific Islands Forum member countrieshave the option of not participating in particular trade facilitation programmes or certainaspects of such programmes if they would be unduly onerous or potentially disadvantageousto them.55
There is a consultation process for parties that feel that an obligation of a tradefacilitation programme has not been, or is not being, fulfilled.56 However, further disputeresolution procedures are only applicable in so far as they are contained in a formalMemorandum of Understanding between parties.
To sum up, PACER emphasizes the interrelationship between trade facilitation andthe need for technical assistance and capacity-building. To what extent national tradefacilitation measures and programmes have been implemented is difficult to assess at thisstage, because the PACER Secretariat has not yet electronically published reviews ofsuch trade facilitation programmes. PACER also has members with very different levels ofeconomic development. Therefore, it is understandable that PACER follows a flexibleapproach to trade facilitation, which includes special and differential treatment (SDT) forLDC members as well as technical assistance and capacity-building. Time will tell howsuccessful this flexible, capacity-building approach to trade facilitation reform is.
5. Singapore-Australia Free Trade Agreement
The RTAs discussed so far address a number of trade facilitation measures ina somewhat general or non-binding manner. All of the RTAs face the challenge of bridgingsignificant differences regarding the economic development of their members. In order togain additional insights into how trade facilitation could be addressed, it is also useful tocompare the more flexible approach of regional trade agreements with a more binding andcomprehensive bilateral agreement between two countries in the Asia-Pacific region.
52 PACER Annex 1, Article 1.
53 PACER Annex 1, Article 2.1. The website of the Pacific Islands Forum Secretariat (www.forumsec.org)currently does not show any such report or other documents on trade facilitation.
54 PACER Annex 1, Article 2 in conjunction with PACER Article 16.
55 PACER Annex 1, Article 3.
56 PACER Annex 1, Article 4.

46
Negotiations for an FTA between Singapore and Australia were launched inNovember 2000. After 10 formal rounds of negotiations, in November 2002 Singapore andAustralia successfully finalized an FTA (ASFTA)57 that came into force on 28 July 2003.58
ASFTA is a comprehensive agreement covering areas such as trade in goods,trade in services, investment, telecommunications, financial services, movement of businesspersons, government procurement, intellectual property rights, competition policy, e-commerceand education cooperation.
Although ASFTA does not mention the term trade facilitation , it contains a seriesof detailed provisions that fall under either the WTO definition of trade facilitation and/orthe wider understanding as previously discussed. Due to the nature of a bilateral agreement,the implementation of the trade facilitation measures contained in ASFTA is binding and(at least theoretically) enforceable by the dispute settlement mechanism of the agreement.
Chapter 4 of ASFTA deals with customs procedures and aims at their simplificationby embracing the practices of the World Customs Organization (WCO) including the RevisedKyoto Convention, and adopting measures such as paperless trading, risk managementand sharing of best practices. Chapter 5 on technical regulations and SPS measures aimsat the harmonization of technical regulations, taking into account relevant internationalstandards and guidelines by using mutual recognition agreements and sectoral annexesfor the implementation of harmonization arrangements.
ASFTA promotes transparency regarding applicable laws and governmentregulations not only in the context of tariffs and customs but also in most other fields suchas telecommunication, competition law, government procurement, trade in services, andinvestment. Chapter 11 of ASFTA contains measures facilitating the movement of businesspeople and chapter 14 (Electronic Commerce) promotes paperless trading, for example byrequiring the parties to make available by 2005 electronic versions of all existing versionsof trade administration documents.
Generally speaking, the trade facilitation measures of ASFTA are implemented inthe different parts of the agreement (customs, trade in goods and trade of services).Wherever possible, trade facilitation measures refer to multilateral agreements andrecognized international standards. The underlying principles are transparency,simplification, harmonization, cooperation and consultation. The trade facilitation measuresthemselves are formulated concisely, are binding and have a time frame for implementation.As both parties were well-developed economies there was no need for provisions regardingtechnical assistance or capacity-building. However, cooperation between governmentsand their agencies is highlighted in several parts of the FTA.
57 Australia and Singapore normally use the abbreviation SAFTA for their FTA. However, to avoidany confusion with the South Asia Free Trade Agreement, this chapter uses the abbreviation ASFTAfor the Singapore-Australia FTA in accordance with the ESCAP APTIAD online PTA database.
58 The full text of ASFTA is available at www.fta.gov.sg/fta/pdf/FTA_SAFTA_Agreement.pdf.

47
6. Comparative analysis of trade facilitation measures covered
Table 2 gives a comparative overview of specific trade facilitation measuresaddressed in the agreements analysed above. To allow ease of comparison, trade facilitationmeasures have been categorized here according to GATT Articles V, VIII and X. ASFTA isthe only agreement of a binding nature; its trade facilitation measures are clearly statedand have been implemented.
APEC sets quantitative goals for trade facilitation (lower trade transaction costs by5 per cent between 2001 and 2006, and a further 5 per cent by 2010), and addressestrade facilitation in the form of the (non-binding) APEC principles on trade facilitation aswell as in action plans (for example, the 2002 TFAP, CAP and IACs). Although APECmembers have, by and large, achieved the first quantitative goal for the 2001-2006 period,the reasons for the success cannot necessarily be ascribed to this particular regionalagreement or even be attributed to specific trade facilitation measures, as the implementationof trade facilitation remains at the discretion of the member economies and can be inconsistentand/or limited to specific sectors (e.g., electrical and electronic equipment).
In ASEAN, trade facilitation efforts have remained limited to specific sectors and ingeneral are aspirational. The implementation of framework agreements (for example, theratification of sectoral protocols) and various trade facilitation measures are not regionallycoordinated and depend on the specific efforts of each member country. SAFTA is evenless binding and only suggests possible trade facilitation measures without being specific.In PACER, trade facilitation is also addressed in a flexible manner leaving it to the contractingparties to develop specific trade facilitation programmes. The formalized and bindingMemoranda of Understanding on Trade Facilitation have not yet been finalized. However,PACER s emphasis on linking trade facilitation reform with specific technical assistanceand capacity-building programmes may be instructive for other developing economies.
The successes of ASFTA (a significant increase both in trade between Australiaand Singapore and in more harmonized trade facilitation procedures) and APEC (reachingits 5 per cent goal) suggest that clearly formulated trade facilitation principles and measuresthat are binding, or which at least require a commitment to quantitative outcomes, aremore effective than the more aspirational approaches of other agreements such as ASEAN,SAFTA and PACER. However, this assertion needs to be complemented by further researchthat examines the spaghetti bowl ef fects of other agreements on members in the ASFTAand APEC agreements, and which seeks to take account of an individual nation s owntrade reform agenda regardless of various trade agreements.
B. A template for trade facilitation in future agreements
Based on the comparative analysis of trade facilitation in RTAs, a templatefor trade facilitation in future agreements (best practice) should encompass two parts:(a) a definition of the underlying trade facilitation principles, and (b) a set of specific,binding and enforceable trade facilitation measures.

48Ta
ble
2.
Co
mp
ari
so
n o
f tr
ad
e f
ac
ilit
ati
on
me
as
ure
s5
9
Tra
de
fa
cil
ita
tio
n
Ma
in a
rea
s c
ov
ere
dm
ea
su
res
AS
EA
N/
AP
EC
SA
AR
C/S
AF
TA
PA
CE
RA
SF
TA
(or
gro
up
s o
fA
FTA
me
as
ure
s)
Pub
licat
ion
and
Pub
licat
ion
of tr
ade
No
Pub
lish
cust
oms
and
No
No
-In
corp
orat
ion
of
avai
labi
l i ty
ofre
gula
tions
othe
r tr
ade-
rela
ted
GA
TT
Art
icle
Xin
form
atio
nla
ws,
reg
ulat
ions
-P
rom
ptan
d gu
idel
ines
inpu
blic
atio
n of
pape
r fo
rm a
ndla
ws
and
elec
tron
ical
lyre
gula
tion
Inte
rnet
pub
licat
ion
No
Yes
No
No
No
expl
icit
prov
isio
n
Not
ifica
tion
of tr
ade
Not
ifica
tion
toN
oN
o-
Not
ifica
tion
toN
otifi
catio
n of
any
regu
latio
nsA
SE
AN
Sec
reta
riat
For
um S
ecre
taria
tch
ange
s to
of r
egul
atio
n th
atof
new
trad
em
anda
tory
affe
ct th
e fa
cil i t
atio
nar
rang
emen
tsre
quire
men
tsof
tran
sit t
rans
port
betw
een
part
ies
of g
oods
and
of t
rade
nego
tiatio
ns w
ithth
ird p
artie
s-
Not
ifica
tion
toF
orum
Sec
reta
riat
of a
ny s
ubst
antiv
ech
ange
s af
fect
ing
trad
e am
ong
part
ies
59Ta
ble
2 lis
ts t
rade
fac
ilita
tion
mea
sure
s an
d pr
inci
ples
con
tain
ed in
the
com
pare
d ag
reem
ents
. T
he s
truc
ture
of
the
tabl
e (
Mai
n ar
eas
cove
red
) fo
llow
sth
e sy
stem
use
d by
WT
O in
its
Com
pila
tion
of M
embe
rs T
rade
Fac
ilita
tion
Pro
posa
ls (
TN
/TF
/W/4
3/).
A
lthou
gh s
ome
agre
emen
ts g
o be
yond
the
sco
pe o
fW
TO
tra
de f
acili
tatio
n, t
he a
utho
rs d
ecid
ed n
ot t
o lis
t al
l tr
ade
faci
litat
ion
initi
ativ
es i
n or
der
to e
ase
com
para
bilit
y.
The
tab
le g
ives
no
indi
catio
n to
wha
tex
tent
the
mea
sure
s ar
e im
plem
ente
d by
the
part
ies
to th
e ag
reem
ents
, exc
ept f
or th
e S
inga
pore
-Aus
tral
ia F
TA, w
hich
has
bee
n su
cces
sful
ly im
plem
ente
d.
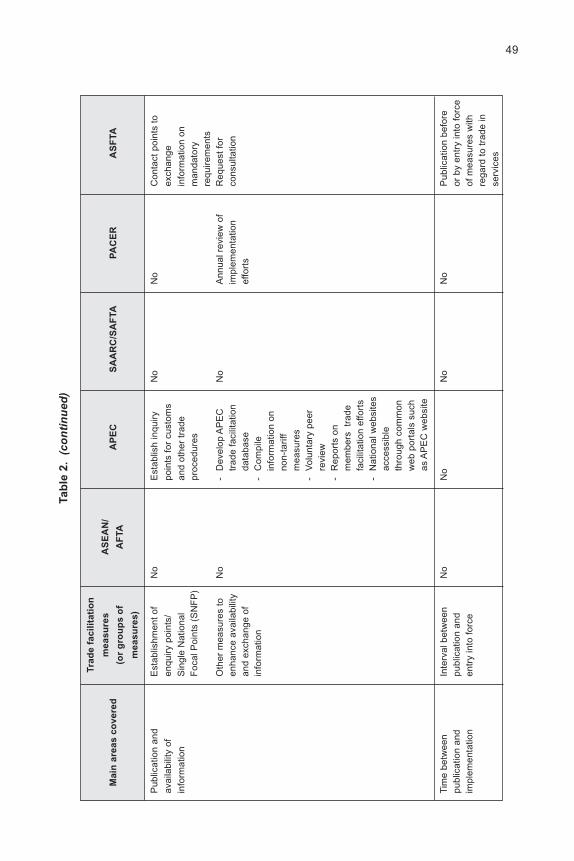
49Ta
ble
2.
(co
nti
nu
ed)
Tra
de
fa
cil
ita
tio
n
Ma
in a
rea
s c
ov
ere
dm
ea
su
res
AS
EA
N/
AP
EC
SA
AR
C/S
AF
TA
PA
CE
RA
SF
TA
(or
gro
up
s o
fA
FTA
me
as
ure
s)
Pub
licat
ion
and
Est
ablis
hmen
t of
No
Est
ablis
h in
quiry
No
No
Con
tact
poi
nts
toav
aila
bil i t
y of
enqu
iry p
oint
s/po
ints
for
cust
oms
exch
ange
info
rmat
ion
Sin
gle
Nat
iona
lan
d ot
her
trad
ein
form
atio
n on
Foc
al P
oint
s (S
NF
P)
proc
edur
esm
anda
tory
requ
irem
ents
Oth
er m
easu
res
toN
o-
Dev
elop
AP
EC
No
Ann
ual r
evie
w o
fR
eque
st fo
ren
hanc
e av
aila
bil i t
ytr
ade
faci
l i tat
ion
impl
emen
tatio
nco
nsul
tatio
nan
d ex
chan
ge o
fda
taba
seef
fort
sin
form
atio
n-
Com
pile
info
rmat
ion
onno
n-ta
riff
mea
sure
s-
Vol
unta
ry p
eer
revi
ew-
Rep
orts
on
mem
bers
trad
efa
cilit
atio
n ef
fort
s-
Nat
iona
l web
site
sac
cess
ible
thro
ugh
com
mon
web
por
tals
suc
has
AP
EC
web
site
Tim
e be
twee
nIn
terv
al b
etw
een
No
No
No
No
Pub
licat
ion
befo
repu
blic
atio
n an
dpu
blic
atio
n an
dor
by
entr
y in
to fo
rce
impl
emen
tatio
nen
try
into
forc
eof
mea
sure
s w
ithre
gard
to tr
ade
inse
rvic
es

50Ta
ble
2.
(co
nti
nu
ed)
Tra
de
fa
cil
ita
tio
n
Ma
in a
rea
s c
ov
ere
dm
ea
su
res
AS
EA
N/
AP
EC
SA
AR
C/S
AF
TA
PA
CE
RA
SF
TA
(or
gro
up
s o
fA
FTA
me
as
ure
s)
Con
sulta
tion
Prio
r co
nsul
tatio
nN
oP
rovi
deN
oN
oC
onsu
ltatio
nan
d co
mm
ents
on
oppo
rtun
ities
for
rega
rdin
g ru
les
ofne
w a
nd a
men
ded
cons
ulta
tion
with
orig
inru
les
stak
ehol
ders
Adv
ance
rul
ings
Pro
visi
on o
fN
oA
dvan
ced
rul in
gsN
oN
oN
oad
vanc
e ru
l ings
for
clas
sific
atio
n of
good
s, d
eter
min
atio
nof
val
ue, m
arki
ngan
d la
bell i
ng, q
uota
san
d an
y ot
her
adm
issi
bil i t
yre
quire
men
t
App
eal p
roce
dure
sR
ight
of a
ppea
lR
ight
of a
ppea
l in
Est
abl is
h ap
peal
No
No
Rig
ht o
f app
eal f
orcu
stom
s an
d tr
ansi
tsy
stem
mat
ters
rel
ated
tom
atte
rsel
igib
ility
for
pref
eren
tial t
ariff
trea
tmen
t-
Rel
ease
of g
oods
No
No
No
No
No
in th
e ev
ent o
fap
peal
-A
ppea
lE
nsur
e an
effe
ctiv
e-
Tran
spar
ent
No
No
No
mec
hani
smm
echa
nism
for
the
revi
ew a
nd/o
rre
view
of d
ecis
ions
judi
cial
pro
cess
(reg
ardi
ng tr
ansi
t-
Pub
lish
appe
alon
ly)
rulin
gs
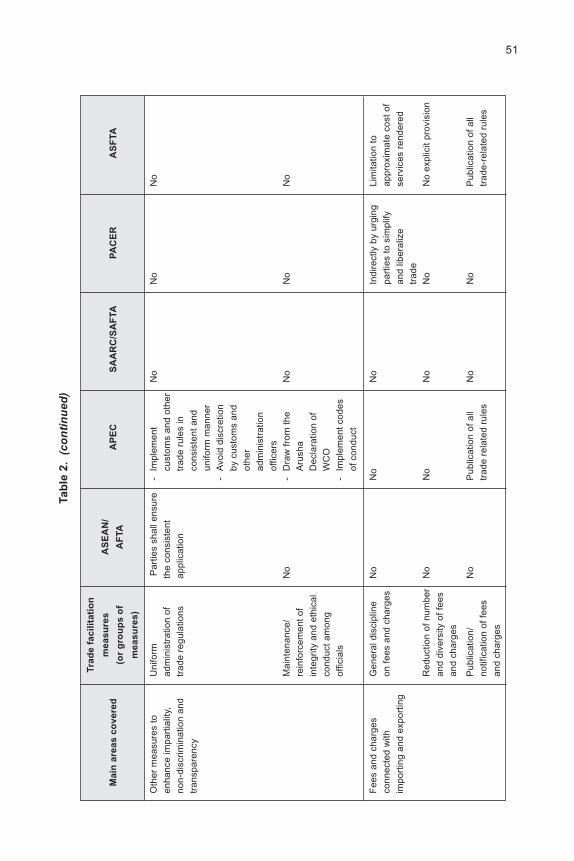
51Ta
ble
2.
(co
nti
nu
ed)
Tra
de
fa
cil
ita
tio
n
Ma
in a
rea
s c
ov
ere
dm
ea
su
res
AS
EA
N/
AP
EC
SA
AR
C/S
AF
TA
PA
CE
RA
SF
TA
(or
gro
up
s o
fA
FTA
me
as
ure
s)
Oth
er m
easu
res
toU
nifo
rmP
artie
s sh
all e
nsur
e-
Impl
emen
tN
oN
oN
oen
hanc
e im
part
ialit
y ,ad
min
istr
atio
n of
the
cons
iste
ntcu
stom
s an
d ot
her
non-
disc
rimin
atio
n an
dtr
ade
regu
latio
nsap
plic
atio
ntr
ade
rule
s in
tran
spar
ency
cons
iste
nt a
ndun
iform
man
ner
-A
void
dis
cret
ion
by c
usto
ms
and
othe
rad
min
istr
atio
nof
ficer
sM
aint
enan
ce/
No
-D
raw
from
the
No
No
No
rein
forc
emen
t of
Aru
sha
inte
grity
and
eth
ical
Dec
lara
tion
ofco
nduc
t am
ong
WC
Oof
ficia
ls-
Impl
emen
t cod
esof
con
duct
Fee
s an
d ch
arge
sG
ener
al d
isci
plin
eN
oN
oN
oIn
dire
ctly
by
urgi
ngLi
mita
tion
toco
nnec
ted
with
on fe
es a
nd c
harg
espa
rtie
s to
sim
plify
appr
oxim
ate
cost
of
impo
rtin
g an
d ex
port
ing
and
liber
aliz
ese
rvic
es r
ende
red
trad
eR
educ
tion
of n
umbe
rN
oN
oN
oN
oN
o ex
plic
it pr
ovis
ion
and
dive
rsity
of f
ees
and
char
ges
Pub
licat
ion/
No
Pub
licat
ion
of a
llN
oN
oP
ublic
atio
n of
all
notif
icat
ion
of fe
estr
ade
rela
ted
rule
str
ade-
rela
ted
rule
san
d ch
arge
s

52Ta
ble
2.
(co
nti
nu
ed)
Tra
de
fa
cil
ita
tio
n
Ma
in a
rea
s c
ov
ere
dm
ea
su
res
AS
EA
N/
AP
EC
SA
AR
C/S
AF
TA
PA
CE
RA
SF
TA
(or
gro
up
s o
fA
FTA
me
as
ure
s)
Fee
s an
d ch
arge
sP
rohi
bitio
n of
No
No
No
No
No
conn
ecte
d w
ithco
llect
ion
ofim
port
ing
and
expo
rtin
gun
publ
ishe
d fe
esan
d ch
arge
sP
erio
dic
revi
ew o
ffe
es a
nd c
harg
esG
ener
al r
evie
w o
fN
oN
oIn
dire
ctly
by
perio
dic
Per
iodi
c re
view
of
impl
emen
tatio
n of
revi
ews
of w
ork
cust
oms
proc
edur
esl ib
eral
izat
ion
prog
ram
mes
rega
rdin
g tr
ansi
ttr
ansp
ort
Oth
er m
easu
res
No
No
No
No
-N
o in
dire
ctpr
otec
tion
by o
rfis
cal p
urpo
ses
offe
es a
nd c
harg
es-
Abo
litio
n of
exp
ort
dutie
s fo
r sp
ecifi
cgo
ods
For
mal
ities
con
nect
edD
isci
plin
e re
gard
ing
Sim
plifi
catio
n of
Sim
plify
Agr
eem
ent t
oN
oP
rinci
ple
ofw
ith im
port
ing
and
form
aliti
es/
cust
oms
proc
edur
espr
oced
ures
cons
ider
sim
plifi
catio
n, n
oex
port
ing
proc
edur
es a
ndan
d re
quire
men
tssi
mpl
ifica
tion
and
expl
icit
mea
sure
sda
ta/d
ocum
enta
tion
harm
oniz
atio
n of
requ
irem
ents
cust
oms
clea
ranc
epr
oced
ure

53Ta
ble
2.
(co
nti
nu
ed)
Tra
de
fa
cil
ita
tio
n
Ma
in a
rea
s c
ov
ere
dm
ea
su
res
AS
EA
N/
AP
EC
SA
AR
C/S
AF
TA
PA
CE
RA
SF
TA
(or
gro
up
s o
fA
FTA
me
as
ure
s)
For
mal
ities
con
nect
edR
educ
tion
ofS
impl
ifica
tion
ofR
educ
eU
se s
tand
ard
form
sN
oP
rinci
ple
ofw
ith im
port
ing
and
form
aliti
es a
ndcu
stom
s pr
oced
ures
requ
irem
ents
for
for
cust
oms
sim
plifi
catio
n, n
oex
port
ing
docu
men
tatio
nan
d re
quire
men
tspa
per
decl
arat
ions
expl
icit
mea
sure
sre
quire
men
tsdo
cum
enta
tion
incu
stom
sU
se o
f int
erna
tiona
l/-
AS
EA
N C
usto
ms
Rev
ised
Kyo
toP
rogr
essi
ve-
...U
se th
eir
best
-W
CO
pra
ctic
esre
gion
al s
tand
ards
Dec
lara
tion
Con
vent
ion
impl
emen
tatio
n of
ende
avou
rs to
and
stan
dard
sD
ocum
ent
revi
sed
Kyo
tofo
l low
inte
rnat
iona
lin
clud
ing
revi
sed
com
plie
s w
ithC
onve
ntio
nbe
st p
ract
ice.
..K
yoto
Con
vent
ion
inte
rnat
iona
l-
Coo
pera
tion
with
stan
dard
sre
gion
al a
nd-
Kyo
to C
onve
ntio
nin
tern
atio
nal
orga
niza
tions
inth
e de
velo
pmen
tan
dim
plem
enta
tion
ofag
reem
ents
on
harm
oniz
edpr
oced
ures
Acc
epta
nce
ofN
oN
oN
oN
oN
oco
pies
and
com
mer
cial
lyav
aila
ble
info
rmat
ion
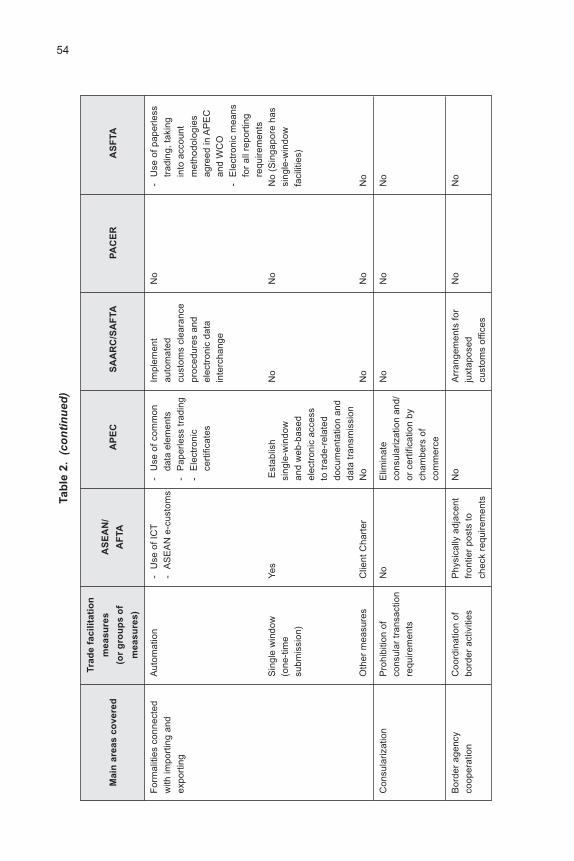
54Ta
ble
2.
(co
nti
nu
ed)
Tra
de
fa
cil
ita
tio
n
Ma
in a
rea
s c
ov
ere
dm
ea
su
res
AS
EA
N/
AP
EC
SA
AR
C/S
AF
TA
PA
CE
RA
SF
TA
(or
gro
up
s o
fA
FTA
me
as
ure
s)
For
mal
ities
con
nect
edA
utom
atio
n-
Use
of I
CT
-U
se o
f com
mon
Impl
emen
tN
o-
Use
of p
aper
less
with
impo
rtin
g an
d-
AS
EA
N e
-cus
tom
sda
ta e
lem
ents
auto
mat
edtr
adin
g, ta
king
expo
rtin
g-
Pap
erle
ss tr
adin
gcu
stom
s cl
eara
nce
into
acc
ount
-E
lect
roni
cpr
oced
ures
and
met
hodo
logi
esce
rtifi
cate
sel
ectr
onic
dat
aag
reed
in A
PE
Cin
terc
hang
ean
d W
CO
-E
lect
roni
c m
eans
for
all r
epor
ting
requ
irem
ents
Sin
gle
win
dow
Yes
Est
ablis
hN
oN
oN
o (S
inga
pore
has
(one
-tim
esi
ngle
-win
dow
sing
le-w
indo
wsu
bmis
sion
)an
d w
eb-b
ased
faci
l i tie
s)el
ectr
onic
acc
ess
to tr
ade-
rela
ted
docu
men
tatio
n an
dda
ta tr
ansm
issi
onO
ther
mea
sure
sC
lient
Cha
rter
No
No
No
No
Con
sula
rizat
ion
Pro
hibi
tion
ofN
oE
limin
ate
No
No
No
cons
ular
tran
sact
ion
cons
ular
izat
ion
and/
requ
irem
ents
or c
ertif
icat
ion
bych
ambe
rs o
fco
mm
erce
Bor
der
agen
cyC
oord
inat
ion
ofP
hysi
cally
adj
acen
tN
oA
rran
gem
ents
for
No
No
coop
erat
ion
bord
er a
ctiv
ities
fron
tier
post
s to
juxt
apos
edch
eck
requ
irem
ents
cust
oms
offic
es

55Ta
ble
2.
(co
nti
nu
ed)
Tra
de
fa
cil
ita
tio
n
Ma
in a
rea
s c
ov
ere
dm
ea
su
res
AS
EA
N/
AP
EC
SA
AR
C/S
AF
TA
PA
CE
RA
SF
TA
(or
gro
up
s o
fA
FTA
me
as
ure
s)
Rel
ease
and
cle
aran
ceP
re-a
rriv
al c
lear
ance
Yes
(Vis
ion
2020
)N
ot e
xplic
itly
No
No
Not
exp
licitl
yof
goo
dsm
entio
ned
men
tione
dE
xped
ited
No
Yes
No
No
Not
exp
l icitl
ypr
oced
ures
for
men
tione
dex
pres
s sh
ipm
ents
App
licat
ion
of r
isk
To a
pply
ris
k-
Gre
en C
hann
elN
oN
o-
Low
-ris
k/hi
gh-r
isk
man
agem
ent
man
agem
ent
- sw
ift c
usto
ms
good
ste
chni
ques
tech
niqu
es a
ndpr
oced
ures
for
-D
evel
op fu
rthe
rch
eck
smal
ler
low
-ris
k ca
rgo
risk
man
agem
ent
perc
enta
ge o
f-
Car
go p
rofi l
ing
tech
niqu
esco
nsig
nmen
tsan
d/or
-S
harin
g of
bes
t(V
isio
n 20
20)
com
pute
rized
prac
tices
risk
man
agem
ent
Pos
t-cl
eara
nce
AS
EA
N c
usto
ms
Yes
No
No
Not
exp
l icitl
yau
dit
PC
A g
uide
lines
and
men
tione
dbe
st p
ract
ices
Sep
arat
ing
rele
ase
Yes
(Vis
ion
2020
)N
oN
oN
oN
ofr
om c
lear
ance
proc
edur
es
Pub
licat
ion
ofE
stab
lish
acco
untin
gC
lear
ance
tim
eN
oN
oN
oav
erag
e re
leas
ean
d st
atis
tical
stud
ies
and
clea
ranc
e tim
esre
port
ing
to e
xped
itecu
stom
s cl
eara
nce
(Vis
ion
2020
)

56Ta
ble
2.
(co
nti
nu
ed)
Tra
de
fa
cil
ita
tio
n
Ma
in a
rea
s c
ov
ere
dm
ea
su
res
AS
EA
N/
AP
EC
SA
AR
C/S
AF
TA
PA
CE
RA
SF
TA
(or
gro
up
s o
fA
FTA
me
as
ure
s)
Rel
ease
and
cle
aran
ceO
ther
mea
sure
sN
oE
stab
lish
a su
rety
Agr
eem
ent t
oN
oN
oof
goo
dsbo
nd s
yste
m (
sim
ilar
cons
ider
to A
TA C
arne
t of I
CC
sim
plifi
catio
n an
dbu
t for
al l
good
s)ha
rmon
izat
ion
ofcu
stom
scl
eara
nce
proc
edur
e
Tarif
fs a
nd ta
riff
Sch
edul
esC
EP
TV
olun
tary
Yes
-V
olun
tary
tarif
fE
l imin
atio
n of
tarif
fs/
clas
sific
atio
nco
nces
sion
sl ib
eral
izat
ion
cust
oms
dutie
sac
cord
ing
to IA
P-
Per
iodi
cal r
evie
wof
tarif
f sch
edul
esO
bjec
tive
crite
ria fo
rA
SE
AN
Har
mon
ized
Har
mon
ized
Sys
tem
Agr
eem
ent t
oN
oA
pplic
atio
n of
HS
tarif
f cla
ssifi
catio
nTa
riff N
omen
clat
ure
(HS
) C
onve
ntio
nco
nsid
erC
onve
ntio
n(A
HT
N)
com
plie
sha
rmon
izat
ion
ofw
ith in
tern
atio
nal
natio
nal c
usto
ms
stan
dard
scl
assi
ficat
ion
base
d on
HS
Con
vent
ion
Oth
er m
easu
res
No
Mak
e av
aila
ble
No
No
No
expo
rt d
utie
s on
prec
eden
t-ba
sed
cert
ain
good
sru
lings
in e
lect
roni
cfo
rmat

57Ta
ble
2.
(co
nti
nu
ed)
Tra
de
fa
cil
ita
tio
n
Ma
in a
rea
s c
ov
ere
dm
ea
su
res
AS
EA
N/
AP
EC
SA
AR
C/S
AF
TA
PA
CE
RA
SF
TA
(or
gro
up
s o
fA
FTA
me
as
ure
s)
Mat
ters
rel
ated
toN
on-d
iscr
imin
atio
nYe
s (f
or g
oods
on
No
No
No
No
good
s in
tran
sit
CE
PT
l ist
)D
isci
plin
e on
fees
No
No
No
No
No
and
char
ges
Dis
cipl
ine
on tr
ansi
tP
artie
s sh
all
No
-In
trod
uctio
n of
No
No
form
aliti
es a
nden
deav
our
tosi
mpl
ified
docu
men
tatio
nen
sure
the
proc
edur
es fo
rre
quire
men
tssi
mpl
ifica
tion
of a
l ltr
ansi
t mov
emen
ttr
ansi
t tra
nspo
rtof
exe
mpt
ed o
rpr
oced
ures
and
peris
habl
e go
ods
requ
irem
ents
or o
ther
goo
dsre
quiri
ng s
uch
clea
ranc
eC
oord
inat
ion
and
-P
artie
s sh
all
No
-A
gree
men
t to
No
Pro
visi
ons
rega
rdin
gco
oper
atio
nen
sure
effi
cien
tco
nsid
er th
eco
nsig
nmen
tan
d ef
fect
ive
deve
lopm
ent o
fad
min
istr
atio
n of
tran
spor
ttr
ansi
t tra
nspo
rtin
fras
truc
ture
-A
djac
ent f
ront
ier
post
s w
ithco
ordi
nate
dw
orki
ng h
ours
-C
oord
inat
eex
amin
atio
n to
avoi
d re
peat
edun
load
ing
and
relo
adin
g

58Ta
ble
2.
(co
nti
nu
ed)
Tra
de
fa
cil
ita
tio
n
Ma
in a
rea
s c
ov
ere
dm
ea
su
res
AS
EA
N/
AP
EC
SA
AR
C/S
AF
TA
PA
CE
RA
SF
TA
(or
gro
up
s o
fA
FTA
me
as
ure
s)
Exc
hang
e an
d ha
ndlin
gM
echa
nism
for
the
Use
of s
tate
-of-
the-
-U
se IC
T to
-E
xcha
nge
No
Exc
hang
e of
of in
form
atio
nex
chan
ge a
ndar
t inf
orm
atio
nfa
cil i t
ate
info
rmat
ion
info
rmat
ion
betw
een
hand
ling
ofte
chno
logy
mov
emen
t of
-Im
plem
ent
cust
oms
info
rmat
ion
com
plia
nt w
ithgo
ods
and
peop
leau
tom
ated
adm
inis
trat
ions
toU
N/E
DIF
AC
T-
Rem
ove
barr
iers
cust
oms
clea
ranc
eas
sist
inve
stig
atio
n(V
isio
n 20
20)
to, a
nd p
rom
ote
proc
edur
es a
ndan
d pr
even
tion
ofus
e of
elec
tron
ic d
ata
infr
inge
men
ts o
fe-
com
mer
cein
terc
hang
ecu
stom
s la
w
Cus
tom
s va
luat
ion
Use
of i
nter
natio
nal
-W
TO
Cus
tom
sIm
plem
ent W
TO
-W
TO
Cus
tom
sN
oC
usto
ms
valu
est
anda
rds
Val
uatio
nC
usto
ms
Val
uatio
nde
term
ined
Agr
eem
ent
Val
uatio
nA
gree
men
tac
cord
ing
to G
AT
T-
AS
EA
N C
usto
ms
Agr
eem
ent
-E
xcha
nge
Art
icle
VII
and
WT
OV
alua
tion
info
rmat
ion
on,
Cus
tom
s V
alua
tion
Impl
emen
tatio
nan
d as
sist
with
the
Agr
eem
ent
Gui
deim
plem
enta
tion
of W
TO
CV
Har
mon
izat
ion
and
Har
mon
izat
ion
of-
Sec
tora
l-
Ado
pt U
nite
d-
Agr
eem
ent t
oC
oope
ratio
n w
ith-
Har
mon
izat
ion
ofst
anda
rdiz
atio
nte
chni
cal s
tand
ards
harm
oniz
atio
n.N
atio
ns/E
DIF
AC
Tco
nsid
er th
ere
gion
al a
ndm
anda
tory
So
far,
only
or o
ther
sta
ndar
dha
rmon
izat
ion
ofin
tern
atio
nal
requ
irem
ents
,st
anda
rds
onel
ectr
onic
form
ats
stan
dard
s ba
sed
orga
niza
tions
inta
king
into
safe
ty a
nd-
Alig
n re
gula
tion,
on in
tern
atio
nal
the
deve
lopm
ent
acco
unt
elec
trom
agne
ticru
les
and
stan
dard
san
d im
plem
enta
tion
inte
rnat
iona
lco
mpa
tibili
typr
oced
ures
-E
ncou
rage
men
t to
of a
gree
men
ts o
nst
anda
rds
and
(EM
C)
have
bee
naf
fect
ing
acce
de to
the
HS
harm
oniz
edgu
idel
ines
impl
emen
ted
acce
ptan
ce o
fC
onve
ntio
nst
anda
rds
-H
arm
oniz
ed
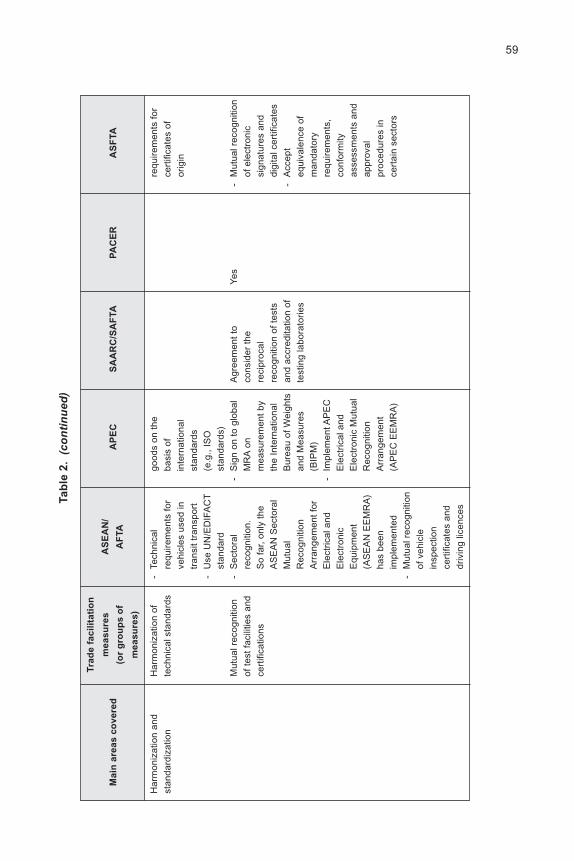
59Ta
ble
2.
(co
nti
nu
ed)
Tra
de
fa
cil
ita
tio
n
Ma
in a
rea
s c
ov
ere
dm
ea
su
res
AS
EA
N/
AP
EC
SA
AR
C/S
AF
TA
PA
CE
RA
SF
TA
(or
gro
up
s o
fA
FTA
me
as
ure
s)
Har
mon
izat
ion
and
Har
mon
izat
ion
of-
Tech
nica
lgo
ods
on th
ere
quire
men
ts fo
rst
anda
rdiz
atio
nte
chni
cal s
tand
ards
requ
irem
ents
for
basi
s of
cert
ifica
tes
ofve
hicl
es u
sed
inin
tern
atio
nal
orig
intr
ansi
t tra
nspo
rtst
anda
rds
-U
se U
N/E
DIF
AC
T(e
.g.,
ISO
stan
dard
stan
dard
s)M
utua
l rec
ogni
tion
-S
ecto
ral
-S
ign
on to
glo
bal
Agr
eem
ent t
oY
es-
Mut
ual r
ecog
nitio
nof
test
faci
l i tie
s an
dre
cogn
ition
.M
RA
on
cons
ider
the
of e
lect
roni
cce
rtifi
catio
nsS
o fa
r, on
ly th
em
easu
rem
ent b
yre
cipr
ocal
sign
atur
es a
ndA
SE
AN
Sec
tora
lth
e In
tern
atio
nal
reco
gniti
on o
f tes
tsdi
gita
l cer
tific
ates
Mut
ual
Bur
eau
of W
eigh
tsan
d ac
cred
itatio
n of
-A
ccep
tR
ecog
nitio
nan
d M
easu
res
test
ing
labo
rato
ries
equi
vale
nce
ofA
rran
gem
ent f
or(B
IPM
)m
anda
tory
Ele
ctric
al a
nd-
Impl
emen
t AP
EC
requ
irem
ents
,E
lect
roni
cE
lect
rical
and
conf
orm
ityE
quip
men
tE
lect
roni
c M
utua
las
sess
men
ts a
nd(A
SE
AN
EE
MR
A)
Rec
ogni
tion
appr
oval
has
been
Arr
ange
men
tpr
oced
ures
inim
plem
ente
d(A
PE
C E
EM
RA
)ce
rtai
n se
ctor
s-
Mut
ual r
ecog
nitio
nof
veh
icle
insp
ectio
nce
rtifi
cate
s an
ddr
ivin
g lic
ence
s

60Ta
ble
2.
(co
nti
nu
ed)
Tra
de
fa
cil
ita
tio
n
Ma
in a
rea
s c
ov
ere
dm
ea
su
res
AS
EA
N/
AP
EC
SA
AR
C/S
AF
TA
PA
CE
RA
SF
TA
(or
gro
up
s o
fA
FTA
me
as
ure
s)
Oth
er m
easu
res
Har
mon
izat
ion
of-
Par
ticip
ate
inE
xcha
nge
-In
tegr
ate
trad
eA
dopt
ion
ofro
ad tr
affic
Asi
a-P
acifi
cin
form
atio
n on
the
faci
litat
ion
UN
CIT
RA
L M
odel
regu
latio
ns in
Labo
rato
rypr
omot
ion
of g
ood
prog
ram
mes
toLa
w o
n E
lect
roni
cac
cord
ance
with
the
Acc
redi
tatio
ncl
assi
ficat
ion
wor
km
ake
them
...
toC
omm
erce
Vie
nna
Con
vent
ions
Coo
pera
tion
infr
astr
uctu
reth
e ex
tent
on R
oad
Traf
fic, a
nd(A
PLA
C)
and
prac
ticab
le ..
.R
oad
Sig
ns a
ndP
acifi
cco
nsis
tent
with
Sig
nals
Acc
redi
tatio
not
her
regi
onal
and
Coo
pera
tion
inte
rnat
iona
l tra
de-
Par
ticip
ate
infa
cil i t
atio
ngl
obal
MR
A o
nag
reem
ents
and
met
rolo
gyin
itiat
ives
...
Coo
pera
tion
and
Trai
ning
and
hum
anTr
aini
ng to
pro
mot
eW
orks
hops
on
Iden
tify
natio
nal
No
No
assi
stan
cere
sour
ces
regi
onal
uni
form
ity,
cust
oms-
rela
ted
trai
ning
inst
itutio
nsde
velo
pmen
tco
ordi
nate
d ac
tion,
issu
esan
d tr
aini
ngeq
uiva
lent
trea
tmen
tin
stru
ctor
s to
and
hom
ogen
eity
unde
rtak
e tr
aini
ng(V
isio
n 20
20)
prog
ram
mes
incu
stom
sad
min
istr
atio
nTe
chni
cal a
ssis
tanc
eTe
chni
cal a
ssis
tanc
eTe
chni
cal
(Im
plic
it) te
chni
cal
-D
evel
opC
oope
rativ
eto
pro
mot
e eq
ual
assi
stan
ce, e
.g.,
assi
stan
ce,
a pr
ogra
mm
e of
activ
ities
, tec
hnic
alle
vels
of
rega
rdin
g:e.
g., r
egar
ding
:w
ork
for
finan
cial
assi
stan
ce a
ndde
velo
pmen
t-
Eva
luat
ion
and
-K
yoto
Con
vent
ion
and
tech
nica
lca
paci
ty-b
uild
ing
toam
ong
cust
oms
impl
emen
tatio
n of
-C
usto
ms
valu
atio
nas
sist
ance
inad
dres
s S
PS
adm
inis
trat
ion
intr
ade
faci
litat
ion
-C
usto
ms
area
s su
ch a
sm
atte
rsor
der
to e
nhan
cem
easu
res,
adm
inis
trat
ion
trad
e fa
cilit
atio
n

61Ta
ble
2.
(co
nti
nu
ed)
Tra
de
fa
cil
ita
tio
n
Ma
in a
rea
s c
ov
ere
dm
ea
su
res
AS
EA
N/
AP
EC
SA
AR
C/S
AF
TA
PA
CE
RA
SF
TA
(or
gro
up
s o
fA
FTA
me
as
ure
s)
Coo
pera
tion
and
Tech
nica
l ass
ista
nce
regi
onal
effi
cien
cy,
asse
ssm
ent o
f-
Tarif
f-
Mut
ual a
ssis
tanc
eas
sist
ance
effe
ctiv
enes
s an
dtr
ade
faci
litat
ion
clas
sific
atio
nin
inte
rnat
iona
lun
iform
ityco
sts
foru
ms
(Vis
ion
2020
)-
WT
O c
usto
ms
valu
atio
nC
apac
ity-b
uild
ing
No
spec
ific
deta
i lsC
apac
ity-b
uild
ing,
(Im
plic
it) c
apac
ity-
Dev
elop
men
t of
Coo
pera
tive
e.g.
, reg
ardi
ng:
build
ing,
e.g
.,ca
paci
ty-b
uild
ing
activ
ities
, tec
hnic
al-
Doc
umen
tre
gard
ing:
prog
ram
mes
assi
stan
ce a
ndex
amin
atio
n-
Kyo
to C
onve
ntio
nca
paci
ty-b
uild
ing
-D
evel
opm
ent a
nd-
Cus
tom
s va
luat
ion
to a
ddre
ss S
PS
impl
emen
tatio
n-
Tarif
f cla
ssifi
catio
nm
atte
rsof
sta
ndar
ds-
Tra
inin
g-
Lega
lin
fras
truc
ture
Coo
pera
tion
Mut
ual a
ssis
tanc
eC
oope
rativ
eP
rom
otio
n of
Coo
pera
tion
-C
oope
rativ
eto
enh
ance
the
initi
ativ
e on
bila
tera
l or
deem
edac
tiviti
es,
effe
ctiv
enes
s of
regu
lato
ry r
efor
mpl
urila
tera
lap
prop
riate
tech
nica
lcu
stom
sag
reem
ents
on
assi
stan
ce a
ndco
mpl
ianc
e an
dcu
stom
sca
paci
ty-b
uild
ing
to c
ontr
ol a
ndco
oper
atio
n to
to a
ddre
ss S
PS
redu
ce s
mug
glin
gpr
even
t and
mat
ters
(Vis
ion
2020
)in
vest
igat
e-
Con
sulta
tion
and
cust
oms
offe
nces
coop
erat
ion
rega
rdin
g ru
les
ofor
igin

62
Rel
atio
nshi
p be
twee
nC
usto
ms/
busi
ness
-E
ncou
rage
-B
uild
ope
n,N
oN
oN
ot e
xplic
itly
gove
rnm
ent a
ndpa
rtne
rshi
pco
oper
atio
n an
dtr
ansp
aren
t and
busi
ness
cons
ulta
tion
with
coop
erat
ive
the
priv
ate
sect
orpa
rtne
rshi
ps w
ith-
Est
abl is
h a
clos
est
akeh
olde
rs (
e.g.
,re
latio
nshi
p w
ithcu
stom
s br
oker
s,th
e bu
sine
sssh
ippe
rs,
com
mun
ity fo
r th
ew
areh
ouse
s)m
utua
l ben
efit
of-
Sur
veys
on
cust
oms
cont
rol
cust
oms
and
trad
etr
ansp
aren
cyIm
prov
e bu
sine
ssN
o-
Str
eam
linin
gA
gree
men
t to
No
-S
hort
-ter
mm
obil i
tyte
mpo
rary
ent
ryco
nsid
er th
ebu
sine
ss v
isito
r(A
PE
C b
usin
ess
sim
plifi
catio
n of
visa
(si
ngle
trav
el c
ard)
proc
edur
es fo
rim
mig
ratio
n-
Inte
rnet
busi
ness
vis
asfo
rmal
ity)
publ
icat
ion
of v
isa
-Lo
ng-t
erm
vis
a fo
rin
form
atio
n an
din
tra-
corp
orat
efo
rms
tran
sfer
ees
Ta
ble
2.
(co
nti
nu
ed)
Tra
de
fa
cil
ita
tio
n
Ma
in a
rea
s c
ov
ere
dm
ea
su
res
AS
EA
N/
AP
EC
SA
AR
C/S
AF
TA
PA
CE
RA
SF
TA
(or
gro
up
s o
fA
FTA
me
as
ure
s)

63
1. Trade facilitation principles
(a) Integration and application
As discussed above, trade facilitation principles can either be listed in a cataloguesuch as APEC or be integrated in an agreement as in ASFTA. If there are several partiesto an agreement with different levels of economic development and different culturalbackgrounds, it is advisable to define the underlying trade facilitation principles separately.Either way, the principles should be limited in number, and should comprise generalunderstandings and intentions.
To be effective, the principles have to be translated into concrete measures. Indisputes regarding such measures, the principles should be the accepted guidelines ininterpreting or applying specific trade facilitation measures.
(b) Model trade facilitation principles
The following trade facilitation principles recur in most modern RTAs and are thereforepotentially instructive as model trade facilitation principles for future trade agreementnegotiations.
(i) Compliance with multilateral agreements
As a general rule, any trade facilitation action should be designed to comply withexisting and future multilateral agreements. The WTO framework already addresses variousaspects of trade facilitation in the wider sense.60 A WTO agreement on trade facilitation61
is still under negotiation and depends on a successful conclusion of the negotiations onthe Doha Development Agenda. However, RTAs can achieve compliance by makingreference to WTO. Other important multilateral agreements such as the revised KyotoConvention of WCO62 should be considered in order to avoid a multitude of contradictorystandards.
Initiatives to comply with multilateral agreements can be found in AFTA (e.g., BaliConcord II and VAP) and APEC. SAFTA aims at harmonizing standards in accordancewith international standards without explicitly referring to multilateral agreements andPACER request programmes for trade facilitation measures that are consistent with otherinternational agreements.
60 For example, WTO Agreements on Sanitary and Phytosanitary Measures, Technical Barriers toTrade, Customs Valuation, Pre-shipment Inspection, Rules of Origin and Import Licensing Procedures.
61 To clarify and further develop GATT Articles V, VIII and X.
62 The International Convention on the Simplification and Harmonization of Customs Procedures(revised Kyoto Convention) was signed in 1999, entered into force on 3 February 2006 and is currentlyratified by 46 Contracting Parties.

64
(ii) Transparency
The principle of transparency is probably one of the most essential tools for buildingtrust and facilitating trade.63 It calls not only for the publication and accessibility of laws,regulations and decisions affecting international trade (trade regulations),64 but also fora uniform, consistent and impartial application of such trade regulations and a judicial,arbitral or administrative mechanism to review their application.
Transparency is one of the 2001 APEC trade facilitation principles. Although it isnot mentioned explicitly in the other agreements, ASFTA refers to GATT Articles X, andAFTA and PACER require that new or changed trade regulations are notified to the respectivesecretariats.
(iii) Simplification
Simplification of trade regulations and procedures is not limited to the clearance ofgoods. The principle of simplification aims in general to reduce the number and diversityof laws, regulations and guidelines related to trade, and to make trade rules and theiradministration simpler, more practicable, consistent and efficient. It is a commonunderstanding that trade regulations and procedures should not be more restrictive thannecessary.65
Simplification is another APEC trade facilitation principle, but it also emerges clearlyfrom trade facilitation measures of AFTA, SAFTA and ASFTA (generally in the context withcustoms formalities, fees and charges). PACER does not mention simplification, but onecould argue that the intention to follow international best practices implies some degree ofsimplification.
(iv) Harmonization and standardization
Most crucial for international trade is the harmonization of regulations andprocedures, which should go hand in hand with overall simplification. Again, to achievethe full benefits, harmonization should not be limited to customs.66 The implementation ofuniform classifications,67 the harmonization of trade regulations in general, and theharmonization and recognition of standards all allow a higher level of automation and useof computer technology, which therefore reduces transaction costs.
63 See Azhari, 2004.
64 See, for example, GATT 1994 Article X.
65 The APEC Trade Facilitation Principles use the phrase no more burdensome or restrictive thannecessary to achieve their legitimate objectives to clarify that trade rules or their complexity shouldnot be used as covert protectionist measures.
66 For example, the WTO Customs Valuation Agreement and the WCO revised Kyoto Convention.
67 For example, ASEAN Harmonized Tariff Nomenclature, WCO Harmonized System Nomenclature(HS 2002, HS 2007).

65
Harmonization and standardization is a trade facilitation principle of APEC andemanates from AFTA, SAFTA and ASFTA trade facilitation measures concerning customs(e.g., the revised Kyoto Convention) and sectoral harmonization of technical standards. Inthe case of PACER, standardization and harmonization are again only being impliedindirectly (i.e., ... follow international best practice ... ).
(v) Cooperation, technical assistance and capacity-building
Cooperation between governments and between a government and the tradecommunity are essential to the design and implementation of efficient trade facilitationmeasures. Cooperation includes consultation about plans for new or amended traderegulations, the identification of international best practices regarding regulations and theirimplementation, and communication of information and data relevant to trade.
There are often significant discrepancies regarding the economic development ofmember States of an RTA and the resources available through an RTA for technicalassistance. There is a need in many developing countries and small economies to buildcapacities by training government officials and members of the trade community toadminister and take advantage of new trade facilitation measures.
Setting up appropriate computer systems and databases for exchanges of customsdata, or the publication of trade regulations, are essential but costly commitments to assistdeveloping countries and LDCs on such matters. This needs to be clearly established inthe principles of any agreement.
PACER emphasizes the general importance of capacity-building and technicalassistance. The other agreements also promote cooperation and technical assistance inthe context of customs control. APEC, SAFTA and ASFTA also provide for capacity-building measures.
2. Trade facilitation measures
(a) Trade facilitation measures in general
In the RTAs examined, a large number of trade facilitation measures have beenproposed. Most of those measures and proposals are quite general and leave - wherenecessary - the details to separate (lower ranking) agreements or specialist bodies. Forexample, in SAFTA, a senior official level Committee of Experts (COE) monitors, reviewsand facilitates the implementation of the provisions of the agreement. This is reasonableas it ensures the flexibility required to adopt new technologies or improved practices.
(b) Model trade facilitation measures
Table 1 shows a general comparative analysis of the treatment of trade facilitationin the agreements discussed above, whereas table 2 provides a more detailed comparisonof specific trade facilitation measures identified. Table 3 provides an overview of theproposed model measures based on key principles, relative cost, level of prioritization andthe current likely outcome of multilateral negotiations on these measures.

66Ta
ble
3.
Ov
erv
iew
of
pro
po
se
d t
rad
e f
ac
ilit
ati
on
mo
de
l m
ea
su
res
a
Tra
de
fa
cil
ita
tio
nT
rad
e f
ac
ilit
ati
on
mo
de
l m
ea
su
reb
Co
stc
Pri
ori
tyd
Ma
in G
AT
T A
rtic
les
Ex
pe
cte
d o
utc
om
e,
WT
Op
rin
cip
lec
on
ce
rne
d
Tran
spar
ency
Pub
lish
trad
e re
gula
tions
Low
(if
1A
rt. X
(P
ublic
atio
n an
dIn
tern
et p
ublic
atio
ntr
ansl
atio
n,A
dmin
istr
atio
n of
Tra
dem
ediu
m-h
igh)
Reg
ulat
ion)
Ens
ure
diss
emin
atio
n of
info
rmat
ion
Low
1A
rt. X
(P
ublic
atio
n an
dIn
tern
et p
ublic
atio
n, n
otifi
catio
nre
leva
nt to
trad
eA
dmin
istr
atio
n of
Tra
deto
WT
O s
ecre
taria
tR
egul
atio
n)P
rovi
de a
dvan
ce r
ulin
gs in
cus
tom
s m
atte
rsM
ediu
m2
Art
. X (
Pub
licat
ion
and
Adv
ance
rul
ings
reg
ardi
ng ta
riff
Adm
inis
trat
ion
of T
rade
clas
sific
atio
n an
d cu
stom
sR
egul
atio
n)va
luat
ion
Est
ablis
h a
mec
hani
sm to
rev
iew
dec
isio
nsH
igh
2A
rt. X
(P
ublic
atio
n an
dR
ight
of a
ppea
lA
dmin
istr
atio
n of
Tra
deR
egul
atio
n)A
pply
trad
e re
gula
tions
con
sist
ently
and
inM
ediu
m2
Art
. X (
Pub
licat
ion
and
Rig
ht o
f app
eal,
code
of
a no
n-di
scrim
inat
ory
man
ner,
and
gua
rant
eeA
dmin
istr
atio
n of
Tra
deco
nduc
tdu
e pr
oces
sR
egul
atio
n)
Sim
plifi
catio
nM
inim
ize/
redu
ce fe
es a
nd c
harg
es in
Med
ium
1A
rt. V
III (
Fee
s an
dU
rge
disc
ipl in
e re
gard
ing
fees
conn
ectio
n w
ith im
port
s or
exp
orts
For
mal
ities
)an
d ch
arge
sE
stab
lish
a si
ngle
win
dow
/one
-tim
eM
ediu
m-h
igh
2A
rt. V
III (
Fee
s an
dS
ingl
e w
indo
wsu
bmis
sion
pro
cedu
reF
orm
aliti
es)
Impl
emen
t pre
-arr
ival
exa
min
atio
nM
ediu
m1
Art
. VIII
(F
ees
and
Pro
visi
on o
f pre
-arr
ival
For
mal
ities
)ex
amin
atio
nIm
plem
ent P
CA
Med
ium
2A
rt. V
III (
Fee
s an
dP
rovi
sion
of P
CA
For
mal
ities
)A
pplic
atio
n of
ris
k m
anag
emen
t tec
hniq
ues
Low
1A
rt. V
III (
Fee
s an
dTr
uste
d tr
ader
, gre
en li
ne e
tc.
For
mal
ities
)E
limin
atio
n of
pre
-shi
pmen
t ins
pect
ions
Low
1A
rt. V
III (
Fee
s an
dN
o cu
stom
s br
oker
s an
dan
d us
e of
cus
tom
s br
oker
sF
orm
aliti
es)
pre-
ship
men
t ins
pect
ions
Sim
plify
and
red
uce
cust
oms
proc
edur
esM
ediu
m2
Art
. VIII
(F
ees
and
Sta
ndar
d cu
stom
s do
cum
ent,
and
docu
men
tary
req
uire
men
tsF
orm
aliti
es)
e-cu
stom
s
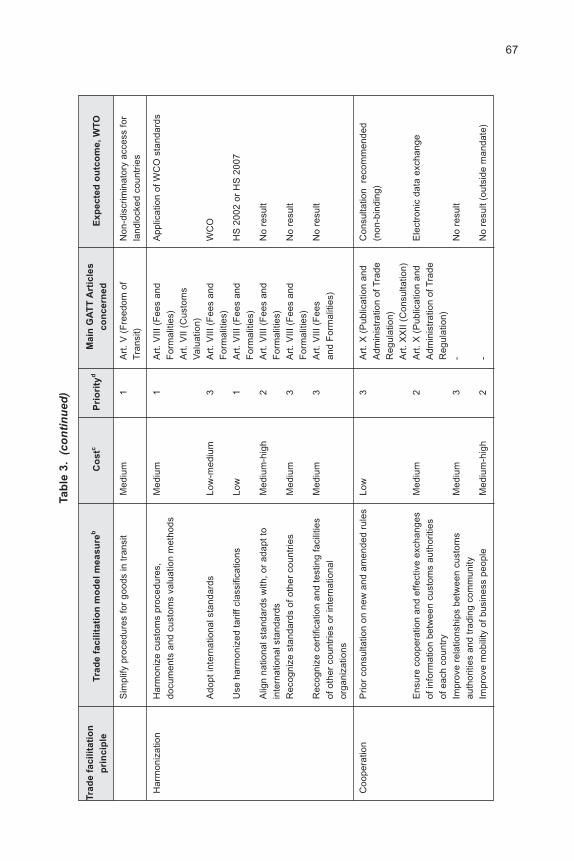
67Ta
ble
3.
(co
nti
nu
ed)
Tra
de
fa
cil
ita
tio
nT
rad
e f
ac
ilit
ati
on
mo
de
l m
ea
su
reb
Co
stc
Pri
ori
tyd
Ma
in G
AT
T A
rtic
les
Ex
pe
cte
d o
utc
om
e,
WT
Op
rin
cip
lec
on
ce
rne
d
Sim
plify
pro
cedu
res
for
good
s in
tran
sit
Med
ium
1A
rt. V
(F
reed
om o
fN
on-d
iscr
imin
ator
y ac
cess
for
Tran
sit)
land
lock
ed c
ount
ries
Har
mon
izat
ion
Har
mon
ize
cust
oms
proc
edur
es,
Med
ium
1A
rt. V
III (
Fee
s an
dA
pplic
atio
n of
WC
O s
tand
ards
docu
men
ts a
nd c
usto
ms
valu
atio
n m
etho
dsF
orm
aliti
es)
Art
. VII
(Cus
tom
sV
alua
tion)
Ado
pt in
tern
atio
nal s
tand
ards
Low
-med
ium
3A
rt. V
III (
Fee
s an
dW
CO
For
mal
ities
)U
se h
arm
oniz
ed ta
riff c
lass
ifica
tions
Low
1A
rt. V
III (
Fee
s an
dH
S 2
002
or H
S 2
007
For
mal
ities
)A
l ign
natio
nal s
tand
ards
with
, or
adap
t to
Med
ium
-hig
h2
Art
. VIII
(F
ees
and
No
resu
ltin
tern
atio
nal s
tand
ards
For
mal
ities
)R
ecog
nize
sta
ndar
ds o
f oth
er c
ount
ries
Med
ium
3A
rt. V
III (
Fee
s an
dN
o re
sult
For
mal
ities
)R
ecog
nize
cer
tific
atio
n an
d te
stin
g fa
cil i t
ies
Med
ium
3A
rt. V
III (
Fee
sN
o re
sult
of o
ther
cou
ntrie
s or
inte
rnat
iona
lan
d F
orm
aliti
es)
orga
niza
tions
Coo
pera
tion
Prio
r co
nsul
tatio
n on
new
and
am
ende
d ru
les
Low
3A
rt. X
(P
ublic
atio
n an
dC
onsu
ltatio
n re
com
men
ded
Adm
inis
trat
ion
of T
rade
(non
-bin
ding
)R
egul
atio
n)A
rt. X
XII
(Con
sulta
tion)
Ens
ure
coop
erat
ion
and
effe
ctiv
e ex
chan
ges
Med
ium
2A
rt. X
(P
ublic
atio
n an
dE
lect
roni
c da
ta e
xcha
nge
of in
form
atio
n be
twee
n cu
stom
s au
thor
ities
Adm
inis
trat
ion
of T
rade
of e
ach
coun
try
Reg
ulat
ion)
Impr
ove
rela
tions
hips
bet
wee
n cu
stom
sM
ediu
m3
-N
o re
sult
auth
oriti
es a
nd tr
adin
g co
mm
unity
Impr
ove
mob
ility
of b
usin
ess
peop
leM
ediu
m-h
igh
2-
No
resu
lt (o
utsi
de m
anda
te)

68Ta
ble
3.
(co
nti
nu
ed)
Tra
de
fa
cil
ita
tio
nT
rad
e f
ac
ilit
ati
on
mo
de
l m
ea
su
reb
Co
stc
Pri
ori
tyd
Ma
in G
AT
T A
rtic
les
Ex
pe
cte
d o
utc
om
e,
WT
Op
rin
cip
lec
on
ce
rne
d
Use
of m
oder
nU
se o
f aut
omat
ion
and
auto
mat
ed s
yste
ms
Hig
h1
Art
. VIII
(F
ees
and
Use
of a
utom
ated
sys
tem
ste
chno
logy
for
cust
oms
carg
o pr
oces
sing
For
mal
ities
)U
se o
f ele
ctro
nic
com
mun
icat
ion
syst
ems
Hig
h1
Art
. VIII
(F
ees
and
Use
of e
lect
roni
c co
mm
unic
atio
nF
orm
aliti
es)
Tech
nica
lP
rovi
de te
chni
cal a
ssis
tanc
e to
LD
Cs
Med
ium
1eD
oha
Dev
elop
men
tTe
chni
cal a
ssis
tanc
e fo
r LD
Cs
assi
stan
ce a
ndA
gend
aca
paci
ty-b
uild
ing
Est
ablis
h in
tern
atio
nal t
rain
ing
prog
ram
mes
Med
ium
2—
Not
exp
l icit,
incl
uded
in te
chni
cal
assi
stan
ce a
nd c
apac
ity-b
uild
ing
Bui
ld c
apac
ity w
ithin
LD
Cs
Low
1D
oha
Dev
elop
men
tC
apac
ity-b
uild
ing
for
LDC
sA
gend
a
Not
es:
a Al l
stat
emen
ts r
egar
ding
cos
t, pr
iorit
ies
and
expe
cted
WT
O o
utco
me
repr
esen
t es
timat
ions
by
the
auth
or b
ased
on
the
anal
ysis
per
form
ed i
nco
ntex
t w
ith t
his
pape
r. T
he a
ctua
l co
st a
nd p
riorit
ies
wil l
var
y fr
om c
ount
ry t
o co
untr
y.
Sim
i larly
the
WT
O o
utco
mes
dep
end
on t
he o
ngoi
ngne
gotia
tions
. (T
he a
utho
rs a
nd th
e IIB
E&
L ar
e no
t res
pons
ible
for
the
accu
racy
of t
hese
est
imat
es a
nd r
efus
e an
y l ia
bil i t
y fo
r ac
tion
take
n ba
sed
onth
ese
estim
ates
.)bT
rade
faci
litat
ion
mod
el m
easu
res
are
desc
ribed
in d
etai
l abo
ve in
the
text
.c E
stim
ated
cos
t fo
r im
plem
enta
tion,
ass
umin
g th
ere
is n
o pr
e-ex
istin
g m
easu
re o
f th
at t
ype
(sca
le:
low
-med
ium
-hig
h);
see
also
cos
t es
timat
es in
Duv
al, 2
006,
p. 1
5 an
d M
os
, 200
4.d S
ugge
sted
prio
rity
base
d on
cos
t/effe
ct c
onsi
dera
tions
(sc
ale:
1 to
3, 1
bei
ng th
e hi
ghes
t prio
rity)
; see
als
o pr
iorit
y of
trad
e fa
cilit
atio
n m
easu
res
inD
uval
(20
06),
p. 2
0.eD
evel
opin
g co
untr
ies
shou
ld r
eque
st th
e ne
cess
ary
tech
nica
l ass
ista
nce
and
capa
city
-bui
ldin
g as
ear
ly a
s po
ssib
le.
cost
/effe
ct

69
As part of the analysis of the RTAs in the Asia-Pacific region and the proposalssubmitted in WTO trade facilitation negotiations,68 considerable effort has been made toidentify best practice measures. Some of the model measures suggested below can besubsumed under more than one trade facilitation principle. To avoid double counting, theauthors have used cross-referencing.
The cost and time required to implement the suggested measures depends on therelevant pre-existing conditions in each country. Accordingly, it is very difficult to providegeneral recommendations on how to prioritize and time the implementation of specificmeasures. However, table 3 makes some attempt to do so.
Publication and information dissemination via the Internet can normally be achievedquickly and at a limited cost (although it might be that not all documents are available in anofficial WTO language). The implementation of international standards and procedures(foremost customs standards and procedures) are more costly, and require some technicalassistance and capacity-building. Probably the most expensive and time-consuming measuresto implement concern the implementation of due process, right of appeal, advance ruling,consultation prior to regulation, code of conduct, and cooperation between governmentagencies and private sector, The reason is that these measures not only require technicalassistance and extensive capacity-building and training programmes, but may often involvevalue and cultural changes within government authorities.
(c) Proposed key model trade facilitation measures
Prioritization and timing aside, the authors propose the following key model tradefacilitation measures, which should be examined in conjunction with tables 1 to 3 of thischapter. The wording proposed by the authors in the suggested model measures is drawnfrom several proposals made by WTO members (World Trade Organization, 2006) andproposed APEC model measures.69
(i) Transparency
• Publish trade regulations. Suggested model measure:
Publish in at least one of the official WTO languages70 all relevant laws,regulations, administrative guidelines, rulings and decisions affecting
68 As a guide to the proposed WTO trade facilitation measures, refer to the latest compilation by theWTO Secretariat TN/TF/W/43/Rev. 12 (July 25, 2007).
69 See APEC, 2005. In the context of the Busan Roadmap towards the Bogor Goals (the promotionof high-quality RTAs and FTAs), APEC leaders committed to developing model measures for RTAs/FTAs for as many commonly accepted chapters as possible by 2008. Although the development ofAPEC model measures on RTAs/FTAs has not been finalized, detailed proposals for trade facilitationmodel measures have been submitted.
70 The official WTO languages are English, French and Spanish. For some developing countries andLDCs, translation and/or publication of all trade regulations could be too demanding. Special anddifferential treatment could therefore allow for the publication of only summaries of relevant regulations.See Turkey s contribution to the WTO trade facilitation negotiation (TN/TF/W/45).
70
international trade, including customs procedures, fees and charges tocross-border trade. Make this information widely available and easilyaccessible (and, where possible, on-line) in a non-discriminatory fashionto any interested party at no cost or at a minimal charge commensuratewith the cost of the services rendered.
• Ensure dissemination of information relevant to trade. Suggested modelmeasures:
(a) Notify other countries and the WTO Secretariat in one of the officialWTO languages the introduction of new or the amendment ofexisting trade regulations that may have a significant impact ontrade at the earliest71 possible stage;
(b) Allow an adequate period between the publication and theimplementation or entry into force of new or amended regulations,except in cases where advance notice is precluded or not practicaldue to extraordinary circumstances such as imminent threats tonational security;
(c) Establish a national enquiry point responsible for providing all relevanttrade-related information or documents to the trading communityon a non-discriminatory basis and within an adequate time period.
• Provide advance rulings in customs matters. Suggested model measure:
Issue upon written request by an applicant with justifiable cause (e.g.,importer, exporter or producer) a binding advance ruling on the mainelements of importation, such as tariff classification, customs valuation,applicable duties and taxes, together with all relevant facts and supportingdocuments.72
• Establish a mechanism to review decisions. Suggested model measure:
Establish non-discriminatory procedures for administrative and legalappeal against customs and other agency decisions at reasonable cost.The appellant should have the right to be represented at all stages ofthe appeal procedure by an agent or a lawyer, and goods subject to anappeal should normally be released provided an adequate guaranteefor duty payment, such as a deposit, is provided by the appellant.
• Apply trade regulations consistently and in a non-discriminatory manner,and guarantee due process. Suggested model measures:
71 This would imply that changes are notified whenever possible before they enter into force. Theadvance notice should be long enough in order for the trade community to adapt to the changes; seealso next suggested model measure.
72 The WTO proposal by Singapore regarding advance rulings is very detailed and elaborates howlong a ruling should be valid and under what conditions it can be revoked (TN/TF/W/38).

71
(a) Establish a mechanism for reviewing decisions (see previousproposed measure);
(b) Develop, implement and enforce a code of conduct for customsofficials and staff based on international best practice;
(c) Establish a centralized government body in charge of interpretingand providing training in the application of customs regulations(e.g., customs classification and valuation);
(d) Introduce computerized systems to reduce the discretion exercisedby customs officials and staff with regard to basic customs decisions.
(ii) Simplification
• Minimize/reduce fees and charges in connection with import or export.Suggested model measures:
(a) Consolidate, reduce and minimize the number, diversity and amountof fees and charges imposed in connection with importation andexportation;
(b) Ensure that fees and charges are only imposed on services providedin direct connection with the specific importation or exportation inquestion;
(c) Ensure that fees and charges do not exceed the approximate costsof the services provided and are not calculated on an ad valorembasis.
• Establish a single window/one-time submission procedure. Suggestedmodel measure:
Establish a single window allowing the one-time electronic orpaper-based submission of import or export data and documentationrequirements.
• Implement pre-arrival examination. Suggested model measure:
Introduce procedures for filing and examining documents prior to thearrival of goods, enabling importers to claim their goods immediatelyafter importation unless the goods are subject to a physical examination73
or the submitted documents have to be reviewed.
73 A risk assessment should determine whether incoming goods are subject to an examination andhow thorough the examination will be. (See also the suggested measure, Application of risk managementtechniques and the proposal by Chile, TN/TF/ W/70).

72
• Implement PCA. Suggested model measure:
Introduce procedures that allow customs authorities to first release all ormost of the imported goods, and then conduct a thorough review of thedocuments regarding selected goods.74
• Application of risk management techniques. Suggested model measure:
Conduct examinations and inspections of goods by using establishedrisk assessment and risk management procedures,75 in particular byclassifying importers/exporters into different risk levels, based on theircompliance record and by simplifying formalities for authorized traders.
• Elimination of pre-shipment inspections (PSI) and use of customs brokers.Suggested model measures:
(a) Eliminate any requirement for the mandatory use of PSI;
(b) Eliminate any requirement for the mandatory use of customs brokers.
• Simplify and reduce customs procedures and documentary requirements.Suggested model measures:
(a) Simplify and reduce the incidence and complexity of import andexport formalities and data requirements to the necessary minimumfor enforcing legitimate policy objectives,76 by applying internationalstandards77 to the extent possible.
(b) Attempt to reach agreement on a minimum number of documentsrequired for imports and exports.
• Simplify procedures for goods in transit. Suggested model measure:
Simplify and reduce formalities, documentation requirements, fees andcharges,78 and controls on goods in transit to the minimum necessary toensuring national security and health, by applying international standards,79
and by promoting bilateral and regional transit agreements.
74 The selection of goods to be thoroughly examined depends on the risk assessment. (See suggestedmeasure, Application of risk management techniques ).
75 For example, as defined in the WCO Revised Kyoto Convention Guidelines.
76 For example, assessment and collection of duties and taxes, compilation of statistics, ensuringconformity with sanitary and phytosanitary or technical barriers to trade requirements (see: proposalof New Zealand, Norway and Switzerland, TN/TF/W/36).
77 For example, WTO Customs Valuation Agreement, HS Conventions (2002 and 2007), UN LayoutKey Guidelines, WCO Revised Kyoto Convention, and UN/CEFACT Recommendations.
78 The majority of proposals in the WTO negotiations aim to eliminate all fees and charges for goodsin transport (see documents TN/TF/W/39, TN/TF/W/70 and TN/TF/W/79).
79 For example, Annex E of the WCO Revised Kyoto Convention, the TIR (Transports InternationauxRoutiers) Convention, the ATA Convention, the Istanbul Convention.
73
(iii) Harmonization
• Harmonize customs procedures, documents and customs valuationmethods. Suggested model measure:
See the above measure, Simplify and reduce customs procedures anddocumentary requirements .
• Adopt international standards. See suggested measure below, Alignnational standards with or adapt to international standards .
• Use harmonized tariff classification. Suggested model measure:
Apply objective criteria for tariff classification of goods by adopting theWCO Harmonized Commodity Description and Coding System (HSConvention 2002/2007).80
(iv) Standardization
• Align national standards with, or adapt to international standards.Suggested model measure:
Align national standards with, or adapt to internationally establishedstandards for quality management and product safety81 to the extentpracticable.
• Recognize standards of other countries. Suggested model measure:
Recognize, based on mutual recognition agreements, product standardsand/or classifications of other countries.
• Recognize certification and testing facilities of other countries orinternational organizations. Suggested model measure:
Recognize, based on mutual recognition agreements, the certificationbodies and test facilities of other countries and/or internationalorganizations and recognize goods approved by such bodies as beingcompliant with safety and quality requirements without further testing.
(v) Cooperation
• Prior consultation on new and amended rules. Suggested model measure:
Provide interested parties, including the private sector, with an opportunityto comment on prospective new or amended trade-related laws andregulations prior to implementation or entry into force of the changes.
80 This measure intersects with the principle of transparency (see the measure, Apply trade regulationsconsistently and in a non-discriminatory manner, and guarantee due process ) and the measures tosimplify customs procedures (see the measure, Simplify and reduce customs procedures and documentaryrequirements ).
81 For example, ISO standards.

74
• Ensure cooperation and effective exchange of information betweencustoms authorities. Suggested model measures:
(a) Provide for compatible import/export data requirements and dataprocessing systems.
(b) Integrate official controls into a one-stop shop to the extent possible,for example, by the alignment of working hours and the developmentof common customs facilities.
• Improve relationships between customs authorities and trading community.Suggested model measures:
(a) Ensure dissemination of information relevant to trade - establisha national enquiry point responsible for providing all relevanttrade-related information or documents to the trading communityon a non-discriminatory basis and within an adequate time period(see (i) Transparency above);
(b) Provide advance rulings in customs matters (see (i) Transparencyabove);
(c) Prior consultation on new and amended rules (see (v) Cooperationabove).
• Improve the mobility of business people. Suggested model measure:
Enhance the mobility of business people engaged in conducting tradeby facilitating temporary business entry and establishing streamlinedimmigration clearance procedures for highly-qualified business people.
(vi) Use of modern technology
• Use of automation and automated systems for customs cargo processing.Suggested model measure:
Establish a mechanism82 and, to the extent possible, an automatedsystem that facilitates cooperation between customs authorities byexchanging specific information such as customs valuation, tariffclassification, accurate description, quantity and origin of goods etc.,and where appropriate, supporting documentation such as commercialinvoices, packing lists, certificates of origin etc.
• Use of electronic communication (e-customs, submission of documentsand payment of duties). Suggested model measure:
Establish an electronic communication system that allows importers andexporters to submit required data and documentation in standardized
82 For example, based on the WCO customs data model.

75
form, pay duties and fees, communicate with customs authorities, andreceive documents and decisions from customs authorities.
(vii) Technical assistance and capacity-building
• Provide technical assistance to LDCs and other countries with specialneeds by:
(a) Offering assistance to develop and maintain of official websites;
(b) Providing translation services to LDCs that face difficulties inpublicizing their trade regulations in an official WTO language;
(c) Providing information on previous experiences regarding tradefacilitations (best practice, lessons learnt);
(d) Offering support for building computerized databases for nationaltrade regulations;
(e) Offering assistance in establishing advance ruling regimes;
(f) Offering assistance in reviewing current customs procedures anddocumentation requirements and in implementing internationalstandards;
(g) Providing resources and assistance for implementing and maintaininga single window;
(h) Offering assistance in implementing risk management systems;
(i) Establishing international training programmes for training customsofficers (e.g., regarding applying harmonized customs proceduresor drafting advance rulings), and exchanges of customs staff fortraining purposes and for gaining (international) experience.
• Capacity-building within LDCs and other countries with special needsby:
(a) Training government officials in developing and maintaining officialwebsites and databases for national trade regulations;
(b) Training customs officials in operating a single window;
(c) Training customs officials in assessing and managing risks;
(d) Organizing courses and seminars to train and enable governmentofficials to implement trade facilitation measures.
While there are undoubtedly other specific measures of merit, the above are putforward as a substantive guide to developing country negotiators for their consideration.As noted above, table 3 attempts to prioritize the above suggested measures. Somefurther generic implications for developing countries are highlighted in the next section.
76
C. Some implications for developing countries
1. Harmonization of trade facilitation measures
Trade facilitation can involve national, bilateral and multilateral action. A significantpart of trade transaction costs are imposed directly or indirectly by national governmentsthat desire to control trade, in some cases so strictly that traders are strangled by red tapeand the associated costs. In such cases, trade facilitation requires national actions andoften a change in political attitudes.83
Some of the costs associated with trade can be reduced by bilateral initiatives(e.g., coordination of opening times of border crossings), but many current trade facilitationinitiatives at the bilateral or plurilateral levels are addressing essentially multilateral issues.Pressure from a major trading partner, promises of reciprocity or of cost underwriting (as inPACER) may contribute to the attractiveness of implementing trade facilitation measures.However, as APEC members and others have recognized that it is crucial to coordinatetrade facilitation with multilateral trade facilitation negotiations or at least with the majorregional trading partners.
2. Importance of capacity-building and technical assistance
Trade facilitation is beneficial to countries at any level of development insofar as itreduces the costs of trading. There are, however, the costs of introducing some tradefacilitation measures, whether in terms of assessing and changing national legislation andregulation, training officials who will implement the measures, hiring new staff or buyingequipment.
Ideally, cost considerations should not deter any country from implementing tradefacilitation measures, as there is broad consensus among many economists that trade isbeneficial for development and for poverty alleviation in developing countries.84 For thesame reason, there is a strong case for developed countries, multilateral institutions andaid donors to fund and staff technical assistance and capacity-building in this area.
A successful assistance programme, however, requires a very careful assessmentof the specific capacities, limitations and needs of each country,85 as that allows it to betterestimate the costs of trade facilitation and to tailor the necessary technical assistance.PACER is seen as a model in this regard as it demonstrates the importance of aligningcapacity-building needs with trade facilitation reform programmes.
83 Positive examples for such changes in the recent past are China and India, whereas countriessuch as Myanmar, Uzbekistan or the Democratic People s Republic of Korea still have to make internaladjustments to reap the benefits from international trade facilitation.
84 Duval, 2006, Engman, 2005 and Mo s , 2006.
85 Mo s , 2006, p. 4.

77
3. Prioritization and sequencing of trade facilitation measures
Cost and time considerations as well as limited technical and human resourcesjustify prioritizing trade facilitation measures. Duval (2006) found that experts ranked theadoption and use of international standards, the establishment of enquiry points, tradefacilitation committees, online publication of trade regulations and procedures, and theestablishment of risk management systems as the five top priority measures.
Developing countries have and should use the flexibility during (extended) transitionperiods to assess what the most appropriate measures are for their economies. However,this should not mean postponing the implementation of measures. Developing countriesshould commence their efforts by quickly implementing those trade facilitation measuresthat require little time and other resources.
As stated above, developing countries should try to identify the resources andassistance required for the implementation of more complex or costly measures, and thendraft a national roadmap for implementation including a self-binding time frame. If theassessment or the national roadmap indicates the need for technical assistance or supportin capacity-building, developing countries should request such assistance from internationalorganizations or more advanced economies as early as possible in the process. Politically,it may be worthwhile to prioritize the implementation of those measures that will providesome immediate benefits to business and the economy.
Estimating the time and cost involved in the implementation of trade facilitationmeasures depends on how the measures are sequenced.86 Accordingly, each countryshould assess not only its priorities regarding measure implementation, but also analysewhether particular sequencing offers greater efficiencies.87
4. Special and differential treatment
Special and differential treatment (SDT) has been advocated for less developedcountries, and especially for some landlocked or island economies.88 These types ofeconomies have much to gain from trade facilitation, so it is important that any specialtreatment should not allow any obstacles to trade facilitation to block desirable measures.Accordingly, such economies should be permitted extended, but finite, transition periods toimplement trade facilitation measures rather than being granted exemptions from compliance.
Extended transition periods should not be used as a reason to postponeimplementation to the last possible minute. The sooner trade facilitation measures areimplemented, the sooner the benefits can be harvested. Implementing trade facilitation
86 Duval, 2006, p. 21.
87 However, experts are still arguing how to best sequence different types trade facilitation measures,see Duval, 2006, pp. 21.
88 See Annex D of the July Package indicating that SDT should allow linking the extent and timing ofcommitments to the implementation capacities of developing and least developed countries.

78
measures as negotiated under WTO is a complex task that affects all levels of governmentand often requires cultural changes. Such changes are normally easier to introducegradually.
Mo s (2006) proposed a more sophisticated approach to SDT , which takes intoaccount the individual needs and priorities of each country by making reference to specificterms for each trade facilitation measure, taking into consideration the relative complexityof implementation. Categorizing each trade facilitation measure for each country, accordingto Mo s , requires a great analytical ef fort before concluding a multilateral agreement;however, it would certainly create more efficient SDT provisions than a one size fits allsolution. It would also promote tailored and therefore more cost-effective capacity-buildingand technical assistance programmes.
5. Implications for multilateral negotiations
A large number of WTO members are actively committed to negotiations on tradefacilitation and have proposed a variety of measures.89 Trade facilitation initiatives in RTAsin the Asia-Pacific region set instructive examples for multilateral negotiations and havearguably been responsible for driving members commitment to multilateral trade facilitationnegotiations in WTO.
The analysis of Asia-Pacific region RTAs in this chapter shows that there areseveral ways to address trade facilitation issues in plurilateral and multilateral treaties.Whether trade facilitation is addressed by general non-binding principles or in specificbinding measures depends on a multitude of considerations such as trust, cultural background,level of economic development, available resources or the number of participating parties.
To make trade facilitation successful in general, it appears to be important to setclear and specific targets that are ambitious but achievable, well understood by businessand able to significantly reduce the cost of international trade.90 Furthermore, too muchflexibility regarding trade facilitation measures in a multilateral environment can underminethe objectives of simplification and harmonization. This is particularly the case for customsprocedures, which are most efficient when intensely supported by modern ICT. Purelyaspirational provisions or measures that cannot be enforced are likely to remain papermeasures, and actual practice at the border will continue to inhibit trade.91
On the other hand, very specific and detailed binding rules in some other areascould be interpreted - in particular in some Asian countries - as a lack of trust anddisregard for national sovereignty, or too costly and complicated to implement for developingcountries. It is the difficult task of the negotiators to balance these diverging approaches.
89 See the latest WTO negotiations on trade facilitation — compilation of members proposals ,TN/TF/W/43/Rev. 12 (July 25, 2007).
90 See Elek, 2005, Annex 1, p. 17.
91 Such an assessment largely applies to SAARC s trade facilitation efforts. The trade facilitationefforts of PACER still remain at the proposal stage.

79
Multilateral trade facilitation negotiations should, to the extent possible, takeadvantage of the pre-existing work and experiences of organizations such as WCO, theUnited Nations Economic Commission for Europe or UNCTAD, and should refer tointernationally established standards such as ISO standards or consider - where appropriateand feasible - established regional standards. These standards are widely accepted andrepresent established best practices.
Trade facilitation is likely to be non-preferential, as reductions in transaction costsor increases in customs clearance efficiency generally benefit all trade. In practice, however,governments should avoid possible discrimination for technical reasons. For example, theintroduction of electronic customs clearance facilities in a country may only benefit exportersto that country who have access to computers. Accordingly, trade facilitation measureshave to provide for traders of small volumes or with limited resources (for example, limitedor no access to the Internet) by implementing simplified paper-based procedures.
Overall, the key implications highlighted here for developing countries seekingto drive successful trade facilitation reform is to ensure consistency with multilateralnegotiations by setting clear, achievable and, where possible, enforceable objectives whetherthey are set in a bilateral or regional context. While some trade facilitation priorities willundoubtedly be based on cost and ease of implementation, it is important for each countryto assess its particular needs, to harmonize and sequence reforms in cooperation with thebusiness sector and key trading partners, and to link capacity-building, technical assistance,and special and differential needs with a specific and detailed trade facilitation reformprogramme.
80
References
APEC, 2006. Review of APEC Trade Facilitation Action Plan, 2001-2006 , Committee onTrade and Investment, APEC#2006/SOM2/CTI/049. Ho Chi Minh City, Viet Nam.
, 2005. APEC model measures for trade facilitation in RTAs/FTAs , paper presentedby Australia, APEC# 2005/CSOM/022. Busan, Republic of Korea.
, 2002. APEC Trade Facilitation Action Plan , APEC Committee on Trade andInvestment. Singapore.
, 2001. APEC economies: Breaking down the barriers , APEC# 201-CT-01.4.
ASEAN, 2001. Promoting trade facilitation through mutual recognition arrangements .Jakarta.
Assanie, N., Yuen Pau Woo and N. Brotherston, 2002. Toward the Shanghai Goal:Implementing the APEC Trade Facilitation Action Plan . Vancouver, Asia PacificFoundation of Canada.
Azhari, N., 2004. Trade facilitation: Development perspectives and approachesof ASEAN , paper presented at the Seminar on Trade Facilitation in East Asia,November 2004, Shanghai, China.
Bhagwati, J., 1995. US trade policy: The infatuation with free trade agreements , inBhagwati, Jagdish and Krueger, Anne O., The Dangerous Drift to Preferential TradeAgreements. AEI Press.
Bhagwati, J., D. Greenaway and A. Panagariya, 1998. Trading preferentially: Theory andpolicy , The Economic Journal, vol. 108, No. 449; pp. 1128-1148.
Baysan, T., A. Panagariya and N. Pitigala, 2006. Preferential trading in South Asia ,World Bank Policy Research Working Paper No. 3813. Washington, D.C.
Duval, Y., 2006. Cost and benefits of implementing trade facilitation measures undernegotiations at the WTO: An exploratory survey , Asia-Pacific Research and TrainingNetwork on Trade Working Paper Series, No. 3. Bangkok, ESCAP.
Elek, A., 2005. The mid-term review of the Bogor Goal - strategic issues and options .Canberra, Australian National University.
Engman, M., 2005. The economic impact of trade facilitation , OECD Trade Policy WorkingPaper No. 21, TD/TC/WP(2005)12/Final. Paris.
ESCAP, 2006. An exploration of the need for and cost of selected trade facilitationmeasured in Asia and the Pacific in the context of the WTO negotiations , Studiesin Trade and Investment, No. 57. Bangkok.
, 2002. Trade Facilitation Handbook for the Greater Mekong Subregion,ST/ESCAP/2224. New York.
Feridhanusetyawan, T., 2005. Preferential trade agreements in the Asia-Pacific Region ,International Monetary Fund, Working Paper No. WP/05/149. Washington, D.C.
81
Freud, C., S. Djankov and Cong S. Pham, 2006. Trading on time . Washington, D.C.,World Bank.
Kelsey, J., 2005. A People s Guide to the Pacific s Economic Partnership Agreement,World Council of Churches - Office in the Pacific. Suva.
McMaster, J., 2003. Feasibility study of Pacific islands regional trade gateway. Bangkok,ESCAP.
Mo s , E., 2006. Special and dif ferential treatment in the area of trade facilitation ,OECD Trade Policy Working Paper No. 32, TD/TC/WP(2006)9/ FINAL. Paris.
, 2004. The cost of introducing and implementing trade facilitation measures:Interim report , OECD Trade Policy Working Paper No. 8, TD/TC/WP(2004)35/FINAL. Paris.
, 2002. The Relationship between regional trade agreements and multilateraltrading system - trade facilitation , OECD Working Paper TD/TC/WP(2002)17/Final.Paris.
Narsey, W., 2004. PICTA, PACER and EPAs: Where are we going? University of theSouth Pacific, Suva.
Organisation for Economic Co-operation and Development, 2005. The costs and benefitsof trade facilitation , OECD Policy Brief. Paris.
Oo, Myo, 2005. Myanmar s experience on implementation of the trade facilitationmeasures , paper presented at the Roundtable Meeting on the WTO Trade FacilitationNegotiations, Geneva, 19-23 September 2005.
Scollay, R. and G. John, 2001. New Regional Trade Arrangements in the Asia-Pacific?Institute for International Economics, Washington D.C.
Weerakoon, D., J. Thennakoon and B. Weeraratne, 2005. Multilateral agreement ontrade facilitation - important but complex agenda for South Asia , in South AsianPositions in the WTO Doha Round - in Search of a True Development Agenda,pp. 249-296. CUTS International, Jaipur, India.
Wilson, J.S. and Ostuki, T., 2004. Trade Facilitation and Regional Integration in SouthAsia: Accelerating the Gains to Trade with Capacity Building. World Bank,Washington D.C.
Wilson, J.S., C.L. Mann and T. Otsuki, 2004. Assessing the potential benefit of tradefacilitation: A global perspective , World Bank Policy Research Working PaperNo. 3224. Washington, D.C. (Also published in The World Economy, vol. 28,No. 6, pp. 841-871).
Woo, Y.P., 2004. APEC s Trade Facilitation Action Plan: A mid-term assessment , reportprepared for the APEC Committee on Trade and Investment, Singapore.
Woo, Y.P. and J. Wilson, 2000. Cutting through Red Tape . Asia Pacific Foundation ofCanada, Vancouver.
World Trade Organization, 2006. WTO negotiations on trade facilitation - compilation ofmembers proposals , TN/TF/W/43/Rev. 7. Geneva.
83
III. TRADE FACILITATION MEASURES IN SOUTH
ASIAN FTAs: AN OVERVIEW OF INITIATIVES
AND POLICY APPROACHES
By Sachin Chaturvedi*
Introduction
During recent years, there has been a sudden surge in FTAs among developingcountries. This process has provided a new dynamics to global trade flows and hasassumed additional significance in light of the suspension of the Doha Round. Accordingto Lamy (2006), more than 50 per cent of global trade is conducted through FTAs. However,not all FTAs can be placed in the same group, as they tend to be very different in terms ofcontents, focus and coverage. This is especially true of the South-South FTAs (i.e., FTAsamong developing countries). Unlike North-South or North-North FTAs, the South-SouthFTAs (as is evident from those in South Asia) focus on a very limited set of issues, withfew exceptions.
The South Asian region has attempted to intensify regional economic integrationover the past decade through regional, subregional and bilateral arrangements. At thispoint, there are at least 23 signed or proposed FTAs in the region; one is a subregionaltrade grouping, the Bengal Initiative for Multisectoral Techno-Economic Cooperation(BIMSTEC), and one is a regional trade agreement (SAFTA) while the other 21 are bilateraltrade agreements.1
Unlike many RTAs in different parts of the world, the regional arrangement inSouth Asia has made little headway in expanding trade within the region. The region hasmaintained a high growth rate in its external sector performance during the past decade,but growth in intraregional trade is a relatively recent phenomenon. There are variousreasons for the slow growth in regional trade in South Asia including a positive list-basedapproach on the exchange of tariff preferences, small product coverage, narrow marginsof preferences and inability to address non-tariff barriers, among many other problems.2
However, it is very important for adequate attention to be paid to issues such as tradefacilitation in the South Asian FTAs, as a lack of infrastructure and access to advanced
* Sachin Chaturvedi is a Fellow, Research and Information System for Developing Countries (RIS),New Delhi, India. The author would like to thank Nagesh Kumar, S.K. Mohanty, Yann Duval and ananonymous referee of ARTNeT for their comments on an earlier draft. Thanks are also due to NasimQureshi, Dayaratna Silva and Parakrama Dissanayake for discussions concerning this chapter. Theauthor can be contacted at [email protected].
1 See ESCAP Asia-Pacific Trade and Investment Agreements Database (APTIAD).
2 Kumar, 2005.
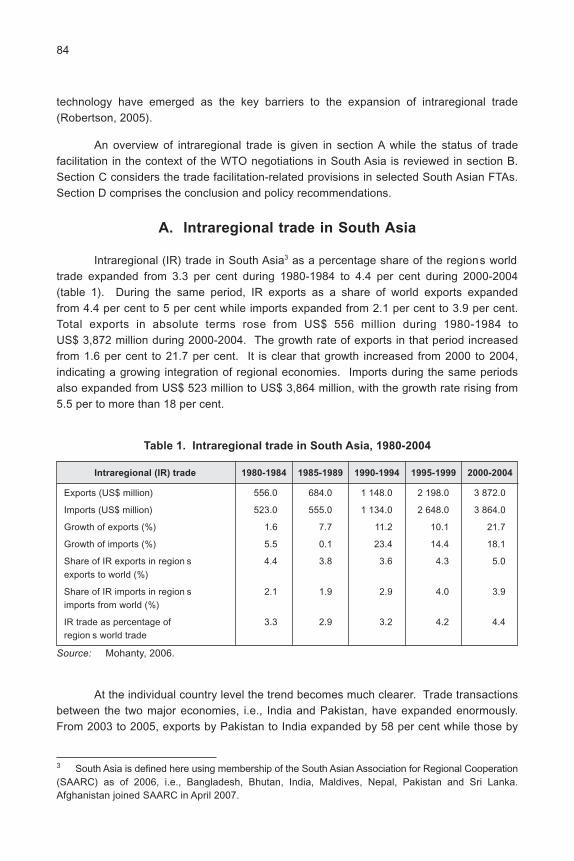
84
technology have emerged as the key barriers to the expansion of intraregional trade(Robertson, 2005).
An overview of intraregional trade is given in section A while the status of tradefacilitation in the context of the WTO negotiations in South Asia is reviewed in section B.Section C considers the trade facilitation-related provisions in selected South Asian FTAs.Section D comprises the conclusion and policy recommendations.
A. Intraregional trade in South Asia
Intraregional (IR) trade in South Asia3 as a percentage share of the regions worldtrade expanded from 3.3 per cent during 1980-1984 to 4.4 per cent during 2000-2004(table 1). During the same period, IR exports as a share of world exports expandedfrom 4.4 per cent to 5 per cent while imports expanded from 2.1 per cent to 3.9 per cent.Total exports in absolute terms rose from US$ 556 million during 1980-1984 toUS$ 3,872 million during 2000-2004. The growth rate of exports in that period increasedfrom 1.6 per cent to 21.7 per cent. It is clear that growth increased from 2000 to 2004,indicating a growing integration of regional economies. Imports during the same periodsalso expanded from US$ 523 million to US$ 3,864 million, with the growth rate rising from5.5 per to more than 18 per cent.
3 South Asia is defined here using membership of the South Asian Association for Regional Cooperation(SAARC) as of 2006, i.e., Bangladesh, Bhutan, India, Maldives, Nepal, Pakistan and Sri Lanka.Afghanistan joined SAARC in April 2007.
Table 1. Intraregional trade in South Asia, 1980-2004
Intraregional (IR) trade 1980-1984 1985-1989 1990-1994 1995-1999 2000-2004
Exports (US$ million) 556.0 684.0 1 148.0 2 198.0 3 872.0
Imports (US$ million) 523.0 555.0 1 134.0 2 648.0 3 864.0
Growth of exports (%) 1.6 7.7 11.2 10.1 21.7
Growth of imports (%) 5.5 0.1 23.4 14.4 18.1
Share of IR exports in region s 4.4 3.8 3.6 4.3 5.0exports to world (%)
Share of IR imports in region s 2.1 1.9 2.9 4.0 3.9imports from world (%)
IR trade as percentage of 3.3 2.9 3.2 4.2 4.4region s world trade
Source: Mohanty, 2006.
At the individual country level the trend becomes much clearer. Trade transactionsbetween the two major economies, i.e., India and Pakistan, have expanded enormously.From 2003 to 2005, exports by Pakistan to India expanded by 58 per cent while those by

85
India to Pakistan grew by 47 per cent (table 2). Similarly, imports by Pakistan from Indiaduring 2004-2005 expanded by 65 per cent while imports by India from Pakistan in thesame period increased by 40 per cent (table 3). The growth rate of exports by Bangladeshto regional members was also very impressive, viz. Bhutan (19 per cent), India (57 percent), Pakistan (10 per cent) and Sri Lanka (26 per cent) (table 2). Pakistan s exports toSri Lanka also grew by 42 per cent. The comprehensive economic cooperation agreementbetween India and Sri Lanka resulted in exports by Sri Lanka to India expanded by morethan 41 per cent while exports by India to Sri Lanka grew by 13 per cent. In the case ofMaldives, imports from Nepal expanded by almost by 60 per cent while imports by Pakistanfrom Nepal grew by more than 58 per cent (table 3).
Table 2. Percentage of growth in intraregional flow of exports, 2003-2005
Country Bangladesh Bhutan India Maldives Nepal Pakistan Sri Lanka
Bangladesh ˚ 19.4 57.4 ˚ 8.4 10.9 25.9
Bhutan
India 5.4 13.5 ˚ 11.2 19.2 46.6 13.0
Maldives ˚ ˚ 25.1 ˚ ˚ ˚ 6.3
Nepal -19.7 ˚ 15.5 59.8 ˚ 58.5 ˚
Pakistan -10.7 -15.2 57.9 -6.6 -13.9 ˚ 41.8
Sri Lanka -9.1 ˚ 41.3 13.3 -40.2 11.4
Source: Direction of Trade 2006, International Monetary Fund.
Table 3. Percentage of growth in intraregional flow of imports, 2004-2005
Country Bangladesh Bhutan India Maldives Nepal Pakistan Sri Lanka
Bangladesh ˚ 86.1 15.3 -50.0 -19.7 25.3 4.3
Bhutan
India 38.7 11.2 ˚ 32.8 15.5 40.1 59.0
Maldives -50.0 ˚ 28.8 ˚ 59.8 22.5 10.4
Nepal 8.4 ˚ 19.2 ˚ ˚ -13.9 -40.2
Pakistan 16.6 -19.6 64.9 -33.5 58.5 ˚ 10.8
Sri Lanka 35.9 ˚ 26.4 0.0 ˚ 36.9˚
Source: Direction of Trade 2006, International Monetary Fund.
The dynamics of regional cooperation is supported by the rapid economic expansionwhich is creating complementarities for trade expansion. The economic expansion inSouth Asia has shown divergence in performance. The aggregate GDP expanded by6.4 per cent in 2004 while in 2003 it was 7.8 per cent (Asian Development Outlook, ADO,2005). In the following year India and Pakistan had high economic growth which boosted
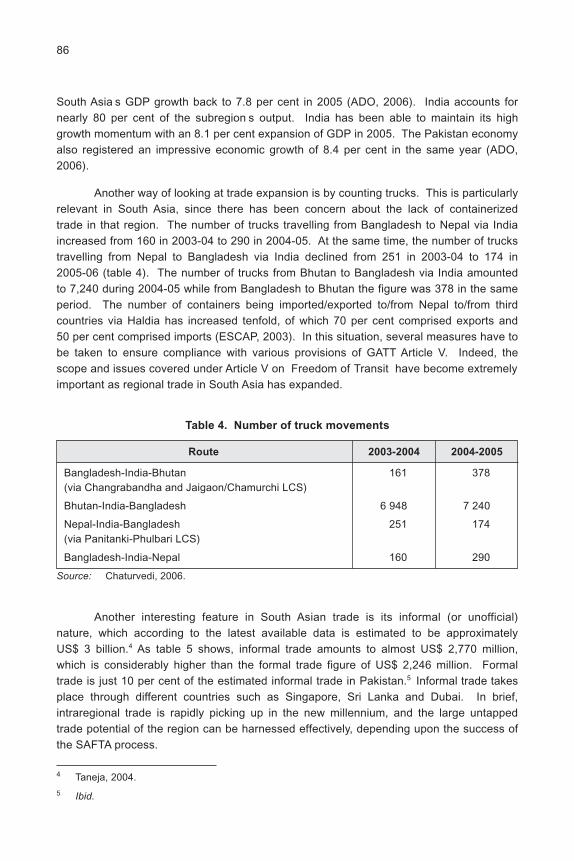
86
South Asia s GDP growth back to 7.8 per cent in 2005 (ADO, 2006). India accounts fornearly 80 per cent of the subregion s output. India has been able to maintain its highgrowth momentum with an 8.1 per cent expansion of GDP in 2005. The Pakistan economyalso registered an impressive economic growth of 8.4 per cent in the same year (ADO,2006).
Another way of looking at trade expansion is by counting trucks. This is particularlyrelevant in South Asia, since there has been concern about the lack of containerizedtrade in that region. The number of trucks travelling from Bangladesh to Nepal via Indiaincreased from 160 in 2003-04 to 290 in 2004-05. At the same time, the number of truckstravelling from Nepal to Bangladesh via India declined from 251 in 2003-04 to 174 in2005-06 (table 4). The number of trucks from Bhutan to Bangladesh via India amountedto 7,240 during 2004-05 while from Bangladesh to Bhutan the figure was 378 in the sameperiod. The number of containers being imported/exported to/from Nepal to/from thirdcountries via Haldia has increased tenfold, of which 70 per cent comprised exports and50 per cent comprised imports (ESCAP, 2003). In this situation, several measures have tobe taken to ensure compliance with various provisions of GATT Article V. Indeed, thescope and issues covered under Article V on Freedom of Transit have become extremelyimportant as regional trade in South Asia has expanded.
Table 4. Number of truck movements
Route 2003-2004 2004-2005
Bangladesh-India-Bhutan 161 378(via Changrabandha and Jaigaon/Chamurchi LCS)
Bhutan-India-Bangladesh 6 948 7 240
Nepal-India-Bangladesh 251 174(via Panitanki-Phulbari LCS)
Bangladesh-India-Nepal 160 290
Source: Chaturvedi, 2006.
Another interesting feature in South Asian trade is its informal (or unofficial)nature, which according to the latest available data is estimated to be approximatelyUS$ 3 billion.4 As table 5 shows, informal trade amounts to almost US$ 2,770 million,which is considerably higher than the formal trade figure of US$ 2,246 million. Formaltrade is just 10 per cent of the estimated informal trade in Pakistan.5 Informal trade takesplace through different countries such as Singapore, Sri Lanka and Dubai. In brief,intraregional trade is rapidly picking up in the new millennium, and the large untappedtrade potential of the region can be harnessed effectively, depending upon the success ofthe SAFTA process.
4 Taneja, 2004.
5 Ibid.

87
B. Status of WTO-related trade facilitation measures
in South Asia
The current mandate of the Negotiating Group on Trade Facilitation at WTO is toclarify and improve Article V (Freedom of Transit), Article VIII (Fees and Formalities) andArticle X (Publication and Administration of Trade Negotiations) of GATT 1994. In thecontext of intraregional trade in South Asia, infrastructural constraints are a major issue,hence Article V assumes greater significance as most LCS require better infrastructure. Inthe context of South Asian countries, the evidence regarding the status of trade facilitationmeasures introduced vis- -vis those that may feature in a future trade facilitation agreementat WTO has been pooled and summarized in this section. The implementation status oftrade facilitation measures related to GATT Articles V, VIII and X, following a WTO/WCOself-assessment checklist (for details, see ESCAP, 2006), is given in the annex to thischapter.
1. Bangladesh
In Bangladesh, the Ministry of Finance has the Internal Resources Division, underwhich the National Board of Revenue works. The National Board of Revenue is the keyagency in the formulation of policies and appraisals of tax administration in Bangladeshand is also responsible for international negotiations and interministerial deliberations.6
With the expansion of trade, Bangladesh has implemented several measures for ensuringtrade facilitation. The specific measures as per the WTO/WCO checklist are summarizedin the annex to this chapter.
Table 5. India s formal and informal trade with South Asia
(US $ million)
CountryExport Import Total trade
Official Unofficial Official Unofficial Unofficial
Bangladesh 1 063 299.00 54 14.00 313.00
Bhutan 9 31.35 11 1.23 32.58
Nepal 342 n.a. 156 n.a. 2 160.00
Sri Lanka 564 142.80 47 121.00 263.80
Total SAARC 1 978 473.15 268 136.23 2 769.38
Source: RIS, 2004.
Note: Unofficial trade figures pertain to different years during the 1990s for different countries.Official figures are from 1999.
6 See the website at www.nbr-bd.org.

88
(a) Article V
Article V has limited relevance in the case of Bangladesh, as it is not bordered byany landlocked country. Although Nepal and Bhutan, which are South Asian landlockedcountries, have shown keenness to use two seaports in Bangladesh (Chittagong andMongla), it is not clear what specific measures have been taken by Bangladesh as part ofthe proposed Article V, such as those related to documentation, securities and guarantees,seals and identification, and charges on transit goods (Bhattacharya and Hossain, 2006).The role of the private sector in supplementing the efforts at implementing Article V is alsounclear. However, Bangladesh has established an extensive network of institutions forborder agency coordination.
(b) Article VIII
Fee and charges connected with imports and exports are clearly defined andplaced on the Internet. The trading community has to pay to access the information. Thecharges are in the form of flat rates and the payments are through the automated systemfor which the World Bank has provided monetary assistance. It is not clear whetherBangladesh has opted for consularization (Bhattacharya and Hossain, 2006). Bangladeshuses ASYCUDA++, which ensures enhanced risk management for selectivity, profiling andintelligence. Also, as part of the customs administration modernization project, which isled by the National Board of Revenue Reforms, the EDI system has been introduced inBangladesh as per the customs modernization plan.
(c) Article X
In Bangladesh, the customs authority charges a flat rate for supplying informationrelated to trade, which does not reflect the cost of services rendered.7 However, theGovernment makes all possible effort to ensure that the information is available to allstakeholders. Information is provided on rules, regulations and, sometimes, changes inthem. However, this information is frequently available only in Bengali. The amount ofduty is published on the Internet together with details of procedures, the entity accessingthe duty and time taken. The Chittagong port authority has initiated a one-stop service toreduce the time taken in documentation and the clearance of goods. Advance ruling andsubmission of data has yet to be introduced. Bangladesh has made extensive efforts toestablish appeal measures at the level of Commissioners (Appeals) and Customs Tribunal.
2. India
India has initiated several measures as part of the Trade Facilitation programme(Chaturvedi, 2006 and Subramaniam, 2005). While most of the measures have alreadybeen put in place in the context of Articles VIII and X, the remainder involve significantcosts and require careful planning before implementation. In the case of Article V, thereare major gaps. In India, the Central Board of Excise and Customs (CBEC), under the
7 Ibid.

89
Ministry of Finance, is the key agency for implementing various trade facilitation-relatedmeasures.
(a) Article V
The customs authorities of India require the declaration of all transit goods on thestandard declaration form that is available online as well as at the relevant offices. Thecustoms authorities are making an effort to enhance the level of coordination between thevarious border agencies. As varying degrees of security control are imposed at differentpoints in the country, there is limited use of a simplified transit declaration. Work has alsobeen started on simplifying procedures established for authorized consignors involved intransit procedures. No duty or tax is charged by India on transit goods. Cash deposits arenot required for goods in transit, and securities and guarantees are discharged as soon asthe necessary requirements have been met.
Transit of goods through India from or to adjacent countries is regulated in accordancewith the bilateral trade and transit treaties, and is subject to such restrictions as may bespecified by the Directorate-General of Foreign Trade in accordance with internationalconventions. In order to tackle abuse of the customs transit corridors, the Government ofIndia issues a list of sensitive commodities at periodic intervals, keeping domestic marketrequirements up as criteria. At present, nine such commodities are identified as sensitive.In the recent past, the Directorate of Revenue Intelligence seized several consignments ofsuch goods worth millions of rupees, which were being channelled towards domesticconsumption in India. This has become a major issue, especially with Nepal.
India has signed a formal treaty with Nepal on trade and transit. A treaty signedwith Bhutan in 1995 is only a trade treaty that has just been revised to accommodatetransit concerns. Efforts are also being made to sign a similar treaty with Afghanistan.8
(b) Article VIII
The customs duties that may be levied on imported goods (and export items incertain cases) are either specific or on an ad valorem basis, or at times specific-cum-advalorem. Regarding formalities connected with importing and exporting, over the years thenumber of documents and copies required has been reduced. Several initiatives havebeen implemented in the past year or so aimed at avoiding the duplicate collection ofinformation by the Customs Department. India does not require consularization of documents.An extensive institutional network has been established to ensure border agencycoordination. In November 2005, India introduced a system of publishing release andclearance data for different quarters in a particular year; currently, data are being releasedfour times per year. The Ministry of Commerce and Industry has made efforts to harmonizeHS codes for facilitating trade.
8 Hindustan Times, 2005.

90
(c) Article X
A website containing all information related to the customs rules and regulations,as published by the Government, has been launched by CBEC. However, in some cases,there is a time lag between publication on the website and its implementation. In addition,CBEC has introduced institutional mechanisms to ensure consultation at various customspoints. The authority for advance ruling was established in 2004 together with the Customs,Excise and Services Tax Appellate Tribunal (CESTAT). A risk management system (RMS)has been introduced at all customs points.
3. Nepal
Nepal introduced major processing reforms in 1985, leading to a wider liberalizationof the trade and investment regime. This also led to the introduction of the AutomatedSystem for Customs Data (ASYCUDA) in selected customs offices as part of a three-yearprogramme (2003-2006) (Rajkarnikar and others, 2006). Nepal is also making efforts toestablish Inland Clearance Depots at various points.
(a) Article V
Many features of this article are not applicable to Nepal, as it is a land-lockedcountry. However, several measures have been launched to facilitate Nepal as a transittrade destination. It has signed a trade transit treaty with India for easy access to Haldiaand other ports. A standardized customs transit declaration document has also beenintroduced, which is in operation with India. With bilateral and multilateral help, efforts arebeing made to improve the infrastructure and automation of LCS.
(b) Article VIII
In Nepal, no charges are levied on traders who seek information. All fee-relatedinformation is widely published by Nepal and is available on the official website of theCustoms Department. However, information related to changes in the regulations is notpublished online. Court judgments are also not available on the website, but are publishedby law journals.
(c) Article X
The Customs Department has launched a website containing details of laws,regulations, documentary requirement, standing operating practices and tariff classification.Details regarding valuation, duty and tax rates, and fees and charges are also available.However, not all the information is available in English. The information is also unavailableat embassies, consulates and trade missions. In addition, information regarding managementplans and rulings is unavailable (see annex to this chapter). Supreme Court decisions arepublished in the Nepal Law Journal. The Customs Department does not publish proposedchanges and related information. Extensive measures, including the establishment of helpdesks, call centres and trade counters, to help customers have been taken by Nepal. A
91
system for rulings and appeals is in place together with a system for monitoring andevaluation of practices.
4. Pakistan
In Pakistan, the Ministry of Commerce and the Central Board of Revenue launcheda National Trade and Transport Facilitation Project in 2001 (Qureshi, 2006) in order toimprove the country s commercial and industrial efficiency and competitiveness in tradefacilitation. The project was implemented in February 2002. The Central Board of Revenueoversees the reform process of the Pakistan Customs Department, as part of the CustomsAdministrative Reforms project. Since its inception, the Customs Administrative Reformsproject has carried out research and development on enhancing the efficiency of thedepartment through the Pakistan Customs Computerized System (PACCS) while the softwareapplications for the system have been developed by a consortium of three softwarecompanies, i.e., Microsoft, PWC Logistics and AOS.9 The key achievements and theproposed strategies for the relevant GATT Articles are being summarized (Qureshi, 2006).
(a) Article V
As per the National Trade and Transport Facilitation Project, the private sector isbeing engaged in improving the quicker clearance of goods in transit without anydiscrimination. A World Bank supported project is being explored for introducing riskassessment and PCA. The existing system outside PACCS requires owners of cargodestined for an upcountry Customs port to file a declaration to Customs at the port ofentry. This declaration, called a TP request, is processed by Customs and the cargo isthen allowed to move up country.
(b) Article VIII
The goods declaration form as a single administrative document for both exportand import is introduced by the Customs Collectorates under the guidance from CentralBoard of Revenue. Similarly, standardization of documents for port clearance of ships isbeing attempted through the FAL Convention of the International Maritime Organization.10
In this regard, training of manpower is also being carried out. Increased attention is beinggiven to automation under the framework of the United Nations Layout Key. Customsprocedures are being improved for faster clearance of goods.
In 2002, the Central Board of Revenue introduced customs administrative reformsthat set the stage for launching the fully automated PACCS.11 All declarations are processedby highly advanced and automated processing and risk management systems. All informationregarding receipt of requests, cargo clearance etc. is presented online to the trading
9 World Trade Organization, 2006.
10 Ibid.
11 http://www.paccs.gov.pk.

92
community. Should clarification regarding declarations be deemed necessary, informationassistance centres are established. PACCS treats the goods declaration (shipping bill) asa request for a rebate. Forms are not required to be presented to the Customs Department;instead, a Form-E number is entered as a part of the goods declaration. Bank creditadvice is not a prerequisite for sanctioning rebate claims.
(c) Article X
Increasingly, all rules and regulations are being provided on the Internet to allowwider access. Tracking through electronic seal and electronic application numbers is alsobeing implemented. PACCS will ensure paperless trade transactions with round-the-clockoperations and achieving single-window clearance is envisaged. The implementation ofa risk management system through PACCS is also planned.
5. Sri Lanka
In Sri Lanka, several measures addressing trade facilitation-related requirementshave been launched by the Department of Commerce, which comes under the Ministry ofTrade, Commerce, Consumer Affairs and Marketing Development. The prevailing SriLankan position on GATT Articles V, VIII and X is summarized below.12
(a) Article V
The Government of Sri Lanka has decided to support the rapid clearance of goodsin transit. In this context, a policy of non-discrimination against transit goods is in place,which also ensures simplified clearance procedures. Provisions have also been made forthe acceptance of guarantees against the clearance of goods in transit. On a selectivebasis, risk assessment is launched while pre-arrival clearance is extended only to couriercargo with additional measures for quicker clearance of perishable goods. A PCA schemehas also been introduced.
(b) Article VIII
Efforts are being made to ensure greater transparency and non-discrimination infees and charges, with provisions for online payments, and to reduce the duty bias prevalentbetween imports and exports. With the partial operation of single-window clearance, thedocumentation and declaration requirements have been made simple. With regard todeclarations, the United Nations Layout Key is being followed with a system that is fullyautomated. The role of customs handling agents (CHAs) and customs brokers is beingstreamlined, and it is now possible to collect shipments without the help of brokers. Inaddition, several other provisions such as pre-shipment inspection (PSI) and consulartransactions are being done away with together with licensing, now currently is requiredfor only a few items.
12 See Department of Commerce, 2006.
93
(c) Article X
The mammoth task of publishing trade regulations is being achieved with the helpof several stakeholders. A large proportion of this is being done through the Internet.Apart from rules and regulations, penalty provisions as published in the GovernmentGazette, customs appeals, judgments etc. are being made available. There is a move toeventually establish a single-window enquiry point. However, at this stage, different agenciesare maintaining their own enquiry points.
C. Trade facilitation in South Asian FTAs
In addition to their active participation in the multilateral trading system, SouthAsian countries have increasingly become engaged in preferential trade initiatives at thebilateral or/and regional level (table 6). This section provides a brief review of tradefacilitation in BIMSTEC, SAFTA as well as in key bilateral trade agreements, i.e., India-Sri Lanka, Sri Lanka-Pakistan and India-Singapore. An overview of the preferential tradeagreements reviewed as well as a comparison of trade facilitation measures and provisionsthey contain in the context of the WTO negotiations are provided in tables 7-9.
1. South Asian Free Trade Agreement
In the context of rapid economic growth in South Asia, the launch of SAFTA assumesadditional importance. South Asia s GDP growth is estimated to have reached 7.8 percent in 2005, which is much higher than the subregion s actual growth of 7.2 per cent in2004 (Asian Development Bank, 2006). Empirical studies have shown that despite fastereconomic growth in the member countries, the potential for regional growth has not beentapped fully (Mohanty, 2006).
The South Asia Free Trade Agreement basically replaced SAPTA, which was overwith the completion of three rounds.13 Actually, during 1995-2003, four SAPTA roundswere launched but only three were successful. SAFTA came into effect on 1 January2006, with the aim of reducing tariffs for intraregional trade among the seven SAARCmembers. Pakistan and India are to complete implementation by 2012, Sri Lanka by 2013and Bangladesh, Bhutan, Maldives and Nepal by 2015.
As summarized in tables 7-9, while SAFTA has some important provision for ensuringtrade facilitation in the region, it also misses out on many vital provisions. It calls forprompt publication of rules and regulations, and the identification of enquiry points forexchange of information on mandatory requirements. There are also provisions related toconsultation on rules of origin, with emphasis on the simplification of formalities connectedwith exporting and importing. The agreement also suggests paperless trading, electronicmeans of reporting and identification of low-risk and high-risk goods.
13 http://www.saarc-sec.org/data/summit12/saftaagreement.pdf.
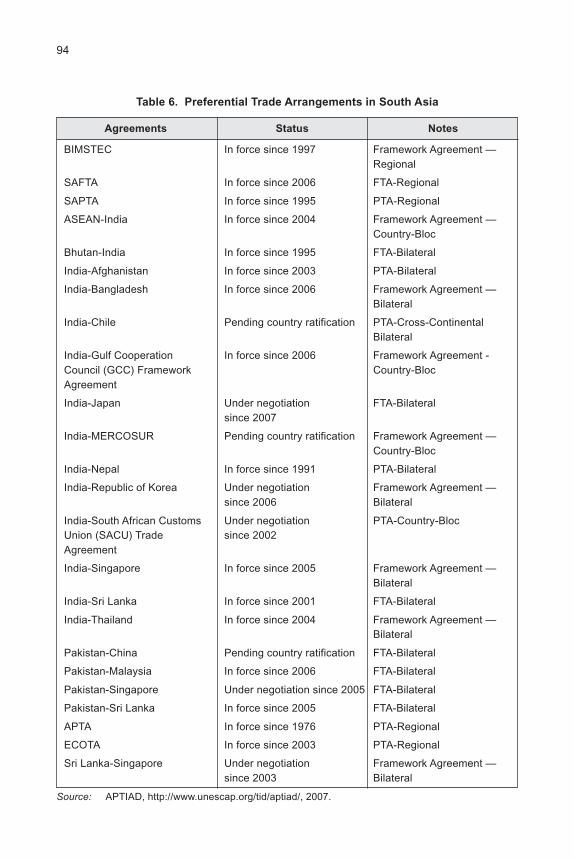
94
Table 6. Preferential Trade Arrangements in South Asia
Agreements Status Notes
BIMSTEC In force since 1997 Framework Agreement —Regional
SAFTA In force since 2006 FTA-Regional
SAPTA In force since 1995 PTA-Regional
ASEAN-India In force since 2004 Framework Agreement —Country-Bloc
Bhutan-India In force since 1995 FTA-Bilateral
India-Afghanistan In force since 2003 PTA-Bilateral
India-Bangladesh In force since 2006 Framework Agreement —Bilateral
India-Chile Pending country ratification PTA-Cross-ContinentalBilateral
India-Gulf Cooperation In force since 2006 Framework Agreement -Council (GCC) Framework Country-BlocAgreement
India-Japan Under negotiation FTA-Bilateralsince 2007
India-MERCOSUR Pending country ratification Framework Agreement —Country-Bloc
India-Nepal In force since 1991 PTA-Bilateral
India-Republic of Korea Under negotiation Framework Agreement —since 2006 Bilateral
India-South African Customs Under negotiation PTA-Country-BlocUnion (SACU) Trade since 2002Agreement
India-Singapore In force since 2005 Framework Agreement —Bilateral
India-Sri Lanka In force since 2001 FTA-Bilateral
India-Thailand In force since 2004 Framework Agreement —Bilateral
Pakistan-China Pending country ratification FTA-Bilateral
Pakistan-Malaysia In force since 2006 FTA-Bilateral
Pakistan-Singapore Under negotiation since 2005 FTA-Bilateral
Pakistan-Sri Lanka In force since 2005 FTA-Bilateral
APTA In force since 1976 PTA-Regional
ECOTA In force since 2003 PTA-Regional
Sri Lanka-Singapore Under negotiation Framework Agreement —since 2003 Bilateral
Source: APTIAD, http://www.unescap.org/tid/aptiad/, 2007.

95Ta
ble
7.
Ov
erv
iew
of
se
lec
ted
So
uth
As
ian
FTA
s
SA
FTA
BIM
ST
EC
Ind
ia-S
ri L
an
ka
Pa
kis
tan
-Sri
La
nk
aIn
dia
-Sin
ga
po
re
Me
mb
ers
Ban
glad
esh,
Bhu
tan,
Ban
glad
esh,
Bhu
tan,
Indi
a an
d S
ri La
nka.
Pak
ista
n an
dIn
dia
and
Sin
gapo
re.
Indi
a, M
aldi
ves,
Indi
a, M
yanm
ar,
Sri
Lank
a.
Nep
al, P
akis
tan,
Nep
al, S
ri La
nka,
Sri
Lank
a.T
haila
nd.
Ye
ar
of
sig
nin
g,
2004
, (1
Janu
ary)
200
6.8
Feb
ruar
y 20
04 w
hile
28 D
ecem
ber
1998
;20
02, 1
2 Ju
ne 2
005.
29 J
une
2005
.
en
try
in
to f
orc
eB
efor
e th
is, f
our
Ban
glad
esh
join
ed in
ente
red
into
forc
e on
roun
ds o
f SA
PTA
wer
eJu
ne 2
004.
1 M
arch
200
0.co
mpl
eted
sin
ce 1
995.
Ty
pe
of
ag
ree
me
nt
FTA
FTA
FTA
FTA
CE
CA
Inte
gra
tio
nC
urre
ntly
, tar
iffTo
str
engt
hen
and
Pro
vide
s du
ty-f
ree
Aim
ed a
t exp
andi
ng th
eLi
bera
l ize
trad
e in
goo
ds
redu
ctio
ns.
Long
-ter
men
hanc
e ec
onom
ic,
conc
essi
ons
for
a w
ide
scop
e of
the
curr
ent F
TAas
per
Art
icle
XX
IV o
f
goal
: fr
ee tr
ade
area
trad
e an
d in
vest
men
tra
nge
of p
rodu
cts
unde
ran
d is
mov
ing
tow
ards
the
GA
TT
and
inby
201
6. E
arly
har
vest
coop
erat
ion
amon
g th
eth
e ag
reem
ent;
gran
tsa
com
preh
ensi
vese
rvic
es a
s pe
r
prog
ram
me:
non
-LD
Cs
mem
bers
; pro
gres
sive
lym
argi
n of
pre
fere
nces
econ
omic
par
tner
ship
Art
icle
V; e
stab
lish
(Ind
ia, P
akis
tan,
liber
aliz
e an
d pr
omot
eon
the
appl
ied
rate
of
agre
emen
t cov
erin
ga
tran
spar
ent,
Sri
Lank
a) p
hase
out
trad
e in
goo
ds a
ndge
nera
l (M
FN
) ta
riffs
for
trad
e in
ser
vice
s an
dpr
edic
tabl
e an
d
tarif
fs fo
r le
ast
serv
ices
, cre
ate
sele
cted
pro
duct
line
s.in
vest
men
t coo
pera
tion.
faci
litat
ive
inve
stm
ent
deve
lope
d st
ates
by
a tr
ansp
aren
t, lib
eral
regi
me;
bui
ld u
pon
thei
r20
09 w
hile
the
LDC
san
d fa
cilit
ativ
eco
mm
itmen
ts a
t WT
O
will
hav
e un
til 2
016
toin
vest
men
t reg
ime;
and
for
Indo
-AS
EA
N
rem
ove
the
expl
ore
new
are
as a
ndlin
kage
s.im
pedi
men
ts.
deve
lop
appr
opria
te
mea
sure
s fo
r cl
oser
coop
erat
ion
amon
g th
em
embe
rs; f
acili
tate

96Ta
ble
7.
(co
nti
nu
ed)
SA
FTA
BIM
ST
EC
Ind
ia-S
ri L
an
ka
Pa
kis
tan
-Sri
La
nk
aIn
dia
-Sin
ga
po
re
mor
e ef
fect
ive
econ
omic
inte
grat
ion
of th
e LD
Cs
in th
e re
gion
; and
brid
ge
the
deve
lopm
ent g
apbe
twee
n th
e m
embe
rs.
Le
ga
l b
as
e f
or
SA
FTA
agr
eem
ent,
As
per A
rtic
le 2
4,R
elev
ant p
rovi
sion
s of
As
per A
rtic
le 2
4,A
s pe
r Art
icle
24,
ec
on
om
icS
MC
agr
eem
ents
.G
AT
T 1
994.
GA
TT
199
4.G
AT
T 1
994.
GA
TT
199
4.
inte
gra
tio
n a
nd
tra
de
fa
cil
ita
tio
n
me
as
ure
s
Str
uc
ture
SM
C, c
ompr
isin
g th
eB
IMS
TE
C T
rade
Gov
ernm
ent o
f Ind
iaP
akis
tan-
SL
Indi
a an
d S
inga
pore
.
Min
iste
rs o
f Com
mer
ce/
Neg
otia
ting
Com
mitt
eean
d G
over
nmen
t of
Fra
mew
ork
Agr
eem
ent.
Trad
e; C
OE
on
the
to e
stab
l ish
the
Sri
Lank
a.
leve
l of s
enio
r ec
onom
icpr
ogra
mm
e of
offic
ials
; SA
AR
Cne
gotia
tions
.S
ecre
taria
t as
secr
etar
ial s
uppo
rt to
SM
C a
nd C
OE
.
En
forc
em
en
tA
mic
able
dis
pute
App
ropr
iate
form
alM
utua
lly a
gree
dT
he D
epar
tmen
t of
To d
evel
op a
dequ
ate
settl
emen
t by
bila
tera
ldi
sput
e se
ttlem
ent
inst
itutio
nal
Com
mer
ce o
f the
mec
hani
sms
to a
ddre
ss
cons
ulta
tions
, CO
Epr
oced
ures
to b
ear
rang
emen
ts fo
rM
inis
try
of T
rade
,en
forc
emen
t-re
late
d
acts
as
Dis
pute
esta
blis
hed
by th
eef
fect
ive
and
smoo
thC
omm
erce
and
issu
es.
Set
tlem
ent B
ody,
and
mem
bers
.im
plem
enta
tion
of th
eC
onsu
mer
Affa
irs is
appe
al a
gain
st C
OE
agre
emen
t.th
e au
thor
ity
reco
mm
enda
tions
tore
spon
sibl
e fo
r al
l

97Ta
ble
7.
(co
nti
nu
ed)
SA
FTA
BIM
ST
EC
Ind
ia-S
ri L
an
ka
Pa
kis
tan
-Sri
La
nk
aIn
dia
-Sin
ga
po
re
SM
C (
SM
Cm
atte
rs r
elat
ed to
the
reco
mm
enda
tion
impl
emen
tatio
n of
the
enfo
rcea
ble
by [l
imite
d]ag
reem
ent,
incl
udin
g
with
draw
al o
fth
e is
suan
ce o
fco
nces
sion
s).
Cer
tific
ates
of O
rigin
for
prod
ucts
exp
orte
d
unde
r th
e ag
reem
ent.
Ta
riff
re
du
cti
on
Tarif
f sch
edul
es, u
seF
ast t
rack
and
nor
mal
Tarif
f red
uctio
n is
The
Neg
ativ
e Li
st o
fA
s pe
r In
dia
s l is
ts
of S
ensi
tive
List
str
ack
are
iden
tifie
d fo
rdi
scus
sed
in e
ight
Pak
ista
n co
mpr
ises
iden
tifie
d in
CE
CA
,(e
xem
ptio
n fr
om ta
riff
deve
lopi
ng c
ount
ries
Ann
exes
to th
e54
0 H
S ta
riff l
ines
a l is
t of p
rodu
cts
unde
r
sche
dule
s).
and
LDC
mem
bers
for
Agr
eem
ent (
Ann
ex A
,(p
rodu
cts)
at t
heth
e ea
rly h
arve
st
redu
ctio
n of
tarif
fs.
B, C
, D-1
, D-2
, E,
six-
digi
t lev
el.
prog
ram
me
has
been
F-1
and
F-2
).B
eing
on
the
Neg
ativ
ein
pla
ce s
ince
List
, the
se p
rodu
cts
are
1 A
ugus
t 200
5.no
t ent
itled
to a
ny ta
riff
The
re a
re li
sts
of
conc
essi
ons
whe
npr
oduc
ts fo
r w
hich
impo
rted
from
Sri
Lank
a.ph
ased
elim
inat
ion
inT
he Im
med
iate
dutie
s is
pla
nned
by
Con
cess
ion
List
1 A
pril
2009
; a fe
w
cont
ains
206
HS
tarif
fot
her
good
s on
lines
(pr
oduc
ts)
at th
eco
nces
sion
al d
utie
s
six-
digi
t lev
el.
Sri
Lank
aw
ith th
e m
argi
n of
will
rec
eive
100
per
pref
eren
ce o
ffere
d by
cent
dut
y-fr
ee a
cces
sIn
dia
are
give
n in
the
for
thes
e pr
oduc
ts in
list.
The
re is
ano
ther
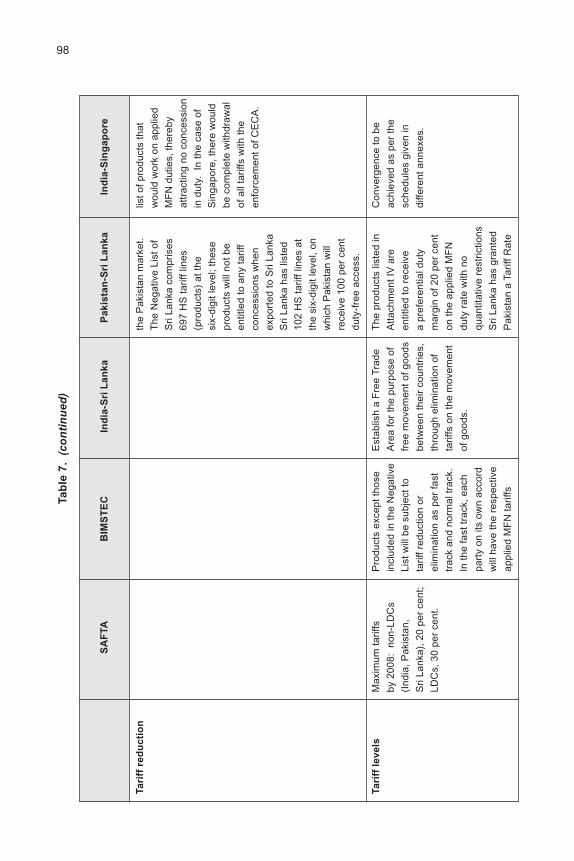
98Ta
ble
7.
(co
nti
nu
ed)
SA
FTA
BIM
ST
EC
Ind
ia-S
ri L
an
ka
Pa
kis
tan
-Sri
La
nk
aIn
dia
-Sin
ga
po
re
Ta
riff
re
du
cti
on
the
Pak
ista
n m
arke
t.lis
t of p
rodu
cts
that
The
Neg
ativ
e Li
st o
fw
ould
wor
k on
app
lied
Sri
Lank
a co
mpr
ises
MF
N d
utie
s, th
ereb
y69
7 H
S ta
riff l
ines
attr
actin
g no
con
cess
ion
(pro
duct
s) a
t the
in d
uty.
In
the
case
of
six-
digi
t lev
el; t
hese
Sin
gapo
re, t
here
wou
ldpr
oduc
ts w
il l n
ot b
ebe
com
plet
e w
ithdr
awal
entit
led
to a
ny ta
riff
of a
l l ta
riffs
with
the
conc
essi
ons
whe
nen
forc
emen
t of C
EC
A.
expo
rted
to S
ri La
nka
Sri
Lank
a ha
s l is
ted
102
HS
tarif
f lin
es a
tth
e si
x-di
git l
evel
, on
whi
ch P
akis
tan
wil l
rece
ive
100
per
cent
duty
-fre
e ac
cess
.
Ta
riff
le
ve
lsM
axim
um ta
riffs
Pro
duct
s ex
cept
thos
eE
stab
lish
a F
ree
Trad
eT
he p
rodu
cts
liste
d in
Con
verg
ence
to b
e
by 2
008:
non
-LD
Cs
incl
uded
in th
e N
egat
ive
Are
a fo
r th
e pu
rpos
e of
Atta
chm
ent I
V a
reac
hiev
ed a
s pe
r th
e(I
ndia
, Pak
ista
n,Li
st w
ill b
e su
bjec
t to
free
mov
emen
t of g
oods
entit
led
to r
ecei
vesc
hedu
les
give
n in
Sri
Lank
a), 2
0 pe
r ce
nt;
tarif
f red
uctio
n or
betw
een
thei
r co
untr
ies,
a pr
efer
entia
l dut
ydi
ffere
nt a
nnex
es.
LDC
s, 3
0 pe
r ce
nt.
elim
inat
ion
as p
er fa
stth
roug
h el
imin
atio
n of
mar
gin
of 2
0 pe
r ce
nttr
ack
and
norm
al tr
ack.
tarif
fs o
n th
e m
ovem
ent
on th
e ap
plie
d M
FN
In th
e fa
st tr
ack,
eac
hof
goo
ds.
duty
rat
e w
ith n
o
part
y on
its
own
acco
rdqu
antit
ativ
e re
stric
tions
will
hav
e th
e re
spec
tive
Sri
Lank
a ha
s gr
ante
d
appl
ied
MF
N ta
riffs
Pak
ista
n a
Tarif
f Rat
e

99Ta
ble
7.
(co
nti
nu
ed)
SA
FTA
BIM
ST
EC
Ind
ia-S
ri L
an
ka
Pa
kis
tan
-Sri
La
nk
aIn
dia
-Sin
ga
po
re
rate
s gr
adua
lly r
educ
ed.
Quo
ta fo
r 6,
000
mt o
f
In th
e no
rmal
trac
k,B
asm
ati r
ice
and
each
par
ty w
il l r
educ
e1,
000
mt o
f pot
atoe
sth
e ta
riff r
ates
inpe
r ca
lend
ar y
ear
acco
rdan
ce w
ith(J
anua
ry-D
ecem
ber)
mut
ually
agr
eed
rate
s.on
a d
uty-
free
bas
is.
How
ever
, im
port
s of
pota
toes
are
per
mitt
ed
only
dur
ing
Sri
Lank
as
off-
seas
on.
(Tw
o th
irds
to b
e im
port
ed d
urin
g
June
-Jul
y an
d on
e th
irddu
ring
Oct
ober
-
Nov
embe
r ea
ch y
ear)
.

100Ta
ble
8.
Pro
vis
ion
s r
ela
ted
to
pu
bli
ca
tio
n a
nd
av
ail
ab
ilit
y o
f in
form
ati
on
in
So
uth
As
ian
FTA
s
Tra
de
fa
cil
ita
tio
n
Ma
in a
rea
sm
ea
su
res
or
co
ve
red
gro
up
s o
f tr
ad
eS
AF
TA
BIM
ST
EC
Ind
ia-S
ri L
an
ka
Pa
kis
tan
-Sri
La
nk
aIn
dia
-Sin
ga
po
re
fac
ilit
ati
on
me
as
ure
s
Pub
licat
ion
and
Pub
licat
ion
of tr
ade
-In
corp
orat
ion
ofP
ropo
ses
mea
sure
sn.
a.n.
a.P
rom
pt p
ublic
atio
n
avai
labi
l i ty
ofre
gula
tions
.G
AT
T A
rtic
le X
for
faci
l i tat
ing
trad
eof
law
s an
d
info
rmat
ion.
-P
rom
ptbu
t mak
es n
ore
gula
tions
.pu
blic
atio
n of
expl
icit
men
tion
of
law
s an
dm
easu
res.
regu
latio
ns.
Inte
rnet
pub
licat
ion.
n.a.
n.a.
n.a.
n.a.
Tra
nsfe
r of
trad
e
rela
ted
info
rmat
ion
in e
lect
roni
c fo
rmat
only
. Pro
pose
s
pape
rless
trad
ing.
Not
ifica
tion
of tr
ade
Not
ifica
tion
of a
nyn.
a.n.
a.n.
a.n.
a.re
gula
tion.
chan
ges
to
man
dato
ry
requ
irem
ents
.E
stab
lishm
ent o
fC
onta
ct p
oint
s to
n.a.
n.a.
n.a.
No
prov
isio
n.
enqu
iry p
oint
s/ex
chan
ge
Sin
gle
Nat
iona
lin
form
atio
n on
Foc
al P
oint
sm
anda
tory
(SN
FP
).re
quire
men
ts.
Oth
er m
easu
res
toR
eque
st fo
ren
hanc
e av
aila
bilit
yco
nsul
tatio
n.n.
a.n.
a.n.
a.S
peci
fical
ly
and
exch
ange
of
sugg
ests
that
CE
CA
info
rmat
ion.
do n
ot r
equi
re a
ny
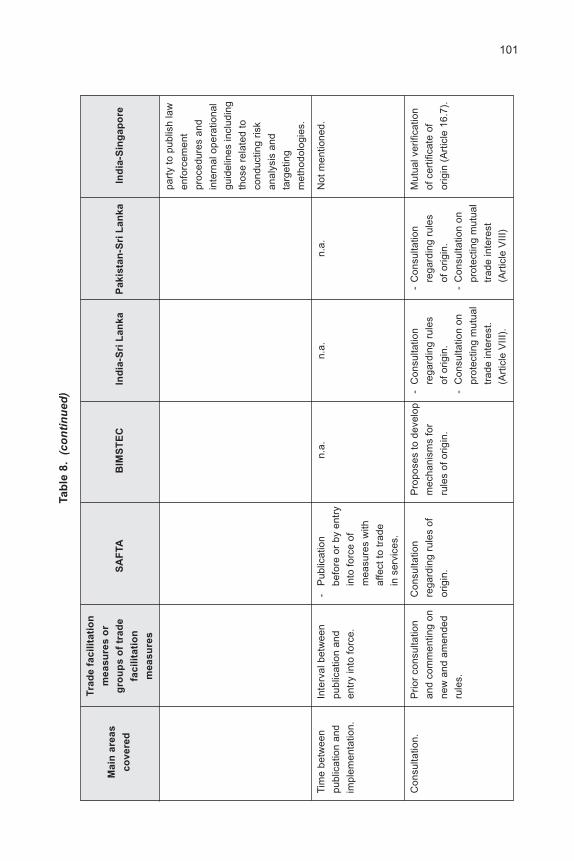
101Ta
ble
8.
(co
nti
nu
ed)
Tra
de
fa
cil
ita
tio
n
Ma
in a
rea
sm
ea
su
res
or
co
ve
red
gro
up
s o
f tr
ad
eS
AF
TA
BIM
ST
EC
Ind
ia-S
ri L
an
ka
Pa
kis
tan
-Sri
La
nk
aIn
dia
-Sin
ga
po
re
fac
ilit
ati
on
me
as
ure
s
part
y to
pub
lish
law
enfo
rcem
ent
proc
edur
es a
nd
inte
rnal
ope
ratio
nal
guid
elin
es in
clud
ing
thos
e re
late
d to
cond
uctin
g ris
k
anal
ysis
and
targ
etin
g
met
hodo
logi
es.
Tim
e be
twee
nIn
terv
al b
etw
een
-P
ublic
atio
nn.
a.n.
a.n.
a.N
ot m
entio
ned.
publ
icat
ion
and
publ
icat
ion
and
befo
re o
r by
ent
ryim
plem
enta
tion.
entr
y in
to fo
rce.
into
forc
e of
mea
sure
s w
ith
affe
ct to
trad
ein
ser
vice
s.
Con
sulta
tion.
Prio
r co
nsul
tatio
nC
onsu
ltatio
nP
ropo
ses
to d
evel
op-
Con
sulta
tion
-C
onsu
ltatio
nM
utua
l ver
ifica
tion
and
com
men
ting
onre
gard
ing
rule
s of
mec
hani
sms
for
rega
rdin
g ru
les
rega
rdin
g ru
les
of c
ertif
icat
e of
new
and
am
ende
dor
igin
.ru
les
of o
rigin
.of
orig
in.
of o
rigin
.or
igin
(A
rtic
le 1
6.7)
.ru
les.
-C
onsu
ltatio
n on
-C
onsu
ltatio
n on
prot
ectin
g m
utua
lpr
otec
ting
mut
ual
trad
e in
tere
st.
trad
e in
tere
st(A
rtic
le V
III).
(Art
icle
VIII
)

102
Ta
ble
8.
(co
nti
nu
ed)
Tra
de
fa
cil
ita
tio
n
Ma
in a
rea
sm
ea
su
res
or
co
ve
red
gro
up
s o
f tr
ad
eS
AF
TA
BIM
ST
EC
Ind
ia-S
ri L
an
ka
Pa
kis
tan
-Sri
La
nk
aIn
dia
-Sin
ga
po
re
fac
ilit
ati
on
me
as
ure
s
Adv
ance
rul
ings
.P
rovi
sion
of
n.a.
n.a.
n.a.
n.a.
Issu
ance
of w
ritte
nad
vanc
e ru
l ings
.ad
vanc
e ru
l ings
prio
r to
the
impo
rtat
ion
of g
oods
with
due
exi
t cla
use.
App
eal
Rig
ht o
f app
eal.
Rig
ht o
f app
eal f
orn.
a.Tw
o pa
rtie
s to
Join
t com
mitt
ee to
n.a.
proc
edur
es.
mat
ters
rel
atin
g to
esta
blis
h A
rbitr
albe
est
abl is
hed.
elig
ibi l i
ty fo
rT
ribun
al fo
r bi
ndin
gpr
efer
entia
l tar
iffde
cisi
on.
trea
tmen
t.
Rel
ease
of g
oods
inn.
a.n.
a.n.
a.n.
a.n.
a.th
e ev
ent o
f app
eal
App
eal m
echa
nism
.n.
a.n.
a.n.
a.n.
a.n.
a.
Oth
er m
easu
res
Uni
form
n.a.
n.a.
n.a.
n.a.
n.a.
to e
nhan
cead
min
istr
atio
n of
impa
rtia
lity,
trad
e re
gula
tions
.
non-
disc
rimin
atio
n
and
tran
spar
ency
.M
aint
enan
ce/
n.a.
n.a.
n.a.
n.a.
Sha
ring
of b
est
rein
forc
emen
t of
prac
tices
for
inte
grity
and
eth
ical
enha
ncin
g ea
chco
nduc
t am
ong
othe
r ca
paci
ties.
offic
ials
.

103Ta
ble
9.
Pro
vis
ion
s r
ela
ted
to
im
po
rts
an
d e
xp
ort
s f
ee
s,
form
ali
tie
s a
nd
pro
ce
du
res
in
So
uth
As
ian
FTA
s
Tra
de
fa
cil
ita
tio
n
Ma
in a
rea
sm
ea
su
res
or
co
ve
red
gro
up
s o
f tr
ad
eS
AF
TA
BIM
ST
EC
Ind
ia-S
ri L
an
ka
Pa
kis
tan
-Sri
La
nk
aIn
dia
-Sin
ga
po
re
fac
ilit
ati
on
me
as
ure
s
Fee
s an
d ch
arge
sG
ener
al d
isci
plin
eLi
mita
tion
ton.
a.n.
a.n.
a.S
houl
d co
ver
conn
ecte
d w
ithon
fees
and
appr
oxim
ate
cost
appr
oxim
ate
cost
impo
rtin
g an
dch
arge
s.of
ser
vice
sof
ser
vice
sex
port
ing.
rend
ered
.re
nder
ed.
Red
uctio
n in
n.a.
n.a.
n.a.
n.a.
No
men
tion,
but
num
ber
and
sugg
ests
dive
rsity
of f
ees
coun
terv
ail in
g an
dan
d ch
arge
s.an
tidum
ping
dut
ies
be c
onsi
sten
t with
WT
O.
Pub
licat
ion/
Pub
licat
ion
of a
l ln.
a.n.
a.n.
a.P
ublic
atio
n of
al l
notif
icat
ion
of fe
estr
ade
rela
ted
rule
s.pr
ovis
ions
.an
d ch
arge
s.P
rohi
bitio
n of
n.a.
n.a.
n.a.
n.a.
n.a.
colle
ctio
n of
unpu
blis
hed
fees
and
char
ges.
Per
iodi
c re
view
of
Per
iodi
c re
view
of
n.a.
n.a.
n.a.
n.a.
fees
and
cha
rges
.cu
stom
spr
oced
ures
.O
ther
mea
sure
s.-
No
indi
rect
n.a.
n.a.
n.a.
Ele
ctro
nic
prot
ectio
n by
or
tran
smis
sion
and
fisca
l pur
pose
sdi
gita
l pro
duct
s to
of fe
es a
ndbe
exe
mpt
ed.
char
ges.
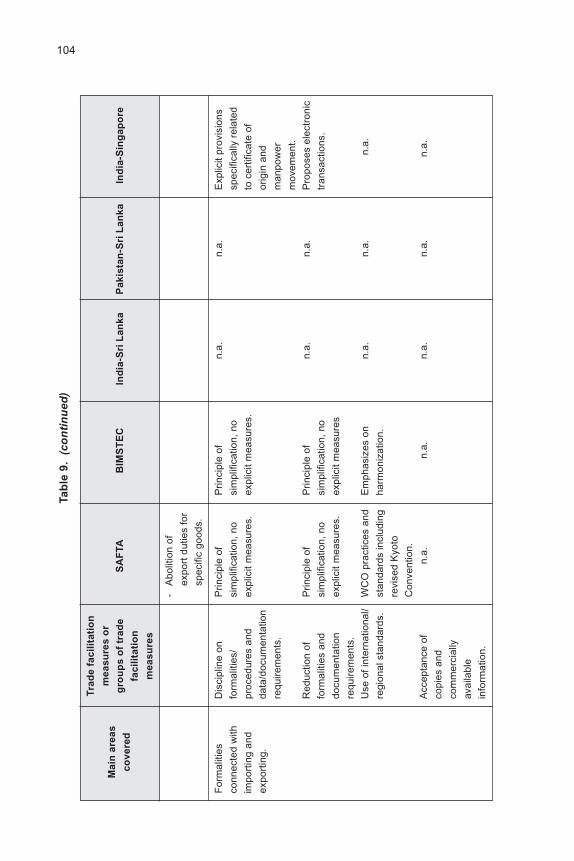
104Ta
ble
9.
(co
nti
nu
ed)
Tra
de
fa
cil
ita
tio
n
Ma
in a
rea
sm
ea
su
res
or
co
ve
red
gro
up
s o
f tr
ad
eS
AF
TA
BIM
ST
EC
Ind
ia-S
ri L
an
ka
Pa
kis
tan
-Sri
La
nk
aIn
dia
-Sin
ga
po
re
fac
ilit
ati
on
me
as
ure
s
-A
bolit
ion
of
expo
rt d
utie
s fo
rsp
ecifi
c go
ods.
For
mal
ities
Dis
cipl
ine
onP
rinci
ple
ofP
rinci
ple
ofn.
a.n.
a.E
xpl ic
it pr
ovis
ions
conn
ecte
d w
ithfo
rmal
ities
/si
mpl
ifica
tion,
no
sim
plifi
catio
n, n
osp
ecifi
cal ly
rel
ated
impo
rtin
g an
dpr
oced
ures
and
expl
icit
mea
sure
s.ex
plic
it m
easu
res.
to c
ertif
icat
e of
expo
rtin
g.da
ta/d
ocum
enta
tion
orig
in a
nd
requ
irem
ents
.m
anpo
wer
mov
emen
t.R
educ
tion
ofP
rinci
ple
ofP
rinci
ple
ofn.
a.n.
a.P
ropo
ses
elec
tron
ic
form
aliti
es a
ndsi
mpl
ifica
tion,
no
sim
plifi
catio
n, n
otr
ansa
ctio
ns.
docu
men
tatio
nex
plic
it m
easu
res.
expl
icit
mea
sure
sre
quire
men
ts.
Use
of i
nter
natio
nal/
WC
O p
ract
ices
and
Em
phas
izes
on
n.a.
n.a.
n.a.
regi
onal
sta
ndar
ds.
stan
dard
s in
clud
ing
harm
oniz
atio
n.re
vise
d K
yoto
Con
vent
ion.
Acc
epta
nce
ofn.
a.n.
a.n.
a.n.
a.n.
a.co
pies
and
com
mer
cial
ly
avai
labl
ein
form
atio
n.

105Ta
ble
9.
(co
nti
nu
ed)
Tra
de
fa
cil
ita
tio
n
Ma
in a
rea
sm
ea
su
res
or
co
ve
red
gro
up
s o
f tr
ad
eS
AF
TA
BIM
ST
EC
Ind
ia-S
ri L
an
ka
Pa
kis
tan
-Sri
La
nk
aIn
dia
-Sin
ga
po
re
fac
ilit
ati
on
me
as
ure
s
Aut
omat
ion.
-U
se o
f pap
erle
sstr
adin
g, ta
king
into
acc
ount
met
hodo
logi
esag
reed
in A
PE
C
and
WC
O.
-E
lect
roni
c m
eans
Pro
pose
s fa
ster
n.a.
n.a.
Ful
ly e
lect
roni
cfo
r al
l rep
ortin
gau
tom
atio
n.tr
ade
tran
sact
ions
.
requ
irem
ents
.
Sin
gle
win
dow
n.a.
n.a.
n.a.
n.a.
No
(Sin
gapo
re h
as(o
ne-t
ime
sing
le-w
indo
w
subm
issi
on).
faci
l i tie
s).
Oth
er m
easu
res.
n.a.
n.a.
n.a.
n.a.
n.a.
Con
sula
rizat
ion
Pro
hibi
tion
ofn.
a.n.
a.n.
a.n.
a.n.
a.co
nsul
ar tr
ansa
ctio
n
requ
irem
ents
.
Bor
der
agen
cyC
oord
inat
ion
ofn.
a.n.
a.n.
a.n.
a.n.
a.
coop
erat
ion.
bord
er a
ctiv
ities
.
Rel
ease
and
Pre
-arr
ival
n.a.
n.a.
n.a.
n.a.
No
prov
isio
n bu
t
clea
ranc
e of
clea
ranc
e.re
flect
s on
the
need
good
s.in
the
first
para
grap
h.
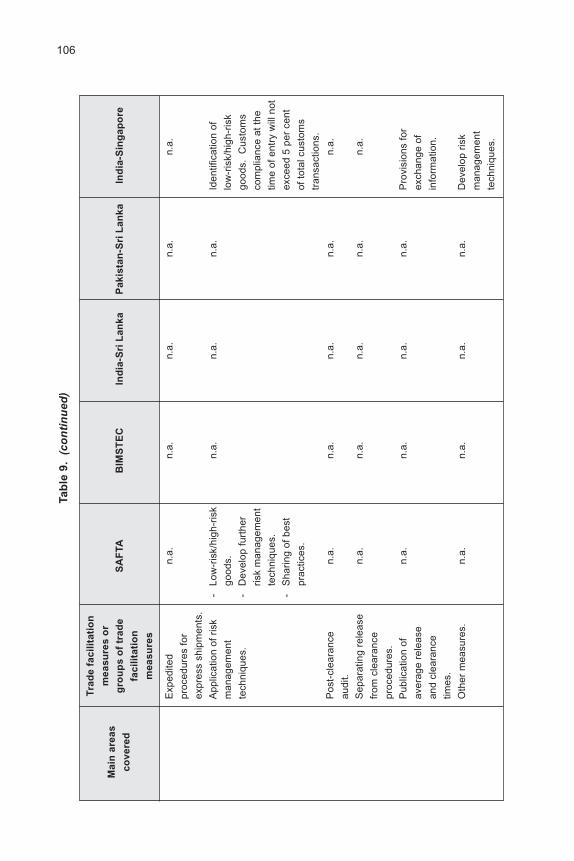
106Ta
ble
9.
(co
nti
nu
ed)
Tra
de
fa
cil
ita
tio
n
Ma
in a
rea
sm
ea
su
res
or
co
ve
red
gro
up
s o
f tr
ad
eS
AF
TA
BIM
ST
EC
Ind
ia-S
ri L
an
ka
Pa
kis
tan
-Sri
La
nk
aIn
dia
-Sin
ga
po
re
fac
ilit
ati
on
me
as
ure
s
Exp
edite
dn.
a.n.
a.n.
a.n.
a.n.
a.pr
oced
ures
for
expr
ess
ship
men
ts.
App
licat
ion
of r
isk
-Lo
w-r
isk/
high
-ris
kn.
a.n.
a.n.
a.Id
entif
icat
ion
ofm
anag
emen
tgo
ods.
low
-ris
k/hi
gh-r
isk
tech
niqu
es.
-D
evel
op fu
rthe
rgo
ods.
Cus
tom
s
risk
man
agem
ent
com
plia
nce
at th
ete
chni
ques
.tim
e of
ent
ry w
il l n
ot
-S
harin
g of
bes
tex
ceed
5 p
er c
ent
prac
tices
.of
tota
l cus
tom
str
ansa
ctio
ns.
Pos
t-cl
eara
nce
n.a.
n.a.
n.a.
n.a.
n.a.
audi
t.S
epar
atin
g re
leas
en.
a.n.
a.n.
a.n.
a.n.
a.
from
cle
aran
ce
proc
edur
es.
Pub
licat
ion
ofn.
a.n.
a.n.
a.n.
a.P
rovi
sion
s fo
r
aver
age
rele
ase
exch
ange
of
and
clea
ranc
ein
form
atio
n.tim
es.
Oth
er m
easu
res.
n.a.
n.a.
n.a.
n.a.
Dev
elop
ris
k
man
agem
ent
tech
niqu
es.

107Ta
ble
9.
(co
nti
nu
ed)
Tra
de
fa
cil
ita
tio
n
Ma
in a
rea
sm
ea
su
res
or
co
ve
red
gro
up
s o
f tr
ad
eS
AF
TA
BIM
ST
EC
Ind
ia-S
ri L
an
ka
Pa
kis
tan
-Sri
La
nk
aIn
dia
-Sin
ga
po
re
fac
ilit
ati
on
me
as
ure
s
Tarif
fs a
nd ta
riff
Sch
edul
es.
El im
inat
ion
ofn.
a.n.
a.
clas
sific
atio
n.ta
riffs
/cus
tom
sdu
ties.
Obj
ectiv
e cr
iteria
for
App
licat
ion
of H
Sn.
a.n.
a.H
S C
onve
ntio
n.
tarif
f cla
ssifi
catio
n.C
onve
ntio
n.O
ther
mea
sure
s.N
o ex
port
dut
ies
onn.
a.n.
a.
cert
ain
good
s.
Mat
ters
rel
ated
toN
on-d
iscr
imin
atio
n.n.
a.n.
a.n.
a.N
o di
scrim
inat
ion
good
s in
tran
sit.
agai
nst t
rans
itgo
ods.
Dis
cipl
ine
on fe
esn.
a.n.
a.n.
a.N
o ad
ditio
nal f
ees
and
char
ges.
char
ged.
Dis
cipl
ine
on tr
ansi
tn.
a.n.
a.n.
a.N
o ad
ditio
nal
form
aliti
es a
nddo
cum
enta
tion
docu
men
tatio
nre
quire
d.re
quire
men
ts.
(Art
icle
3.1
4).
Coo
rdin
atio
n an
dP
rovi
sion
sn.
a.n.
a.M
echa
nism
in
coop
erat
ion.
rega
rdin
gpl
ace.
cons
ignm
ent.
Exc
hang
e an
dM
echa
nism
for
the
Exc
hang
e of
n.a.
n.a.
- E
lect
roni
c
hand
ling
ofex
chan
ge a
ndin
form
atio
nex
chan
ge o
f
info
rmat
ion.
hand
ling
ofbe
twee
n cu
stom
sin
form
atio
nin
form
atio
n.ad
min
istr
atio
ns to
-C
onfid
entia
lity

108Ta
ble
9.
(co
nti
nu
ed)
Tra
de
fa
cil
ita
tio
n
Ma
in a
rea
sm
ea
su
res
or
co
ve
red
gro
up
s o
f tr
ad
eS
AF
TA
BIM
ST
EC
Ind
ia-S
ri L
an
ka
Pa
kis
tan
-Sri
La
nk
aIn
dia
-Sin
ga
po
re
fac
ilit
ati
on
me
as
ure
s
assi
st in
of in
form
atio
n if
it
inve
stig
atio
n an
dad
vers
ely
affe
cts
prev
entio
n of
busi
ness
cust
oms
law
inte
rest
s.
infr
inge
men
ts.
Cus
tom
sU
se o
f int
erna
tiona
lC
usto
ms
valu
eB
road
sta
tem
ent t
on.
a.n.
a.A
rtic
le V
II of
GA
TT
valu
atio
n.st
anda
rds.
dete
rmin
edim
prov
e co
oper
atio
nto
form
the
basi
s.
acco
rdin
g to
GA
TT
in th
is a
rea.
Art
. VII
and
WT
OC
usto
ms
Val
uatio
n
Agr
eem
ent.
Har
mon
izat
ion/
Har
mon
izat
ion
of-
Har
mon
izat
ion
ofH
arm
oniz
edn.
a.n.
a.W
ork
tow
ards
stan
dard
izat
ion.
tech
nica
l sta
ndar
ds.
man
dato
ryre
quire
men
ts fo
rha
rmon
izat
ion
ofre
quire
men
tsce
rtifi
cate
s of
resp
ectiv
e
taki
ng in
toor
igin
.m
anda
tory
acco
unt
requ
irem
ents
.in
tern
atio
nal
(Art
icle
5.3
).
stan
dard
s an
d
guid
elin
es-
Har
mon
ised
requ
irem
ents
for
cert
ifica
tes
ofor
igin
.

109Ta
ble
9.
(co
nti
nu
ed)
Tra
de
fa
cil
ita
tio
n
Ma
in a
rea
sm
ea
su
res
or
co
ve
red
gro
up
s o
f tr
ad
eS
AF
TA
BIM
ST
EC
Ind
ia-S
ri L
an
ka
Pa
kis
tan
-Sri
La
nk
aIn
dia
-Sin
ga
po
re
fac
ilit
ati
on
me
as
ure
s
Mut
ual r
ecog
nitio
n-
Mut
ual
Pro
pose
sn.
a.n.
a.E
xpl ic
it pr
ovis
ions
of te
st fa
cil i t
ies/
reco
gniti
on o
fha
rmon
izat
ion
men
tione
d
cert
ifica
tion.
elec
tron
ic(A
rtic
le 5
.5).
sign
atur
es a
nddi
gita
l cer
tific
ates
-A
ccep
t
equi
vale
nce
ofm
anda
tory
requ
irem
ents
,
conf
orm
ityas
sess
men
ts
and
appr
oval
proc
edur
es in
cert
ain
sect
ors.
Oth
er m
easu
res.
Ado
ptio
n of
Ref
ers
ton.
a.n.
a.W
TO
Info
rmat
ion
UN
CIT
RA
L M
odel
prom
otio
n of
Tech
nolo
gy
Law
on
Ele
ctro
nic
e-co
mm
erce
.A
gree
men
t to
Com
mer
ce.
form
the
basi
s.
Coo
pera
tion/
Trai
ning
and
n.a.
n.a.
n.a.
n.a.
Spe
cific
pro
visi
ons
assi
stan
ce.
hum
an r
esou
rces
for
capa
city
deve
lopm
ent.
deve
lopm
ent
Tech
nica
lC
oope
rativ
eP
ropo
ses
n.a.
n.a.
Mut
ual s
uppo
rt.
assi
stan
ce.
activ
ities
, tec
hnic
alm
easu
res
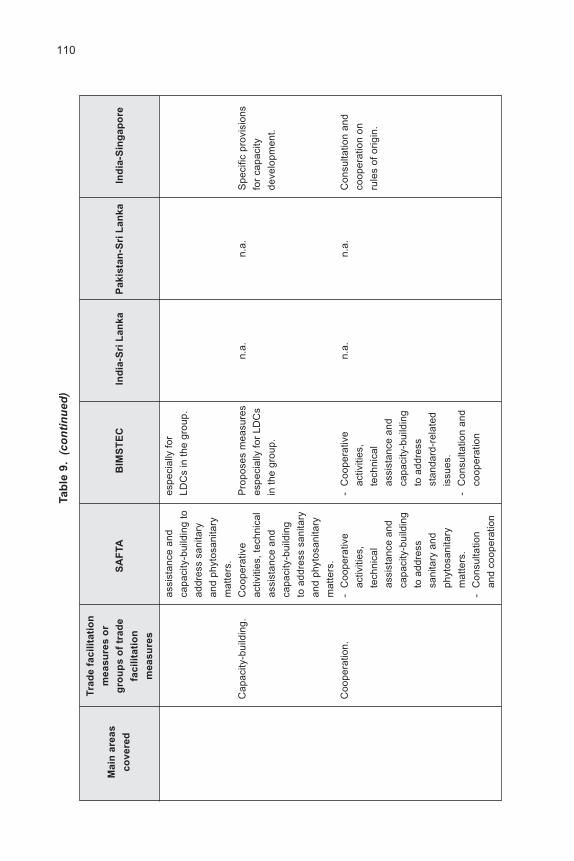
110Ta
ble
9.
(co
nti
nu
ed)
Tra
de
fa
cil
ita
tio
n
Ma
in a
rea
sm
ea
su
res
or
co
ve
red
gro
up
s o
f tr
ad
eS
AF
TA
BIM
ST
EC
Ind
ia-S
ri L
an
ka
Pa
kis
tan
-Sri
La
nk
aIn
dia
-Sin
ga
po
re
fac
ilit
ati
on
me
as
ure
s
assi
stan
ce a
ndes
peci
ally
for
capa
city
-bui
ldin
g to
LDC
s in
the
grou
p.
addr
ess
sani
tary
and
phyt
osan
itary
mat
ters
.
Cap
acity
-bui
ldin
g.C
oope
rativ
eP
ropo
ses
mea
sure
sn.
a.n.
a.S
peci
fic p
rovi
sion
sac
tiviti
es, t
echn
ical
espe
cial
ly fo
r LD
Cs
for
capa
city
assi
stan
ce a
ndin
the
grou
p.de
velo
pmen
t.
capa
city
-bui
ldin
gto
add
ress
san
itary
and
phyt
osan
itary
mat
ters
.C
oope
ratio
n.-
Coo
pera
tive
-C
oope
rativ
en.
a.n.
a.C
onsu
ltatio
n an
d
activ
ities
,ac
tiviti
es,
coop
erat
ion
on
tech
nica
lte
chni
cal
rule
s of
orig
in.
assi
stan
ce a
ndas
sist
ance
and
capa
city
-bui
ldin
gca
paci
ty-b
uild
ing
to a
ddre
ssto
add
ress
sani
tary
and
stan
dard
-rel
ated
phyt
osan
itary
issu
es.
mat
ters
.-
Con
sulta
tion
and
-C
onsu
ltatio
nco
oper
atio
n
and
coop
erat
ion

111Ta
ble
9.
(co
nti
nu
ed)
Tra
de
fa
cil
ita
tio
n
Ma
in a
rea
sm
ea
su
res
or
co
ve
red
gro
up
s o
f tr
ad
eS
AF
TA
BIM
ST
EC
Ind
ia-S
ri L
an
ka
Pa
kis
tan
-Sri
La
nk
aIn
dia
-Sin
ga
po
re
fac
ilit
ati
on
me
as
ure
s
rega
rdin
g ru
les
rega
rdin
g ru
les
of o
rigin
.of
orig
in.
Rel
atio
nshi
p,C
usto
ms/
busi
ness
Not
exp
l icitl
y.Im
prov
e cu
stom
sn.
a.n.
a.E
xpl ic
it pr
ovis
ions
.
gove
rnm
ent-
part
ners
hip.
coop
erat
ion.
busi
ness
Impr
ove
busi
ness
-S
hort
-ter
mIm
prov
e bu
sine
ssn.
a.n.
a.M
obil i
ty o
f bus
ines
s
mob
il ity
.bu
sine
ss v
isito
rvi
sa-g
rant
ing
at s
ecto
ral l
evel
isvi
sa (
sing
lepr
oces
s.de
fined
.
imm
igra
tion
form
ality
).
-Lo
ng-t
erm
vis
a
for
intr
a-co
rpor
ate
tran
sfer
ees.

112
14 www.saarc-sec.org.
15 RIS, 2004.
16 See http://bimstec.org.
Provisions related to harmonization of standards, technical assistance for LDCsand customs cooperation at the SAARC level are also included. SAARC already hasa Group on Customs Cooperation which was set up in 1996 and mandated to harmonizecustoms rules and regulations, simplify documentation and procedural requirements, improveinfrastructure facilities and provide training for human resource development. Fourmeetings of the Group have been held. A Customs Action Plan has been agreed upon.The 4th Meeting of the Group on Customs Cooperation, held at Faridabad, India on 12 and13 August 2004, considered the report of the customs consultant engaged to study andmake recommendations on measures for simplifying procedures as well as standardizingcustoms documents and declarations.14
2. Bay of Bengal Initiative for Multisectoral
Techno-Economic Cooperation
The idea of this regional cooperation agreement was first mooted by Bangladesh,India, Sri Lanka and Thailand at a meeting in Bangkok in June 1997. The BangkokDeclaration of 6 June 1997 on the establishment of Bangladesh-India-Sri Lanka-ThailandEconomic Co-operation (BIST-EC) was adopted. Later, in 2004, Nepal and Bhutan alsojoined and the grouping was then renamed as the Bay of Bengal Initiative for MultisectoralTechno-Economic Cooperation (BIMSTEC),15 combining some geographically contiguousSouth Asian and ASEAN countries in the Bay of Bengal.
The 6th BIMSTEC Ministerial Meeting held in Phuket, Thailand in February 2004provided a major impetus to the grouping with the signing of a Framework Agreement fora BIMSTEC FTA in addition to the entry of Bhutan and Nepal as members. The firstBIMSTEC summit, held at Bangkok in July, was another landmark in the evolution of thegrouping. The combined size of the BIMSTEC member populations and economies is1.3 billion and US$ 750 billion. The members are at different levels of economic andindustrial development, and they have different natural resource endowments. The potentialof intraregional trade remains untapped because of tariff and non-tariff barriers, poorcommunications and transport links and the lack of information about supply capabilities,among other barriers.
Although BIMSTEC has identified many specific areas for cooperation, the FTAagreement does not contain specific provisions on trade facilitation.16 It suggests facilitatingtrade without any explicit elaboration of instruments except for the suggestion of establishingmechanisms for rules of origin and the simplification of formalities connected with importingand exporting. There are some suggestions for harmonization of standards, the introductionof e-commerce, the improvement of customs cooperation as well as technical assistancefor LDCs in the group.
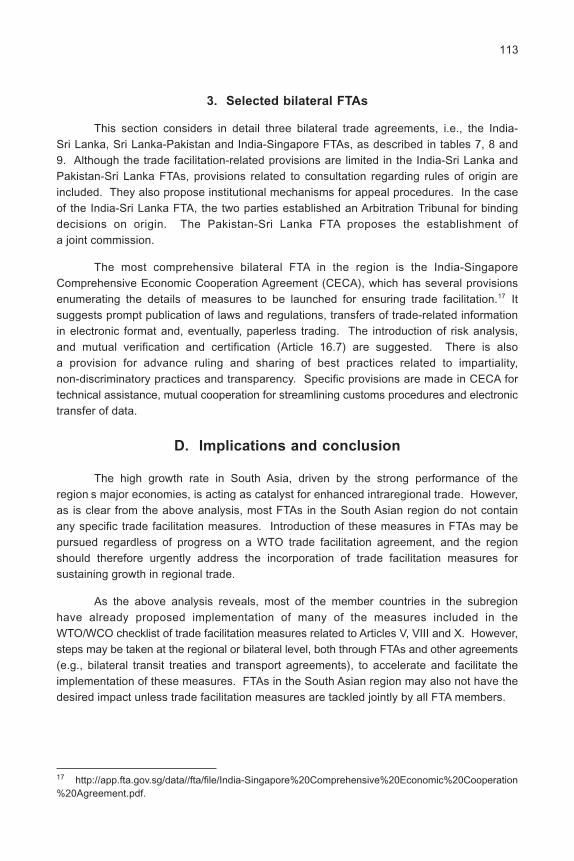
113
17 http://app.fta.gov.sg/data//fta/file/India-Singapore%20Comprehensive%20Economic%20Cooperation%20Agreement.pdf.
3. Selected bilateral FTAs
This section considers in detail three bilateral trade agreements, i.e., the India-Sri Lanka, Sri Lanka-Pakistan and India-Singapore FTAs, as described in tables 7, 8 and9. Although the trade facilitation-related provisions are limited in the India-Sri Lanka andPakistan-Sri Lanka FTAs, provisions related to consultation regarding rules of origin areincluded. They also propose institutional mechanisms for appeal procedures. In the caseof the India-Sri Lanka FTA, the two parties established an Arbitration Tribunal for bindingdecisions on origin. The Pakistan-Sri Lanka FTA proposes the establishment ofa joint commission.
The most comprehensive bilateral FTA in the region is the India-SingaporeComprehensive Economic Cooperation Agreement (CECA), which has several provisionsenumerating the details of measures to be launched for ensuring trade facilitation.17 Itsuggests prompt publication of laws and regulations, transfers of trade-related informationin electronic format and, eventually, paperless trading. The introduction of risk analysis,and mutual verification and certification (Article 16.7) are suggested. There is alsoa provision for advance ruling and sharing of best practices related to impartiality,non-discriminatory practices and transparency. Specific provisions are made in CECA fortechnical assistance, mutual cooperation for streamlining customs procedures and electronictransfer of data.
D. Implications and conclusion
The high growth rate in South Asia, driven by the strong performance of theregion s major economies, is acting as catalyst for enhanced intraregional trade. However,as is clear from the above analysis, most FTAs in the South Asian region do not containany specific trade facilitation measures. Introduction of these measures in FTAs may bepursued regardless of progress on a WTO trade facilitation agreement, and the regionshould therefore urgently address the incorporation of trade facilitation measures forsustaining growth in regional trade.
As the above analysis reveals, most of the member countries in the subregionhave already proposed implementation of many of the measures included in theWTO/WCO checklist of trade facilitation measures related to Articles V, VIII and X. However,steps may be taken at the regional or bilateral level, both through FTAs and other agreements(e.g., bilateral transit treaties and transport agreements), to accelerate and facilitate theimplementation of these measures. FTAs in the South Asian region may also not have thedesired impact unless trade facilitation measures are tackled jointly by all FTA members.
114
Measures that emerge as particularly important based on the above review ofintraregional trade, and which could be tackled through adequate provisions in regionaland bilateral trade and other agreements, include:
(a) Measures related to GATT Article V and other transit trade facilitationmeasures, including the introduction of risk management and authorized tradersprovisions in bilateral transit treaties as well as recognition and enforcementof bilateral commercial motor vehicle agreements or acts;
(b) A trade facilitation infrastructure, particularly at LCS;
(c) Security of goods in transit, as some routes still require army protection forcargoes. (Chaturvedi (2006) reported that transportation in the 35-kilometrearea between Phulbari in Bangladesh and Panitanki in Nepal requires armysupport for cargo protection purposes). The containerization of regionaltrade could also help in addressing some of the security concerns that havebeen holding back trade development;
(d) Border agency coordination.

115A
nn
ex
As
se
ss
me
nt
ch
ec
kli
st
on
me
as
ure
s r
ela
ted
to
GA
TT
Art
icle
s V
, V
III
an
d X
- S
ou
th A
sia
˚˚
Ind
iaB
an
gla
de
sh
Ne
pa
lS
ri L
an
ka
S.N
.Q
ue
sti
on
Re
sp
on
se
Co
mm
en
tsR
es
po
ns
eC
om
me
nts
Re
sp
on
se
Co
mm
en
tsR
es
po
ns
eC
om
me
nts
(Ye
s =
1;
(Ye
s =
1;
(Ye
s =
1;
(Ye
s =
1;
No
= 0
)N
o =
0)
No
= 0
)N
o =
0)
Qu
es
tio
ns
/is
su
es
re
late
d m
ain
ly t
o A
rtic
le X
(p
ub
lic
ati
on
an
d a
dm
inis
tra
tio
n o
f tr
ad
e r
eg
ula
tio
ns
)
Pu
bli
ca
tio
n/a
va
ila
bil
ity
of
info
rma
tio
n˚
1A
re a
ny o
f the
fol lo
win
gpu
blis
hed?
˚La
ws
11
˚1
1R
egul
atio
ns1
1˚
11
Doc
umen
tary
req
uire
men
ts1
1C
hang
es1
1S
tand
ard
oper
atin
g1
1S
ecto
ral
11
prac
tices
Sta
ndar
d pr
oces
sing
tim
es0
No
deci
sion
1T
hree
day
s1
0to
pub
lish
itfo
r P
SI
so fa
r.S
peci
fic c
usto
ms
11
˚1
1pr
oced
ures
Tarif
f cla
ssifi
catio
n1
1˚
11
Val
uatio
n0
Pro
vide
d by
1G
AT
T1
0lo
cal c
usto
ms
valu
atio
nof
fice
Exe
mpt
ions
, pro
hibi
tions
,1
1S
tatu
tory
11
rest
rictio
nsR
egul
ator
yO
rder
s(S
RO
s)D
uty
and
tax
rate
s1
1Ta
riff
11
clas
sific
atio
n/ta
x sc
hedu
le

116A
nn
ex
(co
nti
nu
ed)
˚˚
Ind
iaB
an
gla
de
sh
Ne
pa
lS
ri L
an
ka
S.N
.Q
ue
sti
on
Re
sp
on
se
Co
mm
en
tsR
es
po
ns
eC
om
me
nts
Re
sp
on
se
Co
mm
en
tsR
es
po
ns
eC
om
me
nts
(Ye
s =
1;
(Ye
s =
1;
(Ye
s =
1;
(Ye
s =
1;
No
= 0
)N
o =
0)
No
= 0
)N
o =
0)
Fee
s an
d ch
arge
s1
1˚
11
Adm
inis
trat
ive
11
11
arra
ngem
ents
and
requ
irem
ents
Man
agem
ent p
lans
11
Str
ateg
ic0
1de
velo
pmen
tpl
anR
ulin
gs1
10
1B
y th
est
akeh
olde
rsJu
dici
al d
ecis
ions
0P
ublis
hed
by1
1S
upre
me
1T
his
is d
one
priv
ate
Cou
rtby
priv
ate
publ
ishe
rde
cisi
ons
oper
ator
sar
e pu
blis
hed
inN
epal
Law
Jour
nal.
Dec
isio
ns o
flo
wer
leve
lco
urt a
reno
t pub
lishe
dA
gree
men
ts w
ith o
ther
11
˚1
coun
trie
s
2Is
rel
evan
t cus
tom
s an
d tr
ade-
11
11
rela
ted
info
rmat
ion
mad
eav
aila
ble
via
the
Inte
rnet
?
3Is
rel
evan
t cus
tom
s an
d tr
ade-
1re
late
d in
form
atio
n m
ade
avai
labl
e in
:

117A
nn
ex
(co
nti
nu
ed)
˚˚
Ind
iaB
an
gla
de
sh
Ne
pa
lS
ri L
an
ka
S.N
.Q
ue
sti
on
Re
sp
on
se
Co
mm
en
tsR
es
po
ns
eC
om
me
nts
Re
sp
on
se
Co
mm
en
tsR
es
po
ns
eC
om
me
nts
(Ye
s =
1;
(Ye
s =
1;
(Ye
s =
1;
(Ye
s =
1;
No
= 0
)N
o =
0)
No
= 0
)N
o =
0)
Cus
tom
s of
fices
11
˚1
˚1
˚E
mba
ssie
s1
Thr
ough
1O
ccas
iona
lly0
Lim
ited
web
site
sent
to th
emC
onsu
late
s1
Thr
ough
1O
ccas
iona
lly0
Lim
ited
web
site
sent
to th
emTr
ade
mis
sion
s/of
fices
1T
hrou
gh1
Occ
asio
nally
01
web
site
sent
to th
emG
over
nmen
t bui
ldin
gs/
11
Occ
asio
nally
01
offic
esse
nt to
them
Pub
lic b
uild
ings
/offi
ces
11
Occ
asio
nally
01˚
sent
to th
emO
ther
?P
rivat
e0
Larg
ely
onpu
blis
hing
the
Inte
rnet
hous
es b
ring
out v
ario
uscu
stom
sm
anua
ls
4Is
rel
evan
t inf
orm
atio
n m
ade
1O
nly
in0
Onl
y in
0O
nly
inav
aila
ble
in E
nglis
h, F
renc
hE
nglis
hB
enga
liE
nglis
h˚or
Spa
nish
?
5D
oes
cust
oms
char
ge fo
r0
1T
k 20
for
00
info
rmat
ion
prov
ided
?pa
rtic
ular
info
rmat
ion

118A
nn
ex
(co
nti
nu
ed)
˚˚
Ind
iaB
an
gla
de
sh
Ne
pa
lS
ri L
an
ka
S.N
.Q
ue
sti
on
Re
sp
on
se
Co
mm
en
tsR
es
po
ns
eC
om
me
nts
Re
sp
on
se
Co
mm
en
tsR
es
po
ns
eC
om
me
nts
(Ye
s =
1;
(Ye
s =
1;
(Ye
s =
1;
(Ye
s =
1;
No
= 0
)N
o =
0)
No
= 0
)N
o =
0)
6W
hen
char
ges
are
mad
e,0
Not
10
are
cost
s l im
ited
to o
nly
the
appl
icab
le a
sse
rvic
e pr
ovid
ed?
no c
hang
esar
e im
pose
d
7Is
info
rmat
ion
rele
vant
to a
ny1
Cer
tain
lega
l0
01
prop
osed
cha
nges
or
to n
ewpr
ovis
ions
requ
irem
ents
mad
e av
aila
ble
are
not p
utsu
ffici
ently
in a
dvan
ce fo
rou
t for
inte
rest
ed p
artie
s to
take
com
men
tsac
coun
t of t
hem
?
8D
oes
cust
oms
publ
ish
all
10
The
cus
tom
s0
0pr
opos
ed c
hang
es o
r ne
wau
thor
ityre
quire
men
ts in
adv
ance
of
invi
tes
entr
y in
to fo
rce?
prop
osal
s fo
rch
ange
s fr
omin
tere
stgr
oups
dur
ing
Dec
embe
r-Ja
nuar
ype
riod;
this
prov
isio
ncl
oses
inF
ebru
ary
9D
o st
akeh
olde
rs h
ave
the
1N
ot in
eve
ry1
The
dec
isio
n1
1op
port
unity
to c
ontr
ibut
e/ca
sew
heth
er o
rde
velo
p/in
fluen
ce/q
uest
ion
not t
o ta
ke

119A
nn
ex
(co
nti
nu
ed)
˚˚
Ind
iaB
an
gla
de
sh
Ne
pa
lS
ri L
an
ka
S.N
.Q
ue
sti
on
Re
sp
on
se
Co
mm
en
tsR
es
po
ns
eC
om
me
nts
Re
sp
on
se
Co
mm
en
tsR
es
po
ns
eC
om
me
nts
(Ye
s =
1;
(Ye
s =
1;
(Ye
s =
1;
(Ye
s =
1;
No
= 0
)N
o =
0)
No
= 0
)N
o =
0)
all p
ropo
sed
chan
ges
of n
ewan
y pr
opos
alre
quire
men
ts in
adv
ance
into
acc
ount
of e
ntry
into
forc
e?is
up
to th
eG
over
nmen
t
10D
oes
cust
oms
invi
te1
Not
in e
very
0N
ot a
s su
ch,
10
com
men
ts fr
om th
e pu
blic
case
but n
ewan
d tr
ade
on a
l l pr
opos
edpr
opos
als
are
chan
ges
or n
ewso
ught
from
requ
irem
ents
in a
dvan
ce o
fth
een
try
into
forc
e?st
akeh
olde
rgr
oups
.T
he fi
nal
deci
sion
isup
to th
eG
over
nmen
t.A
ll ch
ange
sar
e in
form
eddu
ring
the
budg
etde
clar
atio
n.
11H
as c
usto
ms
esta
blis
hed
info
rmat
ion
serv
ices
suc
h as
:C
lient
/hel
p de
sk1
0˚
1˚
0˚
Enq
uiry
poi
nt1
01
Sta
keho
lder
sha
ve th
eir
own
enqu
irypo
ints
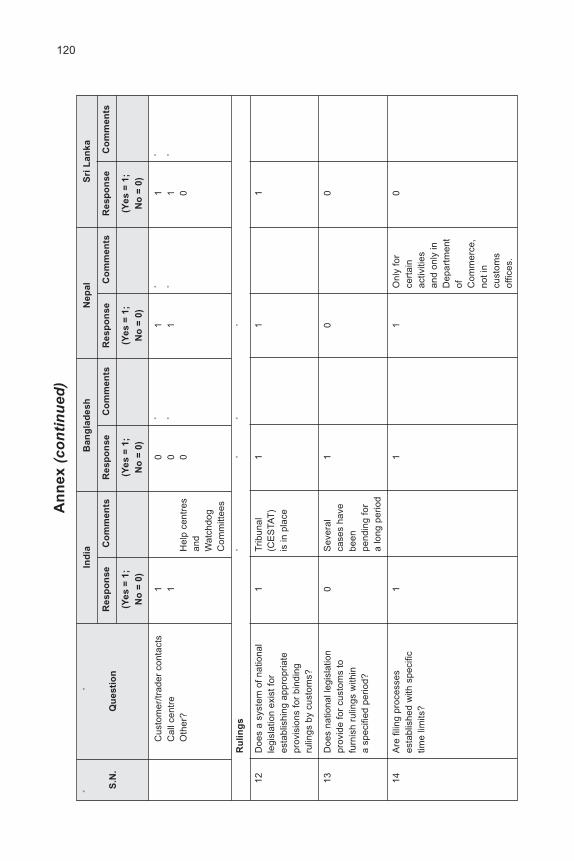
120A
nn
ex
(co
nti
nu
ed)
˚˚
Ind
iaB
an
gla
de
sh
Ne
pa
lS
ri L
an
ka
S.N
.Q
ue
sti
on
Re
sp
on
se
Co
mm
en
tsR
es
po
ns
eC
om
me
nts
Re
sp
on
se
Co
mm
en
tsR
es
po
ns
eC
om
me
nts
(Ye
s =
1;
(Ye
s =
1;
(Ye
s =
1;
(Ye
s =
1;
No
= 0
)N
o =
0)
No
= 0
)N
o =
0)
Cus
tom
er/tr
ader
con
tact
s1
0˚
1˚
1˚
Cal
l cen
tre
10
˚1
˚1
˚O
ther
?H
elp
cent
res
00
and
Wat
chdo
gC
omm
ittee
s
Ru
lin
gs
˚˚
˚˚
12D
oes
a sy
stem
of n
atio
nal
1Tr
ibun
al1
11
legi
slat
ion
exis
t for
(CE
STA
T)
esta
blis
hing
app
ropr
iate
is in
pla
cepr
ovis
ions
for
bind
ing
rul in
gs b
y cu
stom
s?
13D
oes
natio
nal l
egis
latio
n0
Sev
eral
10
0pr
ovid
e fo
r cu
stom
s to
case
s ha
vefu
rnis
h ru
lings
with
inbe
ena
spec
ified
per
iod?
pend
ing
for
a lo
ng p
erio
d
14A
re fi
ling
proc
esse
s1
11
Onl
y fo
r0
esta
blis
hed
with
spe
cific
cert
ain
time
limits
?ac
tiviti
esan
d on
ly in
Dep
artm
ent
of Com
mer
ce,
not i
ncu
stom
sof
fices
.

121A
nn
ex
(co
nti
nu
ed)
˚˚
Ind
iaB
an
gla
de
sh
Ne
pa
lS
ri L
an
ka
S.N
.Q
ue
sti
on
Re
sp
on
se
Co
mm
en
tsR
es
po
ns
eC
om
me
nts
Re
sp
on
se
Co
mm
en
tsR
es
po
ns
eC
om
me
nts
(Ye
s =
1;
(Ye
s =
1;
(Ye
s =
1;
(Ye
s =
1;
No
= 0
)N
o =
0)
No
= 0
)N
o =
0)
15D
o ru
ling
proc
edur
es p
rovi
de1
1C
omm
issi
oner
11
the
oppo
rtun
ity fo
r ap
peal
(App
eal)
and
with
rev
iew
and
/or
judi
cial
the
Cus
tom
spr
oces
sTr
ibun
al a
re in
pla
ce.
16D
oes
the
adm
inis
trat
ion
prov
ide
bind
ing
rul in
gs fo
r:˚
˚˚
Val
uatio
n1
1˚
1˚
1˚C
lass
ifica
tion
11
˚1
˚1
˚O
rigin
11
˚1
˚1
˚O
ther
Cus
tom
s pu
rpos
es?
11
˚1
˚1
˚
Ap
pe
als
an
d r
ev
iew
˚˚
˚
17H
ave
inte
rnal
app
eal a
nd1
11
1re
view
mec
hani
sms
been
esta
blis
hed?
18A
re in
tern
al a
ppea
l and
11
11
revi
ew m
echa
nism
sin
depe
nden
t?
19H
ave
prov
isio
ns b
een
11
11
esta
blis
hed
for
an in
itial
appe
al to
cus
tom
s?
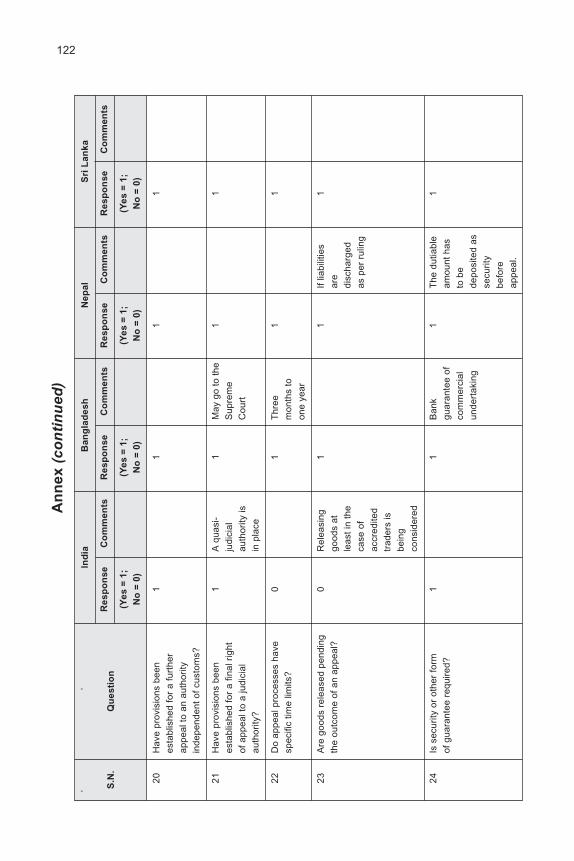
122A
nn
ex
(co
nti
nu
ed)
˚˚
Ind
iaB
an
gla
de
sh
Ne
pa
lS
ri L
an
ka
S.N
.Q
ue
sti
on
Re
sp
on
se
Co
mm
en
tsR
es
po
ns
eC
om
me
nts
Re
sp
on
se
Co
mm
en
tsR
es
po
ns
eC
om
me
nts
(Ye
s =
1;
(Ye
s =
1;
(Ye
s =
1;
(Ye
s =
1;
No
= 0
)N
o =
0)
No
= 0
)N
o =
0)
20H
ave
prov
isio
ns b
een
11
11
esta
blis
hed
for
a fu
rthe
rap
peal
to a
n au
thor
ityin
depe
nden
t of c
usto
ms?
21H
ave
prov
isio
ns b
een
1A
qua
si-
1M
ay g
o to
the
11
esta
blis
hed
for
a fin
al r
ight
judi
cial
Sup
rem
eof
app
eal t
o a
judi
cial
auth
ority
isC
ourt
auth
ority
?in
pla
ce
22D
o ap
peal
pro
cess
es h
ave
01
Thr
ee1
1sp
ecifi
c tim
e l im
its?
mon
ths
toon
e ye
ar
23A
re g
oods
rel
ease
d pe
ndin
g0
Rel
easi
ng1
1If
l iabi
l i tie
s1
the
outc
ome
of a
n ap
peal
?go
ods
atar
ele
ast i
n th
edi
scha
rged
case
of
as p
er r
ulin
gac
cred
ited
trad
ers
isbe
ing
cons
ider
ed
24Is
sec
urity
or
othe
r fo
rm1
1B
ank
1T
he d
utia
ble
1of
gua
rant
ee r
equi
red?
guar
ante
e of
amou
nt h
asco
mm
erci
alto
be
unde
rtak
ing
depo
site
d as
secu
rity
befo
reap
peal
.

123A
nn
ex
(co
nti
nu
ed)
˚˚
Ind
iaB
an
gla
de
sh
Ne
pa
lS
ri L
an
ka
S.N
.Q
ue
sti
on
Re
sp
on
se
Co
mm
en
tsR
es
po
ns
eC
om
me
nts
Re
sp
on
se
Co
mm
en
tsR
es
po
ns
eC
om
me
nts
(Ye
s =
1;
(Ye
s =
1;
(Ye
s =
1;
(Ye
s =
1;
No
= 0
)N
o =
0)
No
= 0
)N
o =
0)
Ma
na
ge
me
nt
˚˚
˚
25A
re s
yste
ms
in p
lace
for
11
11
mon
itorin
g an
d ev
alua
ting
the
perf
orm
ance
of c
usto
ms
agai
nst e
stab
l ishe
dst
anda
rds
and/
or in
dica
tors
?
26H
ave
trai
ning
pro
gram
mes
11
The
Cus
tom
s1
Not
1be
en e
stab
l ishe
d fo
rTr
aini
ngad
equa
tely
cust
oms
clea
ranc
e A
cade
my
proc
edur
espr
ovid
essu
ch c
ours
esto
geth
er w
ithre
fres
her
cour
ses
27A
re a
ll cu
stom
s st
aff g
iven
10
1B
ut n
ot1
trai
ning
on
inte
grity
mat
ters
?sp
ecifi
cally
on in
tegr
ity
28H
as a
Cod
e of
Con
duct
/Cod
e1
A C
itize
ns
0N
othi
ng1
1of
Eth
ics
been
dev
elop
edC
hart
er is
info
rmal
; onl
yan
d im
plem
ente
d by
plac
e.th
e S
ervi
cecu
stom
s?H
owev
er,
Rul
e fo
r th
eIn
dia
is n
otC
ivil
Ser
vant
sin
favo
ur o
fin
Ban
glad
esh
incl
udin
g it
is fo
llow
edin
WT
O.

124A
nn
ex
(co
nti
nu
ed)
˚˚
Ind
iaB
an
gla
de
sh
Ne
pa
lS
ri L
an
ka
S.N
.Q
ue
sti
on
Re
sp
on
se
Co
mm
en
tsR
es
po
ns
eC
om
me
nts
Re
sp
on
se
Co
mm
en
tsR
es
po
ns
eC
om
me
nts
(Ye
s =
1;
(Ye
s =
1;
(Ye
s =
1;
(Ye
s =
1;
No
= 0
)N
o =
0)
No
= 0
)N
o =
0)
Sy
ste
ms
an
d p
roc
ed
ure
s˚
˚˚
29Is
the
cust
oms
proc
ess
11
As
part
of t
he1
Not
ful ly
1A
SY
CU
DA
++
auto
mat
ed?
AS
YC
UD
A+
+an
d no
w E
DI
30Is
ele
ctro
nic
fi lin
g of
ent
ry1
1T
he d
irect
01
Fiv
edo
cum
ents
pro
vide
d fo
r?tr
ader
inpu
tth
ousa
ndsy
stem
per
mon
th
31D
o cu
stom
s an
d ot
her
1O
nly
1In
CD
form
at0
Par
tial ly
agen
cies
sha
re in
form
atio
npa
rtia
l lyel
ectr
onic
ally
?
32A
re p
re-a
rriv
al r
elea
se1
1P
re-a
rriv
al0
1P
artia
l lypr
oced
ures
use
d?as
sess
men
tim
plem
ente
dis
don
e; n
otcl
eara
nce
33D
oes
the
adm
inis
trat
ion
11
Pet
role
um1
Ris
kgr
ant i
mm
edia
te r
elea
se/
and
man
agem
ent
clea
ranc
e pr
oced
ures
tope
risha
ble
bein
gan
y ca
tego
ry o
f goo
ds?
good
s su
chco
nsid
ered
as r
ice,
suga
r,w
heat
etc
.
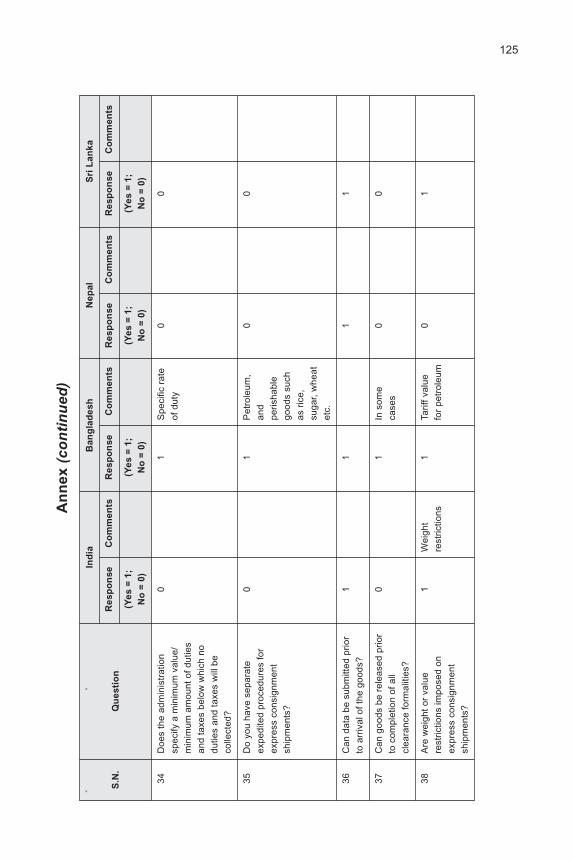
125A
nn
ex
(co
nti
nu
ed)
˚˚
Ind
iaB
an
gla
de
sh
Ne
pa
lS
ri L
an
ka
S.N
.Q
ue
sti
on
Re
sp
on
se
Co
mm
en
tsR
es
po
ns
eC
om
me
nts
Re
sp
on
se
Co
mm
en
tsR
es
po
ns
eC
om
me
nts
(Ye
s =
1;
(Ye
s =
1;
(Ye
s =
1;
(Ye
s =
1;
No
= 0
)N
o =
0)
No
= 0
)N
o =
0)
34D
oes
the
adm
inis
trat
ion
01
Spe
cific
rat
e0
0sp
ecify
a m
inim
um v
alue
/of
dut
ym
inim
um a
mou
nt o
f dut
ies
and
taxe
s be
low
whi
ch n
odu
ties
and
taxe
s w
il l b
eco
l lect
ed?
35D
o yo
u ha
ve s
epar
ate
01
Pet
role
um,
00
expe
dite
d pr
oced
ures
for
and
expr
ess
cons
ignm
ent
peris
habl
esh
ipm
ents
?go
ods
such
as r
ice,
suga
r, w
heat
etc.
36C
an d
ata
be s
ubm
itted
prio
r1
11
1to
arr
ival
of t
he g
oods
?
37C
an g
oods
be
rele
ased
prio
r0
1In
som
e0
0to
com
plet
ion
of a
llca
ses
clea
ranc
e fo
rmal
ities
?
38A
re w
eigh
t or
valu
e1
Wei
ght
1Ta
riff v
alue
01
rest
rictio
ns im
pose
d on
rest
rictio
nsfo
r pe
trol
eum
expr
ess
cons
ignm
ent
ship
men
ts?

126A
nn
ex
(co
nti
nu
ed)
˚˚
Ind
iaB
an
gla
de
sh
Ne
pa
lS
ri L
an
ka
S.N
.Q
ue
sti
on
Re
sp
on
se
Co
mm
en
tsR
es
po
ns
eC
om
me
nts
Re
sp
on
se
Co
mm
en
tsR
es
po
ns
eC
om
me
nts
(Ye
s =
1;
(Ye
s =
1;
(Ye
s =
1;
(Ye
s =
1;
No
= 0
)N
o =
0)
No
= 0
)N
o =
0)
39D
oes
the
adm
inis
trat
ion
use
0T
his
is in
the
1P
aram
eter
s1
Just
initi
ated
1P
artia
llyris
k an
alys
is to
det
erm
ine
impl
emen
t-ar
e th
ere,
on a
tria
lim
plem
ente
dw
hich
goo
ds s
houl
d be
atio
n ph
ase
but o
nly
basi
s fo
rex
amin
ed?
part
lyse
lect
edim
plem
ente
dgo
ods
40D
o C
usto
ms
cont
rol s
yste
ms
1T
his
is in
the
1P
artly
don
e1
Just
initi
ated
1in
clud
e au
dit b
ased
impl
emen
t-on
a tr
ial
cont
rols
?at
ion
phas
eba
sis
for
sele
cted
good
s
41D
oes
the
Cus
tom
s1
Thi
s is
in th
e0
00
adm
inis
trat
ion
auth
oriz
eim
plem
ent-
pers
ons
with
an
appr
opria
teat
ion
phas
eco
mpl
ianc
e re
cord
for
sim
plifi
ed a
nd s
peci
alpr
oced
ures
42F
or a
utho
rized
per
sons
0˚
˚˚
1˚C
an g
oods
be
rele
ased
on
the
prov
isio
n of
min
imum
info
rmat
ion
with
full
clea
ranc
e be
ing
final
ized
subs
eque
ntly
-can
goo
dsbe
cle
ared
at t
hede
clar
ants
pre
mis
es˚
˚˚
˚˚
Oth
er˚
0

127A
nn
ex
(co
nti
nu
ed)
˚˚
Ind
iaB
an
gla
de
sh
Ne
pa
lS
ri L
an
ka
S.N
.Q
ue
sti
on
Re
sp
on
se
Co
mm
en
tsR
es
po
ns
eC
om
me
nts
Re
sp
on
se
Co
mm
en
tsR
es
po
ns
eC
om
me
nts
(Ye
s =
1;
(Ye
s =
1;
(Ye
s =
1;
(Ye
s =
1;
No
= 0
)N
o =
0)
No
= 0
)N
o =
0)
Qu
es
tio
ns
/is
su
es
re
late
d m
ain
ly t
o G
AT
T A
rtic
le V
III
(Fe
e a
nd
Fo
rma
liti
es
co
nn
ec
ted
wit
h I
mp
ort
ing
/Ex
po
rtin
g)
43D
oes
the
adm
inis
trat
ion
0F
reel
y1
Tk
20 p
er0
0ch
arge
for
the
prov
isio
n of
avai
labl
ere
ques
t for
info
rmat
ion
to th
e tr
ade?
info
rmat
ion
44D
o fe
es fo
r cu
stom
s0
Doe
s no
t0
No
fees
are
0pr
oces
sing
ref
lect
the
cost
aris
ech
arge
dof
ser
vice
s re
nder
ed?
othe
r th
andu
ties
and
taxe
s
45A
re fe
es p
ublis
hed?
11
1R
efer
s fe
es1
char
ged
bydi
ffere
ntag
enci
es to
issu
e G
SP
cert
ifica
te
The
am
ount
?1
1˚
˚1
˚
Tim
e du
e?1
1˚
˚1
˚
Ent
ity a
sses
sing
the
fee?
11
˚˚
1
How
pay
men
t can
be
mad
e?1
1˚
˚1
46A
re fe
e am
ount
s pu
blis
hed
01
01
on th
e In
tern
et?
Qu
es
tio
ns
/is
su
es
re
late
d m
ain
ly t
o G
AT
T A
rtic
le V
(F
ree
do
m o
f T
ran
sit
)˚
47H
ave
inte
rnat
iona
l tra
nsit
10
01
syst
ems
been
impl
emen
ted?
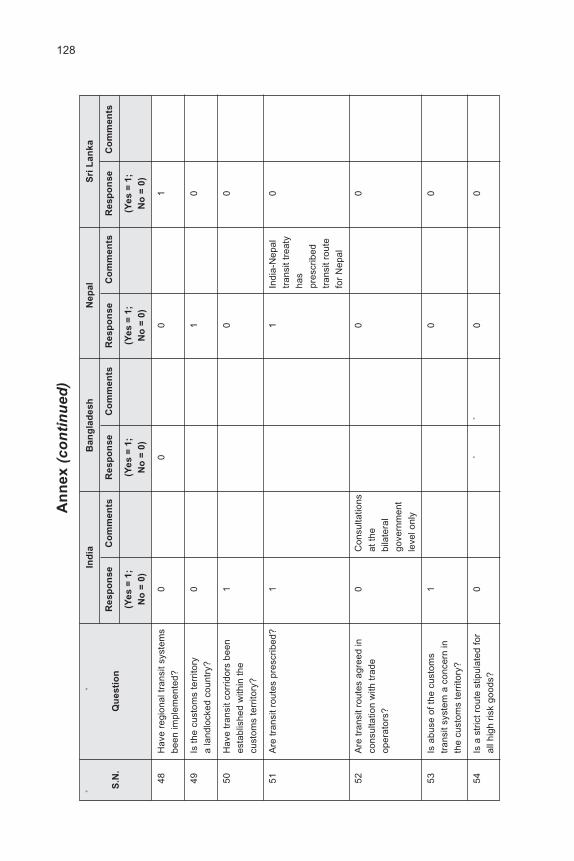
128A
nn
ex
(co
nti
nu
ed)
˚˚
Ind
iaB
an
gla
de
sh
Ne
pa
lS
ri L
an
ka
S.N
.Q
ue
sti
on
Re
sp
on
se
Co
mm
en
tsR
es
po
ns
eC
om
me
nts
Re
sp
on
se
Co
mm
en
tsR
es
po
ns
eC
om
me
nts
(Ye
s =
1;
(Ye
s =
1;
(Ye
s =
1;
(Ye
s =
1;
No
= 0
)N
o =
0)
No
= 0
)N
o =
0)
48H
ave
regi
onal
tran
sit s
yste
ms
00
01
been
impl
emen
ted?
49Is
the
cust
oms
terr
itory
01
0a
land
lock
ed c
ount
ry?
50H
ave
tran
sit c
orrid
ors
been
10
0es
tabl
ishe
d w
ithin
the
cust
oms
terr
itory
?
51A
re tr
ansi
t rou
tes
pres
crib
ed?
11
Indi
a-N
epal
0tr
ansi
t tre
aty
has
pres
crib
edtr
ansi
t rou
tefo
r N
epal
52A
re tr
ansi
t rou
tes
agre
ed in
0C
onsu
ltatio
ns0
0co
nsul
tatio
n w
ith tr
ade
at th
eop
erat
ors?
bila
tera
lgo
vern
men
tle
vel o
nly
53Is
abu
se o
f the
cus
tom
s1
00
tran
sit s
yste
m a
con
cern
inth
e cu
stom
s te
rrito
ry?
54Is
a s
tric
t rou
te s
tipul
ated
for
0˚
˚0
0al
l hig
h ris
k go
ods?

129A
nn
ex
(co
nti
nu
ed)
˚˚
Ind
iaB
an
gla
de
sh
Ne
pa
lS
ri L
an
ka
S.N
.Q
ue
sti
on
Re
sp
on
se
Co
mm
en
tsR
es
po
ns
eC
om
me
nts
Re
sp
on
se
Co
mm
en
tsR
es
po
ns
eC
om
me
nts
(Ye
s =
1;
(Ye
s =
1;
(Ye
s =
1;
(Ye
s =
1;
No
= 0
)N
o =
0)
No
= 0
)N
o =
0)
55Is
cus
tom
s es
cort
req
uire
d0
00
for
all h
igh-
risk
good
s?
56A
re ti
me
l imits
impo
sed
0T
here
are
no
00
for
tran
sit g
oods
?ro
ads,
so
conn
ectiv
ityis
poo
r
57A
re c
urre
nt b
orde
r po
sts
and
10
0cu
stom
s of
fices
sui
tabl
ylo
cate
d fo
r ef
fect
ive
tran
sit
oper
atio
ns w
ithin
the
cust
oms
terr
itory
?
58A
re o
pera
ting
hour
s1
0co
ordi
nate
d w
ith o
ther
cust
oms
adm
inis
trat
ions
?
59A
re c
ontr
ols
and
1It
is la
rgel
y1˚
resp
onsi
bilit
ies
at b
orde
rat
the
leve
lpo
sts
coor
dina
ted
with
oth
erof
the
arm
ybo
rder
age
ncie
s?an
d B
SF
˚˚
60A
re c
ontr
ols
and
0A
utom
atio
n0
resp
onsi
bilit
ies
at b
orde
rm
aypo
sts
coor
dina
ted
with
oth
erim
prov
e th
eco
untr
ys
cust
oms
grou
ndad
min
istr
atio
ns?
situ
atio
n

130A
nn
ex
(co
nti
nu
ed)
˚˚
Ind
iaB
an
gla
de
sh
Ne
pa
lS
ri L
an
ka
S.N
.Q
ue
sti
on
Re
sp
on
se
Co
mm
en
tsR
es
po
ns
eC
om
me
nts
Re
sp
on
se
Co
mm
en
tsR
es
po
ns
eC
om
me
nts
(Ye
s =
1;
(Ye
s =
1;
(Ye
s =
1;
(Ye
s =
1;
No
= 0
)N
o =
0)
No
= 0
)N
o =
0)
Do
cu
me
nta
tio
n
61Is
a g
oods
dec
lara
tion
1N
ot1
requ
ired
for
all g
oods
inap
plic
able
as
Nep
al is
not
a tr
ansi
tco
untr
y
62Is
a s
tand
ardi
zed
cust
oms
11
Thi
s1
tran
sit d
ecla
ratio
n/do
cum
ent
docu
men
t is
in u
se?
used
for
good
s be
ing
mov
ed, v
iaIn
dia,
to a
ndfr
om a
ndN
epal
63H
ave
docu
men
tary
0N
ot0
requ
irem
ents
for
tran
sit
appl
icab
le a
sco
ordi
nate
d w
ith o
ther
Nep
al is
not
bord
er a
genc
ies?
a tr
ansi
tco
untr
y
64A
re d
ocum
enta
ry0
Not
0re
quire
men
ts fo
r tr
ansi
tap
plic
able
as
coor
dina
ted
with
oth
erN
epal
is n
otbo
rder
age
ncie
s?˚
˚˚
a tr
ansi
tco
untr
y

131
65A
re s
impl
ified
tran
sit
1S
o fa
r, on
lyN
ot0
decl
arat
ions
in u
se?
with
Bhu
tan
˚˚
˚ap
plic
able
as
Nep
al is
not
a tr
ansi
tco
untr
y
Se
cu
riti
es
an
d g
ua
ran
tee
s˚
66A
re g
oods
in tr
ansi
t rel
ieve
d0
In s
ome
Not
0of
the
paym
ent o
f dut
ies
case
s,ap
plic
able
as
and
taxe
s?tr
ader
s fa
ceN
epal
is n
otoc
troi
,a
tran
sit
impo
sed
coun
try
by lo
cal
auth
oriti
esat
Sta
te le
vel
˚˚
˚
67A
re a
ny fe
es a
nd c
harg
es0
On
holid
ays,
Not
0le
vied
in c
onne
ctio
n w
ithov
ertim
e is
appl
icab
le a
scu
stom
s tr
ansi
t?ch
arge
d˚
˚˚
Nep
al is
not
a tr
ansi
tco
untr
y
68H
as a
n in
tern
atio
nal
0M
utua
lN
ot0
guar
ante
e sy
stem
bee
ngu
aran
tees
appl
icab
le a
sim
plem
ente
d?ar
e pr
ovid
edN
epal
is n
otby
nat
iona
la
tran
sit
gove
rnm
ents
˚˚
˚co
untr
y
An
ne
x(c
on
tin
ued
)
˚˚
Ind
iaB
an
gla
de
sh
Ne
pa
lS
ri L
an
ka
S.N
.Q
ue
sti
on
Re
sp
on
se
Co
mm
en
tsR
es
po
ns
eC
om
me
nts
Re
sp
on
se
Co
mm
en
tsR
es
po
ns
eC
om
me
nts
(Ye
s =
1;
(Ye
s =
1;
(Ye
s =
1;
(Ye
s =
1;
No
= 0
)N
o =
0)
No
= 0
)N
o =
0)
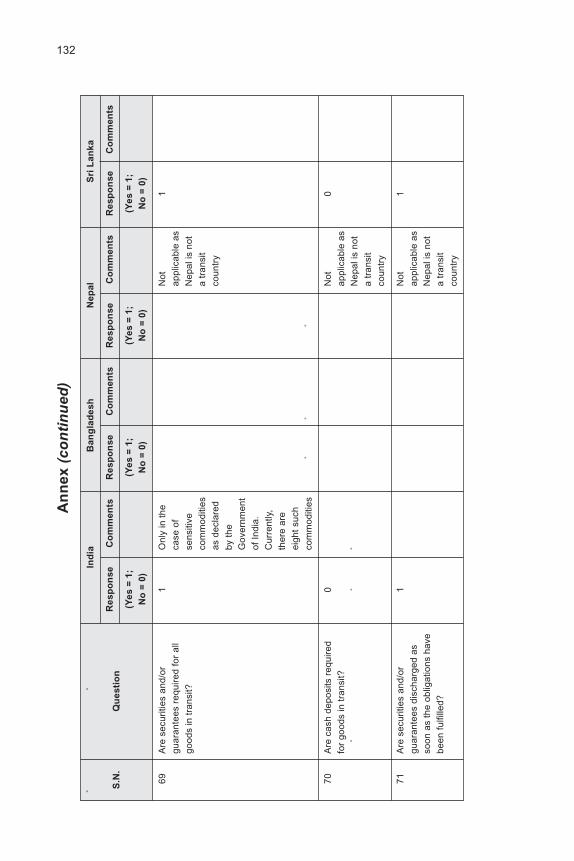
132A
nn
ex
(co
nti
nu
ed)
˚˚
Ind
iaB
an
gla
de
sh
Ne
pa
lS
ri L
an
ka
S.N
.Q
ue
sti
on
Re
sp
on
se
Co
mm
en
tsR
es
po
ns
eC
om
me
nts
Re
sp
on
se
Co
mm
en
tsR
es
po
ns
eC
om
me
nts
(Ye
s =
1;
(Ye
s =
1;
(Ye
s =
1;
(Ye
s =
1;
No
= 0
)N
o =
0)
No
= 0
)N
o =
0)
69A
re s
ecur
ities
and
/or
1O
nly
in th
eN
ot1
guar
ante
es r
equi
red
for
all
case
of
appl
icab
le a
sgo
ods
in tr
ansi
t?se
nsiti
veN
epal
is n
otco
mm
oditi
esa
tran
sit
as d
ecla
red
coun
try
by th
eG
over
nmen
tof
Indi
a.C
urre
ntly
,th
ere
are
eigh
t suc
hco
mm
oditi
es˚
˚˚
70A
re c
ash
depo
sits
req
uire
d0
Not
0fo
r go
ods
in tr
ansi
t?ap
plic
able
as
˚˚
˚N
epal
is n
ota
tran
sit
coun
try
71A
re s
ecur
ities
and
/or
1N
ot1
guar
ante
es d
isch
arge
d as
appl
icab
le a
sso
on a
s th
e ob
ligat
ions
hav
eN
epal
is n
otbe
en fu
lfille
d?a
tran
sit
coun
try

133A
nn
ex
(co
nti
nu
ed)
˚˚
Ind
iaB
an
gla
de
sh
Ne
pa
lS
ri L
an
ka
S.N
.Q
ue
sti
on
Re
sp
on
se
Co
mm
en
tsR
es
po
ns
eC
om
me
nts
Re
sp
on
se
Co
mm
en
tsR
es
po
ns
eC
om
me
nts
(Ye
s =
1;
(Ye
s =
1;
(Ye
s =
1;
(Ye
s =
1;
No
= 0
)N
o =
0)
No
= 0
)N
o =
0)
Ex
am
ina
tio
n
72A
re e
xam
inat
ions
for
good
s0
Cur
rent
ly,
Not
1S
elec
tivel
yin
tran
sit b
ased
on
the
ther
e is
no
appl
icab
le a
sap
plic
atio
n of
ris
ksc
ope
for
Nep
al is
not
asse
ssm
ent?
this
in th
ea
tran
sit
bila
tera
lco
untr
ytr
eatie
s˚
˚˚
Au
tho
rize
d t
rad
es
˚˚
˚˚
˚
73A
re s
impl
ified
pro
cedu
res
0S
ame
for
all
Not
1B
eing
esta
blis
hed
for
auth
oriz
edgo
ods.
appl
icab
le a
sim
plem
ente
dco
nsig
nors
invo
lved
in th
eH
owev
er,
Nep
al is
not
expe
r-tr
ansi
t pro
cedu
re?
Gov
ernm
ent
a tr
ansi
tim
enta
l lyis
wor
king
toco
untr
yim
plem
ent i
t.
Se
als
an
d f
as
ten
ing
˚˚
˚˚
˚
74A
re s
eals
and
iden
tific
atio
n1
Not
1m
arks
affi
xed
by fo
reig
nap
plic
able
as
cust
oms
acce
pted
for
Nep
al is
not
cust
oms
tran
sit o
pera
tions
?˚
a tr
ansi
tco
untr
y
Sou
rce:
Exp
ande
d by
the
aut
hor
from
ES
CA
P, 2
006,
A
n ex
plor
atio
n of
the
nee
d fo
r, a
nd c
ost
of s
elec
ted
trad
e fa
cilit
atio
n m
easu
res
in A
sia
and
the
Pac
ific
in th
e co
ntex
t of t
he W
TO
neg
otia
tions
, in
Stu
dies
in T
rade
and
Inve
stm
ent,
No.
57.

134
References
Asian Development Bank, 2006. Asian Development Outlook. Manila.
Bhattacharya, D. and S.S. Hossain, 2006. An evaluation of the need and cost of selectedtrade facilitation measures in Bangladesh: Implications for the WTO negotiationson trade facilitation , ARTNeT Working Paper Series, No. 9, April (rev. 8/06). ESCAP,Bangkok.
Chaturvedi, S., 2006. An evaluation of the need and cost of selected trade facilitationmeasures in India: Implications for the WTO negotiations , ARTNeT Working PaperSeries, No. 4, March. ESCAP, Bangkok.
Department of Commerce, 2006. WTO trade facilitation negotiations in Sri Lanka ,8 August 2006. Colombo.
ESCAP, 2003. Transit transport issues in landlocked and transit developing countries ,Landlocked Developing Countries Series, No. 1. United Nations, New York.
Hindustan Times, 2005. New transit routes for Bhutan trade , 30 September.
International Monetary Fund, 2006. Direction of Trade, 2006 . Washington, D.C.
Kumar, S. and N. Chowdhury, 2005. Trade and environment in the WTO: Negotiatingoptions for developing countries , RIS Discussion Paper, No. 103.
Lamy, P., 2006. Regional trade agreements: WTO Agreement on Regional TradeArrangements , available at www.wto.org. Geneva.
Mohanty, S.K., 2006. Mainstreaming Environment, Biodiversity and Development Concerns:Lessons for SAFTA in Trade, Biodiversity and Multilateral Environmental Agreements(MEAs): A Report of the South Asia Biodiversity Forum, RIS New Delhi.
Qureshi, N., 2006. Trade facilitation in Pakistan , country paper presented at the UNDP/ESCAP ARTNeT Consultative Meeting on Trade Facilitation and Regional Integration,17-18 August 2006, Bangkok.
Rajkarnikar, P.R., N.M. Maskay and S.R. Adhikari, 2006. The need for, and cost ofselected trade facilitation measures relevant to the WTO trade facilitationnegotiation: A case study of Nepal , ARTNeT Working Paper Series, No. 8, April(rev. 8/06). ESCAP, Bangkok.
Rehman, S.K., 2006. Implementation of WTO Customs Valuation Agreement in India.Directorate of Valuation (mimeograph). Mumbai.
RIS, 2004. Future directions of BIMSTEC: Towards a Bay of Bengal economic community .New Delhi, Research and Information System for Developing Countries.
Robertson, J.W., 2005. Facilitating regional trade under SAFTA in South Asian FreeTrade Area: Opportunities and challenges , United States Agency for InternationalDevelopment, Washington, D.C.
Senga, K., 2006. South Asian economies to emerge as Asia s new tigers , The HinduBusiness Line, 20 October.

135
Subramaniam, K., 2005. Domestic measures for simplification of procedures for clearanceof import/export cargo , presentation at the National Seminar on Trade Facilitation,Department of Commerce, Department of Revenue and UNCTAD, 18 August 2005.
Taneja, N., 2004. Trade Facilitation in the WTO: Implications for India , ICRIER WorkingPaper No. 128.
World Trade Organization, 2006. Communication from Pakistan, Negotiating Group onTrade Facilitation , TN/TF/W/135. Geneva.

137
IV. RULES OF ORIGIN IN EMERGING ASIA-PACIFIC
PREFERENTIAL TRADE AGREEMENTS: WILL PTAs
PROMOTE TRADE AND DEVELOPMENT?
By William E. James*
Introduction
Mapping of FTAs involving at least one Asian or Pacific developing country revealsthat 36 such agreements had been notified to WTO as of March 2006. A further 43agreements had entered into force but were not yet notified by that date while activenegotiations had been launched involving another 43 such agreements.1 In addition,many other bilateral deals are currently under study. The WTO has also reported thatglobally 197 preferential trade agreements (PTAs) have been formally notified by membercountries and that such agreements may well cover about half of the total world merchandisetrade.2
There is good reason to be concerned about the proliferation of bilateral tradeagreements, especially in the absence of progress at WTO. With a global tariff-cuttingformula covering manufactures (by far the bulk of global merchandize trade), and witha similar agreement to reduce agricultural tariffs, once the multilateral liberalization kicksin the margins of preference would be sharply eroded in PTAs. In addition, investmentflows would remain relatively undistorted as investors would take into account longer-termprospects for more open global trade. However, without a Doha Round of multilateralliberalization, stormy times may lie ahead for world trade. First, the United States and theEuropean Union may push ahead in attempting to sign bilateral deals with major partners(e.g., the Republic of Korea, Malaysia and India); these deals may be less benign than ifnegotiated with an active Doha Round in progress. Second, developing countries disappointedby the Doha Round s apparent demise may legitimately pursue cases against the UnitedStates and the European Union in WTO over illegal farm subsidies and other practices,which may create a less positive atmosphere for restarting negotiations. Third, developedand developing countries may be tempted into using antidumping measures (and other
* William E. James is a Visiting Fellow and Trade Advisor, Centre for Strategic and InternationalStudies, Jakarta. The author would like to thank Alex Rusnak and Andrew Briggs for their excellentresearch assistance in preparing this study. The author may be contacted at [email protected].
1 See Asian Development Bank, 2006, also Asia-Pacific Trade and Investment Agreement Databaseat www.unescap.org/tid/aptiad.
2 The actual volume and value of trade that utilizes preferential tariffs is not known with anyprecision, however. This chapter attempts to provide some evidence on this point in the case ofUnited States preference programmes involving developing countries for which accurate data areavailable (see section E of this chapter). The 197 PTAs referred to include only those notified and stillin force, as perhaps 100 other PTAs notified to GATT/WTO are defunct.

138
contingent forms of protection such as safeguards or countervailing duty measures) shouldthe global economy slow down, thus further burdening the system and creating moreanimosity among members.
In this chapter, the main concern is with particular aspects of the PTAs, i.e., therules of origin, which are essential components of PTAs in order to prevent trade deflectionand enforce tariff discrimination (James, 2005). In the absence of such rules, individualmembers of PTAs would lose tariff policy autonomy, as trade would flow through themember with the lower or lowest MFN tariff and would undercut revenue collection in themembers with higher MFN tariffs (Panagariya, 1999). It is also important to recognize thatgovernments regard rules of origin as not simply a technical device to enforce PTAs, butas vital commercial policy instruments (Vermulst and Waer, 1990; and James, 2005).
The failure of the contracting members of WTO to complete the negotiationsaimed at harmonizing non-preferential rules of origin, as provided for in the UruguayRound Agreement on Rules of Origin, is an indication not only of the technical complexityof such rules but is also a reflection of the members desire to retain autonomy in settingproduct-specific rules of origin in order to protect their industries. The refusal of contractingmembers to agree to even negotiate harmonization of preferential rules of origin confirmsthe reservation of such rules as commercial policy tools, and indeed as tools of protectionof special interests and sensitive products.
Section A examines the requirements of WTO for notification of PTAs and theinformation this conveys, particularly with regard to the nature of a PTA. Section Bprovides a review of newer Asia-Pacific PTAs and their rules of origin, including a systematicexploration of differences between rules of origin regimes followed by specific hub countries- China, Japan, the Republic of Korea, Singapore and Thailand. Section C provides someestimates of how PTA tariff discrimination may affect Asian-Pacific developing countries inkey industries, using United States trade and tariff data. Section D examines PTA utilizationrates in the United States case by groups of developing countries receiving preferentialtariff treatment and an attempt is made to correlate these with different rules of origin.Section E concludes the chapter with some proposals for discipline over preferential rulesof origin.
A. WTO requirements for preferential trade agreements
The central principle established in Article I of GATT 1947 is that of non-discriminationor what is referred to as MFN treatment. Trebilcock and Howse (1999) that:
Under Article I of the GATT, with respect to customs duties or charges ofany kind imposed by any country on any other member country, anyadvantage, favour, privilege, or immunity granted by such country to anyproduct originating in any other country shall be accorded immediately andunconditionally to a like product originating in the territories of all othermembers.
139
Exceptions to Article I are allowed under:
(a) GATT Article XXIV - territorial application - frontier traffic - Customs Unionsand free trade areas;
(b) The Enabling Clause - differential and more favourable treatment reciprocityand fuller participation of developing countries (established by the decision ofcontracting members on 28 November 1979 during the Tokyo Round); and
(c) The General Agreement on Trade in Services (GATS) Article V - EconomicIntegration, as part of the Uruguay Round Agreement.3
Each of these three routes of escape from Article I of GATT have requirements ofvarying degrees and it is those requirements that may allow the choice of escape route toconvey useful information about the nature of a PTA.
Specifically, Article XXIV requires:
(a) Notification of Customs Unions and free trade areas to WTO;
(b) Such agreements to cover substantially all (merchandise) trade;
(c) Products exempted from such agreements to be phased into the agreementwithin a reasonable length of time (usually considered to be, at most,10 years);
(d) such agreements are forbidden from increasing restrictions on the commerceof non-members relative to the barriers existing prior to the formation ofa PTA;
(e) Contracting members to take reasonable measures to ensure that subnationallevels of government and authorities within its territories observe the terms ofany such agreements.
Since 1994, many FTAs have included some coverage of services in addition togoods, and such agreements must include notification under Article V of GATS in additionto Article XXIV of GATT. The requirements of Article V include notification of such agreementsto the WTO Council for Trade in Services, substantial coverage of services sectors as wellas the elimination of discriminatory measures among the members of the agreement. Italso proscribes such agreements from raising the overall level of barriers in services tonon-members compared to the pre-existing situation (prior to the conclusion of the PTA).
The Enabling Clause provides for non-reciprocal preferences such as those underthe Generalized System of Preferences (GSP) that are granted to developing countries bydeveloped countries as well as providing for special, more favourable treatment for LDCs
3 Exceptions to Article I are explained in, for example, Trebilcock and Howse, 1999. The full texts ofthese articles and agreements can be downloaded from the WTO homepage at http://www.wto.org/
140
within any agreements. The Enabling Clause is aimed at encouraging developing countriesamong the contracting members to enter into regional arrangements covering mutualreduction of tariffs or elimination of non-tariff measures on products imported from oneanother. Requirements are lighter than under GATT Article XXIV - notification of agreementsto WTO, including consultations with any contracting member with regard to any difficultythat may arise from such arrangements. The Clause specifies that developed countrieswill not expect reciprocation by developing countries and that such an arrangement will notcreate any impediment to the elimination of tariffs or other restrictions on trade on an MFNbasis.
The choice of notifying PTAs under the Enabling Clause as opposed to GATTArticle XXIV is available to any reciprocal agreement involving two or more developingcountry partners. Such a notification usually conveys the information that there are substantialproduct exemptions in the agreement and that sensitive products are likely to be excludedaltogether. Furthermore, the rules and institutional arrangements for the implementationof such light agreements may be presumed to be weak or ill-defined. In the area of rulesof origin, PTAs are often vague compared with agreements notified under Article XXIV.Margins of preference are also frequently much more limited than under full-blown freetrade agreements, implying that such agreements may have far less actual impact ontrade flows (whether in terms of trade creation or of trade diversion).
Non-reciprocal agreements between developed and developing countries andbetween developed countries and LDCs are potentially of greater consequence thanreciprocal agreements among developing countries because of the size of the market andimprovement in market access implied. However, the ability of developing countries totake advantage of non-reciprocal agreements may also be a function of the degree ofgenerosity implicit in the rules of origin, as will be seen below.
B. Proliferation of PTAs in Asia and the Pacific,
and rules of origin
In mid-2003, former WTO Director-General Supachai Panitchpakdi commissioneda study entitled The future of the WTO: Addressing institutional challenges in the newMillennium (World Trade Organization Consultative Board, 2004, hereafter referred to asthe Sutherland Report ). The study was chaired by Peter Sutherland, who wrote the
report together with seven other eminent trade experts.4 The Sutherland Report makesthe following observation in the chapter 2, The erosion of non-discrimination :
The choice of unconditional MFN as the defining principle of the GATTreflected widespread disillusionment with the growth of protectionism andespecially of bilateral arrangements during the inter-war period. ...key politicalleaders as well as most students of trade concluded that MFN, and its
4 J. Bhagwati, K. Botchwey, N. FitzGerald, K. Hamada, J. Jackson, C. Lafer and T. de Montbrial.
141
attendant non-discrimination, was the best way to organize internationaltrade. ...Yet nearly five decades after the founding of the GATT, MFN is nolonger the rule; it is almost the exception. Certainly, much trade betweenmajor economies is conducted on an MFN basis. However, what has beentermed the spaghetti bowl of Customs Unions, common markets, regionaland bilateral free trade areas, preferences and an endless assortment ofmiscellaneous trade deals has almost reached the point where MFN treatmentis exceptional treatment. Certainly the term might now better be defined asLFN, least favoured nation treatment.
The Sutherland Report held out the hope that WTO could eventually reduce MFNtariffs to zero as a means of mitigating the potentially harmful effect of the proliferation ofPTAs; however, this hope has been dashed by the collapse of the Doha Round. A secondline of defence against the burgeoning PTAs identified in the Sutherland Report is througha clarification of Article XXIV and a better-organized means of administering its provisions.This is a polite way of stating that it is high time to begin serious enforcement of therequirements of Article XXIV (and similarly, Article V of GATS). However, it is less clearwhether or not this line of defence could be activated without a successful conclusion tothe Doha Round.5
Recent advances in modelling PTAs have shown that membership in PTAs makesmember countries less willing to liberalize MFN tariffs on the subset of goods thata country imports under a PTA (called PTA goods) than for non-PTA goods. It andempirically verifies this result in the case of the United States membership in NAFTA andother preference programmes including the Andean Trade Promotion and Drug EradicationAct (ATPDA), Caribbean Basin Initiative (CBI) and GSP.6 The MFN tariffs worldwide onPTA goods may remain higher than otherwise and worldwide PTAs may make countriesless willing to engage in multilateral trade liberalization. It is important to recognize that ifthis effect can be confirmed empirically it implies that PTAs violate the requirement thatany PTA (waiving Article I) must not constitute an impediment to lowering tariffs on anMFN basis, as is pointed out in Limao (2006).
As is shown in the quotation above, the Sutherland Report identifies the spaghettibowl effect of the proliferation of PTAs and even criticizes restrictive rules of origin inPTAs such as the Generalized System of Preferences. However the Sutherland Reportstops short of directly commenting on the issue of preferential rules of origin or of suggestingthat such rules of origin be brought under WTO/GATT disciplines. One reason is perhapsthe difficulties that have been experienced in the long-stalled attempt to harmonize and
5 Immediately before the collapse of the Doha Round, WTO Director-General Pascal Lamy on10 July 2006 welcomed a new WTO agreement on RTAs that was aimed at improving transparencyand consistency of RTAs with GATT Article XXIV and GATS Article V. The agreement was meant to bepart of the rules component of the Doha Round Agreement, arrived at by the Negotiating Group onRules. See the WTO homepage at http://www.wto.org/english/news_e/rta_july06_e.htm
6 See Limao, 2006.
142
further discipline non-preferential rules of origin.7 It is also true that contracting membersvetoed previous efforts to compose a working group on preferential rules of origin andwere content with a non-binding statement on preferential rules of origin in GATT 1994(the Uruguay Round Agreement).
Detailed information on recently notified PTAs is provided by WTO on its websitehomepage. Agreements notified under Article XXIV and Article V (GATS) provide muchmore detailed information than those notified under the Enabling Clause. Recentagreements involving at least one ESCAP member country were examined and details ofagreements, including chapters covering rules of origin and detailed annexes containingproduct-specific rules of origin, were obtained for FTAs involving Asia-Pacific hub countries(defined to include China, Japan, the Republic of Korea, Singapore and Thailand). Atleast two agreements involving each hub could be obtained in detail and these serve asthe basis for tables 1-5, which summarize rules of origin provisions in each agreement.The focus for the purposes of this study was to examine rules of origin for manufacturedproducts, as they are more important and complex than for agricultural products and rawmaterials where the wholly obtained criterion is sufficient to confer origin. For manufacturedgoods, rules of origin may be of three basic types:
(a) A change in tariff heading (CTH) rule defined at the six-digit HS level;
(b) A value-added (VA) rule, usually defined as a minimum percentage of regionalvalue content necessary to confer origin or by a maximum amount ofnon-originating content allowed in order to confer origin;
(c) A specified process (SP) rule defined as manufacturing operations thatmust be undertaken in order to confer origin. It is noteworthy that CTH andVA or SP rules are frequently combined in rules of origin in PTAs, despitethe general preference for using a CTH rule in the Uruguay Round Agreementon Rules of Origin.8
The purpose of examining in detail the rules of origin in recent Asian-Pacific PTAsin this chapter is to determine the internal consistency of rules of origin within each hubas well as between hubs. The internal consistency of rules of origin would simplify mattersshould spoke countries in a hub (e.g., Hong Kong, China, and Macao, China) wish to forman FTA. Consistency of rules of origin across major trading hubs would simplify theprocess of establishing a region-wide FTA - an Asian Free Trade Agreement. Each hubcountry is taken in turn.
7 See James, 2005, and Imagawa and Vermulst, 2005 for detailed accounts of the negotiations onnon-preferential rules of origin.
8 A CTH standard was established for non-preferential rules of origin, with the use of a change intariff sub-heading (CTSH) rule in instances where assembly was sufficient to confer origin wherenecessary. See James, 2005, and Imagawa and Vermulst, 2005 for a discussion on this issue.
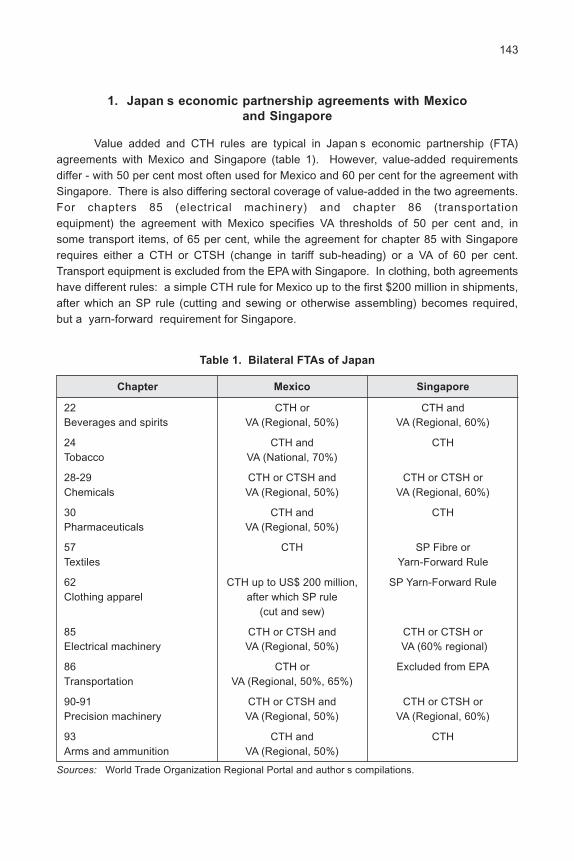
143
1. Japan s economic partnership agreements with Mexico
and Singapore
Value added and CTH rules are typical in Japan s economic partnership (FTA)agreements with Mexico and Singapore (table 1). However, value-added requirementsdiffer - with 50 per cent most often used for Mexico and 60 per cent for the agreement withSingapore. There is also differing sectoral coverage of value-added in the two agreements.For chapters 85 (electrical machinery) and chapter 86 (transportationequipment) the agreement with Mexico specifies VA thresholds of 50 per cent and, insome transport items, of 65 per cent, while the agreement for chapter 85 with Singaporerequires either a CTH or CTSH (change in tariff sub-heading) or a VA of 60 per cent.Transport equipment is excluded from the EPA with Singapore. In clothing, both agreementshave different rules: a simple CTH rule for Mexico up to the first $200 million in shipments,after which an SP rule (cutting and sewing or otherwise assembling) becomes required,but a yarn-forward requirement for Singapore.
Table 1. Bilateral FTAs of Japan
Chapter Mexico Singapore
22 CTH or CTH andBeverages and spirits VA (Regional, 50%) VA (Regional, 60%)
24 CTH and CTHTobacco VA (National, 70%)
28-29 CTH or CTSH and CTH or CTSH orChemicals VA (Regional, 50%) VA (Regional, 60%)
30 CTH and CTHPharmaceuticals VA (Regional, 50%)
57 CTH SP Fibre orTextiles Yarn-Forward Rule
62 CTH up to US$ 200 million, SP Yarn-Forward RuleClothing apparel after which SP rule
(cut and sew)
85 CTH or CTSH and CTH or CTSH orElectrical machinery VA (Regional, 50%) VA (60% regional)
86 CTH or Excluded from EPATransportation VA (Regional, 50%, 65%)
90-91 CTH or CTSH and CTH or CTSH orPrecision machinery VA (Regional, 50%) VA (Regional, 60%)
93 CTH and CTHArms and ammunition VA (Regional, 50%)
Sources: World Trade Organization Regional Portal and author s compilations.
144
This is a case of rules of origin providing less favourable treatment for an Asianpartner compared to a non-regional partner and raises the issue of whether such discriminationmight stymie the efficient development of regional production networks within Asia. Fortobacco products (chapter 24), the value-added threshold in the agreement with Mexico is70 per cent and in this case the treatment of Mexico is less favourable than Singapore.Only national content is counted towards meeting the 70 per cent content requirement -perhaps reflecting the lobbying of Japan s tobacco industry.
2. Bilateral FTAs of the Republic of Korea with Chile and Singapore
The Republic of Korea has concluded two bilateral FTAs (table 2) and these tendto specify value-added and CTH rules in tandem. It is also important to note that theRepublic of Korea-Singapore FTA includes a 10-year period for tariff reductions by theRepublic of Korea in clothing (chapters 61-62) and over a 5-year period for many textileproducts (chapters 50-60). Value-added percentages vary according to methodology orformula used in calculations (45 per cent minimum for build-down formula versus 30 percent for build-up formula) in the agreement with Chile. The value-added requirement ishigher in the agreement with Singapore, where typically a minimum of 55 per cent isrequired. Specified processes (cutting and sewing operations) are required for clothingin addition to CTH and VA rules. The stricter rules of origin coupled with the 10-yearphase-out of Republic of Korea tariffs implies discrimination against Singapore comparedwith Chile and again is not a good precedent for establishment of efficient Asianproduction networks.
3. Bilateral FTAs of China
China has concluded bilateral FTAs with two territories that are part of China butwhich remain as separate customs territories, i.e., Hong Kong, China, and Macao, China.These Closer Economic Partnership Agreements appear to have limited coverage inthat agricultural products are not extensively granted duty-free access in the Chinesemarket. In addition, coverage is much less in the agreement with Macao, China than inthe Hong Kong, China agreement, reflecting the differences in industrial developmentbetween the two territories. For most industrial products, a specified process test isused as the main rule of origin without any value-added or content requirement, as in thecase of textiles and clothing. For clothing, the process is sewing or otherwise assemblingthe garment. Where value-added is used as a rule (in some machinery and electronicsproducts), the amount is consistent at 30 per cent.
4. Singapore s FTAs
Singapore has the most extensive network of FTAs of any country in theAsia-Pacific region (table 4). Not only is Singapore a member of the Association ofSoutheast Asian Nations (ASEAN) and its 10-member AFTA, and with ASEAN plusagreements with China, the Republic of Korea, Japan and India in the process of negotiations,it has also struck out on its own, reaching numerous bilateral free trade agreements

145
Table 2. Bilateral FTAs of the Republic of Korea
Chapter Chile Singapore
28 CTH CTHInorganic chemicals VA (National, 45%, 30%)
29 CTH CTHOrganic chemicals VA (Regional, 30%) * Detailed rules of origin
30 CTH CTHPharmaceuticals
31 CTH CTHFertilizers VA (National, 45%, 30%)
32 CTH CTHDyes VA (Regional, 45%, 30%)
38 CTH CTHMisc. chemical products VA (Regional, 45%, 30%) VA (Regional, 55%)
61-62 SP CTHClothing VA (Regional, 55%)
SP
64 CTH CTHFootwear VA (Regional, 45%, 30%)
84 CTH CTHMachinery VA (Regional, 45%, 30%) VA (Regional 55%)
* Detailed rules of origin
85 CTH CTHElectrical equipment VA (Regional, 45%, 30%) VA (Regional, 55%)
86 CTH CTHTransportation VA (Regional, 55%)
87 CTH CTHVehicles VA (Regional, 45%, 30%) VA (Regional, 55%)
89 CTH CTHShips and boats VA (Regional, 45%, 30%) VA (Regional, 55%)
93 CTH CTHArms and ammunition VA (Regional, 45%, 30%)
Sources: World Trade Organization Regional Portal and author s compilations.
including with Japan and the Republic of Korea (tables 1 and 2 above). Singapore hasconcluded three additional FTAs that have been notified and are extensively documentedon the WTO homepage, including agreements with the United States, the European FreeTrade Association (Iceland, Liechtenstein, Norway and Switzerland) and the Trans-PacificSpecial Economic Partnership (SEP) linking Singapore with New Zealand, Chile and BruneiDarussalam (also an ASEAN and AFTA member).

146
Table 3. Bilateral FTAs of China
Product Hong Kong, China Macao, China
Textiles CTH CTH
Clothing apparel SP SP
Machinery CTH CTHVA (National, 30%) VA (National, 30%)
SP SP
Chemical products CTH CTHSP VA (National, 30%)
Electronics CTH CTHVA (National, 30%) VA (National, 30%)
SP SP
Pharmaceuticals CTH Not accessedSP
Sources: World Trade Organization Regional Portal and author s compilations.
Table 4. Singapore s preferential trade agreements
Chapter United States Trans-Pacific SEP EFTA
1-2 CTH CTH CTHMeat and animals WO
3 CTH CTHFish and crustaceans SP
4-8 CTH CTH WODairy, SPfruit and vegetables
28 CTH CTH CTHInorganic and SP SP VA 50%organic chemicals * Detailed rules SP
of origin
30 CTH CTHPharmaceuticals SP
32-33 CTH CTH CTHDyes SP VA (Regional, 45%) VA 50%
SP
39 CTH CTH CTHPlastics SP VA (Regional, 45%) VA 50%
SP SP
61-62 CTH CTH CTHClothing SP VA (Regional, 50%) VA 50%
SP

147
63 CTH CTH VA 50%Textiles SP VA (Regional, 50%) SP
64 CTH CTH VA 40%Footwear VA (Regional, 55%) VA (Regional, 50%)
74-80 CTH CTH CTHMetals VA (Regional, 45%) VA 50%
84 CTH CTH CTHMachinery VA (Regional, VA (Regional, 45%) VA 50%
45%, 35% )
85 CTH CTH CTHElectrical equipment VA (Regional, VA (Regional, 45%) VA 50%
45%, 35%)
86 CTH CTH CTH
Vehicles VA (Regional, 30%) VA (Regional, 45%) VA 50%
88 CTH CTH CTHAircraft VA (Regional,
45%, 35%)
89 CTH CTH CTHShips VA (Regional, VA (Regional, 45%) VA 50%
45%, 35%)
93 CTH CTH VA 50%Arms and VA (Regional, VA (Regional, 45%)ammunition 45%, 35%)
Sources: World Trade Organization Regional Portal and author s compilations.
Table 4. (continued)
Chapter United States Trans-Pacific SEP EFTA
The United States-Singapore FTA is the most detailed, with nearly 300 pages ofproduct-specific rules of origin. In the textiles and clothing category, complex rules oforigin were adopted despite the fact that Singapore is a very minor producer and exportslittle of these products. The FTA with the United States provides some flexibility in allowingchoice between build-up (45 per cent) and build-down (35 per cent) to calculate regionalcontent. In vehicles (chapter 86), a less stringent 30 per cent build-up content rule isapplied. The four-party Trans-Pacific SEP Free Trade Area has less stringent rules oforigin than the other two agreements shown in table 4. However, in the clothing chapters,the rules are inclusive of a CTH, VA of 50 per cent minimum, and cutting and sewingoperations. The FTA with the EFTA countries (Iceland, Liechtenstein, Norway and Switzerland)provides mainly for a maximum non-originating content rule of 50 per cent (40 per cent forfootwear), and is generally less detailed in the clothing chapters than is the case with theother agreements. The value-added rules are different between the three agreements inspecifics, even though the amounts do not vary much in principle.

148
5. Thailand s bilateral FTAs
Apart from Singapore, Thailand has been the most prolific Asian participant inbilateral FTAs even though it is also a charter member of ASEAN and AFTA. However,Thailand s free trade negotiations with the United States and other partners have beenbogged down as a result of the country s recent political problems. Disputes over coverageof agriculture with Japan (Thailand is a major rice exporter and Japan has very highrice trade barriers) and the patenting of pharmaceutical products, in which the UnitedStates drug industry has strong interest, have slowed the conclusion of these bilateralnegotiations.9 Nonetheless, Thailand has successfully concluded bilateral FTAs with bothCER member countries, Australia and New Zealand (table 5). Both these FTAs have beennotified to WTO and have entered into force.
The rules of origin are very detailed in the agreements with Australia and NewZealand, particularly with the former (286 pages of product specific rules). Despite thefact that Australia and New Zealand have their own common rules of origin under CER,they have adopted different approaches in their bilateral agreements with Thailand.Australia has made extensive use of a VA rule in many manufacturing sectors and hasadopted higher VA rules for textiles and clothing than New Zealand. This indicates thatharmonization and consistency in rules of origin are not a practical priority in bilateral tradenegotiations. If CER does not follow a common template, then who will?
The review of product-specific rules of origin for manufactured goods in FTAsentered into recently by major Asian hub economies reveals that rules of origin are differentacross hubs. Rules of origin are highly idiosyncratic even within agreements entered intoby a hub country. The range of VA rules (from 30 per cent at the low end to 70 per cent atthe high end) masks even more variation when one examines rules of origin on a product-by-product basis. For example, in textiles there are maximum allowances for non-originatingyarn and fabric of 10 per cent of weight in some of these agreements in addition to theoverall regional content requirements. Rules of origin in these agreements may not beharmonized across hubs, let alone within hubs. Hence, the spaghetti bowl problemappears to be very serious and will make it extremely difficult for businesses to takeadvantage of these agreements without incurring significant compliance costs.
C. Tariff discrimination resulting from PTAs: Some examples
from industries of interest to developing countries
In a world of very low MFN tariff rates, and few or no non-tariff border barriers totrade, rules of origin would become fairly benign. They would be mainly used to determinedirection of trade statistics and enforce contingent measures (prevention of circumventionof antidumping measures) as well as a way to regulate practices such as trans-shipment.However, one of the most important features of PTAs is the margin of tariff preference they
9 An FTA between Japan and Thailand was finally signed in April 2007, however. See APTIAD fordetails.

149
Table 5. Thailand s bilateral free trade agreements
Chapter Australia New Zealand
1-2 CTH CTHMeat and animals
3 CTH CTHFish and crustaceans SP WO
4-8 CTH CTHDairy, fruit and vegetables * Detailed rules of origin
28 CTH CTHInorganic and organic SPchemicals
30 CTH CTHPharmaceuticals
32-33 CTH CTHDyes SP
39-40 CTH CTHPlastics and rubber SP WO
58 CTH CTHTextiles VA (Regional, 55%) VA (Regional, 50%)
61-62 CTH CTHClothing VA (Regional, 55%) VA (Regional, 50%)
SP
64 CTH CTHFootwear VA (Regional, 55%)
74-80 CTH CTHMetals VA (Regional, 45%-50%)
84 CTH CTHMachinery VA (Regional, 40%-45%)
85 CTH CTHElectrical equipment VA (Regional, 40%-45%)
86 CTH CTHTransportation VA (Regional, 45%)
87 CTH CTHVehicles VA (Regional, 45%)
88 CTH CTHAircraft VA (Regional, 45%)
89 CTH CTHShips VA (Regional, 45%)
93 CTH CTHArms and ammunition VA (Regional, 45%)
Sources: World Trade Organization Regional Portal and author s compilations.
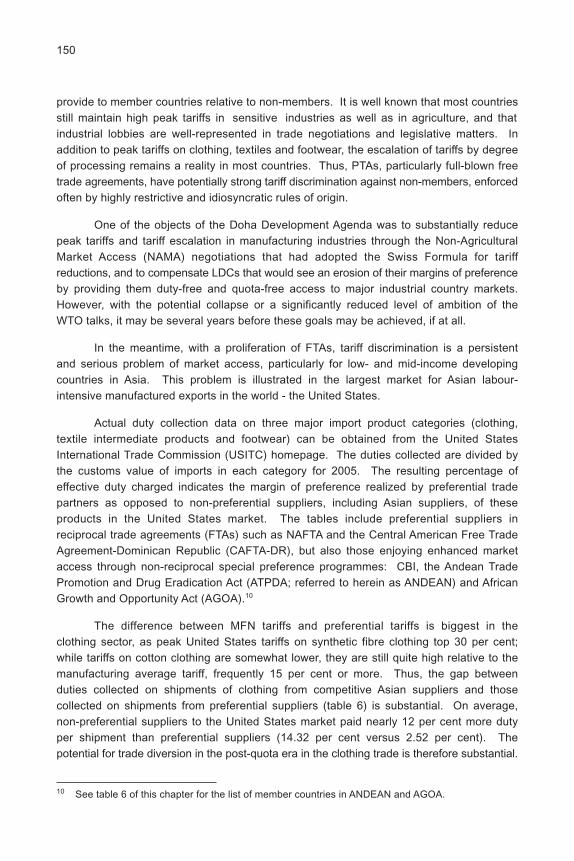
150
provide to member countries relative to non-members. It is well known that most countriesstill maintain high peak tariffs in sensitive industries as well as in agriculture, and thatindustrial lobbies are well-represented in trade negotiations and legislative matters. Inaddition to peak tariffs on clothing, textiles and footwear, the escalation of tariffs by degreeof processing remains a reality in most countries. Thus, PTAs, particularly full-blown freetrade agreements, have potentially strong tariff discrimination against non-members, enforcedoften by highly restrictive and idiosyncratic rules of origin.
One of the objects of the Doha Development Agenda was to substantially reducepeak tariffs and tariff escalation in manufacturing industries through the Non-AgriculturalMarket Access (NAMA) negotiations that had adopted the Swiss Formula for tariffreductions, and to compensate LDCs that would see an erosion of their margins of preferenceby providing them duty-free and quota-free access to major industrial country markets.However, with the potential collapse or a significantly reduced level of ambition of theWTO talks, it may be several years before these goals may be achieved, if at all.
In the meantime, with a proliferation of FTAs, tariff discrimination is a persistentand serious problem of market access, particularly for low- and mid-income developingcountries in Asia. This problem is illustrated in the largest market for Asian labour-intensive manufactured exports in the world - the United States.
Actual duty collection data on three major import product categories (clothing,textile intermediate products and footwear) can be obtained from the United StatesInternational Trade Commission (USITC) homepage. The duties collected are divided bythe customs value of imports in each category for 2005. The resulting percentage ofeffective duty charged indicates the margin of preference realized by preferential tradepartners as opposed to non-preferential suppliers, including Asian suppliers, of theseproducts in the United States market. The tables include preferential suppliers inreciprocal trade agreements (FTAs) such as NAFTA and the Central American Free TradeAgreement-Dominican Republic (CAFTA-DR), but also those enjoying enhanced marketaccess through non-reciprocal special preference programmes: CBI, the Andean TradePromotion and Drug Eradication Act (ATPDA; referred to herein as ANDEAN) and AfricanGrowth and Opportunity Act (AGOA).10
The difference between MFN tariffs and preferential tariffs is biggest in theclothing sector, as peak United States tariffs on synthetic fibre clothing top 30 per cent;while tariffs on cotton clothing are somewhat lower, they are still quite high relative to themanufacturing average tariff, frequently 15 per cent or more. Thus, the gap betweenduties collected on shipments of clothing from competitive Asian suppliers and thosecollected on shipments from preferential suppliers (table 6) is substantial. On average,non-preferential suppliers to the United States market paid nearly 12 per cent more dutyper shipment than preferential suppliers (14.32 per cent versus 2.52 per cent). Thepotential for trade diversion in the post-quota era in the clothing trade is therefore substantial.
10 See table 6 of this chapter for the list of member countries in ANDEAN and AGOA.
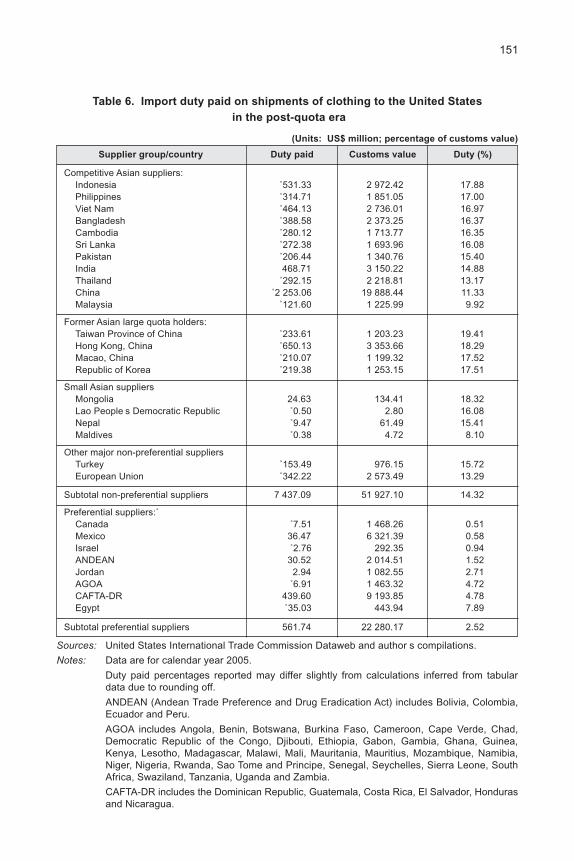
151
Table 6. Import duty paid on shipments of clothing to the United States
in the post-quota era
(Units: US$ million; percentage of customs value)
Supplier group/country Duty paid Customs value Duty (%)
Competitive Asian suppliers:Indonesia ˚531.33 2 972.42 17.88Philippines ˚314.71 1 851.05 17.00Viet Nam ˚464.13 2 736.01 16.97Bangladesh ˚388.58 2 373.25 16.37Cambodia ˚280.12 1 713.77 16.35Sri Lanka ˚272.38 1 693.96 16.08Pakistan ˚206.44 1 340.76 15.40India 468.71 3 150.22 14.88Thailand ˚292.15 2 218.81 13.17China ˚2 253.06 19 888.44 11.33Malaysia ˚121.60 1 225.99 9.92
Former Asian large quota holders:Taiwan Province of China ˚233.61 1 203.23 19.41Hong Kong, China ˚650.13 3 353.66 18.29Macao, China ˚210.07 1 199.32 17.52Republic of Korea ˚219.38 1 253.15 17.51
Small Asian suppliersMongolia 24.63 134.41 18.32Lao People s Democratic Republic ˚0.50 2.80 16.08Nepal ˚9.47 61.49 15.41Maldives ˚0.38 4.72 8.10
Other major non-preferential suppliersTurkey ˚153.49 976.15 15.72European Union ˚342.22 2 573.49 13.29
Subtotal non-preferential suppliers 7 437.09 51 927.10 14.32
Preferential suppliers:˚Canada ˚7.51 1 468.26 0.51Mexico 36.47 6 321.39 0.58Israel ˚2.76 292.35 0.94ANDEAN 30.52 2 014.51 1.52Jordan 2.94 1 082.55 2.71AGOA ˚6.91 1 463.32 4.72CAFTA-DR 439.60 9 193.85 4.78Egypt ˚35.03 443.94 7.89
Subtotal preferential suppliers 561.74 22 280.17 2.52
Sources: United States International Trade Commission Dataweb and author s compilations.
Notes: Data are for calendar year 2005.
Duty paid percentages reported may differ slightly from calculations inferred from tabulardata due to rounding off.
ANDEAN (Andean Trade Preference and Drug Eradication Act) includes Bolivia, Colombia,Ecuador and Peru.
AGOA includes Angola, Benin, Botswana, Burkina Faso, Cameroon, Cape Verde, Chad,Democratic Republic of the Congo, Djibouti, Ethiopia, Gabon, Gambia, Ghana, Guinea,Kenya, Lesotho, Madagascar, Malawi, Mali, Mauritania, Mauritius, Mozambique, Namibia,Niger, Nigeria, Rwanda, Sao Tome and Principe, Senegal, Seychelles, Sierra Leone, SouthAfrica, Swaziland, Tanzania, Uganda and Zambia.
CAFTA-DR includes the Dominican Republic, Guatemala, Costa Rica, El Salvador, Hondurasand Nicaragua.

152
Furthermore, some of the Asian suppliers may move into the preferential camp (particularlythe Republic of Korea and Malaysia, and possibly Thailand) and this could increase thedifficulties facing suppliers without FTA. In particular, Asian suppliers with low-cost laboursuch as Bangladesh, Cambodia, Indonesia and Viet Nam face severe tariff discriminationin the United States market. Access to the United States market via GSP may be oneavenue for reducing the tariff discrimination inherent in bilateral United States tradeprogrammes and special non-reciprocal PTAs. This issue is examined in section E.
For intermediate textile products, United States MFN tariffs are lower than forclothing but are still frequently in double-digits, leading to a substantial margin of preferencefor members of preferential arrangements. Asian yarns and fabrics directly compete withUnited States producers of yarn and fabric in the United States market but must overcomea 10 per cent average effective duty rate versus United States producers (table 7). Theyalso compete with large preferential suppliers such as Mexico and Canada, who effectivelypay a miniscule duty rate of about one-quarter of 1 per cent and thus have a margin ofpreference of nearly 10 per cent over non-preferential suppliers.
Moreover, rules of origin particularly target intermediate textile products in order toprotect the United States textile sector and provide strong incentives for preferential suppliersto use United States yarns and fabrics. This is particularly the case with smaller preferentialsuppliers, such as those in Central America, as they lack textile spinning and weavingcapacities. United States yarn and fabric can enter these markets duty-free for processinginto ready-made garments, which then enter the United States market duty-free. UnderCAFTA-DR, Mexican suppliers of fabric also may enter these six markets duty-free forprocessing, and then can enter the United States market as garments, duty-free. Thus,the United States hub and spoke system doubly discriminates against non-preferentialsuppliers.
Footwear is an important export product for several Asian countries, particularlyChina. However, footwear shipments to the United States face severe tariff discrimination,and preferential suppliers enjoy a margin of preference averaging 10 per cent (table 8).This is not enough of a deterrent to prevent China from attaining a dominant share of themarket. However, the tariff discrimination requires Chinese suppliers to cut costs to thevery bone.11 Other big Asian suppliers face even worse tariff discrimination than China,with Indonesia and Viet Nam paying 11 per cent more duty per shipment than preferentialsuppliers.
11 For example, the producer of a pair of boots that retail for US$ 49.99 in the United States receivesonly US$ 15.30, including a profit of US$ 0.65 and wage costs of US$ 1.30. The United States retailerearns US$ 3.46 per pair (excluding tax and interest payments). See T. Fuller, Trade imbalance masksa struggle to get by: Boots made in China but money made in US , International Herald Tribune, 4August 2006.

153
Table 7. Import duty paid on shipments of textiles to the United States
in the post-quota era
(Units: US$ million; percentage of customs value)
Supplier group/country Duty paid Customs value Duty (%)
Competitive Asian suppliers:˚Indonesia 6.64 54.98 12.07Malaysia 1.82 15.19 11.98Thailand 7.42 65.76 11.28Viet Nam 0.74 6.69 11.05China 58.99 587.47 10.04Pakistan 27.91 294.91 9.47India 10.70 159.42 6.71
Former Asian large quota holdersTaiwan Province of China 26.95 213.92 12.60Republic of Korea 33.49 284.60 11.77Hong Kong, China 2.34 24.92 9.38
Major non-Asian non-preferential suppliersTurkey 10.33 110.85 9.32Italy 23.81 272.78 8.73Brazil 1.42 19.78 7.17
Subtotal non-preferential suppliers 212.56 2 111.27 10.07
Major preferential suppliers ˚ ˚ ˚Mexico 0.05 197.53 0.02Canada 0.50 255.51 0.20Israel 0.03 18.43 1.68CAFTA-DR ˚0.33 7.13 4.56
Subtotal preferential suppliers 0.91 478.60 0.19
Sources: United States International Trade Commission Dataweb and author s compilations.
Notes: Data are for calendar year 2005.
Duty paid percentages reported may differ slightly from calculations inferred from tabulardata due to rounding off.
CAFTA-DR includes the Dominican Republic, Guatemala, Costa Rica, El Salvador, Hondurasand Nicaragua.
D. Impact of rules of origin on utilization of PTAs by
developing countries - the case of the United States
The United States provides preferential access to its market through several routes.The oldest and perhaps best known preference programme is GSP that is open to mostlow and lower-middle income developing countries and LDCs belonging to WTO, includingthose in Asia and the Pacific.12 In addition to GSP, the United States more recentlyprovided preferential access under a series of non-reciprocal preference programmes
12 The Asian Newly Industrialized Economies — Hong Kong, China, Republic of Korea, Singaporeand Taiwan Province of China — have all graduated from GSP. China is excluded from GSP under theterms of its WTO Accession Agreement with the United States.

154
Table 8. Import duty paid on shipments of footwear to the United States
(Units: US$ million; percentage of customs value)
Supplier group/country Duty paid Customs value Duty (%)
Competitive Asian suppliers:Indonesia 58.77 510.19 11.52Viet Nam 82.05 716.21 11.45Thailand 31.50 291.76 10.80China 1 289.72 12 654.22 10.19India 12.14 139.09 8.72
Asian Newly Industrialized Economies˚Taiwan Province of China 6.42 69.18 9.27Republic of Korea 4.10 45.33 9.05Hong Kong, China 5.07 52.49 9.65
Major non-Asian non-preferential suppliers˚Italy 114.45 1 137.05 10.07Brazil 98.39 1 019.20 9.65
Subtotal non-preferential suppliers 1 702.61 16 124.53 10.24
Major preferential suppliers˚Mexico 0.62 247.21 0.25ANDEAN 0.07 9.64 0.71Canada 0.12 93.57 0.12CAFTA-DR ˚0.44 151.04 0.29
Subtotal preferential suppliers 1.25 501.46 0.25
Sources: United States International Trade Commission Dataweb and author s compilations.
Notes: Data are for calendar year 2005.
Duty paid percentages reported may differ slightly from calculations inferred from tabulardata due to rounding off.
CAFTA-DR includes the Dominican Republic, Guatemala, Costa Rica, El Salvador, Hondurasand Nicaragua.
aimed at providing more generous access to small developing and least developedcountries. These include CBI that allows the countries of the Caribbean Basin region(excluding Cuba) access to the United States market for ready-made garments. Similarly,the United States has provided access to the countries of sub-Saharan Africa underAGOA. ANDEAN provides similar access to countries in South America cooperating withthe United States in efforts to eradicate illegal narcotics trade. For Middle Eastern countries,a special programme called the Qualified Industrial Zones (QIZ) also provides preferentialaccess to the United States market for clothing.
These agreements, like GSP, provide access that is limited (capped at a certainvolume of imports) after which MFN tariffs become applicable should shipments exceedthe agreed limits. Each of these programmes is enforced by a set of rules of origin orwhat might also be deemed rules of preference. Participation in the special programmeshas evolved into a process whereby the partner countries are eventually encouraged tonegotiate a bilateral FTA with the United States that involves reciprocation of preferentialtariff treatment and, in theory, more comprehensive access to the United States market.
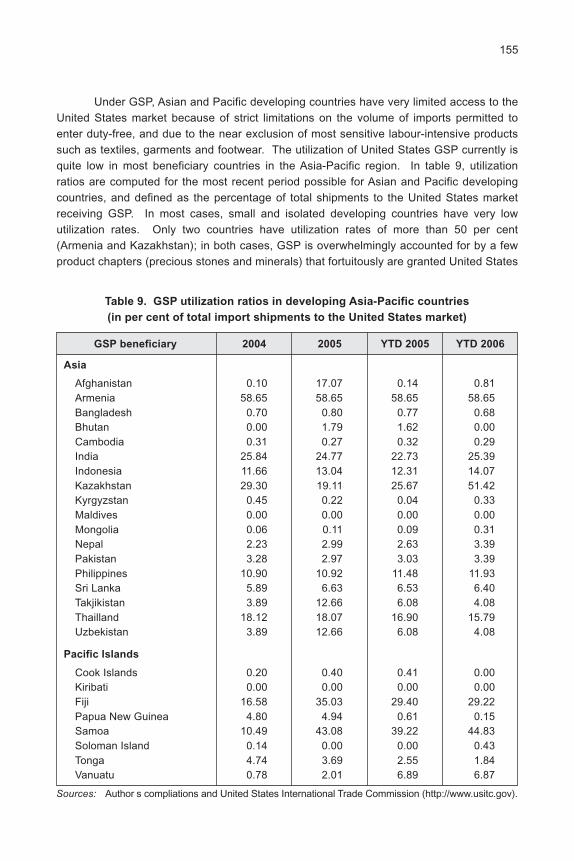
155
Under GSP, Asian and Pacific developing countries have very limited access to theUnited States market because of strict limitations on the volume of imports permitted toenter duty-free, and due to the near exclusion of most sensitive labour-intensive productssuch as textiles, garments and footwear. The utilization of United States GSP currently isquite low in most beneficiary countries in the Asia-Pacific region. In table 9, utilizationratios are computed for the most recent period possible for Asian and Pacific developingcountries, and defined as the percentage of total shipments to the United States marketreceiving GSP. In most cases, small and isolated developing countries have very lowutilization rates. Only two countries have utilization rates of more than 50 per cent(Armenia and Kazakhstan); in both cases, GSP is overwhelmingly accounted for by a fewproduct chapters (precious stones and minerals) that fortuitously are granted United States
Table 9. GSP utilization ratios in developing Asia-Pacific countries
(in per cent of total import shipments to the United States market)
GSP beneficiary 2004 2005 YTD 2005 YTD 2006
Asia
Afghanistan 0.10 17.07 0.14 0.81Armenia 58.65 58.65 58.65 58.65Bangladesh 0.70 0.80 0.77 0.68Bhutan 0.00 1.79 1.62 0.00Cambodia 0.31 0.27 0.32 0.29India 25.84 24.77 22.73 25.39Indonesia 11.66 13.04 12.31 14.07Kazakhstan 29.30 19.11 25.67 51.42Kyrgyzstan 0.45 0.22 0.04 0.33Maldives 0.00 0.00 0.00 0.00Mongolia 0.06 0.11 0.09 0.31Nepal 2.23 2.99 2.63 3.39Pakistan 3.28 2.97 3.03 3.39Philippines 10.90 10.92 11.48 11.93Sri Lanka 5.89 6.63 6.53 6.40Takjikistan 3.89 12.66 6.08 4.08Thailland 18.12 18.07 16.90 15.79Uzbekistan 3.89 12.66 6.08 4.08
Pacific Islands
Cook Islands 0.20 0.40 0.41 0.00Kiribati 0.00 0.00 0.00 0.00Fiji 16.58 35.03 29.40 29.22Papua New Guinea 4.80 4.94 0.61 0.15Samoa 10.49 43.08 39.22 44.83Soloman Island 0.14 0.00 0.00 0.43Tonga 4.74 3.69 2.55 1.84Vanuatu 0.78 2.01 6.89 6.87
Sources: Author s compliations and United States International Trade Commission (http://www.usitc.gov).
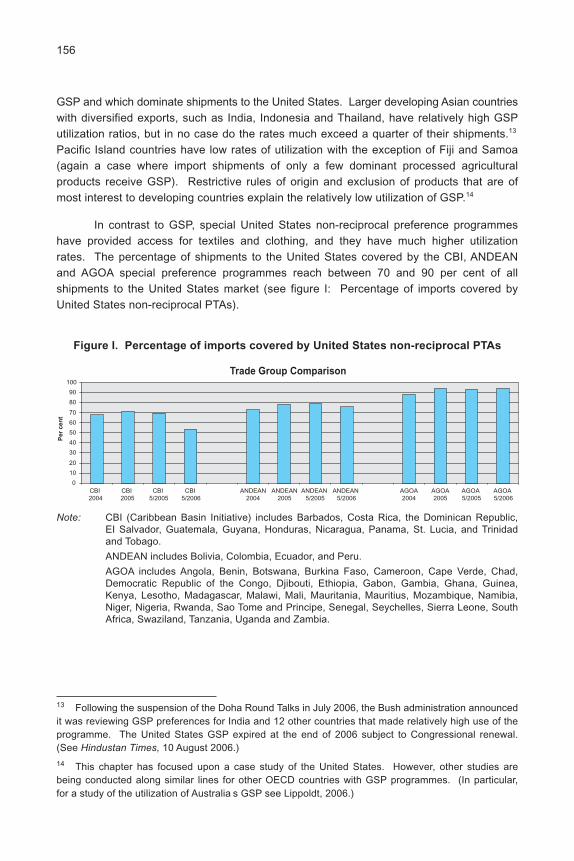
156
GSP and which dominate shipments to the United States. Larger developing Asian countrieswith diversified exports, such as India, Indonesia and Thailand, have relatively high GSPutilization ratios, but in no case do the rates much exceed a quarter of their shipments.13
Pacific Island countries have low rates of utilization with the exception of Fiji and Samoa(again a case where import shipments of only a few dominant processed agriculturalproducts receive GSP). Restrictive rules of origin and exclusion of products that are ofmost interest to developing countries explain the relatively low utilization of GSP.14
In contrast to GSP, special United States non-reciprocal preference programmeshave provided access for textiles and clothing, and they have much higher utilizationrates. The percentage of shipments to the United States covered by the CBI, ANDEANand AGOA special preference programmes reach between 70 and 90 per cent of allshipments to the United States market (see figure I: Percentage of imports covered byUnited States non-reciprocal PTAs).
Figure I. Percentage of imports covered by United States non-reciprocal PTAs
0
10
20
30
40
50
60
70
80
90
100
CBI2004
CBI2005
CBI5/2005
CBI5/2006
ANDEAN2004
ANDEAN2005
ANDEAN5/2005
ANDEAN5/2006
AGOA2004
AGOA2005
AGOA 5/2005
AGOA 5/2006
Pe
r c
en
t
Trade Group Comparison
Note: CBI (Caribbean Basin Initiative) includes Barbados, Costa Rica, the Dominican Republic,EI Salvador, Guatemala, Guyana, Honduras, Nicaragua, Panama, St. Lucia, and Trinidadand Tobago.
ANDEAN includes Bolivia, Colombia, Ecuador, and Peru.
AGOA includes Angola, Benin, Botswana, Burkina Faso, Cameroon, Cape Verde, Chad,Democratic Republic of the Congo, Djibouti, Ethiopia, Gabon, Gambia, Ghana, Guinea,Kenya, Lesotho, Madagascar, Malawi, Mali, Mauritania, Mauritius, Mozambique, Namibia,Niger, Nigeria, Rwanda, Sao Tome and Principe, Senegal, Seychelles, Sierra Leone, SouthAfrica, Swaziland, Tanzania, Uganda and Zambia.
13 Following the suspension of the Doha Round Talks in July 2006, the Bush administration announcedit was reviewing GSP preferences for India and 12 other countries that made relatively high use of theprogramme. The United States GSP expired at the end of 2006 subject to Congressional renewal.(See Hindustan Times, 10 August 2006.)
14 This chapter has focused upon a case study of the United States. However, other studies arebeing conducted along similar lines for other OECD countries with GSP programmes. (In particular,for a study of the utilization of Australia s GSP see Lippoldt, 2006.)
157
The relatively high ratio of preferential to total imports in these groups indicatesthat, without the preferential treatment, shipments to the United States would be muchsmaller than those realized. However, the United States also sets quantitative limits onshipments in a given United States fiscal year (1 October to 30 September) under theTrade and Development Act of 2002, which covers AGOA, the Caribbean Basin TradePartnership Act and ANDEAN.15
The fill rate of these quantitative limits, which are quantified in square metreequivalents of qualifying fabric, are well below the utilization ratios of preferential importsto total imports. For AGOA, the fill rate in FY 2005 was just 34.4 per cent (370 million m2
out of a total preference level of 1,077 million m2). AGOA allows lesser developedsub-Saharan African countries to use third country fabric (most of it from Asia); with thatallowance, the fill rate in FY 2005 was 64 per cent (343 million m2 out of 536 million m2).16
In contrast, in the ANDEAN region the fill rate was a miniscule 4 per cent (25 million m2 outof 710 million m2). For the Caribbean Basin region the fill rate was 61 per cent (596 millionm2 out of 970 million m2) with cotton T-shirts achieving a fill rate of 99 per cent (11.9 milliondozen pairs out of 12 million dozen pairs allowed). The reason for the low fill rate inANDEAN appears to be the use of a restrictive yarn-forward rule of origin (similar to thatof NAFTA) while for the other two regions simple assembly of garments from qualifyingfabric is the rule of origin.
These preference programmes are strictly limited to garments and luggage (madeup from textiles) and hence are inherently restrictive. This is one reason why UnitedStates partners under these programmes have sought to negotiate free trade agreementsthat, by definition, offer broad coverage of substantially all trade as required by GATTArticle XXIV. The QIZ programmes for Middle Eastern countries (Jordan and Egypt) offerpreferences over a wider group of products than under the Trade and Development Act of2002. QIZ preferences covered almost 85 per cent of shipments from Jordan in 2004 butcoverage began to drop in 2005 and 2006 as the United States-Jordan FTA began togradually cover more trade. In the case of Egypt, QIZ was launched in 2005 and covered12.8 per cent of shipments to the United States; in 2006 (January-May), the utilizationratio increased to 21.4 per cent of shipments. In the case of Jordan, clothing accounts for75 per cent of qualifying imports and the high use of the preferences is facilitated bya simple rule of origin - sewing or assembly of qualifying fabric into garments. The QIZprogramme was a precursor to the United States-Jordan FTA.
In contrast to non-reciprocal preference programmes, FTAs tend to be morecomprehensive in coverage of trade and involve reciprocal exchanges of preferentialmarket access. In general, United States FTAs involve very comprehensive and detailed
15 Under the 2002 Act, the Caribbean Basin Trade Partnership Act covers a subset of the CBIcountries (Costa Rica, Dominican Republic, Guatemala, Haiti, Honduras, Jamaica, Nicaragua and ElSalvador).
16 Data are from the Office of Textiles and Apparel (OTEXA) of the United States Department ofCommerce (see http://www.otexa.gov).
158
product-specific rules of origin. This is certainly the case in NAFTA, where rules of origincover several hundred pages. The FTAs that the United States has negotiated and whichhave entered into force were examined in order to estimate the share of the United Statesimports from FTA partners that made use of preferential tariff treatment. In the case ofNAFTA, preferential imports from Canada were as high as 88 per cent of total shipmentsin 2005, up from 82 per cent in 2004, whereas for Mexico the ratio was far lower at62-63 per cent. This may be due to the composition of trade but is also likely to reflect thegreater difficulty a developing country has in complying with rules of origin compared witha developed country.
In particular, value-added requirements ranging from 50 per cent to 62.5 per centmay be more difficult for Mexican enterprises to meet than those in Canada. Chile, whichhas a deal with the United States that is similar to those of Mexico and Canada, achieveda preference ratio of 55-56 per cent in 2005-2006, up from 42 per cent in 2004, the initialyear of the agreement. United States FTAs with Israel (1985), Jordan (2001) and Singapore(2004) have much lower preference ratios than those with Canada, Chile and Mexico.17
Australia is likely to attain a high level of preference coverage in its shipments to theUnited States over the course of time as the agreement only took effect in 2005 (36 percent preference ratio) and coverage appeared to be rising sharply in 2006. It is too earlyto judge how much trade CAFTA-DR will cover, as the agreement only entered into forcein March 2006. Similarly, for Morocco it is too early to tell, although the coverage attainedalready exceeds that of Israel.
The impact of United States-based FTAs is likely to be significant on bilateral tradeflows between partners, and between partners and non-partners. The relatively high MFNtariffs on key labour-intensive manufactured goods, coupled with restrictive rules of origin,make it likely that United States-hub FTAs will lead partners to purchase intermediategoods from within the bloc and to reduce purchases from lower-cost sources outside thebloc. Research using a gravity model (International Monetary Fund, 2006) indicates thatNAFTA members, on average, trade 33 per cent less with non-members than otherwise.The finding that membership in NAFTA reduces the willingness of the United States toreduce MFN tariffs on goods receiving tariff preferences (Limao, 2006) underscores thethreat that reciprocal PTAs pose for multilateral trade liberalization.
In contrast to United States-hub FTAs, research has shown that AFTA has had littleimpact on intra-bloc trade flows (Baldwin, 2006). Moreover, research indicates that ASEANmembers trade more intensively with non-members than do NAFTA members (InternationalMonetary Fund, 2006). However, the recent trend towards expansion of bilateral tradeagreements that are centred around large hub countries (Japan, Republic of Korea, China),
17 In the case of Jordan, almost all shipments to the United States receive preferential treatmentonce QIZ and GSP preferences are taken into account. In 2005, 95 per cent of shipments to theUnited States received preferential treatment (19.5 per cent under the FTA, 74.5 per cent under QIZand 1.5 per cent under GSP). The reason for low coverage in the case of Singapore needs furtherexamination, but it is likely that much of what Singapore ships to the United States comes in underzero or low tariffs (electronics and information technology products).

159
or that involve complex rules of origin and significant margins of preference, could weakenthe will of Asian countries to continue their support for multilateral trade liberalization andmay also slow down or bring a halt to unilateral liberalization efforts that have served Asiawell in the recent past. One of the main dangers is that a complex web of bilateral FTAswill conflict with what Baldwin (2006) referred to as the smooth functioning of FactoryAsia. In other words, the efficient functioning of production networks based on openmultilateral trade may give way to diversion of trade inside the bloc or hub-spoke system,thereby reducing the competitiveness of Asian products in world markets. This threatappears to be very real, given the increasingly complex and differentiated rules of origin inbilateral agreements that Asian hub countries are entering into.
E. Proposals for disciplines and reform in use
of rules of origin
Rules of origin related to the granting of preferential tariff treatment are at presentnot covered by any binding disciplines in the multilateral trading system (James, 2005).The exclusion of preferential rules of origin from the work programme on rules of originunder the Uruguay Round Agreement indicates that contracting member States wished topreserve their freedom to design preferential rules of origin rather than to agree toharmonization as for non-preferential rules of origin. In view of the subsequent exponentialrise in the number of PTAs among contracting members since the agreement of 1994,however, it may be high time to review the omission of preferential rules of origin and toinclude them in the rules component of the Doha Round Agenda.
In the non-binding statement on preferential rules of origin, contracting memberswere admonished to ensure that rules of origin do not in themselves constitute obstaclesto expansion of trade. Coupled with the admonition in Article XXIV of GATT and Article Vof GATS that preferential trade arrangements should not be raised as barriers to thecommerce of non-members and that they should not constitute an obstacle to the reductionof MFN tariffs, the basis for some discipline over preferential rules of origin may beestablished. Moreover, a WTO panel decision that upheld India s complaint regardingEuropean Union preferences extended on a discriminatory basis to contracting memberswho had been a source of contraband but were deemed to have cooperated inanti-narcotics efforts - and not to contracting members that had not been a source ofcontraband, also appears to set the basis for limits on exceptions to Article I and the rulesof origin necessary to enforce such exceptions.18
The difficulties encountered by the working group on non-preferential rules of originin harmonization are a strong indicator that the goal of enhanced disciplines over preferentialrules of origin should be realistic. Harmonization of preferential rules of origin may be toomuch to expect. Rather, some flexibility should be considered, so that such rules do not in
18 The India-European Union GSP case documents are available at the WTO homepage, http://www.wto.org. Also see Bridges Weekly Trade News Digest, 5 November 2003 for a summary of thecase.
160
themselves constitute barriers to commerce. In general, preferential rules of origin shouldbe based upon the same template as non-preferential rules of origin - that is, on a CTHtest. Such a test is not appropriate or applicable to all types of goods and services.Hence, they must be supplemented by percentage or specified process rules as isappropriate. The approach should be consistent with that of the work programme onnon-preferential rules of origin. Thus, in cases where assembly of a product is a substantialtransformation yet involves no CTH, a Change in Tariff Sub-Heading (CTSH) test coupledwith a minimum regional content rule should be adopted.
One way to approach the issue of disciplines would be to allow enterprises someleeway in meeting rules of origin by, for example, giving them a choice between a minimumregional content value-added rule or a maximum non-originating content rule on onehand, and a specified manufacturing process rule on the other hand. Standardization ofaccounting principles and formulae used to implement rules of origin could also simplifythe situation for businesses wishing to take advantage of tariff preferences. Firms shouldalso be allowed to average compliance with minimum regional content rules or maximumnon-originating content rules over a period of time, rather than having every single shipmentin full compliance. Hence, if the value-added rule is 50 per cent regional content anda firm ships US$ 1 million with 45 per cent regional content and another US$ 1 million with55 per cent regional content, the authorities should allow both shipments to enjoypreferential treatment, perhaps retroactively provided the firm can supply the relevantdocumentation to customs. In this context, the reform of Canada s GSP rules of originmay provide a useful model. In 2001, Canada revised its regional content rule to allowdesignated LDCs a maximum of 60 per cent non-originating content (equivalent to 40 percent regional content) as opposed to the general GSP requirement of a maximum of 40per cent (equivalent to a 60 per cent regional content rule).19 In 2003, Canada furtherliberalized its GSP rules of origin by extending coverage to textile and clothing products(among others); this has proven to be beneficial to a number of least developed Asiancountries including Bangladesh and Cambodia.
In addition to efforts to increase flexibility and choice, contracting members mayalso wish to strengthen the observance of the requirements of Article XXIV and Article V innew FTAs and to set a timeframe for existing agreements under the enabling clause toalso gradually comply with those requirements. This is unlikely to be acceptable to manyindividual contracting members; however, collectively, it is in the interests of the overallefficiency of multilateral trade to enforce such requirements and it could be a componentof the new rules under the Doha Development Agenda, should the talks be revived.
A related recommendation to those above is that member countries of eithera regional or bilateral PTA/FTA be required to publish statistics on the level of utilization ofthe preferences by estimating the percentage of imports of each member that are coveredby, and make use of the preferential tariffs. Such information is readily available tocustoms authorities and should be shared through national statistical agencies. The
19 See United Nations Conference on Trade and Development 2001 and 2005 for discussion.
161
information would be very useful to governments in monitoring the performance andcompliance of such agreements with GATT/WTO requirements and their impact on privatecommerce.
Within Asia and the Pacific, caution is now needed as the plethora of bilateral dealscentred on large trading hubs is leading to increasing tariff discrimination within the region.Clearly, the desirable way forward is one that minimizes the creation of discriminatoryhub-spoke systems around the larger Asian traders. In this context, ASEAN might beconsidered as the fulcrum for broader regional trading arrangements, and thus connect thespokes as well as the hubs via the ASEAN 3 agreements with Japan, China and theRepublic of Korea as well as arrangements involving cooperation with India and the otherSAARC member States. In this context, the Asia-Pacific region might opt for a system ofPan-Asian and Pacific Cumulation similar to the Pan-European Cumulation System (PECS)adopted by the European Union in 1997 and which was extended to Turkey in 1999 (TheEconomist, 2006). Such a system would allow member States to cumulate value-addedacross agreements in order to comply with rules of origin. Such a system would enableAsian production networks to thrive rather than becoming a casualty of restrictive rules oforigin.
There are several related concerns that the Doha Round is meant to address butthat may now be in limbo. First, the explosion of bilateral deals is usually among the moreadvanced developing countries and threatens to leave poor, small and isolated countriesbehind. Second, even if these developing countries could enter into negotiations withmore advanced partners, asymmetrical bargaining power would place them ina disadvantageous position. These issues, as well as the issue of erosion of preferencemargins cannot really be adequately addressed in bilateral trade agreements. Thus, thetrend towards increased bilateralism in hub-spoke systems threatens to leave poor, smalland isolated countries worse off.
162
References
Asia-Pacific Trade and Investment Agreement Database, www.unescap.org/tid/aptiad.
Asian Development Bank, 2006. Asian Development Outlook 2006. Manila.
Baldwin, R., 2006. Managing the noodle bowl: The fragility of East Asian regionalism,CEPR Discussion Paper No. 5561. London, Centre for Economic Policy Research.(http://www.cepr.org/pubs/dps/DP5561.asp.)
Bridges Weekly Trade News Digest, 2003. India Wins Landmark EU-GSP Case,5 November.
Fuller, T., 2006. Trade imbalance masks a struggle to get by: Boots made in China butmoney made in US , International Herald Tribune, 4 August 2006, pp. 1 and 12.
Hindustan Times, 2006. US reviewing trade preferences for India, 12 others, 10 August.
Imagawa, H. and E. Vermulst, 2005. The agreement on rules of origin, in PatrickF.J. Macrory, Arthur E. Appleton, and Michael G. Plummer (eds.), The WorldTrade Organization: Legal, Economic and Political Analysis, vol. I; pp. 601-678.New York, Springer.
International Monetary Fund, 2006. Regional Economic Outlook: Asia and Pacific, WorldEconomic and Financial Surveys. Washington D.C.
James, W.E., 2005. Rules of origin and rules of preference and the World Trade Organization:The challenge to global liberalization of trade, in Patrick F.J. Macrory, ArthurE. Appleton, and Michael G. Plummer (eds.), The World Trade Organization: Legal,Economic and Political Analysis, vol. II; pp. 263-293. New York, Springer.
Limao, N., 2006. Preferential trade agreements as stumbling blocks for multilateral tradeliberalization: Evidence for the United States, American Economic Review, vol. 9,No. 3; pp. 896-914.
Lippoldt, Douglas C., 2006. The Australian preferential tariff regime , OECD Trade PolicyWorking Paper No. 33.
Panagariya, Arvind, 1999. Regionalism in Trade Policy: Essays on Preferential Trading,Singapore: World Scientific.
The Economist, 2006. Least favoured nation, 5 August, p. 68.
Trebilcock, M.J. and R. Howse, 1999. The Regulation of International Trade, secondedition. London and New York, Routledge.
United Nations Conference on Trade and Development, 2005. UNCTAD GSP Newsletter,No. 7, (UNCTAD/DITC/TNCD/MISC/2005/6).
, 2001. Handbook on the Scheme of Canada, UNCTAD publications on GSP,(UNCTAD/ITCD/TSB/Misc.67).
Vermulst, E. and P. Waer, 1990. European Community rules of origin as commercialpolicy instruments? Journal of World Trade, vol. 24, No. 3.
World Trade Organization Consultative Board, 2004. The future of the WTO: Addressinginstitutional challenges in the new millennium . Geneva.

163
V. CUSTOMS VALUATION IN INDIA: IDENTIFYING TRADE
FACILITATION-RELATED CONCERNS
By Sachin Chaturvedi*
Introduction
While the Doha Round negotiations on trade facilitation have focused on GATTArticles V, VIII and X, it is being increasingly recognized that implementation of GATTArticle VII (Customs Valuation) remains an important subject and that it is difficult toaddress issues under these four articles separately.
The Agreement on Customs Valuation (ACV) provides a set of valuation rules,expanding and giving greater precision to the existing provisions on customs valuation inthe original GATT agreement. The ACV is largely a manifestation of GATT Article VII,which was revised during the Tokyo Round of GATT negotiations. The fundamentalapproach behind ACV is to reduce trade barriers and transaction costs arising from customsand border control practices, including uniform application of the harmonized system andthe valuation agreement, so that they are not slow, unpredictable and non-transparent.This was a substantial advance over the Brussels Definition of Value (BDV) approach,prevalent in most of the European countries in the 1950s and 1960s (Majumder, 2005). In1950, in an effort to achieve greater harmonization of rules and greater discipline incustoms matters, 13 European governments developed BDV, taking into account the broadprinciples and guidelines prescribed by GATT (Rege, 1999). The responsibility foradministering the BDV rules and for promoting the use of BDV on a worldwide basis wasgiven to the Customs Cooperation Council (CCC) which is now WCO.
Although all WTO member countries are supposed to implement GATT Article VII,except for a few new members, in the case of many member countries it is unclearwhether the implementation of ACV methods has been successful and provided any benefits.
India accepted the concept of transaction value as a primary method for valuationlong before acceding to ACV. It was done as part of the GATT valuation implementation in
* Sachin Chaturvedi is a Fellow, Research and Information System for Developing Countries (RIS),New Delhi, India. The author would like to thank Nagesh Kumar, Yann Duval, Kameswari Subramanianand two external reviewers of ARTNeT for their comments on an earlier version of the study. Specialthanks are due to S.K. Mohanty for his help in data analysis and several officers from the CustomsDepartment, especially S. Dutt Majumder, C. Satapathy, Arun Sahu and S.K. Rehman among othersfor sharing their valuable insights and information on this technical issue. Private sector sources alsoprovided significant assistance in understanding the nuances in this area, particularly Naval Mehta,S. Radhakrishnan, Bhavana Doshi, Mark S. Fernandes, N.G. Pillai and Dushyant Mulani. The researchand presentational support provided by the RIS Documentation Centre, Ritu Paranami and PradeepKumar is also appreciated. The author can be contacted at [email protected].

164
August 1988. As part of this, the Customs Department is bound to accept the value statedby the importer through the invoice unless the department has additional information tosubstantiate under-invoicing. Some importers take advantage of this legal situation andundervalue their imports with fake invoices knowing that customs authorities may not beable to recognize them. To date, this situation is reported to have resulted in a revenueloss of almost Rs 100 billion.1 In this context, the related Uruguay Round ministerialdecision gives customs administrations the right to request further information in caseswhere they have reason to doubt the accuracy of the declared value of imported goods.2
If the administration maintains a reasonable doubt, despite any additional information, itmay be deemed that the customs value of the imported goods cannot be determinedbased on the declared value.
It is often claimed that customs valuation and the way it is carried out may becomea trade barrier or, more importantly, a vehicle for domestic protection from imports (Alburo,2006). Whether the manner of valuing goods is arbitrary or is based on some notionalprice, customs valuation can be an effective trade instrument in the hands of the authorities.
However, the efforts by the Customs Department to minimize the loss of revenueoften lead to situations that make the system slow, unpredictable and non-transparent.This defeats the very raison d etre of ACV and trade facilitation measures. In India,a survey conducted in 2004-2005 as part of an ARTNeT/RIS study on trade facilitationidentified customs valuation as the key problem for the trading community.3
Section A of this chapter provides an overview of the institutional and policyframework in India, together with an attempt to detail revenue composition and broadexperience with ACV. Section B examines private sector perceptions of the implementationof ACV, and analyses undervaluation practices of Indian companies. Section C drawsconclusions and policy recommendations.
A. Institutional and policy framework
The Central Board of Excise and Customs is the key government agency inoverviewing policy planning and development of the institutional infrastructure. In 1997,CBEC established the Directorate of Valuation (DOV) with the mandate to provide guidanceto field staff as well as to develop mechanisms for ensuring the uniform application of rulesand regulations for valuation purposes. Headed by a director-general, DOV is based inMumbai with two zonal offices in Delhi and Bangalore. CBEC has also delegated customsvaluation to DOV regarding work being done by India as part of WCO. Thus, DOV iseffectively linked with international processes that India is engaged in. As part of its
1 Based on estimates by C. Satapathy (personal communication).
2 Uruguay Round Ministerial Decisions adopted by the Trade Negotiations Committee on 15 December1993 and 14 April 1994.
3 Chaturvedi, 2006 and Duval, 2006.

165
international mandate, DOV has been organizing training courses for customs officialsfrom other developing countries.
The major challenge facing DOV is ensuring monitoring of those goods in whichvaluation often comes up as an issue. In order to address this challenge effectively, DOVhas developed a network for gathering information and feedback on the international pricemovements of such commodities. DOV issues Valuation Guidelines for the field offices,based on information received from agencies such as Reuters, Metal Bulletin and Platts aswell as other sources. DOV has also developed its own databases.
In India, efforts have been made, as per Article 11 of ACV, to put in place institutionalarrangements for ensuring rights of appeal under CESTAT. Initially, the first appeal maybe made at the Customs Department itself, followed by the option of the tribunal. Casesmay also be submitted to the public judicial system at the appropriate levels.
Recently, India officially launched a countrywide Accredited Clients Programme(ACP) and RMS for importers. Under ACP, regular importers with a reputation of promptcompliance would be accredited under the scheme. This accreditation will secure themassured facilitation at major customs ports throughout the country. The trading communitywill be able to attempt self-assessment and there will be no need for examination bycustoms. This may help in assuring of quick delivery of imported consignments, and helpimporters in terms of reduced paperwork and transaction costs. It may also help inminimizing the constraints faced in valuation. The declaration of Bills of Entry and theImport General Manifest filed electronically in the Indian Customs EDI System (ICES),either through the service centre or through the Indian Customs and Excise Gateway, isforwarded to the system. The data in the Bill of Entry and the Import General Manifest isthen processed by the RMS, which generates an electronic output for ICES. This outputwill determine whether the Bill of Entry will be taken up for action (appraisement orexamination, or both, by the officers) or such self-assessed bill is given out of chargedirectly - after duty payment but without assessment and examination. Previouslyoperational only at a limited level, RMS has now been launched by the Finance Minister atthe national level.
It is too early to consider the impact of these measures on customs revenue assuch. However, section B deals with some of the details placing revenue from customs ina wider context.
1. Revenue composition
Although all WTO member countries are bound to reduce customs duties, as partof their WTO commitments, India has unilaterally been continuously cutting rates ofcommodities taxes, both customs and excise duties. In recent years, different annualbudgets have attempted to bring down customs duties in India with the intention of eventuallyreaching the levels of the ASEAN countries. The average peak rate declined from 15 percent in 2005 to 12.5 per cent in 2006 (figure I). In the 2006/07 budget, the peak rate ofbasic customs duties has been retained at 12.5 per cent. However, additional customs

166
duty at the rate of 4 per cent is being imposed under section 3(5) on all goods importedinto India in order to compensate for internal taxes such as VAT, sales tax and centralsales tax (CST). The additional customs duty is not applicable to goods exempted frombasic as well as countervailing duty (CVD) goods imported for servicing export promotionsschemes; domestic tariff area (DTA) clearances to Export Oriented Unit (EOU)/ElectronicHardware Technology Park (EHTP)/Software Technology Parks (STP)/Special EconomicZones (SEZ) units provided such goods are not exempt from sales tax/VAT etc. This alsoincludes precious metals like gold, silver and imports by EOUs and units in EHTP/STP orSEZ. In the 2006/07 budget, CVD was imposed on most imports in lieu of VAT ondomestic goods.4
As is evident from table 1, from 1990/91 to 2004/05 the revenue from direct taxes,particularly corporate income tax, expanded considerably. During that period, the share ofindirect taxes declined from 78 to 56 per cent while that of direct taxes went up from 19 to44 per cent. In the same period, the share of corporate income tax expanded from 9 to28 per cent.5
In the case of indirect taxes, the share of revenue as a percentage of GDP declinedfrom 7.9 per cent in 1990/91 to 5.7 per cent in 2004/05. In the same period, the share ofcustoms duty declined from 3.6 to 1.7 per cent of GDP while its share of gross tax revenuedeclined from 36 to 17 per cent. In absolute terms, however, customs revenue stood atRs 206 440 million in 1990/91 and rose to Rs 542 500 million in 2004/05. As table 1shows, there are fluctuations in the revenue from customs. From 1999/2000 to 2001/02,
Figure I. Decline in the average tariff rate in India, 1991-2006
0
20
40
60
80
100
12019
91
1993
1995
1997
1999
2001
2002
2004
2005
2006
Tarif
fs
Source: Economic Survey (2006); Mohanty (2004).
4 Financial Express, 26 July 2006.
5 The Hindu Business Line, 2006.

167
Table 1. Sources of tax revenue in India
(Unit: Rs million)
Tax 1990- 1999- 2000- 2001- 2002- 2003- 2004-
source 1991 2000 2001 2002 2003 2004 (RE) 2005
Directa 110 240 579 580 683 060 691 970 830 800 1 034 000 1 395 100
PIT 53 710 256 540 317 640 320 040 368 580 402 690 509 290
CIT 53 350 306 920 356 960 366 090 461 720 629 860 884 360
Indirect 451 580 1 124 500 1 186 810 1 161 250 1 312 840 1 500 290 1 775 990
Customs 206 440 484 200 475 420 402 680 448 520 493 500 542 500
Excise 245 140 619 020 685 260 725 550 823 100 923 790 1 091 990
Service tax 0 21 280 26 130 33 020 41 220 83 000 141 500
Gross tax 575 760 1 717 520 1 886 030 1 870 600 2 162 660 2 549 230 3 177 330
revenueb
Tax revenue as per cent of gross tax revenue
Directa
19.1 33.7 36.2 37.0 38.4 40.6 43.9
PIT 9.3 14.9 16.8 17.1 17.0 15.8 16.0
CIT 9.3 17.9 18.9 19.6 21.3 24.7 27.8
Indirect 78.4 65.5 62.9 62.1 60.7 58.9 55.9
Customs 35.9 28.2 25.2 21.5 20.7 19.4 17.1
Excise 42.6 36.0 36.3 38.8 38.1 36.2 34.4
Service tax 0.0 1.2 1.4 1.8 1.9 3.3 4.5
Tax revenue as per cent of gross domestic productc
Directa
1.9 3.0 3.3 3.0 3.4 3.7 4.5
PIT 0.9 1.3 1.5 1.4 1.5 1.5 1.6
CIT 0.9 1.6 1.7 1.6 1.9 2.3 2.8
Indirect 7.9 5.8 5.7 5.1 5.3 5.4 5.7
Customs 3.6 2.5 2.3 1.8 1.8 1.8 1.7
Excise 4.3 3.2 3.3 3.2 3.3 3.3 3.5
Service tax 0.0 0.1 0.1 0.1 0.2 0.3 0.5
Gross tax 10.1 8.9 9.0 8.2 8.8 9.2 10.2
revenueb
Source: Economic Survey, 2004-2005, Ministry of Finance.a Direct taxes include taxes pertaining to expenditure, interest, wealth, gift and estate duties.b Includes direct and indirect taxes as well as taxes of Union Territories and other taxes.c Refers to gross domestic product at current market prices.
Notes: PIT: Personal income tax.
CIT: corporate tax.
The ratios to GDP for 2004-2005 (budgetary estimates) are based on CSO advance estimatesreleased in February 2005.

168
there was a continuous decline in customs revenue. The decline was as high as 17 percent while in the period 2002/03 to 2004/05 the increase was in the order of 21 per cent.From 2001/02 to 2002/03, revenue expanded by 11 per cent.
The growth in the customs revenue has largely attributed to the policy frameworkadopted and the surge in trading activities. Merchandise imports grew by almost 40 percent in 2004/05, which is the highest growth rate in past two and half decades.6
Non-oil imports, however, increased by 31 per cent. A significant import boostcame from import of precious and semi-precious stones (8.6 per cent), electronic goods(8.9 per cent), metals especially gold and silver (10 per cent) and capital goods (11.5 percent).
2. Changing policy regime
After independence in 1947, India revised its customs valuation provisions,particularly the Sea Customs Act of 1878, to bring it into conformity with GATT provisions.The Sea Customs Act was based on real value, defined as the wholesale price for whichlike goods could be sold at the time and place of importation (excluding duties payable).The Sea Customs Act also contained provisions for taking over the imported goods by theGovernment on payment of an amount equal to declared real value (Section 32). Thechanges in this Act were made based on recommendations from the Customs ReorganizationCommittee, 1958-1959, which led to the enactment of the Customs Act, 1962. Theprovisions of the latter were in accordance with Article VII of GATT, which helped instandardizing various procedures on a par with other countries for determining value, andlaid down certain principles to avoid fixing of arbitrary or fictitious values. The system wasbased on the actual value of imported goods. In this system, even the values of goods ofnational origin were also ruled out. The provisions enabled acceptance of the invoiceprice so long as the buyer and the seller were unrelated and the price was the soleconsideration for sale.7 The rules were notified through the Customs Valuation Rule 1963.8
As part of India s commitment at the Tokyo Round Agreement on Customs Valuation,the Customs Act 1962 was subsequently amended and the Customs Valuation (Determinationof Price of Imported Goods) Rules, 1988 were implemented, which provided scope forbasing the valuation exercise on transaction value. The new valuation rules of 1988largely reflected provisions of GATT Article VII, 1994 (WTO valuation code). The CustomsValuation Rules, 1988, lay down six methods for the valuation of imported goods. Theprimary basis for valuation is the Transaction Value . However, it is subject to adjustmentby certain Valuation Factors (Rule 9). There are also certain conditions for the transactionvalue method to be applicable (sub-rule 2 of Rule 4). In certain situations, the customsauthorities can reject the declared value (transaction value method), if the truth or accuracy
6 Economic Survey, 2005-2006.
7 Satapathy, 2002.
8 For details see Majumder, 2005.
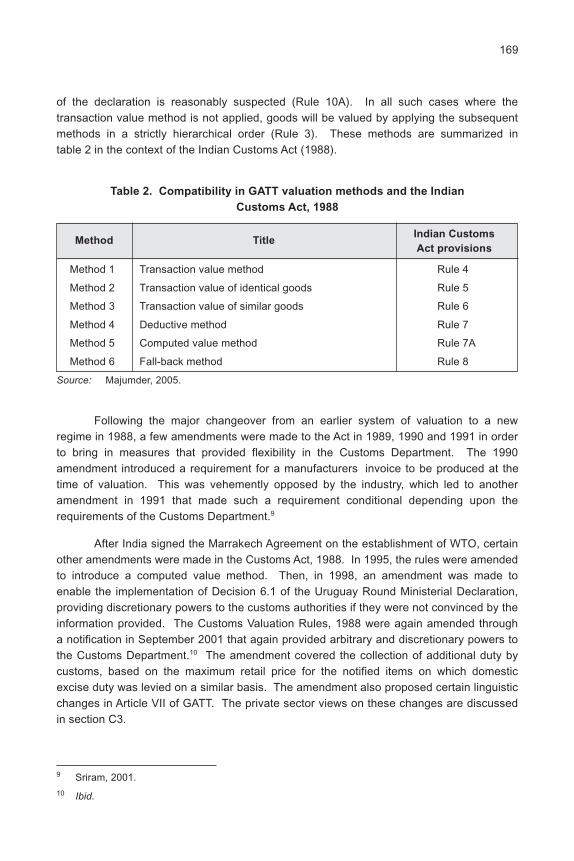
169
of the declaration is reasonably suspected (Rule 10A). In all such cases where thetransaction value method is not applied, goods will be valued by applying the subsequentmethods in a strictly hierarchical order (Rule 3). These methods are summarized intable 2 in the context of the Indian Customs Act (1988).
Table 2. Compatibility in GATT valuation methods and the Indian
Customs Act, 1988
Method TitleIndian Customs
Act provisions
Method 1 Transaction value method Rule 4
Method 2 Transaction value of identical goods Rule 5
Method 3 Transaction value of similar goods Rule 6
Method 4 Deductive method Rule 7
Method 5 Computed value method Rule 7A
Method 6 Fall-back method Rule 8
Source: Majumder, 2005.
Following the major changeover from an earlier system of valuation to a newregime in 1988, a few amendments were made to the Act in 1989, 1990 and 1991 in orderto bring in measures that provided flexibility in the Customs Department. The 1990amendment introduced a requirement for a manufacturers invoice to be produced at thetime of valuation. This was vehemently opposed by the industry, which led to anotheramendment in 1991 that made such a requirement conditional depending upon therequirements of the Customs Department.9
After India signed the Marrakech Agreement on the establishment of WTO, certainother amendments were made in the Customs Act, 1988. In 1995, the rules were amendedto introduce a computed value method. Then, in 1998, an amendment was made toenable the implementation of Decision 6.1 of the Uruguay Round Ministerial Declaration,providing discretionary powers to the customs authorities if they were not convinced by theinformation provided. The Customs Valuation Rules, 1988 were again amended througha notification in September 2001 that again provided arbitrary and discretionary powers tothe Customs Department.10 The amendment covered the collection of additional duty bycustoms, based on the maximum retail price for the notified items on which domesticexcise duty was levied on a similar basis. The amendment also proposed certain linguisticchanges in Article VII of GATT. The private sector views on these changes are discussedin section C3.
9 Sriram, 2001.
10 Ibid.

170
3. Institutional infrastructure
In the light of the increasing global integration of Indian business, severalinstitutional initiatives have been launched to provide policy support as well as facilitatework for customs valuation. The Directorate of Valuation has launched several initiativessuch as the establishment of the National Import Database (NIDB) and the CentralRegistry Database (CRD). DOV has also launched a monthly Valuation Bulletin incorporatingall value-related information, including international price trends of important commoditiesand market intelligence reports from various sources. This is published and distributed toall field offices of the Customs Department. The Valuation Bulletin is mainly intended toprovide an important source of information on valuation questions that officers in the fieldmay have to deal with during their day-to-day assessment work. Apart from this, DOV hasalso launched specific studies on selected commodities depending upon their sensitivity inthe domestic market. Some of these initiatives are discussed below.
(a) National Import Database
The National Import Database was launched to collect and analyse data on goodsimported at almost all the customs stations in India. The idea was to provide instantaccess to the combined data analysed by DOV when checking for undervaluation andvaluation fraud.11 This initiative is made possible by the fact that most of the majorcustoms points are now linked with the EDI system. The required data are retrieved byspecialized software and transmitted to a central server in the Valuation Directorate througha dedicated Intranet called ICENET. In the case of non-EDI stations, the required data aresent to the Valuation Directorate via e-mail. The data are analysed on a weekly basis inDOV with the help of intelligent software packages.
The analysed data are then transmitted to all customs stations each week byelectronic means, i.e. via ICENET to major customs stations and via e-mail to otherstations. Weekly transmissions are consolidated at customs stations and stored in MSaccess format with easy search and retrieval facilities. The data are made available toassessing officers at customs stations on LAN. When the declared value of goods isfound to be below 10 per cent of the weighted average, the consignment is flagged as anoutlier.12
(b) Special Valuation Branch
The Special Valuation Branch (SVB) was established to deal with specialisedinvestigation of transactions involving special relationships and certain special features. Italso looks into technical collaborations and texts of joint venture agreements etc. It hasbranches located at four major customs stations in Chennai, Calcutta, Delhi and Mumbai.Any decision taken in respect of a particular case at any of these major customs stations
11 Srivastav, 2003.
12 Standing Committee on Finance, 2005.
171
is conveyed to all other customs stations by the SVB branches, which have all-Indiajurisdiction and hence on-line communication with all customs stations.
An order issued by SVB remains in operation for three years. Orders by SVB arebased on the replies/documents furnished by importers. Any suppression of facts, or thesubmission of a false or misdeclaration on the part of an importer, will result in necessarypenal action being taken separately in accordance with the provisions of the law. If animporter has continuous imports over a period that extends beyond three years, he/shemust file replies and documents at least three months before the completion of thethree-year period, in order for the renewal of the case to be taken up. In all cases wherean importer is aggrieved by an order passed by SVB, he/she may file an appeal with theCommissioner of Customs (Appeals).
(c) Central Registry Database
DOV established the CRD as part of SVB to assist work on cases related toimports involving complex valuation issues such as related party imports, payment ofroyalties, licence fees, supply of materials and services by an importer, among others.The CRD is available on the Directorate s website for use by departmental officers duringtheir assessment work.
(d) Valuation Risk Assessment Module
In the context of the development of an RMS for import cargo clearance, theDirectorate has joined hands with the national Risk Management Team for devisinga strategy for valuation risk assessment and control. Based on their discussions,a Valuation Risk Assessment Module (VRAM) has been designed, comprising three parts.The first part is a Valuation Corridor consisting of a database of highly sensitivecommodities,13 most of which have a defined permissible value band for allowing clearancewithout intervention. Any consignment with a declared value below the lower limit of valueband will be directed for assessment. The second part of the valuation component ofRMS is Valuation Alerts, which are issued by DOV. If any imports comprise any of thecommodities covered by the Valuation Alerts list, the consignment is sent to an officer forverification. The third part concerns poor data quality. If an importer declares an unusualUnit Quantity Code that is not normally used, the consignment is sent for assessment.
(e) Export Commodity Database
The Directorate has initiated the development of an Export Commodity Databasethat will focus on the valuation of export goods. This action is primarily aimed at checkingthe possibility of overvaluation of export goods, a mechanism followed by unscrupulousexporters to claim a high level of export incentives under different schemes based onexport value. The export data will be compiled on a daily basis in electronic form fromcustoms stations that are linked by the dedicated Customs Network (ICENET). The data
13 www.dov.gov.in.

172
will be extracted in a predetermined format from all ICES locations, transmitted via ICENETand merged at DOV into a single data source. The data will be analysed by specialsoftware on a weekly basis to provide unit values, averages, percentage deviations etc.,enabling it to be used as a real-time source of information for valuation by field-basedassessing officers. The analysed files are transmitted to all field formations throughICENET for building up local databases for utilization by officers.
4. Experience with agreement on customs valuation
The Indian experience with the implementation of ACV is mixed. Although Indiahas largely adopted Article VII of GATT, it has made incorporated certain variations aimedat ensuring smooth implementation of ACV. These variations include, for example, theaddition of Method 7 for settlement of disputes in customs valuation under Rule 11 ofIndian Customs Valuation Rules. Similarly, Rule 10A of the Customs Valuation Rules wasintroduced to provide grounds for rejection of the declared value, based on the existenceof reason(s) to doubt so that customs authorities could make a fair determination ofcustoms value. This provision came from Decision 6.1 of the Uruguay Round WTOMinisterial Declaration. Accordingly, the burden of proof is shifted to the importer.
However, several judicial pronouncements in India have directed the CustomsDepartment to exercise restrain in applying Rule 10A.14 In fact, there is a pattern in thepromulgation of amendments to the Customs Valuation Rules of 1988 as well as theintroduction of new rules and valuation-related rulings by the judicial delivery system.Rule 10A itself was the outcome of a judicial decision. As explained in section B on theprivate sector perception of customs valuation, several legal judgments have instructedthe Customs Department to follow transaction value as the first basis for valuation. TheEicher Tractor Ltd. case in 2000 became a turning point in this regard (see box 1).
Box 1. The case of Eicher Tractor Limited
The Supreme Court of India, in its judgment in 2000 on the Eicher Tractors Limited vs.Commissioner of Customs, Mumbai case, held that unless the price actually paid fora particular transaction falls within the exceptions laid down, customs authorities are boundto charge duty on the transaction value.
The case is an interesting example that demonstrates how the Customs Departmentmay implement provisions that completely overlook fundamental requirements for tradefacilitation. In this case, Eicher Tractors Ltd. imported tailor-made bearings from Japanthat were manufactured in 1989. Part of the consignment was rejected and later wasimported in 1993. Since the Japanese exporter could not sell this product (beingtailor-made to specific requirements) to any other firm, the transaction was made atone-third of the 1989 price. The Customs Department rejected the transaction value.
14 Majumder, 2005.

173
Eventually, while ordering of acceptance of the transaction value, the Supreme Courtdirected that the price of imported goods was to be determined in accordance with the timeand place of importation and the absence of special circumstances.
Following the judgment, in 2001 the Indian Government amended the Customs ValuationRule whereby sales at below cost would no longer be specifically excluded from beingvalued on the basis of the transaction value.
Source: Based on Excise Law Time (ELT [122], 2000).
(a) Impact of enhancement in valuation
In recent years, several measures have been introduced by DOV to minimizerevenue losses. As shown in table 3, there has been a remarkable increase in extrarevenue realized because of the enhancement of declared transaction value.
Table 3. Extra duty realized from enhancement in valuation
Financial yearTotal revenue Amount realized Per cent change
(Rs million) (Rs million) over previous year
2003/04 486 250 1 930
2004/05 542 500 3 340 +73.06
2005/06 648 380 4 550 +36.23
2006/07 108 938 660 +40.42
(up to July 2006) (Rs 470 million duringthe correspondingperiod in theprevious year)
Source: Standing Committee on Finance, 2005.
During 2003/04, the reported value of this undervaluation was Rs 1,930 million.During 2004/05, the additional revenue realized was Rs 3,340 million, which was73 per cent higher compared with the previous year. Similarly, during 2005/06, Rs 4,550million of additional revenue was realized, compared with Rs 3,340 million during thecorresponding period in 2004/05, through the enhanced value of imported goods. DuringApril 2006, an additional Rs 281 million was realized due to the enhanced value ofimports.
B. Private sector perception and key concerns
An earlier ARTNeT study of trade facilitation in India found that customs valuationwas one area that most traders found highly challenging.15 The private sector survey
15 Chaturvedi, 2006.

174
received a reasonable response to both aspects of the questionnaire, i.e., perceptionregarding the level of implementation of trade facilitation measures, and ranking of needsand priorities.
The private sector firms helped in identifying the key problem areas in trade facilitation(figure II). The key problem areas identified by the respondents were in the followingorder: (a) customs valuation (19 per cent); (b) inspection and release of goods (18 percent); (c) tariff classification (16 per cent); and (d) submission of documents for clearance(14 per cent). In the survey, the method was based on a questionnaire developed with thehelp of the ARTNeT Secretariat and selected interviews with key industrialists andrepresentatives from leading private sector firms including the major CHAs. The samplesize was selected taking into account the relative importance of various sectors in totalexports of India.
At the sectoral level, export shares were worked out and a representative targetbase was identified. In that group, manufacturing goods represented a greater share,hovering at around 76 per cent, while primary products were around 16 per cent andpetroleum products approximately 5.2 per cent. The questionnaire was sent to variousfirms according to the weight assigned to their respective sectors. Of 1,020 firms approached,responses were received from 51 firms. The greatest emphasis was given to themanufacturing sector, of which 620 firms were approached; 41 firms responded excludingthree additional firms from the category of others .
Figure II. Problems faced by the private sector in India
Source: Chaturvedi, 2006.
Customs valuation Tariff classification
Technical or sanitary requirements Identification of origin of goods
Inspection and release of goods Submission of documents for clearance
Obtaining import licences Payment of fees and penalties
19%
16%
11%6%
18%
14%
10%
6%

175
1. Survey instrument and methodology
While interacting with different stakeholders concerning customs valuation in India,a number of issues were revealed that need empirical examination. It was commonlyobserved by the stakeholders that under-invoicing occurred for a large number of importedproducts for several reasons. During the interaction with the private sector, several issueswere raised that require further empirical analysis: What is the relationship betweenaverage firm size in terms of magnitude of under-invoicing and the number of firms associatedwith such practices? Is there any trade-off between them? How frequently does theCustoms Department resort to the fall-back option? The issue of under-invoicing fora selected number of products remains important to the Indian Customs Department and itwas therefore decided to conduct a survey of importing firms on customs valuation andunder-invoicing.
(a) Data constraints
In undertaking the empirical analysis, an attempt was made to acquire existingprimary data but such data were not available from the Customs Department. Even thedomestic/international secondary source data available from various sources was tooscanty to undertake an empirical analysis. However, the names of the key companieswere found against which cases of evasion came up at CESTAT. The decisions byCESTAT and available details were supplemented by undertaking an all-India samplesurvey on the level of under-invoicing by the importing firms in different sectors; sincemany of the firms were based in Delhi and Mumbai, the focus remained on those cities.Because of the paucity of time prevented a fully-fledged survey being undertaken, a pilotsurvey was carried out. Hopefully, the outcome of that exercise may stimulate furtherwork in this area in future.
(b) List of firms and CESTAT decisions
Information concerning the involvement of firms in under-invoicing activities wasgathered from the decisions made at CESTAT. As discussed above, India has designatedCESTAT to deal specifically with cases related to customs valuation. The tribunal isa quasi-judicial body where disputes related to customs valuation issues between individualfirms and the Customs Department are settled within a legal framework. At present,CESTAT has three branches in different locations in India. As a matter of practice, casesbrought before the tribunal are notified and are placed in the public domain. Some ofthese cases were related to under-invoicing and were placed before the tribunal and a listof firms to be covered was prepared for the present survey. In total, 500 firms wereidentified from several notifications of CESTAT, based on number of criteria.
(c) Criteria for choosing sample
In the absence of a benchmark survey on customs valuation, very little a prioriknowledge was available about the statistical distribution of under-invoicing in India and itsstatistical parameters. Therefore, reliance had to be placed on information provided by

176
stakeholders with regard to the nature of under-invoicing practices in general in India andof activities of firms in this area in particular. The information received indicated thatunder-invoicing activities occurred for a range of products, but based on the CESTATinformation on the nature of reported cases, 50 important products were selected for thepilot survey.
It was reported that a large number of the firms were located in metropolitan cities,and mostly in Delhi and Mumbai, given the locational advantages. Some stakeholdersalso felt that such activities were highly predominant in machine tools, plastic products andbase metals, among others. Adequate attention was given to those suggestions whileselecting firms for the pilot survey. The pilot survey was, therefore, all-India in nature, butmore focused on certain areas and products.
(d) Survey methods
Taking into consideration time and resource constraints, it was decided to collectfirm-related information using the method of tele-interviews as well as the support of localcustoms station agents. In the process of data collection, special attention was given toacquiring information on the nature of the products imported, HS classification used forsuch transactions, the value of imports, and the extent of undervaluation settled in thecourt (both currently and in the past) from individual firms with confidentiality. Whileinterviewing firms, no structured questionnaire was formally circulated among them. Sincemany of the importing firms were not engaged in manufacturing, and were reluctant todivulge much of their company information, the queries were restricted to satisfying thedata requirements for the empirical analysis.
Information was successfully gathered from 320 firms, covering 50 products at theHS 10-digit level in national lines of India. Most of the firms were engaged in sucheconomic offences for multiple products.
2. Survey results and analysis
The survey interviews received good responses and it was possible to collect dataon key constraints being faced by the private sector in customs valuation. While presentingthe results, the views expressed by the manufacturing companies and the customs stationagents were broadly aggregated. Although some of the private sector representativesinterviewed were also holding positions in their formal industry organizations, most of themspoke in their individual capacity.
(a) Key private sector concerns
The interviews revealed some key concerns. Most of the private companiesinterviewed for this study together with CHAs confirmed that customs valuation remaineda gray area among all its activities. However, it was also pointed out that importers werenot subject to a penalty merely because they decided to appeal against the determinationof customs value by the Customs Department. In the discussions, it was explained that

177
after a rejection of transaction value up until agreed customs duty figures were decided,the importing firm ended up paying huge demurrage charges to the custodian (Port Trust,International Airport Authority of India, IAAI etc.).
As shown in figure III, most of the respondents found the rejection of transactionvalue to be a key constraint (35 per cent) followed by the frequent reference of cases toSVB (20 per cent), lack of experience of field staff (15 per cent), a lack of transparency(12 per cent), the imposition of demurrage charges and container retention charges(10 per cent), and classification (8 per cent).
Figure III. Major concerns over customs valuation
(b) Frequent rejection of transaction value
According to the interviews, the Customs Department officials did not follow thehierarchy of valuation options as mentioned in the Customs Valuation Rule, 1988 butjumped straight to the fall-back method (Rule 8). Although it was not possible to get datafrom the Customs Department to substantiate such claims, the growing number of caseswith CESTAT may well support this assertion. Under Rule 10A of the Customs ValuationRules, 1988, the Customs Department may reject the transaction value method in cases ofsuspected valuation fraud. This actually should apply in instances when there is reason todoubt the truth or accuracy of the value declared by an importer but no evidence for theCustoms Department to establish fraud.
Although arrangements for provisional assessment are possible, it requires bondsof a very high order. Moreover, the excess amount paid by private firms is not returned,
35%
20%8%
10%
12%
15%
Rejection of TV SVB related cases
Classification Demurrage and container charges
Lack of transparency Lack of experience of field staff
178
being classified as unjust enrichment . However, some of the problems related toclassification have been minimized since the harmonization of HS classification. Very fewrespondents raised this as an issue (8 per cent). Largely, problems arise among thosegoods that have unfamiliar designs. For example, most computer servers imported intoIndia have similar characteristics and therefore a clearly defined import duty. However,a new type of server was recently imported that included CVD, DVD and other devices/applications. The Customs Department insisted on imposing duty on each element of theserver separately. Thus, classification may emerge as one of the potentially contentiousareas as the pace of product innovation accelerates.
(c) Lack of transparency
It was found that frequent rejection of the transaction value resulted in the scopefor transparency being greatly reduced. Although most private operators find tools suchas NIDB given to officers are extremely useful and important in facilitating customs valuationwork. However, the traders interviewed had formed the opinion that in many instances theappraising officers simply enhanced the declared value based on contemporaneous importswithout paying attention to the quantity imported. As per Rule 5 (identical goods) andRule 6 (similar goods), comparable consignments will be charged at the same commerciallevel. However, the officers do not make adjustments in price by taking into account thedifferent quantity.
(d) Special Valuation Branch
The SVB of the Directorate of Customs Valuation deals with cases related toimports involving complex valuation issues such as related party imports, cases involvingpayment of royalties, licence fees, supply of materials and services by the importer. Mostof the complicated cases are transferred to SVB, which takes a long time to reacha decision as it is poorly manned, many of the survey respondents noted. They suggestedthat more trained manpower should be provided to SVB in order to improve efficiency andreduce the waiting period.
It appears that the operation of SVB is a major constraint to traders. Some of therespondents produced a CBEC circular (2001) suggesting that, after the submission of alldocuments by importers, the Customs Department would finalize the case within fourmonths. However, in practice this rarely happened. In many cases, the time taken was aslong as two years, during which the affected importer continued to pay a 5 per cent extraduty deposit. No multinational company likes to show the extra duty deposit as pendingwith customs in their balance sheets. With regard to refunds by the Customs Department,some of the respondents said they are never made while others said the refunds tookthree to four years.
(e) Transfers of officers from other services
The private sector representatives also pointed out that on several occasions officersfrom other services had been transferred to important and sensitive positions in the Customs
179
Department, especially at the field level where quick decisions needed to be taken. Someof these decisions have immense economic implications. It was pointed out that suchmovements of officers are made without realizing the severity of the situation. The provisionsof ACV are very detailed and are supplemented by detailed interpretative notes thatrequire special training and better administrative skills. This problem was also seen asone of the factors contributing to the growing number of orders passed by customs officersbeing set aside by CESTAT.
(f) Imports of substandard and second-hand goods
Most of the surveyed private companies reported imports of substandard andsecond-hand goods to be a major constraint as they found it extremely difficult to convincethe Customs Department to opt for the transaction value method. Usually, it is difficult tofind identical or similar commodities under this category when scrap and other such goodsare being imported. In such cases, the customs officers reportedly preferred to use thefall-back method.
The recently amended Foreign Trade Policy and Procedures (2006-2007) allowsimports of second-hand capital goods but restricts imports of re-manufactured goods.16
However, the definition of re-manufacturing is left to the Customs Department. As therehas been a surge in demand for reconditioned goods, the lack of specifications and a clearstatement on definition may create more confusion. Sometimes, old machines are dismantledand reassembled, with some new components being used to replace old parts. It is left tothe discretion of the customs officers to determine whether a machine is re-manufactured.
(g) Narrowing the problem
Most private sector companies are of the opinion that the additional restrictivemeasures imposed by the Customs Department are generally the result of misdeedscommitted by a few traders who may account for, at most, 15 to 18 per cent of total tradetransactions. There was a clear opinion that these few traders should be distinguishedfrom the majority. In this context, there might perhaps be room for some choice betweenpre-clearance control and post-clearance control. It was suggested that manufacturingunits might find it easier to deal with post-clearance audit while in case of the traderspre-clearance control should be made more stringent. The recent introduction of RMS isseen as an important step in this direction.
(h) Customs valuation and transfer pricing
Several key industries felt that efforts needed to be made to explore the possibilityof convergence between customs valuation procedures and transfer pricing norms, thelack of which is increasing cases of litigation in India. With the fast expansion of intra-firmtrade in India, there is a growing need to explore the gap and interplay between customsvaluation and other commitments such as direct taxation between related parties. Some
16 Rajagopalan, 2006.
180
of the surveyed companies also raised the point that the Government should ensuregreater convergence of rules and administrative practices in this area. Transfer pricing isused by multinational enterprises to determine the price and conditions for the transfer ofgoods, services and assets between their affiliated companies situated in different taxjurisdictions.17 These multinational enterprises are said to account for 60 per cent of worldtrade, and transfer pricing has become the number one issue in the international taxarena. While the focus has traditionally been on direct taxation, the customs dutiesdimension of transfer pricing now increasingly attracts the attention of both governmentand business.
In India, provisions under the Customs Act, 1988, Sections 14 1(A) and 14 1(B)provide for customs valuation of transactions that are not arms length18 while Sections112 and 114 (or Section 167 (8) of the Sea Customs Act), penalize improper tradetransactions. Section 111 allows for confiscation. Over-invoicing as well as under-invoicingof imports (Section 112) and exports (Section 114) are recognized as punishable economicoffences.
However, in ACV more needs to be attempted to bring in this type of convergence.In the Tokyo Round Agreement in 1979 and subsequently in Article VII of GATT, 1994,there is hardly any reference to transfer pricing, although a case is made for arms-lengthprice for customs valuation.19
(i) Undervaluation by firm type and sectors
The under-valuation issue is a pressing problem in India, and such economicoffences are often noticed for sizable number of products. Such activities are very closelyassociated with specific products where the market premium for the product plays animportant determining factor. Detection of such offences committed by companies isa complex task because similar economic offences are not committed uniformly across allimported products. The survey data have been utilized in understanding the vulnerabilityof products susceptible to under-invoicing.
In using the survey data to analyse behaviour at the product level, asymmetry wasfound in the distribution of firms engaged in under-invoicing activities for different products.It was also found that several firms were engaged in handling different products in severalsectors; hence, in this analysis, the focus was on revenue evasion by the firms and withimportance being attached to the size of the sample. As discussed above, the sample sizewas 320 firms, which had all been found guilty by CESTAT. The commodities that eachfirm was dealing with ranged from one to 10 products. Among the economic offenders,
17 World Customs Organization, 2006.
18 An arms length transaction is one in which the buyers and sellers of a product act independentlyand have no relationship to each other. In that context, arms length prices are prices that normallyprevail when buyers and sellers have no relationship.
19 Satapathy , 2001.
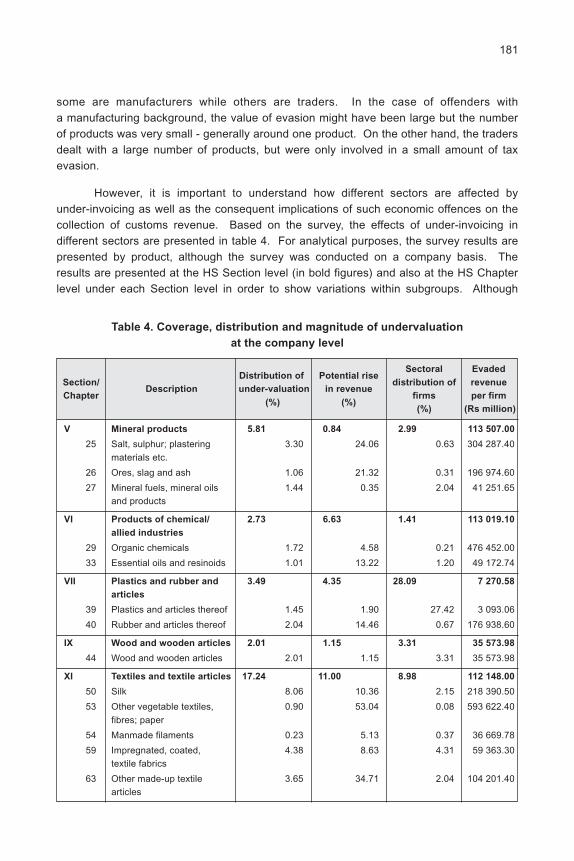
181
some are manufacturers while others are traders. In the case of offenders witha manufacturing background, the value of evasion might have been large but the numberof products was very small - generally around one product. On the other hand, the tradersdealt with a large number of products, but were only involved in a small amount of taxevasion.
However, it is important to understand how different sectors are affected byunder-invoicing as well as the consequent implications of such economic offences on thecollection of customs revenue. Based on the survey, the effects of under-invoicing indifferent sectors are presented in table 4. For analytical purposes, the survey results arepresented by product, although the survey was conducted on a company basis. Theresults are presented at the HS Section level (in bold figures) and also at the HS Chapterlevel under each Section level in order to show variations within subgroups. Although
Table 4. Coverage, distribution and magnitude of undervaluation
at the company level
Distribution of Potential riseSectoral Evaded
Section/Description under-valuation in revenue
distribution of revenue
Chapter (%) (%)
firms per firm
(%) (Rs million)
V Mineral products 5.81 0.84 2.99 113 507.00
25 Salt, sulphur; plastering 3.30 24.06 0.63 304 287.40materials etc.
26 Ores, slag and ash 1.06 21.32 0.31 196 974.60
27 Mineral fuels, mineral oils 1.44 0.35 2.04 41 251.65and products
VI Products of chemical/ 2.73 6.63 1.41 113 019.10
allied industries
29 Organic chemicals 1.72 4.58 0.21 476 452.00
33 Essential oils and resinoids 1.01 13.22 1.20 49 172.74
VII Plastics and rubber and 3.49 4.35 28.09 7 270.58
articles
39 Plastics and articles thereof 1.45 1.90 27.42 3 093.06
40 Rubber and articles thereof 2.04 14.46 0.67 176 938.60
IX Wood and wooden articles 2.01 1.15 3.31 35 573.98
44 Wood and wooden articles 2.01 1.15 3.31 35 573.98
XI Textiles and textile articles 17.24 11.00 8.98 112 148.00
50 Silk 8.06 10.36 2.15 218 390.50
53 Other vegetable textiles, 0.90 53.04 0.08 593 622.40fibres; paper
54 Manmade filaments 0.23 5.13 0.37 36 669.78
59 Impregnated, coated, 4.38 8.63 4.31 59 363.30textile fabrics
63 Other made-up textile 3.65 34.71 2.04 104 201.40articles
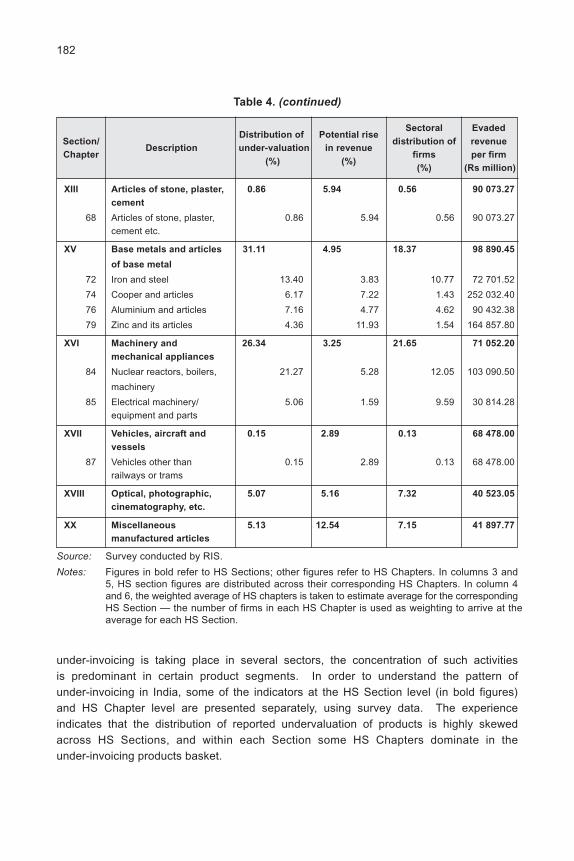
182
XIII Articles of stone, plaster, 0.86 5.94 0.56 90 073.27
cement
68 Articles of stone, plaster, 0.86 5.94 0.56 90 073.27cement etc.
XV Base metals and articles 31.11 4.95 18.37 98 890.45
of base metal
72 Iron and steel 13.40 3.83 10.77 72 701.52
74 Cooper and articles 6.17 7.22 1.43 252 032.40
76 Aluminium and articles 7.16 4.77 4.62 90 432.38
79 Zinc and its articles 4.36 11.93 1.54 164 857.80
XVI Machinery and 26.34 3.25 21.65 71 052.20
mechanical appliances
84 Nuclear reactors, boilers, 21.27 5.28 12.05 103 090.50
machinery
85 Electrical machinery/ 5.06 1.59 9.59 30 814.28equipment and parts
XVII Vehicles, aircraft and 0.15 2.89 0.13 68 478.00
vessels
87 Vehicles other than 0.15 2.89 0.13 68 478.00railways or trams
XVIII Optical, photographic, 5.07 5.16 7.32 40 523.05
cinematography, etc.
XX Miscellaneous 5.13 12.54 7.15 41 897.77
manufactured articles
Source: Survey conducted by RIS.
Notes: Figures in bold refer to HS Sections; other figures refer to HS Chapters. In columns 3 and5, HS section figures are distributed across their corresponding HS Chapters. In column 4and 6, the weighted average of HS chapters is taken to estimate average for the correspondingHS Section — the number of firms in each HS Chapter is used as weighting to arrive at theaverage for each HS Section.
Table 4. (continued)
Distribution of Potential riseSectoral Evaded
Section/Description under-valuation in revenue
distribution of revenue
Chapter (%) (%)
firms per firm
(%) (Rs million)
under-invoicing is taking place in several sectors, the concentration of such activitiesis predominant in certain product segments. In order to understand the pattern ofunder-invoicing in India, some of the indicators at the HS Section level (in bold figures)and HS Chapter level are presented separately, using survey data. The experienceindicates that the distribution of reported undervaluation of products is highly skewedacross HS Sections, and within each Section some HS Chapters dominate in theunder-invoicing products basket.

183
Some of the large product segments at the HS Section level are base metals,machinery and mechanical appliances, and textiles. Some other important broad productgroups are mineral products, plastic articles, optical photography instruments and othermanufactured items. Moreover, a high degree of variability in under-invoicing within thesebroad product groups (i.e., at the HS Section level) was also observed during the survey(i.e., at the HS Chapter level). For example, the detection of under-invoicing was verylarge in the base metals product segment (Section XV), and a break-down of itssubcomponents at the HS Chapter level is also presented. From the total customsundervaluation detected in the base metals segment, nearly 43 per cent is shared byiron and steel (Chapter 72). The case is similar in other broad aggregates at the HSSection level. It is important to note that undervaluation detected in the three sectorsincluding base metals, machinery and textiles constitutes nearly 75 per cent of the overallundervaluation detected in India.
The implications of detection of under-invoicing on customs revenue is important inthe context of the fast decline in revenue collection as a result of sweeping economicreforms in India, leading to a steep decline in the rate of customs duty. As the customstariff rate differs from one product to another, the revenue implications are varied in thedifferent product segments. In terms of product groups (i.e., at the HS Section/Chapterlevel), the likely increase20 in customs revenue as well as the average of each section arealso presented.21 The results show improved prospects for generating more revenue in thesectors of textiles, chemicals, stone and plaster, base metals and other manufacturedproducts.
3. Further analysis of key concerns
In view of the issues raised by the private sector, several government agencieswere interviewed and an effort was made to identify factors responsible for the key concernsof the private sector. Although satisfactory responses could not be obtained on all theissues, a summary of the information collected is presented below.
(a) Customs Department refunds
The perception that customs refunds were not being made was found to be incorrect.Table 5 shows that such refunds from 2000/01 to 2004/05 hovered around an average0.45 per cent share of total customs revenue. In 2004/05, the amount was almost Rs 187million. However, it was accepted that, in some cases, refunds took an exceptionally longtime.
20 The figures indicate the percentage rise in revenue collection in the post-detected period over thecustoms revenue declared before detection.
21 To arrive at the Section level figure (in bold), the weighted average of the data at the Chapter levelwas used. In this case, the number of surveyed firms in each HS Chapter is taken as the weightingwhile calculating the average at the HS Section level.
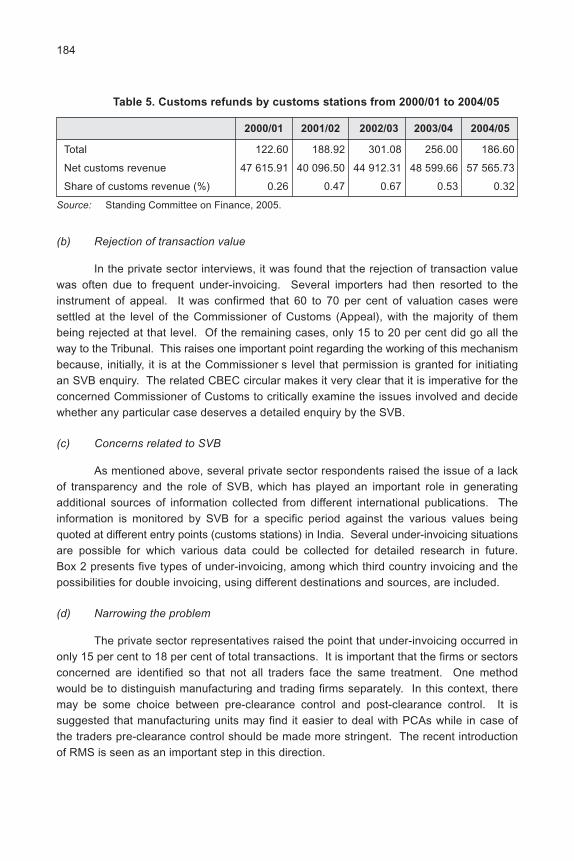
184
(b) Rejection of transaction value
In the private sector interviews, it was found that the rejection of transaction valuewas often due to frequent under-invoicing. Several importers had then resorted to theinstrument of appeal. It was confirmed that 60 to 70 per cent of valuation cases weresettled at the level of the Commissioner of Customs (Appeal), with the majority of thembeing rejected at that level. Of the remaining cases, only 15 to 20 per cent did go all theway to the Tribunal. This raises one important point regarding the working of this mechanismbecause, initially, it is at the Commissioner s level that permission is granted for initiatingan SVB enquiry. The related CBEC circular makes it very clear that it is imperative for theconcerned Commissioner of Customs to critically examine the issues involved and decidewhether any particular case deserves a detailed enquiry by the SVB.
(c) Concerns related to SVB
As mentioned above, several private sector respondents raised the issue of a lackof transparency and the role of SVB, which has played an important role in generatingadditional sources of information collected from different international publications. Theinformation is monitored by SVB for a specific period against the various values beingquoted at different entry points (customs stations) in India. Several under-invoicing situationsare possible for which various data could be collected for detailed research in future.Box 2 presents five types of under-invoicing, among which third country invoicing and thepossibilities for double invoicing, using different destinations and sources, are included.
(d) Narrowing the problem
The private sector representatives raised the point that under-invoicing occurred inonly 15 per cent to 18 per cent of total transactions. It is important that the firms or sectorsconcerned are identified so that not all traders face the same treatment. One methodwould be to distinguish manufacturing and trading firms separately. In this context, theremay be some choice between pre-clearance control and post-clearance control. It issuggested that manufacturing units may find it easier to deal with PCAs while in case ofthe traders pre-clearance control should be made more stringent. The recent introductionof RMS is seen as an important step in this direction.
Table 5. Customs refunds by customs stations from 2000/01 to 2004/05
2000/01 2001/02 2002/03 2003/04 2004/05
Total 122.60 188.92 301.08 256.00 186.60
Net customs revenue 47 615.91 40 096.50 44 912.31 48 599.66 57 565.73
Share of customs revenue (%) 0.26 0.47 0.67 0.53 0.32
Source: Standing Committee on Finance, 2005.
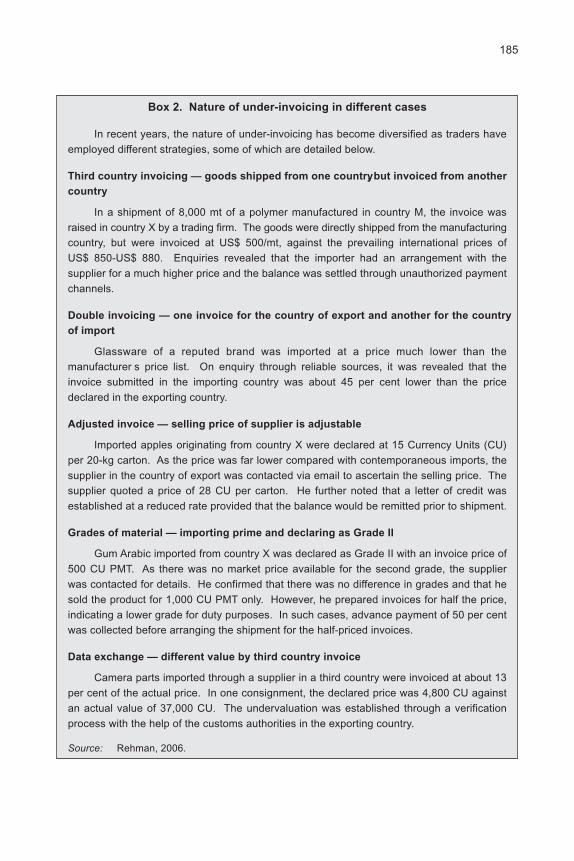
185
Box 2. Nature of under-invoicing in different cases
In recent years, the nature of under-invoicing has become diversified as traders haveemployed different strategies, some of which are detailed below.
Third country invoicing — goods shipped from one country, but invoiced from another
country
In a shipment of 8,000 mt of a polymer manufactured in country M, the invoice wasraised in country X by a trading firm. The goods were directly shipped from the manufacturingcountry, but were invoiced at US$ 500/mt, against the prevailing international prices ofUS$ 850-US$ 880. Enquiries revealed that the importer had an arrangement with thesupplier for a much higher price and the balance was settled through unauthorized paymentchannels.
Double invoicing — one invoice for the country of export and another for the country
of import
Glassware of a reputed brand was imported at a price much lower than themanufacturer s price list. On enquiry through reliable sources, it was revealed that theinvoice submitted in the importing country was about 45 per cent lower than the pricedeclared in the exporting country.
Adjusted invoice — selling price of supplier is adjustable
Imported apples originating from country X were declared at 15 Currency Units (CU)per 20-kg carton. As the price was far lower compared with contemporaneous imports, thesupplier in the country of export was contacted via email to ascertain the selling price. Thesupplier quoted a price of 28 CU per carton. He further noted that a letter of credit wasestablished at a reduced rate provided that the balance would be remitted prior to shipment.
Grades of material — importing prime and declaring as Grade II
Gum Arabic imported from country X was declared as Grade II with an invoice price of500 CU PMT. As there was no market price available for the second grade, the supplierwas contacted for details. He confirmed that there was no difference in grades and that hesold the product for 1,000 CU PMT only. However, he prepared invoices for half the price,indicating a lower grade for duty purposes. In such cases, advance payment of 50 per centwas collected before arranging the shipment for the half-priced invoices.
Data exchange — different value by third country invoice
Camera parts imported through a supplier in a third country were invoiced at about 13per cent of the actual price. In one consignment, the declared price was 4,800 CU againstan actual value of 37,000 CU. The undervaluation was established through a verificationprocess with the help of the customs authorities in the exporting country.
Source: Rehman, 2006.

186
(e) Frequent transfers of manpower
Despite several remedial steps taken by the Customs Department, the field staff isoften unacquainted with the valuation and assessment procedures. Examiners and appraisersare the first to interact with importers, but they are often unaware of nuances in this area.Department officials, especially those who come from agencies other than customs, areoften unaware of the nuances of customs policies, thus creating an extremely complicatedsituation for CHAs and importers. Most of the complicated cases are transferred to SVB,which takes a long time to deal with them as it is poorly manned. Therefore, adequatenumbers of trained staff should be provided at the field level and at SVB in order toimprove efficiency and reduce the time involved in settling such cases. In this context, theGovernment should also pay attention to the policy of transferring officials from otheragencies to key posts in the Customs Department; at least in areas where technical worksuch as valuation is involved, transfers should be avoided.
C. Policy recommendations and conclusion
As discussed above, imports in India have expanded at a phenomenal rate of40 per cent per annum in recent times. Despite this increase, very few cases facecustoms valuation-related constraints - between 3 to 4 per cent of the total transactions.However, this fact assumes importance in the light of the wider efforts being made by Indiato ensure trade facilitation. A difficult customs valuation regime reduces the impact of, andgains from a successful implementation of the trade facilitation agreement. In this regard,certain important measures may be taken by the Government, the international communityand trading partners.
One factor contributing to the decline in the number of reported cases ofunder-invoicing is that customs duties in India have been greatly reduced. However, thisremains a key concern of the trading community. It is a common perception that importersare generally engaged in undervaluation activities, particularly for consumer goods;however, the survey results indicated that such firms were engaged both in manufacturingand consumer products. The survey analysis indicated that a high concentration ofunder-invoicing had been detected in selected import sectors while other sectors werethinly reported on with regard to occurrences of such economic offences. At the macrolevel, the detection of under-invoicing is so high that customs revenue is likely to risesignificantly when evaded customs products are properly assessed and taxed. A largenumber of firms are engaged in under-invoicing. However, it is important to note that theaverage level of evaded customs valuation per firm differs significantly across sectors.
The other factor that eventually may contribute to a further decline in under-invoicingis the launch of a countrywide ACP and RMS for importers, under which regular importerswith a reputation for prompt compliance will be accredited. This accreditation will securethem assured facilitation at major customs ports throughout the country. Self-assessmentwith assurance of quick deliveries of their imported cargo without any examination by theCustoms Department is one of the key features. It will also help importers keep lean

187
inventories as well as reduce transaction costs. Some of the major conclusions and policyrecommendations are being summarized herewith.
1. Problem of under-invoicing
Under-invoicing of imported goods is an extremely serious and complex problemthat has a negative impact on the Indian economy in several ways. Duties and taxesescape the net and this results in gross economic distortions. This leads to an unevenplaying field and unfair competition, and is disadvantageous to goods manufactured inIndia. However, despite the general decline in customs duties there has been no majordecline in the instances of under-invoicing, which is still extensive given the tremendousresource demands in India. As is made clear in this study, under-invoicing is largelyattempted by traders although manufacturers are not far behind. High-risk sectors havealso been identified here. The estimated loss due to this activity is close to Rs 100 billion.The increased vigilance and deployment of modern systems in India such as theintroduction of an electronic RSM, which may alert staff to possible under invoicing, as wellas a database of indicative values for imported goods, may help in minimizing this loss.In addition, there appears to be some scope for the Customs Department to work moreclosely with industry players such as CHAs in identifying wrongdoers. The Indian proposalat WTO also assumes importance in this context, where the help of authorities in othercountries may also be accepted in obtaining evidence of under-invoicing.
2. Reduction of customs duties
The continuous reduction of customs duty appears to have helped to some degreein reducing the cases of under-invoicing. In India, consistent efforts have been made tolower import tariffs as the country integrates with the ASEAN economies. The policypronouncements through the budget speeches of different finance ministers in the pastdecade have suggested a reduction of the peak customs duty. In 1991, the averagecustoms duty was 99 per cent; by 2005, it had been reduced to 15 per cent while in 2006 itwas lowered further to 12.5 per cent. This lowering of tariff duties has a direct impacton the constraints related to customs valuation, as this may remove the incentives forunder-invoicing. Thus, a continuation of the policy of lowering duties may eventuallycontribute to tackling the problem of under-invoicing.
3. Transaction value as the main approach
India is one of the few developing countries to have changed over to the transactionvalue method while implementing the commitments made at the Tokyo Round of GATT in1988. Thus, the implementation of ACV in India, even after the relaxed time frame of fiveyears allowed for the developing countries, did not affect the system in a major way. Thetransaction value is largely accepted as a key technique for assessing trade consignments.It is being expected that new RMS schemes such as the Valuation Corridor , which willconsist of a database of highly sensitive commodities with permissible value bands definedfor allowing clearance without intervention, may help to strengthen the working of the

188
transaction valuation system. Any consignment having a declared value below the lowerlimit of its value band will be redirected for assessment by the Customs Department.
The second part of the valuation component of RMS concerns its contribution togeneral risk evaluation. Here, the risk is computed statistically for various risk elements,including valuation. Each area is assigned a maximum risk index and every commoditybeing imported will be evaluated in terms of a percentage of the total risk.
The third part of the valuation risk component will be the use of interventioncorridor in RMS to study the valuation trend of newly identified sensitive commodities, andto monitor the efficacy of the Valuation Corridor . In this context, the SVB role should alsobe analysed in an objective manner. As revealed by several private sector representatives,SVB occupies a huge discretionary space that, at times, creates enormous costs for thetrading community and eventually increases transaction costs.
4. Voluntary compliance culture
The private sector, together with the agencies concerned at the sectoral level,would have to be encouraged to promote a culture of voluntary compliance. In the case ofexports, this is being dealt with in the context of SPS/TBT commitments, as in India thereis excessive focus on exports while very little attention is being paid to industry responsibilityin helping the Customs Department to manage constraints such as under-invoicing. Althoughindustry and the Customs Department have informal links for collecting such information,there are no structured mechanisms within the industry forums for addressing suchchallenges. Various export councils are working at this point with sectoral focus. Theirhelp may be sought in identifying incidents of fraud that include under-invoicing, tariffmisdeclarations, incorrect use of tariff headings, non-declaration of goods and the importof counterfeit goods.
The private sector, together with other stakeholders, may also help in therealignment of resources including arranging appropriate equipment needed for continuingand improving the reform process so that their firms and industry as a whole remain ona par with the new technologies being adopted by the Customs Department.22 The role ofthe private sector is particularly important in this regard. This assistance would be mostimportant in terms of fighting against fraud in the import process and in continuing thedialogue with all stakeholders to identify specific areas where the private sector cansupport capacity-building. Another means of promoting ownership of reform that could beintroduced by the Customs Department is the identification of sectoral profiles of industrialgroupings, which potentially could help in finding common solutions to shared problemsthrough exchanges of experiences.
22 Kunio, 2002.

189
5. Frequent updating of databases
The launch of services such as NIDB has helped the Customs Department in termsof facilitating assessment activities. However, it is equally important to maintain andupdate the facilities created by DOV, such as NIDB, so that the full benefits in terms ofenhancing trade facilitation potential may be realized. As emphasized by the privatesector survey, there is a huge time lag in updates, which creates various problems amongdifferent sets of importers. It may be a prerequisite to institutionalize such changes andthe appropriate bureau resources dedicated to the maintenance and upgrading of thedatabases. In fact, the NIDB product description convention is to be improved to make itmore precise and to ensure that the data are regularly updated in line with the market.This may help in reducing unnecessary friction between customs authorities and importersregarding the use of the value-range information system.
6. Information sharing
The joint proposal by India and the United States in TN/TF/W/57 sets out thebasic approach to the establishment of a multilateral mechanism for the exchange andhandling of information between WTO members. It is the second communication fromIndia to spell out the exchange of trade transaction information consisting of data elementsand documents that are usually collected by customs at the time of importation orexportation.23 Such exchanges of information may be made through a nodal agencydesignated by each customs administration, and which would be kept confidential as perArticle 10 of the WTO Agreement on Customs Valuation. There could be a cooperationmechanism for exchanging specific information at the multilateral level, as bilateralagreements are not always easy to enter into and which, at times, are limited in nature.Initially, this may be for a limited number of cases such as information on customsvaluation, HS classification, full and accurate descriptions, quantity, and the origin ofgoods in identified cases where there is reason to doubt the truth or accuracy of thedeclaration filed by an importer or exporter. This may not involve serious implications asfar as technical assistance needs are concerned, as this can be achieved through theexisting administrative set-up of customs administrations.
During the negotiations, some countries raised objections regarding data sharing,quoting domestic laws on confidentiality. Therefore, it would be pertinent to have someunderstanding of these sensitivities. However, it must be realized that the idea for sucha multilateral arrangement is as old as ACV itself. An International Convention onMutual Administrative Assistance for the Prevention, Investigation and Repression ofCustoms Offences was conceived in 1977 at Nairobi under the auspices of CCC.24
Known as the Nairobi Convention, in its preamble it acknowledged that offences againstcustoms law are prejudicial to the economic, social and fiscal interests of States and to
23 World Trade Organization, 2005.
24 Satapathy, 2000.
190
the legitimate interests of trade and that action against customs of fences can be renderedmore effective by cooperation between customs administrations. This Convention stillawaits endorsement but such frameworks are needed as a part of ACV.
7. United Nations Valuation Databank
This issue has been discussed by WCO in different forms at various forums.However, in order to promote global convergence and a uniform application of the harmonizedsystem and valuation practices, it would be useful if any relevant agency within the UnitedNations system were to consider taking the lead in establishing a valuation database thatcan be referred to widely whenever needed by any member country s customs authorities.25
This may help in checking further erosion of the WTO Valuation Agreement. As a significantnumber of companies undermine the prescribed duty rates and indulge in activities suchas under-invoicing, some mechanisms for providing back-up information would proveextremely important.
In the United Nations Trade Database, it is possible to capture the value of importsreported by a country with the value of exports in the SITC classification, while taking duenote of the amount of costs including freight as these may vary from country to country,depending on the magnitude of insurance premiums, transport charges, port charges etc.However, this database may still offer considerable assistance.
8. Convergence of approaches in transfer pricing and
related party transactions
During several meetings with private sector representatives, it was pointed out thatthe Government should explore the possible convergence of the different approachescurrently being taken by the Customs Department and the Income Tax Department. It waspointed out that this situation frequently leads to cases of parallel litigation in India. Thus,there is a need to develop international understanding, preferably as part of ACV, so thatnational governments can work out their policy responses to this issue. The furtherelaboration of ACV provisions related to transfer pricing - which, at this point, only coverarms-length prices comparable to test values arrived at from sales of identical or similargoods - may help. This elaboration may come close to the OECD guidelines related totransfer pricing, but should take fully into account the issue of revenue generation, as thisissue remain a key concern of many developing countries.
In the context of related party transactions, customs valuation poses a hugechallenge. The issue becomes more pronounced in situations where an imported productcomprises a combination of hardware and software. Software is often customized to suitspecific country/customer requirements. The differentiation in the product supplied toother countries, in such cases, is extremely difficult and requires a fair degree of technicalknowledge to understand and adjudicate matters. In addition, the price at which goods are
25 World Customs Organization, 2003; Satapathy, 2002.

191
supplied to other countries may or may not represent a comparable price as variousfactors are considered in pricing a product for each country. Customs authorities often donot have adequate information or training to understand the differences. More often thannot, the price at which identical or similar goods are supplied by the exporter to subsidiaries/joint ventures in other countries is accepted as a comparable price by the CustomsDepartment in India. In fact, the Customs Department is often specifically requested todeclare the prices at which goods are supplied to India. However, an importer in Indiafinds it extremely difficult to obtain such information from an exporter, especially if theexporter is holding a small stake in the importer s business (say, between 5 and 10 percent), as such information is considered confidential. With increasing global trade andinvestment, there is a need to consider whether a shareholding of less than 26 per cent inthe absence of any other relationship ought to be considered as a relationship for thepurpose of valuation under GATT Valuation Rules. There is also a need for clear provisionsfor working out the effect of indirect holdings for determining such a stake. It is a fact thatshareholding is often arranged through a web of entities and it becomes very difficult forthe importer to obtain full information.
9. Regional cooperation in Asia and the Pacific
There has been a sudden surge in activities related to bilateral, subregional andregional trade and customs cooperation in the Asia-Pacific region. The arrangementswithin these different agreements and frameworks (harmonized forms/certificates andother support documents such as road consignment notes, contracts and import licences;origin/destination and transit requirements; and transport charges) should be taken intoconsideration in order to determine how to realize their potential use and benefits, especiallywhen addressing the current concerns over customs valuation.
In this context, it is worth noting the work being done by CCC.26 Currently, theparticipating countries mainly include Central Asian countries such as Azerbaijan, China,Kazakhstan, Kyrgyzstan, Mongolia, Tajikistan, Turkmenistan and Uzbekistan. This workmay be further expanded to subsume an Asia-wide programme in order to provide supportfor customs valuation-related activities.
26 Asian Development Bank, 2002.

192
References
Asian Development Bank, 2002. First meeting of the Customs Cooperation Committee,Urumqi, China, 20-21 August.
Alburo, A. Florian, 2006. Customs valuation issues and possible research methodologies ,paper presented at the ARTNeT Project Meeting, Bangkok.
Central Board of Excise and Customs, 2001. Valuation (Customs) - Review of Instructions ,Circular No. 11/2001-CUS. New Delhi, Ministry of Finance.
Chaturvedi, S., 2006. An evaluation of the need and cost of selected trade facilitationmeasures in India: Implications for the WTO negotiations , ARTNeT Working PaperNo. 4. Asia-Pacific Research and Training Network on Trade (ARTNeT), Bangkok.
Duval, Y., 2006. An exploration of the need for, and cost of selected trade facilitationmeasures in Asia-Pacific in the context of the WTO negotiations , Studies in Tradeand Investment, No. 57. Bangkok, ESCAP.
Economic Survey, 2005-2006. Ministry of Finance, New Delhi.
, 2004-2005. Ministry of Finance, New Delhi.
Financial Express, 2006. Exporters cannot claim 4 per cent CVD exemption, clarifiesCBEC , 26 July.
The Hindu Business Line, 2006. Customs duty collections will meet budget estimates ,28 June. New Delhi.
Kunio, M., 2002. Challenge to implement the Agreement on Customs Valuation , addressat the WTO Seminar on Technical Assistance on Customs Valuation, 6-7 November2002, Geneva.
Majumder, S.D., 2005. Customs Valuation Law and Practice, fifth edition. New Delhi,CENTAX Publications Pvt. Ltd.
Rajagopalan, T.N. C., 2006. Trade policy unclear on old goods , Business Standard,17 April.
Rege, V., 1999. Developing country participation in negotiations leading to the adoptionof the WTO Agreement on Customs Valuation and Pre-shipment Inspection , WorldCompetition, vol. 22, No. 1.
Rehman, S.K., 2006. Implementation of WTO Customs Valuation Agreement in India(mimeograph). Mumbai, Directorate of Valuation.
Satapathy, C., 2002. Customs Valuation in India, third edition. Mumbai, MVIRDC WorldTrade Centre.
, 2001. Transfer pricing: Impact on trade and profit taxation , in Economic andPolitical Weekly, 19 May.
, 2000. Implementation of WTO Agreement on Customs Valuation , Economic andPolitical Weekly, 17 June.

193
Standing Committee on Finance, 2005. Seventeenth Report. 2004-2005. New Delhi, LokSabha Secretariat.
Sriram, B., 2001. Breach of a concept , The Hindu Business Line, 20 October.
Srivastav, A.K., 2003. Intensive Course on the WTO Customs Valuation Agreement: AnOverview of Indian Customs Valuation Database, Asian Development Bank,Singapore, 24-28 February.
World Customs Organization, 2006. Background Paper for WCO/OECD Conference onTransfer Pricing and Customs Valuation, 3-4 May, Brussels.
, 2003. Report of the Policy Commission, WCO, Brussels, Doc. SP0119E1.
World Trade Organization, 2005. Cooperation mechanism for customs compliance ,communication from India, TN/TF/W/68.

195
VI. IMPLEMENTATION OF THE WTO CUSTOMS
VALUATION AGREEMENT IN NEPAL: AN EX
ANTE IMPACT ASSESSMENT
By Pushpa Raj Rajkarnikar*
Introduction
Nepal became the one hundred and forty-seventh member of WTO, and the firstLDC member to enter through the regular accession process, on 23 April 2004. Under itscommitment, Nepal had to implement the WTO Agreement on Customs Valuation (ACV)as per the action plan by 1 January 2007, and to introduce Acts and regulations compatiblewith the provisions of the agreement. However, the likely impact on trade, price andrevenue has yet to be assessed.
The basic purposes of ACV are to require countries to adopt a valuation systemthat is fair, neutral and uniform, and to prevent the use of arbitrary or fictitious values(Rege, 2002). For customs purposes, Article VII of GATT (WTO, 1995) requires the valueof imported merchandise to be based on actual transaction value.
A transaction-based valuation system was introduced by Nepal in 1997. However,the Nepalese customs administration faces continuing difficulties in determining transactionvalues based on commercial invoices (Ghimire and others, 2005). The customs officialsfeel uncomfortable with the process of appraisal and verification of transaction values.Similarly, traders are not satisfied with the provisional valuation made by customs on thebasis of reference values. Traders complain that there is lack of transparency, fairnessand competency in that area (ESCAP, 2006). Therefore, the need to identify the problemsthat are likely to be encountered in the course of implementing ACV and provide the mostsuitable solutions is urgent.
This chapter attempts to answer the following questions:
(a) Will the implementation of ACV exert a positive impact on imports?
(b) What will be the effect of implementing ACV on price levels?
(c) Will implementation of ACV contribute to an increase in revenue?
(d) What are the difficulties related to successfully implementing ACV?
* Pushpa Raj Rajkarnikar is former Executive Director Institute for Policy Research and Development(IPRAD), Nepal. D.P. Ghimire, D.R. Upreti and D.L. Kishi provided excellent research assistance forthis study. The author is also grateful to Yann Duval, D.R. Khanal and an anonymous reviewer fortheir valuable comments. The author can be contacted at [email protected].

196
(e) Are the available human and other resources within the Customs Departmentadequate for, and compatible with implementing ACV?
The study detailed in this chapter is based both on secondary and primary data.Secondary sources of information have been used for a comparative analysis of theexisting system of valuation and the WTO (2004) system of valuation. Related Acts,regulations and agreements were thoroughly reviewed. Problems in the implementation ofACV have been identified through discussions with selected customs officials in the threemain customs offices and the Customs Department. The study was mainly based onqualitative analysis. However some simple quantitative exercises together with a briefopinion survey among customs agents were conducted in order to assess the likely impactof change in the valuation practice on trade, prices and revenue.
The chapter is divided into four sections. Section A consists of a literature reviewwhile section B provides a comparative analytical review of the existing valuation systemand the WTO valuation system. An assessment of the likely impact of change in valuationsystem on trade, prices and revenue is detailed in section C. In conclusion, section D putsforward policy recommendations for ensuring the successful implementation of the WTOvaluation system in Nepal.
A. Review of literature on customs valuation
Customs valuation of goods is an important aspect of trade facilitation. Walsh(2003) defined it as an important element in a variety of other aspects of internationaltrade including statistics, quotas and licensing arrangements, taxes and other chargeslevied on imports, and the application of preference systems. Customs duties are leviedmostly on an ad valorem basis and customs valuation is usually the basis on which tariffand tax liability is calculated. Hence, it is important to establish generally acceptable rulesand system for the valuation of imported goods.
In view of such importance of the valuation of goods, procedures for determiningthe dutiable value of imported commodities have been the subject of internationalnegotiations since the early 1920s. Rege (2002) presented a brief account of the historicaldevelopment of valuation agreement. The formal history of customs valuation startedwith the establishment of the League of Nations, but the agreement between nations oncustoms valuation was not finalized until the general conference held in 1947 by theUnited Nations on trade and employment. The conclusions of this conference wereincorporated in Article VII of GATT.
Article VII requires that the value for customs purposes of imported merchandisebe based on actual value . However, it also allows countries substantial flexibility indefining the actual value of imports, thus permitting GATT contracting parties to usewidely differing valuation practices. In 1950, in an effort to achieve greater harmonizationof valuation practices, BDV was developed by 13 European governments. Under BDV, theprice of imported merchandise was to be determined based on the price of the merchandise
197
or the price that the merchandise would fetch if sold on the open market under fullycompetitive conditions in the importing country. The basic elements of BDV are price,time, place, quantity and commercial level. This concept implies that there is a notionalprice that can be determined by customs on the basis of available information, taking intoaccount the conditions and other circumstances related to the specific transaction beingvalued.
Against the notional concept of BDV, on the other hand, big countries such asAustralia, Canada, New Zealand and United States used a positive concept of valuation,laying down the standards based on the price actually agreed on in the sale. Since thepreparatory phase of the Tokyo Round, the European Union had been seeking forimprovements in the GATT rules on valuation, reflecting their desire to restrict customsauthorities discretion. In a November 1977 meeting, the European Union agreed to makea fundamental change in its valuation systems by opting for a positive approach instead ofthe notional approach of BDV. The draft agreement required that in all cases the customsvalue should be determined on the basis of price paid or payable for the imported goodsin the particular transaction. This meant that customs authorities should, as a rule, acceptthe invoice price .
However, most developing countries did not join the new valuation agreement forfear of the undervaluation of goods, which would lead to significant revenue losses. Thesituation changed with the Marrakech Agreement, which established WTO, and ACV hasnow become binding on all member countries. However, the Uruguay Round also offeredLDCs extra flexibility in implementing WTO agreements.
The multilateral trade negotiation effort known as the Uruguay Round commencedin 1986 and was concluded in December 1993. The agreement was amended during theUruguay Round trade negotiations in 1994 and was recognized as the WTO Agreementon Implementation of Article VII of GATT, 1994 . The outcome of this round on customsvaluation was to reinforce Article VII of GATT.
Walsh (2003) explained the various provisions of ACV and their implementationprocedures. The Agreement on Implementation of Article VII of GATT, 1994, which cameto be referred to as the WTO Agreement on Customs Valuation, was one of the results ofthe Tokyo Round of GATT negotiations. It officially came into force on 1 January 1981 andwas adopted by various signatories from the mid-1980s onward. The agreement establishesthe rules for the valuation of imported goods that must be applied by all member countries.It requires, as its basis, the use of the transaction value (selling price) between buyer andseller. It also specifies alternative methods to be used in sequential order for determiningvalue when the transaction value cannot be determined under Article 1 (see Annex fordetails).
Under ACV, developing member countries are allowed to delay application of theagreement for a transition period of five years after their entry into WTO. However, theCommittee on Customs Valuation is empowered, on request, to grant an extension of thetransition period. Moreover, Part II of the agreement provides for administration, consultation,

198
and dispute settlement, including the creation of a GATT Committee on Customs Valuationand a Technical Committee of Customs Valuation, whose operation has been delegated toWCO. The main rules of customs valuation, as laid down in the Agreement onImplementation of Article VII of GATT, 1994, are explained in annex 1 to this chapter.
In Nepal, the process of customs valuation for the purpose of customs tariffs wassystematized only after the introduction of the Customs Act, 1962 (Ministry of Law, 1962).Accordingly, preparation of a brief valuation manual in traditional form was prepared anda system for record keeping of product prices, which was not included in the manual, wasintroduced. In 1997, the Customs Act was amended and the value system of officialreference prices was, in principle, replaced by a transaction-based valuation system(Government of Nepal, 2004). Following an amendment, the new basic valuation provisionswere included in the Customs Act, 1962 and implementation rules were included in theTariff Act.
However, the Customs Department did not apply the provisions of Articles 5, 6and 7 of the Agreement of Implementation of Article VII of GATT, 1994 regarding deductive,computed and fall-back method of valuation, respectively. Even after the seventh amendmentin 1997, there were no provisions in the Customs Act, 1962 on how the Customs Departmentshould act in cases where a buyer and a seller were related to each other. Even before itsaccession to WTO, Nepal was examining the modifications that would have to be introducedin current legislation and practices in order to fully implement ACV. However, the legalsystem has yet to be made fully compatible with ACV.
In the course of joining WTO, Nepal intended to adopt the valuation methods ofArticles 2, 3, 5, 6 and 7 as well as improve Nepalese legal provisions in implementinga WTO-consistent regime. For this, Nepal committed to incorporating the remainingprovisions of ACV into the Customs Act, 1962 and the Customs Regulations, 1969. Atimetable for the enactment of legislation implementing the agreement was provided in thelegislative Action Plan circulated in document WT/ACC/NPL/10/REV I and in the ActionPlan circulated in document WT/ACC/NPL/15.
The Customs Department of Nepal began implementing a three-year CustomsReform Action Plan in 2003/04. The plan accorded high priority to institutionalizing scientificcustoms valuation procedures, among others. Accordingly, the ASYCUDA system is beingintroduced to computerize valuation treatment, and a comprehensive valuation manual isbeing prepared. In addition, post-entry verification and PCAs are being introduced ona trial basis. Article 20.3 of ACV contains a provision for technical assistance to ensuremember countries have the capacity to fully implement the agreement.
In accordance with Section 37 of the Customs Act, 1962, importers have the rightof appeal to the Revenue Tribunal against the decisions of customs officials in thedetermination of customs value. Meanwhile, the establishment of an independentadministrative tribunal on the right to appeal against an administrative decision of thecustoms authority regarding customs valuation is underway. Training of customs officials

199
in the areas of clearance, verification, audit and methods of combating valuation fraud isalso being conducted.
Evasion of duty through undervaluing or misdescribing imports is an acute problemin developing countries. King and others (2003) estimated that under-invoicing waswidespread in Nepal, indicating a lack of effective valuation procedures. Also, the transactionvalue system was introduced without adequate preparation, training and a value informationsystem, and without putting in place the necessary procedural and organizational framework(King and others, 2003). According to Filmer (2003), on the other hand, the tradingcommunity held the view that declaring a higher value resulted in clearance delays inorder to extract illegal payments. Ghimire and others (2005) reported that major problemsin customs valuation included under-invoicing of goods, the use of discretionary power bycustoms officials and a limited database for value appraisal. A limited database for valueappraisal is considered a violation of ACV. A perception survey conducted by Rajkarnikarand others (2005) also identified customs valuation as one of the major issues hinderingtrade facilitation in Nepal.
A trade and competitiveness study in 2003 gave a brief account of Nepal s existingvaluation procedure and its inherent problems. According to the study, the Department ofCustoms had difficulty in determining the transaction value based on the invoice providedbecause procedures for determining the value were not fully developed or understood. Allthe above studies indicate the need to implement ACV, because it provides a fair, uniform,and neutral system for the valuation of goods for customs purposes, conforms to commercialrealities and prohibits the use of arbitrary or fictitious customs values.
Valuation fraud is a serious problem in most countries, and particularly in developingcountries that have relatively high rates of duties and other various taxes on importedgoods. It is often exacerbated by a generally poor level of tax compliance throughout thecountry, a tendency for many importers to deliberately maintain poor records and theexistence of a special relationship with suppliers. WTO valuation rules require anadministration to accept the declared transaction value (even when clearly unreasonable),unless the authenticity of the supporting invoice can be unequivocally disproved by theauthorities. Developing countries are of the view that requiring customs to accept thetransaction value reflected in invoices submitted by importers would impede detectionof cases in which imported goods were undervalued to reduce the incidence of duties(Rege, 2002). Most of the implementation requirements for valuation on the basis of ACVare lacking in developing countries. Such requirements include (a) the establishment ofa legislative and regulatory framework, (b) a mechanism for judicial review, (c) effectiveadministrative procedures, (d) an organizational structure and (e) training. It is incumbentupon customs administrations to develop the system and procedures necessary to effectivelycontrol undervaluation.
Finger and Schuler (2000) argued that the agreement was imposed on developingcountries in an imperialistic manner, with little concern for what it would cost such countriesto change over from BDV to the new system, how it would be carried out or whether it
200
would support their development efforts. Finger and Schuler also observed that ACVprovided neither an appropriate diagnosis nor an appropriate remedy for the problems ofLDC customs administration. Because of the differences in trading environments and theabsence of adequate computer systems and databases, customs officials of developingcountries remain apprehensive that the application of WTO standards will create practicalproblems.
A lack of proprietary feeling among WTO member countries with regard to theagreement, a lack of prospects for immediate advantages, and inadequate technical andfinancial assistance responsive to the needs of developing countries is hindering rapidapplication of WTO standards. Nepal is no exception.
A study conducted in 2004 as a part of the Integrated Framework for Trade-RelatedTechnical Assistance - Nepal, argued that adopting WTO valuation methods would bebeneficial only after customs inspectors had received training in valuation methods as wellas access to a database with pricing information. Otherwise, the study noted, usingtransaction values simply opened the door to fraudulent invoicing. Finger and Schuler(2000) concluded that the Uruguay Round customs valuation agreement presumed anadministrative environment that did not exist in many LDCs.
Only a few studies related to customs valuation have been undertaken. Althoughsome of those studies deal with different aspects and issues of customs valuation inNepal, none provide an assessment of the likely impact of implementing ACV.
B. Customs valuation in Nepal
1. Past practices
Nepal was almost isolated from rest of the world until the political changes of 1950.Traditionally, Nepal s trading partners were limited to India and Tibet. Tariffs on goodsimported from Tibet used to be fixed at a specific rate. However, in the case of trade withIndia, both specific and ad valorem duties were levied. There was no system of customsdeclaration by importers before 1945. Instead, customs officials used to inspect and valuethe goods. Thus, the valuation system was in practice even before 1950. However, therewas no integrated and uniform system of customs valuation. The process of customsvaluation used to be different in different parts of the country. Also, there was no integratedcomprehensive customs legislation. In the Rana regime (i.e., before 1950) only governmentdirectives, known as Sanads and Istihars, were issued to regulate customs. In 1945, allprevious Sanads and Istihars were repealed and a single Sawal (also a set of governmentdirectives) was introduced for customs purposes; thus, for the first time, the declaration ofgoods by importers at customs points was started.
A trade treaty was signed with India in 1950, which contained a provision thatNepal would receive a refund of Indian excise levied on goods imported into Nepal directlyfrom Indian manufactures. Accordingly, the importers had to declare the value of goods

201
and submit invoices for the goods. Customs officers used to verify the invoice prices withthe border prices of similar goods between India and Nepal. Thus, the practice of levyingad valorem duty expanded after the trade treaty was signed with India. In addition, a newera of the rule of law began with the establishment of a democratic system in Nepal in1950. As a result, a Tariff Board was formed and a Customs Commission was establishedin 1957.
In Nepal, the customs valuation process for the purpose of setting customs tariffswas systematized only after the introduction of the Customs Act, 1962. Accordingly, thevaluation of imported and dutiable goods began as per the Act. A valuation guide booklet(a list of reference prices) was published and a system for recording product prices wasintroduced. The valuation guide booklet was updated with regard to imports from thirdcountries other than India, and published based on consultations with various organizations/stakeholders such as the Federation of Nepal Chambers of Commerce and Industry, theNepal Chamber of Commerce and the Nepal Overseas Export-Import Association. Forthis purpose, Customs Department records, information received from sellers, contractsbetween buyers and sellers, documentary evidence submitted by importers, internationalmarket prices of products and agency price lists were used. In general, the invoice pricewas taken for granted if the value was more than that listed in the booklet. The valuationof goods was based on the Kolkata CIF price (Customs Department, 2004). If an importerdid not declare the value and if it was a first-time case, the valuation was made on thebasis of the customs reference record. If there was no reference record and the importerwas unable to submit satisfactory documents, the customs officers could determine thevalue up to an estimated amount of Rs 125,000. For a value determination exceeding thisamount, approval of the Customs Department director-general was required. There wasalso a provision allowing the Government to purchase goods if the declared value waslower than 50 per cent of the actual price.
With regard to imports from India, there are three types of trading arrangements:(a) the Duty Refund Procedure (DRP), (b) in-bond imports and (c) the Local PurchaseSystem. Under DRP and in-bond imports arrangements, valuation was made by addingfreight and insurance to the ex-factory price. Under the Local Purchase System, valuationwas carried out with the use of a booklet prepared based on suggestions received fromregional meetings of the border customs chiefs. In valuing goods, an amount equivalent to5 per cent was added to the price mentioned in the booklet to account for freight andinsurance. Known as the Set Value System, this method was introduced in order tomaintain uniformity in the value of imported goods at all customs offices through referenceto the booklet.
With the rapid development of science and technology, various new productsbegan to emerge. As frequently updating the booklet proved impractical, the valuation ofnew products was then based on catalogues and other documentary evidence submittedby importers. Price records for such new products were maintained and used as the basisfor valuing similar goods. In cases where an invoice was submitted showing a valuehigher than the recorded price, record was revised accordingly.

202
2. Current valuation policy and practices
The Customs Act, 1962 (amended in 1997) was a landmark with regard to customsvaluation. The amendment, for the first time, recognized the transaction value as a basisfor customs valuation. Following the amendment of the Customs Act, 1962, The CustomsRegulation, 1969 was also amended. According to the amended provisions of the said Actand Regulation, assessment of the customs value of imported goods began to be madebased on the invoice price. This amendment conceptually and legally recognized theWTO/GATT valuation system based on the transaction value. However, in order to justifythe transaction price of the imported goods, the importers have to submit invoices andother documents as requested by the customs officials. It is the duty of each importer toprove the authenticity of the bills, invoices or documents submitted by them. According toamended Section 13 of the Customs Act, 1962, if the transaction price as quoted by theimporter does not correspond to the procedure for fixing the actual transaction value or incases where importers cannot submit the transaction price of goods, customs will refer tothe value of similar or identical goods imported into Nepal. If necessary, customs will fixthe price of based on recorded prices, previous prices of identical or similar goods, referenceprices, suggested price lists of manufacturers, local market prices, international marketprices and other available information.
Implementation rules were also formulated in this regard. In order to check forcommercial fraud and valuation discrepancies, the PCA system together with provisionsfor fines and penalties for offenders were also introduced. In addition, provision was madefor surety bonds and fixation of provisional values for immediate clearance in cases wherethe transaction value of goods could not be ascertained and the importer wishes to clearthe goods beforehand.
In the course of joining WTO, Nepal committed to improving its legal provisions inorder to implement a WTO-consistent regime, including customs valuation. An actionplan for implementing ACV in Nepal was provided in Legislative Action Plan documentsWT/ACC/NPL/10/RVI and WT/ACC/NPL/15.
The main items contained in the Action Plan for Implementation of the Agreementon Customs Valuation, submitted to WTO by the working party on the accession of Nepal,included:
(a) Further amendments to the Customs Act and Customs Regulations, enactingthe legislative framework for the gradual implementation of valuation hierarchywith regard to transaction valuation;
(b) Amendments to current legislation in order to establish an independentadministrative tribunal for the right of appeal against administrative decisions;
(c) Training of customs officials in the areas of clearance, verification, audit andmethods of combating valuation fraud;
(d) The preparation of a customs valuation manual;

203
(e) Provisions of interpretative notes in laws and regulations;
(f) The gradual implementation of a valuation hierarchy - further amendments tolegislation to complete the implementation of imputed value, computed valueand enforcement of controls on prohibited forms of valuation.
As a developing country, Nepal enjoyed a grace period of three years to fullyimplement ACV. This means Nepal was not required to implement all the provisions of theagreement immediately. However, it was bound to introduce all provisions of the valuationagreement from 1 January 2007. Hence, Nepal adopted a policy of implementing WTOvaluation provisions gradually and progressively.
As mentioned above, implementation of a three-year Customs Reform Action Planbegan in financial year 2003/04 with various objectives, including institutionalization ofscientific customs valuation procedures as well as making customs valuation systemsmore scientific and transparent. Accordingly, the ASYCUDA system was introduced for thecomputerization of valuation treatment. Post-entry verification and PCA are also beingcarried out on a trial basis. Nepal is seeking all available external technical assistance,including that under Article 20.3 of ACV, to ensure that it has the capacity to fully implementthe agreement when the transition period expires. Legal and infrastructural developmentrelated to implementation of the agreement is also in progress. Meanwhile, a Manual onCustoms Valuation and Post-clearance Audit compatible with WTO is being preparedunder the Nepal Window II Trade-Related Capacity-Building Programme by UNDP incoordination with the Government of Nepal. The Customs Department has also startedupdating valuation data on major commodities and is being assisted by the Trade PromotionCentre, which is supplying the international market prices of major commodities. The aimof the Customs Department is to settle valuation issues within the specified period.
The Government of Nepal, in the process of fulfilling its commitment as a WTOmember, drafted an amendment to the Customs Act, 1962. Although the amendmentcould not be finalized due to the dissolution of Parliament, Finance Ordinances in 2005and 2006 included several provisions for making the legal system compatible with ACV.
The most notable provisions in Financial Ordinance, 2005 are:
(a) A definition of transaction price;
(b) Customs officers are required to follow the main principles of the WTO customsvaluation system while determining the transaction price, whether a buyerand seller are related to each other or not;
(c) If the transaction price declared by an importer is less than that of identical orsimilar goods, customs can ask for further clarification and other documentaryevidence;

204
(d) If the transaction price cannot be determined as above, customs will verifyand determine the transaction price based on unit or computed value, bydeducting or adding necessary expenses as per clarification and documentssubmitted by the importer;
(e) If the transaction price cannot be determined as indicated above, customsmay determine the price without violating the principle of WTO valuationsystem;
(f) If an importer is not satisfied with the valuation decision of customs, he/shemay appeal within 15 days to the director-general of the Customs Departmentdirectly or through the customs office concerned;
(g) If the transaction value cannot be determined in time, the importer mayrequest a provisional value decision. (Provision is made for PCA as thecontrol measure);
(h) With regard to the valuation of imports under DRP from India, the customsvalue will be determined based on the value determined by the governmentof India for excise purpose or the ex-factory or ex-depot price, whichever isthe highest. Freight, insurance and other expenses, if any, will also be addedinto such determined value.
The most notable provisions in Finance Ordinance, 2006 include:
(a) An attempt to make the legal system compatible with ACV;
(b) Further elaboration of the valuation method, which states that if freight andother expenses are included in commercial invoices, the transaction price willbe fixed based on those invoices. If there is no inclusion of these expenses,the valuation authority will fix the transaction price by adding in pre-estimatedexpenses. While fixing the transaction price, the director-general of theCustoms Department can fix the basis of expenses incurred or to be incurredin the goods;
(c) A clearly stated valuation process and sequence in cases where importerscannot submit the necessary documents and evidence as demanded bycustoms, or where the transaction price cannot be determined based onsubmitted documents and evidence. In such cases, customs will determinethe value in following sequence: (i) based on the transaction price of previouslyimported identical goods; (ii) based on the transaction prices of previouslyimported similar goods; (iii) the deductive value method or computed valuemethod as chosen by the importer; and (iv) the fall-back method withoutviolating the principle of the WTO valuation system;
(d) Authorization for customs to clear goods, if the price declared by an importeris less than the price determined by customs, by charging 50 per cent ofadditional duties on such differences. Alternatively, customs can, with the

205
prior permission of the Customs Department director-general, purchase fromthe importer at a declared price by adding insurance, freight and 5 per centof the declared price as profit in such declared prices;
(e) Authorization for customs to fix the value and clear the goods in cases wherean importer cannot submit the documents regarding the freight, insuranceand other expenses, and applies for the fixation of provisional value forclearance.
The Finance Bill, 2006 does not include any new provisions regarding customsvaluation. This is, perhaps, because of the Government s focus on political issues. As theGovernment is interim in nature it is more concerned with political matters. This indicatesthe probability that it will take more time to formulate adequate legislation for effectiveimplementation of ACV.
Thus, from the review of customs legislation, the current system of customsvaluations in Nepal can be termed as a hybrid of the WTO valuation system and BDV. Itdoes not follow the GATT valuation structure strictly. It permits use of the transactionvalue of imported goods and other valuation methods such as identical, similar, deducted,computed and fall-back methods, either in explicit or implicit terms. Failure to incorporateall the provisions of the GATT Valuation Code into the Act, Rules, Ordinances or FinanceBill have resulted in a blending of the old valuation system and the GATT valuationsystem. While it recognizes transaction value, the current valuation system still permitsthe use of minimum value. The main features of current practice include:
(a) Valuation on the basis of the transaction price;
(b) Determination of the value of imported goods, in cases where the transactionvalue cannot be determined, in the following sequence: (i) transaction pricesof previously imported identical goods; (ii) transaction prices of previouslyimported similar goods; (iii) use of the deductive value method or computedvalue method, as chosen by the importer; and (iv) the fall-back method,without violating the principles of the WTO valuation system;
(c) The right of an importer to appeal when he/she is not satisfied with thevaluation done by the customs. The director-general of the Customs Departmentis the final authority to make decision in this regard;
(d) Provisional clearance of goods with surety/deposit;
(e) The requirement for customs to follow the fundamental principles of WTOwhen fixing the value of imported goods for tariff purposes.
Although Nepal has committed to follow ACV, the valuation system in Nepal doesnot follow the GATT valuation structure in entirety. The Customs Act, 1962 and theFinancial Ordinances/Bill enforced that are from time to time do not contain clear provisionsand explanatory notes for each method. There is a lack of detailed provisions for valueadjustments. Moreover, the Customs Act, 1962 and the Finance Act, 2006 do not define

206
the different terms in accordance with ACV. Customs law is incomplete and lacks valuationfactors with regard to the use of WTO principles of customs valuation, and there is noillustration and guidance regarding the specific application of valuation methods.
3. Current problems and issues
The study team used both secondary and primary information to identify the problemsand issues related to customs valuation in Nepal. The secondary information includedlaws related to customs valuation as well as various reports, agreements and otherdocumentation published by international organizations such as the World Bank, IMF,WTO and WCO. The study team also held discussions with customs officials at TribhuvanInternational Airport, the Customs Department, and the Birgung and Bhairahawa customsoffices. Information was also collected from customs agents at Tribhuvan InternationalAirport, and the Biratnagar, Birgunj, Bhairahawa, Mechi and Tatopani customs offices. Thestudy identified problems inherent in the existing valuation system as well as problemsexpected to be encountered while adopting the WTO valuation system.
The Government of Nepal committed to implementing ACV from January 2007onwards. Some current basic problems in customs valuation in Nepal are presented intable 1. Various problems exist that are related to human resources, automation anddatabase/information systems with regard to customs valuation. Although the ASYCUDAprogramme has been introduced at nine customs offices, the personnel directly involved inthe operation of the programme are very limited. Table 2 details the current ASYCUDAskilled manpower situation.
A wide area network computer system to transmit information electronicallybetween customs offices and the Customs Department in support of PCA and customsvaluations is still lacking.
The customs procedures are still non-transparent and unpredictable. There is lessgrounds for self-compliance, especially in valuation practices. These are serious hurdlesto fully and effectively implementing the WTO valuation system. Moreover, there is noadequate legal provision to cover all WTO provisions. In table 3, existing legal provisionsare compared to WTO provisions and associated problems are identified.
The WTO Agreement on Customs Valuations is the outcome of long negotiationsby the contracting parties in several Rounds. It is a remarkable development in the sectorof customs valuation. The positive aspect of WTO valuation is that it is trader-friendly.In this system, customs administrations cannot challenge the declared value withoutdocumentary evidence and cannot increase value without giving importers an opportunityto be heard. This system provides several benefits. Nepal committed to fully implementingthe agreement by the beginning of 2007. However, to implement it successfully ina developing country such as Nepal many associated problems and issues need to beaddressed, some of which are discussed below.
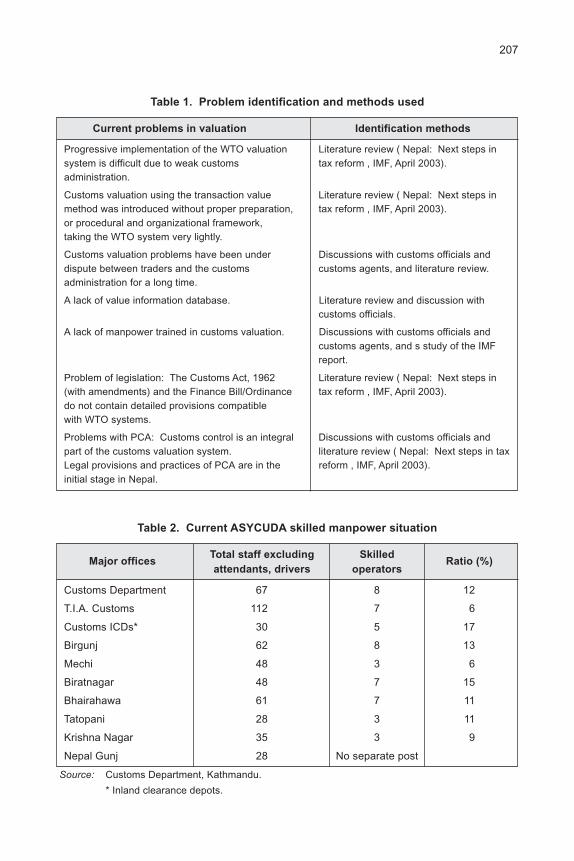
207
Table 1. Problem identification and methods used
Current problems in valuation Identification methods
Progressive implementation of the WTO valuation Literature review ( Nepal: Next steps insystem is difficult due to weak customs tax reform , IMF, April 2003).administration.
Customs valuation using the transaction value Literature review ( Nepal: Next steps inmethod was introduced without proper preparation, tax reform , IMF, April 2003).or procedural and organizational framework,taking the WTO system very lightly.
Customs valuation problems have been under Discussions with customs officials anddispute between traders and the customs customs agents, and literature review.administration for a long time.
A lack of value information database. Literature review and discussion withcustoms officials.
A lack of manpower trained in customs valuation. Discussions with customs officials andcustoms agents, and s study of the IMFreport.
Problem of legislation: The Customs Act, 1962 Literature review ( Nepal: Next steps in(with amendments) and the Finance Bill/Ordinance tax reform , IMF, April 2003).do not contain detailed provisions compatiblewith WTO systems.
Problems with PCA: Customs control is an integral Discussions with customs officials andpart of the customs valuation system. literature review ( Nepal: Next steps in taxLegal provisions and practices of PCA are in the reform , IMF, April 2003).initial stage in Nepal.
Table 2. Current ASYCUDA skilled manpower situation
Major officesTotal staff excluding Skilled
Ratio (%)attendants, drivers operators
Customs Department 67 8 12
T.I.A. Customs 112 7 6
Customs ICDs* 30 5 17
Birgunj 62 8 13
Mechi 48 3 6
Biratnagar 48 7 15
Bhairahawa 61 7 11
Tatopani 28 3 11
Krishna Nagar 35 3 9
Nepal Gunj 28 No separate post
Source: Customs Department, Kathmandu.
* Inland clearance depots.
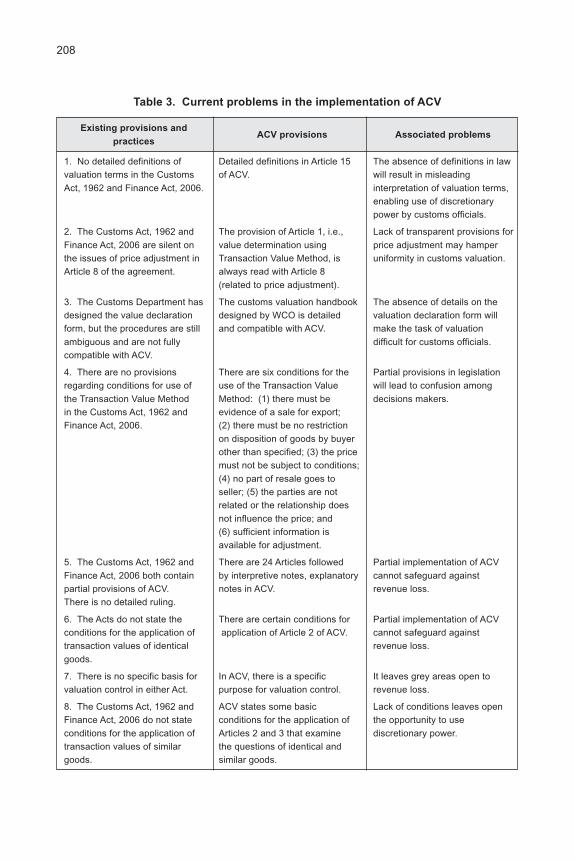
208
Table 3. Current problems in the implementation of ACV
Existing provisions andACV provisions Associated problems
practices
1. No detailed definitions of Detailed definitions in Article 15 The absence of definitions in lawvaluation terms in the Customs of ACV. will result in misleadingAct, 1962 and Finance Act, 2006. interpretation of valuation terms,
enabling use of discretionarypower by customs officials.
2. The Customs Act, 1962 and The provision of Article 1, i.e., Lack of transparent provisions forFinance Act, 2006 are silent on value determination using price adjustment may hamperthe issues of price adjustment in Transaction Value Method, is uniformity in customs valuation.Article 8 of the agreement. always read with Article 8
(related to price adjustment).
3. The Customs Department has The customs valuation handbook The absence of details on thedesigned the value declaration designed by WCO is detailed valuation declaration form willform, but the procedures are still and compatible with ACV. make the task of valuationambiguous and are not fully difficult for customs officials.compatible with ACV.
4. There are no provisions There are six conditions for the Partial provisions in legislationregarding conditions for use of use of the Transaction Value will lead to confusion amongthe Transaction Value Method Method: (1) there must be decisions makers.in the Customs Act, 1962 and evidence of a sale for export;Finance Act, 2006. (2) there must be no restriction
on disposition of goods by buyerother than specified; (3) the pricemust not be subject to conditions;(4) no part of resale goes toseller; (5) the parties are notrelated or the relationship doesnot influence the price; and(6) sufficient information isavailable for adjustment.
5. The Customs Act, 1962 and There are 24 Articles followed Partial implementation of ACVFinance Act, 2006 both contain by interpretive notes, explanatory cannot safeguard againstpartial provisions of ACV. notes in ACV. revenue loss.There is no detailed ruling.
6. The Acts do not state the There are certain conditions for Partial implementation of ACVconditions for the application of application of Article 2 of ACV. cannot safeguard againsttransaction values of identical revenue loss.goods.
7. There is no specific basis for In ACV, there is a specific It leaves grey areas open tovaluation control in either Act. purpose for valuation control. revenue loss.
8. The Customs Act, 1962 and ACV states some basic Lack of conditions leaves openFinance Act, 2006 do not state conditions for the application of the opportunity to useconditions for the application of Articles 2 and 3 that examine discretionary power.transaction values of similar the questions of identical andgoods. similar goods.

209
(i) Legal issues
The provisions of the Customs Valuation Act of Nepal are not fully compatible withthe WTO valuation system. Section 13 (1) of the Customs Act, 1962 states that thecustoms duty on imported goods will be assessed on the basis of the transaction valuewhile Section 13 (4) and 13 (5) permit customs officers to fix the price of concerned goodson the basis of recorded prices and price list obtained from the international market.However, the Finance Acts and Ordinances since 1998 have attempted to present illustrativeprovisions in line with ACV. A mere provision of six methods of customs valuation doesnot serve the purpose of actual transaction value. There is a need for comprehensivecustoms rules that can carry all provisions of ACV. The Finance Ordinance/Bill providedfor value determination for customs purposes using six methods prescribed by ACV. Yet,the need remains for a detailed explanation. Many terms need to be defined according tothe provisions. The Customs Act, 1962 and Finance Ordinances/Bill do not represent thefull body of ACV. Inconsistencies remain between the provisions of the Customs Act, 1962and the Finance Ordinances/Bill.
(ii) Database issues
Nepal has implemented ASYCUDA++ developed by UNCTAD for customs automation.However, local customs offices are not connected with a wide area network. At present,the customs valuation database cannot be disseminated horizontally and vertically. Althoughtransaction value is the price yardstick for customs valuation, value information and thevalue database are the key factors in testing its accuracy. Data can be generated within
9. The Finance Act, 2006 does ACV has detailed provisions with The lack of detailed provisionsnot state the basic principles of interpretive notes for DVM. makes the use of DVMArticles 5 of ACV (Deductive complicated.Value Method).
10. The Finance Act, 2006 ACV has detailed provisions Article 6 is not actually beingmakes provision for the with interpretive notes for the practiced by the customsComputed Value Method. Computed Value Method under administration because theHowever, it does not quote basic Article 6. producers do not reveal theirprinciples for the application of production details.CVM.
11. The Finance Act, 2006 ACV has detailed provisions of The fall-back method is thementions the basic principles of basic principles with interpretive instrument of last resort for valueapplying the fall-back method, notes for the fall-back method determination. Lack of detailedbut only in brief. under Article 7. provisions in legislation may
encourage use of discretionarypower by customs officials invalue determination.
Table 3. (continued)
Existing provisions andACV provisions Associated problems
practices

210
customs and from outside sources such as international price ledgers, magazines etc. Butin the absence of adequate computer support, those data cannot be used.
(iii) Issues concerning necessary preparation
The WTO Agreement on Customs Valuation is free from arbitrariness, and isconducive to trade and commerce as the Customs Department cannot use discretionarypower to determine customs value. The system relies on the PCA system for customscontrol. There is no doubt that the provisions of ACV are based on best valuationpractices, but the necessary preparations are needed because the valuation proceduresare highly technical and demand high skills levels. In the Nepalese Customs Departmentknowledge of the WTO valuations procedures is inadequate. The Customs Departmenthas difficulty in determining transaction values based on invoices because the proceduresfor determining the value are not fully developed or understood (Chapman and others,2003). The infrastructure is not developed sufficiently to cope with the provisions ofACV.
(iv) Issues of post-clearance audit
In its Manual on Measures to Combat Fraud, WCO (1998) defines PCA asa process that enables customs officers to verify the accuracy of declarations through theexamination of the books, records, business system and all relevant commercial data heldby persons/companies directly and indirectly involved in international trade. It is one of thecustoms control measures conducted to verify the accuracy of declared customs values.Thus, the effective implementation of PCA is necessary to secure customs revenue andother taxes while facilitating customs clearance at border. It is conducted, after customsclearance, to confirm the accuracy of declared value and all provisions stipulated in theCustoms Act, 1962.
The PCA system in Nepal was introduced three years ago, but it still has a longway to go. There is no trained manpower available for audit purposes. An Audit Manual isnecessary for the implementation of PCA. However, the result of PCA is not significant inthe current Nepalese situation. The WTO Agreement on Customs Valuation is positivewith regard to valuation control measures and PCA is the most effective one. Customs isaware of valuation fraud and, if developed properly, PCA can combat the risk of revenueleakages. Currently, there is a Post-Clearance Cell working under the Valuation Section ofthe Customs Department, in which three officers and four subordinate staff membersperform PCA. The Cell selects the particular transaction based on revenue risk anddeputes an officer to carry out PCA. At the local level, a Valuation and Post-ClearanceUnit carries out PCA and value assessment.
(v) Informal trade issues
Nepal has a long land border with India, which is extremely porous and conduciveto informal trade. It is a fact that the higher the customs value, the greater the risk ofsmuggling and informal trade. Studies have shown that the customs valuation procedures

211
are the driving force behind informal trade in Nepal, especially with India. The TradeCompetitiveness Study (Chapman and others, 2003) stated that the total volume of informalimports from India accounted for 34 per cent of formal trade. Unauthorized trade isincreasing even from China. It is extremely difficult to control unauthorized trade in thecontext of the open border with India and the difficult terrain along the border with China.When informal trade is large-scale, even genuine traders tend to under-invoice in order tomake their imports competitive with informal imports. An improvement in customs valuationis thus critical to the reduction of such a high magnitude of informal trade.
(vi) Issues of dispute
Customs valuation has remained a subject of dispute between the Governmentand the trading community in Nepal. The latter complains that customs valuation isdiscretionary and unfair. The customs officials charge that the traders always try toundervalue the goods they import. The application of ACV can address the issue, providedimporters declare the prices actually paid or are payable for the goods imported.
(vii) Issue of revenue loss
While full implementation of the WTO valuation system with adequate legal, humanand technical support will exert a positive impact on trade and revenue, it will requireeffective PCA in order to control under-invoicing, the absence of which may enhance theproblem and result in revenue losses. The infant stage of PCA in Nepal is an issueneeding serious consideration before the implementation of ACV.
C. Impact of changes in customs valuation practice
This section attempts to assess the likely impact of change in customs valuationpractice on trade volumes, prices and revenue.
1. Methodology
In order to assess the impact of changes in customs valuation on trade and prices,first an attempt was made to estimate average level of undervaluation under the existingvaluation practices through review of appeal cases and deductive exercises. A total of 325appeal cases were registered during the first three quarters of financial year 2005/06. Of38 appeal cases registered during the last two months of the third quarter of 2005/06,12 cases were selected for both review and a deductive exercise. Later cases wereselected for the reason that market prices were available only for recent months.
Second, the change in price level of imported goods was estimated considering thelikely changes in value of imported goods due to elimination of under-declaration and theaverage rate of the tariff burden being imposed in 2005.

212
Third, an attempt was made to estimate price elasticity of imports of selectedcommodities with the help of a regression analysis. This was done using the value ofselected imports and a constructed average price index of same imported goods.
Fourth, the impact on the general price level was estimated considering the changein the prices of imported goods resulting from changes in valuation practice and the shareof such prices as a component of the general price index. Available secondary informationwas also used in this process.
The impact on revenue was assessed applying an average tariff rate to the changein the value of imports induced by changes in valuation practice.
It is difficult to ensure that the declared value will reflect the real transaction valueeven after implementation of the WTO valuation system. It all depends on the behaviourof traders. Therefore, a concise, limited opinion survey was carried out among 25 customsagents who were well acquainted with the performance of customs officials and traders, inorder to record their views on the likely trend with regard to the declaration of value,changes in imports and revenue earnings. Twenty-one of the customs agents responded.In addition, discussions were held with officials of two land customs offices, one internationalairport cargo office and the Customs Department in this connection. Market informationwas collected from traders.
2. Impact on trade
Table 4 shows the magnitude of under-declaration, which ranges from 1.8 per centfor television parts to 126.2 per cent for multimedia projectors. Of 12 cases, only twocases were found not to have under-declared. Table 4 shows that on average,under-declaration is 21 per cent.
Table 5 shows the deductive exercise for selected imported goods. It reveals anundervaluation of 17 per cent. Based on a review of appeal cases and the deductiveexercise, it was concluded that undervaluation ranged from 17 per cent to 21 per cent, oran average 19 per cent.
The average tariff rate is currently 10.5 per cent. This means that if the average ofthe rate of undervaluation shown by the review of appeal cases and the deductive exercisesare used, the traders will have to bear an extra financial burden of 2 per cent (19 x 10.5)on account of the increase in import costs. If this is passed on to customers, the pricelevel of imported goods will increase by about 2.1 per cent (0.1 percentage point isallowed for profit, as customs provides a profit of 5 per cent on the cost of imported goods,when such goods are acquired by customs).
For the regression analysis, six major products comprising raw materials as well asfinal products were selected. The commodities selected were pesticides, medicinalchemicals, polyester acrylic yarn, polyester fibres, plastic granules and jute. These productswere chosen based on the availability of both value and quantity data with similar units ofmeasurement.

213
Table 4. Declared and reviewed value of imported goods
(Unit: US dollars)
Type of goodsDeclared Assessed Reviewed Undervaluation
value value value Amount Per cent
Celeron Del computer Gx 280 650/set 750/set 734/set 84 12.9small desktop
Samsung colour monitor, 15" 71/unit 73/unit 71/unit — —
Colour Plasma TV42d4S 1 800/set 2 280/set 2 280/set 480 26.7
Daewoo 14" CTV parts kit 16.70/kit 17.00/kit 17.00/kit 0.3 1.8
LCD multimedia projector 420/unit 950/unit 950/unit 530 126.2
LG refrigerator sets (413 litres) 283.49/unit 336/unit 315/unit 31.5 11.1
Copy paper 740/mt 790/mt 790/mt 50 6.8
HDPC injection grade 870/mt 900/mt 900/mt 30 3.4
Green peas (whole) 247/mt 263/mt 263/mt 16 6.5
Small cardamom (mix green) 2 600/mt 3 250/mt 3 250/mt 650 25.0
Chlortetracycline, feed grade 1 340/mt 2 150/mt 2 150/mt 810 60.4
Welding electrode 3.2x350mm 555/mt 590/mt 555/mt — —
Total 9 593.2 12 349.0 12 275.0 2 682.0 21.0
Table 5. Declared and deducted value of imported goods
(Unit: US dollars)
AggregateTransport
CustomsDeducted Declared
UndervaluationType of goods market Profit
cost duty
value valueprice
a rate % Amount Per cent
Celeron Del computer 812.00 40.60 1.00 1 763.00 650.00 113.00 14.8Desktop
Samsung colour monitor 100.00 5.00 1.00 1 93.00 71.00 22.00 23.7
Colour plasma television 2 920.00 146.00 2.00 35 2 053.00 1 800.00 253.00 12.3
Daewoo CTV parts 20.55 0.97 1.00 15 16.08 16.70 (0.62) (3.9)
LCD multimedia 588.00 28.00 2.00 10 516.00 420.00 96.00 18.6
LG Refrigerator (413 Lt) 660.50 31.50 5.00 15 582.00 283.00 29.00 51.4
Copy paper (MT) 866.00 41.00 55.00 15 707.00 420.00 287.00 40.6
MDPE injection grade 1 049.00 50.00 55.00 10 857.00 870.00 (23.00) (2.7)(MT)
Green peas (MT) 349.00 17.00 55.00 10 252.00 247.00 5.00 2.0
Small cardamom (MT) 3 361.00 160.00 55.00 10 2 886.00 2 600.00 286.00 9.9
Chlor-tetracycline (MT) 2 170.00 103.00 55.00 5 1 945.00 1 340.00 605.00 31.1
Welding rods 611.00 29.00 55.00 5 499.00 555.00 (56.00) (11.2)
Total 11 169.08 9 272.70 1 886.38 17.0
a Aggregate market price refers to the price at which the largest unit of goods was sold during the review period.b Figures in parenthesis indicate overvaluation.

214
The regression analysis of the price index of selected imported commodities andthe volume of imports expressed in real terms showed a negative relationship betweenprices and commodity imports.1 The result indicated that a 1 per cent increase in the pricelevel of the imported commodities under consideration would lead to a decrease in importsof around 0.90 per cent. The t-statistics were significant at the 10 per cent level. The R2
was also fairly high at 0.52, indicating that the explanatory power of the model wasrelatively good. This means that demand for imports is sensitive to price changes. Inother words, changes in valuation practice with a slight increase (2.1 per cent) in the valueor cost of imported goods is likely to exert a negative effect of about by 1.9 per cent on thedemand for imports.
3. Impact on price
Imported goods have a weight of 30.04 per cent in the National Wholesale PriceIndex of Nepal. As change in customs valuation practice will induce an increase of 2.1 percent in the Wholesale Price Index of imported goods, its impact on the general price levelwill be only 0.6 per cent. Thus, it can be concluded that a change in customs valuationpractice will not exert significant pressure on the general price level of the country.Fifty-seven per cent of the customs agents corroborated this view.
4. Impact on revenue
As mentioned above, it was estimated that customs valuation would be increasedby 19 per cent after the implementation of WTO valuation practice. Although it is directlyrelated to the value of imported goods, customs revenue would not increase correspondinglybecause of a decrease in the demand for imports due to the rise in price levels. However,an appropriate valuation system is expected to bring some informal imports from India intothe formal channel. In general, with the full implementation of ACV, control of unauthorizedimports together with curtailment in under-invoicing practices will exert some positiveimpact on customs revenue. Forty-three per cent of the customs agents who participatedin the discussion were also of the opinion that customs revenue would increase followingimplementation of ACV.
D. Policy recommendations and conclusion
1. Policy recommendations
The customs processes in poorer countries exhibit many interacting weaknesses inprocedures that are not codified together with poorly-trained officials, who often receiveside-payments for performing their functions. In addition, there are insufficient provisions
1 LOG(IMVA) = 24.76-0.90*LOG(PI)t-values (-0.90) (-2.31)R2 = 0.52; N = 5; DW = 1.36; whereIMVA = import value of selected commodities and PI = price index.

215
for appeal. In many such poorer countries, smuggling is rampant. Thus, customs valuationis only an inch in the whole yard of customs operations that need improvement throughreforms. These reforms need to be based on transparency, objectivity, accountability andbalance (Finger and Schuler, 2000). In view of the inherent problems in customsadministration of Nepal, a comprehensive customs reform is required to ensure that theimplementation of WTO customs valuation requirements is practical and beneficial toNepal. The reform programme should be constructed around three basic themes:moralization, professionalization and modernization. The key reform measures shouldinvolve legislation, organization and management, personnel requirements and development,and computerization and other information and communication technology (ICT) applications.
A closer inspection of current practices in Nepal reveals that WTO valuation methodsare not being applied fully at present; in fact, they cannot be applied effectively until thenecessary legislation has been prepared. An amendment to make the Customs Act, 1962fully compatible with WTO valuation has been drafted but it could not be enforced due topolitical situation in the country. There was no parliament for the last few years. Nowpolitical situation has been improved to some extent and parliament has been restored.However, the Finance Bill, 2006 does not include any new provisions related to customsvaluation. Thus, legal inadequacy still remains. What is needed is a comprehensiveCustoms Act with detailed definitions of valuation terms, transparent provision of priceadjustment, clear guidance to valuation etc. First, the legislation should cover the valuationprinciples and methods in the form of a set of valuation rules as mentioned in ACV.Second, provisions should be made in the appropriate Articles of the Customs Act regardingthe obligations of importers. The following provisions, corresponding to the different Articlesof ACV or ministerial decision, are also recommended for inclusion:
(a) Options with regard to Article 8.2;2
(b) Currency conversion, as mentioned in Article 9;3
(c) Confidentiality of information as per Article 10;4
(d) The right of appeal as per Article 11;5
(e) The duration of final value determination under Article 13;6
2 According to Article 8.2, in framing the legislation each member will provide for inclusion orexclusion from customs values, in whole or in part, of (a) the cost of transportation to the port or placeof import, (b) handling charges and (c) costs of insurance.
3 According to Article 9, the conversion rate should be published by the competent authority. Therate to be used should be that in effect at the time of export or import.
4 According to Article 10, confidential information provided for valuation must be treated as strictlyconfidential.
5 According to Article 11, the legislation should make provisions for appeal against a valuation orpenalty decision.
6 Ministerial decision 6 grants customs authorities the right to ask for supporting documentation orevidence or to be satisfied with evidence presented in support of value declaration.

216
(f) The authority of customs to request supporting documents and additionalinformation (as per ministerial decision No. 6);
(g) The authority of customs to carry out all actions related to verification, includinginvestigation;
(h) The authority of customs to suspect;
(i) The authority of customs to prosecute offenders.
An adequate database, particularly with regard to price information, is a keyprerequisite for successful implementation of ACV. Therefore, the Nepalese CustomsDepartment needs to maintain a comprehensive databank as well as identify and acquireaccess to appropriate regional and international databases. Under ACV, customs officerscan question the declared value whenever they have reasonable doubt about the accuracyof the declared value and the supporting documentation. Reasonable doubt may ariseonly on the basis of the valuation databank and indicators from the risk assessmentsystem. In order to protect the right of customs to ask suspected importers to justifytransaction values, customs officers should be provided with the necessary information.An adequate database on imported goods is also necessary for PCA and for use inmaking comparisons while using alternate valuation methods (i.e., other than transactionvalue methods as mentioned in Article 1). Data concerning quantity, quality and time arerequired for conducting PCA. Electronic data are required for verifying the authenticity ofthe information provided by importers on the value of identical or similar goods. Thus, theestablishment and maintenance of an adequate database is crucial. However, such datawould not be for use as reference prices in the initial valuation.
Electronic transmission of information between the Customs Department, customsoffices and related agencies is equally important. Therefore, efforts should be made todevelop an adequate electronic communication network. At the very least, a wide areanetwork needs to be established between the Customs Department and customs offices.An integrated computer system should be developed at the Customs Department thatencompasses all customs regimes, operations, control functions, audits, administration,exchanges of information with foreign trade operators, statistics and management.
Only skilled manpower can take advantage of modern information technology. Atthe same time, a wide knowledge of WTO valuation among customs staff will be requiredin order to ensure that the implementation of ACV is successful. Extensive training invaluation methods and ICT applications as well as access to databases containing priceinformation is required for the effective adoption of WTO valuation methods.
However, the Customs Department has no training capacity or strategy, and althoughthe Revenue Training Institute has a faculty staff of 44, none are customs specialists(Customs Department, 2004). Various improvement measures should be taken in theareas of personnel recruitment and development, including fiscal incentives and evaluationto promote integrity in the customs administration.

217
Customs valuation should not always be a subject of dispute between theGovernment and the business community. Hence, a congenial environment should becreated so that importers will declare the price that is actually paid or is payable forimported goods. Transparency, fairness and competency in the valuation process willdevelop a voluntary compliance culture in the business community. Attitude and behaviourtoward traders as well as technical competency on the part of customs officials are alsoequally important. This includes computerization and ICT applications that leave little orno room for negotiation, influence or discretion in customs processes, strict staff evaluationand selection procedures, professional training, good incentives, internal control, a codeof conduct, enhanced fairness, competency and integrity in customs administration.Therefore, the extension and upgrading of computerization in the Customs Departmentand all customs offices is recommended. The recent three-year Customs Reform Planinitiated various actions related to the different aspects of good governance. What isnow needed is continuous and effective monitoring of good governance with a strongintelligence audit and investigation mechanism to ensure that offenders are prosecutedand penalized, and that traders who voluntarily comply with the law are assisted andenjoy better benefits. The public/private sector consultation mechanism enhancestransparency. The Government of Nepal has established an institutional mechanism forconsulting the private sector at different stages in the determination of value of importedgoods. This should be continued and firmly established as the right of importers. Thesereforms will enhance mutual trust, confidence and cooperation between the Governmentand the business community.
An effective customs control system is required in order to plug revenue leakagethrough under-invoicing under ACV. A strong enforcement mechanism is also requiredfor the protection of honest traders. The Government s budget for 2006/07 made provisionfor the effective purchase of under-invoiced goods and the completion of PCA of selectedfirms and goods within 60 days. However, practice of PCA is still in the initial stage inNepal. In order to ensure effective customs control, PCA should be extended as well asstrengthened. However, it is not an easy task in Nepal where traders do not keep properaccounting records. Traders may even feel that PCA is an additional burden and activelyresist it. Therefore, special programmes should be launched in this regard. Effortsshould be made to convince traders that PCA will provide them with long-term benefits.According to Rege (2000), lack of sense of ownership is one of reasons for the difficultiesthat face developing countries in implementing ACV. Currently, there is a Post-ClearanceCell under the Valuation Section of the Customs Department. Three officers and foursubordinate staff members perform PCAs. The cell selects the particular transactionbased on revenue risk and assigns an officer to carry out PCA. At the local level,a Valuation and Post-Clearance Unit undertakes PCA and value assessment. It isrecommended that PCA should be undertaken in its fully-fledged form, for which thereshould be a separate section comprising an adequate number of auditors and subordinatestaff at the department and local levels.

218
In order to develop the necessary capacity to adopt WTO valuation, arrangementsshould be made for the provision of necessary technical assistance in a broadened way.In addition to assistance under WTO-focused programmes, Nepal needs technical assistanceto support the computerization, modernization and reform of its customs procedures. TheGovernment should also invest in capacity-building of domestic institutions in order to takeadvantage of WTO rules. External support and financing are necessary for upgrading thephysical infrastructure, implementing training programmes and improving the organizationalstructure.
Many WTO member countries have introduced import verification programmesunder which importers are required to obtain certificates of inspection issued by authorizedpre-shipment inspection (PSI) companies before goods are shipped from the exportingcountry. The certification covers the nature, quantity, value and tariff classification ofgoods. This helps to prevent undervaluation and fraud, and assists customs in determiningthe value. This is an alternative method of detecting undervaluation or overvaluation.However, it is costly and the integrity of PSI companies is often questioned. Nepal, beinga small buyer, may not be able to demand PSI certificates from exporting companies and itwill be difficult for importing companies to bear the burden of PSI costs. Therefore, PSImay not be an appropriate option for Nepal. Nevertheless, an attempt should be made torecognize the PSI system if major importers in Nepal want to obtain this service. Inaddition, information received through PSI may be helpful, particularly in the context ofinadequate PCA.
As legal provisions are still inadequate, and because PCA is still at the learningstage, the probability of revenue leakages appears to be high should ACV be implementedwithout addressing these problems. In view of the current political situation in Nepal, it isrecommended that the Government ask for a grace period of two years to fully implementACV.
2. Conclusion
The WTO customs valuation system provides fair, neutral and uniform valuation,and it protects traders from the risk of arbitrary valuation by customs. However, there isa risk that the Government will experience a loss of revenue due to under-invoicing ofimports by traders if a controlling mechanism such as PCA is not adequately developed.
In Nepal, PCA is in the infant stage and other requisites in terms of legislation,databases, infrastructure and skilled manpower are still inadequate. A draft amendment tothe Customs Act, 1962, aimed at making it WTO valuation compatible, is ready; however,it is being delayed due to the current political situation in Nepal. Although the situation hasimproved, the enforcement of the amendment in the near future is not expected, as thepolitical agenda is being given less priority than the economic agenda.
The impact on the volume of imports as a result of changing from the existingcustoms valuation system to ACV will not be significant. The current study has shown thata decrease in imports of only 1.9 per cent is likely to occur. On the other hand, it will

219
reduce under-invoicing and informal trade, thus creating a positive impact on customsrevenue. As estimated by the study, the impact of a valuation change in the general pricelevel of the country will be as low as 0.6 per cent. As its adverse effect on volume of tradeand general price level is insignificant and there is positive impact on revenue, the fullimplementation of the WTO valuation system will be beneficial to the country. However, asthe necessary prerequisites have yet to be met, and as the controlling mechanism has yetto be strengthened, the Government of Nepal should request a grace period of two yearsfor the full implementation of ACV.
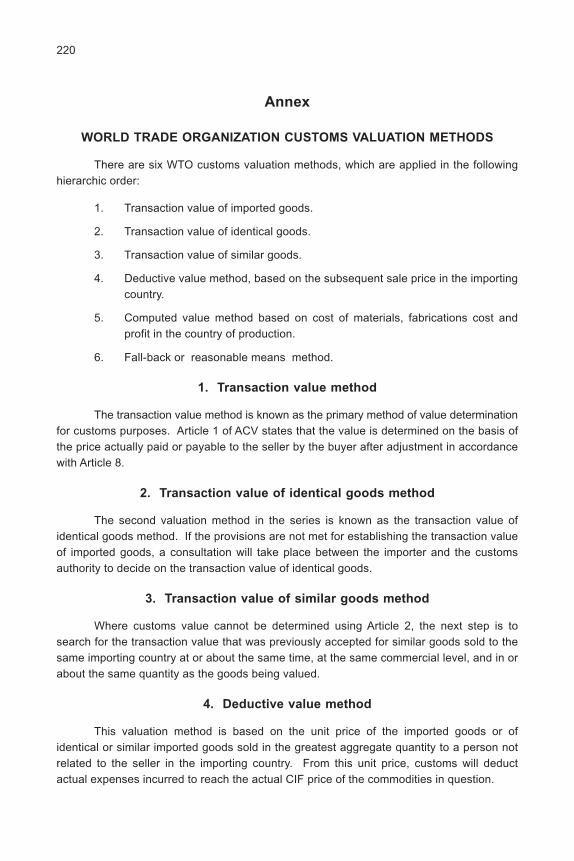
220
Annex
WORLD TRADE ORGANIZATION CUSTOMS VALUATION METHODS
There are six WTO customs valuation methods, which are applied in the followinghierarchic order:
1. Transaction value of imported goods.
2. Transaction value of identical goods.
3. Transaction value of similar goods.
4. Deductive value method, based on the subsequent sale price in the importingcountry.
5. Computed value method based on cost of materials, fabrications cost andprofit in the country of production.
6. Fall-back or reasonable means method.
1. Transaction value method
The transaction value method is known as the primary method of value determinationfor customs purposes. Article 1 of ACV states that the value is determined on the basis ofthe price actually paid or payable to the seller by the buyer after adjustment in accordancewith Article 8.
2. Transaction value of identical goods method
The second valuation method in the series is known as the transaction value ofidentical goods method. If the provisions are not met for establishing the transaction valueof imported goods, a consultation will take place between the importer and the customsauthority to decide on the transaction value of identical goods.
3. Transaction value of similar goods method
Where customs value cannot be determined using Article 2, the next step is tosearch for the transaction value that was previously accepted for similar goods sold to thesame importing country at or about the same time, at the same commercial level, and in orabout the same quantity as the goods being valued.
4. Deductive value method
This valuation method is based on the unit price of the imported goods or ofidentical or similar imported goods sold in the greatest aggregate quantity to a person notrelated to the seller in the importing country. From this unit price, customs will deductactual expenses incurred to reach the actual CIF price of the commodities in question.

221
5. Computed value method
The computed value is determined by adding to the production costs of the importedgoods valued an amount for profit and general expenses equal to that usually reflected inthe sales of goods of the same class or type as the goods being valued, and which areproduced in the exporting country for shipment to the importing country.
6. Fall-back method
Customs value is determined by using any of methods 1 to 5 in a flexible manner,provided that the criteria employed are consistent with Article VII of GATT. The value sofixed should not, however, be based on any of the following factors, among others:
(a) The price of goods for export to a third country market;
(b) Minimum customs values;
(c) Arbitrary or fictitious values.

222
References
Chapman, R., 2003. Nepal: Trade and competitiveness study . World Bank, Kathmandu.
ESCAP, 2006. An exploration of the need for and cost of selected trade facilitationmeasured in Asia and the Pacific in the context of the WTO negotiations , inStudies in Trade and Investment No, 57. Bangkok.
Filmer, R., 2003. Customs Administration: Impediments to trade and investment , SouthAsia FDI Roundtable, Foreign Investment Advisory Service, 9-10 April 2003, Maldives.
Finger, M. and P. Schuler, 2000. Implementation of Uruguay Round commitments: Thedevelopment challenge , RIS Digest.
Ghimire, D.P., 2005. The Legislative Review Study on Customs Policies of HMG, Nepal .Centre for Public Policy Dialogue. Kathmandu.
King, J., 2003. Next steps in tax reform - Preliminary report, Nepal . InternationalMonetary Fund, Washington, D.C.
Nepal, 1962. Customs Act, 1962 and Customs Rules, 1970. (Ministry of Law, Kathmandu).
, 2004. Report of the Working Party on the accession of Nepal to WTO . Kathmandu.
, 2004a. Customs - an Introduction. (Customs Department, Kathmandu).
Rajkarnikar, P.R., N.M. Maskay and S.R. Adhikari, 2005. The need for the cost ofselected trade facilitation measures relevant to the WTO trade facilitationnegotiation: A case study of Nepal . Institute for Policy Research and Development,Kathmandu.
Rege, V., 2002. Customs Valuation and Customs Reform Development, Trade and theWTO (B. Hoekman, A. Mattoo and P. English, eds.). World Bank, Washington,D.C.
Walsh, T.J., 2003. Customs Valuation, Changing Customs (M. Keen, ed.). InternationalMonetary Fund, Washington, D.C.
World Customs Organization, 1998. WCO Manual on Measures to Combat Fraud, Doc.38.080/Rev. Brussels.
World Trade Organization, 2004. Valuation of Goods for Customs Purposes. Geneva.
, 1995. GATT Agreement, 1994. Geneva.

223
VII. TRADE FACILITATION AND CUSTOMS VALUATION
IN FIJI: A COMPARATIVE ANALYSIS OF NEEDS
AND PRIORITIES
By Biman Chand Prasad*
Introduction
International trade has increasingly become an underpinning determinant ofeconomic prosperity in most countries of the world, and Fiji is no exception. Fiji s externaltrading relations increasingly determine the growth and development of the country, andthis influence will only increase with worldwide moves to free trade and globalization. Inline with most developing countries, the past decade has seen Fiji adopt an export-oriented, outward-looking approach to trade relations. Import restrictions have been largelylifted in favour of export promotion and, as such, Fiji now has a more liberalized or openeconomy with increased volumes of both exports and imports.
A concept very much related to trade liberalization and openness is trade facilitation.In simple terms, trade facilitation is the gradual removal of the invisible barriers to trade.Specifically, it is the simplification and harmonization of international trade procedures,including activities, practices and formalities involved in collecting, presenting, communicatingand processing data required for the movement of goods in international trade.1 It reducestransaction costs as well as the complexity of international trade induced by documentation,procedures and regulations, thus expanding trade and resulting in both economic growthand development. In view of such an important role for trade facilitation, many internationalorganizations, including the World Trade Organization (WTO), have included it in theirscope of work.
Based on case studies and private sector surveys conducted in five Asian countries(Bangladesh, China, India, Indonesia and Nepal) on the need and priorities of trade facilitationmeasures under negotiations at WTO, ESCAP (2006) identified customs valuation as themain trade facilitation-related concern of the private sector in those countries. Walsh2
* Biman Chand Prasad is Professor and Head of School of Economics, Faculty of Business andEconomics, the University of the South Pacific (USP), Fiji, Suva. The author wishes to thank YenteshwarRam and Sanjesh Kumar for providing valuable research assistance and Kulu Anisi Bloomfield, ProgrammeManager, Oceania Customs Organization, based in Suva, for his helpful comments on customs valuationin the Pacific islands. The views presented in this paper are those of the author and do not necessarilyreflect the views of USP. The author can be contacted at [email protected].
1 World Trade Organization/UNCTAD, Implementation-related issues and concerns , DohaMinisterial Conference, (fourth session), 9-14 November 2001. Website: http://www.wto.org/english/thewto_e/minist_e/min01_e/mindecl_implementation_e.htm.
2 T.J. Walsh, 2003, Customs Valuation, Changing Customs (edited by Michael Keen), InternationalMonetary Fund, Washington, D.C.
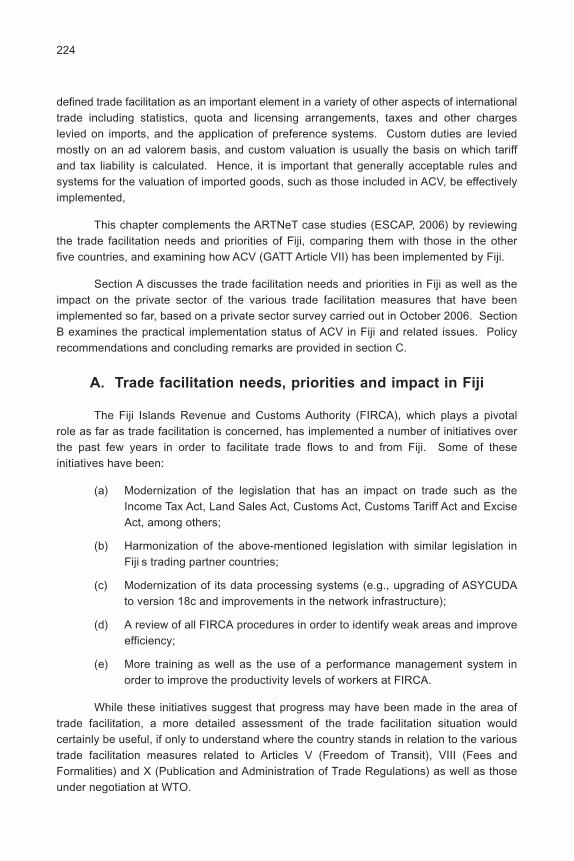
224
defined trade facilitation as an important element in a variety of other aspects of internationaltrade including statistics, quota and licensing arrangements, taxes and other chargeslevied on imports, and the application of preference systems. Custom duties are leviedmostly on an ad valorem basis, and custom valuation is usually the basis on which tariffand tax liability is calculated. Hence, it is important that generally acceptable rules andsystems for the valuation of imported goods, such as those included in ACV, be effectivelyimplemented,
This chapter complements the ARTNeT case studies (ESCAP, 2006) by reviewingthe trade facilitation needs and priorities of Fiji, comparing them with those in the otherfive countries, and examining how ACV (GATT Article VII) has been implemented by Fiji.
Section A discusses the trade facilitation needs and priorities in Fiji as well as theimpact on the private sector of the various trade facilitation measures that have beenimplemented so far, based on a private sector survey carried out in October 2006. SectionB examines the practical implementation status of ACV in Fiji and related issues. Policyrecommendations and concluding remarks are provided in section C.
A. Trade facilitation needs, priorities and impact in Fiji
The Fiji Islands Revenue and Customs Authority (FIRCA), which plays a pivotalrole as far as trade facilitation is concerned, has implemented a number of initiatives overthe past few years in order to facilitate trade flows to and from Fiji. Some of theseinitiatives have been:
(a) Modernization of the legislation that has an impact on trade such as theIncome Tax Act, Land Sales Act, Customs Act, Customs Tariff Act and ExciseAct, among others;
(b) Harmonization of the above-mentioned legislation with similar legislation inFiji s trading partner countries;
(c) Modernization of its data processing systems (e.g., upgrading of ASYCUDAto version 18c and improvements in the network infrastructure);
(d) A review of all FIRCA procedures in order to identify weak areas and improveefficiency;
(e) More training as well as the use of a performance management system inorder to improve the productivity levels of workers at FIRCA.
While these initiatives suggest that progress may have been made in the area oftrade facilitation, a more detailed assessment of the trade facilitation situation wouldcertainly be useful, if only to understand where the country stands in relation to the varioustrade facilitation measures related to Articles V (Freedom of Transit), VIII (Fees andFormalities) and X (Publication and Administration of Trade Regulations) as well as thoseunder negotiation at WTO.
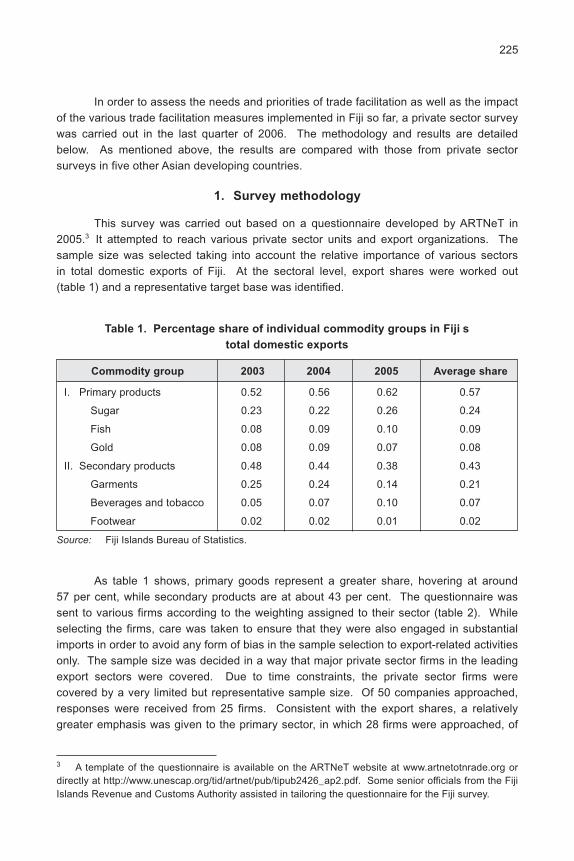
225
In order to assess the needs and priorities of trade facilitation as well as the impactof the various trade facilitation measures implemented in Fiji so far, a private sector surveywas carried out in the last quarter of 2006. The methodology and results are detailedbelow. As mentioned above, the results are compared with those from private sectorsurveys in five other Asian developing countries.
1. Survey methodology
This survey was carried out based on a questionnaire developed by ARTNeT in2005.3 It attempted to reach various private sector units and export organizations. Thesample size was selected taking into account the relative importance of various sectorsin total domestic exports of Fiji. At the sectoral level, export shares were worked out(table 1) and a representative target base was identified.
3 A template of the questionnaire is available on the ARTNeT website at www.artnetotnrade.org ordirectly at http://www.unescap.org/tid/artnet/pub/tipub2426_ap2.pdf. Some senior officials from the FijiIslands Revenue and Customs Authority assisted in tailoring the questionnaire for the Fiji survey.
Table 1. Percentage share of individual commodity groups in Fiji s
total domestic exports
Commodity group 2003 2004 2005 Average share
I. Primary products 0.52 0.56 0.62 0.57
Sugar 0.23 0.22 0.26 0.24
Fish 0.08 0.09 0.10 0.09
Gold 0.08 0.09 0.07 0.08
II. Secondary products 0.48 0.44 0.38 0.43
Garments 0.25 0.24 0.14 0.21
Beverages and tobacco 0.05 0.07 0.10 0.07
Footwear 0.02 0.02 0.01 0.02
Source: Fiji Islands Bureau of Statistics.
As table 1 shows, primary goods represent a greater share, hovering at around57 per cent, while secondary products are at about 43 per cent. The questionnaire wassent to various firms according to the weighting assigned to their sector (table 2). Whileselecting the firms, care was taken to ensure that they were also engaged in substantialimports in order to avoid any form of bias in the sample selection to export-related activitiesonly. The sample size was decided in a way that major private sector firms in the leadingexport sectors were covered. Due to time constraints, the private sector firms werecovered by a very limited but representative sample size. Of 50 companies approached,responses were received from 25 firms. Consistent with the export shares, a relativelygreater emphasis was given to the primary sector, in which 28 firms were approached, of

226
which 15 responded. As far as the secondary sector was concerned, 22 firms wererequested to complete the questionnaire. However, only 10 firms responded.
1. Survey results
The private sector survey managed to get a reasonable response on all the threeaspects of the questionnaire. These three aspects include:
(a) The private sector perception of the implementation level in Fiji of varioustrade facilitation measures related to Articles V, VIII and X;
(b) The ranking of the needs and priorities of the selected trade facilitation measuresfor implementation;
(c) The impact of the various trade facilitation measures implemented in Fiji, sofar, on the private sector.
The survey also identified the key trade facilitation-related areas in which privatesector respondents faced the most problems.
(a) Perceived level of implementation
The survey results concerning the perceived implementation level of trade facilitationmeasures in Fiji are summarized in table 3, in which the private sector responses arecompared with the responses received from the government officials. As is clear from thetable, in most cases the perceptions of most of the traders were similar to the officialpositions. However, the views differed in some key areas. For example, the majority ofthe private sector felt that the laws, regulations and judicial decisions were not applied ina uniform, impartial and reasonable manner; however, the government side did not agreewith that opinion. Similarly, the private sector felt that a formal and effective private sectorconsultation mechanism was still not available, which was contrary to the stated governmentposition. The private sector did not believe that there was an effective advance rulingsystem in place. There were also differences over Article V as the private sector said thatgoods in transit were subject to unreasonable transit duties or transit charges, a view withwhich the government side did not agree. The following paragraphs discuss the resultsregarding the perceived level of implementation in more detail.
Table 2. Sample size and number of responses received
Number of samples Number of samples
Commodity group (category-wise) in (category-wise) in
target sample actual sample
I. Primary products 28 15
II. Secondary products 22 10
Source: Private sector survey.

227
Table 3. Comparison of survey results and the government sector
Perceived implementation of Private sector Government
trade facilitation measures Yes (%) No (%) Yes (1)/No (0)
Customs procedures and regulations are 80 20 1publicly available and easily accessible.
Changes in regulations and procedures are 70 30 1made available promptly and conveniently.
Laws, regulations and judicial decisions are 45 55 1applied in a uniform, impartial and reasonablemanner.
An independent system for appealing trade 60 40 1and/or customs authorities decisions is availableand operates effectively.
A formal and effective private sector consultation 30 70 1mechanism exists, which allows traders to commenton proposed changes to regulations and proceduresbefore they are issued and implemented.
An effective advance ruling system is in place. 50 50 1
Documentation requirements for import/export are 70 30 0excessive and time-consuming.
Fees and charges levied on exports and imports are 50 50 1reasonable.
Penalties and fines for minor breaches of customs 55 45 1regulations are small and reasonable.
Easy to submit required trade documentation 60 40 1to trade/customs authorities for approval.
Computerization and automation of customs and 70 30 1trade procedures have noticeably reduced theaverage time of clearance.
Treatment of goods and vehicles in transit is 55 45 1non-discriminatory.
Goods in transit are subject to unreasonable transit 30 70 0duties or transit charges.
Regulations and procedures for goods in transit are 50 40 1clearly defined and widely available.
Vehicles in transit are allowed to use the most 60 40 1convenient routes to their destination.
A large number of firms appreciated FIRCA s efforts with regard to dissemination ofinformation by making customs procedures and regulations publicly available; as high as80 per cent of the respondents endorsed the availability. They (70 per cent) also agreedthat changes in regulations and procedures were made available in good time.
228
Although many respondents (60 per cent) felt that an independent system to appealtrade and/or customs authorities decisions was available, 55 per cent felt that laws,regulations and judicial decisions were not applied in a uniform, impartial and reasonablemanner. Only 30 per cent of the respondents felt that a formal and effective private sectorconsultation mechanism existed, allowing traders to comment on proposed changes toregulations and procedures before they were issued and implemented. A large number ofrespondents said an effective advance ruling system was in place (50 per cent) but anequal percentage also suggested greater policy attention in making the system even moreeffective. They also stated that documentation requirements for imports/exports wereexcessive and time-consuming (70 per cent). There was strong satisfaction (70 per cent)with the computerization and automation of customs and trade procedures as the averagetime of clearance had been noticeably reduced.
There was a general perception that fees and charges levied on exports andimports were reasonable (50 per cent each). However, a large number of respondents(50 per cent) found the penalties and fines for minor breaches of customs regulations tobe too high. They (70 per cent) also felt that irregular and arbitrary payments were oftenrequired for expediting the release of goods from customs. There was general satisfactionwith the trade documentation required by trade/customs authorities for approval (60 percent). Similarly, the improvement of coordination between relevant agencies, particularlyon document requirements (e.g., through the establishment of a single window forone-time submission and collection of all trade documents) was emphasized (59 per cent).
Most of the respondents indicated that the treatment of goods and vehicles intransit was non-discriminatory (55 per cent) and that goods in transit were not subject tounreasonable transit duties or transit charges (70 per cent). Regulations and proceduresfor goods in transit were considered by 50 per cent of the respondents to be clearlydefined and widely available. Although 60 per cent said vehicles in transit were allowed touse the most convenient routes to their destination, it was felt that more needed to bedone to improve the infrastructure on those routes. Some respondents pointed out thatalternative routes should also be developed so that excessive pressure on existing routescould be avoided. However, in terms of policy, many of the private sector respondents(40 per cent) emphasized the fact that implementation of international and regional transitsystems based on international standards and practices was currently not taking place.The private sector also felt that the existing mechanism of bilateral treaties did not takeinto account the views of the private sector.
Table 4 compares the results obtained on the issue of perceived level ofimplementation in Fiji with the results obtained by surveys in five other developing countriesof Asia and the Pacific.4 The results in Fiji are similar to those obtained in other countries,but the following results are worth noting:
4 ESCAP, 2006, An exploration of the need for and cost of selected trade facilitation measures inAsia and the Pacific in the context of the WTO negotiations , Studies in Trade and Investment No. 57.

229
Table 4. Perceived level of implementation of GATT Articles V, VIII
and X by the private sector in selected countries
Articles VIII and XOverall
(Transparency andaverage
Bangladesh China Fiji India Indonesia Nepal
Fees and Formalities)
Relevant trade and 5.1 3.4 5.1 6.3 5.4 4.9 5.3customs procedures andregulations arepublicly available andeasily accessible.
Computerization and 4.8 4.2 5.8 5.3 5.0 5.6 3.0automation of customsand trade procedureshave noticeably reducedaverage time of clearance.
Penalties and fines for 4.4 3.3 5.6 4.5 4.3 4.3 4.3minor breaches ofcustoms regulation (e.g.,due to typing mistakes)are small and reasonable.
Information about changes 4.5 3.1 4.5 5.5 4.9 3.6 5.3in regulations andprocedures are madeavailable promptly andconveniently to the public.
It is easy to submit 4.4 3.1 3.9 4.6 4.3 5.4 5.0required tradedocumentation totrade/customsauthorities for approval.
A formal and effective 3.7 3.7 4.6 2.3 4.0 3.4 4.3private sector consultationmechanism exists, whichallows traders tocomment on proposedchanges to regulationsand proceduresbefore they are issuedand implemented.
On average, fees and 4.1 3.4 4.3 4.4 4.0 3.3 5.0charges levied on exportand import are reasonable(i.e., are limited to thecost of services renderedby the authorities).
An independent system 4.1 2.6 3.6 5.1 4.4 4.2 4.6for appealing trade and/orcustoms authoritiesdecisions is available,and operates effectively.
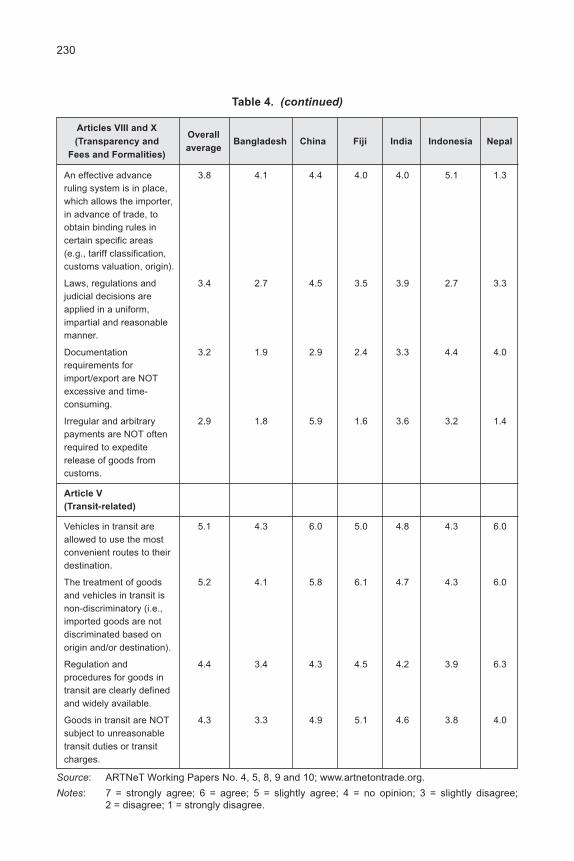
230
An effective advance 3.8 4.1 4.4 4.0 4.0 5.1 1.3ruling system is in place,which allows the importer,in advance of trade, toobtain binding rules incertain specific areas(e.g., tariff classification,customs valuation, origin).
Laws, regulations and 3.4 2.7 4.5 3.5 3.9 2.7 3.3judicial decisions areapplied in a uniform,impartial and reasonablemanner.
Documentation 3.2 1.9 2.9 2.4 3.3 4.4 4.0requirements forimport/export are NOTexcessive and time-consuming.
Irregular and arbitrary 2.9 1.8 5.9 1.6 3.6 3.2 1.4payments are NOT oftenrequired to expediterelease of goods fromcustoms.
Article V
(Transit-related)
Vehicles in transit are 5.1 4.3 6.0 5.0 4.8 4.3 6.0allowed to use the mostconvenient routes to theirdestination.
The treatment of goods 5.2 4.1 5.8 6.1 4.7 4.3 6.0and vehicles in transit isnon-discriminatory (i.e.,imported goods are notdiscriminated based onorigin and/or destination).
Regulation and 4.4 3.4 4.3 4.5 4.2 3.9 6.3procedures for goods intransit are clearly definedand widely available.
Goods in transit are NOT 4.3 3.3 4.9 5.1 4.6 3.8 4.0subject to unreasonabletransit duties or transitcharges.
Source: ARTNeT Working Papers No. 4, 5, 8, 9 and 10; www.artnetontrade.org.
Notes: 7 = strongly agree; 6 = agree; 5 = slightly agree; 4 = no opinion; 3 = slightly disagree;2 = disagree; 1 = strongly disagree.
Table 4. (continued)
Articles VIII and XOverall
(Transparency andaverage
Bangladesh China Fiji India Indonesia Nepal
Fees and Formalities)

231
(a) There was broader agreement in the private sector in Fiji that a formal andeffective private sector consultation mechanism was not in place;
(b) There was relatively stronger agreement among the Fiji respondents thatirregular and arbitrary payments to expedite the release of goods from customswere required;
(c) The respondents from Fiji tended to agree, although only slightly, that anindependent system to appeal trade and/or customs authorities decisionswas available and operating effectively.
(b) Ranking of needs and priorities
As far as the prioritization of the various trade facilitation measures for implementationis concerned (table 5), the following observations were made.
Table 5. Survey results from the private sector: identifying trade
facilitation needs and priorities
(Unit: %)
Trade facilitation needs and prioritiesLow Medium High Highest
priority priority priority priority
Timely and comprehensive publication and 4 8 28 60dissemination of trade rules and regulations.
Establishment (or improvement in the 5 6 39 50effectiveness) of enquiry points and/or callcentres for up-to-date information on tradeprocedures.
Establishment (or improvement in the effectiveness) 5 25 30 40of a consultation mechanism through which traderscan provide inputs on proposed new or amendedrules and regulations.
Establishment (or improvement in the effectiveness) 3 23 40 34of an appeal mechanism outside of the authority ofcustoms or related agencies for traders to disputecustoms and other authorities decisions.
Establishment (or improvement in the effectiveness) 5 20 40 35of an advance ruling system, which allows importers,in advance of trade, to obtain binding rules in certainspecific areas (e.g., tariff classification, customsvaluation, origin).
Beginning and, if possible, completing clearance of 2 11 27 60goods before they have arrived physically in thecustoms territory (based on advance submissionof goods declaration and other documents).
Separating release from clearance procedures, i.e., 10 17 40 33allowing goods to be released before all clearanceformalities have been completed (this may be

232
subject to providing a financial guarantee to customsand/or post-release audit).
Reduction and simplification of the documentation 4 8 22 60requirements for import and export procedures.
Harmonization and standardization of documentation 3 15 27 55requirements based on international standards.
Improvement of coordination between relevant 5 9 27 59agencies, particularly on document requirement,e.g., through the establishment of a single windowfor one-time submission and collection of all tradedocuments.
Computerization and automation of trade 2 8 13 77procedures, e.g., online submission and approval ofCustoms declarations, cargo manifests (includingelectronic payment of fees and customs duties).
Improvement of customs inspection and control 0 5 39 55procedures, e.g., systematic use of risk analysis todetermine which goods should be examined,clearer criteria for green and red channels,and special channels for authorized traders andexpress shipments.
Elimination of bribery and other corrupt practices 1 2 5 92among officials involved in the clearance andrelease of imported goods.
Implementation of international and regional transit 4 26 40 30systems, based on international standards andpractices.
Table 5. (continued)
(Unit: %)
Trade facilitation needs and prioritiesLow Medium High Highest
priority priority priority priority
Elimination of bribery and other corrupt practices among officials involved in theclearance and release of imported goods was considered to be of the highest priority by92 per cent of the respondents. Moreover, 77 per cent of the respondents mentioned thatcomputerization and automation of trade procedures, e.g., online submission and approvalof customs declarations, cargo manifests (including electronic payment of fees and customsduties) was their highest priority.
With regard to the reduction and simplification of documentation requirements forimport and export procedures, 60 per cent of the participants considered it to be theirhighest priority. The same percentage also mentioned that completing clearance of goodsbefore arrival physically in the customs territory (based on advance submission of goodsdeclaration and other documents), together with timely and comprehensive publication anddissemination of trade rules and regulations, were their highest priorities.

233
Fifty-nine per cent of the respondents stated that the improvement of coordinationbetween relevant agencies, particularly on document requirement (e.g., through theestablishment of a single window for one-time submission and collection of all tradedocuments) was their highest priority.
Fifty-five per cent of the respondents also mentioned that improvement in customsinspection and control procedures (e.g., the systematic use of risk analysis to determinewhich goods should be examined, clearer criteria for green and red channels as well asspecial channels for authorized traders and express shipments, and harmonization andstandardization of documentation requirements based on international standards) weretheir highest priorities.
Finally, 50 per cent of the respondents stated that the establishment (or improvementin the effectiveness) of enquiry points and/or call centres for up-to-date information ontrade procedures was also their highest priority.
Table 6 summarizes how private sector respondents in each of the countries studied(including Fiji) prioritize 14 trade facilitation measures mainly related to Articles VIII and Xof GATT. The addition of Fiji does not change any of the overall rankings.
Table 6. Private sector priority ranking of selected trade facilitation measures
in selected countries
Measures Overall Bangladesh China Fiji India Indonesia Nepal
Elimination of bribery and other 1 1 1 1 1 2 1corrupt practices of officialsinvolved in the clearance andrelease of imported goods.
Improved coordination between 2 3 3 6 4 2 4relevant agencies, particularlyon document requirements,e.g., through the establishmentof a single window for one-timesubmission and collection ofall trade documents.
Timely and comprehensive 3 6 4 5 4 1 1publication and disseminationof trade rules and regulations(e.g., through the Internet).
Computerization and 4 6 4 2 2 5 6automation of tradeprocedures, e.g., onlinesubmission and approval ofcustoms declarations andcargo manifests, includingelectronic payment of fees andcustoms duties.
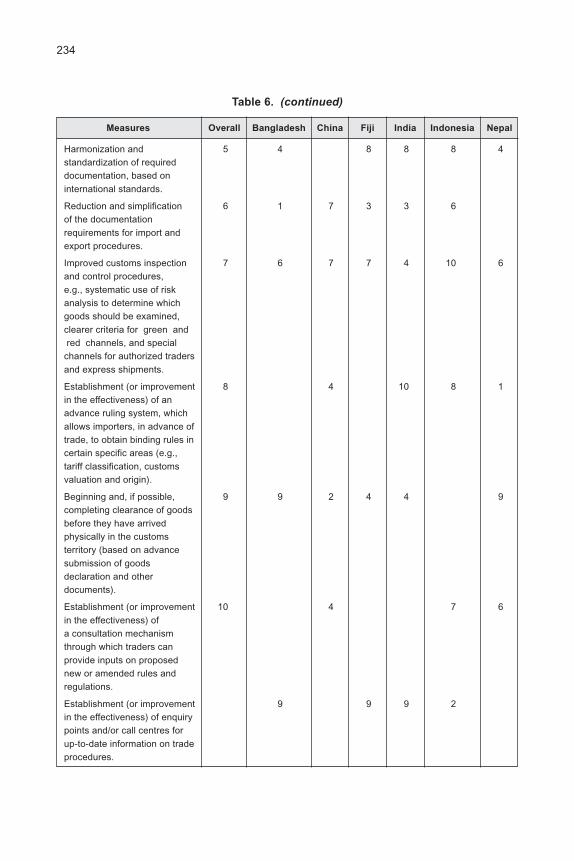
234
Harmonization and 5 4 8 8 8 4standardization of requireddocumentation, based oninternational standards.
Reduction and simplification 6 1 7 3 3 6of the documentationrequirements for import andexport procedures.
Improved customs inspection 7 6 7 7 4 10 6and control procedures,e.g., systematic use of riskanalysis to determine whichgoods should be examined,clearer criteria for green andred channels, and special
channels for authorized tradersand express shipments.
Establishment (or improvement 8 4 10 8 1in the effectiveness) of anadvance ruling system, whichallows importers, in advance oftrade, to obtain binding rules incertain specific areas (e.g.,tariff classification, customsvaluation and origin).
Beginning and, if possible, 9 9 2 4 4 9completing clearance of goodsbefore they have arrivedphysically in the customsterritory (based on advancesubmission of goodsdeclaration and otherdocuments).
Establishment (or improvement 10 4 7 6in the effectiveness) ofa consultation mechanismthrough which traders canprovide inputs on proposednew or amended rules andregulations.
Establishment (or improvement 9 9 9 2in the effectiveness) of enquirypoints and/or call centres forup-to-date information on tradeprocedures.
Table 6. (continued)
Measures Overall Bangladesh China Fiji India Indonesia Nepal

235
Elimination of bribery and other corrupt practices among officials involved in theclearance and release of imported goods was given top priority in all the countries exceptIndonesia. Moreover, computerization and automation of trade procedures received quitea high priority level in Fiji, India and China. In addition, the reduction and simplification ofdocument requirements were ranked quite high in Fiji, Bangladesh and India.
The improvement of coordination between relevant agencies, particularly with regardto documentation requirements (e.g., through the establishment of a single window forone-time submission and collection of trade documents), was also given very high priorityin all the countries except Fiji. Timely and comprehensive publication and disseminationof trade rules and regulations (e.g., through the Internet) was the highest priority in Indonesiaand Nepal, while the reduction and simplification of the documentation requirements forimports/exports was the highest priority in Bangladesh.
Starting and, if possible, completing the clearance of goods before they arrivephysically in the customs territory was a priority for the Chinese private sector and, toa lesser extent, for India and Fiji, but not for the other countries. The establishment ofenquiry points received high priority in Indonesia, but not in the other countries. Theestablishment of an advance ruling system was given top priority by the Nepalese private
Establishment (or improvement 5 10 9in the effectiveness) of anappeal mechanism outside theauthority of customs or relatedagencies for traders to disputecustoms and other authoritiesdecisions.
Separating release from 7clearance procedures, i.e.,allowing goods to be releasedbefore all clearance formalitieshave been completed (thismay be subject to providinga financial guarantee tocustoms and/or post-releaseaudit).
Implementation of internationaland regional transit systems,based on internationalstandards and practices.
Sources: ESCAP, 2006, An exploration of the need for and cost of selected trade facilitation measuresin Asia and the Pacific in the context of the WTO negotiations , Studies in Trade andInvestment No. 57, http://www.unescap.org/tid/artnet/pub/tipub2426.asp; ARTNeT WorkingPapers No. 4, 5, 8, 9 and 10, www.artnetontrade.org.
Note: These figures denote the priority level. For example, 1 = highest priority.
Table 6. (continued)
Measures Overall Bangladesh China Fiji India Indonesia Nepal
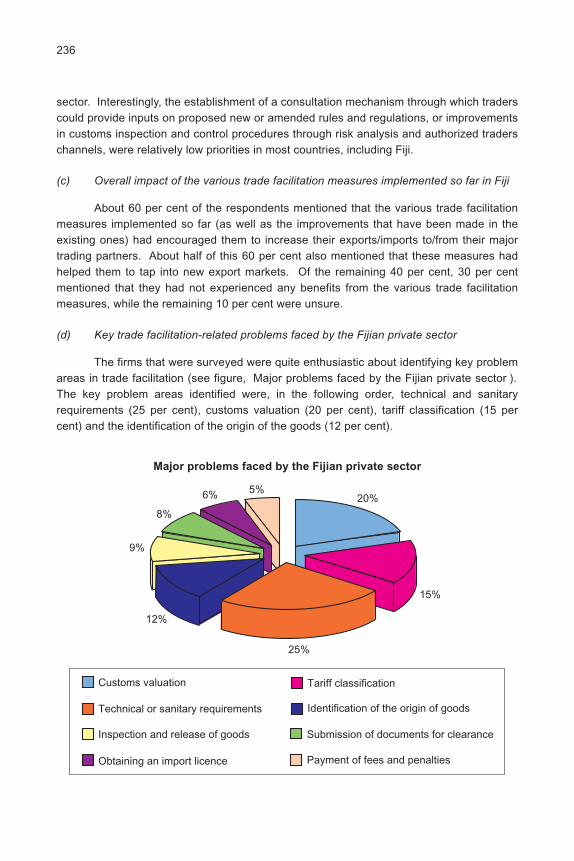
236
sector. Interestingly, the establishment of a consultation mechanism through which traderscould provide inputs on proposed new or amended rules and regulations, or improvementsin customs inspection and control procedures through risk analysis and authorized traderschannels, were relatively low priorities in most countries, including Fiji.
(c) Overall impact of the various trade facilitation measures implemented so far in Fiji
About 60 per cent of the respondents mentioned that the various trade facilitationmeasures implemented so far (as well as the improvements that have been made in theexisting ones) had encouraged them to increase their exports/imports to/from their majortrading partners. About half of this 60 per cent also mentioned that these measures hadhelped them to tap into new export markets. Of the remaining 40 per cent, 30 per centmentioned that they had not experienced any benefits from the various trade facilitationmeasures, while the remaining 10 per cent were unsure.
(d) Key trade facilitation-related problems faced by the Fijian private sector
The firms that were surveyed were quite enthusiastic about identifying key problemareas in trade facilitation (see figure, Major problems faced by the Fijian private sector ).The key problem areas identified were, in the following order, technical and sanitaryrequirements (25 per cent), customs valuation (20 per cent), tariff classification (15 percent) and the identification of the origin of the goods (12 per cent).
Major problems faced by the Fijian private sector
20%
15%
25%
12%
9%
8%
6% 5%
Customs valuation Tariff classification
Technical or sanitary requirements Identification of the origin of goods
Inspection and release of goods Submission of documents for clearance
Obtaining an import licence Payment of fees and penalties
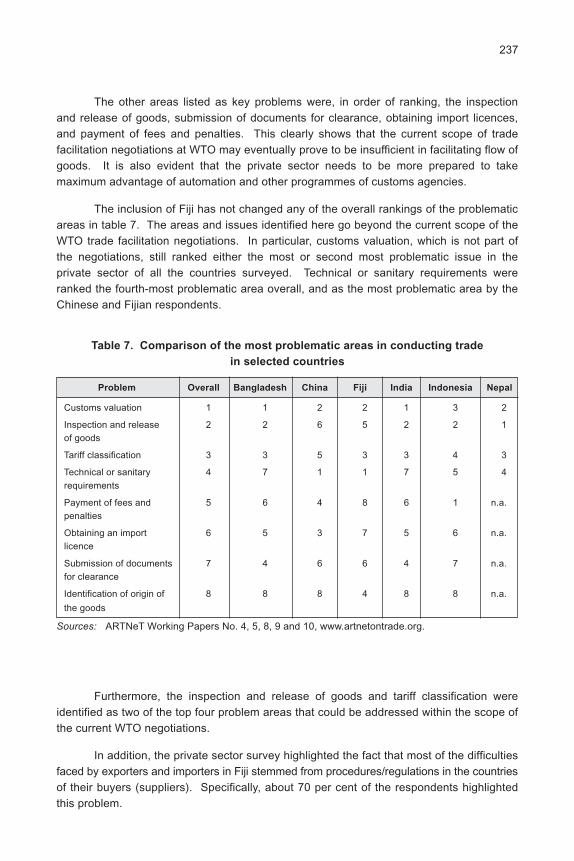
237
The other areas listed as key problems were, in order of ranking, the inspectionand release of goods, submission of documents for clearance, obtaining import licences,and payment of fees and penalties. This clearly shows that the current scope of tradefacilitation negotiations at WTO may eventually prove to be insufficient in facilitating flow ofgoods. It is also evident that the private sector needs to be more prepared to takemaximum advantage of automation and other programmes of customs agencies.
The inclusion of Fiji has not changed any of the overall rankings of the problematicareas in table 7. The areas and issues identified here go beyond the current scope of theWTO trade facilitation negotiations. In particular, customs valuation, which is not part ofthe negotiations, still ranked either the most or second most problematic issue in theprivate sector of all the countries surveyed. Technical or sanitary requirements wereranked the fourth-most problematic area overall, and as the most problematic area by theChinese and Fijian respondents.
Table 7. Comparison of the most problematic areas in conducting trade
in selected countries
Problem Overall Bangladesh China Fiji India Indonesia Nepal
Customs valuation 1 1 2 2 1 3 2
Inspection and release 2 2 6 5 2 2 1of goods
Tariff classification 3 3 5 3 3 4 3
Technical or sanitary 4 7 1 1 7 5 4requirements
Payment of fees and 5 6 4 8 6 1 n.a.penalties
Obtaining an import 6 5 3 7 5 6 n.a.licence
Submission of documents 7 4 6 6 4 7 n.a.for clearance
Identification of origin of 8 8 8 4 8 8 n.a.
the goods
Sources: ARTNeT Working Papers No. 4, 5, 8, 9 and 10, www.artnetontrade.org.
Furthermore, the inspection and release of goods and tariff classification wereidentified as two of the top four problem areas that could be addressed within the scope ofthe current WTO negotiations.
In addition, the private sector survey highlighted the fact that most of the difficultiesfaced by exporters and importers in Fiji stemmed from procedures/regulations in the countriesof their buyers (suppliers). Specifically, about 70 per cent of the respondents highlightedthis problem.
238
B. Implementation by Fiji of the WTO Customs
Valuation Agreement
In the private sector survey, customs valuation was highlighted as one of the keyissues/problems in Fiji. Therefore, this section initially discusses the implementation ofACV by Fiji, followed by a brief discussion of the key issues and constraints.
Customs duties are instruments of fiscal and trade policy that may be calculated byreference to specific rates, ad valorem rates or a combination of both. Like the majority ofcountries, Fiji also applies ad valorem duties and, as a result, places special emphasis onthe valuation principle because a valuation system with uniformity and equity providesa sound base for the assessment of duty, which in turn will deliver fiscal and trade policyaims.
Fiji values imported goods for the purpose of assessing ad valorem duty inaccordance with the principles of ACV, which are spelt out under the Article VII of GATT1994. Fiji s legislative customs valuation provisions are comprehensively set out inSchedule 1 of the Customs Tariff Act, 1986 (parts 1, 2 and 3), which defines how thecustoms value of imported goods is to be determined in compliance with provisions ofACV. However, minimal reference is made in this chapter to legislative provisions becauseFiji s legislation is essentially a mirror reflection of ACV on which it is based.
1. General principles of application of valuation methods
Schedule 1 of the Customs Tariff Act, 1986 is aimed at giving effect to Fiji scommitment under GATT to facilitate international trade by implementing the GATT valuationsystem. Fiji became a signatory to the GATT agreement on 14 January 1996. The WTOAgreement on Customs Valuation, covered under clauses 1(10)-1(12) of Schedule 1 ofthe Customs Tariff Act, 1986, provides Fiji with various methods for valuing importedgoods prior to the application of ad valorem duty rates. Following the WTO ACV, theprimary valuation method adopted is based on the transaction value of imported goods,which is the price actually paid or payable for the goods when sold to Fiji plus adjustmentsfor certain elements - Freight, packaging, commission, goods and services supplied tothe buyer free of charge as well as certain other costs may be added to the customsvalue. In cases where Fiji customs officers are suspicious that the transactions value isfalse, the value may be determined by sequentially applying the following five options:
(a) The value of identical goods;
(b) The value of similar goods;
(c) The imported price of identical or similar goods, less applicable deductionsfor costs incurred within the country of import;
(d) Computed value;
(e) Finally, if none of the above methods work, reasonable means may be usedon the basis of the data available in Fiji.

239
However, under Article IV of ACV and clause 1(11) of Schedule 1 of the CustomsTariff Act, 1986 the deductive and computed value methods may be reversed at therequest of the importer because of the possibility of difficulties in their respectivedeterminations. So far, Fiji has not taken up this right in its statutory enactments.
(a) Primary basis of valuation: Transaction value
The transaction value will only be acceptable as the customs value of the importedgoods if the four conditions set out in paragraph 1 of Article I are satisfied. The fourconditions are:
(a) That there are no restrictions on the disposition or use of the goods by thebuyer other than certain specified ones which: (i) are imposed or required bylaw in the importing country; (ii) are limited to the geographic area in whichthe goods may be resold; and (iii) do not substantially affect the value of thegoods;
(b) That the sale or price is not subject to some condition or consideration forwhich a value cannot be determined with respect to the goods being valued;
(c) That no part of the proceeds of any subsequent resale, disposal or use of thegoods by the buyer will accrue directly or indirectly to the seller, unless anappropriate adjustment can be made in accordance with the provisions ofArticle VIII;
(d) That the buyer and seller are not related or, where the buyer and seller arerelated, the transaction value is acceptable for customs purposes under theprovision of paragraph 2 of Article I.
(b) Subsidiary basis of valuation: Identical and similar goods method
Establishing the value of the imported goods under Article I is not possible when:
(a) The imported goods are not the subject of sale;
(b) The sale is the subject of some restriction on the disposition of use of theimported goods;
(c) The sale is subject to some condition or consideration for which a value canbe determined;
(d) An adjustment needs to be made to the price actually paid or payable underArticle VIII, but insufficient information is available for making the appropriateadjustment;
(e) The sale occurs between related parties.
In all the above cases, Article I will not apply and hence there will be no transactionvalue of the imported goods. In such situations, Fiji s customs administration will resort tothe first alternative basis of value under Article II which is the transaction value of identical
240
goods. If the value still cannot be determined under Article II then the second alternativebasis is Article III which is the transaction value of similar goods. Clauses 4 and 5 ofSchedule 1 of the Customs Tariff Act, 1986 deal with identical and similar good, respectively.
(c) Deductive value method
In cases where the first three methods of arriving at the customs value have beenexamined and discarded, Fiji customs officials may proceed under Article V. Article Vstates that when the customs value cannot be determined under Articles I, II and III, thevalue will be determined on the basis of the price at which the imported goods, or identicalor similar imported goods are sold to unrelated buyers in the importing country.
In that connection, the Customs Tariff Act, 1986 requires that in applying the deductivevalue method for imported goods, profit and general expenses should be taken as a wholeand be calculated on the basis of an accounting report prepared in a manner consistentwith the generally accepted accounting principles.
(d) Computed value method
Article VI states that where the customs value cannot be based on Article V, it willbe based on the sum of the costs incurred in producing the imported goods. Under thedeductive value method, the desired basis is a price at which imported goods are sold inthe importing country and from which certain sales expenses incurred in that country arededucted, but with computed value cost elements reflected in the production of the importedgoods being considered with a view to computing the cost of the goods. For the purposeof Fiji customs procedures, the computed valued is defined in Article VI as being the sumof the following:
(a) The cost or value of materials and fabrication or other processing employedin producing the imported goods;
(b) An amount for profit and general expenses equal to that usually reflected insales of goods of the same class or type as the goods being valued andwhich are made by producers in the exporting country;
(c) The cost or value of all other expenses necessary to reflect the valuationoption chosen by the party under Article VIII(2).
(e) Fall-back method
Provisions relating to the fall-back method of valuation are set out in clause 8 ofSchedule 1 of the Customs Tariff Act, 1986. The five methods of valuation defined in thecode normally provide a basis on which to establish value, but certain situations do notallow the later methods to be applied. These situations include:
(a) The transaction involves leased goods;
(b) Identical or similar goods are not imported;

241
(c) The goods are not resold in the importing country;
(d) The producer is unknown or refuses to disclose cost data to foreigners.
Article VII provides the means for establishing a customs value where the valuecannot be determined under any of the other valuation methods. Article VII does notactually provide for a specific valuation method but rather requires the customs value bedetermined using reasonable means consistent with the principles and general provisionsof Article VII of GATT and on the basis of data available in the importing country.
2. Key constraints and issues in implementing the
WTO Agreement on Customs Valuation
The WTO Agreement on Customs Valuation has been implemented in conjunctionwith other trade facilitation initiatives (as discussed in the previous section) over the pastdecade. The majority of the goods seem to be valued using the transaction value method,5
with other methods being applied in a manner generally consistent with the ACV.6
A FIRCA official confirmed that there had been many cases where imported goodshad been undervalued due to a number of reasons. One of the main reasons is thesubmission of invoices where the goods in question have been undervalued. Once customsofficials are able to ascertain (through the application of their own procedures) thata particular shipment of goods is undervalued, these goods are placed on an audit trialduring which they are heavily scrutinized in order to determine their true value. Penaltiesare also imposed on importers found to have deliberately undervalued their goods. Thepenalties depend on the seriousness of the offence and can range from as low as F$ 150to as high as F$ 2,000. In exceptional circumstances, penalties can be as high as onethird of the value of the imported goods.7
Nonetheless, Customs valuation remains a frequent source of problems that oftenbecome the subject of disputes between traders and customs. The lack of trained manpowerfor customs valuation and the arbitrary and partial application of laws, regulations andjudicial decisions seem to be particularly important issues. Excessive and time-consumingdocumentation requirements and the lack of a formal and effective public-private sectorconsultation mechanism are also alluded to.
C. Policy recommendations and conclusion
This chapter initially discussed the various trade facilitation initiatives that havebeen implemented in Fiji. It then highlighted the trade facilitation needs and priorities of
5 A FIRCA official who was interviewed on this issue was not able to quantify the usage of thetransactions value method, however.
6 A. Singh, 2006, Research, Policy, Planning and Development Officer, Fiji Islands Revenue andCustoms Authority, Suva (personal communication).
7 Ibid.

242
Fiji as well as the impact of the various trade facilitation measures implemented so far onthe private sector in Fiji, based on a private sector survey that carried out in October 2006.This chapter also shed some light on the practical implementation of ACV in Fiji and theproblems faced during its implementation.
Based on the results of the private sector survey, the following priorities can beidentified with regards to trade facilitation and customs valuation:
(a) The elimination of bribery and other corrupt practices among officials involvedin the clearance and release of imported goods;
(b) Computerization and automation of trade procedures, e.g., online submissionand approval of customs declarations, cargo manifests including electronicpayment of fees and customs duties;
(c) The reduction and simplification of required documentation for import andexport procedures;
(d) Completing clearance of goods before they have arrived physically in thecustoms territory (based on advance submission of goods declaration andother documents);
(e) The timely and comprehensive publication and dissemination of trade rulesand regulations;
(f) The improvement of coordination between relevant agencies, particularly withregard to documentation requirements, e.g., through the establishment ofa single window for one-time submission and collection of all trade documents;
(g) The improvement in customs inspection and control procedures, e.g., systematicuse of risk analysis to determine which goods should be examined, clearercriteria for green and red channels as well as special channels for authorizedtraders and express shipments;
(h) Harmonization and standardization of documentation requirements based oninternational standards;
(i) The establishment (or improvement in the effectiveness) of enquiry pointsand/or call centres for up-to-date information on trade procedures.
Fiji, on its own, may need to address recommendation (a), while the otherrecommendations can be ably addressed through regional initiatives. However, it is alsoworthwhile mentioning that Fiji, on its own, has already started working on recommendations(b) and (h) above. Finally, the priorities identified through the private sector survey indicatethat those regional initiatives that have been implemented or which are in the process ofbeing implemented are generally focusing on the right issues.

243
Bibliography
Bhattacharya, D. and S.S. Hossain, 2006. An evaluation of the need and cost of selectedtrade facilitation measures in Bangladesh: Implications for the WTO negotiationson trade facilitation , ARTNeT Working Paper Series No. 9. ESCAP, Bangkok.Website: http://www.unescap.org/tid/artnet/pub/wp906.pdf (accessed 12 December2006).
Chaturvedi, S., 2006. An evaluation of the need and cost of selected trade facilitationmeasures in India: Implications for the WTO negotiations , ARTNeT Working PaperSeries No. 4. ESCAP, Bangkok. Website: http://www.unescap.org/tid/artnet/pub/wp406.pdf (accessed 1 December 2006).
Customs Cooperation Council, 1952. The Customs Valuation Compendium - GATTAgreement and Texts of the Technical Committee on Customs Valuation, WorldCustoms Organization, Brussels.
Damuri, Y.R., 2006. An evaluation of the need for selected trade facilitation measures inIndonesia: Implications for the WTO negotiations on trade facilitation , ARTNeTWorking Paper Series No. 10. Website: http://www.unescap.org/tid/artnet/pub/wp1006.pdf (accessed 12 December 2006).
ESCAP, 2006. An exploration of the need for and cost of selected trade facilitationmeasures in Asia and the Pacific in the context of the WTO negotiations , Studiesin Trade and Investment No. 57. Bangkok. Website: http://www.unescap.org/tid/artnet/pub/tipub2426.asp.
Korea Customs Service, 2004. Customs Valuation, Dunsan-Dong, Seo-Gu, Daejeon,Republic of Korea. Website: http://english.customs.go.kr/hp/eng/trade/eca__000/ecae_000/ecae_000.html (accessed on 23 June 2006).
Rajkarnikar, P.R., 2006. Implementation of the WTO Customs Valuation Agreement inNepal: An ex-ante impact assessment , ARTNeT Working Paper Series No. 16.ESCAP, Bangkok. Website: http://www.unescap.org/tid/artnet/pub/wp1806.pdf(accessed on 1 December 2006).
Rajkarnikar, P.R., N.M. Maskay and S.R. Adhikari, 2006. The need for and cost ofselected trade facilitation measures relevant to the WTO trade facilitationnegotiations: A case study of Nepal , ARTNeT Working Paper Series No. 8. ESCAP,Bangkok. Website: http://www.unescap.org/tid/artnet/pub/wp806.pdf (accessed on2 December 2006).
Singh, A., 2006. Research, Policy, Planning and Development Officer, Fiji Islands Revenueand Customs Authority, Suva. (Personal communication.)
UNCTAD, 1999. Summary of position and proposals regarding the implementation ofthe agreement on implementation of Article VII of the GATT 1994 in terms ofparagraph 9 . Website: http://www.uneca.org/eca_resources/Major_ECA_Websites/wto/cv.htm (accessed on 16 June 2006).

244
Walsh, T.J., 2003. Customs Valuation, Changing Customs, (Michael Keen, ed.). InternationalMonetary Fund, Washington, D.C.
Wenjing, C. and L. Wei, 2006. An evaluation of the need and cost of selected tradefacilitation measures in China: Implications for the WTO negotiations on tradefacilitation , ARTNeT Working Paper Series No. 5. ESCAP, Bangkok. Website:http://www.unescap.org/tid/artnet/pub/wp506.pdf (accessed on 12 December 2006).
World Customs Organization, undated. Customs Valuation of Goods. Website: http://www.eiciindia.org/frontsite/WCO%20Customs%20valuations.pdf (accessed on19 June 2006).
World Trade Organization, undated. Agreement on implementation of Article VII of theGeneral Agreement on Tariffs and Trade 1994 - general introductory commentary .Website: http://www.wto.org/english/docs_e/legal_e/20-val.pdf (accessed on 22 June2006).
, undated. Customs Valuation. Website: http://www.wto.org/english/tratop_e/cusval_e/cusval_e.htm (accessed 21 June 2006).
and UNCTAD, 2001. Implementation-related issues and concerns , Doha MinisterialConference, (fourth session), 9-14 November 2001. Website: http://www.wto.org/english/thewto_e/minist_e/min01_e/mindecl_implementation_e.htm (accessed on25 June 2006).
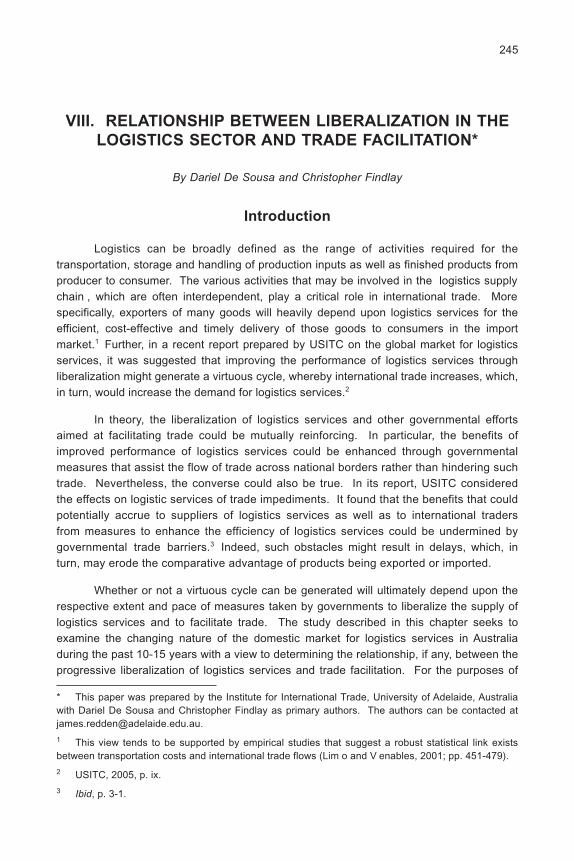
245
VIII. RELATIONSHIP BETWEEN LIBERALIZATION IN THE
LOGISTICS SECTOR AND TRADE FACILITATION*
By Dariel De Sousa and Christopher Findlay
Introduction
Logistics can be broadly defined as the range of activities required for thetransportation, storage and handling of production inputs as well as finished products fromproducer to consumer. The various activities that may be involved in the logistics supplychain , which are often interdependent, play a critical role in international trade. Morespecifically, exporters of many goods will heavily depend upon logistics services for theefficient, cost-effective and timely delivery of those goods to consumers in the importmarket.1 Further, in a recent report prepared by USITC on the global market for logisticsservices, it was suggested that improving the performance of logistics services throughliberalization might generate a virtuous cycle, whereby international trade increases, which,in turn, would increase the demand for logistics services.2
In theory, the liberalization of logistics services and other governmental effortsaimed at facilitating trade could be mutually reinforcing. In particular, the benefits ofimproved performance of logistics services could be enhanced through governmentalmeasures that assist the flow of trade across national borders rather than hindering suchtrade. Nevertheless, the converse could also be true. In its report, USITC consideredthe effects on logistic services of trade impediments. It found that the benefits that couldpotentially accrue to suppliers of logistics services as well as to international tradersfrom measures to enhance the efficiency of logistics services could be undermined bygovernmental trade barriers.3 Indeed, such obstacles might result in delays, which, inturn, may erode the comparative advantage of products being exported or imported.
Whether or not a virtuous cycle can be generated will ultimately depend upon therespective extent and pace of measures taken by governments to liberalize the supply oflogistics services and to facilitate trade. The study described in this chapter seeks toexamine the changing nature of the domestic market for logistics services in Australiaduring the past 10-15 years with a view to determining the relationship, if any, between theprogressive liberalization of logistics services and trade facilitation. For the purposes of
* This paper was prepared by the Institute for International Trade, University of Adelaide, Australiawith Dariel De Sousa and Christopher Findlay as primary authors. The authors can be contacted [email protected].
1 This view tends to be supported by empirical studies that suggest a robust statistical link existsbetween transportation costs and international trade flows (Lim o and V enables, 2001; pp. 451-479).
2 USITC, 2005, p. ix.
3 Ibid, p. 3-1.
246
the study, the term trade facilitation includes the interpretation of this term as the simplificationand harmonization of international trade procedures that apply at the border to exportedand imported good, while also encompassing broader governmental measures to facilitatetrade, which reduce traders transaction costs and thereby promote trade. The export oftuna from South Australia to Japan is used as an example to illustrate this relationship.
A. Trends in the Australian market for logistics services
1. Importance of liberalization
The services sector plays an important role in any domestic economy. In 1998,the World Bank estimated that among developing countries, the services sector accountedfor 38 per cent of gross domestic product in low-income countries and 56 per cent formiddle-income countries. For high-income developed countries, the figure was estimatedto be 65 per cent.4 More recently, in 2005, OECD estimated that, among OECD countries,the services sector accounted for more than 70 per cent of total employment.5
A number of benefits are touted as flowing from domestic liberalization of theservices sector. For example, it is generally considered that regulatory reform of servicesmarkets will create opportunities for firms to develop new services, meet emerging globaldemands and increase employment. Further, liberalization spurs competition, which improvesefficiency and innovation.6 Theory also suggests that liberalization results in lower prices,better quality and increased choice for consumers. Evidence in the telecommunications7
and financial sectors8 tend to bear this theory out. The precise impact and size of thegains resulting from services liberalization will depend upon the market structure of thesector in question, the nature and extent of the liberalization measures adopted and thebroader regulatory framework within which the services in question are being supplied.
The logistics sector is a particularly important services sector for all domesticeconomies and, therefore, the rewards of domestic liberalization can be especially significant.The global market for third-party logistics services was valued at around US$ 130 billionin 2002.9 Notably, consumers of logistics services are typically suppliers of productsthemselves. Consequently, the efficient supply of logistics services, which is enhancedthrough liberalization, helps to facilitate the supply of a whole range of other products.The more timely, reliable and efficient the logistics supply chain, the quicker and morereliably can goods be delivered from the point of production to the point of consumption.
4 Website: http://www.dti.gov.uk/files/file23412.pdf.
5 OECD, 2005; p. 2.
6 OECD, 2005, p. 2.
7 See, for example, International Communications Union, 2002, World Telecommunication DevelopmentReport 2002, March.
8 See, for example, International Financial Services, 2002, Impact of Liberalising Financial Services,January.
9 USITC, 2005; p. 2-1.

247
In this regard, globalization has highlighted the need for and importance ofliberalization of logistics services. As a result of globalization, a vast range of products -perishable and non-perishable alike - can be sourced from all over the world. It is in thiscontext that the cost of time has become a critical factor from the perspective ofexporters, importers and suppliers of logistics services. The time it takes to geta product to market may determine whether or not a product gains entry into a foreignmarket. Furthermore, time may still affect the volume of trade, even in cases whereentry into the foreign market has been achieved.10 Recent studies indicate that a 10 percent increase in time reduced bilateral trade volumes by between 5 and 8 per cent.11
The cost of time becomes all the more pressing if the product is perishable and hasa short shelf-life and/or if the product is needed for just-in-time production. Additionally,perishable products must not only be safe to consume but also edible upon arrival in thedestination market. These combined pressures have driven changes in the logisticssector throughout the world, including in Australia.
Logistics activities represent approximately 9 per cent of Australia s GDP,comparable with 12 per cent for mining, construction and utilities, 11 per cent for wholesaleand retail trade, and 12 per cent for manufacturing.
Australia s large geographic dimensions coupled with the breadth of products thatare exported abroad, ranging from heavy commodities to delicate perishables, pose importantchallenges to the supply of logistics services in Australia. A number of different types oflogistics services may be necessary to transport and deliver the product from Australiato the export market in the form or state required by consumers. The efficient andcost-effective supply of multi-modal logistics services may be compromised if there aresignificant differences between the suppliers of each type of service along the logisticssupply chain in terms of infrastructure, organization and service standards. Poor performanceof just one aspect of the logistics supply chain could affect the competitiveness of theexported product. In the long term, instances of poor performance associated with thesupply of logistics services may permanently damage an exporter s reputation abroad.
2. Logistics supply chain
The performance of logistics services can be analysed in the context of the logisticssupply chain. The supply chain represents the sequence of logistics activities involved inthe transportation, storage and handling of products while en route to the destinationmarket, and illustrates the interdependencies between those activities. Figure I providesa diagrammatic representation of a typical supply chain.
10 OECD, 2006; p.7.
11 Notably, a recent survey conducted by the World Bank found that, in the case of a number ofdeveloping countries, the time taken to get products from the factory gate to the border for export afterclearance was beyond the lead time for delivery of the product prescribed by customers (see OECD,2006; pp 9-10).

248
Swift and seamless delivery is the primary objective along the entire supply chain.In order to achieve that objective, the supply of a specific logistics service must beundertaken in coordination with the supply of the other interdependent logistics services inthe supply chain. One option for achieving an integrated approach is through the in-housesupply of logistics services by the producers who require such services. In Australia,around 50 per cent of logistics services are currently supplied in-house. However, thismay be a costly and resource-draining option, particularly for firms whose core business isfar-removed from the supply of logistics services. Indeed, an important trend in theAustralian market for logistics services is the increasing preparedness of firms to outsource
Figure I. Overview of the logistics supply chain
Source: Bureau of Transport Economics, 2001.
Inputs
Logisticsservices
Production
Logisticsservices
Distribution
Logisticsservices
Consumption
Logisticsinfrastructure
and resources
Logisticsinformationsystems
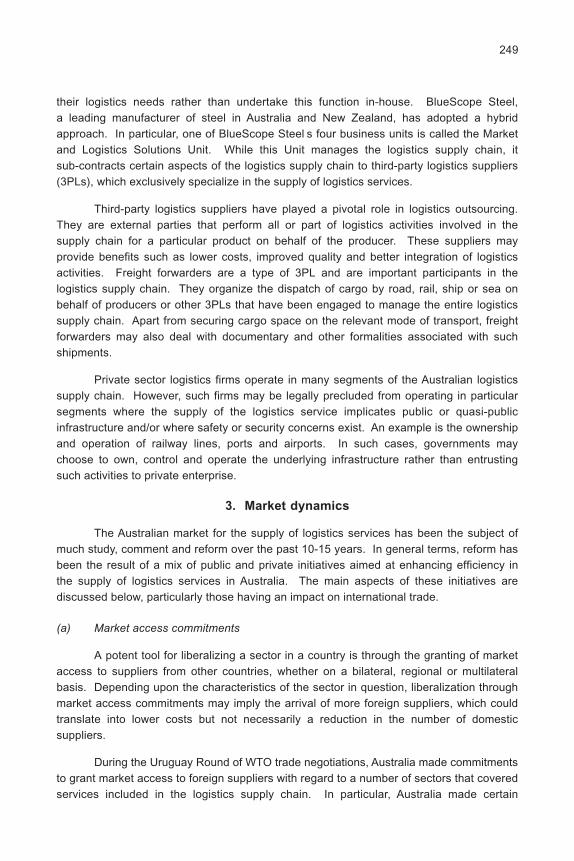
249
their logistics needs rather than undertake this function in-house. BlueScope Steel,a leading manufacturer of steel in Australia and New Zealand, has adopted a hybridapproach. In particular, one of BlueScope Steel s four business units is called the Marketand Logistics Solutions Unit. While this Unit manages the logistics supply chain, itsub-contracts certain aspects of the logistics supply chain to third-party logistics suppliers(3PLs), which exclusively specialize in the supply of logistics services.
Third-party logistics suppliers have played a pivotal role in logistics outsourcing.They are external parties that perform all or part of logistics activities involved in thesupply chain for a particular product on behalf of the producer. These suppliers mayprovide benefits such as lower costs, improved quality and better integration of logisticsactivities. Freight forwarders are a type of 3PL and are important participants in thelogistics supply chain. They organize the dispatch of cargo by road, rail, ship or sea onbehalf of producers or other 3PLs that have been engaged to manage the entire logisticssupply chain. Apart from securing cargo space on the relevant mode of transport, freightforwarders may also deal with documentary and other formalities associated with suchshipments.
Private sector logistics firms operate in many segments of the Australian logisticssupply chain. However, such firms may be legally precluded from operating in particularsegments where the supply of the logistics service implicates public or quasi-publicinfrastructure and/or where safety or security concerns exist. An example is the ownershipand operation of railway lines, ports and airports. In such cases, governments maychoose to own, control and operate the underlying infrastructure rather than entrustingsuch activities to private enterprise.
3. Market dynamics
The Australian market for the supply of logistics services has been the subject ofmuch study, comment and reform over the past 10-15 years. In general terms, reform hasbeen the result of a mix of public and private initiatives aimed at enhancing efficiency inthe supply of logistics services in Australia. The main aspects of these initiatives arediscussed below, particularly those having an impact on international trade.
(a) Market access commitments
A potent tool for liberalizing a sector in a country is through the granting of marketaccess to suppliers from other countries, whether on a bilateral, regional or multilateralbasis. Depending upon the characteristics of the sector in question, liberalization throughmarket access commitments may imply the arrival of more foreign suppliers, which couldtranslate into lower costs but not necessarily a reduction in the number of domesticsuppliers.
During the Uruguay Round of WTO trade negotiations, Australia made commitmentsto grant market access to foreign suppliers with regard to a number of sectors that coveredservices included in the logistics supply chain. In particular, Australia made certain

250
commitments with respect to road and maritime freight transport, storage and warehousing,and various other auxiliary services. Australia s efforts to improve market access to itsdomestic logistics market are ongoing. In the context of the Doha Round of WTO tradenegotiations, a number of offers have been made for new market access commitmentsthat may have an impact upon the domestic market for the supply of logistics services.12
The results of Australia s market access commitments are illustrated in the followingstatistics.
Table 1. Foreign and Australian players in the Australian market
for logistics services
Logistics subsectorMajor players in terms of market share
Foreign Australian
Road transport TNT Toll Holdings LinfoxK&S CorporationScott Corporation
Maritime transport P&O Australia National LinesShipping LineBHP Billiton
Storage P&O Toll HoldingsSwire Linfox
Source: Based on general literature and press reports concerning the logistics sector in Australia.
12 Specifically, Australia has offered market access commitments with respect to maritime cargohandling and agency services, air transport ground handling services, selling and marketing of air andrail transport services, and customs clearance services.
(b) Domestic regulatory reform
Regulatory reform in the Australian logistics sector has been driven by changes inregulatory philosophy, dissatisfaction with the service provided by government or monopolysuppliers, and a desire on the part of federal and state governments to reduce expenditureon infrastructure or to fund infrastructure improvements. Reform has seen major changesin the market environment for both public and private suppliers of logistics services inAustralia. These changes have predominantly been with regard to the transportationcomponents of the logistics supply chain, transportation being the most significant componentof the supply chain in terms of dollars spent.
Prior to such reforms, state monopolies owned and operated the railways whileinterstate road transport was heavily regulated, irregular and slow. In addition, relativelyfew shipping lines and airlines serviced Australia. Since then, liberalization and/or privatizationhave taken place in virtually all segments of the transportation components of the logisticssupply chain. Broadly speaking, the result of the reform efforts has been increased
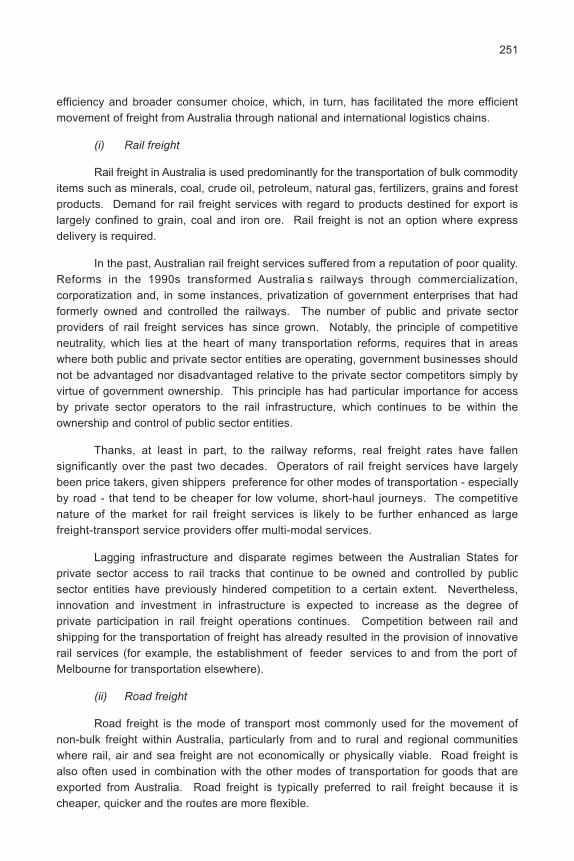
251
efficiency and broader consumer choice, which, in turn, has facilitated the more efficientmovement of freight from Australia through national and international logistics chains.
(i) Rail freight
Rail freight in Australia is used predominantly for the transportation of bulk commodityitems such as minerals, coal, crude oil, petroleum, natural gas, fertilizers, grains and forestproducts. Demand for rail freight services with regard to products destined for export islargely confined to grain, coal and iron ore. Rail freight is not an option where expressdelivery is required.
In the past, Australian rail freight services suffered from a reputation of poor quality.Reforms in the 1990s transformed Australia s railways through commercialization,corporatization and, in some instances, privatization of government enterprises that hadformerly owned and controlled the railways. The number of public and private sectorproviders of rail freight services has since grown. Notably, the principle of competitiveneutrality, which lies at the heart of many transportation reforms, requires that in areaswhere both public and private sector entities are operating, government businesses shouldnot be advantaged nor disadvantaged relative to the private sector competitors simply byvirtue of government ownership. This principle has had particular importance for accessby private sector operators to the rail infrastructure, which continues to be within theownership and control of public sector entities.
Thanks, at least in part, to the railway reforms, real freight rates have fallensignificantly over the past two decades. Operators of rail freight services have largelybeen price takers, given shippers preference for other modes of transportation - especiallyby road - that tend to be cheaper for low volume, short-haul journeys. The competitivenature of the market for rail freight services is likely to be further enhanced as largefreight-transport service providers offer multi-modal services.
Lagging infrastructure and disparate regimes between the Australian States forprivate sector access to rail tracks that continue to be owned and controlled by publicsector entities have previously hindered competition to a certain extent. Nevertheless,innovation and investment in infrastructure is expected to increase as the degree ofprivate participation in rail freight operations continues. Competition between rail andshipping for the transportation of freight has already resulted in the provision of innovativerail services (for example, the establishment of feeder services to and from the port ofMelbourne for transportation elsewhere).
(ii) Road freight
Road freight is the mode of transport most commonly used for the movement ofnon-bulk freight within Australia, particularly from and to rural and regional communitieswhere rail, air and sea freight are not economically or physically viable. Road freight isalso often used in combination with the other modes of transportation for goods that areexported from Australia. Road freight is typically preferred to rail freight because it ischeaper, quicker and the routes are more flexible.

252
The regulation of road transport is linked to externalities such as car accidentsinvolving heavy vehicles, noise emissions, and air pollution and traffic congestion that maydamage roads and the environment in the long term. These externalities imply social,environmental and economic concerns that have been addressed in Australia througha variety of safety and technical standards, rules on traffic and driving conditions andcharges on the use of road infrastructure, such as freeways.
The States and Territories are primarily responsible for the regulation of road transportunder Australia s Constitution.13 In the past, the States each enacted their own lawsdealing with road rules, vehicle standards and driver licensing. Over time, differencesbetween those laws became an impediment to transportation of road freight across stateand territory borders. In 1991, the National Road Transport Commission was establishedto develop uniform arrangements between the States and Territories, and has madeconsiderable progress in harmonizing vehicle registration requirements, vehicle standardsand road rules including those related to the carriage of dangerous goods.
The market for road freight services, in which a significant number of smallowner-operators are incumbent, is fiercely competitive despite the existence of heavyregulation. The barriers to entry are low given the relatively low start-up capital that isneeded (to buy a truck, for example). Inter-modal competition between road and othermodes of transportation, such as rail, air and sea, has also served to heighten the level ofcompetition in the market.
Available evidence indicates that competition in the market for road freight hasresulted in downward pressure on prices. Such evidence also suggests that competitionbetween incumbents is based largely on specialized services (e.g., vehicles tailored fora particular industry or type of cargo) and reliability, rather than on price. Significantly,increased competition has not seen a concomitant reduction in safety standards. Further,there is evidence of a decline in the incidence of heavy vehicles involved in fatal accidents.Nevertheless, it is notable that the industry is gradually becoming more concentrated asa result of a competitive disadvantage faced by the smaller truck owner-operators - i.e.,the difficulties associated with maximizing truck use, 24 hours a day, seven days a week.Large foreign freight companies have become prominent in the industry through capitalizingon this disadvantage. It has yet to be seen whether Australian competition law, which isdiscussed in more detail below, will have a role to play in addressing increasing concentrationin this sector.
(iii) Sea freight
Shipping by sea freight dominates Australia s international freight activity, particularlywith regard to long-haul, high-volume movements of cargo.
13 The Australian Government comprises three main parts. The first is the Federal Government,which has jurisdiction over, and responsibility for the entire Commonwealth of Australia. The secondare the State and Territory Governments, which only have jurisdiction over, and responsibility for therelevant Australian State or Territory they have been elected to govern. The third comprises the localgovernments, which have responsibility for certain matters within sub-areas in the Australian Statesand Territories.

253
The capacity of Australian ports directly affects the supply of sea freight services.Historically, government-owned ports in a number of Australian States developed in isolationfrom one another and were insulated from competition due to the absence of adequateland transport connections between them. Since then, the various ports have been reformedthrough corporatization and privatization, and in some State jurisdictions, third-party accessregimes have been established to facilitate the supply of auxiliary port services. Improvedrail services and enhanced competition in the market for road freight has resulted inincreased competition between the ports.
Port reforms have delivered savings to suppliers of sea freight services. Portshave progressively moved away from basing charges on the value or volume of cargohandled; rather, they have introduced charging that is based on cost. However, inadequateport infrastructure at a number of Australian ports may constitute an impediment to thefurther realization of efficiencies and cost savings.
With respect to the sea freight services themselves, reform has been relativelylimited, due in part to the existence of international bodies that play a role in determiningthe global regulatory framework for the supply of such services, such as the InternationalMaritime Organization. Nevertheless, during the 1990s, several state-owned shippinglines were privatized, including Australian National Lines. The sea freight industry inAustralia is now characterized by a high degree of globalization and is relativelyconcentrated, with foreign-flagged ships carrying the majority of goods in and out ofAustralia. The speed and nature of the service offered by airfreight poses a competitivethreat to sea freight, particularly with regard to low-volume, time-sensitive and valuablefreight as well as for inputs needed for just-in-time production. A formidable barrier toentry is the costly acquisition of equipment - in particular, ships. Further, prices forshipping services to and from Australia are largely determined by international freightrates and are known to be the subject of price-fixing.
Shipping conferences are currently conditionally exempted from the application ofdomestic competition law.14 The main objective of this exemption is to ensure that exportershave access to sea freight services of adequate frequency, capacity and reliability and atrates that are internationally competitive. Amendments made to domestic competition lawin 2000 have provided partial extension of this exemption to assist importers.
(iv) Airfreight
Airfreight is typically used for the transportation of low-volume, high-value products.In Australia, airfreighted imports consist mostly of high-value, high-tech manufacturedgoods such as computers and other electronic goods, whereas exports are dominated byperishable primary products of lower market value, particularly fresh seafood. Airfreightservices can only be accessed through the use of freight forwarders.
14 A shipping conference is an alliance made up of a number of carriers that provide a service fromspecified points to points for a defined route, which is distributed according to market share.

254
The domestic Australian market for airfreight services can now be described asvigorously competitive following the introduction of competition during the past two decades.Competition has been increased through granting of the right to provide air services underair services arrangements that have been negotiated by Australia and other countries,largely on the basis of mutual benefit. Such arrangements determine the number ofaircraft authorized to operate on each route.
As a result of increased competition, the air freight industry is now serviced bya number of different airlines, both domestic and foreign. A large proportion of air freighttransported to and from Australia is carried in the belly-holds of passenger aircraft, as thisis cheaper than using aircraft that are dedicated to air freight. Previously, air freight cargorates were negotiated and fixed at traffic conferences convened by the International AirTransport Association (IATA) and were subsequently approved by governments under airservices arrangements. However, indicative reference fares have since replaced thefixed rates, leaving airlines with some price flexibility. Demand tends to be highlyprice-elastic with respect to low value-to-weight cargo (i.e., those products typically importedinto Australia via airfreight), whereas cargo rates on outbound journeys from Australia forhigh-volume, low-value goods tend to be higher. Of relevance in this regard is the fact thatairfreight operators are reluctant to carry high-volume, low-value cargo on outbound journeysfrom Australia if this compromises their ability to carry high-value products on a subsequentleg of the journey. If the users of freight services are flexible regarding the time taken todeliver freight, cheaper, less direct routes may be possible.
Infrastructure capacity has been, and will continue to be a constraining factor withrespect to the supply of airfreight services. In the longer term, airlines are expected toinvest in larger dedicated freight aircraft to take advantage of this fast-growing sector.
4. Role of domestic competition policy
In 1995, the State and Federal Governments agreed to a domestic reform packagecalled the National Competition Policy. It was pursuant to this policy that many of thereforms referred to above concerning the supply of transportation services in Australiawere undertaken. Competition policy continues to play a role with regard to a number ofthe market segments along the logistics supply chain. In particular, competition policy hasa bearing upon access to publicly and privately owned infrastructure, particularly withregard to rail freight. It may also be relevant to mergers, alliances and cooperativearrangements that have been struck between companies supplying services within and/orbetween segments of the logistics supply chain.
(a) Access to infrastructure
The terms and conditions according to which access to infrastructure is granted willhave a direct impact on the supply of services that are immediately dependent upon thatinfrastructure (for example, access to rail tracks to provide rail freight services). Moreover,service providers further downstream in the supply chain may also be affected if the cost

255
and time associated with negotiating and arranging access to infrastructure result in delaysand uncertainty.
Competition policy can help to strike a balance between the competing interests ofthe infrastructure owner to make a reasonable return on investment while converselygranting users of the infrastructure certain, fair and equitable access to infrastructure.Competition policy may also assist in ensuring a competitive environment among serviceproviders seeking access to such infrastructure.
Australian competition law governs access to essential facilities , includinginterstate and intrastate rail infrastructure controlled by public as well as private entities.That law establishes the framework for access to rail infrastructure in Australia. Inparticular, it provides that rail infrastructure must be accessible by third parties that wishto provide a service dependent upon such infrastructure through a declaration process.The terms and conditions according to which access will be granted is determined upfront through undertakings made by the infrastructure owners, and which are enforceablein court. Competition law also provides for arbitration by the competition regulator in theevent that access to rail infrastructure is the subject of dispute between the owner andthird parties seeking access to the infrastructure in question.
(b) Other competition issues
As is evident from the foregoing discussion, the degree of competition withinparticular market segments along the logistics supply chain varies; in some cases, thisvariation is considerable. The regulatory environment in which the logistics service inquestion is supplied will clearly have an impact on the degree of competition within therelevant market segment. Furthermore, the degree of competition will be affected by thenature of the service being supplied and the market structure. More specifically, thecompetitive environment will be affected by the degree of homogeneity of the particularservices being supplied. It will also be affected by the existence or absence of barriersto entry. Buyer power will also be relevant. For example, the larger the firm seeking toship its cargo, the greater its power to demand speedy, cost-effective and tailor-madefreight transport solutions. Further, the level of competition will depend upon the degreeof consolidation, partnerships and alliances within particular segments of the logisticssupply chain and as between segments of the supply chain.
Australian competition law and policy has a role to play in ensuring that the degreeof competition in each market segment along the logistics supply chain maximizes benefitsfor the suppliers and consumers of such services. It is of particular relevance with regardto the emergence of increased supply chain collaboration, which is possible thanks toincreased globalization, advances in information technology, and a series of acquisitions,mergers and other alliances.
On the one hand, formal as well as informal linkages between players along thelogistics supply chain may result in cost savings for service suppliers and service users.They may also lead to improvements in the range of services offered. Additionally, and

256
perhaps, more importantly, such linkages may facilitate the supply of integrated, seamlesslogistics services, which is increasingly of utmost importance to consumers of logisticsservices. In this regard, it is important to note that studies undertaken over the pastdecade indicate that seamless integration along the logistics supply chain had previouslynot been achieved in Australia. This was due, at least in part, to fragmented marketstructures, incompatible information systems and infrastructure (particularly at inter-modaltransfer points) as well as the independent and competitive mindset of supply chainparticipants. On the other hand, however, linkages between players along the logisticssupply chain may attract the application of Australian competition law if they compromisethe degree of competition in the domestic market. For example, mergers among largeglobal players have been the subject of scrutiny by the Australian competition regulator inrelation to the supply of rail freight services, maritime freight services and stevedoringservices. However, as yet, action has not been taken by the competition regulator toprevent such mergers.
5. General observations
Despite Australia s relatively close geographic proximity to key export markets inthe Asia-Pacific region, in the past logistics costs had been higher than in a number ofcompeting countries. Inefficiencies within segments of the logistics supply chain as wellas lack of integration along the supply chain were at least partly responsible.
As noted above, Australia has implemented a number of reforms in the logisticssector. Some of these reforms have been undertaken with regard to specific aspects of
Table 2. Summary of main reforms in Australia that have had an impact
upon the logistics sector
Type of reformGeneral/specific Aspect of logistics
Time of adoptionto logistics sector supply chain affected
Privatization/ Specific Rail freight 1990sderegulation Road freight
Sea freight(including port reform)
Market access Specific Road freight 1994commitments Sea freight
StorageWarehousingAuxiliary logisticsservices
National Competition General Potentially all aspects 1995Policy but particularly
relevant in relation torail freight and seafreight
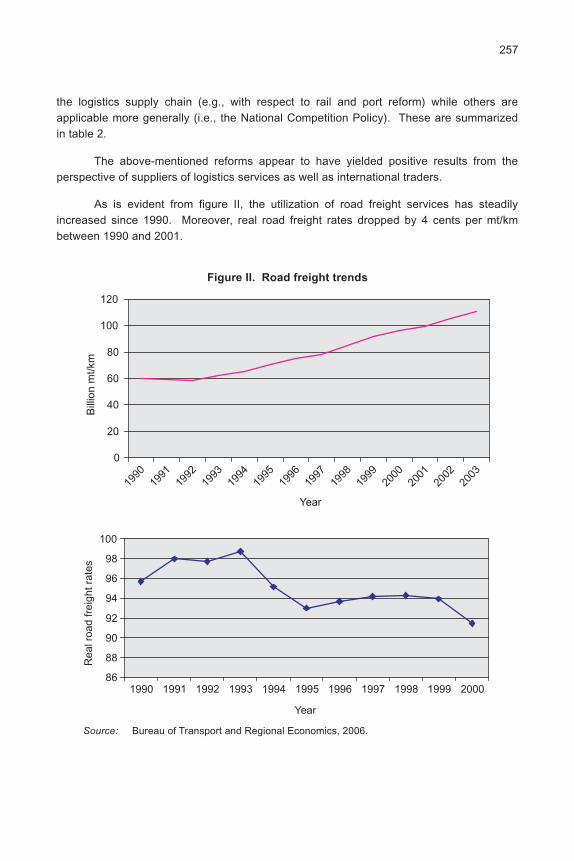
257
the logistics supply chain (e.g., with respect to rail and port reform) while others areapplicable more generally (i.e., the National Competition Policy). These are summarizedin table 2.
The above-mentioned reforms appear to have yielded positive results from theperspective of suppliers of logistics services as well as international traders.
As is evident from figure II, the utilization of road freight services has steadilyincreased since 1990. Moreover, real road freight rates dropped by 4 cents per mt/kmbetween 1990 and 2001.
Source: Bureau of Transport and Regional Economics, 2006.
Figure II. Road freight trends
0
20
40
60
80
100
120
1990
1991
1992
1993
1994
1995
1996
1997
1998
1999
2000
2001
2002
2003
Year
Bill
ion
mt/k
m
86
88
90
92
94
96
98
100
1990 1991 1992 1993 1994 1995 1996 1997 1998 1999 2000
Year
Rea
l roa
d fr
eigh
t rat
es
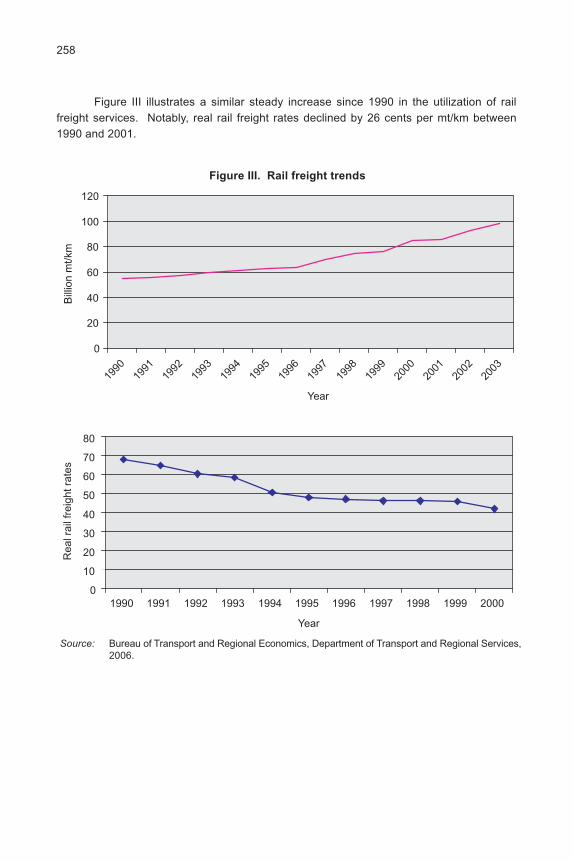
258
Figure III. Rail freight trends
Source: Bureau of Transport and Regional Economics, Department of Transport and Regional Services,2006.
0
20
40
60
80
100
120
1990
1991
1992
1993
1994
1995
1996
1997
1998
1999
2000
2001
2002
2003
Year
Bill
ion
mt/k
m
0
10
20
30
40
50
60
70
80
1990 1991 1992 1993 1994 1995 1996 1997 1998 1999 2000
Year
Rea
l rai
l fre
ight
rat
es
Figure III illustrates a similar steady increase since 1990 in the utilization of railfreight services. Notably, real rail freight rates declined by 26 cents per mt/km between1990 and 2001.

259
Figure IV shows that the utilization of sea freight has also increased since 1990,although more gently than is the case for road and rail freight. Real sea freight ratesdeclined by 7 cents per mt/km between 1990 and 2000.
Figure IV. Sea freight trends
Source: Bureau of Transport and Regional Economics, Department of Transport and RegionalServices, 2006.
0
20
40
60
80
100
120
140
1990
1991
1992
1993
1994
1995
1996
1997
1998
1999
2000
2001
2002
2003
Year
Bill
ion
mt/k
m
606264666870
7274767880
1990 1991 1992 1993 1994 1995 1996 1997 1998 1999 2000
Year
Rea
l sea
frei
ghtr
ates

260
0
20
40
60
80
100
120
1990 1991 1992 1993 1994 1995 1996 1997 1998 1999 2000
Year
Rea
l airf
reig
ht r
ates
Finally, figure V shows a marked increase in the utilization of airfreight servicessince 1990. Real airfreight rates declined by 27 cents per mt/km between 1990 and 2000.
Figure V. Airfreight trends
Source: Bureau of Transport and Regional Economics, Department of Transport and Regional Services,2006.
0
0.05
0.1
0.15
0.2
0.25
0.3
1990
1991
1992
1993
1994
1995
1996
1997
1998
1999
2000
2001
2002
2003
Year
Bill
ion
mt/k
m
Australian competition policy and law currently plays, and will continue to play animportant role in striking a balance between the need, on the one hand, to maintaina competitive environment that produces the efficient supply of good quality logisticsservices at a reasonable price and, on the other hand, in allowing linkages betweensuppliers of logistics services in aid of an integrated, seamless supply chain.
261
B. Governmental measures that may have an impact
on the supply of logistics services
As noted above, non-tariff governmental measures have the potential to underminethe benefits of logistics liberalization. Indeed, in its report on the global logistics market,USITC15 noted that border customs procedures and inspections pose the most significantobstacles to the supply of certain logistics services, the principal objective of which is tomove freight expeditiously, reliably and at the lowest cost possible. Nevertheless, inappraising governmental border measures that may have an impact upon the supply oflogistics services, their rationale needs to be considered. This is particularly importantwith regard to the globalized context in which such services are supplied, where realsecurity threats at national borders exist. Indeed, tighter border controls over freightmovement, handling and storage throughout the world are being implemented in the faceof increasing security concerns. Furthermore, while the removal of certain governmentalmeasures might facilitate trade, it could also seriously jeopardize the health and safety ofcitizens on both sides of a country s border. Therefore, a balance is needed betweenfurthering the trade facilitation objective and ensuring that borders are secure againstterrorist, health and safety threats.
Australia s international trade is subject to a number of customs and quarantinerequirements, which are relevant to the logistics supply chain. The governmental institutionsthat administer such requirements are the Australian Customs Service (ACS) and theAustralian Quarantine and Inspection Service (AQIS). As a rule, exporters and importersmust provide the ACS and AQIS certain information about movements of products betweenAustralia and overseas origins or destinations. That information is primarily required forthe purposes of collecting customs duties, preventing the entry of pests and diseases intoAustralia, quality certification of some exports and national security reasons. Variousorganizations are involved in the provision of this information, including shippers, shippinglines, terminal operators, customs brokers and freight forwarders. Other governmentalagencies, such as state-based agriculture departments, may also be involved on thegovernment side.
1. Export controls
Under Australian customs law, goods may not be exported nor loaded on toa ship or aircraft for export unless they have been entered in the Customs ExportIntegration System (EXIT). EXIT is an electronic data interchange clearance and reportingsystem that: (a) automates procedures for reporting exports; (b) accelerates and simplifiesthe clearance of outward bound air and sea cargo; and (c) enables ACS to monitor high-risk exports without impeding the majority of exports, which pose no risk. The EXITsystem links ACS with exporters, freight forwarders, airline and shipping companies, andthe Australian Bureau of Statistics for the record of Australia s export statistics. Exportersthat have been registered in the EXIT system apply for export clearance by transmitting
15 USITC, 2005, p. 3-2.

262
information to ACS electronically. EXIT verifies the data and, if valid, an export clearancenumber will be issued, with a turnaround time of approximately 10 minutes.
A similar system for the clearance of cargo by AQIS exists. The ExportDocumentation System (EXDOC) was developed by AQIS to facilitate export approvaland health certification by AQIS. The purpose of the EXDOC system is to electronicallyprocess and produce government-to-government documentation required for exportsof certain prescribed goods. This system expedites the clearance of cargo and helps tominimize delays by automatically generating a sanitary and phytosanitary certificaterequired by importing customs authorities. Currently, export approval for all meat andmeat products is available using EXDOC, which now also covers dairy, fish, grains andhorticultural products. EXDOC is available 24 hours a day, seven days a week.
EXDOC and EXIT are linked, providing a single electronic window through whichexporters may access ACS as well as AQIS. The single electronic window allows exportersto lodge one message requesting clearance of cargo by both ACS and AQIS. Currently,some 98 per cent of export entries are lodged electronically, directly into the EXIT system.
2. Import controls
Goods imported into Australia must be cleared by both ACS and AQIS. Importdeclarations are used to obtain ACS clearance for security, health and safety reasons.Import declarations must be filed in the Integrated Cargo System (ICS), which can beaccessed in three ways. First, a hard copy of an import declaration may be filed with anACS officer. Second, an importer may purchase a digital certificate that enablescommunication with ACS electronically via an interactive website. Finally, the services ofa customs broker can be engaged to complete the customs requirements. Occasionally,ACS will examine the imported goods to verify that they correspond to the description ofthe goods in the import declaration or to ensure that the goods are not prohibited, restrictedor pose a quarantine risk
Imported goods may also be screened by AQIS. For example, imported foodsare monitored by AQIS to ensure that they conform to the Australian Food StandardsCode. High-risk food products are subjected to mandatory inspection and testing whereaslow-risk food may be randomly tested. Rapid quarantine clearance is available for cargoaccompanied by documentation demonstrating that the entry requirements have beenmet. An electronic entry request may be lodged with AQIS via the Joint Entry ManagementSystem (JEMS). The entry request will then be sent to the AQIS Import ManagementSystem (AIMS), which enables tax concessions, broker accreditation and otherco-regulation activities to be implemented and monitored. Finally, AQIS officers also usethe Import Conditions Database (ICON) to check the quarantine requirements for particulargoods and to verify that the relevant entry import permit is valid.
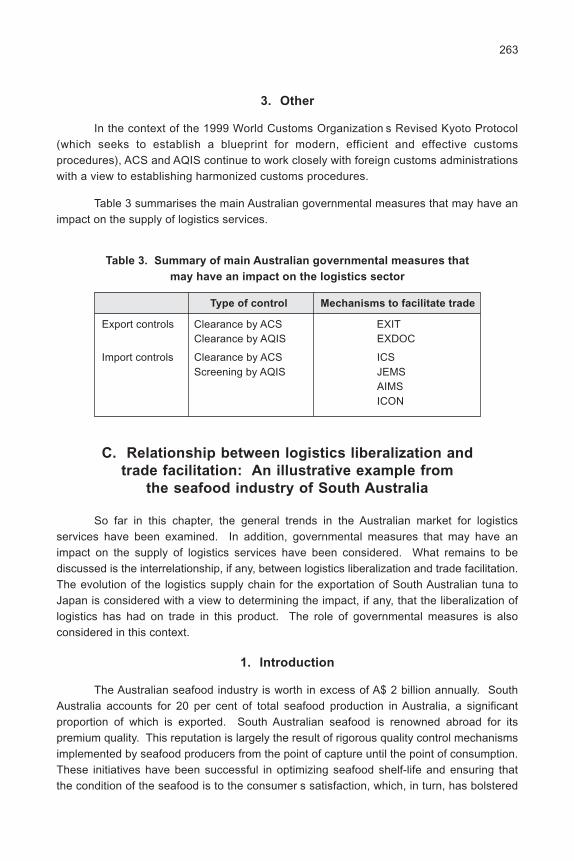
263
3. Other
In the context of the 1999 World Customs Organization s Revised Kyoto Protocol(which seeks to establish a blueprint for modern, efficient and effective customsprocedures), ACS and AQIS continue to work closely with foreign customs administrationswith a view to establishing harmonized customs procedures.
Table 3 summarises the main Australian governmental measures that may have animpact on the supply of logistics services.
Table 3. Summary of main Australian governmental measures that
may have an impact on the logistics sector
Type of control Mechanisms to facilitate trade
Export controls Clearance by ACS EXITClearance by AQIS EXDOC
Import controls Clearance by ACS ICSScreening by AQIS JEMS
AIMSICON
C. Relationship between logistics liberalization and
trade facilitation: An illustrative example from
the seafood industry of South Australia
So far in this chapter, the general trends in the Australian market for logisticsservices have been examined. In addition, governmental measures that may have animpact on the supply of logistics services have been considered. What remains to bediscussed is the interrelationship, if any, between logistics liberalization and trade facilitation.The evolution of the logistics supply chain for the exportation of South Australian tuna toJapan is considered with a view to determining the impact, if any, that the liberalization oflogistics has had on trade in this product. The role of governmental measures is alsoconsidered in this context.
1. Introduction
The Australian seafood industry is worth in excess of A$ 2 billion annually. SouthAustralia accounts for 20 per cent of total seafood production in Australia, a significantproportion of which is exported. South Australian seafood is renowned abroad for itspremium quality. This reputation is largely the result of rigorous quality control mechanismsimplemented by seafood producers from the point of capture until the point of consumption.These initiatives have been successful in optimizing seafood shelf-life and ensuring thatthe condition of the seafood is to the consumer s satisfaction, which, in turn, has bolstered
264
the reputation of South Australian seafood. Efforts undertaken by the local South Australianseafood industry to continually improve product quality have been supported by legislativemeasures, which have sought to simultaneously promote quality as well as sustainableproduction.
2. Some factors affecting the supply of South Australian tuna
This subsection focuses on exports of tuna from South Australia (in particular, fromthe coastal town of Port Lincoln) to Japan, the latter country being one of the world slargest markets for fresh tuna.
Despite the existence of a quota limiting the amount of tuna that can be fished inAustralia,16 tuna is the fastest growing and most lucrative type of seafood exported fromSouth Australia. In 1991, the first experimental tuna farm was established in Port Lincolnand, by 1992, tuna exports from South Australia had commenced. The vast proportion oftuna produced in Port Lincoln is being exported to Japan for the premium sashimi market.The total export value of the industry grew from around 2,000 mt, worth approximatelyA$ 40 million, in 1994 to 10,000 mt, worth around A$ 264 million, in 2006.
There are numerous tuna producers based in Port Lincoln. The industry bodyrepresenting them, the Australian Tuna Boat Owners Association, has played a critical rolein the evolution of the tuna industry in South Australia. Through the association, producershave jointly adopted initiatives to nurture, market and preserve the reputation of SouthAustralian tuna abroad. They have also worked closely with Japanese purchasers (whoare heavily involved in the tuna production process in South Australia) to achieve advancesin fishing and aquaculture techniques, which have contributed to the quality and value ofSouth Australian tuna in export markets.
In the early 1990s, South Australian southern blue fin tuna faced competitionfrom imports by Japan from China, Indonesia, the Philippines and Taiwan Province ofChina. However, the degree of competition has significantly lessened during recent years.Over-fishing in the breeding grounds proximate to those competing countries has led toa diminution in the supply of southern blue fin tuna. Rising fuel costs have preventedproducers in the competing countries from fishing further afield and, consequently, havelargely driven them out of the Japanese market for the supply of high-end tuna.
3. Logistics supply chain for the export of tuna from
South Australia to Japan
Perishable products are prone to deterioration and spoilage. Tuna is one suchproduct. The role of logistics services for the delivery of tuna from the point of productionto the final destination, and for that matter all perishable products, is critical. The speed
16 The quota is imposed pursuant to an agreement reached between Australia, New Zealand andJapan under the auspices of the Commission for Conservation of Southern Blue Fin Tuna, which wasestablished in 1994 to restore the global population of southern blue fin tuna that had been significantlydepleted due to overfishing in the early 1980s.

265
and manner in which perishables are delivered to consumers will have an impact on thecondition of the product at the point of consumption. The better the condition of theproduct at the point of consumption in terms of its colour, taste, appearance and safety forconsumption, the higher the price paid and the greater the likelihood of repeat business.Delays in transportation and failure to transport, handle and store in a manner that inhibitsthe deterioration of product throughout the logistics supply chain could mean spoilage ofthe product with a consequent mark-down of the price payable for the product or outrightrejection of the entire consignment of the product, and possibly even refusal to acceptfuture consignments from the producer concerned as well as other producers of theproduct from the same geographical area. In other words, deficiencies in the logisticssupply chain may have widespread and profound repercussions for an industry.
The logistics supply chain for the export of tuna from South Australia to Japandepends upon the form in which the tuna is being exported, i.e., chilled or frozen. Whenexports of tuna from South Australia to Japan first commenced, it was exclusively suppliedin chilled form. Limitations in freezing technology at the time prevented the exportation offrozen tuna. However, since then, the use of nitrogen freezing as a complement to blastfreezing has made exports of frozen tuna to Japan possible. Currently, 3,000 mt of SouthAustralian of fresh tuna and 7,000 mt of frozen tuna are exported each year.
In general, the longer and more circuitous the route is from Australia to Japan, thecheaper the cost of delivery. However, lower costs may come at the expense of quality.The longer the delivery path, the greater the likelihood of breaks in the so-called coldchain ,17 and the more vulnerable the product is to spoilage. Temperature control alongthe entire supply chain and minimization of breaks in the cold chain are of critical importanceto exports of both chilled and frozen tuna. The price of tuna that has been improperlyhandled in transit may be less than a third of the price that would otherwise be receivable.In every case, a balance must be struck between the need to get the tuna to market assoon as possible, the cost associated with achieving that objective and the requirementthat the tuna be fit for consumption when it finally reaches its destination.
The organization of the logistics supply chain for the delivery of tuna from SouthAustralia was somewhat fraught during the early days when exports to Japan were juststarting to accelerate. Tuna producers faced an increasingly customer-driven market inwhich time and quality were of the essence. Simultaneously, the logistics system inAustralia prior to export as well as in Japan became more and more complex. Theincreasing complexity made optimization of the path of delivery, from production toconsumption, difficult. In addition, as mentioned above, the state of technology at thattime imposed certain limitations on the supply chain.
In order to ensure that they could compete in the global marketplace, the SouthAustralian tuna producers worked closely together with the Japanese purchasers as well
17 The cold chain refers to the supply or demand chain for cooled or frozen produce. It requires thecontinual maintenance of the correct temperature for the product concerned, from the point of production/harvesting through all stages of packaging, transport, storage and retailing.
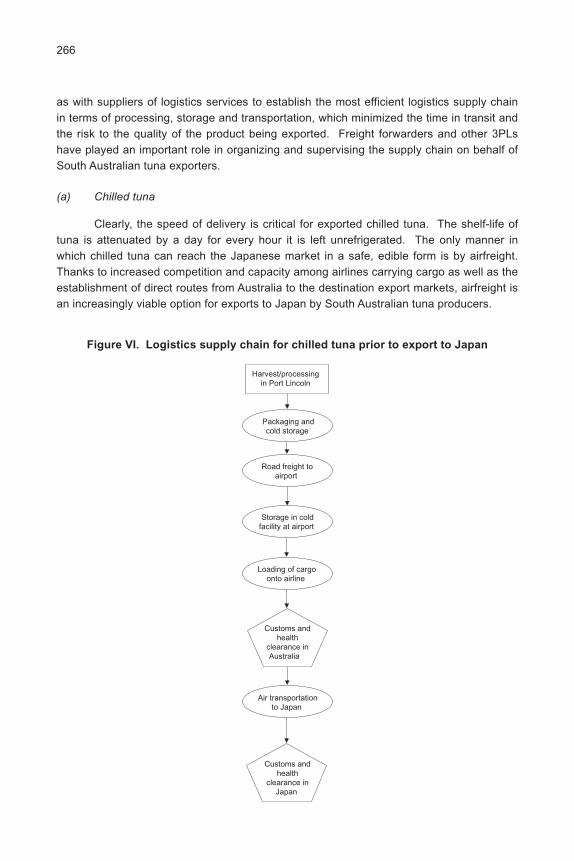
266
as with suppliers of logistics services to establish the most efficient logistics supply chainin terms of processing, storage and transportation, which minimized the time in transit andthe risk to the quality of the product being exported. Freight forwarders and other 3PLshave played an important role in organizing and supervising the supply chain on behalf ofSouth Australian tuna exporters.
(a) Chilled tuna
Clearly, the speed of delivery is critical for exported chilled tuna. The shelf-life oftuna is attenuated by a day for every hour it is left unrefrigerated. The only manner inwhich chilled tuna can reach the Japanese market in a safe, edible form is by airfreight.Thanks to increased competition and capacity among airlines carrying cargo as well as theestablishment of direct routes from Australia to the destination export markets, airfreight isan increasingly viable option for exports to Japan by South Australian tuna producers.
Figure VI. Logistics supply chain for chilled tuna prior to export to Japan
Harvest/processingin Port Lincoln
Packaging andcold storage
Customs andhealth
clearance inAustralia
Customs andhealth
clearance inJapan
Road freight toairport
Storage in coldfacility at airport
Loading of cargoonto airline
Air transportationto Japan

267
South Australian tuna is sent by airfreight from Adelaide, Sydney and Melbourneairports. In all cases, the tuna must be transported by road freight from Port Lincoln to therelevant airport (figure VI). Road freight reforms have resulted in incremental efficiencyimprovements with regard to the transportation of tuna by truck from Port Lincoln, whichhave led to lower costs. In addition, tuna exporters have witnessed quicker transportationtimes. It is now possible to transport tuna from Port Lincoln to Sydney or Melbourne withinthree days of catching it. Competition has also led to the emergence of road freightcompanies with particular expertise in the transportation and handling of perishable goodssuch as tuna. Chilled tuna must be transported in a pre-cooled refrigerated vehicle, whichmust preserve the temperature of the tuna for the duration of its journey. Specialist roadfreight companies are now able to supply trucks fitted with rollarised decks to minimizehandling while loading and unloading the tuna onto the trucks. The trucks are alsorefrigerated and triple insulated to maintain the temperature of the fish.
Once the tuna arrives at the relevant airport, it must be stored in a cold storagefacility. The cold storage facility at Adelaide airport has been identified as a potential weaklink in the logistics supply chain for the export of tuna from South Australia to Japan. Thecosts associated with operating the facility, even for small quantities of tuna, are so highthat it has proved uneconomical for many producers to transport their chilled tuna viaAdelaide airport. The result has been the diversion of tuna from Adelaide airport toSydney and Melbourne airports, which has increased transportation time and costs. Further,there is a heightened risk of product spoilage because of additional breaks in the coldchain.
Freight forwarders must be experienced in arranging the transportation of cargoby airfreight, given that airlines will only deal with freight forwarders when allocatingcargo space. Lack of regulation in the freight forwarding market has meant that somefreight forwarders lack the requisite skills to ensure appropriate handling, storage andtransportation of perishable products by airfreight, including tuna from South Australia.Furthermore, growing competition and declining margins in the freight forwarding businesshave led to the adoption of cut-throat business tactics. For example, some freightforwarders are known for reserving cargo space on airlines without having first securedcontracts for the transportation of cargo with prospective exporters. Such tactics haveresulted in inefficiencies in the logistics supply chain for the export of chilled tuna byairfreight.
(b) Frozen tuna
The combination of nitrogen and blast freezing, which rapidly freezes tuna whilemaintaining a uniform fresh quality of the fish, has meant that tuna may be exported frozento Japan, defrosted and then used fresh for the sashimi market (figure VII). While thespeed of delivery is not as critical as for chilled tuna exports, it is still an importantconsideration. The longer the period of freezing, the more susceptible the tuna is toalteration, deterioration and, ultimately, spoilage.

268
Figure VII. Logistics supply chain for frozen tuna prior to export to Japan
Harvest/processingin Port Lincoln
Packaging andcold storage
Customs andhealth
clearance inAustralia
Customs andhealth
clearance inJapan
Road freight toport
Loading of cargoonto ship
Processing ofcargo on ship
Shiptransportation to
Japan
Port reform in Australia has facilitated the export of frozen tuna from South Australiato Japan in two ways. First, such reform has directly translated into lower costs for tunaexporters using port services to export their product. Second, such reforms have hada major impact on efficiencies and costs at Australian ports associated with the storageand handling of imported feed that is used for tuna aquaculture in South Australia.
The supply of sea freight services for exports of tuna from South Australia toJapan is usually undertaken by Japanese flag ships, whose crews are experienced inthe processing, preparation and transportation of tuna. Global expansion of the shippingsector has led to the emergence of massive shipping companies that have the capacity

269
and facilities to efficiently ship perishable products in refrigerated containers. While itis not obligatory to use freight forwarders for sea freight, they have proved useful forsmall-scale fish producers who do not have the volume to secure cargo space on largefreighters without the intervention of an intermediary.
4. Governmental measures affecting tuna exports from
South Australia to Japan
(a) Export control
Members of the South Australian tuna industry have commended the fact that theyface relatively few governmental impediments in exporting their tuna to Japan. Indeed,the electronic, automated export clearance procedure on the Australian side (discussedearlier in this chapter) has helped to preserve the tuna producers comparative advantage.A number of other mechanisms are being implemented by Australian governmental authorities,which have served to further strengthen this advantage.
AQIS bears responsibility for ensuring that the systems implemented in Australiaresult in the production of fish and fish products that are safe to eat and are as free aspossible from hazards that are potentially harmful to humans. To this end, fish producersare required to develop, implement and maintain Approved Arrangements . Onceimplemented, AQIS must then decide whether or not to authorise an ApprovedArrangement. Initially, a desk audit will be conducted to evaluate the control system thatis proposed by the producer and will then be followed by a site audit. If and whenchanges to the operations of a fishing establishment occur, an application for approval ofthe variation must be made to AQIS.
The Approved Arrangements have been an important mechanism through whichgovernmental impediments to tuna exports have been minimized in three distinct ways.First, the Approved Arrangements essentially seek to ensure that the wholesomeness andintegrity of fish are maintained during their preparation for export. In other words, suchagreements amount to instruments to control the quality of tuna, which helps to reduce thelikelihood of the tuna being blocked at the border in Japan on health and safety grounds.Second, while the establishment and implementation of such arrangements involvegovernmental input at the outset, once authorized, governmental intervention is significantlyreduced. Third, the Approved Arrangements may be a vehicle through which logisticalissues confronting exporters may be addressed.
For example, an important issue that has arisen regarding AQIS involvement inexports of tuna from South Australia to Japan concerns the point at which the minimumtemperature of tuna must be established prior to export for safety reasons. Initially, AQISrequired the minimum temperature to be attained ex-factory. However, subsequent todiscussions with the tuna producers, AQIS authorized the establishment of the minimumtemperature just prior to export. This means that in the case of chilled tuna, which isusually transported by road from Port Lincoln to Melbourne or Sydney from where it isdelivered by airfreight to Japan, the truck journey from Port Lincoln to Melbourne and
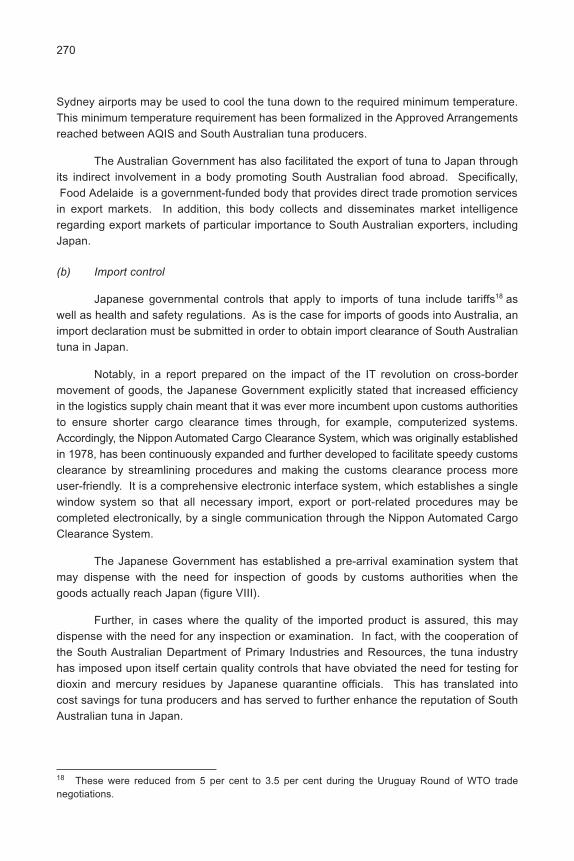
270
Sydney airports may be used to cool the tuna down to the required minimum temperature.This minimum temperature requirement has been formalized in the Approved Arrangementsreached between AQIS and South Australian tuna producers.
The Australian Government has also facilitated the export of tuna to Japan throughits indirect involvement in a body promoting South Australian food abroad. Specifically,Food Adelaide is a government-funded body that provides direct trade promotion services
in export markets. In addition, this body collects and disseminates market intelligenceregarding export markets of particular importance to South Australian exporters, includingJapan.
(b) Import control
Japanese governmental controls that apply to imports of tuna include tariffs18 aswell as health and safety regulations. As is the case for imports of goods into Australia, animport declaration must be submitted in order to obtain import clearance of South Australiantuna in Japan.
Notably, in a report prepared on the impact of the IT revolution on cross-bordermovement of goods, the Japanese Government explicitly stated that increased efficiencyin the logistics supply chain meant that it was ever more incumbent upon customs authoritiesto ensure shorter cargo clearance times through, for example, computerized systems.Accordingly, the Nippon Automated Cargo Clearance System, which was originally establishedin 1978, has been continuously expanded and further developed to facilitate speedy customsclearance by streamlining procedures and making the customs clearance process moreuser-friendly. It is a comprehensive electronic interface system, which establishes a singlewindow system so that all necessary import, export or port-related procedures may becompleted electronically, by a single communication through the Nippon Automated CargoClearance System.
The Japanese Government has established a pre-arrival examination system thatmay dispense with the need for inspection of goods by customs authorities when thegoods actually reach Japan (figure VIII).
Further, in cases where the quality of the imported product is assured, this maydispense with the need for any inspection or examination. In fact, with the cooperation ofthe South Australian Department of Primary Industries and Resources, the tuna industryhas imposed upon itself certain quality controls that have obviated the need for testing fordioxin and mercury residues by Japanese quarantine officials. This has translated intocost savings for tuna producers and has served to further enhance the reputation of SouthAustralian tuna in Japan.
18 These were reduced from 5 per cent to 3.5 per cent during the Uruguay Round of WTO tradenegotiations.

271
Figure VIII. Pre-arrival examination system in Japan
Source: http://www.customs.go.jp/asem/partners_db/preflow.htm.
— —
— —
— —
— —
— —
— —
— —
— —
— —
— —
— —
— —
— —
— —
— —
— —
— —
— —
— —
— —
— —
— —
— —
— —
— —
— —
— —
— —
— —
— —
— —
— —
— —
— —
Flow of regularimport cargo
Overseas ports
Japanese Ports
Arrival
Hozei AreaEntrance of
goods
Regular importdeclaration
Import declarationusing PRE-ARRIVAL
EXAMINATION SYSTEM
Departure
IMPORT DECLARATION
Examination
Examinationomission
Examination
IMPORTPERMIT
IMPORTPERMIT
PhysicalExamination
PRE-ARRIVALDECLARATION
PRE-ARRIVALEXAMINATION
Submission of declaration,etc.
Examinationomission
Examination
PRE-ARRIVALnotice
Obtainingpermits
IMPORTPERMIT
PhysicalExamination
IMPORTPERMIT
(A) Simultaneous Customs procedure and other import related procedure
(A)
— —
— —
— —
— —
— —
— —
—
— — — — — —
FLOW CHART OF PRE-ARRIVAL EXAMINATION SYSTEM
5. General observations
It is evident from the foregoing that the logistics supply chain for the export of tunafrom South Australia to Japan is complex, involving a number of different players andtransactions. South Australian tuna producers have, in general, successfully navigatedthis complex maze through a profound understanding of the market environment andregulatory requirements regarding the supply of tuna in Japan. They have been so intentupon preserving the positive image of South Australian tuna in Japan that they haveimposed upon themselves certain quality standards that are not demanded by law. Theseself-imposed standards reduce the risk that the product will be blocked for health andsafety reasons in Australia prior to export as well in Japan following importation. Inaddition, the success of the South Australian tuna producers can be linked to the effective

272
efforts they have made to establish and manage relationships between all the relevantplayers in the supply chain, all with a view to ensuring customers expectations are metand that the price payable for their tuna is the highest possible. Their success is evidentfrom export statistics, which indicate a marked increase in exports of tuna to Japan overtime. In particular, in 2000, tuna exports were worth A$ 214 million, 18 per cent more thanin the previous year and 196 per cent more than in 1997.
Such export success on the part of South Australian tuna producers is attributablenot just to the tuna producers themselves. It is also attributable to initiatives taken bysuppliers in the logistics supply chain to improve customer satisfaction as well as bygovernment bodies in Australia at the state and federal levels (and of course by theJapanese Government in terms of speedier, more efficient custom clearance of tunaimports). In Australia, air, sea and land freight councils have been established to addressissues such as process and control issues concerning the logistics supply chain, publicpolicy as it concerns the supply of logistics services as well as cultural change. Thesecouncils have been useful forums in which to identify, discuss and address issues thathave hindered the supply of seamless, integrated logistics services in the past.
Moreover, the domestic reform measures adopted to liberalize the market for thesupply of logistics services in Australia appear to have played a role in the South Australiantuna producers success. Liberalization measures in the airfreight sector have increasedairfreight capacity and, consequently, have made airfreight of chilled tuna to Japan moreeconomically viable. There has been a marked increase in the use of airfreight for exportsof southern blue fin tuna from South Australia, from some 100 mt in 2001/02 to some3,000 mt in 2004/05, according to ABS/Maritrade data. Exports of southern blue-fin tunafrom South Australia to Japan by sea freight have also seen a marked increase,rising from close to 400 mt in 1997/98 to some 5,000 mt in 2004/05, according to ABSMaritrade. Heightened competition in the road freight sector has contributed to thedevelopment of specialist service providers with trucks that are fitted with equipment tomaximize the degree of insulation, ensure temperature control during transit and minimizethe time spent unloading the tuna cargo from truck onto aircraft or ships.
Significantly, the tuna industry considers that the involvement of ACS and AQISin the export of tuna from Australia to Japan has served to enhance its comparativeadvantage rather than to hinder trade. Minimal documentary requirements coupled withrigorous quality standards have helped to support the reputation of South Australian tunaabroad without imposing unduly onerous obligations on exporters. Furthermore,computerized single windows in both Australia and Japan for the processing of exportand import requests, respectively, have minimized trade barriers.
On the negative side, intense competition in the Australian logistics market has, onoccasion, led freight forwarders, desperate for business in a market of declining margins,to accept delivery contracts for the export of tuna to Japan despite their lack of experiencewith tuna. This lack of experience could mean that the conditions needed to ensure thedelivery of a high-quality product in Japan are not maintained, which could put the sale ofthe tuna producers product in Japan at risk. Accreditation systems for freight forwarders

273
for quality control purposes of a kind similar to those in place in Europe would minimizesuch risks.19 Additionally, the practical limitations associated with utilization of the coldstorage facility at Adelaide airport discussed above, which have led to certain inefficienciesin the logistics supply chain, highlight the need to ensure that infrastructure matches theneeds of participants in, and users of the logistics supply chain. Industry consultation isessential to ensure that the development of infrastructure takes into consideration all therelevant interests at stake.
D. Implications for developing countries and policymakers
1. Importance of efficient logistics for economic growth
The cost of logistics services typically amounts to between 12 per cent and 17 percent of GDP. Estimates indicate that total logistics costs may reach 20 per cent of totalproduction costs in developed countries and, for certain landlocked developing countries,freight costs alone could represent up to 40 per cent of export values.
Efficient logistics supply chains may enhance international competitivenesswhereas inefficiencies may undermine a country s comparative advantage. The sourcesof inefficiencies in the logistics supply chain may stem from a mix of action or inaction onthe part of governmental authorities as well as private players involved in the supply oflogistics services. More specifically, such inefficiencies may be the product of proceduralred tape, inadequate infrastructure that may result in delays, or overly intense competitionthat may deter suppliers of logistics services from working together to provide a seamless,integrated supply chain. On the basis of the Australian experience, it appears thataddressing such inefficiencies in a consistent and coherent fashion will yield productivityand competitiveness gains for developed and developing countries alike.
2. Acknowledging the relationship between supply of logistics
services and trade facilitation
This chapter has illustrated that there is a clear relationship between logisticsservices and trade facilitation. Specifically, governmental measures that hinder the efficientsupply of logistics services may, by extension, impede trade in goods. Any benefits thatmight accrue through the liberalization of logistics services to enhance efficiency andthereby expedite the export or import of products could well be undermined by governmental
19 The International Air Cargo Association states that freight forwarders should only be able toprovide services if they are properly trained and certified. It further states that national associationsshould create standardized training and certification requirements for forwarders, and that the Governmentshould endorse them. The Association notes that, for example, in Germany, Austria and Switzerland,accreditation may be obtained following a three-year apprenticeship and business administrationprogramme, followed by an examination. While these training programmes are not mandated bygovernment, they are nevertheless encouraged. Furthermore, Switzerland s Federal Office for ProfessionalEducation and Technology grants diplomas in international freight forwarding and logistics (see thewebsite at <http://www.tiaca.org/articles/2006/06/26/DE79CF63C2FB4D4390714753009FBCD8.asp>).
274
export and import controls that unduly delay delivery of such products to their destination.Conversely, however, measures or conditions that facilitate and/or promote trade maypromote greater demand for logistic services. The example of tuna exports from SouthAustralia to Japan highlights the fact that minimal and, at best, actively positive governmentalintervention may improve an industry s competitive standing in an export market. Thismay result in an increase in trade of that industry s product, which will entail the consumptionof more logistics services.
Given the close interrelationship between logistics and trade facilitation, it isimportant for the liberalization of the logistics supply chain and more general efforts bygovernments to facilitate trade to be undertaken on a complementary basis. Taking theinitial step of recognizing and acknowledging the role that logistics may play in fosteringinternational trade is essential. Such recognition and acknowledgement will help toensure that, to the extent possible, governments establish the appropriate physical andregulatory framework to maximize the efficiency of the logistics supply chain. Ideally, theframework should ensure:
(a) The adequacy of and reasonable access to relevant infrastructure;
(b) Cohesion at inter-modal transfer points (e.g., road/rail, road/rail/ports) in transportnetworks; and
(c) A level of competition in the various segments of the logistics supply chainthat promotes innovation and specialization without undermining the ultimateobjective of ensuring a seamless, integrated supply chain.
Such a framework will not necessarily compromise the ability of governments toensure trade that is safe, secure and sustainable. Obviously, measures to facilitate trademust be subject to controls in order to safeguard these concerns. However, these controlsshould be the least trade-disruptive possible. In this regard, it is essential that the measuresadopted to establish such a framework are undertaken in a balanced, prudent fashion,bearing in mind all the interests and issues at stake.
3. The need to consult all relevant stakeholders
Logistics services involve a multitude of different institutions and concern a broadrange of sectors. The various stakeholders affected by the supply of logistics servicesinclude relevant government ministries and regulatory bodies, multinational or nationalsuppliers of logistics services, and exporters and importers dependent upon logistics services.The concerns and interests of these stakeholders are varied but, at least to some extent,interdependent. Therefore, it is essential that all stakeholders be consulted during theestablishment of the framework for the supply of logistics services to ensure that synergiesare realized.
Effective dialogue between the public and private sector players will help to securecoherence between private and public sector initiatives. Such dialogue may also result inpublic/private partnerships, which will facilitate the regulatory reform process. With respect

275
to the prospect of foreign competition as a result of market access commitments made inthe logistics area, consultation with the private sector will assist in mobilizing politicalsupport from key players for such commitments. Cooperation between private sectorplayers in this process will not necessarily preclude competition between them. Rather,relationship-building between these stakeholders may yield benefits for individual firms aswell as for the industry as whole.
4. Issues concerning regulatory framework establishment
A variety of tools that might be useful in liberalizing the logistics sector have beenreferred to in this chapter. Commitments to providing market access to foreign suppliersof logistics services, corporatization or privatization of government utilities owning and/oroperating the infrastructure on which the supply of logistics services is dependent, and theapplication of competition law to the market for the supply of logistics services are buta few of the available tools.
This chapter has also highlighted the importance of balancing competitiveliberalization in logistics services with sustainable industry practice and quality controlsystems. The existence of unbridled competition, as was the case with freight forwarders,may lead to increased risk for traders. Prudent regulation can contribute to the quality,safety and reliability of the exported product while simultaneously abiding by the principleof minimizing trade-distorting barriers.
The question of whether a particular type of infrastructure upon which the supply oflogistics services is dependent should be retained in public control, or whether it should beprivatized, is a complex issue with which policymakers need to grapple. The benefits ofprivatization may include enhanced efficiency, enhanced competition and less governmentinterference, but could be outweighed by the threat to the public interest that might beposed by private ownership. In weighing up the benefits and the disadvantages, it isnecessary to identify the objective of ownership of the infrastructure in question, and toensure that the incentives that will exist for a private, public or even corporatized owner ofthe asset achieve that objective.
Consultation of the various stakeholders affected by the supply of logisticsservices will assist the national government in identifying the nature of and priorities forregulatory reform. The establishment of a framework for the efficient supply of logisticservices may involve a clear sequence of discrete steps to be taken, but it may alsoindicate that certain steps should ideally be undertaken in tandem. Ultimately, theprioritization of steps in the regulatory reform process as well as the sequencing of thosesteps will depend upon the domestic regulatory environment and the dynamics in thelocal market for the supply of logistics services.
The resistance that governments may face domestically to efforts in reforming thesupply of logistics services may be addressed through regional or multilateral forums.Initiatives taken at the regional and/or multilateral level will help to maximize and multiply
276
the benefits of logistics liberalization. More specifically, such initiatives will give traders anadvantage not only in the export market but also in the import market.
E. Conclusion and research implications
Developed and developing countries have much to gain from the liberalization oflogistics services. The benefits that may accrue to suppliers of logistics services, exportersand importers that are dependent upon such services and nations as a whole are clear.Logistics liberalization facilitates international trade, which, in turn, drives economic growthand development. Trade facilitation measures that promote trade (including but not limitedto more efficient, well-coordinated border control mechanisms) may also consequentlypromote greater demand for logistic services, thereby generating a virtuous cycle.
This chapter has highlighted the fact that a balanced regulatory framework forachieving liberalization of logistics services while at the same time maintaining the requisitedegree of control at national borders to protect against security, safety and health threat,will lay the foundation for such a virtuous cycle. Consultation with all the relevant stakeholders- governmental bodies, suppliers of logistics services, and exporters and importers dependentupon logistics services - will help to realize the known benefits of logistics liberalization.
The interplay between liberalization of logistical services on the one hand, andtrade facilitation on the other hand, is equally clear and should be borne in mind in thecontext of WTO negotiations on services and trade facilitation when they are pursued inthe future. Thus, negotiators in both contexts should at least explicitly recognize thepotential for mutual reinforcement of liberalization of the logistics sector together with tradefacilitation.
A final comment on the value of further research in the area of logistics servicesand trade facilitation - it would be useful for further research to focus on the role ofgovernments in developing countries in determining the appropriate balance betweenprudential regulation and progressive liberalization of logistic services. For example, casestudies might be drawn from countries such as Singapore or Malaysia that examine thenature of successful regulatory measures in specific segments of the logistics supply chainthat have been trade-enhancing.
Identification of the variety of policy tools that have been successful in achievingprogressive liberalization and sequencing of logistics services would also add value.Deregulation, privatization and competition policy are among domestic reform policies that,if implemented appropriately, could lead to greater realization of efficiencies in the logisticsservices supply chain.
Given the relevant implications of government reforms affecting the logisticsservices industry and trade facilitation derived from the above analysis of the seafoodindustry in Australia, there would be significant lessons to be drawn from a cost-benefitanalysis of the advantages (or potential advantages) of logistic services liberalization in

277
a developing country in the region. It would be interesting, for example, for such ananalysis to focus on the clothing and textile industry in China or in a least developedcountry such as Cambodia.
The vital nature of government-private sector consultation and cooperation onlogistics services and trade facilitation policy reform has been manifest throughout thischapter. Specific research and analysis as to how various governments, developed anddeveloping, have undertaken such consultation and cooperation in specific segments ofthe logistics supply chain would also be instructive in determining future policy-makingapproaches.

278
Bibliography
ALPHA Research Consortium, 2004. Characteristics, strategies and trends for 3PL/4PLin Australia . Sydney.
Arblaster, M., 2005. Regulating rail access and competition , paper presented at theAustralian Rail Summit, Sydney.
Australian Customs Service, 2003. Australian customs, protecting our borders . Sydney.
, 2005. Documentary import declaration comprehensive guide . Sydney.
, 2006. Export control , vol. 12. Sydney. Accessed at www.customs.gov.au.
, 2006. Import control , vol. 7. Sydney. Accessed at www.customs.gov.au.
Australian Industry Commission, 1991. Rail Transport , Report No. 13. Canberra.
Australian Logistics Assured, undated. Freight logistics performance quality standards forthe export of fresh chilled tuna from Australia to Japan via air . Adelaide, SouthAustralia.
Australian Productivity Commission, 2006. Road and rail freight infrastructure pricing ,Productivity Commission Issues Paper. Melbourne.
, 2005. Modelling impacts of infrastructure industry change over the 1990sSupplement to Review of National Competition Policy Reforms, ProductivityCommission Inquiry Report No. 33. Melbourne.
, 1998. International Air Services , Inquiry Report, Report No. 2. Melbourne.
Australian Quarantine and Inspection Service, 2005. Approved Arrangement, a guidelineto compliance with the Export Control (Fish and Fish Products) Orders 2005 .Canberra.
, 2004. Electronic export documentation system, plain English information paperfor prospective EXDOC users , Version 8.2 (January). Canberra.
Boylaud, O. and G. Nicoletti, 2001. Regulatory reform in road freight , OECD EconomicStudies No. 32, 2001/1. Paris
Bureau of Transport and Regional Economics, 2006. Freight measurement and modellingIn Australia , Report No. 112. Canberra.
, 2005. Australian transport statistics . Canberra.
Bureau of Transport Economics, 2001. Logistics in Australia: A preliminary analysis ,working paper No. 49. Canberra.
Council for Trade in Services, 2005. Special Session, Joint Statement on Liberalization ofLogistics Services, communication from Australia and others, TN/S/W/34. WorldTrade Organization, Geneva.
, 2005. Special Session, Australia s Revised Services Offer, TN/S/O/AUS/Rev. 1.World Trade Organization, Geneva.

279
, 2005. Special Session, Logistics Services , Communication from Australia andothers, TN/S/W/20. World Trade Organization, Geneva.
Craig, T., 2003. 4PL versus 3PL - A business process outsourcing option for internationalsupply chain management , World Wide Shipping, December/January 2003.
Departments of Transport, the Northern Territory, South Australia, Tasmania and WesternAustralia, 2000. Freight trade logistics , based on interviews conducted in Tokyo,Osaka, Taiwan Province of China, Shanghai, Singapore and Hong Kong, China.
Findlay, C., 2002. Multilateral liberalisation of services, trade and investment in a globalisingworld: Scope and limitations , National Europe Centre Paper No. 55. Canberra.
Freight Transport Logistics Industry Action Agenda, Industry Steering Committee, FreightLogistics in Australia: An Agenda for Action , May 2002.
Government of South Australia, 2006. Air freight summaries, SA exports by air , MarchQuarter 2006 Report. Aviation and Planning Coordination Unit, Transport PlanningDivision, Adelaide.
Hausmann, W., H. Lee and U. Subramanian, 2005. Global logistics indicators, supplychain metrics and bilateral trade patterns , World Bank policy research workingpaper No. 3773. World Bank, Washington, D.C.
Institute of Applied Logistics, 2001. Road transport of perishable food, product skillsaudit , prepared for the Transport Training Advisory Board, SA Inc. South Australia.
King, S. and R. Pitchford, 1998. Privatisation in Australia: Understanding the incentivesin public and private firms , The Australian Economic Review, vol. 31, No. 4;pp. 313-328.
Lim o, N. and A. Venables, 2001. Infrastructure, geographical disadvantage, transportcosts and trade , The World Bank Economic Review, vol. 15; pp. 451-479. OxfordUniversity Press.
Luo, W. and C. Findlay, 2002. Logistics in China: Implications of accession to the WTO ,December.
McGuire, G., 2002. Trade in services - market access opportunities and the benefits ofliberalization for developing economies , Policy Issues in International Trade andCommodities Study Series, No. 19, UNCTAD/ITCD/TAB/20. UNCTAD, Geneva.
OECD, 2006. Logistics and Time as a Trade Barrier , OECD Trade Policy Working PaperNo. 35. Paris.
, 2005. Growth in Services: Fostering Employment, Productivity and Innovation ,Meeting of the OECD Council at Ministerial Level, Paris.
, 1999. Chairman s Summary, Workshop on Regulatory Reform in InternationalAir Cargo Transportation, 5-6 July 1999. Paris.
Owens, H., 2003. Rail reform strategies: The Australian experience , NBER WorkingPaper Series, No. 9592. National Bureau of Economic Research, Cambridge,Massachusetts.

280
South Australian Freight Council, 2006. South Australia s freight transport infrastructure:Moving freight - setting a strategic framework for the future . Port Adelaide, SouthAustralia.
UNCTAD, 2005. Trade facilitation as an engine for development , Note by the UNCTADSecretariat, TD/B/COM.3/EM.24/2. Geneva.
USITC, 2005. Logistic services: An overview of the global market and potential effects ofremoving trade impediments , Investigation No. 332-462, USITC Publication 3770.Washington, D.C.

281
IX. IMPACT OF TRADE COSTS ON TRADE:
EMPIRICAL EVIDENCE FROM ASIAN COUNTRIES
By Prabir De*
Introduction
Higher trade costs form an obstacle to trade and impede the realization of gainsfrom trade liberalization. Gains from trade depend not only on the tariff liberalizationbut also on the quality of infrastructure and related services. Improved infrastructuraland logistics services play an important role in the flow of international trade. On onehand, they generate enormous wealth by reducing the costs of trade because of theirnon-discriminatory and non-rivalrous characteristics; on the other hand, they integrateproduction and trade across countries.
Trade costs are often cited as an important determinant of the volume of trade.The growth of literature concerning this aspect documents the impact of trade costs on thevolume of trade.1 Most of these studies show that integration is the result of reducedcosts of transportation in particular and other infrastructure services in general. Theshared objective of economic integration, in general, is to reduce trade barriers - visibleand invisible. Direct evidence on border costs shows that tariff barriers are now low inmost countries - on average less than 5 per cent on average (trade-weighted or arithmetic)for rich countries and, with a few exceptions, between 10 to 20 per cent on average fordeveloping countries (Anderson and van Wincoop, 2004).
While the world has witnessed a drastic fall in tariffs over the past two decades,many barriers remain that penalize trade, among which are both soft and hard barriers.One set of such soft barriers is dealt with through trade and business facilitation measures.The hard set of barriers, which are often cited as physical or infrastructure barriers, aredealt with through transport facilitation measures. In a different vein, the costs created bythese barriers can be clubbed together and can be termed as trade costs that are
* Prabir De is a Fellow at the Research and Information System for Developing Countries (RIS).The author is particularly grateful to Bhisma Rout for his assistance in preparing the large datasets foranalysis, without which this study would not have been possible. The author is also grateful to AhmetSuayb Gundogdu and Tirthankar Mandal for their assistance in managing the data as well as YannDuval for his perceptive comments on an earlier version of this paper and Maersk Sealand forproviding complimentary access to its historical database. Thanks are also due to Nagesh Kumar, MiaMikic and Buddhadeb Ghosh for their intellectual support. The author can be contacted [email protected] or [email protected].
1 The 2004 study, Trade costs by E. Anderson and E. van Wincoop elaborately covered the majorseminal studies carried out on this subject. See also P. De, 2006a for an updated list of studies dealingtrade costs.

282
measured as a mark-up between export and import prices; this mark-up roughly indicatesthe relative costs of the transfer of goods from one country to another.
In recent years, Asia has witnessed the spread of regional and bilateral integrationand cooperation initiatives.2 Trade volume in Asia has been rising at a very rapid pacewhile at the same time the composition of trade within Asia has been taking a new shape.Countries in Asia are gradually specializing in trade in intermediate and finished products,where the effectiveness of the transportation infrastructure plays an important role in tradeand international integration. The effective rate of protection provided by transport costs inmany cases is higher than that provided by tariffs (World Bank, 2001). For the majority ofcountries in sub-Saharan Africa, Latin America and the Caribbean as well as a large partof Asia, transportation cost incidence for exports is five times higher than tariff cost incidence(World Bank, 2001).3 Therefore, supply constraints are the primary factors that havelimited the ability of many countries to exploit trade opportunities. As a result, complementarytrade policies focusing on trade costs have gained immense importance in enhancinginternational trade.
With the rise of bilateralism in Asia, any attempt towards deeper integration of theeconomies of the region thus holds high promise if accompanied by initiatives that helpimprove trade efficiency and reduce trade costs (Asian Development Bank, 2006).
The reduction of trade costs helps traders to get their goods to market more quicklyand cheaply. Considering the increase in trade interdependency in Asia, the need fora better enabling environment to trade in Asia has gained high momentum. On thedemand side, the noticeable development is that tariff barrier in Asia has become low asa result of trade liberalization. However, on the supply side, rising trade costs are havingan adverse impact on trade. Freight costs are one major component of trade costs. Whilefreight costs for imports in developed countries continue to be lower than those in developingcountries, in the case of developing Asia such costs are hovering around 6.5 per cent,thereby affecting the comparative advantage of Asian countries. Table 1 shows that freightcosts in developing Asia are, on an average, 116 per cent higher than in developedcountries.
According to UNCTAD (2006), this difference is mainly attributable to global tradestructures, regional infrastructure facilities, logistics systems and the more influentialdistribution strategies of shippers of developed countries.
2 Regionalism entered Asia with the establishment of ASEAN in the 1960s. Since then, severalregional and subregional initiatives have appeared in Asia, such as Bangkok Agreement, SAARC etc.However, the East Asia Summit in 2005 involving the ASEAN+6 countries indicated the rise of constructiveregionalism in Asia. Slow progress in the WTO Doha Round and pan-Asian integration has encouragedthe proliferation of bilateral agreements in Asia. In 2005, some 36 bilateral agreements in Asia werenotified to WTO, compared with only three involving developing Asian countries before 1995; currently,46 agreements have yet to be notified to WTO and a further 42 agreements are being negotiated(Asian Development Bank, 2006; ESCAP, 2005).
3 According to the World Bank, for 168 of 216 United States trading partners, transportation costbarriers outweighed tariff barriers.

283
Freight costs vary across Asia. Inefficient transportation services are reflected inhigher freight costs and longer delivery times. Table 2 indicates that while ocean freighthas fallen over time (here, between 2003 and 2005) for the movement of vessels amongsome selected Asian countries, auxiliary (other) charges have gone up, thereby offsettingthe gains arising from (a) technological advancement (e.g., bigger vessels) and (b) tradeliberalization (e.g., lower tariffs). Therefore, differences across countries in transport costsare a source of absolute and comparative advantage and affect the volume and compositionof trade (World Trade Organization, 2004).4
How are the Asian countries progressing with regard to reducing trade costs?A clear understanding of the role of trade costs in enhancing trade will help to promotedeeper integration of the region. This chapter therefore seeks to enhance understandingin this area in the context of selected Asian countries. In particular, the impact of selectedtrade cost components and other factors on trade flows of separate customs territories innine Southeast and East Asian countries as well as India are evaluated. Section A definestrade costs and review studies done so far on the subject. Some insights into the freightcost components as possible trade barriers are presented in section B. Econometricresults are presented and discussed in section C followed by conclusions in section D.
A. Trade costs and their relevance
In broad terms, trade costs include all costs incurred in getting a product to a finaluser other than the marginal cost of producing the good itself, such as transportation costs(both freight costs and time costs), policy barriers (tariffs and non-tariff barriers), informationcosts, contract enforcement costs, costs associated with the use of different currencies,legal and regulatory costs, and local distribution costs (wholesale and retail). Trade costsare reported in terms of their ad valorem tax equivalent. According to Anderson and van
Table 1. Estimates of total freight costs for imports
(Unit: Percentage)
YearDeveloped Developing Developing
countries countries Asia
1990 2.9 6.7 6.9
2000 2.9 5.9 6.5
2003 2.9 6.1 6.7
2004 3.0 5.9 6.5
Source: UNCTAD, 2006.
Note: As a percentage of import value (taken at CIF).
4 In another context, while describing East Asia s outward-oriented growth, an Asian DevelopmentBank-Japan Bank for International Cooperation-World Bank (2005, pp. 61-64) team commented thatthe efficiency of East Asia s logistics was falling behind, with costs of transportation representinga high proportion of the final price of goods, thereby affecting the competitiveness of the region.
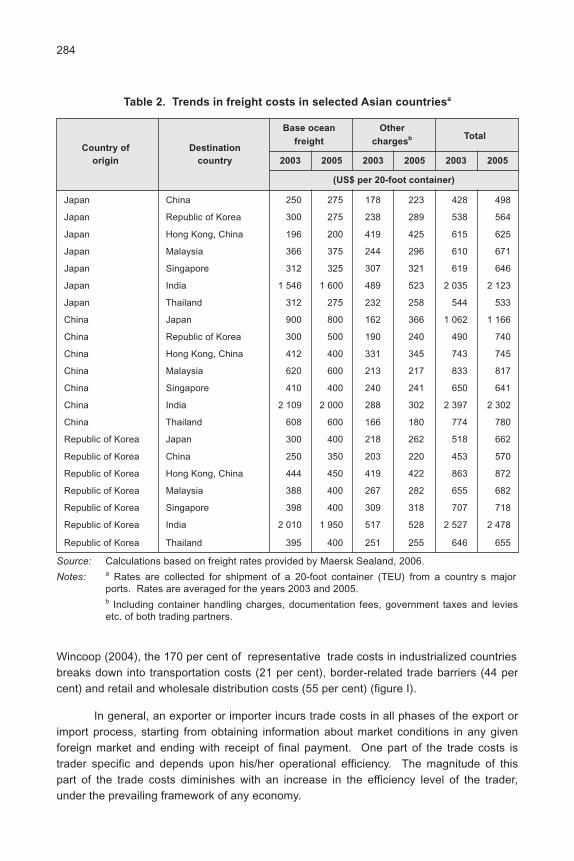
284
Wincoop (2004), the 170 per cent of representative trade costs in industrialized countriesbreaks down into transportation costs (21 per cent), border-related trade barriers (44 percent) and retail and wholesale distribution costs (55 per cent) (figure I).
In general, an exporter or importer incurs trade costs in all phases of the export orimport process, starting from obtaining information about market conditions in any givenforeign market and ending with receipt of final payment. One part of the trade costs istrader specific and depends upon his/her operational efficiency. The magnitude of thispart of the trade costs diminishes with an increase in the efficiency level of the trader,under the prevailing framework of any economy.
Table 2. Trends in freight costs in selected Asian countriesa
Base ocean OtherTotal
Country of Destinationfreight charges
b
origin country 2003 2005 2003 2005 2003 2005
(US$ per 20-foot container)
Japan China 250 275 178 223 428 498
Japan Republic of Korea 300 275 238 289 538 564
Japan Hong Kong, China 196 200 419 425 615 625
Japan Malaysia 366 375 244 296 610 671
Japan Singapore 312 325 307 321 619 646
Japan India 1 546 1 600 489 523 2 035 2 123
Japan Thailand 312 275 232 258 544 533
China Japan 900 800 162 366 1 062 1 166
China Republic of Korea 300 500 190 240 490 740
China Hong Kong, China 412 400 331 345 743 745
China Malaysia 620 600 213 217 833 817
China Singapore 410 400 240 241 650 641
China India 2 109 2 000 288 302 2 397 2 302
China Thailand 608 600 166 180 774 780
Republic of Korea Japan 300 400 218 262 518 662
Republic of Korea China 250 350 203 220 453 570
Republic of Korea Hong Kong, China 444 450 419 422 863 872
Republic of Korea Malaysia 388 400 267 282 655 682
Republic of Korea Singapore 398 400 309 318 707 718
Republic of Korea India 2 010 1 950 517 528 2 527 2 478
Republic of Korea Thailand 395 400 251 255 646 655
Source: Calculations based on freight rates provided by Maersk Sealand, 2006.
Notes: a Rates are collected for shipment of a 20-foot container (TEU) from a country s majorports. Rates are averaged for the years 2003 and 2005.b Including container handling charges, documentation fees, government taxes and leviesetc. of both trading partners.

285
The other part of the trade costs is specific to the trading environment and isincurred by the traders due to in-built inefficiencies in the trading environment. It includesinstitutional bottlenecks (transport, regulatory and other logistics infrastructure), informationasymmetry and administrative power that give rise to rent-seeking activities by governmentofficials at various stages of the transaction. This may cost traders (or a country) time andmoney, including demurrage charges, making transactions more expensive.
Trade costs are large, even aside from trade policy barriers and even betweenapparently highly integrated economies. In explaining trade costs, Anderson and vanWincoop (2004) referred to the example of Mattel s Barbie doll (discussed in Feenstra,1998), which indicated that the production costs for the doll were US$ 1, while it sold forabout US$ 10 in the United States. The cost of transportation, marketing, wholesaling andretailing represented an ad valorem tax equivalent of 900 per cent. Anderson and vanWincoop (2004) commented: The tax equivalent of representative trade costs for richcountries is 170 per cent. This includes all transport, border-related and local distributioncosts from foreign producer to final user in the domestic country. Trade costs are richlylinked to economic policy. Direct policy instruments (tariffs, the tariff equivalents of quotasand trade barriers associated with the exchange rate system) are less important than other
Figure I. Estimated trade costs in industrialized countries
No. ComponentsTariff rate equivalent
(%)
1 Total trade costsa 170
1.1 International trade costsb 74
1.1.1 Border-related trade barriers 44
1.1.1.1 Policy 8
1.1.1.2 Language 7
1.1.1.3 Currency 14
1.1.1.4 Information cost 6
1.1.1.5 Security 3
1.1.2 Transportation cost 21
1.1.2.1 Freight 11
1.1.2.2 Time (transit cost)c 9
1.2 Retail and wholesale distribution costs 55
Source: J.E. Anderson and E. van Wincoop, 2004.
Notes: a Trade costs due to international trade is 74 per cent (1.21*1.44 = 1.74),as reported in this table. The total trade costs, as shown in Anderson andvan Wincoop (2004) is 170 per cent (1.74*1.55-1). The costs are notsimply additive, but rather multiplicative.b The combination of direct observation and inferred costs, which, accordingto the author, is an extremely approximate breakdown.c Tax equivalent of the time value of goods in transit. Both are based onestimates for United States data.
286
policies (transport infrastructure investment, law enforcement and related property rightsinstitutions, informational institutions, regulation and language).
Direct transport costs include freight charges and insurance, which are customarilyadded to the freight charge. Indirect transport user costs include holding costs for thegoods in transit, inventory costs due to buffering the variability of delivery dates, preparationcosts associated with shipment size (full container load vs. partial loads) etc. Indirectcosts must be inferred. Alongside tariffs and NTBs, transport costs appear to be comparablein average magnitude and variability across countries, commodities and time.
Trade costs have large welfare implications. Current policy-related costs are oftenworth more than 10 per cent of national income (Anderson and van Wincoop, 2002).Obstfeld and Rogoff (2000) commented that all the major puzzles of internationalmacroeconomics hung on trade costs. Some studies (for example: Asia-Pacific EconomicCooperation, 2002; OECD, 2003; and Francois and others, 2005) estimated that for each1 per cent reduction in trade transaction costs, world income could increase by US$ 30billion to US$ 40 billion.
Many commentators have indicated that the success of trade liberalization willalways be sub-optimal if transport costs are not controlled. According to WTO (2004),the effective rate of protection provided by transport costs in many cases is higher than
that provided by tariffs . According to the World Bank (2001), for 168 out of 216 tradingpartners of the United States, transport cost barriers outweighed tariff barriers. It isestimated that doubling the distance increases overall freight rates by between 20 and30 per cent (Hummels, 1999b). Time delays affect international trade. It is estimated that,on average, each additional day that a product is delayed prior to being shipped reducestrade by at least 1 per cent (Djankov and others, 2006).5 Therefore, what follows is thatgains from trade will be more if trade frictions are minimized.
Details of trade costs also matter to economic geography. For example, the homemarket effect hypothesis (big countries produce more goods with scale economies) hangson differentiated goods with scale economies having greater trade costs than homogeneousgoods (Davis, 1998). The cross-commodity structure of policy barriers is important towelfare (see, for example, Anderson, 1994).
In dealing with cross-country trade, influenced by new trade theory, several studieshave explicitly considered transport costs (or, often interchangeably, transaction costs)such as, for example, Bergstrand (1985 and 1989), Davis (1998), Deardorff (1998), Limaoand Venables (2001), Fink and others (2002), Clark, Dollar and Miucco (2004), Reddingand Venables (2004), Hummels (1999a, 2001), Wilson and others (2003).
5 This was estimated by the authors through a structured gravity model using the newly constructedDoing Business database of the World Bank for shipment of cargo from the factory gate to the ship(vessel) in 126 countries.

287
Poor institutions and poor infrastructure act as impediments to trade, differentiallyacross countries. While dealing with barriers to trade, some studies explicitly emphasizedthe quality of infrastructure (as a proxy of trade costs) associated with cross-country trade.A country s infrastructure plays a vital role in carrying trade. For example, by incorporatingtransport infrastructure in a two-country Ricardian framework, Bougheas and others (1999)showed the circumstances under which it affected trade volumes. According to Francoisand Manchin (2006), the transport and communications infrastructure and institutionalquality are significant determinants not only for a country s export levels but also for thelikelihood of exports. Nord s and Piermartini (2004) showed that the quality of infrastructurewas an important determinant of trade performance wherein port efficiency alone had thelargest impact on trade among all indicators of infrastructure. De (2005 and 2006b)provided evidence that transaction costs were statistically significant and important inexplaining variations in trade in Asia.
In addition, De (2005 and 2006b) found that port efficiency and infrastructurequality were two important determinants of trade costs. In other words, the higher thetransaction costs, the lower the volume of trade. This is exemplified in figure II, whichshows a negative non-linear relationship between transaction costs and imports for 2004in the context of 15 Asian economies. This relationship clearly points to the fact that tradetransaction costs do influence trade.
Figure II. Relative importance of trade transaction costs in Asia
Source: P. De, 2006b.
Note: Import and transaction costs are based on pooled bilateral trading pairs for 15 Asianeconomies (listed in this chapter) for 2004.
Transaction costs
121086420-2
Impo
rt
26
24
22
20
18
16
14
12

288
The infrastructure variables have explanatory power in predicting trade volume.Limao and Venables (2001) emphasized the dependence of trade costs on infrastructure,where infrastructure is measured as an average of the density of the road network, thepaved road network, the rail network and the number of telephone main lines per person.A deterioration of the infrastructure from the median to the 75th percentile of destinationsraises transport costs by 12 per cent. The median landlocked country has transport costswhich are 55 per cent higher than the median coastal economy.6 A country s comparativeadvantage also depends upon the quality of its infrastructure. Yeaple and Golub (2002)found that differences in the quality of public infrastructure between countries could explaindifferences in total factor productivity.
Some studies have indicated that the cost of trade facilitation (specifically tradedocumentation and procedures) is high, ranging between 4 and 7 per cent of the value ofgoods shipped. In 1996, APEC conducted a study that highlighted the gain from effectivetrade facilitation. For example, the gains from streamlining customs procedures exceededthose resulting from trade liberalization, such as tariff reduction. Gains from effectivetrade facilitation would account for about 0.26 per cent of real GDP of APEC members(about US$ 45 billion), while the gains from trade liberalization would be 0.14 per cent ofreal GDP (about US$ 23 billion).7 According to the World Bank (2002), raising performanceacross the region to halfway up to the level of the APEC average could result in a 10 percent increase in intra-APEC exports, worth roughly US$ 280 billion.
Finally, efforts to understand trade costs and their role in determining internationaltrade flows must take into consideration the internal geography of countries and theassociated interior trade costs. This chapter builds upon the earlier literature on thissubject, and in particular, De (2006a; 2006b).8
B. Barriers to trade: Ocean freight and auxiliary
shipping charges
Despite technological advancements, the cost of moving goods across countrieshas not fallen in Asia. As an indication of the relative importance of lower, simplified andtransparent ocean freight for trade, figure III and table 3 provide the composition andstructure of ocean freight in Asia for 2004. Some 60 per cent of total shipping costs for the
6 Bougheas and others, 1999 estimated gravity equations for a sample limited to nine Europeancountries. They included the product of the partner s kilometres of motorway in one specification andthat of public capital stock in another, and found that these have a positive particle correlation withbilateral exports.
7 Similar indications were obtained for countries in APEC (Cernat, 2001; World Bank, 2002; andWilson and others, 2003).
8 In particular, the extended gravity model presented in section C controls for remoteness. Inaddition, it is estimated using a large cross-section of data taken at 4-digit HS level for 10 Asiancountries and controls for endogeneity problems. See Annex to this chapter for details.
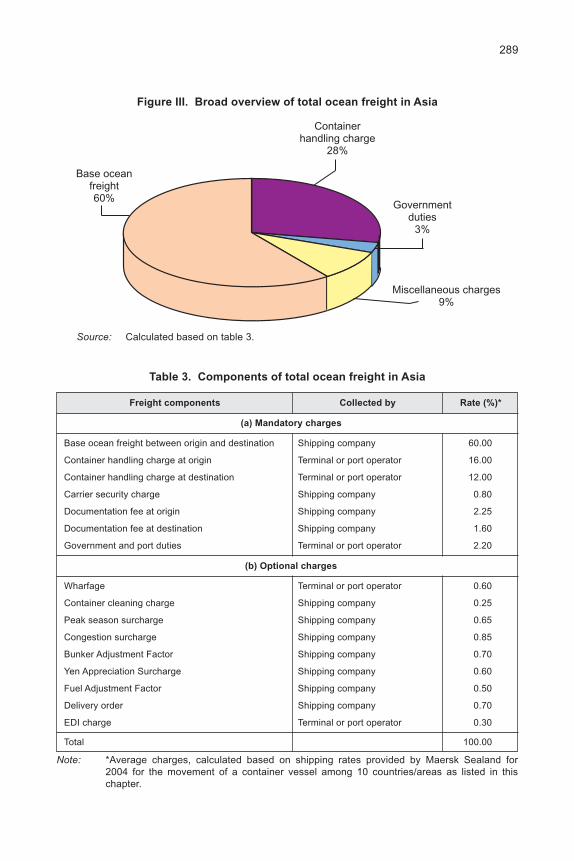
289
Base oceanfreight60%
Miscellaneous charges9%
Governmentduties
3%
Containerhandling charge
28%
Figure III. Broad overview of total ocean freight in Asia
Source: Calculated based on table 3.
Table 3. Components of total ocean freight in Asia
Freight components Collected by Rate (%)*
(a) Mandatory charges
Base ocean freight between origin and destination Shipping company 60.00
Container handling charge at origin Terminal or port operator 16.00
Container handling charge at destination Terminal or port operator 12.00
Carrier security charge Shipping company 0.80
Documentation fee at origin Shipping company 2.25
Documentation fee at destination Shipping company 1.60
Government and port duties Terminal or port operator 2.20
(b) Optional charges
Wharfage Terminal or port operator 0.60
Container cleaning charge Shipping company 0.25
Peak season surcharge Shipping company 0.65
Congestion surcharge Shipping company 0.85
Bunker Adjustment Factor Shipping company 0.70
Yen Appreciation Surcharge Shipping company 0.60
Fuel Adjustment Factor Shipping company 0.50
Delivery order Shipping company 0.70
EDI charge Terminal or port operator 0.30
Total 100.00
Note: *Average charges, calculated based on shipping rates provided by Maersk Sealand for2004 for the movement of a container vessel among 10 countries/areas as listed in thischapter.

290
movement of cargo between origin and destination countries is charged by shipping linesas base ocean freight, whereas 28 per cent is container handling charges, recovered bythe terminal or port operators. Government duties are also not negligible; about 3 per centof total shipping costs is imposed by governments as taxes and levies for using port andnavigation facilities.
However, the extent of auxiliary shipping charges9 is very wide and covers severalcomponents, such as peak season surcharge, congestion surcharge, Bunker AdjustmentFactor, Yen Appreciation Surcharge, Fuel Adjustment Factor and delivery order etc., whichoften make shipping between countries costlier. For example, exporters had to pay anaverage of US$ 35 per 20-foot container towards the Bunker Adjustment Factor in 2004,which was imposed by the shipping lines as a fuel surcharge, and an average of US$ 30per 20-foot container as the Yen Appreciation Surcharge for cargo going to Japan.
In many cases, the volume of auxiliary shipping charges often overtakes baseocean freight. This is clearly shown in table 4. For cargo originating in Japan and going toHong Kong, China an average of US$ 425 per 20-foot container had to be paid towardsauxiliary charges in 2004, whereas the base ocean freight was only US$ 200, thus makingcontainer transportation between the two countries effectively costlier than that betweenJapan and India. The sea trade between Japan and the Republic of Korea follows thesame direction. Because of the close proximity as well as advanced maritime and shippingfacilities, it would be expected that auxiliary charges would be low. However, this studyfound that the charges between the two countries were higher than the base ocean freight.Quite contrary to popular belief, the volume of auxiliary shipping charges in South Asiancountries is relatively low. For example, for cargo originating in Japan and destined forSri Lanka, about US$ 231 had to be paid (11.94 per cent of the total shipping costs) asauxiliary charges. Cargo originating at China and destined for India incurred a US$ 302(13.11 per cent of the total shipping costs) payment towards auxiliary charges in 2004.
Therefore, as table 4 indicates, the auxiliary shipping charges have witnesseda steep rise in recent years, which is likely to offset the gains arising from tariff liberalizationand make the entire trade costlier. A major part of these charges, such as documentationfees, government taxes and levies etc., are soft barriers to trade and very much explicitin the system, over which traders (both exporters and importers) have less control. Whilesome auxiliary charges, such as terminal handling charges, are market driven, governmentduties and levies (similar to tariffs) are very much ad hoc and offer less economicrationale . Apparently, the auxiliary charges are relatively higher at the ports of Japan andHong Kong, China as well as most of the countries/areas located in Northeast Asia andSoutheast Asia, where the volume of two-way trade is also very high. Therefore, it followsthat auxiliary shipping charges are increasingly becoming critical to trade in Asia, whichshould be seen unambiguously as explicit barriers to merchandise trade.
9 Auxiliary shipping charges include all shipping charges other than basic ocean freight in this study.In figure IV, auxiliary shipping charges include a container handling charge, government duties andmiscellaneous charges (40 per cent of total ocean freight).

291Ta
ble
4.
Oc
ea
n f
reig
ht
an
d a
ux
ilia
ry c
ha
rge
s i
n A
sia
, 2
00
4
Co
un
try
/are
aD
es
tin
ati
on
Ba
se
oc
ea
nA
ux
ilia
ryB
OF
-AC
Co
un
try
/are
aD
es
tin
ati
on
Ba
se
oc
ea
nA
ux
ilia
ryB
OF
-AC
of
ori
gin
co
un
try
/are
afr
eig
hta
ch
arg
es
ara
tio
b
of
ori
gin
co
un
try
/are
afr
eig
hta
ch
arg
es
ara
tio
b
(%)
(%)
HK
, Chi
na c
Sin
gapo
re52
.71
47.2
989
.70
Tha
iland
Chi
na79
.80
20.2
025
.32
HK
, Chi
naS
ri La
nka
71.0
828
.92
40.6
8T
haila
ndS
inga
pore
71.2
728
.73
40.3
2
HK
, Chi
naIn
dia
71.5
728
.43
39.7
2T
haila
ndS
ri La
nka
77.3
622
.64
29.2
7
HK
, Chi
naM
alay
sia
35.7
464
.26
179.
80T
haila
ndJa
pan
75.2
324
.77
32.9
3
HK
, Chi
naIn
done
sia
64.4
435
.56
55.1
8T
haila
ndM
alay
sia
73.2
826
.72
36.4
6
HK
, Chi
naT
haila
nd62
.28
37.7
260
.56
Tha
iland
Indo
nesi
a69
.32
30.6
844
.27
HK
, Chi
naJa
pan
46.8
853
.12
113.
30T
haila
ndIn
dia
76.2
323
.77
31.1
8
HK
, Chi
naR
ep. o
f Kor
ea40
.27
59.7
314
8.30
Tha
iland
HK
, Chi
na63
.97
36.0
356
.33
HK
, Chi
naP
hil ip
pine
s43
.15
56.8
513
1.72
Tha
iland
Rep
. of K
orea
69.8
730
.13
43.1
2
HK
, Chi
naV
iet N
am48
.08
51.9
210
7.99
Tha
iland
Phi
l ippi
nes
76.7
223
.28
30.3
4
HK
, Chi
naTa
iwan
d63
.62
36.3
857
.18
Tha
iland
Vie
t Nam
86.0
813
.92
16.1
7
Japa
nC
hina
55.2
144
.79
81.1
3T
haila
ndTa
iwan
61.8
838
.12
61.6
0
Japa
nS
inga
pore
50.3
449
.66
98.6
3S
inga
pore
Chi
na60
.57
39.4
365
.10
Japa
nS
ri La
nka
88.0
611
.94
13.5
6S
inga
pore
Mal
aysi
a48
.70
51.3
010
5.35
Japa
nIn
dia
75.3
724
.63
32.6
8S
inga
pore
Sri
Lank
a73
.16
26.8
436
.68
Japa
nM
alay
sia
55.9
344
.07
78.8
0S
inga
pore
Japa
n70
.74
29.2
641
.36
Japa
nIn
done
sia
53.5
746
.43
86.6
8S
inga
pore
Tha
iland
46.1
253
.88
116.
84
Japa
nT
haila
nd51
.58
48.4
293
.87
Sin
gapo
reIn
done
sia
34.8
965
.11
186.
58
Japa
nH
K, C
hina
32.0
167
.99
212.
44S
inga
pore
Indi
a68
.18
31.8
246
.68
Japa
nR
ep. o
f Kor
ea48
.79
51.2
110
4.97
Sin
gapo
reH
K, C
hina
36.7
963
.21
171.
84
Japa
nP
hilip
pine
s62
.41
37.5
960
.24
Sin
gapo
reR
ep. o
f Kor
ea50
.12
49.8
899
.51
Japa
nV
iet N
am71
.65
28.3
539
.56
Sin
gapo
reP
hilip
pine
s73
.93
26.0
735
.26

292Ta
ble
4.
(co
nti
nu
ed)
ou
ntr
y/a
rea
De
sti
na
tio
nB
as
e o
ce
an
Au
xil
iary
BO
F-A
CC
ou
ntr
y/a
rea
De
sti
na
tio
nB
as
e o
ce
an
Au
xil
iary
BO
F-A
C
of
ori
gin
co
un
try
/are
afr
eig
hta
ch
arg
es
ara
tio
b
of
ori
gin
co
un
try
/are
afr
eig
hta
ch
arg
es
ara
tio
b
(%)
(%)
Japa
nTa
iwan
35.1
564
.85
184.
52S
inga
pore
Vie
t Nam
67.5
032
.50
48.1
6
Indo
nesi
aS
hang
hai
64.5
135
.49
55.0
1S
inga
pore
Taiw
an34
.86
65.1
418
6.89
Indo
nesi
aS
inga
pore
52.3
547
.65
91.0
2R
ep. o
f Kor
eaC
hina
61.3
738
.63
62.9
5
Indo
nesi
aC
olom
bo76
.99
23.0
129
.89
Rep
. of K
orea
Mal
aysi
a58
.63
41.3
770
.55
Indo
nesi
aTo
kyo
72.0
727
.93
38.7
5R
ep. o
f Kor
eaS
ri La
nka
79.7
220
.28
25.4
4
Indo
nesi
aT
haila
nd58
.67
41.3
370
.45
Rep
. of K
orea
Japa
n59
.86
40.1
467
.06
Indo
nesi
aM
alay
sia
52.8
447
.16
89.2
6R
ep. o
f Kor
eaT
haila
nd61
.04
38.9
663
.84
Indo
nesi
aIn
dia
77.9
022
.10
28.3
8R
ep. o
f Kor
eaIn
done
sia
57.7
642
.24
73.1
3
Indo
nesi
aH
K, C
hina
53.3
746
.63
87.3
8R
ep. o
f Kor
eaIn
dia
78.6
821
.32
27.0
9
Indo
nesi
aR
ep. o
f Kor
ea51
.33
48.6
794
.82
Rep
. of K
orea
HK
, Chi
na51
.60
48.4
093
.80
Indo
nesi
aP
hil ip
pine
s71
.38
28.6
240
.09
Rep
. of K
orea
Sin
gapo
re55
.73
44.2
779
.45
Indo
nesi
aV
iet N
am75
.88
24.1
231
.79
Rep
. of K
orea
Phi
l ippi
nes
71.1
928
.81
40.4
8
Indo
nesi
aTa
iwan
47.3
452
.66
111.
25R
ep. o
f Kor
eaV
iet N
am80
.20
19.8
024
.69
Mal
aysi
aC
hina
64.5
435
.46
54.9
4R
ep. o
f Kor
eaTa
iwan
40.5
759
.43
146.
50
Mal
aysi
aS
inga
pore
54.7
545
.25
82.6
6C
hina
Japa
n68
.78
31.2
245
.39
Mal
aysi
aS
ri La
nka
80.8
019
.20
23.7
6C
hina
Sin
gapo
re62
.37
37.6
360
.33
Mal
aysi
aJa
pan
82.6
317
.37
21.0
2C
hina
Sri
Lank
a86
.89
13.1
115
.09
Mal
aysi
aT
haila
nd56
.82
43.1
876
.00
Chi
naIn
dia
86.8
913
.11
15.0
9
Mal
aysi
aIn
done
sia
53.5
046
.50
86.9
0C
hina
Mal
aysi
a73
.46
26.5
436
.12
Mal
aysi
aIn
dia
82.0
617
.94
21.8
7C
hina
Indo
nesi
a62
.53
37.4
759
.92
Mal
aysi
aH
K, C
hina
33.7
266
.28
196.
55C
hina
Tha
iland
76.9
223
.08
30.0
0
Mal
aysi
aR
ep. o
f Kor
ea54
.77
45.2
382
.58
Chi
naH
K, C
hina
53.6
846
.32
86.2
7
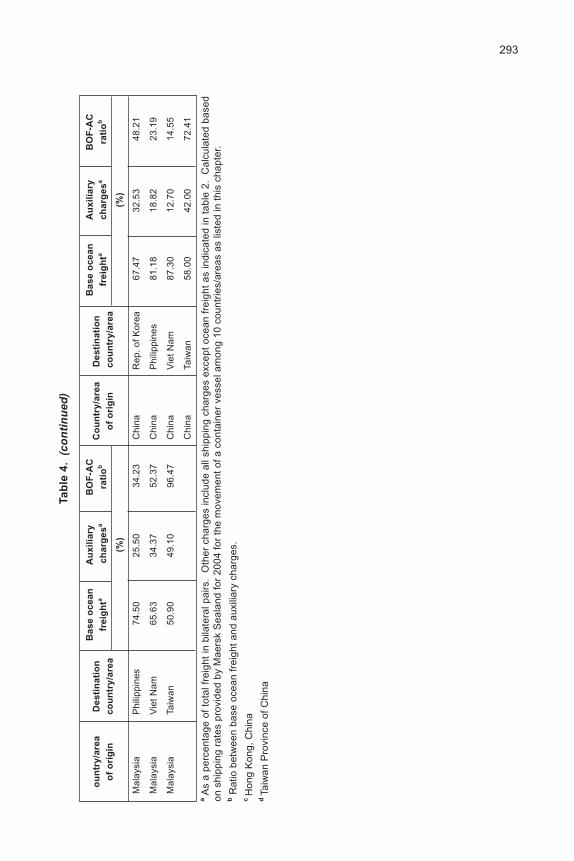
293Ta
ble
4.
(co
nti
nu
ed)
ou
ntr
y/a
rea
De
sti
na
tio
nB
as
e o
ce
an
Au
xil
iary
BO
F-A
CC
ou
ntr
y/a
rea
De
sti
na
tio
nB
as
e o
ce
an
Au
xil
iary
BO
F-A
C
of
ori
gin
co
un
try
/are
afr
eig
hta
ch
arg
es
ara
tio
b
of
ori
gin
co
un
try
/are
afr
eig
hta
ch
arg
es
ara
tio
b
(%)
(%)
Mal
aysi
aP
hilip
pine
s74
.50
25.5
034
.23
Chi
naR
ep. o
f Kor
ea67
.47
32.5
348
.21
Mal
aysi
aV
iet N
am65
.63
34.3
752
.37
Chi
naP
hilip
pine
s81
.18
18.8
223
.19
Mal
aysi
aTa
iwan
50.9
049
.10
96.4
7C
hina
Vie
t Nam
87.3
012
.70
14.5
5
Chi
naTa
iwan
58.0
042
.00
72.4
1a A
s a
perc
enta
ge o
f tot
al fr
eigh
t in
bila
tera
l pai
rs.
Oth
er c
harg
es in
clud
e al
l shi
ppin
g ch
arge
s ex
cept
oce
an fr
eigh
t as
indi
cate
d in
tabl
e 2.
C
alcu
late
d ba
sed
on s
hipp
ing
rate
s pr
ovid
ed b
y M
aers
k S
eala
nd fo
r 20
04 fo
r th
e m
ovem
ent o
f a c
onta
iner
ves
sel a
mon
g 10
cou
ntrie
s/ar
eas
as l i
sted
in th
is c
hapt
er.
b R
atio
bet
wee
n ba
se o
cean
frei
ght a
nd a
uxi l i
ary
char
ges.
cH
ong
Kon
g, C
hina
dTa
iwan
Pro
vinc
e of
Chi
na

294
C. Estimating the effects of trade costs on trade
1. Data and methodology
The main objective of this section is to estimate the effect of trade costs on tradeflows of 10 Asian economies. The specification of the gravity equation - i.e., the equationspecifying bilateral trade flows as a function of trading economies gross domestic products,distance, trade costs, and other relevant factors - and details of its estimation are providedin Annex to this chapter.
The study dealt with selected components of trade costs imposed by both policy(such as tariffs) as well as environment (such as transportation and others). The shadedboxes in figure IV are the trade cost components considered in the study. Due to lack ofcompatible quantitative information, the study did not consider NTBs, quotas, and transitand pre-shipment costs.
10 Many methods have been constructed to measure transportation cost. The most straightforwardmeasure in international trade is the difference between cost, insurance and freight (CIF), and free onboard (FOB) quotations of trade. The difference between these two values is a measure of the cost ofgetting an item from the exporting country to the importing country. There is another source forobtaining data for transport costs from industry or shipping firms. Limao and Venables (2001) obtainedquotes from shipping firms for a standard container shipped from Baltimore to various destinations.Hummels (1991a) obtained indices of ocean shipping and air freight rates from trade journals, whichpresumably are averages of such quotes. The most widely available data (many countries and yearsare covered) are average ad valorem transport costs based on the aggregate bilateral CIF/FOB ratiosfrom the United Nations COMTRADE database, supplemented in some cases with national datasources. Because of the availability of this data as well as the difficulty of obtaining better estimatesfor a wide range of countries and years, apparently careful work such as J. Harrigan, 1993, and S.L.Baier and J.F. Bergstrand, 2001 used this measure.
11 Ocean freight rates, collected from Maersk Sealand, 2006, have been used here.
Figure IV. Trade costs and its components
Trade costs
Costs imposed by policy Costs imposed by
environment
Tariffs NTBs Quotas Transport costs Miscellaneouscosts
Direct costs Indirect costs
Freightcharges
Insurance Transit costs Pre-shipmentcosts
Infrastructure
In estimating bilateral transportation costs, two methods have been used: (a) thedifference in ad valorem trade-weighted freight rates;10 and (b) the differences in intercountrycosts of transportation using shipping rates collected from shipping agents.11

295
Table 5. OLS (log linear) results at the 4-digit HS level for 2004
Model 1a Model 2b
Coefficient t-value Coefficient t-value
GDP of importing countries/areas 0.107 e 3.720 0.059 d 2.350
GDP of exporting countries/areas 0.488 e 20.440 0.394 e 21.230
Infrastructure of importing countries/areas -0.421 e -7.500 -0.586 e -12.090
Infrastructure of exporting countries/areas -0.054 c -1.990 -0.148 e -5.930
Weighted tariff -0.276 e -13.830 -0.161 e -9.450
Trade-weighted transport costs$ -0.571 e -11.620
Trade-weighted transport costs# -0.021 c -1.940
Remoteness of importing countries/areas -0.001 -0.010 -0.680 e -8.260
Remoteness of exporting countries/areas -0.638 e -8.720 -0.929 e -15.150
Distance -0.420 e -9.970 -0.573 e -15.570
Free Trade Agreement dummy 0.323 e 5.900 0.179 e 3.970
Adjacency dummy 0.163 d 2.260 0.072 1.290Language dummy 0.114 1.570 0.117 c 2.000
Country/area effect
China 0.693 e 4.940 0.579 e 9.580
Hong Kong, China Insignificant Insignificant
India Insignificant Insignificant
Indonesia 0.087 1.080 -0.212 d -2.810
Japan Insignificant Insignificant
Korea, Republic of -0.488 e -6.340 -0.964 e -13.750
Malaysia Insignificant Insignificant
Singapore Insignificant Insignificant
Thailand 0.119 c 1.940 0.241 e 4.570
Number of observations 20 533 12 051
Adjusted R2 0.130 0.555a Estimated using equation (4).b Estimated using equation (5).c Significant at the 10 per cent level.d Significant at the 5 per cent level.e Significant at the1 per cent level.
2. Estimation results
Table 5 shows the estimation results of gravity equation (9) for two scenarios oftransportation costs, one using equation (4) and the other using equation (5).12 Theexplanatory variables of interest are trade infrastructure (II), transport costs (TC) andtariffs (T) in equation (9). It is assumed that the TC, T and II are negatively correlated withthe volume of imports, respectively.13 The gravity model performs well and most of the
12 See Annex I for details.
13 The usual caveat is that in this particular case, an inverse measure of II in the regression wastaken so that an increase in II is expected to be associated with an increase in the TC, and vice versa.
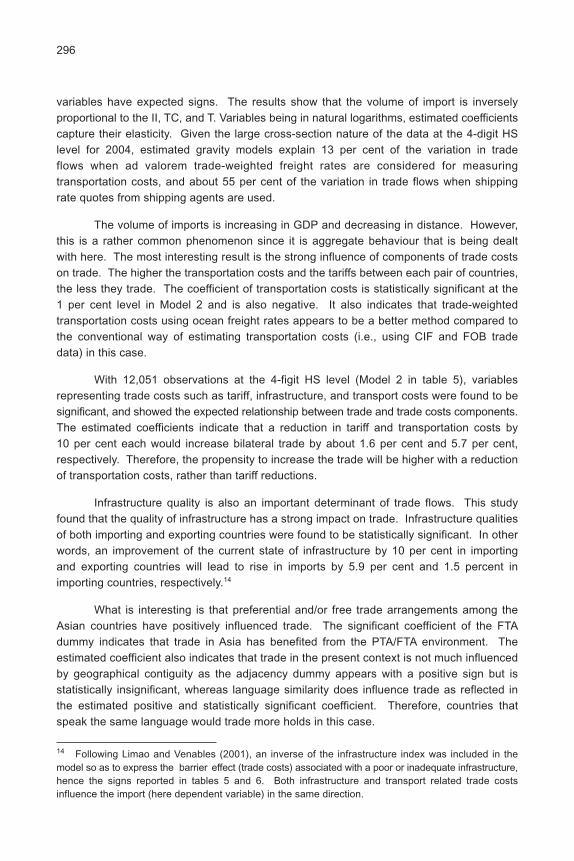
296
variables have expected signs. The results show that the volume of import is inverselyproportional to the II, TC, and T. Variables being in natural logarithms, estimated coefficientscapture their elasticity. Given the large cross-section nature of the data at the 4-digit HSlevel for 2004, estimated gravity models explain 13 per cent of the variation in tradeflows when ad valorem trade-weighted freight rates are considered for measuringtransportation costs, and about 55 per cent of the variation in trade flows when shippingrate quotes from shipping agents are used.
The volume of imports is increasing in GDP and decreasing in distance. However,this is a rather common phenomenon since it is aggregate behaviour that is being dealtwith here. The most interesting result is the strong influence of components of trade costson trade. The higher the transportation costs and the tariffs between each pair of countries,the less they trade. The coefficient of transportation costs is statistically significant at the1 per cent level in Model 2 and is also negative. It also indicates that trade-weightedtransportation costs using ocean freight rates appears to be a better method compared tothe conventional way of estimating transportation costs (i.e., using CIF and FOB tradedata) in this case.
With 12,051 observations at the 4-figit HS level (Model 2 in table 5), variablesrepresenting trade costs such as tariff, infrastructure, and transport costs were found to besignificant, and showed the expected relationship between trade and trade costs components.The estimated coefficients indicate that a reduction in tariff and transportation costs by10 per cent each would increase bilateral trade by about 1.6 per cent and 5.7 per cent,respectively. Therefore, the propensity to increase the trade will be higher with a reductionof transportation costs, rather than tariff reductions.
Infrastructure quality is also an important determinant of trade flows. This studyfound that the quality of infrastructure has a strong impact on trade. Infrastructure qualitiesof both importing and exporting countries were found to be statistically significant. In otherwords, an improvement of the current state of infrastructure by 10 per cent in importingand exporting countries will lead to rise in imports by 5.9 per cent and 1.5 percent inimporting countries, respectively.14
What is interesting is that preferential and/or free trade arrangements among theAsian countries have positively influenced trade. The significant coefficient of the FTAdummy indicates that trade in Asia has benefited from the PTA/FTA environment. Theestimated coefficient also indicates that trade in the present context is not much influencedby geographical contiguity as the adjacency dummy appears with a positive sign but isstatistically insignificant, whereas language similarity does influence trade as reflected inthe estimated positive and statistically significant coefficient. Therefore, countries thatspeak the same language would trade more holds in this case.
14 Following Limao and Venables (2001), an inverse of the infrastructure index was included in themodel so as to express the barrier effect (trade costs) associated with a poor or inadequate infrastructure,hence the signs reported in tables 5 and 6. Both infrastructure and transport related trade costsinfluence the import (here dependent variable) in the same direction.

297
Models 1 and 2 in table 5 report the results, including remoteness of both exportingand importing countries. Coefficients of remoteness and distance are significant withunchanged negative signs, thereby indicating that a country s distance from its tradingpartner and relative remoteness from the rest of the world has a clear negative effect onimports. Therefore, the importance of distance is not diminished, even if quality ofinfrastructure is included. Since distance is a proxy for trade costs where, according toseveral studies quoted in this chapter, trade costs are largely determined by the quality ofinfrastructure, this is somewhat surprising. It is likely that better infrastructure and lowertransportation costs primarily increase the trade volume, while distance is as important asbefore for the distribution of trade in individual trading partners.
The sign of country effects is a reflection of the current trade situation. Countryeffects also appeared significantly in the case of China, Indonesia, the Republic of Koreaand Thailand. China and Thailand show positive and significant country effects, while inthe case Indonesia and the Republic of Korea the effects are negative and significant.The reason is large or medium-sized countries such as China and Thailand, which aremajor producers and exporters, have much to influence the trade in Asia, thus showingpositive and significant country effects. On the other hand, countries such as Indonesiaand the Republic of Korea are still unable to gain adequate benefits due to the presence ofcomparatively higher trade barriers such as higher tariffs and transportations costs. It mayalso be inferred that countries with negative and significant country effects (here, forexample, Indonesia and the Republic of Korea) indicate a low exploitation level of tradepotentiality and a high presence of trade barriers.15
A two-stage least square estimation procedure (2SLS) is implemented to addressthe potential endogeneity of transport costs, using the number of ports engaged in trade incountry pairs as instrument (see table 6). The explanatory power of the models hasimproved slightly as a result, although only marginally.
The 2SLS estimates indicate that trade cost components, i.e., infrastructure quality,transportation costs and tariffs, have statistically significant negative impacts on the volumeof imports. The coefficients of these trade cost components increase marginally, comparedwith the OLS results. Therefore, 2SLS estimates imply that a 10 per cent saving intransportation costs and a 10 per cent reduction in tariffs will increase imports by about6 per cent and 2 per cent, respectively. At the same time, a 10 per cent improvement ininfrastructure quality will increase imports by 3 per cent.
Therefore, a country s infrastructure quality and transportation costs are the twomain determinants of cross-country variations of trade flows in the present context.Interestingly, these two barriers are explicitly related to the environment, where the rise intransportation costs is an outcome of the environment and policy constraints on the regionaltrade and infrastructure system. Nevertheless, these findings provide sufficient indicationsof presence of trade costs in Asia.
15 However, the problems of multi-colinearity associated with the results cannot be refuted.

298
Table 6. 2SLS (log linear) results at the 4-digit HS level for 2004
Model 1a Model 2b
Coefficient t-value Coefficient t-value
GDP of importing countries/areas 0.014 0.410 0.150 e 4.950
GDP of exporting countries/areas 0.325 e 9.390 0.112 e 3.800
Infrastructure of importing countries/areas -0.279 e -4.640 -0.341 e -6.550
Infrastructure of exporting countries/areas -0.008 -0.290 -0.170 e -6.830
Weighted tariff -0.276 e -13.830 -0.159 e -9.360
Trade-weighted transport costs b -0.574 e -7.700
Trade-weighted transport costsa -0.024 d -2.210
Remoteness of importing countries/areas -0.056 -0.600 -0.727 e -8.880
Remoteness of exporting countries/areas -0.504 e -6.640 -0.726 e -11.500
Distance -0.530 e -11.680 -0.786 e -19.460
Free Trade Agreement dummy 0.292 e 5.310 0.014 0.300
Adjacency dummy -0.006 -0.080 -0.036 -0.640
Language dummy 0.171 e 2.330 0.066 1.130
Country/area effect
China 0.738 e 5.260 0.470 e 7.750
Hong Kong, China Insignificant Insignificant
India Insignificant Insignificant
Indonesia Insignificant -0.378 e -4.970
Japan Insignificant Insignificant
Korea, Republic of -0.555 e -7.160 -1.029 e -14.720
Malaysia Insignificant Insignificant
Singapore Insignificant Insignificant
Thailand 0.300 e 4.450 0.548 e 9.460
Instrument: Number of seaports for Yes Yesexports and imports in bilateral pair
Number of observations 20 533 12 051
Adjusted R2 0.132 0.560a Estimated using equation (4).b Estimated using equation (5).c Significant at 10 per cent level.d Significant at 5 per cent level.e Significant at 1 per cent level.
To summarize, there is strong empirical evidence that trade cost components, i.e.,infrastructure quality, tariffs and transportation, costs are important for international tradepatterns. Indeed, as product differentiation, vertical specialization and international outsourcinghave become more prominent in world trade, the relative importance of these costs asa determinant of international trade has increased in Asia.

299
D. Conclusion
This chapter has provided new empirical estimates of the impact of trade barriersusing an extended gravity model. First, infrastructure quality of trading partners is introducedas it is believed to have an impact on trade. Second, bilateral tariffs, which are largelyignored in the empirical gravity literature in the context of Asia, are introduced. Third, inorder to ensure unbiased estimates, resistance parameters have been used. Fourth, inorder to find the relative robustness of transportation costs, trade-weighted transportationcosts that consider cross-country shipping rates have been used, which is also a newcontribution to the gravity literature. Fifth, in order to control for the potential problem ofomitted variable bias and endogeneity, the model was estimated using an instrumentalvariable estimation procedure.
The findings presented in this chapter highlight the significance of trade costs inthe context of Asian trade. In particular, the analysis carried out provides sufficient evidenceto ascertain that variations in transportation costs together with infrastructure facilitieshave significant influence on regional trade flows in Asia. A 10 per cent saving in transportationcosts is likely to increase trade by about 6 per cent. Further, the findings show that tariffshave a relatively large and negative impact on trade, and that the importance of distanceis not diminished, even if the quality of infrastructure and transportation costs is included.
The econometric results also indicate that trade in Asia has been benefited fromFTAs, whereas trade in the present context is not much influenced by geographical contiguity.Further, it is shown that countries that speak the same language also trade more. Countriessuch as China, Indonesia, the Republic of Korea and Thailand, which are major regionalproducers and exporters, have influenced Asian trade more than others in recent years.However, countries such as Indonesia and the Republic of Korea have yet to reap muchbenefit from the freer trade environment due to a low level of exploitation of trade potentialityand a high presence of trade barriers. Also highlighted is the fact that a country s infrastructurequality and transportation costs are the two main determinants of cross-country variationsof trade flows in the present context. Interestingly, these two barriers are explicitly relatedto the environment, where the rise in transportation costs is an outcome of the environmentand policy constraints on the regional trade and infrastructure system.
As tariffs have fallen not only in Asia but also across most of the economies of theworld, more attention is being paid towards trade and transportation facilitation. As Asia ismoving progressively into more complex and higher-value manufacturing, and greaterintegration into global production chains, logistics requirements have become moresophisticated. The challenge for Asian countries is thus to identify improvements in logisticsservices and related infrastructure that can be achieved in the short-to-medium term andthat would have a significant impact on their competitiveness. The results presented inthis study have important policy implications for Asian countries seeking to expand trade.These findings also have important policy implications for LDCs. If improvements in thequality of infrastructure in LDCs continue to lag behind the more developed countries, theshare of LDCs in world trade is likely to continue to decline.

300
The present study has considered some direct and indirect trade costs componentsbut omitted infrastructure costs as well as wholesale and distribution costs. The impactsof infrastructure costs together with wholesale and distribution costs thus need to becaptured more accurately in future models. Future studies may also attempt to establishthe technological relationship between transportation costs and distance as bigger vesselsare now plying between Asian ports, and the region is witnessing a more liberal tradeenvironment.
One of the objectives of technological development and improved trade facilitationmeasures at ports and borders is to reduce the costs of the movement of goods acrosscountries. In this chapter, a plausible explanation has been given as to why ocean freightcosts are penalizing merchandise trade. While individual components of ocean freightcosts have not been considered in the model, future studies should be carried out thatattempt to understand how the components of ocean freight costs (such as base oceanfreight and auxiliary shipping charges) together with other trade barriers are affectingtrade.

301
Annexes
Annex I. Methodology
A. Bilateral transportation cost estimation
Importing countries report the value of imports from partner countries inclusive oftransportation charges, and exporting countries report their value exclusive of transportationcharges, which measures the costs of the imports and all charges incurred in placing themerchandise aboard a carrier in the exporting port. Alternatively, using the freight rate, wearrive at variations in transportation costs across countries. Let T
ij denote the unit cost of
shipping a particular good from country j to country i. We assume that it is determined by:
Tij= f (x
ij, X
i, X
j, μ
ij) (1)
where xij
is a vector of characteristics related to the journey between i and j, Xiis a vector
of characteristics of country i, Xj is a vector of characteristics of country j, and μ
ij represents
all unobservable variables.
Denoting the export price shipped from j to i by pij, we define t
ij, the ad valorem
transportation cost factor, as
tij
= (pij
+ Tij) / p
ij= t (x
ij, X
i, X
j, μ
ij) (2)
where the determinants of Tij are given in equation (1). The ratio of import and export
costs provides the measure of transportation costs of trade between each pair of countries.Assuming that t
ij can be approximated by a log linear function up to some measurement
error, the average observed transaction cost rates tij appears as
ln tij = α + β ln x
ij + γ ln X
i + δ ln X
j+ ω
j(3)
Here, the transport costs tij represent costs of transportation between country i
and j.
In the present study, two separate methods have been used to estimate tij.
Method I is trade-weighted transport costs, derived from the differences in export andimport prices, whereas Method II represents weighted costs of transportation, estimatedusing cross-country shipping rates.16 While both methods have been widely used to estimatetransportation costs, there is a methodological difference between the two. The trade-weighted transport cost in Method I for commodity k is
tk = (4)
16 Here, methodology follows Limao and Venables (2001), which was adopted from Hummels (1999a).
ij - 1 Sk
EXkji
i
IMkij( )
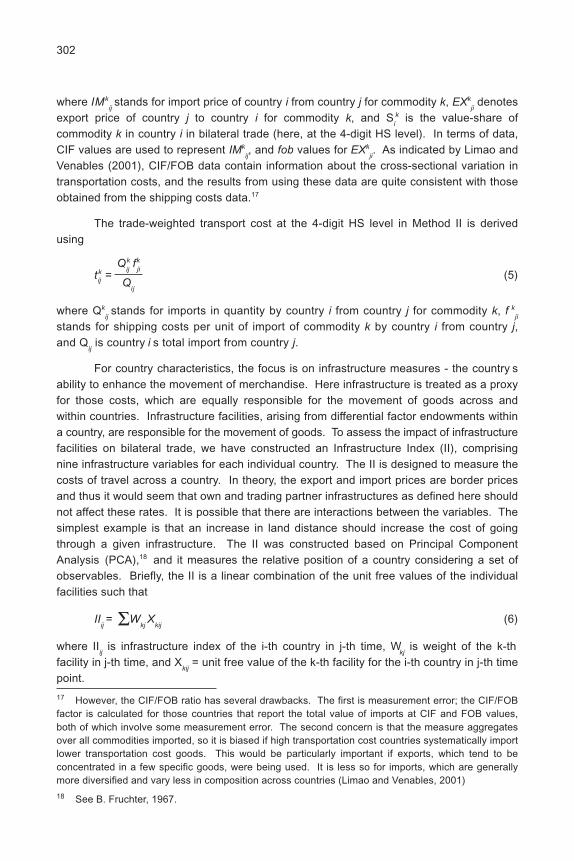
302
where IMkij stands for import price of country i from country j for commodity k, EXk
jidenotes
export price of country j to country i for commodity k, and Sik is the value-share of
commodity k in country i in bilateral trade (here, at the 4-digit HS level). In terms of data,CIF values are used to represent IMk
ij, and fob values for EXk
ji. As indicated by Limao and
Venables (2001), CIF/FOB data contain information about the cross-sectional variation intransportation costs, and the results from using these data are quite consistent with thoseobtained from the shipping costs data.17
The trade-weighted transport cost at the 4-digit HS level in Method II is derivedusing
tk = (5)
where Qkijstands for imports in quantity by country i from country j for commodity k, f k
ji
stands for shipping costs per unit of import of commodity k by country i from country j,and Q
ij is country i s total import from country j.
For country characteristics, the focus is on infrastructure measures - the country sability to enhance the movement of merchandise. Here infrastructure is treated as a proxyfor those costs, which are equally responsible for the movement of goods across andwithin countries. Infrastructure facilities, arising from differential factor endowments withina country, are responsible for the movement of goods. To assess the impact of infrastructurefacilities on bilateral trade, we have constructed an Infrastructure Index (II), comprisingnine infrastructure variables for each individual country. The II is designed to measure thecosts of travel across a country. In theory, the export and import prices are border pricesand thus it would seem that own and trading partner infrastructures as defined here shouldnot affect these rates. It is possible that there are interactions between the variables. Thesimplest example is that an increase in land distance should increase the cost of goingthrough a given infrastructure. The II was constructed based on Principal ComponentAnalysis (PCA),18 and it measures the relative position of a country considering a set ofobservables. Briefly, the II is a linear combination of the unit free values of the individualfacilities such that
IIij= ΣW
kjX
kij(6)
where IIij is infrastructure index of the i-th country in j-th time, W
kj is weight of the k-th
facility in j-th time, and Xkij
= unit free value of the k-th facility for the i-th country in j-th timepoint.
17 However, the CIF/FOB ratio has several drawbacks. The first is measurement error; the CIF/FOBfactor is calculated for those countries that report the total value of imports at CIF and FOB values,both of which involve some measurement error. The second concern is that the measure aggregatesover all commodities imported, so it is biased if high transportation cost countries systematically importlower transportation cost goods. This would be particularly important if exports, which tend to beconcentrated in a few specific goods, were being used. It is less so for imports, which are generallymore diversified and vary less in composition across countries (Limao and Venables, 2001)
18 See B. Fruchter, 1967.
ij Qij
Qk fkij ji
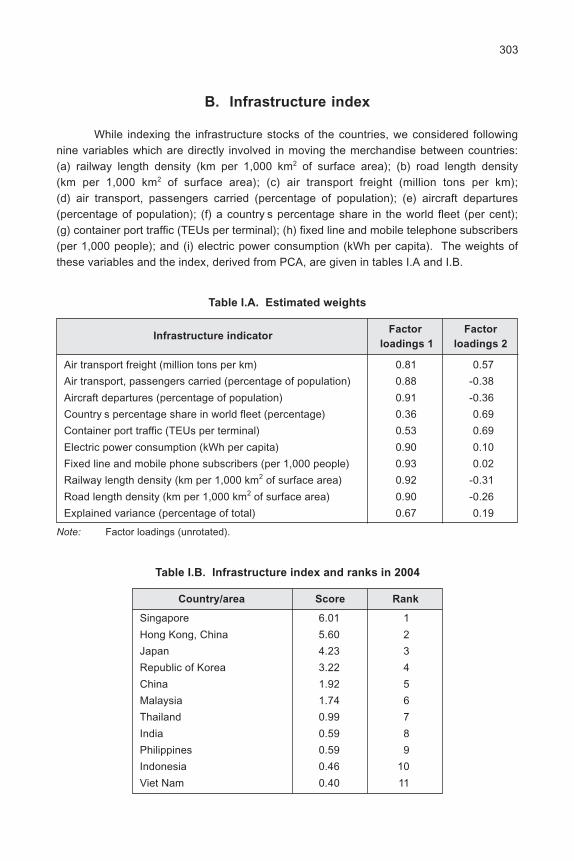
303
B. Infrastructure index
While indexing the infrastructure stocks of the countries, we considered followingnine variables which are directly involved in moving the merchandise between countries:(a) railway length density (km per 1,000 km2 of surface area); (b) road length density(km per 1,000 km2 of surface area); (c) air transport freight (million tons per km);(d) air transport, passengers carried (percentage of population); (e) aircraft departures(percentage of population); (f) a country s percentage share in the world fleet (per cent);(g) container port traffic (TEUs per terminal); (h) fixed line and mobile telephone subscribers(per 1,000 people); and (i) electric power consumption (kWh per capita). The weights ofthese variables and the index, derived from PCA, are given in tables I.A and I.B.
Table I.A. Estimated weights
Infrastructure indicatorFactor Factor
loadings 1 loadings 2
Air transport freight (million tons per km) 0.81 0.57
Air transport, passengers carried (percentage of population) 0.88 -0.38
Aircraft departures (percentage of population) 0.91 -0.36
Country s percentage share in world fleet (percentage) 0.36 0.69
Container port traffic (TEUs per terminal) 0.53 0.69
Electric power consumption (kWh per capita) 0.90 0.10
Fixed line and mobile phone subscribers (per 1,000 people) 0.93 0.02
Railway length density (km per 1,000 km2 of surface area) 0.92 -0.31
Road length density (km per 1,000 km2 of surface area) 0.90 -0.26
Explained variance (percentage of total) 0.67 0.19
Note: Factor loadings (unrotated).
Table I.B. Infrastructure index and ranks in 2004
Country/area Score Rank
Singapore 6.01 1
Hong Kong, China 5.60 2
Japan 4.23 3
Republic of Korea 3.22 4
China 1.92 5
Malaysia 1.74 6
Thailand 0.99 7
India 0.59 8
Philippines 0.59 9
Indonesia 0.46 10
Viet Nam 0.40 11

304
C. Gravity Model
The gravity model provides the main link between trade barriers and trade flows.The gravity equation proposed here is a sort of reduced form of an intra-industry trademodel. Following Anderson and van Wincoop (2003), the baseline equation is
Xij
= (7)
where Yi Y
j and Y
w denote the aggregate size of countries i, j and the world, respectively;
Tij accounts for trade costs and other trade barriers; P
i and P
jreflect the implicit aggregate
equilibrium prices; and σ is the constant elasticity of substitution (CES) between all goodsin the consumption utility function.19
It is assumed from equation (7) that Tij may be divided into several components,
namely, infrastructure quality, tariff barriers, transport costs, distance, difference in languageand other border effects. Assuming monopolistically competitive market, the term (1-σ)should be negatively related to volume of trade.
In order to carry out the estimations, following Head (2003), and Anderson and vanWincoop (2003), it is assumed that the implicit aggregate equilibrium prices P
i and P
j are
basically resistance term or remoteness (trade weighted average distances from rest ofthe world).20 Here, remoteness (R
i), as a proxy of implicit aggregate equilibrium prices, is
derived through
Ri= Σ (8)
where Rireflects the average distance of country i from all trading partners other than j, d
im
is the distance between countries i and m, Ym is the GDP of country m.
In order to explore the impact of trade costs on trade flows, our empirical analysisconsiders an augmented gravity model, since it is one of the popular partial equilibriummodels known in explaining the variation of trade flows.
19 See, Anderson and van Wincoop (2003) for compete derivation of the model. We assume, asshown in Anderson (1979) and Anderson and van Wincoop (2003), all goods are differentiated byplace of origin and each country is specialized in the production of only one good. Therefore, supplyof each good is fixed (ni = 1), but it allows preferences to vary across countries subject to theconstraint of market clearing (CES).
20 In fact, some authors tentatively estimated model with price index variables (Baier and Bergstrand,2001). Baier, S.L. and Bergstrand, J.H. 2001. The Growth of World Trade: Tariffs, Transport Costs,and Income Similarity , Journal of International Economics, Vol. 53, pp. 1-27.
/Ym
dim( )
Yw
YiY
j
PiP
j
1-σTij( )/
m›j

305
The gravity model explains bilateral trade flows as a function of the trading partnersmarket sizes and their bilateral barriers to trade. As indicated in Nordos and Piermartini(2004), a number of standard variables are used in the empirical literature to capture tradebarriers:
(a) Transportation costs are generally captured by distance and island, landlockedand border dummies to reflect that transport costs increase with distance.They are higher for landlocked countries and islands and are lower forneighbouring countries;
(b) Information costs are generally captured by a dummy for common language;
(c) Tariff barriers are generally neglected. However, data on tariff barriers showthat there is a high degree of variability in cross-country bilateral appliedtariffs. Since neglecting tariffs may be a source of an omitted variable bias,bilateral tariffs have therefore been included in our estimations.
The, final estimable gravity equation takes following shape
ln IMij= α
0+ α
i + β
1ln Y
iY
j+ β
2ln II
i + β
3ln II
j + β
4ln TC
ij+β
5ln T
ij
+ β6
ln Ri + β
7ln R
j + β
8ln D
ij+β
9 d
1 + β
10 d
2 + β
11 d
3+ ε
ij (9)
where i and j are the importing and exporting country, respectively, IMij
represents importby country i from country j, taken at constant US dollars, Y
iand Y
jdenote gross domestic
products, taken at constant US dollars, of countries i and j, respectively, II representscountry s infrastructure quality, measured through an index, TC
ij stands for transportation
costs for bilateral trade between countries i and j, Tij stands for bilateral tariff (weighted
average) between country i and j, Ri and R
j denote average remoteness of countries i and
j, and Dij is the distance between countries i and j. Dummies 1, 2 and 3 refer to PTA/FTA
in force, adjacency, and language, respectively. To capture country effects, we use countryspecific dummy, α
i. The parameters to be estimated are denoted by β, and ε
ij is the error
term.
There are a few important reasons for considering the equation (9). First, weestimate a modified gravity equation, controlling for endogeneity and remoteness. Second,an alternative method for obtaining unbiased estimates of the impact of distance and otherbilateral variables on bilateral trade flows is to replace the multilateral resistance indexeswith importer and exporter dummies.21 We therefore estimate a gravity equation includingcountry specific effects. Third, the variables are identified keeping in mind their importancein influencing bilateral trade. Fourth, elasticity of trade flows can be estimated with regardto exogenous variables. Fifth, a country s trade with any given partner is dependent uponits average remoteness to the rest of the world (Anderson and van Wincoop, 2003).Studies that do not control for remoteness produce biased estimates of the impact oftransaction costs on trade. Finally, in an attempt to minimize the possibility of endogeneity
21 See J.E. Anderson and E. van Wincoop, 2003.
306
bias, equation (9) is also estimated using the number of ports in bilateral pairs as aninstrument for a country s imports. This instrument is selected for two main reasons:(a) countries in Asia rely more on seaports for merchandise trade, rather than overlandtransportation, and (b) due to spatial distribution, the number of seaports are unlikely to beaffected by the total volume of imports in a given pair.
The augmented gravity model considered here uses data for 2004 at the 4-digit HSlevel for 10 Asian countries/areas: China; Hong Kong, China; India; Indonesia; Japan;Republic of Korea; Malaysia; Singapore; Taiwan Province of China; and Thailand. Bytaking tariffs, transportation costs and infrastructure quality, a major portion of trade costsis covered. Bilateral trade, transportation costs and tariffs are taken at the 4-digit HS levelfor 2004.22 Since the gravity equation is the standard analytical framework for the predictionof bilateral trade flows, we use it as a policy simulation technique rather than extending itfor forecasting purposes.
The major sources of secondary data were the International Monetary Fund (2006),United Nations Statistical Division, UNCTAD and the World Bank.
22 The model also suffers from data limitation when considering equation (4) for estimating transportationcosts. On average, 56 per cent of total observations for all sectors are found to be either zero ornegative, or missing. Theoretically, tij cannot be negative or zero. Due to the poor quality of datacompilation, a discrepancy is faced in transportation cost estimation. However, better results areachieved when considering equation (5) and using freight rates. Annex II shows the country-wiseobservations collected and those with errors.

307
Annex II. Discrepancies in transportation cost estimations
at 4-digit HS, and data classification
Table II.A below illustrates the discrepancies in transportation cost estimations andtable II.B presents the data classifications.
Table II.A. Discrepancies in transportation cost estimations at 4-digit HS
Total Total observations Total observations
Importerobservations with positive with zero/negative/
at HS 4 level transport costs missing transport
at HS 4 level costs at HS 4 level
China 6 380 2 847 3 533
Hong Kong, China 5 734 2 626 3 108
India 5 652 2 566 3 086
Indonesia 6 213 2 916 3 297
Japan 5 582 2 548 3 034
Korea, Republic of 5 705 2 599 3 106
Malaysia 6 736 2 924 3 812
Singapore 6 937 2 755 4 182
Taiwan Province of China 5 517 2 266 3 251
Thailand 6 463 2 584 3 879
Total 60 919 26 631 34 288
Table II.B. Data classification
SectorCorresponding
Remarks2-digit HS level
Food 16-23 Taken all at HS 4
Chemical 28-40
Textiles and clothing 41-67
Machinery 84 Excluding HS 8415,8418, 8471, 8473
Electronics 85, 90, 91, 92, 95 Including HS 8415,8418, 8471, 8473
Auto components 87 Taken all at HS 4
Steel and metal 72-83
Transport equipment 86, 88, 89

308
References
Anderson, J.E., 1994. The theory of protection , in Surveys in International Trade, DavidGreenway and L. Alan Winters (eds.); pp. 107-138. Blackwell, Oxford.
, 1979. A theoretical foundation for the gravity equation , American EconomicReview, vol. 69; pp. 106-116.
Anderson, J.E. and E. van Wincoop, 2004. Trade costs , Journal of Economic Literature,vol. XLII, No. 3; pp. 691-751.
, 2003. Gravity with gravitas: A solution to the border puzzle , American EconomicReview, vol. 93, pp. 170-192.
, 2002. Borders, trade and welfare , in Brookings Trade Forum 2001, SusanCollins and Dani Rodrik (eds.); pp. 207-244. Brookings Institution, Washington,D.C.
Asia-Pacific Economic Cooperation, 2002. Measuring the Impact of APEC Trade Facilitationon APEC Economies: A CGE Analysis. Singapore.
Asian Development Bank, 2006. Asian Development Outlook 2006: Routes for Asia sTrade. Manila.
Asian Development Bank, Japan Bank for International Cooperation and World Bank,2005. Connecting East Asia: A New Framework for Infrastructure. World Bank,Washington, D.C.
Baier, S.L. and J.H. Bergstrand, 2001. The growth of world trade: Tariffs, transport costs,and income similarity , Journal of International Economics, vol. 53; pp. 1-27.
Bergstrand, J.H., 1989. The generalized gravity equation, monopolistic competition, andthe factor-proportions theory in international trade , Review of Economics andStatistics, vol. 71; pp. 143-153.
, 1985. The gravity equation in international trade: Some microeconomic foundationsand empirical evidence , Review of Economics and Statistics, vol. 67; pp. 474-481.
Bougheas, S. et al., 1999. Infrastructure, transport costs, and trade , Journal of InternationalEconomics, vol. 47; pp. 169-189.
Cernat, L., 2001. Assessing regional trading arrangements: Are South-South RTAs moretrade diverting? UNCTAD Policy Issues in International Trade and CommoditiesStudy Series No. 16. UNCTAD, Geneva.
Clark, X., D. Dollar and A. Miucco, 2004. Port efficiency, maritime transport costs andbilateral trade , working paper 10353. National Bureau of Economic Research,Cambridge, Massachusetts.
Davis, D., 1998. The home market effect, trade and industrial structure , AmericanEconomic Review, vol. 88, No. 5; pp. 1264-1276.
309
De, P., 2006a. Regional trade in Northeast Asia: Why do trade costs matter? CESifoworking paper No. 1809, CESifo, Munich (Version 3). Previous versions of thispaper also appeared as CNAEC Research Series 06-02, Korea Institute forInternational Economic Policy (KIEP), Seoul (Version 1), and ARTNeT WorkingPaper Series, No. 7, (Version 2). ESCAP, Bangkok.
, 2006b. Trade, infrastructure and transaction costs: The imperatives forAsian economic cooperation , Journal of Economic Integration, vol. 21, No. 4;pp. 708-735.
, 2005. Affect of transaction costs on international integration in the Asian economiccommunity , in Asian Economic Cooperation and Integration: Progress, Prospects,Challenges. Asian Development Bank, Manila.
Deardorff, A., 1998. Determinants of bilateral trade: Does gravity work in a neo-classicalworld? in J. Frankel (ed.), Regionalization of the World Economy. University ofChicago Press, Chicago.
Djankov, S., C. Freund and C.S. Pham, 2006. Trading on time , working paper. WorldBank, Washington, D.C.
ESCAP, 2005. Multilateralizing regionalism: Towards an integrated and outward-orientedAsia-Pacific economic area , paper presented by the Trade and Investment Division,ESCAP, at Delivering on the WTO Round: A High-level Government-BusinessDialogue for Development, Macao, China, 4-6 October 2005.
Feenstra, R.C., 1998. Integration of trade and disintegration in production in the globaleconomy , Journal of Economic Perspectives, vol. 12, No. 4; pp. 31-50.
Fink, C., A. Mattoo and I.C. Neagu, 2002. Trade in international maritime services:How much does policy matter? The World Bank Economic Review, vol. 16;pp. 451-479. Oxford University Press.
Francois, J. and M. Manchin, 2006. Institutional Quality, Infrastructure, and the Propensityto Export. Centre for Economic Policy Research, London.
Francois, J. et al., 2005. Trade liberalization in the Doha Development Round , EconomicPolicy, vol. 20, No. 42; pp. 349-391.
Fruchter, B., 1967. Introduction to Factor Analysis. New Delhi, Affiliated East West Press.
Harrigan, J., 1993. OECD imports and trade barriers in 1983 , Journal of InternationalEconomics, vol. 34; pp. 91-111.
Head, K., 2003. Gravity for Beginners (mimeograph). University of British Columbia,Vancouver.
Hummels, D., 2001. Time as trade barrier , working paper. West Lafayette, PurdueUniversity.
, 1999a. Toward a geography of trade costs , working paper. University ofChicago.
310
, 1999b. Have international trade costs declined? Working paper. Chicago,University of Chicago Business School, Chicago.
International Monetary Fund, 2006. Direction of Trade Statistics Year Book 2006(CD-ROM). Washington, D.C.
Limao, N. and A.J. Venables, 2001. Infrastructure, geographical disadvantage, transportcosts, and trade , The World Bank Economic Review, vol. 15; pp. 451-479. OxfordUniversity Press.
Maersk Sealand, 2006. Historical Shipping Rates Database. Available at http://www.maerskline.com.
Nordos, H.K. and R. Piermartini, 2004. Infrastructure and trade , staf f working paperERSD-2004-04, Economic Research and Statistics Division. World TradeOrganization, Geneva.
Obstfeld, M and K. Rogoff, 2000. The six major puzzles in international macroeconomics:Is there a common cause? , in B.S. Bernanke and K. Rogoff (eds.), NBERMacroeconomics Annual 2000; pp. 339-390. The MIT Press, Cambridge,Massachusetts.
OECD, 2003. Quantitative Assessment of the Benefits of Trade Facilitation. Paris.
Redding S. and A.J. Venables, 2004. Economic geography and international inequality ,Journal of International Economics, vol. 62, No. 1; pp. 53-82.
UNCTAD, 2006. Review of Maritime Transport, New York and Geneva.
Wilson, J.S., C.L. Mann and T. Otsuki, 2003. Trade facilitation and economic development:A new approach to quantifying the impact , in The World Bank Economic Review,vol. 17, No. 3; pp. 367-389. Oxford University Press.
World Bank. 2002. The Economic Impact of Trade Facilitation Measures: A DevelopmentPerspective in the Asia Pacific. Washington, D.C.
. 2001. Global Economic Prospects and the Developing Countries 2002: MakingTrade Work for the Poor. Washington, D.C.
World Trade Organisation, 2004. World Trade Report 2004. Geneva. Available at http://www.wto.org.
Yeaple, S. and S.S. Golub, 2002. International Productivity Differences, Infrastructure andComparative Advantage (mimeograph). University of Pennsylvania.

311
X. PRIORITIZING TRADE FACILITATION MEASURES:
A NOTE
By Florian A. Alburo*
Introduction
The progress achieved by the current Negotiating Group on Trade Facilitation(NGTF) as evidenced by the wide participation of WTO members, especially from developingand least developed economies, the constructive coalitions between North and South oncommon trade facilitation issues, and the promises of concrete technical assistance andcapacity-building support, has given the Doha Round a much needed confidence-buildingboost. This has, in turn, led to a view that in the likelihood of the Round s failure, NGTFshould proceed to an agreement on trade facilitation as an exemption from the singleundertaking. While this is a practical recognition of its importance, it remains doubtfulwhether it will actually deliver a sustainable development impact from trade. After all,facilitation and other supply considerations are only half of what is needed to push fora significant contribution of trade to development. Both trade facilitation and marketaccess are essential to its realization. It also remains to be seen whether importantconcerns of developing and least developed WTO members would be addressed in thesame magnitude if trade facilitation proceeds outside of the single undertaking.
The purpose of this note is to argue that despite the surfeit of trade facilitationproposals on the table, even more difficult hurdles need to be overcome to reach a bindingagreement. Even more challenging is the design of measures that the developing andleast developed economies can implement without substantial costs or from which theycan reap significant benefits. This implies that some prioritization of trade facilitationmeasures would be necessary, which could become the basis for concluding a multilateralagreement.
Section A presents a summary of the many trade facilitation proposals received byNGTF, as reported by NGTF to the WTO Ministers and which are found in Annex E of theHong Kong WTO Ministerial Declaration (World Trade Organization, 2005). Section Bbriefly examines the results of some studies in Asia on trade facilitation implementationand the scale of measures that are considered important to trade users and other stakeholders.Section C outlines what is needed in terms of the next steps to move the trade facilitationmeasures into concrete and binding commitments, especially on the part of developingand least developed economies. Section D presents concluding remarks.
* Florian A. Alburo is Professor of Economics at the University of the Philippines and ARTNeTAdvisor on Trade Facilitation. This note, which was prepared for a presentation at the Meeting ofTrade Ministers of Landlocked Developing Countries on International Trade and Trade Facilitation inUlaanbaatar, Mongolia, 28-29 August 2007, benefited from detailed comments by Yann Duval. Theauthor takes sole responsibility for its content.

312
A. Trade facilitation proposals
While not exclusive, the Doha Ministerial Declaration of WTO delineated theboundaries of trade facilitation in terms of Articles V, VIII, and X of GATT 1994 (WorldTrade Organization, 2001). Article X is related to Publication and Administration ofTrade Regulations, Article VIII to Fees and Formalities Connected with Imports and Exports,and Article V to Freedom of Transit. The WTO members were asked to look at thesespecific articles with regard to their review, clarification and improvement and to ...identifytrade facilitation needs and priorities of members, in particular developing and leastdeveloped countries. We commit ourselves to ensuring adequate technical assistanceand capacity-building support in this area... (paragraph 27). The subsequent JulyPackage of the Doha Work Programme (see World Trade Organization, 2004.) specifiedthe various modalities for the trade facilitation negotiations (Annex D).
In all, more than 150 proposals have been submitted to NGTF in relation to thethree Articles, with more than one-fourth incrementally added since the Hong Kong MinisterialMeeting of WTO in 2005 (World Trade Organization, 2007). In the comprehensive NGTFreport, the summary of the proposals lists more than 60 proposed measures under13 categories that follow the three Articles mandated in the July Package modalities. Ofthe 13, six groups of measures clarify and improve Article X, another six groups deal withArticle VIII and only one group deals with Article V.
Table 1. Proposed trade facilitation measures
ArticleCategories Measures
(number) (number)
Article V: Freedom of Transit 1 18
Article VIII: Fees and Formalities 6 26Connected with Imports and Exports
Article X: Publication and 6 20Administration of Trade Regulations
Source: World Trade Organization, 2005, Hong Kong Ministerial DeclarationAnnex E.
Table 1, which shows the proposed trade facilitation measures submitted to NGTF,does not really yield adequate information about the substance of the potential commitmentsthat countries can give in any agreement. The specific measure has to be examinedinstead of the broad article being further clarified. There are some commonalities generallyacross all Articles, but especially between Articles VIII and X. For example, many of themeasures under Article V are related to fees and charges as well as the publication ofregulations surrounding goods in transit, which come under Articles VIII and X.
A close review of the proposed trade facilitation measures elicits several observationsthat suggest the need for a larger agenda.

313
First, of the 64 proposed measures summarized by NGTF for the Hong Kong WTOMinisterial Declaration no more than 15 are direct proposals for the use of informationtechnology (IT). Even these are not purely IT, but the use of electronic formats forpublication and distribution of forms and public notices.1 What developed, developing andleast developed WTO member countries are pointing to is the extensive informationdissemination of rules, procedures, requirements and other documentary materials necessaryfor trade transactions. These measures are more fundamental to greater transparencyand a predictable business and trade environment than the barriers and bottlenecks to themovement of goods themselves.
Second, some of the measures are clearly linked to other multilateral agreementsin GATT 1994. Difficulties in carrying out customs valuation, for example, suggest furtherclarification and improvements despite a separate article on the understanding of customsvaluation. Measures to clarify the agreement on import licensing in the context ofArticles VIII and X also affect trade facilitation. Therefore, the scope of trade facilitation,as delineated in the mandate, is quite inadequate, limited and GATT-centred. It is, ofcourse, true that, based on the number of proposals alone and with the focus on the threeGATT 1994 Articles, there is already a great deal on the plate. Yet, trade facilitation isslowly being understood to cover measures at the border and behind the border, and evenbefore the border. Confining the scope to the negotiations may be essential but it isimportant to recognize that compartmentalization equally diminishes the totality of tradefacilitation. Indeed, this broader realization could often lead to expanded agreements andcommitments.
Third, with the large number of proposals on trade facilitation, there do not appearto be overly high expectations of capacities beyond what the developing and least developedeconomies can muster. Those proposals by the developing and least developed membersappear to be within their means; if they are not, special and differential provisions areinvoked through delayed implementation, or the measures are not required if these arebeyond existing capacities, with notifications to be given to WTO upon the acquisition ofcapacities to carry out the measures. Therefore, the fear among those countries that theywould be required to undertake obligations beyond their means is turning out to be unfounded,since even those measures that encompass automation and other forms of IT applicationsare only a small fraction of the many measures that have been proposed.
Fourth, the proposed trade facilitation measures do not indicate any scale of prioritiesand needs among developing and least developed economies. Each of the proposalssubmitted has not been tagged in terms of importance or ranking in facilitating tradeamong WTO members. However, it is possible to imply priorities by the number ofmeasures proposed according to some criteria (e.g., Articles V, VIII and X). What can beobserved from the report found in Annex E of the WTO Hong Kong Ministerial Declarationis that many proposals pertain to increasing the transparency of rules, procedures andrequirements for trade transactions through wider dissemination, the publication of existing
1 This particularly refers to the use of the Internet through the creation of websites that containinformation in electronic formats.
314
rules and, in other measures, the further specification of these as additional ways ofenhancing the movement of goods. Publication and dissemination suggests that theirposting on the Internet would be a widely accessible manner of ensuring availability ofinformation for traders inside and outside the countries concerned. Simple informationsuch as flow charts of procedures should be posted in public places in order to guidethose interested in moving goods across borders. However, at many borders such informationindicating procedural steps and the necessary requirements as well as the time taken foreach step is still seldom available or even accessible.
Finally, apart from the lack of prioritization, the proposed trade facilitation measureshave yet to be transformed into operational legally-binding commitments on the part of allWTO members to a trade facilitation agreement. This requires that negotiated agreementsshould be sufficiently clear and unambiguous, so that members can bring specific instancesof violations to the dispute settlement mechanism of WTO. This would include even thecommitments of technical assistance and capacity-building agreed on by developed members.This requires compressing the proposed trade facilitation measures into those that bindmembers, given the potential costs and benefits. Thus, the identification of the needs andpriorities in trade facilitation is a useful first step. What is implied by the proposed tradefacilitation measures must be validated by the expressed preferences and priorities oftraders and other stakeholders in the developing countries and LDCs. This is where theresults of independent studies become relevant. While the more careful text-basedthird-generation proposals appear to be geared towards an eventual language of an
agreement, which in turn may lead to a consensus, there is really no prioritization (impliedor actual) as yet. In fact, these are just elaborations and refinements of the originalproposed measures.2
B. Trade facilitation priorities of traders and stakeholders
In a series of research studies and surveys of the private sector in severalcountries in Asia (Bangladesh, China, India, Indonesia and Nepal) under the auspicesof ESCAP-ARTNeT, the state of implementation of trade facilitation measures centredaround the three GATT 1994 Articles was reviewed, with attempts to determine the costsof some of the measures. The private sector was asked to rank the important barriers tothe efficient movement of goods (Bhattacharya and Hossain, 2006; Damuri, 2006;Rajkarnikar and others, 2006; Chaturvedi, 2006; Wenjing and Wei, 2006). OECD haslikewise completed several country studies related to the costs of implementing tradefacilitation measures (Mo s , 2004).
The results from those private sector surveys in some of the Asian countriesrevealed similar concerns, ranked comparable priorities and suggested common directionsamong trade stakeholders (see the summary of the country surveys in Duval, 2006b). The
2 There is no indication in TN/TF/W/43/Rev. 12, 25 July 2007 (World Trade Organization, 2007) thatthere are already priorities in the proposed measures encompassing the third-generation proposals.See also SITPRO, 2007.

315
leading concern (and priority) expressed in the surveys was the irregular payments thathad to be made for the clearance and release of goods, a euphemism for bribes to officialsfor the facilitation of goods movement. The need for good governance in the bureaucracyis the overall meaning of this concern. Next among the concerns were coordinationamong government agencies having border responsibilities in terms of issuing licencesand permits for trade (import or export), the lack of a one-stop centre for submission andsecuring of necessary documentation; and the timely publication and dissemination oftrade rules and requirements. The remaining concerns covered computerization andautomation of trade clearance and procedures among responsible agencies, harmonizationand standardization of documents, and the simplification and reduction of these requirementsin the export and import process. The Asian studies/surveys show that the first threeconcerns (and priorities) are similar among the five countries concerned while the last twomay show wider variation across the surveys.
The relevant question is whether trade facilitation measures (proposed or implemented)exist that address these concerns (and priorities). Take the top-most concern regardingirregular payments for the clearance and release of goods. Aside from being a nationalissue, there are really no standards, no best practices and no benchmarks to addressgovernance. One (if not the only) way to apply a measure here is to understand thepossible causes of its underlying failure. While this would open a whole coterie of hypothesesand explanations (e.g., low salaries of bureaucrats in developing countries), an importantfactor is the lack of information about what is needed to complete a trade transaction. Putdifferently, when information is privately appropriated instead of being publicly available, itinvites irregular payments. That is why the other concerns (and priorities) expressed inthe survey impinge on this leading concern.
Consider the next two important concerns that roughly pertain to informationdissemination, publication, and wider circulation of procedures, processes and otherrequirements for trade. Relevant measures exist in the countries studied, although withprovisions for varying degrees of enforcement. Several of the proposals further clarify andexpand them, and these interact to reduce irregular payments. Annex E of the Hong KongMinisterial Declaration includes proposals not only related to publishing payments of feesand charges but also for a measure for not paying when such fees and charges are not
indicated (G of Annex E ...prohibition of collection of unpublished fees and charges... ).
When the implied priorities of the various proposed trade facilitation measures arecompared to the priorities and concerns expressed in the country studies, a tight fit can beobserved.3 This is particularly true with regard to the importance attached to information
3 This is not to say that the scope of trade facilitation is adequate. As noted by Duval in chapter I ofthis publication, the priority problematic areas in conducting trade that were identified in the surveysextend beyond Articles V, VIII, and X. A policy-wide set of issues needs to be addressed. Tariffclassification problems arise, for example, when many tariff bands exist with varying rates, international(harmonized systems) standards are not followed and testing facilities for product specifications areinadequate. On the other hand, customs valuation problems arise when insufficient training on theappropriate valuation steps to follow is provided for customs officials.

316
accessibility, dissemination and wider publication of trade rules, procedures, documentaryrequirements etc. Indeed, the survey results across several countries validated what hadbeen submitted by the WTO members as important measures to facilitate trade.
What has not been easy to determine is the cost of undertaking the various tradefacilitation measures. An alternative followed was a qualitative measure of costs andbenefits of trade facilitation through an expert survey (Duval, 2006a). The idea was totake the broad classification of measures in the three GATT 1994 Articles and then arriveat what experts considered to be the associated benefits and costs. This can providea reference point for examining implementation options for trade facilitation measures.
C. From measures to binding commitments and agreement
The consistency between the proposed trade facilitation measures and the concernsand priorities expressed by stakeholders is an important first step in transforming theminto actual components of a potential trade facilitation agreement. The convergent importanceof groups of measures from among many becomes another step in the determination ofwhat will comprise such an agreement. In addition, the specification of measures intoactionable language contributes to agreement and compliance. It is unlikely that incorporatingall the more than 150 measures into a multilateral agreement would be acceptable orenforceable. Scaling them to a third may be feasible but it is equally doubtful that WTOmembers will accept them. What may be more useful is to focus on some generalprinciples and a framework that can bear legal obligations.
1. Classifying measures based on implied priority
The scale of measures drawn up from the proposals submitted to NGTF andmerged with concerns and priorities from a larger sample of survey results4 than thatreported here (and from other countries) appear to imply a workable framework. Theproposals to NGTF do not have explicit priorities but their distribution suggests a scale ofimportance. Their fit with priorities from the surveys reinforces the underlying needs. Atthe same time, based on the previous section, principles for information dissemination,wider publication and related activities can be obligations to a trade facilitation agreement.Another tier of trade facilitation measures can be obligated in the form of reduction,simplification, standardization and harmonization of trade documents and procedures(anchored, for example, on the Revised Kyoto Convention). A final tier could be theobligation for computerization and automation of trade procedures following establishedflows. These tiers would define trade facilitation priorities and needs.
4 The five studies through ARTNeT (in Asia) may not provide a sufficient sample of WTO membersfrom which to derive trade facilitation priorities and concerns for comparison with submissions by thewider WTO membership.

317
2. Binding commitments on top tier measures
Trade facilitation obligations can be in tiers that are tied either to the capacity tocarry them out or to some kind of special and differential treatment in terms of a timeschedule for implementation.5 The most basic and fundamental tier includes measuresthat promote transparency and predictability of the trading system. This involves obligationsto disseminate information, publicize rules and regulations, procedures and other traderequirements. Public display and dissemination of procedural flow charts for the entry andexit of goods in all media forms then become a binding commitment of a trade facilitationagreement. The succeeding tier obligations become subject to notification to WTO.
3. Concrete commitment from developed countries on trade
facilitation costs
The concept behind the consideration of trade facilitation costs as part of theobligation in an agreement is not the determination of actual outlays needed, but whethersupport for such costs can become a commitment on the part of the developed membersof WTO as a technical assistance and capacity-building contribution. This could bea separate principle defining criteria for technical assistance and capacity-building. Thiscould also be associated with higher tiers of trade facilitation measures. For example,succeeding tiers beyond basic and fundamental transparency are obligations that go withcommitment of support. Obligations on the part of the developing and least developedmember countries are coupled with obligations on the part of the developed membercountries for technical assistance and capacity-building, and these obligations have to bespecified and notified to WTO.
Obligations and commitments, both in terms of trade facilitation measures andtrade facilitation support, should be capable of being brought before the WTO disputesettlement mechanism for consultations, conciliation, mediation and arbitration regardingviolations. For example, when members are unable to display flow charts of import andexport procedures in the public media they should be held accountable for trade facilitationmeasure violations in the same way as that for second tier trade facilitation measures. Forexample, after their notification of implementation and committed technical assistance andcapacity-building, developed country members can be brought before the dispute settlementbody when such assistance is not forthcoming.
5 Tiering and compression simplify and tighten language, which does not seem to be the direction ofthe third-generation proposals. Indeed the ...third-generation proposals represent a significant advance,but not an agreement, and are not without prejudice to the right of Members to put forward furtherproposals... (SITPRO, 2007, p. 6). Moreover, there are more than 30 of these text-based proposals.
318
D. Conclusion
The many proposed trade facilitation measures point to the need to translate theminto a sufficiently flexible multilateral agreement that binds countries to certain generalprinciples of trade facilitation within their capacities, and which holds developed countrymembers to specific types of support that can be made subject to complaint and disputewith consequences similar to other types of trade commitments. When these trade facilitationmeasures are cast in certain tiers associated with some principles instead of detailingvarious proposals, they can be binding. Provisions for notification in higher-tier tradefacilitation could effectively bind WTO members under the general agreement.
When seen in this context, negotiations on trade facilitation appear to be far fromreaching an agreement. Developing countries and LDCs remain apprehensive aboutobligations beyond their capacities, developed countries continue to be hesitant in committingconcrete assistance, demands for special and differential treatment remain an impedimentand few, if any, countries are expected to announce implementation of trade facilitationmeasures.
However, the main ingredients for a trade facilitation agreement are there - themany collaborative and cooperative proposed measures summarized in Annex E, thescale of associated support, the recognition of limited capacities among developing andleast developed WTO members, and the variety of independent designs and formulationsfor trade facilitation (e.g., the trade facilitation templates noted above). In addition, there isthe general acknowledgment of the importance of trade facilitation to expanding trade,especially among the emerging economies, and of the need of those emerging economiesfor support as they integrate more into the global economy, and achieve developmentgoals and poverty reduction.

319
References
Bhattacharya, D. and S.S. Hossain, 2006. An evaluation of the need and cost of selectedtrade facilitation measures in Bangladesh: Implications for the WTO negotiationson trade facilitation , ARTNeT Working Paper No. 9. ESCAP, Bangkok.
Chaturvedi, S., 2006. Selected trade facilitation measures in India: Implications for theWTO negotiations , ARTNeT Working Paper No. 4. ESCAP, Bangkok.
Damuri, Y.R., 2006. An evaluation of the need for selected trade facilitation measured inIndonesia: Implications for the WTO negotiations on trade facilitation , ARTNeTWorking Paper No. 10. ESCAP, Bangkok.
Duval, Y., 2006a. Cost and benefits of implementing trade facilitation measures undernegotiations at the WTO: An exploratory survey , ARTNeT Working Paper No. 3.ESCAP, Bangkok.
Duval, Y., 2006b. An exploration of the need for and cost of selected trade facilitationmeasures in Asia-Pacific in the context of WTO negotiations , ARTNeT WorkingPaper No. 14. ESCAP, Bangkok.
Mo s , E., 2004. The cost of introducing and implementing trade facilitation measures:Interim report , OECD Trade Policy Working Paper No. 8, TD/TC/WP(2004)35/FINAL November 2004. Paris.
Rajkarnikar, P.R., N.M. Maskay and S.R. Adhikari, 2006. The need for and cost ofselected trade facilitation measured relevant to the WTO trade facilitation negotiations:A case study of Nepal , ARTNeT Working Paper No. 8. ESCAP, Bangkok.
SITPRO Ltd., 2007. Guide to the WTO Trade Facilitation Negotiations, revised edition,April 2007 (available at http://www.sitpro.org.uk). London.
Wenjing, C. and L. Wei, 2006. An evaluation of the need and cost of selected tradefacilitation measures in China: Implications for the WTO negotiations on tradefacilitation , ARTNeT Working Paper Series No. 5. ESCAP, Bangkok.
World Trade Organization, 2007. WTO negotiations on trade facilitation: Compilation ofmembers textual proposals , TN/TF/W/43/Rev. 12, 25 July 2007. Geneva.
, 2005. Ministerial Declaration, WTO Ministerial Conference Sixth Session,Hong Kong, 13-18 December 2005, WTO/MIN(05)/DEC. Geneva.
, 2004. Doha Work Programme. Decision adopted by the General Council on1 August 2004, WTO/L/579. Geneva.
, 2001. Ministerial Declaration, WTO Ministerial Conference, Fourth Session, Doha,9-14 November 2001, WTO/MIN(01)/DEC/W/1. Geneva.
Printed in Bangkok United Nations publicationJanuary 2008 — 500 Sales No. E.08.II.F.9
Copyright © United Nations 2008ISBN: 978-92-1-120539-8
ST/ESCAP/2466
United NationsE S C A P
United NationsEconomic and Social Commission for Asia and the PacificTrade and Investment DivisionUnited Nations Building, Rajadamnern Nok AvenueBangkok 10200, ThailandTel.: +66 2 2882252Fax: +66 2 2881027E-mail: [email protected]
[email protected] site: http://www.unescap.org/
Related Documents