Trade Facilitation and Trade Flows in Africa Abdoulaye Seck FacultØ des Sciences Economiques et de Gestion UniversitØ Cheikh Anta Diop Dakar, Senegal Email: [email protected] April 13, 2014 Abstract Despite a signicant trade expansion that has been above the world average in the recent period, Africa still remains relatively marginalized in the world trading system. This paper sets out to analyze the extent to which various elements of the trade cost landscape in Africa may have contributed to shape trade patterns both within the continent and with the outside world. Various trade facilitation aspects are aggregated into four main indicators using alterna- tively simple average and factor analysis: border e¢ ciency, physical infrastructure, regulatory environment, information and communication technology, as well as the World Banks Logis- tics Performance Index. These indicators are then related to bilateral trade ows in a gravity framework that accounts for a number of theoretical and empirical issues, and that distinguishes between agricultural and non-agricultural commodity trade and among various trading partners. The results indicate facilitating trade would generate varying trade gains, depending on which of the trade cost landscape, which commodity, which trading partner one considers, and which country in the bilateral trade relationship undertakes the reforms. These results o/er a strong basis for designing targeted trade facilitation reforms that would improve Africas international trade position. JEL Classication Codes: F13, F14. Keywords: Trade facilitation, trade ows, Africa, factor analysis, gravity model. 1 Introduction Over the rst decade of the XXIst century, trade expanded signicantly across Africa. In e/ect, trade volume grew at an annual rate of 5.9 percent, and this increase was well above the world average of 3.8 percent. 1 This trade pattern happened in a general context of relatively strong economic growth of African economies, with an annual rate of 5.0 percent (5.3 percent for Sub- Saharan countries), twice as much as the global economys growth rate, making the continent the second fastest growing region in the world (UNDP, 2013). However, this positive trend had more to do with imports than exports. In e/ect, exports have grown at a lower rate than imports: 5.1 percent against 6.9 percent, suggesting a further worsening of African economiesinternational trade position. Moreover, Africa is still a marginalized region in 1 World Banks World Development Indicators online (the subsequent data are from the same source). 1

Welcome message from author
This document is posted to help you gain knowledge. Please leave a comment to let me know what you think about it! Share it to your friends and learn new things together.
Transcript

Trade Facilitation and Trade Flows in Africa
Abdoulaye SeckFaculté des Sciences Economiques et de Gestion
Université Cheikh Anta DiopDakar, Senegal
Email: [email protected]
April 13, 2014
Abstract
Despite a significant trade expansion that has been above the world average in the recentperiod, Africa still remains relatively marginalized in the world trading system. This papersets out to analyze the extent to which various elements of the trade cost landscape in Africamay have contributed to shape trade patterns both within the continent and with the outsideworld. Various trade facilitation aspects are aggregated into four main indicators using alterna-tively simple average and factor analysis: border effi ciency, physical infrastructure, regulatoryenvironment, information and communication technology, as well as the World Bank’s Logis-tics Performance Index. These indicators are then related to bilateral trade flows in a gravityframework that accounts for a number of theoretical and empirical issues, and that distinguishesbetween agricultural and non-agricultural commodity trade and among various trading partners.The results indicate facilitating trade would generate varying trade gains, depending on whichof the trade cost landscape, which commodity, which trading partner one considers, and whichcountry in the bilateral trade relationship undertakes the reforms. These results offer a strongbasis for designing targeted trade facilitation reforms that would improve Africa’s internationaltrade position.
JEL Classification Codes: F13, F14.Keywords: Trade facilitation, trade flows, Africa, factor analysis, gravity model.
1 Introduction
Over the first decade of the XXIst century, trade expanded significantly across Africa. In effect,trade volume grew at an annual rate of 5.9 percent, and this increase was well above the worldaverage of 3.8 percent.1 This trade pattern happened in a general context of relatively strongeconomic growth of African economies, with an annual rate of 5.0 percent (5.3 percent for Sub-Saharan countries), twice as much as the global economy’s growth rate, making the continent thesecond fastest growing region in the world (UNDP, 2013).
However, this positive trend had more to do with imports than exports. In effect, exports havegrown at a lower rate than imports: 5.1 percent against 6.9 percent, suggesting a further worseningof African economies’international trade position. Moreover, Africa is still a marginalized region in
1World Bank’s World Development Indicators online (the subsequent data are from the same source).
1

the world trading system, with a meager 2.8 percent share of the global trade volume in 2010 (1.9percent for Sub-Saharan economies). It would certainly take a far greater pace of trade expansionfor the continent to become a major player in the global trade arena and reap the economic growthbenefits associated with international trade.2
Major trade reforms have been successfully implemented all over Africa. They range from tradeliberalization to regional integration and other bilateral and multilateral trade agreements. As aresult, tariffs have been at all-time low, in line with a world trend. But these reforms often fallshort of addressing the myriad of non-tariff barriers that often have more devastating effects ontrade than actual tariffs. In effect, Africa is still the place where importers and exporters face fargreater hurdles than anywhere else. For instance, it takes on average more time to ship a containerfrom Africa to the rest of the world (31 days) or from the outside world to Africa (38 days) thanany other region in the world.3 In addition, over the course of trading across African borders,it is required far greater number of documents: 8 when exporting and 9 when importing. As aconsequence, the average cost of flowing goods across borders is larger in Africa: US$2,108 to shipa container outside the average African country, and US$2,793 to send a container in the oppositedirection (respectively 2.5 and 3.2 times as much as it costs to trade in East Asia and the Pacific).The same pattern shows in the World Banks’Logistics Performance Index: overall, the continentscored 2.47 out of 5 in 2014, which is again below the world average (excluding Africa) of 3.07,and this is a slight worsening compared to the 2012’s score of 2.48.4 All of these impediments spellhigher trade costs in Africa (Arvis et al., 2013), and the resulting higher prices tend to discourageboth imports and exports, further harming African economies’international competitiveness.
There is a relatively strong belief that reforms aiming at facilitating trade could reduce tradetransaction costs and bring significant economic gains. Trade facilitation refers to the "simplificationand harmonization of international trade procedures", or more specifically, to the "activities, prac-tices and formalities involved in collecting, presenting, communicating and processing data requiredfor the movement of goods in international trade".5 More broadly, trade facilitation encompasses"measures aimed at streamlining trade procedures and reducing the cost and uncertainties of in-ternational trade transactions" (UNESCAP, 2011). In addition to traditional issues surroundingcustoms procedures, transit time and logistics, facilitating trade involves broader aspects related totransport infrastructure, business practices, telecommunications, regulatory environment and evenorganized crime (Moïsé, 2013; Clark et al., 2002).
The existing economic literature on trade facilitation is based on the notion of trade transactioncosts, and measures that successfully reduce these costs tend to generate significant trade benefitsto the country. For instance, Hummels and Schaur (2013) find that each day in transit generatesan additional trade cost similar to an ad-valorem tariff of 0.6 to 2.1 percent (see also Djankov etal., 2010). Arvis et al. (2013) suggest that the combined effect of maritime transport connectivityand logistics can even be as high as that of geographical distance. Lesser and Moïsé-Leeman (2009)show that trade facilitation measures aiming at overcoming border bottlenecks can significantlyreduce informal cross-border trade in Sub-Saharan Africa.
At a micro-level, trade facilitation is found to increase firms’performance. For instance, as aresult of falling trade costs, industries enjoy relatively strong productivity growth, non-exporting
2Some of the gains include foreign technology acquisition and increased productivity (see, for instance, Seck, 2012).3World Bank’s Ease of Doing Business (http://www.doingbusiness.org/data). Accessed in December 2013.4See http://lpi.worldbank.org/ for more details (accessed in April 2014).5World Trade Organization, cited by Portugal-Perez and Wilson (2010, p. 2), and Moïsé (2013, p. 7).
2

firms are very likely to start exporting, and existing exporters increase their trade volume (seeBernard et al., 2006). Furthermore, lowering trade costs has an important resource re-allocationeffect: it improves the effi ciency of an industry by both increasing the likelihood that ineffi cientproducers exit the industry, and allowing effi cient ones to expand and export more (Blyde andIberti, 2010).
But trade facilitation involves various components, and their impacts on trade are very differentdepending on the traded goods, trade routes, modes of transports, and trading partners. Adding tothe complexity, while some measures are very costly to implement, others require greater operatingcosts. All of these call for a detailed analysis of how country specifics contribute to shape theeffectiveness of any trade facilitation reform. More specifically, such analysis should answer thefollowing questions: Which trade facilitation measures have greater trade potential in the specificcontext of African economies? Which economic sector is more likely to benefit the most from tradefacilitation? Which trading partners are more responsive to trade facilitation measures?
A clear assessment of the ineffi ciency costs of various elements that influence the cross-bordermovement of goods can offer a formal basis for a good understanding of the economic importanceand relevance of trade facilitation measures. It will also feed into the momentum sparked by therecent success of the World Trade Organization’s negotiations over trade facilitation and furtherstrengthen the political will for reforms. The results can also help in the prioritization of tradefacilitation actions, in the face of overstretched government budgets in Africa. By contributingtowards increasing Africa’s trade potential, successful trade facilitation reforms can ultimatelyreduce the continent’s relative marginalization in the world trading system.
The paper sets out to assess the benefits that would result from greater facilitation of trade inAfrica. More specifically, it discusses how the different components of trade costs impede Africancountries’trade performance, and how removing such hurdles could boost African trade on variousproducts both within the continent and with the rest of the world.
The three-part empirical approach first deals with constructing four aggregate indicators of tradefacilitation: physical infrastructure, border effi ciency, regulatory environment, and e-business. TheWorld Bank’s Logistics Performance Index is also considered. Two alternative weighting schemesare considered: equal weights and factor loadings from factor analysis. Second, these measures arerelated to bilateral trade flows within a gravity model. Additional explanatory variables includesadd-valorem tariffs, and the traditional variables such as distance. Third, comparing the resultsallows one to simulate the gains from trade facilitation as a distance-reduction equivalent or anad-valorem-tariff equivalent.
The results based on 105 countries (with 19 from Africa) and two years (2012 and 210) clearlyindicate that trade facilitation measures have varying effects on African countries’exports. Theextent to which they affect trade depends on the type of measures, the export destinations (Africa orthe rest of the world), the commodities being traded (agricultural versus non-agricultural products),and the country at the end of the bilateral trade relationship which costs are accounted for (exporteror importer). For instance, the results show that if trade reforms targeting physical infrastructureof the like of ports or airports were to raise the average African country to the world best performingstandard, then trade would increase by 6.8 to 15.1 percent. This amounts to getting the countrycloser to its trading partners by 125.9 to 570.5 km, depending on whether the reforms were tobe undertaken by the importing or exporting country and whether intra-African trade or tradewith the outside world is considered. These results appear to be more driven by non-agriculturalcommodities, agricultural ones being more responsive to measures related to ICT usage, especially
3
in the exporting countries. Other trade cost measures such as border effi ciency (number of requireddocuments), regulatory environment, and LPI also appear to have shaped in various ways Africa’strade patterns.
The remainder of the paper is organized as follows: section 2 offers some insights from theliterature, section 3 details the methodology, section 4 describes the data, section 5 presents anddiscusses the results, and section 6 offers some concluding remarks.
2 Literature review
Thanks to various international organizations that have recently been collecting survey data onvarious aspects of trade facilitation at a country level, there has been a renewed interest in measuringtheir impacts on trade. A typical empirical research starts by aggregating the myriad of indicatorsinto broad measures of trade facilitation, and then tests their explanatory ability of observed tradepatterns. What emerges from the large body of empirical literature is that these measures aresignificant components of trade costs; an improvement in the trade environment generates increasedtrade flows; the extent of these gains are different across trade facilitation measures, products, andtrading partners, rendering the effectiveness of any trade facilitation reforms very dependent uponcountry specifics. Maur and Wilson (2010) provide an extensive survey of the literature.
A historical perspective of world trade dynamics indicates that trade costs have declined sig-nificantly over the past century and a half, although not at a regular pace. Over that period, thedynamics of trade flows have been intimately related to the evolution of trade costs. For instance,Jacks et al. (2008) suggest a strong correlation between trade booms and trade busts on one hand,and trade costs on the other. The authors indicate that rapid expansion of world trade from 1870to 1913 and then in the post-World War II period owes greatly to trade costs declines. In effect,the latter explain roughly 55 percent of trade boom in the first period, and 33 percent in the secondperiod. On the other hand, the retreat of world trade from 1921 to 1939 is found to be stronglyrelated to a precipitous rise in trade costs. This contribution of the costs of international trade tothe evolution of trade flows appears to be larger than that of the growth of global output. Hummels(2007) also suggests that the significant rise in speed of international has more to do with fallingtrade costs, specifically transport costs (air and ocean shipping).
A disaggregation of these global patterns of trade costs and trade flows reveals significantcross-country differences. For instance, Arvis et al. (2013) provide evidence that trade costs aredeclining with income per capita: developed countries are experiencing faster decline in trade coststhan developing countries. In countries such as those in Sub-Saharan Africa, maritime transportconnectivity and logistics performance are found to be very important determinants of bilateraltrade costs, and their combined effects are comparable to that of geographical distance. Thissuggests that trade facilitation reforms could reduce Africa’s isolation in the world trading systemand provide the continent with significant economic gains.
Hummels and Schaur (2013) for instance suggest that reducing transit time by one day can boosttrade at a magnitude equivalent to that of a reduction in ad-valorem tariff by 0.6 to 2.1 percent.These results are consistent with many findings in the literature that view time as a trade barrier(Nordås et al., 2006). In line with these findings, gains from reforms aiming at cutting lengthy tradeprocesses will have differentiated effects across traded goods. Increasingly time-sensitive goods ofthe likes of those involved in a global value chain (parts and components) or agricultural productsare found to be more responsive to measures that shorten trade time.
4
Reducing the time it takes to ship a container involves not only improving the quality of tradeinfrastructure, but also streamlining the export and import processes with the use of new technolo-gies, as well as improving the regulatory environment. Iwanow and Kirkpatrick (2009) for instancesuggest that the low performance of the African manufacturing sector in exports markets is mainlyattributable to poor infrastructure and unfriendly institutional environment. Their results basedon a gravity model indicate that trade facilitation could unlock Africa’s trade potential on manu-facturing goods. These reforms should improve the quality of the regulatory environment and thequality of the basic transport and communication infrastructure.
Portugal-Perez and Wilson (2010) provide further evidence that trade facilitation also mattersfor Africa both today and in the long run, where trade costs are found to be higher than in anyother region in the world. Their gravity-model estimates clearly indicate that trade facilitationmeasures could yield increased trade flows, more so than substantially cutting tariffs. One specificexample is that improving logistics in Ethiopia to the extent of one standard deviation is equivalentto 7.6-percent decrease in ad-valorem tariff.
A move towards paperless commerce is also found to stimulate trade, mostly through a reductionof market-specific sunk costs of exporting. For instance, Freund and Weinhold (2000) show from agravity model that over the period 1998-1999, a ten-percent increase in the number of web hosts isassociated with a one-percent rise in trade flows. These gains are found to be larger in developingcountries than in developed ones. But there seems to be little supporting evidence that Internetusage has reduced the impact of geographical distance on trade. In the same vein, Fink et al.(2005) also indicate that bilateral communication costs, measured by per-minute calling prices,have a significant influence on bilateral trade flows both in the aggregate and across sectors.
There is also strong empirical evidence that trade facilitation can have a positive impact on firmsperformance. The recent heterogeneous-firm models of international trade have provided theoreticalfoundations that linked trade costs to firms’productivity and export performance. For instance, astrade costs decline, productivity increases both within plants and at the industry level (Bernard etal., 2006). In addition, exports appear to be strongly correlated with productivity, either through alearning-by-exporting process by which greater interactions with highly effi cient foreign firms leadsto more productivity gains, or through a self-selection channel by which more productive firms aremore likely to enter export markets. Similar findings are also true for African manufacturing plants.Van Biesebroeck (2005) for instance shows that exporters increase their productivity advantage afterentry into export markets, providing support to the selection hypothesis. Clarke (2005) suggeststhat the main reasons why African manufacturers do not export have greatly to do with restrictivetrade and customs regulation as well as poor customs administration. All of these suggest thatAfrican firms could greatly benefit from trade facilitation, and the aggregate benefits could translateinto an improvement in the continent’s international trade position.
3 Methodology
In assessing the impact of trade facilitation on trade flows, the first step consists of constructingaggregate indicators. Next, a gravity model of trade follows is developed and augmented with thesetrade facilitation measures. Finally, the estimation results will be used to simulate how countryspecifics shape the extent of the gains from any trade facilitation reform.
5

3.1 Constructing aggregate trade facilitation indicators
The literature has suggested various indicators that capture the quality of the environment in whichcross border trading takes place. These measures aggregate different elements that determine theextent to which the environment is conducive to trade performance (see Francois and Manchin,2013; Portugal-Perez and Wilson, 2010; Wilson et al., 2005; Wilson et al., 2003; among others).Following most of the literature, we consider four broad trade facilitation indicators:
(1) Physical infrastructure: it tells about the quality of ports, airports, road, and railroadinfrastructure. The existence of such trade infrastructure determines to a greater extent the verypossibility for a to engage in trade with foreign partners;
(2) Border effi ciency: it aims at measuring the effi ciency of the customs formalities throughwhich importers and exporters have to go. It relates to the number of required documents, thetime it takes to clear the customs, and eventually the dollar costs.
(3) Regulatory environment: it relates to the transparency and predictability of public policies,in particular trade policies. These are of particular importance to traders in the sense that theyprovide clear information regarding trade procedures and reduce the level of uncertainty and risk.
(4) E-business: this measure indicates the extent to which the use of information and commu-nication technology (ICT) improves paperless trade and effi ciency on one hand, and reduces tradetransaction costs on the other.
The specific inputs that enter the construction of each trade facilitation indicator are collectedby yearly surveys, the mostly used in the literature being the World Economic Forum’s WorldCompetitiveness Report (WCR) and the World Bank’s Ease of Doing Business (EDB). Table 1shows the aggregate indicators and their input elements.
Table 1: Trade facilitation indicators, input elements, and data sources.Aggregate indicators / Inputs SourcePhysical infrastructure indicatorQuality of ports infrastructure WCRQuality of airports infrastructure WCRQuality of roads infrastructure WCRQuality of railroad infrastructure WCR
Border effi ciency indicatorNumber of documents required to export EDBNumber of documents required to import EDB
Regulatory environment indicatorTransparency of government policy-making WCRPublic trust in politicians WCRIrregular payments and bribes WCRFavoritism in decisions of government offi cials WCR
E-business indicatorAvailability of latest technologies WCRInternet usage WCRFirm-level technology absorption WCRInternet bandwidth WCR
6

Additional information regarding the trade environment is offered by the World Bank’s Logis-tics Performance Index (LPI). It measures "the on-the-ground effi ciency of trade supply chains, orlogistics performance". It encompasses various elements ranging from customs, infrastructure, in-ternational shipment, logistics quality and competence, tracking and tracing, as well as timeliness.6
Turkson (2011) indicated that this indicator is a good indicator of bilateral export performance indeveloping countries. To the extent that the degree of colinearity with the above indicators allows,this can be used to measure the impact of trade facilitation on trade performance.
Various approaches to aggregating the individual aspects of the trade environment into grossmeasures have been used in the empirical literature. As a first approximation, we will use thesimple average. Averaging over these different aspects is the simplest one, be it arithmetically orgeometrically. It is used for instance by Wilson et al. (2005). This approach arbitrary assigns equalweight to each input element, thereby suggesting that an improvement along any input dimensionwould yield equal trade gains. Such a hypothesis might be valid if there is a one-unit correlationamong the individual inputs, which is not always the case.
Alternative approaches involve factor analysis and principal component analysis. Through ananalytically-generated weighing scheme, both approaches extract the joint information embodied ina larger set of correlated, observed variables (say, the number of documents required to trade andthe number of days), and then summarize it into a smaller set of unobserved or latent variables (sayborder effi ciency), called factors or components. In generating the synthetic indicator, principalcomponent analysis uses statistical procedure to generate the weights, while factor analysis isbased on a regression analysis. More specifically, factor analysis estimates the contribution ofthe unobserved factor to the realization of each observed variable. The estimations provide thecorrelation coeffi cients called factor loadings, as well as the predicted common factor. The greaterthe factor loadings, the more the contribution of the observed variable into the aggregate syntheticmeasure. Such an approach is used for instance by Portugal-Perez and Wilson (2010) to generatetrade facilitation indicators which are then related to trade flows in a gravity framework. We followsuit in this study.
There is a clear advantage of factor loadings over equal weights. When using aggregate measure,such as physical infrastructure indicator, a favorable coeffi cient estimate would lead to policy recom-mendation of the like of: "governments need to facilitate trade by improving trade infrastructure".When using equal weights, such a recommendation would fail to tell which component element ofthe physical infrastructure government efforts should be directed to (seaport, airport, road, or rail-road). Factor loadings, instead, indicate which element contributes the most into the unobservedmechanism, thereby revealing a clear policy target. For the sake of robustness check though, bothequal weights and factors loadings will be considered.
3.2 The gravity model
The gravity model has become a very popular approach to modelling the relationship between tradeand geography. More specifically, bilateral trade flows are related to market size (GCP or GDPper capita) and distance to account for intra-industry trade effects that arise between countrieswith similar size but different tastes (Wilson et al., 2005). Different elements that enter trade costsare also added to the basic formulation. They comprise tariff barriers, trade agreements, currencyunion, contiguity, landlocked, language/ethnic similarities, colonial heritage, etc. For the purpose
6World Bank, 2014: "Connecting to Compete: Trade Logistics in the Global Economy", 4th edition (page v).
7

of this study, we include trade facilitation measures to further address country heterogeneity. Thefollowing basic specification of the gravity model is considered:
yijt = β0 +
K∑k=1
βkzkijt + εijt (1)
where yijt represents the value of exports from country i to country j in year t, zijt the gravityvariables, and εijt an error term.
Some common issues need to be addressed in order to obtain reliable coeffi cient estimates. Onthe theoretical ground, various works have suggested that structural elements be included in themodel to better account for the real patterns of international trade. These elements include theheterogeneity of traded goods along many dimensions, especially quality and origins, and pricedifferentials of similar goods that are associated with border effects and transport costs (see forinstance Anderson, 1979; Balistreri and Hillberry, 2001; Anderson and van Wincoop, 2003).
On the empirical side, Egger and Pfaffermayr (2003) suggest that these various sources ofheterogeneity are translated into a misspecification of the intercept term. A correction strategyconsists of making the latter vary across trading partners and over time to fully capture unobservablebilateral trade flows (see also Cheng and Wall, 2004; Wilson et al., 2013). More specifically, thefollowing specification of the error term is considered:
εijt = βi + βj + βij + γt + νijt
where βi and βj denote country fixed effects that capture unobservable differences in productquality and domestic policies in importing and exporting countries, βij relates to the pair-wiseunobservable trade characteristics, γt a time specific fixed effect, and νijt a zero-mean, normally-distributed random error.
The general specification of the model that accounts for all of these theoretical and empiricaldevelopments is as follows:
lnXijt = β0 + βi + βj + γt + β1 ln(GDPpcit) + β2 ln(GDPpcjt) + β3 lnDSTij
+β4TFIit + β5TFIjt + β6 ln(1 + TARIFFijt) +K∑k=7
βkzkijt + νijt (2)
where lnXijt is the natural logarithm of exports of country i to country j in year t, GDPpcdenotes GDP per capita, DSTij the distance between capital cities of countries i and j, TFItrade facilitation indicators in importing and exporting countries, TARIFFijt the ad-valorem tariffrate applied by j to products from i, and zk the standard trade impeding or enhancing variables(contiguity, language, colonial ties, free trade agreements, currency union, landlocked, etc.).
3.3 Estimation strategies
We consider the regular pooled OLS estimator in a panel data setting, controlling for reporter-,partner-, and pair-wise specific effects, and eventually correcting for any non-spherical disturbance.This estimation strategy is used in conjunction with a specific way of dealing with zero-trade. Somecountries do not trade with each other, and as such, the log operator does not apply. A common
8

solution, which is considered here, consists of replacing these zeroes by a very small positive tradeflow (say, 0.01).
Because trade patterns may be different from one product to another, and from one partner toanother, we will consider different sets of estimations. First, the model will be estimated using thefull sample in order to get the average effects of trade facilitation measures. Next, we estimate themodel separately for agriculture products and manufacturing goods. Finally, we split the sampleand estimate the model for two groups of countries: African exporters and importers, and Africavis-a-vis the rest of the world. This will reveal whether trade facilitation will benefit more intra-African trade than trade with the outside world.
An interesting way to put the effect of various trade costs into perspective is to get the stan-dardized coeffi cients, also known as the "beta" coeffi cients. This will help compare the magnitudeof the contribution of each explanatory variable relative to a benchmark variable. For instance, wecan express the cost element that is targeted by trade facilitation into a distance equivalence usingthe distance variable as a reference: delaying imports or export by one day will be equivalent toincreasing the geographical distance between a given country and its average trading partner by agiven number of kilometers.
The results can also be used to simulate the conditional gains that would result from tradefacilitation reforms. It is very likely that depending on the countries’trade profile, an improvementin a given element of trade costs will have differentiated effects. The results will tell about theadditional amount of trade flows that a given country would gain were it to raise the quality of itstrade infrastructure to the level of the best performing country.
4 Data
Table 2 shows some descriptive statistics of the data. Africa’s trade profile positions the continentbelow the world average. In effect, total exports of the average African economy represent 24.4percent of its GDP, compared to 35.0 percent for the average country of the outside world. Indicativeof a relatively heavy reliance on primary activities, agricultural commodities accounts for a largerpart of total exports in Africa than the rest of the world, by a factor of 4.3. As a further indicationof Africa’s relative marginalization in the world trading system, the continent accounts for only 2.3percent of the world commodity exports, and a higher proportion of its trade (29.1) remains withinthe continent. Again, due to the relatively larger importance of the agricultural sector in a typicalAfrican economy, the latter commands a relatively higher share in world trade on agriculturalcommodities, and consequently a lower share in within-Africa trade.
In line with this trade profile, Africa also under-performs as far as the trade cost landscape isconcerned. In effect, when it comes to any of the trade facilitation aggregate measures (constructedby using either simple average or factor analysis), or any of their input elements, the averageAfrican country is consistently below the average non-African country. Due to the low quality ofthe physical infrastructure, cross-border trade in and with Africa faces greater hurdles than theaverage place outside the continent. The same is true when it comes to border effi ciency, theregulatory environment, the incidence of ICT, as well as the various component elements of thetrading environment captured by the Logistics Performance Index, such as customs, infrastructure,international shipments, tracking and tracing.
Adding to this quite unfavorable set of patterns, trade barriers such as tariffs are still relativelyimportant in Africa, indicating that the continent is lagging behind a world trend towards their
9

reduction. In effect, ad-valorem tariffs on commodities are almost twice as much in Africa comparedwith the outside world. The difference is more important for agricultural commodities, with theaverage ad-valorem tariff rate in Africa representing more than 2.3 times of that in the averagecountry outside the continent. In addition, while trade on agricultural commodities appears to bemore constrained by tariffs than other manufacturing goods for example, the difference is againmore pronounced in Africa, on average: 40.0 percent against 4.1 percent.
Furthermore, African trade scope tends to be slightly less wide, when it comes to distance. Theaverage distance between an African economy and a trading partner is 7391.8 km, against 7421.8km for a typical country outside the continent. More revealing of the lower trade performance, thetypical African exporter appears to be less able to overcome the distance barrier to trade: whenaccounting only for destination countries actually reached by African exports, the average distanceis reduced by 9.0 percent, against only 1.0 percent for the average non-African country. Agriculturalcommodities appear to travel farther: while African trade still remains below the average distancewith respect to the whole world, that of its outside counterpart goes 3.4 percent farther.
Table 2. Summary statisticsVariables Africa World (excluding Africa)TradeAll commodities (%GDP) 24.37 34.97African share (%) 29.12 2.29Agriculture (% all commodities) 1.02 0.24African share (%) 18.58 17.95
Trade facilitation indicatorsPhysical infrastructure 3.14 (3.26) 3.98 (3.94)Border effi ciency 7.79 (7.79) 5.58 (5.58)Regulatory environment 2.98 (3.00) 3.50 (3.52)E-business (ICT) 6.67 (6.86) 23.36 (27.17)LPI - overall score 3.11 (3.12) 4.10 (4.11)
Other variablesAd-valorem tariff: all commodities (%) 11.84 6.89Ad-valorem tariff: agriculture (%) 16.54 7.17Distance (km): all countries 7391.80 7421.80Distance (km): partners, all comm. 6726.47 7347.35Distance (km): partners, agriculture 7207.23 7597.39GDP per capita ($US) 2325.04 20866.95
Notes: Data for trade facilitation are all on a 0-7 scale, except for border effi ciency (number of documentsrequired to trade) and e-business which comprises among others Internet bandwidth; values are obtainedby factor analyis, and those between parentheses are generated using simple average.
In addition, a reduced economic activity could be indicative of a weak export capacity. In effect,the relatively low level of GDP per capita tells about the limited scope of the production base aswell as the excess over domestic demand or export supply. This relatively weaker export capacity,in conjunction with less favorable trade environment, is more likely to reduce the continent abilityto fully benefit from the relatively larger purchasing power in the developed world, as revealed by
10

foreign GDP per capita. The extent to which such trade impediments play out is further analyzedin the next section.
5 Results
Table 3 shows the results for all commodity trade. Firstly, the results clearly indicate that theextent to which a given country exports to another one is determined by both countries’ tradecost landscape. In effect, trade facilitation indicators for both reporter and partner appear tobe significant predictor of a reporter’s export to its partners. In addition, the cost element thatseems to consistently matter the most for both exporting and importing partners is related to thephysical infrastructure of the likes of ports or airports. More specifically, as far as global trade isconcerned, improving such infrastructure in the exporting country by one point (on the 0-7 scale)amounts to an increase in exports by 2.0 percent, and by 1.7 percent if a similar improvementoccurs in the trading partner. The results can be put into perspective by using the standardizedcoeffi cients and compare with the effects of distance. It then appears that a one-point improvementof physical infrastructure in exporting and importing countries is respectively equivalent to reducingthe distance between the trading partners by respectively 2.6 and 2.2 percent. This amounts toa reduction by 194.7 km and 167.4 km respectively. These results tend to be consistent with thefindings in the literature, such as Portugal-Perez and Wilson (2010).
African trade, both among African countries or with the rest of the world, is also responsiveto physical infrastructure, even more so than the world average. In effect, an increase in thequality of infrastructure would lead to an increase in intra-African trade value by 5.1 percent if theimprovement were to occur in the exporting partner and by 2.3 percent if it were to originate fromthe importing partner. These figures translate to a distance equivalence of 93.3 and 42.5 km.
The figures make intra-African trade more responsive to trade costs than trade between Africaand the rest of the world when it comes to trade facilitation measures originating from the exportingcountries; the opposite is true for trade costs in the importing countries. In effect, bilateral exportswould increase by 3.5 and 2.9 percent respectively, which amount to a reduction in distance-reduction by 2.6 and 2.1 percent, or 192 and 158 km. In addition, because tariffs appear to be asignificant barrier to trade only between Africa and the rest of the world, a one-point improvementin the measure in exporting and importing countries is equivalent to reducing ad- valorem tariffby 13.1 and 10.8 percent. Furthermore, because factor loadings are larger with roads and portsthan airports and railroads (respectively 0.90, 0.89, 0.87, and 0.76), improving trade infrastructuremight focus primarily on these two aspects of the trade cost landscape. The greater contributionof these two aspects of physical infrastructure also shows in Portugal-Perez and Wilson (2010).7
The other trade facilitation measures contribute in various degrees to explaining the extent tobilateral trade flows. As one might expect, an improvement of the institutional environment sur-rounding cross-border trade tends to enhance the latter. In effect, extremely sound "transparencyof government policymaking", very high "public trust of politician", never-occurring "irregularpayments and bribe", and almost no "favoritism in decisions of government offi cials" all concur togenerate a positive effect of the institutional quality on trade, for example by reducing the levelof uncertainty and transaction costs. The results unequivocally indicate a trade-enhancing effect
7Factor loadings and uniqueness for component elements of each aggregate trade facilitation measure are shownin the appendix.
11

of the regulatory environment in either trading partner, in line with the general findings in theliterature.
Table 3. Estimation results (excerpt): all commoditiesVariables All countries Intra-Africa Africa-WorldlnGDPpc_reporter 1.6072*** 0.2948 2.518*** 0.3299 0.9223*** 0.1602
(0.05) (0.53) (0.11)lnGDPpc_partner 1.0409*** 0.1907 -1.2014** -0.1596 0.0313 0.0054
(0.05) (0.54) (0.12)lnDistance -0.9082*** -0.1064 -3.9147*** -0.3234 -2.3512*** -0.1476
(0.06) (0.56) (0.19)Infrastructure_reporter 2.0224*** 0.2775 5.0961*** 0.4043 3.5245*** 0.3804
(0.07) (0.59) (0.16)Regulatory env._reporter 2.1226*** 0.2529 2.2052*** 0.2003 2.3245*** 0.2269
(0.07) (0.48) (0.15)E-business_reporter -0.0002 -0.0090 0.3924** 0.1592 -0.0001 -0.0002
(0.01) (0.16) (0.01)Border_reporter -0.0850* -0.0226 0.2785 0.0550 0.0111 0.0026
(0.03) (0.19) (0.06)Infrastructure_partner 1.7358*** 0.2385 2.2834*** 0.1839 2.8915*** 0.3136
(0.07) (0.59) (0.16)Regulatory env._partner 1.0860*** 0.1296 2.2280*** 0.2064 1.0148*** 0.0995
(0.08) (0.48) (0.15)E-business_partner -0.0009*** -0.0428 0.3925** 0.1610 -0.0014*** -0.0438
(0.01) (0.16) (0.01)Border_partner 0.1633*** 0.0433 0.0613 0.0119 0.1387** 0.0326
(0.03) (0.20) (0.07)ln(1+tariff)_partner 0.0096 0.0013 -0.1636 -0.0206 -0.2672** -0.0291
(0.06) (0.32) (0.12)Intercept -5.0574*** 52.7314*** 11.1873***
(1.00) (7.09) (2.51)N 17957 532 5806F-stat 474.9 16.3 124.8R2 0.346 0.377 0.302
Notes: The dependent variable is the logarithm of bilateral commodity trade flows. Only results forexplanatory variables relevant to the analysis are shown here. Complete results are shown in theappendix. The estimator is a pooled OLS, and dummies are included to capture individual and timeeffects. The second column for each series of estimation results represents the standardized coeffi cientestimates. Values between parentheses are the standard errors. Significance at 1, 5, and 10 percent areindicated by ***, **, and *.
For example, a one-point improvement in the exporting country generates 2.12-, 2.21- and 2.32-percent increase in trade for the whole sample, trade within Africa, and trade between Africa andthe outside world, respectively. These figures are equivalent to a distance-reduction by 2.4, 0.6 and
12

1.6 percent, or 177.5, 46.2, and 114.8 km, respectively. On the other hand, when the improvementoriginates from the importing country the distance-equivalence gain is respectively 90.9, 47.7, and50.3 km. Therefore, as opposed to physical infrastructure, institutional environment benefits moretrade between Africa and the rest of the world than trade within the continent. Reforms aimingat facilitating trade would focus on reducing favoritism and improving public trust, which loadingfactors are higher than bribery and transparency (0.95 and 0.90, against 0.87 and 0.85).
When it comes e-business or the extent of ICT usage and quality, the results first indicate thattrade within the continent is the sole significant beneficiary from any improvement in the exportingcountry: a one-point increase in the indicator is associated with an increase in bilateral trade by0.4 percent. This result could denote the extent of the continent’s backwardness as far as elementssuch as availability of the latest technologies or firm-level technology absorption are concerned, andtheir translation into far greater potentials for trade than anywhere else in the world.
But, somewhat curiously, when the improvement happens in the trading partners, the associatedtrade effect appears to be negative for all countries but Africa. The literature tends overwhelminglyto suggest strong positive effects (such as Freund and Weinhold, 2000, or Fink et al., 2005), butit does not go as far as to break the overall gains into different trading partners. The result couldfirst contribute to further reinforce the previous results on the trade potentials associated with ICTusage in Africa. But the significant and negative effect on trade when other countries are involvedis very counterintuitive. It might be the case that further improvement of an already-high qualitybandwidth and the corresponding greater adjustment of firms to continually absorb continuingtechnology flows are associated with costs that outweigh any benefits. The negative result could beindicative of this net trade loss to exporting countries that have to adjust to this often unfamiliartechnologically-moving environment in their trading partners, on average.
As far as paperless trade is concerned, reducing the number of required documents in a givencountry increases its exports if one considers global trade. In effect, one less document generates anincrease in trade by 0.09 percent. Trade in which African countries are involved as exporters, eitherwithin the continent or with the outside world, appears to be irresponsive to border effi ciency,potentially indicating that traders have already adjusted to the many hurdles associated withbottlenecks associated with border formalities. On the other hand, it is quite surprising that anincrease in the number of documents in the importing partners is associated with positive effecton trade. Rather than denoting any meaningful generating economic mechanisms, these results aremore of a statistical curiosity.
In sum, when it comes to trade flows in Africa, not all trade elements of the trade cost landscapematter to the same extent. As it shows with physical infrastructure and the regulatory environment,the effect of trade facilitation vary with respect to the trading partners (either in Africa or outside).
To check whether similar patterns from overall trade also holds with agricultural commodities,Table 4 shows estimation results for this sub-sample of products, again distinguishing betweentrading partners. First, physical infrastructure seems not to matter for African trade, whether anyimprovement happens in exporting or importing countries. This suggests that the significant andpositive relation in Table 3 is more driven by non-agricultural commodities. Therefore, improvingthe quality of ports, airports, roads or railroads in either trading partner would benefit generatesignificant trade benefits only for manufacturing goods.
Second, improving the regulatory environment also benefits African economies’ agriculturaltrade, except for trade within the continent when such improvement is occurs in the exportingcountries. Third, ICT is associated with great agricultural trade gains. These benefits shows in
13

intra-African Trade where a one-point improvement in the trading leads to a 0.6 percent increase intrade flows, as well as trade between Africa and the rest of the world where similar improvement inimporting countries generates a 0.001-percent increase in trade. Compared to the results in Table3, agricultural commodities tend to benefit more responsive to trade-related ICT development thannon-agricultural commodities.
Table 4. Estimation results (excerpt): agricultural commoditiesVariables All countries Intra-Africa Africa-WorldlnGDPpc_reporter 0.1250 0.0182 1.2591 0.1313 0.5891*** 0.0915
(0.08) (0.812) (0.15)lnGDPpc_partner 0.2520*** 0.0367 0.3280 0.0347 -0.1042 -0.0162
(0.09) (0.83) (0.16)lnDistance -0.2723*** -0.0254 0.4887 0.0321 -0.4388* -0.0246
(0.10) (0.84) (0.26)Infrastructure_reporter 0.4953*** 0.0540 1.0073 0.0636 0.1009 0.0097
(0.12) (0.89) (0.22)Regulatory env._reporter 0.7186*** 0.0681 -0.4687 -0.0339 0.4527** 0.0395
(0.12) (0.74) (0.19)E-business_reporter 0.0015*** 0.0571 0.6286** 0.2030 0.0013*** 0.0365
(0.01) (0.24) (0.01)Border_reporter 0.4379*** 0.0925 -0.1906 -0.0299 0.2977*** 0.0627
(0.05) (0.29) (0.09)Infrastructure_partner 0.1130 0.0123 1.0087 0.0647 0.0045 0.0004
(0.12) (0.90) (0.22)Regulatory env._partner 0.1976* 0.0187 2.0599*** 0.1519 0.8340*** 0.0731
(0.12) (0.73) (0.19)E-business_partner 0.0012*** 0.0453 0.1119 0.0365 0.0013*** 0.0371
(0.01) (0.24) (0.01)Border_partner -0.0696 -0.0147 -0.0959 -0.0148 0.0885 0.0186
(0.05) (0.31) (0.09)ln(1+tariff)_partner -0.0778 -0.0097 0.2517 0.0337 -0.1827 -0.0237
(0.07) (0.35) (0.12)Intercept 9.3788*** 0.5879 1.7522
(1.54) (10.81) (3.31)N 17957 532 5806F-stat 20.8 2.35 8.0R2 0.023 0.08 0.027
Notes: The dependent variable is the logarithm of bilateral agricultural commodity trade flows. Asbefore, only results for explanatory variables relevant to the analysis are shown here; the estimator isa pooled OLS, and dummies are included to captures individual and time effects; the second columnfor each series of estimation results represents the standardized coeffi cient estimates. Values betweenparentheses are the standard errors. Significance at 1, 5, and 10 percent are indicated by ***, **, and *.
Finally, while agricultural trade within the continent is not significantly influenced by bordereffi ciency (number of documents), following in that the overall trend shown in Table 3, trade between
14
the continent and the rest of the world reacts very significantly to an improvement occurring inthe exporting country: the corresponding marginal distance-equivalent is 190.3 km. This is greaterthan the overall effect found in Table 3, which in fact appears to be insignificant. But the oppositeis true when the improvement is made in the importing country. It therefore matters which tradingpartner undertakes the reforms aiming at enhancing African trade performance.
Alternative estimation results based on the average measures of trade facilitation, as well asthose on the Logistics Performance Index, tend grossly to tell similar story. They are shown in theappendix.
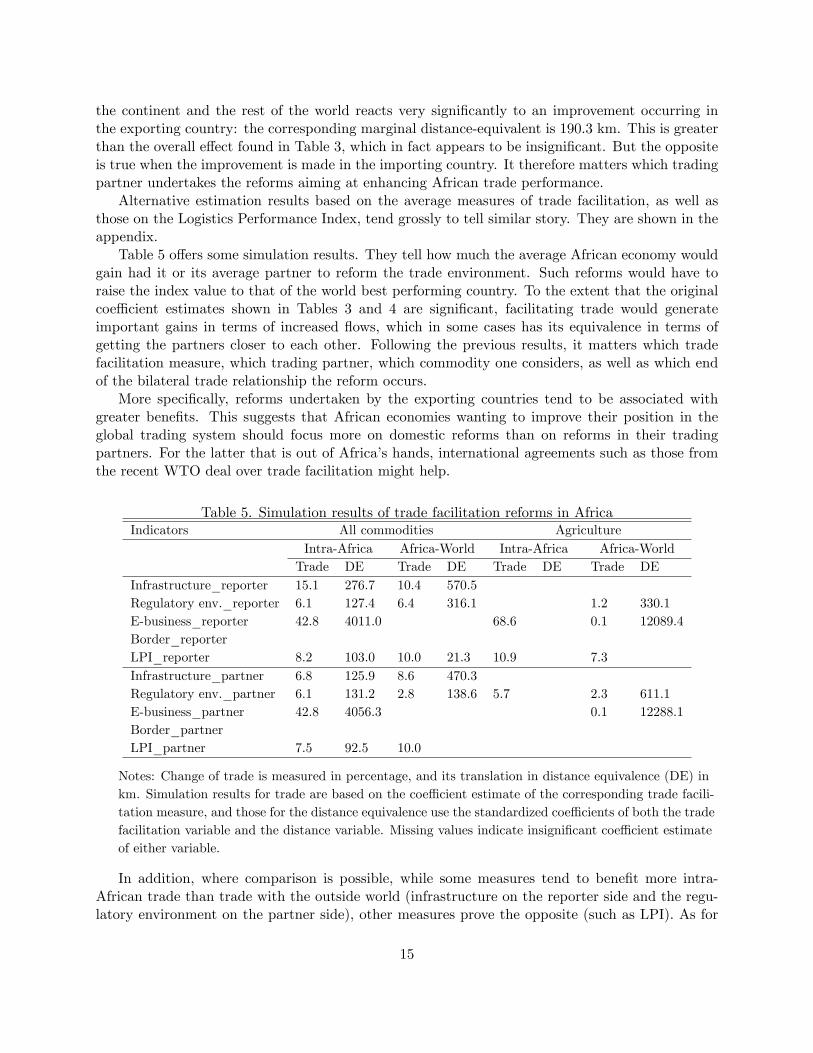
Table 5 offers some simulation results. They tell how much the average African economy wouldgain had it or its average partner to reform the trade environment. Such reforms would have toraise the index value to that of the world best performing country. To the extent that the originalcoeffi cient estimates shown in Tables 3 and 4 are significant, facilitating trade would generateimportant gains in terms of increased flows, which in some cases has its equivalence in terms ofgetting the partners closer to each other. Following the previous results, it matters which tradefacilitation measure, which trading partner, which commodity one considers, as well as which endof the bilateral trade relationship the reform occurs.
More specifically, reforms undertaken by the exporting countries tend to be associated withgreater benefits. This suggests that African economies wanting to improve their position in theglobal trading system should focus more on domestic reforms than on reforms in their tradingpartners. For the latter that is out of Africa’s hands, international agreements such as those fromthe recent WTO deal over trade facilitation might help.
Table 5. Simulation results of trade facilitation reforms in AfricaIndicators All commodities Agriculture
Intra-Africa Africa-World Intra-Africa Africa-WorldTrade DE Trade DE Trade DE Trade DE
Infrastructure_reporter 15.1 276.7 10.4 570.5Regulatory env._reporter 6.1 127.4 6.4 316.1 1.2 330.1E-business_reporter 42.8 4011.0 68.6 0.1 12089.4Border_reporterLPI_reporter 8.2 103.0 10.0 21.3 10.9 7.3Infrastructure_partner 6.8 125.9 8.6 470.3Regulatory env._partner 6.1 131.2 2.8 138.6 5.7 2.3 611.1E-business_partner 42.8 4056.3 0.1 12288.1Border_partnerLPI_partner 7.5 92.5 10.0
Notes: Change of trade is measured in percentage, and its translation in distance equivalence (DE) inkm. Simulation results for trade are based on the coeffi cient estimate of the corresponding trade facili-tation measure, and those for the distance equivalence use the standardized coeffi cients of both the tradefacilitation variable and the distance variable. Missing values indicate insignificant coeffi cient estimateof either variable.
In addition, where comparison is possible, while some measures tend to benefit more intra-African trade than trade with the outside world (infrastructure on the reporter side and the regu-latory environment on the partner side), other measures prove the opposite (such as LPI). As for
15

agricultural commodities, all of the relevant measures on both sides tend to yield greater gains totrade within Africa than trade with the outside world. This further contributes to make the sectora good target for trade facilitation reforms.
6 Conclusion
Facilitating trade appears to have a great potential to improving export performance of Africancountries. The effectiveness of trade reforms need to account for many factors. One such factor isthe type of measures, as they have varying effects on trade flows. Other factors pertain to tradingpartners (intra-African trade or trade with the rest of the world), as well the commodities beingtrade (agricultural or non-agricultural).
A clear understanding of the various elements that make up the trade cost landscape and theway they interact to generate low performance is undoubtedly a crucial step towards reforming thetrade environment in Africa. But whether such reforms might be effective, or even successfullyimplemented, is matter that needs to be addressed. The issue pertains to the political economyof trade reforms, not only in Africa, but also in its trading partners. An understanding of themechanisms that underlie special interest at both ends of the bilateral trade relationship is as muchcrucial as the knowledge of the extent of the trade gains associated with reducing trade costs.
16

References
[1] Anderson, J.E., 1979. A Theoretical Foundation for the Gravity Equation. American EconomicReview 69 (1), 106—16.
[2] Anderson, J.E., and E. van Wincoop, 2003. Gravity with Gravitas: A Solution to the BorderPuzzle. American Economic Review 93 (1), 170—92.
[3] Arvis, J.F., Y. Duval, B. Shepherd, and C. Utoktham, 2013. Trade Costs in the DevelopingWorld: 1995-2010. World Bank Policy Research Working Paper 6309, The World Bank.
[4] Balistreri, E. J. and R. H. Hillberry, 2001. Trade Friction and Welfare in the Gravity Model:How Much of the Iceberg Melts? US International Trade Commission, Washington, D.C.
[5] Bernard, A. B., B. Jensen, J. Bradford, and P. Schott, 2006. Trade Costs, Firms and Produc-tivity. Journal of Monetary Economics 53, 917-937.
[6] Blyde, J., and G. Iberti, 2010. Trade costs, Resource Reallocation, and Productivity in Devel-oping Countries. MPRA Paper No. 21318.
[7] Cheng, I.-H., and H. J. Wall, 2004. Controlling for Heterogeneity in Gravity Models of Tradeand Integration. Working Paper No. 1999-010E, Federal Reserve Bank of St. Louis.
[8] Clark, X., D. Dollar, and A. Micco, 2002. Maritime Transport Costs and Port Effi ciency. WorldBank Policy Research Working Paper 2781, The World Bank.
[9] Clarke, G., 2005: Beyond Tariffs and Quotas: Why Don’t African Manufacturers ExportMore? World Bank Policy Research Working Paper 3617, The World Bank.
[10] Egger, P., and M. Pfaffermayr, 2003. The Proper Panel Econometric Specification of theGravity Equation: A Three-way Model with Bilateral Interaction Effects. Empirical Economics28(3): 571—80.
[11] Fink, C., A. Mattoo, and C.I. Neagu, 2005. Assessing the Impact of Communication Costs onInternational Trade. Journal of International Economics 67 (2): 428-445.
[12] Francois, J., and M. Manchin, 2013. Institutions, Infrastructure, and Trade. World Develop-ment 46: 165—175.
[13] Freund, C., and D. Weinhold, 2000. On the Effect of the Internet on International Trade.International Finance Discussion Papers No. 693.
[14] Hummels, D.L., 2007. Transportation Costs and International Trade in the Second Era ofGlobalization. Journal of Economic Perspectives 21 (3): 131-154.
[15] Hummels, D.L., and G. Schaur, 2013. Time as a Trade Barrier. American Economic Review103(7): 2935-2959.
[16] Iwanow, T., and C. Kirkpatrick, 2009. Trade Facilitation and Manufactured Exports: Is AfricaDifferent? World Development 37 (6): 1039-1050.
17
[17] Jacks, D., C.M. Meissner, and D. Novy, 2008. Trade Costs: 1870-2000. American EconomicReview : Papers & Proceedings 98 (2): 529-534.
[18] Lesser, C., and E. Moisé-Leeman, 2009. Informal Cross-border Trade and Trade FacilitationReform in Sub-Saharan Africa. OECD Trade Policy Working Paper No. 86, OECD Publishing.
[19] Maur, J.C., and J.S. Wilson, 2010. Trade Costs and Facilitation: Open Trade and EconomicDevelopment. Edward Elgar Publications.
[20] Moïsé, E. 2013. The Costs and Challenges of Implementing Trade Facilitation Measures. OECDTrade Policy Papers, No. 157, OECD Publishing.
[21] Moïsé, E. and S. Sorescu, 2013. Trade Facilitation Indicators: The Potential Impact of TradeFacilitation on Developing Countries’ Trade. OECD Trade Policy Papers No. 144, OECDPublishing.
[22] Nordås, K.H., E. Pinali, and M.G. Grosso, 2006. Logistics and Time as Trade Barriers. OECDTrade Policy Working Paper No. 35.
[23] Portugal-Perez, A., and J.S. Wilson, 2010. Export Performance and Trade Facilitation Reform:Hard and Soft Infrastructure. World Bank Policy Research Working Paper 5261.
[24] Portugal-Perez, A., and J.S. Wilson, 2019. Why Trade Facilitation Matters to Africa? TheWorld Trade Review 8 (3): 379-416.
[25] Seck, A., 2012. International Technology Diffusion and Economic Growth: Explaining theSpillover Benefits to Developing Countries, Structural Change and Economic Dynamics 23(4): 437-451.
[26] Turkson, F.E., 2011. Logistics and Bilateral Exports in Developing Countries: A MultiplicativeForm Estimation of the Logistics Augmented Gravity Equation. Credit Research Paper 11/06,University of Nottingham.
[27] UNDP, 2013. The MDGs Report: Assessing Progress in Africa towards the Millennium Devel-opment Goals. United Nations Development Program.
[28] UNESCAP, 2011. Trade Facilitation in Asia and the Pacific: An Analysis of Import and ExportProcesses. United Nations Economic and Social Commission of Asia and Pacific Report No71.
[29] Van Biesebroeck, J., 2005. Exporting Raises Productivity in Sub-Saharan African Manufac-turing Firms. Journal of International Economics 67, 373—391.
[30] Wilson, J.S., C.L. Mann, and T. Otsuki, 2003. Trade Facilitation and Economic Development:A New Approach to Measuring the Impact. World Bank Economic Review 17 (3): 367—89.
[31] Wilson, J.S., C.L. Mann, and T. Otsuki, 2005. Assessing the Benefits of Trade Facilitation: AGlobal Perspective. The World Economy 28 (6): 841-871.
18

Appendix
A1. Additional and detailed results
Table A1.1. Factor loadings and trade facilitation indicatorsAggregate indicators / Inputs Factor1 UniquenessPhysical infrastructure indicatorQuality of ports infrastructure 0.885 0.216Quality of airports infrastructure 0.866 0.250Quality of roads infrastructure 0.905 0.181Quality of railroad infrastructure 0.756 0.428
Border effi ciency indicatorNumber of documents required to export 0.878 0.229Number of documents required to import 0.878 0.229
Regulatory environment indicatorTransparency of government policy-making 0.848 0.281Public trust in politicians 0.904 0.182Irregular payments and bribes 0.874 0.236Favoritism in decisions of government offi cials 0.949 0.099
E-business indicatorAvailability of latest technologies 0.969 0.059Internet usage 0.778 0.394Firm-level technology absorption 0.921 0.152Internet bandwidth 0.560 0.686
Logistics Performance IndexCustoms 0.959 0.079Infrastructure 0.974 0.051International Shipment 0.944 0.109Logistics Competence and Quality 0.979 0.040Tracking and Tracing 0.974 0.052Timeliness 0.938 0.121
19

Table A1.2. Estimation results: all commodities, factor analysisVariables All countries Intra-Africa Africa-WorldlnGDPpc_rep 1.6072*** (0.05)[0.2948] 2.518*** (0.53)[0.3299] 0.9223*** (0.11)[0.1602]lnGDPpc_par 1.0409*** (0.05)[0.1907] -1.2014** (0.54)[-0.1596] 0.0313 (0.12)[0.0054]lnDistance -0.9082***(0.06)[-0.1064] -3.9147***(0.56)[-0.3234] -2.3512***(0.19)[-0.1476]Infrastructure_rep 2.0224*** (0.07)[0.2775] 5.0961*** (0.59)[0.4043] 3.5245*** (0.16)[0.3804]Regulatory env._rep 2.1226*** (0.07)[0.2529] 2.2052*** (0.48)[0.2003] 2.3245*** (0.15)[0.2269]E-business_rep -0.0002 (0.01)[-0.0090] 0.3924** (0.16)[0.1592] -0.0001 (0.01)[-0.0002]Border_rep -0.0850* (0.03)[-0.0226] 0.2785 (0.19)[0.0550] 0.0111 (0.06)[0.0026]Infrastructure_par 1.7358*** (0.07)[0.2385] 2.2834*** (0.59)[0.1839] 2.8915*** (0.16)[0.3136]Regulatory env._par 1.0860*** (0.08)[0.1296] 2.2280*** (0.48)[0.2064] 1.0148*** (0.15)[0.0995]E-business_par -0.0009***(0.01)[-0.0428] 0.3925** (0.16)[0.1610] -0.0014***(0.01)[-0.0438]Border_par 0.1633*** (0.03)[0.0433] 0.0613 (0.20)[0.0119] 0.1387** (0.07)[0.0326]ln(1+tariff)_par 0.0096 (0.06)[0.0013] -0.1636 (0.32)[-0.0206] -0.2672** (0.12)[-0.0291]FTA 0.03505***(0.13)[0.0206] 0.1460 (1.07)[0.0056] -0.0192 (0.12)[-0.0291]Common currency -0.9815** (0.37)[-0.0160] -3.1654***(0.90)[-0.0397]Contiguity 2.9414*** (0.32)[0.0609] 1.1881 (1.29)[0.0378] 2.8748** (1.23)[0.0273]Common language 2.7856*** (0.16)[0.1085] 5.0169*** (0.77)[0.3232] 3.2538*** (0.28)[0.1358]Colony 0.9157*** (0.34)[0.0164] 1.9256** (0.85)[0.0258]Common colonizer -1.3911 (0.98)[-0.0695]Landlocked_rep -1.7421***(0.13)[-.0887] -3.9889***(0.82)[-0.1375] -1.8550***(0.25)[-0.0904]Landlocked_par -1.9709***(0.13)[-0.1003] -2.3257***(0.83)[-0.1357] -2.8151***(0.25)[-0.1376]Year2012 -0.3835***(0.09)[-0.0250] -1.9740** (0.82)[-0.1272] -0.2692 (0.19)[-0.0155]Intercept -5.0574***(1.00) 52.7314***(7.09) 11.1873***(2.51)N 17957 532 5806F-stat 474.9 16.3 124.8R2 0.346 0.377 0.302
Notes: The dependent variable is the logarithm of bilateral trade flows. The regressions consider allcommodities, and trade facilitation measures are aggregated using factor analysis. The extensions"rep" and "par" refer to "reporter" and "partner". Values between parentheses represent standarderrors, and those between brackets standardized coeffi cients. The same applies in the tables below,as well the standard indication of significance.
20

Table A1.3. Estimation results: all commodities, simple averagesVariables All countries Intra-Africa Africa-WorldlnGDPpc_rep 1.7941*** (0.05)[0.3306] 2.8499*** (0.62)[0.3734] 1.2393*** (0.12)[0.2152]lnGDPpc_par 1.1721*** (0.06)[0.2157] -1.0124 (0.62)[0.1345] -0.1947 (0.12) [0.0338]lnDistance -1.0605***(0.06)[-0.1237] -4.0055***(0.59)[-0.3309] -2.1133***(0.21)[-0.1326]Infrastructure_rep 1.2456*** (0.08)[0.1753] 5.0842*** (0.86)[0.4331] 2.4105*** (0.20)[0.2646]Regulatory env._rep 1.8117*** (0.08)[0.2163] 4.0613*** (0.62)[0.3688] 2.3443*** (0.17)[0.2284]E-business_rep -0.0001 (0.00)[-0.0094] 0.4180* (0.16)[0.1817] 0.0001 (0.01)[0.0037]Border_reporter -0.1619***(0.03)[-0.0432] 0.4631** (0.21)[0.0914] -0.0494 (0.07)[-0.0116]Infrastructure_par 1.2327*** (0.08)[0.1737] 1.3138 (0.86)[0.1137] 2.4249*** (0.20)[0.2674]Regulatory env._par 0.9006*** (0.08)[0.1076] 2.7437*** (0.61)[0.2542] 1.2479*** (0.18)[0.1221]E-business_par -0.0002***(0.01)[-0.0420] 0.4117*** (0.15)[0.1812] -0.0003***(0.01)[-0.0387]Border_par 0.1058*** (0.03)[0.0282] 0.0495 (0.22)[0.0096] 0.1158* (0.07)[0.0272]ln(1+tariff)_par 0.0811 (0.06)[0.0107] 0.0627 (0.33)[0.0079] -0.1820 (0.13)[-0.0198]FTA 0.3581*** (0.13)[0.0211] 1.3495 (1.12)[0.0517] 0.8125** (0.36)[0.0293]Common currency -1.2128***(0.38)[-0.0198] -3.8217***(0.94)[-0.0480]Contiguity 2.8297*** (0.32)[0.0589] 2.3123* (1.39)[0.0749] 3.4373*** (1.27)[0.0327]Common language 2.7046*** (0.16)[0.1059] 5.4172*** (0.79)[0.3490] 3.3822*** (0.29)[0.1411]Colony 0.6760* (0.35)[0.0122] -6.0715* (3.67)[-0.0676] 1.1798 (0.88)[0.0158]Common colonizer -2.7430***(1.01)[-0.1371]Landlocked_rep -1.7893***(0.13)[-0.0915] -4.2659***(0.87)[-0.2503] -1.7571***(0.26)[-0.0857]Landlocked_par -2.0080***(0.13)[-0.1027] -2.3286***(0.87)[-0.1376] -2.7064***(0.26)[-0.1323]Year2012 -0.4264***(0.09) [-0.0279] -2.9222***(0.89)[-0.1883] -0.4655** (0.20)[-0.0268]Intercept -2.4542** (1.02) 63.7452***(7.55) 12.1990***(2.60)N 17957 532 5806F-stat 435.5 12.7 95.0R2 0.33 0.33 0.25
21

Table A1.4. Estimation results: agricultural commodities, factor analysisVariables All countries Intra-Africa Africa-WorldlnGDPpc_rep 0.1250 (0.08)[0.0182] 1.2591 (0.81)[0.1313] 0.5891*** (0.15)[0.0915]lnGDPpc_par 0.2520*** (0.09)[0.0367] 0.3280 (0.83)[0.0347] -0.1042 (0.16)[-0.0162]lnDistance -0.2723***(0.10)[-0.0254] 0.4887 (0.84)[0.0321] -0.4388* (0.26)[-0.0246]Infrastructure_rep 0.4953*** (0.12)[0.0540] 1.0073 (0.89)[0.0636] 0.1009 (0.22)[0.0097]Regulatory env._rep 0.7186*** (0.12)[0.0681] -0.4687 (0.74)[-0.0339] 0.4527** (0.19)[0.0395]E-business_rep 0.0015*** (0.01)[0.0571] 0.6286** (0.24)[0.2030] 0.0013*** (0.01)[0.0365]Border_rep 0.4379*** (0.05)[0.0925] -0.1906 (0.29)[-0.0299] 0.2977*** (0.09)[0.0627]Infrastructure_par 0.1130 (0.12)[0.0123] -1.0087 (0.90)[-0.0647] 0.0045 (0.22)[0.0004]Regulatory env._par 0.1976* (0.12)[0.0187] 2.0599***(0.73)[0.1519] 0.8340*** (0.19)[0.0731]E-business_par 0.0012*** (0.01)[0.0453] 0.1119 (0.24)[0.0365] 0.0013*** (0.01)[0.0371]Border_par -0.0696 (0.05)[-0.0147] -0.0959 (0.31)[-0.0148] 0.0885 (0.09)[0.0186]ln(1+tariff)_par -0.0778 (0.07)[-0.0097] 0.2517 (0.35)[0.0337] -0.1827 (0.12)[-0.0237]FTA -0.1106 (0.20)[-0.0052] 0.0125 (1.63)[0.0004] -0.1443 (0.46)[-0.0046]Common currency -0.9294 (0.58)[-0.0120] 1.3276 (1.19)[0.0149]Contiguity -0.2318 (0.49)[-0.0038] 2.6794 (1.98)[0.0691] 2.4452 (1.62)[0.0208]Common language 0.2647 (0.25)[0.0082] 0.7132 (1.18)[0.0366] 0.9626*** (0.37)[0.0359]Colony -0.4926 (0.54)[-0.0070] -0.6714 (1.12)[-0.0081]Common colonizer 0.4425 (1.49)[0.0176]Landlocked_rep 1.4364*** (0.19)[0.0582] -1.9916 (1.26)[-0.0930] 0.0006 (0.33)[0.0001]Landlocked_par -0.4773** (0.19)[-0.0193] -4.1725***(1.27)[-0.1963] -1.9850***(0.33)[-0.0868]Year2012 -0.2950** (0.14)[-0.0153] 1.1352 (1.26)[0.0582] 0.0019 (0.26)[0.0001]Intercept 9.3788*** (1.54) 0.5879 (10.81) 1.7522 (3.31)N 17957 532 5806F-stat 20.8 2.4 8.0R2 0.02 0.08 0.03
22

Table A1.5. Estimation results: agricultural commodities, simple averagesVariables All countries Intra-Africa Africa-WorldlnGDPpc_rep 0.1310 (0.08)[0.0191] 0.8227 (0.91)[0.0858] 0.7310*** (0.15)[0.1136]lnGDPpc_par 0.2711*** (0.09)[0.0395] 0.2640 (0.92)[0.0279] -0.0703 (0.16)[-0.0109]lnDistance -0.2838***(0.09)[-0.0262] 0.5187 (0.85)[0.0341] -0.4642* (0.26)[-0.0261]Infrastructure_rep 0.5851*** (0.12) [0.0652] 0.5745 (1.27)[0.0390] 0.6924*** (0.25)[0.0680]Regulatory env._rep 0.8007*** (0.12)[0.0757] -0.5671 (0.91)[-0.0410] -0.1421 (0.22)[-0.0124]E-business_rep 0.0004*** (0.01)[0.0576] 0.3385 (0.23)[0.1172] 0.0004*** (0.01)[0.0374]Border_rep -0.4459***(0.05)[-0.0941] -0.1637 (0.31)[-0.0257] -0.3481***(0.09)[-0.0733]Infrastructure_par 0.0214 (0.12)[0.0024] -0.3151 (1.27)[-0.0217] -0.0321 (0.25)[-0.0032]Regulatory env._par 0.2336* (0.12)[0.0221] 2.1147** (0.90)[0.1559] 0.8259*** (0.22)[0.0723]E-business_par 0.0003*** (0.01)[0.0443] 0.1496 (0.23)[0.0524] 0.0004*** (0.01)[0.0374]Border_par -0.0841* (0.05)[-0.0177] -0.0735 (0.32)[-0.0114] 0.0769 (0.09)[0.0162]ln(1+tariff)_par -0.0627 (0.07)[-0.0078] 0.1735 (0.35)[0.0232] -0.1777 (0.12)[-0.0230]FTA -0.0933 (0.20)[-0.0044] 0.1147 (1.65)[0.0035] -0.0160 (0.46)[-0.0005]Common currency -0.8916 (0.58)[-0.0115] 1.1918 (1.19)[0.0134]Contiguity -0.2884 (0.49)[-0.0048] 3.6898* (2.06)[0.0951] 2.4954 (1.62)[0.0212]Common language 0.2646 (0.25)[0.0082] 0.9567 (1.18)[0.0491] 1.0291*** (0.37)[0.0384]Colony -0.3741 (0.54)[-0.0053] -9.3846* (5.40)[-0.0832]Common colonizer 0.3349 (1.50)[0.0133] -0.4824 (1.12)[-0.0058]Landlocked_rep 1.4328*** (0.19)[0.0580] -1.8626 (1.28)[-0.0870] 0.0119 (0.33)[0.0005]Landlocked_par -0.4690** (0.19)[-0.0190] -4.3800***(1.29)[-0.2061] -1.9530***(0.33)[0.0854]Year2012 -0.3116** (0.15)[-0.0161] 0.7570 (1.32)[0.0388] 0.0002 (0.26)[0.0001]Intercept 9.6432*** (1.56) -1.4231 (11.13) 1.8324 (3.31)N 17953 532 5806F-stat 20.8 2.1 8.3R2 0.02 0.07 0.03
23
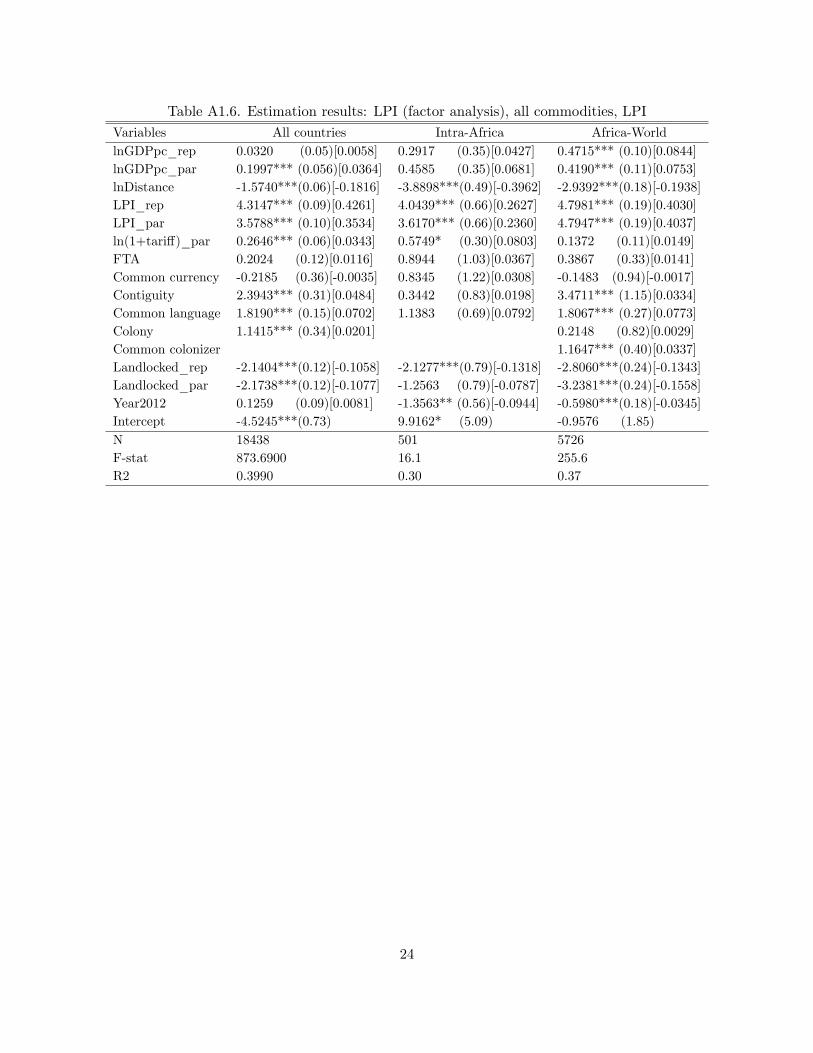
Table A1.6. Estimation results: LPI (factor analysis), all commodities, LPIVariables All countries Intra-Africa Africa-WorldlnGDPpc_rep 0.0320 (0.05)[0.0058] 0.2917 (0.35)[0.0427] 0.4715*** (0.10)[0.0844]lnGDPpc_par 0.1997*** (0.056)[0.0364] 0.4585 (0.35)[0.0681] 0.4190*** (0.11)[0.0753]lnDistance -1.5740***(0.06)[-0.1816] -3.8898***(0.49)[-0.3962] -2.9392***(0.18)[-0.1938]LPI_rep 4.3147*** (0.09)[0.4261] 4.0439*** (0.66)[0.2627] 4.7981*** (0.19)[0.4030]LPI_par 3.5788*** (0.10)[0.3534] 3.6170*** (0.66)[0.2360] 4.7947*** (0.19)[0.4037]ln(1+tariff)_par 0.2646*** (0.06)[0.0343] 0.5749* (0.30)[0.0803] 0.1372 (0.11)[0.0149]FTA 0.2024 (0.12)[0.0116] 0.8944 (1.03)[0.0367] 0.3867 (0.33)[0.0141]Common currency -0.2185 (0.36)[-0.0035] 0.8345 (1.22)[0.0308] -0.1483 (0.94)[-0.0017]Contiguity 2.3943*** (0.31)[0.0484] 0.3442 (0.83)[0.0198] 3.4711*** (1.15)[0.0334]Common language 1.8190*** (0.15)[0.0702] 1.1383 (0.69)[0.0792] 1.8067*** (0.27)[0.0773]Colony 1.1415*** (0.34)[0.0201] 0.2148 (0.82)[0.0029]Common colonizer 1.1647*** (0.40)[0.0337]Landlocked_rep -2.1404***(0.12)[-0.1058] -2.1277***(0.79)[-0.1318] -2.8060***(0.24)[-0.1343]Landlocked_par -2.1738***(0.12)[-0.1077] -1.2563 (0.79)[-0.0787] -3.2381***(0.24)[-0.1558]Year2012 0.1259 (0.09)[0.0081] -1.3563** (0.56)[-0.0944] -0.5980***(0.18)[-0.0345]Intercept -4.5245***(0.73) 9.9162* (5.09) -0.9576 (1.85)N 18438 501 5726F-stat 873.6900 16.1 255.6R2 0.3990 0.30 0.37
24

Table A1.7. Estimation results: LPI (factor analysis), agricultural commoditiesVariables All countries Intra-Africa Africa-WorldlnGDPpc_rep 0.8029*** (0.09)[0.1180] 1.8025*** (0.53)[0.1960] 0.9606*** (0.14)[0.1543]lnGDPpc_par 0.0041 (0.08)[0.0006] 0.2118 (0.54)[0.0234] -0.0409 (0.15)[0.0066]lnDistance -0.3175***(0.10)[-0.0295] -0.3985 (0.74)[-0.0302] -0.0731 (0.25)[-0.0043]LPI_rep 2.5612*** (0.16)[0.2040] 5.2248*** (1.01)[0.2524] 3.4897*** (0.27)[0.2628]LPI_par 0.8181*** (0.15)[0.0652] -1.1939 (1.01)[-0.0579] -0.0404 (0.27)[-0.0031]ln(1+tariff)_par -0.1955***(0.08)[-0.0243] -0.0323 (0.34)[-0.0045] -0.4538***(0.12)[-0.0589]FTA -0.1417 (0.20)[-0.0066] -1.3699 (1.58)[-0.0419] -0.6027 (0.45)[-0.0197]Common currency 1.3318** (0.57)[0.0172] 1.2980 (1.29)[0.0133]Contiguity -0.5674 (0.50)[-0.0093] -0.6813 (1.86)[-0.0187] -0.5988 (1.59)[-0.0052]Common language 0.1835 (0.24)[0.0057] 2.8338*** (1.07)[0.1467] 0.5607 (0.37)[0.0215]Colony -0.7935 (0.53)[-0.0113] -1.6895 (1.12)[-0.0203]Common colonizer -1.1778 (1.27)[-0.0503] -0.1990 (0.55)[-0.0052]Landlocked_rep -0.9932***(0.19)[-0.0396] -3.1540** (1.22)[-0.1453] -1.1651***(0.32)[-0.0500]Landlocked_par -0.5123***(0.19)[-0.0205] -2.5495** (1.21)[-0.1188] -1.5428***(0.33)[-0.0666]Year2012 -0.1484 (0.14)[-0.0077] -1.5985* (0.86)[-0.0828] -0.0543 (0.25)[-0.0028]Intercept 4.8004*** (1.14) 9.3012 (7.78) 5.2730** (2.52)N 18438 501 5726F-stat 33.0 4.0 15.4R2 0.03 0.10 0.04
25
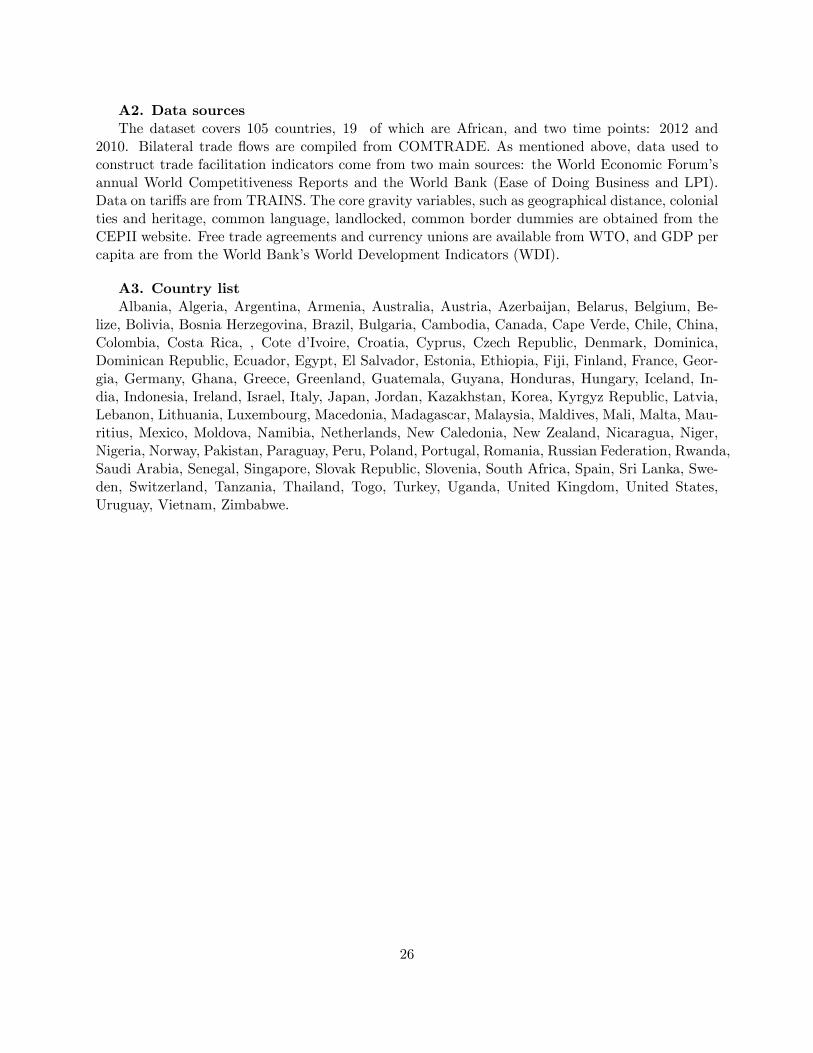
A2. Data sourcesThe dataset covers 105 countries, 19 of which are African, and two time points: 2012 and
2010. Bilateral trade flows are compiled from COMTRADE. As mentioned above, data used toconstruct trade facilitation indicators come from two main sources: the World Economic Forum’sannual World Competitiveness Reports and the World Bank (Ease of Doing Business and LPI).Data on tariffs are from TRAINS. The core gravity variables, such as geographical distance, colonialties and heritage, common language, landlocked, common border dummies are obtained from theCEPII website. Free trade agreements and currency unions are available from WTO, and GDP percapita are from the World Bank’s World Development Indicators (WDI).
A3. Country listAlbania, Algeria, Argentina, Armenia, Australia, Austria, Azerbaijan, Belarus, Belgium, Be-
lize, Bolivia, Bosnia Herzegovina, Brazil, Bulgaria, Cambodia, Canada, Cape Verde, Chile, China,Colombia, Costa Rica, , Cote d’Ivoire, Croatia, Cyprus, Czech Republic, Denmark, Dominica,Dominican Republic, Ecuador, Egypt, El Salvador, Estonia, Ethiopia, Fiji, Finland, France, Geor-gia, Germany, Ghana, Greece, Greenland, Guatemala, Guyana, Honduras, Hungary, Iceland, In-dia, Indonesia, Ireland, Israel, Italy, Japan, Jordan, Kazakhstan, Korea, Kyrgyz Republic, Latvia,Lebanon, Lithuania, Luxembourg, Macedonia, Madagascar, Malaysia, Maldives, Mali, Malta, Mau-ritius, Mexico, Moldova, Namibia, Netherlands, New Caledonia, New Zealand, Nicaragua, Niger,Nigeria, Norway, Pakistan, Paraguay, Peru, Poland, Portugal, Romania, Russian Federation, Rwanda,Saudi Arabia, Senegal, Singapore, Slovak Republic, Slovenia, South Africa, Spain, Sri Lanka, Swe-den, Switzerland, Tanzania, Thailand, Togo, Turkey, Uganda, United Kingdom, United States,Uruguay, Vietnam, Zimbabwe.
26
Related Documents