TRADE, ECONOMIC GROWTH AND QUALITY OF INSTITUTIONS IN ASEAN: A CASE STUDY A Thesis submitted to the Faculty of the Graduate School of Arts and Sciences of Georgetown University in partial fulfillment of the requirements for the degree of Master of Public Policy By Linh Bun, B.S. Washington, DC April 8, 2009

Welcome message from author
This document is posted to help you gain knowledge. Please leave a comment to let me know what you think about it! Share it to your friends and learn new things together.
Transcript

TRADE, ECONOMIC GROWTH AND QUALITY OF INSTITUTIONS IN ASEAN: A CASE STUDY
A Thesis submitted to the Faculty of the
Graduate School of Arts and Sciences of Georgetown University
in partial fulfillment of the requirements for the degree of
Master of Public Policy
By
Linh Bun, B.S.
Washington, DC April 8, 2009

TRADE, ECONOMIC GROWTH AND QUALITY OF INSTITUTIONS IN ASEAN: A CASE
STUDY
Linh Bun, B.S.
Thesis Advisor: Joydeep Roy, Ph.D.
Abstract
Widely debated among economists, the relationship between trade and growth has
been a hot topic in the era of globalization. Currently, there are many studies that support the
positive effects of trade on growth; on the other hand, some studies that caution us about the
correlation between trade and growth have been recently published. This paper examines the
effect of trade on growth in the ten countries of the Association of Southeast Asian Nations. It
employs both the ordinary least squares and instrumental variable regressions to investigate the
relationship between trade and growth. This paper will investigate into the effect of trade on
the growth rates of Real GDP Per Capita. Since geography greatly influences the unobserved
intra-trade share this paper includes the natural log of population and areas as proxy to account
for the large volume of intra-trade. Moreover, since the regressor trade share is correlated with
the factors that affect income the OLS regression of income on trade share is problematic. To
separate the effect of trade share on income from other factors, this paper employs the
constructed trade share (CTS) as the IV variable as in Frankel and Romer (1999). Lastly, the
geographical factor of the CTS is also correlated with factors that affect income such as the
Quality of Institutions. As a result, this paper will include Quality of Institution in the main
regression. The result of the paper suggests that both trade and Quality of Institutions
positively affect economic growth and Quality of Institutions has larger effect on economic
growth than trade and is statistically significant.
ii

I would like to extend my sincere thanks to Professor Joydeep Roy for spending
his valuable time to help me with this project. This thesis would not be possible
without his help, insight and guidance. I also would like to thank others whose names
are not mentioned here due to space constraint for their constructive comments.
iii

TABLE OF CONTENTS
1. Introduction…………………………………………………………………..…1
2. Literature Reviews……………………………………………………………...2
3. History of ASEAN……………………………………………………………...4
4. Why the Study of the Topic is Important………………………………….........6
5. Goal of the Paper: How This Paper is Different from Previous Studies…….....8
6. Theoretical Framework
6.1. The Comparative Advantage Models…………………………………….10
6.2. Channel in Which Trade Could Affect Income…………………………..11
6.3. The Gravity Model……………………………………………………….12
7. Empirical Framework
7.1. Main Regression Model………………………………….……………….12
7.1.1. Independent Variables
7.1.2. Dependent Variables
7.2. Instrumental Variable (IV) Regression Model…………...…………….....15
7.2.1. Independent Variables
iv
7.2.2. Dependent Variables
8. Results
8.1. Why the OLS Estimate is Larger Than the IV Estimate ……………..23
8.2. Why the t-statistics of IV Estimate is Small………………………………24
8.3. OLS and IV Regressions Without Country Dummy Variables……...........26
9. Discussions and Further Works
9.1. Comparison of Results with Frankel & Romer (1999)……………………27
9.2. Comparison with Rodrik and Rodriquez (2000)………………………….28
10. Policy Implications………………………………………………………….....28
11. Conclusion……………………………………………………………………..29
12. References……………………………………………………………………...31
13. Appendices
13.1. Graphs……………………………………………………………………35
13.2. Tables……………………………………………………………………38
13.3. Data Summary
13.3.1. Quality of Institutions…………………………….………………..44
v

13.3.2. World Development Indicators: GDP Per Capita (US$ 2000), GDP Per
Capita PPP (US$ 2005), Population, Trade
Share…………………….....................................................................44
13.3.3. Areas…………………………………………………………….…46
vi
1
I. Introduction
In recent years, the ASEAN member countries have experienced high economic
growth. The original goal of ASEAN is to help establish political stability in the region
by strengthening the cooperation among the 10 countries. In recent years, ASEAN has
also evolved to provide an important platform for economic cooperation among the
member countries. Among the important platforms is the ASEAN Free Trade Area
(FTA). The goal of the FTA is to eliminate most of tariffs and trade barrier between the
member countries and to increase trade flow between member countries. Recent trend
shows that trade among the ASEAN member countries have increased considerably.
This paper studies the effect of trade on the growth rates of Real GDP Per
Capita. Because intra-trade also has significant unobserved effect on income, based on
the Gravity Model, we include area and population in the regression as a proxy to
intra-trade. Moreover, Because of the correlation between the regressor, trade share,
with other factors that affect the growth rates of Real GDP Per Capita this paper will
employ the IV variable. Following Frankel and Romer (1999), this paper uses the
constructed trade share (CTS) as an instrumental variable to find the separate effect of
trade on the growth rates of Real GDP Per Capita. Since the IV, CTS, is also correlated
with other factors such as the Quality of Institutions that could affect income this paper
will also include the Quality of Institutions in the main regression equation.

II. Literature Reviews
The relationship between trade and growth has been a hot topic in debates
recently among economists. There are many empirical findings that support the
hypothesis that trade leads to higher growth rates, some of which includes Frankel and
Romer (1999), Dollar (2001), Sachs and Warner (1997). Contrary, there are also some
papers that disagree with the findings above; one includes the work of Rodrik and
Rodriquez (2000), which mentions some of the problems regarding the findings of the
papers that confirm a positive relationship between trade and growth such as those of
Jeffrey Frankel, David Dollar, Jeffrey Sachs and Andrew Warner. In recent years, there
are many empirical studies that investigate in the effect of international trade on
economic growth. Many of these literatures recognize the potential problem of
endogeneity in the regression of the effect of trade on economic growth. As a result,
the result of the Ordinary Least Square (OLS) estimate is biased and its interpretation
is not useful. Using the instrumental variable (IV) in the regression of the effect of
trade on economic growth could help provide better estimate.
The seminal paper by Jeffrey Frankel and David Romer (1999) is one of those
that attempt to solve the problem of endogeneity of trade in the regression. Frankel and
Romer’s paper point out that there is a problem of omitted variable since trade share is
correlated with other factors that affect Real GDP Per Capita in the regression. There is
also a problem of simultaneous equations and for instance, countries with high income
are likely to trade more as a result. In addition, Frankel’s paper suggests that using
2

trade policy instead of trade share does not solve the endongeneity problem. Instead,
Frankel and Romer use the constructed trade share as an instrumental variable for the
actual trade share in the cross-country instrumental variable regression of income on
trade share. In the regression of bilateral trade on proximity between countries,
country’s population, areas, dummy variables for landlocked countries and common
borders, he calculates the fitted value of the regression. He then uses it as the
constructed trade share and as an instrument for the regression of trade and income.
The instrument is assumed to be exogenous, i.e. it is unlikely to correlate with other
factors that affect income, and is likely to correlate with the actual trade share. The
gravity model in international trade proves the strong effect of geographical factor on
trade.
Even though there are many papers providing support of the positive effects of
trade on economic growth, the influential paper by Rodrik and Rodriquez (2000) also
gives us some important cautions in interpreting all the results of the correlation
between trade and growth. In their paper, Rodrik and Rodriquez (2000) offers us many
several criticisms of the interpretation of the result of many papers regarding the
positive effects of trade on growth. The authors mention that one of the problems in
many papers is the use of the share of a country’s trade as its measure of openness.
Rodrik and Rodriquez’s finding suggests that researchers should be cautious in their
interpretation of the cross country regression of the effect of trade on the growth rates
of income.
3

III. History of ASEAN
The Association of Southeast Asian Nations, ASEAN was established on
August 8, 1967 in Bangkok, Thailand and the founding members included Thailand,
Malaysia, Philippines, Singapore and Indonesia. The evolution of ASEAN is shown in
the following figure. According to the ASEAN Secretariat, the ASEAN region has
total area of 4.5 million square kilometers, a combined GDP of almost US$ 700 billion,
and a total trade of about US$ 850 billion.
The Evolution of ASEAN
ASEAN (5)
Thailand
(August 1967)
Singapore
(August 1967)
Malaysia
(August 1967)
Indonesia
(August 1967)
Philippines
(August 1967)
ASEAN (6)
Brunei Darussalam
(January 1982)
ASEAN (7)
Vietnam
(July 1995)
ASEAN (9)
Lao PDR
(July 1997)
Myanmar
(July 1997)
ASEAN (10)
Cambodia
(April 1999)
4

The basic agreement and cooperation among ASEAN is as follows:
The ASEAN Declaration states that the aims and purposes of the Association are: (i) to accelerate the economic growth, social progress and cultural development in the region through joint endeavors in the spirit of equality and partnership in order to strengthen the foundation for a prosperous and peaceful community of Southeast Asian Nations, and (ii) to promote regional peace and stability through abiding respect for justice and the rule of law in the relationship among countries in the region and adherence to the principles of the United Nations Charter.
ASEAN was originally created to address both political and economic concerns,
although their (ASEAN) purpose was mainly political. This was clearly stated in their
objective when the five original members, including Indonesia, Malaysia, Philippines,
Thailand and Singapore, signed the Treaty on Amity and Cooperation (TAC) at the
first ASEAN Summit on February 24, 1976. The goal of TAC is to promote peace and
stability in the region, and there are many other political accords of ASEAN that
follow TAC. However, as the Association progressed, trade and economic cooperation
among ASEAN’s members became an important part of ASEAN’s goal. When
ASEAN was formed, trade among its members was quite small and insignificant. Since
then, ASEAN has established many trade accords among its members. The Preferential
Trading Arrangement in 1977 (PTA), which provided tariff preferences for trading
among members of ASEAN, is the early and major stepping-stone toward economic
cooperation in ASEAN. Since then, the major development for ASEAN toward greater
economic cooperation among its members was the Framework Agreement on
5

Enhancing Economic Cooperation, which was adopted in 1992 in Singapore. This
accord also included the launching of the ASEAN Free Trade Area (AFTA).
ASEAN sets a Free Trade Area agreement, which leads to the elimination of
tariffs and non-tariffs barriers between members of the ASEAN countries by 2010. The
strategic objective of AFTA is to increase the ASEAN region’s competitive advantage
as a single production unit. The elimination of tariff and non-tariff barriers among the
member countries is expected to promote greater economic efficiency, productivity,
and competitiveness.
In 1997, the ASEAN leaders adopted the ASEAN Vision 2020. The accord
called for a highly competitive ASEAN Economic Region, in which there is a free flow
of goods, services, investments, capital, and equitable economic development and
reduced poverty and disparities among the member of ASEAN countries. ASEAN
cooperation has then resulted in greater regional integration. In the process, according
to the data from table 4 and table 5, from 1997 to 2003 both imports and exports
among ASEAN countries increase.
IV. Why the Study of the Topics is Important
The study of this paper on the effect of trade on economic growth is important
in several dimensions. Firstly, there are big disparities in real GDP per capita among
the members of ASEAN. One group, which includes Singapore, Thailand, Malaysia,
the Philippines, and Indonesia, is experiencing significantly greater economic growth
6

and high real GDP per capita and has more open trade policy. On the other hand, the
other group, which includes Cambodia, Vietnam, Lao People’s Democratic Republic,
Myanmar, and Brunei Darussalam, has a relatively low growth and real GDP Per
Capita. This disparity in the ASEAN member countries presents an interesting case
showing that the group with a higher real GDP per capita is more open to international
trade; whereas, the remaining ASEAN countries with lower real GDP per capita are
not as open to international trade. Particularly, members with economies that are more
open to trade grow more quickly.
Secondly, the recent growth and development of Vietnam and Cambodia have
improved since they became members ASEAN in 1995 and 1999, respectively.
Furthermore, the two countries have also adopted a more open trade policy with many
of the other ASEAN countries as well as the rest of the world. At the same time, the
economies of Lao PDR and Myanmar remain closed to the rest of the world. This
development provides an interesting case whether trade plays important role in the
development of Cambodia and Vietnam and whether this will be the case for the
remaining member of ASEAN such as Lao and Myanmar.
Thirdly, ASEAN has increasingly become an important trading bloc in Asia
over the years. ASEAN is also active in the region economically and politically. The
growth and development of ASEAN in the region plays an important role for the
region such as in the cooperation with China, Japan and Korea, as evident in the
inaugural East Asia Summit, which took place in Kuala Lumpur. Particularly, ASEAN
7

is negotiating for ASEAN-China FTA, ASEAN-Japan FTA and ASEAN-KoR FTA.
ASEAN has also held talks with New Zealand and Australia, and in fact, they are
progressing in the negotiations for the ASEAN-Australia-New Zealand FTA. Globally,
ASEAN also has much cooperation with the European Union and for instance, both
parties agree to establish a Vision Group to study a potential ASEAN-EU FTA.
Moreover, the United States, which is one of the largest trading partners of many
ASEAN member countries, is the negotiation process with ASEAN for possible future
Free Trade Agreement (FTA). This is clearly demonstrated in the signing of the
ASEAN-US Trade and Investment Framework Agreement in 2006. Hence, this helps
set up the future regional trade liberalization between the United States and the region
as a whole. In addition, as many previous studies, the study of this paper could have
important policy implication for ASEAN. Many of the member countries of ASEAN
have large population in poverty and helping them out of poverty is an important step.
V. Goal of the Paper: How This Paper is Different from Previous Studies
The approach herein is different from many previous papers particularly
Frankel’s paper in several ways. There are several reasons that I think this paper could
contribute to the research on the effect of international trade on economic growth.
Firstly, it focuses on the smaller region in Southeast Asia than those in Frankel’s paper.
The paper by Frankel and Romer shed light interestingly on the topic with the use of
geographical factor of trade as an instrument for the regression. While this paper is
similar to Frankel’s paper with regards to the regression model and the use of the
8

instrumental variable but it only focus on a particular region in Southeast Asian in
which inter and intra trades plays an important role in the economic development of
the region. In Frankel’s paper, he uses data on 150 and 98 countries around the world
from the Penn World Table (PWT). As a result, his regression might just capture the
average effect in many different countries while this paper would capture the unique
effect in ASEAN.
Secondly, from figure 3 and 4 in the appendix, they show that there were large
increases in trade among the member countries in ASEAN in 1997. Also, these
increases were for a short period of time. In a short period of time, it is unlikely that
other factors such as Population and Quality of Institutions that affect Real GDP Per
Capita could also change with such large magnitude. As result, this short-life increase
in trade is very useful and could help study the effect of trade share on income
separated from other factors.
In addition, even though the geographical factor does have strong relationship
with trade as predicted by the gravity model of trade theory it also has some issues
regarding the validity of its exogenous assumption with the error term in the regression.
Although income does not affect geography but geographical factors might affect
factors such as quality of institutions, natural resources and colonial history that could
in turn affect income and this point is also pointed out by Rodriquez and Rodrik (2000).
This paper will attempt to control for these factors by including several dimensions of
quality of institution and it will run two similar regressions in comparison. One
9

regression will focus on ASEAN with the constructed trade share mentioned above as
IV. The other regression will also constructed trade share as IV but it will also control
for factors such as quality of institutions and colonial history. This would allow use to
see if the geographical factors affect income directly or mainly through other factors
such as institutions. If the inclusion of the control variable in the regression equation
substantially affects the coefficient of trade share then it could be that non-
geographical factors affect income more than trade.
Moreover, the regression in Frankel’s paper uses data from the PWT in 1985
while this paper will use times series data for all the ASEAN member countries. Hence,
the regression in this paper could also capture the evolution and the fixed effect of
trade and economic growth in ASEAN over the years.
VI. Theoretical Framework
A. The Comparative Advantage Models:
Theory of international trade suggests that trade could allow country to reach
economy of scale in production. In this case, country will be able to focus more on
producing certain goods that it has competitive advantages, i.e. it could do well, rather
than focus on producing variety of goods with low efficiency. Ultimately, this will
allow country to become more efficient and as a result, they can gain more in trade.
There are two main models of the Theory of Comparative Advantage, the Ricardian
Model and the Heckscher-Ohlin Model. The Ricardian model points out that
10

international trade occurs mainly due to differences in countries particularly labor
productivity. As a result, it shows that countries could gain from trade. Intuitively,
trade allows country to focus on producing goods that it do well and then trade for
other goods. Since each partners specialize in producing certain goods this will allow
for the increase in total productions and hence, provide more consumption and income.
The model predicted that country will export goods that its labor could produce more
efficiently, comparative advantage, and import goods that its labor could not do so. At
the same time, the Heckscher-Ohlin model suggests that there is international trade
because there is different in factor of endowments across countries while their
technology remains the same. As a result, countries benefit from trade because of
diversification of products that they otherwise could not produce by themselves. Under
the Ricardian model, with international trade, the total production is higher compared
to the case of closed economy. On the other hand, under the Heckscher-Ohlin, the total
production is the same in open economy as to closed economy but countries still
benefit because consumers benefit from product diversification.
B. Channels in Which Trade Could Affect Income:
Potentially, there are many channels in which trade could affect income. Firstly,
trade between countries could help increase the growth of productivity of the country
and this feature is illustrated in the spill-over of knowledge, exchange of ideas and
technology between trading partners. Local firms will benefit from learning and
reusing or modifying existing technology of foreign firms when trade occurs. Secondly,
11
trade provides the consumers to be exposed to new variety of goods that do not exist in
the local market. This means that trade gives way to expansion of the consumption
possibility. It also opens up new dimensions that local entrepreneur could take
advantage. Moreover, trade also allows country to specialize in certain areas, which
also helps increase productivity. Ricardian model suggests that country should exports
goods that it has comparative advantage.
C. The Gravity Model:
Under this model, bilateral trade between two countries is proportional to the
product of the country’s GDPs and it also mentioned that relative size of countries also
directly affects bilateral trades between two countries. In particular, it predicts that
countries with high incomes or GDPs tend to trade more with each and countries with
similar in relative sizes also tend to trade more with each other. Historical works
especially those Tinbergen, Nobel Laureates in Economics, supported these predictions.
As a result, this solidifies the significant and validity of this model. This paper will use
this model to justify the appropriate use of the instrumental variable and its validity. As
a result, the use of country’s size and population is directly related to country’s
bilateral trade as predicted by this model.
VII. Empirical Framework
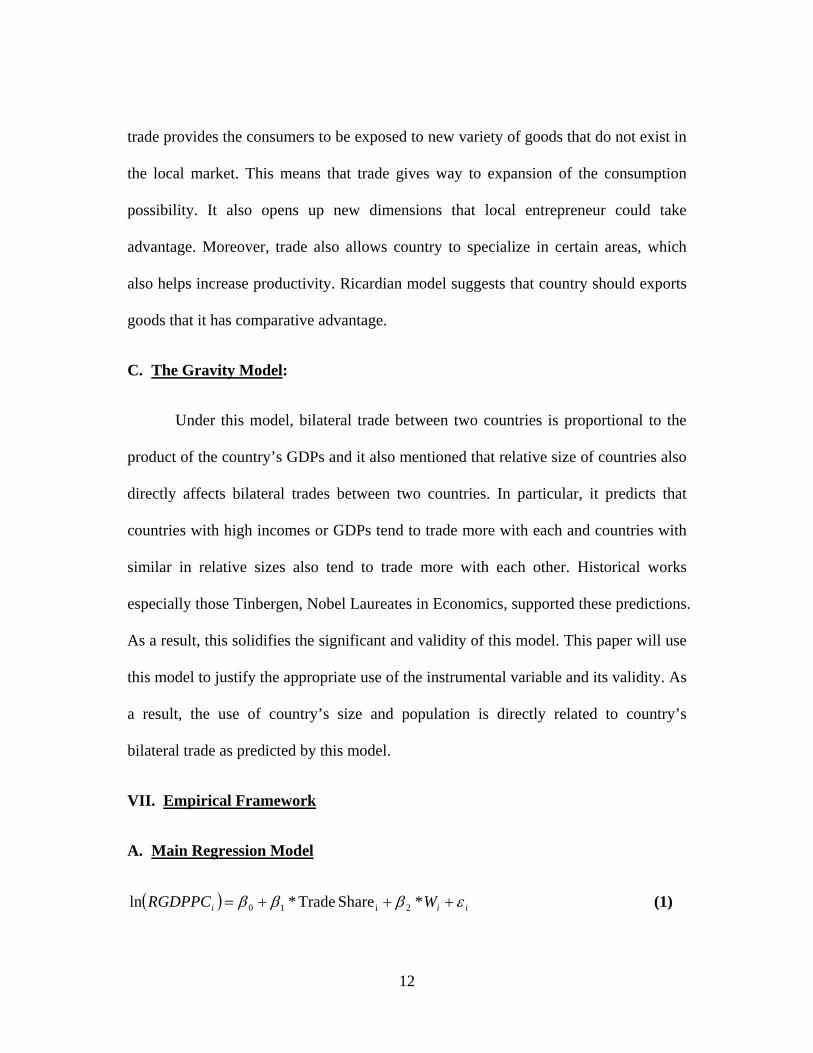
A. Main Regression Model
( ) iii WRGDPPC εβββ +++= *Share Trade*ln 2i10 (1)
12

iii SW ξγα ++= * (2)
( ) ( ) iiii SRGDPPC εξγαβββ +++++= **Share Trade*ln 2i10 (3)
( ) ( ) ( )iiii SRGDPPC εξβγββαββ +++++= ***Share Trade**ln 22i120 (4)
Second Stage Regression:
( ) ( ) ( ) ( ) iiiii QAPRGDPPC υλλλλλ +++++= ln*ln*ln*Share Trade*ln 543i21 (5)
1. Independent Variables
Share Trade is the amount of trade as a percentage of GDP and in this case,
trade is the sum of imports and exports.
iP is the total population of country i in the regression and data and is the
total areas of country i. Basically, these two independent variables represent the size of
the country as stated in the Gravity model.
iA
Qi represents the quality of institutions for country i. Qi is taken from the
World Governance Indicators of the World Bank. Each of these variables is used to
measure the quality of institutions along 6 dimensions and they are: Voice and
Accountability, Political Stability and Absence of Violence/Terrorism, Government
Effectiveness, Regulatory Quality, Rule of Law and Control of Corruption.
While the Gravity model predicted that the size of the country is directly related
to trade, geographical component of trade, CTSi, that might not be an appropriate
13

instrument. Although country’s income or Real GDP Per Capita does not affect
geography it is very likely that geography could affect many variables especially the
quality of institutions that could in turn affect income. As a result, controlling for the
quality of institution could help improve the quality of the instrument and the estimated
coefficient of trade share. It is also interesting in providing us a mechanism to test
whether CSTi is a good instrument. We expect to see a positive effect of the quality of
institutions on income. Countries with good quality of institutions will be likely to
facilitate economic activities and other factors that could positively affect income. We
expect to see a positive correlation between the two variables, income and quality of
institutions.
2. Dependent Variables
iRGDPPC
i
is the Real GDP Per Capita of country i in the data. The data for
of the ASEAN countries are in US$. RGDPPC
The main regression equation that we are interested in is equation (5) and in
this equation we are mainly interested in the relationship between and
. More specifically, we are interested in the magnitude of the parameter
iRGDPPC
Share Trade
2λ and it is interpreted the percentages of change in as a result of one
percentage of change in .
iRGDPPC
Share Trade
14
B. Instrumental Variable (IV) Regression Model
( ) ( ) ( ) ijiiji
ij SSDGDPBilat
ζρρρρ ++++=⎟⎟⎠
⎞⎜⎜⎝
⎛ln*ln*ln*ln 4321 (6)
( ) ( ) ( ) ( ) ( )
( ) ( ) ( )( ) ( ) ( ) ( ) ctjiijjijjijiij
iijijijijji
jjiiiji
ij
LLBABPBAB
PBDBBLL
APAPDGDPBilat
ζρρρρ
ρρρρ
ρρρρρρ
++++++
+++++
+++++=⎟⎟⎠
⎞⎜⎜⎝
⎛
**ln**ln**ln**
ln**ln****
ln*ln*ln*ln*ln*ln
14131211
10987
654321
(7)
( )∑≠
=ij
i valuefittedCTS exp (8)
First Stage Regression:
iiCTS ψμμ ++= *Share Trade 21 (9)
1. Independent Variables
Dij is the distance between countries i and j. To calculate this distance, we use
the great-circle distance between the principle cities between the two countries. The
great-circle distance is simply the measurement of the shortest distance between two
on a sphere rather than a flat surface. For picking the principle city, we try to find the
city that satisfies most of the following criteria: centrally located, large population,
important economic and financial center. In the case of ASEAN, capital cities in most
of ASEAN countries satisfy the criteria above with the exception of Vietnam. For
15

Vietnam, we used Ho Chi Minh city as the principle city instead the capital city Hanoi.
Pi and Ai are described above.
Bij is the dummy variable for whether country i and j have common border.
Li is the dummy variable for whether country i is landlocked or not. General,
Lao is the only country in ASEAN that is landlocked.
2. Dependent Variables
i
ij
GDPBilat
is the ratio of Bilateral trade between country i and j and GDP of
country i.
CSTi is the fitted value of the regression above. Basically, after the regression,
we evaluate equation (7) at the value of the coefficients that result from the regression.
The main regression equation that we are interested in is equation (8) and
particularly, we mainly interested in the relationship between trade share and CTSi. As
predicted by the Gravity model, we should expect to have a positive coefficient from
the regression and the magnitude of the coefficient should expect to be large.
Relationship between trade share and CTSi is also important in determining the quality
of the instrument. High value of the coefficient means that there is high correlation
between the two variables while small value of the coefficient indicates that the
instrument is weak.
16

Main Regression
This paper will focus on the following main regression equation. It will
investigate into the effect of trade share on the growth rates of Real GDP Per Capita.
We are interested in the regression of the natural logarithm of Real GDP Per Capita on
trade share. Hence, it will see how changes in growth rates on Real GDP Per Capita as
a result of the changes in trade share.
( ) iiRGDPPC υλλ ++= i21 Share Trade*ln (10)
Frankel & Romer (1999)
In the paper by Frankel and Romer (1999), they include intra-country trade in
the regression equation as stated in the following equation. Wi in the regression
equation accounts for intra-country trade. For their case, they use the natural log of
population and natural log of areas to represent inter-country trade. Based on the
Gravity model, country’s size represent a significant factors that could affect both trade
within the country and trade between countries. In practice, intra-trade is often a lot
larger than international trade but hard to measure. Countries that are large in size such
as population and areas will have larger intra-trade and international trade.
( ) iii WRGDPPC εβββ +++= *Share Trade*ln 2i10 (11)
As a result, we will include the natural logarithm of Population and Areas in the
regression equation.
17
( ) ( ) ( ) iiii APRGDPPC υλλλλ ++++= ln*ln*Share Trade*ln 43i21 (12)
Problem of Trade Share as a Regressor
However, in the main regression above, using trade share as the regression is
problematic. This is because trade share is correlated with other factors that could
affect the growth rates Real GDP Per Capita. For instance, country might choose to
have major institutional, market liberalization and free trade reform at the same time
and as a result, it is hard to distinguish the separate individual effect of all the three
changes above on the growth rates of Real GDP Per Capita.
Instrument Trade Share with Constructed Trade Share
To solve the problem above, we need to use the instrumental variable in the
regression to help distinguish the separate individual effect of trade share on the
growth rates of Real GDP Per Capita. The paper will follow Frankel and Romer (1999)
and it will use the constructed trade share (CTS) as an instrumental variable.
According to the Gravity model, the CTS is highly correlated with trade share and it is
also assumed to be uncorrelated with other factors that could affect the growth rates of
Real GDP Per Capita. Since CTS is uncorrelated with other factors then any changes in
CTS will result in changes in trade share that is not related with changes with other
factors. As a result, we should be able to indentify only the effect of trade share on the
growth rate of Real GDP Per Capita. Basically, the paper use the result predicted by
the Gravity model, i.e. geography including size and distance influence international
trade and from this result, we constructed the geographical factor of trade and use it as
18
an instrumental variable. After running the regression equation below, we used the
estimates to calculate the fitted value of the natural logarithm of the ratio of bilateral
trade and GDP, i.e. we plug in the value of the estimates in the equation, and these
values are the CTS.
( ) ( ) ( ) ( ) ( )
( ) ( ) ( ) ( )( ) ( ) ( ) ( ) ctjiijjijjijiij
iijijijijji
jjiiijj
ij
LLBABPBAB
PBDBBLL
APAPDGDPBilat
ζρρρρ
ρρρρ
ρρρρρρ
++++++
+++++
+++++=⎟⎟⎠
⎞⎜⎜⎝
⎛
**ln**ln**ln**
ln**ln**ln*ln*
ln*ln*ln*ln*ln*ln
14131211
10987
654321
(13)
Problem with CTS: Use of Quality of Institution
As noted above, the use of CTS depends heavily on the assumption that it is not
correlated with other factors that could affect Real GDP Per Capita. However, it might
not always the case that this assumption holds. It is true that Real GDP Per Capita does
not affect geographical factors. At the same time, according to Rodrik and Rodriquez
(2000), it might be the case that geography could have significant effects on Real GDP
Per Capita through many channels. For instance, countries location could heavily affect
its colonial history and hence, the Quality of its Institutions. It might also the case that
geography also affects quality of human capital through diseases. As a result, this
could well affect its growth rates of Real GDP Per Capita. As a result, we need to
control for Quality of Institutions. Controlling for Quality of Institutions allows us to
fix one factor that geography could affect the growth rates of Real GDP Per Capita. If
the inclusion of the variables of the Quality of Institutions significantly reduces the
19

estimated effect of trade share on growth rates of Real GDP Per Capita then it could be
the case the Quality of Institutions is important and must be included in the regression
equations. Frankel and Romer also mentioned that including other non-geographical
factors of trade that are uncorrelated with factors that could affect the income in the
regression equation could help improve the result of the estimate of the effect of trade
share on growth rates of Real GDP Per Capita. Lastly, the main regression equation
will also include the Quality of Institutions.
( ) ( ) ( ) ( ) iiiii QAPRGDPPC υλλλλλ +++++= ln*ln*ln*Share Trade*ln 543i21 (14)
Variables of the Quality of Institutions
The paper will use the 6 variable of measure of the Quality of Institution from
the Worldwide Governance Indicators of the World Bank. These variables include:
Rule of Law, Control of Corruption, Government Effectiveness, Political
Stability/Absence of Violence or Terrorism, Regulatory Quality, Voice and
Accountability. These variables are subjective measures of the Quality of Institutions.
It is based on the perception of public opinions on the government through survey and
NGOs. They are ranging from -2.5 to 2.5 although variables of few countries might be
outside this range. They also have mean 0 and standard deviation of 1.
VIII. Results
From the result of the OLS regression, we have that one percent increase in
trade share in the ASEAN countries will, on average, result in about 0.003 percent
20

increase in Per Capita Real GDP in the member countries of ASEAN. In this case, the
coefficient is statistically significant with the t-statistic of 5.95. Moreover, controlling
for international trade and countries differences, one unit increase in Quality of
Institution (Rule of Law) will result in 0.115 percent increase in Per Capita Real GDP
on average in the ASEAN countries. Quality of Institution (Rule of Law) measurement
ranges from -2.5 to 2.5 and in this case, a unit change in Quality of Institution
represents significant changes. Practically, 0.2 increases in Quality of Institution (Rule
of Law) will result in 0.023 percent increase in Per Capita Real GDP.
The coefficient of Quality of Institution (Rule of Law) is significant as the t-
statistics is 2.43. Generally speaking, the result also suggests that country’s size,
including total areas and population, affects income positively. This is generally in line
with our intuition that controlling for international trade, in larger countries, their
citizens will engage more in intra-trade than those of small countries. For instance, one
percent increase in total population could increase Per Capita Real GDP by 1.43
percent but one percent increase in total areas will decrease Per Capita Real GDP by
0.73 percent. Using total areas and population as proxy for country size, the result of
the regression suggests that generally, one percent increase in country size could result
in 0.7 percent increase in income, Per Capita Real GDP. In addition, the coefficients of
total areas and population are both statistically significant with t-statistic of -16.25 and
9.69 respectively.
From the result of the IV regression, one percent increase in trade share could
result in 0.004 percent increase in Per Capita Real GDP on average with significant t-
21

statistics of 3.99. At the same time, one percent in crease in Quality of Institution (Rule
of Law) will result in 0.092 percent in crease in Per Capita Real GDP with marginally
significant t-statistics of 1.83. Similar with the result of the OLS regression, intra-trade
still positively affects income, Per Capita Real GDP. In particular, once percent
increase in the country size, total areas and population, could increase Per Capita Real
GDP by 0.6 percent with t-statistics of -6.86 and 6.29 for total areas and population
respectively. Interestingly, the signs and magnitude of the coefficients of total areas
and population does not differ much from the OLS regression.
Increasing total population by one percent could increase Quality of Institution
(Rule of Law) by 0.41 percent while increasing total areas by one percent could
decrease Quality of Institutions by 0.49 percent. As noted above, Quality of Institution
(Rule of Law) ranges from -2.5 to 2.5 and hence, 0.49 percent increase signifies a very
small increase in absolute value of Quality of Institutions. Both coefficients are
statistically significant and generally speaking, the result of the regression suggests that
increasing country size will negatively affect Quality of Institutions (Rule of Law).
Similar results also hold using other index for Quality of Institution from the
Worldwide Governance Indicators of the World Bank and those includes Government
Effectiveness, Regulatory Quality, Peace and Stability, Control of Corruption, Voice
and Accountability. From the result, it is suggested that country size, total areas and
population, seems to have negative effects on Quality of Institution (Rule of Law).
Upon close review, this might be mainly due to the particular feature of ASEAN
22

countries. ASEAN is a very diverse organizing and its members consist of countries
with very different political institutions and rule of law.
A. Why the OLS Estimate is Larger Than the IV Estimate
As suggested in Frankel and Romer (1999), since there is a positive correlation
between trade share and the error term then it is the case that the OLS estimate will
overstate. For simplicity, assuming that we are only investigating the effect of trade
share on income, Per Capita Real GDP, only.
The structural model:
( ) iiRGDPPC υλλ ++= i21 Share Trade*ln (15)
( )( )
( )( )i
2i Share TradeShare Trade d
dd
RGDPPCd ii υλ += (16)
Under the OLS, we assume that there is no correlation between trade share and
the error term and hence, we have that ( )
( ) 0Share Trade i
=d
d iυ and in this case the OLS
estimator is unbiased and consistent. However, since there is positive correlation
between trade share and the error term then we have that ( )
( ) 0Share Trade i
⟩d
d iυ and by
using the instrumental variable, under which case we assume that ( )
( ) 0Share Trade i
=d
d iυ .
As a result, we expected that the estimate using the IV is 2λ and that the estimate using
23

the OLS is ( )( )i2 Share Traded
d iυλ + when ( )
( ) 0Share Trade i
⟩d
d iυ . Hence, it should be the
case that the estimates using the OLS is larger than the estimate using the IV regression.
The result of this paper is similar with those of Frankel and Romer (1999) in
the sense that the estimate of coefficient on trade share is higher under the IV
regression using the IV than it is when OLS is used. More importantly, this result
contradicts what is suggested above.
I will try to come up with this over the weekend.
From the result of the regression above, increasing total population by one
percent increase Quality of Institution (Rule of Law) by 0.41 percent while increasing
total areas by one percent could decrease Quality of Institutions by 0.49 percent. Both
coefficients are statistically significant and generally speaking, the result of the
regression suggests that increasing country size will negatively affect Quality of
Institutions (Rule of Law). Similar results also hold using other index for Quality of
Institution from the Worldwide Governance Indicators of the World Bank and those
includes Government Effectiveness, Regulatory Quality, Peace and Stability, Control
of Corruption, Voice and Accountability.
B. Why the t-statistics of IV Estimate is Small
1. Small Sample:
It could be the case that the result is biased toward small t-statistics because of
small number of observations available. In this paper, due to the constraint of the
24

availability of the data on Quality of Institutions (Rule of Law) from the World Bank,
we could only have 103 observations for all the 10 ASEAN countries for each of the
index of Quality of Institutions. We suspect that this might contribute to the small t-
statistics in the result of the IV regression. Moreover, the data from the Worldwide
Governance Indicators are only from 1996, 1998, 2000, 2002, 2003, 2004, 2005, 2006,
and 2007. In this case, for those missing years, the paper uses the average between the
previous and after the current years to impute for their values.
2. Measurement Error:
The Worldwide Governance Indicators are the latest index variables that could
be used to measure the Quality of Institutions and currently, it is one of the most
reliable and comprehensive data sources available. It uses and combines various
respected and well known survey data to calculate the Quality of Institutions index.
However, as pointed out in their publication, it might be the case that the index might
not be a very good proxy for Quality of Institutions.
3. Irrelevant Variable:
Lastly, it could be just the case that the variable included in the regression does
not belong to the regression equation and it is irrelevant to the regression equation
investigated. Hence, it has no significant effects on the equation.
25

C. OLS and IV Regressions Without Country Dummy Variables
From the result of the regression in table 8 and 9, we can conclude the following trade
offs:
1. Different Results:
From table 8, the coefficients of trade share are both negative in the OLS and
IV regressions and this was not the case when the country dummy variables are
included in the regression equation. The same also holds true for the coefficients on
LN(Total Population), which were both positive with the country dummy variables but
negative without them.
2. More Variations:
Also, from the result of table 8, it shows that there were fewer variations of the
estimates in the OLS and IV regressions when the country dummy variables are
included then when they are not included. This could be attributed to the fact that since
Quality of Institutions (Rule of Law) changes slowly and very little over time and
hence, small variations from Quality of Institutions. As a result, all of the other
variations are absorbed by the country dummy variable and in this case, fewer
variations occur when the regressions equations included the country dummy variables.
26

IX. Discussions and Further Works
A. Comparison of Results with Frankel & Romer (1999)
From the result of the regression tables above, we can see that the magnitude
of the coefficients of trade share in the IV regression in this thesis is much smaller than
those in Frankel & Romer (1999). From table 3 in Frankel and Romer (1999), the
coefficient of trade share in the IV regression is 1.97 while it is 0.004 in the IV
regression in this paper. One possible reason is that trade among members of the
ASEAN countries are still small compared to trade between the ASEAN countries and
the rest of the world especially the U.S. and Japan. According to the ASEAN
Secretariat, the data suggests that while trade between the member of ASEAN
countries are growing it is still small then trade between ASEAN countries and the rest
of the world. From the ASEAN Secretariat, in 2006, intra-ASEAN trade was $353
billion while extra-ASEAN trade was $1,052 billion. At the same time, according to
Frankel and Romer (1999), they used the data available data on bilateral trades with all
countries and hence, this includes more trading partners for each countries than those
used in this paper.
However, the result of the estimates of the coefficient of trade share from
OLS and IV regressions of this paper are similar with those of Frankel and Romer
(1999) in that the estimate of the coefficient of trade share from the IV regression is
larger than the estimate of the OLS regression.
27
B. Comparison with Rodrik and Rodriquez (2000)
Rodrik and Rodriquez (2000) suggests that the instrumental variable used by
Frankel and Romer (1999) is no valid. They argued that the instrumental variable could
be correlated with other factors that could affect income and in this case, geographical
factors in trade, used as instrumental variable in Frankel and Romer (1999), could
affect the Quality of Institutions and public health that could ultimately affect income.
They ran regression including various geographical factors variables and the results
show that the estimate of the coefficient of trade share is no longer significant and the
estimates of the geographical variables are large and significant. The geographical
factors that are used by Rodrik and Rodriquez (2000) are country distance from the
equator, percentage of the country’s land area that is in the tropics, set of regional
dummy variables.
The results of IV regression of this paper suggest that Quality of Institutions
has large effect on income and that, it belongs to the regression. At the same time, it is
important to note that geographical factors that are used in this paper are different from
those used by Rodrik and Rodriquez (2000).
X. Policy Implications
From the result of the IV regression in table 2, we can conclude that among the
ASEAN countries Quality of Institutions (Rule of Law) will on average have larger
effect on income, Per Capita Real GDP, than trade share. One main suggestion of the
28

paper is that trade share does not seem to have large impact on economic growth as
suggested. The results did not suggest that trade does not have impact on economic
growth but they give us caution when advocating for trade policy at the expense of
other important policy. In the world of limit and constraint resource, it is important that
policy makers use their available resources to the most effective policy in addressing
their needs. On the other hand, it is also important to realize that in general, it requires
time and effort to change institutions.
XI. Conclusion
In short, there were many previous literatures suggesting the positive effect of
trade on economic growth but the results of this paper provide us evidence that in the
member countries of ASEAN, trade is not as important as Quality of Institutions in the
ASEAN countries. Moreover, due to the explosion in trade especially exports in the
East Asia Tigers, South Korea, Taiwan, Hong Kong and Singapore, during their high
economic growth period, there were many strong advocates of the possibility of export
led growth and strong exports in these East Asia countries led to them to experience
tremendous economic growth. The results of this paper give us cautions about the only
importance of trade in economic growth in the ASEAN countries. While it is important
for growth but there are also other factors that could also affect economic growth such
as Quality of Institutions. Rodrik, Grossman, and Norman (1995) also cautions us
about the positive correlation between trade and economic growth in the South Korea
and Taiwan. Both trade and Quality of Institutions positively affect economic growth.
29
Given limit resource available especially the developing countries, policy makers in
these countries should be judicious in their policy for economic development as there
are other alternative that could also be at least as effective in enhancing economic
growth as trade policy. While for some countries it requires time and effort to change
the Quality of Institutions it might not be the case for others. In short, policy makers
should approach their policy options appropriately according to their particular
situation in achieving economic growth.
30

XII. References
Acemoglu, Daron, and Simon Johnson. 2005. “Unbundling Institutions.” Journal of
Political Economy 113(5): 949-995.
Acemoglu, Daron, Simon Johnson, and James Robinson. 2001. “The Colonial Origins
of Comparative Development: An Empirical Investigation.” American
Economic Review 91(5): 1369-1401.
ASEAN Secretariat. “Overview Association of Southeast Asian Nations.”
http://www.aseansec.org/64.htm (accessed November 1, 2008).
ASEAN Secretariat. “External Trade Statistics.”
http://www.aseansec.org/Stat/Table18.pdf (accessed November 1, 2008).
Cameron, Colin, and Pravin Trivedi. 2005. Microeconometrics: Methods and
Applications. United States of America: Cambridge University Press.
Dollar, David, and Aart Kraay. 2004. “Trade, Growth and Poverty.” Economic Journal,
114(493): F22-F49.
Dollar, David, and Aart Kraay. 2003. “Institution, Trade and Growth.” Journal of
Monetary Economics, 50(493): 133-162.
Dollar, David, and Aart Kraay. 2002. “Spreading the Wealth.” Foreign Affairs, 81(1):
120-133.
31
Dollar, David, and Aart Kraay. 2003. “Institutions, Trade and Growth: Revisiting the
Evidence.” World Bank.
Frankel, Jeffrey, and David Romer. 1999. “Does Trade Cause Growth?” American
Economic Review, 89(3): 379-399.
Glaeser, Edward, Rafael La Porta, and Andrei Schleifer. 2004. “Do Institutions Cause
Growth?” Journal of Economic Growth, 9: 271-303.
Greene, William. 2008. Econometric Analysis, 6th ed. Prentice Hall.
Hall, Robert, and Charles Jones. 1999. “Why Do Some Countries Produce So Much
More Output Per Worker Than Others.” The Quarterly Journal of Economics.
114(1): 83-116.
Kaufmann, Daniel, Aart Kraay, and Massimo Mastruzzi. 2008. “Governance Matters
VII: Aggregate and Individual Governance Indicators 1996-2007”: The World
Bank Development Research Group Macroeconomics and Growth Team &
World Bank Institute Global Governance Program, Policy Research Working
Paper No. 4654.
Levine, Ross, and David Renelt. 1992. “A Sensitivity Analysis of Cross-Country
Growth Regressions.” American Economic Review 82(4): 942-963.
Pindyck, Robert, and Daniel Rubinfeld. 1998. Econometric Models and Economic
Forecasts, 4th ed. Singapore: McGraw-Hill.
32

Rodrik, Dani, and Francisco Rodriquez. 2000. “Trade Policy and Economic Growth: A
Skeptic’s Guide to the Cross National Evidence.” University of Maryland and
John F. Kennedy School of Government Mimeo.
Rodrik, Dani, Gene Grossman, and Victor Norman. 1995. “Getting Interventions Right:
How South Korea and Taiwan Grew Rich” The Center for Economic Policy
Research, Center for Economic Policy and the Maison des Sciences de l’Homme
10(20): 55-107.
Sachs, Jeffrey, and Andrew Warner. 1995. “Economic Reform and the Process of
Global Integration.” Brookings Paper on Economic Activity 1:1-118.
The Center for International Comparisons at The University of Pennsylvania. “The
Penn World Table 6.2.” http://pwt.econ.upenn.edu/php_site/pwt_index.php
(accessed November 1, 2008).
The International Monetary Fund. “Direction of Trade Statistics.”
http://www.imfstatistics.org/DOT/ (accessed November 1, 2008).
The International Monetary Fund. “International Financial Statistics.”
http://www.imfstatistics.org/IMF/imfbrowser.aspx?branch=ROOT (accessed
November 1, 2008).
The United States Trade Representative. 2006. “U.S. Trade Representative Susan C.
Schwab Meets with ASEAN Economic Ministers and Signs TIFA.”
33

http://www.ustr.gov/Document_Library/Press_Releases/2006/August/US_Trade_
Representative_Susan_C_Schwab_Meets_with_ASEAN_Economic_Ministers_S
igns_TIFA.html (accessed November 1, 2008).
The World Bank Group. “World Development Indicator Online.”
http://devdata.worldbank.org.floyd.lib.umn.edu/dataonline/ (accessed November
1, 2008).
The World Bank Institute. “Worldwide Governance Indicators Online.”
http://info.worldbank.org/governance/wgi/index.asp (accessed November 1,
2008).
34

XIII. Appendices A. Graphs and Figures
Figure1: % Real GDP Per Capita: Malaysia, Vietnam, Indonesia, Thailand, Philippines
-16
-14
-12
-10
-8
-6
-4
-2
0
2
4
6
8
10
12
14
1980 1982 1984 1986 1988 1990 1992 1994 1996 1998 2000 2002 2004 2006 2008
Years
% R
eal G
DP
Per C
apita
Thailand
Indonesia
Malaysia
Vietnam
Philippines
s
Figure 2: % Real GDP Per Capita: Cambodia, Lao, Myanamar
-16
-14
-12
-10
-8
-6
-4
-2
0
2
4
6
8
10
12
14
16
1980 1982 1984 1986 1988 1990 1992 1994 1996 1998 2000 2002 2004 2006 2008
Years
% R
eal G
DP
Per C
apita
Lao PDR Cambodia
Myanmar
35

Figure 3: Thailand, Vietnam, Malaysia, Indonesia and Philippines Total Trade with ASEAN Countries
0
5000
10000
15000
20000
25000
30000
35000
40000
45000
50000
55000
60000
65000
70000
75000
80000
85000
90000
1980 1982 1984 1986 1988 1990 1992 1994 1996 1998 2000 2002 2004 2006 2008Years
Tota
l Vol
ume
of T
rade
in M
illio
ns o
f US$
Thailand
Vietnam
Malaysia
Indonesia
Philippines
Figure 4: Cambodia, Lao and Myanmar Total Trade with ASEAN Countries
0
500
1000
1500
2000
2500
3000
3500
4000
4500
5000
5500
1980 1982 1984 1986 1988 1990 1992 1994 1996 1998 2000 2002 2004 2006 2008
Years
Tota
l Vol
ume
of T
rade
in M
illio
ns o
f US$
Cambodia
Lao
Myanmar
36

Figure 5: Actual Versus Constructed Trade Share
0
50
100
150
200
250
300
350
400
450
500
0 20 40 60 80 100
Constructed Trade Share (In Percentage)
Act
ual T
rade
Sha
re (I
n Pe
rcen
tage
)
120
37

B. Tables Table 1:
The Result of The OLS & IV Regressions Using Constructed Trade Share as an Instrument
Dependent Variable Independent Variable LN(Real GDP Per Capita)
OLS IV Regression
Trade Share
0.003 (0.0004)
0.004 (0.001)
LN(Total Areas)
-0.735 (0.045)
-0.655 (0.083)
LN(Total Population)
1.431 (0.148)
1.300 (0.182)
Quality of Institution: Rule of Law
0.115 (0.048)
0.101 (0.048)
Constant
-7.716 (2.043)
-6.693 (2.166)
Brunei
6.292 (0.414)
6.121 (0.427)
Cambodia
(Base Country) (Base Country)
Indonesia
-1.145 (0.359)
-0.917 (0.401)
Lao
1.938 (0.138)
1.847 (0.155)
Malaysia
1.409 (0.132)
1.352 (0.137)
Myanmar
-1.184 (0.164)
-1.015 (0.217)
Philippines
-1.331 (0.267)
-1.119 (0.318)
Singapore
(Base Country) (Base Country)
Thailand
0.126 (0.234)
0.251 (0.251)
Vietnam
-1.762 (0.261)
-1.579 (0.298)
Note: Standard errors are in parenthesis under the respective coefficient.
38

Table 2:
The Result of The First Stage Regression
Dependent Variable Independent Variable
Trade Share Constructed Trade Share 0.750
(0.175) LN(Total Areas) -59.629
(7.168) LN(Total Population) 68.681
(31.129) Quality of Institution: Rule of Law
2.290 (10.251)
Constant -305.743 (445.050)
Brunei 40.664 (90.037)
Cambodia
(Base Country)
Indonesia -97.759 (77.283)
Lao 33.054 (30.227)
Malaysia 58.189 (27.354)
Myanmar -105.431 (33.211)
Philippines -99.535 (57.245)
Singapore
(Base Country)
Thailand -36.871 (51.242)
Vietnam -82.740 (55.951)
Note: Standard errors are in parenthesis under the respective coefficient.
39

Table 3:
The Result of The OLS Regression of Quality of Institutions on Geographical Characters
Dependent Variable Independent Variable
Quality of Institution: Rule of Law LN(Total Areas) -0.322
(0.060) LN(Total Population) -0.823
(0.292) Constant 16.290
(4.077) Brunei -2.513
(0.863) Cambodia
(Base Country)
Indonesia 3.347 (0.681)
Lao -0.636 (0.287)
Malaysia 2.271 (0.161)
Myanmar 1.193 (0.304)
Philippines 2.305 (0.502)
Singapore
(Base Country)
Thailand 2.945 (0.400)
Vietnam 2.224 (0.500)
Note: Standard errors are in parenthesis under the respective coefficient.
40

Table 4:
The Result of The IV Regression Using Constructed Trade Share as an Instrument
Dependent Variable Independent Variable LN(Real GDP Per Capita)
(1) (2) (3) (4) Trade Share
0.006 (0.003)
0.006 (0.003)
0.003 (0.0008)
0.005 (0.002)
LN(Total Areas)
-1.333 (0.643)
6.838 (0.998)
-0.892 (0.060)
10.329 (0.419)
LN(Total Population)
1.397 (0.421)
1.388 (0.432)
1.897 (0.173)
2.374 (0.160)
Quality of Institution: Rule of Law
0.196 (0.070)
0.197 (0.071)
-0.093 (0.056)
-0.111 (0.057)
Constant
-0.182 (1.821)
-98.962 (18.741)
-13.760 (2.231)
-157.692 (7.170)
Brunei
7.702 (0.452)
Cambodia
(Based Country)
(Based Country)
(Based Country)
(Based Country)
Indonesia
0.480 (0.298)
-18.786 (3.655)
-1.999 (0.401)
-29.698 (1.362)
Lao
2.200 (0.425)
(Based Country)
2.470 (0.151)
(Based Country)
Malaysia
1.349 (0.526)
-3.551 (0.594)
1.421 (0.113)
-5.728 (0.360)
Myanmar
(Based Country)
Philippines
-0.996 (0.453)
-5.107 (-5.107)
-1.990 (0.312)
-8.463 (0.474)
Singapore
(Based Country)
Thailand
0.660 (0.207)
-7.854 (1.638)
-0.197 (0.245)
-12.624 (0.627)
Vietnam
-1.421 (-0.182)
-6.300 (1.325)
-2.375 (0.292)
-9.955 (0.490)
Note: Standard errors are in parenthesis under the respective coefficient. (1) IV Regression without Brunei and Singapore. (2) IV Regression without Brunei, Myanmar and Singapore.
41
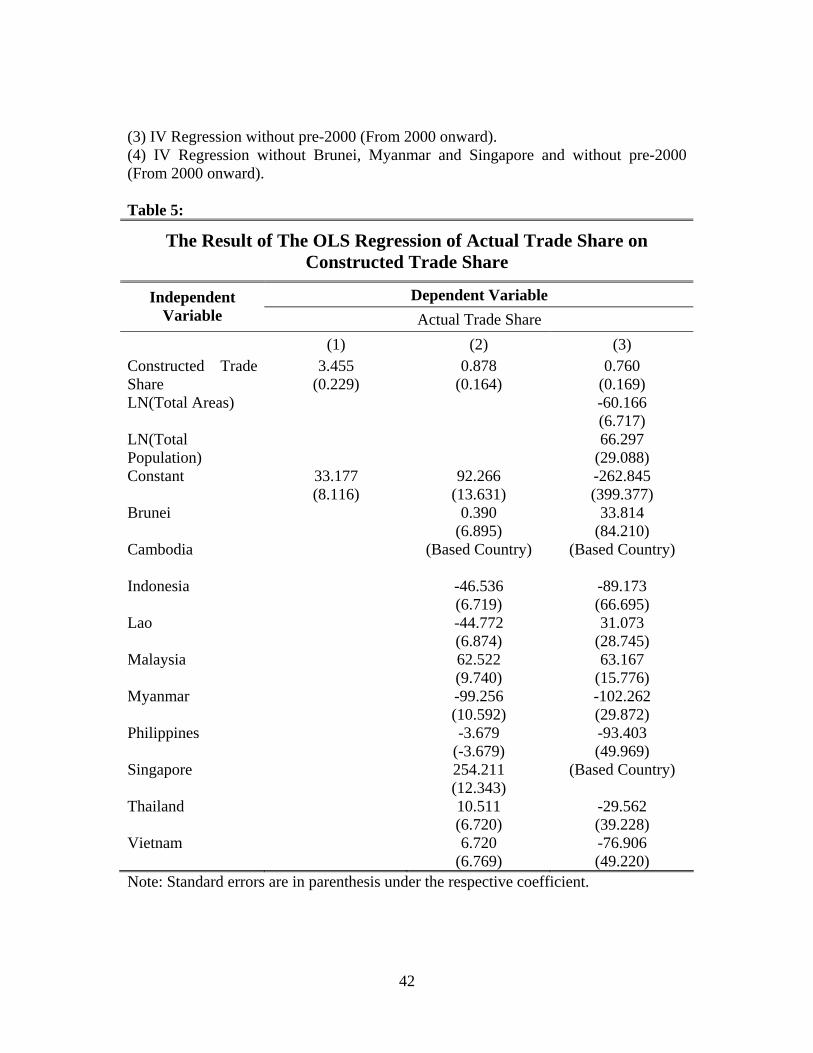
(3) IV Regression without pre-2000 (From 2000 onward). (4) IV Regression without Brunei, Myanmar and Singapore and without pre-2000 (From 2000 onward). Table 5:
The Result of The OLS Regression of Actual Trade Share on Constructed Trade Share
Dependent Variable Independent Variable Actual Trade Share
(1) (2) (3) Constructed Trade Share
3.455 (0.229)
0.878 (0.164)
0.760 (0.169)
LN(Total Areas)
-60.166 (6.717)
LN(Total Population)
66.297 (29.088)
Constant
33.177 (8.116)
92.266 (13.631)
-262.845 (399.377)
Brunei
0.390 (6.895)
33.814 (84.210)
Cambodia
(Based Country) (Based Country)
Indonesia
-46.536 (6.719)
-89.173 (66.695)
Lao
-44.772 (6.874)
31.073 (28.745)
Malaysia
62.522 (9.740)
63.167 (15.776)
Myanmar
-99.256 (10.592)
-102.262 (29.872)
Philippines
-3.679 (-3.679)
-93.403 (49.969)
Singapore
254.211 (12.343)
(Based Country)
Thailand
10.511 (6.720)
-29.562 (39.228)
Vietnam
6.720 (6.769)
-76.906 (49.220)
Note: Standard errors are in parenthesis under the respective coefficient.
42

(1) OLS Regression without Country Size and Dummy Variables. (2) OLS Regression with Dummy Variables. (3) OLS Regression with Country Size and Dummy Variables. Table 6:
The Result of The OLS & IV Regressions of Income on Trade Share and Country Size Without Country Dummy Variables
Dependent Variable Independent Variable LN(Real GDP Per Capita)
OLS IV Regression Trade Share -0.003
(0.001) -0.003 (0.001)
LN(Total Areas) -0.001 (0.062)
0.015 (0.066)
LN(Total Population) -0.189 (0.054)
-0.203 (0.057)
Quality of Institution: Rule of Law
1.540 (0.098)
1.517 (0.103)
Constant 12.344 (0.454)
12.311 (0.446)
Note: Standard errors are in parenthesis under the respective coefficient. Table 7:
The Result of The OLS Regression of Quality of Institutions on Geographical Characters without Dummy Variables
Dependent Variable Independent Variable
Quality of Institution: Rule of Law LN(Total Areas) -0.400
(0.044) LN(Total Population) 0.200
(0.050) Constant 1.220
(0.528) Note: Standard errors are in parenthesis under the respective coefficient.
43

C. Data
1. Quality of Institutions
Variable | Obs Mean Std. Dev. Min Max -------------+-------------------------------------------------------- RegQual | 90 -.0556667 1.118773 -2.32 3.41 RuleofLaw | 90 -.2521111 .9271225 -1.64 1.81 VoiceAccount | 90 -.7561111 .7473905 -2.2 .51 -------------+-------------------------------------------------------- ContofCorr | 90 -.2932222 1.023705 -1.71 2.39 GovtEffect | 90 .0036667 1.025317 -1.67 2.41 PeaceStabil | 90 -.1746667 .9309789 -2.03 1.36 RegQual: Regulatory Quality RuleofLaw: Rule of Law VoiceAccount: Voice and Accountability ContofCorr: Control of Corruption GovtEffect: Government Effectiveness PeaceStabil: Political Stability Regulatory Quality is calculated by including.
Years avaiable: 2007 2006 2005 2004 2003 2002 2000 1998 1996 2. World Development Indicators: GDP Per Capita (US$ 2000), GDP Per
Capita PPP (US$ 2005), Population, Trade Share
Variable | Obs Mean Std. Dev. Min Max -------------+--------------------------------------------------------
44

BRNGDP | 33 21071.36 3893.046 17787.4 33244.62 BRNPPP | 27 52448.92 7022.258 46991.41 79031.6 BRNPOP | 48 220872.4 92980.64 81800 389252 BRNTRADES | 28 106.6681 5.86108 96.17914 120.5797 -------------+-------------------------------------------------------- KHMGDP | 15 305.1847 86.82147 205.9795 482.269 KHMPPP | 15 1076.5 306.2515 726.5661 1701.141 KHMPOP | 48 8981432 2819938 5433306 1.44e+07 KHMTRADES | 30 59.69769 43.57816 12.62781 144.5866 -------------+-------------------------------------------------------- IDNGDP | 48 511.4314 270.5576 193.3993 1033.559 IDNPPP | 28 2377.658 664.2047 1350.528 3519.284 IDNPOP | 48 1.58e+08 4.06e+07 9.40e+07 2.26e+08 IDNTRADES | 48 45.47835 16.1394 10.92291 96.1862 -------------+-------------------------------------------------------- LAOGDP | 24 296.2188 78.15643 201.3458 461.5192 LAOPPP | 24 1296.377 342.0452 881.1732 2019.801 LAOPOP | 48 3668042 1199389 1986236 5859891 LAOTRADES | 23 50.99772 21.40783 9.105691 84.26954 -------------+-------------------------------------------------------- MYSGDP | 48 2294.429 1206.251 784.4456 4715.235 MYSPPP | 28 8307.962 2469.378 4950.813 12630.76 MYSPOP | 48 1.61e+07 5617571 8140405 2.65e+07 MYSTRADES | 48 130.5855 54.05856 69.25857 228.8752 -------------+-------------------------------------------------------- MMRGDP | 0 MMRPPP | 26 540.5454 177.9541 377.4084 963.1254 MMRPOP | 48 3.54e+07 8817400 2.11e+07 4.88e+07 MMRTRADES | 39 16.0092 11.13994 1.530677 40.36921 -------------+-------------------------------------------------------- PHLGDP | 48 878.2148 144.1165 612.0087 1216.172 PHLPPP | 28 2552.461 255.7663 2173.956 3218.755 PHLPOP | 48 5.42e+07 1.82e+07 2.71e+07 8.79e+07 PHLTRADES | 48 60.25127 26.70481 21.02074 110.9349 -------------+-------------------------------------------------------- SGPGDP | 48 12206.3 8037.943 2251.283 28964.15 SGPPPP | 28 28879.5 9947.01 14825.6 47488.04 SGPPOP | 48 2852096 863309.8 1646000 4588600 SGPTRADES | 7 414.709 37.49924 368.0011 462.4626 -------------+-------------------------------------------------------- THAGDP | 48 1193.696 752.5421 316.9652 2712.666 THAPPP | 28 4777.329 1714.074 2255.144 7682.073 THAPOP | 48 4.81e+07 1.11e+07 2.77e+07 6.38e+07
45
46
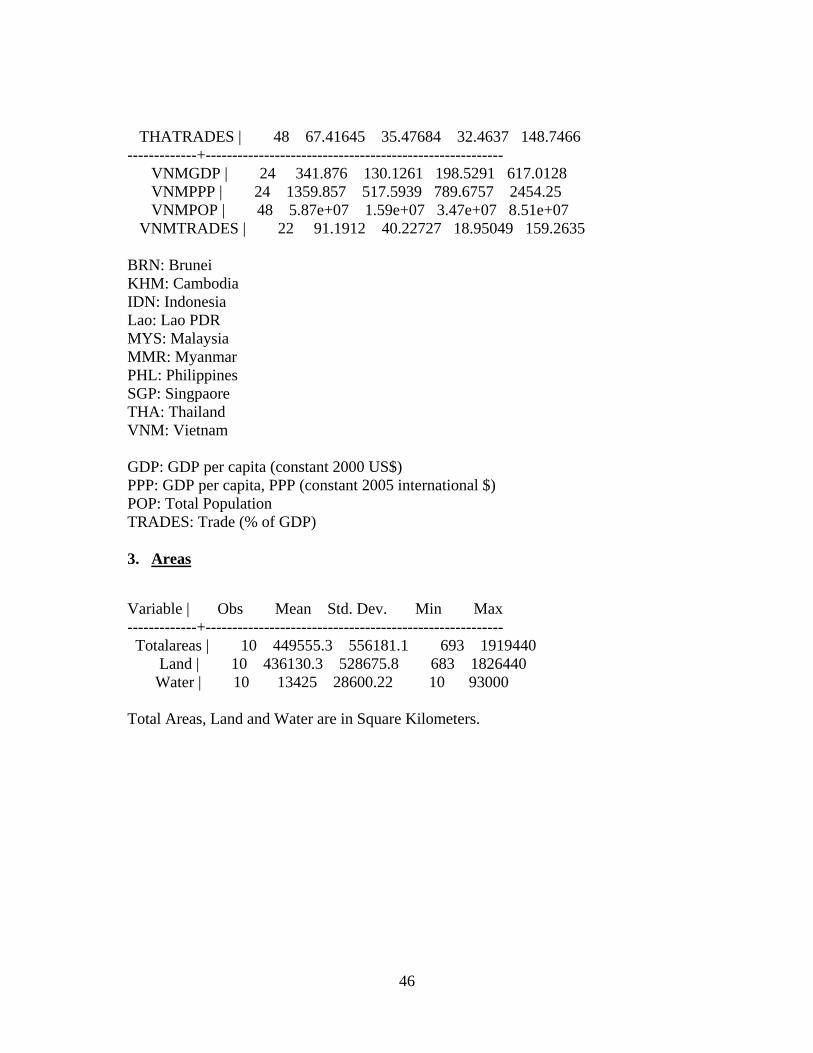
THATRADES | 48 67.41645 35.47684 32.4637 148.7466 -------------+-------------------------------------------------------- VNMGDP | 24 341.876 130.1261 198.5291 617.0128 VNMPPP | 24 1359.857 517.5939 789.6757 2454.25 VNMPOP | 48 5.87e+07 1.59e+07 3.47e+07 8.51e+07 VNMTRADES | 22 91.1912 40.22727 18.95049 159.2635 BRN: Brunei KHM: Cambodia IDN: Indonesia Lao: Lao PDR MYS: Malaysia MMR: Myanmar PHL: Philippines SGP: Singpaore THA: Thailand VNM: Vietnam GDP: GDP per capita (constant 2000 US$) PPP: GDP per capita, PPP (constant 2005 international $) POP: Total Population TRADES: Trade (% of GDP) 3. Areas
Variable | Obs Mean Std. Dev. Min Max -------------+-------------------------------------------------------- Totalareas | 10 449555.3 556181.1 693 1919440 Land | 10 436130.3 528675.8 683 1826440 Water | 10 13425 28600.22 10 93000 Total Areas, Land and Water are in Square Kilometers.
Related Documents