1 Trade and Investment Implications of Brexit July 11, 2016 Note prepared by the World Bank Group Trade & Competiveness Global Practice 1 The exit of the United Kingdom from the European Union (Brexit) may have a negative impact on trade and investment flows not just for the UK, but also for the countries with the largest exposure to the UK. The indirect impact of a Brexit-induced recession in the UK –may also be felt in the EU because of their strong trade, investment, and financial linkages. The magnitude of these impacts will depend on the type of trade relationship that the UK negotiates with the EU, the duration of the negotiations, and the market confidence in the leadership of the UK, EU and other mayor players during the transition period. The major effect of the Brexit vote is the withdrawal of the UK from the EU project of deep economic integration, raising the possibility that the same doubts that gave rise to Brexit lead to an interruption of trade openness and integration in other parts of the world. International development institutions like the World Bank Group can play an important role in informing debates in this area. 1. IMPACT ON TRADE Trade Patterns The UK is an important global player, accounting for 4 percent of global GDP and benefiting from strong links with the EU. The EU accounts for half of the UK’s trade and over 40 percent of value added in UK exports. The UK is also a significant player in trade in services (namely, financial services and other business activities) which represent 37 percent of UK total exports and 23 percent of UK imports. The majority of UK services (66 percent) are imported from non-EU members, particularly from the US (29 percent). The US is the top export partner and the second most important import partner (after Germany). The UK is highly integrated in global value chains, with 41 percent of the value added in its exports coming from the EU and 12 percent from the US. The high ratio of trade in gross relative to value-added terms suggests that much of the UK’s trade with Europe is connected to supply chains. About 59 percent of intermediate goods used for the production of UK exports come from non-EU members, of which the most important are the US and Norway. Within the EU, the UK relies on intermediate imports from Germany (11 percent) and France (6 percent). 59 percent of UK exported value added is absorbed by final demand in non-EU countries, with the US being the most important destination. Within the EU, the largest demand for UK intermediate goods comes from Germany (9 percent) and France (7 percent). The emerging and developing economies with the largest trade exposure to the UK are located in Eastern and Central Asia (ECA) and Sub-Saharan Africa (SSA). The UK represents 6 percent of exports in SSA and 3 percent of exports in ECA; and UK imports account for 3 percent in ECA and SSA. A similar pattern can be seen in trade in parts and components. The UK represents around 4 percent of total imports in intermediate goods for SSA and around 3 percent for ECA; and about 3 percent of total 1 The note was coordinated by Paloma Anos Casero and Michele Ruta under the supervision of Anabel Gonzalez and included contributions by Paul Brenton, Michael Ferrantino, Martin Molinuevo, Alen Mulabdic, Alberto Osnago, Nadia Rocha, Shawn Tan and Gonzalo Varela. Public Disclosure Authorized Public Disclosure Authorized Public Disclosure Authorized Public Disclosure Authorized

Welcome message from author
This document is posted to help you gain knowledge. Please leave a comment to let me know what you think about it! Share it to your friends and learn new things together.
Transcript

1
Trade and Investment Implications of Brexit
July 11, 2016
Note prepared by the World Bank Group Trade & Competiveness Global Practice1
The exit of the United Kingdom from the European Union (Brexit) may have a negative impact on trade and
investment flows not just for the UK, but also for the countries with the largest exposure to the UK. The indirect
impact of a Brexit-induced recession in the UK –may also be felt in the EU because of their strong trade, investment,
and financial linkages. The magnitude of these impacts will depend on the type of trade relationship that the UK
negotiates with the EU, the duration of the negotiations, and the market confidence in the leadership of the UK, EU
and other mayor players during the transition period.
The major effect of the Brexit vote is the withdrawal of the UK from the EU project of deep economic integration,
raising the possibility that the same doubts that gave rise to Brexit lead to an interruption of trade openness and
integration in other parts of the world. International development institutions like the World Bank Group can play
an important role in informing debates in this area.
1. IMPACT ON TRADE
Trade Patterns
The UK is an important global player, accounting for 4 percent of global GDP and benefiting from
strong links with the EU. The EU accounts for half of the UK’s trade and over 40 percent of value added
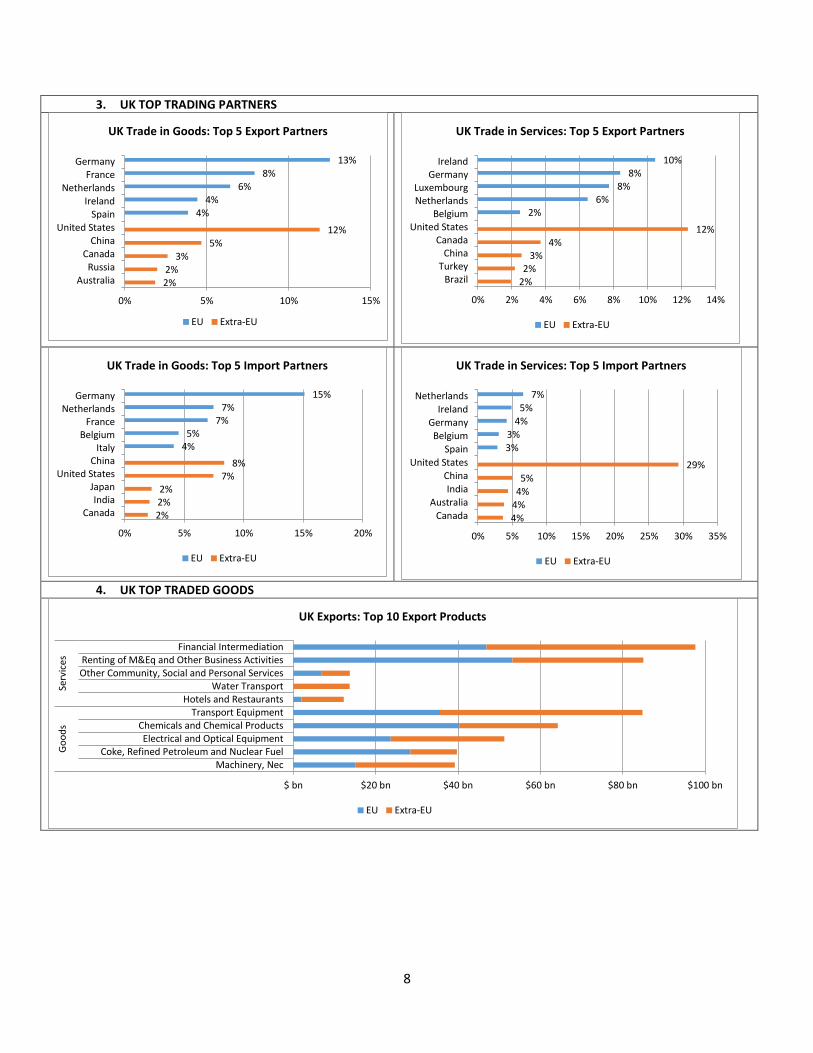
in UK exports. The UK is also a significant player in trade in services (namely, financial services and other
business activities) which represent 37 percent of UK total exports and 23 percent of UK imports. The
majority of UK services (66 percent) are imported from non-EU members, particularly from the US (29
percent). The US is the top export partner and the second most important import partner (after
Germany).
The UK is highly integrated in global value chains, with 41 percent of the value added in its exports
coming from the EU and 12 percent from the US. The high ratio of trade in gross relative to value-added
terms suggests that much of the UK’s trade with Europe is connected to supply chains. About 59
percent of intermediate goods used for the production of UK exports come from non-EU members, of
which the most important are the US and Norway. Within the EU, the UK relies on intermediate imports
from Germany (11 percent) and France (6 percent). 59 percent of UK exported value added is absorbed
by final demand in non-EU countries, with the US being the most important destination. Within the EU,
the largest demand for UK intermediate goods comes from Germany (9 percent) and France (7 percent).
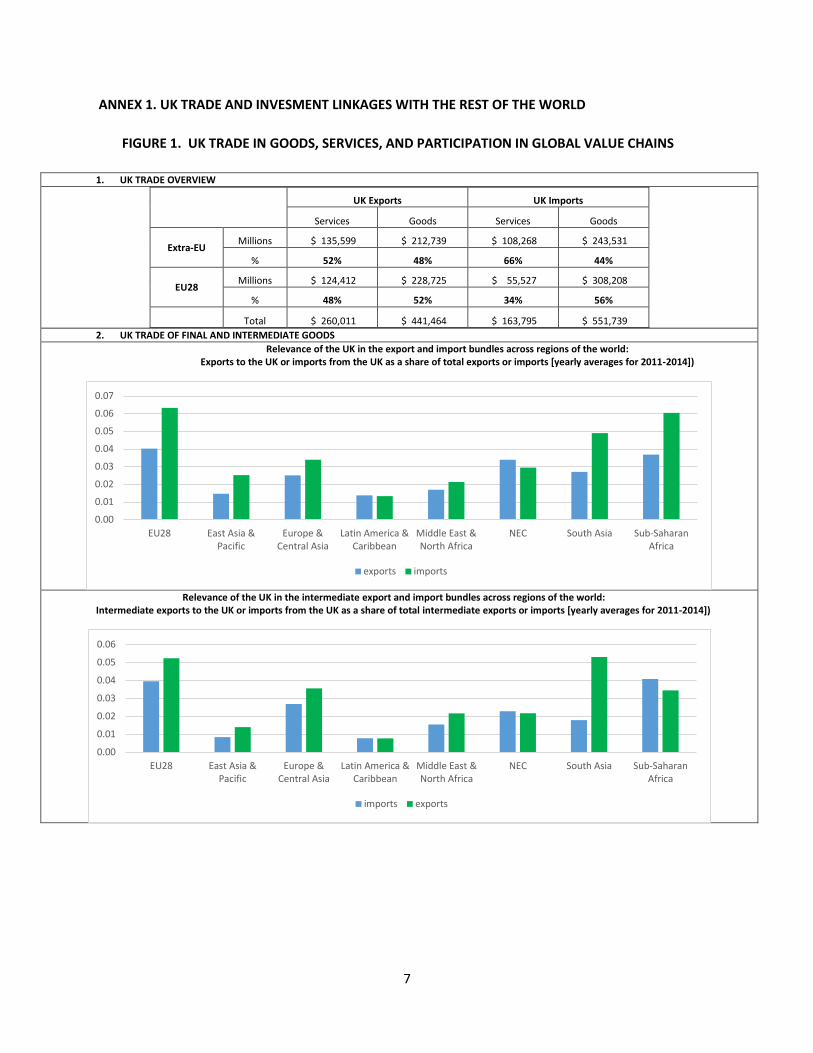
The emerging and developing economies with the largest trade exposure to the UK are located in
Eastern and Central Asia (ECA) and Sub-Saharan Africa (SSA). The UK represents 6 percent of exports in
SSA and 3 percent of exports in ECA; and UK imports account for 3 percent in ECA and SSA. A similar
pattern can be seen in trade in parts and components. The UK represents around 4 percent of total
imports in intermediate goods for SSA and around 3 percent for ECA; and about 3 percent of total
1 The note was coordinated by Paloma Anos Casero and Michele Ruta under the supervision of Anabel Gonzalez
and included contributions by Paul Brenton, Michael Ferrantino, Martin Molinuevo, Alen Mulabdic, Alberto Osnago, Nadia Rocha, Shawn Tan and Gonzalo Varela.
Pub
lic D
iscl
osur
e A
utho
rized
Pub
lic D
iscl
osur
e A
utho
rized
Pub
lic D
iscl
osur
e A
utho
rized
Pub
lic D
iscl
osur
e A
utho
rized

2
exports in intermediate goods from SSA and ECA. The countries with the largest trade exposure to the
UK are Hungary, Poland, Czech Republic, South Africa, and Nigeria (See Annex 2). The Caribbean is also
linked to the UK through trade and remittances, albeit to a lesser extent.
Impact on Trade Policy
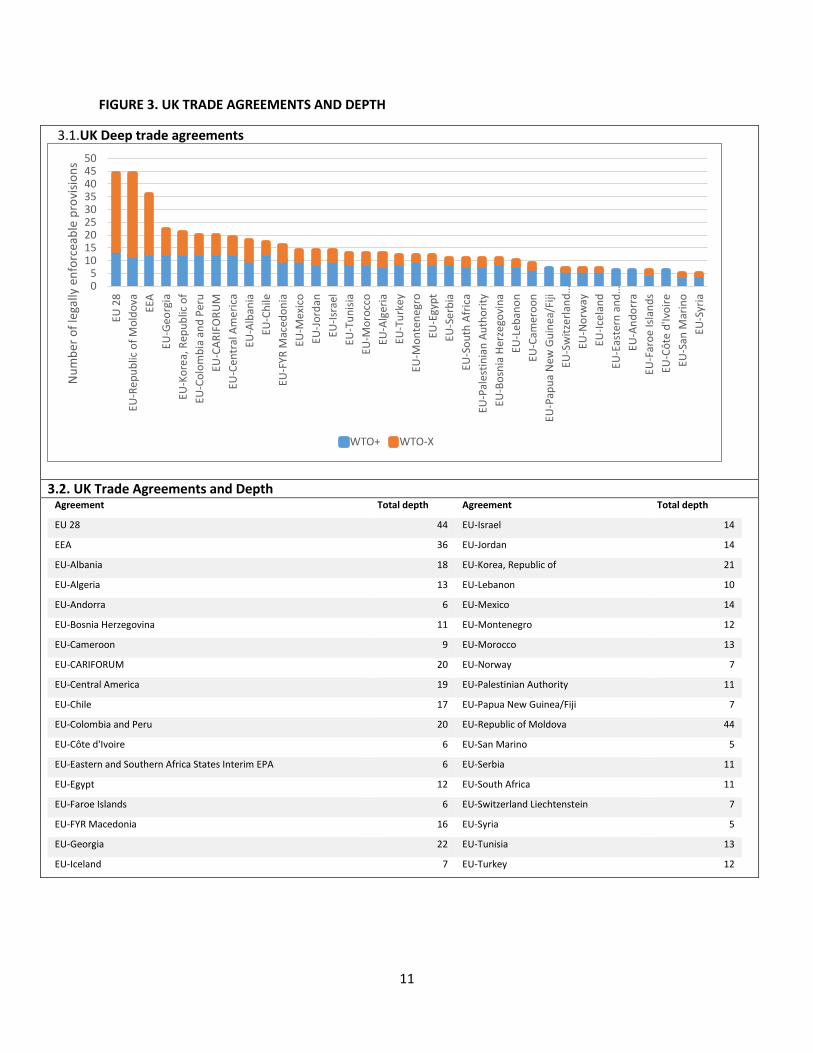
Brexit will increase trade policy uncertainty for the UK and may reduce the depth (i.e. the coverage of
policy areas) of its trade agreements. Before Brexit, the UK had clear commitments and rights under
the WTO, the EU, and other preferential trade agreements (PTAs) with the EU. The EU integration
agreements go well beyond tariffs. They comprise legally enforceable provisions on policy areas that are
outside of the mandate of the WTO such as competition policies, investment, and movement of capital.
Post-Brexit, it is unclear what will be the rights and obligations of the UK vis a vis the other members of
the EU, the countries that have preferential trade agreements with the EU and possibly with WTO
members more broadly.
As an EU member, the UK is part of 36 trade agreements (in force) and other trade agreements
concluded (Canada) or under negotiation (TTIP). Post-Brexit, these trade agreements may need to be
renegotiated. Irrespective of the type of trade relationship negotiated with the EU, the UK may have to
renegotiate all its trade agreements with third countries. In case of no preferential agreement with the
EU and third countries, the relationship may revert to the current WTO commitments. The UK may also
need to re-establish its terms of trade within the WTO. The UK is a WTO member, but its obligations and
rights at the WTO were negotiated as an EU member. It only has these commitments as an EU member.
Brexit also raises uncertainty over the future of the Transatlantic Trade and Investment Partnership
(TTIP). The UK was a TTIP strong advocate, and its exit from the EU may tilt the balance of power within
the EU, further challenging the already complicated negotiations between the US and the EU.
The majority of UK trade is covered by preferential trade agreements (PTAs). About 60 percent and 64
percent of UK exports and imports respectively take place with countries that are part of a PTA with the
EU or with the EU itself (exports to the EU account for 73 percent of total exports under PTAs; imports
from the EU account for 86 percent of total imports under PTAs). Similarly, in the case of intermediates,
60 percent of UK imports of intermediates come from countries with whom the EU has a PTA in force. In
addition, 56 percent of UK exports of intermediates go to other EU PTA members (see Annex 1 for
details). A significant share of UK imports to other regions is also based on preferential agreements.
Exceptions include South Asia and East Asia and the Pacific, where only Fiji and Papua New Guinea have
preferential agreements with the EU (more recently, Vietnam concluded negotiations with the EU but
the agreement has not yet come into force). In MNA a significant share of imports from the UK, both
total trade and trade in intermediates, are also based on PTAs.
Impact on Trade Flows
Several Post-Brexit scenarios are being considered, with varying degrees of “depth” in economic
integration:
The “Norway” scenario assumes that the UK will become a non-EU EEA member. As such, it will
be part of the European Single Market, enjoying free movement of goods, services, people and

3
capital. But it will have to accept and implement EU legislation governing the Single Market
without being able to influence it. In addition, it will not belong to the EU’s customs union, and
UK exports will need to satisfy rules of origin requirements in order to enter the EU duty free
and the EU can use anti-dumping measures to restrict imports from the UK.
The “Swiss” scenario assumes that the UK will not be a member of the EU or the EEA. Instead, it
will negotiate a series of bilateral treaties with the EU under which it will adopt EU policies in
specific areas. The bilateral treaty approach will allow the UK the flexibility to choose which EU
initiatives it wishes to participate in. But this scenario assumes less economic integration
between the UK and the EU than the Norway scenario.
The “free trade agreement (FTA)” scenario assumes that the UK will be free to negotiate FTAs
independently, and the UK’s relationship with the EU will be itself governed by an FTA. Tariff
barriers are unlikely under this scenario, but as with all FTAs, the UK will need to trade off depth
– which means agreeing common standards and regulation- with independence.
The “no-agreement/MFN scenario”. If the UK leaves the EU without putting in place any
alternative arrangements, UK trade would be governed by the WTO. As a WTO member, the
UK’s exports to the EU and other WTO members would be subject to the importing countries’
MFN tariffs. UK services trade would also be subject to WTO rules and commitments. This
scenario would mean reduced access to EU markets for UK service exporters.
Brexit will reduce the depth of the UK trade agreements, which may lower UK trade flows. Preliminary
analysis shows that countries that join deep trade agreements experience an increase of 128 percent in
their exports to other members, on average. Exiting the deep trade agreement with the EU may lead to
a decrease in UK trade flows with the EU. The magnitude of such impact varies widely depending on the
post-Brexit trade policy scenarios assumed, the transmission channels considered, and the modeling
technique used. The post-Brexit trade outcome is more negative the weaker the trade deal negotiated
with the EU. That is, the Norway scenario dominates the FTA scenario, which dominates MFN scenarios.
Estimates that also consider uncertainty, foreign direct investment (FDI), and productivity effects of
lower trade and FDI produce the most negative effects. The few studies that look into potential positive
effects on the UK refer to reduced EU budget contributions and greater freedom in determining trade
policy (See Annex 3)
Brexit may have a negative direct impact on trade beyond the UK --particularly for some EU member
states and other countries with large exposure to the UK. The indirect impact of a Brexit-induced
recession in the UK may also be felt in the EU because of their strong trade, investment, and financial
linkages. Lower trade flows may impact countries that have higher trade linkages with the UK. The EU
member states mostly exposed are Hungary, Poland, Czech Republic, Ireland, Netherlands, and Cyprus.
Other non-EU countries with high trade exposure to the UK include South Africa, Nigeria and to a lesser
extent, countries in the Caribbean.
Brexit raises a broader economic and political challenge: a historical shift in trade policy attitudes. The
major effect of the Brexit vote is the withdrawal of the UK from the EU project of deep economic
integration, raising the possibility that the same doubts that gave rise to Brexit lead to an interruption of
trade openness and integration in other parts of the world. European integration has contributed to
global growth to a large extent due to the opening of the EU market. The process of economic
integration (i.e. the flows of goods, services, capital, people, ideas) has been an engine of economic
growth in the post-World War II era. This process has been supported by a set of commonly-agreed

4
rules of the game, many of which have been embedded in deep trade agreements at the regional level
and at the multilateral level in the WTO system. The EU has also been a model for regional integration.
Regional integration agreements in Africa, Latin America and East Asia have largely contributed –or have
the potential to contribute- to the reduction of trade costs among members.
2. IMPACT ON INVESTMENT
Brexit’s effect on UK FDI flows may be significant. In the short-term, Brexit could have a negative effect
on inward investments into the UK, particularly those serving EU markets. In the longer term,
institutional changes within the UK (e.g., the announced call for a referendum on the independence of
Scotland to enable it to remain in the EU) and changes in the UK relationship with the EU could also lead
to disruptions in UK FDI flows. The impact of Brexit over global FDI flows is more uncertain.
Brexit may lead to changes in UK investment policy. These changes will affect not only FDI flows
between the UK and the EU, but also investments of third countries currently governed by existing
treaties between extra-EU partners and the EU, as well as new treaties under negotiation. After entering
into force of the Lisbon Treaty, the EU has exclusive competence in this area. This allowed the EU to
conclude comprehensive trade agreements (including investment disciplines); while, before,
agreements on investment protection were concluded bilaterally by individual Member States. The EU
currently has existing comprehensive trade agreements with 52 countries, and it is negotiating with
another 72 countries.
The extent of the investment policy changes in the UK following Brexit are uncertain. Although the UK
will be able to keep the existing 106 Bilateral Investment Treaties (BITS), it would need to re-negotiate
or start new bilateral negotiations on the existing EU trade and investment agreements with external
partners, clarify its non-EU status at the WTO, and at the same time, re-define its own status as a third
country vis-à-vis the EU. This process will generate further uncertainty for investors. First, renegotiating
these agreements will take time. As an example, negotiations on the EU’s Comprehensive Economic and
Trade Agreement (CETA) with Canada started in 2009 and were only concluded in early 2016. The
intervening period while renegotiations take place could be marked by legal uncertainty, to the
detriment of UK investors abroad and foreign investors in the UK. Second, the international investment
agreements (IIAs) that have been recently agreed by the EU and its relevant trading partners, but are
still awaiting signature or ratification (namely, CETA, the EU-Singapore FTA and the EU-Vietnam FTA),
would have to be amended to reflect Brexit. Likewise, the UK will be excluded from the currently
ongoing EU IIAs negotiations with the US (TTIP), Japan, and China, which will also need to be restarted
on a bilateral basis.
Short-term impact
According to a 2015 poll by Ernst and Young (EY), 72 percent of investors in the UK cited access to the
European single market as a key factor to the UK’s investment attractiveness. EU-bound efficiency-
seeking FDI could see the first negative effects of the investment diversion generated by the Brexit. In

5
fact, according to the same EY survey, by 2015, 31 percent of investors surveyed had already frozen or
stopped expanding investment decisions pending the results of the referendum.2
Service firms located in the UK with the purpose of serving the regional EU market will face great
uncertainty regarding their conditions of access to the EU market. Probably the best example is the
financial sector. One of the most cited potential consequences from Brexit is a diminished role of
London as a financial center. Currently, London has a share of nearly 50 percent in certain segments of
global financial markets, particularly on interest rate over-the-counter (OTC) derivatives and foreign
exchange trading. Other European financial centers, notably Frankfurt and Paris, could be the main
beneficiaries of financial investments relocating outside of London. Some financial centers in emerging
economies (e.g., Dubai, Singapore, Hong Kong) could also benefit from this relocation.
Efficiency-seeking FDI in manufacturing may also endure dislocations, largely for similar reasons. With
increased uncertainty regarding market access to the EU, global value chain segments located in the UK
may be prone to locate elsewhere. The auto industry is one of the sectors where these movements are
more probable, given that about 50 percent of the vehicles assembled in the UK are exported to the EU.
In an illustrative example of what the future may bring, Tata, a major emerging multinational in the auto
industry, already announced that it will revise its corporate strategy in the UK.
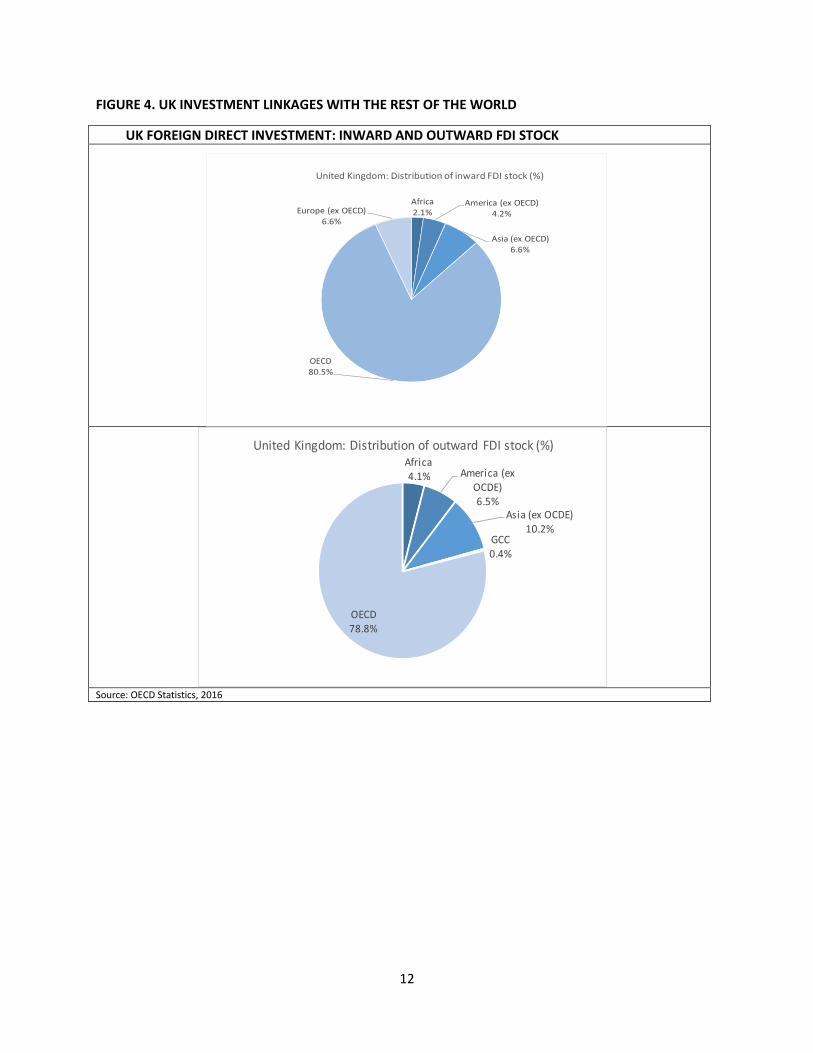
Further, the UK had increasingly become an important destination for investment flows originating in
developing countries. While inward FDI stocks still show a majority share from advanced economies
(see figure 4), the UK has attracted approximately $83.2 billion of investment from companies
headquartered in developing countries since 2003. This makes the UK the second most important
destination of developing countries’ FDI among advanced economies, only behind the US. In view of
Brexit, such investments may also tend to relocate given the uncertainty in terms of access into EU
markets.
In the short term it could be argued that previous trends in efficiency-seeking FDI could be somewhat
mitigated by the pound devaluation. The days following Brexit have already sent the pound to its
lowest level since the mid-eighties. If sustained, this would ameliorate the cost competitiveness of firms
in the UK, somewhat reducing the impact from hardened entry conditions into the EU. However, it is
known that efficiency-seeking FDI and GVCs do not rely on these short-term circumstantial variables to
base long-term locational decisions. Thus, the UK may be hurt by investment diversion of efficiency-
seeking FDI looking for more certain platforms on which to base production.
Long Term Impact
Investment diversion may not only occur in the short and medium term, as efficiency-seeking FDI may
leave the UK due to the uncertainty of conditions of access into the EU market. Further, in the long
term, other types of FDI risk of being diverted from the UK. Natural resource seeking and market
seeking FDI are other types of FDI which may decline as a result of the Brexit. If Scotland launches the
referendum for independence, the UK would lose the oil and gas reserves within Scottish territory. It is
estimated that 90 percent of Great Britain’s gas and oil reserves are in Scotland. In this case, natural-
resource seeking FDI into the UK would fall in the long term. This is not a minor thing as Scottish exports
of oil, gas and refined hydrocarbons were estimated by the UK government to be about $49 billion in
2 Source: http://www.ey.com/UK/en/Issues/Business-environment/2015-UK-attractiveness-survey

6
2012. In addition, market-seeking FDI into the UK may also likely decrease as a result of the shrinking of
the British economy –already forecasted in the short term but exacerbated by the possible
fragmentation of the British market.
Another set of impacts that may require some time to materialize relates to the legal vacuum that
some UK outward investments may face once the country is not bound by EU policy. This would be
particularly the case of UK investments in EU member countries, but also countries where the EU is
currently conducting comprehensive trade and investment agreements. These countries make up the
majority of the UK’s outward FDI, with the EU being the location of 40 percent of total outward
investments, followed by the US with 26 percent of FDI stocks. At a large distance, Canada, China and
Japan host 2.8 percent, 0.7 percent and 0.4 percent of total FDI positions.
Impact on global FDI
The behavior of global FDI is characterized by a significant degree of resilience, but a broader impact
of Brexit could emerge through a deterioration of investors’ confidence. UNCTAD (2016) remarks that
global FDI flows increased by 38 percent during 2015, reaching their highest level since the arrival of the
global financial crisis. In this way, the uncertain economic context is having a limited impact over global
FDI flows. Instead, some features of current FDI activity are more troubling. The same publication states
that a surge in cross-border mergers and acquisitions (M&As) moving from $432 billion in 2014 to $721
billion in 2015, was the principal factor behind the rebound in global FDI. Allegedly, much of the growth
in M&A was due to corporate reconfigurations, as firms seek new alliances and corporate strategies to
navigate a global economy plagued with risks. In general, these reconfigurations involve large
movements in the balance of payments but little change in actual operations of multinational
enterprises. As a consequence, recent FDI flows are not being translated into an increase in actual
investment and productive capacity of the host economies. A situation that could be prolonged should
Brexit intensify economic uncertainty. If this is the case, the impacts of Brexit could be much more
significant for FDI flows specifically linked to the UK versus for global FDI flows more broadly.
3. POLICY IMPLICATIONS
The UK and the countries exposed to UK trade will need to seek clarity in trade relations in order to
minimize policy uncertainty. This could involve freezing current rules and commitments in preferential
and WTO agreements and establishing a clear roadmap to clarify/renegotiate the agreements with the
UK going forward. Renegotiating upward (i.e. preserving the existing depth) would be more efficient
from a trade perspective, but more challenging from a political standpoint.
7
ANNEX 1. UK TRADE AND INVESMENT LINKAGES WITH THE REST OF THE WORLD
FIGURE 1. UK TRADE IN GOODS, SERVICES, AND PARTICIPATION IN GLOBAL VALUE CHAINS
1. UK TRADE OVERVIEW
UK Exports UK Imports
Services Goods Services Goods
Extra-EU Millions $ 135,599 $ 212,739 $ 108,268 $ 243,531
% 52% 48% 66% 44%
EU28 Millions $ 124,412 $ 228,725 $ 55,527 $ 308,208
% 48% 52% 34% 56%
Total $ 260,011 $ 441,464 $ 163,795 $ 551,739
2. UK TRADE OF FINAL AND INTERMEDIATE GOODS
Relevance of the UK in the export and import bundles across regions of the world: Exports to the UK or imports from the UK as a share of total exports or imports [yearly averages for 2011-2014])
Relevance of the UK in the intermediate export and import bundles across regions of the world: Intermediate exports to the UK or imports from the UK as a share of total intermediate exports or imports [yearly averages for 2011-2014])
0.00
0.01
0.02
0.03
0.04
0.05
0.06
EU28 East Asia &Pacific
Europe &Central Asia
Latin America &Caribbean
Middle East &North Africa
NEC South Asia Sub-SaharanAfrica
imports exports
0.00
0.01
0.02
0.03
0.04
0.05
0.06
0.07
EU28 East Asia &Pacific
Europe &Central Asia
Latin America &Caribbean
Middle East &North Africa
NEC South Asia Sub-SaharanAfrica
exports imports
8
3. UK TOP TRADING PARTNERS
4. UK TOP TRADED GOODS
2% 2%
3% 5%
12%
4% 4%
6% 8%
13%
0% 5% 10% 15%
AustraliaRussia
CanadaChina
United StatesSpain
IrelandNetherlands
FranceGermany
UK Trade in Goods: Top 5 Export Partners
EU Extra-EU
2% 2%
3% 4%
12%
2% 6%
8% 8%
10%
0% 2% 4% 6% 8% 10% 12% 14%
BrazilTurkey
ChinaCanada
United StatesBelgium
NetherlandsLuxembourg
GermanyIreland
UK Trade in Services: Top 5 Export Partners
EU Extra-EU
2% 2% 2%
7% 8%
4% 5%
7% 7%
15%
0% 5% 10% 15% 20%
CanadaIndia
JapanUnited States
ChinaItaly
BelgiumFrance
NetherlandsGermany
UK Trade in Goods: Top 5 Import Partners
EU Extra-EU
4% 4% 4% 5%
29%
3% 3%
4% 5%
7%
0% 5% 10% 15% 20% 25% 30% 35%
CanadaAustralia
IndiaChina
United StatesSpain
BelgiumGermany
IrelandNetherlands
UK Trade in Services: Top 5 Import Partners
EU Extra-EU
$ bn $20 bn $40 bn $60 bn $80 bn $100 bn
Machinery, NecCoke, Refined Petroleum and Nuclear Fuel
Electrical and Optical EquipmentChemicals and Chemical Products
Transport EquipmentHotels and Restaurants
Water TransportOther Community, Social and Personal ServicesRenting of M&Eq and Other Business Activities
Financial Intermediation
Go
od
sSe
rvic
es
UK Exports: Top 10 Export Products
EU Extra-EU

9
5. UK PARTICIPATION IN GLOBAL VALUE CHAINS
Source for Figure 1: Authors’ calculations, based on UN Comtrade data; and TiVA (2011). Note: Intermediate exports and imports are defined as sections 42 (parts and accessories of capital goods) & 53 (parts and accessories of transport equipment) of BEC plus code 65 of SITC (textiles).
$ bn $20 bn $40 bn $60 bn $80 bn $100 bn
Chemicals and Chemical ProductsFood, Beverages and Tobacco
Mining and QuarryingElectrical and Optical Equipment
Transport EquipmentAir Transport
Other Community, Social and Personal ServicesFinancial Intermediation
Hotels and RestaurantsRenting of M&Eq and Other Business Activities
Go
od
sSe
rvic
es
UK Imports: Top 10 Import Products
EU Extra-EU
3%
3%
4%
6%
11%
3%
4%
6%
10%
12%
0 0.05 0.1 0.15
Japan
Russia
China (People's Republic of)
Norway
United States
Netherlands
Spain
Italy
France
Germany
Foreign Value Added in UK Exports (2011)
Extra-EU EU
EU 41%
Extra-EU 59%
Foreign Value Added in UK Exports (2011)
3%
4%
4%
7%
9%
3%
3%
3%
4%
18%
0 0.05 0.1 0.15 0.2
Canada
India
Japan
China…
United States
Netherlands
Italy
Spain
France
Germany
UK Value Added in Foreign Demand
Extra-EU EU
EU 41%
Extra-EU 59%
UK Value Added in Foreign Demand (2011)

10
FIGURE 2. UK PREFERENTIAL TRADE WITH THE REST OF THE WORLD
2.1. UK preferential trade, share of trade across regions (2011-2014, average) Share of UK Preferential imports (% of total trade) Share of UK Preferential imports (% of intermediate trade)
Share of UK Preferential exports (% of total trade) Share of UK Preferential exports (% of intermediate trade)
Table 2.1: UK Preferential trade, average (2011-2014)
UK exports, Millions
(US dollars)
Perc.
UK imports, Millions
(US dollars)
Perc.
Preferential 266,133 60% 374,327 64%
Non preferential 175,165 40% 210,836 36%
Table 2.2: UK Preferential trade in intermediates, average (2011-2014)
UK imports,
Millions (US dollars)
Perc. UK exports, Millions (US
dollars) Perc.
Preferential 49,100 60% 37,600 56%
Non preferential 33,100 40% 29,200 44%
Source: Author’s calculations based on WTO RTA database and UN Comtrade
0%
20%
40%
60%
80%
100%
PTA=1 PTA=0
0%
20%
40%
60%
80%
100%
PTA=1 PTA=0
0%
20%
40%
60%
80%
100%
PTA=1 PTA=0
0%
20%
40%
60%
80%
100%
PTA=1 PTA=0
11
FIGURE 3. UK TRADE AGREEMENTS AND DEPTH
3.1.UK Deep trade agreements
3.2. UK Trade Agreements and Depth Agreement Total depth Agreement Total depth
EU 28 44 EU-Israel 14
EEA 36 EU-Jordan 14
EU-Albania 18 EU-Korea, Republic of 21
EU-Algeria 13 EU-Lebanon 10
EU-Andorra 6 EU-Mexico 14
EU-Bosnia Herzegovina 11 EU-Montenegro 12
EU-Cameroon 9 EU-Morocco 13
EU-CARIFORUM 20 EU-Norway 7
EU-Central America 19 EU-Palestinian Authority 11
EU-Chile 17 EU-Papua New Guinea/Fiji 7
EU-Colombia and Peru 20 EU-Republic of Moldova 44
EU-Côte d'Ivoire 6 EU-San Marino 5
EU-Eastern and Southern Africa States Interim EPA 6 EU-Serbia 11
EU-Egypt 12 EU-South Africa 11
EU-Faroe Islands 6 EU-Switzerland Liechtenstein 7
EU-FYR Macedonia 16 EU-Syria 5
EU-Georgia 22 EU-Tunisia 13
EU-Iceland 7 EU-Turkey 12
05
101520253035404550
EU 2
8
EU-R
ep
ub
lic o
f M
old
ova
EEA
EU-G
eorg
ia
EU-K
ore
a, R
epu
blic
of
EU-C
olo
mb
ia a
nd
Per
u
EU-C
AR
IFO
RU
M
EU-C
entr
al A
me
rica
EU-A
lban
ia
EU-C
hile
EU-F
YR M
aced
on
ia
EU-M
exic
o
EU-J
ord
an
EU-I
srae
l
EU-T
un
isia
EU-M
oro
cco
EU-A
lger
ia
EU-T
urk
ey
EU-M
on
ten
egro
EU-E
gyp
t
EU-S
erb
ia
EU-S
ou
th A
fric
a
EU-P
ales
tin
ian
Au
tho
rity
EU-B
osn
ia H
erze
govi
na
EU-L
eb
ano
n
EU-C
amer
oo
n
EU-P
apu
a N
ew G
uin
ea/F
iji
EU-S
wit
zerl
and
…
EU-N
orw
ay
EU-I
cela
nd
EU-E
aste
rn a
nd
…
EU-A
nd
orr
a
EU-F
aro
e Is
lan
ds
EU-C
ôte
d'Iv
oir
e
EU-S
an M
arin
o
EU-S
yria
Nu
mb
er o
f le
gally
en
forc
eab
le p
rovi
sio
ns
WTO+ WTO-X
12
FIGURE 4. UK INVESTMENT LINKAGES WITH THE REST OF THE WORLD
UK FOREIGN DIRECT INVESTMENT: INWARD AND OUTWARD FDI STOCK
Source: OECD Statistics, 2016
Africa2.1%
America (ex OECD) 4.2%
Asia (ex OECD)6.6%
OECD 80.5%
Europe (ex OECD)6.6%
United Kingdom: Distribution of inward FDI stock (%)
Africa4.1% America (ex
OCDE)6.5%
Asia (ex OCDE)10.2%
GCC0.4%
OECD78.8%
United Kingdom: Distribution of outward FDI stock (%)

13
ANNEX 2. REGIONAL FOCUS OF BREXIT IMPACT: ECA AND SUB SAHARAN AFRICA
Regional Focus 1: Impact on ECA West Countries
While Brexit will affect the whole ECA region, the EU member countries in ECA West may experience
the largest impact. This analysis focuses on the Brexit impact on ECA West countries: Bulgaria, Croatia,
Cyprus, Czech Republic, Estonia, Hungary, Latvia, Lithuania, Poland, Romania, Slovakia, and Slovenia.
The effects of Brexit on the ECA West countries will depend on the type of deal that the UK
negotiates. Brexit may have minimal impact on ECA West countries if the UK continues to be part of the
European single market but not part of the EU. In this scenario, the UK will retain the benefits of free
movements of goods, investments, and people within the single market. The UK might request to
deviate from the free mobility requirement in the single market and impose restrictions on workers
from other EU countries, but these countries will reciprocate and restrict the movements of British
citizens. Conversely, Brexit may have a large impact on ECA West countries if the UK leaves the EU and
the single market. The negative effects will happen through four transmission channels: EU budget,
trade, investment and labor/migration. This annex focuses on the trade and investment effects.
Brexit may reduce trade between the UK and ECA West countries, especially trade in intermediate
inputs, which will hamper ECA West countries participating in global value chains. Brexit may re-
institute trade barriers between the UK and the EU as the UK is removed from the European single
market. The UK is an important export market for many ECA West countries, representing on average
4.1 percent of total merchandise exports in 2015. In particular, Poland, Slovakia, Czech Republic and
Latvia send more than 5 percent of their exports to the UK. With the exception of Estonia, all ECA West
countries have a trade surplus with the UK. Many firms in ECA West countries participating in GVCs and
exporting intermediate inputs to the UK would suffer from the increase in trade barriers. The potential
increase in trade barriers emphasizes the need for trade facilitation measures to reduce the costs of
exporting.
The effects of Brexit on the services trade flows between the UK and ECA West countries are likely to
be small. The UK has a large trade surplus for services with the EU, attributed mainly to the exports of
financial services. The bulk of the financial services exports do not go to the ECA West countries: 42
percent of the £38.1 billion in net export earnings in the UK financial sector in 2013 came mainly from
the developed countries in EU countries. In addition, Brexit may affect access to services sectors in the
EU and may encourage more UK firms to relocate to other EU countries to serve the market.
The effect of Brexit on investment flows into ECA West countries is uncertain but likely to be small.
The share of UK investments in these countries is small. Most foreign direct investment (FDI) flowing
from the UK into the EU goes to France, Germany and the Netherlands. To a smaller degree, Estonia,
Hungary, Slovakia, and Slovenia received some amount of FDI from the UK in 2014 but it is a small
percentage of the total FDI inflows. Brexit will not change the fundamental reasons for British investors
to invest in ECA West countries.
On the other hand, there may be some increase in FDI into ECA West countries as foreign investors
redirect part of their investments from the UK. One of the reasons for investing in the UK is to access
the large EU market. Without this advantage, some investors may move their investments to another EU
country. ECA West countries may benefit from firms moving out of the UK and locating in more
14
developed ECA countries. While UK firms may not move to an ECA West country, there may be spillover
effects when these firms locate in another EU country that require supporting services and suppliers in
the region. The ability of ECA West countries to attract these foreign investment flows will depend to a
large degree on the underlying business environment.
Regional focus 2: Impact on Sub Saharan Africa
The short-term impacts will emanate from the uncertainty that the Brexit vote has caused. Brexit was
a vote against something rather than a vote for something. The nature of the new relationship between
the UK and the EU will likely be unclear for at least the next two and half years. This uncertainty is being
felt at the moment in the main currency and stock markets and what is not clear is how much this will
spillover will interact with other sources of uncertainty in the global economy. We do know that such
uncertainty is not good for the volume of global trade.
The most direct effects in the short-term will come from exchange rate movements. The biggest
falling currency after the Pound in the aftermath of Brexit was the South African Rand. This comes on
top of a period of sustained pressure on a number of currencies in Africa. So there will likely be an
increase in current account challenges and upward pressure on prices in countries. The domestic
currency value of remittances from the UK and other European countries may fall, while those from the
US may increase. Exporters of products denominated in dollars could see some positive impact on
export receipts in local currency.
If the uncertainty translates into slower growth, primarily in the UK, then there may be some impact
on UK imports from Africa. South Africa and Nigeria account for over 70% of UK imports from SSA.
Most of these imports are products of the mining sector including crude oils and precious stones. Of
non-mining UK imports, South Africa accounts for 75% of the total – mainly due to vehicles. In terms of
shares of goods exports going to the UK – Mauritius appears to be most dependent with over 18% of
total exports going to the UK in 2014, followed by Nigeria (5%). Other countries with export
dependence to the UK include: Malawi (4.9%); Mozambique (4.4%); The Gambia (4.3%); Cameroon
(4.2%); South Africa (3.8%) and Madagascar (2.2%). For all other SSA countries the UK is the destination
for less than 2% of total exports.
In the longer term there is uncertainty about what the UK trade policy may look like after it leaves
the EU. This will be a key issue that will be discussed over the next two years. A likely outcome is that
the UK will remain in the single market or at the least part of the Common Customs Area – there was
discussion during the referendum of the UK running its own trade policy and negotiating its own trade
deals but this is most unlikely. Even if the UK were to pursue its own independent trade policy it is
unlikely that the UK would raise tariffs against SSA countries. Issues around standards will arise. Even if
the UK were to leave the single market, it is unlikely that it would revisit all of the EU standards it has
adopted or would disengage from the European standards setting bodies.
To conclude, the main impact of Brexit on SSA is from the uncertainty it has caused and the impact on
exchange rates and the subsequent changes in the value of imports and remittances. In itself, the size
of this shock is unlikely to be unmanageable – the challenge is that for many countries it comes on top
of and exacerbates existing uncertainties and adjustments as China reorients its growth path and
commodity prices decline. In terms of exports, the impact of any slowdown in growth in the UK will
probably be focused on a few countries, notably Mauritius, South Africa and Nigeria.
15
ANNEX 3. Estimates of Brexit Impact: Survey of Studies Published Prior to the Brexit Vote
Estimates of the magnitude of the Brexit impact vary widely depending on the post-Brexit trade
policy scenarios assumed, the transmission channels considered, and the modeling technique used.
There is a broad agreement among the “mainstream” (negative) estimates that the post-Brexit outcome
is more negative the weaker is the deal negotiated with the EU. That is, the Norway scenario dominates
the Canada FTA scenario, which dominate scenarios in which tariffs are imposed between the UK and
EU. Estimates which consider uncertainty, FDI, and especially productivity effects of lower trade and FDI
produce the most negative effects. Potential positive effects on the UK could include reduced budget
contributions and a greater freedom in both trade and regulatory policy. The one available Computable
General Equilibrium (CGE) study looking at third-country effects finds that there would be modest
negative effects on the EU from Brexit, most notably on Ireland, and miniscule positive effects on non-
EU countries from reversal of the historically caused EU trade diversion (see below for more details).
In a survey of estimates of Brexit effects recently published by the Institute of Fiscal Studies, the
average GDP effects relative to a 2030 baseline were between -2.0 percent and -3.8 percent. This
range characterizes the central estimates of 16 scenarios from 8 organizations. Similarly, the central
tendency for estimates of merchandise trade effects runs from -13.5 to -16.5 percent, based on 11
scenarios from four organizations, and of FDI effects, -17 percent to -24 percent, based on eight
scenarios from three organizations (see Institute for Fiscal Studies, “Brexit and the UK’s Public Finances,”
May 2016).
The extreme bounds of GDP effects range from +4.0 percent (Economists for Brexit) to -9.5 percent
(lower bounds of estimates from Center for Economic Performance (CEP) and HM Treasury). Of the
eight organizations surveyed, six report only negative GDP effects, one (Economists for Brexit) reports a
single positive effect, and one (Open Europe) reports effects that center around zero.
Most studies focus on effects on the UK alone. Many note that there are substantial trade and
investment linkages between the UK and other economies. Ciuriak et al (2015)3, using a CGE
framework, find that Brexit would have modest negative effects on EU members and potentially
positive effects on non-EU members. In their central “WTO option” scenario, in 2030 the UK would
experience losses of -2.8 percent (close to the consensus of studies) while other EU members would
lose -0.3 percent of GDP, with higher losses in Ireland, Benelux and the Baltics (see annexes). Other
major economies would benefit fractionally from the undoing of trade diversion caused by the old EU,
ranging from 0.03 percent of GDP in the US and China to 0.04 percent of GDP in Canada and Japan.
These effects would be modified if the UK received Norway-type treatment. Benefits of TTIP for the EU-
minus-UK are more or less the same whether the UK is in or out.
The wide range of estimates reflects three main considerations: the trade scenarios considered, the
channels of economic effects included in the model, and the choice of modeling technique. The way in
which these impact estimates are as follows:
Trade policy scenarios
3 Dan Ciruriak and Jingliang Xiao, with Natassia Ciuriak, Ali Dadkha, Dmitry Lysenko and Badri Narayanan, “The
Trade-Related Impact of a UK Exit from the EU Single Market,” Ciuriak Consulting Inc., April 25, 2015
16
Considering only cases where different scenarios have been done by the same organization, there is a
fairly consistent ranking of trade policies in terms of outcome, as follows:
o Scenarios in which Britain ends up in the European Economic Area (like Norway or
Iceland) are the least negative. In these scenarios, there would be nearly duty-free UK-
EU trade, except for agriculture, and nearly full access to the EU single market, including
for financial services. Britain would have access to 26 EFTA FTAs but not to other EU
FTAs, which number 35 in total. EU rules on free movement of people would apply,
Britain would make budgetary contributions, and goods would face trade costs at
customs checkpoints.
o Scenarios in which Britain negotiates a free trade area with the EU rank next. These
take a variety of forms. For example, the EU-Switzerland FTA grants more limited
sectoral access to the EU than Norway has but is otherwise similar (Switzerland belongs
to EFTA but not the EEU). The EU-Turkey Customs Union, which imposes a common
external tariff, and EU-Canada FTA provide duty-free treatment but no special access to
the EU single market or to EU FTA partners. Given their expressed desire for policy
freedom, policymakers informed by the Leave campaign are unlikely to be amenable to
the EU-Turkey option, since Brussels would continue to inform the external tariff.
o Scenarios in which there are no special relations between Britain and the EU (so-called
WTO scenarios) are scored widely by different organizations. WTO scenarios are scored
as the most negative by analyses which assume that the EU would impose external
tariffs on the UK (and perhaps the UK would also impose an MFN tariff on the EU).
More positive results come from assuming that the UK, being free to negotiate
agreements of its own choice, secures wider or deeper partnerships than the EU has, or
engages in unilateral free trade. For example, in a scenario in which the UK nimbly
manages to negotiate a separate UK-USA agreement with deeper commitments, both
partners would come out ahead relative to the agreement which is currently being
negotiated.
Channels of impact modeled
Available studies very widely on the channels of impact in which Brexit could affect the UK economy.
Besides trade, these include the following:
Likely negative impacts: increases in uncertainty, decreases in FDI, decreases in
migration.4 If it is assumed that trade and FDI are linked to the level of UK productivity,
then reductions in either of these may be assumed to lead to lost productivity. The
studies with the largest negative estimates of Brexit effects on the UK include large
negative productivity impacts.
Likely positive impacts: If the UK does not join the EEA (Norway option), there would be
a direct budgetary savings to the UK from not making EU contributions of around 0.4
percent of GDP. Improvements in efficiency from de-linking business regulation from
4 This refers to most estimates of the aggregate effect of reduced migration, and does not address distributional
impacts. For example, the impact of reduced migration on less-skilled UK workers might be positive.
17
Brussels could be on the order of +0.3 percent of GDP (OECD) to +0.7 percent (Open
Europe).
Modeling techniques also affect the magnitude of the effects modeled. The various
studies variously use CGE models or gravity models. It is not clear whether using one
method or the other is likely to lead to larger effects. Estimates from CGE models derive
from explicit foundations of microeconomic theory and are better capable of capturing
explicit details of trade policy, such as tariff structures, but have difficulty with effects of
regional integration that are harder to quantify. Gravity models (like those used by HM
Treasury) can potentially capture harder-to-quantify unobservable effects but are less
tied to economic theory.
Optimistic, contrarian views
Alone among the studies reviewed by IFS, Economists for Brexit (2016, “The Economy After Brexit,”)
provides a positive estimate of the effects of Brexit. This estimate arises from a different economic
paradigm than most of the other available studies, though certain of its arguments are noted in other
studies. The main arguments in the optimistic case, presented by a variety of individual authors, are as
follows:
The EU’s economic growth performance in recent years has been weak, and there is no
particular advantage in close links to the EU.
Sharp increases in regulation in the EU have contributed to weak growth, and the UK might
perform better with more economic freedom.
An independent UK could adopt or negotiate more liberal trading rules in areas where the EU is
protectionist, leading to lower prices. Continued membership in the WTO provides a substantial
measure of policy stability.
Since UK growth is likely to be higher outside of the EU, jobs performance should also expect to
be better.
Immigration from the EU has negative consequences on UK unskilled workers, which would be
mitigated under an independent UK immigration policy. An independent policy which allowed
the UK to restrict EU immigration could potentially be more liberal with respect to non-EU
immigration.
The City of London is likely to remain a major financial sector regardless of what happens. As a
member of the EU, the UK has limited ability to influence financial sector regulation, and is
exposed to tensions between euro-zone and non-eurozone countries.5
Budgetary contributions to the EU could be eliminated, with the money spent better on
domestic priorities. The concerns of UK universities and other organizations which receive EU
funding are overblown, since the money comes from the UK in the first place.
5 The argument stated in this short form either discounts the potential negative effects of losing the EU “financial
services passport,” or assumes EEA (Norway-type) treatment in the post-Brexit environment.
Related Documents