CEPAL REVIEW 91 • APRIL 2007 67 Trade agreements by Colombia, Ecuador and Peru with the United States: effects on trade, production and welfare José E. Durán Lima, Carlos J. de Miguel and Andrés R. Schuschny T he Computable General Equilibrium model, based on the Global Trade Analysis Project (GTAP) model, is used to evaluate the impact of separate bilateral free trade agreements by Colombia, Ecuador and Peru with the United States of America (USA). As the Andean Trade Promotion and Drug Eradication Act ( ATPDEA) is to expire shortly, a number of different scenarios have been analyzed: full liberalization, liberalization excluding sensitive products and non-conclusion of agreements. Signature of the agreements would lead to a widespread increase in trade among the negotiating countries to the detriment of their Andean partners. While the effects on welfare would benefit only the United States and Peru, from the capital accumulation standpoint they are clearly positive for all countries. Research shows that, while these agreements would not be enough on their own to trigger a process of sustained development, an active economic and social policy could usefully tap their potential. KEYWORDS Treaties Free trade Trade negotiations Social welfare Economic analysis Econometric models Andean region United States José E. Durán Lima Economic Affairs Officer, International Trade and Integration Division, ECLAC ✒ [email protected] Carlos J. De Miguel Economic Affairs Officer, Sustainable Development and Human Settlements Division, ECLAC ✒ [email protected] Andrés R. Schuschny Statistician, Economic Projections Centre, Statistics and Economic Projections Division, ECLAC ✒ [email protected]

Welcome message from author
This document is posted to help you gain knowledge. Please leave a comment to let me know what you think about it! Share it to your friends and learn new things together.
Transcript

C E P A L R E V I E W 9 1 • A P R I L 2 0 0 7
67
Trade agreements byColombia, Ecuador and Peruwith the United States: effects
on trade, production and welfare
José E. Durán Lima, Carlos J. de Miguel andAndrés R. Schuschny
The Computable General Equilibrium model, based on the Global
Trade Analysis Project (GTAP) model, is used to evaluate the impact of
separate bilateral free trade agreements by Colombia, Ecuador and
Peru with the United States of America (USA). As the Andean Trade
Promotion and Drug Eradication Act (ATPDEA) is to expire shortly, a
number of different scenarios have been analyzed: full liberalization,
liberalization excluding sensitive products and non-conclusion of
agreements. Signature of the agreements would lead to a widespread
increase in trade among the negotiating countries to the detriment of
their Andean partners. While the effects on welfare would benefit only
the United States and Peru, from the capital accumulation standpoint
they are clearly positive for all countries. Research shows that, while
these agreements would not be enough on their own to trigger a process
of sustained development, an active economic and social policy could
usefully tap their potential.
K E Y W O R D S
Treaties
Free trade
Trade negotiations
Social welfare
Economic analysis
Econometric models
Andean region
United States
José E. Durán Lima
Economic Affairs Officer,
International Trade and
Integration Division,
ECLAC
Carlos J. De Miguel
Economic Affairs Officer,
Sustainable Development and
Human Settlements Division,
ECLAC
Andrés R. Schuschny
Statistician,
Economic Projections Centre,
Statistics and Economic
Projections Division,
ECLAC

68
TRADE AGREEMENTS BY COLOMBIA, ECUADOR AND PERU WITH THE UNITED STATES: EFFECTS ON TRADE, PRODUCTION AND WELFARE • JOSÉ E. DURÁN LIMA, CARLOS J. DE MIGUEL AND ANDRÉS R. SCHUSCHNY
C E P A L R E V I E W 9 1 • A P R I L 2 0 0 7
There is widespread consensus that free trade agreements lead to increased exports and production levels in the short to medium term and provide an opportunity to introduce an analysis of productive development agendas, including competitiveness. However, some regional experiences have shown that dynamic export growth does not go hand-in-hand with equally dynamic growth rates in gross domestic product (GDP), meaning that additional policies are needed to accompany liberalization and efforts to access new markets. During the process of trade opening and signature of free trade agreements, new opportunities also bring with them the challenge of how to minimize or mitigate the adverse effects on the least competitive sectors of the greater exposure to global competition entailed by trade opening.
In the short term, the net effect that will determine whether trade liberalization is beneficial to a country will be established on the basis of its impact on welfare. This will be the result of a combination of sometimes opposing factors, including: (i) the trend in the terms of trade and changes in relative prices; (ii) the effects on tax revenues and their use; (iii) a country’s pattern of production specialization; (iv) winner and loser sectors; (v) the predominant types of employment and the level of technology in the sectors and (vi) the distribution of added value among the various factors of production. The effects on production costs and the timely availability of factors of production and inputs will also be key factors in effectively exploiting the new dynamic created by free trade agreements.
The inclusion of long-term elements, such as attracting greater foreign investment, technological change arising from easier access to high-technology capital goods, possible reductions in country-risk premiums in response to a better reputation and a reduction in the monopoly power of sectors exposed to stiffer competition as a result of trade opening, can create additional dynamic benefits that qualify, accentuate or reverse the short-term results.
The main objective of this study is to evaluate the socio-economic effects that would occur as a result of three Andean countries (Colombia, Ecuador and Peru) concluding separate free trade agreements (FTA) with the United States. The process of negotiating bilateral agreements with the United States is not confined to the Andean countries but responds, in part, to an international context that is both political (geostrategic interests and competition by areas of influence) and commercial (multilateral negotiations are stalled). In fact, the scant success with negotiations within the multilateral trade system, following the skepticism generated at the World Trade Organization (WTO) Ministerial Conference in Cancun and the timid advances made at the WTO Ministerial Conference in Hong Kong, has led to a wave of bilateral and multilateral free trade agreements.
At present, the Latin American and Caribbean countries continue to negotiate a large number of preferential free trade agreements of varying types with countries from inside and outside the region. By September 2006, around 70 trade intra- and extraregional agreements had been concluded, not counting those still under negotiation. All of these agreements and their corresponding negotiation processes have generated centrifugal and centripetal forces that tend to unite or divide the process of regional integration respectively. Thus, one political consequence of the free trade agreement negotiations by three Andean countries with the United States, and specifically the conclusion of negotiations in the cases of Peru (November 2005) and Colombia (April 2006), has been the decision by the Bolivarian Republic of Venezuela to formally withdraw from the Andean Community (AC). However, this study does include the Bolivarian Republic of Venezuela among the AC members when counting the regional aggregates, since the simulation exercises were conducted prior to the country’s withdrawal.
The negotiation process for the free trade agreements in this study has not been easy. From the very outset, the negotiations have been plagued by innumerable tensions. Indigenous peoples, peasant farmers, small-producer organizations, trade unions and many social movements moved to halt the progress of
IIntroduction
The authors are grateful for the useful comments provided by Robert Devlin, André Hofman, Felipe Jiménez, José Luis Machinea, Watanuki Masakazu, Osvaldo Rosales, María Inés Terra, Sara Wong and an anonymous judge.

69
TRADE AGREEMENTS BY COLOMBIA, ECUADOR AND PERU WITH THE UNITED STATES: EFFECTS ON TRADE, PRODUCTION AND WELFARE • JOSÉ E. DURÁN LIMA, CARLOS J. DE MIGUEL AND ANDRÉS R. SCHUSCHNY
C E P A L R E V I E W 9 1 • A P R I L 2 0 0 7
the negotiations. The negotiations were viewed as a huge concession to United States economic and geopolitical interests. This is why we feel that it is appropriate to conduct as objective as possible a quantitative evaluation of the consequences of concluding these agreements for the three countries involved in the negotiations. This study therefore analyses the macroeconomic and sectoral effects (GDP, exports, imports and intraregional trade), as well as their impact in terms of welfare. The database of the Global Trade Analysis Project (version 6.1) and the associated computable general equilibrium model were used. As the base year for the original GTAP database was 2001, the information on tariff protection was updated to 2004 in order to reflect the current situation regarding all the preferential agreements and tariff reductions in force in the region. This was the reference year used for the simulation exercises. Thus, our benchmark scenario already incorporates the effects of the unilateral preferences granted by the United States under the Andean Trade Promotion and Drug Eradication Act, so it is possible to filter the real effects of the agreements under negotiation.
It is important to note that, as with any application of the computable general equilibrium model, the simulation exercises in this study do not consider the possible effects of non-commercial aspects of a free trade agreement (such as services, investments, public procurement, intellectual property or competition policy), which for some countries are even more important than the purely commercial aspects. Furthermore, as they are static simulation exercises, their added value lies in identifying “winner” and “loser” sectors, regions and agents. These are therefore short to medium term results that do not allow growth paths to be deduced nor possible dynamic effects to be incorporated.1 Even though the model faithfully reflects the system of prices and quantities, as well as the public policies applied (in this case free trade
agreements), it does not incorporate the institutional, cultural, administrative, business and other elements that are also key to exploiting the static and dynamic advantages of a trade agreement and to mitigating adverse effects. Although these limitations do not invalidate the results, they do limit the scope of interpretation and call for caution in the use of the model.
In summary, this study uses a computable general equilibrium model to analyse the direct and indirect effects of Colombia, Ecuador and Peru concluding bilateral free trade agreements with the United States, in three static and two dynamic scenarios. In the main static scenario, the three Andean countries (hereafter referred to as AC3) and the United States fully liberalize their trade reciprocally (“AC3-USA full liberalization”). Next, two alternative scenarios are simulated: one that excludes sensitive products (“AC3-USA excluding sensitives”) and another where no agreement is concluded and ATPDEA benefits from the United States are terminated (“No FTA/end ATPDEA”). This non-signature scenario could be considered as an alternative to the scenario of signing free trade agreements. The “AC3-USA full liberalization” and “No FTA/end ATPDEA” scenarios are also simulated dynamically.
Section II of this article describes the key variations between the AC countries’ trade policies, highlighting the main reasons that prompted them to engage in negotiations with the United States. The section also reviews literature on the computable general equilibrium model in the region and in the AC countries. Section III describes the model’s characteristics and the details of country and product aggregations, as well as of the simulation scenarios analysed. Section IV presents the main results. Lastly, Section V makes a number of conclusions and discusses the economic policy implications.
1 At the end of the study, the simulation results are analysed in a “dynamic” version of the model, based on a steady-state representation.

70
TRADE AGREEMENTS BY COLOMBIA, ECUADOR AND PERU WITH THE UNITED STATES: EFFECTS ON TRADE, PRODUCTION AND WELFARE • JOSÉ E. DURÁN LIMA, CARLOS J. DE MIGUEL AND ANDRÉS R. SCHUSCHNY
C E P A L R E V I E W 9 1 • A P R I L 2 0 0 7
1. Trade strategy of the Andean countries
The AC countries’ trade policy has developed in three directions: towards unilateral, bilateral and multilateral liberalization. Between the mid-1980s and the late 1990s, the Andean countries unilaterally reduced their average tariff levels from more than 40% to around 12%.
Another pillar of liberalization was regional integration. In 1969, the Andean countries concluded the Cartagena Agreement in a determined bid to achieve greater commercial and industrial integration. This initiative was inspired by policies of import substitution-led industrialization, which was very much in vogue at the time. However, integration ground to a halt without achieving any tangible results until 1991. During the 1980s, the Andean subregion found it very hard to comply with tariff reduction commitments. In response to the initiative of the Southern Common Market (MERCOSUR) in 1991, the member countries of the Andean Pact agreed to relaunch the integration initiative. So, as from 1992, somewhat deeper integration was achieved among Colombia, Ecuador, Bolivia and the Bolivarian Republic of Venezuela, having been given new impetus by the free trade agreement concluded by Colombia and the Bolivarian Republic of Venezuela in the same year. A free trade zone among the member countries which had been in operation since 1993 was turned into an (albeit imperfect) Customs Union in 1995. The new challenge of globalization made it necessary to deepen integration by introducing a common external tariff. However, this process is still ongoing.2
Trade between the AC countries has increased since the free trade zone came into force (1993). Between 1990 and 2005, its annual rate of growth was 13.5%. However, intrasubregional trade is still limited compared with intraregional trade in Asia and the European Union for example. Whereas in the Andean Community the coefficient of intraregional trade (intraregional
exports/total exports) is around 10%, in Asia it is one third and in the European Union, approximately two thirds (Rosales, Durán and Sáez, 2006). In terms of trade volume, the United States alone is a much more important partner than the subregion itself.
The AC countries also played an active part in the Uruguay Round negotiations and made major efforts to reduce and equalize import barriers on virtually 100% of their entire tariffs lines. Their active participation in the multilateral negotiations has continued to this day, chiefly because there are a number of issues at stake of special importance for improving their competitiveness, such as greater access to markets for agricultural products and the abolition of domestic support and subsidies in developed countries. This is why the Andean countries participate in the World Trade Organization (WTO) negotiations in a coordinated manner, especially on the agricultural issues mentioned. However, this is a slow process in which it takes a long time to reach consensus. On average, a multilateral round lasts six years, since countries, and particularly their entrepreneurs, need to expand their trade opportunities into new markets quickly, especially for products where they have a comparative advantage.
The scant success with negotiations within the multilateral trade system, following the scepticism at the WTO Ministerial Conference in Cancun and the timid advances made at the Hong Kong Conference, has led to a wave of bilateral and multilateral free trade agreements. At present, the Latin American and Caribbean countries continue to negotiate a large number of preferential free trade agreements of varying types with countries from inside and outside the region. Between 2001 and 2005, countries in the region concluded at least 10 new free trade agreements with countries in the northern hemisphere. This increased trend towards north/south agreements affected the Andean countries both directly and indirectly, since in a sense the proliferation of bilateral and multilateral FTAs reflected the frustration of many Governments at the slow progress made under the multilateral trade system.
IIThe Andean Community’s trade policy and
reasons for negotiating a free trade agreement
with the United States
2 See Durán and Maldonado (2005).

71
TRADE AGREEMENTS BY COLOMBIA, ECUADOR AND PERU WITH THE UNITED STATES: EFFECTS ON TRADE, PRODUCTION AND WELFARE • JOSÉ E. DURÁN LIMA, CARLOS J. DE MIGUEL AND ANDRÉS R. SCHUSCHNY
C E P A L R E V I E W 9 1 • A P R I L 2 0 0 7
2. Andean Trade Preference Act, its expansion and trade between the Andean Community countries and the United States
The United States is the Andean countries’ leading trading partner. In 2005, 40% of the group’s total exports went to the United States and, in return, 26% of total imports into the Andean Community came from the United States. By contrast, total exports from the United States to AC countries account for barely 1.6%. Andean exports are mainly composed of petroleum and mining (54%), heavy manufactures (21%) and, to a lesser extent, light manufactures (13%) and agricultural products (7.6%). Fuels and petroleum by-products together represent 56% of exports, although sectors such as metals (7%), wearing apparel (6.5%), other crops and chemicals (each around 4%) also play an important role. Imports from the United States to AC countries predominantly comprise heavy manufactures, which account for more than 70% of the total. The machinery and equipment, chemicals, rubber and plastics and other manufactures sectors represent more than 60%. The machinery and equipment sector basically comprises capital goods.
One factor that has heavily influenced relations between the Andean countries and the United States has undoubtedly been the United States Andean Trade Preference Act (ATPA), which was expanded and replaced in 2002 by the United States Andean Trade Promotion and Drug Eradication Act (ATPDEA), after the original act expired in late 2001. Despite being part of the United States trade policy, as both these legal instruments are unilateral, they have been central to the trade policy of the three Andean countries that have embarked on negotiations for the signature of a free trade agreement.
ATPA was approved by the United States Congress in December 1991, providing access to the United States market for 5,600 tariff headings and granting preferences to four Andean countries (Bolivia, Colombia, Ecuador and Peru). The aim was to provide them with better commercial alternatives to the illegal sale of drugs to the United States, as well as to contribute to their development and to the consolidation of democratic institutions in the four countries. When ATPA expired in 2001, the United States Government approved ATPDEA to replace it. This new act was promulgated on 6 August 2002 and conferred retroactive benefits starting from the date on which the former act expired.
The new act added around 700 products to the original list, increasing the number of products with
free access to 6,300 (United States International Trade Commission (USITC), 2005 and 2006). The term of ATPDEA was extended from 31 December 2006 to June 2007.
Between 1992 and 2005, exports from the Andean ATPDEA beneficiary countries grew fast as a result of improved access to the United States market, especially in the three-year period from 2003 to 2005. The products with the highest increases were basically raw materials, especially minerals, and manufactures based on natural resources, such as textiles and fuels (table 1 and figure 1). In general, tariff preferences under ATPDEA form a large proportion of total exports from each country.
Exports from the Andean countries to the United States chiefly comprise primary products and manufactures based on natural resources. These sectors offset the deficit created by imports of intermediate and high technology manufactures, such as electrical machinery, accessories and parts and electronic equipment (table 2).
3. Reasons for entering into trade negotiations with the United States
A combination of factors led the Andean countries to accept the United States’ invitation to start negotiations on a free trade agreement: (i) the small size of the regional market, representing no more than 10% of total trade; (ii) weak regional integration and a dearth of agreements at the time when consensus was reached on key issues such as final approval of the common external tariff and the deepening of trade in services; (iii) little or no probability of progress with the negotiations on the Free Trade Area of the Americas (FTAA), which have technically been at a standstill since March 2004; (iv) scepticism about the feasibility of achieving speedy and conclusive results with multilateral negotiations; and (v) the huge importance of the United States as a trading partner for the AC3 countries. All these factors, combined with each country’s need to maintain predictable trade relations with their northern neighbour as the end of ATPDEA in December 2006 drew near, led Colombia, Ecuador and Peru to accept the United States’ invitation to start trade negotiations for the conclusion of separate free trade agreements.
The negotiations began in Cartagena (Colombia) in May 2004. In 2005, there were 12 negotiation rounds involving three countries (Colombia, Ecuador and Peru). Bolivia maintained observer status throughout

72
TRADE AGREEMENTS BY COLOMBIA, ECUADOR AND PERU WITH THE UNITED STATES: EFFECTS ON TRADE, PRODUCTION AND WELFARE • JOSÉ E. DURÁN LIMA, CARLOS J. DE MIGUEL AND ANDRÉS R. SCHUSCHNY
C E P A L R E V I E W 9 1 • A P R I L 2 0 0 7
TABLE 1
Andean Community: main products exported to the United Statesand percentages of use of atpdea, 2005a
(Percentages)
Country Main products by country Percentage of each Country contribution to (% of the total under ATPDEA) country’s total exports total ATPDEA exports
2001 2005 2001 2005
Bolivia Precious metals, zinc, nuts, shirts, cotton fabrics, wood products (95%) 41.1 53.7 3.3 1.5
Colombia Petroleum and by-products, gold, coal, coffee, bananas, textile products, plastics, aluminium, ceramics (96%) 50.5 50.6 43.1 41.8
Ecuador Petroleum and by-products, bananas, shrimps, flowers, tuna, cocoa, cocoa butter (98%) 77.3 64.2 13.1 35.7
Peru Copper, gold, shirts, pullovers, petroleum, zinc, silver, asparagus, coffee, mangoes (91%) 43.5 43.9 40.6 21.0
Four ATPDEA beneficiary countries 56.2 53.0 100.0 100.0
Source: Authors, based on official data from the United States Department of Commerce (International Trade Commission, 2005 and 2006).
a ATPDEA: Andean Trade Promotion and Drug Eradication Act (United States).
FIGURE 1
Andean countries: exports to the United States under ATPA and ATPDEA, 1992-2005a
(Millions of United States dollars)
Source: Authors, based on official data from the United States Department of Commerce (International Trade Commission, 2005 and 2006).
a ATPA = Andean Trade Preference Act. ATPDEA = Andean Trade Promotion and Drug Eradication Act. Both are United States laws.
12 000
10 000
8 000
6 000
4 000
2 000
0
ATPA (1991)
ATPDEA (2002)
1992 1993 1994 1995 1997 1998 1999 2000 2001 2002 2003 2004 2005
Bolivia
Peru
Ecuador
Colombia
Mill
ions
of
dolla
rs

73
TRADE AGREEMENTS BY COLOMBIA, ECUADOR AND PERU WITH THE UNITED STATES: EFFECTS ON TRADE, PRODUCTION AND WELFARE • JOSÉ E. DURÁN LIMA, CARLOS J. DE MIGUEL AND ANDRÉS R. SCHUSCHNY
C E P A L R E V I E W 9 1 • A P R I L 2 0 0 7
the negotiation process, but did not actually join in the negotiations.
From the outset, the negotiations of the three Andean countries with the United States have been beset by political and social problems and setbacks. Some civil society groups were highly active in their determination to hold up the process, as they considered their governments to be making concessions to United States economic and geopolitical interests. In spite of the climate of unease and doubts about the viability and social legitimacy of such negotiations, Peru and Colombia concluded agreements in November 2005 and March 2006, respectively, whereas Ecuador has postponed negotiations in an effort to reach an agreement more conducive to its own interests.
4. An overview of literature on the subject
There has been a large increase in economic literature on measuring the effects of free trade agreements, prompted mainly by changes in the trade policy of the principal international trading partners. That is why many economists have focused their efforts on evaluating the possible effects of this greater trade liberalization.
Innumerable studies have focused on evaluating the effects of free trade agreements in the region, especially advance studies on the possible effects of the FTAA negotiations. A large number of these studies were carried out on the basis of rather large aggregations of sectors and regions. These studies included Cuadra and Florián (2005); Andean Development Corporation (2005);
Argüello and Valenzuela (2005); Latin American Integration Association (2004); Argüello (2004); Diao, Diaz-Bonilla and Robinson (2002); Diao and Somwaru (2001) and Hinojosa-Ojeda, Lewis and Robinson (1997).
Monteagudo, Rojas et al (2004); Light (2003); Argüello (2004); Argüello and Valenzuela (2005); Andean Community (2005); Morales, Parada and Torres (2005) and Sepúlveda (2005) make specific references to studies on assessing the impact of FTAs involving Andean countries. Some impact assessments of free trade agreements consider only the country dimension, as is the case with Botero (2005) in relation to Colombia and with Morales, Parada and Torres (2004) in relation to Ecuador. The latter article was not written in a general equilibrium context.
The results of studies like these show that the changes which have taken place in trade are generally greater than those in GDP, with very little effect on welfare. Of the studies mentioned, only Cuadra and Florián (2005) conduct simulations that consider the long term by explicitly including dynamic elements that capture the effects of capital accumulation in the model. Their approach follows that of Baldwin and Venables (1995), François and McDonald (1996) and Walmsley (1998). In these cases, the results show that GDP growth may be greater than that achieved by applying static computable general equilibrium models. Obviously this leaves the debate open on the possible positive bias of dynamic effects in computable general equilibrium models.
TABLE 2
Andean Community: trade with the United States, 2004(Millions of dollars)
Country Exports Imports Trade Opening of the trade balance according to technology intensity balance Raw Manufactures Low Intermediate Other materials based on natural technology and high resources technology
Bolivia 360 260 99 31 127 99 - 144 - 13
Colombia 7 042 4 807 2 235 3 729 42 472 -2 434 426
Ecuador 3 265 1 323 1 942 2 682 168 - 58 - 847 - 4
Peru 3 604 1 981 1 622 170 1 713 692 -1 042 89
Venezuela (Bol. Rep. of)a 11 075 2 754 8 321 9 305 111 - 112 - 963 - 20
AndeanCommunity 25 346 11 126 14 220 15 917 2 161 1 093 -5 430 479
Source: Authors, based on information from the United Nations Commodity Trade Statistics Database (COMTRADE).
a Based on information for 2003.

74
TRADE AGREEMENTS BY COLOMBIA, ECUADOR AND PERU WITH THE UNITED STATES: EFFECTS ON TRADE, PRODUCTION AND WELFARE • JOSÉ E. DURÁN LIMA, CARLOS J. DE MIGUEL AND ANDRÉS R. SCHUSCHNY
C E P A L R E V I E W 9 1 • A P R I L 2 0 0 7
1. The model
The Global Trade Analysis Project (GTAP) model and database were used for the exercises in this study. It is a multiregional computable general equilibrium model, linked with a global database which, in addition to modelling trade flows between countries, includes an explicit treatment of the transport sector, a reconciliation system (or global bank) that mediates between the levels of savings and investment and a module that simulates the behaviour of demand from household consumption, from the production sector (intermediate goods) and from the Government, as well as the behaviour of primary demand factors (Hertel, 1997; Schuschny, Durán and de Miguel, 2007).
Version 6.1 of the model was used for the simulation exercises in this study. This is based on assumptions of perfect competition and constant returns to scale. The model simulations are implemented numerically via the GEMPACK calculation software.3
To avoid the use of integrated social accounting matrices (SAM) for each country or region and to facilitate calculations of the equivalent variation,4 the model uses an “aggregate regional household” that collects income and taxes, pays subsidies and, via a Cobb-Douglas-type per capita utility function, allocates levels of spending, in constant shares, to private consumption (households themselves, which provide skilled and unskilled labour to firms), government expenditure and savings.
In addition to making a distinction between domestic and imported goods, consumers are able to distinguish between similar imported goods according to their origin (Armington, 1969). Under Armington’s assumption, imports are imperfect substitutes for domestic products. The behaviour of households is simulated with implicit uti8lity functions of the constant differences of elasticity variety.
The behaviour of firms (sectors) is shown as a “technology tree” (figure 2) which determines the
primary demand factors (skilled and unskilled labour, capital, land and natural resources) and intermediate consumer goods, which can be produced domestically or imported (using Armington’s assumption). The latter can, in turn, come from a variety of sources (even though the elasticities of substitution are identical in all the countries included in the model). The supply of primary factors and intermediate inputs is based on the use of Leontief functions, and constant elasticity functions are used to determine their origin (domestic or imported) and, in turn, their demand by specific regions. The choice of how much to supply to the domestic market and how much to export is modelled with a constant elasticity of transformation function.
As the model is not enough on its own to explain investment behaviour, investment must be adjusted in accordance with regional changes in savings. As part of the model’s accounting closure, it is assumed that the current account may be other than zero but that it must be balanced with each country’s trade balances by means of a sort of global bank.
Different closures of the model were used to change the baseline, as depicted in the ovals in figure 3, in accordance with Schuschny, Durán and de Miguel (2007). With respect to the free trade agreement simulations under analysis, and in order to avoid artif ices that would distort the model’s representativeness and its comparability with other studies, a standard or general equilibrium closure was assumed, in which all the markets are balanced, the benefits are zero, the agents’ budgetary constraints are met and therefore Walras’ Law is met.5
It remains for future studies (in particular a study of the exogenous trade balance, which permits a longer-term analysis) to explore other closure
IIIDescription of the methodology
3 General Equilibrium Modelling Package. See Harrison and Pearson (1996).4 Indicator that determines changes in welfare levels.
5 Even though this form of closure (the most standard type) has been adopted for this study, a simulation was also made of a case in which variations in the imbalance/equilibrium of each country’s trade balances were impeded, requiring additional adjustments in relative prices and hence in the real rate of exchange, in order to satisfy this macroeconomic constraint. That is to say, in this case a country cannot increase its pre-existing deficit or surplus after the simulated perturbation. As welfare outcomes were similar in sign and magnitude, it was decided to exclude it from this study.

75
TRADE AGREEMENTS BY COLOMBIA, ECUADOR AND PERU WITH THE UNITED STATES: EFFECTS ON TRADE, PRODUCTION AND WELFARE • JOSÉ E. DURÁN LIMA, CARLOS J. DE MIGUEL AND ANDRÉS R. SCHUSCHNY
C E P A L R E V I E W 9 1 • A P R I L 2 0 0 7
FIGURE 2
Production process of firmsa
FIGURE 3
Sequential methodology for updating trade policy data and scenarios for separate bilateral free trade agreements by three andean countries with the United States
Source: Authors, based on Hertel (1997).
a CES = constant elasticity of substitution.
End Product (qop,r
)
Leontief
Value Added (qvap,r
)
ESUBVA(CES)a
Intermediate inputs (qft,p,r
)
ESUBD(CES)a
Land LaborSkilled
LaborUnskilled
Capital Nat. Res. Domestic(qfd
t,p,s)
Imports(qfm
t,p,r)
r - regions - region (destination)p - Produced goodst - Traded goodse - Factors (endowment commodities)
Countries or Regions(qxs
t,r,s)
ESUBM 2x ESUBD
(CES)a
(qfee,p,r
)ROW
Source: Authors, based on Schuschny, Durán and de Miguel (2007).
GTAP 2001ECLAC baseline
GTAP 2004ECLAC benchmark
Simulation withALTERTAX closure
Tariff preferences in FTAs inLatin American countries
(to December 2001)
Standard computablegeneral equilibriumclosure simulation
Tariff preferences in FTAs inLatin American countries(between 2001 and 2004))
Outcomes outlined in this article
Standardcomputable generalequilibrium closure
simulation
Comparative staticscenarios/Simulated
scenarios(i) AC3-USA full
liberalization(ii) AC3-USA full
liberalization (excludingsensitives)
(iii) No FTA/end ATPDEA
GTAP 6.1Partially upgrade data
to 2001
76
TRADE AGREEMENTS BY COLOMBIA, ECUADOR AND PERU WITH THE UNITED STATES: EFFECTS ON TRADE, PRODUCTION AND WELFARE • JOSÉ E. DURÁN LIMA, CARLOS J. DE MIGUEL AND ANDRÉS R. SCHUSCHNY
C E P A L R E V I E W 9 1 • A P R I L 2 0 0 7
rules, the inclusion of rigidities in some markets, the unemployment context and economies of scale in specific sectors and to make a more detailed analysis of other effects, such as environmental and social ones.
The model comprises an extensive set of equations that are solved using non-linear programming methods. The Gragg method for the extrapolation of numerical solutions was used for the exercises. The results obtained subsequent to the simulation of the perturbations should represent the short or medium term effects of the liberalization agreements under study.6
2. Aggregation of countries and products
Version 6.1 of the GTAP database contains information on 92 countries (or regions), 57 products and five primary factors, and refers to the year 2001. For the simulations to be treated computationally and conducted within reasonable timeframes, it was necessary to aggregate the database and to confine the universe of countries (into regional groups) and products included in the simulation exercises. The list of products is presented in table 3.
The regional aggregation aims to respect the principal places of origin and destination of Latin American and Caribbean trade flows as individual regions. Thus, there are aggregations for 24 regions (17 countries and seven regional aggregates).7 Production sectors were chosen according to three considerations: (i) the need to maintain a level of sectoral disaggregation that takes into account each sector’s share in exports from the countries in the region; (ii) uniform levels of protection of the products in each group and (iii) the limitations imposed by computerization of the model. The 57 products in the GTAP database were grouped into 31 products, as shown in table 3, which also shows the Armington elasticities.
3. Methodology used to obtain the benchmark scenario, taking into account the changes up to 2004
Version 6.1 of the original GTAP database fails to incorporate a number of trade agreements that existed prior to the base year 2001. For example, there were the preferential agreements between Chile and the countries of MERCOSUR as well as those between the MERCOSUR countries and the Andean Community countries. There were also the agreements concluded between the European Union and Mexico and between Mexico and Chile. This led us to update the original version of database 6.1 and to create a new updated database which we shall call “GTAP 2001 ECLAC baseline”.
However, there are a number of drawbacks with using 2001 as the reference year for conducting the simulations of potential future free trade agreements because the scenario of bilateral trade agreements changed substantially between 2001 and 2004. During this period, Chile concluded a number of free trade agreements, including with the United States, all the European Union Member States and the Republic of Korea. In addition, Chile deepened reciprocal preferential access with MERCOSUR and the Andean Community. On 4 December 2001, the Andean Trade Preference Act (ATPA) also came to an end. The United States had approved ATPA for the unilateral benefit of Bolivia, Colombia, Ecuador and Peru and, as mentioned earlier, ATPA was later extended and broadened by promulgating the Andean Trade Promotion and Drug Eradication Act (ATPDEA).
For all of the above reasons, the starting scenario used for this study was a database for the year 2004, which we shall call “GTAP 2004 ECLAC benchmark”. This includes all the free trade agreements concluded by Latin American countries in force up to 31 December 2004, as well as the benefits which the United States unilaterally conferred on the AC countries mentioned earlier. Figure 3 shows the technical specifications used to update the tariffs and to change the baseline from the one in the original GTAP 6.1 database for 2001, in order to gear it to the reality of the region in 2004. Figure 3 depicts a sequence of three consecutive phases.
The details on how the benchmark scenario for the year 2004 was defined can be consulted in Schuschny, Durán and de Miguel (2007). Suffice it to say here that, during the first phase, actual tariffs in the original GTAP database were revised to 2001 and tariffs not included were updated, applying the AlterTax methodology detailed in Malcolm (1998). After this,
6 According to empirical studies, the adjustment period for a new scenario or perturbation in the United States economy is between 10 and 12 years (DeRosa and Gilbert, 2004). At the end of the study, some results of the impact that free trade agreements would have in the longer term in a steady-state-type configuration are shown.7 The 17 countries are: Argentina, Bolivia, Brazil, Chile, Colombia, Mexico, Peru, Uruguay, Bolivarian Republic of Venezuela, United States, Canada, China, Republic of Korea, South Africa, India, China and Japan. The seven regional aggregations are: the European Union (15 countries), the countries of Central and Eastern Europe (CCEE), the rest of Europe, the rest of Asia, Central America and the Caribbean, the rest of Latin America and the rest of the world.

77
TRADE AGREEMENTS BY COLOMBIA, ECUADOR AND PERU WITH THE UNITED STATES: EFFECTS ON TRADE, PRODUCTION AND WELFARE • JOSÉ E. DURÁN LIMA, CARLOS J. DE MIGUEL AND ANDRÉS R. SCHUSCHNY
C E P A L R E V I E W 9 1 • A P R I L 2 0 0 7
TABLE 3
Detailed product aggregation in global trade analysis project GTAP 6.1
No. Code Description based on the products defined Armington elasticities Sensitive products in the GTAP 6.1 databasea
Domestic/ Imports United Andean import according States countries to origin
Agricultural products 1 Arroz PDR (Paddy rice), PCR (Processed rice) 3.6 6.4 X 2 Trigo WHT (Wheat) 4.5 8.9 X 3 Ocereales GRO (Cereal grains n.e.c.)b 1.3 2.6 X 4 FrutasVeg V_F (Vegetables, fruit, nuts) 1.9 3.7 5 Semilloil OSD (Oil seeds) 2.5 4.9 X
Light manufactures 6 AceiteVeg VOL (Vegetable oils and fats) 3.3 6.6 X 7 Azúcar C_B (Sugar cane, sugar beet), SGR (Sugar) 2.7 5.4 X X 8 FibrasVeg PFB (Plant-based fibers), WOL (Wool, silk-worm cocoons) 3.7 7.1 9 Ocultivos OCR (Crops n.e.c.) 3.3 6.5 X 10 BeyTa B_T (Beverages and tobacco products) 1.2 2.3 11 Ganadería CTL (Cattle,sheep,goats,horses), OAP (Animal products n.e.c.) 1.5 3.0 12 Carne CMT (Meat: cattle,sheep,goats,horse), OMT (Meat products n.e.c.) 4.1 8.3 13 Lácteos RMK (Raw milk), MIL (Dairy products) 3.7 7.3 X 14 Oaliment OFD (Food products n.e.c.) 2.0 4.0 X 15 Pesca FSH (Fishing) 1.3 2.5 X 16 Forestal FRS (Forestry) 2.5 5.0 17 Textil TEX (Textiles) 3.8 7.5 X 18 Confección WAP (Wearing apparel) 3.7 7.4 X 19 CueroCalz LEA (Leather products) 4.1 8.1 X 20 Madera LUM (Wood products) 3.4 6.8
Petroleum and mining 21 Minería OMN (Minerals n.e.c.), NMM (Mineral products n.e.c.) 2.4 4.8 22 Combustibles COA (Coal), OIL (Oil), GAS (Gas) 7.5 14.9 23 Dpetrol P_C (Petroleum, coal products) 2.1 4.2
Heavy manufactures 24 Química CRP (Chemical,rubber,plastic prods) 3.3 6.6 25 Metal I_S (Ferrous metals), NFM (Metals n.e.c.) 3.4 7.2 26 ProdMetal FMP (Metal products) 3.8 7.5 27 MaquiEqui OME (Machinery and equipment n.e.c.) 4.1 8.1 28 Autop MVH (Motor vehicles and parts) 2.8 5.6 X 29 Etransp OTN (Transport equipment n.e.c.) 4.3 8.6 30 Omanu ELE (Electronic equipment), OMF (Manufactures n.e.c.), PPP (Paper products, publishing) 3.8 8.2
Services 31 Servicios ELY (Electricity), GDT (Gas manufacture, distribution), WTR (Water), CNS (Construction), TRD (Trade), OTP (Transport n.e.c.), WTP (Sea transport), ATP (Air transport), CMN (Communication), OFI (Financial services n.e.c.), ISR 1.9 3.8 (Insurance), OBS (Business services n.e.c.), ROS (Recreation and other services), OSG (PubAdmin/Defence/Health/Educat), DWE (Dwellings)
Source: Authors.
a The names of the GTAP products have been left in their original language in order to facilitate their identification and the replicability of the aggregations. The information is available at www.GTAP.agecon.purdue.edu/databases/default.asp.
b n.e.c. = not elsewhere classified.

78
TRADE AGREEMENTS BY COLOMBIA, ECUADOR AND PERU WITH THE UNITED STATES: EFFECTS ON TRADE, PRODUCTION AND WELFARE • JOSÉ E. DURÁN LIMA, CARLOS J. DE MIGUEL AND ANDRÉS R. SCHUSCHNY
C E P A L R E V I E W 9 1 • A P R I L 2 0 0 7
the preferential agreements concluded between early 2002 and late 2004 were incorporated. The results of this new database (GTAP 2004 ECLAC benchmark) are useful for filtering new scenarios, preventing undue effects from being attributed to the tariff preferences that would be obtained by concluding new free trade agreements.
4. Description of the simulation scenarios
Once the reference scenario had been updated, the next step was to analyse the potential impacts of the trade liberalization initiatives by Colombia, Ecuador and Peru with the United States. Three simulation scenarios were defined for this purpose:(i) AC3-USA, full liberalization: Under this scenario,
the tariffs of all tradable goods from Colombia, Ecuador and Peru (listed in table 3) are considered to
fall to zero for the United States and vice versa.(ii) AC3-USA, excluding sensitive products: Under this
scenario, some products imported by Colombia, Ecuador and Peru, as well as by the United States, are considered to have zero tariffs, while others are not (table 3).
(iii) No FTA/end ATPDEA: Under this scenario, it is assumed that, when the term of ATPDEA expires, no free trade agreement of any kind is signed. This means that the United States would once again close its economy to the products covered by ATPDEA. Colombia, Ecuador and Peru would therefore lose the preferential and unilateral access to the United States market that they had enjoyed up to that time. Even though this is considered to be the most pessimistic scenario, it could come about if the free trade agreements are not concluded or if the agreements failed to be ratified afterwards.
IVAnalysis of results
This section analyses the scenario in which separate bilateral agreements by Colombia, Ecuador and Peru are concluded simultaneously with the United States. The full liberalization version of the simulation scenarios is analysed in detail as a yardstick for comparison with the other scenarios. The results of all the scenarios are calculated based on the variations from the benchmark scenario created for 2004, referred to as “GTAP 2004 ECLAC benchmark”. It is important to reiterate that this scenario already incorporates the unilateral benefits conferred by the United States on the Andean Community countries via ATPDEA and the free trade agreements that were implemented by Latin American and Caribbean countries between 2001 and 2004. The results of the different scenarios have therefore been filtered to remove the benefits or losses from any “preferences” granted previously.
The analysis was conducted in the following order: (i) macroeconomic effects on GDP, final demand components and income from factors of production; (ii) international and intraregional trade; (iii) sector analysis and (iv) effects on welfare and breakdown of these effects.8
1. Macroeconomic effects of the “AC3-USA full liberalization” scenario
(a) EffectsFrom the macroeconomic standpoint, although the
signature of separate bilateral free trade agreements by Colombia, Ecuador and Peru with the United States has clearly favourable results on the signatory countries’ export and import trade, this does not lead to improvements in public and private consumption and nor does it influence investment demand to any great degree. In percentages, the Andean Community signatory countries increase their imports from the United States more than their exports to the United States, primarily because many of their products already benefit from tariff preferences under ATPDEA. Under this scenario, the impacts on the value of GDP therefore tend to be negative, even though they are insignificant for the AC countries. The chief reason is the negative
8 Owing to the characteristics of this type of modelling, the results
are presented in the form of variations in the value of the variables compared with their level in the reference scenario. For example, when mention is made of effects on GDP, this refers to a percentage variation in the level of GDP (one time only) and should not be understood as a growth rate or a change in the growth rate.

79
TRADE AGREEMENTS BY COLOMBIA, ECUADOR AND PERU WITH THE UNITED STATES: EFFECTS ON TRADE, PRODUCTION AND WELFARE • JOSÉ E. DURÁN LIMA, CARLOS J. DE MIGUEL AND ANDRÉS R. SCHUSCHNY
C E P A L R E V I E W 9 1 • A P R I L 2 0 0 7
variations in GDP price indices (price effect), since a minimum negative effect on the quantities is seen only in the case of Colombia (table 4).9
Ecuador is the hardest-hit country in trade terms: it presents the widest negative differential between what it gains from increased exports and what it loses from increased imports. Peru is the country with the highest percentage increase in trade, and, even though the effect on the trade balance is also negative, in its case the result is marginal.
As regards the breakdown of the effects on income from the various factors of production, in all the countries payment/income from natural resources increases by 0.7% compared with the benchmark scenario, rising to 1.1% in the cases of Colombia and Ecuador. Land rent improves significantly in Ecuador (1.6%) and partially in Peru (0.6%) but worsens in Colombia (–0.8%). Wages for skilled labour and returns on capital worsen in all three countries, with Colombia the hardest hit country (–0.5% in both cases). Finally, there also tends to be a
negative impact on unskilled labour in Colombia and Ecuador. However, if we weight the aforementioned effects in line with the factor structure of the existing added value, the AC countries suffer the negative impact basically via a reduction in payment to the capital factor (in the case of Peru it explains practically the entire effect) and next via the effect on unskilled labour. In the remaining countries, including the United States, there are no substantial effects.
(b) Comparison with the macroeconomic effects in alternative scenariosThere is a possibility that the agreements might
exclude a number of sensitive products or sectors, or that their liberalization might be postponed for several years, which would maintain their level of tariff protection. In this case, the negative impact on GDP is reduced by approximately 20% in Colombia and Ecuador, and a little less than 10% in Peru compared with the values shown in table 4, whereas the positive effects for exports and imports are also reduced by between 25% and 40% (table 5). Ecuador is the country that suffers the greatest proportional reduction in export growth and Peru suffers the least, whereas proportionally Colombia manages to mitigate the increase in its imports the most when sensitive products are included in the agreements.
In the event that separate free trade agreements between the three Andean countries and the United States are not signed, these AC countries would not have FTAs and would not enjoy the benefits of ATPDEA. In terms of the value of GDP, this scenario has a significantly adverse affect on Peru, with a drop in GDP of more than double that in the two previous scenarios (“AC3-USA full liberalization” and “AC3 excluding sensitive products”). This is explained not only by a reduction in trade but also by a reduction in consumption, in terms of the demand components, and by a fall in income from factors of production (since from a tax standpoint this scenario is positive), as regards the source of GDP. The results for Colombia and Ecuador are less negative, especially in the case of Ecuador.
In addition, both the exports and imports of the three Andean countries would decrease compared with benchmark scenario 2004 by between 1% and 2% for Colombia and Peru (table 5). If we now analyse the gap between the two scenarios (“AC3-USA full liberalization” and “No FTA/end ATPDEA”), the situation would be even worse, with an aggregate reduction in exports of 4.9% in Peru, 4.7% in Colombia and 1.4% in Ecuador. However, as the “No FTA/end ATPDEA” scenario is no
TABLE 4
Macroeconomic impacts of the AC3-USA scenario: breakdown of GDP(Percentage variation compared with benchmark scenario, 2004)
Quantum Price Value
Bolivia 0.0 -0.4 -0.4Colombia -0.1 -1.1 -1.1Ecuador 0.0 -1.2 -1.2Peru 0.0 -0.8 -0.7Venezuela (Bol. Rep. of) 0.0 -0.2 -0.3
United States 0.0 0.0 0.0
Argentina 0.0 -0.1 -0.1Brazil 0.0 -0.1 -0.1Uruguay 0.0 -0.1 -0.1Chile 0.0 -0.2 -0.2Mexico 0.0 0.0 0.0
Source: Authors, based on simulations modelled on version 6.1 of the Global Trade Analysis Project database (GTAP 6.1).
9 If we estimate the effect of the separate simultaneous FTAs by Colombia, Ecuador and Peru with the United States, assuming that they never enjoyed the benefits from ATPDEA, the impact on the value of GDP would be positive in the case of Peru (0.8%), whereas for Ecuador (–0.7%) and Colombia (–0.3%) it would significantly reduce the negative effect on GDP value.

80
TRADE AGREEMENTS BY COLOMBIA, ECUADOR AND PERU WITH THE UNITED STATES: EFFECTS ON TRADE, PRODUCTION AND WELFARE • JOSÉ E. DURÁN LIMA, CARLOS J. DE MIGUEL AND ANDRÉS R. SCHUSCHNY
C E P A L R E V I E W 9 1 • A P R I L 2 0 0 7
better for the United States GDP and trade, this would encourage the United States to negotiate an FTA even though its impact would be slight.
2. Impact of the “AC3-USA full liberalization” scenario on regional trade
The signature of separate simultaneous agreements by Colombia, Ecuador and Peru with the United States increases the total exports and imports of the countries involved and adversely affects the rest. To a large extent, the impact depends on each country’s trading-partner structure. For example, Mexico, Central America and the Caribbean and the Bolivarian Republic of Venezuela would be more affected by the changes
in trade flows of goods caused by FTAs, given that the United States market represents respectively 89%, 50% and 42% of their trade (see table 5).
Thus, the AC countries’ principal trading partner is the United States, which absorbs an average 40% of their exports, whereas United States exports to the Andean Community represent barely 10%. Peru seems to be the country with the most diverse export destinations, whilst for Ecuador and Colombia, the Andean Community is more important than for Peru.
It is also necessary to analyse the effects on trade between trading partners, as a result of the new order of preferential access and the new cost structure. The AC signatory countries will increase their exports to the United States, ranging from 3.8% in the case
TABLE 5
Free trade agreements by andean countries with the United States;effects on foreign trade(Percentage variation from benchmark scenario 2004 and percentages)
Exports of goods and services Imports of goods and services United States in trade in goods (%)
AC3-USA AC3-USA No FTA AC3-USA AC3-USA No FTA/ Exports Imports full excluding /End full excluding End liberalization sensitive ATPDEA liberalization sensitive ATPDEA products products
Andean Community 1.47 0.99 -0.61 1.96 1.40 -0.85 40.0 22.4
Bolivia -0.39 -0.12 -0.67 -0.47 -0.15 -0.91 16.4 13.8Colombia 3.25 2.12 -1.36 4.02 2.77 -1.53 45.4 28.1Ecuador 1.13 0.70 -0.26 2.00 1.51 -0.39 40.4 16.8Peru 3.70 2.69 -1.22 4.32 3.22 -2.07 27.0 19.6Venezuela (Bol.Rep.of) -0.19 -0.16 -0.03 -0.27 -0.24 0.00 42.0 31.2
United States 0.17 0.13 -0.03 0.14 0.11 -0.02 … …
MERCOSUR -0.09 -0.06 -0.01 -0.14 -0.10 -0.01 19.6 17.0
Argentina -0.11 -0.06 -0.02 -0.17 -0.10 -0.02 11.1 14.7Brazil -0.08 -0.06 -0.01 -0.13 -0.11 -0.01 23.6 18.3Uruguay -0.06 -0.05 -0.01 -0.08 -0.06 -0.01 12.0 7.2Chile -0.21 -0.18 -0.02 -0.24 -0.21 -0.02 17.2 15.1Mexico -0.02 -0.02 0.01 -0.04 -0.04 0.01 88.8 56.6Central America and the Caribbean -0.04 -0.03 0.03 -0.06 -0.04 0.05 50.0 38.6
FTAA 0.15 0.11 -0.04 0.14 0.11 -0.03 30.8 14.3
EU15 + CCEE + EFTAa -0.01 -0.01 0.00 -0.02 -0.02 0.00 11.0 5.8Japan 0.00 0.00 0.00 -0.03 -0.02 0.01 28.0 14.0Asia -0.01 -0.01 0.01 -0.02 -0.01 0.01 23.0 10.0
Source: Authors, based on simulations modelled on version 6.1 of the Global Trade Analysis Project database (GTAP 6.1) and official information from the United Nations Commodity Trade Statistics Database (COMTRADE).
a EU 15 = European Union (15 countries); CCEE = the countries of Central and Eastern Europe; EFTA = European Free Trade Association.

81
TRADE AGREEMENTS BY COLOMBIA, ECUADOR AND PERU WITH THE UNITED STATES: EFFECTS ON TRADE, PRODUCTION AND WELFARE • JOSÉ E. DURÁN LIMA, CARLOS J. DE MIGUEL AND ANDRÉS R. SCHUSCHNY
C E P A L R E V I E W 9 1 • A P R I L 2 0 0 7
of Ecuador to 7.3% for Peru. However, the benefit of this greater access and the effect it produces is twofold: (i) increased competitiveness by Colombia, Ecuador and Peru in third countries as a result of their access to cheaper imports from the United States and (ii) greater competition among the three Andean beneficiary countries of the agreements. Greater export competitiveness allows them to increase their exports to other destinations, both non-signatory AC members (Bolivia and the Bolivarian Republic of Venezuela) and the rest of the world, whilst increased competition among the three countries leads to a reduction in mutual exports averaging about 10%. In short, the result is a 4.1% drop in trade within the Andean Community, whereas the United States increases its exports to the three signatory countries significantly (table 6).
3. Comparison of effects on regional trade under alternative scenarios (excluding “AC3-USA excluding sensitive products” and “No FTA/end ATPDEA”)
Although the exclusion of sensitive products from the three free trade agreements does not modify the sign of the variations, it does modify their value. Thus, the increase in exports from the three AC signatory countries to the United States would be reduced overall to practically half: under this scenario exports from Colombia would rise by only 3.1% and those from Ecuador and Peru would rise by only 2.1% and 3.6% respectively. Similarly, exports from the United States to these countries would increase less (by 10, 9 and 14
percentage points respectively), with exports to Peru continuing to benefit the most, with an increase of 53% compared with benchmark scenario 2004. The impact on trade within the Andean Community is positive compared with the scenario of excluding sensitive products (the drop decreases from 4.1% to 3.1%).10
Under the “No FTA/end ATPDEA” scenario, the effects on intraregional trade change significantly. In addition to total exports falling slightly for all the countries compared with benchmark scenario 2004, the trade increase caused by FTAs is lost and there is a reduction in exports to the United States, partially offset by an increase in exports to third trading partners and (except for Ecuador) to the Andean Community. These effects are felt most forcefully by Peru. Practically all the countries in the Andean Community would increase their imports from the block, whereas the United States would reduce them by 4.4%, with Peru the most affected country (table 7). The United States would reduce its exports to the AC member countries very slightly, which in terms of its total exports is insignificant.
4. Sectoral impacts of the simulation scenarios
In this section, impacts on the value of exports and imports in all the simulation scenarios are disaggregated by sector and by country. Also, trade between the United States and the AC signatory countries is analysed at sector level.
TABLE 6
“AC3-USA full liberalization” scenario: intraregional exports(Percentage variation from benchmark scenario 2004)
DestinationOrigin Bolivia Colombia Ecuador Peru Venezuela AC United Rest of Total (Bol. Rep. of) States the world
Bolivia -9.7 -10.4 -8.0 0.3 -5.1 1.5 1.0 -0.4Colombia 4.6 -9.3 -10.1 4.8 -0.5 5.4 3.0 3.3Ecuador 3.0 -12.0 -4.9 2.4 -6.3 3.8 1.4 1.2Peru 3.2 -8.7 -10.3 2.7 -3.6 7.3 2.8 3.7Venezuela (Bol.Rep.of) 0.2 -11.6 -8.6 -9.0 -10.3 0.4 0.4 -0.2Andean Community 3.3 -11.2 -9.3 -7.8 4.1 -4.1 2.8 1.6 1.5United States -1.1 43.4 45.8 66.6 -1.0 26.7 … -0.2 0.2
Source: Authors, based on simulations modelled on version 6.1 of the Global Trade Analysis Project database (GTAP 6.1).
10 The respective table has been omitted for reasons of space and because it is directly related with the previous table.

82
TRADE AGREEMENTS BY COLOMBIA, ECUADOR AND PERU WITH THE UNITED STATES: EFFECTS ON TRADE, PRODUCTION AND WELFARE • JOSÉ E. DURÁN LIMA, CARLOS J. DE MIGUEL AND ANDRÉS R. SCHUSCHNY
C E P A L R E V I E W 9 1 • A P R I L 2 0 0 7
(a) Effects on the value of exports disaggregated by sectorThe signature of free trade agreements between the
AC countries and the United States has a positive effect on exports from the Andean block. Furthermore, this positive effect feeds through to all the major sectoral items, although the greatest variation (and contribution to the total impact) is in light manufactures, especially in the case of full liberalization (table 8).11 However, an examination of the specific sectors shows wide differences under this full liberalization scenario, whereas when sensitive products are excluded, the benefits of the agreements are more evenly spread among the sectors.
In the event that no agreement is signed, resulting in the Andean countries losing the preferences conferred by ATPDEA, it would have a negative impact on total exports. This negative impact would be serious in the case of light manufactures, mainly the textile and wearing apparel sectors, exports of which would fall by more than 20% and 40% respectively compared with benchmark scenario 2004, which would only be partially offset by the increase in exports of petroleum, minerals and heavy manufactures.
(i) Colombia. After those from Peru, exports from Colombia benefit the most from concluding an FTA with the United States; however they are the most adversely
affected by not signing one and losing ATPDEA preferences. Under the best scenario (AC3-USA full liberalization), the greatest growth in exports occurs in light manufactures, followed by heavy manufactures.
Failure to sign an FTA and losing the preferences has a negative affect on exports of wearing apparel, textiles and leather products, which fall by more than 37%, 10% and 4%, respectively (compared with benchmark scenario 2004). However, exports from other sectors would increase: exports from the meat sector would increase the most (by more than 5%), whereas the increase in the chemicals, rubber and plastics sector has the greatest positive impact.
(ii) Ecuador. Among the signatories of an agreement with the United States, Ecuador is the country that increases its exports the least. It is also the country that reduces its exports the least should it lose ATPDEA preferences. Light manufactures are the biggest winners if an agreement is signed and the biggest losers if one is not signed. Heavy manufactures would experience the reverse effect. The sectors that would benefit most from an agreement in terms of increased exports are wheat (33%), provided that sensitive products are included, dairy products (13%) and forestry (4% to 5%), within the agricultural production sector, together with sugar (165%) and other food products, where no products are excluded (3%), wearing apparel (4% to5%) within the light manufactures sector, and transport equipment, within the heavy manufactures sector.
Exports of rice (–6%), other cereals (–16%) and oilseeds (–11%) present the biggest decreases within
TABLE 7
“No FTA/end ATPDEA” scenario: intraregional exportsa
(Percentage variation from benchmark scenario 2004)
DestinationOrigin Bolivia Colombia Ecuador Peru Venezuela AC United Rest of World (Bol. Rep. of) States the world
Bolivia -0.3 0.8 0.1 0.9 0.4 -12.6 2.1 -0.7Colombia 2.4 2.5 1.4 3.0 2.7 -7.8 2.7 -1.4Ecuador -0.2 -1.2 -0.4 1.0 -0.4 -1.6 0.8 -0.3Peru 5.1 4.5 6.1 6.9 5.7 -18.6 5.8 -1.2Venezuela (Bol.Rep.of) -0.9 -1.2 -0.5 -0.4 -0.9 0.0 0.0 0.0Andean Community 3.6 -0.5 2.1 0.2 2.9 1.5 -4.4 2.0 -0.6United States -1.2 -1.5 -1.0 -2.3 -0.3 -1.0 … 0.0 0.0
Source: Authors, based on simulations modelled on version 6.1 of the Global Trade Analysis Project database (GTAP 6.1).
a ATPDEA:= Andean Trade Promotion and Drug Eradication Act (United States).
11 Without prejudice to the aggregate results in five major sectors presented in the tables in this section, information is available on the 31 sectors listed in table 3.

83
TRADE AGREEMENTS BY COLOMBIA, ECUADOR AND PERU WITH THE UNITED STATES: EFFECTS ON TRADE, PRODUCTION AND WELFARE • JOSÉ E. DURÁN LIMA, CARLOS J. DE MIGUEL AND ANDRÉS R. SCHUSCHNY
C E P A L R E V I E W 9 1 • A P R I L 2 0 0 7
TABLE 8
Various scenarios: sectoral breakdown of the effects on exports of an FTA between the United States and the Andean Community(Percentage variation from benchmark scenario 2004 and each sector’s share in the total)
Scenario AC3-USA AC3-USA excluding No FTA/ end ATPDEAa
full liberalization sensitive products
Main sectors Changes Shareb Changes Shareb Changes Shareb
Andean Community
Agricultural products 1.1 0.1 0.9 0.1 0.5 0.0
Petroleum and mining 0.8 0.3 0.7 0.3 1.1 0.5
Light manufactures 5.4 0.8 2.3 0.3 -12.4 -1.5
Heavy manufactures 0.7 0.2 0.6 0.1 1.4 0.3
Services 1.2 0.1 1.1 0.1 1.9 0.2
Total exports 1.5 1.5 1.0 1.0 -0.6 -0.6
Colombia
Agricultural products 1.9 0.3 1.2 0.2 0.4 0.1
Petroleum and mining 1.1 0.3 1.0 0.3 1.4 0.4
Light manufactures 8.6 1.6 3.4 0.6 -16.3 -2.4
Heavy manufactures 3.7 0.9 3.4 0.8 2.8 0.7
Services 1.7 0.2 1.5 0.2 2.3 0.4
Total exports 3.3 3.3 2.1 2.1 -1.4 -1.4
Ecuador
Agricultural products 0.5 0.1 0.6 0.2 0.2 0.1
Petroleum and mining 0.4 0.1 0.3 0.1 0.3 0.1
Light manufactures 3.7 0.8 1.9 0.4 -2.7 -0.6
Heavy manufactures -0.7 -0.1 -0.8 -0.1 0.8 0.1
Services 1.0 0.2 0.8 0.1 0.7 0.1
Total exports 1.1 1.1 0.7 0.7 -0.3 -0.3
Perú
Agricultural products 0.9 0.0 1.2 0.1 2.3 0.1
Petroleum and mining 3.2 1.3 3.3 1.3 6.0 2.6
Light manufactures 6.2 1.9 2.5 0.7 -17.2 -4.2
Heavy manufactures 3.5 0.3 3.6 0.3 6.9 0.7
Services 1.4 0.2 1.4 0.2 4.1 0.7
Total exports 3.7 3.7 2.7 2.7 -1.2 -1.2
Source: Authors, based on simulations modelled on version 6.1 of the Global Trade Analysis Project database (GTAP 6.1).
a ATPDEA = Andean Trade Promotion and Drug Eradication Act (United States).b This shows the variation in exports from each sector’s base level, weighted according to the sector’s share of total exports.
agricultural products. Meat (–15% to –20%) and textiles (–6%) present the biggest decreases among light manufactures, and chemicals (–4% to –6%) and metals (–6% to –8%) and the motor vehicles and parts sector present the biggest drops among heavy manufactures.
In the alternative scenario to conclusion of an agreement, where no agreement is signed and the
preferences conferred by the United States via ATPDEA are also lost, exports of textiles and wearing apparel fall substantially, by 14% and 48% respectively, accounting for a large majority of the total negative effect.
(iii) Peru. Exports from Peru benefit the most from signing an FTA with the United States, thanks chiefly to sugar (in the case of full liberalization), other food products, mining and metals. Exports of rice, wheat,

84
TRADE AGREEMENTS BY COLOMBIA, ECUADOR AND PERU WITH THE UNITED STATES: EFFECTS ON TRADE, PRODUCTION AND WELFARE • JOSÉ E. DURÁN LIMA, CARLOS J. DE MIGUEL AND ANDRÉS R. SCHUSCHNY
C E P A L R E V I E W 9 1 • A P R I L 2 0 0 7
dairy products and other manufactures also increase more than 5% (even though they make a minimum contribution to the total effect).
Should no FTAs be signed, the adverse effect on Peru’s exports is concentrated mainly on light manufactures, a sectoral grouping which decreases more in Peru than in the other AC countries. The second hardest-hit exports would again be textiles and wearing apparel. However, under this non-signature scenario, numerous sectors would increase their exports by more than 5%, although it is the increase in the petroleum and mining sectors which would do most to mitigate the adverse effects of this scenario on Peruvian exports.
(b) Effects on the value of imports disaggregated by sectorUnder any of the simulation scenarios, the effect
on imports from Colombia, Ecuador and Peru is greater than the effect on exports. The sectoral distribution of the increase in imports stems partially from the existing structure of these imports (table 9). Basically it is concentrated on heavy manufactures (between 50% and 65%), followed very far behind by light manufactures (between 10% and 15%), whereas exports from AC countries, which are better distributed among the major sectors, concentrate more on petroleum and mining.
In the “AC3-USA full liberalization” scenario there is a major increase in imports of agricultural products (especially wheat), light manufactures (chiefly meat, wearing apparel and textiles) and heavy manufactures (particularly machinery and equipment, other manufactures and chemicals, rubber and plastics). Heavy manufactures account for the majority of the total effect. The inclusion of sensitive products reduces the increase in imports significantly, chiefly that of agricultural products and light manufactures, as well as that of many specific products (such as rice, vegetable oils and fats, dairy products, other food products, fish products, textiles, wearing apparel and leather products).
Failure to sign FTAs and the loss of preferences leads to a drop in imports (greater than in exports), largely attributable to a general decrease in trade which, in share terms, centres on the Andean block’s main import products, that is to say, heavy and light manufactures (especially textiles, chemicals, machinery and equipment and other manufactures).
(i) Colombia. An increase in Colombia’s imports as a result of signing an FTA with the United States occurs in all the major sectors, although the largest rises are in heavy and light manufactures and in
agricultural products. The exclusion of sensitive products from the agreement reduces the increase in imports of agricultural products and light manufactures significantly. The sectors which cause the increase in imports are other manufactures (7.2%), machinery and equipment (5%), chemicals (3.5%), wearing apparel (43%), textiles (9%) and meat (52.5%). Although imports of wheat, other cereals, oil seeds, sugar, plant-based fibres, wood and metal products experience rises of around 10% compared with benchmark scenario 2004, they make a very small contribution to the total effect. If sensitive products are excluded from the agreement, the variation in imports becomes negative for the aforementioned sectors, with drops of more than 3% in the wearing apparel sector, explaining the lower increase in total imports. Failure to sign an agreement and loss of ATPDEA preferences leads to a widespread fall in imports in all economic sectors, associated with the reduction in activity, with the textile sector experiencing the largest percentage decrease.
(ii) Ecuador. In Ecuador, the effect of the major sectoral items on imports is similar to that of Colombia, albeit with smaller variations and a reduction in imports from the large petroleum and mining sector. Under any of the scenarios where an FTA is signed with the United States, imports of machinery and equipment and other manufactures (in the heavy manufactures sector) account for half the increase in imports. However, significant increases occur in some items, including: meat (almost 40%) and dairy products, wood and wearing apparel (around 10%). The exclusion of sensitive products makes it possible to reduce imports to those sectors, which could even decrease imports (for instance, imports of dairy products and wearing apparel could fall by 1%). Under a scenario of full liberalization, only imports of rice and metals would decrease, and this by only around 2%. Except in the wheat and fishing sectors, failure to sign an FTA reduces slightly imports of all sectors fairly evenly.
(iii) Peru. Just as in Ecuador and Colombia, in Peru heavy manufactures is key to the increase in imports (chemicals, machinery and equipment, transport equipment (with a 22% increase) and other manufactures). However, the imports that increase the most are agricultural products (wheat by 11% and plant- and animal-based fibres by 12%) and some light manufactures, such as meat (30%), vegetable oils and fats (11%) and wearing apparel (8%). The inclusion of sensitive products makes it possible to avoid an increase in imports, as in the case of wheat and other cereals, or even reduce them, as with textiles and wearing apparel.

85
TRADE AGREEMENTS BY COLOMBIA, ECUADOR AND PERU WITH THE UNITED STATES: EFFECTS ON TRADE, PRODUCTION AND WELFARE • JOSÉ E. DURÁN LIMA, CARLOS J. DE MIGUEL AND ANDRÉS R. SCHUSCHNY
C E P A L R E V I E W 9 1 • A P R I L 2 0 0 7
TABLE 9
Various scenarios: sectoral breakdown of the effects on imports of an FTA between the United States and the Andean Community (Percentage variation from benchmark scenario 2004 and each sector’s share n the total)
Scenario AC3-USA AC3-USA excluding No FTA/ end ATPDEAa
full liberalization sensitive products
Main sectors Changes Shareb Changes Shareb Changes Shareb
Andean Community
Agricultural products 3.6 0.2 0.6 0.0 -0.7 0.0
Petroleum and mining 0.6 0.0 0.7 0.0 -0.3 0.0
Light manufactures 3.7 0.5 0.6 0.1 -1.9 -0.2
Heavy manufactures 2.4 1.4 2.3 1.4 -0.6 -0.4
Services -0.9 -0.1 -0.8 -0.1 -1.2 -0.2
Total imports 2.0 2.0 1.4 1.4 -0.9 -0.9
Colombia
Agricultural products 6.0 0.4 0.7 0.0 -1.2 -0.1
Petroleum and mining 2.4 0.2 2.5 0.2 -0.6 0.0
Light manufactures 9.6 1.1 2.0 0.2 -4.4 -0.5
Heavy manufactures 4.5 2.6 4.4 2.6 -1.1 -0.6
Services -1.3 -0.2 -1.1 -0.2 -1.7 -0.3
Total imports 4.0 4.0 2.8 2.8 -1.5 -1.5
Ecuador
Agricultural products 3.1 0.1 1.6 0.1 -0.3 0.0
Petroleum and mining -0.4 0.0 -0.3 0.0 0.0 0.0
Light manufactures 5.5 0.6 0.7 0.1 -0.7 -0.1
Heavy manufactures 2.5 1.6 2.4 1.6 -0.3 -0.2
Services -1.4 -0.2 -1.0 -0.1 -0.8 -0.1
Total imports 2.0 2.0 1.5 1.5 -0.4 -0.4
Peru
Agricultural products 7.2 0.6 1.3 0.1 -1.1 -0.1
Petroleum and mining 0.7 0.1 0.7 0.1 -0.5 -0.1
Light manufactures 5.1 0.5 0.3 0.0 -3.6 -0.4
Heavy manufactures 6.6 3.4 6.3 3.3 -2.0 -1.0
Services -0.8 -0.2 -0.9 -0.2 -2.6 -0.5
Total imports 4.3 4.3 3.2 3.2 -2.1 -2.1
Source: Authors, based on simulations modelled on version 6.1 of the Global Trade Analysis Project database (GTAP 6.1).
a ATPDEA = Andean Trade Promotion and Drug Eradication Act (United States).b This shows the variation in exports from each sector’s base level, weighted according to the sector’s share in total exports.
In the event that no FTA is signed with the United States and preferences are lost, Peruvian imports suffer a larger drop than the other AC countries, owing chiefly to a reduction in imports of machinery and equipment, other manufactures, chemicals and vehicle parts in the heavy manufactures sector, and of other food products and textile products, in the light manufactures sector.
(c) Trade between the Andean countries and the United StatesUnder any of the simulation scenarios, the
differences between the effects on total exports and on exports from the AC block to the United States are low and affect the levels. Basically they consist of a larger increase in exports of light manufactures to the United

86
TRADE AGREEMENTS BY COLOMBIA, ECUADOR AND PERU WITH THE UNITED STATES: EFFECTS ON TRADE, PRODUCTION AND WELFARE • JOSÉ E. DURÁN LIMA, CARLOS J. DE MIGUEL AND ANDRÉS R. SCHUSCHNY
C E P A L R E V I E W 9 1 • A P R I L 2 0 0 7
States market. Much the same happens with imports, with the greatest differences between the world market and the United States market occurring in imports of heavy manufactures.
The signature of an FTA makes it possible to diversify exports to the United States more, since it increases the share of light manufactures to the detriment of petroleum and mining. A failure to sign an FTA and the loss of ATPDEA preferences would have precisely the opposite effect. The significant increase in commodity imports from the United States chiefly comprises heavy manufactures. However, the largest increases occur in light manufactures, providing that the AC countries do not exclude sensitive products. FTAs would have a diversifying effect on imports from the United States, although concentration increases when sensitive products are excluded from the agreement.12
5. Effects on welfare
The effects on welfare are measured by means of the equivalent variation, which is an indicator derived from calculating the total income level and incorporates the effects on changes in resource allocation among sectors and the variation in the terms of trade. In short, it measures how much income should be added/subtracted from the aggregate regional household13 to enable it to enjoy equal welfare before and after a variation in relative prices and the implications thereof. Note that the effects on welfare are aggregated at country/region level, which is why it is possible for reduced values to be masking much greater offsetting of values between winner and loser agents or sectors.
Given that the benchmark scenario 2004 estimate also includes the processes of trade liberalization that occurred in the region between the years 2001 and 2004, it is necessary to consider the impact on welfare that these processes have already produced. In particular, the benefits derived by Bolivia, Colombia, Ecuador and Peru from the United States ATPDEA preferences were manifested chiefly during the period from 2001 to 2004. This is why the equivalent variation is analysed with respect to 2001 (in millions of United States dollars14 and as a percentage of GDP) under benchmark scenario
2004 (first column of table 10) and all the simulated scenarios (remaining columns of table 10). After that, the additional effects obtained for each of the three countries under study are analysed with respect to 2004 (table 11). The assessment of the impact on welfare is supplemented by a sensitivity analysis of the results of the equivalent variation for the “AC3-USA full liberalization” and “No FTA/end ATPDEA” scenarios, and by the results of two “dynamic” simulations for those same scenarios.
(a) Effects on welfare resulting from free trade agreements between AC countries and the United States In 2004 (according to the estimation process
described in figure 3), AC countries benefiting from ATPDEA preferences increase their welfare by the equivalent of 0.1% of their GDP, except Peru, where the figure is 0.2%. Chile, which during that period concluded major FTAs with its main trading partners (Canada, United States, the European Union, the European Free Trade Association, the Republic of Korea and a number of Latin American countries), also shows a strong increase in its welfare (triple the increase obtained by the Andean Community), representing 1.1% of its GDP (result of the first column of table 10). The remaining Latin America countries suffer, indirectly, a relative loss of competitiveness (or erosion of prior preferences) compared with countries with new preferential access chiefly to the markets of the United States and Europe, which leads to slight reductions in welfare in MERCOSUR, as well as in Mexico and in Central America and the Caribbean. In any case, these reductions are not significant as a proportion of the respective GDP rates.
When the effects of the simultaneous signature of separate FTAs with the United States by Colombia, Ecuador and Peru are added to these effects, the cumulative effects on welfare become negative in both Ecuador and Colombia, even when sensitive products are excluded (rest of table 10). In both countries, the negative effect on terms of trade heads the declines in welfare, although in Ecuador the effect of better resource allocation is positive. In Ecuador, the adverse effect on terms of trade is seen chiefly in the sectors of other food products, other manufactures and livestock, whereas in Colombia it centres on all heavy manufactures, textiles, wearing apparel and other food products. This adverse effect on welfare is offset by the other crops sector, especially in Colombia, the fuel sector and, in Ecuador, the vehicle parts sector.
12 For further details on the impact of trade with the United States, see Durán, de Miguel and Schuschny (2006).13 See the description of the model in section III.14 Note that these are reference values and are not equivalent to current dollars.
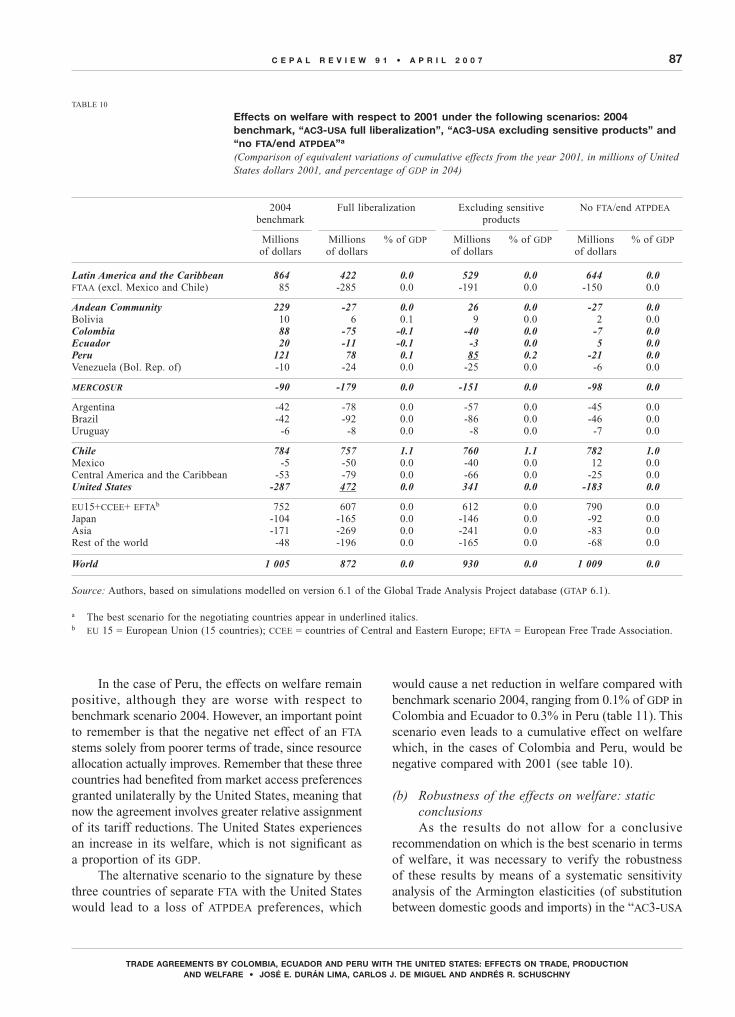
87
TRADE AGREEMENTS BY COLOMBIA, ECUADOR AND PERU WITH THE UNITED STATES: EFFECTS ON TRADE, PRODUCTION AND WELFARE • JOSÉ E. DURÁN LIMA, CARLOS J. DE MIGUEL AND ANDRÉS R. SCHUSCHNY
C E P A L R E V I E W 9 1 • A P R I L 2 0 0 7
TABLE 10
Effects on welfare with respect to 2001 under the following scenarios: 2004 benchmark, “AC3-USA full liberalization”, “AC3-USA excluding sensitive products” and “no FTA/end ATPDEA”a
(Comparison of equivalent variations of cumulative effects from the year 2001, in millions of United States dollars 2001, and percentage of GDP in 204)
2004 Full liberalization Excluding sensitive No FTA/end ATPDEA benchmark products
Millions Millions % of GDP Millions % of GDP Millions % of GDP of dollars of dollars of dollars of dollars
Latin America and the Caribbean 864 422 0.0 529 0.0 644 0.0FTAA (excl. Mexico and Chile) 85 -285 0.0 -191 0.0 -150 0.0
Andean Community 229 -27 0.0 26 0.0 -27 0.0Bolivia 10 6 0.1 9 0.0 2 0.0Colombia 88 -75 -0.1 -40 0.0 -7 0.0Ecuador 20 -11 -0.1 -3 0.0 5 0.0Peru 121 78 0.1 85 0.2 -21 0.0Venezuela (Bol. Rep. of) -10 -24 0.0 -25 0.0 -6 0.0
MERCOSUR -90 -179 0.0 -151 0.0 -98 0.0
Argentina -42 -78 0.0 -57 0.0 -45 0.0Brazil -42 -92 0.0 -86 0.0 -46 0.0Uruguay -6 -8 0.0 -8 0.0 -7 0.0
Chile 784 757 1.1 760 1.1 782 1.0Mexico -5 -50 0.0 -40 0.0 12 0.0Central America and the Caribbean -53 -79 0.0 -66 0.0 -25 0.0United States -287 472 0.0 341 0.0 -183 0.0
EU15+CCEE+ EFTAb 752 607 0.0 612 0.0 790 0.0Japan -104 -165 0.0 -146 0.0 -92 0.0Asia -171 -269 0.0 -241 0.0 -83 0.0Rest of the world -48 -196 0.0 -165 0.0 -68 0.0
World 1 005 872 0.0 930 0.0 1 009 0.0
Source: Authors, based on simulations modelled on version 6.1 of the Global Trade Analysis Project database (GTAP 6.1).
a The best scenario for the negotiating countries appear in underlined italics.b EU 15 = European Union (15 countries); CCEE = countries of Central and Eastern Europe; EFTA = European Free Trade Association.
In the case of Peru, the effects on welfare remain positive, although they are worse with respect to benchmark scenario 2004. However, an important point to remember is that the negative net effect of an FTA stems solely from poorer terms of trade, since resource allocation actually improves. Remember that these three countries had benefited from market access preferences granted unilaterally by the United States, meaning that now the agreement involves greater relative assignment of its tariff reductions. The United States experiences an increase in its welfare, which is not significant as a proportion of its GDP.
The alternative scenario to the signature by these three countries of separate FTA with the United States would lead to a loss of ATPDEA preferences, which
would cause a net reduction in welfare compared with benchmark scenario 2004, ranging from 0.1% of GDP in Colombia and Ecuador to 0.3% in Peru (table 11). This scenario even leads to a cumulative effect on welfare which, in the cases of Colombia and Peru, would be negative compared with 2001 (see table 10).
(b) Robustness of the effects on welfare: static conclusionsAs the results do not allow for a conclusive
recommendation on which is the best scenario in terms of welfare, it was necessary to verify the robustness of these results by means of a systematic sensitivity analysis of the Armington elasticities (of substitution between domestic goods and imports) in the “AC3-USA

88
TRADE AGREEMENTS BY COLOMBIA, ECUADOR AND PERU WITH THE UNITED STATES: EFFECTS ON TRADE, PRODUCTION AND WELFARE • JOSÉ E. DURÁN LIMA, CARLOS J. DE MIGUEL AND ANDRÉS R. SCHUSCHNY
C E P A L R E V I E W 9 1 • A P R I L 2 0 0 7
TABLE 11
Net effects on welfare of the following scenarios with respect to 2004:a “AC3-USA full liberalization”, “AC3-USA excluding sensitive produccts” and “no FTA/end ATPDEA”(Variations from the results of the GTAP 2004 ECLAC benchmark scenario, in millions of United States dollars 2001, and percentage of GDP in 2004)
AC3-USA AC-3USA excluding No FTA/end ATPDEA full liberalization sensitive products
Millions of % of GDP Millions of % of GDP Millions of % of GDP dollars dollars dollars
Latin America and the Caribbean -442 0.0 -335 0.0 -220 0.0FTAA (excl. Mexico and Chile) -370 0.0 -276 0.0 -235 0.0
Andean Community -256 -0.1 -203 -0.1 -255 -0.1Bolivia -4 -0.1 -1 0.0 -9 -0.1Colombia -163 -0.2 -128 -0.2 -95 -0.1Ecuador -31 -0.2 -23 -0.1 -14 -0.1Peru -43 -0.1 -35 -0.1 -141 -0.3Venezuela (Bol. Rep. of) -15 0.0 -15 0.0 4 0.0
MERCOSUR -89 0.0 -61 0.0 -8 0.0
Chile -27 0.0 -24 0.0 -2 0.0Mexico -45 0.0 -35 0.0 17 0.0Central America and the Caribbean -26 0.0 -13 0.0 28 0.0United States 759 0.0 628 0.0 105 0.0
EU 15 + CCEE + EFTAb -145 0.0 -140 0.0 38 0.0Japan -61 0.0 -42 0.0 12 0.0Asia -97 0.0 -70 0.0 88 0.0Rest of the world -148 0.0 -117 0.0 -20 0.0
World -133 0.0 -75 0.0 4 0.0
Source: Authors, based on simulations modelled on vesion 6.1 of the Global Trade Analysis Project database (GTAP 6.1).
a The net effect discounts the result of the equivalent variation already obtained up to 2004 from the equivalent variation obtained under the different scenarios.
b EU 15 = European Union (15 countries); CCEE = Countries of Central and Eastern Europe; EFTA = European Free Trade Association.
full liberalization” and “No FTA/end ATPDEA” scenarios, which are the two extremes (table 12). This sensitivity analysis consists of varying the Armington elasticities (keeping other conditions equal), with a uniform probability of up to 50% of their established value in either direction. It was decided to use the Armington elasticities as they are the most important ones in effects on trade, as well as variations in the terms of trade which, as we have already seen, are key to the final effect on welfare.15
As the results of the sensitivity analysis for the “AC3-USA full liberalization” scenario show (table
12), the effects on welfare could become positive for both Colombia and Ecuador and are highly unlikely to be negative for Peru. Failure to sign agreements and the loss of preferences leads to negative results for Colombia and Peru and positive results for Ecuador. From the welfare standpoint in particular, it could be concluded that:(i) For the United States, the best scenario is
unequivocally the one where the three AC countries sign agreements with full liberalization, and the worst scenario is the one where no countries sign, even though the United States would withdraw ATPDEA preferences. The impact is not important as a proportion of GDP.
(ii) For Peru, it is very clear that failure to sign an FTA with the United States and the loss of ATPDEA preferences is the worst option, since all the
15 See the justification and methodology in Schuschny, Durán and de Miguel (2007).

89
TRADE AGREEMENTS BY COLOMBIA, ECUADOR AND PERU WITH THE UNITED STATES: EFFECTS ON TRADE, PRODUCTION AND WELFARE • JOSÉ E. DURÁN LIMA, CARLOS J. DE MIGUEL AND ANDRÉS R. SCHUSCHNY
C E P A L R E V I E W 9 1 • A P R I L 2 0 0 7
confidence interval values for this scenario are lower than any of the interval values for scenarios involving signature of an agreement. The results indicate that the best option is to sign an FTA.
(iii) Contrary to the United States and Peru, the results for Colombia and Ecuador are inconclusive. In Colombia, all the possible results of the “No FTA/end ATPDEA” scenario come within the confidence interval of the “AC3-USA full liberalization” scenario. Furthermore, all the considered options have a robust negative result, meaning that the choice of any particular option will depend on its dynamic effects and on considerations other than purely commercial ones.
(iv) The results for Ecuador are similar to those of Colombia, since the interval of the “No FTA/end ATPDEA” option comes almost completely within that of the “AC3-USA full liberalization” scenario, even though the latter could produce positive cumulative results on welfare. The result in the non-signature scenario is unequivocally positive but, even though it might be the best option, its scant value in terms of GDP does not give a clear signal for choosing it either.
(c) Gains in welfare when dynamic considerations are included: the effect of capital accumulationIn static models like the GTAP model, the potential
benefits of trade opening derive more efficient allocation of production resources and of consumption of goods, as well as from the variation in the terms of trade as a result of this process. Estimates of the consequences of
trade opening generally tend to be modest, leading to increases in welfare levels of not even one GDP point. However, the increases would be greater if the dynamic effects of liberalization were taken into account.
In an attempt to calculate the long-term benefits of trade opening, a steady-state model was recreated in which the capital stock can be adjusted, linking the return on capital with the cost of producing it. Schuschny, Durán and de (2007) explain the methodology used (based on François and McDonald, 1996) for modifying the closure rules to incorporate the positive effects of capital accumulation on the results, by virtue of the fall in the relative prices of capital goods caused by tariff liberalization. We shall now focus solely on comparing the effects on welfare of the “AC3-USA full liberalization” and “No FTA/end ATPDEA” scenarios, after discounting the results of the GTAP 2004 ECLAC benchmark scenario (in this case also estimated in a steady state) for the two types of simulation: standard general equilibrium and steady state. The results are presented in table 13.
As can be seen, when we use the closure that recreates a steady-type state, which makes it possible (with certain limitations) to incorporate dynamic effects into the scenarios under analysis, the effects on welfare change markedly. The AC signatories experience a net positive effect on welfare which, in the case of Peru, could rise to as much as 0.4% of GDP and, in Colombia and Ecuador, could be in the order of 0.2%. For the United States, the situation improves slightly. For the AC countries, failure to sign the three FTAs and the loss of ATPDEA preferences increases the negative
TABLE 12
Comparative effects on welfare according to a sensitivity analysis of the “AC3-USA full liberalization” and “no FTA/end ATPDEA” scenariosa
(Comparison of equivalent variations, cumulative effects since 2001, in millions of dollars)
Sensitivity AC3-USA full liberalization No FTA/end ATPDEAb
analysis Result Lower limit Upper limit Result Lower limit Upper limit
Colombia -75 -149 3 -7 -10 -3Ecuador -11 -29 7 5 3 8Peru 78 -1 173 -21 -24 -16United States 472 364 586 -183 -236 -132
Source: Authors, based on simulations modelled on vesion 6.1 of the Global Trade Analysis Project database (GTAP 6.1).
a Includes the upper and lower limit calculated on the basis of the average, and the standard deviation obtained from the sensitivity analysis.
b ATPDEA = Andean Trade Promotion and Drug Eradication Act (United States).

90
TRADE AGREEMENTS BY COLOMBIA, ECUADOR AND PERU WITH THE UNITED STATES: EFFECTS ON TRADE, PRODUCTION AND WELFARE • JOSÉ E. DURÁN LIMA, CARLOS J. DE MIGUEL AND ANDRÉS R. SCHUSCHNY
C E P A L R E V I E W 9 1 • A P R I L 2 0 0 7
impact on Colombia and Ecuador significantly (to practically double) and on Peru even more (greater than triple).16
In static simulations, the results are governed by the tariff reductions stemming from the agreements. However, when simulating possible processes of capital accumulation that transcend tariff reductions and form part of a long-term context, in practice a series of policies and institutions are required to ensure that this
TABLE 13
Equivalent variation: simulations under static and steady-stategeneral equilibrium conditions(Variations from the results of the standard benchmark 2004 and “dynamic” scenarios respectively, in millions of United States dollars 2001)
AC3-USA full liberalization No FTA/end ATPDEA
Standard general Steady-state closure Standard general Steady-state closure equilibrium closure (dynamic increase) equilibrium closure (dynamic increase)
Colombia -163 156 -95 -185Ecuador -31 44 -14 -26Peru -43 214 -141 -485United States 759 768 105 158
Source: Authors, based on simulations modelled on vesion 6.1 of the Global Trade Analysis Project database (GTAP 6.1).
investment actually takes place (such as legal security, proper infrastructure, trained human resources and promotion of foreign direct investment). Foreign direct investment is not included in the model. Although the signature of an FTA provides an opportunity to exploit dynamic advantages that lead to improvements in welfare, as this calls for an additional effort, it does not come about merely are a result of signing an agreement.
VSummary and conclusions
As empirical evidence has shown, the FTAs would have very limited effects on GDP (Markusen’s Law)17 and, as in any comparative statics exercise, the effect would be one time only. However, the impacts on trade are fairly positive for all the countries involved, except in the non-conclusion scenario (“No FTA/end ATPDEA”). In general, a positive effect is produced on exports, chiefly of light manufactures, with a simultaneous rise in all imports. The combined effect does not favour heavy manufactures or agricultural products from the
Andean countries. In the alternative case (“No FTA/end ATPDEA”), these countries concentrate more on producing petroleum and mineral products, with light manufactures negatively affected. However, it must be addressed that, because imports of machinery and equipment (which are the imports that increase the most if an agreement is signed) are bought at relatively lower prices, they can serve to stimulate investment, boosting the countries’ economic growth and competitiveness.
As regards welfare, the net effect of FTAs under static conditions tends to be slightly negative, although it is important to bear in mind that the benefits of the unilateral ATPDEA preferences received by the Andean countries have already been internalized. Therefore, when comparing the effects of FTAs, a possible alternative would be to conclude no agreement at all and to let ATPDEA expire. In such a case, the
16 Even though the results obtained for the simulations in steady-state conditions with variations in the capital stock give us a guideline as to how the values of the economic variables would be affected in the medium or long term, they must be viewed with extreme caution, as explained in Durán, de Miguel and Schuschny (2006).17 See François and McDonald (1996).

91
TRADE AGREEMENTS BY COLOMBIA, ECUADOR AND PERU WITH THE UNITED STATES: EFFECTS ON TRADE, PRODUCTION AND WELFARE • JOSÉ E. DURÁN LIMA, CARLOS J. DE MIGUEL AND ANDRÉS R. SCHUSCHNY
C E P A L R E V I E W 9 1 • A P R I L 2 0 0 7
benefits already achieved are withdrawn, with a return to higher tariffs for products included in ATPDEA. The main results for each country are as follows:• When the dynamic effects are ignored, the
results for Colombia are not at all conclusive when it comes to choosing the best alternative, since they all fall within the confidence interval in the sensitivity analysis of the “AC3-USA full liberalization” scenario. In any case, all the simulation scenarios of comparative statics produced negative results in terms of welfare. Therefore the choice of alternative is much more dependent on the dynamic effects, which are positive if an FTA is concluded.
• The static results for Ecuador are similar to those for Colombia, since all the scenarios have negative effects on net welfare. The “No FTA/end ATPDEA” option comes practically within the confidence interval of the “AC3-USA full liberalization” scenario, even though it might be the least negative option. However, if we consider the long-term effects under a “quasi-dynamic” scenario, the signature of an FTA has clearly positive results in terms of trade and welfare.
• In the case of Peru, the expiration of ATPDEA preferences without the conclusion of an FTA is undoubtedly the worst alternative from any standpoint. The outcomes of the simulation exercises favour the conclusion of an FTA, especially if sensitive products are excluded. A quasi-dynamic exercise confirms these conclusions.
• For the United States, the empirical results endorse its trade policy strategy in favour of concluding free trade agreements because the greater the number of countries with which the United States concludes an FTA and the smaller the number of excluded sensitive products, the greater are the benefits it derives in all fields. However, once again, weighted for GDP, the results appear unimportant. While it is true that, in terms of aggregate welfare
the results show reduced values, this masks important sectoral effects which, as history and economics have shown, cannot be easily offset by means of transfers from winners to losers (whose sectoral identification justifies studies like this). The exclusion of sensitive products from free trade agreements improves the results for the Andean countries, alleviating the impact on some of the most negatively affected sectors. However, this is not enough in itself, since the agreements establish new sectoral rules of the game which will partly determine the countries’ development paths.
Furthermore, the signature of an FTA incorporates numerous elements that are hard to quantify, such as gains in productivity stemming from greater access to technological improvements, or the beneficial effects of a possible improvement in the legal security of contracts or in the prospects of economic agents. Point 5 (c) of the previous section set out to analyse the dynamic impetus which FTAs can give to investment, showing that gains in welfare could be doubled. However, the model has not examined the economic changes that could be promoted by other active public policies (including institution building, promotion of competitiveness, improvement of infrastructure, training of human resources and protection of the environment and natural resources). While these policies could (and should) be implemented even in there are no FTAs, their effect would be greater if free trade agreements existed.
In other words, the figures in this article show that the conclusion of free trade agreements is no substitute for active development policies, and that doubts remain about the level of synergy that could be established between the application of such policies and the signature of free trade agreements. These are the areas on which public debate on free trade agreements should focus. This article helps to show that it is in those areas and in sectoral impacts, rather than in changes in the level of economic activity associated with tariff changes, that justification should be found for adopting a specific stance on the agreements and for identifying the characteristics that should be pursued when negotiating them, rather than solely the admittedly important issue of special treatment for sensitive products.
In addition, the results show that FTAs will also reduce intrasubregional trade and increase trade with the United States. In particular, Bolivia and the Bolivarian Republic of Venezuela would suffer losses in production and in exports to AC countries that negotiate agreements. Furthermore, a number of countries in the region, like Chile and Mexico, would suffer some erosion of their trade preferences in the United States market. To work along the “open regionalism” lines promoted by ECLAC, bilateral agreements must not clash with processes of Latin American integration and multilateral efforts. Greater uniformity of rules and disciplines between the different types of agreement is one of the prerequisites for preventing an asymmetric “hub-and-spoke” system of agreements. In any case, the continent’s solidarity should not be undermined and, with it, the chance to reach sustainable integration solutions.
Finally, in the specific case of the three free trade agreements analysed, the Andean countries possibly

92
TRADE AGREEMENTS BY COLOMBIA, ECUADOR AND PERU WITH THE UNITED STATES: EFFECTS ON TRADE, PRODUCTION AND WELFARE • JOSÉ E. DURÁN LIMA, CARLOS J. DE MIGUEL AND ANDRÉS R. SCHUSCHNY
C E P A L R E V I E W 9 1 • A P R I L 2 0 0 7
face the dilemma of choosing between signing a trade agreement that balances the advantages conferred by the United States via ATPDEA, and not negotiating an agreement at all (regardless of its possible benefits), which, in principle, would mean forfeiting the preferential treatment which they already enjoy. This second scenario prevents negotiations being conducted without conditions and, to a certain extent, forces the Andean countries down the road of FTAs with the United States. If the United States really wishes to continue its policy of support for the region’s development (which would tie in with the commitments of the United Nations Conference of Environment and Development
(Rio de Janeiro, 1992), the Millennium Summit (New York, 2000), the International Conference on Financing for Development (Monterrey, 2002) and the World Summit on Sustainable Development (Johannesburg, 2002)), and at the same time to progress with free trade integration, the first step should to be extend the term of ATPDEA for a prudent period, so as not to undermine the climate of negotiation. Even though two countries have already concluded negotiations, this is still a valid argument, as Ecuador has not yet completed its negotiations and a large section of Bolivia’s production sector depends crucially on exports covered by ATPDEA.
Bibliography
ADC (Andean Development Corporation) (2005): América Latina en el comercio global. Ganando mercado, División de Estudios Económicos, Bogotá, D.C., Vicepresidencia de Estrategias de Desarrollo, November.
Andean Community (2005): Evaluación de las posibles implicaciones para Ecuador de la no suscripción del Tratado de Libre Comercio con EEUU, documento informativo, SG/di 709, Lima, 3 March.
Argüello, R. (2004): An Exploratory Assessment of the Potential Impact of the Free Trade Area of the American on the Andean Community, Documentos borradores de investigación series, No. 46, Bogotá, D.C., Universidad del Rosario.
Argüello, R. and E. Valenzuela (2005): Market Access in the Western Hemisphere: Implications for the Andean Community, Documentos borradores de investigación series, No. 68, Bogotá, D.C., Universidad del Rosario.
Armington, P.S. (1969): The Geographic Pattern of Trade and the Effects of Price Changes, International Monetary Fund Staff Papers, vol. 16, No. 2, Washington, D.C., International Monetary Fund.
Baldwin, R.E. and A.J. Venables (1995): Regional economic integration, in G.M. Grossman and K. Rogoff (eds.), Handbook of International Economics, vol. III, Amsterdam, Elsevier.
Botero, J. (2005): Estimación del impacto sobre el empleo de los tratados de libre comercio en Colombia: análisis de equilibrio general computable, Estudios y perspectivas series, No. 8, LC/L.2366-P, Bogotá, D.C., ECLAC office in Bogotá, July. United Nations publication, Sales No. S.05.II.G.105. Available in http://www.eclac.cl/publicaciones /colombia/6/LCL2366P/ SERIECOL8-G-ES.pdf
Cuadra, C.G. and D. Florián (2005): Impacto de los procesos de integración latinoamericanos a partir de un modelo multiregional de equilibrio general computable, Perspectivas: análisis de temas críticos para el desarrollo sostenible, vol. 3, No. 1, Lima, Andean Development Corporation (ADC), July.
Dean, A., D. de Rosa and J.P. Gilbert (2004): Technical appendix: quantitative estimates of the economic of U.S. bilateral free trade agreements, in J. Schoot, Free Trade Agreements. US Strategies and Priorities, Washington, D.C., Institute for International Economics.
Diao, X. and A. Somwaru (2001): A dynamic evaluation of a free trade area of the Americas: an intertemporal global general equilibrium model, Journal of Economic Integration, vol. 16, No. 1, Seoul, Center for International Economics.
Diao, X., E. Diaz-Bonilla and S. Robinson (2002): Scenarios for trade integration in the Americas, Integration and Trade, year 6, No. 17, July-December, Washington, D.C., Institute for the Integration of Latin America and the Caribbean (INTAL).
Dimaranan, B.V. and R.A. McDougall (eds.) (2005): Global Trade, Assistance, and Production: The GTAP 6 Data Base, West Lafayette, Center for Global Trade Analysis, Purdue University. Available in https://www.gtap.agecon. purdue.edu/databases/v6/v6_doco.asp.
Durán Lima, J. and R. Maldonado (2005): América Latina y el Caribe: la integración regional en la hora de las definiciones, Comercio internacional series, No. 62, LC/L.2464-P, Santiago, Chile. United Nations publication, Sales No. S.05.II.G.200. Available in http://www.eclac.cl/publicaciones/ Comercio/4/LCL2454P/lcl2454e.pdf.
Durán, J.,C. de Miguel and A. Schuschny (2006): Acuerdos de libre comercio entre los países andinos y los EEUU ¿cuánto se puede esperar de ellos?, Comercio internacional series, No. 77, Santiago, Chile, Economic Commission for Latin America and the Caribbean (ECLAC).
François, J. and B. McDonald (1996): Trade Liberation and Capital Accumulation in the GTAP Model, GTAP Technical Paper, No. 7, West Lafayette, July. Available in https://www.gtap.agecon. purdue.edu/resources/res_display. asp?RecordID=310
Harrison, W.J. and K.R. Pearson (1996): Computing solutions for large general equilibrium models using GEMPACK, Computational Economics, vol. 9, No. 2, August.
Hertel, T. (ed.) (1997): Global Trade Analysis: Modeling and Applications, New York, Cambridge University Press.
Hinojosa-Ojeda, R., J.D. Lewis and S. Robinson (1997): Convergence and Divergence between NAFTA, Chile, and MERCOSUR: Overcoming Dilemmas of North and South American Economic Integration, Working Paper Series, No. 219, Washington, D.C., Inter-American Development Bank, May.
LAIA (Latin American Integration Association) (2004): Impacto del ALCA sobre la economía de los países miembros de la

93
TRADE AGREEMENTS BY COLOMBIA, ECUADOR AND PERU WITH THE UNITED STATES: EFFECTS ON TRADE, PRODUCTION AND WELFARE • JOSÉ E. DURÁN LIMA, CARLOS J. DE MIGUEL AND ANDRÉS R. SCHUSCHNY
C E P A L R E V I E W 9 1 • A P R I L 2 0 0 7
ALADI: un análisis de equilibrio general, ALADI/ SEC/dt 457, Montevideo, 8 March.
Light, M. (2003): Acuerdo de Libre Comercio de las Américas: impactos económicos en la Comunidad Andina, Lima, Secretariat of the Andean Community, September.
Malcolm, G. (1998): Adjusting Tax Rates in the GTAP Data Base, GTAP Technical Paper, No. 12, West Lafayette, September. Available in https://www.gtap.agecon.purdue.edu/resources/ res_display.asp?RecordID=315
Monteagudo, J., L. Rojas and others (2004): The New Challenges of the Regional Trade Agenda for the Andean Countries, document presented at the Seventh Annual Conference on Global Economic Analysis (17-19 June), Washington, D.C. Available in https://www.gtap.agecon.purdue.edu/ resources/download/1853.pdf
Morales, C., S. Parada and M. Torres (2005): Los impactos dife-renciados del Tratado de Libre Comercio Ecuador-Estados Unidos de Norte América sobre la agricultura del Ecuador, in A. Barrantes and L. Fernández (eds.), ALCA: efectos sobre el sector agrícola en las economías latinoamericanas, Recife, Editora Universitaria UFPE.
Rosales, O., J. Durán and S. Saéz (2006): Recent Trends in Latin American Integration: An Overview, Texas, Baylor University, forthcoming.
Schuschny, A., J. Durán and C. de Miguel (2007): El modelo GTAP y las preferencias arancelarias en América Latina y el Caribe: reconciliando su año base con la evolución reciente de la agenda de liberalización regional, Santiago, Chile, Serie Manuales 53, Economic Commission for Latin America and the Caribbean, www.eclac.cl/publicaciones/xml/7/27947/LCL-L2679-P.pdf.
Sepúlveda, C. (2005): Metodologías aplicables para un análisis sobre impactos comerciales de un tratado de libre comercio entre los países miembros de la Comunidad Andina de Naciones (CAN) y los EEUU, Santiago, Chile, Economic Commission for Latin America and the Caribbean (ECLAC), unpublished.
USITC (United States International Trade Commission) (2005): The Impact of the Andean Trade Preference Act. Eleventh Report 2004, Investigation No. 332-352 (Publication 3803), Washington, D.C., September.
(2006): 2006 Trade Policy Agenda and 2005 Annual Report of the President of the United States on the Trade Agreements Program, Washington, D.C. March.
Walmsley, T.L. (1998): Long-run Simulations with GTAP: Illustrative Results from APEC Trade Liberalization, GTAP Technical Paper, No. 9, West Lafayette, March. Available in https://www.gtap.agecon.purdue.edu/resources/res_ display.asp?RecordID=312.
Related Documents