New Zealand Population Review, 39:1-24. Copyright © 2013 Population Association of New Zealand Tracking Patterns of Tribal Identification in the New Zealand Census, 1991 to 2006 TAHU KUKUTAI * MOANA RARERE † Abstract Despite the growing political and economic importance of iwi in New Zealand, little attention has been given to their changing demography. Using data from the New Zealand Census of Population and Dwellings, we analyse the growth trajectories of four iwi - Ngāi Tahu, Waikato, Ngāti Awa and Tūhoe - between 1991 and 2006. We find a great deal of variation in iwi growth between censuses and over the entire focal period. In most instances, iwi birth cohorts increased rather than decreased in size, and gains from “new” members were especially marked among children, the middle-aged and women. The findings confirm the importance of accounting for non-demographic factors when projecting and planning for future iwi population growth. ver the past decade iwi (Māori tribes) have emerged as important regional and national economic stakeholders in New Zealand with considerable economic resources at their disposal (Nana, Stokes, & Molano, 2011; Te Puni Kōkiri/Ministry of Māori Development, 2011). As a result of settling historic grievances with the Crown, a growing number of iwi are now in a position to influence the economic, social and cultural well-being of their communities in ways that were previously unthinkable. Many iwi are engaged in a range of well-being oriented activities, from profit-making market enterprises to cultural advancement strategies, education initiatives and social service provision and delivery. Post-settlement development has underscored the importance of having access to relevant and timely demographic information with which to inform internal decision-making relating to the use and distribution of * Senior Research Fellow, National Institute of Demographic and Economic Analysis, University of Waikato. Email : [email protected] † Research Officer, National Institute of Demographic and Economic Analysis, University of Waikato. O

Welcome message from author
This document is posted to help you gain knowledge. Please leave a comment to let me know what you think about it! Share it to your friends and learn new things together.
Transcript

New Zealand Population Review, 39:1-24. Copyright © 2013 Population Association of New Zealand Tracking Patterns of Tribal Identification in the New
Zealand Census, 1991 to 2006
TAHU KUKUTAI *
MOANA RARERE †
Abstract
Despite the growing political and economic importance of iwi in New Zealand, little attention has been given to their changing demography. Using data from the New Zealand Census of Population and Dwellings, we analyse the growth trajectories of four iwi - Ngāi Tahu, Waikato, Ngāti Awa and Tūhoe - between 1991 and 2006. We find a great deal of variation in iwi growth between censuses and over the entire focal period. In most instances, iwi birth cohorts increased rather than decreased in size, and gains from “new” members were especially marked among children, the middle-aged and women. The findings confirm the importance of accounting for non-demographic factors when projecting and planning for future iwi population growth.
ver the past decade iwi (Māori tribes) have emerged as important regional and national economic stakeholders in New Zealand with considerable economic resources at their disposal (Nana, Stokes, &
Molano, 2011; Te Puni Kōkiri/Ministry of Māori Development, 2011). As a result of settling historic grievances with the Crown, a growing number of iwi are now in a position to influence the economic, social and cultural well-being of their communities in ways that were previously unthinkable. Many iwi are engaged in a range of well-being oriented activities, from profit-making market enterprises to cultural advancement strategies, education initiatives and social service provision and delivery.
Post-settlement development has underscored the importance of having access to relevant and timely demographic information with which to inform internal decision-making relating to the use and distribution of * Senior Research Fellow, National Institute of Demographic and Economic Analysis, University of Waikato. Email : [email protected] † Research Officer, National Institute of Demographic and Economic Analysis, University of Waikato.
O

2 Kukutai and Rarere
resources (Walling, Small-Rodriguez, & Kukutai, 2009). Population projections are a valuable tool, but can be challenging to undertake for indigenous peoples because of the often unpredictable nature of indigenous population growth (Australian Bureau of Statistics, 2013; Eschbach, Supple, & Snipp, 1998; Guimond, 1999; Guimond, Kerr, & Beaujot, 2004; Passel, 1997). Nevertheless, the intergenerational focus of iwi development means that iwi can ill afford to ignore future population change. In a post-settlement context, iwi leaders will increasingly need to ask themselves two basic demographic questions: How fast are our populations likely to grow in the future (e.g. in five, 10 or 20 years time)? And, how many members are we likely to have?
Since 1991, the number and proportion of Māori reporting at least one iwi affiliation in the census has increased significantly. At the 1991 Census, 76.5 percent of Māori descendants recorded an affiliation to at least one iwi, and by 2006 this had increased to 83.4 percent. In absolute terms this represented an increase of more than one-third. However, while interesting, the aggregate patterns shown in Table 1 are likely to obscure a great deal of inter-iwi variation with respect to the timing and magnitude of growth.
Table 1: Number and proportion of Māori descent population reporting at least one iwi
1991 1996 2001 2006 Iwi 370,476 426,321 454,479 512,325 NEI1 27,609 40,920 37,824 29,331 Don’t know 113,193 112,563 111,810 102,363 Total Māori descent 511,278 579,714 604,110 643,977 Percent of stated2 76.5 79.1 80.3 83.4 Source: Statistics New Zealand, Census of Population and Dwellings
Notes: 1. NEI = Not Elsewhere Included; this category includes Refused to Answer, Response Unidentifiable, Response Outside Scope, and Not Stated.
2. Excludes Not Elsewhere Included as defined above. In this paper we use data from the New Zealand Census of
Population and Dwellings to analyse the observed growth and change between 1991 and 2006 of four iwi – Ngāi Tahu, Waikato, Ngāti Awa and Tūhoe. While a global analysis of the 100-plus iwi in the official Statistical Standard for Iwi (Statistics New Zealand, 2009) would be ideal, such an exercise is beyond the scope of this paper. In the 2006 Census, all four iwi ranked among the ten largest tribes, but varied significantly with respect to population size and composition, asset base, public profile and
Tracking patterns of tribal identification 3
settlement histories.1 The timing and context of tribal settlements is a particularly important factor to consider because of its potential to influence patterns of identification (Walling et al., 2009).2
Drawing on a range of standard demographic techniques, we examine differences in the growth trajectories of each of the four iwi between 1991 and 2006. In particular, we assess how much of the growth in each intercensal period was due to the addition of “new” iwi members through individual changes in reported iwi identification – a process often referred to in the literature as “ethnic mobility”. Studies of ethnic mobility emerged from the United States when population researchers observed that the large increase in the American Indian population between 1960 and 1990 was not solely due to natural increase and changes to census procedures, but also reflected an increased propensity to identify as indigenous (Eschbach, 1995; Eschbach et al., 1998; Nagel, 1996; Passel, 1997; Thornton, 1997).3 In seeking to explain these shifts, a number of studies emphasised the importance of macro-political factors such as American Indian political activism and changes in government policy (Cornell & Hartmann, 1998; Nagel, 1995). Other studies linked changes in identification with micro-level factors such as higher levels of education, intermarriage and urban residence (Eschbach, 1995; Eschbach et al., 1998; Guimond, 1999; Guimond et al., 2004; Robitaille, Guimond, & Boucher, 2010).
While a number of national statistics agencies now routinely build in explicit assumptions relating to ethnic mobility in their indigenous population projections (see, for example, Australian Bureau of Statistics, 2013; Statistics New Zealand, 2010), these technical innovations have not yet been matched by a more sophisticated understanding of census-based inquiries into indigenous identity. Conventional demographic studies still tend to reify state-imposed statistical categories as objective descriptors of an underlying social reality, even though such categories may be incongruent with how indigenous peoples think about themselves (Andersen, 2008; Kukutai, 2011; Walter, 2005). When individuals change their responses to such categories, shifts can sometimes be erroneously interpreted as “evidence” of more substantive changes in individuals’ identities, particularly when described in terms of “ethnic switching” or “ethnic drifting”. This points to a larger problem with demographic studies of indigenous peoples, that is, the virtual absence of indigenous
4 Kukutai and Rarere
perspectives and a lack of attention to historical context (Kukutai & Taylor, 2013). In New Zealand, this history has been shaped in crucial ways by colonial relationships which have impacted on census categories, and the context within which Māori identities are formed and expressed.
To date, several studies have examined changing patterns of ethnic identification in the New Zealand Census and in large-scale surveys (Brown & Gray, 2009; Callister, Didham, & Kivi, 2009; Carter, Hayward, Blakely, & Shaw, 2009; Coope & Piesse, 1997), but none have looked specifically at iwi. This paper makes a start at addressing this knowledge gap by exploring how changing patterns of identification may be contributing to the growth of iwi. While we do not attempt to provide a comprehensive explanation for the drivers of change, we do consider the timing of settlements as well as the core demographic variables of age and sex. To place census-based inquiries into iwi identity within a broader historical context, we begin with a brief overview of iwi data collection in New Zealand.
Background
Iwi data collection in the New Zealand Census
Iwi have a long history of being quantified and qualified through census-taking. Iwi registers were first compiled by missionaries in the 1840s, ostensibly to track the spread of Christianity. An unofficial Māori census undertaken between 1857 and 1858 included crude population counts for main iwi groupings, but it wasn’t until 1874 that the first official Māori census was carried out. Kinship featured as the central organising concept in nineteenth-century Māori censuses and was expressed through a three-tiered typology of principal tribe (iwi), sub-tribe (hapū), and residence. The concept of a principal tribe appeared to have a much narrower meaning than the modern understanding of tribe; the list was relatively small and many of the so-called sub-tribes would today be recognised as autonomous tribes. Enumerator reports suggest a considerable degree of confusion prevailed, not only about which tribes were considered principals but also to which principals certain sub-tribes belonged. The ambiguities partly arose from treating tribes as timeless, discrete entities, at odds with the inherent dynamism of the Māori kinship system and the porous boundaries between whānau, hapū and iwi (Ballara, 1998).
Tracking patterns of tribal identification 5
Counting iwi was a time-consuming and difficult task and enumerators had limited resources at their disposal to cover large areas with dispersed populations. In the central North Island, some Māori communities simply disappeared between censuses while others reappeared in a new locality or in the same place but under a different tribal appellation (Kukutai, Pool, & Sceats, 2002). The inconsistencies reflected enumeration error as well as the complexity of local migration patterns which were influenced by changing tribal alliances and leadership, disease and conquest, as well as shifting economic arrangements. Much has been written about the tension between the collectivism of the traditional Māori usufruct system and state ambitions to individualise Māori landholdings (Ward, 1974), and these tensions were often remarked upon in census reports. The 1857/58 Māori census, conducted by the Waikato Resident Magistrate Francis Fenton (who would later preside over the Native Land Court), commented on the benefits that could be derived from Māori adopting a “fixity of residence”. It is no surprise, then, that many iwi viewed census-taking with suspicion, perceiving it to be linked with taxation or conscription.4
From the turn of the twentieth century, iwi came more firmly under the aegis of state control and, stripped of much of their land, were perceived as less of a political and economic threat. After the 1901 Census, the collection of tribal data was abandoned altogether.
It was not until 1991, almost a century later, that the state again began to collect iwi data. In many ways, the return to iwi enumeration reflected the emergence of iwi organisations as state-recognised actors to received and distribute settlement monies and assume internal governance and policy-making functions (Walling et al., 2009). The Rūnanga Iwi Act (1990) embodied the Government’s policy of devolving limited responsibility to Māori by conferring legal recognition to iwi authorities as Treaty partners and the preferred organisations to deliver social services to Māori. Although the Act was repealed a year later, the legacy of centralised iwi authorities remained (Barcham, 1998).

6 Kukutai and Rarere
Changes in iwi identification
Despite this rich history, studies of iwi population dynamics are sparse. Lowe’s (1989) study, based on data from 19th-century censuses and the 1951 electoral role, remains the most comprehensive study of tribal demography to date. His detailed analysis showed that, even in the 1870s, there was significant inter-iwi variation in terms of size, structure and growth potential. Pool (1991) also used 19th-century census data to examine iwi differences in growth and survivorship, but explicitly linked these differences to variation in the timing, magnitude and mechanism of iwi land loss through Crown purchase, raupatu (confiscation) and the Māori Land Court. This work formed the basis for a number of demographic reports, furnished as evidence for Waitangi Tribunal hearings, that documented and interpreted changes in iwi population health over time (e.g. Kukutai et al., 2002). Gould’s (1996) study of socio-economic differences between iwi was the first to use contemporary census data to undertake systematic inter-iwi comparisons.
More recently, a case study by Walling et al. (2009) compared census-based indicators for Waikato iwi with those generated by the tribe’s own register and found significant differences in population size and composition. Their study highlighted important departures in the concepts and processes employed to define iwi membership in official statistics versus tribal data sources. Whereas iwi affiliation in the census is based on self-identification (at least for adults), registers usually require some form of external recognition, typically by a kaumātua or elder. In such situations, the notion of belonging is explicitly tied to the acknowledgement of whakapapa.5 Often interpreted as a synonym for genealogical connection or kinship, whakapapa refers in a more general sense to the layers of relationships that connect individuals to ancestors, to the living, and to the natural environment (Te Rito, 2007). Individual knowledge or willingness to identify as a group member is neither necessary nor sufficient for a whakapapa connection to exist. As Royal (1992, p. 21) notes, whakapapa is ”an inescapable fact of human existence. Whether you know your parents or not, as a human you are the product of a group of people brought together in a number of antecedental events.”

Tracking patterns of tribal identification 7
This sentiment resonates with the popular practice (anecdotally observed) of kaumātua and kuia registering their children and grandchildren on iwi registers to ensure that their whakapapa connection is acknowledged. Taken together, these studies draw attention to the historical origins of inter-iwi diversity, the linkages between demography, development and politics, and the disconnection between official notions of indigenous collective identity and those held within indigenous communities.
Methodology
The data used in this paper are drawn from the New Zealand Census of Population and Dwellings obtained from Statistics New Zealand either on their website or through custom data. Comparisons with tribal registration data are not possible as such data are the property of the individual iwi and are governed by strict privacy controls. Iwi data collected in the census are coded and reported on using the two-tier classification (rohe and iwi) used in the Statistical Standard for Iwi (Statistics New Zealand, 2009).6 New iwi categories have been added over time and in its most recent iteration the Standard includes 128 iwi (excludes level-one regional categories) and eight residual-type categories. (For a more comprehensive analysis, see Rarere, 2012.) Iwi data are outputted using the total response method which means that individuals are counted in all of the groups with which they identify. As such, the sum of all iwi exceeds the sum of Māori descendants reporting an iwi affiliation.8
Both the wording and response categories of the iwi question in the census changed between 1991 and 2006. In 1991 the two-part question asked respondents of Māori descent if they knew their iwi and those ticking “yes” were prompted to write in the name of their main iwi. Those stating a main iwi could then indicate up to two other iwi with which they had strong ties (Statistics New Zealand, 1998). At the request of Māori stakeholders, the main iwi prompt was dropped in 1996 and the question simply asked if respondents knew the names of their iwi, with space to write in up to six iwi names and rohe. In 2001 the number of write-in spaces was reduced from six to five and a supplementary list of iwi from the classification standard was included in the help notes accompanying the census questionnaire. The question and format were retained in 2006.
8 Kukutai and Rarere
Our analysis of iwi growth trajectories employs intercensal percentage change, average annual rate of growth (exponential), and cohort analyses. For the latter, we track changes in the size of five-year birth cohorts across the three intercensal periods covered by this study. In theory, indigenous populations such as Māori are “closed” to migration because there is no homeland outside of New Zealand that can provide a long-term source of augmentation. In reality, Māori have high levels of international mobility, although this invariably produces net losses in most years, particularly to Australia (Bedford, Didham, Ho, & Hugo, 2004; Kukutai & Pawar, 2013). Given this, iwi birth cohorts should decrease over time as a consequence of mortality and out-migration, and so any increase can thus be attributed to net increases through changing patterns of identification. Finally, we also use the cohort component method (Smith, Tayman, & Swanson, 2001) to compute the expected iwi population size by five-year age groups for 2006 and compare it with the observed figures. The expected population is computed by “surviving” the 1991 iwi base population and then adding expected births based on age-specific birth rates. The same method is applied for the following census years until an expected iwi population for 2006 is produced. An excess of observed over expected iwi members also points to gains through the addition of new affiliates.
Results
Growth and change overall
To provide a comparative context for the iwi case studies, Table 2 shows the intercensal growth for the aggregate iwi-identified population (“Iwi”), as well as the Māori ethnic group (MEG) (i.e. those who identified as Māori on their census form), those of Māori descent, and the total New Zealand population.
Of the four groups examined, the largest increase (38 percent) over the focal period and in two out of the three intercensal periods was among those who identified with at least one iwi. The exception was 1991 to 1996, where the biggest increase was for the Māori ethnic group. The increase in the MEG has elsewhere been attributed to a change in the 1996 ethnicity question that appeared to encourage multiple responses (Kukutai, 2001; Statistics New Zealand, n.d.). In fact, the wording for all three Māori

Tracking patterns of tribal identification 9
identity questions changed between 1991 and 1996, making it difficult to untangle the influence of instrumental changes and other factors that might promote a greater willingness to identify as Māori. Compared to the Māori subgroups, the total New Zealand population experienced much lower growth in all three intercensal periods.
Table 2: Number and intercensal change for iwi, Māori ethnic group, Māori descent group and total New Zealand, 1991–2006
Population 1991 1996 2001 2006 Iwi 370,476 426,231 454,479 512,325 MEG 434,847 523,371 526,281 565,329 Māori descent 511,278 579,714 604,110 643,977 New Zealand 3,373,926 3,618,300 3,737,277 4,027,947 1991–1996 1996–2001 2001–2006 1991–2006 Iwi 15.0 6.6 12.7 38.3 MEG 20.4 0.6 7.4 30.0 Māori descent 13.4 4.2 6.6 26.0 New Zealand 7.2 3.3 7.8 19.4
Source: New Zealand Census of Population and Dwellings, various years
Growth and change among iwi
This section has a particular focus on whether the timing of Treaty settlements is correlated with an increase in iwi numbers in the census. Figure 1 plots the numerical size of the four specific iwi in each census year, and the year of settlement.
We focus first on the patterns for Waikato and Ngāi Tahu. Lead by charismatic, high-profile tribal leaders, both the Waikato-Tainui and Ngāi Tahu settlements attracted widespread media coverage in the lead-up to the signing of the deeds and in the years that followed. However, far from showing a systematic or clear pattern, the patterns are mixed. Ngāi Tahu experienced strong growth between 1991 and 2006, more than doubling in size from a baseline population of 20,304 to 49,185. Although the absolute increase was greatest in the two last intercensal periods (gains of 10,044 and 10,005, respectively), the largest proportionate increase occurred between 1991 and 1996 (43.5 percent). Ngāi Tahu also continued to experience significant growth in the decade following its settlement.
The pattern for Waikato iwi was far more volatile. Between 1991 and 1996, Waikato grew by only 7.1 percent and then increased by about 50 percent between 1996 and 2001. The number of people identifying as
10 Kukutai and Rarere
Waikato then declined between 2001 and 2006. Making sense of these erratic patterns requires an understanding of both the settlement context and changes to the iwi classification system. Although the Deed of Settlement was signed in the name of Waikato-Tainui, the public profile of the iwi in the years preceding the settlement was simply the name Tainui, reflecting both the legacy of the Tainui Māori Trust Board (established under the Māori Trusts Board Act (1955)) and the connections between Waikato iwi and the larger Tainui waka confederation.8 In 1991 and 1996 the iwi classification standard did not include the Tainui appellation; Tainui responses were likely to have been classified under some other category, most likely, “Waikato/King Country region – not further defined (NFD)” (Statistics New Zealand, 1993). In 1991 and 1996 the number of responses classified under that category was 15,399 and 18,711, respectively. In 2001 a change was made to the iwi classification standard that provided for the inclusion of waka categories, including Tainui, which were published as a supplementary iwi list in the notes section of the 2001 census. Between 1996 and 2001 there was a dramatic decline in the number of responses classified under the NFD category (from 18,711 to 1,650), which was partly offset by the increase in Tainui waka responses (12,591). The number of Waikato iwi responses also increased significantly in 2001. There is no obvious procedural explanation for why the number reporting Waikato iwi in the census declined in 2006 although it is important to note that the Waikato iwi register continued to grow over this period (Walling et al., 2009).
For Ngāti Awa the proportionate increase over the focal period (55.8 percent) was slightly higher than for Waikato but occurred in a more even manner, with the gain in any given intercensal period ranging between 15 and 17 percent. Compared to the post-settlement spikes observed for both Ngāi Tahu and Waikato, the Ngāti Awa settlement in 2003 did not appear to have a marked impact on patterns of identification in the 2006 census. The Ngāti Awa settlement received relatively little national media attention. In part this was because it was not novel – by the time the Deed was signed at least 20 direct negotiations had been reached with the Office of Treaty Settlements. Finally, of the four iwi shown in Figure 1, Ngāi Tūhoe experienced the smallest increase during the focal period, 33.2 percent, below the growth of the aggregate iwi

Tracking patterns of tribal identification 11
identified population (38.3 percent). Like Ngāti Awa, the intercensal growth was reasonably consistent, at between 15.4 and 17.0 percent.
Figure 1: Number identified as Ngāi Tahu, Waikato, Ngāti Awa and Ngāi Tūhoe, 1991-2006
Source: Statistics New Zealand, Census of Population and Dwellings, various years.
While intercensal rates are a useful indicator of growth, average annual rates of growth are more useful, in that they allow for an explicit comparison with rates of natural increase. Figure 2 shows rates of growth within each intercensal period for the four iwi as well as for the total iwi-identified population. To provide a benchmark we also visualise the theorised maximum limit of growth (5.5 percent per annum) that could be achieved in a non-contracepting high-fertility population (for details, see Guimond et al., 2004). The growth rates for Ngāi Tahu in the first period, and for both Ngāi Tahu and Waikato in the second period, significantly exceeded the upper limit of growth that could be achieved by natural increase alone. Clearly these iwi growth rates were due to factors other than an excess of births over deaths. If we consider that, even in the least developed countries in the world, annual population growth rarely exceeds 3.5 percent (World Bank, 2012), then even the increases experienced by Ngāti Awa (2.9 – 3.1 percent) can be seen to be very substantial.
0
10000
20000
30000
40000
50000
60000
1991 1996 2001 2006
Num
ber
of P
erso
ns
Census Year
Ngāi Tahu Waikato Ngāti Awa Ngāi Tūhoe
Wai
kato
Settl
emen
t 19
95
Ngā
i Tah
u Se
ttlem
ent
1997
Ngā
ti Aw
a Se
ttlem
ent
2003

12 Kukutai and Rarere
Figure 2: Average annual growth rates (exponential), Ngāi Tahu, Waikato, Ngāti Awa and Ngai Tūhoe, 1991–2006
Source: Statistics New Zealand, Census of Population and Dwellings, various years. Notes: In theory, the maximum rate of natural increase is 5.5 percent per annum. However, the highest national rates of natural increase in the world are approximately 3.5 percent per annum (Guimond, 1999).
The preceding analysis confirms that individual changes in
identification must account for at least part of the observed growth of our four iwi case studies. To what extent did these shifts occur uniformly across the different age groups? To answer this question we examine changes in the size of five-year age groups across the three intercensal periods. For ease of interpretation we use birth cohort ratios (age x+n, time t+n/ age x, time t) where ratios greater than one denote an increase in the size of a birth cohort over time and ratios less than one signal a decline. In theory birth cohorts should always decline over time through mortality. Even if we take account of migration, the number should decline as the flow of New Zealanders out of New Zealand consistently exceeds the number that return. The results are shown in Figure 3.
For Ngāi Tahu, we see that the ratios for all age groups in all periods exceeded one, with the exception of those aged 15-19 in 2001 (who were aged 20-24 in 2006). The ratios were highest at the youngest ages suggesting that the biggest shifts in identification were due to parents identifying their children as Ngāi Tahu (where they previously did not). Ratios were also relatively high at the younger adult ages, from 25 to 39 years. The graph for Ngāti Awa shows similar peaks at the younger and middle ages, albeit of a much smaller magnitude. It is interesting to note
2.9
1.3
2.4
7.2
5.9
4.5
1.4
8.1
-1.4
2.9 2.9 3.1
1.1
2.4 2.2
-2.0
0.0
2.0
4.0
6.0
8.0
10.0
1991-1996 1996-2001 2001-2006
Ave
rage
Ann
ual G
row
th R
ate
(%)
Census Years
Total Iwi Ngāi Tahu Waikato Ngāti Awa Ngāi Tūhoe
Theoretical maximum natural increase (5.5% p.a.)

Tracking patterns of tribal identification 13
that for all iwi the ratios were lowest at ages 15-19. This means that the number of 20-24 year olds at the end of the intercensal period was smaller than the number of 15-19 year olds at the beginning. This may be a reflection of a change from parental designation to self-identification associated perhaps with moving away from home for study or employment purposes. Tūhoe is unique in that, for all periods, the ratios were either at or below one, even at the younger ages. This suggests that ethnic mobility (which would show up as ratios > one) was a relatively insignificant contributor to population growth over the focal period and that natural increase was more important.
Figure 3: Ratio of birth cohort size by age group for Ngāi Tahu, Waikato, Ngāti Awa and Ngai Tūhoe, 1991-1996, 1996-2001 and 2001-2006
0
0.2
0.4
0.6
0.8
1
1.2
1.4
1.6
0-4
5-9
10-1
4
15-1
9
20-2
4
25-2
9
30-3
4
35-3
9
40-4
4
45-4
9
50-5
4
55-5
9
Rat
io (p
opul
atio
n si
ze a
t t+n
/t)
Age Groups
Ngāi Tahu
1991-1996 1996-2001 2001-2006
0
0.2
0.4
0.6
0.8
1
1.2
1.4
1.6
0-4
5-9
10-1
4
15-1
9
20-2
4
25-2
9
30-3
4
35-3
9
40-4
4
45-4
9
50-5
4
55-5
9
Rat
io (p
opul
atio
n si
ze a
t t+n
/t)
Age Groups
Waikato
1991-1996 1996-2001 2001-2006

14 Kukutai and Rarere
Source: Based on data from Statistics New Zealand Census of Population and Dwellings, various years. Notes: t = time; n = number of years
Survivorship Analysis
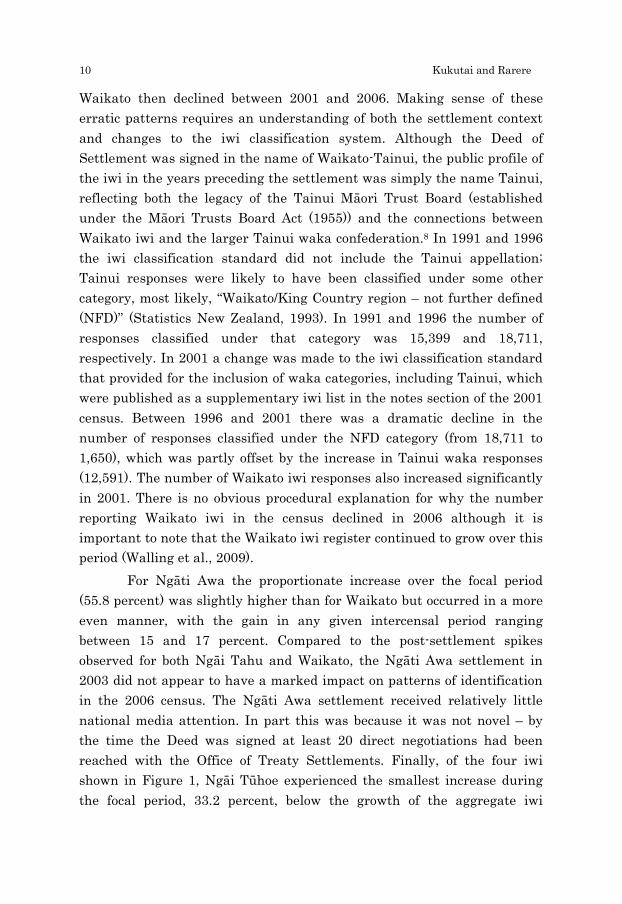
Building on the cohort analysis, Figures 4a to 4d show the expected and observed number in each five-year age group, for each iwi, in 2006. The expected numbers were arrived at using procedures described in the methods section. For Ngāi Tahu there were pronounced gaps between the expected and actual population at all ages and the differences were especially marked among children aged under 15 years where the observed number was almost double the expected. For Waikato iwi, the observed number of children also exceeded the expected number but the actual number of young adults (20-39 years) was slightly lower than expected. Ngāti Awa and Ngāi Tūhoe also had more children in 2006 than expected but, in the case of Tūhoe, the actual number was lower than the expected for all adult age groups. For Ngāti Awa, the actual number exceeded the expected with the exception of ages 25-34 years.
0
0.2
0.4
0.6
0.8
1
1.2
1.40-
4
5-9
10-1
4
15-1
9
20-2
4
25-2
9
30-3
4
35-3
9
40-4
4
45-4
9
50-5
4
55-5
9
Rat
io (p
opul
atio
n si
ze a
t t+n
/t)
Age Groups
Ngāti Awa
1991-1996 1996-2001 2001-2006
0
0.2
0.4
0.6
0.8
1
1.2
0-4
5-9
10-1
4
15-1
9
20-2
4
25-2
9
30-3
4
35-3
9
40-4
4
45-4
9
50-5
4
55-5
9
Rat
io (p
opul
atio
n si
ze a
t t+n
/t)
Age Groups
Ngāi Tūhoe
1991-1996 1996-2001 2001-2006
Tracking patterns of tribal identification 15
Figure 4: Expected and actual number by age groups, Ngāi Tahu, Waikato-Tainui, Ngati Awa and Ngāi Tuhoe, 2006
0
1000
2000
3000
4000
5000
6000
0-4
5-9
10-1
4
15-1
9
20-2
4
25-2
9
30-3
4
35-3
9
40-4
4
45-4
9
50-5
4
55-5
9
60-6
4
65+
Num
ber o
f Per
sons
Age Groups
Ngāi Tahu
Expected Actual
0
1000
2000
3000
4000
5000
6000
0-4
5-9
10-1
4
15-1
9
20-2
4
25-2
9
30-3
4
35-3
9
40-4
4
45-4
9
50-5
4
55-5
9
60-6
4
65+
Num
ber o
f Per
sons
Age Groups
Waikato
Expected Actual
0
1000
2000
3000
4000
5000
6000
0-4
5-9
10-1
4
15-1
9
20-2
4
25-2
9
30-3
4
35-3
9
40-4
4
45-4
9
50-5
4
55-5
9
60-6
4
65+
Num
ber o
f Per
sons
Age Groups
Ngāti Awa
Expected Actual

16 Kukutai and Rarere
Source: Statistics New Zealand Census of Population and Dwellings 1991-2006 and Infoshare Māori Period Life Tables, various years
While the foregoing analyses show that changing patterns of
identification have important age-related dimensions, we now turn our attention to the possible influences of gender. Table 3 shows the ratio of males to females for all four iwi plus the Māori Ethnic Group (MEG) over the entire focal period. In all instances we see a marked decline in sex ratios, indicating the increasing significance of women as drivers of iwi population growth. The shift is most marked for Ngāi Tahu where the ratio of men to women changed from 95 per 100 in 1991 to 86 per 100 in 2006. This cannot be attributed to what has been called the “missing men” phenomenon – men missing from official statistics due to under-enumeration, migration and other gender-linked factors (Callister & Lawton, 2011). If this were the case we would expect to see a similar decline in the sex ratios of the overall Māori ethnic group population and this is not the case. Of all four iwi, the shift towards a more female-dominated population was least apparent for Waikato-Tainui although the ratio was already well skewed towards women at the beginning of our focal period (89 men per 100 women in 1991 compared to 97 men per 100 women for the MEG).
Table 3: Sex ratios, by iwi, 1991-2006
Population 1991 1996 2001 2006 Ngāi Tahu 0.95 0.90 0.86 0.86 Waikato-Tainui 0.89 0.90 0.88 0.86 Ngāti Awa 0.94 0.91 0.87 0.87 Ngāi Tūhoe 0.96 0.94 0.91 0.90 MEG 0.97 0.97 0.96 0.95
Source: Statistics New Zealand, New Zealand Census of Population and Dwellings
0
1000
2000
3000
4000
5000
60000-
4
5-9
10-1
4
15-1
9
20-2
4
25-2
9
30-3
4
35-3
9
40-4
4
45-4
9
50-5
4
55-5
9
60-6
4
65+
Num
ber
of P
erso
ns
Age Groups
Ngāi Tūhoe
Expected Actual
Tracking patterns of tribal identification 17
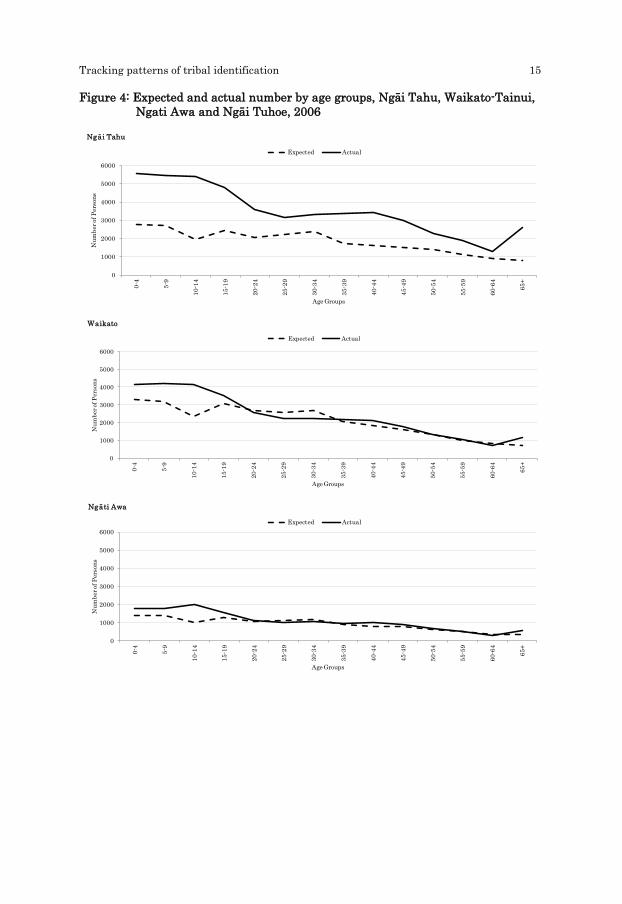
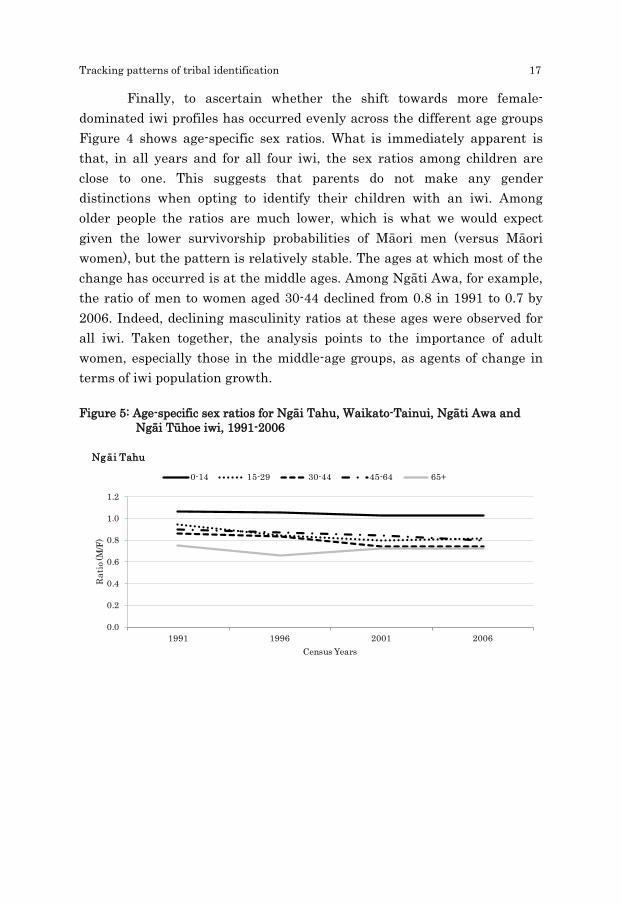
Finally, to ascertain whether the shift towards more female-dominated iwi profiles has occurred evenly across the different age groups Figure 4 shows age-specific sex ratios. What is immediately apparent is that, in all years and for all four iwi, the sex ratios among children are close to one. This suggests that parents do not make any gender distinctions when opting to identify their children with an iwi. Among older people the ratios are much lower, which is what we would expect given the lower survivorship probabilities of Māori men (versus Māori women), but the pattern is relatively stable. The ages at which most of the change has occurred is at the middle ages. Among Ngāti Awa, for example, the ratio of men to women aged 30-44 declined from 0.8 in 1991 to 0.7 by 2006. Indeed, declining masculinity ratios at these ages were observed for all iwi. Taken together, the analysis points to the importance of adult women, especially those in the middle-age groups, as agents of change in terms of iwi population growth.
Figure 5: Age-specific sex ratios for Ngāi Tahu, Waikato-Tainui, Ngāti Awa and Ngāi Tūhoe iwi, 1991-2006
0.0
0.2
0.4
0.6
0.8
1.0
1.2
1991 1996 2001 2006
Rat
io (M
/F)
Census Years
Ngāi Tahu
0-14 15-29 30-44 45-64 65+
18 Kukutai and Rarere
Source: Statistics New Zealand Census of Population and Dwellings, various years.
0.0
0.2
0.4
0.6
0.8
1.0
1.2
1991 1996 2001 2006
Rat
io (M
/F)
Census Years
Waikato
0-14 15-29 30-44 45-64 65+
0.0
0.2
0.4
0.6
0.8
1.0
1.2
1991 1996 2001 2006
Rat
io (M
/F)
Census Years
Ngāti Awa
0-14 15-29 30-44 45-64 65+
0.0
0.2
0.4
0.6
0.8
1.0
1.2
1991 1996 2001 2006
Rat
io (M
/F)
Census Years
Ngāi Tūhoe
0–14 15–29 30–44 45–64 65+

Tracking patterns of tribal identification 19
Conclusion
Motivated by the lack of attention given to iwi demography and the absence of indigenous perspectives in much of the ethnic mobility literature, this paper has sought to address a significant gap in the demographic literature. The main contribution has been to empirically identify key features of iwi population change in a period of major societal change in New Zealand. While our analysis shows that changing patterns of identification is clearly an important factor underlying the growth of iwi populations, its significance has varied over time and between iwi. Though partial, our analysis suggests that the increased propensity of Māori to identify with an iwi in the census cannot be solely attributed to changing incentive structures afforded through financial settlements. Rather, our analysis suggests that a range of factors are implicated, including instrumental changes in census and classification practices, changes in the broader socio-political environment, and individual-level demographic characteristics. In most instances, iwi cohorts increased rather than decreased in size and gains from “new” members were especially marked among children, the middle-aged and women. The findings confirm the importance of accounting for non-demographic factors when projecting and planning for future iwi population growth.
Finally, while these findings provide significant support for contemporary perspectives that highlight the fluid and contingent nature of ethnic identification, care needs to be taken in interpreting the substantive meanings associated with these shifts. That census-based findings may well depart significantly from the population patterns observed in tribal registers points to the shortcomings of relying solely on official data. A more comprehensive and critical approach that makes use of a range of sources and interpretive frameworks is likely to generate a more nuanced understanding of iwi population dynamics and the factors that underlie it.
20 Kukutai and Rarere
Acknowledgement
The authors gratefully acknowledge the helpful comments provided by Paul Hamer, as well as those from an anonymous reviewer. Any errors or omissions are ours alone.
Notes
1 The 2013 census results for iwi were not available at the time of writing.
2 Waikato-Tainui were the first major iwi to bypass the Waitangi Tribunal process and achieve settlement with the Crown through direct negotiations. Signed in 1995, the Waikato-Tainui Deed of Settlement included a formal apology and financial redress for the confiscation (raupatu) of tribal lands in a $170 million deal that included cash and the return of State-owned land. A subsequent Deed of Settlement relating to the Waikato River was signed much later, in 2009.
The Ngāi Tahu Deed of Settlement, which was signed in 1998 but formalised as a Heads of Agreement in 1996, was also the result of direct negotiation with the Crown, and provided for cultural redress and a cash settlement of $170 million. Previously, Ngāi Tahu were involved in Tribunal hearings which resulted in a substantial three-volume report on their claims in 1991, followed by further reports on fisheries and ancillary claims in 1992 and 1995. The Ngāti Awa settlement, which was pursued through the Tribunal, was signed nearly a decade after the Waikato and Ngāi Tahu Deeds and provided for redress of about $42 million in land and cash.
Tūhoe were involved in Tribunal hearings and were also part of the so-called “Treelords” deal, signed in 2008, which provided for iwi and hapū (sub-tribe) forestry interests in the central North Island. The Tūhoe Deed of Settlement was signed in 2013 – well after the period covered by this analysis – and included a $170 million financial, commercial and cultural redress package.
3 Passel (1997), for example, found that almost half of the increase in the American Indian population observed between 1960 and 1990 was due to non-demographic factors including ethnic mobility.
4 “Rebel” tribes affiliated with the Kīngitanga (Māori King Movement) were recorded on several occasions as being especially un-cooperative.

Tracking patterns of tribal identification 21
5 Some iwi also allow for the registration of whangai (adopted) whanau members.
6 Note that this includes residual, unspecified and iwi categories.
7 Note the proportion reporting two or more iwi affiliations over time; cannot be computed for 1991.
8 Tainui is the name of the ancestral waka (canoe) from which Waikato and other iwi (Maniapoto, Raukawa and Hauraki) trace their descent. Tainui is also the name of a hapū in Whaingaroa (Raglan).
References
Andersen, C. (2008). From nation to population: The racialisation of ‘Metis’ in the Canadian census. Nations and Nationalism, 14(2), 347–368.
Australian Bureau of Statistics. (2013). Census of Population and Housing: Understanding the Increase in Aboriginal and Torres Strait Islander Counts, 2006–2011. Retrieved from http://www.abs.gov.au/ausstats/abs@. nsf/Lookup/2077.0main+features42006-2011
Ballara, A. (1998). Iwi: The dynamics of Māori tribal organisation from c.1769 to c.1945. Wellington, New Zealand: Victoria University Press.
Barcham, M. (1998). The challenge of urban Maori: Reconciling conceptions of indigeneity and social change. Asia Pacific Viewpoint, 39(3), 303–314.
Bedford, R., Didham, R., Ho, E., & Hugo, G. (2004). Māori internal and international migration at the turn of the century: An Australasian perspective. New Zealand Population Review, 30(1 & 2), 131–141.
Brown, P., & Gray, A. (2009). Inter-ethnic mobility between the 2001 and 2006 censuses: The statistical impact of the New Zealander response. In Final report of a review of the official ethnicity statistical standard 2009. Wellington, New Zealand: Statistics New Zealand.
Callister, P., Didham, R., & Kivi, A. (2009). Who are we? The conceptualisation and expression of ethnicity. Official Statistics Research Series, 4, 1–56. Retrieved from http://www.statisphere.govt.nz/further-resources-and-info/official-statistics-research/series/volume-4-2009.aspx
Callister, P., & Lawton, Z. (2011). The New Zealand man drought: Is it real, what are its causes, and what are the implications for partnering? Retrieved from http://callister.co.nz/nz-man-drought.pdf
Carter, K., Hayward, M., Blakely, T., & Shaw, C. (2009). How much and for whom does self-identified ethnicity change over time in New Zealand? Results from a longitudinal study. Social Policy Journal of New Zealand, 36, 32–45.
Coope, P., & Piesse, A. (1997). 1991–1996 Inter-censal consistency study. Revised unpublished paper. Wellington, New Zealand.

22 Kukutai and Rarere
Cornell, S., & Hartmann, D. (1998). Ethnicity and race: Making identities in a changing world. Thousand Oaks, USA: Pine Forge Press.
Eschbach, K. (1995). The enduring and vanishing American Indian: American Indian population growth and intermarriage in 1990. Ethnic and Racial Studies, 18(1), 89–107.
Eschbach, K., Supple, K., & Snipp, M. (1998). Changes in racial identification and the educational attainment of American Indians, 1970–1990. Demography, 35(1), 35–43. Retrieved from http://www.jstor.org/stable/3004025
Gould, J. (1996). Socio-economic differences between Māori iwi, The Journal of the Polynesian Society, 105(2), 165-184.
Guimond, E. (1999). Ethnic mobility and the demographic growth of Canada’s Aboriginal populations from 1986 to 1996. Current Demographic Trends, 190–191.
Guimond, E., Kerr, D., & Beaujot, R. (2004). Charting the growth of Canada’s aboriginal populations: Problems, options and implications. Canadian Studies in Population, 31(1), 55–82.
Kukutai, T. (2001). Māori identity and political arithmetick: The dynamics of reporting ethnicity (Unpublished master’s thesis). University of Waikato, Hamilton, New Zealand.
———— (2011). Building ethnic boundaries in New Zealand: Representations of Māori identity in the census. In P. Axelsson & P. Skold (Eds.), Indigenous peoples and demography: The complex relation between identity and statistics. New York, USA: Berghahn Books.
Kukutai, T., & Pawar, S. (2013). Māori in Australia: A comprehensive overview of the 2011 Census (Working Paper). Hamilton, New Zealand: National Institute of Demographic and Economic Analysis.
Kukutai, T., Pool, I., & Sceats, J. (2002). Central North Island Iwi: Population patterns and trends (Report prepared for the Crown Forestry Rental Trust by Portal Consulting and Associates). Wellington, New Zealand: Crown Forestry Rental Trust.
Kukutai, T., & Taylor, J. (2013). Postcolonial profiling of indigenous populations: Limitations and responses in Australia and New Zealand. Espace Populations Societes, (2012/1), 13–27.
Lowe, R. (1989). He kaupapa korero: Te puawaitanga o nga iwi 1874–1951. Wellington, New Zealand: Department of Māori Affairs.
Nagel, J. (1995). American Indian ethnic renewal: Politics and the resurgence of identity. American Sociological Review, 60(6), 947–965.
— (1996). American Indian ethnic renewal: Red power and the resurgence of identity and culture. New York, USA: Oxford University Press.
Nana, G., Stokes, F., & Molano, W. (2011). The asset base, income, expenditure and GDP of the 2010 Māori economy. Wellington, New Zealand: Business and Economic Research Limited.

Tracking patterns of tribal identification 23
Passel, J. (1997). The growing American Indian population, 1960–1990: Beyond demography. Population Research and Policy Review,(16), 11-31.
Pool, I. (1991). Te iwi Maori: A New Zealand Population Past, Present and Projected. Auckland, New Zealand: Auckland University Press.
Rarere, M. (2012). The determinants of tribal population growth in the New Zealand Census (Unpublished master’s thesis). University of Waikato, Hamilton, New Zealand.
Robitaille, N., Guimond, E., & Boucher, A. (2010). Intergenerational ethnic mobility among Canadian aboriginal populations in 2001. Canadian Studies in Population, 37(1–2), 151–174.
Royal, T. A. (1992). Whakapapa. In Genealogical Research Institute of New Zealand Yearbook. Lower Hutt, New Zealand: Genealogical Research Institute of New Zealand.
Smith, S., Tayman, J., & Swanson, D. (2001). State and local population projections: Methodology and analysis. New York, USA: Kluwer Academic/Plenum Publishers.
Statistics New Zealand. (1993). Glossary and References: Residual Categories. Retrieved from http://www.stats.govt.nz/surveys_and_methods/methods/ classifications-and-standards/classification-related-stats-standards/iwi/ glossary-and-references.aspx
——— (1998). 2001 census of population and dwellings: Preliminary views on content. Wellington, New Zealand: Author.
——— (2009). Iwi. Retrieved from http://www.stats.govt.nz/surveys_and_methods /methods/classifications-and-standards/classification-related-stats-standards/iwi.aspx
——— (2010). Population projection tables: National ethnic population projections tables. Retrieved from http://www.stats.govt.nz/tools_and_services/ nzdotstat/population-projections-tables.aspx
Statistics New Zealand. (n.d.). 2001 Census of population and dwellings: Change in ethnicity question. Retrieved from http://www.stats.govt.nz/Census/2001-census-data/change-in-ethnicity-question.aspx
Te Puni Kōkiri/Ministry of Māori Development. (2011). A profile of iwi and Māori representative organisations/He kōtaha o ngā rōpu māngai iwi/Māori. Wellington, New Zealand.
Te Rito, J. (2007). Whakapapa: A framework for understanding identity. MAI Review, 2, 1–10.
Thornton, R. (1997). Tribal membership requirements and the demography of “old” and “new” Native Americans. Population Research and Policy Review, 16, 33–42.
Walling, J., Small-Rodriguez, D., & Kukutai, T. (2009). Tallying tribes: Waikato-Tainui in the census and iwi register. Social Policy Journal of New Zealand, 36, 2–15.

24 Kukutai and Rarere
Walter, M. (2005). Using the power of data within indigenous research practice. Australian Aboriginal Studies, 2, 27–34.
Ward, A. (1974). A show of justice: Racial amalgamation in nineteenth century New Zealand. Canberra, Australia: Australian National University Press.
Related Documents


![IN THE COURT OF APPEAL OF NEW ZEALAND · IN THE COURT OF APPEAL OF NEW ZEALAND CA160/2017 [2017] NZCA 613 BETWEEN NGĀI TAI KI TĀMAKI TRIBAL TRUST Appellant AND MINISTER OF CONSERVATION](https://static.cupdf.com/doc/110x72/5f0bcb7f7e708231d432401b/in-the-court-of-appeal-of-new-zealand-in-the-court-of-appeal-of-new-zealand-ca1602017.jpg)