Tracking Clean Energy Innovation Progress

Welcome message from author
This document is posted to help you gain knowledge. Please leave a comment to let me know what you think about it! Share it to your friends and learn new things together.
Transcript

Tracking Clean Energy Innovation Progress

66 Tracking clean energy progress Tracking clean energy innovation progress
© OECD/IEA, 2017.
Tracking clean energy innovation progress
Key messages
The total investment in clean energy RD&D is estimated to have been USD 27 billion in 2015
but is not yet rising globally. It needs to pick up to be on track toward a sustainable energy
transition. Public funding of clean energy RD&D, including by certain state-owned
enterprises, was over USD 19 billion in 2015. This is significantly higher than combined
corporate RD&D expenditure of USD 6 billion and investment by venture capital funds into
start-up clean energy technology companies of around USD 2 billion in 2016.
Clean energy RD&D has been key to provide us with the clean technology options of today,
and will continue its importance into the future. Public funding is striving to fulfil its
prescribed function of supporting technologies that are further from the market or have high
development and demonstration costs, including nuclear, CCS and ocean energy. Corporate
investment into clean energy is growing but remains a small share of total corporate energy
sector R&D, which is dominated by companies active in oil and gas, thermal power,
networks and utilities. Venture capital funds, on the other hand, are mostly targeting clean
energy topics.
Implementation of complementary public and private pledges, such as Mission Innovation
and Breakthrough Energy Coalition, can serve as essential springboards to boost clean
energy innovation. Such new efforts can benefit from building upon existing collaboration
mechanisms such as IEA’s Technology Collaboration Programmes.
Understanding RD&D investment patterns can further enhance the effectiveness of RD&D
spending as well as highlight areas for collaboration. Key recommendations for decision
makers in governments and the private sector include:
Collect better data on public- and private-sector RD&D spending, especially for key
emerging countries and the private sector. Better data will enable public and private
decision makers to better identify gaps and to enhance efficiency of resource allocation.
Develop and track key performance indicators for priority technologies. Measurement of
progress in clean energy innovation needs to go beyond the flow of money and to also
focus on performance indicators, such as those defined in IEA Technology Roadmaps.
Increase further the level of collaboration and exchange on innovation policy, including
through use of innovative public-private partnerships, including Mission Innovation, and
IEA Technology Collaboration Programmes (TCPs). Further explore how international
co-operation across the public sector can leverage private-sector engagement.
Enhance communication of progress in technology innovation not only to stimulate further
discussion among experts, but also unlock additional investment opportunities.
Conduct clean energy RD&D investment in concert with the other key elements of the
innovation ecosystem, including early-stage market development and human resource
capabilities. Effective priority setting and investment takes account of short-term and long-
term perspectives and all relevant levels of activity: international, national, municipal,
company and entrepreneur.

Tracking clean energy progress Tracking clean energy innovation progress 67
© OECD/IEA, 2017.
Introduction
Technological innovation has always been a key driver of energy sector evolution. The importance of innovation will only increase as societies strive to achieve affordable, secure and sustainable energy systems into the future. This is especially true where societies are aiming to achieve a number of shared energy policy objectives, such as climate change mitigation, air pollution and energy security.
The world’s arsenal of clean energy technologies has been vastly improved since the first edition of TCEP was published in 2012. Many clean energy technologies are now cost-competitive, but innovation will need to be further accelerated in coming years. The individual sections of TCEP 2017 highlight numerous areas in need of substantial technology
1 innovation. These areas range widely, from lignocellulosic biomass pre-
treatment to low-energy CO2 separation and compression, and from breakthrough cement production processes to small modular nuclear reactors and improved vehicle materials and design.
In addition to improving this suite of identified clean technologies, innovation can also take advantage of unforeseen opportunities. Options on a path to net zero emissions need to include certain “frontier” technologies that do not currently attract wide attention from investors, but that could be highly valuable over the coming decades.
Considering the inherently non-linear and uncertain nature of innovation, trying to assess incremental and radical innovations on a purely cost-benefit basis is misguided. Accordingly, governments should consider taking a portfolio approach to supporting public- and private-sector energy innovation (IEA, 2011). Such an approach balances the uncertainties of competing future scenarios with the potential payoffs of technological breakthroughs. It supports both lower-risk improvements to familiar technologies and more uncertain, potentially disruptive ideas.
2
Moreover, truly innovative technologies – such as superconducting electricity transmission; cheap, dense hydrogen storage; novel low-impact construction materials; or fossil fuel-free iron and steel production – could help offset sectors and technologies that may underperform in achieving a 2DS, let alone a well-below-2DS. History shows that unimagined changes are more likely than unlikely over decades.
3 Looking back from 2070
may be like reflecting from today back to 1964, a time before pocket calculators, communication satellites and microwave ovens, let alone the Internet, drones and 3D seismic surveys.
This special feature section complements the main TCEP by focusing on RD&D, the first stage in the innovation journey (Box 2.1). It examines all the available public and private data on energy RD&D investment, including highlighting key trends. The special feature also includes a set of specific recommendations for governments and the private sector that take into account the complexities of the innovation process and its drivers. In the tables that follow this special feature, key technologies for each sector have been emphasised to draw attention to their RD&D progress and needs. The IEA will look to further build its competences in this area in going forward.
1. Technologies can be defined at various levels. At a high level, it could be the technology of space heating or even electrical space
heating. At a lower level, a ground source heat pump refrigerant or borehole drill could be the focus for innovation. This report generally
discusses technologies at their more aggregated level, recognising that they are composed of a vast number of smaller technologies that
can be individually improved and contribute to overall progress.
2. A portfolio approach requires the following questions be answered by government sponsors: What technology improvements are central
to realising the national vision of its energy future? Where might these improvements come from, and which policy instruments can deliver
them most efficiently? What technologies could raise overall optionality value and keep open other visions that meet the policy objectives?
3. It hardly needs to be pointed out that energy technology innovation does not take place only in low-carbon energy technologies:
traditional high-carbon energy technologies are also still being improved. Innovation in extraction technologies has made additional
hydrocarbon resources available at economically viable costs – thereby dispelling the spectre of a near-term peak in oil production.

68 Tracking clean energy progress Tracking clean energy innovation progress
© OECD/IEA, 2017.
Box 2.1. Stages and sources of the innovation process
Innovation is an evolutionary process. Technologies are selected by users based on how well they fit the environment in which they arise.
4 Technologies that can adapt to the needs
and resources of a greater number of users will be perpetuated, expanding their market share. As in the natural world, the selection environment itself is not static. Changes in related technologies, consumer behaviour or policy choice can iteratively improve the value of a given technology, making it more likely to be selected or – as has happened with fossil fuel infrastructure and will happen with some low-carbon technologies – displaced. Governments play a crucial role in shaping and influencing the marketplace for technologies.
The process of energy technology innovation can be represented in four stages (IEA, 2015):
prototype and demo
high cost and performance gap
low cost and performance gap
competitive without financial support.
At each stage the level of risk taken by investors is reduced, as is the need for public support. However, innovation is not usually a linear progression from prototype to demonstration, deployment and diffusion. A given technology is simultaneously at different stages in different markets and applications.
5 In addition, deployment will generate new
ideas for improvements to a technology that will continuously appear at the prototype stage. Thus, the stages run concurrently and may overlap, feeding on one another and surpassing each other’s performance (Figure 2.1).
At different stages of development, innovation arises from different sources, which means that support to technologies needs to be tailored accordingly. Four sources are identified:
RD&D for novel technologies and improvements to existing technologies
learning-by-doing, by which engineers and others improve technology incrementally
as they get more experience
scale-up of production enables economies of scale and efficient value chains
exchange of knowledge between stakeholders across sectors and regions.
Through RD&D, new ideas and variants of existing technologies become available for selection. R&D precede demonstration and are undertaken in corporate research labs, universities, government research institutions and small firms. Demonstration in a real-world environment at commercial scale is a subsequent step to show technical and commercial viability. Demonstration informs market players and policy makers of cost and performance.
RD&D is mostly associated with the prototype and demo stage of the innovation process. At this stage, investors typically face the highest risks and government support is at its strongest. RD&D
4. The selection environment includes social norms, existing infrastructure, complementary technologies and competing technologies.
Incumbent power and bounded rationality can influence these factors such that users may not always have the opportunity or information
to be able to select optimal technologies, but among available options they tend to adopt solutions that fit their needs and expectations.
5. Today’s batteries may be sufficiently low cost in island systems with high electricity prices, such as Hawaii, but in need of significant
improvement or support in other US states.

Tracking clean energy progress Tracking clean energy innovation progress 69
© OECD/IEA, 2017.
however remains ongoing even when the technology is competitive without financial support to improve its performance and market competitiveness.
2.1. Figure: Stages of technology evolution and sources of innovation
illustrated for solar PV
Key point: Innovation is an evolutionary process whereby today’s commercial technologies – whether low-carbon or high-carbon – can be out-competed by solutions that are currently at the prototype stage if conditions are right.
Tracking RD&D spending
A centralised, reliable source for global energy RD&D spending data, either public or private, is not currently available. Government spending is a crucial source of innovation in the global economy (Box 2.2), yet the IEA is one of the few agencies collecting data on energy RD&D budgets, which its members report annually per technology category according to prescribed guidance. Outside IEA members, some countries publish budgets and expenditures, but generally they do not break down the data beyond broad classifications such as energy or electricity, oil and gas, and coal companies.
Furthermore, research into energy end-use efficiency is not always reported consistently, and so activity relating to efficient construction, vehicles or manufacturing is likely to be underreported (Wilson et al., 2012). Complicating the issue further, some countries have significant “public” investment in innovation beyond traditional government budgets. In China, as in some other countries, a significant share of government-directed research is performed by state-owned enterprises that fund their own RD&D. In Mexico, a duty is levied on the value of oil and gas production for spending on energy R&D by non-state entities (SENER, 2017). Separating research investments in “clean” energy from other energy topics is also troublesome and stakeholders have divergent definitions of what constitutes “clean”.
Low cost and
performance gap
Compe��ve without
financial support
Time
RD&D
Se
co
nd
wa
ve
Th
ird
wa
ve
Niche
markets
Continual
incremental
improvements
Spillovers
Widespread
deployment
Inn
ova
tio
n s
tag
es
First
commercial
project
Second
generation
(learning from
early projects)
Third generation
(performance improvement
from ongoing R&D)
Learning: learning by doing, scaling up
Learning: learning by doing, scaling up
Learning: demonstra�on, knowledge
exchange, scale
Learning: R&D, knowledge exchange
Public support: strategically
supported R&D
Private ac�ons: angel investors,
corporate R&D
Public support: market crea�on,
technology-specific support
Private ac�ons: PPPs, VC, corporate debt,
equity investors
Public support: declining,
technology-neutral support
Private ac�ons: project ac�ons,
corporate debt
Public support: accelerate adop�on
Private ac�ons: corporate and
household budgets; bond markets
Prototype and
demo stage
High cost and
performance gap
Fir
st
wa
ve
70 Tracking clean energy progress Tracking clean energy innovation progress
© OECD/IEA, 2017.
Challenges are even larger in the corporate sector, with many companies hesitant to report their funding levels with any granularity. Furthermore, energy and non-energy RD&D spending are often difficult to distinguish.
With these challenges in mind, this special feature attempts to pull together in one place the available numbers, both for government and corporate spending, and to highlight key trends and opportunities to improve RD&D knowledge base.
Box 2.2. Stages and sources of the innovation process
Governments play a leading role in clean energy RD&D, especially because many societal benefits, such as reducing GHG emissions and local pollution are not yet sufficiently valued by markets. Through RD&D support, governments guide their economies towards activities they value as important. Governments thus have a dual role as a corrector of market failures and a shaper of market developments.
6
Investments in RD&D are unlike other energy sector investments. The resulting assets are often intangible, and the returns are highly uncertain. Financers may have difficulty evaluating projects, especially if the only way to learn about a technology is to invest in it. Knowledge that is procured can be employed by competitors at low marginal costs. RD&D has long lead times and is often a collective, cumulative enterprise involving multiple organisations. Finance must be willing to bear high risks, be strategic and be patient.
While finance sources such as venture capital and private equity funds are successful at identifying technologies with high medium-term value, they have not been as successful as strategic long-term investors. Companies can access financial markets for major research projects, but investment can be limited by a vicious cycle: raising finance for research on a technology cannot be justified until a clear demand arises for the product; market actors cannot generate demand for the product until the technology is proven to be effective; the technology cannot be proven without finance for research. As a result, investments in innovation can be biased towards opportunities affording short-term gains: a survey of 240 000 small and large businesses undertaking energy R&D in the United States found that two-thirds of those that formally measure the economic impacts of their energy innovation expected to recoup investments within just two to three years (Anadon et al., 2011).
Corporate balance sheets are used for strategic investments in innovation, but evidence suggests that business expenditures may be becoming more focused on maximising short-term share value. Despite recent low interest rates for borrowing for R&D, many companies in Europe and the United States have raised finance for share buybacks.
7
Since the financial crisis, the level of share buybacks among companies active in clean energy technologies has risen and was higher than investments in R&D in 2015 (Figure 2.2). Furthermore, in industries dominated by incumbent players with substantial legacy assets, little incentive exists to support radical innovation, leading to a focus on incremental research.
6. Governments continually act to shape markets to realise social goods via actions such as: adjusting taxes, regulating market
competition and antitrust behaviour, implementing trade and immigration rules, distributing revenues, providing access to education,
prohibiting environmentally damaging activities, and creating forums for exchanging information.
7. Lazonick (2015) describes the impact of 1980s public policy in relation to share buybacks and its effect on the spending patterns of the
US corporate sector since the objectives of maximising shareholder value have become dominant, leading to more short-term decision
making.

Tracking clean energy progress Tracking clean energy innovation progress 71
© OECD/IEA, 2017.
Governments are a vital source of long-term, patient finance. Policy instruments can be used to enable access to finance for risky projects. As a result, much innovation by the private sector builds on publicly funded programmes for early-stage, higher-risk research (Mazzucato, 2011). Governments can “crowd in” other sources of funds in pursuit of long-term strategic missions. The commercial results of public energy RD&D investments can be dramatic. Within 20 years, China transformed itself from a technology importer into a major manufacturer and exporter of several low-carbon technologies (Tan and Seligsohn, 2010).
2.2. Figure: Expenditure on R&D and share buybacks of the top 20
clean energy firms by revenue
Note: Clean energy companies defined based on Bloomberg Industry Classification System (BICS) sectoral
classifications.
Source: Bloomberg (2016), Bloomberg Terminal.
Key point: While access to capital has been relatively easy in recent years, some companies have been incentivised to spend on short-term benefits rather than their long-term development.
Trends in IEA member countries’ RD&D spending
Reported RD&D spending by IEA member governments on topics related to clean energy doubled between 2000 and 2010 to around USD 15 billion (IEA, 2016c), around 0.15% of their total budget expenses (Figure 2.3). This growth represents a fourfold increase if nuclear is excluded. However, spending on energy RD&D has stagnated since 2010, an observation that has underpinned the timely launch of the Mission Innovation initiative.
8
Countries that have signed up to the Mission Innovation pledge of doubling clean energy research spending over five years will seek to reverse this trend.
8. While the peak year since 2000 was 2009, this surge in spending was related to post-crisis stimulus packages targeted at large
technology demonstration projects, such as the US American Recovery and Reinvestment Act of 2009.
0
2
4
6
8
10
2009 2010 2011 2012 2013 2014 2015
USD
nom
inal
R&D Investment Share buybacks

72 Tracking clean energy progress Tracking clean energy innovation progress
© OECD/IEA, 2017.
Figure 2.3. IEA public energy RD&D budget by technology group
Notes: T&D = transmission and distribution. Basic energy research refers to basic research where the final application may not be
attributable to a specific technology listed in previous sections. Included are the European Commission and state-owned enterprise
expenditure where reported.
Key point In real terms, public RD&D spending in IEA countries has bounced back since a low in 2000, with growth mostly in clean energy technologies.
The share of RD&D spending that is not directed specifically to fossil fuels has risen from a low point of 80% in 1990 to 93% in 2015. Shares of renewables and efficiency each increased from just 7% of the total in 1985 to 20% in 2015, reaching almost USD 7 billion in 2015 when combined. Since 2010, budgets for fossil fuels (excluding CCS) have been constant in real terms at USD 1.1 billion.
The United States (35% of the total) and Japan (19%) are the countries with the largest absolute spending on energy RD&D among IEA members. Overall, energy RD&D is only around 4% of total R&D expenditure in IEA members, however. This level has more than halved since the 1980s, while defence research has remained dominant at around 30%.
IEA data demonstrate that public funding is striving to fulfil its prescribed function of supporting technologies that are further from the market or have high development and demonstration costs, including nuclear, CCS and ocean energy. This point can be seen in a comparison of the shares of public funding for different clean energy technologies and private funding by venture capital (Figure 2.4).
Data reported to the IEA indicate direct budget expenditures on RD&D, as well as R&D budgets of some state-owned enterprises. However, governments invest in clean energy RD&D using a more diverse variety of instruments and policies that can serve different purposes (Table 2.1). These instruments are most commonly employed at the level of national or subnational governments, but there is a positive trend toward more engagement of cities at one end of the scale and intergovernmental collaborations at the other. Cities can effectively support projects, such as smart city demonstrations, that are tailored to local needs, while international initiatives can fund projects that countries cannot fulfil alone.
0
5
10
15
20
1980 1985 1990 1995 2000 2005 2010 2015
USD
(201
6) b
illio
n
Other
Nuclear/basic energy research
Hydrogen/storage
Renewables
CCS
Efficiency

Tracking clean energy progress Tracking clean energy innovation progress 73
© OECD/IEA, 2017.
Figure 2.4. Relative shares of clean energy technologies in public RD&D
and venture capital (VC) funding
Source: Cleantech Group (2017), i3 database.
Key point Governments tend to support a broader range of technologies than the private sector, showing the value of a portfolio approach to public RD&D funding.
Table 2.1 Public instruments for supporting clean energy RD&D
Funding instrument
or policy
Description Purpose Examples Challenges
Tax incentives Lower tax rates
or rebates for
R&D
expenditures;
tax allowances;
payroll tax
deductions; tax
refunds for not-
yet-profitable
start-ups.
Encourage firms to
undertake more
RD&D in all sectors,
raising skills and
keeping local firms
competitive.
Widely used across
OECD countries.
Indiscriminately
shared between
research with and
without a high
social value. The
risk of high budget
costs means that
available tax relief
is sometimes
capped. Can lead
to competition
between countries
or regions for R&D
talent, increasing
costs. No
mechanism for
ensuring that the
resulting research
is of a high quality.
Targeted tax
incentives
Favourable tax
treatment for a
specific sector
or type of R&D.
Stimulate more
activity in a part of
the innovation chain
or strategically
shape a sector.
La jeune entreprise
innovante (J.E.I.) in
France.
India tax exemption
for start-ups
involving innovation
development
START-UP NY.
IEA member country spendingVC breakdown for 2016 from CTGEnergy efficiency (except transport)
CCS
Solar
Wind
Geothermal
Bioenergy
Transport
Hydro and marine
Nuclear
Hydrogen and fuel cells
Energy storage
Other

74 Tracking clean energy progress Tracking clean energy innovation progress
© OECD/IEA, 2017.
Public research labs
Government can employ researchers as civil servants and establish long-term research programmes.
Provides funding and job stability for researchers working on strategic topics free from commercial pressures.
US National Laboratories: National Renewable Energy Laboratory (NREL), Pacific Northwest National Laboratory (PNNL), Lawrence Berkeley National Laboratory (LBNL), ENL etc.
Fraunhofer-Institut für System- und Innovation-forschung (Institute for Systems and Innovation Research) (Fraunhofer ISI).
India Department of Biotechnology bioenergy research centres.
King Abdullah Petroleum Studies and Research Center (KAPSARC).
CanmetENERGY/NRC (Canadian National Research Council).
Can entrench path dependency in research as expertise is difficult to shift to new topics.
Budgets tend to be hard to vary significantly between funding cycles.
Research by state-owned enterprises
Governments can use their ownership rights to direct the level and type of research undertaken.
Support national champions that are committed to preserving the returns to RD&D within the country. Direct corporate strategy towards national interests.
Rosatom.
Masdar.
Vattenfall.
State Grid Corporation of China (SGCC).
Hydro-Quebec IREQ (Institut de recherche d’Hydro-Quebec).
Managerial incentives need to be aligned with ensuring the highest returns to innovation.
100% grants Funding awarded to researchers in public or private institutions for projects selected by government agencies.
Address private underfunding of research and direct efforts towards government priorities.
China Key Technologies R&D Program.
Public funding of private research can risk “crowding out” private investment in RD&D.9
Public funds may not be spent as carefully as a company’s own resources.
9. While concerns have been raised about the possible “crowding out” of private sector RD&D investment by public RD&D expenditure, the
evidence is mixed. In general, a large government initiative is considered to send a signal to private investors that outweighs the effects of
competition for funding or human capital.

Tracking clean energy progress Tracking clean energy innovation progress 75
© OECD/IEA, 2017.
Co-funded grants
Funding for private research projects is contingent on use of own funds by the company, ranging from 5% to over 50% of costs.
Compared with 100% grants, co-funding reduces the risk of “crowding out” and uses public funds more efficiently.
Advanced Research Projects Agency-Energy (ARPA-E).
Horizon 2020 Secure, Clean and Efficient Energy.
Brazilian Development Bank Fundo Tecnológico (Technological Fund) (BNDES Funtec)
Canada’s Energy Innovation Program (EIP).
In most cases, the government funder does not retain any rights to the underlying intellectual property generated and benefits only indirectly from the returns.
VC and seed funding
Capital, usually equity, is provided to new, small enterprises in the expectation that they can be sold for a substantial profit several years later.
Government VC funds create a market for risky, commercially oriented innovation and can give a social direction to capital market-based technology selection.
Small Business Innovation Research (SBIR) in United States.
Sitra in Finland.
United Kingdom Innovation Investment Fund (UKIIF).
Japan New Energy Venture Technology Innovation Project.
The short-term incentive structure of the VC manager, usually with a non-technical background, may be in conflict with broader social goals.
Prizes Funding awarded to winners of competitions to meet a specific technology performance target or outperform rivals.
Use the prize money (or other reward) to stimulate innovation and help policy makers of technology status at reduced public cost.
Sunshot Prize.
Horizon Prizes for PV, low-carbon hospitals and CO2 reuse.
EcoCAR.
Loans and loan guarantees
Public loans can bridge funding gaps for companies on the verge of profitability, enabling them to construct demonstration plants or first-of-a-kind facilities.
Public lenders can be more tolerant of risk in the pursuit of public goods, lending at lower than market rates.
US loan (e.g. to Tesla).
Loans to Renault and PSA Groupe for research into EVs (EUR 3bn).
Can be politically sensitive to failure and non-repayment. Only suitable for technologies that are already proven to be very close to market.
The portfolio of public RD&D investment can also include, for example, venture capital and seed funding, which are not solely the territory of private finance. Finland’s Sitra directs investment to over 40 funds that support start-ups solving ecological, social and well-being

76 Tracking clean energy progress Tracking clean energy innovation progress
© OECD/IEA, 2017.
challenges. While it is financed from the yield on its investments, its mission to help bridge the gap between R&D and deployment for clean technologies is enshrined in legislation.
The UKIIF has invested 150 million pounds (GBP) of public venture funds and GBP 180 million of private funds in different phases of innovation and prioritises clean energy. In the United States, SBIR provides seed funding to small innovative businesses, and a portion of its funding is awarded by the government’s Office of Energy Efficiency & Renewable Energy. In many countries, governments are active in public–private partnerships, loan guarantees, incubators and business networks that facilitate early-stage investment in clean energy entrepreneurship.
The appropriate combination of policy instruments and funding sources differs for different technologies and industrial partners (Box 2.3). Direct support for RD&D (e.g. grants, loans, tax credits) and non-RD&D support for business innovation (e.g. support for venture capital and assistance for starting up entrepreneurial activities) need to be balanced with targeted policies that foster demand and markets for clean energy (e.g. pricing mechanisms, public procurement, minimum energy performance standards, energy efficiency labels and mandatory targets). Any of these policies implemented alone would be less effective and more expensive.
Box 2.3. Different types of technologies have different funding needs
When the type of support and investment needed for RD&D are being considered, the characteristics of a technology are important. For example, empirical experience indicates that clean energy technologies with low unit costs of demonstration require a lower share of their RD&D funding from public sources (Figure 2.5). Conversely, technologies that have high modularity and ease of product differentiation are able to raise finance more easily if an initial market exists, even in the “high cost gap” stage.
In some situations, clean energy technologies share characteristics with the needs of other fast-evolving sectors and can piggyback on RD&D by a wider range of innovators, allowing investors from one sector to bear less of the total risk and financial burden. For example, a huge drive is currently under way to improve batteries for consumer electronics, transport and military purposes, and electricity storage for integrating renewables and shifting demand. These “spillovers” accelerate innovation in comparison with, say, new cement production methods.
Technologies with a high unit cost of demonstration require more capital to be put at risk in an early stage of the innovation chain. CCS, nuclear and integrated smart city solutions fall into this category due to their costs, situational specificity and value chain complexity. For nuclear innovation, the timescale of the development cycle is long due to the need to develop new qualification programmes and regulatory frameworks, which requires appropriate financial conditions. In the case of CCS, demonstration projects can cost around USD 1 billion, take five years or more from investment decision to gaining results, and currently have a market value of around one-tenth of their costs.
10 The regulatory
changes that would make the demonstration risks attractive to the private sector alone are generally politically unpalatable, and governments accept a strategic role in a significant proportion of the costs, while providing signals that markets for these technologies will be supported in the future. In contrast, other technologies, such as software for energy demand management, have a very different risk profile at the prototype and demo stage.
10. Based on expected CO2 prices for tradeable certificates or enhanced oil recovery (EOR) in the medium term.

Tracking clean energy progress Tracking clean energy innovation progress 77
© OECD/IEA, 2017.
2.5. Figure: Technology characteristics influence relative needs for
public innovation support
Note: HVAC = heating, ventilation and air conditioning.
Key point: Different types of low-carbon technologies require different levels and kinds ofpublic support.
Modular clean energy technologies that can be mass-produced include solar PV, LEDs, batteries, passenger vehicles and efficient appliances. In this way, substantial manufacturing experience can be generated for each doubling of industrial output. Such technologies can generally support a greater variety of competing manufacturers for a given production capacity and lend themselves to standardisation and more rapid cost reduction through learning-by-doing and scale economies. Private risk capital can be raised as for other commodity products, but may depend on commodity cycles. These characteristics give governments a role in early stage research; “market pull” policies, such as performance standards or consumer subsidies; and countercyclical support.
Some innovations allow different consumer segments to be offered differentiated products. For these technologies, governments can have a smaller role in creating initial “niche” markets for products. For example, high-performance EVs are affordable to wealthy early-adopter consumers to whom they provide status and pleasure. In the earliest stages of deployment, this differentiated consumer market partly reduces the total cost of subsidising purchases and can favour policies such as obligations on automakers to sell EVs.
78 Tracking clean energy progress Tracking clean energy innovation progress
© OECD/IEA, 2017.
Energy RD&D spending in the rest of the world Data on energy RD&D investment by countries that do not yet report activity to the IEA are challenging to collect and track. They are generally not routinely collected or published but can in some cases be extracted from national budgets or financial reports of state-owned enterprises. For example, India publishes R&D spending in ministerial budgets.
By aggregating information from Mission Innovation submissions, national budgets and reports, we estimate clean energy RD&D expenditure by non-IEA member governments
11 to
have been around USD 4.5 billion in 2015. This total includes spending by major state-owned enterprises in these countries, which is a dominant source of publicly directed clean energy RD&D in China. China alone represents three-quarters of the total, even though its total reported R&D spending by industrial energy enterprises using public funds and state-owned enterprises declined 11% since 2012 in real terms (China Statistics Press, 2016). The vast majority of this decline was related to coal, gas and oil companies and might be somewhat offset by an increase in clean energy R&D spending that is targeted by China, as it is in other Mission Innovation members. Unlike in IEA member countries, this report estimates that most public expenditure on energy RD&D in non-IEA member countries is directed to fossil fuel research, which is in accordance with the earlier result of Kempener et al. (2010).
Improvements on existing technologies are the main focus of current innovation efforts in emerging countries. That said, economic growth and capital accumulation have increased the exposure of economies in China, Southeast Asia, the Middle East and elsewhere to international technology through trade and foreign direct investment. Combined with investment in domestic skills development, this interaction with international technology and knowledge exchanges has contributed to emerging countries’ growing capacity for a broader range of innovation effort. A particular opportunity exists for new, low-cost technologies that will be appropriate for these countries’ specific circumstances and climates.
Most current collaborative activities in emerging economies focus on facilitating deployment rather than RD&D. Collaborative RD&D is often difficult, because sharing knowledge is risky, capabilities for innovation are limited in some countries, and national regulations and policies related to RD&D tend to differ. However, changes brought about by the globalisation of the economy and the pace of technology innovation have brought more co-operation in what is known as “open innovation” (IEA, 2015).
The IEA has a long history of facilitating international RD&D co-operation, and countries from around the world, including emerging and developing countries, are members of various IEA Technology Collaboration Programmes (TCPs). TCPs and other bilateral initiatives have encouraged joint calls for R&D and innovation projects using pooled resources from two or more governments. Joint calls are a valuable instrument for directing research towards appropriate technologies and building on knowledge in OECD and non-OECD countries.
Corporate energy RD&D spending Existing data sources for corporate spending on energy RD&D, especially for efforts directed toward clean energy, are limited. This special feature lays out what is currently available and highlights key trends, all with an understanding that a significant opportunity exists for further improvement of data collection into the future to benefit decision making by government policy makers, companies, and other stakeholders. This knowledge gap is one that the IEA aims to work with business stakeholders to help fill.
11. Includes: Brazil, China, India, Indonesia, Mexico, Russia, Saudi Arabia, South Africa, United Arab Emirates.

Tracking clean energy progress Tracking clean energy innovation progress 79
Reported R&D spending by listed and other energy companies12
worldwide declined by 2% per year in 2015 and again in 2016 (according to initial results), reversing a growth trend over the preceding years (Figure 2.6). However, much of this decline can be attributed to the drop in revenue of oil and gas companies rather than an industry-wide trend or an indication of lower R&D investment. While firms generally smooth their R&D spending over time, if possible, to retain key skills, this shows that R&D can be vulnerable to sharp changes in the total capital budgets of companies, especially in markets with volatile prices.
Figure 2.6. Reported R&D spending by energy companies according to
sectoral classification
Notes: 2016 data are provisional, based on reporting by end April 2017. The reported data is in 2016 USD. Data from 2016 are
estimates and are likely to be refined over the course of 2017. Classifications are based on BICS sectors and associated shares of
revenue for all companies active in these sectors. This approach likely misallocates some clean energy R&D spending to thermal power
OEMs and utilities. It omits companies domiciled in countries that do not require disclosure of R&D spending, but where clean energy
R&D is likely lower.
Source: Bloomberg (2016). Bloomberg Terminal.
Key point Clean energy spending remains a small but important – and growing – share of all corporate R&D spending.
R&D expenditure by companies categorised as clean energy (or with reported revenue in clean energy categories) increased from USD 3.9 billion to USD 5.4 billion between 2012 and 2016. The share of clean energy in corporate energy R&D spending increased from 10% to 14% over this period, in large part due to the decline in oil and gas R&D expenditure.
Among energy companies, differences exist between sectors. Oil and gas companies and electric utilities, on average, both spend around 0.25% of their revenue on R&D each year, whereas thermal power OEMs and clean energy companies spend around 2.5% of their
12. Energy companies have been isolated according to BICS. Data limitations mean that energy efficiency R&D is underrepresented,
because it is undertaken primarily by companies active in non-energy sectors, with attempts at fuller inclusivity have been made by
allocating a percentage of such firms’ R&D to energy topics according to the share of revenue from these activities. With the exception of
firms assigned to alternative vehicle drivetrains and LEDs, R&D spending is extracted from the filed accounts of companies, for example,
SEC 10-K filings in the United States. The cross-cutting nature of R&D activities by some companies means that some spending is not
captured by this method.
© OECD/IEA, 2017.
0
15
30
45
2012 2013 2014 2015 2016
USD
(201
6) b
illio
n
All energy
Oil & gas Coal Thermal power
Networks, utilities Clean energy
0
2
4
6
2012 2013 2014 2015 2016
Clean energy only
Solar Wind
Other and mixed renewables Fuel cells, storage, smart grid
80 Tracking clean energy progress Tracking clean energy innovation progress
© OECD/IEA, 2017.
revenue on R&D. This is reflective of the demands for innovation in the competitive markets for equipment and the less mature status of clean energy compared with oil and gas and coal mining.
Compared with sectors such as pharmaceuticals, consumer goods and automobile manufacturing, most energy company business models are not R&D-intensive. The number of energy firms in the top 1 400 R&D spenders has decreased since 2010, from 63 to 42 (EC, 2016). Automobile companies, whose in-house research makes up much of the world’s work on efficient vehicle technologies, spend, on average, 3.2% of their sales revenue on R&D to stay competitive in a consumer-focused market. For some carmakers, such as Volkswagen, this percentage is as high as 7%. Revenue in this sector is large – if only half of that in oil and gas – so the absolute spending of all listed automobile companies was five times higher than that of oil and gas firms in 2015.
In 2015, members of the Breakthrough Energy Coalition13
set the goal to raise their investments in clean energy R&D, including to make increased private sector investment that is more patient and risk-tolerant. Other industrial players have also recognised the need to accelerate clean energy R&D. Yet, while general trends may be discerned in corporate R&D spending, the available data are currently insufficient to reliably inform policy making.
The four main reasons a robust aggregation of private RD&D spending is currently not feasible using publicly available data are as follows:
14
Not all energy businesses submit annual financial reports that declare R&D spending; for
example, start-ups and unlisted companies15 do not publish such reports.
Not all energy R&D spending is undertaken by energy businesses; for example, much of the
research into energy efficiency is in the construction, manufacturing, automotive,
information technology (IT) and consumer goods sectors.
Companies that report R&D spending are often active in multiple sectors but report one
corporate aggregate figure; for example, such companies include those that produce
electricity-generating equipment and are also major players in health care development.
Within the energy domain, corporate R&D spending is generally reported at a level that does
not allow expenditure on different energy technologies to be disentangled. Definitions of
what constitutes R&D expenditure can vary between companies and sectors, including
whether or not the whole or incremental costs of an innovative demonstration project are
reported.
Some governments overcome these challenges by undertaking surveys to learn about R&D spending in industry and include survey questions on energy, often within ongoing statistical business surveys. In the United States, for example, the Business R&D Survey has been carried out each year since 2008,
16 and companies are obliged to report their expenditure
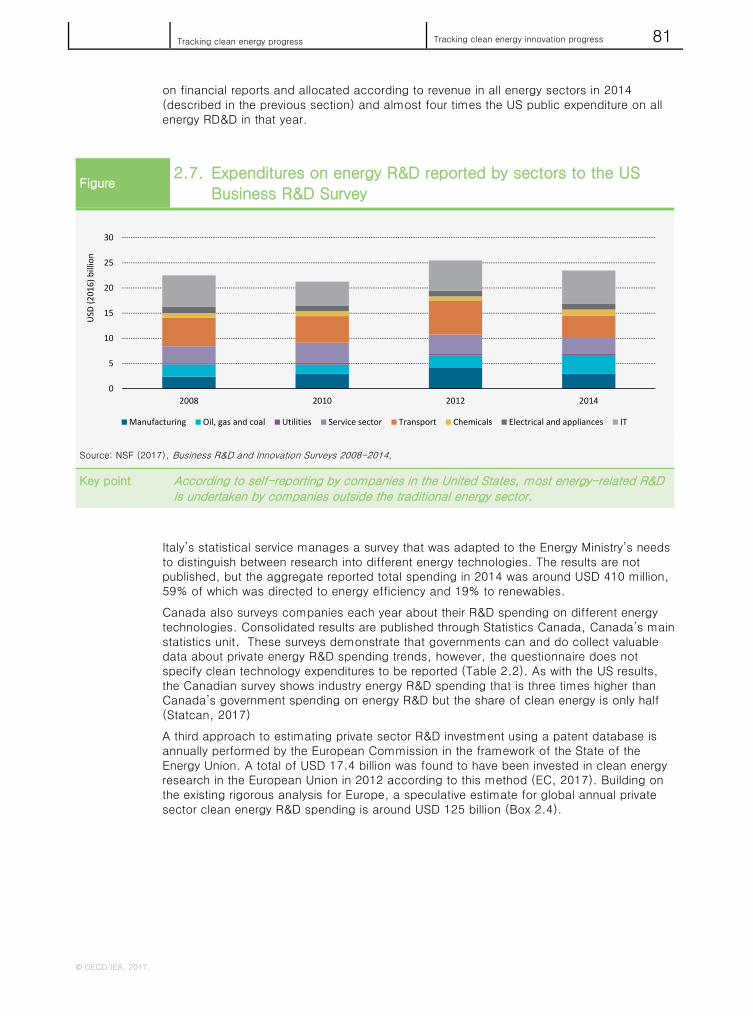
on energy technologies. The results show that the diversity of sectors that report energy R&D is much broader than traditional energy companies (Figure 2.7). In fact, most reported spending is by non-energy companies, proving the vital importance of looking beyond the energy sector for energy innovation. For comparison, the USD 23 billion reported in this survey is double the energy R&D spending by US companies that we have estimated based
13. The Breakthrough Energy Coalition is a partnership of large group of individuals and institutions committed to investing in new energy
technologies emerging out of government research institutions to provide reliable, affordable power with zero emissions.
14. Each of these reasons indicates that our estimate of USD 5.4 billion for spending on clean energy R&D by private companies is an
underestimation. In addition to not covering relevant R&D in certain companies or sectors, it is likely that some smart grids R&D is
included within the “networks” category and some power generation efficiency R&D is included within the “thermal power” category.
15. Much of the research by large corporations is directed towards incremental and sustaining innovations that support the existing
business interests of the firms. Smaller firms are more likely to pursue more novel, riskier technology options, partly because their
prospects to enter the market depend on being able to differentiate themselves from incumbent companies.
16. As the successor of the Survey of Industrial R&D (SIRD), begun in 1953.
Tracking clean energy progress Tracking clean energy innovation progress 81
© OECD/IEA, 2017.
on financial reports and allocated according to revenue in all energy sectors in 2014 (described in the previous section) and almost four times the US public expenditure on all energy RD&D in that year.
Figure 2.7. Expenditures on energy R&D reported by sectors to the US
Business R&D Survey
Source: NSF (2017), Business R&D and Innovation Surveys 2008-2014,
Key point According to self-reporting by companies in the United States, most energy-related R&D is undertaken by companies outside the traditional energy sector.
Italy’s statistical service manages a survey that was adapted to the Energy Ministry’s needs to distinguish between research into different energy technologies. The results are not published, but the aggregate reported total spending in 2014 was around USD 410 million, 59% of which was directed to energy efficiency and 19% to renewables.
Canada also surveys companies each year about their R&D spending on different energy technologies. Consolidated results are published through Statistics Canada, Canada’s main statistics unit. These surveys demonstrate that governments can and do collect valuable data about private energy R&D spending trends, however, the questionnaire does not specify clean technology expenditures to be reported (Table 2.2). As with the US results, the Canadian survey shows industry energy R&D spending that is three times higher than Canada’s government spending on energy R&D but the share of clean energy is only half (Statcan, 2017)
A third approach to estimating private sector R&D investment using a patent database is annually performed by the European Commission in the framework of the State of the Energy Union. A total of USD 17.4 billion was found to have been invested in clean energy research in the European Union in 2012 according to this method (EC, 2017). Building on the existing rigorous analysis for Europe, a speculative estimate for global annual private sector clean energy R&D spending is around USD 125 billion (Box 2.4).
0
5
10
15
20
25
30
2008 2010 2012 2014
USD
(201
6) b
illio
n
Manufacturing Oil, gas and coal Utilities Service sector Transport Chemicals Electrical and appliances IT
82 Tracking clean energy progress Tracking clean energy innovation progress
© OECD/IEA, 2017.
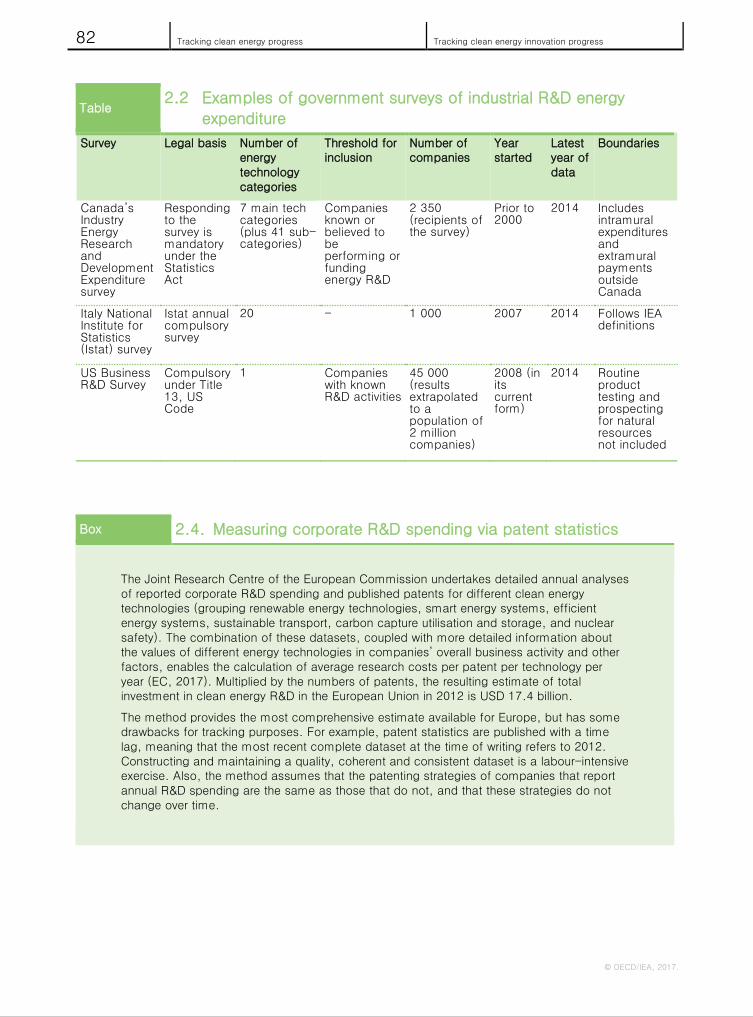
Table 2.2 Examples of government surveys of industrial R&D energy
expenditure
Survey Legal basis Number of energy technology categories
Threshold for inclusion
Number of companies
Year started
Latest year of data
Boundaries
Canada’s Industry Energy Research and Development Expenditure survey
Responding to the survey is mandatory under the Statistics Act
7 main tech categories (plus 41 sub-categories)
Companies known or believed to be performing or funding energy R&D
2 350 (recipients of the survey)
Prior to 2000
2014 Includes intramural expenditures and extramural payments outside Canada
Italy National Institute for Statistics (Istat) survey
Istat annual compulsory survey
20 - 1 000 2007 2014 Follows IEA definitions
US Business R&D Survey
Compulsory under Title 13, US Code
1 Companies with known R&D activities
45 000 (results extrapolated to a population of 2 million companies)
2008 (in its current form)
2014 Routine product testing and prospecting for natural resources not included
Box 2.4. Measuring corporate R&D spending via patent statistics
The Joint Research Centre of the European Commission undertakes detailed annual analyses of reported corporate R&D spending and published patents for different clean energy technologies (grouping renewable energy technologies, smart energy systems, efficient energy systems, sustainable transport, carbon capture utilisation and storage, and nuclear safety). The combination of these datasets, coupled with more detailed information about the values of different energy technologies in companies’ overall business activity and other factors, enables the calculation of average research costs per patent per technology per year (EC, 2017). Multiplied by the numbers of patents, the resulting estimate of total investment in clean energy R&D in the European Union in 2012 is USD 17.4 billion.
The method provides the most comprehensive estimate available for Europe, but has some drawbacks for tracking purposes. For example, patent statistics are published with a time lag, meaning that the most recent complete dataset at the time of writing refers to 2012. Constructing and maintaining a quality, coherent and consistent dataset is a labour-intensive exercise. Also, the method assumes that the patenting strategies of companies that report annual R&D spending are the same as those that do not, and that these strategies do not change over time.
Tracking clean energy progress Tracking clean energy innovation progress 83
© OECD/IEA, 2017.
The source of financing used by a company for R&D can affect its cost. Many large corporations fund R&D activities from their balance sheets, giving them a relatively low cost of capital compared with smaller companies that are more reliant on bank lending. As bank lending tends to be more risk-averse, a high share of third-party financing can be associated with less radical and more incremental innovation, especially during macroeconomic uncertainty (Nanda and Nicholas, 2014).
Over the past decade, the amount of bank financing for corporate research by larger companies has increased, in some cases because it is a cheaper source of capital than retained earnings, with around 40% of firms registering patents in the US having pledged patents as collateral for debt (Mann, 2016). This is an area where public policy may have a role to play in ensuring that financing costs are aligned with long-term objectives.
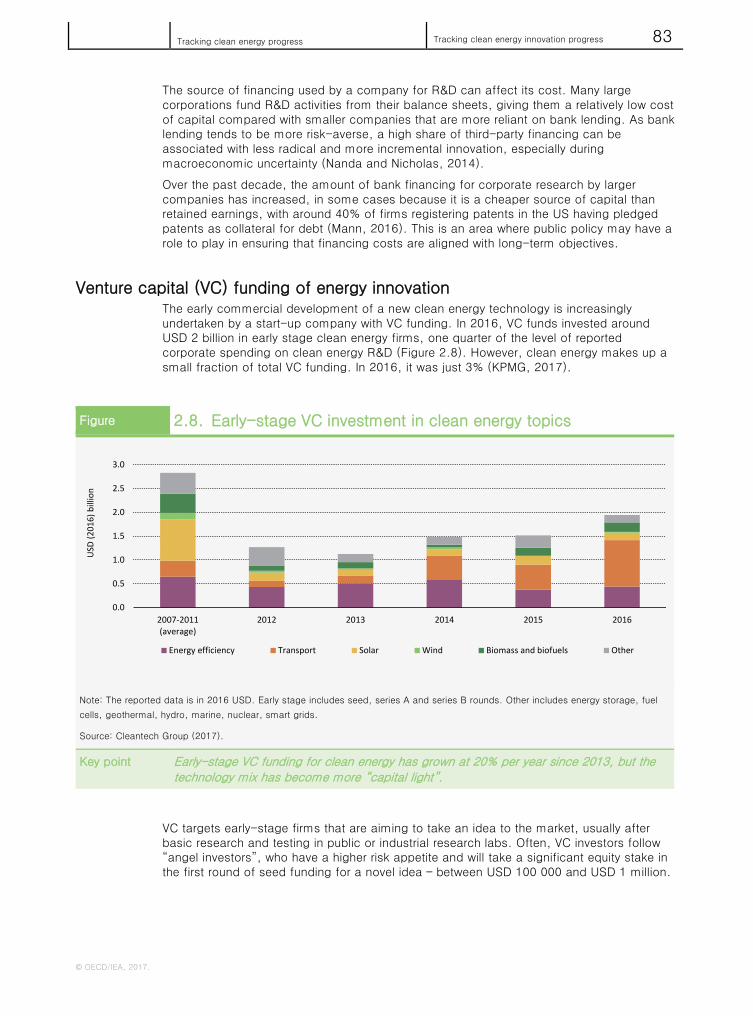
Venture capital (VC) funding of energy innovation The early commercial development of a new clean energy technology is increasingly undertaken by a start-up company with VC funding. In 2016, VC funds invested around USD 2 billion in early stage clean energy firms, one quarter of the level of reported corporate spending on clean energy R&D (Figure 2.8). However, clean energy makes up a small fraction of total VC funding. In 2016, it was just 3% (KPMG, 2017).
Figure 2.8. Early-stage VC investment in clean energy topics
Note: The reported data is in 2016 USD. Early stage includes seed, series A and series B rounds. Other includes energy storage, fuel
cells, geothermal, hydro, marine, nuclear, smart grids.
Source: Cleantech Group (2017).
Key point Early-stage VC funding for clean energy has grown at 20% per year since 2013, but thetechnology mix has become more “capital light”.
VC targets early-stage firms that are aiming to take an idea to the market, usually after basic research and testing in public or industrial research labs. Often, VC investors follow “angel investors”, who have a higher risk appetite and will take a significant equity stake in the first round of seed funding for a novel idea – between USD 100 000 and USD 1 million.
0.0
0.5
1.0
1.5
2.0
2.5
3.0
2007-2011(average)
2012 2013 2014 2015 2016
USD
(201
6) b
illio
n
Energy efficiency Transport Solar Wind Biomass and biofuels Other

84 Tracking clean energy progress Tracking clean energy innovation progress
© OECD/IEA, 2017.
Both angel and VC investors seek to sell their shares for large profits within a time frame of around five to seven years.
17 Compared with bank finance, VC monitoring improves
governance for small businesses and can increase the rate of radical innovation due to a tolerance of failure in the expectation of a few major successes.
While governments signal the importance of clean energy innovation and in some cases specifically support VC activity, the two are often not well matched. The time frame to learn about the viability of energy projects can be too long, the capital requirements for technology demonstration too high, and the consumer value too low. Such technologies may get attention when financial markets are hot, but not when they are more risk-averse. In 2012, the first wave of cleantech VC crashed as investors learned that the VC model was ill-suited to asset-intensive RD&D, such as solar and bioenergy.
The role of VC in the energy sector has been reinvigorated since 2013 but is not yet at pre-2012 levels. This has been led by the rise of digital technologies in all parts of the value chain, in particular in consumer-facing segments. Technologies such as cloud computing, computer simulation, rapid prototyping and object-oriented programming have lowered the costs of learning about viability in a technology’s early stages. Excluding mobility services, clean transport technologies accounted for over half of all clean energy VC activity in 2016, reflecting the growth of software and automation start-ups for driving applications. This has changed the technology mix of clean energy VC activity.
Another factor in rising clean energy VC activity is an increase in corporate VC involvement (Figure 2.9). By nurturing promising start-ups outside the confines of company management and payrolls, venture investing can increase the flexibility and option value of corporate innovation. Corporate VC funding appears set to increase further for clean energy. However, unless that capital is successfully directed to innovations in infrastructure and hardware as well as software, the need for government funding and corporate labs in the energy transition will not diminish.
Figure 2.9. Corporate involvement in early-stage VC transactions
Note: Early stage includes seed, series A and series B rounds.
Source: Cleantech Group (2017). i3 database.
Key point Since 2014, corporate involvement in early-stage clean energy VC has grown fromone-third to almost half of all transactions, reflecting a shift in corporate RD&D strategies.
17. While venture-funded start-ups can be innovative, Bernstein (2015) found that the level of innovation spending tends to fall after
successful public offerings of start-ups on a securities exchange.
0%
25%
50%
75%
100%
2007-2011(average)
2012 2013 2014 2015 2016
Shar
e of
dea
l val
ue (U
SD 2
016)
Corporate only At least one corporate investor Other
Tracking clean energy progress Tracking clean energy innovation progress 85
© OECD/IEA, 2017.
Recommendations
Assessing current levels of energy RD&D investment is not straightforward, and further improvements are advisable and possible. Furthermore, no perfect formula exists for how governments should spend their RD&D budgets.
18 With that said, the following
recommendations can assist countries, companies and stakeholders to better take advantage of clean energy innovation opportunities.
Collect better data on public and private RD&D investment
Better understanding of the status and breakdown of public and private investments for
RD&D will enable policy makers to better identify gaps and to enhance efficiency of public
finance allocation. Sufficient detail about how budgets are allocated to different technology
areas is required, i.e. at the level of the specific type of solar cell rather than PV in general.
All the public investments in RD&D should be captured separately, including grants, tax
breaks, state-owned enterprise spending, and loans or equity for start-ups. The IEA survey
for RD&D spending by its member countries provides a robust and tested methodology for
collecting and reporting data at a variety of different technology levels and, importantly,
provides like-for-like comparability.
Governments should consider using surveys to collect better data on private sector energy
R&D spending. Such data collection should use technology categories that are consistent
with those used for reporting public spending data and that capture vital energy efficiency
technology progress outside traditional energy sector companies. The national surveys of
private sector energy R&D activity established by Canada, Italy and the United States
provide examples of good practice but also show opportunities for greater harmonisation,
notably through increased commonality between public and private sector reporting.
The IEA would be interested in further enhancing its capabilities to serve as a central hub of
energy R&D data from both governments – including current IEA members, partners, and
other key countries – and the private sector.
Develop and track key performance indicators for priority technologies
Measurement of progress in clean energy innovation needs to go beyond the flow of money
and should aim to ask a set of core questions about individual technologies.19
Accelerating
energy transitions depend on the outcomes of the funded innovation programmes. Up-to-
date information on performance and economic characteristics for energy technologies is
needed to inform and adjust strategies for innovation prioritisation and market support.
18. Indeed, few methods are available for assessing the impacts of RD&D spending; the timing of results can be hard to predict, and
projects can generate valuable spillover effects in other technologies or sectors that are hard to quantify (Jaffe, 2002). For example,
among the objectives of the European Commission’s Horizon 2020 research and innovation programme are economic growth, job
creation, researcher mobility and supporting the external policies of the European Union.
19. The following questions of individual technologies are of high relevance: How is performance improving at the cutting edge of the
technology, and how is it measured? What are the relative costs and benefits of commercially available versions of the technology? How
smooth and rapid is the journey from lab to market for this type of technology? Are research priorities easily adjusted according to new
information? Do the sources of finance match the technologies’ RDD&D needs? Are the most appropriate versions of the technology
being developed for the regions of the world where they will be most needed over the 2DS time frame?
86 Tracking clean energy progress Tracking clean energy innovation progress
© OECD/IEA, 2017.
Performance indicators should be internationally comparable and available at the highest
level of detail that avoids compromising competitive advantage. In many cases, defining
these indicators will require the development of impartial and broadly agreed standards for
defining and testing the performance of low-carbon technologies. Performance and cost
metrics could be complemented by target-setting exercises, such as the development of
Technology Roadmaps that establish milestones and responsibilities.20
Performance
indicators need to take into account the cost and performance needs of low-income level
consumers, where significant potential for achieving the 2DS has been identified.
As an example, the European Commission’s Strategic Energy Technologies Information
System (SETIS) was established to monitor the development of innovative energy
technologies and system solutions. A mechanism is currently being established that will
assign a set of Key Performance Indicators (KPIs) for priority technology areas (EC, 2016).
Performance will be reported annually against these KPIs, which include current and future
market penetration, techno-economic performance, and prices.
Increase the level of collaboration and exchange on innovation policy
A wide variety of models of innovation collaboration exist around the world, among both
governments and public–private partnerships. Governments and companies currently work
together on projects that range from sharing information on technology deployment
(e.g. EVs, PV and heat pumps) to undertaking joint research into technologies of common
interest (e.g. IEA TCPs, US–China Clean Energy Collaboration).
Best practice in alignment and facilitation of different stages of innovation is not widely
disseminated. Greater international exchange of knowledge is needed on how to identify
priority technologies, how to match the sources of R&D financing with innovation needs and
how to assess R&D outcomes.21
Several frameworks for intergovernmental collaboration on clean energy could be leveraged
for this purpose. Mission Innovation (Box 2.5) and the IEA Technology Network are pertinent
examples.
20. For nearly a decade, IEA Technology Roadmaps have helped set the global agenda for clean energy technology development and
deployment. The programme has been a considerable success and has provided recognised guidance to the public and private sectors, in
part due to its collaborative nature, authoritative guidance on the priorities and steps needed to accelerate technology innovation and
deployment, and emphasis on broad stakeholder engagement and consensus. The roadmaps each contain recommended actions,
including RD&D priorities and targets, showing policy makers, investors and entrepreneurs, who are navigating an increasingly diverse and
regionally specific energy landscape, how they can jointly act to transform the global energy system.
21. Priority action should close research gaps and avoid duplication of effort worldwide. There is value in sharing experiences with how to
allocate resources between necessary incremental improvements and radical technologies that could dramatically reduce the reliance on
known but highly uncertain solutions. In addition, cross-fertilisation with basic research advances in other fields, such as advanced
materials and biotechnology, is dependent on innovation policy strategy.

Tracking clean energy progress Tracking clean energy innovation progress 87
© OECD/IEA, 2017.
Box 2.5. Mission Innovation: An innovation initiative for accelerating the
energy transition
Mission Innovation is a landmark intergovernmental initiative launched in December 2015. It groups together 22 countries and the European Commission to mobilise support for clean energy technologies, in part through doubling clean energy R&D over five years.
Seven Innovation Challenges have been launched with the aim of catalysing global research efforts to meet Mission Innovation goals of reducing GHG emissions, increasing energy security and creating new opportunities for clean economic growth:
Smart Grids
Off-Grid Access to Electricity
Carbon Capture
Sustainable Biofuels
Converting Sunlight
Clean Energy Materials
Affordable Heating and Cooling of Buildings.
Work programmes for the Innovation Challenges are in preparation in the first half of 2017. Increased engagement from the global research community, industry and investors is being encouraged, alongside collaborations between Mission Innovation members on these topics. Participants undertake working closely with private sector leaders, including through collaboration with the Breakthrough Energy Coalition – a partnership of 28 investors from ten countries committed to investing in new energy technologies that emerge from government-funded research in Mission Innovation countries.
The countries that make up Mission Innovation have reported approximately USD 15 billion per year of total investment in clean energy R&D today. Because Mission Innovation is a voluntary initiative, the methodologies behind countries’ investment estimates are not formally co-ordinated, and countries can choose what technologies they include as “clean” energy. For example, only 9 of the 22 countries include nuclear energy, while 12 include cleaner fossil energy. Renewables and energy storage are the only technology areas included by all countries.
Enhance regular tracking of innovation progress by public and private sectors
While deployment of clean energy technology is increasingly well disseminated, information
sharing about technology progress at the innovation frontier is lagging behind. This failure is
due to the paucity of available data and legitimate confidentiality concerns.
Communication of progress in technology innovation can not only stimulate further
discussion among experts, but can also unlock additional investment opportunities. One
effective mechanism for communicating progress is to regularly highlight breakthroughs that
have resulted through research programmes and create a buzz about what the novel
technology, or combination of technologies, might deliver in terms of costs and benefits if
momentum is maintained.
88 Tracking clean energy progress Tracking clean energy innovation progress
© OECD/IEA, 2017.
The tables that follow this special feature provide an overview of how progress could be
reported for key technologies identified in TCEP 2017.
Conduct clean energy RD&D investment in concert with the other key elements of the innovation ecosystem
Effective RD&D investment is one element in a coherent system of innovation that includes
early-stage niche markets, often supported by policies, and the broader competitive
landscape. Effective priority setting and investment should take account of short-term and
long-term perspectives and all relevant levels of activity: international, national, municipal,
company and entrepreneur. In the international environment, initiatives such as Mission
Innovation can benefit from linkages with the Breakthrough Energy Coalition and the Clean
Energy Ministerial to cover the value chain from research to venture funding and deployment.
Misalignments in the wider innovation system present barriers to effective RD&D and
deployment.22
Countries can and should explore whether different elements of their
innovation ecosystems are working harmoniously and in accord with their national strengths
and opportunities.
A government’s overall policy package should support knowledge development, feedback
processes, entrepreneurship, market formation, education, industrial support and mitigation
of resistance to change at all stages of the innovation pathway. It should allow
experimentation in many small units and be tolerant of failures and disruption in order to
achieve long-term success.23
Factors such as visibility of future energy market regulation
and rewards for longevity, instead of short-termism, are important to encourage private
sector innovation in clean energy
22. For example, RD&D investments in energy efficiency are sometimes made alongside subsidies to retail consumers of fossil fuels, or
RD&D investments in wind energy are encouraged despite local planning laws that prohibit the installation of wind turbines.
23. Governments can take a portfolio approach to supporting technologies that have high potential but low certainty, as well as those with
high chances of success but lower performance. A portfolio approach recognises that not all ventures and projects will succeed, just as
venture capitalists anticipate a success rate of under 40% but target a small number of highly beneficial breakthroughs.

Tra
ckin
g c
lean e
nerg
y pro
gre
ss
Tra
ckin
g c
lean e
nerg
y innova
tion p
rogre
ss
89
© O
EC
D/IE
A, 2
017.
Table
2.3
Tra
ckin
g te
chnolo
gy R
&D
challe
nges to
achie
ve th
e
susta
inable
energ
y transitio
n
Key RD&D challenges How critical is it
to the 2DS?
Why is this RD&D challenge critical? Key RD&D focus areas over the next 5 years Pow
er genera
tion
Solar PV Reducing balance-of-
system costs
Reducing plant-level
integration costs
Increasing efficiencies
beyond 24% PERC
Non-PV panel cost reductions needed to reduce system
costs (Si-based panels now constitute less than 30% of the
system cost)
Plants will have to increasingly contribute to their own
integration costs with solar PV penetration increase
Having crossed the 1 USD/W threshold for module
manufacturing, high conversion efficiencies will be the
largest contributor to future PV cost reductions
Development of high efficiency conversion materials to
reduce balance-of-systems costs
Reduce costs and increase functionality of inverters;
develop interoperable digital and electrical interfaces;
remote digital monitoring and maintenance;
Develop new materials for PV panels (e.g. alternative
technologies beyond c-Si)
Wind Power Improve resource
assessment and spatial
planning
Reducing plant-level
integration costs and
Wind farm planning, both onshore and offshore, will require
enhanced sensitivity assessment of the surrounding
environment to ensure long term turbine efficiency and
attractive return on investment
Wind farms need to ensure their value to the system is
maintained with the high penetration levels in the 2DS
Improve the accuracy of offshore pre-construction planning
to accommodate seasonal and yearly variations changes
in the wind resource; refinement and validation of model
outputs against measured data;
Enhance short-term forecasts to facilitate the integration of
higher volumes. Innovate big-data analytics from plant-
level measurements
Hydropower Improved spatial planning
and environmental
assessments
Enhance flexibility of
hydropower
Hydropower sees a two-fold growth in the 2DS, but its
potential is highly constrained by geography and robust
planning
In the 2DS, hydropower will be increasingly called upon to
provide flexibility to accommodate changes in both supply
and demand
Designing, testing, and validating new ways to improve
sustainability and reduce the environmental effects of
hydropower generation on fish populations and ecosystems
Quantify the value of services that support the resilience of
the electric grid
Gas-fired power Flexible operation of gas
power plants
Use of next generation fuel
cells (e.g. hydrogen)
Cost-competitive hydrogen
turbines
Existing gas power capacity is not optimised for the flexibility
requirements of systems with higher shares of variable
renewables
Fuel cells produced from excess power during periods of
abundant renewables generation could play a key role in
power systems
Potential for hydrogen use at a larger scale, including
injection of power in the electricity grid from long-term
hydrogen storage
Explore technical options for retrofitting gas fired power
plants and assess their economics against other flexibility
options
Increase activity and utilisation, or fully avoid the use of
platinum; direct R&D to increase durability and reduce
degradation of fuel cell mechanisms
Explore technologies that provide enhanced material
capabilities, reduced air cooling and leakage, and higher
pressure ratios than conventional turbines
Coal-fired
power
Increasing combustion
temperature and efficiencies
Operation under low load
High efficiency low emissions coal power is a requirement for
new coal power plants
Coal power suffers an efficiency penalty when ramping
frequently, which is exacerbated with the power mixes in the
2DS
Explore technical options for retrofitting coal fired power
plants and assess their economics against other flexibility
options
Nuclear power Cost-effective life extensions
beyond 50-60 years
Small-scale, modular
reactors
Nuclear combined heat-and-
power
Required rates for nuclear plant construction could be
reduced by life extensions of existing plants
Small modular reactors open up possibilities for small scale
nuclear power in new countries and niche markets
Nuclear energy is also a low-carbon source for heat and can
play a relevant role in decarbonising other parts of the energy
system
Explore new materials and retrofitting technologies for life
extensions
Develop improved materials and fuels for advanced SMR
designs; direct R&D towards manufacturing processes to
compete with economies of scale in large-scale reactors
Explore extraction technologies and processes for district
heating of buildings, seawater desalination, industrial
production processes and fuel synthesis

90
Tra
ckin
g c
lean e
nerg
y pro
gre
ss
Tra
ckin
g c
lean e
nerg
y innova
tion p
rogre
ss ©
OEC
D/IE
A, 2
017.
Key RD&D challenges How critical is
it to the 2DS?
Why is this RD&D challenge critical? Key RD&D focus areas over the next 5 years In
dustry
Chemicals
and Petro-
chemicals
Naphtha catalytic cracking
Use of biomass-based feedstocks
Electricity-based hydrogen for
ammonia & methanol
This technology shows energy savings compared with the widely used steam
cracking process
CO2 emissions associated with feedstocks for chemical production can be
avoided using biomass to produce light olefins, methanol and ammonia
Ammonia and methanol production through renewable electricity-based
processes removes all direct carbon emissions.
Explore avenues for further commercial deployment and
increasing throughput
Promote further research to reduce energy consumption and
costs in current biomass-based chemical production
Further research to bring down costs and increase capacity
of electrolysers
Pulp &
Paper
Black liquor gasification
Lignin extraction
Low carbon alternatives to traditional
pulping
Alternative drying and forming
processes
Gasification of black liquor could increase the flexibility of end-uses for
biomass-based by-products from the pulping process.
Lignin can be isolated as a potential feedstock for new industrial products,
such as new chemicals and plastics
Alternative processes using deep eutectic solvents could have significantly
lower carbon footprints for pulping, and could produce additional added
value for pulp producers through the sale of pure lignin as a material
Alternative drying and forming processes with lower water content could
reduce energy consumption in these two steps
Scale up development of gasification designs, including low-
temperature steam reforming process and high-temperature
entrained flow reactor
Develop lignin extraction processes that fulfill technical and
economic maturity market requirements
Conduct first feasibility studies and pilot testing of this
process will bring it closer to commercialization
Conduct additional study and testing is needed to bring these
alternative processes to the market
Iron & Steel Coke oven gas (COG) reforming
Blast furnaces with top gas recovery
Upgraded smelting reduction (SR)
and DRI
Electrolysis for iron making
Electricity-based hydrogen as
reducing agent
COG reforming partially converts carbon compounds into hydrogen and
carbon monoxide. Through integration with oxy blast furnaces, coke
consumption is considerable reduced for pig iron production and it enables
CO2 capture
Top gas reuse in oxy blast furnaces reduces coke use in pig iron making,
and can enable easier carbon capture.
Enhanced SR and DRI processes have reduced energy intensity compared to
their standard commercial process, respectively, and facilitate CO2 capture
through oxygen operation.
The wider sustainability benefits of electrolysis processes rely on the use of
renewable-based or carbon-free electricity.
Use of electrolysis-based hydrogen based on renewable electricity in iron
production would displace fossil-based reducing agents
Develop commercial scale demonstrations
Develop commercial scale demonstrations
Develop commercial scale demonstrations for upgraded SR
and promote long-trial pilot plant testing for upgraded DRI
Pilot projects are needed since the concepts have been
proven only at experimental scale.
Demonstration projects are needed to integrate this
technology in iron making processes
Aluminium Enhanced use of inert anodes
Direct carbothermic reduction of
alumina
Kaolinite reduction
Carbon anodes produce CO2 as they degrade; inert anodes would produce
pure oxygen, greatly reducing process CO2 emissions
Direct carbothermic reduction of alumina could reduce energy consumption
by 20% but has substantially lower aluminium conversion yields than
standard processes.
Kaolinite reduction could reduce on-site energy requirements by 15% and
use lower quality bauxite
Explore use of alternative materials to replace carbon-based
anodes
Research ways of enhancing aluminium conversion yield
issues to scale up this technology
Demonstrate commercial kaolinite reduction and reduce
material requirements of the process
Cement Oxy-combustion
Alternative clinkers and cement
products
Use of oxygen-enriched gas in the combustion process can increase the
concentration of CO2 in the flue gases and enable CO2 capture
Alternatives to traditional clinker and Portland cement could reduce CO2
emissions associated with calcination
Oxy-combustion both for the pre-calciner and the kiln should
be demonstrated at large scale
Further testing of new products is needed to be accepted
within regulatory frameworks and to develop experience in
their use by end users

Tra
ckin
g c
lean e
nerg
y pro
gre
ss
Tra
ckin
g c
lean e
nerg
y innova
tion p
rogre
ss
91
© O
EC
D/IE
A, 2
017.
Key RD&D challenges How critical is
it to the 2DS?
Why is this RD&D challenge critical? Key RD&D focus areas over the next 5 years Tra
nsportt
Electric
Vehicles
Develop of novel battery chemistries and scale up their mass production
Inter-
national
Shipping
Fuel
economy
of LDVs
Transport
Biofuels
Reducing costs and increasing
energy density of batteries
Improving zero emission vehicle
infrastructure
Integration of electric vehicles in
the electricity grid
Increasing ship efficiency and
integrating wind assistance
Demonstrating zero emission
technologies for shipping
Demonstrating the use of low
carbon fuels in shipping
Technologies reducing vehicle
weight, improving rolling
resistance and aerodynamics
Technologies improving the
efficiency of ICEs, hybrids
Increased production of
advanced biofuels from
sustainable waste and residue
feedstocks.
Hydrogen and synthetic fuels
from low carbon sources
Aviation Developing energy efficient
technologies
Trucks/
Heavy duty
vehicles
Demonstrating the commercial
feasibility of innovative aircraft
configurations
Improving air traffic
management technologies
Material substitution, low rolling
resistance tyres, improved
aerodynamics, more efficient
powertrains
Demonstrating electric road
systems for road freight
Demonstrate and deploy zero
emission infrastructure based
on hydrogen
Batteries are the most expensive component of EVs, improving their
energy density allows for weight reductions and range extensions,
increasing the value proposition of EVs to consumers
The availability of charging infrastructure is correlated with EV uptake
The limited capacity of the existing grid infrastructure can be one of
the first bottlenecks for widespread EV uptake
Limitations to the widespread uptake of cost effective energy efficient
technologies in shipping
Decarbonising long distance transport modes will require zero
emission technologies
Decarbonizing shipping will require the use of low carbon fuels
Technologies allowing energy demand reduction at the shaft enable a
wide range of cost reductions and favour the deployment of other
energy saving technologies
Energy efficient ICEs and hybrids provide the bulk of the short term
emission reductions from powertrains used on PLDVs and trucks
Low carbon fuels have a major importance for the decarbonisation of
long distance transport modes. Advanced biofuels are one of the key
options available for use in this sector.
Synthetic low carbon fuels are one of the options that could ensure
decarbonisation of long distance transport modes
Technologies allowing to reduce the energy demand of aircraft
account for most of the energy savings from aviation in the short term
Long term energy efficiency improvements require major aircraft
technology development, including changes in the conventional
aircraft configuration
Improved air traffic management can deliver significant fuel savings
thanks to the minimisation of flight distances
Technologies allowing to reduce the energy demand of trucks and
powertrains currently widely deployed account for most of the energy
savings in the next few years
Decarbonising long distance transport modes will require zero
emission technologies
Decarbonising long distance transport modes will require zero
emission technologies
Improve infrastructure development through scaled up deployment and best
practice business models for self-sustaining market conditions
Research and develop standards and regulations enabling widespread use
of demand side management practices
Enhance development of fuel saving technologies through learning by doing
by deployment of retrofits and improved wind assistance.
Develop the technical feasibility and cost prospects for zero emission
technologies (e.g. electrification and hydrogen) in different applications
Transform the experience with the use of low carbon fuels into the shipping
sector, develop technical specifications of low carbon fuels
Deploy adequate policy tools that give a signal to R&D actors on what
activities could best complement market deployment.
Set clear and transparent regulations (e.g.fuel economy regulations and
differentiated taxation on vehicle purchase) to drive R&D that maximises the
existing cost-efficient potential
Production scale up at commissioned commercial scale cellulosic ethanol
plants through debottlenecking, to pave the way for lower-cost replication
facilities. Ongoing technical research to widen waste and residue feedstock
base for HVO production.
Advance sustainable and cost effective production of hydrogen and
synthetic fuels from renewable electricity/biomass resources and improve
their thermodynamic efficiency
Develop energy efficient technologies (e.g. lightweight materials and
advanced engine concepts)
Demonstrate the commercial feasibility of innovative aircraft configurations,
such as hybrid wing body aircraft architectures
Demonstrate air traffic management (ATM) technologies enabling
optimised routing and the minimisation of flight distances
Deploy adequate policy tools and transparent regulation that gives a signal
to R&D actors on what priority areas could best increase efficiency in the
short-term
Demonstrate Electric Road Systems and identify optimal option between
conductive and inductive technologies for scale up.
Identify the best solution allowing the deployment of hydrogen distribution
infrastructure, taking into account for the cost of electricity and the costs of
centralised production and hydrogen distribution infrastructure
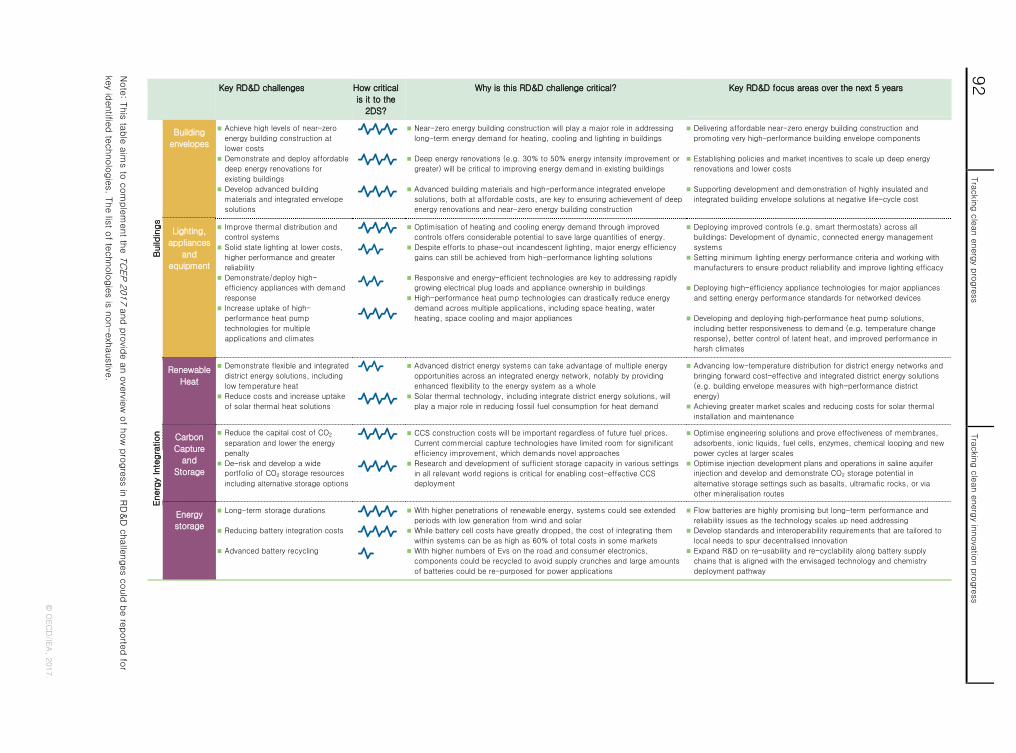
92
Tra
ckin
g c
lean e
nerg
y pro
gre
ss
Tra
ckin
g c
lean e
nerg
y innova
tion p
rogre
ss ©
OEC
D/IE
A, 2
017.
Note
: This
table
aim
s to
com
ple
ment th
e T
CEP 2
017 a
nd p
rovid
e a
n o
vervie
w o
f how
pro
gre
ss in
RD
&D
challe
nges c
ould
be re
porte
d fo
r
key id
entifie
d te
chnolo
gie
s. T
he lis
t of te
chnolo
gie
s is
non-exh
austive
.
Key RD&D challenges How critical
is it to the
2DS?
Why is this RD&D challenge critical? Key RD&D focus areas over the next 5 years
Build
ings
Building
envelopes
Achieve high levels of near-zero
energy building construction at
lower costs
Demonstrate and deploy affordable
deep energy renovations for
existing buildings
Develop advanced building
materials and integrated envelope
solutions
Near-zero energy building construction will play a major role in addressing
long-term energy demand for heating, cooling and lighting in buildings
Deep energy renovations (e.g. 30% to 50% energy intensity improvement or
greater) will be critical to improving energy demand in existing buildings
Advanced building materials and high-performance integrated envelope
solutions, both at affordable costs, are key to ensuring achievement of deep
energy renovations and near-zero energy building construction
Delivering affordable near-zero energy building construction and
promoting very high-performance building envelope components
Establishing policies and market incentives to scale up deep energy
renovations and lower costs
Supporting development and demonstration of highly insulated and
integrated building envelope solutions at negative life-cycle cost
Lighting,
appliances
and
equipment
Improve thermal distribution and
control systems
Solid state lighting at lower costs,
higher performance and greater
reliability
Demonstrate/deploy high-
efficiency appliances with demand
response
Increase uptake of high-
performance heat pump
technologies for multiple
applications and climates
Optimisation of heating and cooling energy demand through improved
controls offers considerable potential to save large quantities of energy.
Despite efforts to phase-out incandescent lighting, major energy efficiency
gains can still be achieved from high-performance lighting solutions
Responsive and energy-efficient technologies are key to addressing rapidly
growing electrical plug loads and appliance ownership in buildings
High-performance heat pump technologies can drastically reduce energy
demand across multiple applications, including space heating, water
heating, space cooling and major appliances
Deploying improved controls (e.g. smart thermostats) across all
buildings; Development of dynamic, connected energy management
systems
Setting minimum lighting energy performance criteria and working with
manufacturers to ensure product reliability and improve lighting efficacy
Deploying high-efficiency appliance technologies for major appliances
and setting energy performance standards for networked devices
Developing and deploying high‐performance heat pump solutions,
including better responsiveness to demand (e.g. temperature change
response), better control of latent heat, and improved performance in
harsh climates
Energ
y In
tegra
tion
Renewable
Heat
Demonstrate flexible and integrated
district energy solutions, including
low temperature heat
Reduce costs and increase uptake
of solar thermal heat solutions
Advanced district energy systems can take advantage of multiple energy
opportunities across an integrated energy network, notably by providing
enhanced flexibility to the energy system as a whole
Solar thermal technology, including integrate district energy solutions, will
play a major role in reducing fossil fuel consumption for heat demand
Advancing low-temperature distribution for district energy networks and
bringing forward cost-effective and integrated district energy solutions
(e.g. building envelope measures with high-performance district
energy)
Achieving greater market scales and reducing costs for solar thermal
installation and maintenance
Carbon
Capture
and
Storage
Reduce the capital cost of CO2
separation and lower the energy
penalty
De-risk and develop a wide portfolio of CO2 storage resources
including alternative storage options
CCS construction costs will be important regardless of future fuel prices.
Current commercial capture technologies have limited room for significant
efficiency improvement, which demands novel approaches
Research and development of sufficient storage capacity in various settings
in all relevant world regions is critical for enabling cost-effective CCS
deployment
Optimise engineering solutions and prove effectiveness of membranes,
adsorbents, ionic liquids, fuel cells, enzymes, chemical looping and new
power cycles at larger scales
Optimise injection development plans and operations in saline aquifer injection and develop and demonstrate CO2 storage potential in
alternative storage settings such as basalts, ultramafic rocks, or via
other mineralisation routes
Energy
storage
Long-term storage durations
Reducing battery integration costs
Advanced battery recycling
With higher penetrations of renewable energy, systems could see extended
periods with low generation from wind and solar
While battery cell costs have greatly dropped, the cost of integrating them
within systems can be as high as 60% of total costs in some markets
With higher numbers of Evs on the road and consumer electronics,
components could be recycled to avoid supply crunches and large amounts
of batteries could be re-purposed for power applications
Flow batteries are highly promising but long-term performance and
reliability issues as the technology scales up need addressing
Develop standards and interoperability requirements that are tailored to
local needs to spur decentralised innovation
Expand R&D on re-usability and re-cyclability along battery supply
chains that is aligned with the envisaged technology and chemistry
deployment pathway
Related Documents
