SLAC-PUB-15095 Track Finding Efficiency in B A B AR T. Allmendinger a , B. Bhuyan b, , D. N. Brown c , H. Choi d , S. Christ e , R. Covarelli f , M. Davier g , A. G. Denig h , M. Fritsch h , A. Hafner h , R. Kowalewski d , O. Long i , A. M. Lutz g , M. Martinelli j , D. R. Muller k , I. M. Nugent d , D. Lopes Pegna l , M. V. Purohit m , E. Prencipe h , J. M. Roney d , G. Simi n , E. P. Solodov o , A. V. Telnov l , E. Varnes l , R. Waldi e , W. F. Wang p , R. M. White m a Ohio State University, Columbus, Ohio 43210, USA b Indian Institute of Technology Guwahati, Assam, 781 039, India c Lawrence Berkeley National Laboratory and University of California, Berkeley, California 94720, USA d University of Victoria, Victoria, BC, V8W 3P6, Canada e Universit¨ at Rostock, D-18051 Rostock, Germany f INFN Sezione di Perugia, Dipartimento di Fisica, Universit` a di Perugia, I-06100 Perugia, Italy g Laboratoire de l’Acc´ el´ erateur Lin´ eaire, IN2P3/CNRS et Universit´ e Paris-Sud 11, Centre Scientifique d’Orsay, B. P. 34, F-91898 Orsay Cedex, France h Johannes Gutenberg-Universit¨ at Mainz, Institut f¨ ur Kernphysik, D-55099 Mainz, Germany i University of California at Riverside, Riverside, California 92521, USA j INFN Sezione di Bari, I-70126 Bari, Italy k SLAC National Accelerator Laboratory, Stanford, California 94309 USA l Princeton University, Princeton, New Jersey 08544, USA m University of South Carolina, Columbia, South Carolina, 29208, USA n Universit´ a di Padova, I-35131 Padova, Italy o Budker Institute of Nuclear Physics, Novosibirsk 630090, Russia p University of Notre Dame, Notre Dame, Indiana 46556, USA Abstract We describe several studies to measure the charged track reconstruction efficiency and asymmetry of the B A B AR de- tector. The first two studies measure the tracking efficiency of a charged particle using τ and initial state radiation decays. The third uses the τ decays to study the asymmetry in tracking, the fourth measures the tracking efficiency for low momentum tracks, and the last measures the reconstruction efficiency of K 0 S particles. The first section also examines the stability of the measurements vs B A B AR running periods. Keywords: B A B AR, tracking, efficiency 1. Introduction 1 The B A B AR experiment operated from 1999 to 2008 2 at the PEP-II asymmetric e + e − collider at the SLAC 3 National Accelerator Laboratory. B A B AR was designed 4 to study CP violation and other rare decays in flavor 5 physics from events produced at or near the Υ reso- 6 nances, from 9.46 GeV to over 11 GeV. A critical re- 7 quirement for meeting B A B AR’s science goals was the 8 ability to efficiently and accurately detect stable charged 9 particles, or tracks, produced in e + e − collisions. Many 10 Email address: [email protected] (B. Bhuyan) analyses performed at B A B AR require a precise estimate 11 of the track finding efficiency, as input for measuring 12 the absolute or relative rate of the physics process being 13 studied. 14 In this paper, we present the algorithms and methods 15 used in B A B AR to estimate the track finding efficiency. 16 To cover the range of particle momenta and produc- 17 tion environments relevant to most B A B AR analyses, a 18 number of methods are used. To compute the track- 19 ing efficiency from data alone, these methods rely on 20 special data samples, where additional constraints can 21 be applied. The primary efficiency result is computed 22 using e + e − → τ + τ − events, which can be cleanly iso- 23 Preprint submitted to Nuclear Instruments and Methods in Physics Research A July 13, 2012 Work supported in part by US Department of Energy under contract DE-AC02-76SF00515. Published in arXiv:1207.2849.

Welcome message from author
This document is posted to help you gain knowledge. Please leave a comment to let me know what you think about it! Share it to your friends and learn new things together.
Transcript

SLAC-PUB-15095
Track Finding Efficiency inBABAR
T. Allmendingera, B. Bhuyanb,, D. N. Brownc, H. Choid, S. Christe, R. Covarellif, M. Davierg, A. G. Denigh,M. Fritschh, A. Hafnerh, R. Kowalewskid, O. Longi, A. M. Lutzg, M. Martinellij , D. R. Mullerk, I. M. Nugentd,
D. Lopes Pegnal, M. V. Purohitm, E. Prencipeh, J. M. Roneyd, G. Simin, E. P. Solodovo, A. V. Telnovl, E. Varnesl ,R. Waldie, W. F. Wangp, R. M. Whitem
aOhio State University, Columbus, Ohio 43210, USAbIndian Institute of Technology Guwahati, Assam, 781 039, India
cLawrence Berkeley National Laboratory and University of California, Berkeley, California 94720, USAdUniversity of Victoria, Victoria, BC, V8W 3P6, Canada
eUniversitat Rostock, D-18051 Rostock, GermanyfINFN Sezione di Perugia, Dipartimento di Fisica, Universita di Perugia, I-06100 Perugia, Italy
gLaboratoire de l’Accelerateur Lineaire, IN2P3/CNRS et Universite Paris-Sud 11, Centre Scientifique d’Orsay, B. P. 34, F-91898 Orsay Cedex,France
hJohannes Gutenberg-Universitat Mainz, Institut fur Kernphysik, D-55099 Mainz, GermanyiUniversity of California at Riverside, Riverside, California 92521, USA
j INFN Sezione di Bari, I-70126 Bari, ItalykSLAC National Accelerator Laboratory, Stanford, California 94309 USA
lPrinceton University, Princeton, New Jersey 08544, USAmUniversity of South Carolina, Columbia, South Carolina, 29208, USA
nUniversita di Padova, I-35131 Padova, ItalyoBudker Institute of Nuclear Physics, Novosibirsk 630090, Russia
pUniversity of Notre Dame, Notre Dame, Indiana 46556, USA
Abstract
We describe several studies to measure the charged track reconstruction efficiency and asymmetry of theBABAR de-tector. The first two studies measure the tracking efficiency of a charged particle usingτ and initial state radiationdecays. The third uses theτ decays to study the asymmetry in tracking, the fourth measures the tracking efficiencyfor low momentum tracks, and the last measures the reconstruction efficiency ofK0
S particles. The first section alsoexamines the stability of the measurements vsBABAR running periods.
Keywords: BABAR, tracking, efficiency
1. Introduction1
The BABAR experiment operated from 1999 to 20082
at the PEP-II asymmetrice+e− collider at the SLAC3
National Accelerator Laboratory.BABAR was designed4
to study CP violation and other rare decays in flavor5
physics from events produced at or near theΥ reso-6
nances, from 9.46 GeV to over 11 GeV. A critical re-7
quirement for meetingBABAR’s science goals was the8
ability to efficiently and accurately detect stable charged9
particles, ortracks, produced ine+e− collisions. Many10
Email address:[email protected] (B. Bhuyan)
analyses performed atBABAR require a precise estimate11
of the track finding efficiency, as input for measuring12
the absolute or relative rate of the physics process being13
studied.14
In this paper, we present the algorithms and methods15
used inBABAR to estimate the track finding efficiency.16
To cover the range of particle momenta and produc-17
tion environments relevant to mostBABAR analyses, a18
number of methods are used. To compute the track-19
ing efficiency from data alone, these methods rely on20
special data samples, where additional constraints can21
be applied. The primary efficiency result is computed22
usinge+e− → τ+τ− events, which can be cleanly iso-23
Preprint submitted to Nuclear Instruments and Methods in Physics Research A July 13, 2012
Work supported in part by US Department of Energy under contract DE-AC02-76SF00515.
Published in arXiv:1207.2849.

lated in theBABAR data sample, and which have a sim-24
ple topology. To cross-check this result, we indepen-25
dently measure the tracking efficiency using radiative26
e+e− → π+π−π+π−γIS R events, whereγIS R is an initial27
state radiation (ISR) photon, which can be constrained28
kinematically. To study the reconstruction efficiency of29
low momentum tracks, we useD∗± → D0π± decays. We30
also present a dedicated study of the efficiency to recon-31
structK0S → π
+π−, whose daughter tracks can have a32
different efficiency due to their displacement from the33
primary event origin.34
The strategy for theτ-based and e+e− →35
π+π−π+π−γIS R track reconstruction efficiency measure-36
ments is to use charge conservation and kinematics to37
deduce the existence of a track, given a subset of de-38
tected tracks in well-defined events. The efficiency39
analyses based onD0 decays and for theK0S efficiency40
study use a statistical approach, using properties of41
momentum distributions which will be described be-42
low. Systematic errors are estimated using internal self-43
consistency measures and by comparing different effi-44
ciency analysis techniques.45
The BABAR detector geometry, material, and sensor46
response functions have been accurately modeled in a47
detailed simulation based on the Geant4 [1] framework.48
The output of theBABAR simulation is processed using49
the same reconstruction algorithms as applied to data,50
and the results have been found to be very similar to51
what we see in data. By using accurate computer mod-52
els of the physics processes relevant atBABAR energies53
[2, 3], we are able to generate equivalent samples of54
simulated data as used in nearly allBABAR analyses,55
including the tracking efficiency analysis.BABAR has56
therefore adopted the strategy of estimating the track-57
ing efficiency relative to that observed in the simula-58
tion, which simplifies the application of the tracking59
efficiency results in analysis. As will be shown in the60
following sections, for most of the studies, the tracking61
efficiency found in data agrees within errors with the62
efficiency found in simulated data. This allows the re-63
sult of the tracking efficiency measurement to be used64
in analysis simply by propagating the appropriate sys-65
tematic errors on the tracks involved to the simulation66
estimate of the analysis signal reconstruction efficiency.67
This strategy has been used in many scientificBABAR68
publications. However, for analyses involving aK0S, a69
correction is required in the MC for its daughter recon-70
struction efficiency which depends on the kinematics of71
the decay of interest.72
2. BABAR Detector and Data Sample73
The BABAR detector is a multi-purpose device de-74
signed to simultaneously measure many properties of75
the multiple particles produced ine+e− collisions near76
theΥ resonances, as described in detail in [4]. Charged77
particles are identified in a Silicon Vertex Tracker78
(SVT), and a Drift Chamber (DCH), which are sur-79
rounded by a superconducting solenoid that generates80
an approximately uniform 1.5 Tesla magnetic field in-81
side the sensitive volumes of these detectors.82
The SVT consists of five layers of double-sided sili-83
con strip detectors covering the full azimuthal range and84
the laboratory frame polar angle (θlab) range 20.1◦ <85
θlab < 150.2◦ [4]. The intrinsic resolution of individual86
SVT position measurements of particles which traverse87
it varies between 10µm and 30µm, depending on the88
incident particle direction and the readout view. The89
DCH consists of 7,104 hexagonal drift cells, which are90
approximately 1.9 cm-wide and 1.2 cm-high, made up91
of one sense wire surrounded by six field wires. The92
sense wires are 20µm gold-plated tungsten-rhenium,93
the field wires are 120µm and 80µm gold-plated alu-94
minium. The cells are arranged in 40 cylindrical lay-95
ers and the layers are grouped by four into tensuper-96
layersextending from roughly 25 cm to 80 cm in the97
transverse direction, with full coverage over the range98
24.8◦ < θlab < 141.4◦, and partial coverage over the99
range 17.2◦ < θlab < 152.6◦. The intrinsic resolution of100
individual measurements of track position in the DCH101
varies between 100µm and 200µm, depending on the102
track position and angle relative to the wire, with an av-103
erage resolution of 150µm.104
TheBABAR detector includes a dedicated charged par-105
ticle identification (PID) device based on detection of106
internally reflected Cherenkov radiation (DIRC), and107
a Cesium-iodide crystal electromagnetic calorimeter108
(EMC) for identifying electrons and photons. The steel109
for the solenoid magnet flux return is instrumented with110
position-sensitive chambers, which produce distinctive111
signatures from passing muons and pions.BABAR es-112
timates the species of charged particles using a com-113
bination of information from these devices, plus the114
specific ionization (dE/dx) measured in both the SVT115
and DCH. By studying the response of these systems116
to high-purity control samples, likelihood functions de-117
scribing a track’s consistency with each of the 5 charged118
particle species (e±, µ±, π±,K±, andp±) directly observ-119
able in theBABAR tracking system are defined. Samples120
of specific particle species of varying efficiency and pu-121
rity are selected by cutting on appropriate likelihood ra-122
tios.123
2

The results presented in this paper are based on the124
full BABAR data sample, collected in seven distinct pe-125
riods, Runs 1-7. Runs 1-6 correspond to data collected126
with a center-of-mass (CM) collision energy near or at127
theΥ (4S) resonance and Run 7 corresponds to the data128
collected with a CM collision energy at theΥ (3S) and129
Υ (2S) resonances.130
3. BABAR Track Reconstruction Algorithms131
Tracks are reconstructed inBABAR using a combi-132
nation of several algorithms. Tracks with transverse133
momentum above roughly 150 MeV/c are principally134
found in the DCH. Tracksegmentsare identified as con-135
tiguous sets of hits in a super-layer having a pattern con-136
sistent with coming from a roughly radial track. Seg-137
ments are linked using their position and angle to form138
a track candidate. Track candidates are fit to a helix,139
which is used to resolve the left-right ambiguity, and to140
removeoutlier hits. The candidate is kept if at least 20141
DCH hits remain. Tracks with large impact parameter142
are found in the DCH using a less restrictive algorithm.143
Tracks found in the DCH are fit using a Kalman filter144
[5] fit, which accounts for material effects and corrects145
for magnetic field inhomogeneities. The Kalman filter146
track fit is extrapolated inwards, and SVT hits consis-147
tent with the extrapolated track position and covariance148
are added.149
Tracks with low transverse momentum are found150
principally in the SVT using hits not already associated151
with tracks found in the DCH. Sets of four or moreφ152
hits (which measure the position in the plane transverse153
to the beam direction), in different layers of the SVT154
and consistent with lying on a circle, are selected. Hits155
in the orthogonal (z) view of the same wafers as theφ156
hits are then added to form three-dimensional track can-157
didates. Candidates with at least 8 hits are selected, and158
fit using the Kalman filter. Additional tracks are found159
in the SVT using space points constructed from pairs of160
φ andz hits not already used in other tracks. Sets of161
at least 4 space points consistent with a helix fit are se-162
lected as tracks. DCH hits are added to tracks found in163
the SVT in a procedure analogous to how SVT hits are164
added to tracks found in the DCH.165
After all the tracks in an event are found, they are fil-166
tered to remove duplicate tracks due to hard scattering167
in the material separating the SVT and the DCH, de-168
cays in flight, or pattern recognition errors in the DCH,169
where stereo and axial hits generated by a single particle170
are sometimes reconstructed as separate tracks. A final171
pass to remove inconsistent hits and to add individual172
hits missed in the pattern recognition is then performed173
using the Kalman filter fit.174
The resultant set of tracks is referred to asCharged175
Tracks(CT). A Good Tracks(GT) subset of tracks, with176
a higher probability of originating from the primary177
e+e− interaction, is selected from these. The GT se-178
lection requires the impact parameter with respect to179
the average interaction point be less than 1.5 cm in the180
transverse direction, and less than 2.5 cm along the ma-181
gentic field (z) direction. Analyses atBABAR generally182
use either the CT or the GT track selection, and the183
tracking efficiency studies described in this note are per-184
formed independently for both.185
4. Tau31 Tracking Efficiency Study186
The efficiency of charged track reconstruction at187
BABAR is determined usinge+e− → τ+τ− events. With188
over 430 millionτ pair events collected atBABAR, τ de-189
cays provide an opportunity to make a precision mea-190
surement of the tracking efficiency. At the CM energies191
produced atBABAR, τ decays are an ideal candidate for192
measuring the tracking efficiency because they have a193
momentum and angular distributions of tracks that are194
similar to those from decays of D and B mesons. De-195
cays ofτ leptons have a high track density due to the196
initial boost, β ∼ 0.94c, of theτ leptons, while the total197
track multiplicity is low. Theτ lepton has a life-time198
of (290.6± 1.0)× 10−15s, which results in a transverse199
flight length of 200µm at theBABAR CM energies, a200
value that is slightly larger than the beam spot size but201
small enough not to impact the tracking efficiency.202
The tracking efficiency is measured usinge+e− →203
τ+τ− events in which oneτ lepton decays leptoni-204
cally via τ± → µ±νµντ, and the otherτ lepton de-205
cays semi-leptonically to 3 charged hadrons viaτ∓ →206
h∓h∓h±ντ + ≥ 0 neutrals (excludingK0), referred to207
as Tau31events. The tracking efficiency is measured208
using the 3-prongτ decays. The branching ratio of209
τ± → µ±νµντ and 3-prongτ decays are (17.36± 0.05)%210
and (14.56 ± 0.08)% [6] respectively, so that Tau31211
events constitute over 5% of the total. Theτ pair candi-212
dates are selected by requiring an isolated muon track,213
plus at least two other reconstructed tracks consistent214
with being hadrons. Events are selected in two over-215
lapping channels; those where two of the hadrons have216
the same charge (“same-sign”), and those where two of217
the hadrons have opposite charge (“opposite-sign”). Re-218
quiring a muon track is an essential part of suppressing219
non-τ backgrounds: radiative Bhabha events where the220
photon interacts with the detector material producing221
an e+e− pair (conversion),γ-γ events, andqq events.222
3

)Truth4th Trackθcos(
-1 -0.5 0 0.5 1
)]/N
)/(0
.02)
Tru
th4t
h T
rack
θ([
dn/d
cos(
0
0.005
0.01
0.015
0.02
0.025
)Truth4th Trackθcos(
-1 -0.5 0 0.5 1
)]/N
)/(0
.02)
Tru
th4t
h T
rack
θ([
dn/d
cos(
0
0.005
0.01
0.015
0.02
0.025n=N4 Events
n=N3+N4 Events
n=N3+N4+N5 Events
Figure 1: The truecos(θ) in the laboratory frame for the fourth trackfor the selected opposite-sign and same-sign MC events.N = N3 +
N4+N5 is the number of selected same-sign and opposite-sign events.N4 is the number of events where the fourth track is found for theCT definition, N3 is the number of events where the fourth track isnot found for the CT definition andN5 is the number of events wheretwo CT candidates are found for the fourth track. The dotted linesindicate the outer edge of the tracking detectors, while thedashedlines indicate the edge where the full detector coverage begins. Theregion in between where there is partial coverage is indicated by theshading.
Charge conservation infers the existence of the fourth223
track.224
The tracking efficiencyǫ is defined by225
ǫ × A =N4
N3 + N4(1)
whereA is the geometric acceptance of the fourth track226
constrained by theτ pair kinematics and the selection227
criteria of the Tau31 sample,N4 is the number of events228
where the fourth track is found, andN3 is the number229
of events where the fourth track is not found. The ge-230
ometric acceptance of theBABAR detector for a uniform231
cos(θ) distribution is∼ 83%. In figures 1 and 2, the232
geometric acceptance of the detector is plotted for sim-233
ulated events as a function of the polar angle (θ) and the234
transverse momentum (pt) of the fourth track, respec-235
tively. These figures demonstrate the limited angular236
acceptance of the detector, and the poor acceptance for237
low momentum tracks.238
4.1. Monte Carlo Samples239
τ+τ− pair events are simulated with higher-order ra-240
diative corrections using theKK2f Monte Carlo (MC)241
generator [7] withτ decays simulated withTauola [8,242
9]. The simulated Standard Model backgrounds in-243
clude: bb; cc; ss; uu; andµ+µ− events [3, 7, 8, 9, 10].244
(GeV/c)Trutht,4th TrackP
0 1 2 3 4 5
]/N)/
(0.0
5GeV
/c)
Tru
th
t,4th
Tra
ck([
dn/d
P
0
0.01
0.02
0.03
0.04
(GeV/c)Trutht,4th TrackP
0 1 2 3 4 5
]/N)/
(0.0
5GeV
/c)
Tru
th
t,4th
Tra
ck([
dn/d
P
0
0.01
0.02
0.03
0.04n=N4 Events
n=N3+N4 Events
n=N3+N4+N5 Events
Figure 2: The truept for the fourth track for the selected opposite-sign and same-sign MC events.N = N3 + N4 + N5 is the numberof selected same-sign and opposite-sign events,N4 is the number ofevents where the fourth track is found for the CT definition,N3 isthe number of events where the fourth track is not found for the CTdefinition andN5 is the number of events where two CT candidatesare found for the fourth track. The tracks in the shaded region do notreach the outer edge of the DCH.
The number of simulated background events is compa-245
rable to the number expected in the data, with the ex-246
ception of Bhabha and two-photon events, which are not247
simulated. Bhabha and two-photon events backgrounds248
are studied with control samples. The detector simula-249
tion and reconstruction of the MC events is described in250
Section 2.251
4.2. Event Selection252
We require the events to have a minimum of three GT253
and a maximum of five CT tracks. Events withK0S are254
removed, where theK0S candidate is defined as having255
two oppositely charged tracks with an invariant mass256
within 10 MeV of theK0S mass [6], a vertex displaced257
more than 2 mm from the beam-spot and a vertex fitχ2258
probability of more than 1%. The three GT tracks are259
required to havept > 100 MeV. To remove any remain-260
ing duplicate tracks, the three GT tracks are required to261
satisfy an isolation cut inθ, φ and momentum by 0.1262
rad, 0.1 rad and 0.4 GeV, respectively. One of the three263
GT tracks must be more than 120 degrees from the other264
track. This isolated track must satisfy a tight muon PID265
selection. At least two of the other tracks are required266
to be identified as pions, by being inconsistent with a267
loose electron PID selection.268
For the “same-sign” channel (τ± → π±π±X∓ντ, where269
X∓ is the unidentified 4th track), we require 0.3 GeV270
< Mπ±π± < Mτ to ensure that the charged pions are271
consistent with coming from aτ lepton decay. For the272
4

)γl-θcos(-1 -0.5 0 0.5 10
5000
10000
15000
0
)γl-θcos(-1 -0.5 0 0.5 10
5000
10000
15000
0Same-Sign Channel
Reject
-1 -0.5 0 0.5 1
Eve
nts/
(0.0
2)
0
5000
10000
15000
20000
-1 -0.5 0 0.5 1
Eve
nts/
(0.0
2)
0
5000
10000
15000
20000
Reject
Opposite-Sign Channel
Data Signal Bkg-τ+τ) Bkgγ(-µ+µ Bkg qq
Figure 3: The cosine of the angle between the muon and the closestidentified photon (cos(θµγ)) with all other selection criteria applied forabout 15% of theBABAR data sample. The points represent the data,the empty histogram represents the 3 prongτ decays, the light shadedhistogram represents the otherτ+τ− MC, the medium dark histogramrepresent theµ+µ− MC and the dark histogram represents theqq MC.The background contamination in these samples is small.
“opposite-sign” channel (τ± → π±π∓X±ντ), we require273
|Mπ±π∓ − Mρ| < 100 MeV to ensure that the charged pi-274
ons are consistent with coming from aρ meson. This275
produces a loose selection for the “same-sign” channel276
and a tight selection for the “opposite-sign” channel. An277
event can be selected in either or both channels. In the278
case where more than one same-sign or opposite-sign279
pion pairing is possible, the pair with the highest labo-280
ratory framept is selected.281
To removeqq backgrounds, events with neutral parti-282
cles with an energy greater than 0.5 GeV that are within283
90 degrees from the muon track are removed. Figure 3284
shows the cosine of the angle between the muon and the285
photon (cos(θµγ)). To suppress radiative di-muon and286
Bhabha backgrounds with conversions, the muon track287
must have a CM momentum, (pCMµ ) less than 80% and288
greater than 20% of√
s/2, where√
s is the beam CM289
energy. To further reduce the non-τ backgrounds, the290
polar angle of the system of charged particles, theµ-ππ291
system, in the CM frame must satisfy| cos(θµ−ππ)| < 0.8,292
with the net transverse momentum of theµ-ππ system293
being more than 0.3 GeV.294
After the same-sign and opposite-sign events have295
been selected, fourth track candidates are selected,296
which are required to have the appropriate charge to297
come from aτ pair event and satisfy the track defini-298
s/CMµ2p
0 0.2 0.4 0.6 0.8 1 1.21
10
210
310
410
510
610
s/CMµ2p
0 0.2 0.4 0.6 0.8 1 1.21
10
210
310
410
510
610Same-Sign Channel
RejectReject
0 0.2 0.4 0.6 0.8 1 1.2
Eve
nts/
(0.0
1)
1
10
210
310
410
510
610
0 0.2 0.4 0.6 0.8 1 1.2
Eve
nts/
(0.0
1)
1
10
210
310
410
510
610
RejectReject
Opposite-Sign Channel
Data Signal Bkg-τ+τ) Bkgγ(-µ+µ Bkg qq
Figure 4: The 2pCMµ /√
s of the tag track with all other selection cri-teria applied for about 15% of theBABAR data sample. Contaminationfrom di-muon and Bhabha events, which peak at 2P/
√s=1.0, are neg-
ligible. The points represent the data, the empty histogramrepresentsthe 3 prongτ decays, the light shaded histogram represents the otherτ+τ− MC, the medium dark histogram represent theµ+µ− MC and thedark histogram represents theqq MC.
3 4 51
210
410
610
810
3 4 51
210
410
610
810 Same-Sign Channel (CT)
3 4 5
Eve
nts
1
210
410
610
810
3 4 5
Eve
nts
1
210
410
610
810 Opposite-Sign Channel (CT)
3 4 51
3 4 51
Same-Sign Channel (GT)
3 4 51
3 4 51
Opposite-Sign Channel (GT)
Data Signal Bkg-τ+τ) Bkgγ(-µ+µ Bkg qq
3 4 5
-5000
500
3 4 5
-500
0
500
3 4 5-2000
02000
TracksN3 4 5
-2000
0
2000
Figure 5: The track multiplicity in events that have been selected withthe same-sign or opposite-sign selection presented using the CT andGT definitions of the fourth track with all criteria applied for about15% of theBABAR data sample. The points represent the data; thecontributions from different backgrounds are shown in the histograms.
5

tions being studied. Figure 5 shows the multiplicity of299
the selected same-sign and opposite-sign events for the300
CT and GT definitions. Once the fourth track candidates301
have been selected, the tracking efficiency is determined302
by using Eq. 1. The difference in the tracking efficiency303
between data and MC is defined using Eq. 2.304
∆ = 1− ǫMC
ǫdata. (2)
Similarly, the charge asymmetry of the tracking effi-305
ciency is defined using Eq. 3.306
a± =ǫ+ − ǫ−ǫ+ + ǫ−
. (3)
where the efficiency measurements in Eq. 2 and Eq. 3307
also include the detector acceptance.308
Monte Carlo studies indicate that the backgrounds309
that could potentially bias the determination of the rel-310
ative tracking efficiency and the charge asymmetry are:311
events with two primary tracks from thee+e− collision312
and a photon that converts into an electron pair;qq and313
τ pair events with six tracks; andτ− → π−K0sντ where314
the K0s decays into aπ−π+ pair with a vertex that de-315
viates significantly from the primary vertex. For the316
background events with conversions andK0s, the re-317
construction efficiency could differ from that of tracks318
originating from the interaction point of thee+e− col-319
lision. The largest source of conversions comes from320
hadronicτ decays with one charged track and 1 or321
more neutral particles. This includesτ∓ → ρ∓ντ and322
τ∓ → h±π0π0ντ (h = π or K), which have branching323
fractions of (25.51± 0.09)% and (9.51± 0.11)% [6] re-324
spectively. The contribution from theτ decays with aK0s325
is small due to the suppression by the selection cuts and326
the branching fractions. The largest background from327
events with six tracks originating from thee+e− colli-328
sion is fromτ± → µ±νµντ, τ∓ → h∓h∓h∓h±h± ≥ 0329
neutralsντ(excludingK0S ) events which have a branch-330
ing fraction of (0.102± 0.004)%. The contamination331
from τ pair events with six tracks is≪ 0.1% for both332
the same-sign and opposite-sign channels.333
4.3. Systematic Uncertainties334
The primary systematic uncertainties in measuring335
the tracking efficiency and charge asymmetry arise due336
to mis-modeling of background contamination, which337
can bias the tracking efficiency due to fake tracks. The338
largest background comes from events with two tracks339
and a photon that converts in the detector material pro-340
ducing ane+e− pair. This background includes contri-341
butions fromτ pair events, radiative di-muon, Bhabha342
events, and two-photon events.343
We estimate the effect of background mis-modeling344
on the efficiency measurement using control samples se-345
lected to be enriched in photon conversion backgrounds.346
The control samples are selected using the standard se-347
lection, minus the vertex requirements, the loose elec-348
tron rejection using PID, and the same-sign and op-349
posite sign invariant mass cuts. Instead of these we350
apply a tight electron PID selection to two oppositely351
charged tracks. The invariant mass of the two oppo-352
sitely charged tracks is required to be less than 0.1 GeV353
using an electron mass hypothesis. The agreement be-354
tween the data and MC for the selection efficiency of355
this control sample is taken as the uncertainty on the356
modeling of conversions. This is propagated to the∆357
and the charge asymmetry measurements using the mea-358
sured rates. Note that this systematic error includes359
both contributions from the mis-modeling of the con-360
versions, and contributions from backgrounds that are361
not included in the MC simulation.362
To assess the impact of potentially different track363
multiplicity from qq backgrounds and the small contri-364
bution fromτ decays with aK0S, the efficiency differ-365
ence∆ and the charge asymmetry are calculated with-366
out subtracting these backgrounds. The difference be-367
tween these and the nominal values computed after368
background subtraction is conservatively taken as the369
systematic uncertainty.370
To account for possible differences in the rate of faketracks, a systematic uncertainty based on the differencebetween∆ and the charge asymmetry calculated with(ǫA) and
ǫ′ × A =N4
N3 + N4 + N5(4)
is included, whereN5 is the number of events where two371
candidate fourth tracks are found.372
As a cross check on the systematic errors, we com-373
pute∆ and the charge asymmetry,a±, separately in the374
same-sign and opposite-sign channels, and find these to375
be consistent within statistical and background uncer-376
tainties.377
In general, tracks selected in an analysis will not have378
the same kinematic distributions as the tracks in the379
Tau31 study. Therefore, when applying the efficiency380
results of the Tau31 study to an analysis, an additional381
systematic uncertainty is needed to account for the ef-382
ficiency dependence on track kinematics. In the Tau31383
analysis we do not estimate the dependence of tracking384
efficiency on track density or track multiplicity. That is385
done in the ISR analysis presented in Section 5.386
We quantify the kinematic variation in∆ and thecharge asymmetry by measuring them as a function offourth track polar angleθ and transverse momentumpt.
6
)missθcos(-1 -0.5 0 0.5 1
)4t
h T
rack
θco
s(
-1
-0.5
0
0.5
1
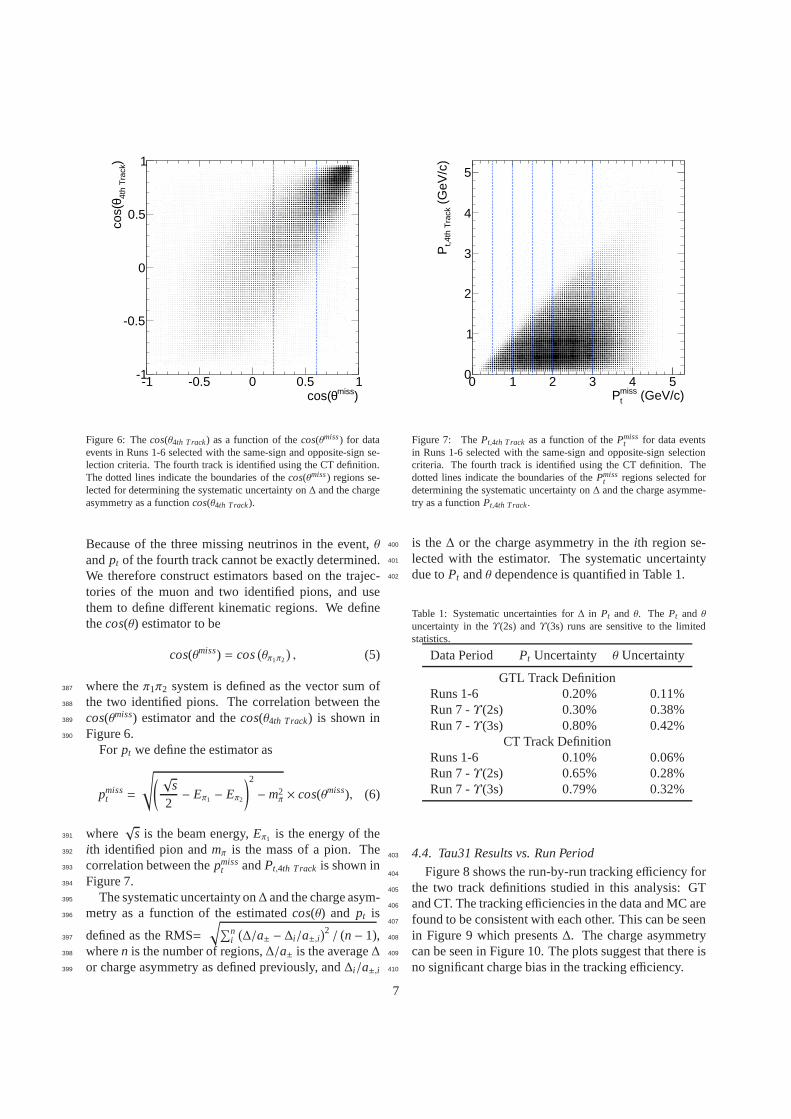
Figure 6: Thecos(θ4th Track) as a function of thecos(θmiss) for dataevents in Runs 1-6 selected with the same-sign and opposite-sign se-lection criteria. The fourth track is identified using the CTdefinition.The dotted lines indicate the boundaries of thecos(θmiss) regions se-lected for determining the systematic uncertainty on∆ and the chargeasymmetry as a functioncos(θ4th Track).
Because of the three missing neutrinos in the event,θ
andpt of the fourth track cannot be exactly determined.We therefore construct estimators based on the trajec-tories of the muon and two identified pions, and usethem to define different kinematic regions. We definethecos(θ) estimator to be
cos(θmiss) = cos(
θπ1π2
)
, (5)
where theπ1π2 system is defined as the vector sum of387
the two identified pions. The correlation between the388
cos(θmiss) estimator and thecos(θ4th Track) is shown in389
Figure 6.390
For pt we define the estimator as
pmisst =
√
( √s
2− Eπ1 − Eπ2
)2
−m2π × cos(θmiss), (6)
where√
s is the beam energy,Eπ1 is the energy of the391
ith identified pion andmπ is the mass of a pion. The392
correlation between thepmisst andPt,4th Track is shown in393
Figure 7.394
The systematic uncertainty on∆ and the charge asym-395
metry as a function of the estimatedcos(θ) and pt is396
defined as the RMS=√
∑ni(
∆/a± − ∆i/a±,i)2/ (n− 1),397
wheren is the number of regions,∆/a± is the average∆398
or charge asymmetry as defined previously, and∆i/a±,i399
(GeV/c)misstP
0 1 2 3 4 5
(G
eV/c
)t,4
th T
rack
P
0
1
2
3
4
5
Figure 7: ThePt,4th Track as a function of thePmisst for data events
in Runs 1-6 selected with the same-sign and opposite-sign selectioncriteria. The fourth track is identified using the CT definition. Thedotted lines indicate the boundaries of thePmiss
t regions selected fordetermining the systematic uncertainty on∆ and the charge asymme-try as a functionPt,4th Track.
is the∆ or the charge asymmetry in theith region se-400
lected with the estimator. The systematic uncertainty401
due toPt andθ dependence is quantified in Table 1.402
Table 1: Systematic uncertainties for∆ in Pt and θ. The Pt and θuncertainty in theΥ(2s) andΥ(3s) runs are sensitive to the limitedstatistics.
Data Period Pt Uncertainty θ Uncertainty
GTL Track DefinitionRuns 1-6 0.20% 0.11%Run 7 -Υ(2s) 0.30% 0.38%Run 7 -Υ(3s) 0.80% 0.42%
CT Track DefinitionRuns 1-6 0.10% 0.06%Run 7 -Υ(2s) 0.65% 0.28%Run 7 -Υ(3s) 0.79% 0.32%
4.4. Tau31 Results vs. Run Period403
Figure 8 shows the run-by-run tracking efficiency for404
the two track definitions studied in this analysis: GT405
and CT. The tracking efficiencies in the data and MC are406
found to be consistent with each other. This can be seen407
in Figure 9 which presents∆. The charge asymmetry408
can be seen in Figure 10. The plots suggest that there is409
no significant charge bias in the tracking efficiency.410
7

A (
%)
×∈
92
94
96
GT DataGT MCCT DataCT MC
(4s)Υ (4s)Υ (4s)Υ (4s)Υ (4s)Υ (4s)Υ (2S)Υ (3S)ΥRun 1 Run 2 Run 3 Run 4 Run 5 Run 6 Run 7
Figure 8: The tracking efficiency as a function of run number for theGT definition (top) and the CT definition (bottom). The data are repre-sented by solid markers and the MC by open markers. The error barsrepresent the total uncertainty where the statistical and backgroundsystematic uncertainties have been added in quadrature.
The stability of the agreement between data and MC411
over the 7 run periods (as shown in Figures 9 and 10)412
demonstrates that the detector simulation, which is up-413
dated regularly, accurately models the tracking perfor-414
mance of the detector as a function of time. Because415
there is no significant time variation observed between416
Runs 1 and 6 in∆ and in the charge asymmetry of the417
tracking efficiencies, an average of Runs 1-6 for∆ and418
the charge asymmetry of the tracking efficiencies is cal-419
culated. These averages are used to calculate the sys-420
tematic uncertainty due to tracking efficiency. The sys-421
tematic uncertainty per track for a given track definition422
is423
ΣTau31Tracking=
σ∆CT/GT
1− ∆CT/GT(7)
whereσ∆CT/GT is the total uncertainty on∆ for the given424
track definition. These results are the primary source of425
systematic uncertainty in track reconstruction efficiency426
in BABAR.427
5. Tracking efficiency using the ISR channel428
π+π−
π+π−
γISR429
A complementary approach to the Tau31 method is430
to study the tracking efficiency using processes such as431
e+e− → π+π−γIS R ande+e− → π+π−π+π−γIS R, where a432
high energetic photonγIS R is emitted from an initial lep-433
ton. This final state provides a clean event sample, cov-434
ering a wide range of momenta and polar angles of the435
tracks. In this section, we describe one such measure-436
ment involving four pions in the final state along with437
(%
)∆
-2
-1
0
1
2GT
CT
(4s)Υ (4s)Υ (4s)Υ (4s)Υ (4s)Υ (4s)Υ (2S)Υ (3S)ΥRun 1 Run 2 Run 3 Run 4 Run 5 Run 6 Run 7
Figure 9: The data-MC difference in the tracking efficiency as a func-tion of run number for the GT definition and the CT definition. Theerror bars represent the total uncertainty where the statistical and sys-tematic uncertainties have been added in quadrature.
(%
)±a
-2
-1
0
1
2GT DataGT MC
-2
-1
0
1
2CT DataCT MC
(4s)Υ (4s)Υ (4s)Υ (4s)Υ (4s)Υ (4s)Υ (2S)Υ (3S)ΥRun 1 Run 2 Run 3 Run 4 Run 5 Run 6 Run 7
Figure 10: The charge asymmetry of the tracking efficiency as a func-tion of run number for the GT definition (top) and the CT definition(bottom). The data are represented by the solid markers and the MCby the open markers. The error bars represent the total uncertaintywhere the statistical and systematic uncertainties have been added inquadrature.
8

the ISR photon. The Tau31 method has a higher statisti-438
cal accuracy, allowing the explicit study of time depen-439
dent effects. By contrast, since no neutrinos are present440
in the final state, the ISR events allow a more precise441
estimate of the missing track parameters than the Tau31442
method. In addition, the track density for ISR events is443
higher compared to the events in the Tau31 study, cor-444
responding to differentBABAR physics channels. The445
high track density in combination with the precise track446
parameter prediction allows studying the track overlap447
effects in tracking efficiency.448
To study tracking efficiency with ISR, we use two449
event samples: one in which all 4 charged particles450
are reconstructed (4-track), and one in which only 3451
charged particles are found (3-track). Using energy and452
momentum conservation in a kinematic fit, we can accu-453
rately predict the direction and momentum of the miss-454
ing track in the 3-track sample. By calculating the ra-455
tio of the number of lost tracksNlost tracksto the number456
of measured tracksNdetected tracks, we obtain the tracking457
inefficiency,η, defined in equation (8), and the track-458
ing efficiency,ǫ, according to equation (9). Both can be459
measured as a function of the kinematic properties of460
the missing track.461
η =Nlost tracks
Ndetected tracks+ Nlost tracks(8)
ǫ = 1− η (9)
5.1. ISR Event Selection462
For the ISR efficiency measurement we require that463
the tracks have a polar angle inside the detector accep-464
tance (−0.82 < cosθch < 0.92), and that the transverse465
distance of closest approach of the track to the event466
vertex (or nominal interaction point if no primary event467
vertex is found) be smaller than 1.5 cm, and be within468
2.5 cm in the beam direction. Tracks with less than469
100 MeV/c transverse momentum are rejected. The ISR470
photon is restricted to the polar angular range inside the471
EMC acceptance (0.5 rad< θγISR < 2.4 rad), and a mini-472
mum photon energy ofEIS R> 3 GeV is required. Either473
3 or 4 selected tracks are required in the event.474
In order to suppress radiative Bhabha events, we re-475
ject events where the two most energetic tracks pass a476
loose electron PID selection. This also removes mostγγ477
events with an additional high energetic photon (Eγ,cm >478
4 GeV) in opposite direction to the ISR photon can-479
didate. We require the minimum angle between the480
charged tracks and the ISR photon to be larger than481
1.0 rad, which rejects a large fraction ofe+e− → qq,482
(q = u, ,.s) ande+e− → τ+τ− event backgrounds. Events483
with one or two tracks with PID consistent with being484
a K± in the 3-track or the 4-track sample are rejected,485
respectively. Finally, we require the 4π invariant mass486
to be in the range of 1.2 GeV/c2 < M4π < 2.4 GeV/c2,487
where we expect a high signal to noise ratio.488
Backgrounds frome+e− → qq (q = u, ,.s) are sim-489
ulated with JETSET [10], whilee+e− → τ+τ− back-490
grounds are simulated using KORALB [11]. The ISR-491
channels are simulated with the AFKQED [12] genera-492
tor, based on an early version of PHOKHARA [13]. The493
MC samples are normalized according to the luminosity494
observed in the data.495
5.2. ISR Kinematic Fit496
Selected events are subjected to a kinematic fit as-497
suming theπ+π−π+π−γIS Rsignal hypothesisχ24π, as well498
as theK+K−π+π−γIS R background hypothesisχ22K2π.499
The fit in the 4-track (3-track) sample uses the four500
(three) tracks, the ISR photon and the kinematic infor-501
mation of incoming electron and positron. Energy and502
momentum conservation leads to four (one) constraints,503
or a 4C-fit (1C-fit), respectively.504
The resultingχ2 distributions are shown in Fig. 11.505
The χ2 distributions are broader than expected, partly506
due to detector resolution effects, but mostly because507
additional ISR photons are not included into the kine-508
matic fit hypothesis. In Fig. 11(a) the 4-track sample509
shows a good agreement between the data and MC in510
the presence of negligible background.511
In Fig. 11(b) the correspondingχ2 distributions are512
shown for the 3-track sample. Here, we also require513
the predicted polar angle for the missing track be in the514
detector acceptance (−0.82 < cosθch < 0.92) region.515
The relative amount of background is much larger in516
this sample, since the kinematic closure that suppresses517
a lot of background in the 4-track sample is weaker with518
only one constraint. The visible difference between the519
number of events after background subtraction (red) and520
signal MC (black) suggests that moreπ tracks are lost521
in data than are described by MC.522
Fig. 11(b) also shows a difference in the shape of the523
χ2 distributions between the data and MC. The plateau524
in the background MC at largeχ2 suggests that all back-525
grounds are not subtracted from data. Therefore we526
perform an additional background subtraction based on527
data sidebands. The idea of the sideband subtraction is528
illustrated in Fig. 12, which plots the 3-trackχ2 distri-529
bution for a subset of theBABAR data. We define a sig-530
nal region enriched in signal events, which containsN1531
events. The control region, which has substantial back-532
ground contributions, containsN2 events. LetN1s (N1b)533
9

10 3
10 4
10 5
0 10 20 30 40 50 60 70 80 90
10 2
10 3
10 4
0 1 2 3 4 5 6 7 8 9
χ2 4πγ, 4C
Eve
nts
/ uni
t χ2
χ2 4πγ, 1C
Eve
nts
/ uni
t χ2
Figure 11: (a):χ24π distribution for 4-track sample (4C). Data with
subtracted background (red points), signal MC (black histogram) andthe sum of background MC channels (blue histogram). (b): Corre-spondingχ2
4π distributions for the 3-track sample (1C). The signal andcontrol regions are indicated with vertical lines, with theregion in theextreme left being the signal region and the area in the middle beingthe control region.
be the number of signal (background) events in the sig-534
nal region, andN2s (N2b) the corresponding numbers for535
the control region. Assuming one knows the ratios,536
a =N2s
N1sand b=
N2b
N1b(10)
the number of signal events can then be calculated ac-537
cording to the following equation:538
N1s =b · N1 − N2
a− b(11)
We define signal and control regions in the 4-track539
sample asχ24π,4C < 30 and 30< χ2
4π,4C < 60 respec-540
tively. The corresponding regions in the 3-track sample541
are chosen so that the ratio of events in the signal to con-542
trol region is the same as in the 4-track sample, resulting543
in χ24π,1C < 3 and 3< χ2
4π,1C < 6 respectively. The ra-544
tio a is determined using signal MC. In order to obtain545
b, we assume any difference in tracking inefficiency be-546
tween data and MC does not depend onχ24π. Therefore547
we performed a fit of the difference between data and548
MC using a linear Probability Density Function (PDF),549
allowing a scale-factor for MC.550
2χ0 1 2 3 4 5 6 7 8 9 10
0
500
1000
1500
2000
2χ0 1 2 3 4 5 6 7 8 9 10
0
500
1000
1500
2000=117.82χ0.02, ±= 0.71
run5b
Eve
nts
/ 0
.1 u
nit
2χ
signal region control region
N
N N N N
N 1 2
1s
1b 2b2s
Figure 12: Fit result for sideband parameterb using Run 5 fittingsignal MC (blue histogram) and a linear background (blue line) todata (black points). Also indicated are the number of signalN1s/2s
and backgroundN1b/2b events in the signal and control region.
The result of the fit is shown in Fig. 12. Small dis-551
crepancies at lowχ2 indicate that there is still some552
background present. The remaining difference in theχ2553
distribution is consistent within the uncertainty of the554
cross section of the peaking background contributions555
that have been subtracted. After subtracting the addi-556
tional background using equation 11, the inefficiency557
difference between data and MC∆η = ηdata − ηMC is558
determined to be559
∆η = (0.75± 0.05stat± 0.34syst)%. (12)
The systematic uncertainty on∆η is dominated by560
the uncertainty of the cross section of the subtracted in-561
dividual background contributions in the 3-track sam-562
ple. Most of these cross sections have been measured563
in previousBABAR analyses [14, 15, 16, 17, 18]. The564
normalization of the additional contributions of contin-565
uum ande+e− → ττ backgrounds have been verified566
with specific kinematic distributions. Note that this re-567
sult is not directly comparable to the Tau31 efficiency568
result, as that was calculated using an isolation require-569
10

ment between the tracks. The effect of track overlaps is570
discussed in the next section.571
5.3. ISR Efficiency Kinematic Dependence572
In Fig. 13 the dependence of∆η on the polar angleθ573
(a) and the transverse momentumpt (b) of the missing574
track is presented. The dependence onpt is flat within575
the uncertainties of 0.4%. A slight dependence on the576
polar angle is visible with almost no difference between577
data and MC in the forward region at small polar angles578
and a difference of approximately 1% in the central and579
backward region. Due to the beam energy asymmetry580
at BABAR, high energy photons are preferably emitted581
in the forward direction at small polar angles. In ISR582
events, the hadronic system is emitted back-to-back to583
the ISR photon. The energy of the photon is correlated584
with the opening angle of the cone of the hadronic sys-585
tem. This correlation leads to an increasing track over-586
lap probability in the backward region of the detector,587
which is not perfectly modeled by MC as shown in the588
following.589
One source of tracking inefficiency is when two590
tracks overlap in the detector, causing sensor signals591
from one or both to be lost or distorted, and creating592
hit patterns that can be hard for the track finding al-593
gorithms to distinguish. BABAR tracking inefficiency594
is most affected by overlaps in azimuth, as the DCH595
largely projects out track polar angle. Due to magnetic596
bending, tracks with the same charge are more likely597
to overlap in azimuth than tracks with opposite charge.598
Furthermore, the overlap between tracks with opposite599
charge depends in an asymmetric way on the azimuthal600
angle between them. These effects are shown schemat-601
ically in Fig. 14. To study the dependence of tracking602
efficiency on overlap, we define variables sensitive to603
the charge-dependent two-track azimuthal separation:604
The effect of track loss due to overlapping tracks with605
different charge (DC) is visible in the distribution of606
the charge oriented azimuthal angle difference between607
the lost track and the reconstructed track with different608
charge∆φDC = φ(π+) − φ(π−). Since in our study there609
are always two pions with the different charge of the610
missing pion, two angles are obtained for each event.611
In Fig. 15(a) the∆φDC distribution is plotted for data612
and MC. The asymmetric distribution shows that the DC613
tracking inefficiency peaks at small positive values.614
The number of tracks lost due to DC track over-615
lap is estimated by subtracting the negative half of this616
distribution from the positive, as illustrated for MC in617
Fig. 15(b). The inefficiency is corrected as indicated618
in equation 13, leading to a correction for overlapping619
tracks with different charge DC of 0.41%.620
-0.02
-0.01
0
0.01
0.02
0.03
0.04
0.5 0.75 1 1.25 1.5 1.75 2 2.25 2.5
-0.01
-0.005
0
0.005
0.01
0.015
0.02
0.025
0.03
0 0.5 1 1.5 2 2.5 3
θ [rad.]
∆η /
0.05
rad
.
pt[GeV/c]
∆η /
0.1
GeV
/c
Figure 13: Relative data-MC difference of tracking inefficiency vs.the polar angle of the trackθ (a) and vs. the transverse momentumpt (b). Red lines indicate the detection region used to determine theaverage inefficiency.
η′ =Nlost tracks− Noverlapping tracks
Ntracks(13)
We describe the same charge (SC) track overlap in-621
efficiency in terms of∆φSC = |φ(π±) − φ(π±)|, as illus-622
trated in Fig. 14 (b): the angle between the lost track623
and the reconstructed track with the same charge. For624
data in Fig. 15(c) the angle between lost track and re-625
constructed track with the same charge in the 3-track626
sample is plotted in red. The blue histogram shows the627
same distribution for the two detected tracks. The dis-628
tribution with one lost track is the superposition of the629
distribution due to detection inefficiency and a peaking630
distribution at small∆φSC due to track overlap losses.631
The distribution due to usual detection inefficiency has632
the same∆φSC dependence as the distribution of the two633
measured tracks. The number of tracks lost due to track634
overlap can be estimated by scaling down the distribu-635
11

Figure 14: (a): Charge oriented azimuthal angle between missing pionand detected pions with different charge∆φDC = φ(π+)−φ(π−) (2 en-tries per event); (b) absolute value of azimuthal angle between missingpion and detected pion with same charge∆φSC = |φ(π±) − φ(π±)|.
tion of the measured tracks until the tails of the distri-636
bution match with the distribution including one miss-637
ing pion. The difference at small∆φSC is a good esti-638
mate for the number of tracks lost due to track overlap.639
The corresponding distributions for MC are displayed640
in Fig. 15(d). The effect of SC tracks overlap is well641
modeled in MC.642
5.4. ISR Efficiency Summary643
To summarize, the difference in tracking inefficiency644
per track including track overlap is determined from645
ISR events to be:646
∆η = (0.75± 0.05stat± 0.34syst)% (14)
Because of the track isolation requirement applied in the647
Tau31 selection, the different track multiplicity, and the648
different event topology, the ISR study includes a sig-649
nificantly higher track overlap probability and thus the650
value in equation 14 is not directly comparable with the651
Tau31 result discussed in Section 4. To make a compari-652
son, we quantify the effect due to track overlap by study-653
ing the distributions of the azimuthal angular difference654
between same charged tracks and oppositely charged655
tracks. Taking this effect into account, we measure an656
efficiency difference between data and simulation of:657
0
500
1000
1500
2000
2500
-1 -0.5 0 0.5 10
500
1000
1500
2000
2500
-1 -0.5 0 0.5 1
0
500
1000
1500
2000
2500
3000
3500
0 0.5 10
500
1000
1500
2000
2500
0 0.5 1
∆φDC [rad.]
Eve
nts
/ 0.0
4 ra
d.
∆φDC [rad.]
Eve
nts
/ 0.0
4 ra
d.
∆φSC [rad.]
Eve
nts
/ 0.0
4 ra
d.
∆φSC [rad.]
Eve
nts
/ 0.0
4 ra
d.
Figure 15: (a): Angle between missing pion and detected pions withdifferent charge for the data (red points) and signal simulationnormal-ized to the luminosity (black histogram). Two entries per event. (b):Illustration of the cleaning procedure. Tracks lost due to DC overlap(red) and due to other effects (black). (c): Angle between missingpion and detected pions with same charge (red) and the angle betweentwo detected pions (blue) normalized to the same number of events inthe region 0.3 rad < ∆Φ < 0.8 rad. (d): Same as (c), but for signalMC.
∆η′ = (0.38± 0.05stat± 0.39syst)% (15)
This result is consistent with the Tau31 efficiency658
difference within the uncertainties. Depending on the659
event multiplicity and kinematics,BABAR analyses may660
need the inefficiency with or without track overlap ef-661
fects.662
6. Tracking Charge Asymmetry663
Since a main objective of theBABAR experiment is to664
measure CP violation, it is vital to understand and mea-665
sure any possible charge asymmetry in the track recon-666
struction. For instance, a promising mode for searching667
for CP violation in charm decays isD± → K+K−π±.668
An asymmetry in the reconstruction efficiency for the669
π± would bias the CP result. Because the signal in these670
decays has a statistical uncertainty of∼ 0.25%, a com-671
parable control of the tracking efficiency asymmetry is672
needed.673
We define the charged pion tracking asymmetry as
a(pLab) ≡ǫ(pπ+ ) − ǫ(pπ− )ǫ(pπ+ ) + ǫ(pπ− )
(16)
12

GeV/cLab
p0 1 2 3 4 5 6
-∈+ +∈-∈- +∈
-0.1
-0.08
-0.06
-0.04
-0.02
0
0.02
0.04
0.06
0.08
0.1
0 0.2 0.4 0.6 0.8 1 1.2 1.4 1.6 1.8 2-0.0025
-0.002
-0.0015
-0.001
-0.0005
0
0.0005
0.001
0.0015
0.002
0.0025
Figure 16: Tracking asymmetry from MC as a function of chargedpion momentum in the laboratory frame. The inset plot shows theasymmetry up to 2 GeV.
wherepLab indicates that momenta are in the lab frame,674
andpπ+ (pπ−) refers to the momentum of the positively675
(negatively) charged pion.676
We illustrate our expectations in this regard using677
MC. Figure 16 shows the pion tracking efficiency asym-678
metry derived from MC using generator information679
for pion tracks inD± → K+K−π± decays. The av-680
erage asymmetry for MC in this mode is found to be681
a(pLab) = (−6± 23)× 10−5, consistent with zero within682
the uncertainties, and without any significant momen-683
tum dependence.684
Two different methods are used to determine the piontrack efficiency asymmetry directly from data. Themore precise technique relies on Tau31 events. We workdirectly in the observed variables and use the ratios ofthe numbers of two-hadron decays to three-hadron de-cays to determine the pion inefficiency. Instead of fittingdistributions of 2- and 3-hadron decays, we recognizethat the (fewer) 2-hadron events that arise from track-ing inefficiency can be easily modeled directly from the3-hadron events. In practice this is done by weightingevery 3-hadron event by the ratio (1− ǫ)/ǫ, whereǫis the track efficiency of the observed third track. Forboth 3-hadron as well as 2-hadron events we select onlyevents from theρ-decay channelsτ− → ρ0h−ντ, ac-cording to the selection criteria described in section 4since the inclusiveτ− → π−π−h+ντ has more signifi-cant backgrounds, specifically with contamination from
(GeV/c)miss
pt0 1 2 3 4 5 6 7
mis
s)θ
cos(
-1
-0.8
-0.6
-0.4
-0.2
0
0.2
0.4
0.6
0.8
1
Figure 17: Distribution of the observed 2-hadron events forthe fullBABAR data sample. Bin boundaries were chosen to obtain the samenumber of events (215) in each bin.
electrons. The total number of 2-prong (3-prong) eventsin the sample is 86,092 (1,365,900). The distribution ofevents in the observed variables,ptmissand cos(θ)miss, isshown in Figure 17. The observed variables are deter-mined from the 2-prong momenta:
~p(ππ) ≡ ~p(π+) + ~p(π−) (17)
such that
cos(θ)miss=pz(ππ)p(ππ)
(18)
and
ptmiss= pT(ππ). (19)
In order to fit these event distributions, one must685
also account for backgrounds. The 2-hadron events of686
interest include approximately 7% background events.687
Chief among these are events from photon (5%) and688
π0 (1%) conversions in 1-hadron decays of the tau,689
where the 1-prong track from the tau is combined with690
a track from the photon orπ0 and identified as a 2-prong691
event. Inelastic nuclear interactions due to tracks pass-692
ing through detector material and other backgrounds693
are small in comparison. The backgrounds are split694
into “photon” and “other” components and the overall695
normalization of each distribution is a parameter in a696
binnedχ2 fit. Another large background contribution to697
2-hadron events (whose normalization is a parameter) is698
acceptance loss events due to the third track being lost in699
the direction of the beam. PDFs are obtained from MC700
as normalized histograms in the observed variables of701
13

the various backgrounds; events in these have been re-702
weighted to account for inadequacies in the MC 3-body703
Dalitz distributions by matching the 3-body mass distri-704
bution as well as both the 2-body mass distributions to705
those in data. The tracking efficiency asymmetry fit is a706
binnedχ2-fit with binning as shown in Fig. 17.707
The significant parameters in the fit describe the708
tracking efficiency and the asymmetry as a function of709
the lab momentum. The tracking efficiency is parame-710
terized with the following phenomenological formula:711
ǫ(pLab) = 1− A0epLab−p0τ0 − B0e
pLab−p1τ1 (20)
where the parameters areA0, B0, p0, p1, τ0, andτ1, in712
addition to parameters which measure the asymmetry in713
bins of lab momentum. Finally, it should be mentioned714
that we account for differences in the 3-hadron distri-715
butions ofm212 versusm2
23 (1, 2, 3 denote the particles716
in the 3-prong tau decay) in data and MC by weighting717
3-hadron events according to the data/MC m212 , m2
23 dis-718
tribution ratio. The fit to our data is good as evidenced719
by aχ2/NDF = 792/780, i.e., a 37% probability.720
Results from this procedure are shown in Figures 18721
and 19. We find the average charged pion tracking effi-722
ciency asymmetry to bea(pLab) = (0.10±0.26)%, in our723
momentum range of approximately 0-4 GeV/c, consis-724
tent with zero. To account for systematic errors we re-fit725
the data with the following variations. We force the ac-726
ceptance loss and background descriptions in the fit in-727
dividually to be charge-independent, and we reduce the728
number of background components by combining some729
PDFs. We find the total systematic error to be 0.10%.730
GeV/cLab
p0 1 2 3 4 5 6 7
trac
k∈
0.9
0.92
0.94
0.96
0.98
1
Figure 18: The tracking efficiency determined by the Tau31 methodas a function of charged pion momentum in the laboratory frame. Thered envelope around the efficiency curve indicates 1σ statistical errorbands.
Another technique we use to measure the charged731
track efficiency asymmetry utilizes isotropy of spinless-732
) GeV/c±π(Lab
p0 1 2 3 4 5 6 7
-∈+ +∈-∈- +∈
-0.01
-0.008
-0.006
-0.004
-0.002
0
0.002
0.004
0.006
0.008
0.01
31τAsymmetry and Error in
-π+π →)0
D (0Average Asymmetry and Error in D
Figure 19: The tracking asymmetry determined by the Tau31 methodas a function of charged pion momentum in the laboratory frame. Theaverage asymmetry over momenta 0-2 GeV/c determined fromD0
decays is also shown here for comparison.
two-body decays. In this method we study theD0 →733
π+π− andD0→ π+π− decays. We require that these de-734
cays not be from B-meson decays (as these have larger735
backgrounds) and that they be tagged as being fromD∗±736
decays to improve signal purity. Also, in both cases we737
require that at least one pion have momentum greater738
than 2 GeV/c and assume that the tracking efficiency739
charge asymmetry is zero for this pion. Therefore, any740
asymmetry in yields is the result of tracking asymmetry741
of the lower momentum pion which is reported below.742
High purity samples ofD0 and D0
decays are ob-743
tained using slow pions associated with the decay ofD∗+744
to tag the flavor of theD0 meson. A detailed description745
of the event selection is described in the publication of746
D0− D0 mixing using the ratio of lifetimes for the decay747
of D0 → π+π− [19]. Particle identification is not applied748
to the selection of pion tracks, rather we choose to re-749
move reflections from theK−π+ decays of theD0 using750
a cut on the reflected mass and we account for the re-751
maining contamination from the tails by studying their752
π+π− mass distributions and including a term with such753
a shape in our 1-D binnedπ+π− mass fit. Yields ofD0754
decays where the higher momentum track is either the755
π+ or theπ− are separately determined and are used to756
determine the asymmetry. A similar study is carried out757
usingD0
decays, and the combined charge asymmetry758
of the efficiency, averaged over pion momenta from 0 to759
2 GeV/c is found to bea(pLab) = (−0.12± 0.50)%, con-760
sistent with zero and the Tau31 method result, but not761
as precise as the Tau31 method.762
14

7. Low pT tracking efficiency measurement763
Theτ pair sample provides an estimate of tracking ef-764
ficiency for charged tracks withpT > 180 MeV/c only.765
However, the detection of lowpT tracks (pT < 180766
MeV/c) is important for taggedD0 analyses.D0 tagging767
is performed through theD∗+→ D0 π+ decay, where the768
soft pion(π+s) is emitted with an energy just over its rest769
mass in theD∗+ frame, and so typically has very low770
pT in the lab frame.D0 tagging is used inCP violation,771
mixing, and many other precision analyses, therefore a772
good understanding of the lowpT tracking efficiency is773
required.774
The low pT reconstruction efficiency analysis is775
based on a previous analysis by the CLEO collaboration776
[20]. CLEO demonstrated that the relative slow pion ef-777
ficiency can be measured as a function of momentum778
usinghelicity distributions. The slow pion helicity an-779
gleθ∗ is defined as the angle between the slow pion mo-780
mentum in theD∗ rest frame and theD∗ momentum in781
the laboratory frame. This is illustrated in Fig. 20.782
Rest Frame+D*
)+sπ*(p
*θ(D*)
Labp
)0*(Dp
Figure 20: Definition of slow pion helicity angleθ∗.
When a vector meson decays to a final state madeof two pseudo-scalar mesons, the distribution of the he-licity angle is expected to be symmetrical and can bedescribed as [21, 22]
dNd cosθ∗
∝ (1+ α cos2 θ∗), 1 < α < +∞, (21)
Furthermore, the cosine of the helicity angle is relatedto the slow pion momentum by:
pπs = γ(p∗πs
cosθ∗ − βE∗πs), (22)
whereβ andγ are theD∗ boost parameters. Sincep∗ and783
E∗ are known once theD∗ momentum is known, Eq. 22784
maps any asymmetry observed in Eq. 21 to a relative785
reconstruction inefficiency in a specific part of the slow786
pion momentum spectrum.787
We measure the cosθ∗ distribution in 8 bins ofp∗(D∗)788
spectrum as shown in Fig. 21. Sincepπ depends not789
just on the cosθ∗, but also onp∗(D∗), we perform an790
angular efficiency analysis in bins ofp∗(D∗). We then791
fit these cosθ∗ distrubions to a function defined as the792
convolution of Eq. 21 and the efficiency function:793
ǫ(p) =
1− 1δ(p−p0)+1 , if p > p0
0, if p ≤ p0.(23)
The goal of this analysis is to compare data and MCefficiencies to get a systematic error from the relativedifference between them:
σsyst=
∫
ǫdata(p)dp−∫
ǫMC(p)dp∫
ǫdata(p)dp. (24)
The limitations of this method are the effects that may794
be not correctly described in the MC, such as final state795
interactions or radiative losses.796
p*(D*) GeV/c0 0.5 1 1.5 2 2.5 3 3.5 4 4.5 5
)2E
vent
s/(5
0 M
eV/c
0
10000
20000
30000
40000
50000 1 2 3 4 5 6 7 8
Figure 21: Distribution ofp∗(D∗) in the data sample. On top of thefigure the blue lines show the lower and upper limit of each binindi-cated by the red number.
The analysis is done using 470 fb−1 of data recorded797
by theBABAR detector and about 4.2× 10⁹ generic MC798
events. The decay chaine+e− → D∗+ X, D∗+ → D0799
π+s , D0 → K− π+ [23] is reconstructed in both data and800
MC, requiring particle identification for the kaon and801
the two vertices to be successfully reconstructed. The802
D0→ K− π+ mode is chosen to provide a clean sample803
of D∗+ → D0 π+ decays with a high branching fraction.804
A control sample is reconstructed the same way by not805
requiring the kaon identification. This sample is used806
for background subtraction. Thep∗(D∗) spectrum has807
been compared between data and MC. Differences are808
corrected for by weighting the MC sample which is then809
normalized to data.810
As shown in Fig. 22, four categories of events can be811
recognized after the reconstruction:812
15

1. signal: realD0 andπ+s from D∗+ decay.813
2. Missedπ+s : real D0 → K− π+ decay that may or814
may not have come from aD∗+, combined to aπ+815
from combinatoric.816
3. MissedD0: a mis-reconstructedD0 with a realπ+s817
from D∗+. This is mostlyD0→ K− K+, D0→ K−818
π+ π0, D0 → π+ π− or cases where the kaon and819
pion assignments have been swapped.820
4. Combinatoric background: neitherD0 or π+s are821
correctly reconstructed from aD∗+ decay.822
The amount of combinatoric and realD0, fake π+s823
background in the signal region is estimated using the824
re-normalized distribution of the control sampleD0825
sidebands in the∆m = m(K−π+π+s ) − m(K−π+) signal826
region. The scale factor needed for going from∆mside-827
band to the∆m signal region is taken from the control828
sample itself. This background subtraction procedure
1
10
210
310
410
2m GeV/c∆0.14 0.145 0.15 0.155 0.16 0.165
2)
GeV
/c+ π-
m(K
1.78
1.8
1.82
1.84
1.86
1.88
1.9
1.92
1.94
2
3
3 4
4
1
Figure 22: m(K− π+) vs.∆mscatter plot of the data sample. Signal re-gion is identified by the red box and the blue lines show the sidebands.The numbers identify the events category.
829
has been carried out for the cosθ∗ distribution for each830
bin of p∗(D∗) using the following steps:831
1. consider theno PID sample in the m(K−π+) side-832
band regions; divide the number of events in the833
∆m signal region by the number of events in the834
∆msideband to get the scale factor to go from side-835
band to signal in∆m;836
2. in thegood PIDsample scale the m(K−π+) spec-837
trum in the∆m sideband region using the factor838
obtained in the previous step; then integrate the839
resulting m(K−π+) spectrum to get the factor to840
rescale background;841
3. use the factor measured in step 2 to rescale842
the interesting distribution (cosθ∗) obtained from843
the events of theno PID sample in∆m signal,844
m(K−π+) sideband region (category 4);845
4. subtract the distribution obtained in step 3 from the846
same distribution retrieved fromgood PIDsample847
in signal region.848
This procedure has been carried out for the cosθ∗ dis-849
tribution for each bin ofp∗(D∗). All the histograms have850
been then fit to the convolution of Eqs. 21 and 23 to de-851
termine the parameters of the efficiency functionp0 and852
δ. Measuringp0 andδ for data and MC, we can evaluate853
the systematic error using Eq. 24. The fit makes use of854
a globalχ2 defined as855
χ2 =∑
l,k
(Dlk − Slk)2
σ2Dlk
, (25)
wherek is the index referring to one of the 8p∗(D∗)regions,l refers to one of the 16 bins of thecosθ∗ his-togram in that region.Dlk, σDlk andSlk are the numberof events observed in the bin, its error and the numberof events expect by the fit model, respectively. The ex-pression of the fit model is
Slk =∑
i, j
ǫ(pi j ; p0, δ)Nk(1+ αk cosθ∗i ) (26)
wherei indicates the bin of the cosθ∗ distribution in the856
kth p∗(D∗) region, andj is one of the 10 bins of the de-857
tailed distribution within the range of momentum con-858
sidered in thekth p∗(D∗) region.859
The number of floating parameters in the fit are 18:860
8 normalization factorsNi , 8αi (one for each bin) from861
Eq. 21, andδ andp0 from Eq. 23. The fit has been made862
both to data and MC, giving the results shown in Fig. 23863
and Tab. 2.864
Finally, the efficiency functions are compared in865
Fig. 25. Please note that these distributions include ac-866
ceptance. The method shown herein does not allow to867
disentangle the acceptance from the soft pion efficiency.868
The systematic uncertainty estimated from Eq. 24 for869
the low pT tracks isσsyst= 1.54%.870
8. K0S
reconstruction efficiency measurement871
A significant number of analyses inBABAR involve the872
reconstruction of the decayK0S → π
+π−, where the two873
charged pions belong to the list CT of all reconstructed874
tracks in the event. The track reconstruction efficiency875
for charged tracks originating within 15 mm in XY from876
the beam spot is studied by the other methods presented877
earlier in the paper. However, most of theK0S’s decay878
16

)sπθcos(
-1 -0.8 -0.6 -0.4 -0.2 0 0.2 0.4 0.6 0.8 1
Eve
nts/
0.12
5
0
10000
20000
30000
40000
50000
60000
70000
80000
90000 0.5≤D*
p*
1.0≤D*
0.5<p*
1.5≤D*
1.0<p*
2.0≤D*
1.5<p*
2.5≤D*
2.0<p*
3.0≤D*
2.5<p*
4.0≤D*
3.0<p*
5.0≤D*
4.0<p*
Data
)sπθcos(
-1 -0.8 -0.6 -0.4 -0.2 0 0.2 0.4 0.6 0.8 1
Eve
nts/
0.12
5
0
10000
20000
30000
40000
50000
60000
70000
80000 0.5≤D*
p*
1.0≤D*
0.5<p*
1.5≤D*
1.0<p*
2.0≤D*
1.5<p*
2.5≤D*
2.0<p*
3.0≤D*
2.5<p*
4.0≤D*
3.0<p*
5.0≤D*
4.0<p*
MC
Figure 23: Fit of the model distribution to data (top) and MC (bottom).In both the plots, the measured data/MC event ratios are representedby the dots, while the fit results are shown using a line histogram.The distributions of cosθ∗ in the different ranges ofp∗(D∗) are shownusing different colors, as outlined in the legend (thep∗(D∗) values aremeasured in GeV/c). The fit to data returnsχ2/ndo f = 1.34; the oneto MC givesχ2/ndo f = 0.71.
outside this 15 mm radius, making it necessary to under-879
stand theK0S daughter reconstruction efficiency in data880
and MC.881
The reconstruction efficiency of theK0S daughters de-882
pends on theK0S transverse momentum,pT , polar angle,883
θLAB and transverse (XY) flight distance,dXY, which is884
computed as the distance between the primary vertex of885
the event and the refittedK0S decay vertex.886
The general strategy is to subdivide the data and MC887
events into a large number of samples by choosing an888
appropriate binning in these variables, determine the889
number ofK0S’s in each bin in data and MC and, for each890
of the momentum and polar angle ranges, normalize the891
ratio of its value in the first bin indXY, where all tracking892
effects are understood to 1.000 by definition, with no as-893
sociated error other than the systematic uncertainty per894
Table 2: Fit results on data and MC.
Parameter MC Data
δ 13.77± 0.18 14.54± 0.15p0 27.82± 0.21 MeV/c 27.01± 0.14 MeV/cN1 1284645± 1784 185581± 1927α1 −9.88± 0.12× 10⁻¹ −9.30± 0.10× 10⁻¹
N2 452849± 3524 970429± 5694α2 −8.25± 1.41× 10⁻² −9.75± 0.86× 10⁻²
N3 738162± 4631 1482799± 7329α3 7.12± 0.89× 10⁻² 8.95± 0.60× 10⁻²
N4 1023973± 5400 1527424± 6434α4 2.53± 0.07× 10⁻¹ 5.19± 0.06× 10⁻²
N5 894908± 4092 1093406± 4040α5 1.90± 0.06× 10⁻¹ 5.13± 0.07× 10⁻¹
N6 937073± 3729 1050245± 3390α6 −1.93± 0.49× 10⁻² −6.36± 0.44× 10⁻²
N7 1738326± 5687 1948264± 5116α7 0.98± 3.43× 10⁻³ −2.78± 0.32× 10⁻²
N8 626949± 1881 665218± 1678α8 1.46± 0.55× 10⁻² 1.73± 0.06× 10⁻¹
2p*(D*) GeV/c0 0.5 1 1.5 2 2.5 3 3.5 4 4.5 5
α
-1
-0.5
0
0.5
1DataMC
Figure 24: Comparison of the fit results onα in the 8 bins ofp∗(D∗)for data (black) and Monte Carlo (red). The difference observed in the4th, 5th and 8th bins is due to the slightly different helicity distributionfor data and MC in thesep∗(D∗) ranges.
track, as discussed in Section 4. Bin sizes are optimized895
to ensure a sufficient number of events in each bin, with896
4 bins inpT (0.0 - 0.4 - 1.0 - 2.0 - 4.0 GeV/c), 8 bins in897
θLAB (7.0◦−25.6◦−44.25◦−62.88◦−81.5◦−100.13◦−898
118.75◦ − 137.38◦ − 156.0◦) and 10 bins indXY (0.0 -899
0.3 - 1.3 - 2.78 - 3.2 - 4.0 - 5.4 - 9.1 - 11.4 - 23.6 - 40.0900
cm). The binning indXY roughly reflects the structure901
of theBABAR detector and the bins are numbered from 0902
to 9, bin 1 being the normalization bin. The normalized903
ratio of the data and MC as a function of different bins904
is provided as a correction factor for theK0S daughter905
reconstruction efficiency. In order to reduce the uncer-906
tainty from the imperfect simulation of the random track907
background or the potential differences between theK0S908
quality cut efficiencies in data and MC, we remove the909
17

) GeV/cSπp(0 0.05 0.1 0.15 0.2 0.25 0.3 0.35 0.4 0.45 0.5
Effi
cien
cy
0
0.1
0.2
0.3
0.4
0.5
0.6
0.7
0.8
0.9
DataMC
0 0.05 0.1 0.15 0.2 0.25 0.3 0.35 0.4 0.45 0.5
(%
)da
ta∈
MC
∈-da
ta∈ -5
05
1015
Figure 25: Soft pion reconstruction efficiency functions obtained fromthe fit to data (red) and MC (blue). Both the efficiency functions areshown together with the functions obtained by varying the central val-ues of the fit parametersp0 andδ by 1σ. The curve obtained using thecentral values is drawn in black. On top of the curves, the distributionof the relative difference between data and MC is shown.
immediate vicinity of the event’s primary vertex which910
is 3 mm in XY from the first (normalization) bin.911
Events of interest are selected by looking for the912
B → h+h−K0S (with h = π,K) decays in the data and913
MC samples. The MC sample includes events from914
generic B decays, light quark events (u,d,s,c) andτ+τ−915
decays. TheK0S is reconstructed from two oppositely916
charged tracks, the invariant mass of which is required917
to be within 25 MeV/c2 of the PDG value of theK0S918
mass (mk0s= 497.614± 0.024 MeV/c2) [6]. The two op-919
positely charged tracks must originate from a common920
vertex and the fit is required not to fail. The event is re-921
quired to have at least five GT tracks, two of which are922
oppositely charged GT tracks that when combined with923
the K0S candidate to form an object withmES > 5.19924
GeV/c2 and|∆E| < 0.3 GeV. About 93% of these events925
come from the light quark (udsc) continuum; the con-926
tribution fromτ+τ− production is about 2.5% and only927
about 3.5% of candidates arise from B decays, most of928
which are random track combinations. Figures 26 and929
27 show the data and MC comparison of theK0S mass,930
pT , θLAB anddXY distributions for the reconstructedK0S931
candidates.932
To determine the number ofK0S’s in each of the bins933
in data and MC, theK0S mass distributions in each of934
the bins are fitted with a sum of a double Gaussian and935
a constant background. The constant background, de-936
termined from the sideband regions in theK0S mass dis-937
tribution, [0.476, 0.485] U [0.511, 0.520] GeV/c2, for938
each bin, is then subtracted to determine the number of939
0
200
400
600
800
1000
1200
1400
1600
x 10 2
0.475 0.48 0.485 0.49 0.495 0.5 0.505 0.51 0.515 0.52
Eve
nts/
0.00
1
DataMC
KS Mass, GeV/c2
0
2500
5000
7500
10000
12500
15000
17500
20000
0 0.5 1 1.5 2 2.5 3
Eve
nts/
0.01
6Data
MC
pT, GeV/c
Figure 26:K0S mass (top) and transverse momentum (bottom) for data
and MC. MC is normalized to the data luminosity.
K0S in each bin. The limited statistics in a large fraction940
of bins makes it impractical to allow the slope of the941
background to float. The binned maximum log likeli-942
hood method is used since the defaultχ2-minimization943
method is less appropriate in this study as it systemati-944
cally, in a statistics-dependent way, underestimates the945
number of events in each bin.946
We define the values of the normalized ratiosRi jk and947
the uncertaintiesσRi jk , where the indicesi, j andk stand948
for the number of thepT , θLAB anddXY bins respectively,949
to be950
Ri jk = (Ni jk/Mi jk )/(Ni j1/Mi j1) (27)
18

0
1000
2000
3000
4000
5000
6000
7000
8000
0 20 40 60 80 100 120 140 160 180
Eve
nts/
0.25
Data
MC
θLABΟ
10
10 2
10 3
10 4
10 5
0 10 20 30 40 50 60 70 80
Eve
nts/
0.25
DataMC
dXY, cm
Figure 27:K0S polar angle (top) and transverse flight length (bottom)
for data and MC. MC is normalized to the data luminosity.
σRi jk = Ri jk
√
(
σNi jk /Ni jk
)2+
(
σMi jk /Mi jk
)2(28)
whereNi jk andσNi jk are the numbers ofK0S’s and their951
uncertainties in data andMi jk andσMi jk are the numbers952
of K0S’s and their uncertainties in MC. We also take into953
account the difference in theK0S mass resolutions in data954
and MC by performing numerical integration to deter-955
mine the efficiencies of the|mπ+π− −mK0S| < 12 MeV/c2
956
cut in data and MC. The efficiency corrected normalized957
ratio,Ri jk , also called the correction factor, is computed958
for each bin and also as a function of several different959
sets ofK0S quality cuts (cuts on theK0
S mass, 3-D orXY960
flight length or its significance, the 3-D orXY angle,961
α between theK0S momentum and the line connecting962
theK0S decay vertex and the primary vertex of the event,963
and, in one instance, a cut on theK0S → π
+π− vertexing964
quality), which also enables us to study the systematic965
uncertainties associated with a correction factor.966
To get the overall correction in theK0S daughter re-967
construction efficiency in an analysis, we apply the cor-968
rection factors to the signal MC. IfHi jk is the num-969
ber of events in the signal MC sample that falls within970
the bin (ijk), the relative weight of aK0S reconstruc-971
tion efficiency correction table elementRi jk is Hi jk /972
Htot, whereHtot = ΣHi jk and its statistical uncertainty is973√
(Hi jk)/Htot. The central value of the overall data/MC974
efficiency ratio is simply given by975
R=1
Htot
∑
i jk
Hi jkCi jk =∑
i jk
Ri jkCi jk (29)
Calculation of the statistical uncertainty on this num-976
ber is slightly non-trivial since we have to take into ac-977
count the fact that the statistical uncertainty on the nor-978
malization bin ratio,σRi j1, influences the entire row (ij).979
SubstitutingRi jk in Eq. 29 with the expression in Eq. 27980
and differentiating the resulting expression with respect981
to each of the variables that enter it while usingRi j1 =982
1, we obtain983
σR =1
Htot
∑
i j
{
∑
k
Hi jkR2i jk +
∑
k,1
{Hi jkσRi jk }2 + {∑
k,1
Hi jkRi jkσRi j1}2}
12
(30)
where the first term reflects the finite size of the signal984
MC sample used in the study and is generally the small-985
est, the second term reflects the statistical uncertainties986
on the number ofK0S’s in bins other than the normaliza-987
tion bin, and the third term, the dominant one, reflects988
the dependence on the statistical precision ofRi j1 of the989
correction factors in each of the binsRi jk , k , 1.990
The K0S correction factors are applied to signal MC991
for the decay modesB0→ φK0S andB0→ π+D−(D− →992
K0Sπ−), which provideK0
S spectra representative of most993
cases ofK0S used inBABAR analyses, to determine the994
overall correction factor and its statistical error. The995
above exercise is repeated for several sets ofK0S qual-996
ity cuts, from none to tight, and for three different bin-997
ning approaches. Half of the largest deviation in theK0S998
correction factors for differentK0S quality cuts is con-999
sidered to be the systematic uncertainty associated with1000
K0S daughter reconstruction efficiency. For these modes1001
we are able to determine the ratio of the data and MC1002
19

K0S daughter reconstruction efficiency to be about 99.5%1003
and with a statistical error of∼ 0.4% and a systematic1004
uncertainty of∼0.7%.1005
9. Conclusion1006
In conclusion, we studied the track reconstruction1007
efficiency of charged particles inBABAR over a wide1008
range of momentum, polar angle, and track separation.1009
Our results come from several different control sam-1010
ples, which are observed to be self-consistent, and well1011
modeled in MC. The overall reconstruction efficiency1012
for isolated tracks is found to be consistent with MC1013
predictions. We also measured the charge asymmetry1014
in the track reconstruction, which was found be con-1015
sistent with zero. Any observed difference between1016
data and MC in the track reconstruction efficiency could1017
be considered as a source of systematic uncertainty in1018
all the physics analyses inBABAR. For physics anal-1019
yses with low multiplicity and similar topology to the1020
Tau31 decays and for charged tracks with momentum1021
greater than 180 MeV/c, the results from the Tau311022
study should be used; for other B and D decays, the1023
results from the ISR study could be considered. For1024
charged tracks with momenta less than 180 MeV/c, an1025
additional systematic uncertainty of 1.54% per track1026
should be applied. TheK0S reconstruction efficiency in1027
data and MC is found to be a function ofK0S momentum,1028
polar angle and transverse flight distance, which needs1029
to be considered forK0S reconstruction inBABAR.1030
10. Acknowledgements1031
We are grateful for the extraordinary contributions of1032
our PEP-II colleagues in achieving the excellent lumi-1033
nosity and machine conditions that have made this work1034
possible. The success of this project also relies criti-1035
cally on the expertise and dedication of the computing1036
organizations that supportBABAR. The collaborating in-1037
stitutions wish to thank SLAC for its support and the1038
kind hospitality extended to them. This work is sup-1039
ported by the US Department of Energy and National1040
Science Foundation, the Natural Sciences and Engi-1041
neering Research Council (Canada), the Commissariat1042
a l’Energie Atomique and Institut National de Physique1043
Nucleaire et de Physique des Particules (France), the1044
Bundesministerium fur Bildung und Forschung and1045
Deutsche Forschungsgemeinschaft (Germany), the Isti-1046
tuto Nazionale di Fisica Nucleare (Italy), the Founda-1047
tion for Fundamental Research on Matter (The Nether-1048
lands), the Research Council of Norway, the Ministry of1049
Education and Science of the Russian Federation, Min-1050
isterio de Ciencia e Innovacion (Spain), and the Science1051
and Technology Facilities Council (United Kingdom).1052
Individuals have received support from the Marie-Curie1053
IEF program (European Union), the A. P. Sloan Foun-1054
dation (USA) and the Binational Science Foundation1055
(USA-Israel).1056
References1057
[1] J. Sulkimoet al., Nucl. Inst. and Meth. A506 250 (2003), J.1058
Allison et al., IEEE Trans. Nucl. Sci.53 270 (2006).1059
[2] P. Golonkaet al., Comput. Phys. Commun.174 818 (2006), P.1060
Golonka and Z. Was, Eur. Phys. J. C45 97 (2006).1061
[3] D. J. Lange, Nucl. Instr. Methods Phys. Res., Sect. A462, 1521062
(2001).1063
[4] B. Aubertet al.(BABAR Collaboration), Nucl. Instr. and Methods1064
A 479, 1 (2002).1065
[5] D. Brown, talk presented at CHEP97,1066
http://www.ifh.de/CHEP97/abstract/a341.htm.1067
[6] K. Nakamuraet al.(Particle Data Group), J. Phys. G37, 0750211068
(2010).1069
[7] B. F. Ward, S. Jadach, and Z. Was, Nucl. Phys. Proc. Suppl.116,1070
73 (2003).1071
[8] S. Jadach, Z. Was, R. Decker, and J. H. Kuhn, Comp. Phys.1072
Comm.76, 361 (1993).1073
[9] E. Barberio and Z. Was, Comp. Phys. Comm.79, 291 (1994).1074
[10] T. Sjostrand, Comput. Phys. Commun.82, 74 (1994).1075
[11] S. Jadach and Z. Was, Comput. Phys. Commun.85, 453 (1995).1076
[12] V.P.Druzhinin,http://www.slac.stanford.edu/BFROOT/www/Physics/Tools1077
[13] H. Czyz, J.H. Kuhn,A. Grzelinska and J.H. Kuhn, Phys. Rev. D1078
81, 094014 (2010).1079
[14] B. Aubertet al.(BABAR Collaboration), Phys. Rev. D70, 0720041080
(2004).1081
[15] B. Aubertet al.(BABAR Collaboration), Phys. Rev. D73, 0520031082
(2006).1083
[16] B. Aubertet al.(BABAR Collaboration), Phys. Rev. D76, 0920051084
(2007).1085
[17] B. Aubertet al.(BABAR Collaboration), Phys. Rev. D76, 0120081086
(2007).1087
[18] B. Aubertet al.(BABAR Collaboration), Phys. Rev. D77, 0920021088
(2008).1089
[19] B. Aubertet al.(BABAR Collaboration), Phys. Rev. D78, 0111051090
(2008).1091
[20] S. Menary, CLEO Internal Note,CBX 92-103 (1992) (unpub-1092
lished).1093
[21] G. Brandenburget al. (CLEO Collaboration), Phys. Rev. D58,1094
052003 (1998)1095
[22] L. Gibbonset al. (CLEO Collaboration), Phys. Rev. D56, 37831096
(1997)1097
[23] Charge-conjugate reactions are implied throughout this paper1098
except for section 6.1099
20
Related Documents