ORIGINAL PAPER Tracing the factors responsible for arsenic enrichment in groundwater of the middle Gangetic Plain, India: a source identification perspective Pankaj Kumar Manish Kumar A. L. Ramanathan Maki Tsujimura Received: 14 December 2008 / Accepted: 2 June 2009 / Published online: 24 June 2009 Ó Springer Science+Business Media B.V. 2009 Abstract Arsenic contamination in groundwater is of increasing concern because of its high toxicity and widespread occurrence. This study is an effort to trace the factors responsible for arsenic enrichment in groundwater of the middle Gangetic Plain of India through major ion chemistry, arsenic speciation, sediment grain-size analyses, and multivariate statis- tical techniques. The study focuses on the distinction between the contributions of natural weathering and anthropogenic inputs of arsenic with its spatial distri- bution and seasonal variations in the plain of the state Bihar of India. Thirty-six groundwater and one sediment core samples were collected in the pre- monsoon and post-monsoon seasons. Various graph- ical plots and statistical analysis were carried out using chemical data to enable hydrochemical evaluation of the aquifer system based on the ionic constituents, water types, hydrochemical facies, and factors con- trolling groundwater quality. Results suggest that the groundwater is characterized by slightly alkaline pH with moderate to strong reducing nature. The general trend of various ions was found to be Ca 2? [ Na ? [ Mg 2? [ K ? [ NH 4 ? ; and HCO 3 - [ Cl - [ SO 4 2- [ NO 3 - [ PO 4 3- [ F - in both sea- sons. Spatial and temporal variations showed a slightly higher arsenic concentration in the pre-monsoon period (118 lg/L) than in the post-monsoon period (114 lg/L). Results of correlation analyses indicate that arsenic contamination is strongly associated with high concentrations of Fe, PO 4 3- , and NH 4 ? but relatively low Mn concentrations. Further, the enrich- ment of arsenic is more prevalent in the proximity of the Ganges River, indicating that fluvial input is the main source of arsenic. Grain size analyses of sediment core samples revealed clay (fine-grained) strata between 4.5 and 7.5 m deep that govern the vertical distribution of arsenic. The weathering of carbonate and silicate minerals along with surface- groundwater interactions, ion exchange, and anthro- pogenic activities seem to be the processes governing groundwater contamination, including with arsenic. Although the percentage of wells exceeding the permissible limit (50 lg/L) was less (47%) than that reported in Bangladesh and West Bengal, the percent- age contribution of toxic As(III) to total arsenic concentration is quite high (66%). This study is vital considering that groundwater is the exclusive source of drinking water in the region and not only makes situation alarming but also calls for immediate attention. P. Kumar A. L. Ramanathan School of Environmental Sciences, JNU, New Delhi 67, India P. Kumar M. Tsujimura Graduate School of Life and Environmental Sciences, University of Tsukuba, Tsukuba 305-8572, Japan M. Kumar (&) Department of Urban Engineering, School of Engineering, University of Tokyo, Tokyo 113-8656, Japan e-mail: [email protected]; [email protected] 123 Environ Geochem Health (2010) 32:129–146 DOI 10.1007/s10653-009-9270-5

Welcome message from author
This document is posted to help you gain knowledge. Please leave a comment to let me know what you think about it! Share it to your friends and learn new things together.
Transcript
ORIGINAL PAPER
Tracing the factors responsible for arsenic enrichmentin groundwater of the middle Gangetic Plain, India:a source identification perspective
Pankaj Kumar Æ Manish Kumar Æ A. L. Ramanathan ÆMaki Tsujimura
Received: 14 December 2008 / Accepted: 2 June 2009 / Published online: 24 June 2009
� Springer Science+Business Media B.V. 2009
Abstract Arsenic contamination in groundwater is
of increasing concern because of its high toxicity and
widespread occurrence. This study is an effort to trace
the factors responsible for arsenic enrichment in
groundwater of the middle Gangetic Plain of India
through major ion chemistry, arsenic speciation,
sediment grain-size analyses, and multivariate statis-
tical techniques. The study focuses on the distinction
between the contributions of natural weathering and
anthropogenic inputs of arsenic with its spatial distri-
bution and seasonal variations in the plain of the state
Bihar of India. Thirty-six groundwater and one
sediment core samples were collected in the pre-
monsoon and post-monsoon seasons. Various graph-
ical plots and statistical analysis were carried out using
chemical data to enable hydrochemical evaluation of
the aquifer system based on the ionic constituents,
water types, hydrochemical facies, and factors con-
trolling groundwater quality. Results suggest that the
groundwater is characterized by slightly alkaline pH
with moderate to strong reducing nature. The general
trend of various ions was found to be
Ca2? [ Na? [ Mg2? [ K? [ NH4?; and HCO3
- [Cl- [ SO4
2- [ NO3- [ PO4
3- [ F- in both sea-
sons. Spatial and temporal variations showed a slightly
higher arsenic concentration in the pre-monsoon
period (118 lg/L) than in the post-monsoon period
(114 lg/L). Results of correlation analyses indicate
that arsenic contamination is strongly associated with
high concentrations of Fe, PO43-, and NH4
? but
relatively low Mn concentrations. Further, the enrich-
ment of arsenic is more prevalent in the proximity of
the Ganges River, indicating that fluvial input is the
main source of arsenic. Grain size analyses of
sediment core samples revealed clay (fine-grained)
strata between 4.5 and 7.5 m deep that govern the
vertical distribution of arsenic. The weathering of
carbonate and silicate minerals along with surface-
groundwater interactions, ion exchange, and anthro-
pogenic activities seem to be the processes governing
groundwater contamination, including with arsenic.
Although the percentage of wells exceeding the
permissible limit (50 lg/L) was less (47%) than that
reported in Bangladesh and West Bengal, the percent-
age contribution of toxic As(III) to total arsenic
concentration is quite high (66%). This study is vital
considering that groundwater is the exclusive source of
drinking water in the region and not only makes
situation alarming but also calls for immediate
attention.
P. Kumar � A. L. Ramanathan
School of Environmental Sciences, JNU, New Delhi 67,
India
P. Kumar � M. Tsujimura
Graduate School of Life and Environmental Sciences,
University of Tsukuba, Tsukuba 305-8572, Japan
M. Kumar (&)
Department of Urban Engineering, School of Engineering,
University of Tokyo, Tokyo 113-8656, Japan
e-mail: [email protected];
123
Environ Geochem Health (2010) 32:129–146
DOI 10.1007/s10653-009-9270-5

Keywords Arsenic � Gangetic Plain �Groundwater � Health � Hydrogeochemical
processes � India � Mobilization and transport �Nitrate contamination � Grain-size analysis
Introduction
The World Health Organization (WHO) has repeat-
edly insisted that the single major factor adversely
influencing the general health and life expectancy of
a population is the lack of ready access to clean
drinking water (Kumar et al. 2007). Because of
severe problems of water stress and deterioration of
water quality, there is high concern about groundwa-
ter quality all over the world. The quality of
groundwater depends on the composition of recharg-
ing water, the mineralogy and reactivity of the
geological formations in aquifers, the impact of
human activities, and environmental conditions that
may affect the geochemical mobility of certain
constituents (Kumar et al. 2006). These geochemical
processes are responsible for seasonal and spatial
variations in groundwater chemistry (Matthess 1982;
Kumar et al. 2009a). Groundwater evolves chemi-
cally by interacting with aquifer minerals or by
internal mixing among different groundwater along
flow paths in the subsurface (Domenico 1972). The
presence of trace elements in groundwater is an
important issue because it affects possible uses of
water. Arsenic contamination of groundwater, in
particular, is of increasing concern because of the
high toxicity and widespread occurrence of this
element (Jain and Ali 2000; Smedley and Kinniburgh
2002).
Further, exposure to elevated levels of arsenic (As)
in groundwater has become a global concern in recent
years (Meliker et al. 2008). Most estimates of arsenic
pollution have focussed on the predominance of
arsenic poisoning in the groundwater of West Bengal
(India) and Bangladesh (Bhattacharya et al. 1997;
Ben et al. 2003; Ahmed et al. 2004), which has been
thought to be limited to the Ganges Delta (the lower
Gangetic Plain). Early surveys have been conducted
on arsenic contamination in groundwaters of West
Bengal (Saha 1984; Mazumder et al. 1998) and
groundwater in the Union Territory of Chandigarh
and its surroundings in the northwestern upper Ganga
Plain and recent findings in the Tarai areas of Nepal
(Chakraborti et al. 2003). Several authors have
suggested that the reductive dissolution of Fe(III)
oxyhydroxides under strongly reducing conditions of
the young alluvial sediments is the cause for As
mobilization (Ahmed et al. 2004; Bhattacharya et al.
1997; Harvey et al. 2002; McArthur et al. 2004;
Nickson et al. 1998; Nickson et al. 2000). The
reduction is driven by microbial degradation of
sedimentary organic matter, which is a redox-depen-
dent process consuming dissolved O2 and NO3
(Nickson et al. 2000).
Gradually, researchers have shifted their focus to
vertical profiling of arsenic contamination (Datta and
Subramanian 1994; Acharyya and Shah 2004; Ach-
aryya 2004, Nickson et al. 2007; Shah 2008). It was
an important step towards precise understanding of
vertical mobilization of As and role of geology of the
area. However, most of the studies have correlated
sediment colour with As concentrations (Bromssen
et al. 2007, 2008). Very few attempts have been made
to correlate grain-size distribution with As contam-
ination. Further, it is recognized that the environ-
mental impact and mobility of an element is not
purely controlled by total concentration but the
speciation of the element. For example in the case
of arsenic, As(III) is more toxic than As(V). There-
fore, inclusion of spatial distribution of different
species becomes imperative for complete discussion
of arsenic contamination.
Furthermore, the arsenic contamination in the
alluvium plain of the Gangetic Plain may cause
secondary effects when it enters the food chain. The
arsenic contamination may result from a combination
of natural and anthropogenic processes, for example
weathering reactions, biological activity, mining
activity, combustion of fossil fuels, use of arsenical
pesticides, herbicides, and crop desiccants, and use of
arsenic as an additive to livestock, particularly for
poultry feed (Huq et al. 2001). Therefore, it is
essential to distinguish between the contributions by
natural weathering and anthropogenic inputs. Glob-
ally, contaminated drinking water is the chief source
of chronic human intoxication (Gebel 2000; Smith
et al. 2000) and may result in skin ailments, such as
hyper-pigmentation and kurtosis, and progress to
cancer and, ultimately, death. The current drinking
water quality guideline for arsenic is 10 lg/L (WHO
1993). The current standard for arsenic in drinking
130 Environ Geochem Health (2010) 32:129–146
123

water in both Bangladesh and India is 50 lg/L.
Moreover, the upper, middle, and lower Gangetic
Plains are the most densely populated areas of India.
Moreover, in these parts of India dependence on
groundwater has increased tremendously, which
intensifies the likely health problem from groundwa-
ter contamination. Thus, there is an immediate need
for an inventory which can take account of the
amount of arsenic actually present in the area and
number of people actually exposed to it.
In the work discussed in this paper an effort was
therefore made to reveal the spatial distribution and
predict the seasonal changes in the levels of various
contaminants, to quantify the occurrence of different
arsenic species, and to understand the mechanism
controlling the occurrence of arsenic and to distinguish
between the contributions made by natural weathering
and anthropogenic inputs. An effort has been also
made to correlate grain-size distribution of sediment
with depth-wise variation of As concentration.
Study area
Bhagalpur district is located between 25�13.290 and
25�6080 N and from 86�64.080 to 87�5420 E (Fig. 1).
The district is a peneplain, intersected by numerous
streams. Surface levels varied because of high banks
of the Ganga, Koshi (Ghugri), Chanari, and Chandan.
The geomorphology of the area is a monotonously
flat and featureless plain with gradient towards the
river Ganges. The southwestern monsoon brings
much-needed rainfall and nearly 70% of the rainfall
occurs during the months of July, August, and
September. There is significant seasonal variation in
temperature with mean annual temperature of 26�C.
The major part of the district is characterised by an
arid soil moisture regime according to the criteria laid
in Soil Taxonomy (Brady and Weil 2002).
Hydrogeology
Geomorphologically the area is represented by allu-
vial deposits of Quaternary age. The area has been
divided into four different zones: recent alluvium
(non-calcareous), recent alluvium (calcareous), Tal
land soils, and old alluvium (Fig. 1). The Gangetic
Plain has huge amounts of river-deposited sediments
which accumulate on the flood and deltaic plain of
Bengal. They generally consist of Pleistocene and
Holocene formations. However, the central Gangetic
Plain has a unique geological geo-morphological
Fig. 1 General
geomorphology of the
Bhagalpur district,
including sampling
locations
Environ Geochem Health (2010) 32:129–146 131
123

setting with aquifers ranging from Quaternary Hima-
layan alluvial fans and plains to the pre-Cenozoic
(Precambrian to Cretaceous) Indian cratonic, igneous,
and meta-sediment shield provinces. XRD studies on
soil samples of As-safe older alluvial and As-
contaminated newer alluvium from the Middle Gan-
getic Plain reveals an mineralogical assemblage of
quartz, muscovite, chlorite, kaolinite feldspar, amphi-
bole, and goethite (Shah 2008). The groundwater
occurs in Holocene sandy sediments and forms
extensive unconfined to leaky confined aquifers,
i.e., the area has both confined and unconfined
aquifers. Water level fluctuates with seasonal
recharge and discharge. The depth of wells varies
from 6 to 13 m bgl. The depth to water level has been
observed to vary from 3 to 8 m bgl during the pre-
monsoon season and from 2 to 4 m bgl during the
post-monsoon season. The multiple aquifer system of
this region has variable hydraulic conductivity. The
deeper aquifers i.e., semi-confined aquifers are pro-
lific aquifers and may be a future water resource
supplies for the region with good hydraulic charac-
teristics. The district has two means of irrigation—
canals and tube wells (groundwater).
Materials and methods
Sampling wells were selected in such a way that they
represent different geological formations and land-
use patterns at varying topography of the area. Thirty-
six groundwater samples were collected during May
and November 2007 (Fig. 1) in order to observe the
impact of the monsoon season on arsenic and other
contaminant status of the area. Groundwater samples
were collected in clean polyethylene bottles. For bore
well and hand pumps, the water samples were
collected after pumping the water for 5–10 min. For
open wells, water samples were collected 30 cm
below the water level using a depth sampler.
In-situ measurements mainly EC, PH, and ORP
were measured by use of a portable Orion Thermo
water analysing kit (Model Beverly, MA, USA;
01915). Total arsenic was determined with the help of
a Digital Arsenator (Wagtech, UK) and arsenic
speciation was performed in the field with disposable
cartridges (Metal Soft Center, PA, USA) which
absorb As(V), but allow As(III) to pass through.
Further, these samples were stored below 4�C in a
portable ice-box to minimize chemical alteration. The
collected groundwater samples were classified for
anion and cation analysis. Further, groundwater
samples were filtered through 0.45-lm Millipore
filter paper and acidified with 2 M HNO3 (Ultra pure;
Merck) for cation analysis. HBO3 acid was used as
preservative for nitrate analysis (Kumar et al. 2009b).
Fe and Mn were analysed in the laboratory by use
of an atomic absorption spectrophotometer (Shima-
dzu AA-6800). Concentrations of total arsenic were
cross-checked on acidified samples using graphite-
furnace (GF) AAS (Shimadzu AA-6800) in absorp-
tion mode using chemical standards; the detection
limit was 2 lg/L. Major cation analysis (Na?, K?,
Ca2?, and Mg2?) was carried out by use of an EEL
flame photometer (APHA 1995). The concentration
of HCO3- was measured by acid titration. Other
anions F-, Cl-, NO3-, SO4
2-, and PO43- were
analysed by use of a Dionex DX-120 ion chromato-
graph. Other characteristics, for example SiO2 and
NH4? were analysed with a Jenway model 6505
spectrophotometer. High-purity reagents (Merck) and
Milli-Q water (Model Milli-Q, Biocel) were used for
all the analysis.
Analytical precision was checked by normalized
inorganic charge balance (NICB) (Huh et al. 1998;
Kumar et al. 2006). This is defined as [(Tz? - Tz-)/
(Tz? ? Tz-)] and represents the fractional difference
between total cations and anions. In general, samples
showed a charge imbalance mainly in favour of
positive charge. The observed charge balance support
the quality of the data points, which is better than
±5% except for some samples.
Sediment grain-size analysis
With the help of local drillers one borehole was
drilled to confirm different lithological units and its
relationship with arsenic enrichment. During drilling,
samples were collected on the basis of visible change
in sediment colour and texture. The change was rapid
initially and thus samples were collected every 1.5 m;
later the depth interval between two samples col-
lected was 3 m. Thus, thirteen (n = 13) samples were
obtained from the single core sediment. Only washed
and disturbed sediments could be sampled as a result
of the hand percussion technique. Washed sediments
were collected in a bucket and allowed to settle
before being transferred on to a bamboo carpet. Later,
132 Environ Geochem Health (2010) 32:129–146
123

the sediment samples were allowed to drain (but not
dry), before putting them into plastic bags (Bromssen
et al. 2007). Samples were air-dried in the laboratory.
Stones and plant fragments were removed by passing
the dried samples through a 2-mm sieve. The sieved
samples were powdered and finally passed through
ASTM standard sieves. Size fractions of the bed
sediments down to 37 lm were separated and
fractionated using the Astenburg cylinder method
based on Stoke’s law (Griffiths 1967).
Statistical analysis
The matrix of hydrogeochemical data obtained was
subjected to multivariate analytical techniques. These
techniques help to simplify and organize large data
sets in order to make useful generalizations. At first
data was subjected to correlation analysis using
Spearman’s rank coefficient which is based on the
ranking of the data and not their absolute value.
Thereafter, factor analysis was performed for effec-
tive display of complex relationships among many
samples (Kumar et al. 2009c). These analyses were
performed using Statistical Package for Social Sci-
ences (SPSS) software package (Version 10.5).
Result and discussion
General groundwater chemistry
A statistical summary of the analytical results (min-
imum, maximum, mean, and the standard deviation)
for each water-quality characteristic analysed is given
in Table 1.
Result for pH values at different lithology showed
that the groundwater was alkaline in nature (Kumar
et al. 2007). pH, EC, and Cl- values were higher in
Table 1 Statistical summary of hydro-geochemical parameters of the groundwater
Characteristic Unit Minimum Maximum Average SD
Pre-
monsoon
Post-
monsoon
Pre-
monsoon
Post-
monsoon
Pre-
monsoon
Post-
monsoon
Pre-
monsoon
Post-
monsoon
Ph 7.8 7.66 8.3 8.16 8.13 7.98 0.13 0.13
ORP mV -134 -125 169 135 8.97 7.91 95.19 86.68
EC ls/cm 250 217 980 967 599 591 175 174
TDS mg/L 191.25 185 710 685 455 441 133 128
Na? mg/L 5.76 5.16 41.91 37.58 18.66 17 8.54 8.13
K? mg/L 0.44 0.43 3.22 3.16 1.45 1.39 0.70 0.66
Ca2? mg/L 20.7 18.87 126 161 64.81 69.4 30.28 37.91
Mg2? mg/L 7.83 8.36 18.2 19.43 10.67 11.5 2.21 2.28
HCO3- mg/L 15.2 23.74 214.5 266 105 129 42.19 57.68
F- mg/L 0.08 0.06 4.94 2.48 0.76 0.63 0.86 0.50
Cl- mg/L 6.56 6.08 219.93 154 69.67 55.52 50.78 35.89
NO3- mg/L 1.01 1.12 39 46.7 23.71 22.66 11.59 13.33
SO42- mg/L 3.84 3.61 72.8 68.4 32.93 27.68 20.19 16.65
PO43- mg/L 2.66 2.36 6.37 5.65 4.05 3.59 0.95 0.84
H4SiO4 mg/L 14 17.27 49.33 55.55 30.01 35.1 8.15 9.24
NH4? mg/L 0.59 0.54 3.11 2.83 1.38 1.26 0.76 0.70
Fe mg/L 0.66 0.43 7.62 6.84 3.19 2.82 2.23 1.98
Mn mg/L 0.01 0.01 1.79 1.75 0.66 0.63 0.56 0.55
As (tot) lg/L 19.1 18.46 118 113.5 51.23 48.97 27.64 25.76
As3? lg/L 10.9 11.63 81.1 75.9 34.43 32.73 21.04 18.04
As5? lg/L 7.1 5.32 55.2 47.89 16.81 16.24 10.28 11.49
Environ Geochem Health (2010) 32:129–146 133
123

the pre-monsoon season whereas HCO3- values were
higher in the post-monsoon season. On the other
hand, no significant seasonal variations were
observed for SO42- (Table 1). Higher values of pH
and EC in the pre-monsoon season are the combined
effect of the high concentration of dissolved solids
and/or high ionic strength of the groundwater, local
variation in soil type, multiple aquifer system, and
agricultural activities in the area. Higher HCO3-
concentrations in the post-monsoon period are
because of weathering of carbonaceous sandstones
by rain water followed by subsequent precipitation of
HCO3- along with other cations.
The higher and lower concentrations of Cl- in the
pre-monsoon and post monsoon seasons, respec-
tively, may be because of the input from sewage
effluents in the village areas and dilution by rain
water in post monsoon season (Todd 1959). The
groundwater seems to have secondary salinity, as
indicated by high Cl- and SO42- concentrations. The
presence of salts in the unsaturated top zone of the
groundwater suggests that the flushing rate of the
aquifers may be slow because of high Cl- concen-
trations trapped in clayey lenses, which may be
gradually diffusing into the aquifer.
The average concentration of NO3- was found to
be as high as 23 mg/L (Table 1), which indicates the
influence of agricultural activities, fertilizer use, and
microbial mineralization on the groundwater. Further,
the higher concentration of nitrate may also be a
result of the presence of E. coli, Staphylococcus
aureus, Proteus vulgaris, Salmonella typhii, and
Pseudomonas aeruginosa in the faecal matter, as
reported by Saha and Kumar (2006). This seems
reasonable as there is a severe lack of a proper
sanitation system in the district. Further, animal
waste sources are also a significant contributor of
nitrate to groundwater, especially within mixed land-
use. Some parts of the study area is occupied by
industrial and urban land-use, therefore some nitrate
leaching from landfill sites and industrial effluents
cannot be neglected. The underlying cause of PO43-
in the groundwater of the Bhagalpur district indicates
input of fertilizers in farmlands to enhance paddy and
wheat productivity and the dilution effect in the rainy
season. In Bhagalpur, F- varied significantly from
0.08 to 4.94 mg/L in the pre-monsoon season and
0.06 to 2.48 mg/L in the post-monsoon season
(Table 1), which is an indicator of weathering of
mica containing mineral like biotite. Pollution and
health aspects of this have already been reported by
Chaurasia et al. (2007). Finally, among anions the
average value trend found was HCO3- [ Cl- [ -
SO42- [ NO3
- [ PO43- [ F- in both seasons.
The dominant cation was Ca2? followed by Na?,
Mg2? K?, and NH4?. There was little seasonal
variation in most of the cations, except a few
locations where seasonal variations were significant
(Table 1). In the post-monsoon season, high concen-
trations of Ca2? may be because of weathering of
carbonate mainly from gypsum, plagioclase and
feldspar minerals, which are abundant in the flood-
plain regions (Bhattacharya et al. 1997). However,
the results for Na? and K? followed the opposite
pattern with high concentrations in the pre-monsoon
season (Table 1). This implies that the contribution of
cations via alumino-silicate weathering is low in
comparison with carbonate weathering. The average
ratio trend of Ca2? ? Mg2?/Na? ? K? varied from
4.65 in the pre-monsoon season to 5.45 in the post-
monsoon season, indicating the dominance of car-
bonate rock weathering in the groundwater of Bha-
galpur. Further, the concentration of H4SiO4 varied
from 14 to 49 mg/L in the pre-monsoon season and
from 17 to 56 mg/L in the post-monsoon season
(Table 1). The slight increment in concentration
indicates the possibility of alumino-silicate weath-
ering in the rainy season.
Total arsenic concentrations in the groundwater
varied from 19.1 to 118 lg/L in the pre-monsoon
season and from 18.5 to 113.5 lg/L in post-monsoon
season (Table 1). The concentration of Fe varied
from 0.66 to 7.62 mg/L in the pre-monsoon season
and from 0.43 to 6.84 mg/L in the post-monsoon
season whereas Mn values were very low in both
seasons (Table 1). This high concentration of Fe and
low concentration of Mn is indicative of a reducing
environment in the groundwater environment of the
area. The concentration of NH4? varied from 0.59 to
3.11 mg/L in the pre-monsoon season and from 0.54
to 2.83 mg/L in the post-monsoon season (Table 1).
NH4? is a good indicator of contamination from
inadequate sanitation facilities. The finding supports
an earlier argument pertaining to higher NO3- and
further shows that some dilution occurs in the post-
monsoon season.
134 Environ Geochem Health (2010) 32:129–146
123

Graphical representation of hydrochemical data
In this study, water-quality data were analysed by
use of Piper diagrams to gain better insight into the
hydro-geochemical processes operating in the
groundwater environment of the central Gangetic
Plain that resulted in the spatial and temporal
variation. The major cations and anions for the
analysed water were plotted on a Piper diagram
(Figs. 2, 3). It was found that not only were the
water samples of Ca-Cl (about 62%) and Ca-HCO3
(about 36%) type in the pre-monsoon period but
also remained so in the post-monsoon period, with
slight changes in their percentage share of each
water type of Ca-HCO3 (*59%) and Ca-Cl
(*40%). This indicates the presence of carbona-
ceous sandstone in the aquifers and weathering of
carbonate minerals in the post-monsoon period
whereas in the pre-monsoon period the result
favours salt precipitation. In most places hardness
is of the CaCO3 type with some locations saturated
with calcite.
Statistical analysis
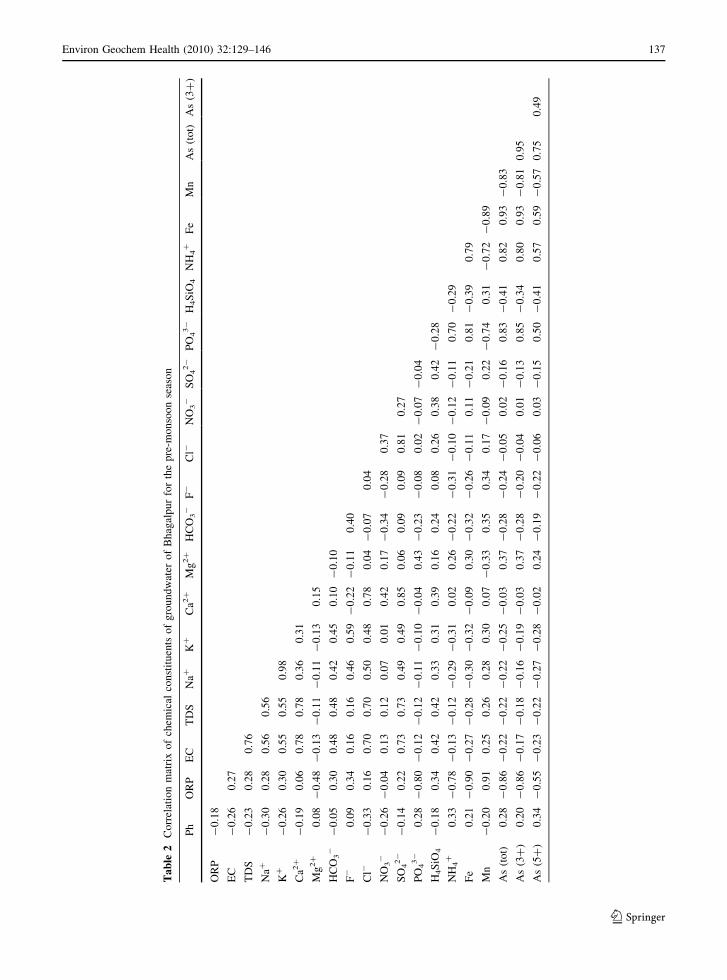
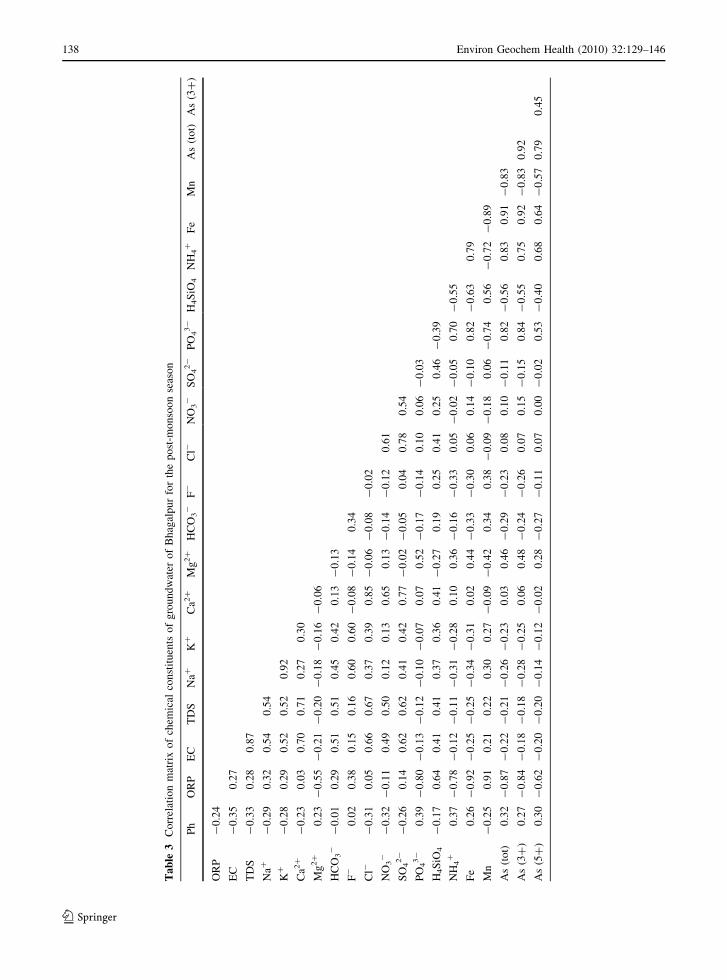
Correlation analysis
The correlation pattern for the pre-monsoon and post-
monsoon periods are given in Tables 2 and 3,
respectively; these give a clear picture of hydro-
chemical processes occurring in the study area. There
was an inverse correlation between arsenic and Eh
(redox potential), i.e., the value of Eh increases with
decreasing arsenic concentration, which mean con-
centration of arsenic increases with increasing redox
status of any environment. Further, significant
positive correlation between As and Fe, NH4?, and
PO43- were also noticed along with negative corre-
lation between As and Mn, which substantiate the
strong reducing character of this environment. There
is a good correlation between Na? and K? which
indicates that the source for both elements could be
the same. There are good correlations between TDS
and Ca2?, between TDS and Cl-, and between TDS
and SO42-, which indicate that carbonate weathering
Fig. 2 Piper diagram of
groundwater in the pre-
monsoon season with
legend of 26 sampling
locations
Environ Geochem Health (2010) 32:129–146 135
123

with anthropogenic sources, mainly fertilizers, con-
trol the geochemistry of the groundwater in the pre-
monsoon period. Further, good correlations between
Ca2? and Cl- and between Ca2? and SO42- are
readily apparent, which indicates that both gypsum
(absorbed in clay) and limestone are acting as a
source of calcium. During the post-monsoon season,
an additional correlation arises between TDS and
HCO3-, which further supports the existence of
carbonate weathering in the area. Other correlations
of different strength, for example the correlation
between Cl- and SO4-and between Cl- and NO3
-,
may be attributed to secondary leaching.
Factor analysis
Factor analysis of hydrochemical properties of the
groundwater samples identified five major compo-
nents (factor) in each season (Tables 4 and 5). The
number of significant factors within the dataset was
determined by including only components with eigen-
values [1.0. The total variability explained by the
identified five factors in the pre-monsoon and post-
monsoon seasons were 80.38 and 81.77%,
respectively. The degree of association between each
variable and factor is shown by their respective
loading for each component. The pre-monsoon
(Table 4) and post monsoon (Table 5) results
substantiate the fact that there is an insignificant
seasonal variation in the governing hydro-geochemi-
cal processes that control the groundwater quality in
the area, as is evident from the loading of each variable
on each factor and the communality of each variable.
Although there is a slight difference in the loading of
each variable in each factor in each season, the
numbers of pairs of variables in each component
remain same throughout the year with very few
exceptions.
In general, factor 1 exhibits high loading, i.e.,
strong geochemical associations between PO43-, Fe,
As, and As(III) and inverse association with Depth,
ORP and Mn in both seasons. Such loading for the
most important factor i.e., component 1 is a strong
indicator of a reducing environment which seems to
be the main reason for arsenic enrichment in the
groundwater. Factor 2 represents the association of
EC and TDS with some major ions which indicates
percolation of salts and halite deposits. Factor 3 is
accounted for Na and K that indicate feldspar
weathering. Thus, factors 2 and 3 account for
geochemical processes which are less important than
the existence of the reducing environment expressed
by factor 1. Factor 4 is attributed to anthropogenic
activities, as is evident from the high loading for Ph
with NO3-, which arise from biological mineraliza-
tion and agricultural activities. Further, component 4
Fig. 3 Piper diagram of
groundwater in the post-
monsoon season with
legend of 26 sampling
locations
136 Environ Geochem Health (2010) 32:129–146
123
Ta
ble
2C
orr
elat
ion
mat
rix
of
chem
ical
con
stit
uen
tso
fg
rou
nd
wat
ero
fB
hag
alp
ur
for
the
pre
-mo
nso
on
seas
on
Ph
OR
PE
CT
DS
Na?
K?
Ca2
?M
g2?
HC
O3-
F-
Cl-
NO
3-
SO
42-
PO
43-
H4S
iO4
NH
4?
Fe
Mn
As
(to
t)A
s(3
?)
OR
P-
0.1
8
EC
-0
.26
0.2
7
TD
S-
0.2
30
.28
0.7
6
Na?
-0
.30
0.2
80
.56
0.5
6
K?
-0
.26
0.3
00
.55
0.5
50
.98
Ca2
?-
0.1
90
.06
0.7
80
.78
0.3
60
.31
Mg
2?
0.0
8-
0.4
8-
0.1
3-
0.1
1-
0.1
1-
0.1
30
.15
HC
O3-
-0
.05
0.3
00
.48
0.4
80
.42
0.4
50
.10
-0
.10
F-
0.0
90
.34
0.1
60
.16
0.4
60
.59
-0
.22
-0
.11
0.4
0
Cl-
-0
.33
0.1
60
.70
0.7
00
.50
0.4
80
.78
0.0
4-
0.0
70
.04
NO
3-
-0
.26
-0
.04
0.1
30
.12
0.0
70
.01
0.4
20
.17
-0
.34
-0
.28
0.3
7
SO
42-
-0
.14
0.2
20
.73
0.7
30
.49
0.4
90
.85
0.0
60
.09
0.0
90
.81
0.2
7
PO
43-
0.2
8-
0.8
0-
0.1
2-
0.1
2-
0.1
1-
0.1
0-
0.0
40
.43
-0
.23
-0
.08
0.0
2-
0.0
7-
0.0
4
H4S
iO4
-0
.18
0.3
40
.42
0.4
20
.33
0.3
10
.39
0.1
60
.24
0.0
80
.26
0.3
80
.42
-0
.28
NH
4?
0.3
3-
0.7
8-
0.1
3-
0.1
2-
0.2
9-
0.3
10
.02
0.2
6-
0.2
2-
0.3
1-
0.1
0-
0.1
2-
0.1
10
.70
-0
.29
Fe
0.2
1-
0.9
0-
0.2
7-
0.2
8-
0.3
0-
0.3
2-
0.0
90
.30
-0
.32
-0
.26
-0
.11
0.1
1-
0.2
10
.81
-0
.39
0.7
9
Mn
-0
.20
0.9
10
.25
0.2
60
.28
0.3
00
.07
-0
.33
0.3
50
.34
0.1
7-
0.0
90
.22
-0
.74
0.3
1-
0.7
2-
0.8
9
As
(to
t)0
.28
-0
.86
-0
.22
-0
.22
-0
.22
-0
.25
-0
.03
0.3
7-
0.2
8-
0.2
4-
0.0
50
.02
-0
.16
0.8
3-
0.4
10
.82
0.9
3-
0.8
3
As
(3?
)0
.20
-0
.86
-0
.17
-0
.18
-0
.16
-0
.19
-0
.03
0.3
7-
0.2
8-
0.2
0-
0.0
40
.01
-0
.13
0.8
5-
0.3
40
.80
0.9
3-
0.8
10
.95
As
(5?
)0
.34
-0
.55
-0
.23
-0
.22
-0
.27
-0
.28
-0
.02
0.2
4-
0.1
9-
0.2
2-
0.0
60
.03
-0
.15
0.5
0-
0.4
10
.57
0.5
9-
0.5
70
.75
0.4
9
Environ Geochem Health (2010) 32:129–146 137
123
Ta
ble
3C
orr
elat
ion
mat
rix
of
chem
ical
con
stit
uen
tso
fg
rou
nd
wat
ero
fB
hag
alp
ur
for
the
po
st-m
on
soo
nse
aso
n
Ph
OR
PE
CT
DS
Na?
K?
Ca2
?M
g2?
HC
O3-
F-
Cl-
NO
3-
SO
42-
PO
43-
H4S
iO4
NH
4?
Fe
Mn
As
(to
t)A
s(3
?)
OR
P-
0.2
4
EC
-0
.35
0.2
7
TD
S-
0.3
30
.28
0.8
7
Na?
-0
.29
0.3
20
.54
0.5
4
K?
-0
.28
0.2
90
.52
0.5
20
.92
Ca2
?-
0.2
30
.03
0.7
00
.71
0.2
70
.30
Mg
2?
0.2
3-
0.5
5-
0.2
1-
0.2
0-
0.1
8-
0.1
6-
0.0
6
HC
O3-
-0
.01
0.2
90
.51
0.5
10
.45
0.4
20
.13
-0
.13
F-
0.0
20
.38
0.1
50
.16
0.6
00
.60
-0
.08
-0
.14
0.3
4
Cl-
-0
.31
0.0
50
.66
0.6
70
.37
0.3
90
.85
-0
.06
-0
.08
-0
.02
NO
3-
-0
.32
-0
.11
0.4
90
.50
0.1
20
.13
0.6
50
.13
-0
.14
-0
.12
0.6
1
SO
42-
-0
.26
0.1
40
.62
0.6
20
.41
0.4
20
.77
-0
.02
-0
.05
0.0
40
.78
0.5
4
PO
43-
0.3
9-
0.8
0-
0.1
3-
0.1
2-
0.1
0-
0.0
70
.07
0.5
2-
0.1
7-
0.1
40
.10
0.0
6-
0.0
3
H4S
iO4
-0
.17
0.6
40
.41
0.4
10
.37
0.3
60
.41
-0
.27
0.1
90
.25
0.4
10
.25
0.4
6-
0.3
9
NH
4?
0.3
7-
0.7
8-
0.1
2-
0.1
1-
0.3
1-
0.2
80
.10
0.3
6-
0.1
6-
0.3
30
.05
-0
.02
-0
.05
0.7
0-
0.5
5
Fe
0.2
6-
0.9
2-
0.2
5-
0.2
5-
0.3
4-
0.3
10
.02
0.4
4-
0.3
3-
0.3
00
.06
0.1
4-
0.1
00
.82
-0
.63
0.7
9
Mn
-0
.25
0.9
10
.21
0.2
20
.30
0.2
7-
0.0
9-
0.4
20
.34
0.3
8-
0.0
9-
0.1
80
.06
-0
.74
0.5
6-
0.7
2-
0.8
9
As
(to
t)0
.32
-0
.87
-0
.22
-0
.21
-0
.26
-0
.23
0.0
30
.46
-0
.29
-0
.23
0.0
80
.10
-0
.11
0.8
2-
0.5
60
.83
0.9
1-
0.8
3
As
(3?
)0
.27
-0
.84
-0
.18
-0
.18
-0
.28
-0
.25
0.0
60
.48
-0
.24
-0
.26
0.0
70
.15
-0
.15
0.8
4-
0.5
50
.75
0.9
2-
0.8
30
.92
As
(5?
)0
.30
-0
.62
-0
.20
-0
.20
-0
.14
-0
.12
-0
.02
0.2
8-
0.2
7-
0.1
10
.07
0.0
0-
0.0
20
.53
-0
.40
0.6
80
.64
-0
.57
0.7
90
.45
138 Environ Geochem Health (2010) 32:129–146
123
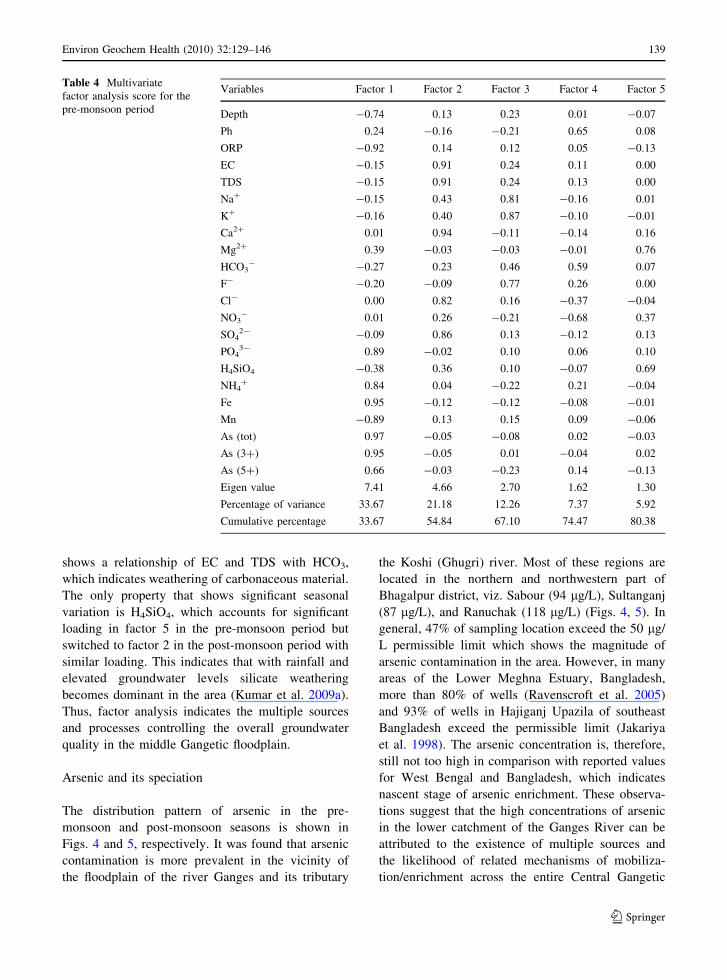
shows a relationship of EC and TDS with HCO3,
which indicates weathering of carbonaceous material.
The only property that shows significant seasonal
variation is H4SiO4, which accounts for significant
loading in factor 5 in the pre-monsoon period but
switched to factor 2 in the post-monsoon period with
similar loading. This indicates that with rainfall and
elevated groundwater levels silicate weathering
becomes dominant in the area (Kumar et al. 2009a).
Thus, factor analysis indicates the multiple sources
and processes controlling the overall groundwater
quality in the middle Gangetic floodplain.
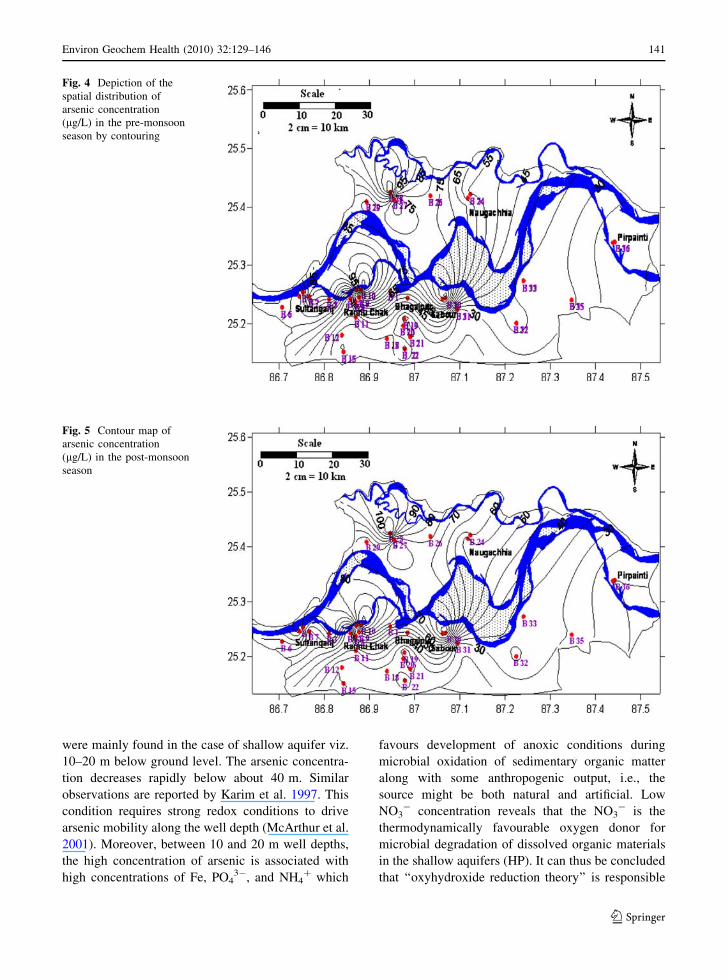
Arsenic and its speciation
The distribution pattern of arsenic in the pre-
monsoon and post-monsoon seasons is shown in
Figs. 4 and 5, respectively. It was found that arsenic
contamination is more prevalent in the vicinity of
the floodplain of the river Ganges and its tributary
the Koshi (Ghugri) river. Most of these regions are
located in the northern and northwestern part of
Bhagalpur district, viz. Sabour (94 lg/L), Sultanganj
(87 lg/L), and Ranuchak (118 lg/L) (Figs. 4, 5). In
general, 47% of sampling location exceed the 50 lg/
L permissible limit which shows the magnitude of
arsenic contamination in the area. However, in many
areas of the Lower Meghna Estuary, Bangladesh,
more than 80% of wells (Ravenscroft et al. 2005)
and 93% of wells in Hajiganj Upazila of southeast
Bangladesh exceed the permissible limit (Jakariya
et al. 1998). The arsenic concentration is, therefore,
still not too high in comparison with reported values
for West Bengal and Bangladesh, which indicates
nascent stage of arsenic enrichment. These observa-
tions suggest that the high concentrations of arsenic
in the lower catchment of the Ganges River can be
attributed to the existence of multiple sources and
the likelihood of related mechanisms of mobiliza-
tion/enrichment across the entire Central Gangetic
Table 4 Multivariate
factor analysis score for the
pre-monsoon period
Variables Factor 1 Factor 2 Factor 3 Factor 4 Factor 5
Depth -0.74 0.13 0.23 0.01 -0.07
Ph 0.24 -0.16 -0.21 0.65 0.08
ORP -0.92 0.14 0.12 0.05 -0.13
EC -0.15 0.91 0.24 0.11 0.00
TDS -0.15 0.91 0.24 0.13 0.00
Na? -0.15 0.43 0.81 -0.16 0.01
K? -0.16 0.40 0.87 -0.10 -0.01
Ca2? 0.01 0.94 -0.11 -0.14 0.16
Mg2? 0.39 -0.03 -0.03 -0.01 0.76
HCO3- -0.27 0.23 0.46 0.59 0.07
F- -0.20 -0.09 0.77 0.26 0.00
Cl- 0.00 0.82 0.16 -0.37 -0.04
NO3- 0.01 0.26 -0.21 -0.68 0.37
SO42- -0.09 0.86 0.13 -0.12 0.13
PO43- 0.89 -0.02 0.10 0.06 0.10
H4SiO4 -0.38 0.36 0.10 -0.07 0.69
NH4? 0.84 0.04 -0.22 0.21 -0.04
Fe 0.95 -0.12 -0.12 -0.08 -0.01
Mn -0.89 0.13 0.15 0.09 -0.06
As (tot) 0.97 -0.05 -0.08 0.02 -0.03
As (3?) 0.95 -0.05 0.01 -0.04 0.02
As (5?) 0.66 -0.03 -0.23 0.14 -0.13
Eigen value 7.41 4.66 2.70 1.62 1.30
Percentage of variance 33.67 21.18 12.26 7.37 5.92
Cumulative percentage 33.67 54.84 67.10 74.47 80.38
Environ Geochem Health (2010) 32:129–146 139
123

Plain. It has been reported by Ravenscroft et al.
(2005) that average arsenic contents of riverbed
samples are 2.03 mg/kg in the Ganges, 2.79 mg/kg
in the Brahmaputra, and 3.49 mg/kg in the Meghna.
Therefore, the high As concentration in the ground-
water is mainly because of infiltration of river water
through contaminated river bed sediment. This
observation must be further supported by the
regional groundwater flow direction based on topog-
raphy or hydrographs. Although groundwater helps
to sustain base flow of the river in some places,
perennial Himalayan rivers, for example the Ganges
and the Yamuna are likely to feed groundwater
(Kumar et al. 2009a).
Less than 50 lg/L of arsenic concentration in the
central portion of the study area is possibly because
of the accumulation of coarser sediment along
Holocene course of the river Ganges (Ravenscroft
et al. 2005). This indicates how depositional
environment and geological age are important factors
in controlling arsenic mobilization. After speciation
analysis it has been observed that As(III) varies from
11 to 81 lg/L in the pre-monsoon season and from 12
to 76 lg/L in the post-monsoon season. The average
value of As(III) was found to be equal to 66% of the
average value of the total As concentration; this is the
most important issue in the area, because As(III) is
prime source of lethality. Although the percentage of
wells exceeding the permissible limit (50 lg/L) is
less than in Bangladesh and West Bengal, the
percentage contribution of As(III) to the total arsenic
concentration is quite high. It has also been found that
As(III) has the same correlation as total As.
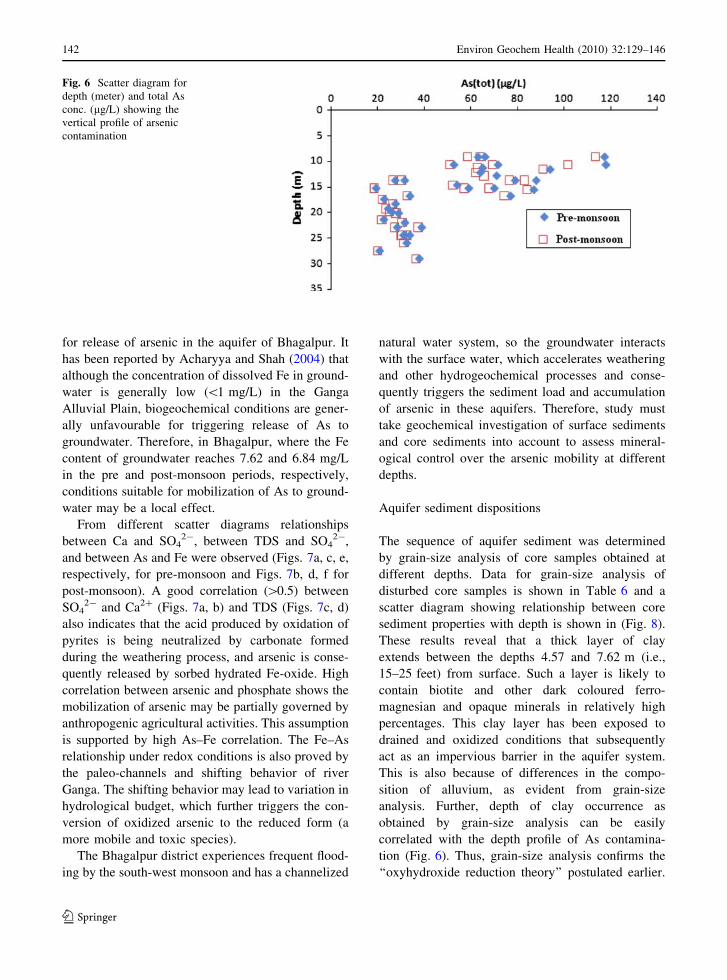
The depth distribution of arsenic reveals a strong
correlation between occurrence of arsenic and the
depth of hand pumps or tube wells (Fig. 6). In
general, the highest arsenic concentration and the
spatial distribution and significant temporal variation
Table 5 Multivariate
factor analysis score for the
post-monsoon period
Variables Factor 1 Factor 2 Factor 3 Factor 4 Factor 5
Depth -0.74 -0.01 0.32 0.01 -0.07
Ph 0.30 -0.27 -0.08 0.03 0.85
ORP -0.93 0.08 0.17 0.08 0.09
EC -0.15 0.72 0.20 0.59 -0.13
TDS -0.15 0.73 0.20 0.58 -0.11
Na? -0.17 0.29 0.88 0.22 -0.14
K? -0.14 0.30 0.88 0.19 -0.13
Ca2? 0.06 0.92 -0.02 0.18 0.02
Mg2? 0.52 -0.03 0.00 -0.18 0.13
HCO3- -0.21 -0.04 0.30 0.87 0.10
F- -0.21 -0.10 0.81 0.06 0.16
Cl- 0.08 0.92 0.14 -0.04 -0.08
NO3- 0.11 0.75 -0.08 -0.10 -0.28
SO42- -0.07 0.88 0.18 -0.10 0.03
PO43- 0.88 0.04 0.07 -0.02 0.18
H4SiO4 -0.62 0.52 0.20 -0.07 0.29
NH4? 0.84 0.02 -0.21 0.12 0.18
Fe 0.95 -0.02 -0.17 -0.10 -0.05
Mn -0.89 -0.05 0.21 0.10 0.07
As (tot) 0.96 -0.01 -0.05 -0.10 0.06
As (3?) 0.92 -0.01 -0.13 -0.01 -0.03
As (5?) 0.71 0.00 0.07 -0.21 0.19
Eigen value 7.80 4.61 2.74 1.70 1.14
Percentage of variance 35.46 20.95 12.45 7.74 5.18
Cumulative percentage 35.46 56.41 68.86 76.60 81.78
140 Environ Geochem Health (2010) 32:129–146
123
were mainly found in the case of shallow aquifer viz.
10–20 m below ground level. The arsenic concentra-
tion decreases rapidly below about 40 m. Similar
observations are reported by Karim et al. 1997. This
condition requires strong redox conditions to drive
arsenic mobility along the well depth (McArthur et al.
2001). Moreover, between 10 and 20 m well depths,
the high concentration of arsenic is associated with
high concentrations of Fe, PO43-, and NH4
? which
favours development of anoxic conditions during
microbial oxidation of sedimentary organic matter
along with some anthropogenic output, i.e., the
source might be both natural and artificial. Low
NO3- concentration reveals that the NO3
- is the
thermodynamically favourable oxygen donor for
microbial degradation of dissolved organic materials
in the shallow aquifers (HP). It can thus be concluded
that ‘‘oxyhydroxide reduction theory’’ is responsible
Fig. 5 Contour map of
arsenic concentration
(lg/L) in the post-monsoon
season
Fig. 4 Depiction of the
spatial distribution of
arsenic concentration
(lg/L) in the pre-monsoon
season by contouring
Environ Geochem Health (2010) 32:129–146 141
123
for release of arsenic in the aquifer of Bhagalpur. It
has been reported by Acharyya and Shah (2004) that
although the concentration of dissolved Fe in ground-
water is generally low (\1 mg/L) in the Ganga
Alluvial Plain, biogeochemical conditions are gener-
ally unfavourable for triggering release of As to
groundwater. Therefore, in Bhagalpur, where the Fe
content of groundwater reaches 7.62 and 6.84 mg/L
in the pre and post-monsoon periods, respectively,
conditions suitable for mobilization of As to ground-
water may be a local effect.
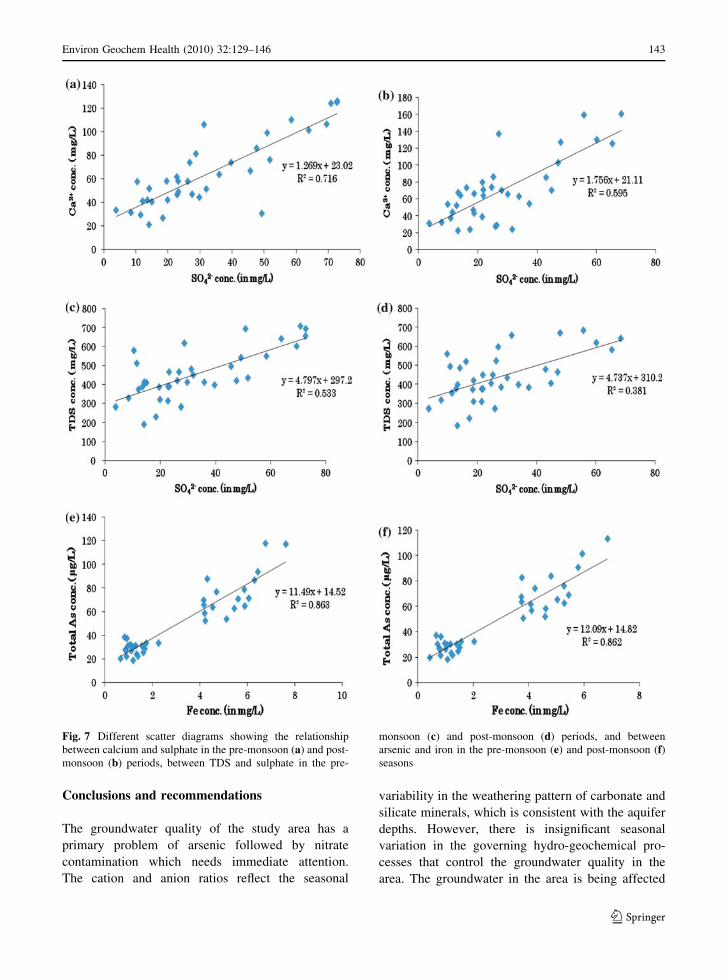
From different scatter diagrams relationships
between Ca and SO42-, between TDS and SO4
2-,
and between As and Fe were observed (Figs. 7a, c, e,
respectively, for pre-monsoon and Figs. 7b, d, f for
post-monsoon). A good correlation ([0.5) between
SO42- and Ca2? (Figs. 7a, b) and TDS (Figs. 7c, d)
also indicates that the acid produced by oxidation of
pyrites is being neutralized by carbonate formed
during the weathering process, and arsenic is conse-
quently released by sorbed hydrated Fe-oxide. High
correlation between arsenic and phosphate shows the
mobilization of arsenic may be partially governed by
anthropogenic agricultural activities. This assumption
is supported by high As–Fe correlation. The Fe–As
relationship under redox conditions is also proved by
the paleo-channels and shifting behavior of river
Ganga. The shifting behavior may lead to variation in
hydrological budget, which further triggers the con-
version of oxidized arsenic to the reduced form (a
more mobile and toxic species).
The Bhagalpur district experiences frequent flood-
ing by the south-west monsoon and has a channelized
natural water system, so the groundwater interacts
with the surface water, which accelerates weathering
and other hydrogeochemical processes and conse-
quently triggers the sediment load and accumulation
of arsenic in these aquifers. Therefore, study must
take geochemical investigation of surface sediments
and core sediments into account to assess mineral-
ogical control over the arsenic mobility at different
depths.
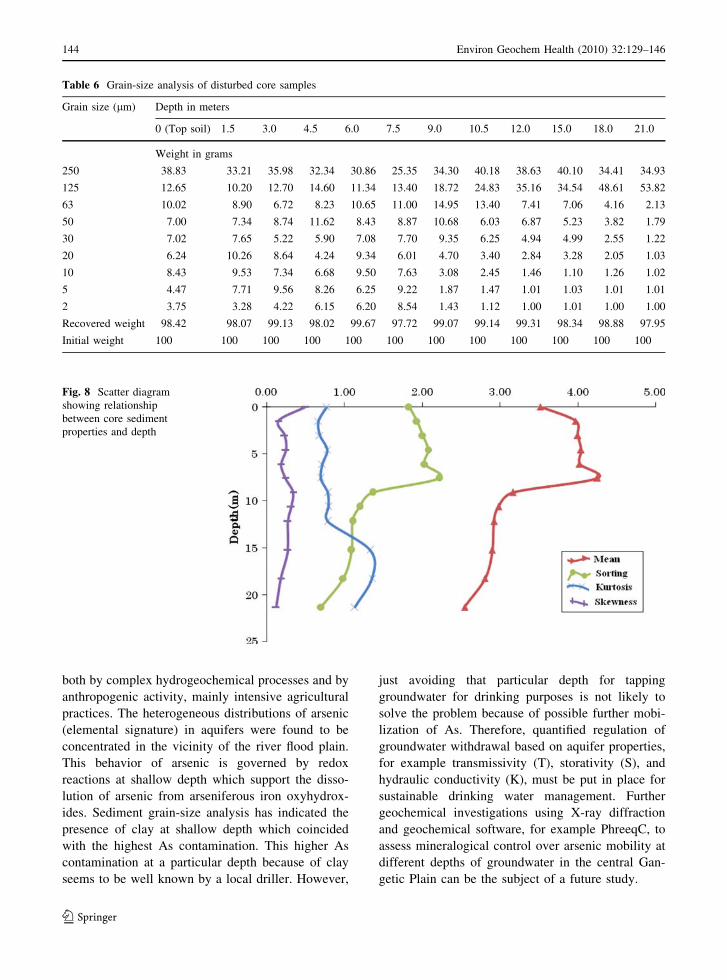
Aquifer sediment dispositions
The sequence of aquifer sediment was determined
by grain-size analysis of core samples obtained at
different depths. Data for grain-size analysis of
disturbed core samples is shown in Table 6 and a
scatter diagram showing relationship between core
sediment properties with depth is shown in (Fig. 8).
These results reveal that a thick layer of clay
extends between the depths 4.57 and 7.62 m (i.e.,
15–25 feet) from surface. Such a layer is likely to
contain biotite and other dark coloured ferro-
magnesian and opaque minerals in relatively high
percentages. This clay layer has been exposed to
drained and oxidized conditions that subsequently
act as an impervious barrier in the aquifer system.
This is also because of differences in the compo-
sition of alluvium, as evident from grain-size
analysis. Further, depth of clay occurrence as
obtained by grain-size analysis can be easily
correlated with the depth profile of As contamina-
tion (Fig. 6). Thus, grain-size analysis confirms the
‘‘oxyhydroxide reduction theory’’ postulated earlier.
Fig. 6 Scatter diagram for
depth (meter) and total As
conc. (lg/L) showing the
vertical profile of arsenic
contamination
142 Environ Geochem Health (2010) 32:129–146
123
Conclusions and recommendations
The groundwater quality of the study area has a
primary problem of arsenic followed by nitrate
contamination which needs immediate attention.
The cation and anion ratios reflect the seasonal
variability in the weathering pattern of carbonate and
silicate minerals, which is consistent with the aquifer
depths. However, there is insignificant seasonal
variation in the governing hydro-geochemical pro-
cesses that control the groundwater quality in the
area. The groundwater in the area is being affected
Fig. 7 Different scatter diagrams showing the relationship
between calcium and sulphate in the pre-monsoon (a) and post-
monsoon (b) periods, between TDS and sulphate in the pre-
monsoon (c) and post-monsoon (d) periods, and between
arsenic and iron in the pre-monsoon (e) and post-monsoon (f)seasons
Environ Geochem Health (2010) 32:129–146 143
123
both by complex hydrogeochemical processes and by
anthropogenic activity, mainly intensive agricultural
practices. The heterogeneous distributions of arsenic
(elemental signature) in aquifers were found to be
concentrated in the vicinity of the river flood plain.
This behavior of arsenic is governed by redox
reactions at shallow depth which support the disso-
lution of arsenic from arseniferous iron oxyhydrox-
ides. Sediment grain-size analysis has indicated the
presence of clay at shallow depth which coincided
with the highest As contamination. This higher As
contamination at a particular depth because of clay
seems to be well known by a local driller. However,
just avoiding that particular depth for tapping
groundwater for drinking purposes is not likely to
solve the problem because of possible further mobi-
lization of As. Therefore, quantified regulation of
groundwater withdrawal based on aquifer properties,
for example transmissivity (T), storativity (S), and
hydraulic conductivity (K), must be put in place for
sustainable drinking water management. Further
geochemical investigations using X-ray diffraction
and geochemical software, for example PhreeqC, to
assess mineralogical control over arsenic mobility at
different depths of groundwater in the central Gan-
getic Plain can be the subject of a future study.
Fig. 8 Scatter diagram
showing relationship
between core sediment
properties and depth
Table 6 Grain-size analysis of disturbed core samples
Grain size (lm) Depth in meters
0 (Top soil) 1.5 3.0 4.5 6.0 7.5 9.0 10.5 12.0 15.0 18.0 21.0
Weight in grams
250 38.83 33.21 35.98 32.34 30.86 25.35 34.30 40.18 38.63 40.10 34.41 34.93
125 12.65 10.20 12.70 14.60 11.34 13.40 18.72 24.83 35.16 34.54 48.61 53.82
63 10.02 8.90 6.72 8.23 10.65 11.00 14.95 13.40 7.41 7.06 4.16 2.13
50 7.00 7.34 8.74 11.62 8.43 8.87 10.68 6.03 6.87 5.23 3.82 1.79
30 7.02 7.65 5.22 5.90 7.08 7.70 9.35 6.25 4.94 4.99 2.55 1.22
20 6.24 10.26 8.64 4.24 9.34 6.01 4.70 3.40 2.84 3.28 2.05 1.03
10 8.43 9.53 7.34 6.68 9.50 7.63 3.08 2.45 1.46 1.10 1.26 1.02
5 4.47 7.71 9.56 8.26 6.25 9.22 1.87 1.47 1.01 1.03 1.01 1.01
2 3.75 3.28 4.22 6.15 6.20 8.54 1.43 1.12 1.00 1.01 1.00 1.00
Recovered weight 98.42 98.07 99.13 98.02 99.67 97.72 99.07 99.14 99.31 98.34 98.88 97.95
Initial weight 100 100 100 100 100 100 100 100 100 100 100 100
144 Environ Geochem Health (2010) 32:129–146
123
Acknowledgments First author (PK) would like to thank
Indian Council of Medical Research (ICMR), Government of
India, for giving a fellowship and grant for my research work.
The authors also acknowledge the Department of Science and
Technology (DST), under the Government of India for their
financial support.
References
Acharyya, S. K. (2004). Arsenic levels in groundwater from
quaternary alluvium in the Ganga Plain and the Bengal
basin, Indian subcontinent: Insights into influence of stra-
tigraphy. Gondwana Research, 8(1), 55–66. doi:10.1016/
S1342-937X(05)70262-8.
Acharyya, S. K., & Shah, B. A. (2004). Risk of arsenic con-
tamination in groundwater affecting Ganga alluvial Plain,
India? Environmental Health Perspectives, 112, A19–
A20.
Ahmed, K. M., Bhattacharya, P., Hasan, M. A., Akhter, S. H.,
Alam, M. A., Bhuyian, H., et al. (2004). Arsenic enrich-
ment in groundwater of the alluvial aquifers in Bangla-
desh: An overview. Applied Geochemistry, 19, 181–200.
doi:10.1016/j.apgeochem.2003.09.006.
American Public Health Association (APHA). (1995). Stan-dard methods for the examination of water and waste-water (19th ed., 1467 pp.). Washington DC: American
Public Health Association.
Ben, D. S., Berner, Z., Chandrasekharam, D., & Karmakar, J.
(2003). Arsenic enrichment in groundwater of West
Bengal, India: Geochemical evidence for mobilization of
As under reducing conditions. Applied Geochemistry, 18,
1417–1434. doi:10.1016/S0883-2927(03)00060-X.
Bhattacharya, P., Chatterjee, D., & Jacks, G. (1997). Occurrence
of arsenic contamination of groundwater in alluvial aqui-
fers from Delta Plain, eastern India: Option for safe
drinking supply. International Journal of Water ResourcesDevelopment, 13, 79–92. doi:10.1080/07900629749944.
Brady, N. C., & Weil, R. R. (2002). The nature and propertiesof soils (13th ed.). NY: Prentice Hall.
Bromssen, M. V., Jakariya, M., Bhattacharya, P., Ahmed, K.
M., Hasan, M. A., Sracek, O., et al. (2007). Targeting low-
arsenic aquifers in Matlab Upazila, southeastern Bangla-
desh. Science of the Total Environment, 379, 121–132.
Bromssen, M. V., Larsson, S. H., Bhattacharya, P., Hasan, M.
A., Ahmed, K. M., Jakariya, M., et al. (2008). Geochemical
characterisation of shallow aquifer sediments of Matlab
Upazila, southeastern Bangladesh—implications for tar-
geting low-As aquifers. Journal of Contaminant Hydrol-ogy, 99, 137–149. doi:10.1016/j.jconhyd.2008.05.005.
Chakraborti, D., Mukherjee, S. C., Pati, S., Sengupta, M. K.,
Rahman, M. M., Chowdhury, U. K., et al. (2003). Arsenic
groundwater contamination in middle Ganga Plain, Bihar,
India: A future danger? Environmental Health Perspec-tives, 111, 1194–1201.
Chaurasia, O. P., Kumari, C., & Ankita, S. (2007). Genotoxic
effect of ground water salts rich in fluoride. Cytologia,72(2), 141–144.
Datta, D. K., & Subramanian, V. (1994). Texture and mineral-
ogy of sediments from the Ganges–Brahmaputra–Meghna
river system in the Bengal basin and their environmental
implications. Environmental Geology, 30(3/4), 181–188.
Domenico, P. A. (1972). Concepts and models in groundwaterhydrology. New York: McGraw–Hill.
Gebel, T. (2000). Confounding variables in the environmental
toxicology of arsenic. Toxicology, 144, 155–162. doi:
10.1016/S0300-483X(99)00202-4.
Griffiths, J. C. (1967). Scientific methods in analysis of sedi-ments. New York: McGraw Hill.
Harvey, C., Swartz, C. H., Badruzzaman, A. B. M., Keon-
Blute, N. E., Yu, W., Ashraf Ali, M., et al. (2002). Arsenic
mobility and groundwater extraction in Bangladesh. Sci-ence, 298, 1602–1606.
Huh, Y., Tsoi, M. Y., Zaitiser, A., & Edward, J. N. (1998). The
fluvial geochemistry of the river of eastern Siberia. I.
Tributaries of Lena River draining the sedimentation
platform of the Siberia Craton. Geochimica et Cosmo-chimica Acta, 62, 1657–1676. doi:10.1016/S0016-7037
(98)00107-0.
Huq, S. M. I., Ara, Q. A. J., Islam, K., Zaher, A., & Naidu, R.
(2001). The possible contamination from arsenic through
food chain. In: Bhattacharya, P., Jacks, G., Khan, A. A.
(eds.). Groundwater arsenic contamination in the Bengal
delta Plain of Bangladesh. Proceedings of the KTH-DhakaUniversity Seminar (pp. 9–96). KTH Special Publication,
TRITA-AMI Report 3084.
Jain, C. K., & Ali, I. (2000). Arsenic: Occurrence, toxicity and
speciation techniques. Water Resources, 34, 4304–4312.
Jakariya, M., Choudhary, M., Tareq, M. A. H., & Ahmed, J.
(1998). BARC: Village health workers can test tubewellwater for arsenic. Bangladesh Rural Advancement Com-
mittee. Available at: http://wso.net/wei/dch/acic/infobank.
Karim, M., Komori, Y., & Alam, M. (1997). Subsurface As
occurrence and depth of contamination in Bangladesh.
Journal of Environmental Chemistry, 7, 783–792.
Kumar, M., Kumari, K., Ramanathan, A. L., & Saxena, R.
(2007). A comparative evaluation of groundwater suit-
ability for irrigation and drinking purposes in two agri-
culture dominated districts of Punjab, India. EnvironmentalGeology, 53, 553–574. doi:10.1007/s00254-007-0672-3.
Kumar, M., Kumari, K., Singh, U. K., Ramanathan, A. L., &
Saxena, R. (2009a). Hydrogeochemical processes in the
groundwater environment of Muktsar, Punjab: Conven-
tional graphical and multivariate statistical approach.
Environmental Geology, 53, 553–574. doi:10.1007/s00
254-007-0672-3.
Kumar, M., Ramanathan, A. L., & Keshari, A. K. (2009b).
Understanding the extent of interactions between
groundwater and surface water through major ion chem-
istry and multivariate statistical techniques. HydrologicalProcesses, 23, 297–310.
Kumar, M., Ramanathan, A. L., Rao, M. S., & Kumar, B.
(2006). Identification and evaluation of hydrogeochemical
processes in the groundwater environment of Delhi, India.
Environmental Geology, 50, 1025–1039. doi:10.1007/
s00254-006-0275-4.
Kumar, M., Sharma, B., Ramanathan, A. L., Rao, M. S., &
Kumar, B. (2009c). Nutrient chemistry and salinity map-
ping of the Delhi aquifer, India: Source identification
perspective. Environmental Geology, 56, 1171–1181. doi:
10.1007/s00254-008-1217-0.
Environ Geochem Health (2010) 32:129–146 145
123

Matthess, G. (1982). The properties of groundwater (p. 498).
New York: Wiley.
Mazumder, D. N. G., Haque, R., Ghosh, N., De, B. K., Santra,
A., Chakraborty, D., et al. (1998). Arsenic levels in
drinking water and the prevalence of skin lesions in West
Bengal, India. International Journal of Epidemiology, 27,
871–877. doi:10.1093/ije/27.5.871.
McArthur, J. M., Banerjee, D. M., Hudson-Edwards, K. A.,
Mishra, R., Purohit, R., & Ravenscroft, P. (2004). Natural
organic matter in sedimentary basins and its relation to
arsenic in anoxic ground water; the example of West Bengal
and its worldwide implications. Applied Geochemistry, 19,
1255–1293. doi:10.1016/j.apgeochem.2004.02.001.
McArthur, J. M., Ravenscroft, P., Safiullah, S., & Thirlwall, M.
F. (2001). Arsenic in groundwater: Testing pollution
mechanisms for sedimentary aquifers in Bangladesh.
Water Resources Research, 37(1), 109–117. doi:10.1029/
2000WR900270.
Meliker, J. R., Slotnick, M. J., Avruskin, G. A., Haack, S. K., &
Nriagu, J. O. (2008). Influence of groundwater recharge
and well characteristics on dissolved arsenic concentra-
tions in southeastern Michigan groundwater. Environ-mental Geochemistry and Health,. doi:10.1007/s10653-
008-9173-x.
Nickson, R. T., McArthur, J. M., Burgess, W. G., Ahmed, K.
M., Ravenscroft, P., & Rahman, M. (1998). Arsenic poi-
soning of Bangladesh groundwater. Nature, 395, 338. doi:
10.1038/26387.
Nickson, R. T., McArthur, J. M., Ravenscroft, P., Burgess, W.
G., & Ahmed, K. M. (2000). Mechanism of arsenic
release to groundwater, Bangladesh and West Bengal.
Applied Geochemistry, 15, 403–413. doi:10.1016/S0883-
2927(99)00086-4.
Nickson, R., Sengupta, C., Mitra, P., Dave, S. N., Banerjee, A.
K., Bhattacharya, A., et al. (2007). Current knowledge on
the distribution of arsenic in groundwater in five states of
India. Journal of Environmental Science and Health PartA, 42, 1707–1718. doi:10.1080/10934520701564194.
Ravenscroft, P., Burgess, W. G., Ahmed, K. M., Burren, M., &
Perrin, J. (2005). Arsenic in groundwater of the Bengal
basin, Bangladesh: Distribution, field relations, and
hydrological setting. Hydrogeology Journal, 13, 727–751.
doi:10.1007/s10040-003-0314-0.
Saha, K. C. (1984). Melanokeratosis from arsenic contami-
nated tubewell water. Indian Journal of Dermatology, 29,
37–46.
Saha, L. C., & Kumar, S. (2006). Comparative quality of potable
waters at Bhagalpur, India. Acta Hydrochimica et Hydro-biologica, 18(4), 459–467. doi:10.1002/aheh.19900180410.
Shah, B. A. (2008). Role of quaternary stratigraphy on arsenic-
contaminated groundwater from parts of middle Ganga
Plain, UP–Bihar, India. Environmental Geology, 35,
1553–1561. doi:10.1007/s00254-007-0766-y.
Smedley, P. L., & Kinniburgh, D. G. (2002). A review of the
source, behaviour and distribution of arsenic in natural
waters. Applied Geochemistry, 17, 517–568. doi:10.1016/
S0883-2927(02)00018-5.
Smith, A. H., Lingas, E. O., & Rahman, M. (2000). Contam-
ination of drinking water by arsenic in Bangladesh: A
public health emergency. Bulletin of the World HealthOrganization, 83, 177–186.
Todd, D. K. (1959). Ground water hydrology. Singapore:
Wiley.
WHO. (1993). Guidelines for drinking water quality. Recom-
mendation edn, vol. 1–2. World Health Organization
Geneva.
146 Environ Geochem Health (2010) 32:129–146
123
Related Documents