1 23 Arabian Journal of Geosciences ISSN 1866-7511 Volume 6 Number 9 Arab J Geosci (2013) 6:3527-3533 DOI 10.1007/s12517-012-0600-z Tracing subsurface oil pollution leakage using 2D electrical resistivity tomography Mohamed Metwaly, Mohamed Ahmed Khalil, El-Said Al-Sayed & Abeer El- Kenawy

Welcome message from author
This document is posted to help you gain knowledge. Please leave a comment to let me know what you think about it! Share it to your friends and learn new things together.
Transcript

1 23
Arabian Journal of Geosciences ISSN 1866-7511Volume 6Number 9 Arab J Geosci (2013) 6:3527-3533DOI 10.1007/s12517-012-0600-z
Tracing subsurface oil pollution leakageusing 2D electrical resistivity tomography
Mohamed Metwaly, Mohamed AhmedKhalil, El-Said Al-Sayed & Abeer El-Kenawy

1 23
Your article is protected by copyright and
all rights are held exclusively by Saudi
Society for Geosciences. This e-offprint is
for personal use only and shall not be self-
archived in electronic repositories. If you wish
to self-archive your article, please use the
accepted manuscript version for posting on
your own website. You may further deposit
the accepted manuscript version in any
repository, provided it is only made publicly
available 12 months after official publication
or later and provided acknowledgement is
given to the original source of publication
and a link is inserted to the published article
on Springer's website. The link must be
accompanied by the following text: "The final
publication is available at link.springer.com”.
ORIGINAL PAPER
Tracing subsurface oil pollution leakage using 2Delectrical resistivity tomography
Mohamed Metwaly & Mohamed Ahmed Khalil &El-Said Al-Sayed & Abeer El-Kenawy
Received: 2 November 2011 /Accepted: 17 May 2012 /Published online: 30 May 2012# Saudi Society for Geosciences 2012
Abstract This study provides an evaluation of the subsur-face oil contaminant flow in an oil production field at theWadi Feiran fan, along the Gulf of Suez, Egypt. The 2Delectrical resistivity tomography technique has been appliedalong four profiles surrounding the spill location of oildump site. Theoretical soil resistivity response versus fluidresistivity for different cation exchange capacity values hasbeen studied. Then, a physical model for the current situa-tion of flowing the oil over the groundwater (sea invadedwater) of saturated fluvial sediments has been introduced. Itwas supposed that the crude oil has higher resistivity valuesand turned to be conductive far away from the oil spillsource under the effect of microbial biodegradation. Suchconditions of contaminated distribution and its resistivityvalues have been considered during the inversion and inter-pretation of the acquired data sets. The processed 2D resis-tivity profiles reveal that oil plumes are accumulated in theseawater invasion direction, whereas it has low signaturesalong the profiles parallel to the shore line.
Keywords 2D electrical resistivity tomography . Oilpollution . Egypt
Introduction
Oil production activities and industries generate usuallyhuge volumes of wastes, which contaminate the soil andgroundwater. Gulf of Suez area in Egypt has an intensive oilproduction and industry activities. Such activities may pro-duce waste products which are mainly dumped in a pit closeto the pumping machine. However, these pits are sometimesthe main source of contamination in the vadose zone and theunderlain groundwater causing severe environmental prob-lem. In such arid areas, there is a resilient need to use thegroundwater as the primary drinking water supply and forboth agricultural and industrial purposes. The occurrence ofoil spill in permeable sediments causes microbial biodegra-dation, which changes the original nature of oil seepage andgroundwater geochemistry. The most important features ofthese processes are the creation of organic acids, the enrich-ment of groundwater with Fe2+ and Mn2+ cations, and out-gassing of CO2 and CH4 into the vadose zone. Organic acidsand the carbonic acid attack rock minerals and extract fromthem further cations like Ca2+, Mg+, etc. All these geochem-ical changes affect the physical properties of groundwaterbelow and in turn the soil characteristics beneath the watertable (Baedecker et al. 1993). Among geophysical techni-ques, geoelectrical prospecting has been successfully usedto detect and trace the fresh/salt water interface in coastalaquifers (Barker 1980; Al-Sayed and El-Qady 2007), andtrace the hydrocarbon leakage in the subsoil (Shevnin et al.2005; Sauck 2000).
In areas where the groundwater is significantly saline, theaquifer resistivity is considerably reduced. On the other
M. Metwaly (*) :M. A. Khalil : E.-S. Al-SayedNational Research Institute of Astronomy and Geophysics,Helwan, Cairo, Egypte-mail: [email protected]
M. MetwalyGeology and Geophysics Department, College of Sciences,King Saud University,Riyadh, Saudi Arabia
M. A. KhalilCentro de Geofísica da Universidade de Lisboa-IDL,Campo Grande C8,1749-016 Lisbon, Portugal
A. El-KenawyGeology Department, Faculty of Science, Zagazig University,Zagazig, Egypt
Arab J Geosci (2013) 6:3527–3533DOI 10.1007/s12517-012-0600-z
Author's personal copy
hand, the crude oil leakage exhibits high resistivity in con-trast with the processed oil-contaminated soil, which ischaracterized by low resistivity due to chemical degrada-tions and increase in the level of total dissolved solidscreated by bacterial action (Sauck et al. 1998; Sauck 2000;Atekwana et al. 2000; Shevnin et al. 2005). In this work, the2D electrical resistivity tomography technique has beenapplied to trace the subsurface oil-contaminated plumes inone of the important oil field sites in the fan of Wadi Feiranalong the Gulf of Suez. The theoretical simulations of thedifferent factors affecting the subsurface resistivity values aswell as the physical models of the oil-contaminated plumeshave been represented.
Geological and hydrogeological setting of the fanof Wadi Feiran
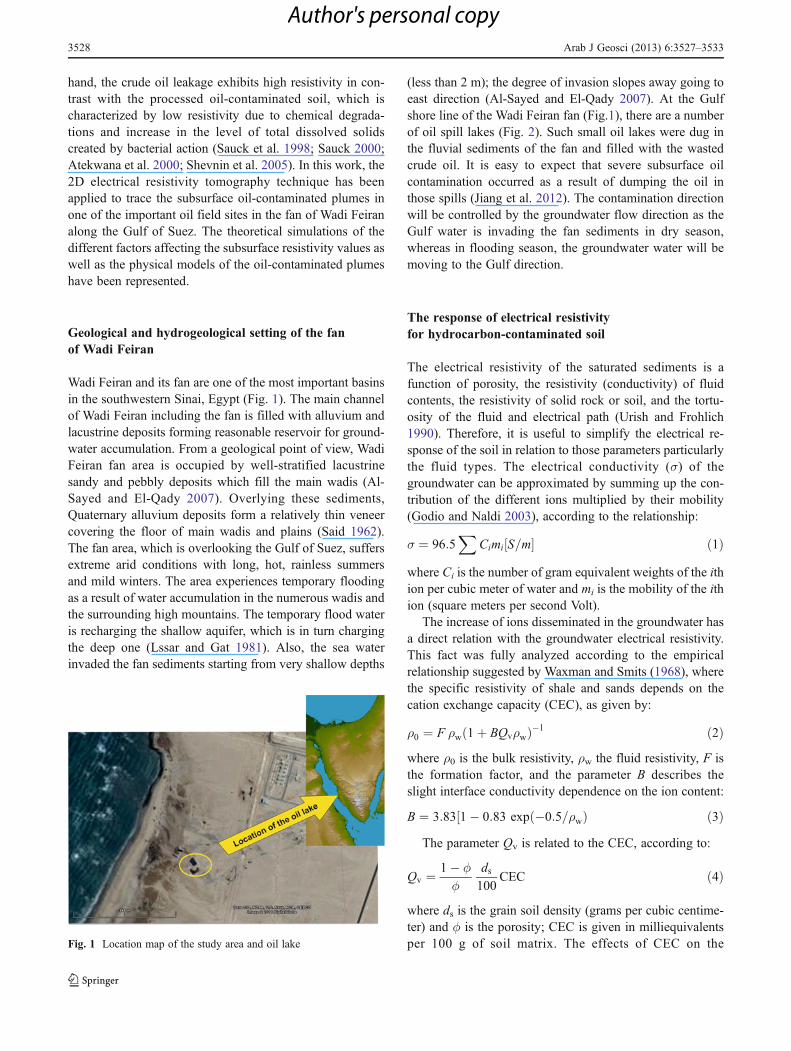
Wadi Feiran and its fan are one of the most important basinsin the southwestern Sinai, Egypt (Fig. 1). The main channelof Wadi Feiran including the fan is filled with alluvium andlacustrine deposits forming reasonable reservoir for ground-water accumulation. From a geological point of view, WadiFeiran fan area is occupied by well-stratified lacustrinesandy and pebbly deposits which fill the main wadis (Al-Sayed and El-Qady 2007). Overlying these sediments,Quaternary alluvium deposits form a relatively thin veneercovering the floor of main wadis and plains (Said 1962).The fan area, which is overlooking the Gulf of Suez, suffersextreme arid conditions with long, hot, rainless summersand mild winters. The area experiences temporary floodingas a result of water accumulation in the numerous wadis andthe surrounding high mountains. The temporary flood wateris recharging the shallow aquifer, which is in turn chargingthe deep one (Lssar and Gat 1981). Also, the sea waterinvaded the fan sediments starting from very shallow depths
(less than 2 m); the degree of invasion slopes away going toeast direction (Al-Sayed and El-Qady 2007). At the Gulfshore line of the Wadi Feiran fan (Fig.1), there are a numberof oil spill lakes (Fig. 2). Such small oil lakes were dug inthe fluvial sediments of the fan and filled with the wastedcrude oil. It is easy to expect that severe subsurface oilcontamination occurred as a result of dumping the oil inthose spills (Jiang et al. 2012). The contamination directionwill be controlled by the groundwater flow direction as theGulf water is invading the fan sediments in dry season,whereas in flooding season, the groundwater water will bemoving to the Gulf direction.
The response of electrical resistivityfor hydrocarbon-contaminated soil
The electrical resistivity of the saturated sediments is afunction of porosity, the resistivity (conductivity) of fluidcontents, the resistivity of solid rock or soil, and the tortu-osity of the fluid and electrical path (Urish and Frohlich1990). Therefore, it is useful to simplify the electrical re-sponse of the soil in relation to those parameters particularlythe fluid types. The electrical conductivity (σ) of thegroundwater can be approximated by summing up the con-tribution of the different ions multiplied by their mobility(Godio and Naldi 2003), according to the relationship:
σ ¼ 96:5X
Cimi S=m½ � ð1Þwhere Ci is the number of gram equivalent weights of the ithion per cubic meter of water and mi is the mobility of the ithion (square meters per second Volt).
The increase of ions disseminated in the groundwater hasa direct relation with the groundwater electrical resistivity.This fact was fully analyzed according to the empiricalrelationship suggested by Waxman and Smits (1968), wherethe specific resistivity of shale and sands depends on thecation exchange capacity (CEC), as given by:
ρ0 ¼ F ρw 1þ BQvρwð Þ�1 ð2Þwhere ρ0 is the bulk resistivity, ρw the fluid resistivity, F isthe formation factor, and the parameter B describes theslight interface conductivity dependence on the ion content:
B ¼ 3:83 1� 0:83 exp �0:5=ρwð Þ½ ð3ÞThe parameter Qv is related to the CEC, according to:
Qv ¼ 1� ϕϕ
ds100
CEC ð4Þ
where ds is the grain soil density (grams per cubic centime-ter) and ϕ is the porosity; CEC is given in milliequivalentsper 100 g of soil matrix. The effects of CEC on theFig. 1 Location map of the study area and oil lake
3528 Arab J Geosci (2013) 6:3527–3533
Author's personal copy
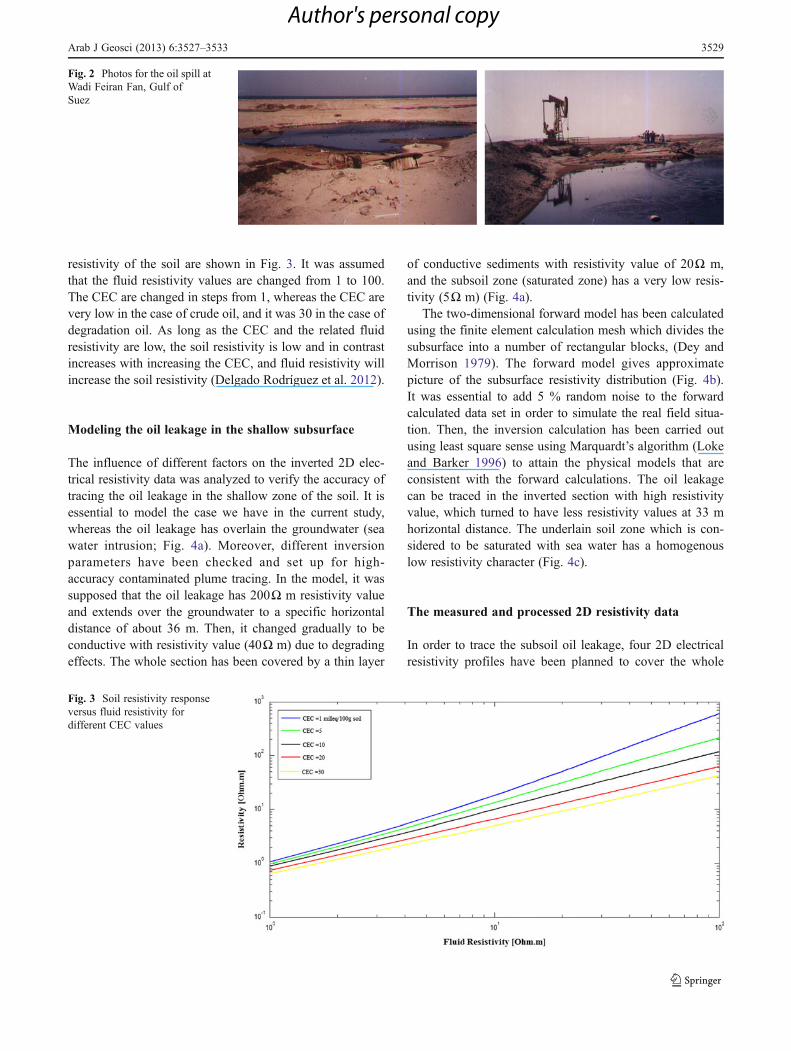
resistivity of the soil are shown in Fig. 3. It was assumedthat the fluid resistivity values are changed from 1 to 100.The CEC are changed in steps from 1, whereas the CEC arevery low in the case of crude oil, and it was 30 in the case ofdegradation oil. As long as the CEC and the related fluidresistivity are low, the soil resistivity is low and in contrastincreases with increasing the CEC, and fluid resistivity willincrease the soil resistivity (Delgado Rodríguez et al. 2012).
Modeling the oil leakage in the shallow subsurface
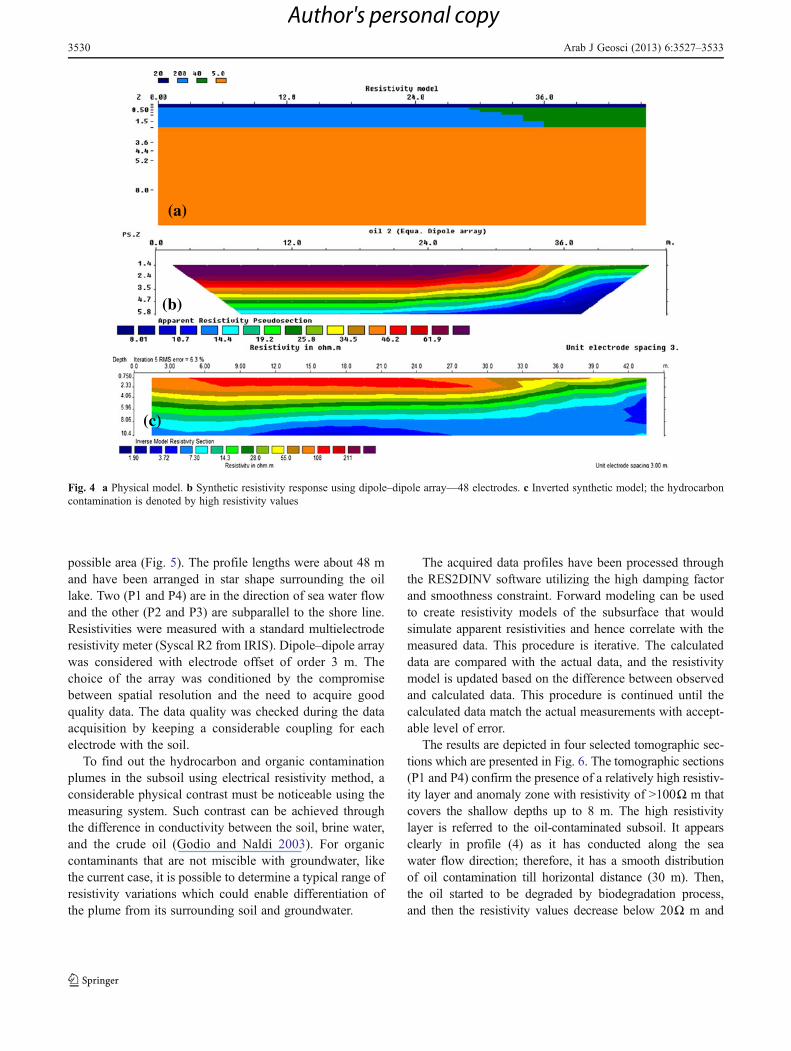
The influence of different factors on the inverted 2D elec-trical resistivity data was analyzed to verify the accuracy oftracing the oil leakage in the shallow zone of the soil. It isessential to model the case we have in the current study,whereas the oil leakage has overlain the groundwater (seawater intrusion; Fig. 4a). Moreover, different inversionparameters have been checked and set up for high-accuracy contaminated plume tracing. In the model, it wassupposed that the oil leakage has 200Ω m resistivity valueand extends over the groundwater to a specific horizontaldistance of about 36 m. Then, it changed gradually to beconductive with resistivity value (40Ω m) due to degradingeffects. The whole section has been covered by a thin layer
of conductive sediments with resistivity value of 20Ω m,and the subsoil zone (saturated zone) has a very low resis-tivity (5Ω m) (Fig. 4a).
The two-dimensional forward model has been calculatedusing the finite element calculation mesh which divides thesubsurface into a number of rectangular blocks, (Dey andMorrison 1979). The forward model gives approximatepicture of the subsurface resistivity distribution (Fig. 4b).It was essential to add 5 % random noise to the forwardcalculated data set in order to simulate the real field situa-tion. Then, the inversion calculation has been carried outusing least square sense using Marquardt’s algorithm (Lokeand Barker 1996) to attain the physical models that areconsistent with the forward calculations. The oil leakagecan be traced in the inverted section with high resistivityvalue, which turned to have less resistivity values at 33 mhorizontal distance. The underlain soil zone which is con-sidered to be saturated with sea water has a homogenouslow resistivity character (Fig. 4c).
The measured and processed 2D resistivity data
In order to trace the subsoil oil leakage, four 2D electricalresistivity profiles have been planned to cover the whole
Fig. 2 Photos for the oil spill atWadi Feiran Fan, Gulf ofSuez
Fig. 3 Soil resistivity responseversus fluid resistivity fordifferent CEC values
Arab J Geosci (2013) 6:3527–3533 3529
Author's personal copy
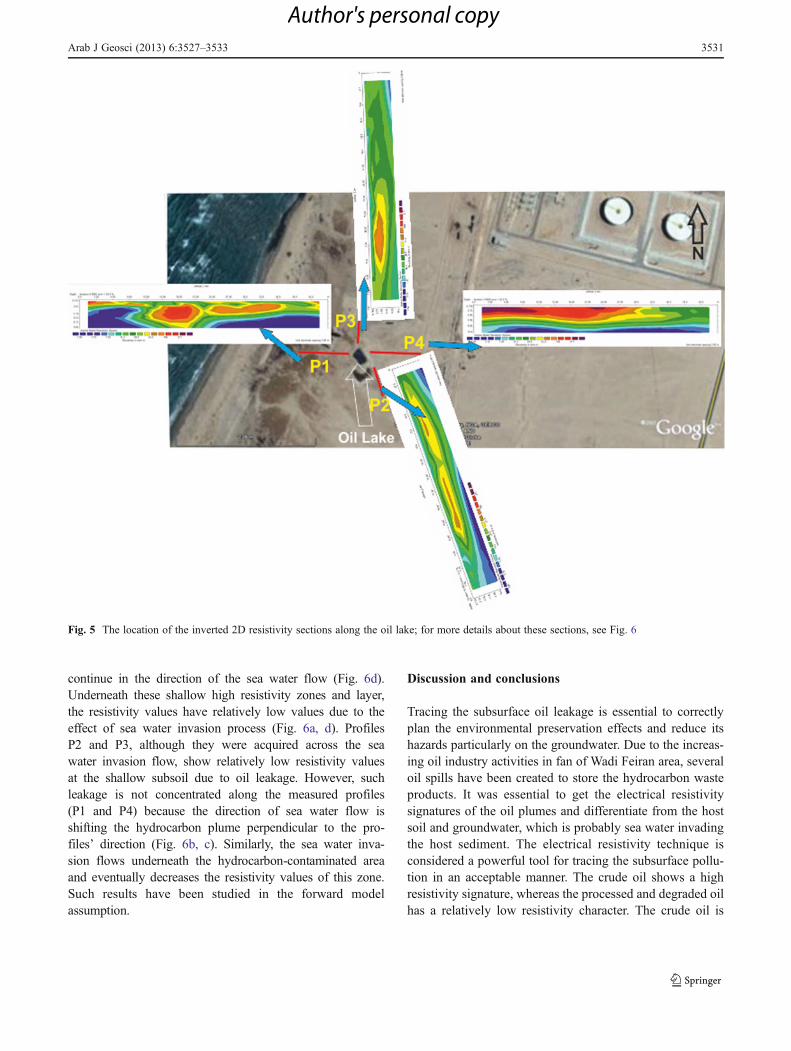
possible area (Fig. 5). The profile lengths were about 48 mand have been arranged in star shape surrounding the oillake. Two (P1 and P4) are in the direction of sea water flowand the other (P2 and P3) are subparallel to the shore line.Resistivities were measured with a standard multielectroderesistivity meter (Syscal R2 from IRIS). Dipole–dipole arraywas considered with electrode offset of order 3 m. Thechoice of the array was conditioned by the compromisebetween spatial resolution and the need to acquire goodquality data. The data quality was checked during the dataacquisition by keeping a considerable coupling for eachelectrode with the soil.
To find out the hydrocarbon and organic contaminationplumes in the subsoil using electrical resistivity method, aconsiderable physical contrast must be noticeable using themeasuring system. Such contrast can be achieved throughthe difference in conductivity between the soil, brine water,and the crude oil (Godio and Naldi 2003). For organiccontaminants that are not miscible with groundwater, likethe current case, it is possible to determine a typical range ofresistivity variations which could enable differentiation ofthe plume from its surrounding soil and groundwater.
The acquired data profiles have been processed throughthe RES2DINV software utilizing the high damping factorand smoothness constraint. Forward modeling can be usedto create resistivity models of the subsurface that wouldsimulate apparent resistivities and hence correlate with themeasured data. This procedure is iterative. The calculateddata are compared with the actual data, and the resistivitymodel is updated based on the difference between observedand calculated data. This procedure is continued until thecalculated data match the actual measurements with accept-able level of error.
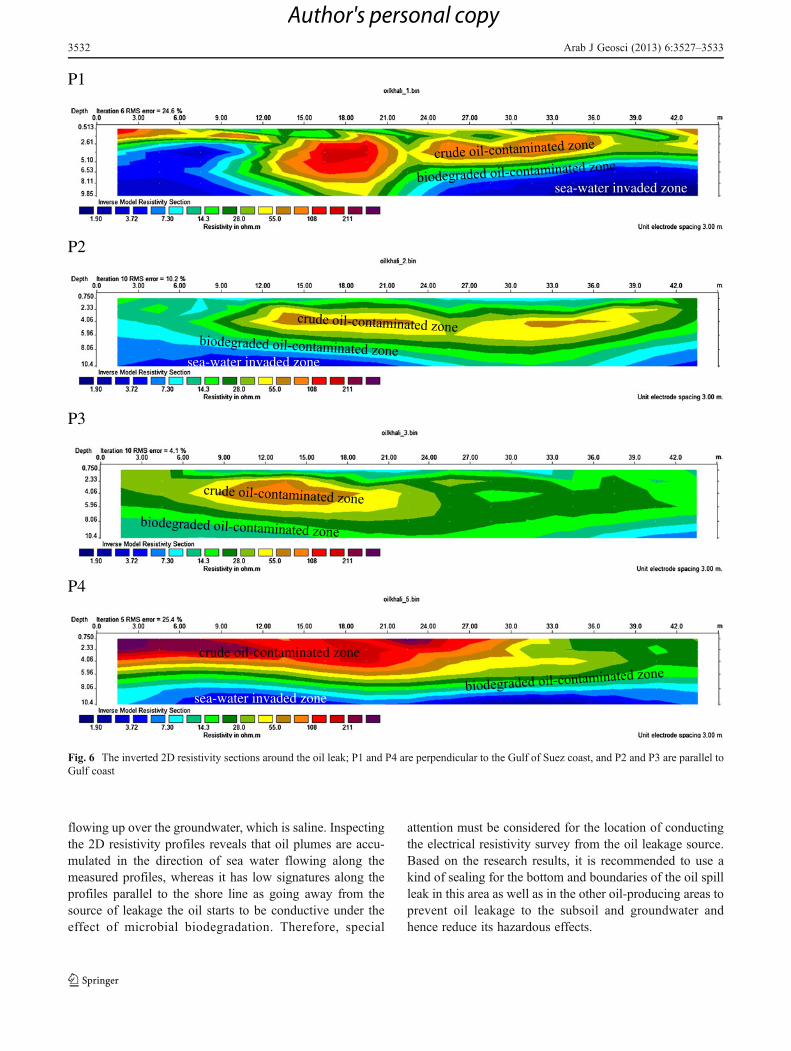
The results are depicted in four selected tomographic sec-tions which are presented in Fig. 6. The tomographic sections(P1 and P4) confirm the presence of a relatively high resistiv-ity layer and anomaly zone with resistivity of >100Ω m thatcovers the shallow depths up to 8 m. The high resistivitylayer is referred to the oil-contaminated subsoil. It appearsclearly in profile (4) as it has conducted along the seawater flow direction; therefore, it has a smooth distributionof oil contamination till horizontal distance (30 m). Then,the oil started to be degraded by biodegradation process,and then the resistivity values decrease below 20Ω m and
(a)
(b)
(c)
Fig. 4 a Physical model. b Synthetic resistivity response using dipole–dipole array—48 electrodes. c Inverted synthetic model; the hydrocarboncontamination is denoted by high resistivity values
3530 Arab J Geosci (2013) 6:3527–3533
Author's personal copy
continue in the direction of the sea water flow (Fig. 6d).Underneath these shallow high resistivity zones and layer,the resistivity values have relatively low values due to theeffect of sea water invasion process (Fig. 6a, d). ProfilesP2 and P3, although they were acquired across the seawater invasion flow, show relatively low resistivity valuesat the shallow subsoil due to oil leakage. However, suchleakage is not concentrated along the measured profiles(P1 and P4) because the direction of sea water flow isshifting the hydrocarbon plume perpendicular to the pro-files’ direction (Fig. 6b, c). Similarly, the sea water inva-sion flows underneath the hydrocarbon-contaminated areaand eventually decreases the resistivity values of this zone.Such results have been studied in the forward modelassumption.
Discussion and conclusions
Tracing the subsurface oil leakage is essential to correctlyplan the environmental preservation effects and reduce itshazards particularly on the groundwater. Due to the increas-ing oil industry activities in fan of Wadi Feiran area, severaloil spills have been created to store the hydrocarbon wasteproducts. It was essential to get the electrical resistivitysignatures of the oil plumes and differentiate from the hostsoil and groundwater, which is probably sea water invadingthe host sediment. The electrical resistivity technique isconsidered a powerful tool for tracing the subsurface pollu-tion in an acceptable manner. The crude oil shows a highresistivity signature, whereas the processed and degraded oilhas a relatively low resistivity character. The crude oil is
Fig. 5 The location of the inverted 2D resistivity sections along the oil lake; for more details about these sections, see Fig. 6
Arab J Geosci (2013) 6:3527–3533 3531
Author's personal copy
flowing up over the groundwater, which is saline. Inspectingthe 2D resistivity profiles reveals that oil plumes are accu-mulated in the direction of sea water flowing along themeasured profiles, whereas it has low signatures along theprofiles parallel to the shore line as going away from thesource of leakage the oil starts to be conductive under theeffect of microbial biodegradation. Therefore, special
attention must be considered for the location of conductingthe electrical resistivity survey from the oil leakage source.Based on the research results, it is recommended to use akind of sealing for the bottom and boundaries of the oil spillleak in this area as well as in the other oil-producing areas toprevent oil leakage to the subsoil and groundwater andhence reduce its hazardous effects.
P1
P2
P3
P4
sea-water invaded zone
sea-water invaded zone
sea-water invaded zone
crude oil-contaminated zone
Fig. 6 The inverted 2D resistivity sections around the oil leak; P1 and P4 are perpendicular to the Gulf of Suez coast, and P2 and P3 are parallel toGulf coast
3532 Arab J Geosci (2013) 6:3527–3533
Author's personal copy
Acknowledgments The authors gratefully thank the Geoelectricityand Geothermic Lab. at NRIAG, Egypt for helping to carry out thefield work. The first author appreciates the College of Science Re-search Center at King Saud University for partially supporting thiswork.
References
Al-Sayed EA, El-Qady G (2007) Evaluation of sea water intrusion usingthe electrical resistivity and transient electromagnetic survey: casestudy at fan of Wadi Feiran, Sinai, Egypt. EGM InternationalWorkshop. Innovation in EM, Grav, Mag Methods: a newPerspective for Exploration. Capri, Italy, 15–18 April 2007, pp. 1–4
Atekwana EA, Sauck WA, Werkema DD Jr (2000) Investigations ofgeoelectrical signatures at a hydrocarbon contaminated site. JAppl Geophys 44:167–180
Baedecker MJ, Cozzarelli IM, Eganhouse RP, Siegel DI, Benett PC(1993) Crude oil in a shallow sand in gravel aquifer—III. ApplGeochem 3:569–586
Barker RD (1980) Application of geophysics in groundwater inves-tigations. Water Surv 84:489–492
Delgado Rodríguez O, Torres ML, Shevnin V, Ryjov A (2012)Estimation of soil petrophysical parameters based on electricalresistivity values obtained from lab and in-field measurements.Geofisc Int 51:5–15
Dey A, Morrison HF (1979) Resistivity modeling for arbitrarily shapedtwo-dimensional structures. Geophys Prospect 27:1020–1036
Godio A, Naldi M (2003) Two-dimensional electrical imaging fordetection of hydrocarbon contaminants. Near Surf Geophys 1(3):131–137
Jiang Y, Li Y, Kang X, Zhou Q, Zhou X, Zhu Y (2012) Characteristicsof leakage pollution of Longpan Road gas station and its enlight-enment. J Environ Prot 3:49–54
Loke M, Barker R (1996) Rapid least squares inversion of apparentresistivity pseudosections using a quasi Newton’s method.Geophys Prospect 44:131–152
Lssar A, Gat J (1981) Environmental isotopes as a tool in hydrogeo-logical research in an Arid Basin. Ground Water 19:490–494
Said R (1962) The geology of Egypt. Elsevier, Amsterdam, p 377Sauck WA (2000) A model for the resistivity structure of LNAPL
plumes and their environs in sandy sediments. J Appl Geophys44:151–165
Sauck WA, Atekwana EA, Nash MS (1998) Elevated conductivitiesassociated with an LNAPL plume imaged by integrated geophys-ical techniques. J Environ Eng Geophys 2:203–212
Shevnin V, Delgado-Rodrigues O, Fernandez-Linares L, Martinez AM,Ryjov A (2005) Geoelectrical characterization of an oil-contaminated site in Tabasco, Mexico. Geofisc Int 44:251–263
Urish DW, Frohlich RK (1990) Surface electrical resistivity in coastalgroundwater exploration. Geoexploration 26:267–289
Waxman MH, Smits LJM (1968) Electrical conductivities in oil bear-ing sands. Soc Petrol Eng J 8:107–122
Arab J Geosci (2013) 6:3527–3533 3533
Author's personal copy
Related Documents