Do Policies make a Difference? TRACING IMMIGRANT INTEGRATION POLICIES’ CAPACITY TO MEDIATE XENOPHOBIC ATTITUDES IN POST-APARTHEID SOUTH AFRICA AND GERMANY AFTER REUNIFICATION

Welcome message from author
This document is posted to help you gain knowledge. Please leave a comment to let me know what you think about it! Share it to your friends and learn new things together.
Transcript

Do Policies make a Difference?TRACING IMMIGRANT INTEGRATION POLICIES’ CAPACITY TO MEDIATE XENOPHOBIC ATTITUDES IN POST-APARTHEID SOUTH AFRICA AND GERMANY AFTER REUNIFICATION

Two Tales of Anti-Foreigner Sentiment
1995-1998 1999-2004 2005-2009 2010-20140
10
20
30
40
50
13.3
21.4
8.9
19.621
13.7
7.27
11
78
53
2 4
10.4
Germany Netherlands Poland SpainSweden Switzerland
% “D
on’t
wan
t im
migr
ants
as
neig
hbou
rs”
1995-1998 1999-2004 2005-2009 2010-20140
10
20
30
40
50
19
31
24
41
25.828
2018
27.5
21
14
South Africa Ghana NigeriaTanzania Zambia Zimbabwe
% “D
on’t
wan
t im
migr
ants
as
neig
hbou
rs”
State of Knowledge
Social Learning Hypothesis
- Normative Framework- Key actors- Perpetual accountability
Opportunity Structure Hypothesis- Key arenas- Conflict vs. Contact
Policy Responsiveness- Mass policy preferences
Macro level (“Rules of the Game”)
- Linkage Processes

Descriptive HypothesisIMMIGRATION INTEGRATION POLICIES HAVE CHANGED OVER TIME

Immigrant Integration Policy Index
Policy Strands Policy Dimension Indicator
Labour Market Mobility
Access
Immediate access to labour marketPrivate sectorPublic sector
General Support
Recognition of academic qualificationsRecognition of professional qualifications
Worker’s RightsMembership in Trade UnionAccess to social securityAccess to housing
Education Access Compulsory education as a legal right
Political Participation
Electoral Rights
National levelRegional levelLocal levelRight to stand as local candidate
Political LibertiesRight to associationMembership in Political Party
Consultative Bodies Strength of consultative Body*
Access to Nationality
Eligibility
Residence PeriodBirth right for citizenship of 2nd generation
Conditions for Acquisition
Naturalisation language requirementNationalisation integration requirement
Asylum seekersAccess Immediate access to labour
marketWorker’s Rights Access to social security Worker’s Rights Access to housing
*Indicator is comprised of three sub-indicators.
List of all indicators of the newly constructed IIPI
- 5 Strands- 23 Indicators- National level policies
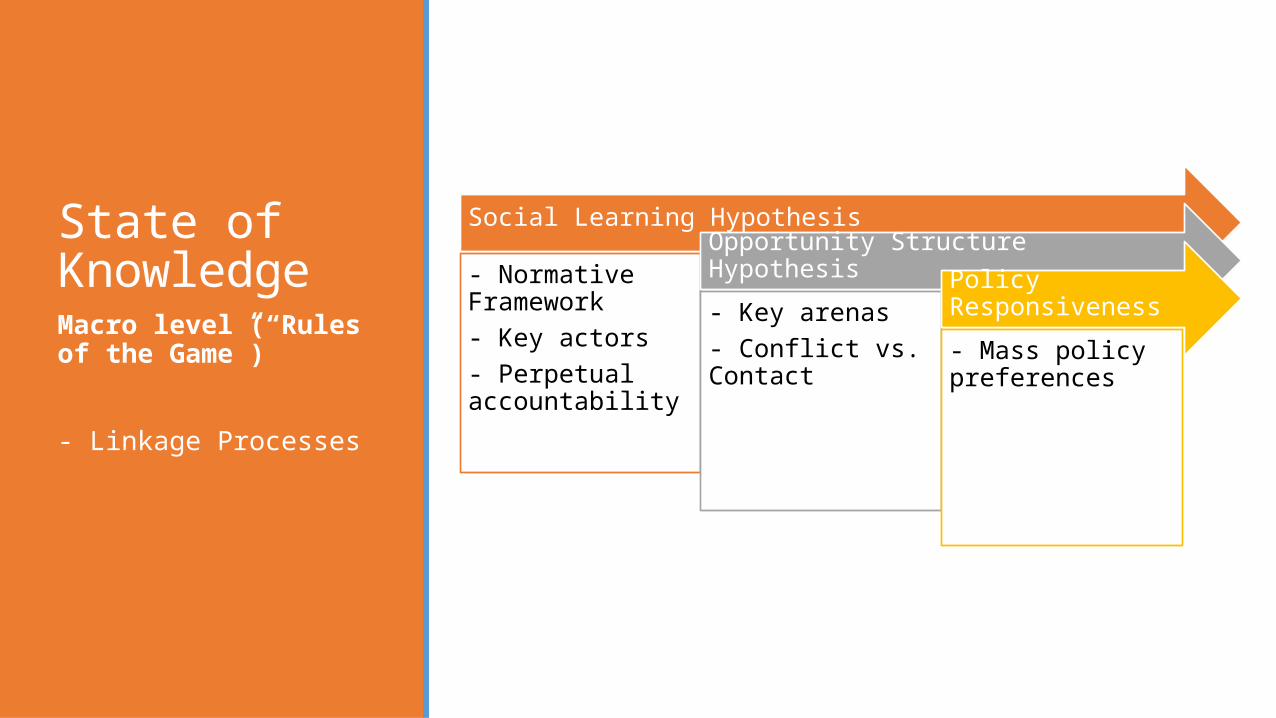
IIPI in Germany and South AfricaOverall Scores
- Germany: 34% increase
- South Africa: 54% increase
19901991
1992
1993
1994
1995
1996
1997
1998
1999
2000
20012002
20032004
2005
2006
2007
2008
2009
2010
2011
2012
2013
20142015
0
10
20
30
40
50
60
70
Germany South Africa
IIPI
sco
re
Explanatory HypothesisMORE PERMISSIVE IMMIGRATION INTEGRATION POLICIES LEAD TO DECREASING LEVELS OF XENOPHOBIA AMONG NATIONALS

IIPI and Xenophobia
1990
1992
1994
1996
1998
2000
2002
2004
2006
2008
2010
2012
2014
0
10
20
30
40
50
60
70
80
90
100
0
10
20
30
40
50
60
70
80
90
100
Econ ThreatMoving average (Econ Threat)Culture ThreatMoving average (Culture Threat)IIPI
Perc
enta
ge (
agre
e/me
ntio
ned)
IIPI
sco
re
1993
1995
1997
1999
2001
2003
2005
2007
2009
2011
2013
2015
0
10
20
30
40
50
60
70
80
90
100
0
10
20
30
40
50
60
70
80
90
100
Econ ThreatMoving average (Econ Threat)Culture ThreatMoving average (Culture Threat)IIPI
Perc
enta
ge (
agre
e/me
ntio
ned)
IIPI
sco
re

Germany
MODEL 1997 2006 2013
B Sig B Sig B Sig
(CONSTANT) 1,116 ,000 2,053 ,000 1,627 ,000
AGE ,008 ,000 ,004 ,026 ,006 ,001
FEMALE ,046 ,320 -,077 ,081 ,026 ,547
EDUCATION -,021 ,528 -,178 ,000 -,181 ,000
PART-TIME ,003 ,968 ,001 ,990 -,091 ,200
UNEMPLOYED ,002 ,973 -,117 ,056 -,179 ,007
RETIRED ,060 ,458 -,047 ,528 -,233 ,001
SMALL TOWN -,090 ,088 -,107 ,028 -,073 ,136
BIG CITY -,171 ,005 -,056 ,280 -,096 ,082
POLITICS IMPORTANT -,030 ,299 -,072 ,005 -,062 ,016
MEMBERSHIP 8 ORGANISATIONS
-,061 ,000 -,044 ,007 -,052 ,001
TRUST IN PEOPLE -,288 ,000 -,209 ,000 -,111 ,007
LIFE SATISFACTION -,026 ,055 -,030 ,018 -,018 ,130
FINANCIAL SATISFACTION
-,011 ,357 -,006 ,584 -,025 ,012
NATIONAL PRIDE ,235 ,000 ,113 ,000 ,195 ,000
IIPI and Economic Threat
- Linkage Processes operate in expected direction

South Africa
MODEL 1996 2006 2013B Sig B Sig B Sig
(CONSTANT) 1,858 ,000 1,402 ,000 1,257 ,000AGE -,001 ,477 ,002 ,093 ,006 ,000
FEMALE ,023 ,345 -,013 ,619 -,067 ,018
EDUCATION -,013 ,461 ,040 ,071 -,006 ,830PART-TIME -,018 ,759 -,030 ,565 -,016 ,798
UNEMPLOYED -,116 ,000 ,030 ,334 -,024 ,491RETIRED ,047 ,340 ,014 ,791 -,163 ,006
SMALL TOWN -,006 ,866 -,016 ,708 -,022 ,838BIG CITY -,121 ,000 ,074 ,013 Data
issue not
resolved
Data issue not
resolvedPOLITICS IMPORTANT ,021 ,072 ,004 ,726 -,030 ,026
MEMBERSHIP 8 ORGANISATIONS -,007 ,289 ,006 ,238 -,009 ,060
TRUST IN PEOPLE -,099 ,002 ,026 ,345 -,039 ,246LIFE SATISFACTION -,005 ,361 -,003 ,657 -,010 ,203
FINANCIAL SATISFACTION ,003 ,585 -,008 ,140 -,009 ,193NATIONAL PRIDE ,023 ,342 ,038 ,129 ,049 ,015
IIPI and Economic Threat
- Linkage Processes do not hold
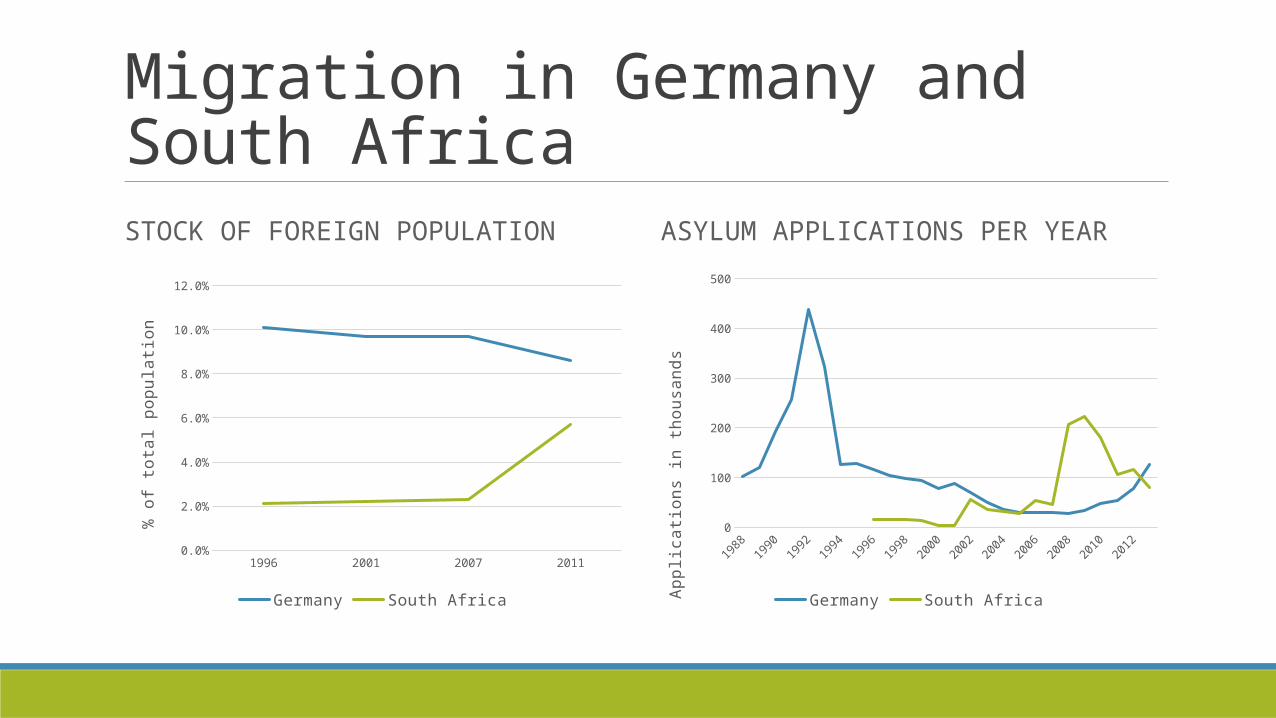
Migration in Germany and South AfricaSTOCK OF FOREIGN POPULATION ASYLUM APPLICATIONS PER YEAR
0
100
200
300
400
500
Germany South AfricaAppl
icat
ions
in
thou
sand
s
1996 2001 2007 20110.0%
2.0%
4.0%
6.0%
8.0%
10.0%
12.0%
Germany South Africa
% of
tot
al p
opul
atio
n
Concluding Remarks - Limitations - Different policy emphases - Policy – Attitude Linkage - Alternative explanations - Theory and practice
Related Documents