Page 1 TRACER STUDY FOR DOCTOR OF VETERINARY MEDICINE GRADUATES FROM 1999-2014 OF THE TARLAC AGRICULTURAL UNIVERSITY DR. MA. ASUNCION G. BELTRAN (Project Leader) DR. LAVINA GRACIA G. MANZANO DR. ANNALIE B. PARAGAS

Welcome message from author
This document is posted to help you gain knowledge. Please leave a comment to let me know what you think about it! Share it to your friends and learn new things together.
Transcript

Page 1
TRACER STUDY FOR DOCTOR OF VETERINARY MEDICINE GRADUATES
FROM 1999-2014 OF THE TARLAC AGRICULTURAL UNIVERSITY
DR. MA. ASUNCION G. BELTRAN(Project Leader)
DR. LAVINA GRACIA G. MANZANODR. ANNALIE B. PARAGAS

Page 2
RATIONALE
The opportunities and options for veterinarians are more varied than ever. Graduates can choose different path of veterinary medicine, animal health
and production and other related agricultural job opportunities. The tracer study on graduates of Doctor of Veterinary Medicine of the
Tarlac Agricultural University seeks to determine the status of graduates following their graduation Gauging graduates’ capability of securing employment. Appraising graduates’ satisfaction level, encompassing various
experiences throughout their studies in TAU. Results as input to enhance the effectiveness of TAU’s academic program
and administrative system mainly for the DVM program.

Page 3
List of Veterinary Schools1. Aklan State University2. Benguet State University3. Cagayan State University4. Capiz State University5. Cavite State University6. Cebu Technological University7. Central Bicol State Univ Agriculture8. Central Luzon State University9. Central Mindanao University10. Dela Salle Araneta University11. DMMMSU12. Isabela State University13. Nueva Vizcaya State University14. Pampanga State Agri University15. Southwestern University16. Tarlac Agricultural University17. Univ of Eastern Philippines18. Univ of the Philippines at LB19. University of Southern Mindanao20. Virgen Milagrosa Univ Foundation21. Visayas State University
ASU
BSU
CSU
CapSU
CavSU
CBSUA
CLSU
CMU
DLSU
DMMMSU
ISU
NVSU
PAC
SWU
TCA
UEP
UPLB
USM
VMUF
VSU
ASU
BSU
CSU
CapSU
CavSU
CBSUA
CLSU
CMU
DLSU
DMMMSU
ISU
NVSU
PAC
SWU
TCA
UEP
UPLB
USM
VMUF
VSU
ASU
BSU
CSU
CapSU
CavSU
CBSUA
CLSU
CMU
DLSU
DMMMSU
ISU
NVSU
PAC
SWU
TCA
UEP
UPLB
USM
VMUF
VSU
ASU
BSU
CSU
CapSU
CavSU
CBSUA
CLSU
CMU
DLSU
DMMMSU
ISU
NVSU
PAC
SWU
TCA
UEP
UPLB
USM
VMUF
VSU

Page 4
CMU
USM
UPLB
CLSU
DLSU-GAUF
TAU
VMUFNVSU
DMMMSU BSUISU
PSAU
CBSUA
CvSU
CSU
CapSU
SWU
VSU
ASU
UEP
CTU

Page 5
OBJECTIVES The study primarily aimed to determine:
1. Personal profile of the graduates;2. The employment status of DVM graduates after completing their
studies; 3. Graduates’ satisfaction level of the curriculum, career guidance, quality
of lecturers, and infrastructure facilities;4. Graduates’ interest in furthering their studies at higher level;5. Graduates’ capability of securing employment; 6. Job market based on starting pay for first-time employees, according to
field and qualifications; 7. Graduates’ experience in getting their first job; and 8. Graduates’ capability in performing at their job.

Page 6
Feedback from graduates concerning various issues related to teaching and learning is also taken into account. Assist the college management in planning and determining factors linked to student intake, curriculum design and improvement in services provided by TAU.

Page 7
SCOPE OF THE STUDY
CVM Tracer Study covers graduates who completed their studies in 1999 to 2014. Target respondents comprised at least 80 percent of all graduates from 1999-2014 from local and abroad.

Page 8
CONCEPTUAL FRAMEWORK
Survey and Personal Interview Personal Attributes:• Civil Status• Sex• Age• Regional Residence• Province Educational Background:• Year Graduated• Honors/Awards Received• Employment status• Nature of Employment• Licensure Status Employment Background:• First work• Waiting time to get first
employment• Competencies/skills learned
that are most useful in landing their first job
• Satisfaction level on their work• Employment security
Survey –Questionnaires
Interview Facebook Messenger Pers CommDescriptiveAnalysis
Personal profile of the graduates;
Employment profile of the graduates;
Economic profile of graduates;
Satisfaction level based on evaluation of graduates on curriculum, career guidance, quality of lecturers and infractructure facilities;
Educational profile after graduation;
Profile of capability of securing employment;
Work experience profile among graduates,
INPUTS PROCESS OUTPUT

Page 9
METHODOLOGYCollection of Data Starting from 1999, when the first graduates of DVM from TAU data was
collected until 2014. A soft copy of graduates was gathered from the office of the Admissions
of TAU to acquire the complete whereabouts of the graduates. Data collection was administered by the team. Questionnaire attached to the invitation sent through mail or e-mails and
on their Facebook accounts. Graduates returned completed questionnaires by FB or through post, or
electronic communication. Most feedbacks were taken through messenger, Viber or chat/telephone
conversations

Page 10
RESEARCH DESIGNPercetage analysis and descriptive research method was used.
LOCATION OF THE STUDY
Locally from the Philippines Abroad

Page 11
RESPONDENTS OF THE STUDY
The list of the Doctor of Veterinary Medicine graduates was secured from the Admission and Registration Office. Random Sampling was utilized in determining the samples. The summary and distribution of respondents according to
year of graduation was used. Nevertheless, almost 90 percent of the graduates were
reached out purposively to get the majority of the graduates by all means despite of limited resources.
Page 12
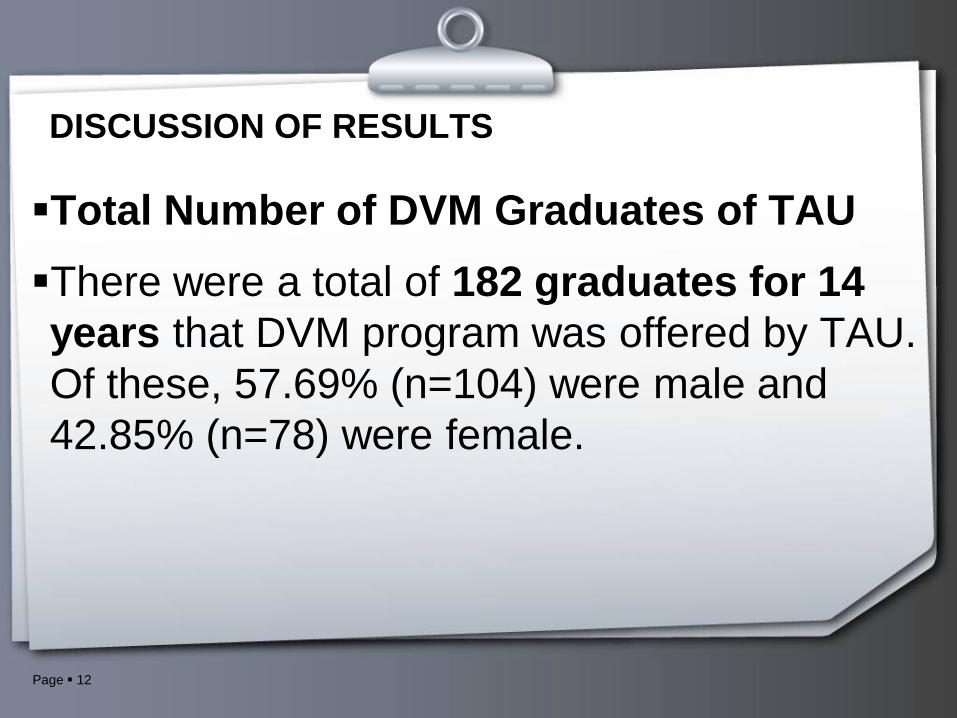
DISCUSSION OF RESULTS
Total Number of DVM Graduates of TAUThere were a total of 182 graduates for 14 years that DVM program was offered by TAU. Of these, 57.69% (n=104) were male and 42.85% (n=78) were female.

Page 13
Figure 1a. Doctors of Veterinary Medicine Graduates from 1999-2014 in their Gender Distribution
Male, 10442.85%
Female, 7857.69%
n= 182

Page 14
Figure 1a. Doctors of Veterinary Medicine Graduates from 1999-2014 in their Gender Distribution
0
5
10
15
20
25
TotalMaleFemale

Page 15
The highest number of graduate in a year was only 20 (Year 2009);Average number of graduates was 12 per year. The average number of entrants was 34 throughout the years Survival rate 35.29% and 64.71% of students did not pushed through the course or did not finished the course on time.
Years with highest number of graduates

Page 16
20
1817
16
15
Batch with the Biggest Number of Graduates
20092003201120052004, 2008
Figure 2. Years with highest number of graduates

Page 17
Provinces where TAU graduates came from
Most of graduates came from Tarlac (58.24%, n=106), 41. 76% from other countries and provinces. Two graduates were from Korea, as part of their government
plan to study in the Philippines. Both of them passed their board exams in Korea and both currently own their small animal clinics back in their country.

Page 18
10626
229
6 3 2 211
111
Place where the Graduates came fromTarlac Pangasinan Pampanga Camarines SurAlbay Nueva Ecija Laguna Korea
Figure 3. Provinces where TAU graduates came from.

Page 19
History of students When the graduates entered the DVM program, 126 (69%)
graduated from public high schools, 56 (31%) graduated from private high schools. Most came from average to poor families, having less than
Php 10,000 salaries/month. Financial support mostly comes from their farming activities
and monetary aids and support from relatives working abroad. Some maintained merit, leadership and other scholarships,
an average of three (3) students per year (13.63%). Nevertheless, all students finished their course in 6 years (96%) or more (4%)..

Page 20
For honor students, only two graduated Cum Laude, enjoyed merit scholarships and both landed top 10 in the board examination during their time and landed very good jobs. Ninety eight percent (98%, n=174) graduates stated that
DVM was their first choice as course while (2%, n=4) was not their first choice but it was their parent’s choice or no choice at all. All students finished their course in 6 years (96%) or more (4%).

Page 21
126, 69%
56, 31%
Type of high school where DVM Graduates came
Public
Private
Figure 4. Type of high school where DVM graduates came.

Page 22
174, 98%
4, 2%
Is Doctor of Veterinary Medicine Their First Choice?
YESNO
Figure 5. Data of Doctor of Veterinary Medicine graduates’ first choice upon entry to TAU

Page 23
3, 2%
179, 98%
Number of Deceased Graduates
YES
NO
Figure 6. Livability of graduates was 98%

Page 24
Figure 7a. Employment Status (Batches 1999-2014)
169,94%
9, 5%
1,1%
n=179
Fully EmployedUnderemployedNot employed
*One deceased

Page 25
0
5
10
15
20
25
Gra
duat
es
Year Graduated
Fully EmployedUnderemployedNot EmployedTotal
Figure 7b. Employment Status (Batches 1999-2014)

Page 26
Figure 8. Nature of Employment of DVM Graduates
31%
23%13%
8%
7%6%
5% 3% 2%1%
1% Farm VetSmall Animal PractCompany VetSales RepGovernmtOthersBusinessAcademeZooMilitaryLab
N= 179

Page 27
Figure 9. Location of Employment of DVM Graduates as of 2014
71%
11%
7%
5% 4% 1% 1%
N=179
PhilippinesCanadaMiddle eastAustralia/New ZealandAsiaEuropeUSA

Page 28
Figure 10. Problems Encountered by graduates upon seeking jobs
39%
29%
22%
9%1%
N=179
Board Exam Eligibility
Competition bet School
Insufficient budget forboard applicationLack of training
Others

Page 29
Board Examination Passers
The passing of the licensure examination for veterinarian was the last thing to hurdle by the graduates before they could land their job. Only 41% (n=74) among graduates passed the test, while
59% did not passed the board exam (n=105). The national passing percentage is between 35-45% every
year administered by the Professional Regulatory Commission.

Page 30
Board Exam…
Measures have been made to help our graduates increase their passing in the board exam like attending a review centers and free review for the graduates from TAU. Faculty were annually trained to improve the syllabi to cope up with the
changing times, but still the result of exam does not lie on our materials, but in the graduates’ personal diligence, discipline and focus in their studies in the basic and professional years. But all graduates are employed.

Page 31
7441%
10559%
Figure 9. Percentage of Board Exam Passer from 1999-2014
Passer
Non-Passer

Page 32
Graduates’ satisfaction level of the curriculum, career guidance, quality of lecturers, and infrastructure facilities at TAU
49.16%, n=88 stated that they are moderately satisfied on the level of the curriculum, career guidance, quality of lectures and the infrastructure facilities of TAU. Another 43.02% (n=77) said they are fully satisfied, against 7.82% (n=14)
are not satisfied . Suggestions given were, equipment and supplies must be sustainably
given to the college. Laboratory aide/technician to maintain the equipments.

Page 33
Figure 10. Graduates’ status in furthering their studies at higher level
94%
4%
1%0%
1%
N=179
DVMwith masteral unitMaster's degreewith doctoral unitsDoctorate degree
Page 34
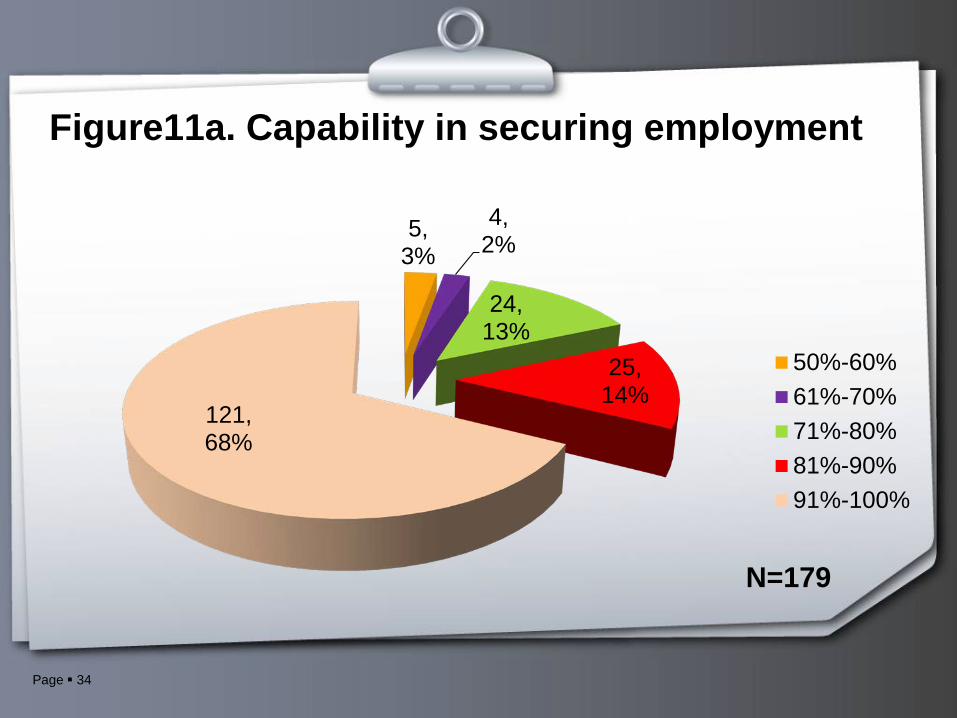
Figure11a. Capability in securing employment
5,3%
4,2%
24,13%
25,14%
121,68%
N=179
50%-60%61%-70%71%-80%81%-90%91%-100%
Page 35
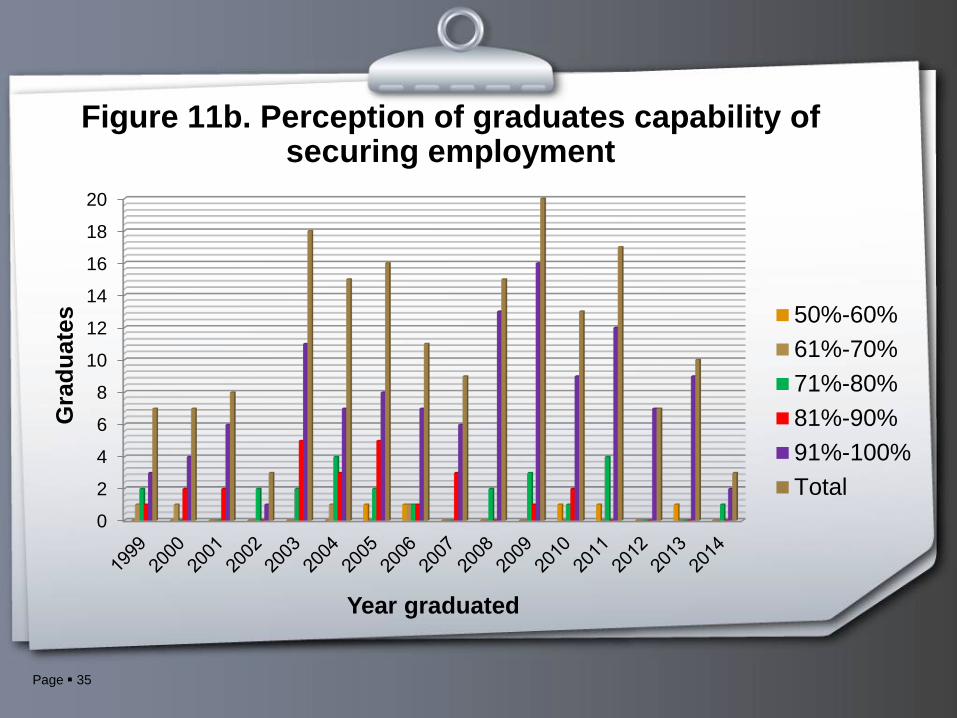
Figure 11b. Perception of graduates capability of securing employment
0
2
4
6
8
10
12
14
16
18
20
Gra
duat
es
Year graduated
50%-60%61%-70%71%-80%81%-90%91%-100%Total

Page 36
Figure 12. Starting pay of Doctor of Veterinary Medicine Graduates
6%
69%
25%
N=179
Less than 10,00010,000-20,00020,000-30,000

Page 37
Figure 13. Length of time getting the first job among graduates
26%
8%65%
1%
N=179
immediate1-2 monthsin 3 monthsin 6 months

Page 38
Figure 14. Capability of DVM graduates performing the first job
76%
15%8%
1%
N=179
very capable
capable, learned from co-workerscapable, but needs moretrainingnot capable

Page 39
Figure 15. Work experiences profile of graduates
29%
39%
24%
8%
N=179
1st job2nd job3rd job4th job

Page 40
Figure 16. Work satisfaction profile of graduates
64%
25%
11%
N=179
Fully satisfiedFairly satisfiedNot satisfied

Page 41
CONCLUSIONGraduates of the DVM program in TAU performed well in the
field.Graduates were fully satisfied in their jobs. Graduates found their jobs in less than three months, passers
and non-passers alike. Board passer took better salaries than those did not passed
the licensure examination. Strategies made to improve board results: better IM/syllabi
for faculty; review classes integrated in the last semester an coaching of faculty before the exams

Page 42
RECOMMENDATION support from the TAU administration be given to the College of Veterinary Medicine for its program enrichment of laboratory and faculty development program.

Page 43
Thank you!
Related Documents