LATIN AMERICA 6L TF TRACE Model in Pilot Cities in Latin America May 19, 2015 GEEDR LATIN AMERICA AND CARIBBEAN REPORT NO: AUS5783

Welcome message from author
This document is posted to help you gain knowledge. Please leave a comment to let me know what you think about it! Share it to your friends and learn new things together.
Transcript
LATIN AMERICA 6L TFTRACE Model in Pilot Cities in Latin America
May 19, 2015
GEEDR
LATIN AMERICA AND CARIBBEAN
REPORT NO: AUS5783

Standard Disclaimer:
This volume is a product of the staff of the International Bank for
Reconstruction and Development/ The World Bank. The findings,
interpretations, and conclusions expressed in this paper do not necessarily
reflect the views of the Executive Directors of The World Bank or the
governments they represent. The World Bank does not guarantee the
accuracy of the data included in this work. The boundaries, colors,
denominations, and other information shown on any map in this work do
not imply any judgment on the part of The World Bank concerning the
legal status of any territory or the endorsement or acceptance of such
boundaries.
Copyright Statement:
The material in this publication is copyrighted. Copying and/or
transmitting portions or all of this work without permission may be a
violation of applicable law. The International Bank for Reconstruction and
Development/ The World Bank encourages dissemination of its work and
will normally grant permission to reproduce portions of the work promptly.
For permission to photocopy or reprint any part of this work, please
send a request with complete information to the Copyright Clearance
Center, Inc., 222 Rosewood Drive, Danvers, MA 01923, USA, telephone
978-750-8400, fax 978-750-4470, http://www.copyright.com/.
All other queries on rights and licenses, including subsidiary rights,
should be addressed to the Office of the Publisher, The World Bank, 1818
H Street NW, Washington, DC 20433, USA, fax 202-522-2422, e-mail
Tool for Rapid Assessment of City Energy (TRACE)LE
ÓN
, GU
AN
AJU
AT
O,
MÉX
ICO

Tool for Rapid Assessment of City Energy (TRACE) LEÓN, GUANAJUATO, MÉXICO

LEÓN, GUANAJUATO, MÉXICOTOOL FOR RAPID ASSESSMENT OF CITY ENERGY (TRACE) iii
PREFACE- MUNICIPAL PRESIDENT OF LEÓN
The Municipal Government of León is aware of the importance of keeping
our natural heritage and reversing the trend of environmental deterioration.
To reach this target, public, private, national and international efforts must
be joined.
Based on our strong municipal vocation we advocate the idea of the
strong potential of local governments to undertake concrete actions
leading to the efficient use of energy and inputs generating said energy.
That is why we are very pleased the World Bank selected the city of
León to implement the energy efficiency study using TRACE (Tool for
Rapid Assessment City Energy).
From the very first day, we worked under the premise “think globally, act
locally”. We have taken several actions that have translated in irrefutable
benefits for the people; moreover, they have been considered as national
and international references since they are judged as “success stories”
because of their high impact.
Such is the case of the Integrated Public Transport System, which made
the city of León the municipality with the most sustainable transportation
system worldwide, by the current diagnosis.
Based on the conclusions of this document, the transportation system
of León has the lowest fuel consumption per inhabitant among the cities
where TRACE was implemented. This is a big achievement, since it places
us as a city with a cutting-edge public transport system and at the same
time environmentally friendly.
The energy co-generation system using biogas from the Municipal
Wastewater Treatment Plant implemented by Sistema de Agua Potable
y Alcantarillado de León – SAPAL, the water and wastewater public entity,
has been one of the projects considered as a success story, and it has
also been identified by TRACE as sustainability benchmarking of city
governments.
This process not only reduces considerably this type of gas emissions
to the atmosphere, it uses them to generate the electric and thermal
power required by the Plant, contributing to significant economic savings.
These are just two of the innovating model examples that have extended
the virtuous circle of their actions towards the environmental, social and
economic sustainability. These models have been proudly implemented by
the Municipal Presidency of León using available resources, and also with
the dedication and support from the Municipal staff.
The current diagnosis of energy efficiency has also allowed us to
identify our improvement opportunities, leading us to take actions to
improve the existing programs.
An example is waste management identified by TRACE as an
improvement opportunity. As TRACE implementation advanced in this
sector, we saw the urgent need to re-design our urban solid waste collection
and disposal system.
Thus, since the beginning of this year we began re-designing the
system, from the legal scope with the service call for tenders to change
criteria for payments to concessionaires and the use of recyclable waste.
This action discovered multiple layers in a complex network for waste
collection and disposal. It was a problem for those who collected waste
illegally, but it helped us to break with inertia, deeply rooted defects, and
to undergo a needed and urgent transformation.
In spite of the troubles for many, benefits will be for everybody in León.
At the present time, we are on the right track to become the most efficient
and sustainable municipality as far as urban solid waste management is
concerned.

LEÓN, GUANAJUATO, MÉXICOTOOL FOR RAPID ASSESSMENT OF CITY ENERGY (TRACE) iv
These and many other benefits were achieved by conducting the
energy diagnosis of the city based on TRACE that we implemented
thanks to the support from the World Bank that is assisting us to build an
environmentally responsible León.
On behalf of all the people of León, I thank the World Bank, not only for
having chosen the city of León to implement TRACE, but also for trusting
city governments as the global driving force the planet is requesting.
LIC. MARÍA BÁRBARA BOTELLO SANTIBÁÑEZ
Municipal President of León
LEÓN, GUANAJUATO, MÉXICOTOOL FOR RAPID ASSESSMENT OF CITY ENERGY (TRACE) v
PREFACE - SECRETARY OF ENERGY (SENER)
The National Energy Strategy 2013-2027 establishes that Mexico has had
a growing urban population, which resulted from the migration from rural
to urban areas, in search of more employment opportunities and a better
quality of life. This has led to a growth in demand for services such as water
pumping systems, public lighting, public transport, space conditioning and
infrastructure, which concentrate power and fuel consumption.
In light of this growing urban footprint, it is essential to improve energy
efficiency in Mexican cities to reduce energy costs and local and global
environmental impacts deriving from energy consumption.
Mexico is committed to boosting the national energy sector through
projects, programs and actions aimed at achieving greater use and
development of renewable energy and clean technologies as well as to
promote energy efficiency to achieve an appropriate balance that allows the
country to move towards social, economic and environmental sustainability
in line with current and future global environmental commitments.
In this regard, the Secretary of Energy, with World Bank support,
supported the development of the diagnosis on energy efficiency through
the implementation of the Tool for Rapid Assessment of Cities Energy
(TRACE), a tool for prioritizing energy saving in cities. TRACE allows local
governments to understand opportunities to increase energy efficiency;
primarily through energy saving for transportation, buildings, street
lighting, solid waste, water pumping energy and heating, which will result in
significant savings opportunities for the municipality and important social
benefits and care for the local and global environment.
The diagnostics are expected to clearly identify potential areas of
public or private investment that the local government can use to improve
services provided to the city, and with that, make more efficient energy use.
LEONARDO BELTRÁN RODRÍGUEZ.
Undersecretary of Planning and Energy Transition
Secretary of Energy (SENER)

LEÓN, GUANAJUATO, MÉXICOTOOL FOR RAPID ASSESSMENT OF CITY ENERGY (TRACE) vi

LEÓN, GUANAJUATO, MÉXICOTOOL FOR RAPID ASSESSMENT OF CITY ENERGY (TRACE) vii
PREFACE – WORLD BANK GROUP
City governments are in a unique position to lead the transition to more
efficient energy use and in the process improve their urban services, reduce
budgetary expenditures, and curb energy use and emissions.
Municipalities are typically large and visible energy consumers that
through their actions and good example can encourage energy efficiency
and help promote the market for energy efficient products and services.
While energy efficiency priorities will be different depending on factors
such as geography, climate, and the level of economic development,
Mexican cities appear to have significant potential to reduce energy
consumption, for example, in public lighting, municipal buildings, and the
provision of water and sanitation. FIDE estimates that energy savings of up
to 50 percent are possible through the installation of efficient street lights
and up to 40 percent by employing more efficient water pumps. Municipal
facilities, such as office buildings or schools, typically have a similar energy
consumption pattern that may offer an attractive investment opportunity
for commercial equipment and service providers, while at the same time
providing energy and financial savings to the municipality.
Although programs to support energy efficiency exist at the municipal
level, a fundamental question is why these measures are not undertaken
on a larger scale given the availability of proven technologies and when
financing is not a constraint. Among the common barriers to urban
energy efficiency investments are regulatory and legal constraints, lack
of knowledge of cost-effective interventions, and limited institutional
capacity to design and implement projects. This study is based on a rapid
assessment of municipal energy use and identifies where opportunities for
energy savings exist. With this information, and through the support of
other federal and state programs, municipal authorities in Mexico will be
in a better position to plan and implement cost-effective energy efficiency
measures.
This study is part of a broader program in Mexico to help identify
and implement energy efficiency measures. The country has previously
established the National Program for Efficient Energy Use (Programa
Nacional para el Aprovechamiento de la Energia, PRONASE) that seeks to
promote and support the establishment of institutional arrangement for
the design and implementation of energy efficiency policies, programs,
and projects at the subnational level. To elevate the focus on cities, SENER
launched a national urban energy efficiency program in June 2014. This
study evaluates a range of options to reduce energy use in municipal
services, including street lighting, public buildings, water supply and
sanitation, public transport, solid waste management, and within energy
utilities (electricity and gas). The World Bank has been involved in end-use
energy efficiency programs in Mexico and has recently supported energy
use diagnostics at the municipal level. This has led to a cooperative effort
between SENER and the World Bank to design and implement a national

LEÓN, GUANAJUATO, MÉXICOTOOL FOR RAPID ASSESSMENT OF CITY ENERGY (TRACE) viii
municipal energy efficiency program, beginning with multi-city energy use
assessments.
This report focuses on energy use in the Municipality of Leon. The hope
is that the findings from this study will provide useful lessons to other
cities that are interested in improving the efficiency of energy use. Both
the methodology and specific energy efficiency measures identified here
are likely to be illustrative of the potential in other cities in Mexico. The
World Bank intends to draw on the findings from León and other Mexican
cities to provide global lessons for urban energy efficiency.
MALCOLM COSGROVE-DAVIES
Practice Manager
Energy and Extractives Global Practice
The World Bank Group
LEÓN, GUANAJUATO, MÉXICOTOOL FOR RAPID ASSESSMENT OF CITY ENERGY (TRACE) 1
TABLE OF CONTENTS
Preface - Municipal President of León ....................................... iii
Preface - Secretary of Energy (SENER) .......................................v
Preface - World Bank Group.........................................................vii
Executive Summary ........................................................................ 2
Methodology ..................................................................................... 8
Background León ...........................................................................11
National Framework Regarding Energy ..................................13
León Sector Diagnostics ...........................................................19
Streetlights ..............................................................................23
Solid Waste .............................................................................25
Municipal Buildings ................................................................28
Urban Transport .....................................................................29
Water ........................................................................................36
Energy Efficiency Recommendations ....................................41
Streetlights ..............................................................................44
Solid Waste ..............................................................................47
Municipal Buildings .................................................................49
Municipal Vehicles .................................................................51
Energy Efficiency Strategy and Action Plan ....................52
Annexes ............................................................................................55
ESMAP COPYRIGHT DISCLAIMER
Energy Sector Management Assistance Program (ESMAP) reports are
published to communicate the results of ESMAP’s work to the development
community with the lease possible delay. Some sources cited in this paper
may be informal documents that are not readily available.
The findings, interpretations, and conclusions expressed in this report
are entirely those of the author(s) and should not be attributed in any
manner to the World Bank, or its affiliated organizations, or to members
of its board of executive directors for the countries they represent, or to
ESMAP. The World Bank and ESMAP do not guarantee the accuracy of the
data included in this publication and accepts no responsibility whatsoever
for any consequence of their use. The boundaries, colors, denominations,
and other information shown on any map in this volume do not imply on
the part of the World Bank Group any judgment on the legal status of any
territory or the endorsement of acceptance of such boundaries.
TRACE (Tool for Rapid Assessment of City Energy) was developed by
ESMAP (Energy Sector Management Assistance Program), a unit of the
World Bank, and is available for download and free use at: http://esmap.
org/TRACE.
LEÓN, GUANAJUATO, MÉXICOTOOL FOR RAPID ASSESSMENT OF CITY ENERGY (TRACE) 2
EXECUTIVE SUMMARY
Beautiful Leon, Guanajuato,Its fair with its gambling;There one bets one’s life,
And the winner is respected.There in my Leon, Guanajuato
Life is not worth anything.
Background
This report, supported by the Energy Sector Management Assistance
Program (ESMAP), applies the Tool for the Rapid Assessment of City
Energy (TRACE) to examine energy use in León, México. This study is
one of three requested (besides by León, by Puebla, México and Bogota,
Colombia) and conducted in 2013 by the World Bank Latin America and
the Caribbean Energy Unit to begin a dialogue on energy efficiency (EE)
potential in Latin America and Caribbean cities. In Puebla and León, TRACE
helped the Mexican Secretary of Energy (SENER) develop an urban EE
strategy.
TRACE is a simple, practical tool for making rapid assessments of
municipal energy use. It helps prioritize sectors that have the potential to
save significant amounts of energy and identifies appropriate EE measures
in six sectors—transport, municipal buildings, wastewater, streetlights,
solid waste, and power/heat. Globally, the six are often managed by the
cities which have substantial influence over public utility services. In this
context, TRACE—which is a low-cost, user-friendly, and practical tool that
can be applied in any socioeconomic setting—offers local authorities the
information they need about energy performance and identifies areas
where more analysis would be useful. The tool includes about 65 EE efforts
based on case studies and global best practices. It is targeted mainly at
local authorities and public utility companies, but it could also be used
by state or federal authorities to increase their knowledge about how to
make cities more energy efficient.
Because TRACE is rapid, the analysis is somewhat limited. Its
recommendations should thus be seen as an indication of what can be done
to improve a city’s energy performance and reduce energy expenditures
in some areas; however, it does not assess the residential, industrial, or
commercial sectors. In many cities worldwide, the six TRACE areas are
under municipal jurisdiction, but in Latin America and the Caribbean, local
authorities often have only limited influence over sectors such as transport,
electricity, water, and sanitation.
Several recommendations were produced through the TRACE analysis
to help the city improve EE in urban services. The findings were made in
consultation with local authorities based on sector analyses by local
consultants. The study looked at six areas to determine the three that
have the greatest savings potential and where the city has a significant
degree of control: streetlights, solid waste, and municipal buildings.
Overview of energy use
STREETLIGHTS. The streetlight infrastructure is mainly owned by León, and
part of the total concrete light poles are owned by the national electricity
company, Comisión Federal de Electricidad (CFE). León is responsible for
maintaining the streetlights and pays CFE for energy consumption through
a local tax on residential consumers.
Although a relatively large number of city roads are lit, authorities do
not have a good inventory of the number of streetlights. Also, the use of
meters needs to increase since these will allow the city to identify the
LEÓN, GUANAJUATO, MÉXICOTOOL FOR RAPID ASSESSMENT OF CITY ENERGY (TRACE) 3
amount of energy consumed. Of the city roads, 76 percent are lit, but only
65 percent of consumption is actually metered. The remaining amount is
estimated by CFE. Also, the precise number of street lamps is unclear, with
the figures differing. The city department estimates 70,000 while CFE says
there are 90,000.
In the last two decades, the city carried out measures to improve
streetlights—replacing old, high-energy-intensive bulbs with more efficient
high-pressure sodium (HPS) vapor lamps and equipping some light
poles with energy-saving devices for dimming. The TRACE results have
encouraged the city to pursue a pilot project to replace 613 HPS with
Light-Eemitting Diode LED lamps for 10 km along the Boulevard Adolfo
Lopez Mates, one of León’s main avenues.
Although lights are not on all the city’s streets, the system requires a
large amount of electricity to operate the lights—costs which are ultimately
paid by residents. According to the Mexican constitution, public lighting is
a city responsibility, paid for by a tax in consumers’ electricity bills.
Streetlights use 2.9 percent of the total electricity consumed by the
city. According to the TRACE, about US$2 million a year could be saved in
energy expenditures if the city improved the system. This would involve
the following steps:
• Conduct an audit of all streetlights.
• Upgrade/renovate street lamps with more efficient technology that can
deliver the same lighting levels with lower energy consumption, thus reducing
carbon emissions and operating expenses.
• In areas where the city controls the street lamps, it should introduce a
program that dims lights at certain times according to varying weather and
activity levels (for example, more light is needed at night when people are out
than in the early morning hours when there is less activity).
• Contract with an energy service company (ESCO) so that a third party pays
for the cost of the upgrades and recovers its investment by sharing in the
savings achieved.
SOLID WASTE. This function is carried out by both public and private
institutions under the control and oversight of the city’s Integrated
Public Cleaning System (Sistema Integral de Aseo Público [SIAP]). Private
operators collect industrial waste while SIAP and private operators hired
under short-term contracts collect urban commercial and residential
waste. The city’s landfill is managed by a private contractor. Given the
numerous private operators, the city lacks accurate and reliable data on
collection trucks, routes, fuel consumption, and overall energy use. Thus,
the TRACE only studied current expenditures for which there was enough
information.
The solid waste system serves 264,830 households in urban areas
and nearly 15,000 in rural communities. The 309 kg produced per capita
is comparable to other cities in the TRACE database with similar-sized
populations. Since, as mentioned before, the waste is collected by several
private companies, this prevents optimal disposal, reuse, and recycling and
increases fuel consumption. The short-term contracts also prevent the
collection of information on energy use and monitoring of the practices.
Less than three percent of León’s solid waste is recycled, which is
carried out mainly by informal collectors.
Because there are no transfer stations in the city, solid waste trucks
travel long distances—about 80 km a day—to the landfill, using a large
amount of fuel.
The system can be improved and savings obtained if the following EE
measures are adopted:
LEÓN, GUANAJUATO, MÉXICOTOOL FOR RAPID ASSESSMENT OF CITY ENERGY (TRACE) 4
• Create transfer stations and recycling centers, which would allow waste to be
separated (for recycling and composting), and thereby reduce (1) the amount
sent to the landfill and (2) the number of truck trips and fuel consumption by
waste collectors.
• Establish medium- to long-term private operator contracts since these would
optimize collection, disposal, and infrastructure investments.
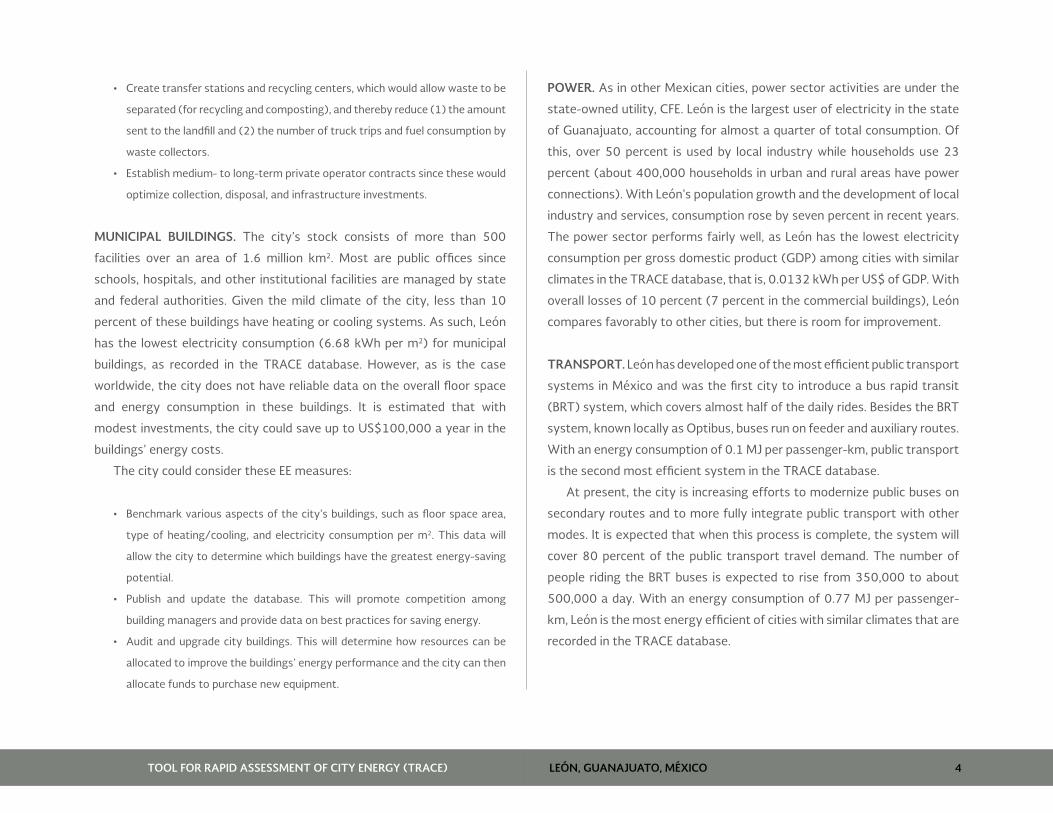
MUNICIPAL BUILDINGS. The city’s stock consists of more than 500
facilities over an area of 1.6 million km2. Most are public offices since
schools, hospitals, and other institutional facilities are managed by state
and federal authorities. Given the mild climate of the city, less than 10
percent of these buildings have heating or cooling systems. As such, León
has the lowest electricity consumption (6.68 kWh per m2) for municipal
buildings, as recorded in the TRACE database. However, as is the case
worldwide, the city does not have reliable data on the overall floor space
and energy consumption in these buildings. It is estimated that with
modest investments, the city could save up to US$100,000 a year in the
buildings’ energy costs.
The city could consider these EE measures:
• Benchmark various aspects of the city’s buildings, such as floor space area,
type of heating/cooling, and electricity consumption per m2. This data will
allow the city to determine which buildings have the greatest energy-saving
potential.
• Publish and update the database. This will promote competition among
building managers and provide data on best practices for saving energy.
• Audit and upgrade city buildings. This will determine how resources can be
allocated to improve the buildings’ energy performance and the city can then
allocate funds to purchase new equipment.
POWER. As in other Mexican cities, power sector activities are under the
state-owned utility, CFE. León is the largest user of electricity in the state
of Guanajuato, accounting for almost a quarter of total consumption. Of
this, over 50 percent is used by local industry while households use 23
percent (about 400,000 households in urban and rural areas have power
connections). With León’s population growth and the development of local
industry and services, consumption rose by seven percent in recent years.
The power sector performs fairly well, as León has the lowest electricity
consumption per gross domestic product (GDP) among cities with similar
climates in the TRACE database, that is, 0.0132 kWh per US$ of GDP. With
overall losses of 10 percent (7 percent in the commercial buildings), León
compares favorably to other cities, but there is room for improvement.
TRANSPORT. León has developed one of the most efficient public transport
systems in México and was the first city to introduce a bus rapid transit
(BRT) system, which covers almost half of the daily rides. Besides the BRT
system, known locally as Optibus, buses run on feeder and auxiliary routes.
With an energy consumption of 0.1 MJ per passenger-km, public transport
is the second most efficient system in the TRACE database.
At present, the city is increasing efforts to modernize public buses on
secondary routes and to more fully integrate public transport with other
modes. It is expected that when this process is complete, the system will
cover 80 percent of the public transport travel demand. The number of
people riding the BRT buses is expected to rise from 350,000 to about
500,000 a day. With an energy consumption of 0.77 MJ per passenger-
km, León is the most energy efficient of cities with similar climates that are
recorded in the TRACE database.
LEÓN, GUANAJUATO, MÉXICOTOOL FOR RAPID ASSESSMENT OF CITY ENERGY (TRACE) 5
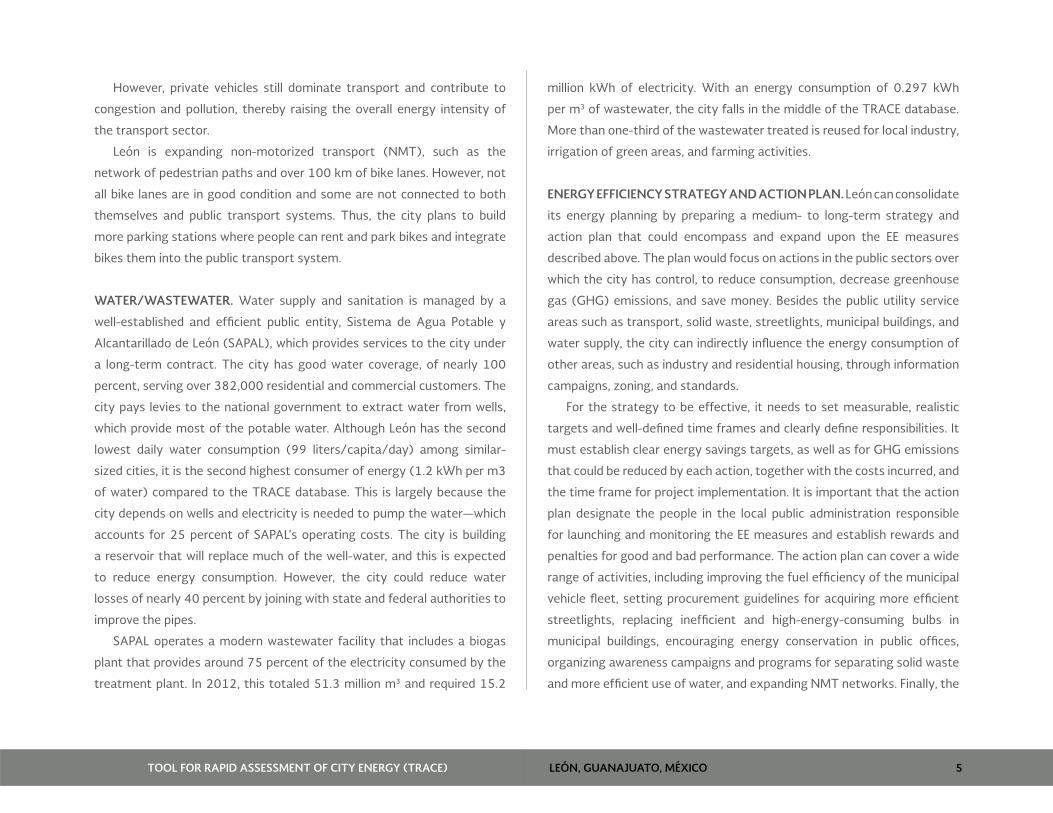
However, private vehicles still dominate transport and contribute to
congestion and pollution, thereby raising the overall energy intensity of
the transport sector.
León is expanding non-motorized transport (NMT), such as the
network of pedestrian paths and over 100 km of bike lanes. However, not
all bike lanes are in good condition and some are not connected to both
themselves and public transport systems. Thus, the city plans to build
more parking stations where people can rent and park bikes and integrate
bikes them into the public transport system.
WATER/WASTEWATER. Water supply and sanitation is managed by a
well-established and efficient public entity, Sistema de Agua Potable y
Alcantarillado de León (SAPAL), which provides services to the city under
a long-term contract. The city has good water coverage, of nearly 100
percent, serving over 382,000 residential and commercial customers. The
city pays levies to the national government to extract water from wells,
which provide most of the potable water. Although León has the second
lowest daily water consumption (99 liters/capita/day) among similar-
sized cities, it is the second highest consumer of energy (1.2 kWh per m3
of water) compared to the TRACE database. This is largely because the
city depends on wells and electricity is needed to pump the water—which
accounts for 25 percent of SAPAL’s operating costs. The city is building
a reservoir that will replace much of the well-water, and this is expected
to reduce energy consumption. However, the city could reduce water
losses of nearly 40 percent by joining with state and federal authorities to
improve the pipes.
SAPAL operates a modern wastewater facility that includes a biogas
plant that provides around 75 percent of the electricity consumed by the
treatment plant. In 2012, this totaled 51.3 million m3 and required 15.2
million kWh of electricity. With an energy consumption of 0.297 kWh
per m3 of wastewater, the city falls in the middle of the TRACE database.
More than one-third of the wastewater treated is reused for local industry,
irrigation of green areas, and farming activities.
ENERGY EFFICIENCY STRATEGY AND ACTION PLAN. León can consolidate
its energy planning by preparing a medium- to long-term strategy and
action plan that could encompass and expand upon the EE measures
described above. The plan would focus on actions in the public sectors over
which the city has control, to reduce consumption, decrease greenhouse
gas (GHG) emissions, and save money. Besides the public utility service
areas such as transport, solid waste, streetlights, municipal buildings, and
water supply, the city can indirectly influence the energy consumption of
other areas, such as industry and residential housing, through information
campaigns, zoning, and standards.
For the strategy to be effective, it needs to set measurable, realistic
targets and well-defined time frames and clearly define responsibilities. It
must establish clear energy savings targets, as well as for GHG emissions
that could be reduced by each action, together with the costs incurred, and
the time frame for project implementation. It is important that the action
plan designate the people in the local public administration responsible
for launching and monitoring the EE measures and establish rewards and
penalties for good and bad performance. The action plan can cover a wide
range of activities, including improving the fuel efficiency of the municipal
vehicle fleet, setting procurement guidelines for acquiring more efficient
streetlights, replacing inefficient and high-energy-consuming bulbs in
municipal buildings, encouraging energy conservation in public offices,
organizing awareness campaigns and programs for separating solid waste
and more efficient use of water, and expanding NMT networks. Finally, the
LEÓN, GUANAJUATO, MÉXICOTOOL FOR RAPID ASSESSMENT OF CITY ENERGY (TRACE) 6
strategy or plan would not only reduce carbon emissions and lower energy
costs but also improve air quality and make León a more attractive place
for citizens and visitors.
Matrix with EE priorities and proposed programs
The matrix below presents the public sectors identified by the TRACE tool as
having the highest energy-saving potential and some of the measures the
city could consider to reduce consumption and improve overall efficiency.
The maximum energy saving potential is calculated by the TRACE tool
considering the total energy spending in the sector1 and other parameters
such as the city authority control and the relative energy intensity of the
TRACE tool as is explained in the Summary of Section Priorization in the
Recommendation section.
The energy saving recommendations in the matrix were presented,
discussed and agreed with the city authorities and key stakeholders,
and represent only some of the possible measures to achieve maximum
potential savings. These are classified by cost, energy saving potential
and time of implementation, which are an estimation based on previous
experiences however further assessments should be conducted to get the
real cost of implementing the measures in Leon.
1 The total energy spending on public transportation and private vehicles was estimated by multiplying the annual fuel consumption (diesel and gasoline, respectively) by the average price of the fuel. Energy spending in street lighting, potable water and public buildings were provided by the utility companies and the city authorities.
Notes for the Matrix of EE Priorities a These amount refers to the maximum potential savings in the sector base on
the TRACE tool, assuming all possible recommendations are implemented. The
recommendations shown in the table were selected after discussions with the
municipal authorities and utility companies and could help achieve some of the
potential energy savings; however a detailed audit would need to be done to assess
with more precision the amount of energy savings each measure can achieve.
b Cost of Implementation estimated: low ($) = US$0 -US$100,000; medium ($$) =
US$100,000 – US$1,000,000; high ($$$) = > US$1,000,000
c Energy Saving Potential estimated: low (*), medium (**), high (***)
LEÓN, GUANAJUATO, MÉXICOTOOL FOR RAPID ASSESSMENT OF CITY ENERGY (TRACE) 7
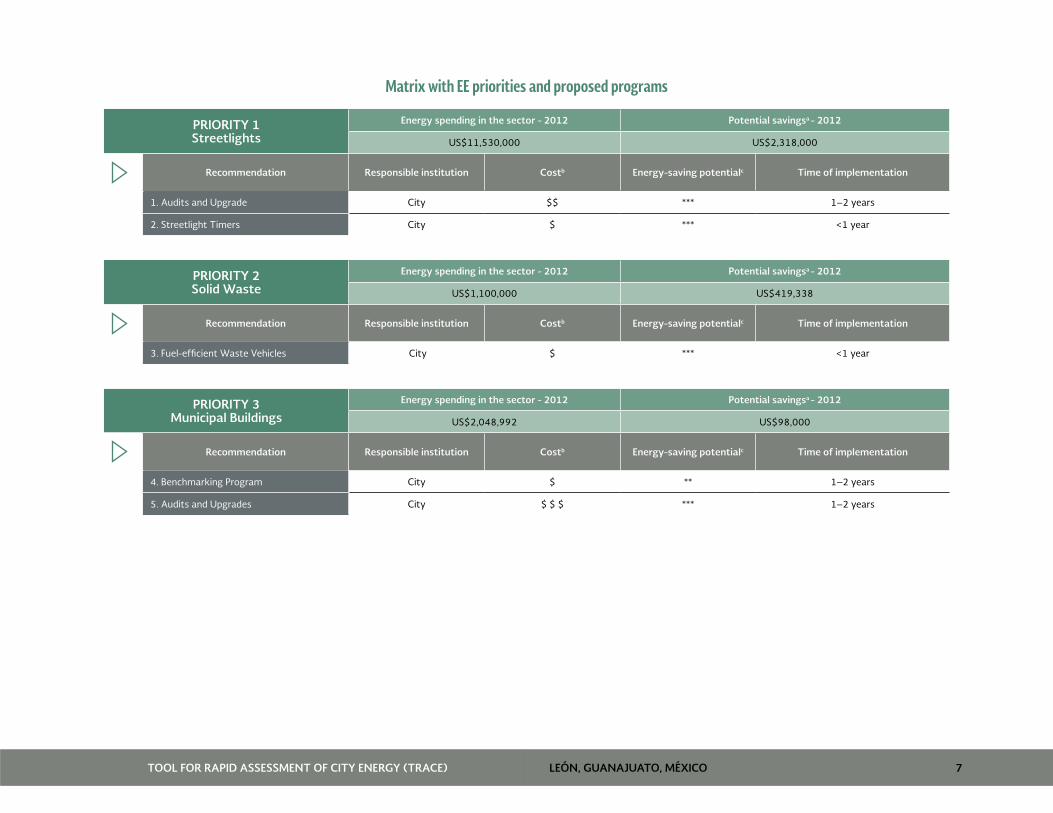
Matrix with EE priorities and proposed programs
PRIORITY 1Streetlights
Energy spending in the sector - 2012 Potential savingsa - 2012
US$11,530,000 US$2,318,000
Recommendation Responsible institution Costb Energy-saving potentialc Time of implementation
1. Audits and Upgrade City $$ *** 1–2 years
2. Streetlight Timers City $ *** <1 year
PRIORITY 2Solid Waste
Energy spending in the sector - 2012 Potential savingsa - 2012
US$1,100,000 US$419,338
Recommendation Responsible institution Costb Energy-saving potentialc Time of implementation
3. Fuel-efficient Waste Vehicles City $ *** <1 year
PRIORITY 3Municipal Buildings
Energy spending in the sector - 2012 Potential savingsa - 2012
US$2,048,992 US$98,000
Recommendation Responsible institution Costb Energy-saving potentialc Time of implementation
4. Benchmarking Program City $ ** 1–2 years
5. Audits and Upgrades City $ $ $ *** 1–2 years
LEÓN, GUANAJUATO, MÉXICOTOOL FOR RAPID ASSESSMENT OF CITY ENERGY (TRACE) 8
METHODOLOGY
TRACE helps prioritize the areas/sectors with significant energy-saving
potential, and identifies appropriate EE measures in six areas: transport,
municipal buildings, water and wastewater, streetlights, solid waste, and
power/heat. It consists of three components: (1) an energy benchmarking
module that compares key performance indicators (KPIs) in similar cities;
(2) a prioritization model that identifies areas which offer the greatest
potential for energy cost-savings; and (3) an activity model that functions
like a ‘playbook’ of tried-and-tested EE measures. The three are part of
a user-friendly software application that takes the city through a series
of sequential steps from initial data gathering to a report with a matrix
of EE recommendations based on the city’s particular context, to a list of
implementation and financing options. These are the steps:
1. Collecting City Energy Use Data
The TRACE database has 28 KPIs from 80 cities. Each of the data points
in the KPIs is collected for the city before the tool is applied; once TRACE
is launched, the collection grows as new, reliable data become available.
2. Analyzing City Energy Use Against Similar Cities
The city’s performance is compared with others with similar population,
climate, and human development in each of the six areas (3–6 KPIs per
area). The benchmarking provides an overview of energy performance so
the city can assess its relative rankings against the others. The relative
energy intensity (REI)—the percentage by which energy use in one area
can be reduced—is calculated by a simple formula. It looks at all cities that
perform better on certain KPIs (for example, energy use per streetlight),
and estimates the average improvement potential. The more cities in the
database, the more reliable the final results will be.
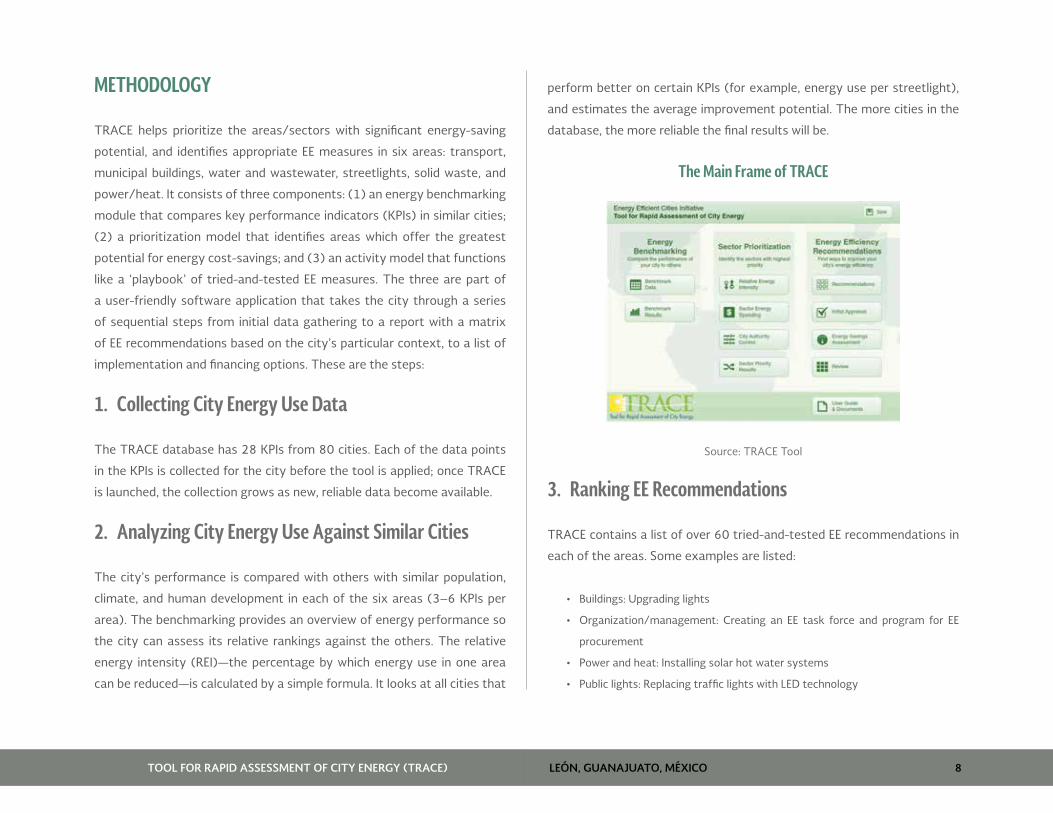
The Main Frame of TRACE
Source: TRACE Tool
3. Ranking EE Recommendations
TRACE contains a list of over 60 tried-and-tested EE recommendations in
each of the areas. Some examples are listed:
• Buildings: Upgrading lights
• Organization/management: Creating an EE task force and program for EE
procurement
• Power and heat: Installing solar hot water systems
• Public lights: Replacing traffic lights with LED technology
LEÓN, GUANAJUATO, MÉXICOTOOL FOR RAPID ASSESSMENT OF CITY ENERGY (TRACE) 9
• Transport: Reducing traffic in congested areas, maintaining the city bus fleet
• Waste: Management/hauling efficiency program
• Water and wastewater: Replacing pumps
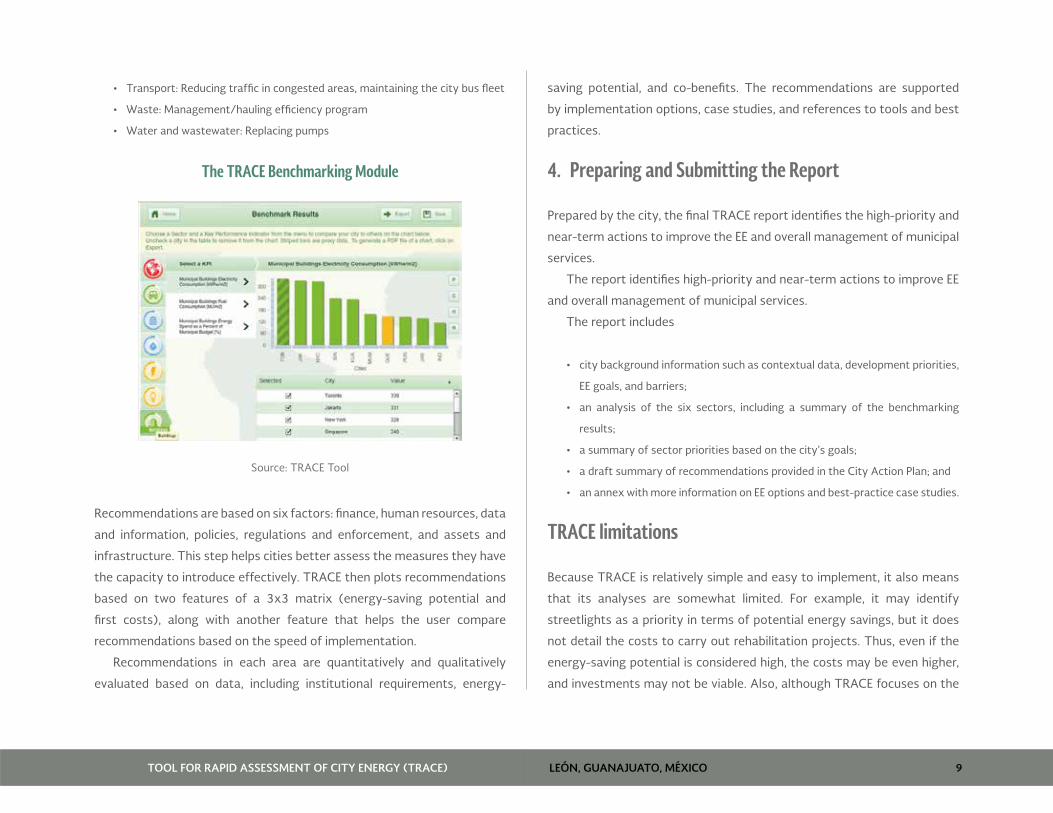
The TRACE Benchmarking Module
Source: TRACE Tool
Recommendations are based on six factors: finance, human resources, data
and information, policies, regulations and enforcement, and assets and
infrastructure. This step helps cities better assess the measures they have
the capacity to introduce effectively. TRACE then plots recommendations
based on two features of a 3x3 matrix (energy-saving potential and
first costs), along with another feature that helps the user compare
recommendations based on the speed of implementation.
Recommendations in each area are quantitatively and qualitatively
evaluated based on data, including institutional requirements, energy-
saving potential, and co-benefits. The recommendations are supported
by implementation options, case studies, and references to tools and best
practices.
4. Preparing and Submitting the Report
Prepared by the city, the final TRACE report identifies the high-priority and
near-term actions to improve the EE and overall management of municipal
services.
The report identifies high-priority and near-term actions to improve EE
and overall management of municipal services.
The report includes
• city background information such as contextual data, development priorities,
EE goals, and barriers;
• an analysis of the six sectors, including a summary of the benchmarking
results;
• a summary of sector priorities based on the city’s goals;
• a draft summary of recommendations provided in the City Action Plan; and
• an annex with more information on EE options and best-practice case studies.
TRACE limitations
Because TRACE is relatively simple and easy to implement, it also means
that its analyses are somewhat limited. For example, it may identify
streetlights as a priority in terms of potential energy savings, but it does
not detail the costs to carry out rehabilitation projects. Thus, even if the
energy-saving potential is considered high, the costs may be even higher,
and investments may not be viable. Also, although TRACE focuses on the
LEÓN, GUANAJUATO, MÉXICOTOOL FOR RAPID ASSESSMENT OF CITY ENERGY (TRACE) 10
service areas for which the city is responsible, the tool cannot factor in the
institutional/legislative mechanisms that may be needed to launch specific
EE actions.
While TRACE seems to apply well in Eastern European cities and
Commonwealth of Independent States (CIS) countries, where most public
utilities are under the city governments (which gives them substantial
control over the TRACE areas), elsewhere, as in Latin America, cities have
less control over them, either because they are managed at a state or
federal level or because the service is provided by a contractor. For example,
in 2013, TRACE was applied in Romania’s seven largest cities where
important services such as public transport, district heating, streetlights,
and municipal buildings were under local control. In some, even where
operation and maintenance (O&M) is outsourced to a contractor (as
with streetlights), the city owns the infrastructure and can make the final
decisions. Thus, in Romania, the TRACE studies helped local and national
authorities prepare local EE measures that were supported with funds from
the European Union (EU), whose Europe 2025 Strategy aimed to reduce
GHG emissions by 20 percent over the next few years.
LEÓN, GUANAJUATO, MÉXICOTOOL FOR RAPID ASSESSMENT OF CITY ENERGY (TRACE) 11
BACKGROUND
México is the fifth largest country in the Americas, behind Canada, the
United States, Brazil, and Argentina. Spread over two million sq km, it is
bordered by the United States on the north, the Pacific Ocean on the west,
Belize, Guatemala, and the Caribbean Sea on the south, and the Gulf of
México on the east.
A large share of the territory consists of mountains as the country is
crossed by the Sierra Madre Oriental and Occidental mountain ranges (from
north to south); the Trans-Mexican Volcanic Belt (from east to west); and
the Sierra Madre del Sur in the southwest. México is also intersected by the
Tropic of Cancer, which divides the country into two climatic areas—the
temperate continental climate and the tropical one—which bring a very
diverse weather system. For example, the northern part of the country has
cooler temperatures during the winter and fairly constant temperatures
year around. Most of the central and northern parts are in high altitudes.
An upper-middle-income country with macroeconomic stability,
México is the world’s 14th largest economy in nominal terms, ranks tenth
by purchasing power parity, and has the second highest degree of income
disparity between rich and poor among the Organization for Economic
and Cooperation Development (OECD) countries. According to the 2011
Human Development Report, México’s Human Development Index was at
0.889, and based on the World Bank’s GINI index, the income inequality
ratio was 42.7 percent (2010). The economy has a mix of modern and
outdated agricultural and industrial enterprises.
México was severely affected by the 2008 economic crisis, when the
GDP dropped by more than 6 percent. Currently, the government is working
to reduce the large gap between rich and poor, upgrade infrastructure,
modernize the tax system and labor laws, and reform the energy sector.
The country has an export-oriented economy with more than 90 percent of
trade occurring under free-trade agreements with 40 countries, including
the United States and Canada, the EU, Japan, and other Latin American
countries. Services represent two-thirds of GDP, industry 30 percent, and
agriculture 3 percent. Tourism is very important, attracting millions of
visitors every year and is the second most visited nation in the Americas,
after the United States.
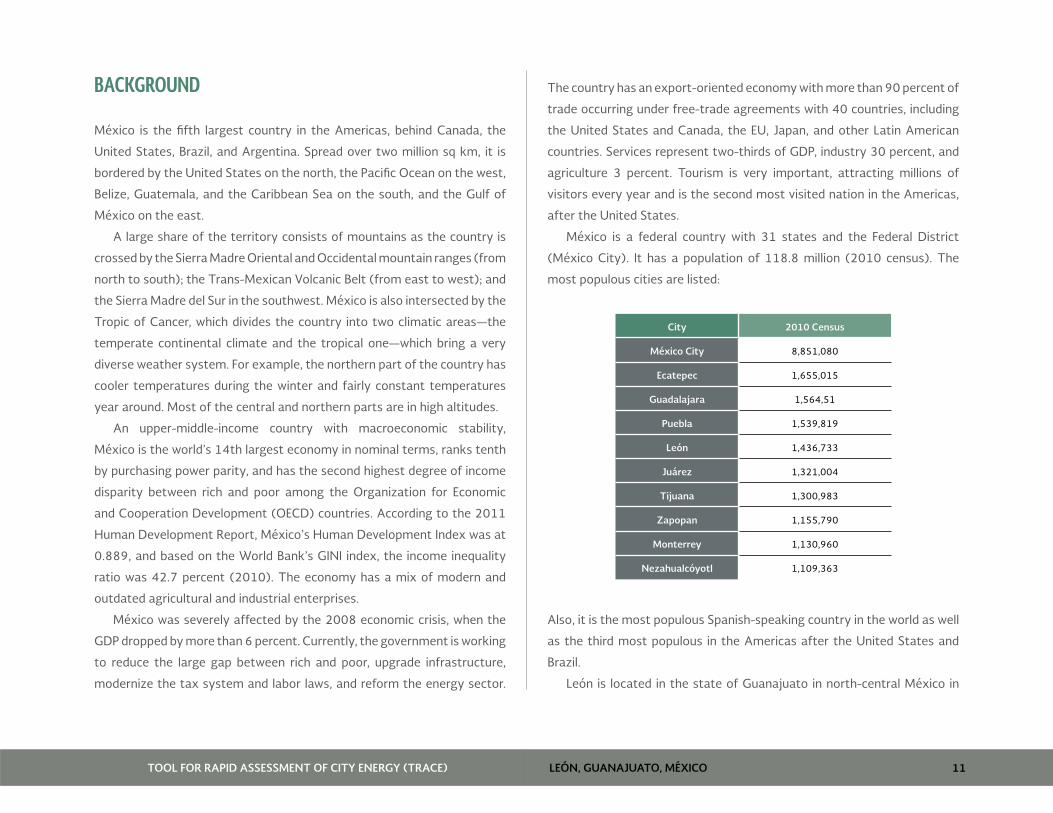
México is a federal country with 31 states and the Federal District
(México City). It has a population of 118.8 million (2010 census). The
most populous cities are listed:
City 2010 Census
México City 8,851,080
Ecatepec 1,655,015
Guadalajara 1,564,51
Puebla 1,539,819
León 1,436,733
Juárez 1,321,004
Tijuana 1,300,983
Zapopan 1,155,790
Monterrey 1,130,960
Nezahualcóyotl 1,109,363
Also, it is the most populous Spanish-speaking country in the world as well
as the third most populous in the Americas after the United States and
Brazil.
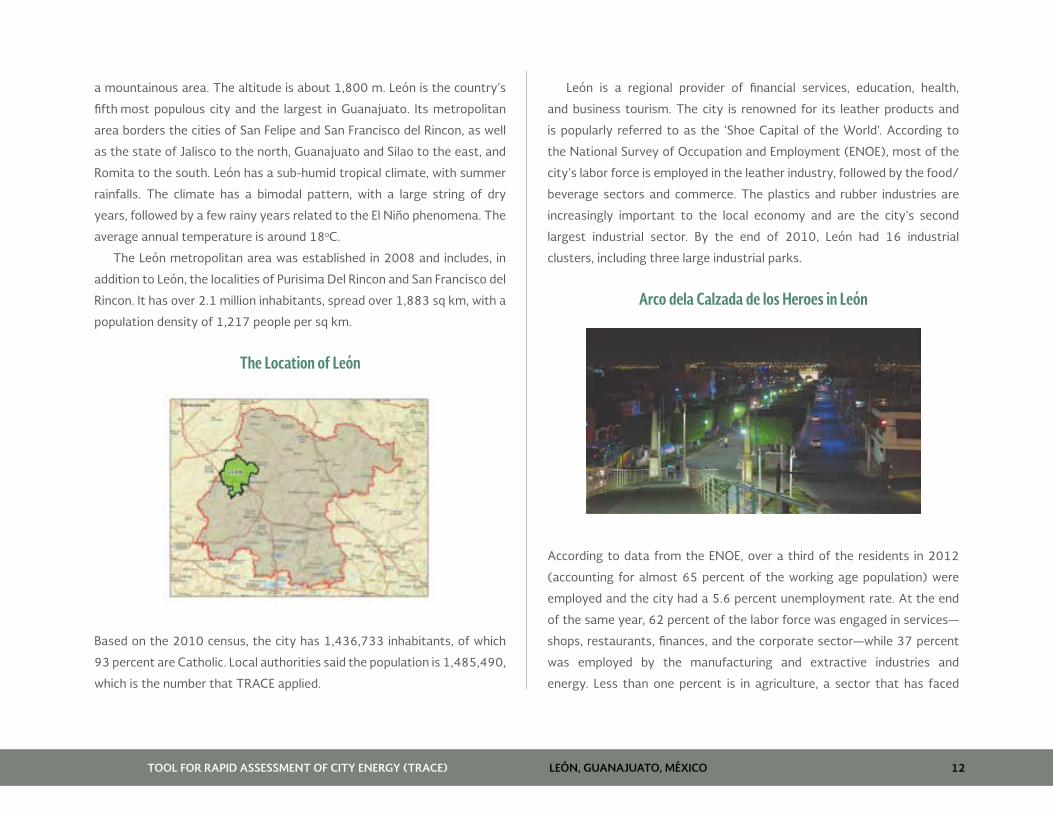
León is located in the state of Guanajuato in north-central México in
LEÓN, GUANAJUATO, MÉXICOTOOL FOR RAPID ASSESSMENT OF CITY ENERGY (TRACE) 12
a mountainous area. The altitude is about 1,800 m. León is the country’s
fifth most populous city and the largest in Guanajuato. Its metropolitan
area borders the cities of San Felipe and San Francisco del Rincon, as well
as the state of Jalisco to the north, Guanajuato and Silao to the east, and
Romita to the south. León has a sub-humid tropical climate, with summer
rainfalls. The climate has a bimodal pattern, with a large string of dry
years, followed by a few rainy years related to the El Niño phenomena. The
average annual temperature is around 18oC.
The León metropolitan area was established in 2008 and includes, in
addition to León, the localities of Purisima Del Rincon and San Francisco del
Rincon. It has over 2.1 million inhabitants, spread over 1,883 sq km, with a
population density of 1,217 people per sq km.
The Location of León
Based on the 2010 census, the city has 1,436,733 inhabitants, of which
93 percent are Catholic. Local authorities said the population is 1,485,490,
which is the number that TRACE applied.
León is a regional provider of financial services, education, health,
and business tourism. The city is renowned for its leather products and
is popularly referred to as the ‘Shoe Capital of the World’. According to
the National Survey of Occupation and Employment (ENOE), most of the
city’s labor force is employed in the leather industry, followed by the food/
beverage sectors and commerce. The plastics and rubber industries are
increasingly important to the local economy and are the city’s second
largest industrial sector. By the end of 2010, León had 16 industrial
clusters, including three large industrial parks.
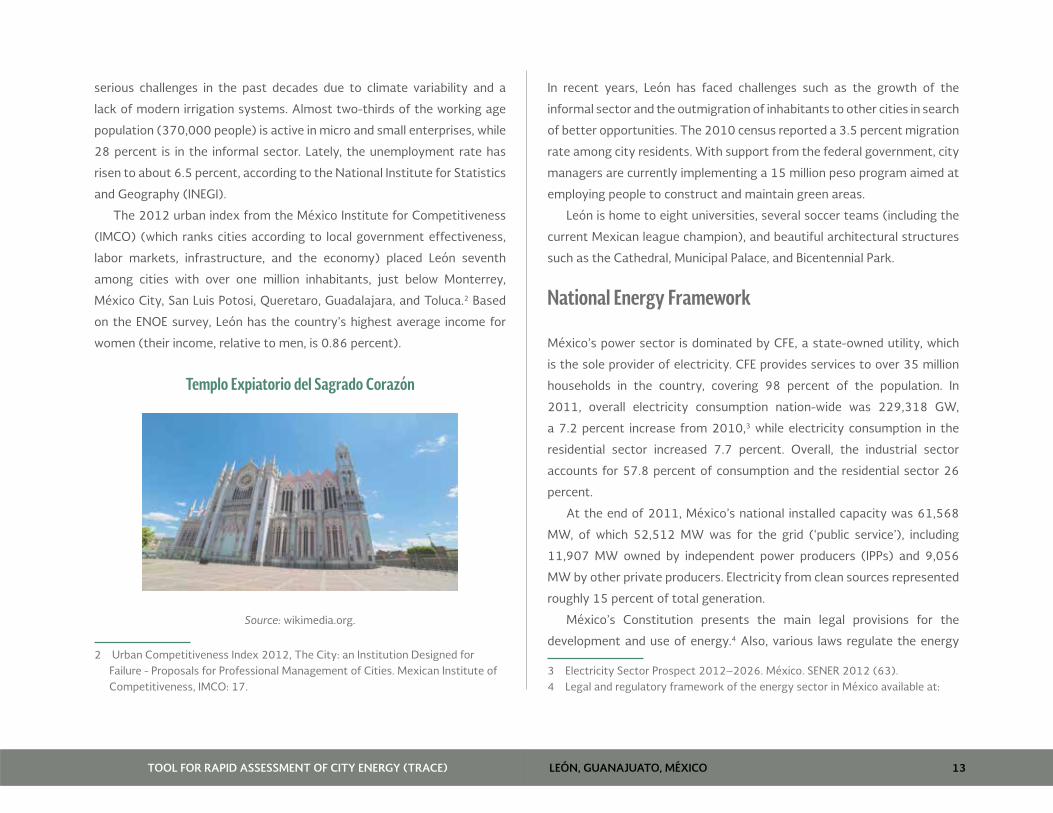
Arco dela Calzada de los Heroes in León
According to data from the ENOE, over a third of the residents in 2012
(accounting for almost 65 percent of the working age population) were
employed and the city had a 5.6 percent unemployment rate. At the end
of the same year, 62 percent of the labor force was engaged in services—
shops, restaurants, finances, and the corporate sector—while 37 percent
was employed by the manufacturing and extractive industries and
energy. Less than one percent is in agriculture, a sector that has faced
LEÓN, GUANAJUATO, MÉXICOTOOL FOR RAPID ASSESSMENT OF CITY ENERGY (TRACE) 13
serious challenges in the past decades due to climate variability and a
lack of modern irrigation systems. Almost two-thirds of the working age
population (370,000 people) is active in micro and small enterprises, while
28 percent is in the informal sector. Lately, the unemployment rate has
risen to about 6.5 percent, according to the National Institute for Statistics
and Geography (INEGI).
The 2012 urban index from the México Institute for Competitiveness
(IMCO) (which ranks cities according to local government effectiveness,
labor markets, infrastructure, and the economy) placed León seventh
among cities with over one million inhabitants, just below Monterrey,
México City, San Luis Potosi, Queretaro, Guadalajara, and Toluca.2 Based
on the ENOE survey, León has the country’s highest average income for
women (their income, relative to men, is 0.86 percent).
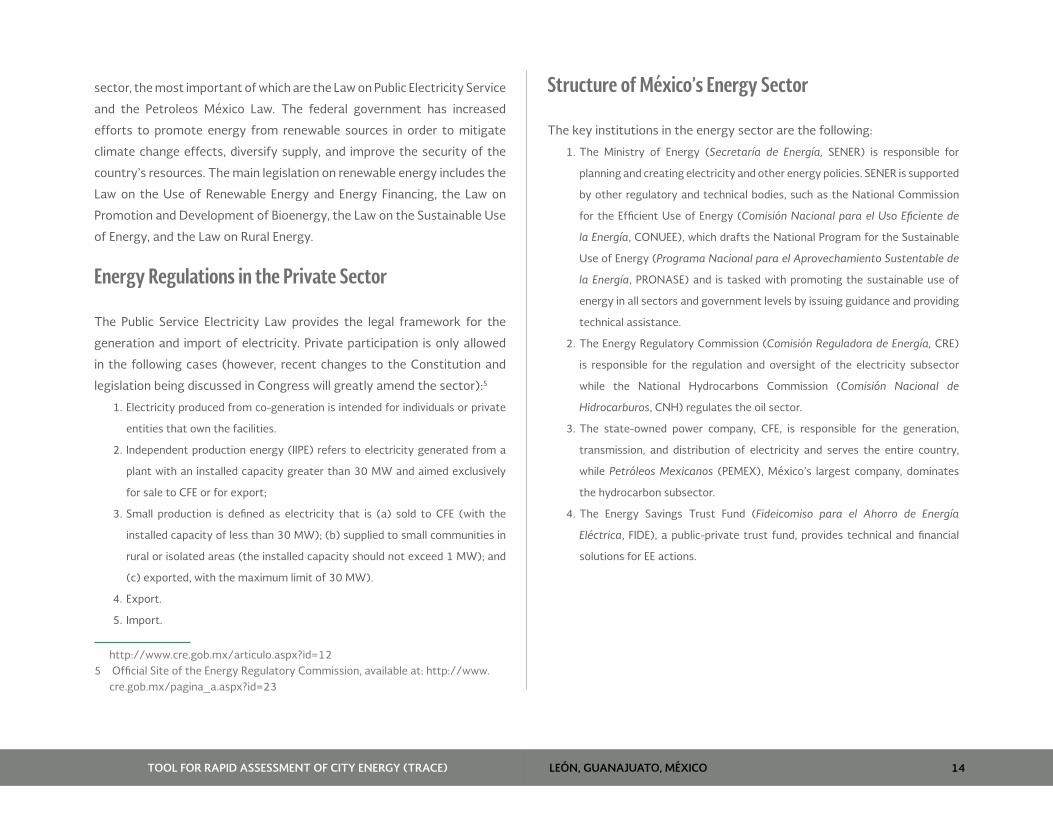
Templo Expiatorio del Sagrado Corazón
Source: wikimedia.org.
2 Urban Competitiveness Index 2012, The City: an Institution Designed for Failure - Proposals for Professional Management of Cities. Mexican Institute of Competitiveness, IMCO: 17.
In recent years, León has faced challenges such as the growth of the
informal sector and the outmigration of inhabitants to other cities in search
of better opportunities. The 2010 census reported a 3.5 percent migration
rate among city residents. With support from the federal government, city
managers are currently implementing a 15 million peso program aimed at
employing people to construct and maintain green areas.
León is home to eight universities, several soccer teams (including the
current Mexican league champion), and beautiful architectural structures
such as the Cathedral, Municipal Palace, and Bicentennial Park.
National Energy Framework
México’s power sector is dominated by CFE, a state-owned utility, which
is the sole provider of electricity. CFE provides services to over 35 million
households in the country, covering 98 percent of the population. In
2011, overall electricity consumption nation-wide was 229,318 GW,
a 7.2 percent increase from 2010,3 while electricity consumption in the
residential sector increased 7.7 percent. Overall, the industrial sector
accounts for 57.8 percent of consumption and the residential sector 26
percent.
At the end of 2011, México’s national installed capacity was 61,568
MW, of which 52,512 MW was for the grid (‘public service’), including
11,907 MW owned by independent power producers (IPPs) and 9,056
MW by other private producers. Electricity from clean sources represented
roughly 15 percent of total generation.
México’s Constitution presents the main legal provisions for the
development and use of energy.4 Also, various laws regulate the energy
3 Electricity Sector Prospect 2012–2026. México. SENER 2012 (63).4 Legal and regulatory framework of the energy sector in México available at:
LEÓN, GUANAJUATO, MÉXICOTOOL FOR RAPID ASSESSMENT OF CITY ENERGY (TRACE) 14
sector, the most important of which are the Law on Public Electricity Service
and the Petroleos México Law. The federal government has increased
efforts to promote energy from renewable sources in order to mitigate
climate change effects, diversify supply, and improve the security of the
country’s resources. The main legislation on renewable energy includes the
Law on the Use of Renewable Energy and Energy Financing, the Law on
Promotion and Development of Bioenergy, the Law on the Sustainable Use
of Energy, and the Law on Rural Energy.
Energy Regulations in the Private Sector
The Public Service Electricity Law provides the legal framework for the
generation and import of electricity. Private participation is only allowed
in the following cases (however, recent changes to the Constitution and
legislation being discussed in Congress will greatly amend the sector):5
1. Electricity produced from co-generation is intended for individuals or private
entities that own the facilities.
2. Independent production energy (IIPE) refers to electricity generated from a
plant with an installed capacity greater than 30 MW and aimed exclusively
for sale to CFE or for export;
3. Small production is defined as electricity that is (a) sold to CFE (with the
installed capacity of less than 30 MW); (b) supplied to small communities in
rural or isolated areas (the installed capacity should not exceed 1 MW); and
(c) exported, with the maximum limit of 30 MW).
4. Export.
5. Import.
http://www.cre.gob.mx/articulo.aspx?id=125 Official Site of the Energy Regulatory Commission, available at: http://www.
cre.gob.mx/pagina_a.aspx?id=23
Structure of México’s Energy Sector
The key institutions in the energy sector are the following:
1. The Ministry of Energy (Secretaría de Energía, SENER) is responsible for
planning and creating electricity and other energy policies. SENER is supported
by other regulatory and technical bodies, such as the National Commission
for the Efficient Use of Energy (Comisión Nacional para el Uso Eficiente de
la Energía, CONUEE), which drafts the National Program for the Sustainable
Use of Energy (Programa Nacional para el Aprovechamiento Sustentable de
la Energía, PRONASE) and is tasked with promoting the sustainable use of
energy in all sectors and government levels by issuing guidance and providing
technical assistance.
2. The Energy Regulatory Commission (Comisión Reguladora de Energía, CRE)
is responsible for the regulation and oversight of the electricity subsector
while the National Hydrocarbons Commission (Comisión Nacional de
Hidrocarburos, CNH) regulates the oil sector.
3. The state-owned power company, CFE, is responsible for the generation,
transmission, and distribution of electricity and serves the entire country,
while Petróleos Mexicanos (PEMEX), México’s largest company, dominates
the hydrocarbon subsector.
4. The Energy Savings Trust Fund (Fideicomiso para el Ahorro de Energía
Eléctrica, FIDE), a public-private trust fund, provides technical and financial
solutions for EE actions.
LEÓN, GUANAJUATO, MÉXICOTOOL FOR RAPID ASSESSMENT OF CITY ENERGY (TRACE) 15
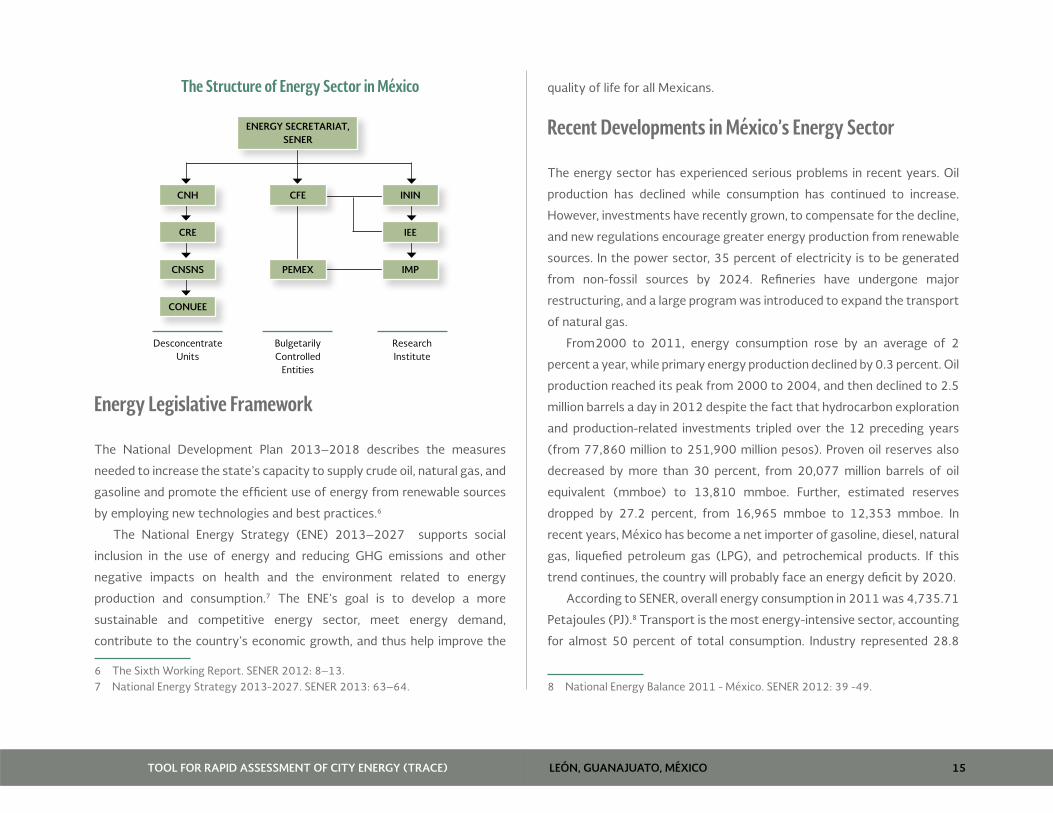
The Structure of Energy Sector in México
ENERGY SECRETARIAT, SENER
CNH ININCFE
CRE IEE
CNSNS IMPPEMEX
CONUEE
DesconcentrateUnits
BulgetarilyControlled
Entities
ResearchInstitute
Energy Legislative Framework
The National Development Plan 2013–2018 describes the measures
needed to increase the state’s capacity to supply crude oil, natural gas, and
gasoline and promote the efficient use of energy from renewable sources
by employing new technologies and best practices.6
The National Energy Strategy (ENE) 2013–2027 supports social
inclusion in the use of energy and reducing GHG emissions and other
negative impacts on health and the environment related to energy
production and consumption.7 The ENE’s goal is to develop a more
sustainable and competitive energy sector, meet energy demand,
contribute to the country’s economic growth, and thus help improve the
6 The Sixth Working Report. SENER 2012: 8–13.7 National Energy Strategy 2013-2027. SENER 2013: 63–64.
quality of life for all Mexicans.
Recent Developments in México’s Energy Sector
The energy sector has experienced serious problems in recent years. Oil
production has declined while consumption has continued to increase.
However, investments have recently grown, to compensate for the decline,
and new regulations encourage greater energy production from renewable
sources. In the power sector, 35 percent of electricity is to be generated
from non-fossil sources by 2024. Refineries have undergone major
restructuring, and a large program was introduced to expand the transport
of natural gas.
From 2000 to 2011, energy consumption rose by an average of 2
percent a year, while primary energy production declined by 0.3 percent. Oil
production reached its peak from 2000 to 2004, and then declined to 2.5
million barrels a day in 2012 despite the fact that hydrocarbon exploration
and production-related investments tripled over the 12 preceding years
(from 77,860 million to 251,900 million pesos). Proven oil reserves also
decreased by more than 30 percent, from 20,077 million barrels of oil
equivalent (mmboe) to 13,810 mmboe. Further, estimated reserves
dropped by 27.2 percent, from 16,965 mmboe to 12,353 mmboe. In
recent years, México has become a net importer of gasoline, diesel, natural
gas, liquefied petroleum gas (LPG), and petrochemical products. If this
trend continues, the country will probably face an energy deficit by 2020.
According to SENER, overall energy consumption in 2011 was 4,735.71
Petajoules (PJ).8 Transport is the most energy-intensive sector, accounting
for almost 50 percent of total consumption. Industry represented 28.8
8 National Energy Balance 2011 - México. SENER 2012: 39 -49.
LEÓN, GUANAJUATO, MÉXICOTOOL FOR RAPID ASSESSMENT OF CITY ENERGY (TRACE) 16
percent, while the residential sector was 28 percent, and agriculture was
about 16 percent. The commercial and public sectors represented less
than 3 percent and 0.6 percent, respectively. The demand for gasoline
and naphtha rose by 31.7 percent due to both population and economic
growth.
According to the National Inventory of Greenhouse Gas Emissions,
from 1990 to 2006, the energy sector was the main source, accounting
for 60.7 percent of the total: In 2011, the total was 498.51 Tg CO2eq,
3.5 percent less than in 2010. The transport sector emitted the highest
amount (nearly 40 percent), followed by power generation (30.8 percent)
and industry (12.6 percent). México’s goal is to reduce emissions by 30
percent (under the business-as-usual scenario) by 2020.
Federal and Local Government Authority for Public Utility Services
The Law on Fiscal Coordination regulates the relationship between states
and municipalities with regard to financial and fiscal issues. It establishes
their respective contributions to the federal budget and defines the fiscal
institutions at the state, municipal, and federal levels. Some public utility
services are regulated at the national level through several federal entities
such as the Secretariat of Communications and Transport (SCT) for freight
transport; the National Water Commission (CONAGUA) for water; and the
Secretariat of the Environment and Natural Resources (SEMARNAT) for
solid waste. In addition, the recently created the Secretariat of Agricultural,
Territorial and Urban Development (SEDATU) is tasked with promoting
urban transport policies.
The federal government provides support for public service projects
and related infrastructure. Municipalities usually obtain this support for
economic, social, real estate, and infrastructure projects (for example,
transport, waste, water, public lighting, municipal buildings, and power).
For example, 75 percent of municipal budgets are usually funded by the
national government, while less than 3 percent is financed by the state,
and the rest is from local revenues.
Some TRACE areas are regulated by the federal government, while
others are managed by local authorities, as described below.
1. Transport
Public transport is coordinated and funded by federal and state authorities
while the national government has a monopoly over air, rail, and sea
transport. In a few cases, municipalities (in the states of Guanajuato,
Baja California, Coahuila, and Quintana Roo) are responsible for public
transport. Since 2008, federal funds have been available for integrated
public transport systems through the Programa Federal de Transporte
Masivo (PROTRAM). In these, the sector is organized by private operators
under contracts, and local authorities provide oversight. The latter are
also responsible for enforcing public transport regulations while private
transport is usually regulated by state governments.
2. Solid Waste
At the national level, solid waste is regulated by SEMARNAT. At the local
level, it is under public authorities and private contractors. Landfills are
usually managed by private operators. Public companies usually collect
solid waste from residences while private operators collect industrial and
commercial waste.

LEÓN, GUANAJUATO, MÉXICOTOOL FOR RAPID ASSESSMENT OF CITY ENERGY (TRACE) 17
3. Water
The water sector is regulated by CONAGUA and all water sources are
considered state property. Cities pay levies to CONAGUA for extracting
water from wells. A service agency under the local government typically
manages the distribution of potable water, wastewater treatment, sewage,
and drains.
4. Power and Heat
The power sector is under CFE, which is responsible for the overall production,
transmission, and distribution of electricity. However, municipalities can
partner with private companies for self-supply electricity projects. Given
the climate, most cities do not require heating.
5. Municipal Buildings
The municipal building stock managed by cities consists mainly of public
administration offices. Schools and hospitals are usually under federal and
state authorities.
6. Streetlights
Power for streetlights is usually provided by CFE while the assets are
operated, maintained, and owned by local authorities. In some cities,
private contractors maintain the systems. Most municipalities charge
a public lighting tax known as Derecho sobre Alumbrado Publico (DAP).
Under DAP, all electricity users (including residential clients and private
companies) are required to pay for public streetlights through a levy that
is included in the monthly electricity bill or local taxes. CFE collects the fee
for the municipalities; the amount varies from state to state.

LEÓN, GUANAJUATO, MÉXICOTOOL FOR RAPID ASSESSMENT OF CITY ENERGY (TRACE) 18

LEÓN, GUANAJUATO, MÉXICOTOOL FOR RAPID ASSESSMENT OF CITY ENERGY (TRACE) 19
SECTOR DIAGNOSTICS
LEÓN, GUANAJUATO, MÉXICOTOOL FOR RAPID ASSESSMENT OF CITY ENERGY (TRACE) 20
ASSESSMENT BY SECTOR/AREA
POWER SECTOR
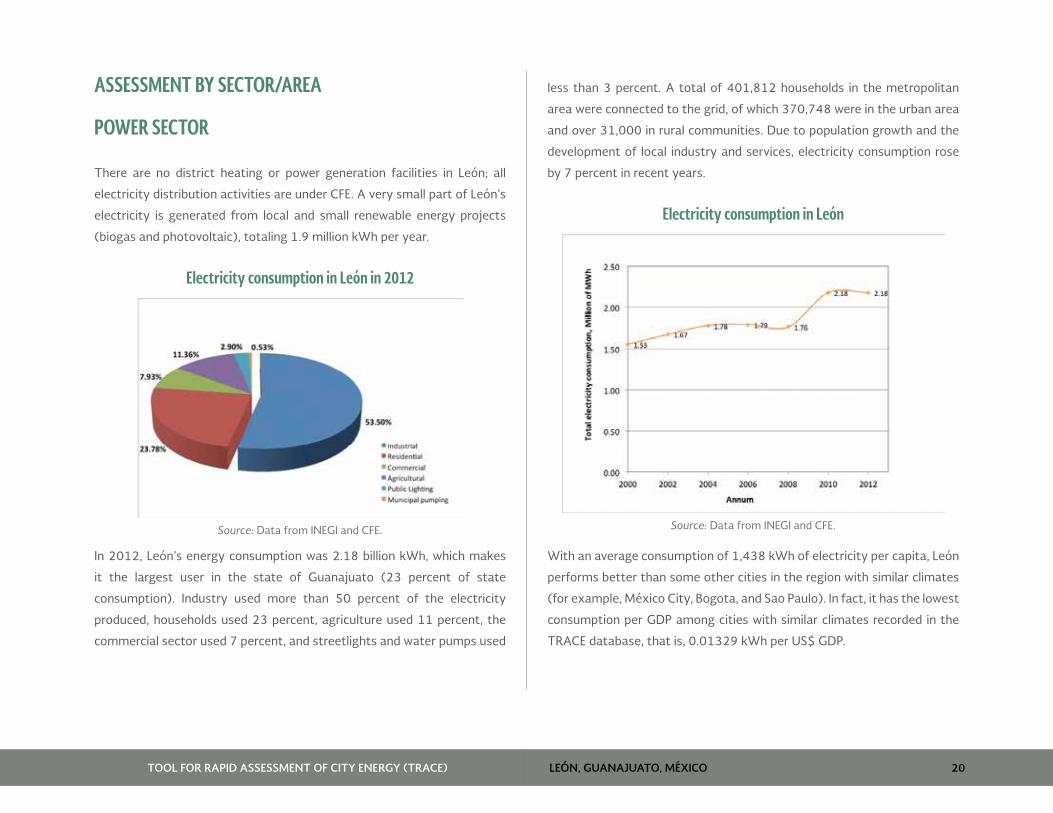
There are no district heating or power generation facilities in León; all
electricity distribution activities are under CFE. A very small part of León’s
electricity is generated from local and small renewable energy projects
(biogas and photovoltaic), totaling 1.9 million kWh per year.
Electricity consumption in León in 2012
Source: Data from INEGI and CFE.
In 2012, León’s energy consumption was 2.18 billion kWh, which makes
it the largest user in the state of Guanajuato (23 percent of state
consumption). Industry used more than 50 percent of the electricity
produced, households used 23 percent, agriculture used 11 percent, the
commercial sector used 7 percent, and streetlights and water pumps used
less than 3 percent. A total of 401,812 households in the metropolitan
area were connected to the grid, of which 370,748 were in the urban area
and over 31,000 in rural communities. Due to population growth and the
development of local industry and services, electricity consumption rose
by 7 percent in recent years.
Electricity consumption in León
Source: Data from INEGI and CFE.
With an average consumption of 1,438 kWh of electricity per capita, León
performs better than some other cities in the region with similar climates
(for example, México City, Bogota, and Sao Paulo). In fact, it has the lowest
consumption per GDP among cities with similar climates recorded in the
TRACE database, that is, 0.01329 kWh per US$ GDP.
LEÓN, GUANAJUATO, MÉXICOTOOL FOR RAPID ASSESSMENT OF CITY ENERGY (TRACE) 21
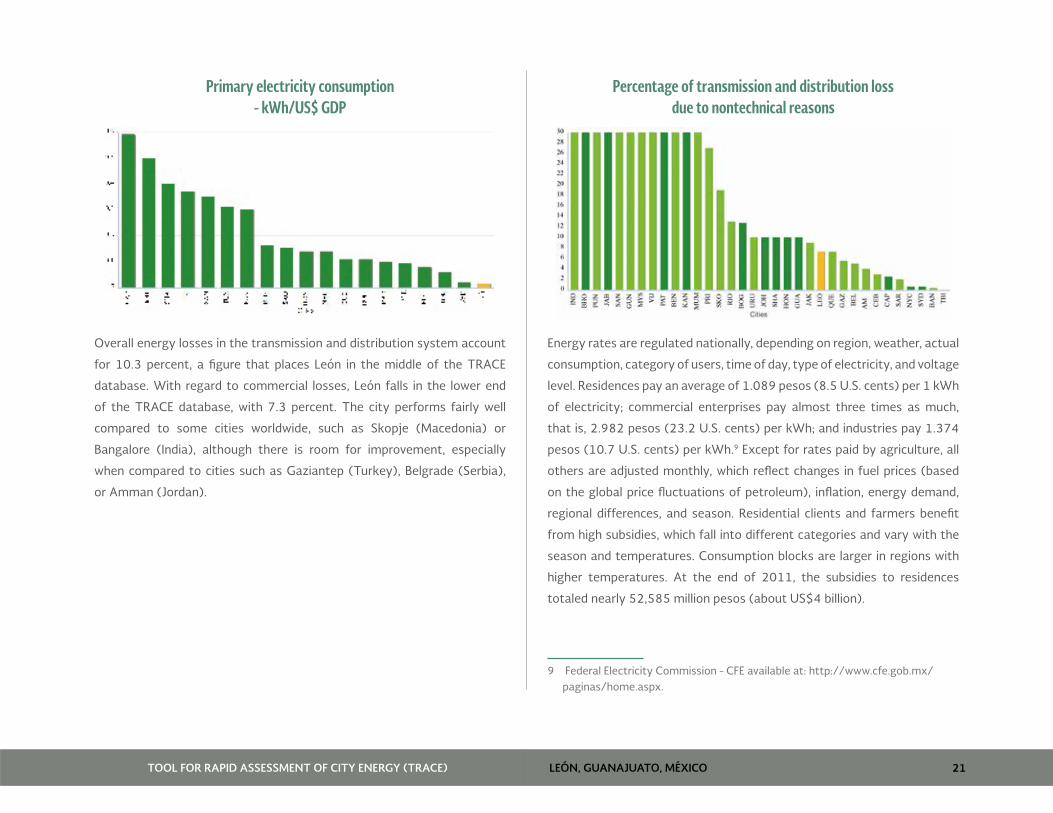
Primary electricity consumption - kWh/US$ GDP
Overall energy losses in the transmission and distribution system account
for 10.3 percent, a figure that places León in the middle of the TRACE
database. With regard to commercial losses, León falls in the lower end
of the TRACE database, with 7.3 percent. The city performs fairly well
compared to some cities worldwide, such as Skopje (Macedonia) or
Bangalore (India), although there is room for improvement, especially
when compared to cities such as Gaziantep (Turkey), Belgrade (Serbia),
or Amman (Jordan).
Percentage of transmission and distribution loss due to nontechnical reasons
Energy rates are regulated nationally, depending on region, weather, actual
consumption, category of users, time of day, type of electricity, and voltage
level. Residences pay an average of 1.089 pesos (8.5 U.S. cents) per 1 kWh
of electricity; commercial enterprises pay almost three times as much,
that is, 2.982 pesos (23.2 U.S. cents) per kWh; and industries pay 1.374
pesos (10.7 U.S. cents) per kWh.9 Except for rates paid by agriculture, all
others are adjusted monthly, which reflect changes in fuel prices (based
on the global price fluctuations of petroleum), inflation, energy demand,
regional differences, and season. Residential clients and farmers benefit
from high subsidies, which fall into different categories and vary with the
season and temperatures. Consumption blocks are larger in regions with
higher temperatures. At the end of 2011, the subsidies to residences
totaled nearly 52,585 million pesos (about US$4 billion).
9 Federal Electricity Commission - CFE available at: http://www.cfe.gob.mx/paginas/home.aspx.

LEÓN, GUANAJUATO, MÉXICOTOOL FOR RAPID ASSESSMENT OF CITY ENERGY (TRACE) 22
The state of Guanajuato is promoting renewable energy. In 2011, it
approved regulations to improve coordination between municipal, state,
and federal authorities to strengthen this area as a way to enhance the
quality of life, help preserve the environment, and encourage sustainable
human development.10 However, only 0.65 percent of the energy used in
León in 2012 was generated from renewable sources.11 Of this, 32 percent
was produced from biomass (wood and coal), 2.1 percent was from biogas,
and less than 1 percent was from photovoltaic panels. The largest amount
(64 percent) was from solar water heaters. The city has good solar energy
potential, with an irradiation of 6 kWh per sq km.
Map of Solar Energy Potential for León
Source: Clean Power Research (CPR) and Solartronic.
10 Law for the Promotion and Use of Renewable Energy and Energy Sustainability for the state and the municipalities of Guanajuato. Official newspaper of the government of the state of Guanajuato, Number 178, Guanajuato, November 8, 2011.
11 Prospective Natural Gas Market 2012–2026. SENER 2013: 67–70.
LEÓN, GUANAJUATO, MÉXICOTOOL FOR RAPID ASSESSMENT OF CITY ENERGY (TRACE) 23
STREETLIGHTS
In León, streetlights are managed by the Public Works Directorate. Léon
was one of the first cities in México to have electric streetlights, beginning
in 1884. In the mid-1950s, it introduced a mercury-based lighting system,
which was extended throughout the city by 1960.
León owns the infrastructure (except for part of concrete light poles
that belong to CFE) and is responsible for maintaining it. Through DAP,
a local tax is charged to consumers and collected by CFE. The amount
collected is compared to municipal consumption, and if any surplus remains
at the end of the fiscal year, CFE returns the funds to the city. The León
DAP for residences and small users was 8 percent of monthly electricity
consumption and 5 percent for industries. However, the Supreme Court
recently ruled that the DAP charge is unconstitutional (stating that
consumption is not directly linked to the public service, and the DAP is thus
inequitable) and should be reviewed in the near future.
Today, only three-quarters of the streets are lit, that is, 2,042 km out
of 2,665 km (76 percent of streets). This places León in the middle of the
TRACE database, in the same range as Sarajevo and Banja Luka (both in
Bosnia and Herzegovina), and behind other similar cities such as Gaziantep
and Skopje.
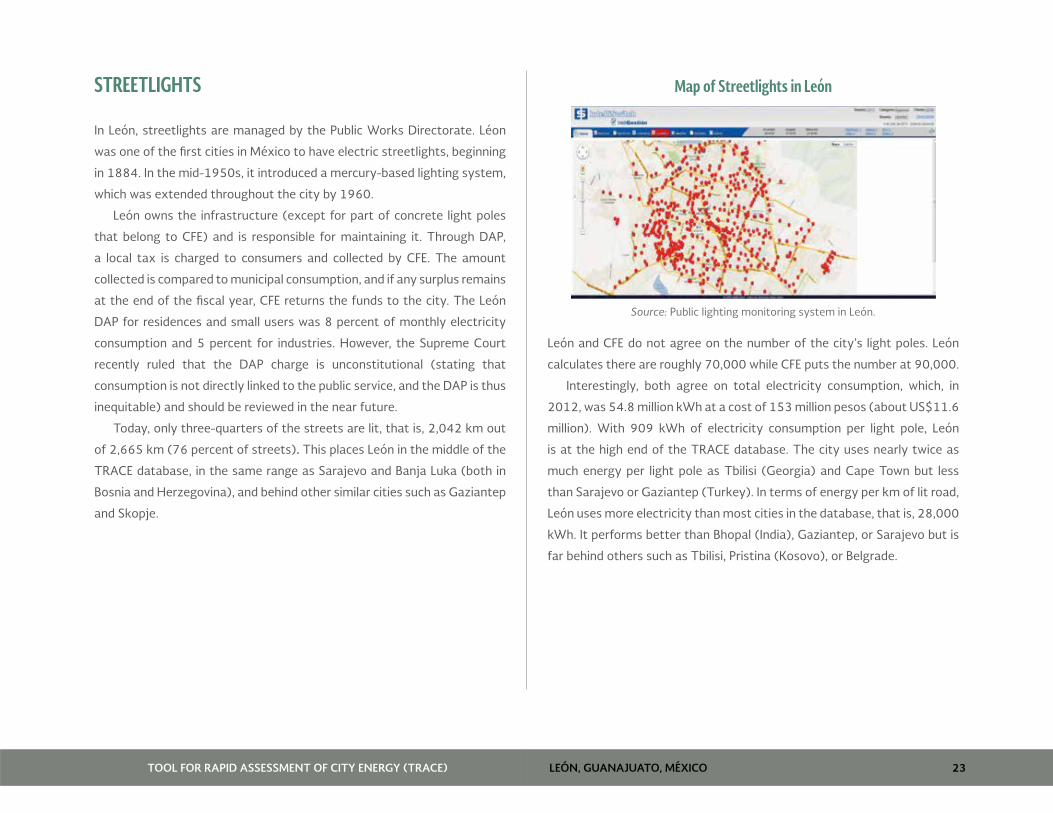
Map of Streetlights in León
Source: Public lighting monitoring system in León.
León and CFE do not agree on the number of the city’s light poles. León
calculates there are roughly 70,000 while CFE puts the number at 90,000.
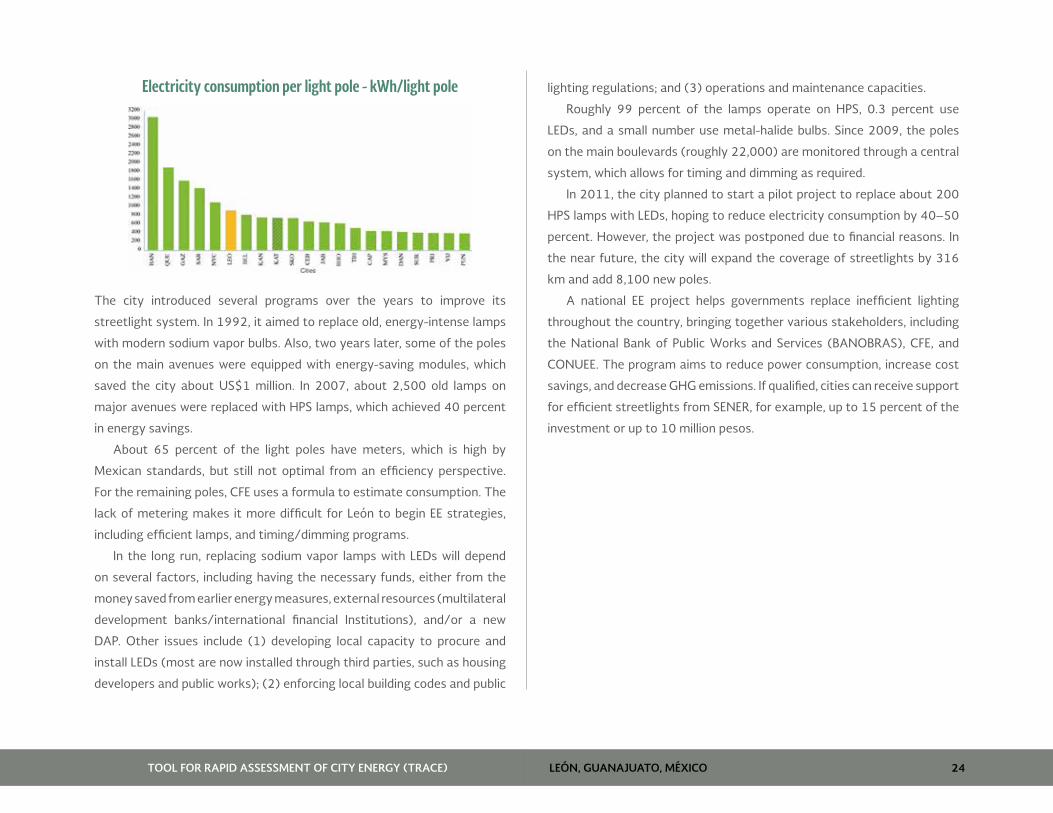
Interestingly, both agree on total electricity consumption, which, in
2012, was 54.8 million kWh at a cost of 153 million pesos (about US$11.6
million). With 909 kWh of electricity consumption per light pole, León
is at the high end of the TRACE database. The city uses nearly twice as
much energy per light pole as Tbilisi (Georgia) and Cape Town but less
than Sarajevo or Gaziantep (Turkey). In terms of energy per km of lit road,
León uses more electricity than most cities in the database, that is, 28,000
kWh. It performs better than Bhopal (India), Gaziantep, or Sarajevo but is
far behind others such as Tbilisi, Pristina (Kosovo), or Belgrade.
LEÓN, GUANAJUATO, MÉXICOTOOL FOR RAPID ASSESSMENT OF CITY ENERGY (TRACE) 24
Electricity consumption per light pole - kWh/light pole
The city introduced several programs over the years to improve its
streetlight system. In 1992, it aimed to replace old, energy-intense lamps
with modern sodium vapor bulbs. Also, two years later, some of the poles
on the main avenues were equipped with energy-saving modules, which
saved the city about US$1 million. In 2007, about 2,500 old lamps on
major avenues were replaced with HPS lamps, which achieved 40 percent
in energy savings.
About 65 percent of the light poles have meters, which is high by
Mexican standards, but still not optimal from an efficiency perspective.
For the remaining poles, CFE uses a formula to estimate consumption. The
lack of metering makes it more difficult for León to begin EE strategies,
including efficient lamps, and timing/dimming programs.
In the long run, replacing sodium vapor lamps with LEDs will depend
on several factors, including having the necessary funds, either from the
money saved from earlier energy measures, external resources (multilateral
development banks/international financial Institutions), and/or a new
DAP. Other issues include (1) developing local capacity to procure and
install LEDs (most are now installed through third parties, such as housing
developers and public works); (2) enforcing local building codes and public
lighting regulations; and (3) operations and maintenance capacities.
Roughly 99 percent of the lamps operate on HPS, 0.3 percent use
LEDs, and a small number use metal-halide bulbs. Since 2009, the poles
on the main boulevards (roughly 22,000) are monitored through a central
system, which allows for timing and dimming as required.
In 2011, the city planned to start a pilot project to replace about 200
HPS lamps with LEDs, hoping to reduce electricity consumption by 40–50
percent. However, the project was postponed due to financial reasons. In
the near future, the city will expand the coverage of streetlights by 316
km and add 8,100 new poles.
A national EE project helps governments replace inefficient lighting
throughout the country, bringing together various stakeholders, including
the National Bank of Public Works and Services (BANOBRAS), CFE, and
CONUEE. The program aims to reduce power consumption, increase cost
savings, and decrease GHG emissions. If qualified, cities can receive support
for efficient streetlights from SENER, for example, up to 15 percent of the
investment or up to 10 million pesos.
LEÓN, GUANAJUATO, MÉXICOTOOL FOR RAPID ASSESSMENT OF CITY ENERGY (TRACE) 25
SOLID WASTE
León’s solid waste sector is managed by public and private institutions. It
is collected by several private companies that are overseen by SIAP, a city
agency. These companies cover 118 collection routes (91 percent of the
total), while SIAP collects solid waste from households on 11 routes (six
rural and five peri-urban) using 30 trucks. Private companies also collect
waste from businesses and industries.
The landfill is managed by a private company under contract with
the city. León does not have a proper solid waste collection structure as
the system involves multiple private operators hired under short-term
agreements. The landfill serves 264,830 urban households and nearly
15,000 rural ones.
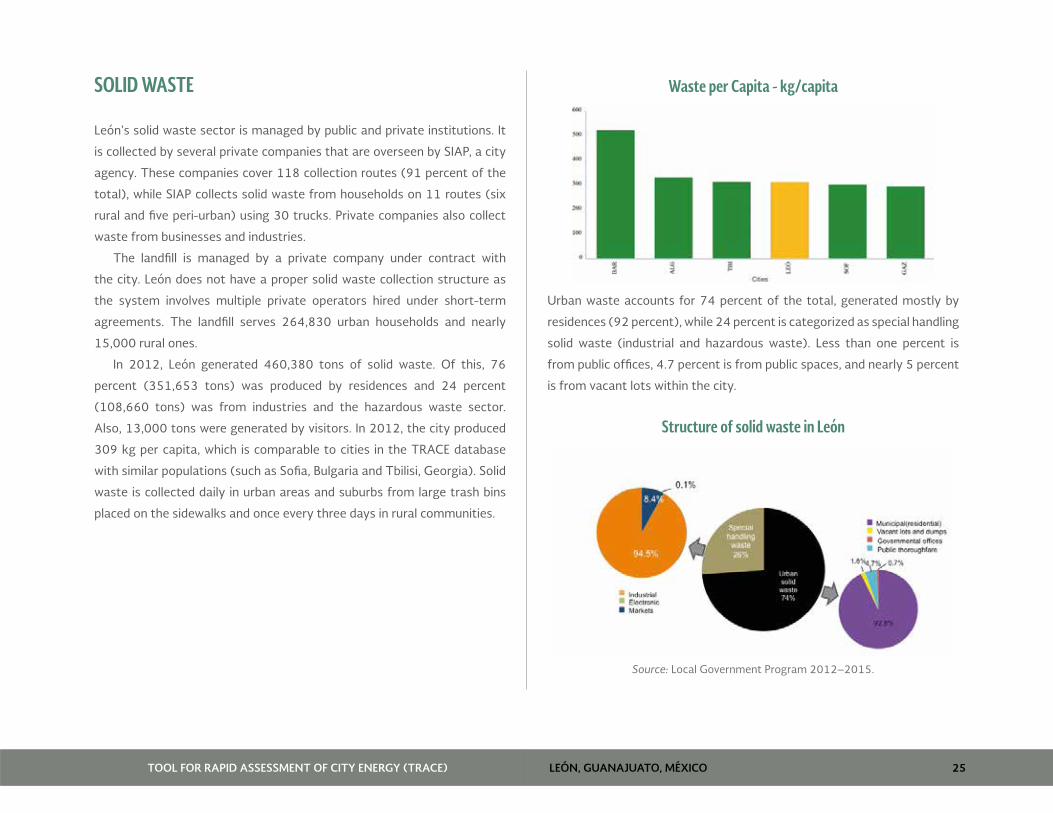
In 2012, León generated 460,380 tons of solid waste. Of this, 76
percent (351,653 tons) was produced by residences and 24 percent
(108,660 tons) was from industries and the hazardous waste sector.
Also, 13,000 tons were generated by visitors. In 2012, the city produced
309 kg per capita, which is comparable to cities in the TRACE database
with similar populations (such as Sofia, Bulgaria and Tbilisi, Georgia). Solid
waste is collected daily in urban areas and suburbs from large trash bins
placed on the sidewalks and once every three days in rural communities.
Waste per Capita - kg/capita
Urban waste accounts for 74 percent of the total, generated mostly by
residences (92 percent), while 24 percent is categorized as special handling
solid waste (industrial and hazardous waste). Less than one percent is
from public offices, 4.7 percent is from public spaces, and nearly 5 percent
is from vacant lots within the city.
Structure of solid waste in León
Source: Local Government Program 2012–2015.
LEÓN, GUANAJUATO, MÉXICOTOOL FOR RAPID ASSESSMENT OF CITY ENERGY (TRACE) 26
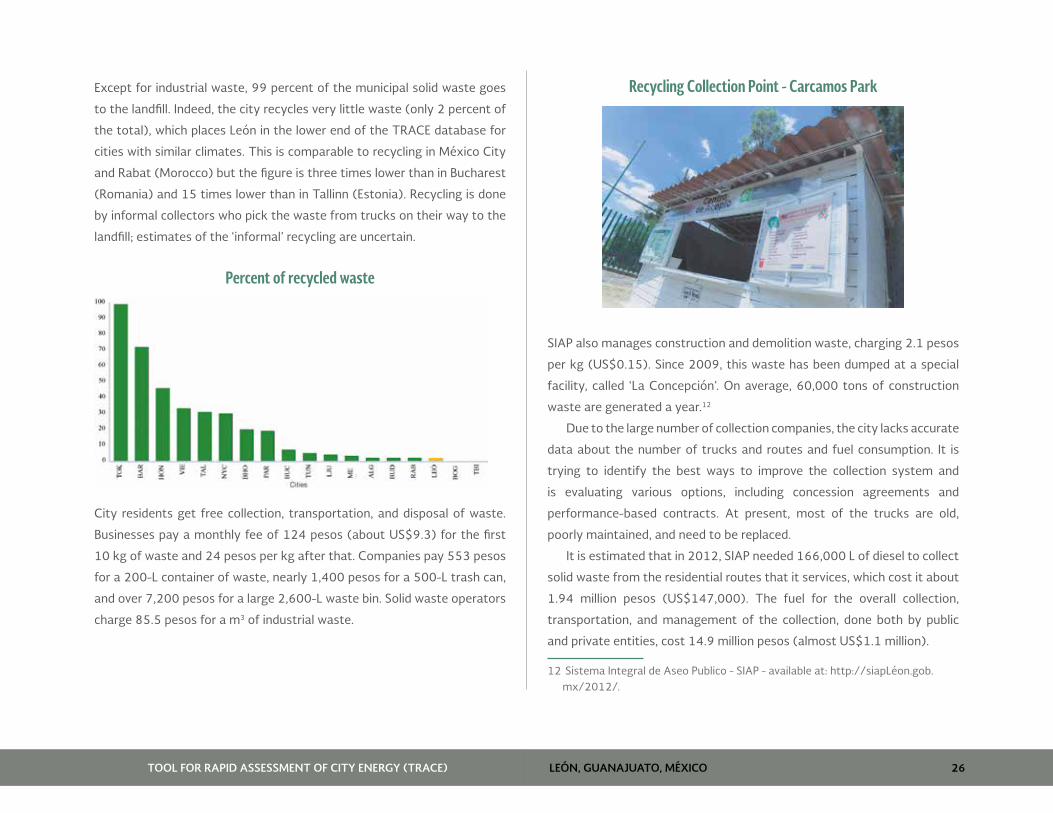
Except for industrial waste, 99 percent of the municipal solid waste goes
to the landfill. Indeed, the city recycles very little waste (only 2 percent of
the total), which places León in the lower end of the TRACE database for
cities with similar climates. This is comparable to recycling in México City
and Rabat (Morocco) but the figure is three times lower than in Bucharest
(Romania) and 15 times lower than in Tallinn (Estonia). Recycling is done
by informal collectors who pick the waste from trucks on their way to the
landfill; estimates of the ‘informal’ recycling are uncertain.
Percent of recycled waste
City residents get free collection, transportation, and disposal of waste.
Businesses pay a monthly fee of 124 pesos (about US$9.3) for the first
10 kg of waste and 24 pesos per kg after that. Companies pay 553 pesos
for a 200-L container of waste, nearly 1,400 pesos for a 500-L trash can,
and over 7,200 pesos for a large 2,600-L waste bin. Solid waste operators
charge 85.5 pesos for a m3 of industrial waste.
Recycling Collection Point - Carcamos Park
SIAP also manages construction and demolition waste, charging 2.1 pesos
per kg (US$0.15). Since 2009, this waste has been dumped at a special
facility, called ‘La Concepción’. On average, 60,000 tons of construction
waste are generated a year.12
Due to the large number of collection companies, the city lacks accurate
data about the number of trucks and routes and fuel consumption. It is
trying to identify the best ways to improve the collection system and
is evaluating various options, including concession agreements and
performance-based contracts. At present, most of the trucks are old,
poorly maintained, and need to be replaced.
It is estimated that in 2012, SIAP needed 166,000 L of diesel to collect
solid waste from the residential routes that it services, which cost it about
1.94 million pesos (US$147,000). The fuel for the overall collection,
transportation, and management of the collection, done both by public
and private entities, cost 14.9 million pesos (almost US$1.1 million).
12 Sistema Integral de Aseo Publico - SIAP - available at: http://siapLéon.gob.mx/2012/.

LEÓN, GUANAJUATO, MÉXICOTOOL FOR RAPID ASSESSMENT OF CITY ENERGY (TRACE) 27
Because the city has no transfer stations, waste trucks must drive long
distances to the landfill; TRACE estimates that trucks drive around 86
km of round trips each day, spending US$0.77 per L of diesel. If transfer
and sorting stations were built, this could increase the recycling rate and
reduce fuel consumption.
The landfill, called CTR La Verde (“The Green” Waste Treatment
Center), is a new, modern facility, managed by a private operator under a
15-year contract that was recently renewed.
La Verde landfill
The facility is in El Verde, about 15 km northwest of the city. It began
operating in 2001, when it replaced the old landfill. The landfill is spread
over 60 ha and has two large cells, each divided into five smaller cells of
five ha. It has a leachate plant where wastewater from the landfill is treated
and discharged.
Leachate plant at la Verde landfill
Although the landfill can capture and flare biogas, it has not yet begun to
generate electricity. To do so, both the operator and city agreed in April
2014 on how investments will be financed and how to use the electricity
produced, which is intended for public lighting purposes. The project could
provide the power for up to 30 percent of the city’s streetlights.
LEÓN, GUANAJUATO, MÉXICOTOOL FOR RAPID ASSESSMENT OF CITY ENERGY (TRACE) 28
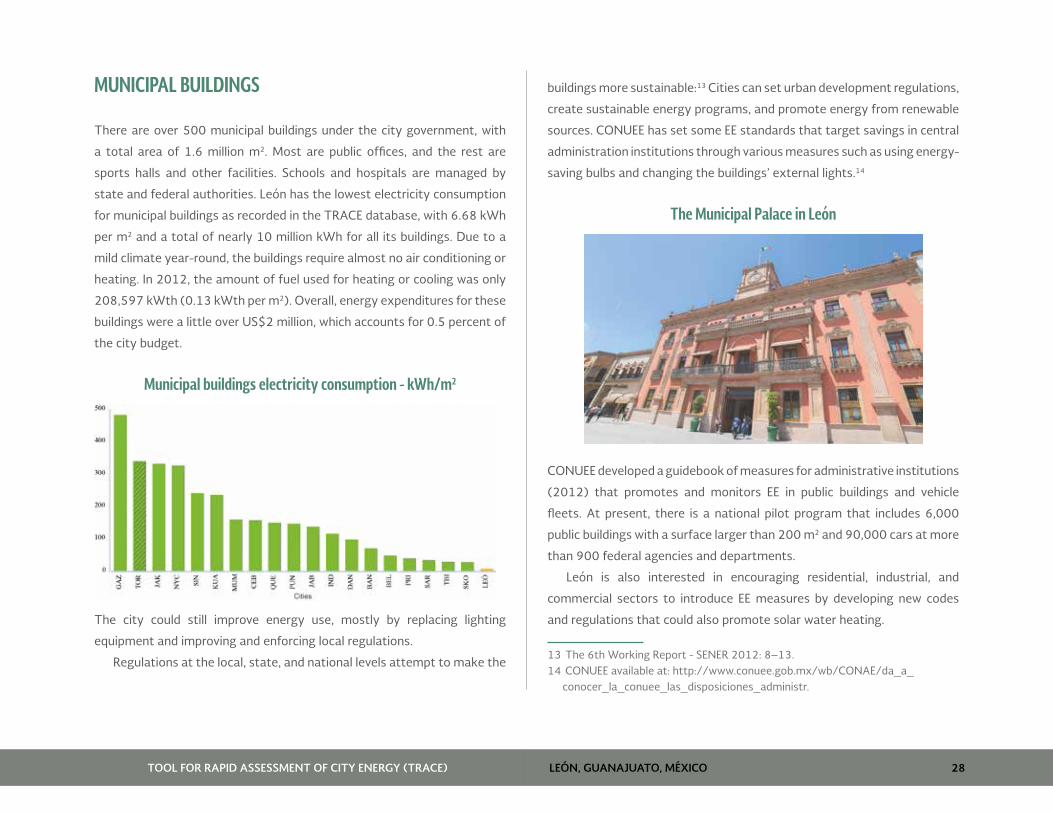
MUNICIPAL BUILDINGS
There are over 500 municipal buildings under the city government, with
a total area of 1.6 million m2. Most are public offices, and the rest are
sports halls and other facilities. Schools and hospitals are managed by
state and federal authorities. León has the lowest electricity consumption
for municipal buildings as recorded in the TRACE database, with 6.68 kWh
per m2 and a total of nearly 10 million kWh for all its buildings. Due to a
mild climate year-round, the buildings require almost no air conditioning or
heating. In 2012, the amount of fuel used for heating or cooling was only
208,597 kWth (0.13 kWth per m2). Overall, energy expenditures for these
buildings were a little over US$2 million, which accounts for 0.5 percent of
the city budget.
Municipal buildings electricity consumption - kWh/m2
The city could still improve energy use, mostly by replacing lighting
equipment and improving and enforcing local regulations.
Regulations at the local, state, and national levels attempt to make the
buildings more sustainable:13 Cities can set urban development regulations,
create sustainable energy programs, and promote energy from renewable
sources. CONUEE has set some EE standards that target savings in central
administration institutions through various measures such as using energy-
saving bulbs and changing the buildings’ external lights.14
The Municipal Palace in León
CONUEE developed a guidebook of measures for administrative institutions
(2012) that promotes and monitors EE in public buildings and vehicle
fleets. At present, there is a national pilot program that includes 6,000
public buildings with a surface larger than 200 m2 and 90,000 cars at more
than 900 federal agencies and departments.
León is also interested in encouraging residential, industrial, and
commercial sectors to introduce EE measures by developing new codes
and regulations that could also promote solar water heating.
13 The 6th Working Report - SENER 2012: 8–13.14 CONUEE available at: http://www.conuee.gob.mx/wb/CONAE/da_a_
conocer_la_conuee_las_disposiciones_administr.
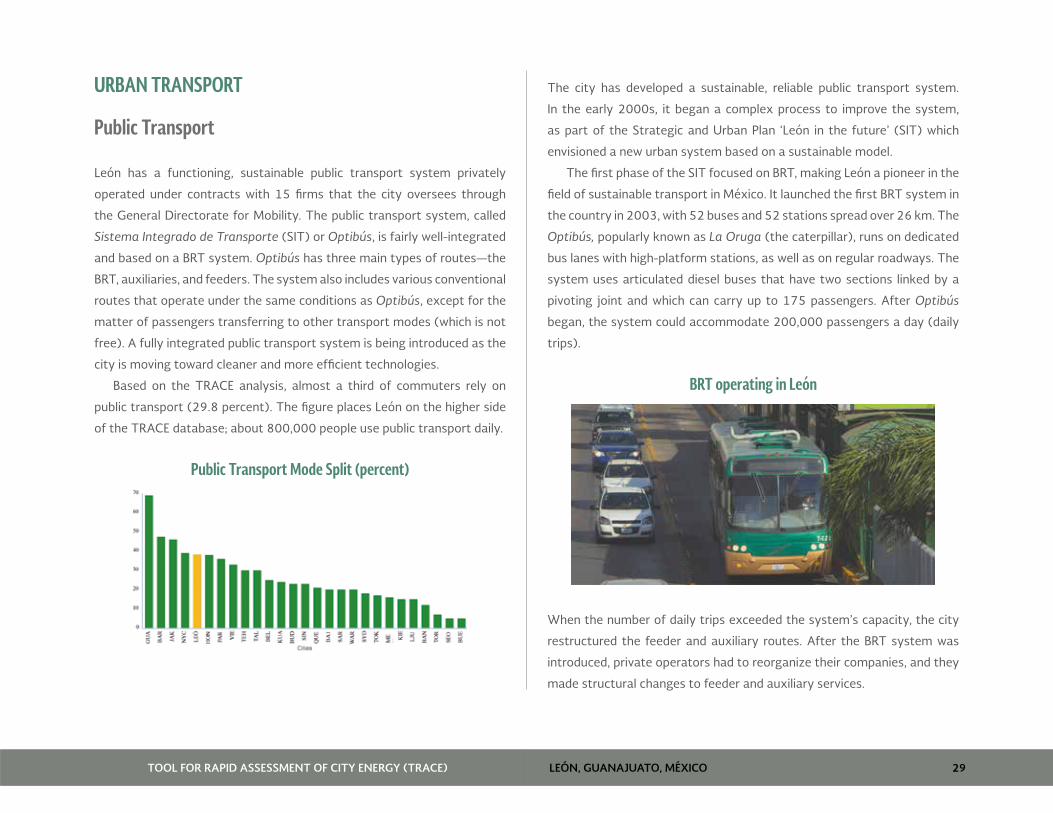
LEÓN, GUANAJUATO, MÉXICOTOOL FOR RAPID ASSESSMENT OF CITY ENERGY (TRACE) 29
URBAN TRANSPORT
Public Transport
León has a functioning, sustainable public transport system privately
operated under contracts with 15 firms that the city oversees through
the General Directorate for Mobility. The public transport system, called
Sistema Integrado de Transporte (SIT) or Optibús, is fairly well-integrated
and based on a BRT system. Optibús has three main types of routes—the
BRT, auxiliaries, and feeders. The system also includes various conventional
routes that operate under the same conditions as Optibús, except for the
matter of passengers transferring to other transport modes (which is not
free). A fully integrated public transport system is being introduced as the
city is moving toward cleaner and more efficient technologies.
Based on the TRACE analysis, almost a third of commuters rely on
public transport (29.8 percent). The figure places León on the higher side
of the TRACE database; about 800,000 people use public transport daily.
Public Transport Mode Split (percent)
The city has developed a sustainable, reliable public transport system.
In the early 2000s, it began a complex process to improve the system,
as part of the Strategic and Urban Plan ‘León in the future’ (SIT) which
envisioned a new urban system based on a sustainable model.
The first phase of the SIT focused on BRT, making León a pioneer in the
field of sustainable transport in México. It launched the first BRT system in
the country in 2003, with 52 buses and 52 stations spread over 26 km. The
Optibús, popularly known as La Oruga (the caterpillar), runs on dedicated
bus lanes with high-platform stations, as well as on regular roadways. The
system uses articulated diesel buses that have two sections linked by a
pivoting joint and which can carry up to 175 passengers. After Optibús
began, the system could accommodate 200,000 passengers a day (daily
trips).
BRT operating in León
When the number of daily trips exceeded the system’s capacity, the city
restructured the feeder and auxiliary routes. After the BRT system was
introduced, private operators had to reorganize their companies, and they
made structural changes to feeder and auxiliary services.

LEÓN, GUANAJUATO, MÉXICOTOOL FOR RAPID ASSESSMENT OF CITY ENERGY (TRACE) 30
Feeder (left) and auxiliary (right) buses in León
During the Optibús second stage, the BRT added 10 new stations, another
5 km of dedicated bus lanes, and 29 modern, high-quality articulated buses
that removed more than 100 old, polluting public vehicles from the road.
With low operating costs per km, the BRT is the most energy efficient
transport in the city, with service on 5 routes and 65 stations on the main
avenues in the central area. Today, of the total 800,000 people using
León’s public transport daily, 350,000 ride the Optibús. The integration
between BRT, feeder, and auxiliary routes has helped not only to expand
the city’s network but also to bring significant environmental benefits.
Today, 69 out of 100 public bus routes are integrated with the BRT.
Map of BRT system in León
Source: wikipedia.org.
Private operators work with the city to provide sustainable, reliable public
transport. They buy the buses, and the city maintains and modernizes the
streets, stations, and terminals.
The BRT system requires significant investments since costs for the
Optibús buses are 2–5 million pesos (US$200,000–US$500,000),
depending on the technology.
The city has three permanent transfer stations (at San Jerónimo, Delta
de Jerez, and San Juan Bosco); two micro-stations (at Santa Rita and
Parque Juárez, which are also the endpoints for the BRT system); feeder
routes; and auxiliary routes. At these stations, riders can transfer for
free from any of the lines. León also has several conventional routes that
circulate through most of the city.
BRT bus stop in León
With an energy consumption of 0.1 MJ per passenger-km, the public
transport is the second most efficient system (in the TRACE database)
after Mumbai. It performs far better than many cities, including Toronto,
Hong Kong, or Singapore. Indeed, the system won the ‘Sustainable
Transport Award 2011’ along with Guangzhou in China, outdoing cities like
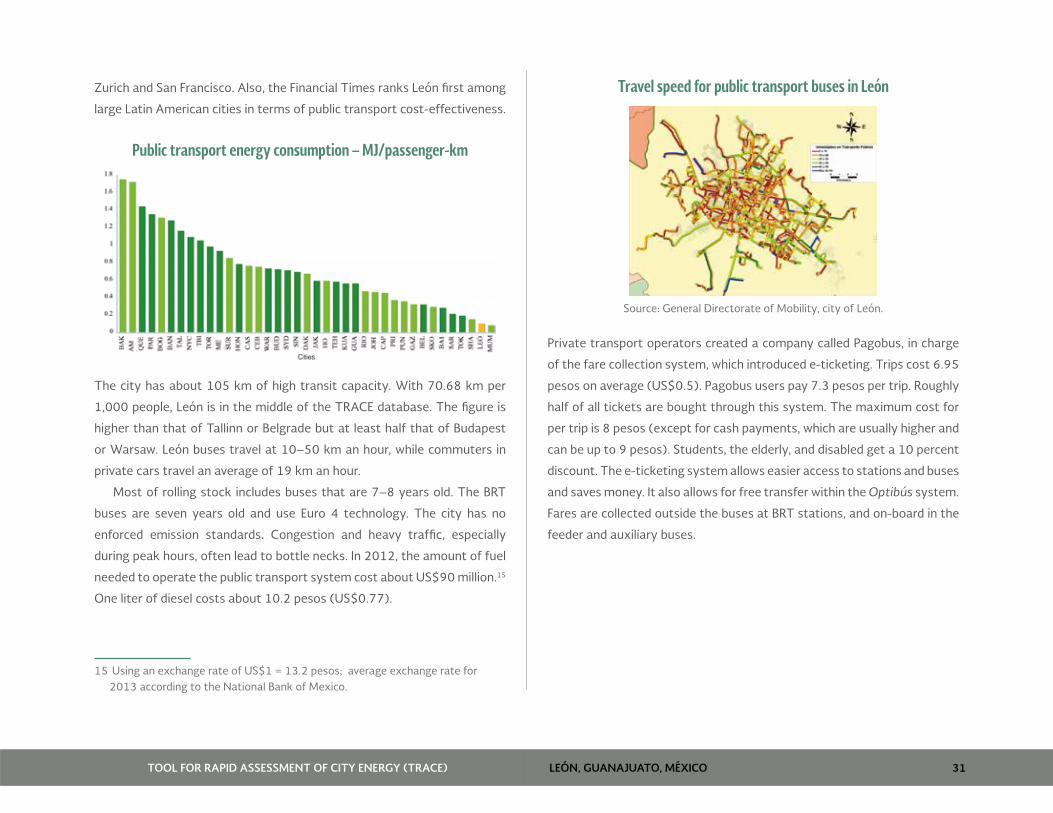
LEÓN, GUANAJUATO, MÉXICOTOOL FOR RAPID ASSESSMENT OF CITY ENERGY (TRACE) 31
Zurich and San Francisco. Also, the Financial Times ranks León first among
large Latin American cities in terms of public transport cost-effectiveness.
Public transport energy consumption – MJ/passenger-km
The city has about 105 km of high transit capacity. With 70.68 km per
1,000 people, León is in the middle of the TRACE database. The figure is
higher than that of Tallinn or Belgrade but at least half that of Budapest
or Warsaw. León buses travel at 10–50 km an hour, while commuters in
private cars travel an average of 19 km an hour.
Most of rolling stock includes buses that are 7–8 years old. The BRT
buses are seven years old and use Euro 4 technology. The city has no
enforced emission standards. Congestion and heavy traffic, especially
during peak hours, often lead to bottle necks. In 2012, the amount of fuel
needed to operate the public transport system cost about US$90 million.15
One liter of diesel costs about 10.2 pesos (US$0.77).
15 Using an exchange rate of US$1 = 13.2 pesos; average exchange rate for 2013 according to the National Bank of Mexico.
Travel speed for public transport buses in León
Source: General Directorate of Mobility, city of León.
Private transport operators created a company called Pagobus, in charge
of the fare collection system, which introduced e-ticketing. Trips cost 6.95
pesos on average (US$0.5). Pagobus users pay 7.3 pesos per trip. Roughly
half of all tickets are bought through this system. The maximum cost for
per trip is 8 pesos (except for cash payments, which are usually higher and
can be up to 9 pesos). Students, the elderly, and disabled get a 10 percent
discount. The e-ticketing system allows easier access to stations and buses
and saves money. It also allows for free transfer within the Optibús system.
Fares are collected outside the buses at BRT stations, and on-board in the
feeder and auxiliary buses.
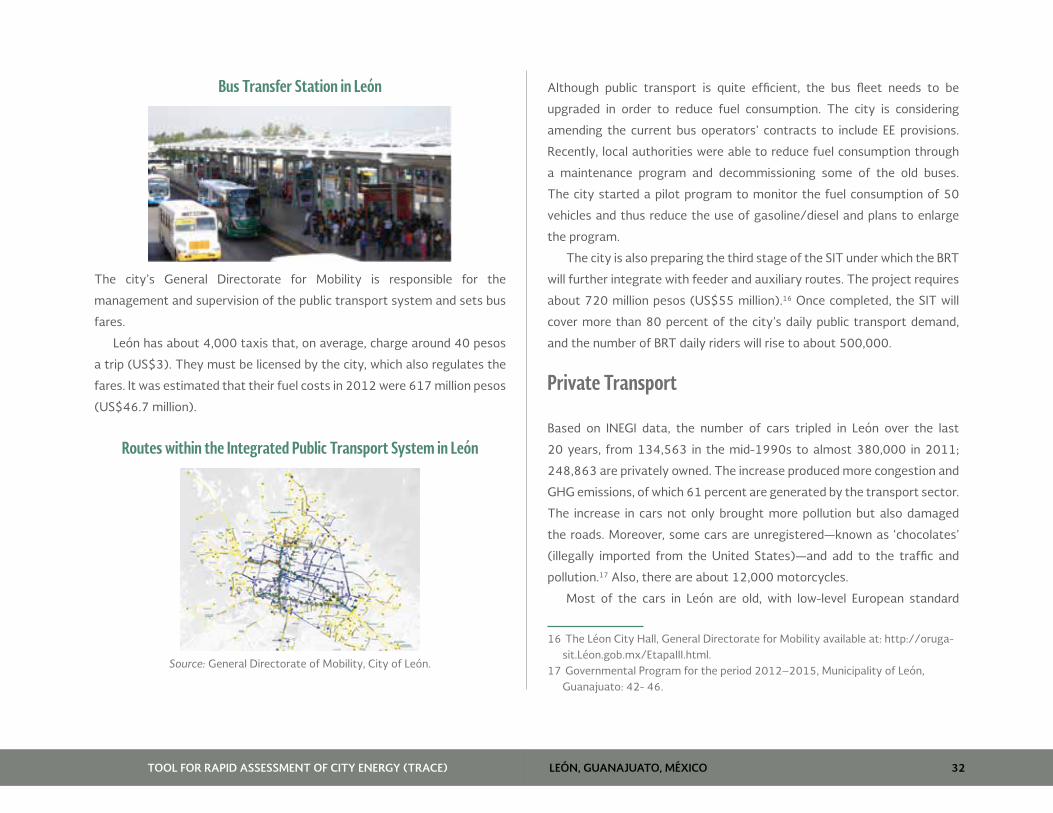
LEÓN, GUANAJUATO, MÉXICOTOOL FOR RAPID ASSESSMENT OF CITY ENERGY (TRACE) 32
Bus Transfer Station in León
The city’s General Directorate for Mobility is responsible for the
management and supervision of the public transport system and sets bus
fares.
León has about 4,000 taxis that, on average, charge around 40 pesos
a trip (US$3). They must be licensed by the city, which also regulates the
fares. It was estimated that their fuel costs in 2012 were 617 million pesos
(US$46.7 million).
Routes within the Integrated Public Transport System in León
Source: General Directorate of Mobility, City of León.
Although public transport is quite efficient, the bus fleet needs to be
upgraded in order to reduce fuel consumption. The city is considering
amending the current bus operators’ contracts to include EE provisions.
Recently, local authorities were able to reduce fuel consumption through
a maintenance program and decommissioning some of the old buses.
The city started a pilot program to monitor the fuel consumption of 50
vehicles and thus reduce the use of gasoline/diesel and plans to enlarge
the program.
The city is also preparing the third stage of the SIT under which the BRT
will further integrate with feeder and auxiliary routes. The project requires
about 720 million pesos (US$55 million).16 Once completed, the SIT will
cover more than 80 percent of the city’s daily public transport demand,
and the number of BRT daily riders will rise to about 500,000.
Private Transport
Based on INEGI data, the number of cars tripled in León over the last
20 years, from 134,563 in the mid-1990s to almost 380,000 in 2011;
248,863 are privately owned. The increase produced more congestion and
GHG emissions, of which 61 percent are generated by the transport sector.
The increase in cars not only brought more pollution but also damaged
the roads. Moreover, some cars are unregistered—known as ‘chocolates’
(illegally imported from the United States)—and add to the traffic and
pollution.17 Also, there are about 12,000 motorcycles.
Most of the cars in León are old, with low-level European standard
16 The Léon City Hall, General Directorate for Mobility available at: http://oruga-sit.Léon.gob.mx/EtapaIII.html.
17 Governmental Program for the period 2012–2015, Municipality of León, Guanajuato: 42- 46.
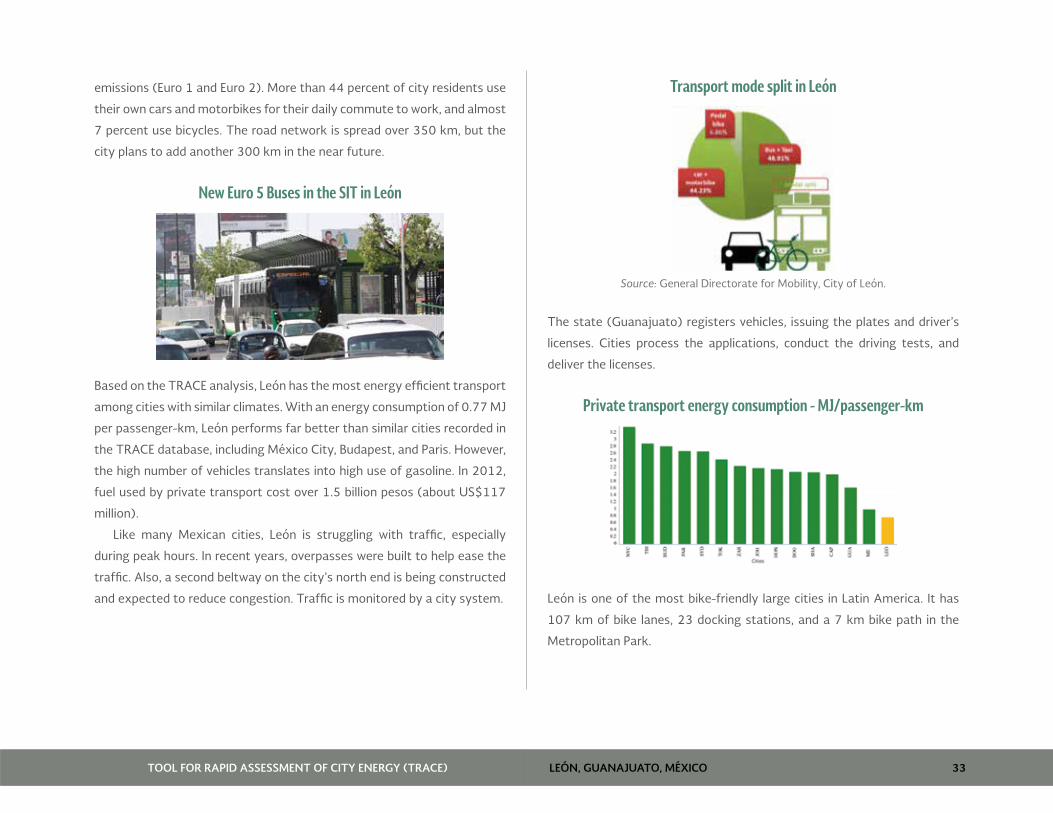
LEÓN, GUANAJUATO, MÉXICOTOOL FOR RAPID ASSESSMENT OF CITY ENERGY (TRACE) 33
emissions (Euro 1 and Euro 2). More than 44 percent of city residents use
their own cars and motorbikes for their daily commute to work, and almost
7 percent use bicycles. The road network is spread over 350 km, but the
city plans to add another 300 km in the near future.
New Euro 5 Buses in the SIT in León
Based on the TRACE analysis, León has the most energy efficient transport
among cities with similar climates. With an energy consumption of 0.77 MJ
per passenger-km, León performs far better than similar cities recorded in
the TRACE database, including México City, Budapest, and Paris. However,
the high number of vehicles translates into high use of gasoline. In 2012,
fuel used by private transport cost over 1.5 billion pesos (about US$117
million).
Like many Mexican cities, León is struggling with traffic, especially
during peak hours. In recent years, overpasses were built to help ease the
traffic. Also, a second beltway on the city’s north end is being constructed
and expected to reduce congestion. Traffic is monitored by a city system.
Transport mode split in León
Source: General Directorate for Mobility, City of León.
The state (Guanajuato) registers vehicles, issuing the plates and driver’s
licenses. Cities process the applications, conduct the driving tests, and
deliver the licenses.
Private transport energy consumption - MJ/passenger-km
León is one of the most bike-friendly large cities in Latin America. It has
107 km of bike lanes, 23 docking stations, and a 7 km bike path in the
Metropolitan Park.
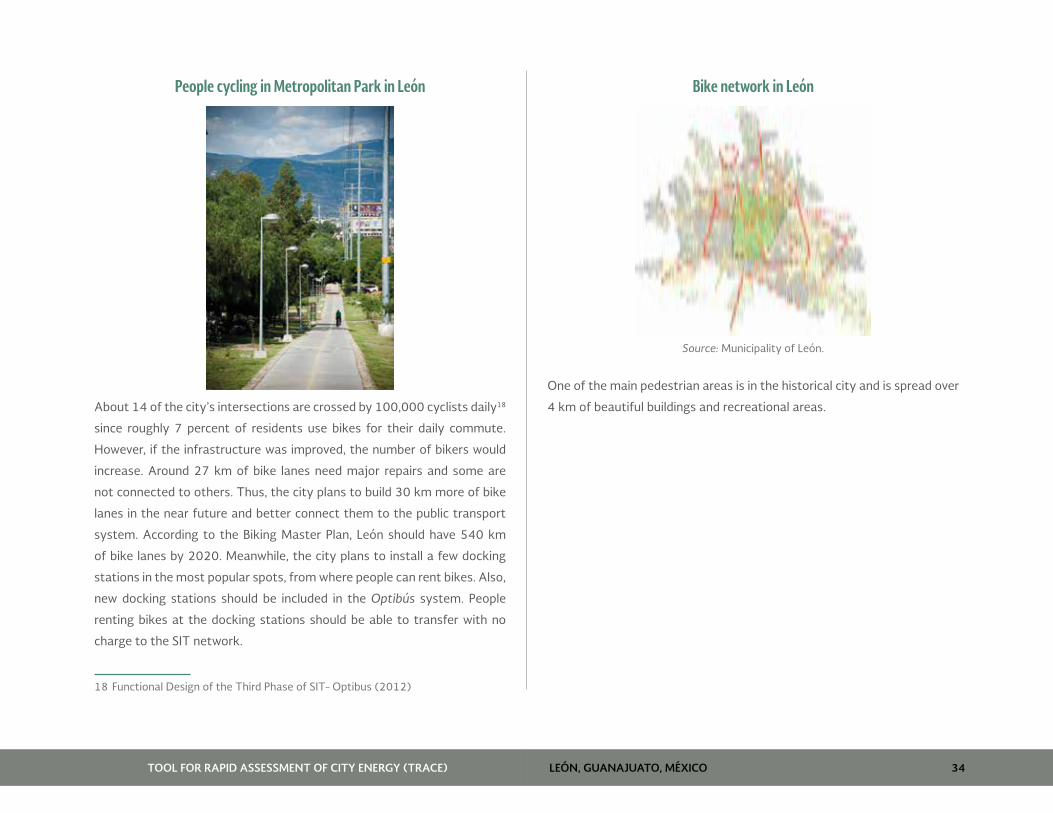
LEÓN, GUANAJUATO, MÉXICOTOOL FOR RAPID ASSESSMENT OF CITY ENERGY (TRACE) 34
People cycling in Metropolitan Park in León
About 14 of the city’s intersections are crossed by 100,000 cyclists daily18
since roughly 7 percent of residents use bikes for their daily commute.
However, if the infrastructure was improved, the number of bikers would
increase. Around 27 km of bike lanes need major repairs and some are
not connected to others. Thus, the city plans to build 30 km more of bike
lanes in the near future and better connect them to the public transport
system. According to the Biking Master Plan, León should have 540 km
of bike lanes by 2020. Meanwhile, the city plans to install a few docking
stations in the most popular spots, from where people can rent bikes. Also,
new docking stations should be included in the Optibús system. People
renting bikes at the docking stations should be able to transfer with no
charge to the SIT network.
18 Functional Design of the Third Phase of SIT- Optibus (2012)
Bike network in León
Source: Municipality of León.
One of the main pedestrian areas is in the historical city and is spread over
4 km of beautiful buildings and recreational areas.
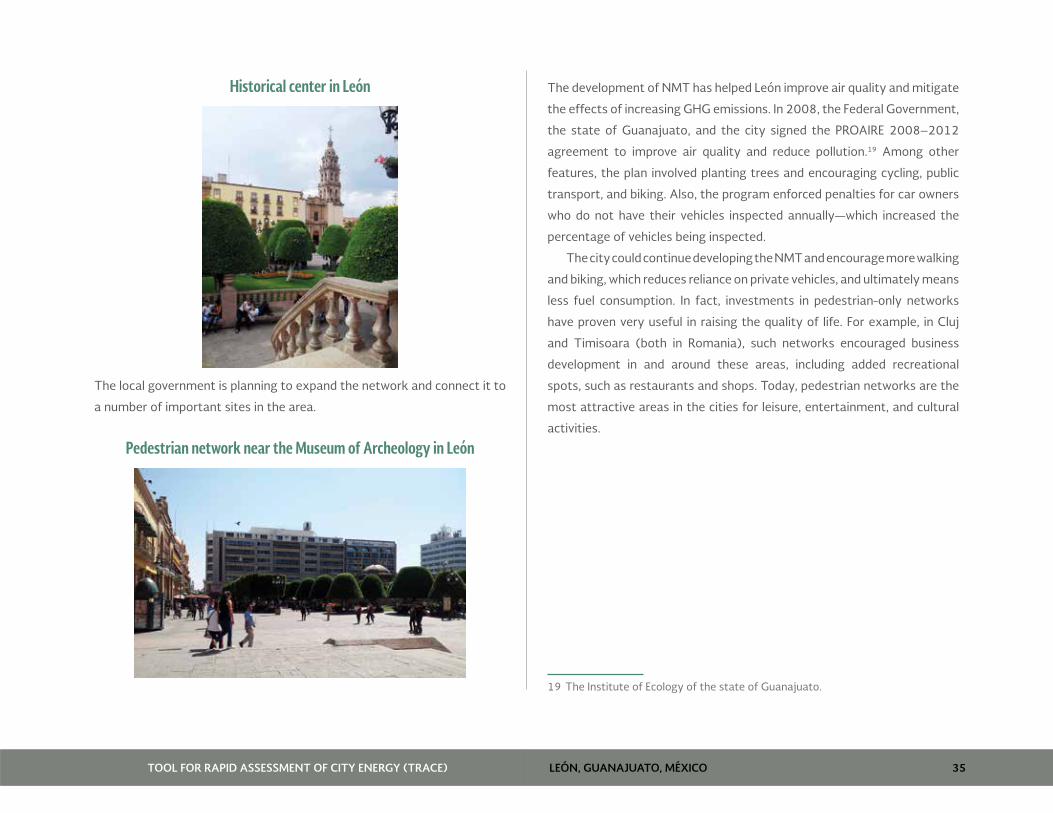
LEÓN, GUANAJUATO, MÉXICOTOOL FOR RAPID ASSESSMENT OF CITY ENERGY (TRACE) 35
Historical center in León
The local government is planning to expand the network and connect it to
a number of important sites in the area.
Pedestrian network near the Museum of Archeology in León
The development of NMT has helped León improve air quality and mitigate
the effects of increasing GHG emissions. In 2008, the Federal Government,
the state of Guanajuato, and the city signed the PROAIRE 2008–2012
agreement to improve air quality and reduce pollution.19 Among other
features, the plan involved planting trees and encouraging cycling, public
transport, and biking. Also, the program enforced penalties for car owners
who do not have their vehicles inspected annually—which increased the
percentage of vehicles being inspected.
The city could continue developing the NMT and encourage more walking
and biking, which reduces reliance on private vehicles, and ultimately means
less fuel consumption. In fact, investments in pedestrian-only networks
have proven very useful in raising the quality of life. For example, in Cluj
and Timisoara (both in Romania), such networks encouraged business
development in and around these areas, including added recreational
spots, such as restaurants and shops. Today, pedestrian networks are the
most attractive areas in the cities for leisure, entertainment, and cultural
activities.
19 The Institute of Ecology of the state of Guanajuato.

LEÓN, GUANAJUATO, MÉXICOTOOL FOR RAPID ASSESSMENT OF CITY ENERGY (TRACE) 36
WATER SECTOR
Potable Water
The water sector is coordinated by SAPAL, the independent public water
utility, which is in charge of distributing potable water and managing
wastewater, as well as sewage and drainage. Although the city is on
SAPAL’s Board of Directors, it is not involved in its management; nor does it
provide financial support. The company has a well-established, operations/
management model that could be an example for other public utilities in
México.
Almost all the water supply (99 percent) comes from a network of 132
wells, whose capacity is 3,617 L/s and which supply nearly 80,000,000
cubic meters of water. As all water sources in México are state property,
Léon pays a fee to CONAGUA (the National Water Commission) to use the
well water. There are 182 water tanks across the city with a total storage
capacity of 208,000 cubic meters.
The city’s main surface water source is the Palote Dam, whose capacity
is 135 liters per second. It is mostly used during hot seasons, depending
on available water volume. But in 2012, the dam’s water level was very low
and not used at all.
In the future, an alternative source could be El Zapotillo dam on the
Rio Verde in the state of Jalisco. The dam is currently being constructed,
and will cover all current needs and replace the use of wells. The project is
expected to be completed in the next three years and should guarantee an
adequate drinking water supply for the next 25 years to over 2.8 million
people in the states of Guanajuato and Jalisco. It is expected to deliver
water to León at a rate of 3.8 liters per second.
Water coverage in León is nearly 100 percent. SAPAL serves 382,000
customers, of which 361,467 are residences (households) and 17,868
are commercial. The former pay 17.8 pesos (US$1.32) per m3 of water,
industry pays 38.82 pesos (US$2.89) per m3, and businesses pay 39.81
pesos (US$2.97).
Water coverage in León
Source: Municipal Planning Institute IMPLAN.
The number of water connections increased by 15 percent from 2007-
2012. In that last year, the total water sold was 53.6 million m3. León uses
98.9 liters per capita per day, a figure that puts the city in the lower end
of the TRACE database. It has the second lowest daily water consumption
among similar cities as it requires less than half the water used in Barcelona,
Sofia, Bratislava, or Santiago.
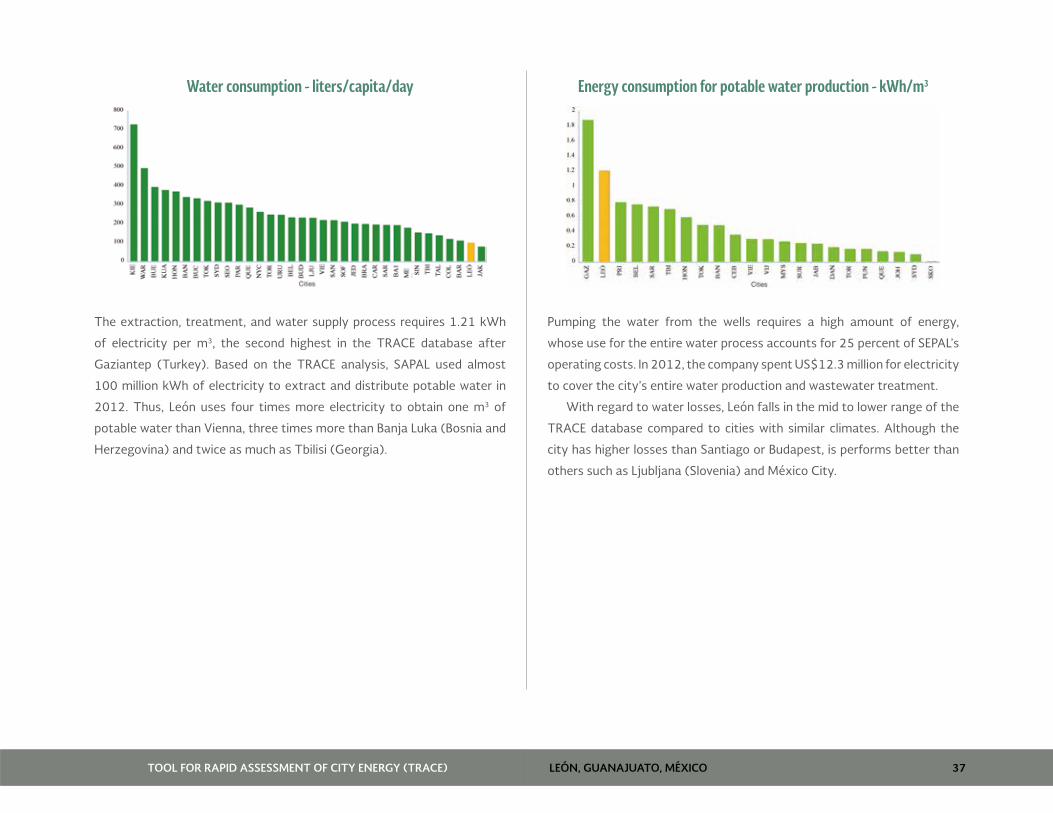
LEÓN, GUANAJUATO, MÉXICOTOOL FOR RAPID ASSESSMENT OF CITY ENERGY (TRACE) 37
Water consumption - liters/capita/day
The extraction, treatment, and water supply process requires 1.21 kWh
of electricity per m3, the second highest in the TRACE database after
Gaziantep (Turkey). Based on the TRACE analysis, SAPAL used almost
100 million kWh of electricity to extract and distribute potable water in
2012. Thus, León uses four times more electricity to obtain one m3 of
potable water than Vienna, three times more than Banja Luka (Bosnia and
Herzegovina) and twice as much as Tbilisi (Georgia).
Energy consumption for potable water production - kWh/m3
Pumping the water from the wells requires a high amount of energy,
whose use for the entire water process accounts for 25 percent of SEPAL’s
operating costs. In 2012, the company spent US$12.3 million for electricity
to cover the city’s entire water production and wastewater treatment.
With regard to water losses, León falls in the mid to lower range of the
TRACE database compared to cities with similar climates. Although the
city has higher losses than Santiago or Budapest, is performs better than
others such as Ljubljana (Slovenia) and México City.
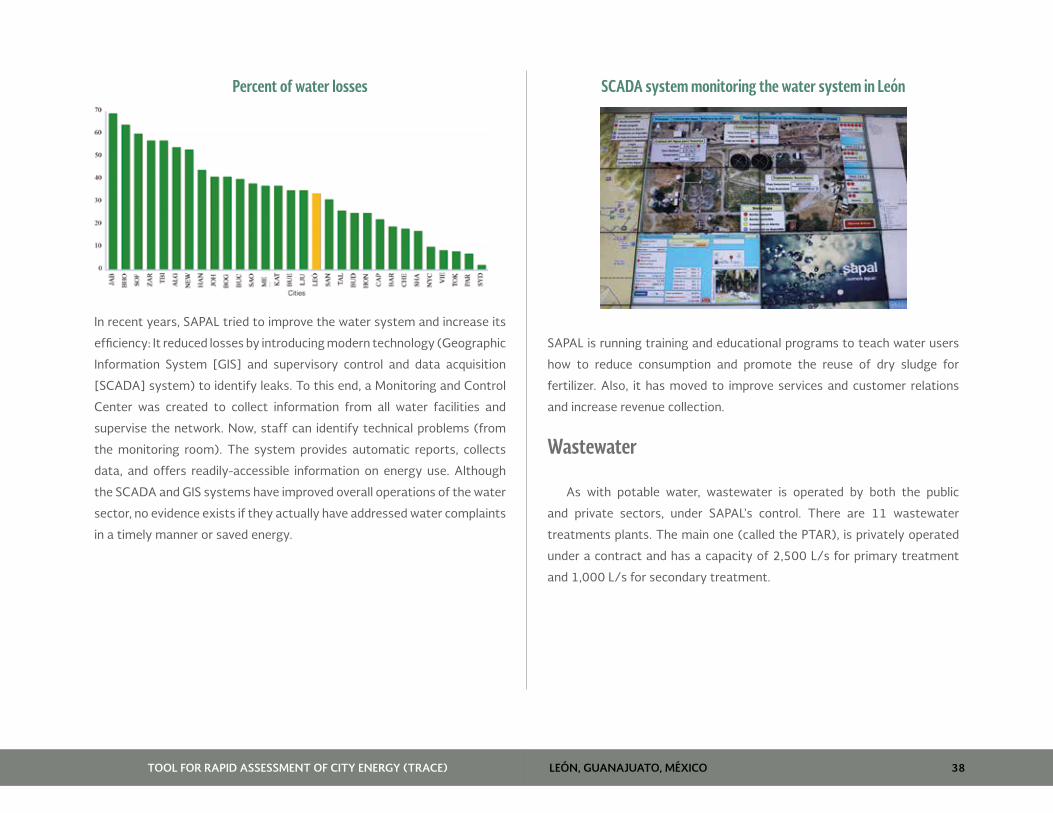
LEÓN, GUANAJUATO, MÉXICOTOOL FOR RAPID ASSESSMENT OF CITY ENERGY (TRACE) 38
Percent of water losses
In recent years, SAPAL tried to improve the water system and increase its
efficiency: It reduced losses by introducing modern technology (Geographic
Information System [GIS] and supervisory control and data acquisition
[SCADA] system) to identify leaks. To this end, a Monitoring and Control
Center was created to collect information from all water facilities and
supervise the network. Now, staff can identify technical problems (from
the monitoring room). The system provides automatic reports, collects
data, and offers readily-accessible information on energy use. Although
the SCADA and GIS systems have improved overall operations of the water
sector, no evidence exists if they actually have addressed water complaints
in a timely manner or saved energy.
SCADA system monitoring the water system in León
SAPAL is running training and educational programs to teach water users
how to reduce consumption and promote the reuse of dry sludge for
fertilizer. Also, it has moved to improve services and customer relations
and increase revenue collection.
Wastewater
As with potable water, wastewater is operated by both the public
and private sectors, under SAPAL’s control. There are 11 wastewater
treatments plants. The main one (called the PTAR), is privately operated
under a contract and has a capacity of 2,500 L/s for primary treatment
and 1,000 L/s for secondary treatment.
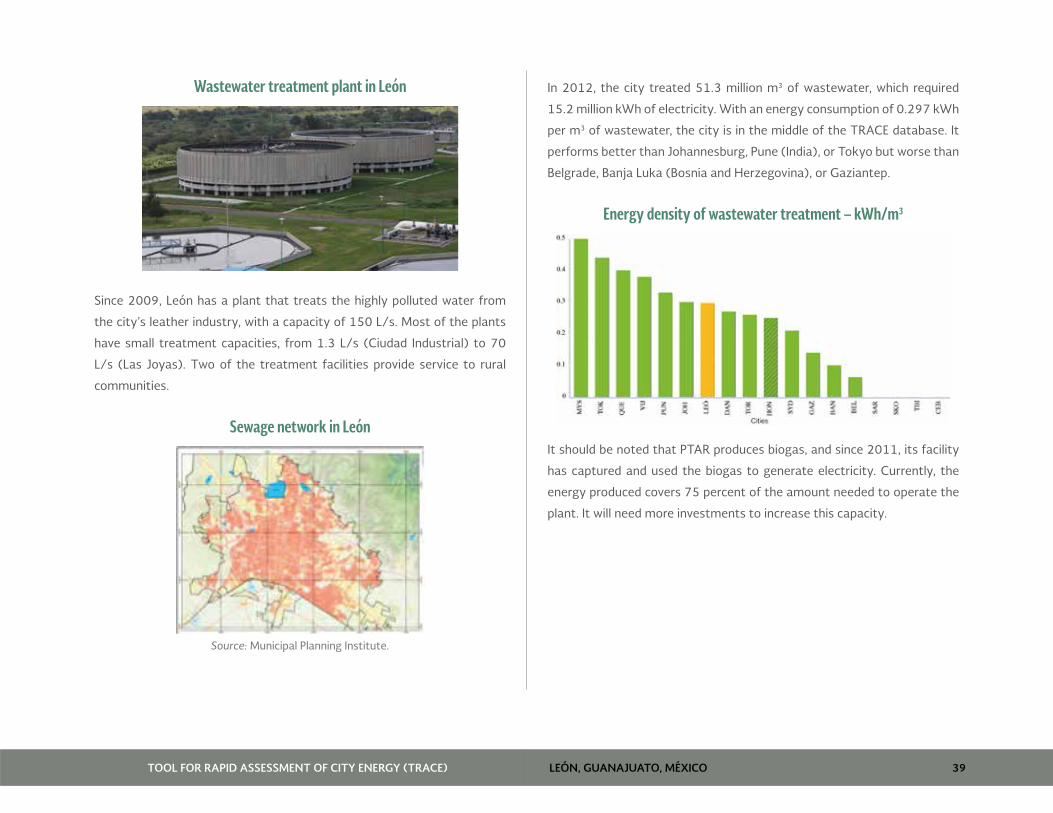
LEÓN, GUANAJUATO, MÉXICOTOOL FOR RAPID ASSESSMENT OF CITY ENERGY (TRACE) 39
Wastewater treatment plant in León
Since 2009, León has a plant that treats the highly polluted water from
the city’s leather industry, with a capacity of 150 L/s. Most of the plants
have small treatment capacities, from 1.3 L/s (Ciudad Industrial) to 70
L/s (Las Joyas). Two of the treatment facilities provide service to rural
communities.
Sewage network in León
Source: Municipal Planning Institute.
In 2012, the city treated 51.3 million m3 of wastewater, which required
15.2 million kWh of electricity. With an energy consumption of 0.297 kWh
per m3 of wastewater, the city is in the middle of the TRACE database. It
performs better than Johannesburg, Pune (India), or Tokyo but worse than
Belgrade, Banja Luka (Bosnia and Herzegovina), or Gaziantep.
Energy density of wastewater treatment – kWh/m3
It should be noted that PTAR produces biogas, and since 2011, its facility
has captured and used the biogas to generate electricity. Currently, the
energy produced covers 75 percent of the amount needed to operate the
plant. It will need more investments to increase this capacity.

LEÓN, GUANAJUATO, MÉXICOTOOL FOR RAPID ASSESSMENT OF CITY ENERGY (TRACE) 40
Biogas digesters at the wastewater treatment plant in León
More than a third of the wastewater treated in León is reused. In 2012,
nearly 19 million m3 was used for different purposes. About 336,000 m3
was used by local industry (especially for leather tanning), nearly 120,000
m3 was to irrigate the city’s green areas, and the rest went to agriculture.

LEÓN, GUANAJUATO, MÉXICOTOOL FOR RAPID ASSESSMENT OF CITY ENERGY (TRACE) 41
ENERGY EFFICIENCY RECOMMENDATIONS
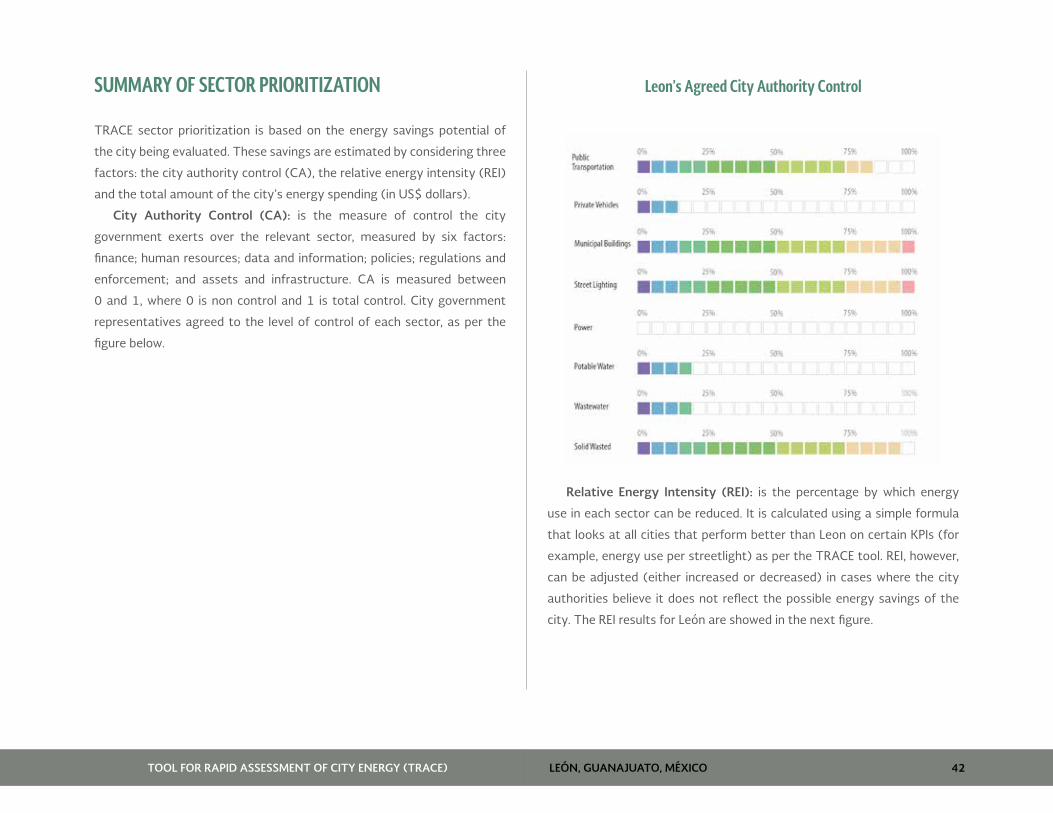
LEÓN, GUANAJUATO, MÉXICOTOOL FOR RAPID ASSESSMENT OF CITY ENERGY (TRACE) 42
SUMMARY OF SECTOR PRIORITIZATION
TRACE sector prioritization is based on the energy savings potential of
the city being evaluated. These savings are estimated by considering three
factors: the city authority control (CA), the relative energy intensity (REI)
and the total amount of the city’s energy spending (in US$ dollars).
City Authority Control (CA): is the measure of control the city
government exerts over the relevant sector, measured by six factors:
finance; human resources; data and information; policies; regulations and
enforcement; and assets and infrastructure. CA is measured between
0 and 1, where 0 is non control and 1 is total control. City government
representatives agreed to the level of control of each sector, as per the
figure below.
Leon’s Agreed City Authority Control
Relative Energy Intensity (REI): is the percentage by which energy
use in each sector can be reduced. It is calculated using a simple formula
that looks at all cities that perform better than Leon on certain KPIs (for
example, energy use per streetlight) as per the TRACE tool. REI, however,
can be adjusted (either increased or decreased) in cases where the city
authorities believe it does not reflect the possible energy savings of the
city. The REI results for León are showed in the next figure.
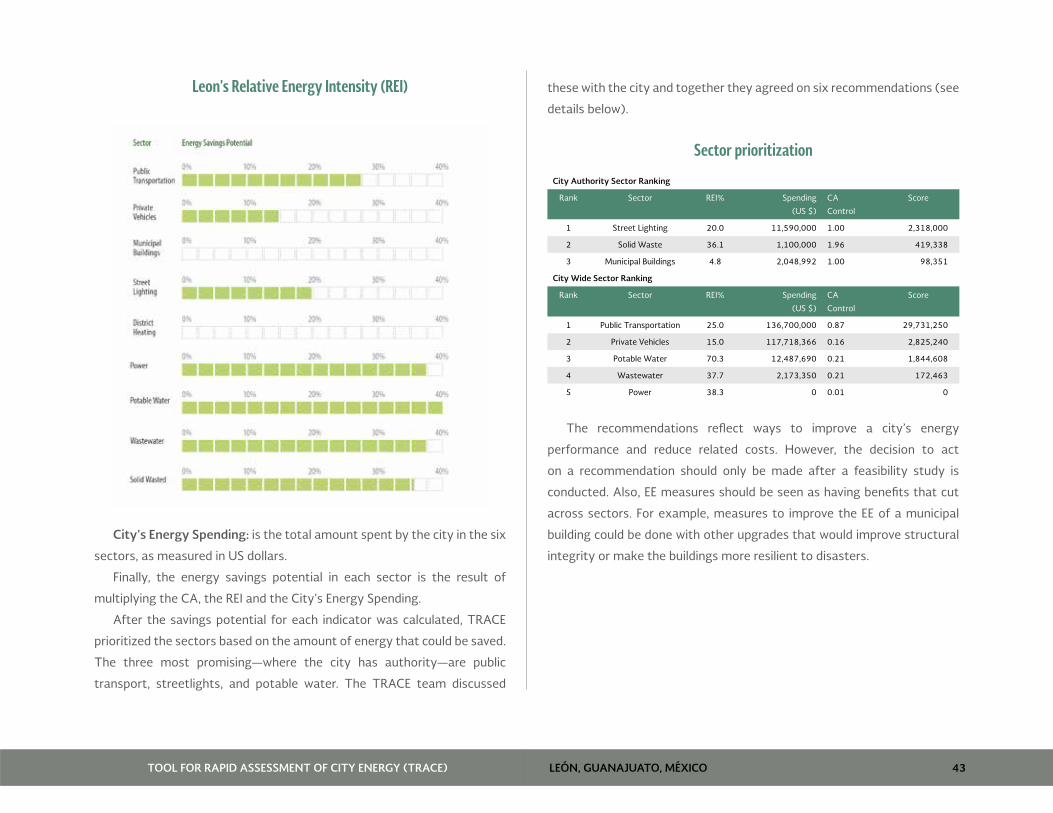
LEÓN, GUANAJUATO, MÉXICOTOOL FOR RAPID ASSESSMENT OF CITY ENERGY (TRACE) 43
Leon’s Relative Energy Intensity (REI)
City’s Energy Spending: is the total amount spent by the city in the six
sectors, as measured in US dollars.
Finally, the energy savings potential in each sector is the result of
multiplying the CA, the REI and the City’s Energy Spending.
After the savings potential for each indicator was calculated, TRACE
prioritized the sectors based on the amount of energy that could be saved.
The three most promising—where the city has authority—are public
transport, streetlights, and potable water. The TRACE team discussed
these with the city and together they agreed on six recommendations (see
details below).
Sector prioritization
City Authority Sector Ranking
Rank Sector REI% Spending
(US $)
CA
Control
Score
1 Street Lighting 20.0 11,590,000 1.00 2,318,000
2 Solid Waste 36.1 1,100,000 1.96 419,338
3 Municipal Buildings 4.8 2,048,992 1.00 98,351
City Wide Sector Ranking
Rank Sector REI% Spending
(US $)
CA
Control
Score
1 Public Transportation 25.0 136,700,000 0.87 29,731,250
2 Private Vehicles 15.0 117,718,366 0.16 2,825,240
3 Potable Water 70.3 12,487,690 0.21 1,844,608
4 Wastewater 37.7 2,173,350 0.21 172,463
5 Power 38.3 0 0.01 0
The recommendations reflect ways to improve a city’s energy
performance and reduce related costs. However, the decision to act
on a recommendation should only be made after a feasibility study is
conducted. Also, EE measures should be seen as having benefits that cut
across sectors. For example, measures to improve the EE of a municipal
building could be done with other upgrades that would improve structural
integrity or make the buildings more resilient to disasters.
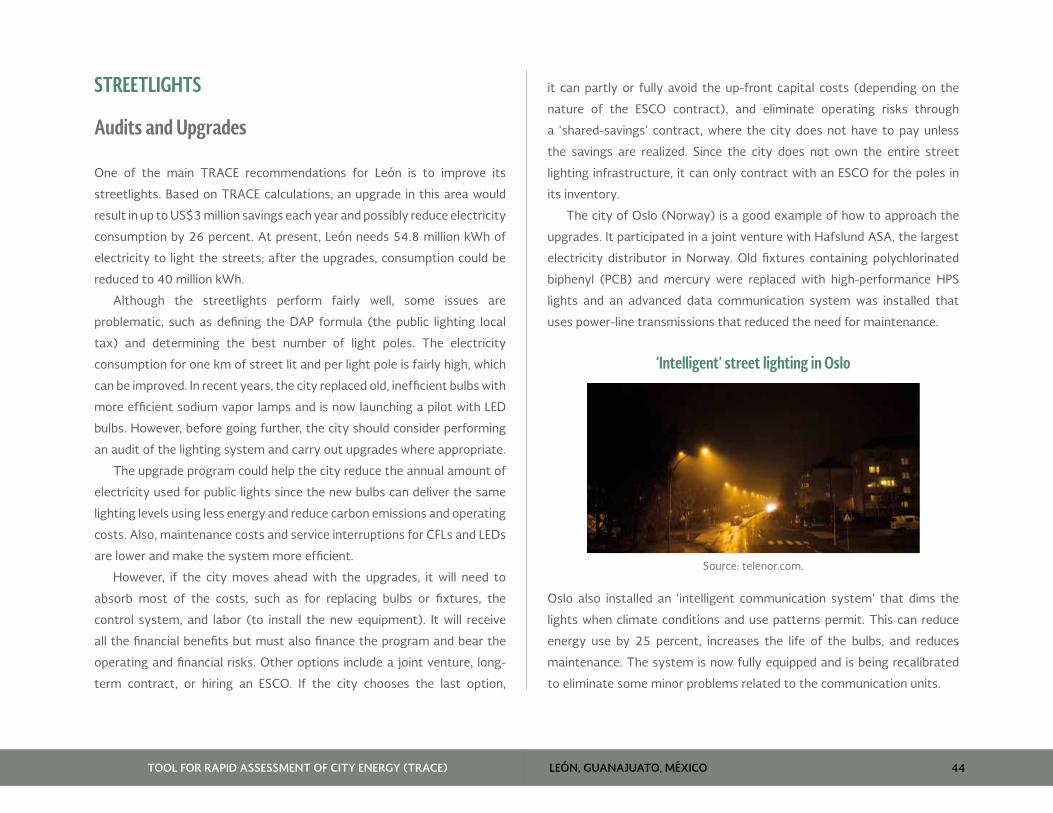
LEÓN, GUANAJUATO, MÉXICOTOOL FOR RAPID ASSESSMENT OF CITY ENERGY (TRACE) 44
STREETLIGHTS
Audits and Upgrades
One of the main TRACE recommendations for León is to improve its
streetlights. Based on TRACE calculations, an upgrade in this area would
result in up to US$3 million savings each year and possibly reduce electricity
consumption by 26 percent. At present, León needs 54.8 million kWh of
electricity to light the streets; after the upgrades, consumption could be
reduced to 40 million kWh.
Although the streetlights perform fairly well, some issues are
problematic, such as defining the DAP formula (the public lighting local
tax) and determining the best number of light poles. The electricity
consumption for one km of street lit and per light pole is fairly high, which
can be improved. In recent years, the city replaced old, inefficient bulbs with
more efficient sodium vapor lamps and is now launching a pilot with LED
bulbs. However, before going further, the city should consider performing
an audit of the lighting system and carry out upgrades where appropriate.
The upgrade program could help the city reduce the annual amount of
electricity used for public lights since the new bulbs can deliver the same
lighting levels using less energy and reduce carbon emissions and operating
costs. Also, maintenance costs and service interruptions for CFLs and LEDs
are lower and make the system more efficient.
However, if the city moves ahead with the upgrades, it will need to
absorb most of the costs, such as for replacing bulbs or fixtures, the
control system, and labor (to install the new equipment). It will receive
all the financial benefits but must also finance the program and bear the
operating and financial risks. Other options include a joint venture, long-
term contract, or hiring an ESCO. If the city chooses the last option,
it can partly or fully avoid the up-front capital costs (depending on the
nature of the ESCO contract), and eliminate operating risks through
a ‘shared-savings’ contract, where the city does not have to pay unless
the savings are realized. Since the city does not own the entire street
lighting infrastructure, it can only contract with an ESCO for the poles in
its inventory.
The city of Oslo (Norway) is a good example of how to approach the
upgrades. It participated in a joint venture with Hafslund ASA, the largest
electricity distributor in Norway. Old fixtures containing polychlorinated
biphenyl (PCB) and mercury were replaced with high-performance HPS
lights and an advanced data communication system was installed that
uses power-line transmissions that reduced the need for maintenance.
‘Intelligent’ street lighting in Oslo
Source: telenor.com.
Oslo also installed an ‘intelligent communication system’ that dims the
lights when climate conditions and use patterns permit. This can reduce
energy use by 25 percent, increases the life of the bulbs, and reduces
maintenance. The system is now fully equipped and is being recalibrated
to eliminate some minor problems related to the communication units.

LEÓN, GUANAJUATO, MÉXICOTOOL FOR RAPID ASSESSMENT OF CITY ENERGY (TRACE) 45
León has been exploring the new, highly efficient LED technology. It
is negotiating with SEMERNAT to finance a pilot to replace 613 HPS with
LEDs for 10 km along the Boulevard Adolfo Lopez Mates, one of León’s
main avenues. Although it is acknowledged that environmentally friendly
LEDs are more efficient than vapor-sodium bulbs and use less energy, they
are costly and require large up-front investments. Thus, the city should
do a cost-benefit analysis before moving to expand LEDs to more lighting
poles. At present, due to financial constraints, the LED project was put on
hold. In the meantime, the city could prepare a procurement guidebook
that could be used when it is able to replace the lamps.
Best practices worldwide confirm that the upgrading process works
better when there is a partnership or joint venture between a city and
private entity, such as in Los Angeles, where the city formed a partnership
with the Clinton Climate Initiative. At present, it is developing the largest
streetlight upgrade program ever carried out, which will replace traditional
lights with environmentally friendly LEDs. The project is expected to reduce
CO2 emissions by 40,500 tons and save US$10 million annually through 40
percent energy savings and reduced maintenance costs.
Street Lighting Timing Program
A second TRACE recommendation is a light timing program that reduces
the light intensity according to the needs of a particular area. This is an
inexpensive method in which electricity for streetlights can be substantially
reduced. With initial investments of a minimum of US$100,000, the annual
electricity consumption for León’s streetlights could be reduced by at
least 200,000 kWh. This would work best in areas where consumption is
metered and incorporates the lessons the city has learned over the last 10
years. At the same time, the city is encouraged to expand streetlights to
the neighborhoods not yet covered. At present, only three-quarters of the
city streets are lit; expanding coverage would be one of the main priorities
in the short and medium term.
The light timing program can be tailored to the needs in a particular
area and time. The level of lighting can be adjusted through a monitoring
system, and most systems have astronomical timers with geographic
positioning that allow for adjustments according to the season and time
of day. More light is required in the winter, when days are shorter, and less
light in summer when days are longer. Also, the intensity of the lamps
can vary based on demand at a particular time of day. For instance, after
midnight, when there are fewer people and cars on the streets, the light
can be diminished automatically from a command center. By dimming it
gradually, the fact that light is reduced is barely noticed.
LED Streetlight Timer
Source: ledoes.com
Besides León, several cities have adopted such timing programs. For
example, in Kirklees, United Kingdom, the city installed upgrades on each
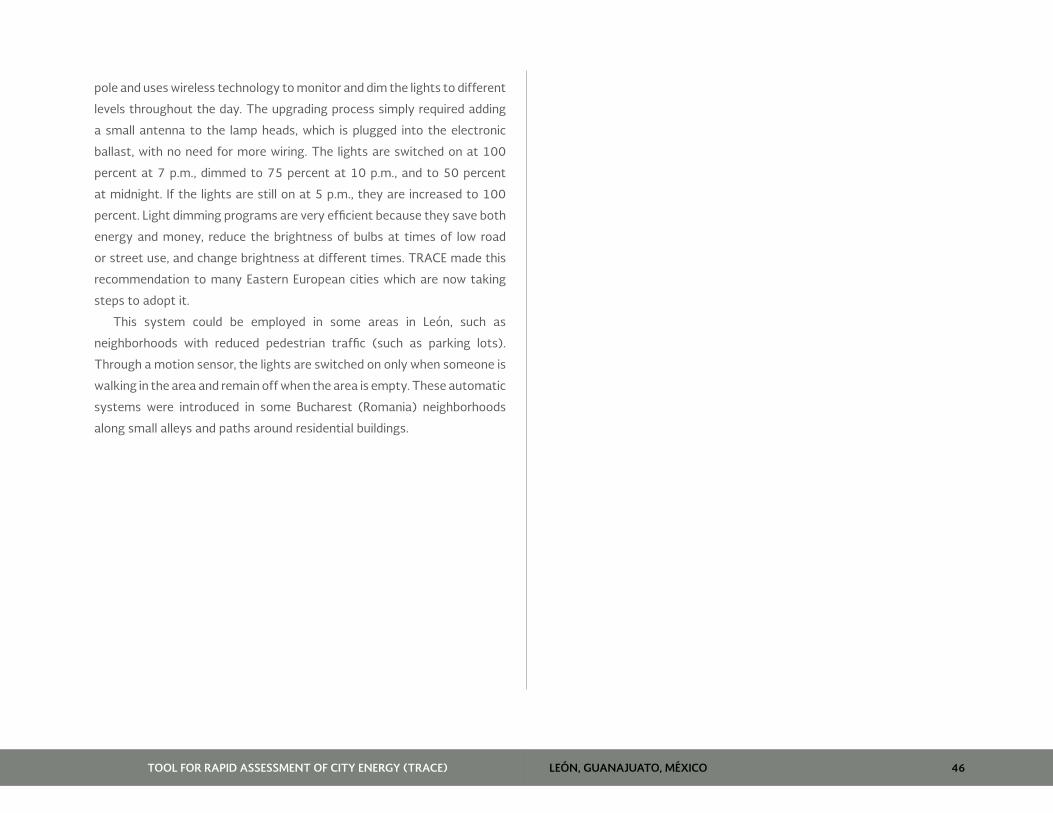
LEÓN, GUANAJUATO, MÉXICOTOOL FOR RAPID ASSESSMENT OF CITY ENERGY (TRACE) 46
pole and uses wireless technology to monitor and dim the lights to different
levels throughout the day. The upgrading process simply required adding
a small antenna to the lamp heads, which is plugged into the electronic
ballast, with no need for more wiring. The lights are switched on at 100
percent at 7 p.m., dimmed to 75 percent at 10 p.m., and to 50 percent
at midnight. If the lights are still on at 5 p.m., they are increased to 100
percent. Light dimming programs are very efficient because they save both
energy and money, reduce the brightness of bulbs at times of low road
or street use, and change brightness at different times. TRACE made this
recommendation to many Eastern European cities which are now taking
steps to adopt it.
This system could be employed in some areas in León, such as
neighborhoods with reduced pedestrian traffic (such as parking lots).
Through a motion sensor, the lights are switched on only when someone is
walking in the area and remain off when the area is empty. These automatic
systems were introduced in some Bucharest (Romania) neighborhoods
along small alleys and paths around residential buildings.
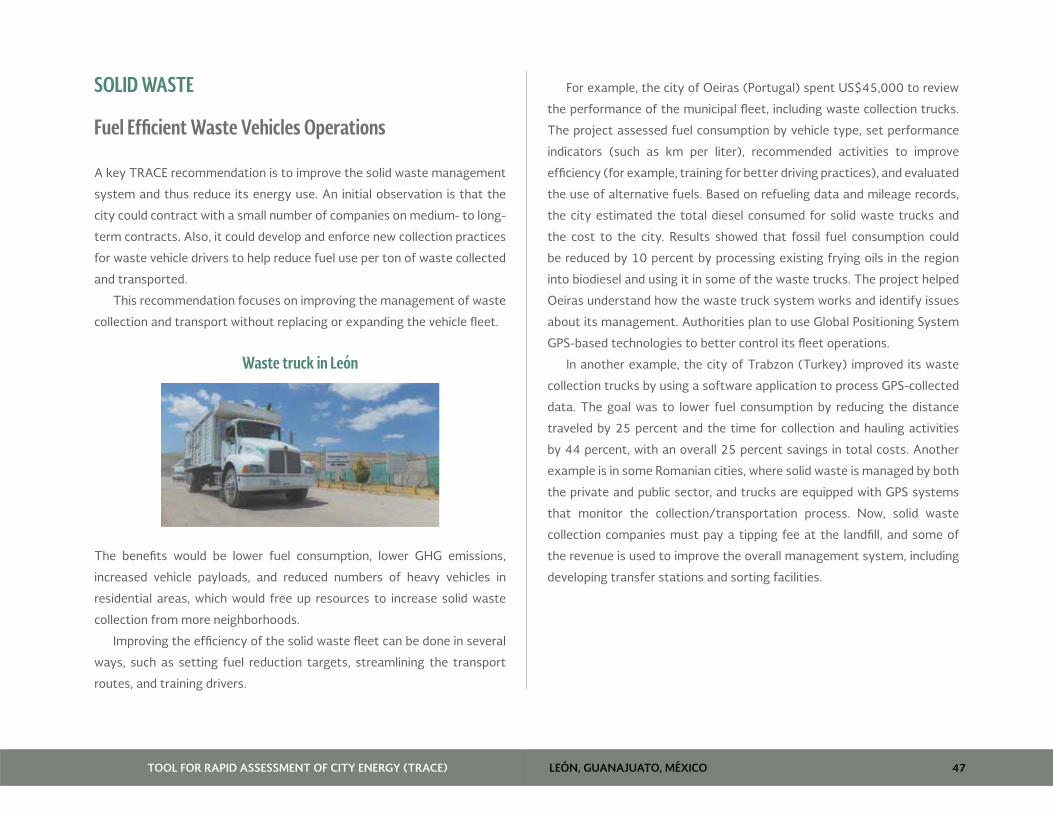
LEÓN, GUANAJUATO, MÉXICOTOOL FOR RAPID ASSESSMENT OF CITY ENERGY (TRACE) 47
SOLID WASTE
Fuel Efficient Waste Vehicles Operations
A key TRACE recommendation is to improve the solid waste management
system and thus reduce its energy use. An initial observation is that the
city could contract with a small number of companies on medium- to long-
term contracts. Also, it could develop and enforce new collection practices
for waste vehicle drivers to help reduce fuel use per ton of waste collected
and transported.
This recommendation focuses on improving the management of waste
collection and transport without replacing or expanding the vehicle fleet.
Waste truck in León
The benefits would be lower fuel consumption, lower GHG emissions,
increased vehicle payloads, and reduced numbers of heavy vehicles in
residential areas, which would free up resources to increase solid waste
collection from more neighborhoods.
Improving the efficiency of the solid waste fleet can be done in several
ways, such as setting fuel reduction targets, streamlining the transport
routes, and training drivers.
For example, the city of Oeiras (Portugal) spent US$45,000 to review
the performance of the municipal fleet, including waste collection trucks.
The project assessed fuel consumption by vehicle type, set performance
indicators (such as km per liter), recommended activities to improve
efficiency (for example, training for better driving practices), and evaluated
the use of alternative fuels. Based on refueling data and mileage records,
the city estimated the total diesel consumed for solid waste trucks and
the cost to the city. Results showed that fossil fuel consumption could
be reduced by 10 percent by processing existing frying oils in the region
into biodiesel and using it in some of the waste trucks. The project helped
Oeiras understand how the waste truck system works and identify issues
about its management. Authorities plan to use Global Positioning System
GPS-based technologies to better control its fleet operations.
In another example, the city of Trabzon (Turkey) improved its waste
collection trucks by using a software application to process GPS-collected
data. The goal was to lower fuel consumption by reducing the distance
traveled by 25 percent and the time for collection and hauling activities
by 44 percent, with an overall 25 percent savings in total costs. Another
example is in some Romanian cities, where solid waste is managed by both
the private and public sector, and trucks are equipped with GPS systems
that monitor the collection/transportation process. Now, solid waste
collection companies must pay a tipping fee at the landfill, and some of
the revenue is used to improve the overall management system, including
developing transfer stations and sorting facilities.
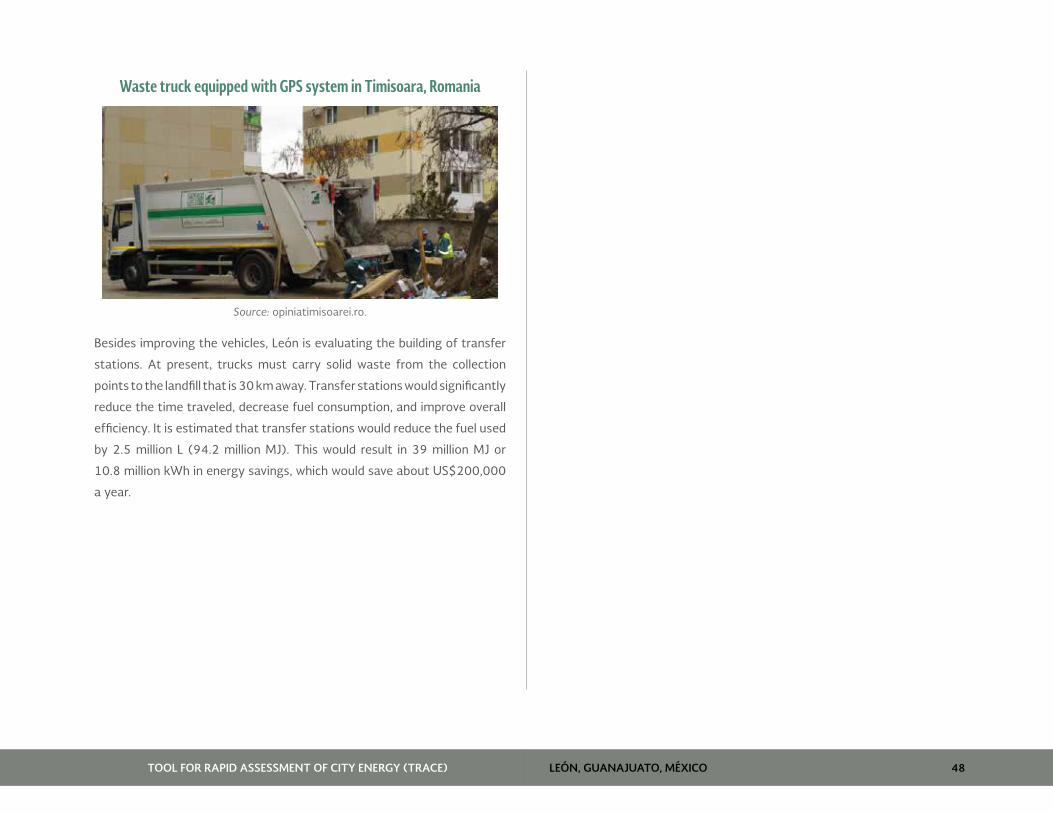
LEÓN, GUANAJUATO, MÉXICOTOOL FOR RAPID ASSESSMENT OF CITY ENERGY (TRACE) 48
Waste truck equipped with GPS system in Timisoara, Romania
Source: opiniatimisoarei.ro.
Besides improving the vehicles, León is evaluating the building of transfer
stations. At present, trucks must carry solid waste from the collection
points to the landfill that is 30 km away. Transfer stations would significantly
reduce the time traveled, decrease fuel consumption, and improve overall
efficiency. It is estimated that transfer stations would reduce the fuel used
by 2.5 million L (94.2 million MJ). This would result in 39 million MJ or
10.8 million kWh in energy savings, which would save about US$200,000
a year.

LEÓN, GUANAJUATO, MÉXICOTOOL FOR RAPID ASSESSMENT OF CITY ENERGY (TRACE) 49
MUNICIPAL BUILDINGS
Buildings Benchmarking Program
A common TRACE recommendation is to prepare a municipal building
energy database, where all energy-related information can be tracked and
monitored. In most cities worldwide, local authorities do not keep reliable
records on energy use and costs related to these buildings. Often, cities
do not know the heat or electricity consumption per m2 and the related
costs for a given floor area. Thus, it is not possible to know if completed EE
investments are effective. Similarly, León does not have a reliable database
with accurate information on the floor area and does not track the energy/
electricity consumed and expenditures related to municipal buildings.
The Municipal Palace in León
An energy database is useful not only for having a record of energy-related
consumption and expenditures, but also for introducing almost any EE
program. Thus, a full audit of municipal buildings in León is warranted.
The public building benchmarking would require an investment of about
US$100,000 that would bring potential savings of 100,000 kWh–200,000
kWh a year.
The benchmarking could be done by a small team of one or two people
from the city or outside consultants, and various departments should be
involved, including the Environment Directorate. The benchmarking would
track data on consumption of electricity, natural gas, and water, besides
data on building construction and renovation, floor space, forms of cooling/
heating (if used), energy bills for recent years, and lighting system modes.
With such information, it should be possible to identify the most suitable
energy-saving options. By regularly publishing the analysis and updating
the data, this could promote competition among building managers, and
lead to a productive exchange of data and collaboration.
This is the first step for a program that could reduce the buildings’
energy expenditures. The database is valuable to compare buildings and
determine the highest potential in terms of energy savings at the lowest
cost. The analysis would identify the most appropriate energy-saving
options that the city could support.
Municipal Buildings Audit and Upgrade
Once the municipal building benchmarking program is prepared, the city
could also consider an audit and upgrade project. The audits would provide
information on energy consumption for each building, which would include
the types of equipment that use electricity, such as computers, lights,
air conditioning and heating systems, server rooms and coolers (for the

LEÓN, GUANAJUATO, MÉXICOTOOL FOR RAPID ASSESSMENT OF CITY ENERGY (TRACE) 50
servers), and appliances (refrigerators, water coolers). Depending on the
results, the city may need to allocate funds for EE upgrades, purchasing
new equipment, and some building renovations.
The upgrades can be done cost effectively through ESCOs, which would
pay the up-front costs and share in the savings that follow. However,
before it contracts with an ESCO, the city should assign a staff member or
hire someone to oversee the EE projects.
According to TRACE calculations, the audits and upgrades for city
administration offices could save about 330,000 kWh of electricity a year
since the energy used would drop from nearly 10 million kWh to 9.6 million
kWh. To lower utility bills even further, the city could consider replacing the
remaining incandescent bulbs with more efficient fluorescent or LED lights.
The audits and upgrades could save a large amount of energy. The
Bank helped Kiev (Ukraine) audit 1,270 municipal buildings and provided
support with the measures adopted on both the demand side (automation
and control system) and supply side (meters and tariffs) and reduced
heating by 26 percent a year, which saved 387,000 MWh.
Explora: Museum and Center of Science in León
Stuttgart (Germany) has reduced its CO2 emission every year by 7,200 tons
through an innovative form of internal contracting that uses a revolving
fund to finance energy and water-saving measures. The city invests these
savings into new activities, adding to environmental improvements and
reducing emissions. In other countries such as Romania, a building can
be sold or rented only if has energy audit and performance certificates
showing it has met requirements.
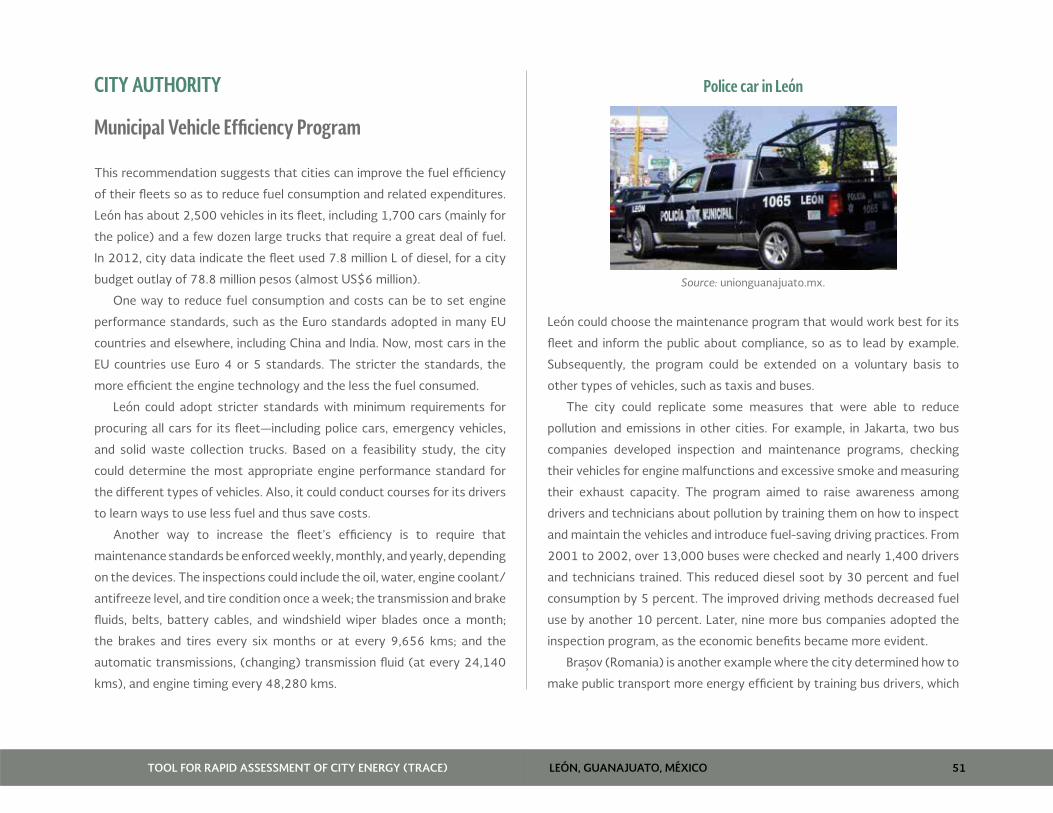
LEÓN, GUANAJUATO, MÉXICOTOOL FOR RAPID ASSESSMENT OF CITY ENERGY (TRACE) 51
CITY AUTHORITY
Municipal Vehicle Efficiency Program
This recommendation suggests that cities can improve the fuel efficiency
of their fleets so as to reduce fuel consumption and related expenditures.
León has about 2,500 vehicles in its fleet, including 1,700 cars (mainly for
the police) and a few dozen large trucks that require a great deal of fuel.
In 2012, city data indicate the fleet used 7.8 million L of diesel, for a city
budget outlay of 78.8 million pesos (almost US$6 million).
One way to reduce fuel consumption and costs can be to set engine
performance standards, such as the Euro standards adopted in many EU
countries and elsewhere, including China and India. Now, most cars in the
EU countries use Euro 4 or 5 standards. The stricter the standards, the
more efficient the engine technology and the less the fuel consumed.
León could adopt stricter standards with minimum requirements for
procuring all cars for its fleet—including police cars, emergency vehicles,
and solid waste collection trucks. Based on a feasibility study, the city
could determine the most appropriate engine performance standard for
the different types of vehicles. Also, it could conduct courses for its drivers
to learn ways to use less fuel and thus save costs.
Another way to increase the fleet’s efficiency is to require that
maintenance standards be enforced weekly, monthly, and yearly, depending
on the devices. The inspections could include the oil, water, engine coolant/
antifreeze level, and tire condition once a week; the transmission and brake
fluids, belts, battery cables, and windshield wiper blades once a month;
the brakes and tires every six months or at every 9,656 kms; and the
automatic transmissions, (changing) transmission fluid (at every 24,140
kms), and engine timing every 48,280 kms.
Police car in León
Source: unionguanajuato.mx.
León could choose the maintenance program that would work best for its
fleet and inform the public about compliance, so as to lead by example.
Subsequently, the program could be extended on a voluntary basis to
other types of vehicles, such as taxis and buses.
The city could replicate some measures that were able to reduce
pollution and emissions in other cities. For example, in Jakarta, two bus
companies developed inspection and maintenance programs, checking
their vehicles for engine malfunctions and excessive smoke and measuring
their exhaust capacity. The program aimed to raise awareness among
drivers and technicians about pollution by training them on how to inspect
and maintain the vehicles and introduce fuel-saving driving practices. From
2001 to 2002, over 13,000 buses were checked and nearly 1,400 drivers
and technicians trained. This reduced diesel soot by 30 percent and fuel
consumption by 5 percent. The improved driving methods decreased fuel
use by another 10 percent. Later, nine more bus companies adopted the
inspection program, as the economic benefits became more evident.
Bra ov (Romania) is another example where the city determined how to
make public transport more energy efficient by training bus drivers, which
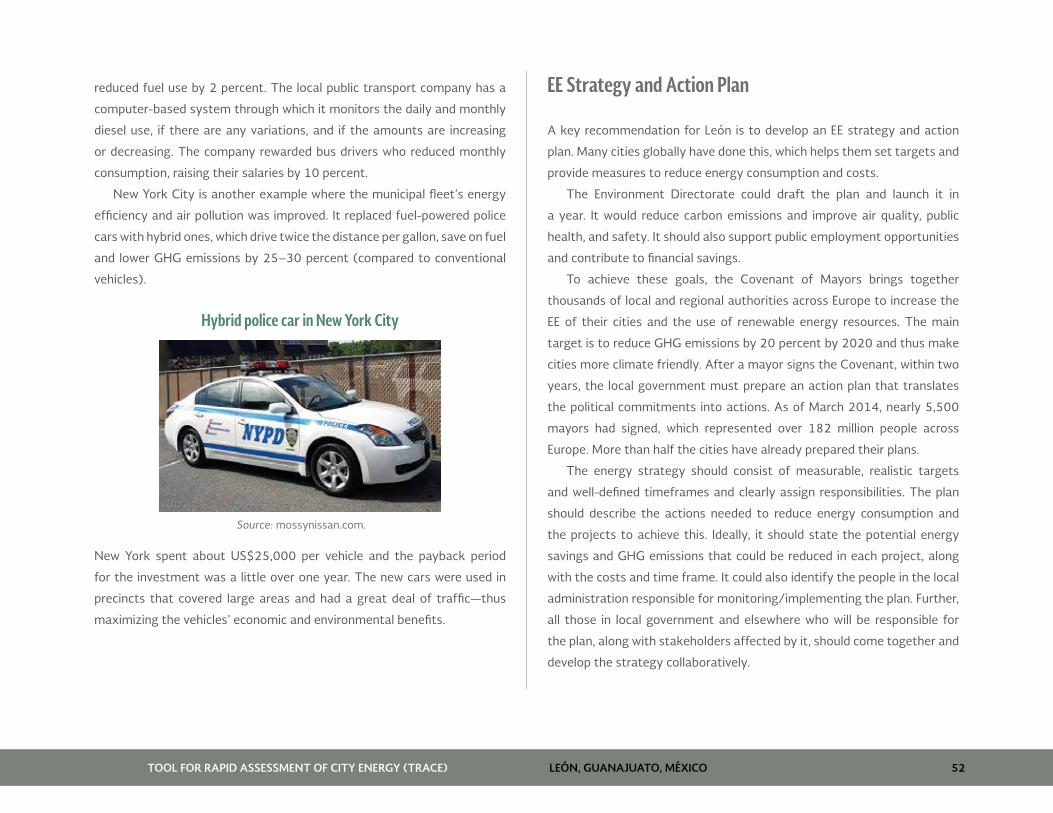
LEÓN, GUANAJUATO, MÉXICOTOOL FOR RAPID ASSESSMENT OF CITY ENERGY (TRACE) 52
reduced fuel use by 2 percent. The local public transport company has a
computer-based system through which it monitors the daily and monthly
diesel use, if there are any variations, and if the amounts are increasing
or decreasing. The company rewarded bus drivers who reduced monthly
consumption, raising their salaries by 10 percent.
New York City is another example where the municipal fleet’s energy
efficiency and air pollution was improved. It replaced fuel-powered police
cars with hybrid ones, which drive twice the distance per gallon, save on fuel
and lower GHG emissions by 25–30 percent (compared to conventional
vehicles).
Hybrid police car in New York City
Source: mossynissan.com.
New York spent about US$25,000 per vehicle and the payback period
for the investment was a little over one year. The new cars were used in
precincts that covered large areas and had a great deal of traffic—thus
maximizing the vehicles’ economic and environmental benefits.
EE Strategy and Action Plan
A key recommendation for León is to develop an EE strategy and action
plan. Many cities globally have done this, which helps them set targets and
provide measures to reduce energy consumption and costs.
The Environment Directorate could draft the plan and launch it in
a year. It would reduce carbon emissions and improve air quality, public
health, and safety. It should also support public employment opportunities
and contribute to financial savings.
To achieve these goals, the Covenant of Mayors brings together
thousands of local and regional authorities across Europe to increase the
EE of their cities and the use of renewable energy resources. The main
target is to reduce GHG emissions by 20 percent by 2020 and thus make
cities more climate friendly. After a mayor signs the Covenant, within two
years, the local government must prepare an action plan that translates
the political commitments into actions. As of March 2014, nearly 5,500
mayors had signed, which represented over 182 million people across
Europe. More than half the cities have already prepared their plans.
The energy strategy should consist of measurable, realistic targets
and well-defined timeframes and clearly assign responsibilities. The plan
should describe the actions needed to reduce energy consumption and
the projects to achieve this. Ideally, it should state the potential energy
savings and GHG emissions that could be reduced in each project, along
with the costs and time frame. It could also identify the people in the local
administration responsible for monitoring/implementing the plan. Further,
all those in local government and elsewhere who will be responsible for
the plan, along with stakeholders affected by it, should come together and
develop the strategy collaboratively.
LEÓN, GUANAJUATO, MÉXICOTOOL FOR RAPID ASSESSMENT OF CITY ENERGY (TRACE) 53
It is important that the EE plan state how emissions will be reduced to
ensure that intermediate targets are reached and that progress is made
toward the goals in a given time frame. The monitoring plan should include
performance indicators as well as a schedule for measuring progress over
a given time and assign responsibilities. The city could appoint a senior
officer to monitor energy use and efficiency in the city’s departments and
public organizations. The collection/management of energy data should
be done by the city employees responsible for EE activities.
A well-designed plan with concrete measures to tackle the issue
of energy consumption could also improve the city’s economic
competitiveness and open ways to achieve greater energy independence.
The plan could be a good opportunity to translate various initiatives into a
coherent strategy for citywide EE. Finally, the strategy could be an internal
and external promotion tool for the city to gain support for future work
on EE.
Once authorities launch an EE strategy and begin preparing the action
plan, they should focus on high-priority areas such as municipal buildings,
streetlights, and solid waste. The measures for each sector should include
indicators on total city energy use, overall savings from EE measures, and
the percentage for which data is collected annually. The TRACE indicators
are a good starting point as they involve urban transport, municipal
buildings, streetlights, water, solid waste, and power, which can be used
to monitor a city’s energy performance. Also, the plan should include
indicators for EE in private buildings and industries.
Several cities have prepared energy action plans that set targets on how
to reduce energy consumption and present measures to meet the goals.
Stockholm, which signed the Covenant of Mayors, prepared an integrated
city planning and management plan with environmental programs and
concrete actions to reduce GHG emissions and tackle climate change. It
launched the plan in the southern district of Hammarby Sjöstad, which
aims to double the goals of the 1995 Swedish best practices. The district
integrated the management of waste, energy, water, and sewage with
the collaboration of stakeholders. According to the first assessment, the
district reduced nonrenewable energy use by 28–42 percent, along with a
29–37 percent decrease in GHG emissions.
Philadelphia is another example of best practices, where the city
launched measures that helped achieve the goal to reduce energy
consumption by 30 percent by 2015. These measures included upgrading
municipal buildings, replacing the municipal fleet, encouraging conservation
among employees, switching to LEDs, developing EE building guidelines,
providing tax incentives to EE star performers, creating neighborhood
competitions to reduce energy use, developing an EE marketing campaign,
and building energy-efficient public housing.

LEÓN, GUANAJUATO, MÉXICOTOOL FOR RAPID ASSESSMENT OF CITY ENERGY (TRACE) 54
LEÓN, GUANAJUATO, MÉXICOTOOL FOR RAPID ASSESSMENT OF CITY ENERGY (TRACE) 55
ANNEX - TRACE LEÓN RECOMMENDATIONS
LEÓN, GUANAJUATO, MÉXICOTOOL FOR RAPID ASSESSMENT OF CITY ENERGY (TRACE) 56
DETAILED RECOMMENDATIONS FROM TRACE
Improving Energy Efficiency in León, Guanajuato, México
Annex 1: Streetlights Audit and Upgrade 57
Annex 2: Streetlight Timing Program 61
Annex 3: Fuel-Efficient Waste Vehicles Operations 65
Annex 4: Municipal Building Benchmarking Program 72
Annex 5: Municipal Buildings’ Audits and Upgrades 79
Annex 6: Municipal Vehicle Fleet Efficiency Program 83
Annex 7: Awareness-raising Campaigns 88
Annex 8: Abbreviations for Cities in the TRACE Database 92

LEÓN, GUANAJUATO, MÉXICOTOOL FOR RAPID ASSESSMENT OF CITY ENERGY (TRACE) 57
ANNEX 1: STREETLIGHTS AUDIT AND UPGRADE
Description Incandescent bulbs used in streetlights are highly inefficient. They produce little light and much heat
from their significant power consumption. Also, they are often poorly designed and unnecessarily
disperse light in all directions, including the sky. New bulb technologies can significantly increase
their efficiency as well as extend their life. This recommendation aims to both assess current lighting
efficiency and upgrade where needed.
The upgrades deliver the same lighting levels using less energy and reduce carbon emissions and
operating costs. The increased life reduces maintenance and costs and interruptions to service, thus
improving public health and safety.
ATTRIBUTES
Energy-saving Potential
>200,000 kWh/year
First Cost
US$100,000–US$1,000,000
Speed of Implementation
1–2 years
Co-Benefits
Reduced carbon emissions
Enhanced public health & safety
Increased employment opportunities
Financial savings
Implementation Options
Activity Method
Self-implementation
The main costs related to upgrading streetlights are to replace the bulbs, the control system, and labor to
install the items. These expenses, along with consulting fees, are funded by the city, which means it receives all
the financial benefits but bears the financial risks.
ESCO upgrades
The city engages an ESCO to carry out the project, which can involve part and full ownership of the system and
translates into varying levels of benefits in terms of reducing risks, up-front capital costs, and financial savings
over the project’s life. Using local ESCOs helps streamline the process and makes the upgrade more feasible.
Similarly, having a local, credible, and independent measurement and verification agency minimizes contractual
disputes by verifying performance. See the Akola Street Lighting Case Study for details.
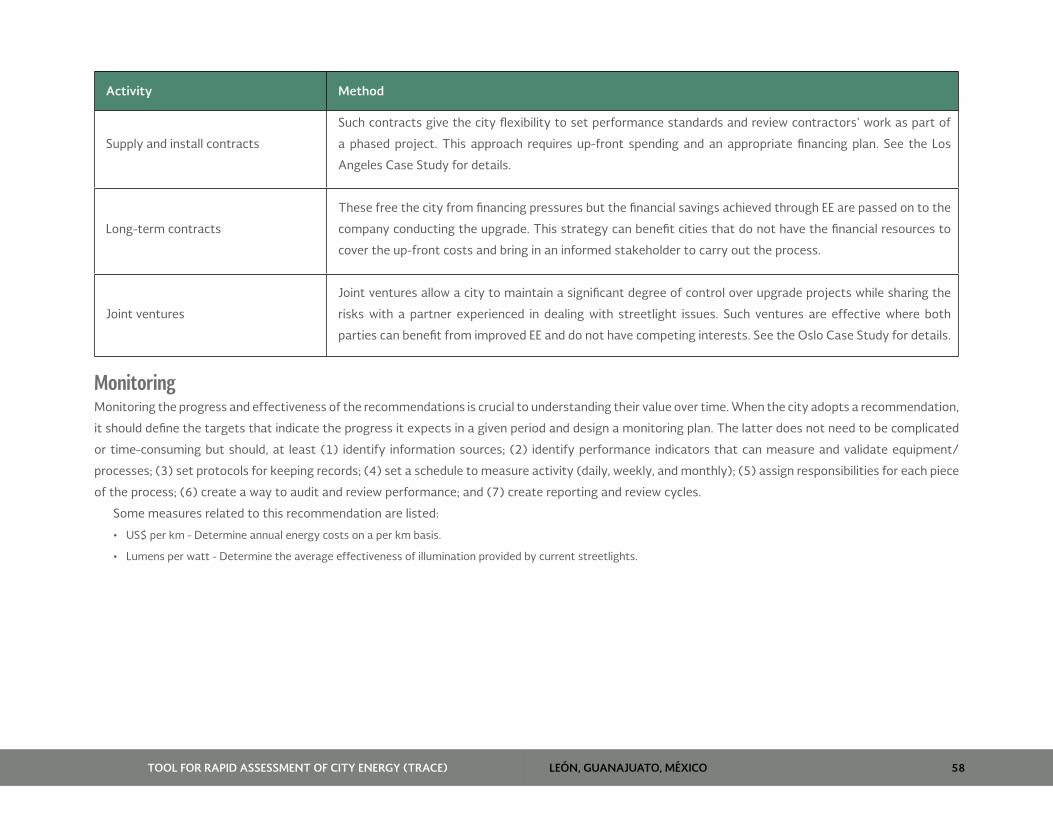
LEÓN, GUANAJUATO, MÉXICOTOOL FOR RAPID ASSESSMENT OF CITY ENERGY (TRACE) 58
Activity Method
Supply and install contracts
Such contracts give the city flexibility to set performance standards and review contractors’ work as part of
a phased project. This approach requires up-front spending and an appropriate financing plan. See the Los
Angeles Case Study for details.
Long-term contracts
These free the city from financing pressures but the financial savings achieved through EE are passed on to the
company conducting the upgrade. This strategy can benefit cities that do not have the financial resources to
cover the up-front costs and bring in an informed stakeholder to carry out the process.
Joint ventures
Joint ventures allow a city to maintain a significant degree of control over upgrade projects while sharing the
risks with a partner experienced in dealing with streetlight issues. Such ventures are effective where both
parties can benefit from improved EE and do not have competing interests. See the Oslo Case Study for details.
Monitoring Monitoring the progress and effectiveness of the recommendations is crucial to understanding their value over time. When the city adopts a recommendation,
it should define the targets that indicate the progress it expects in a given period and design a monitoring plan. The latter does not need to be complicated
or time-consuming but should, at least (1) identify information sources; (2) identify performance indicators that can measure and validate equipment/
processes; (3) set protocols for keeping records; (4) set a schedule to measure activity (daily, weekly, and monthly); (5) assign responsibilities for each piece
of the process; (6) create a way to audit and review performance; and (7) create reporting and review cycles.
Some measures related to this recommendation are listed:
• US$ per km - Determine annual energy costs on a per km basis.
• Lumens per watt - Determine the average effectiveness of illumination provided by current streetlights.

LEÓN, GUANAJUATO, MÉXICOTOOL FOR RAPID ASSESSMENT OF CITY ENERGY (TRACE) 59
Case Studies
ESCO streetlight retrofit, Akola, India
Source: ESMAP (Energy Sector Management Assistance Program). 2009. “Good Practices in City Energy Efficiency: Akola Municipal Corporation, India -
Performance Contracting for Street lighting Energy Efficiency.”
Akola contracted with an ESCO to replace over 11,500 streetlights (standard fluorescent, mercury vapor, and sodium vapor) with T5 fluorescent lamps.
The contractor, AEL, financed 100 percent of the investments, launched the project, maintained the new lights, and received part of the verified energy
savings to recover its investment. Under the contract, the city paid the ESCO 95 percent of the verified energy bill savings over the six-year period it was
in effect. It also paid AEL an annual fee to maintain the lamps and fixtures. Initial investments were about US$120,000 and the upgrade was completed
in three months. The project saved 56 percent in energy costs a year, which meant a total savings of US$133,000—a payback in less than 11 months!
Streetlight retrofits, Dobrich, Bulgaria
Source: http://www.eu-greenlight.org - Go to ‘Case Study’.
In 2000, Dobrich audited its entire streetlight system, which resulted in a project the next year to modernize it. Mercury bulbs were replaced with HPS
lamps and compact fluorescent lamps (a total of 6,450 EE lamps). The control system was also upgraded, and two electric meters were installed. These
measures delivered an illumination level of 95 percent and saved 2,819,640 kWh a year (€91,400 a year).
Street Lighting LED Replacement Program, City of Los Angeles, USA
Source: Clinton Climate Initiative, http://www.clintonfoundation.org/what-we-do/clinton-climate-initiative/i/cci-la-lighting.
This project, which involved a partnership between the Clinton Climate Initiative (CCI) and the city of Los Angeles, is the largest streetlight upgrade by
a city to date, replacing traditional lights with environmentally friend LEDs. It will reduce CO2 emissions by 40,500 tons and save US$10 million annually
through reduced maintenance costs and 40 percent reduced energy consumption.
The mayor and Bureau of Street Lighting collaborated with the CCI’s Outdoor Lighting Program to review the latest technology, financing strategies,
and public-private implementation models for LED upgrades. CCI’s analysis of models and technology, and its financial advice, were key sources for
developing this comprehensive plan.

LEÓN, GUANAJUATO, MÉXICOTOOL FOR RAPID ASSESSMENT OF CITY ENERGY (TRACE) 60
The project’s phased nature allowed the city to evaluate its approach each year, which gave it flexibility when selecting contractors and the lights to
be upgraded. It also capitalized on its status to attract financial institutions that would offer favorable loans and funding mechanisms since they wanted
to create positive relationships with the city. Thus, the city was able to create a well-developed business case for the project.
Lighting Retrofit, City of Oslo
Source: Clinton Climate Initiative, Climate Leadership Group, C40 Cities, http://www.c40cities.org/bestpractices/lighting/oslo_streetlight.jsp.
Oslo formed a joint venture with Hafslund ASA, the largest electricity distribution company in Norway. Old fixtures containing PCB and mercury were
replaced with high performance, HPS lights and an advanced data communication system was installed using power-line transmissions that reduced the
maintenance. They also installed ‘intelligent communication systems’ that dim lights when climate conditions and usage patterns permit, which reduced
energy use and increased the bulbs’ life, which also reduced maintenance (and related costs).
The system is fully equipped with all its components and is calibrated to correct some minor problems related to the communication units. Overall,
the system has performed well under normal operating conditions.
Tools & Guidance
European Lamp Companies Federation. ‘Saving Energy through Lighting’, A procurement guide for efficient lighting, including a chapter on street
lighting. http://buybright.elcfed.org/uploads/fmanager/saving_energy_through_lighting_jc.pdf.
Responsible Purchasing Network (2009). "Responsible Purchasing Guide LED Signs, Lights and Traffic Signals", A guidance document for maximizing
the benefits of upgrading exit signs, streetlights and traffic signals with high efficiency LED bulbs. http://www.seattle.gov/purchasing/pdf/
RPNLEDguide.pdf.
ESMAP Public Procurement of Energy Efficiency Services - Guide of good procurement practice from around the world. http://www.esmap.org/Public_
Procurement_of_Energy_Efficiency_Services.pdf.

LEÓN, GUANAJUATO, MÉXICOTOOL FOR RAPID ASSESSMENT OF CITY ENERGY (TRACE) 61
ANNEX 2: STREETLIGHT TIMING PROGRAM
Description Public lights usually only perform ‘on’ and ‘off’ functions and switch between these two settings in the
early evening and early morning. However, demand for light varies throughout the day, with periods
where little light is needed, such as in the middle of the night. A program with timers or dimmers
tailored to meet specific needs in different areas can significantly reduce energy consumption and yet
deliver appropriate levels of light that provide safety and a sense of security. These devices, called
‘intelligent monitoring systems’, can be used to adapt the levels of light according to weather and
activity levels. The recommendation involves identifying public space use patterns and adjusting the
lighting levels accordingly. Often, the timing programs are part of a full audit and upgrade program,
but for cities that already have energy-efficient public lights, a timing program may be a small but
effective measure.
Timing programs can reduce energy consumption, carbon emissions, and operating costs. They
also increase the light bulbs’ life, reduce maintenance and associated costs, and allow faults to be
detected quickly, which translates into quick replacement and overall improvement of the streetlight
service.
ATTRIBUTES
Energy-saving Potential
>200,000 kWh/year
First Cost
<US$100,000
Speed of Implementation
<1 year
Co-Benefits
Reduced carbon emissions
Enhanced public health & safety
Increased employment opportunities
Financial savings
Implementation Options
Activity Method
Determine timing needs and products Prepare a study to identify the types of streets and lights that would benefit from reduced timing and
dimming during late night hours.
Install timers and dimmers on existing lights Allocate funds to install dimming and timing equipment. Expand these upgrades over several years to
cover 100 percent of all streetlights. See the Kirklees and Oslo case studies for details.

LEÓN, GUANAJUATO, MÉXICOTOOL FOR RAPID ASSESSMENT OF CITY ENERGY (TRACE) 62
Activity Method
Set standards for new lights Create standards for new public lights that conform to global best practices for EE and Illuminating
Engineering Society of North America (IESNA) guidelines.
Monitor and publish energy savings Measure the energy saved each year by this program and encourage private owners to use the same
technology.
MonitoringMonitoring the progress and effectiveness of the recommendations is crucial to understanding their value over time. When the city adopts a recommendation,
it should define the targets that indicate the progress it expects in a given period and design a monitoring plan. The latter does not need to be complicated
or time consuming but should, at least (1) identify information sources; (2) identify performance indicators that can measure and validate equipment/
processes; (3) set protocols for keeping records; (4) set a schedule to measure activity (daily, weekly, and monthly); (5) assign responsibilities for each piece
of the process; (6) create a way to audit and review performance; and (7) create reporting and review cycles.
Some measures related to this recommendation are
• Define the hours each year that streetlights are illuminated at maximum output.
• Define the hours each year that streetlights are illuminated at less than 50 percent of maximum output.
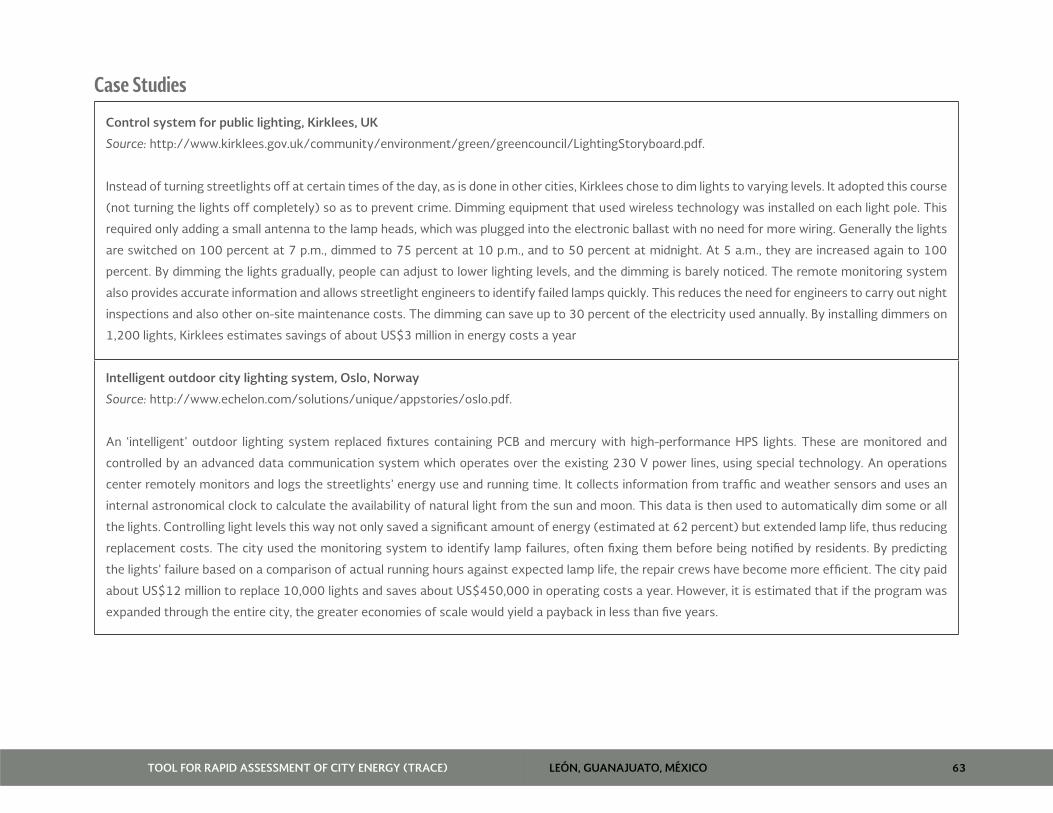
LEÓN, GUANAJUATO, MÉXICOTOOL FOR RAPID ASSESSMENT OF CITY ENERGY (TRACE) 63
Case Studies
Control system for public lighting, Kirklees, UK
Source: http://www.kirklees.gov.uk/community/environment/green/greencouncil/LightingStoryboard.pdf.
Instead of turning streetlights off at certain times of the day, as is done in other cities, Kirklees chose to dim lights to varying levels. It adopted this course
(not turning the lights off completely) so as to prevent crime. Dimming equipment that used wireless technology was installed on each light pole. This
required only adding a small antenna to the lamp heads, which was plugged into the electronic ballast with no need for more wiring. Generally the lights
are switched on 100 percent at 7 p.m., dimmed to 75 percent at 10 p.m., and to 50 percent at midnight. At 5 a.m., they are increased again to 100
percent. By dimming the lights gradually, people can adjust to lower lighting levels, and the dimming is barely noticed. The remote monitoring system
also provides accurate information and allows streetlight engineers to identify failed lamps quickly. This reduces the need for engineers to carry out night
inspections and also other on-site maintenance costs. The dimming can save up to 30 percent of the electricity used annually. By installing dimmers on
1,200 lights, Kirklees estimates savings of about US$3 million in energy costs a year
Intelligent outdoor city lighting system, Oslo, Norway
Source: http://www.echelon.com/solutions/unique/appstories/oslo.pdf.
An ‘intelligent’ outdoor lighting system replaced fixtures containing PCB and mercury with high-performance HPS lights. These are monitored and
controlled by an advanced data communication system which operates over the existing 230 V power lines, using special technology. An operations
center remotely monitors and logs the streetlights’ energy use and running time. It collects information from traffic and weather sensors and uses an
internal astronomical clock to calculate the availability of natural light from the sun and moon. This data is then used to automatically dim some or all
the lights. Controlling light levels this way not only saved a significant amount of energy (estimated at 62 percent) but extended lamp life, thus reducing
replacement costs. The city used the monitoring system to identify lamp failures, often fixing them before being notified by residents. By predicting
the lights’ failure based on a comparison of actual running hours against expected lamp life, the repair crews have become more efficient. The city paid
about US$12 million to replace 10,000 lights and saves about US$450,000 in operating costs a year. However, it is estimated that if the program was
expanded through the entire city, the greater economies of scale would yield a payback in less than five years.

LEÓN, GUANAJUATO, MÉXICOTOOL FOR RAPID ASSESSMENT OF CITY ENERGY (TRACE) 64
Motorway intelligent lights upgrade, Kuala Lumpur, Malaysia
Source: http://www.lighting.philips.com.my/v2/knowledge/case_studies-detail.jsp?id=159544.
The project introduced a lighting project for the highways leading to the Kuala Lumpur International Airport, which cover 66 km. The main requirement
was that each lamp should be dimmed independently from the others. This called for a network linking all 3,300 posts to a central control facility. Further,
maintenance needed to be more efficient and visibility needed to be set at levels that did not compromise vision. The project used tele-management
controls which made it possible to switch or control each light from a central point. It also allows the system to dim specific lights to levels that are
appropriate for road conditions, receive instant messages when lights fail, and create a database where all information is stored. The project significantly
reduced energy consumption besides the 45 percent saved due to the dimming circuits.
Tools & Guidance
Not applicable.
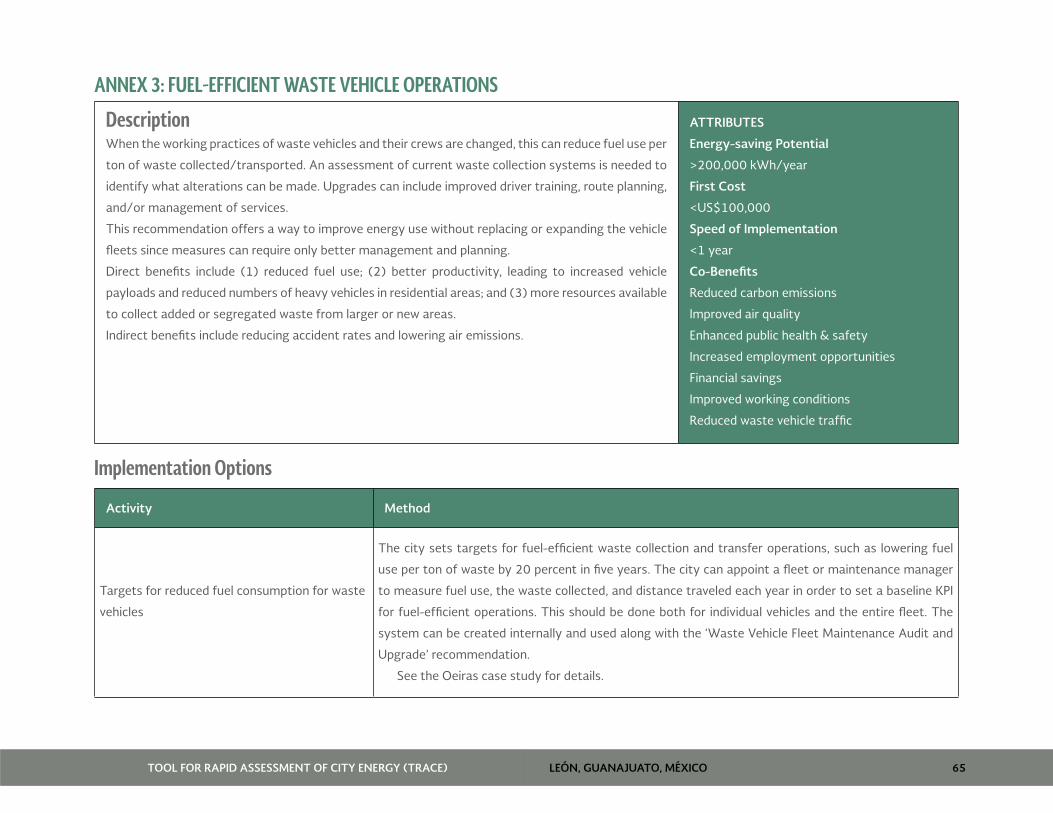
LEÓN, GUANAJUATO, MÉXICOTOOL FOR RAPID ASSESSMENT OF CITY ENERGY (TRACE) 65
ANNEX 3: FUEL-EFFICIENT WASTE VEHICLE OPERATIONS
Description When the working practices of waste vehicles and their crews are changed, this can reduce fuel use per
ton of waste collected/transported. An assessment of current waste collection systems is needed to
identify what alterations can be made. Upgrades can include improved driver training, route planning,
and/or management of services.
This recommendation offers a way to improve energy use without replacing or expanding the vehicle
fleets since measures can require only better management and planning.
Direct benefits include (1) reduced fuel use; (2) better productivity, leading to increased vehicle
payloads and reduced numbers of heavy vehicles in residential areas; and (3) more resources available
to collect added or segregated waste from larger or new areas.
Indirect benefits include reducing accident rates and lowering air emissions.
ATTRIBUTES
Energy-saving Potential
>200,000 kWh/year
First Cost
<US$100,000
Speed of Implementation
<1 year
Co-Benefits
Reduced carbon emissions
Improved air quality
Enhanced public health & safety
Increased employment opportunities
Financial savings
Improved working conditions
Reduced waste vehicle traffic
Implementation Options
Activity Method
Targets for reduced fuel consumption for waste
vehicles
The city sets targets for fuel-efficient waste collection and transfer operations, such as lowering fuel
use per ton of waste by 20 percent in five years. The city can appoint a fleet or maintenance manager
to measure fuel use, the waste collected, and distance traveled each year in order to set a baseline KPI
for fuel-efficient operations. This should be done both for individual vehicles and the entire fleet. The
system can be created internally and used along with the ‘Waste Vehicle Fleet Maintenance Audit and
Upgrade’ recommendation.
See the Oeiras case study for details.
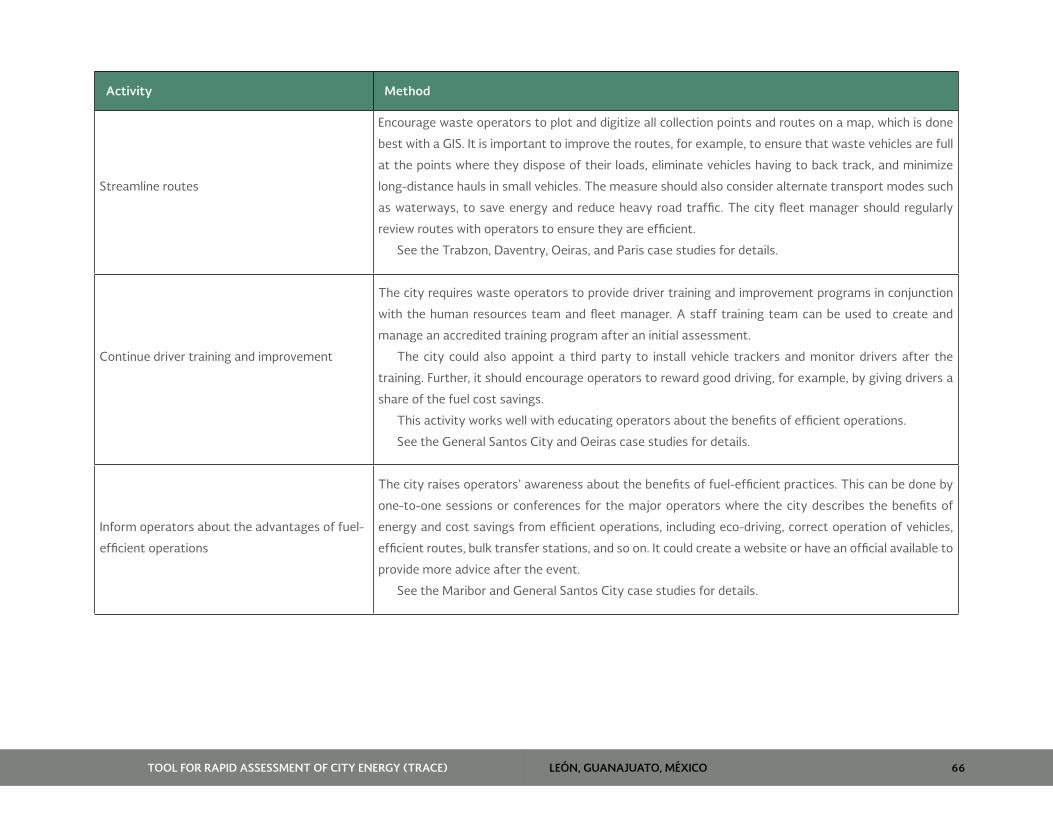
LEÓN, GUANAJUATO, MÉXICOTOOL FOR RAPID ASSESSMENT OF CITY ENERGY (TRACE) 66
Activity Method
Streamline routes
Encourage waste operators to plot and digitize all collection points and routes on a map, which is done
best with a GIS. It is important to improve the routes, for example, to ensure that waste vehicles are full
at the points where they dispose of their loads, eliminate vehicles having to back track, and minimize
long-distance hauls in small vehicles. The measure should also consider alternate transport modes such
as waterways, to save energy and reduce heavy road traffic. The city fleet manager should regularly
review routes with operators to ensure they are efficient.
See the Trabzon, Daventry, Oeiras, and Paris case studies for details.
Continue driver training and improvement
The city requires waste operators to provide driver training and improvement programs in conjunction
with the human resources team and fleet manager. A staff training team can be used to create and
manage an accredited training program after an initial assessment.
The city could also appoint a third party to install vehicle trackers and monitor drivers after the
training. Further, it should encourage operators to reward good driving, for example, by giving drivers a
share of the fuel cost savings.
This activity works well with educating operators about the benefits of efficient operations.
See the General Santos City and Oeiras case studies for details.
Inform operators about the advantages of fuel-
efficient operations
The city raises operators’ awareness about the benefits of fuel-efficient practices. This can be done by
one-to-one sessions or conferences for the major operators where the city describes the benefits of
energy and cost savings from efficient operations, including eco-driving, correct operation of vehicles,
efficient routes, bulk transfer stations, and so on. It could create a website or have an official available to
provide more advice after the event.
See the Maribor and General Santos City case studies for details.

LEÓN, GUANAJUATO, MÉXICOTOOL FOR RAPID ASSESSMENT OF CITY ENERGY (TRACE) 67
Activity Method
Waste charges
The city levies a charge on waste, for example, a gate fee or eco-tax for waste disposed at landfills. This
generates revenue that can be used to buy new equipment/infrastructure and cover the costs of a waste
monitoring/policing department. This activity could also be used to encourage operators to arrange
more efficient trips (for example, where trucks have full loads) to landfills.
See the Paris and Italian Local Authorities’ Waste Management case studies for details.
Monitoring Monitoring the progress and effectiveness of the recommendations is crucial to understanding their value over time. When the city adopts a recommendation,
it should define the targets that indicate the progress it expects in a given period and design a monitoring plan. The latter does not need to be complicated
or time consuming but should, at least (1) identify information sources; (2) identify performance indicators that can measure and validate equipment/
processes; (3) set protocols for keeping records; (4) set a schedule to measure activity (daily, weekly, monthly); (5) assign responsibilities for each piece of
the process; (6) create a way to audit and review performance; and (7) create reporting and review cycles.
Some measures related to this recommendation are listed:
• Calculate the original fuel use per ton of waste collected and transferred and per km travelled.
• Calculate the improved fuel use per ton of waste collected and transferred.
• Measure current performance using data from the maintenance department. If this information is not available, the city should measure current fleet performance over a
reasonable period, for example, reviewing performance annually, over five years.
• Produce monthly management targets and schedules to identify how the program is performing and the magnitude of effort that will be required to achieve the KPI.
LEÓN, GUANAJUATO, MÉXICOTOOL FOR RAPID ASSESSMENT OF CITY ENERGY (TRACE) 68
Case Studies
Energy Study on Oeiras’ Municipal Fleet, Oeiras, Portugal
Source: ManagEnergy. 2010. “Good Practice Case Study: Energy Study on Oeiras’ Municipal Fleet, Portugal.” http://www.managenergy.net/download/
nr263.pdf.
Oeiras partnered with the Technical University of Lisbon (IST) on a project to review the municipal fleet’s performance, which included waste collection
trucks. The objectives were to assess the fuel consumption by vehicle type, establish performance indicators (km/L), propose simple measures to
improve efficiency (eco-driving training), study the potential to switch fuels (biodiesel and natural gas), and perform an environmental assessment.
Lacking complete data, the project used refueling data and mileage records to estimate the fuel consumption of waste trucks and its impact on the city
budget. A more advanced fleet management system was planned for the later phases, using technologies supported by GPS to allow for better control
over fleet operations and improve the data. The project cost of US$45,384 was funded by the city budget.
By the end of 2006, OEINERGE (the project coordinator) estimated that processing used frying oils into biodiesel and utilizing it to fuel some of the
fleet’s waste trucks could reduce about 10 percent of the fossil fuel consumed. The project also informed the city about areas that could be better
managed and had an important role in disseminating best practices, stressing the importance of keeping accurate records and monitoring operations to
achieve fuel and cost savings.
Route Optimization for Solid Waste Collection, Trabzon City, Turkey
Source: Global NEST 2007. “Route Optimization for Solid Waste Collection: Trabzon (Turkey) Case Study.” http://journal.gnest.org/sites/default/
files/Journal%20Papers/6-11_APAYDIN_388_9-1.pdf.
As part of the municipal solid waste management system, a study was undertaken to determine if collection costs could be decreased by streamlining
the routes in Trabzon. Data related to present spending, truck type and capacity, solid waste production, and number of inhabitants and GPS receivers for
each route were collected and recorded (using GIS software) over 777 container location points. The collection/hauling processes were improved using
a shortest-path model with ‘Route View Pro’ software. Thus, fuel savings amounted to 24.7 percent in distance and 44.3 percent in time for collection
and hauling. Total costs were cut by 24.7 percent.
LEÓN, GUANAJUATO, MÉXICOTOOL FOR RAPID ASSESSMENT OF CITY ENERGY (TRACE) 69
MasterMap Integrated Transport Study, Daventry, United Kingdom
Source: Ordinance Survey 2010. “Optimizing waste collection using OS MasterMap Integrated Transport Network Layer Case study.” http://www.
ordnancesurvey.co.uk/business-and-government/case-studies/daventry-district-council-optimises-waste-collection-with-os-mastermap-itn.html.
Daventry local authority worked with the Northamptonshire Waste Partnership (NWP) to rationalize the number of domestic waste collection routes
from nine to eight, reducing diesel costs by 12 percent and increasing spare capacity by 14 percent without increasing labor hours. The project was
carried out by an external environmental advisory and management company using the OS MasterMap Integrated Transport Network (ITN) Layer with
Road Routing Information (RRI), which includes detailed road routing and driving information such as width, height, and weight restrictions, taking into
account the delays caused by left and right turns and intersections. This allowed each waste vehicle route to be improved and balanced the workload
between routes on a daily or on a weekly basis.
The system streamlined the waste collection procedures, which increased spare capacity that could be used later for areas experiencing new housing
growth. This, in turn, reduced the need for new routes. The project saved over US$154,136 a year for Daventry alone (which did not include savings by
nearby local authorities). Since the project was financed by regional public funds, the overall savings greatly exceed the cost of the contract and city
staff time.
Eco-driving Project, Maribor, Slovenia
Source: Recodrive 2009 Press Release, “Eco-driving leads to fuel savings in waste management in Maribor, Slovenia.” http://www.recodrive.eu/index.
phtml?id=1039&study_id=2596.
Maribor’s public waste collection, management, and transport company (Snaga) conducted a comprehensive 3-month training program for drivers to
adopt eco-driving. As part of the EU-wide ‘Rewarding and Recognition Schemes for Energy Conserving Driving, Vehicle Procurement and Maintenance’
(RECODRIVE) project, it reduced fuel consumption by an average of 4.27 percent over eight months. The savings were used to provide bonuses to fuel-
efficient drivers. Also, by changing its routes, Snaga collected the same amount of waste in the same area with one less vehicle.
The RECODRIVE project also involved disseminating information about fuel savings of over 10 percent in municipal fleets across Europe. Fleet owners
promoted the concept by inviting other firms to workshops and conferences on eco-driving and fuel-efficient vehicle operations. The scheme can be
adopted at the city level by waste management operators.

LEÓN, GUANAJUATO, MÉXICOTOOL FOR RAPID ASSESSMENT OF CITY ENERGY (TRACE) 70
Garbage Collection Efficiency Project, General Santos City, Philippines
Source: USAID. “Introducing Measures To Improve Garbage Collection Efficiency.” http://pdf.usaid.gov/pdf_docs/PNADB349.pdf.
USAID. “Moving Towards an Integrated Approach to Solid Waste Management.” http://pdf.usaid.gov/pdf_docs/PNADB344.pdf.
General Santos City Solid Waste Management Council organized workshops to create ways to make collection systems and management of dumpsites
more efficient. Formerly, collection was concentrated only in the central business district with no regular routes or schedules. With the help of
stakeholders, the city created schedules and routes and identified pre- and post-collection measures. Routes were modified to reduce the number of left
turns and U-turns to increase the speed of collection and reduce accidents. Also, the number of staff on each compactor truck was reduced from five
to a maximum of three, and waste collection trips were reduced from six to two or three a day. The new, efficient scheme allowed the trucks to cover a
wider area without increasing the number of trips, accelerated waste collection, and provided more time for vehicles to be maintained and allowed the
crews to rest. The scheme succeeded, given the high levels of community participation and coordination of working groups.
At the same time, campaigns were launched to promote recycling, the city improved the management of the dumpsite, and a new landfill is being
built.
Isseane EfW and Materials Recycling Facility, Paris, France
Source: The Chartered Institution of Waste Management. “Delivering key waste management infrastructure: lessons learned from Europe.” http://
www.wasteawareness.org/mediastore/FILES/12134.pdf.
The Associate Parliamentary Sustainable Research Group. “Waste Management Infrastructure: Incentivizing Community Buy-in.” http://www.
policyconnect.org.uk.
In 2008, the Isseane Energy from Waste (EfW) and Materials Recycling Facility was opened on the banks of the Seine by the Intercommunal Syndicate
for Treatment of Municipal Waste (SYCTOM) to replace an existing incinerator that had operated for over 40 years. The project was approved by the
municipal council of Issy-les-Moulineaux in July 2000 with an investment of US$686 million to be financed over seven years by a type of prudential
borrowing, based upon gate fee revenues from the communities.
Isseane was designed on the principle that waste should not need to be hauled more than six miles to be treated. The facility’s design also considered
traffic issues and approved a scheme where waste deliveries to the facility occur below ground, to control dust, noise, and odors. Also, its location makes
use of the Seine, with barges hauling away inert bottom ash from the incineration process for use in ancillary projects.
LEÓN, GUANAJUATO, MÉXICOTOOL FOR RAPID ASSESSMENT OF CITY ENERGY (TRACE) 71
Local Authorities’ Waste Management, Italy
Source: The Chartered Institution of Waste Management. “Delivering key waste management infrastructure: lessons learned from Europe.” http://
www.aikantechnology.com/fileadmin/user_upload/file_pdf/SLR-report-2005_Delivering_Key_Waste%20Management_Infrastructure.pdf.
Italy’s waste services are delivered through public bodies known as ‘ATOs’, which are funded by local authorities that are responsible for determining the
services needed to manage waste. While the infrastructure is often funded locally, for large facilities there may also be some private finance, through
a form of prudential borrowing. In some cases, the facilities or services may be procured through a tendering process from private companies, with
contracts either with a local authority or the ATO. An ATO can also partly or fully fund a waste infrastructure project through eco-taxes. For example,
the CONAI scheme raises US$324 million a year from an eco-tax on all packaging that sets aside funds for new infrastructure.
Tools & Guidance
"Integrated Toolbox for fleet operators." http://www.fleat-eu.org/downloads/fleat_wp3_d32_toolbox_updated.pdf.
"Policy mix for energy efficient fleet management." http://www.fleat-eu.org/downloads/fleat_wp3_d33_policymix_final.pdf.
RECODRIVE online knowledge hub. http://www.recodrive.eu/window.phtml?id=1008&folder_id=38.

LEÓN, GUANAJUATO, MÉXICOTOOL FOR RAPID ASSESSMENT OF CITY ENERGY (TRACE) 72
ANNEX 4: MUNICIPAL BUILDING BENCHMARKING PROGRAM
Description This recommendation is to develop a municipal building energy benchmarking program that collects
and reports annually on the energy use and costs, water use and costs, floor areas, and names of
building managers (if any). The goal is to identify the city’s most energy-intensive buildings so as to
develop the best EE opportunities. Also, it is to use the EE program resources most effectively and
spend time/money on the areas where EE can be most easily achieved. The program collects annual
data to measure the energy/carbon footprint for municipal operations.
This recommendation is best suited to larger cities with the size/capacity to conduct such a
program. A starting point is to routinely monitor and analyze building energy consumption and identify
ways to improve EE. However, good benchmarks require detailed analyses because similar buildings
can actually be very different, regarding types of tenants and occupancy density (people per m2).
ATTRIBUTES
Energy-saving Potential
100,000–200,000 kWh/year
First Cost
< US$100,000
Speed of Implementation
1–2 years
Co-Benefits
Reduced carbon emissions
Efficient water use
Improved air quality
Financial savings
Implementation Options
Activity Method
Appoint benchmarking staff
Appoint 1–2 staff or hire a consultant with the skills, experience, and personality needed to head the
program that is designed to gather a wide variety of data from many departments across the city
administration.
Identify benchmarking requirements
Define the information needed for an energy-benchmarking database. Besides electricity bills, other
important data include
• Building name and address;
• Electricity, gas, and water utility account numbers;

LEÓN, GUANAJUATO, MÉXICOTOOL FOR RAPID ASSESSMENT OF CITY ENERGY (TRACE) 73
Activity Method
• Electricity, gas, and water utility bills for the past three years;
• Building floor plans;
• Energy and water meter locations on the floors;
• The dates buildings were constructed and substantially renovated;
• The name of the building manager (if any); and
• Types of heating, cooling, and lighting systems.
Set data collection strategy
Create an efficient process to collect information for the database. Identify which departments and
individuals are likely to have access to this information. Define which data should be collected yearly
and create a method to receive it. Create a method to verify data and a period in which it should be
done. Some city departments may not collect the data; if so, the benchmarking team must collect it.
Begin collecting data
Appoint junior staff to begin the process of requesting, collecting, and checking data from the source.
Or, write a Request For Proposal (RFP) and award a contract to gather energy benchmarking data for
all municipal buildings, which can then be stored in spreadsheets or dedicated energy software tools.
The quality of the data must be checked to ensure its level of detail and accuracy.
Analyze and interpret data
Once it is determined that the data is accurate, the analyses should begin. These include the following:
• Compare kWh/m2/year electricity consumption by building type.
• Compare kWh/m2/year heating energy by building type.
• Compare total US$/m2/year energy consumption by building type.
Starting with buildings with the highest and lowest performance, verify the floor areas where utility
meters are located and note special conditions that may raise or lower energy use (server rooms,
unoccupied space, and renovations).

LEÓN, GUANAJUATO, MÉXICOTOOL FOR RAPID ASSESSMENT OF CITY ENERGY (TRACE) 74
Activity Method
Create a benchmark
The results of the analyses must be used to create a benchmark that considers the factors affecting
the city’s energy use. These factors may vary significantly from city to city and among different
buildings. They include
• Types of tenant;
• Occupancy density (persons/m2); and
• Building energy management.
This benchmarking is usually done in order to label buildings. See the Singapore case study for
details.
Publicize benchmarking findings internally
One of the most important ways to promote EE in building operations is peer pressure since no building
owner/operator wants to be seen as having the worst performing buildings. Thus, sharing data on
building energy intensity with other departments/operators will reduce energy use and encourage
them to share their experiences with others, city-wide.
Publish benchmarking publicly
The boldest action is to present energy performance data to the public, press, voters, and potential
political opponents. This last stage of the program may occur many years after it begins, when the
data shows that progress has been made to achieve efficient government operations. The city can
then challenge (or require, as some cities have begun to do) private building owners to benchmark
their properties and publish their findings.
Monitoring Monitoring the progress and effectiveness of recommendations is crucial to understand their value over time. Where the city authority (CA) adopts a
recommendation, it should define a target(s) that indicates the progress it expects in a given period and design a monitoring plan. The latter does not need
to be complicated or time consuming but should, at least (a) identify information sources; (b) identify performance indicators that can measure and validate
equipment/processes; (c) set protocols for keeping records; (d) set a schedule to measure activity (daily, weekly, monthly); (e) assign responsibilities for
each piece of the process; (f) create a way to audit and review performance; and (g) create reporting and review cycles.

LEÓN, GUANAJUATO, MÉXICOTOOL FOR RAPID ASSESSMENT OF CITY ENERGY (TRACE) 75
Some measures related to this recommendation are listed:
• kWhe/m2 - Determine annual electrical energy intensity by type of building (schools, offices, residences, hospitals, and so on).
• kWht/m2 - Determine annual heating energy intensity by building type.
• US$/m2 - Determine annual energy costs by building type.
Case Studies
Energy Efficiency in Public Buildings, Kiev, Ukraine
Source: ESMAP (2010). “Good Practices in City Energy Efficiency: Kiev, Ukraine - Energy Efficiency in Public Buildings.” Available online from http://
www.esmap.org/esmap/node/656.
Under the Kiev Public Buildings Energy Efficiency Project, 1,270 public buildings—including health facilities, schools, and cultural facilities—were
upgraded with cost-effective EE systems and equipment. The project focused on the supply side, such as automation and control systems, as well as the
demand side, by installing meters and weatherization, along with creating appropriate heating rates. The project was conducted by the Kiev City State
Administration (KCSA). Savings were estimated at 333,423 Gigacalories (Gcal) per year by 2006—normalized by degree/days in the baseline year—or
about a 26 percent savings compared to the buildings’ heat consumption before the project. These upgrades also improved the buildings’ comfort levels,
helped foster an EE services industry, and raised public awareness about the issues.
The project cost US$27.4 million and was financed through a World Bank loan, Swedish Government grant, and KCSA funds. Based on the project’s
success, many other Ukrainian cities have requested information and shown interest in launching similar programs.
Building Energy Efficiency Master Plan (BEEMP), Singapore
Source: http://www.esu.com.sg/pdf/research6_greece/Methodology_of_Building_Energy_Performance_Benchmarking.pdf.
http://www.bdg.nus.edu.sg/BuildingEnergy/energy_masterplan/index.html.
The Inter-Agency Committee on Energy Efficiency (IACEE) report presented key measures to improve the EE of the buildings, industries, and transport
sectors. The Building Energy Efficiency Master Plan (BEEMP), created by the Building & Construction Authority (BCA), describes the initiatives taken by

LEÓN, GUANAJUATO, MÉXICOTOOL FOR RAPID ASSESSMENT OF CITY ENERGY (TRACE) 76
the BCA to adopt the recommendations. The plan contains measures that span the whole life cycle of a building. It begins with a set of EE standards to
ensure buildings are designed right and continues with an energy management program to ensure they are operated efficiently throughout their life-
span. The BEEMP consists of the following programs:
• Review and update energy standards.
• Audit the energy use in selected buildings.
• Create energy efficiency indices (EEI) and performance benchmarks.
• Develop ways to better manage the energy use of public buildings.
• Insist on performance-based contracts.
• Conduct research and development.
Energy Smart Building Labeling Programme, Singapore
Source: http://www.e2singapore.gov.sg/buildings/energysmart-building-label.html.
The Energy Smart Building Labeling Program, developed by the Energy Sustainability Unit (ESU) of the National University of Singapore (NUS) and the
National Environment Agency (NEA), aims to promote EE and conservation by awarding owners of EE buildings with a label that recognizes this fact.
Authorities use the ‘Energy Smart Tool’, an online benchmarking system, to evaluate the energy performance of office buildings and hotels. The program
allows building owners to review their energy consumption patterns and compare them against industry norms. The Energy Smart Building Label is
reviewed every three years and is given at an annual awards ceremony. Besides reducing energy consumption and carbon emissions in the buildings
sector, the program does the following:
• Saves energy through enlightened energy management
• Brings higher satisfaction to occupants
• Enhances a company’s corporate image
LEÓN, GUANAJUATO, MÉXICOTOOL FOR RAPID ASSESSMENT OF CITY ENERGY (TRACE) 77
Municipal Energy Efficiency Network, Bulgaria
Source: http://www.munee.org/files/MEEIS.pdf.
Thirty-five Bulgarian cities created the Municipal Energy Efficiency Network (MEEN). ‘EnEffect’ is the Secretariat of the Network. Since April 2001, MEEN
has enrolled four municipal associations as members. To create a successful municipal energy plan, MEEN created an energy database and training
program for municipal officials. Information is collected and stored in municipal ‘passports’ through surveys of organizations and entered into a database,
or EE information system (EEIS), which includes an analysis. The database, a Microsoft Access application, contains objective, technical information,
and the analysis includes non-technical information, such as financial, institutional, and regulatory documents generated at the national level. This
information is organized into three categories: city-wide consumption, site-specific consumption, and city-wide production.
Energy Management Systems in Public Building, Lviv, Ukraine
Source: ESMAP (2011). “Good Practices in City Energy Efficiency: Lviv, Ukraine - Energy Management Systems in Public Buildings.” Available online from
http://www.esmap.org/esmap/sites/esmap.org/files/Lviv%20Buildings%20Case%20final%20edited%20042611_0.pdf.
Lviv reduced its annual energy consumption in its public buildings by about 10 percent and tap water consumption by about 12 percent through a
monitoring and targeting (M&T) program. The program was launched in December 2006 and was operating fully by May 2007. By 2010, it produced
net savings of UAH 9.5 million (US$1.2 million). It provided the city with monthly consumption data for district heating, natural gas, electricity, and
water in all of the city’s 530 public buildings. Utility use is reported and analyzed each month and the targets for monthly consumption are determined
annually, based on historical patterns and negotiated when these are expected to change. Actual consumption is reviewed monthly against the target,
with deviations spotted and acted upon immediately and the buildings’ performance is presented to the public.
The M&T program was able to reap significant savings with minimal investment and recurring costs. The utility bill reductions were very helpful, given
fiscal constraints and rising energy prices. The program was helped by the fact that most of the public buildings already had water and energy meters
and the city had been collaborating with international aid programs in municipal energy since the late 1990s. Also, it was due to a strong, committed
city government: The city created an energy management unit (EMU) and provided resources to train all personnel responsible for building utility use.
The M&T system established responsibility, created transparency, and laid the groundwork for sustained improvements in energy and water efficiency.

LEÓN, GUANAJUATO, MÉXICOTOOL FOR RAPID ASSESSMENT OF CITY ENERGY (TRACE) 78
Public Building Energy Management Program, Lviv, Ukraine
Source: http://www.ecobuild-project.org/docs/ws2-kopets.pdf.
As part of the Energy Efficiency Cities of Ukraine initiative, launched in 2007 in four cities, supported by MHME, NAER, and the European Association of
local authorities ‘Energie-Cites’, Lviv promoted a sustainable energy policy and action plans at the local level through a Public Building Energy Management
Program. This involves various agencies regularly gathering data about energy consumption that is then monitored and analyzed so as to identify easily
achievable improvements.
SMEU Software, Romania
Source: http://www.munee.org/files/SMEU-romania.pdf.
The SMEU software was created to set priorities for municipal energy action plans and assess global energy costs and consumption. The software is
applied to gather energy data so decision-makers can analyze consumers’ energy use and predict the energy budget for the following period.
The software divides data into individual and (interacting) modules The city collects information on an annual basis, which lists the area being studied,
population, average temperatures, number of buildings, and number of dwellings in each area.
Tools & Guidance
Target Finder helps users establish an energy performance target for design projects and major building renovations. http://www.energystar.gov/
index.cfm?c=new_bldg_design.bus_target_finder.
Portfolio Manager is an interactive energy management tool to track and assess energy and water consumption across the entire portfolio of
buildings. http://www.energystar.gov/index.cfm?c=evaluate_performance.bus_portfoliomanager.
A presentation by Berlin Energy Agency on Berlin's Energy Saving Partnership - "a Model of Success", June 29, 2010. http://siteresources.worldbank.
org/INTRUSSIANFEDERATION/Resources/305499-1280310219472/CArce_BEA_ENG.pdf.

LEÓN, GUANAJUATO, MÉXICOTOOL FOR RAPID ASSESSMENT OF CITY ENERGY (TRACE) 79
ANNEX 5: MUNICIPAL BUILDINGS’ AUDITS AND UPGRADES
Description This recommendation involves developing a program to audit buildings and explore opportunities for
EE upgrades. Once introduced, it would reduce a city’s energy costs for its offices and lower its carbon
footprint. The program will identify and introduce immediate payback items from which the savings
can be used to fund other municipal services.
ATTRIBUTES
Energy-saving Potential
>200,000 kWh/year
First Cost
>US$1,000,000
Speed of Implementation
1–2 years
Co-Benefits
Reduced carbon emissions
Improved air quality
Enhanced public health & safety
Increased employment opportunities
Financial savings
Implementation Options
Activity Method
Appoint a program head Identify an existing staff or hire a new person to head EE projects in municipal office buildings. He/she
must be able to work across agencies, understand building systems, and manage subcontractors.
Identify preliminary EE projects
With results from the benchmarking program or new data on office buildings collected by staff, identify
preliminary opportunities for EE such as new lighting/air conditioning/heating systems, new computers,
and server cooling opportunities.
Some buildings are more complex and have various types of systems, for example, some may have
simple air conditioning window units, while others may have central air conditioning systems with
chillers, cooling towers, air handlers, and ductwork.
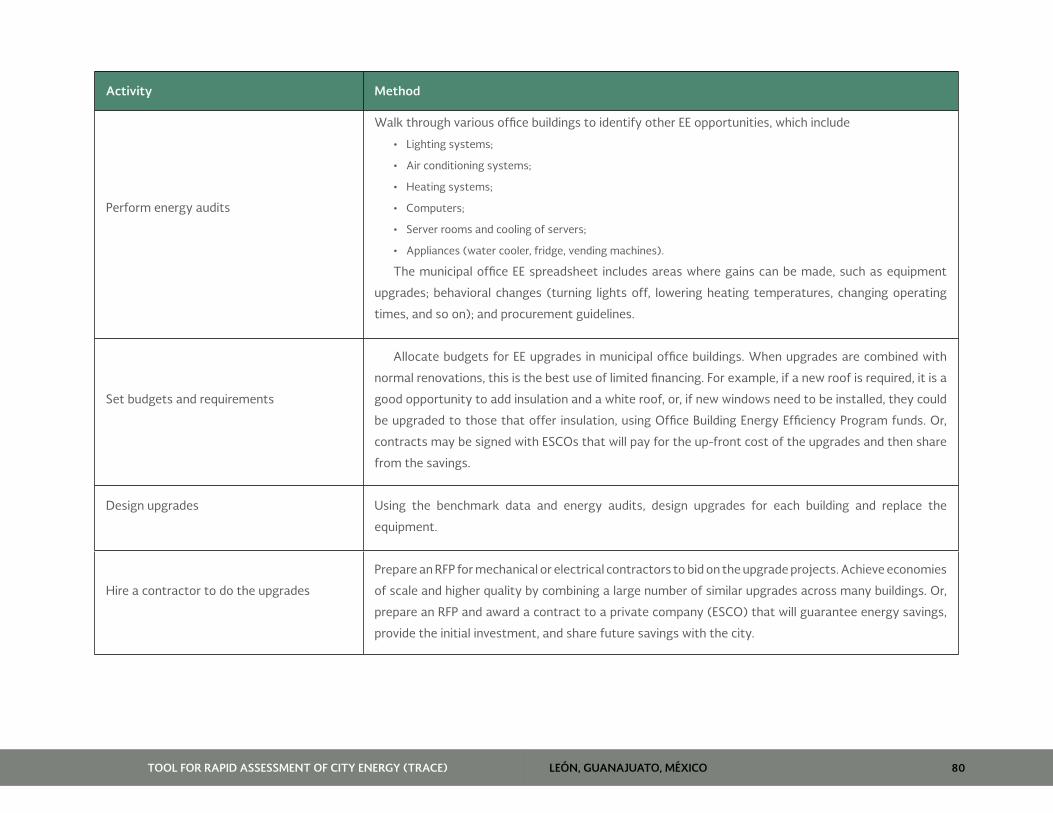
LEÓN, GUANAJUATO, MÉXICOTOOL FOR RAPID ASSESSMENT OF CITY ENERGY (TRACE) 80
Activity Method
Perform energy audits
Walk through various office buildings to identify other EE opportunities, which include
• Lighting systems;
• Air conditioning systems;
• Heating systems;
• Computers;
• Server rooms and cooling of servers;
• Appliances (water cooler, fridge, vending machines).
The municipal office EE spreadsheet includes areas where gains can be made, such as equipment
upgrades; behavioral changes (turning lights off, lowering heating temperatures, changing operating
times, and so on); and procurement guidelines.
Set budgets and requirements
Allocate budgets for EE upgrades in municipal office buildings. When upgrades are combined with
normal renovations, this is the best use of limited financing. For example, if a new roof is required, it is a
good opportunity to add insulation and a white roof, or, if new windows need to be installed, they could
be upgraded to those that offer insulation, using Office Building Energy Efficiency Program funds. Or,
contracts may be signed with ESCOs that will pay for the up-front cost of the upgrades and then share
from the savings.
Design upgrades Using the benchmark data and energy audits, design upgrades for each building and replace the
equipment.
Hire a contractor to do the upgrades
Prepare an RFP for mechanical or electrical contractors to bid on the upgrade projects. Achieve economies
of scale and higher quality by combining a large number of similar upgrades across many buildings. Or,
prepare an RFP and award a contract to a private company (ESCO) that will guarantee energy savings,
provide the initial investment, and share future savings with the city.

LEÓN, GUANAJUATO, MÉXICOTOOL FOR RAPID ASSESSMENT OF CITY ENERGY (TRACE) 81
Activity Method
Verify upgrades and performance
Walk through the building and verify that each construction project has been completed according to
the EE upgrade specifications. Continue collecting electricity and heating bills for each upgraded building
to compare them with historical data.
Monitoring Monitoring the progress and effectiveness of recommendations is crucial to understand their value over time. When the city adopts a recommendation, it
should define a target(s) that indicates the progress it expects in a given period and design a monitoring plan. The latter does not need to be complicated
or time consuming but should, at least (a) identify information sources; (b) identify performance indicators that can measure and validate equipment/
processes; (c) set protocols for keeping records; (d) set a schedule to measure activity (daily, weekly, monthly); (e) assign responsibilities for each piece of
the process; (f) create a way to audit and review performance; and (g) create reporting and review cycles.
Some measures related to this recommendation are listed:
• US$/m2 - Determine annual energy costs on a per-m2 basis for all municipal office buildings.
• kWhe/m2 - Determine annual electrical energy consumption on a per-m2 basis for all municipal office buildings.
• kWht/m2 - Determine annual heating energy consumption on a per-m2 basis for all municipal office buildings.
• US$/year saved - Aggregate total energy savings generated through the life of the program.
Case Studies
Model for Improving Energy Efficiency in Buildings, Berlin, Germany
Source: http://www.c40cities.org/bestpractices/buildings/berlin_efficiency.jsp.
Berlin, in partnership with the Berlin Energy Agency (BEA), pioneered an excellent model to improve EE in its buildings. Together they managed the
upgrade of public and private buildings, preparing tenders for work that is guaranteed to reduce emissions. The tenders require the ESCOs that win the
contracts to reduce CO2 emissions by an average of 26 percent. To date, 1,400 buildings have been upgraded, reducing CO2 emissions by 60,400 tons a
year. These upgrades cost the building owners nothing and savings were almost immediate.

LEÓN, GUANAJUATO, MÉXICOTOOL FOR RAPID ASSESSMENT OF CITY ENERGY (TRACE) 82
Internal Contracting, Stuttgart, Germany
Source: http://www.c40cities.org/bestpractices/buildings/stuttgart_efficiency.jsp.
Stuttgart reduces its CO2 emissions each year by about 7,200 tons through an innovative form of internal contracting, making use of a revolving fund
to finance energy- and water-saving measures. The city then reinvests the savings into new activities, creating a cycle of environmental improvements
and reduced emissions.
EU and Display Campaign Case Studies
Source: http://www.display-campaign.org/page_162.html.
The European Display Campaign is a voluntary scheme designed by energy experts from European towns and cities. When it began in 2003, it aimed
to encourage local authorities to publicly display the energy and environmental performances of city buildings—adopting the same energy label that is
used for household appliances. Since 2008, private companies have also been encouraged to use the ‘display’ for their corporate social responsibilities.
Tools & Guidance
EU LOCAL ENERGY ACTION Good practices 2005 - Brochure of good practice examples from energy agencies across Europe. http://www.
managenergy.net/download/gp2005.pdf.
ESMAP Public Procurement of Energy Efficiency Services - Guide of good procurement practice from around the world. http://www.esmap.org/Public_
Procurement_of_Energy_Efficiency_Services.pdf.
Energy Conservation Buildings Code provides minimum requirements for the energy efficient design and construction of buildings and their systems.
http://www.emt-india.net/ECBC/ECBC-UserGuide/ECBC-UserGuide.pdf.
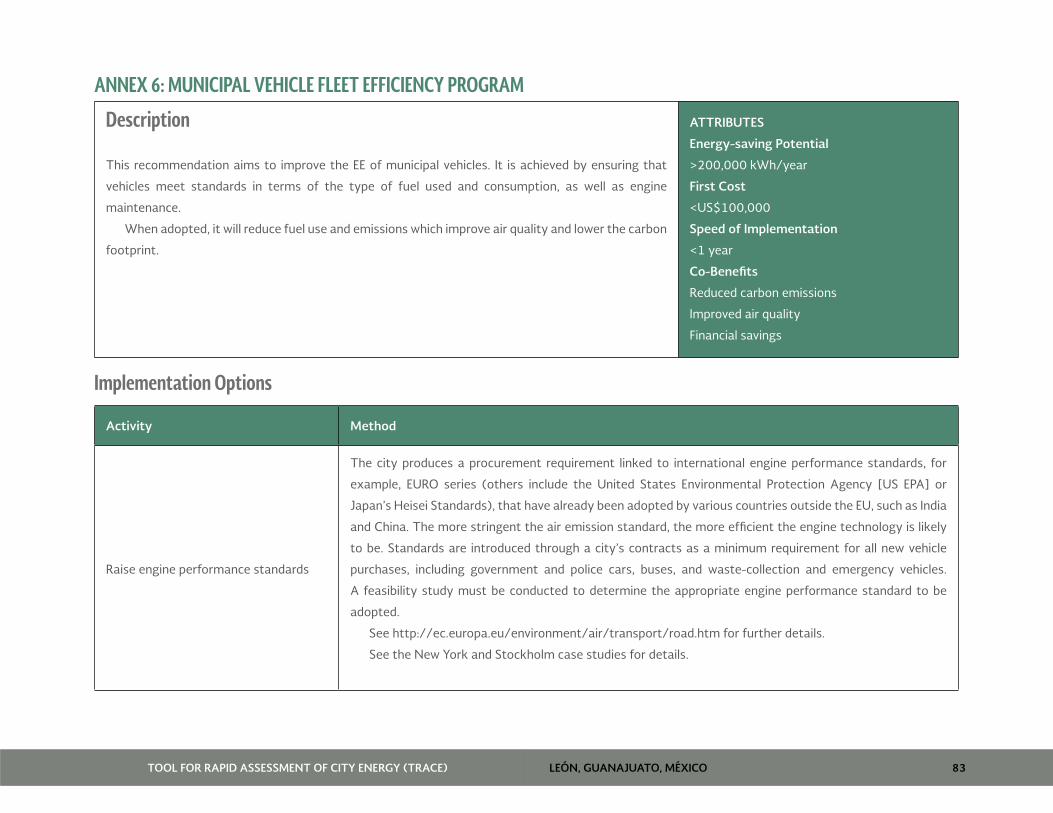
LEÓN, GUANAJUATO, MÉXICOTOOL FOR RAPID ASSESSMENT OF CITY ENERGY (TRACE) 83
ANNEX 6: MUNICIPAL VEHICLE FLEET EFFICIENCY PROGRAM
Description
This recommendation aims to improve the EE of municipal vehicles. It is achieved by ensuring that
vehicles meet standards in terms of the type of fuel used and consumption, as well as engine
maintenance.
When adopted, it will reduce fuel use and emissions which improve air quality and lower the carbon
footprint.
ATTRIBUTES
Energy-saving Potential
>200,000 kWh/year
First Cost
<US$100,000
Speed of Implementation
<1 year
Co-Benefits
Reduced carbon emissions
Improved air quality
Financial savings
Implementation Options
Activity Method
Raise engine performance standards
The city produces a procurement requirement linked to international engine performance standards, for
example, EURO series (others include the United States Environmental Protection Agency [US EPA] or
Japan’s Heisei Standards), that have already been adopted by various countries outside the EU, such as India
and China. The more stringent the air emission standard, the more efficient the engine technology is likely
to be. Standards are introduced through a city’s contracts as a minimum requirement for all new vehicle
purchases, including government and police cars, buses, and waste-collection and emergency vehicles.
A feasibility study must be conducted to determine the appropriate engine performance standard to be
adopted.
See http://ec.europa.eu/environment/air/transport/road.htm for further details.
See the New York and Stockholm case studies for details.

LEÓN, GUANAJUATO, MÉXICOTOOL FOR RAPID ASSESSMENT OF CITY ENERGY (TRACE) 84
Activity Method
Set maintenance standards
City transportation departments set regular preventative maintenance standards for vehicles owned by
contractors. For example,
• Once a week or at each fill-up, the oil, water, wiper fluid, engine coolant/antifreeze level, and tire conditions/
pressure should be checked.
• Once a month, the transmission, power steering and brake fluids, the windshield wiper blades, the belts, hoses, and
battery cables should be checked.
• Every six months or 6,000 miles, the brakes, the clutch on manual transmissions, and chassis lubrication should be
checked and tires should be inspected or rotated.
• Once a year, underbody flushing should be performed and the engine cooling system should be serviced (which
should include inspecting the radiator, water pump, fan belt, thermostat(s), radiator cap, and antifreeze). Also, the
accelerator control system should be checked and the doors, locks, hinges, and parking brake should be lubricated.
• At 15,000 miles, the automatic transmission should be inspected and the transmission fluid and filter should be
changed.
• At 30,000 miles, the spark plugs and fuel filter should be changed, and the spark plug wire and engine timing should
be checked.
Source: http://www.gmfleet.com/government/maintenance-info/maintenanceSchedule.jsp.
The city should define a maintenance program that suits their fleet profile and ensure that city-owned
vehicles are operating at desired performance levels. Maintenance requirements can be extended to taxis
and buses, although these can be voluntary where the vehicles are not city-owned. Municipal compliance
with the objective should be made public to demonstrate leadership by example.
See the Jakarta case study for further details.
Contingent contracts
If the municipal fleet is subcontracted to different operators, contracts can be made contingent upon the
use of vehicle standards with specific minimum fuel use and performance levels set by the city.
See the Copenhagen case study for details.

LEÓN, GUANAJUATO, MÉXICOTOOL FOR RAPID ASSESSMENT OF CITY ENERGY (TRACE) 85
Monitoring Monitoring the progress and effectiveness of recommendations is crucial to understand their value over time. Where the CA adopts a recommendation, it
should define a target(s) that indicates the progress it expects in a given period and design a monitoring plan. The latter does not need to be complicated
or time consuming but should, at least (a) identify information sources; (b) identify performance indicators that can measure and validate equipment/
processes; (c) set protocols for keeping records; (d) set a schedule to measure activity (daily, weekly, monthly); (e) assign responsibilities for each piece of
the process; (f) create a way to audit and review performance; and (g) create reporting and review cycles.
Some measures related to this recommendation are listed:
• Determine KPIs: Check vehicle fleet fuel consumption records, emission test records, and number of maintenance checks undertaken.
• Survey baseline performance (fuel consumption).
• Survey ongoing performance on fuel consumed per vehicle-mile.
Case Studies
NYPD hybrid vehicle program, New York, USA
Source: NYPD press release 2009–14. http://www.nyc.gov/html/nypd/html/pr/pr_2009_014.shtml.
The mayor introduced hybrid autos for the fleet of police cars. Each vehicle produces 25–30 percent lower CO2 emissions compared to conventional
fuel-powered models and averages twice the distance per gallon for city driving. At a cost of US$25,391 per vehicle, the payback period for the capital
investment was just over one year. To maximize their economic and environmental benefits, the vehicles were assigned to precincts that cover large
areas and where there is a great deal of traffic.
Clean Vehicles Program, Stockholm, Sweden
Source: http://www.c40cities.org/bestpractices/transport/stockholm_vehicles.jsp.
http://www.managenergy.net/products/R1375.htm.
As of the end of 2010, all new municipal cars, buses, and heavy trucks are required to operate on biofuels or at a high emission standard. The new
standard is applied when old vehicles are replaced. To reduce the cost of the new electric vehicles, the city procured them with other cities (lowering unit
costs) and also encouraged local production of biogas.

LEÓN, GUANAJUATO, MÉXICOTOOL FOR RAPID ASSESSMENT OF CITY ENERGY (TRACE) 86
Bus inspection and maintenance program, Jakarta, Indonesia
Source: http://www.unep.org/pcfv/pcfvnewsletter/2009Issue2/Retrofit.pdf.
To reduce emissions from the city bus fleet, nine bus companies developed their own internal inspection and maintenance programs that checked for
engine malfunctions and excessive smoke and measured the exhaust. They were successful because they introduced an extensive education program to
raise technicians’ and drivers’ awareness about the environment and safe and fuel-saving driving practices. Also, they offered technical training on how
to conduct a proper inspection and maintenance program.
Altogether, over 13,000 buses were tested in 2001–2002, and 89 technicians and 1,372 drivers were trained. Through the inspections, the companies
learned that certain problems could be easily fixed: cleaning air filters, adjusting fuel injection timing and injection nozzle pressure, and calibrating the
fuel injection pump. In some cases, air filters and fuel injection nozzles had to be replaced.
The regular maintenance reduced diesel soot by 30 percent and fuel consumption by 5 percent. The improved driving methods reduced consumption
by another 10 percent. About a third of the vehicles failed the inspection but over 80 percent could be repaired with minor costs. The inspection test
in Jakarta, which was free, checked acceleration emissions to measure the smoke produced, which is a simple procedure that indicates gross engine
malfunction.
The Jakarta program started with just two bus companies on a voluntary basis but, by the end of the program, grew to nine, as the economic benefits
of inspection and maintenance became more apparent.
Contracted bus fleet, Copenhagen, Denmark
Source: http://www.kk.dk/sitecore/content/Subsites/Klima/SubsiteFrontpage/.
As part of the Copenhagen Climate Plan, the Copenhagen City Authority (CCA) contracted with bus companies contingent on their reducing CO2
emissions by 25 percent. The CCA does not require a particular technical solution, for example, procurement of hybrid busses, but instead taps into
national government funds available until 2012 to pilot test various energy efficient transport solutions (including improving the buses’ EE). The CCA
sought cooperation with neighboring cities to launch a trial project that involved energy efficient buses.

LEÓN, GUANAJUATO, MÉXICOTOOL FOR RAPID ASSESSMENT OF CITY ENERGY (TRACE) 87
Tools & Guidance
UNEP. 2009. "UNEP/TNT Toolkit for Clean Fleet Strategy Development." A step-by-step toolkit with guidelines and calculators to develop a strategy
for reducing the environmental impacts of a fleet. This includes measures which improve fuel and performance efficiency of the fleet. http://www.
unep.org/tnt-unep/toolkit/index.html.
Energy Trust. 2009. "Grey Fleet guidance." A guidance document which provides an overview for reducing the impact of a City Authority's grey fleet
(privately owned vehicles used by employees on CA business). http://www.energysavingtrust.org.uk/business/Global-Data/Publications/Transport-
Advice-E-bulletin-October-09-Focus-on-grey-fleet.
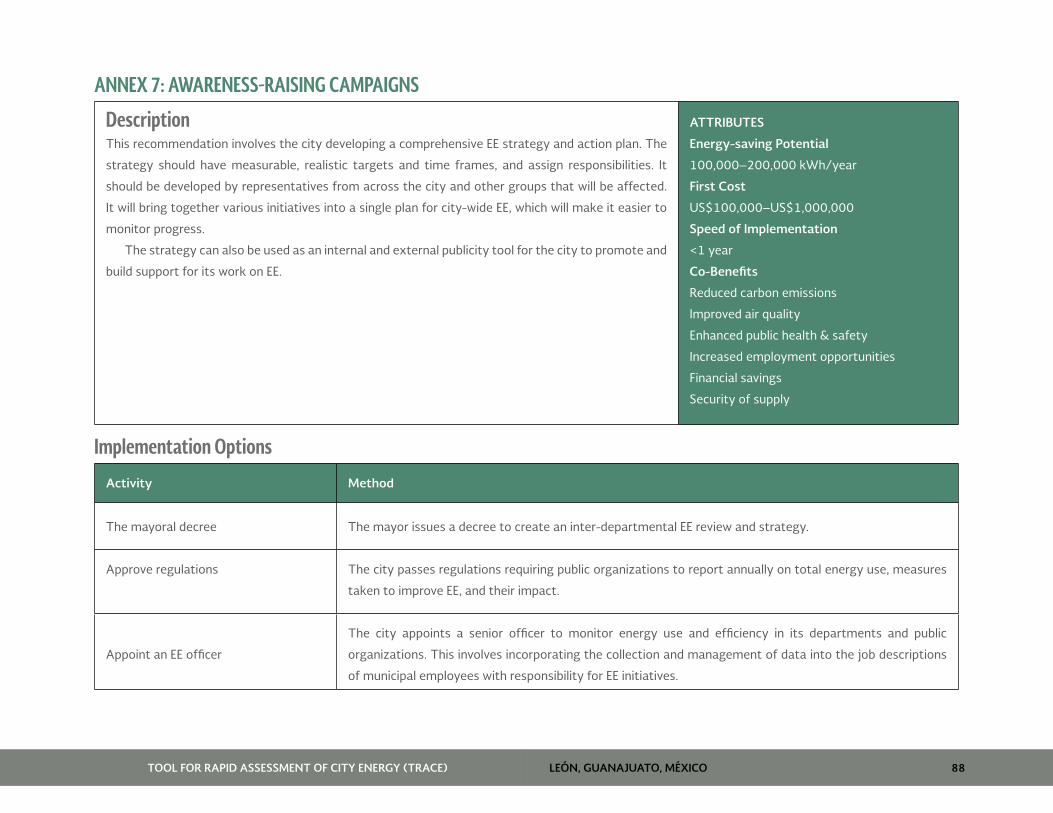
LEÓN, GUANAJUATO, MÉXICOTOOL FOR RAPID ASSESSMENT OF CITY ENERGY (TRACE) 88
ANNEX 7: AWARENESS-RAISING CAMPAIGNS
Description This recommendation involves the city developing a comprehensive EE strategy and action plan. The
strategy should have measurable, realistic targets and time frames, and assign responsibilities. It
should be developed by representatives from across the city and other groups that will be affected.
It will bring together various initiatives into a single plan for city-wide EE, which will make it easier to
monitor progress.
The strategy can also be used as an internal and external publicity tool for the city to promote and
build support for its work on EE.
ATTRIBUTES
Energy-saving Potential
100,000–200,000 kWh/year
First Cost
US$100,000–US$1,000,000
Speed of Implementation
<1 year
Co-Benefits
Reduced carbon emissions
Improved air quality
Enhanced public health & safety
Increased employment opportunities
Financial savings
Security of supply
Implementation Options
Activity Method
The mayoral decree The mayor issues a decree to create an inter-departmental EE review and strategy.
Approve regulations The city passes regulations requiring public organizations to report annually on total energy use, measures
taken to improve EE, and their impact.
Appoint an EE officer
The city appoints a senior officer to monitor energy use and efficiency in its departments and public
organizations. This involves incorporating the collection and management of data into the job descriptions
of municipal employees with responsibility for EE initiatives.

LEÓN, GUANAJUATO, MÉXICOTOOL FOR RAPID ASSESSMENT OF CITY ENERGY (TRACE) 89
Monitoring
Monitoring the progress and effectiveness of recommendations is crucial to understand their value over time. Where the CA adopts a recommendation, it
should define a target(s) that indicates the progress it expects in a given period and design a monitoring plan. The latter does not need to be complicated
or time consuming but should, at least (a) identify information sources; (b) identify performance indicators that can measure and validate equipment/
processes,; (c) set protocols for keeping records; (d) set a schedule to measure activity (daily, weekly, monthly); (e) assign responsibilities for each piece of
the process; (f) create a way to audit and review performance; and (g) create reporting and review cycles.
Some measures related to this recommendation are listed:
• Determine the city’s total energy use, savings achieved from EE initiatives; and the percentage of these initiatives for which data is collected yearly.
• Set targets for the city for each KPI, for example, improve KPI performance by 20 percent in five years. Produce annual reports on progress toward the targets.
• Monitor and update the action plan regularly.
Case Studies
Municipal Initiatives to address Climate Change, Bridgeport, Connecticut, USA
Source: Connecticut General Assembly. “Municipal Initiatives to address Climate Change.” http://www.cga.ct.gov/2010/rpt/2010-R-0300.htm.
Regional Plan Association, Copy of Mayor’s Executive Order. http://www.rpa.org/bgreen/BGreen_2020_Executive_Order.pdf.
Regional Plan Association, “BGreen 2020: A Sustainability Plan for Bridgeport, Connecticut.” http://www.rpa.org/bgreen/BGreen-2020.pdf.
In 2008, the mayor issued an executive order that established a goal for the city to reduce its annual GHG emissions from a 1990 baseline by 7 percent by
2012 and 20 percent by 2020, according to its Plan of Conservation and Development. To meet this goal, the order required the city to obtain at least 25
percent of its electricity from renewable resources by 2012 and for all new major city construction and renovation projects to earn at least a silver rating
under the Leadership in Energy and Environmental Design (LEED) program, or its equivalent under similar rating systems.
The order established a Sustainability Community Advisory Committee charged with
• Overseeing the completion of a city-wide and municipal government GHG inventory;
• Recommending actions to the city for meeting its sustainability goals;
• Preparing educational materials for households and businesses that describe climate change and actions they can take to promote sustainability; and
• Identifying economic and workforce development opportunities associated with green jobs.

LEÓN, GUANAJUATO, MÉXICOTOOL FOR RAPID ASSESSMENT OF CITY ENERGY (TRACE) 90
Collaborating with the Bridgeport Regional Business Council, the city developed a program to promote sustainability. It includes measures for auditing
energy use, reducing total building footprints, using advanced waste treatment techniques, and analyzing the feasibility of installing renewable energy
systems in public and private buildings.
Since the order was issued, the city and Regional Business Council also developed a comprehensive sustainability plan, BGreen 2020. It was developed
following an 18-month planning process with a Community Advisory Committee and five technical subcommittees. The process involved over 200
participants from city, state, and federal governments; businesses; and civic and neighborhood groups. The plan is a comprehensive strategy to improve
the quality of life, social equity, and economic competitiveness while reducing GHG emissions and increasing the community’s resilience to the impacts of
climate change.
Energy Efficiency Strategy, Spain
Source: European Commission - Saving & Energy Efficiency Strategy in Spain. http://ec.europa.eu/energy/demand/legislation/doc/neeap/es_neeap_
en.pdf.
Evaluate Energy Savings. http://www.evaluate-energy-savings.eu/emeees/en/countries/Spain/index.php.
Spain’s Energy Saving and Energy Efficiency Strategy 2008–2012 (E4), which constitutes its National Energy Efficiency Action Plan (NEEAP), aims to
achieve security of supply in terms of quantity and price with some basic levels of self-sufficiency, taking into consideration the environmental impact and
economic competitiveness.
The plan identifies seven sectors including agriculture, buildings, domestic and office equipment, industry, public services, transport, and energy
transformation. In each, it presents strategic objectives as well as the course the energy policy should take to achieve them. The plan establishes a primary
energy saving of 24,776 ktoe in 2012 as a quantified energy objective as opposed to the scenario used as the base for the initial Plan 2004–2012,
involving 13.7 percent. The plan also monitors progress against previous action plans, identifies investments and the potential for improving each sector,
and sets targets for the immediate future.
The financing is done through investments in the private sector and public services, the costs of which are passed on to consumers and employers, who
make investments that improve the processes or equipment they produce (using less energy).

LEÓN, GUANAJUATO, MÉXICOTOOL FOR RAPID ASSESSMENT OF CITY ENERGY (TRACE) 91
Energy and resource saving program, Brisbane, Australia
Source: Good Practices in City Energy Efficiency: Eco2 Cities: Energy and Resource Saving Program in Brisbane. Available online http://www.esmap.org/
esmap/node/1225.
Brisbane’s population is expected to continue to grow over the next two decades. In 2007, the City Council issued Brisbane’s Plan for Action on Climate
Change and Energy, which described the actions for the short term (about 18 months) and long term (over five years). Brisbane has three major challenges:
climate change, high peak oil demand, and GHG emissions. Analysts suggest that if Brisbane responds well to these issues, it may generate significant
economic benefits by developing sustainable industries while saving resources. Brisbane is introducing various approaches to sustainable development. Also,
in the city’s ‘Our Shared Vision: Living in Brisbane 2026’ policy document, authorities committed to cutting GHG emissions in half, reusing all wastewater,
and restoring 40 percent of the natural habitat by 2026.
Integrated resource planning and management, Stockholm, Sweden
Source: Good Practices in City Energy Efficiency: Eco2 Cities - Integrated Resource Management in Stockholm. Available online http://www.esmap.org/
esmap/node/1228.
Stockholm has pursued integrated city planning and management to become a sustainable city. It has a comprehensive urban vision, environmental
programs, and concrete action plans to reduce GHG emissions and tackle climate change. It implements integrated urban planning approaches that
consider ecological benefits and efficient resource use.
The ongoing redevelopment in the city’s southern district, Hammarby Sjöstad, is a good model for understanding integrated approaches. The area aims
to be twice as sustainable as Sweden was in 1995. It launched integrated resource management (waste, energy, water, and sewage) through systematic
stakeholder collaboration and has transformed the linear urban metabolism into a cyclical one known as the Hammarby Model.
According to Grontmij AB, a private consultant firm in Stockholm, primary assessments of Hammarby Sjöstad development show that the area has
reduced nonrenewable energy use by 28–42 percent and global warming potential by 29 to 37 percent.
Tools & Guidance
Not applicable.
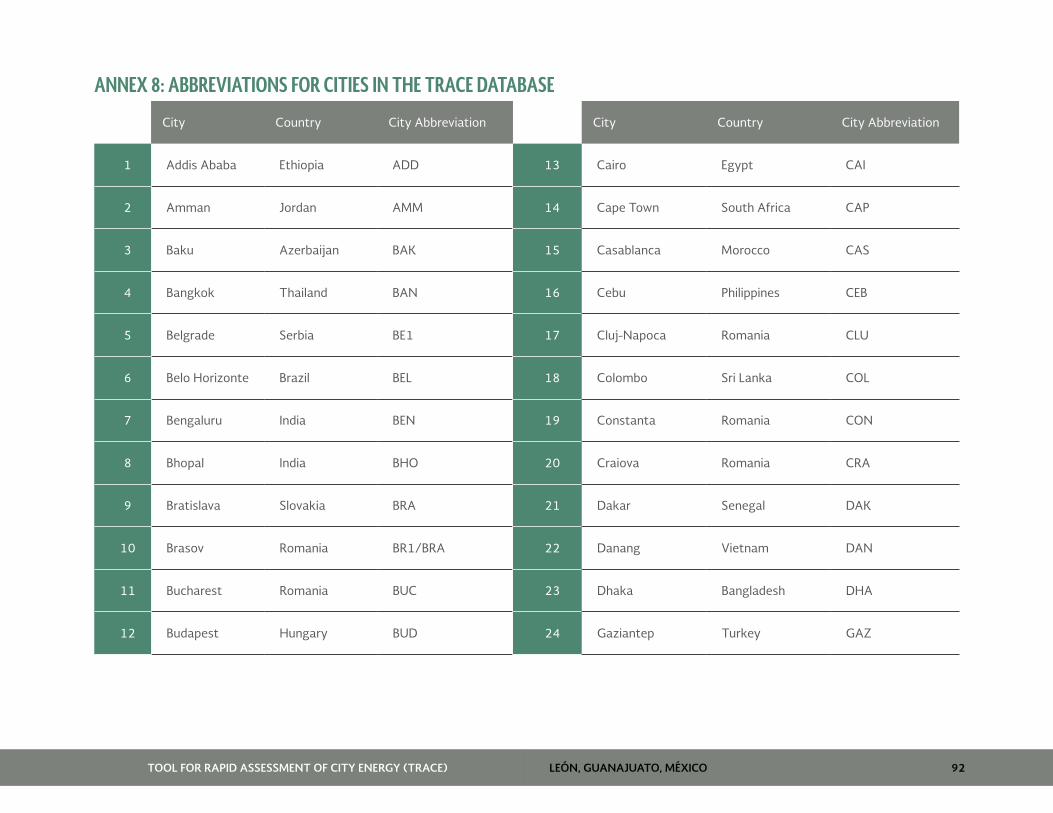
LEÓN, GUANAJUATO, MÉXICOTOOL FOR RAPID ASSESSMENT OF CITY ENERGY (TRACE) 92
ANNEX 8: ABBREVIATIONS FOR CITIES IN THE TRACE DATABASE
City Country City Abbreviation City Country City Abbreviation
1 Addis Ababa Ethiopia ADD 13 Cairo Egypt CAI
2 Amman Jordan AMM 14 Cape Town South Africa CAP
3 Baku Azerbaijan BAK 15 Casablanca Morocco CAS
4 Bangkok Thailand BAN 16 Cebu Philippines CEB
5 Belgrade Serbia BE1 17 Cluj-Napoca Romania CLU
6 Belo Horizonte Brazil BEL 18 Colombo Sri Lanka COL
7 Bengaluru India BEN 19 Constanta Romania CON
8 Bhopal India BHO 20 Craiova Romania CRA
9 Bratislava Slovakia BRA 21 Dakar Senegal DAK
10 Brasov Romania BR1/BRA 22 Danang Vietnam DAN
11 Bucharest Romania BUC 23 Dhaka Bangladesh DHA
12 Budapest Hungary BUD 24 Gaziantep Turkey GAZ
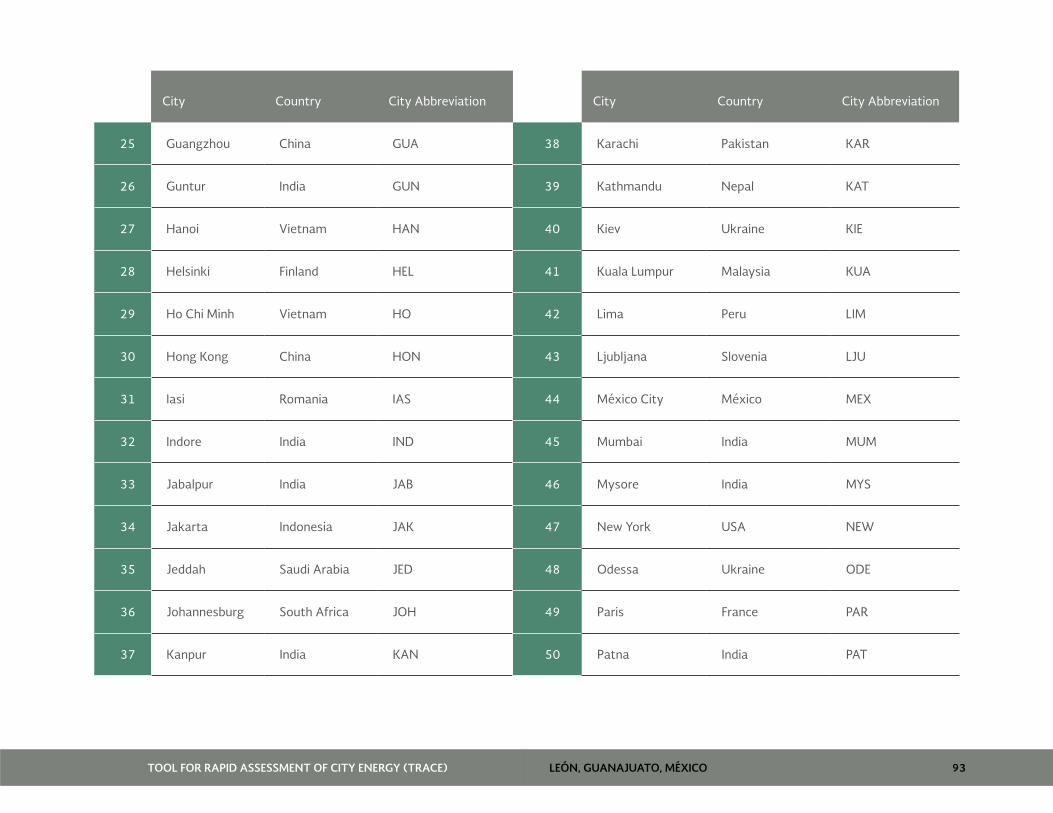
LEÓN, GUANAJUATO, MÉXICOTOOL FOR RAPID ASSESSMENT OF CITY ENERGY (TRACE) 93
City Country City Abbreviation City Country City Abbreviation
25 Guangzhou China GUA 38 Karachi Pakistan KAR
26 Guntur India GUN 39 Kathmandu Nepal KAT
27 Hanoi Vietnam HAN 40 Kiev Ukraine KIE
28 Helsinki Finland HEL 41 Kuala Lumpur Malaysia KUA
29 Ho Chi Minh Vietnam HO 42 Lima Peru LIM
30 Hong Kong China HON 43 Ljubljana Slovenia LJU
31 Iasi Romania IAS 44 México City México MEX
32 Indore India IND 45 Mumbai India MUM
33 Jabalpur India JAB 46 Mysore India MYS
34 Jakarta Indonesia JAK 47 New York USA NEW
35 Jeddah Saudi Arabia JED 48 Odessa Ukraine ODE
36 Johannesburg South Africa JOH 49 Paris France PAR
37 Kanpur India KAN 50 Patna India PAT
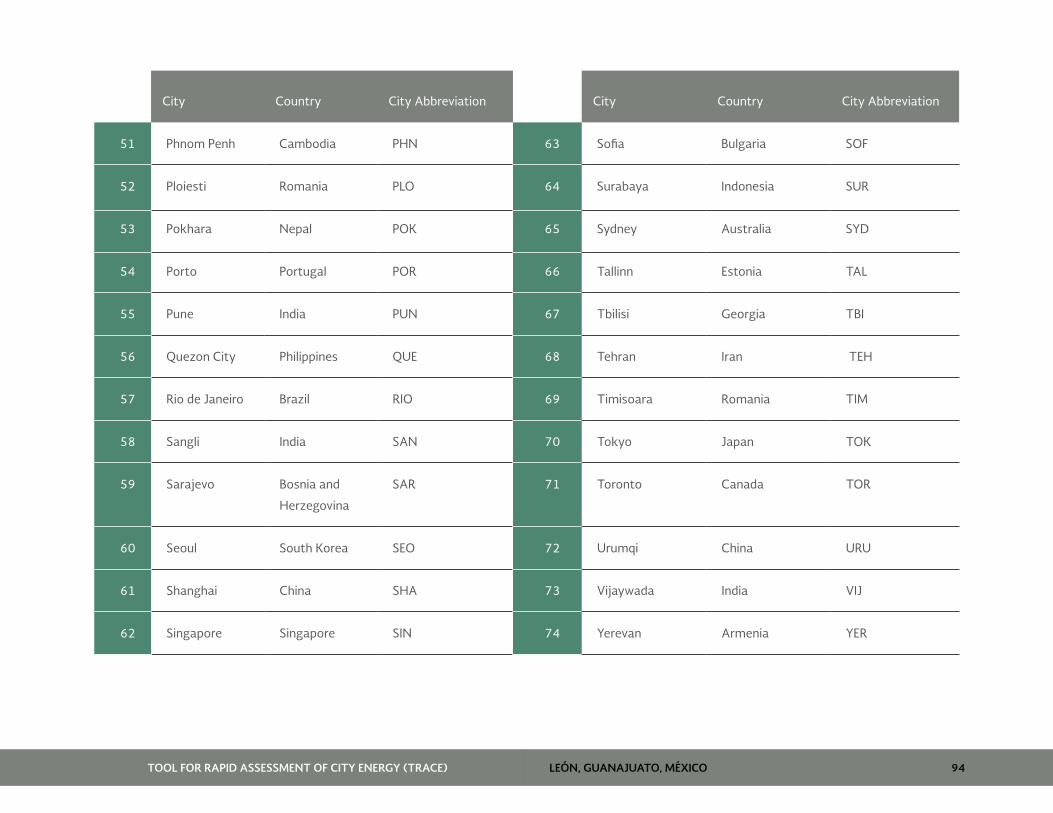
LEÓN, GUANAJUATO, MÉXICOTOOL FOR RAPID ASSESSMENT OF CITY ENERGY (TRACE) 94
City Country City Abbreviation City Country City Abbreviation
51 Phnom Penh Cambodia PHN 63 Sofia Bulgaria SOF
52 Ploiesti Romania PLO 64 Surabaya Indonesia SUR
53 Pokhara Nepal POK 65 Sydney Australia SYD
54 Porto Portugal POR 66 Tallinn Estonia TAL
55 Pune India PUN 67 Tbilisi Georgia TBI
56 Quezon City Philippines QUE 68 Tehran Iran TEH
57 Rio de Janeiro Brazil RIO 69 Timisoara Romania TIM
58 Sangli India SAN 70 Tokyo Japan TOK
59 Sarajevo Bosnia and
Herzegovina
SAR 71 Toronto Canada TOR
60 Seoul South Korea SEO 72 Urumqi China URU
61 Shanghai China SHA 73 Vijaywada India VIJ
62 Singapore Singapore SIN 74 Yerevan Armenia YER


Tool for Rapid Assessment of City Energy (TRACE)PU
EBLA
, PU
EBLA
,M
ÉXIC
O

Tool for Rapid Assessment of City Energy (TRACE) PUEBLA, PUEBLA, MÉXICO

Photograph from Gabriel Navarro Guerrero.
PUEBLA, PUEBLA, MÉXICOTOOL FOR RAPID ASSESSMENT OF CITY ENERGY (TRACE) iii
PREFACE - MUNICIPAL PRESIDENT OF PUEBLA
The social, environmental and economic development is only possible if
supported by the energy sector, a driving force of productive activities,
transport, trade and also supplying goods and services. Governments not
including the energy issues in their priorities are jeopardizing their future.
Today, cities largely depend on fossil fuels resulting in high costs and
the environmental impact. Thus, to establish appropriate environmental
and energy efficiency criteria, it will be critical to safeguard and protect the
natural resources together with the economic and social benefits it entails.
Puebla is a vigorous municipality undergoing a full development,
requiring an accelerated energy consumption; notwithstanding, at the
present time, most of the transformation and combustion systems are
not as efficient as we would like, there being potential opportunities in this
sector. On the other hand, fuels supply and quality need to be carefully
supervised by the governmental sector, under a working scheme jointly
coordinated by the government and the community.
The time we are currently living may be considered as the energy
period, asking the government for an appropriate and timely decision-
making process. In this respect, the municipality of Puebla jointly with the
World Bank has implemented a tool called:
“Tool for Rapid Assessment of City Energy” – TRACE
The purpose of this tool is to identify sectors with low energy
performance, to assess the potential for improvements, to prioritize
sectors and to reduce costs, in order to implement energy efficiency
actions and interventions.
The assessed sectors are: transport, street lighting, municipal buildings,
solid waste, power and heat, water and wastewater.
The World Bank´s TRACE tool, gives the opportunity to conduct an
analysis to compare the Municipality of Puebla with other peers in the
world, valuing successful cases and the experience elsewhere. This report
details energy efficiency actions for each sector as well as potential actions
to be implemented. We are lucky to be principal actors in the transition
phase of the Municipality of Puebla towards a period of energy efficiency
and leadership.
We would like to thank the World Bank for the opportunity of being one
of the pioneering cities in Latin America that has implemented the TRACE
tool by which potential areas for action were identified as far as energy
efficiency is concerned.
JOSÉ ANTONIO GALI FAYAD
Municipal President of Puebla
PUEBLA, PUEBLA, MÉXICOTOOL FOR RAPID ASSESSMENT OF CITY ENERGY (TRACE) iv
PREFACE - SECRETARY OF ENERGY (SENER)
The National Energy Strategy 2013-2027 establishes that Mexico has had
a growing urban population, which resulted from the migration from rural
to urban areas, in search of more employment opportunities and a better
quality of life. This has led to a growth in demand for services such as water
pumping systems, public lighting, public transport, space conditioning and
infrastructure, which concentrate power and fuel consumption.
In light of this growing urban footprint, it is essential to improve energy
efficiency in Mexican cities to reduce energy costs and local and global
environmental impacts deriving from energy consumption.
Mexico is committed to boosting the national energy sector through
projects, programs and actions aimed at achieving greater use and
development of renewable energy and clean technologies as well as to
promote energy efficiency to achieve an appropriate balance that allows the
country to move towards social, economic and environmental sustainability
in line with current and future global environmental commitments.
In this regard, the Secretary of Energy, with World Bank support,
supported the development of the diagnosis on energy efficiency through
the implementation of the Tool for Rapid Assessment of Cities Energy
(TRACE), a tool for prioritizing energy saving in cities. TRACE allows local
governments to understand opportunities to increase energy efficiency;
primarily through energy saving for transportation, buildings, street
lighting, solid waste, water pumping energy and heating, which will result in
significant savings opportunities for the municipality and important social
benefits and care for the local and global environment.
The diagnostics are expected to clearly identify potential areas of
public or private investment that the local government can use to improve
services provided to the city, and with that, make more efficient energy
use.
LEONARDO BELTRÁN RODRÍGUEZ
Undersecretary of Planning and Energy Transition
Secretary of Energy (SENER)
PUEBLA, PUEBLA, MÉXICOTOOL FOR RAPID ASSESSMENT OF CITY ENERGY (TRACE) v
PREFACE – WORLD BANK GROUP
City governments are in a unique position to lead the transition to more
efficient energy use and in the process improve their urban services, reduce
budgetary expenditures, and curb energy use and emissions.
Municipalities are typically large and visible energy consumers that
through their actions and good example can encourage energy efficiency
and help promote the market for energy efficient products and services.
While energy efficiency priorities will be different depending on factors
such as geography, climate, and the level of economic development,
Mexican cities appear to have significant potential to reduce energy
consumption, for example, in public lighting, municipal buildings, and the
provision of water and sanitation. FIDE estimates that energy savings of up
to 50 percent are possible through the installation of efficient street lights
and up to 40 percent by employing more efficient water pumps. Municipal
facilities, such as office buildings or schools, typically have a similar energy
consumption pattern that may offer an attractive investment opportunity
for commercial equipment and service providers, while at the same time
providing energy and financial savings to the municipality.
Although programs to support energy efficiency exist at the municipal
level, a fundamental question is why these measures are not undertaken
on a larger scale given the availability of proven technologies and when
financing is not a constraint. Among the common barriers to urban
energy efficiency investments are regulatory and legal constraints, lack
of knowledge of cost-effective interventions, and limited institutional
capacity to design and implement projects. This study is based on a rapid
assessment of municipal energy use and identifies where opportunities for
energy savings exist. With this information, and through the support of
other federal and state programs, municipal authorities in Mexico will be
in a better position to plan and implement cost-effective energy efficiency
measures.
This study is part of a broader program in Mexico to help identify
and implement energy efficiency measures. The country has previously
established the National Program for Efficient Energy Use (Programa
Nacional para el Aprovechamiento de la Energia, PRONASE) that seeks to
promote and support the establishment of institutional arrangement for
the design and implementation of energy efficiency policies, programs,
and projects at the subnational level. To elevate the focus on cities, SENER
launched a national urban energy efficiency program in June 2014. This
study evaluates a range of options to reduce energy use in municipal
services, including street lighting, public buildings, water supply and
sanitation, public transport, solid waste management, and within energy
utilities (electricity and gas). The World Bank has been involved in end-use
energy efficiency programs in Mexico and has recently supported energy
use diagnostics at the municipal level. This has led to a cooperative effort
between SENER and the World Bank to design and implement a national

PUEBLA, PUEBLA, MÉXICOTOOL FOR RAPID ASSESSMENT OF CITY ENERGY (TRACE) vi
municipal energy efficiency program, beginning with multi-city energy use
assessments.
This report focuses on energy use in the Municipality of Puebla. The
hope is that the findings from this study will provide useful lessons to other
cities that are interested in improving the efficiency of energy use. Both
the methodology and specific energy efficiency measures identified here
are likely to be illustrative of the potential in other cities in Mexico. The
World Bank intends to draw on the findings from Puebla and other Mexican
cities to provide global lessons for urban energy efficiency.
MALCOLM COSGROVE-DAVIES
Practice Manager
Energy and Extractives Global Practice
The World Bank Group
PUEBLA, PUEBLA, MÉXICOTOOL FOR RAPID ASSESSMENT OF CITY ENERGY (TRACE) 1
TABLE OF CONTENTS
Preface - Municipal President of Puebla..................................... iii
Preface - Secretary of Energy (SENER) ......................................iv
Preface - World Bank Group...........................................................v
Executive Summary ........................................................................ 2
Methodology .................................................................................... 7
Background .....................................................................................10
National Energy Framework ..................................................... 12
Puebla Sector Assessments ................................................. 18
Power sector ............................................................................18
Streetlights .............................................................................20
Municipal Buildings ................................................................23
Solid Waste .............................................................................25
Urban Transport ....................................................................29
Water ........................................................................................35
Energy Efficiency Recommendations ....................................39
Streetlights .............................................................................42
Municipal Buildings ................................................................44
Solid Waste ..............................................................................49
Awareness-raising Campaign ............................................51
Annexes .......................................................................................55
ESMAP COPYRIGHT DISCLAIMER
Energy Sector Management Assistance Program (ESMAP) reports are
published to communicate the results of ESMAP’s work to the development
community with the lease possible delay. Some sources cited in this paper
may be informal documents that are not readily available.
The findings, interpretations, and conclusions expressed in this report
are entirely those of the author(s) and should not be attributed in any
manner to the World Bank, or its affiliated organizations, or to members
of its board of executive directors for the countries they represent, or to
ESMAP. The World Bank and ESMAP do not guarantee the accuracy of the
data included in this publication and accepts no responsibility whatsoever
for any consequence of their use. The boundaries, colors, denominations,
and other information shown on any map in this volume do not imply on
the part of the World Bank Group any judgment on the legal status of any
territory or the endorsement of acceptance of such boundaries.
TRACE (Tool for Rapid Assessment of City Energy) was developed by
the ESMAP (Energy Sector Management Assistance Program), a World
Bank unit, and is available for download and free use at: http://esmap.
org/TRACE.
PUEBLA, PUEBLA, MÉXICOTOOL FOR RAPID ASSESSMENT OF CITY ENERGY (TRACE) 2
EXECUTIVE SUMMARY
Background
This report, supported by the Energy Sector Management Assistance
Program (ESMAP), applies the Tool for the Rapid Assessment of City Energy
(TRACE) to examine urban energy use in Puebla, México. This study is
one of three requested (Puebla; León, México; and Bogota, Colombia) and
conducted in 2013 by the World Bank Latin America and the Caribbean
Energy Unit, so as to begin a dialogue on the potential for energy efficiency
(EE) in Latin America and the Caribbean cities. The assessments in Puebla
and León helped the Mexican Secretary of Energy (SENER) develop an
urban EE strategy.
TRACE is a simple, practical tool for making rapid assessments of
municipal energy use. It helps prioritize sectors that have the potential to
save significant amounts of energy and identifies appropriate EE measures
in six sectors—transport, municipal buildings, wastewater, streetlights,
solid waste, and power/heat. Globally, the six are often managed by the
cities which have substantial influence over public utility services. In this
context, TRACE—which is a low-cost, user-friendly, and practical tool
that can be applied in any socioeconomic setting—offers local authorities
the information they need about energy performance, and identifies
areas where more analysis would be useful. The tool describes about 65
EE efforts based on case studies and global best practices. It is targeted
mainly at local authorities and public utility companies, but it could also be
used by state or federal authorities to increase their knowledge about how
to make cities more energy efficient.
In many cities worldwide, the six TRACE areas are under municipal
jurisdiction, but in Latin America and the Caribbean, local authorities often
have only limited influence over sectors such as transport, electricity,
water, and sanitation.
Because TRACE is a relatively rapid exercise, the analysis is somewhat
limited. Its recommendations should thus be seen as an indication of what
can be done to improve a city’s energy performance and reduce energy
expenditures in some areas; however, it does not assess the residential,
industrial, or commercial sectors.
Puebla, Puebla, México
The city of Puebla, the capital of the state with the same name, is about
2,100 m above sea level, at the foot of the Popocatepetl volcano, and is
130 miles southwest of México City. The local economy is based mainly
on industry; it has the second-largest Volkswagen factory in the world and
the largest plant in the Americas, located in the neighboring municipality
of Cuautlancingo. Many city residents are employed in the automotive
sector and other industrial branches, and the area has relatively low
unemployment (4.5 percent).
In consultation with Puebla authorities and based on sector analyses by
local consultants, the TRACE team recommended actions to promote EE
in urban services. The three areas with the greatest potential for savings
and for which the local administration has a significant degree of control
are streetlights, municipal buildings, and solid waste. A summary of all
six areas that were evaluated are discussed below, along with the main
recommendations.
PUEBLA, PUEBLA, MÉXICOTOOL FOR RAPID ASSESSMENT OF CITY ENERGY (TRACE) 3
Puebla’s energy use
More than 54 percent of the city’s energy is used by the transport sector,
while residential, commercial, and public sectors account for 23.8 percent,
and industry consumes 21.6 percent. Total energy consumption by the six
TRACE areas is about 27.6 billion MJ, of which 62 percent goes to urban
transport, and a little over a third to the power sector. The water company
uses one percent to treat potable and wastewater, while streetlights
require even less, that is, 0.9 percent. The smallest share, 0.1 percent, is
used by municipal buildings. Since figures for solid waste collection and
management are incomplete, it is not possible to estimate their share.
STREETLIGHTS. Only two-thirds of Puebla’s streets are lit. While there is
one lamp every 30 m on primary and secondary roads, some neighborhoods
are poorly lit. The total number of streetlights is nearly 100,000.
Although 80 percent of the lights use medium-efficient high-pressure
sodium bulbs, only 15 percent are metered—making it difficult to calculate
their energy use. However, it was determined that the amount of electricity
used per km of road (23,146 kWh) is similar to the average found for other
cities in the TRACE database; the annual expenditure for the city lights is
over US$12 million.
In recent years, the city has tried to improve the system, such as by
introducing a pilot light-dimming program on one of the main avenues,
and in the future, by expanding streetlights and switching to efficient
LED (light emitting diode) technology. This area has significant potential
to save energy (US$3 million) by reducing consumption and at the same
time, improving the quality of streetlights. To accomplish this, it could do
the following:
• Create a procurement guide that would set strict rules for using EE technology
for its streetlights. It would require upgrading the lights with energy-efficient
lamps that can deliver the same light and use significantly less energy, thus
reducing carbon emissions and operating costs. The cost of LED technology
has dropped to where it is the optimal choice.
• Bring in an energy service company (ESCO) as a third party that could pay for
the lights and other upgrade costs, and finance the investments from a share
of the energy savings.
MUNICIPAL BUILDINGS. Most of Puebla’s 134 municipal buildings are
public offices since all schools and most hospitals are managed by state and
federal authorities. Puebla presents a unique case since many government
buildings in the large downtown area are designated as historic (UNESCO
identified the area as a World Cultural Heritage site in 1987) and it
is difficult and costly to renovate historic buildings. Most of the energy
used in these buildings is for lighting and IT, since the temperate climate
minimizes the need for space heating or air conditioning. As a result, overall
energy use is among the lowest of cities in the TRACE database (14 kWh/
m2). Still, Puebla lacks reliable information on the overall floor space and
energy consumption in the buildings it manages. With small investments,
local authorities could improve the management of municipal buildings in
the city, and save on energy and other utility expenditures.
Some of the EE measures could include creating the following:
• A municipal building database and benchmarking program: The database
could identify the buildings (and their end-use) with the largest energy-saving
potential. If the database was regularly published and updated, this would
promote competition among building managers and the exchange of data
and best practices.
PUEBLA, PUEBLA, MÉXICOTOOL FOR RAPID ASSESSMENT OF CITY ENERGY (TRACE) 4
• A municipal building audit and upgrade program that would identify and
prioritize EE upgrades for city managers.
• Mandatory EE codes and guidelines for new buildings that would establish
best-practice standards based on new or existing international codes.
SOLID WASTE. This sector, which is handled by both public and private
operators, presents parameters that compare favorably with international
findings, such as the low level of waste generated per capita (0.89 kg per
day and 324 kg per year), and the high percent of solid waste that goes
to the landfill. Located six km from the city, it is operated by a private
contractor and is well-equipped with a modern leachate plant that treats
the landfill’s wastewater. However, like other Mexican cities, Puebla does
not have a well-developed collection system to separate organic waste
from recyclables. Although the latter, which are collected by informal
sector workers, increased in the last few years, the recycling rate is still
very low (less than 3 percent). Further, the city does not monitor the fuel
consumed or expenditures of private contractors who collect and transfer
waste. Nor does it encourage them to adopt EE measures—although
both public and private operators have recently bought new trucks that
are more fuel efficient. In addition, in a new program, private entities buy
the recycled items from the city, which puts the proceeds into a fund to
improve public safety.
In the short and medium term, the EE of the solid waste sector could be
improved by the following:
• Building transfer stations that would reduce the number of trips to the landfill
and the distance travelled per ton of waste, thus lowering energy use.
• Auditing and planning solid waste actions, whereby the city could evaluate
the infrastructure and identify ways to save energy throughout the process
of collecting, transporting, and disposing of solid waste.
• Launching public awareness campaigns about the importance of recycling
that would teach people how to separate organic trash from recyclables and
organize the collection of items to be recycled.
POWER AND HEATING. Puebla’s per capita electricity consumption is
low (1,786 kWh), although the per unit of gross domestic product (GDP)
is average when compared to other cities internationally (0.204 kWh).
These are other facts about this sector: (1) Puebla has 98 percent power
coverage, with over 660,000 households connected to the grid. (2) Overall
losses in the transmission/distribution network as well as commercial
losses account for about 11 percent of the total produced. (3) There are
four private energy producers which have a total installed capacity of 7
MW; none uses renewable resources. (4) Industries consume almost two-
thirds of the energy, while residences use 25 percent. (5) As in all Mexican
cities, the local government does not have a great deal of influence over
the power sector, which is operated by the Federal Electricity Commission
(CFE), the state-owned electricity provider.
TRANSPORT. The transport system is managed by state and federal
authorities, with oversight from the cities. Almost half the city residents
use public transport, while over a third uses non-motorized transport
(NMT). Many people bike or walk, particularly in the historic district, where
there is a good pedestrian network. The city is expanding the number of
bike lanes and is also promoting bike share programs with docking stations
where people can rent bicycles.
About 21 percent of the population uses their own cars for daily
commute. Compared to other cities in the TRACE database, public
transport is very energy efficient. The public network includes a bus rapid
PUEBLA, PUEBLA, MÉXICOTOOL FOR RAPID ASSESSMENT OF CITY ENERGY (TRACE) 5
transit (BRT) system and various feeder and auxiliary routes. At present,
only one BRT route operates, accounting for 108,000 daily trips, and one
more route is being constructed. Unlike the BRT vehicles, others in the
public system are fairly old.
About one quarter of city residents use their cars for the daily commute
which raises energy use per trip, that is, 3 MJ per passenger-km, which is
one of the highest figures in the TRACE database. During rush hour, it is
estimated that drivers spend up to a third of their travel time waiting in
traffic.
WATER. Operated by a decentralized state institution, Puebla’s water
sector faces several challenges. (1) Water coverage is not universal, as
the network does not reach all neighborhoods; thus, parts of the historic
district receive water from tanker trucks. (2) Although Puebla uses a
fairly low amount of water per capita (172 liters), network losses are high
(nearly 40 percent), partly due to the old pipes and the difficulty attached
to rehabilitating the large historic part of the city. (3) The system requires
a fairly high amount of energy to treat potable water (0.5 kWh/m3 of
water). (4) Although Puebla has five wastewater treatment facilities, some
large industries discharge wastewater into the rivers, polluting surface
water and the environment. (5) Although the wastewater treatment
process uses a relatively small amount of energy, none of the current
facilities has the capacity to generate energy.
Matrix with EE priorities and proposed programs
The matrix below presents the public sectors identified by the TRACE tool as
having the highest energy-saving potential and some of the measures the
city could consider to reduce consumption and improve overall efficiency.
The maximum energy saving potential is calculated by the TRACE tool
considering the total energy spending in the sector1 and other parameters
such as the city authority control and the relative energy intensity of the
TRACE tool as is explained in the Summary of Section Priorization in the
Recommendation section.
The energy saving recommendations in the matrix were presented,
discussed and agreed with the city authorities and key stakeholders,
and represent only some of the possible measures to achieve maximum
potential savings. These are classified by cost, energy saving potential
and time of implementation, which are an estimation based on previous
experiences however further assessments should be conducted to get the
real cost of implementing the measures in Puebla.
1 The total energy spending on public transportation and private vehicles was estimated by multiplying the annual fuel consumption (diesel and gasoline, respectively) by the average price of the fuel. Energy spending in street lighting, potable water and public buildings were provided by the utility companies and the city authorities.
Notes for the Matrix of EE Priorities a These amount refers to the maximum potential savings in the sector base on
the TRACE tool, assuming all possible recommendations are implemented. The
recommendations shown in the table were selected after discussions with the
municipal authorities and utility companies and could help achieve some of the
potential energy savings; however a detailed audit would need to be done to assess
with more precision the amount of energy savings each measure can achieve.
b Cost of Implementation estimated: low ($) = US$0 -US$100,000; medium ($$) =
US$100,000 – US$1,000,000; high ($$$) = > US$1,000,000
c Energy Saving Potential estimated: low (*), medium (**), high (***)
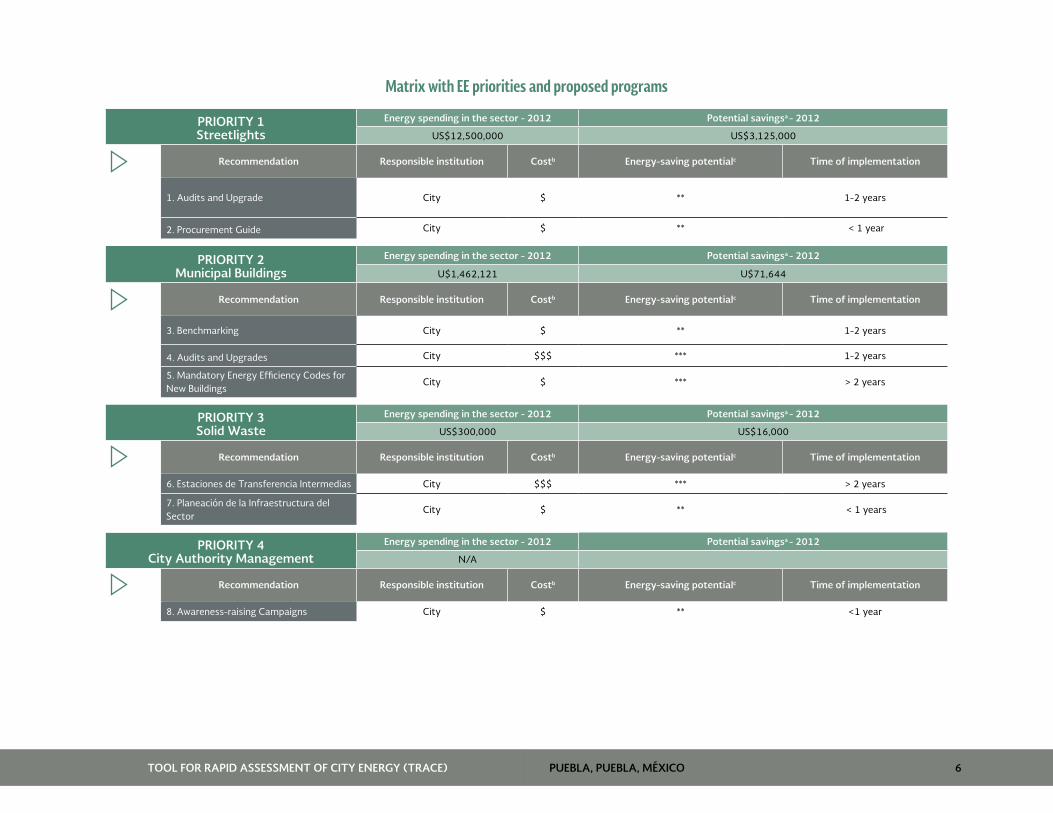
PUEBLA, PUEBLA, MÉXICO 6TOOL FOR RAPID ASSESSMENT OF CITY ENERGY (TRACE)
Matrix with EE priorities and proposed programs
PRIORITY 1Streetlights
Energy spending in the sector - 2012 Potential savingsa - 2012
US$12,500,000 US$3,125,000
Recommendation Responsible institution Costb Energy-saving potentialc Time of implementation
1. Audits and Upgrade City $ ** 1-2 years
2. Procurement Guide City $ ** < 1 year
PRIORITY 2Municipal Buildings
Energy spending in the sector - 2012 Potential savingsa - 2012
U$1,462,121 U$71,644
Recommendation Responsible institution Costb Energy-saving potentialc Time of implementation
3. Benchmarking City $ ** 1-2 years
4. Audits and Upgrades City $$$ *** 1-2 years
5. Mandatory Energy Efficiency Codes for New Buildings
City $ *** > 2 years
PRIORITY 3Solid Waste
Energy spending in the sector - 2012 Potential savingsa - 2012
US$300,000 US$16,000
Recommendation Responsible institution Costb Energy-saving potentialc Time of implementation
6. Estaciones de Transferencia Intermedias City $$$ *** > 2 years
7. Planeación de la Infraestructura del Sector
City $ ** < 1 years
PRIORITY 4City Authority Management
Energy spending in the sector - 2012 Potential savingsa - 2012
N/A
Recommendation Responsible institution Costb Energy-saving potentialc Time of implementation
8. Awareness-raising Campaigns City $ ** <1 year
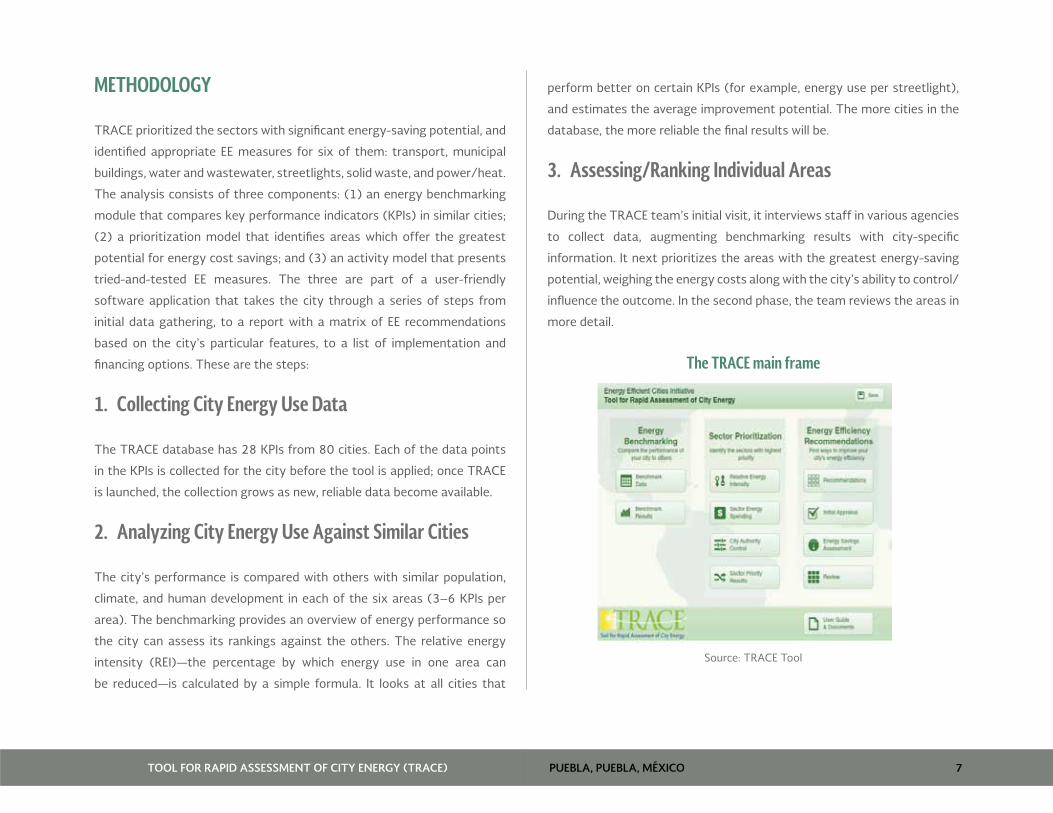
PUEBLA, PUEBLA, MÉXICOTOOL FOR RAPID ASSESSMENT OF CITY ENERGY (TRACE) 7
METHODOLOGY
TRACE prioritized the sectors with significant energy-saving potential, and
identified appropriate EE measures for six of them: transport, municipal
buildings, water and wastewater, streetlights, solid waste, and power/heat.
The analysis consists of three components: (1) an energy benchmarking
module that compares key performance indicators (KPIs) in similar cities;
(2) a prioritization model that identifies areas which offer the greatest
potential for energy cost savings; and (3) an activity model that presents
tried-and-tested EE measures. The three are part of a user-friendly
software application that takes the city through a series of steps from
initial data gathering, to a report with a matrix of EE recommendations
based on the city’s particular features, to a list of implementation and
financing options. These are the steps:
1. Collecting City Energy Use Data
The TRACE database has 28 KPIs from 80 cities. Each of the data points
in the KPIs is collected for the city before the tool is applied; once TRACE
is launched, the collection grows as new, reliable data become available.
2. Analyzing City Energy Use Against Similar Cities
The city’s performance is compared with others with similar population,
climate, and human development in each of the six areas (3–6 KPIs per
area). The benchmarking provides an overview of energy performance so
the city can assess its rankings against the others. The relative energy
intensity (REI)—the percentage by which energy use in one area can
be reduced—is calculated by a simple formula. It looks at all cities that
perform better on certain KPIs (for example, energy use per streetlight),
and estimates the average improvement potential. The more cities in the
database, the more reliable the final results will be.
3. Assessing/Ranking Individual Areas
During the TRACE team’s initial visit, it interviews staff in various agencies
to collect data, augmenting benchmarking results with city-specific
information. It next prioritizes the areas with the greatest energy-saving
potential, weighing the energy costs along with the city’s ability to control/
influence the outcome. In the second phase, the team reviews the areas in
more detail.
The TRACE main frame
Source: TRACE Tool
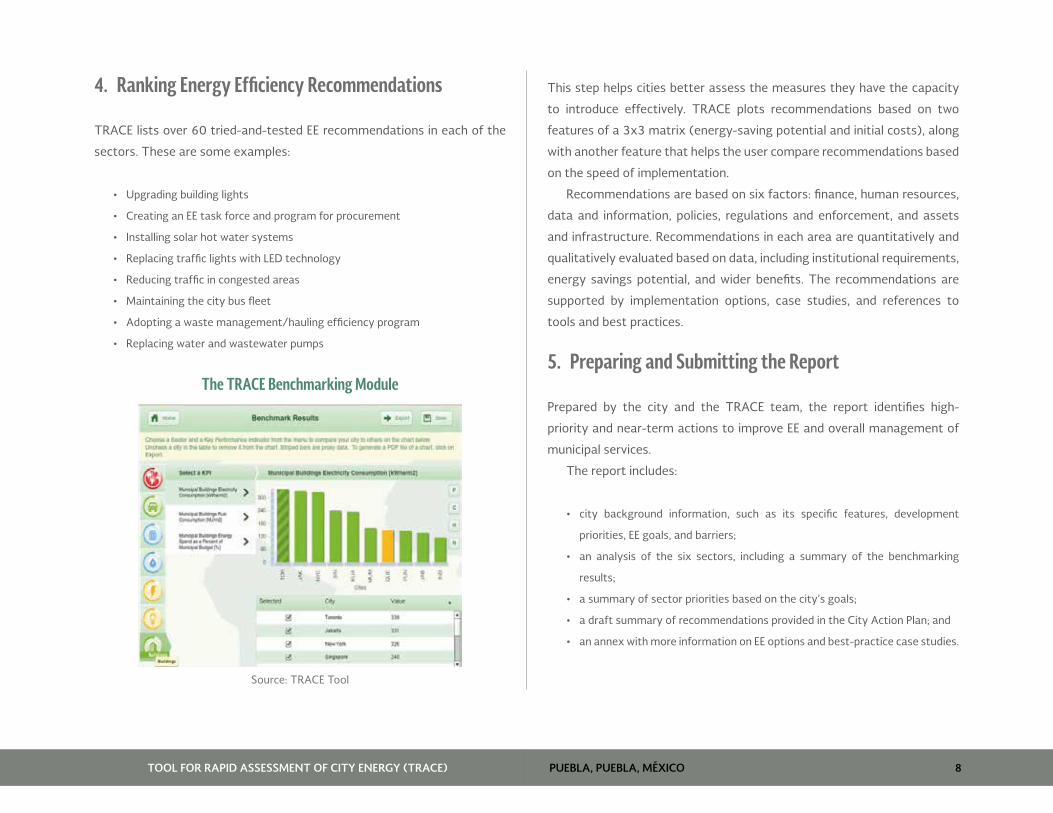
PUEBLA, PUEBLA, MÉXICOTOOL FOR RAPID ASSESSMENT OF CITY ENERGY (TRACE) 8
4. Ranking Energy Efficiency Recommendations
TRACE lists over 60 tried-and-tested EE recommendations in each of the
sectors. These are some examples:
• Upgrading building lights
• Creating an EE task force and program for procurement
• Installing solar hot water systems
• Replacing traffic lights with LED technology
• Reducing traffic in congested areas
• Maintaining the city bus fleet
• Adopting a waste management/hauling efficiency program
• Replacing water and wastewater pumps
The TRACE Benchmarking Module
Source: TRACE Tool
This step helps cities better assess the measures they have the capacity
to introduce effectively. TRACE plots recommendations based on two
features of a 3x3 matrix (energy-saving potential and initial costs), along
with another feature that helps the user compare recommendations based
on the speed of implementation.
Recommendations are based on six factors: finance, human resources,
data and information, policies, regulations and enforcement, and assets
and infrastructure. Recommendations in each area are quantitatively and
qualitatively evaluated based on data, including institutional requirements,
energy savings potential, and wider benefits. The recommendations are
supported by implementation options, case studies, and references to
tools and best practices.
5. Preparing and Submitting the Report
Prepared by the city and the TRACE team, the report identifies high-
priority and near-term actions to improve EE and overall management of
municipal services.
The report includes:
• city background information, such as its specific features, development
priorities, EE goals, and barriers;
• an analysis of the six sectors, including a summary of the benchmarking
results;
• a summary of sector priorities based on the city’s goals;
• a draft summary of recommendations provided in the City Action Plan; and
• an annex with more information on EE options and best-practice case studies.
PUEBLA, PUEBLA, MÉXICOTOOL FOR RAPID ASSESSMENT OF CITY ENERGY (TRACE) 9
TRACE limitations
Because TRACE is relatively simple and easy to implement, it also means
that its analyses are somewhat limited. For example, it may identify
streetlights as a priority in terms of potential energy savings, but it does
not detail the costs to carry out rehabilitation projects. Thus, even if the
energy-saving potential is considered high, the costs may be even higher,
and investments may not be viable. Also, although TRACE focuses on the
service areas for which the city is responsible, the tool cannot factor in the
institutional/legislative mechanisms that may be needed to launch specific
EE actions.
While TRACE can be applied well in Eastern European cities and
Commonwealth of Independent States (CIS) countries, where most public
utilities are under the city governments (which gives them substantial
control over the TRACE areas), elsewhere, as in Latin America, cities have
less control over them, either because they are managed at the state
or federal level, or because the service is provided by a contractor. For
example, in 2013, TRACE was applied in Romania’s seven largest cities
where important services, such as public transport, district heating,
streetlights, and municipal buildings were under local control. In some,
even where operations and maintenance (O&M) are outsourced to a
contractor (as with streetlights), the city owns the infrastructure and can
make the final decisions. Thus, in Romania, the TRACE studies helped local
and national authorities prepare local EE measures that were supported
with funds from the European Union (EU), whose Europe 2020 Strategy
aimed to reduce greenhouse gas (GHG) emissions by 20 percent over the
next few years.
PUEBLA, PUEBLA, MÉXICOTOOL FOR RAPID ASSESSMENT OF CITY ENERGY (TRACE) 10
BACKGROUND
México is the fifth largest country in the Americas, behind Canada, the
United States, Brazil, and Argentina. Spread over two million km2, it is
bordered by the United States on the north, the Pacific Ocean on the west,
Belize, Guatemala, and the Caribbean Sea on the south and west, and the
Gulf of México on the east.
A large share of the territory consists of mountains, as the country
is crossed by the Sierra Madre Oriental and Occidental mountain ranges
(from north to south), the Trans-Mexican Volcanic Belt (from east to west),
and the Sierra Madre del Sur in the southwest. México is also intersected
by the Tropic of Cancer, which divides the country into two climatic areas—
the temperate continental climate and the tropical one—which bring very
diverse weather. For example, the northern part of the country has cooler
temperatures during the winter and fairly constant temperatures year
around. Most of the central and northern parts are in high altitudes.
An upper-middle-income country with macroeconomic stability,
México is the world’s 14th largest economy in nominal terms, ranks tenth
by purchasing power parity, and has the second highest degree of income
disparity between rich and poor among OECD (Organization for Economic
Co-operation and Development) countries. According to the 2011 Human
Development Report, México’s Human Development Index (HDI) was at
0.889, and based on the World Bank’s GINI index, the income inequality
ratio was 42.7 percent (2010). The economy has a mix of modern and
outdated agricultural and industrial enterprises.
México was severely affected by the 2008 economic crisis, when the
GDP dropped by more than 6 percent. Currently, the government is working
to reduce the large gap between rich and poor, upgrade infrastructure,
modernize the tax system and labor laws, and reform the energy sector.
The country has an export-oriented economy with more than 90 percent of
trade occurring under free-trade agreements with 40 countries, including
the United States and Canada, the EU, Japan, and other Latin American
countries. Services represent two-thirds of GDP, industry 30 percent, and
agriculture 3 percent. Tourism is very important, attracting millions of
visitors every year, and México is the second most visited nation in the
Americas after the United States.
México is a federal country with 31 states and the Federal District
(México City). It has a population of 118.8 million (2010 census). The
most populous cities are listed:
City 2010 Census
México City 8,851,080
Ecatepec 1,655,015
Guadalajara 1,564,51
Puebla 1,539,819
León 1,436,733
Juárez 1,321,004
Tijuana 1,300,983
Zapopan 1,155,790
Monterrey 1,130,960
Nezahualcóyotl 1,109,363
Also, it is the most populous Spanish-speaking country in the world as well
as the third most populous in the Americas after the United States and
Brazil.
The city of Puebla is the capital of the state. Founded in 1531, it is
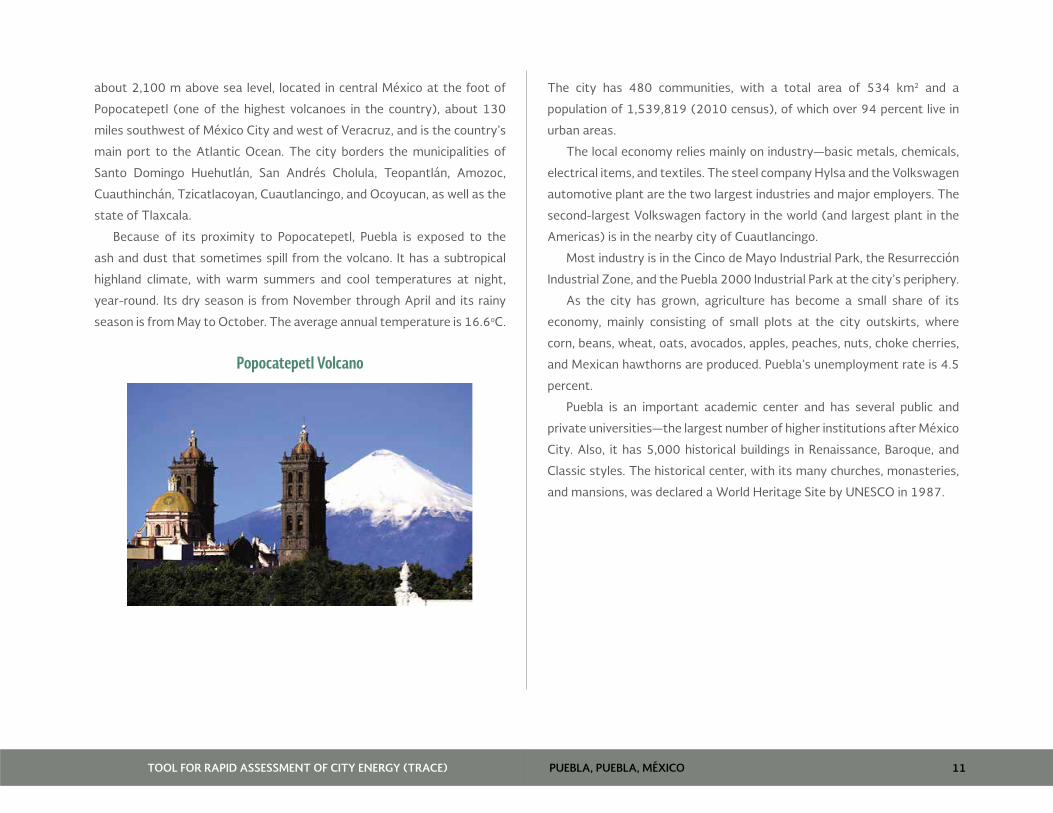
PUEBLA, PUEBLA, MÉXICOTOOL FOR RAPID ASSESSMENT OF CITY ENERGY (TRACE) 11
about 2,100 m above sea level, located in central México at the foot of
Popocatepetl (one of the highest volcanoes in the country), about 130
miles southwest of México City and west of Veracruz, and is the country’s
main port to the Atlantic Ocean. The city borders the municipalities of
Santo Domingo Huehutlán, San Andrés Cholula, Teopantlán, Amozoc,
Cuauthinchán, Tzicatlacoyan, Cuautlancingo, and Ocoyucan, as well as the
state of Tlaxcala.
Because of its proximity to Popocatepetl, Puebla is exposed to the
ash and dust that sometimes spill from the volcano. It has a subtropical
highland climate, with warm summers and cool temperatures at night,
year-round. Its dry season is from November through April and its rainy
season is from May to October. The average annual temperature is 16.6oC.
Popocatepetl Volcano
The city has 480 communities, with a total area of 534 km2 and a
population of 1,539,819 (2010 census), of which over 94 percent live in
urban areas.
The local economy relies mainly on industry—basic metals, chemicals,
electrical items, and textiles. The steel company Hylsa and the Volkswagen
automotive plant are the two largest industries and major employers. The
second-largest Volkswagen factory in the world (and largest plant in the
Americas) is in the nearby city of Cuautlancingo.
Most industry is in the Cinco de Mayo Industrial Park, the Resurrección
Industrial Zone, and the Puebla 2000 Industrial Park at the city’s periphery.
As the city has grown, agriculture has become a small share of its
economy, mainly consisting of small plots at the city outskirts, where
corn, beans, wheat, oats, avocados, apples, peaches, nuts, choke cherries,
and Mexican hawthorns are produced. Puebla’s unemployment rate is 4.5
percent.
Puebla is an important academic center and has several public and
private universities—the largest number of higher institutions after México
City. Also, it has 5,000 historical buildings in Renaissance, Baroque, and
Classic styles. The historical center, with its many churches, monasteries,
and mansions, was declared a World Heritage Site by UNESCO in 1987.
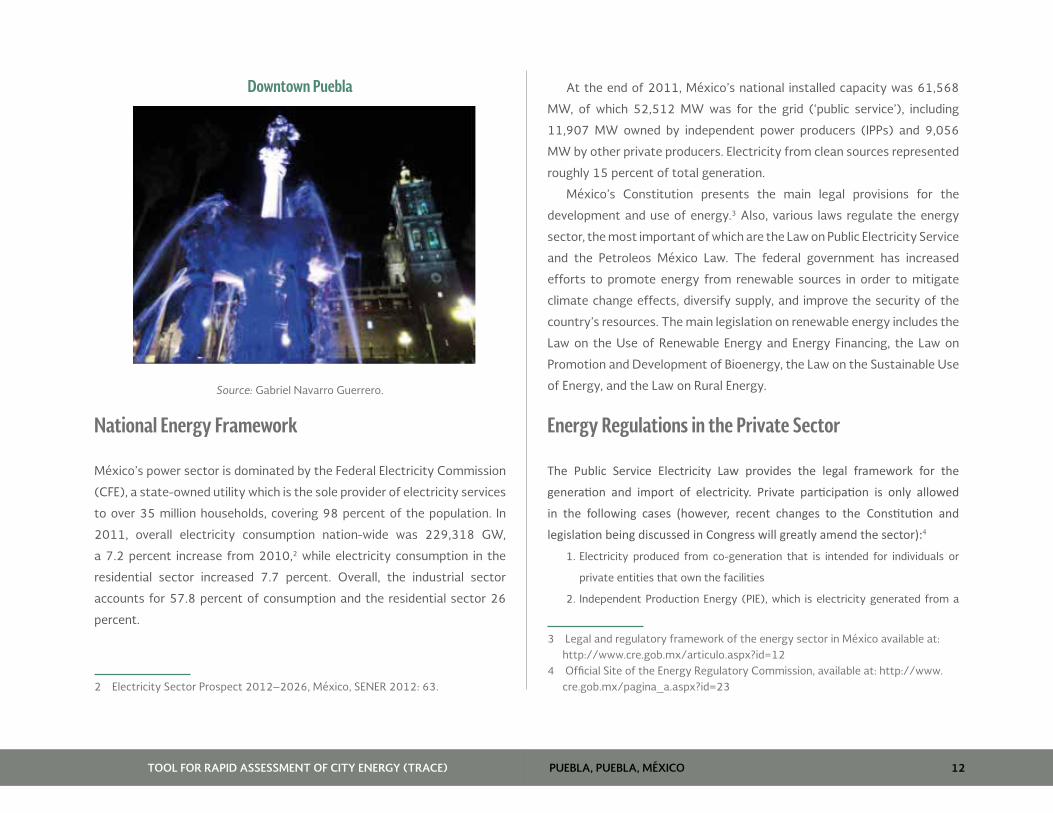
PUEBLA, PUEBLA, MÉXICOTOOL FOR RAPID ASSESSMENT OF CITY ENERGY (TRACE) 12
Downtown Puebla
Source: Gabriel Navarro Guerrero.
National Energy Framework
México’s power sector is dominated by the Federal Electricity Commission
(CFE), a state-owned utility which is the sole provider of electricity services
to over 35 million households, covering 98 percent of the population. In
2011, overall electricity consumption nation-wide was 229,318 GW,
a 7.2 percent increase from 2010,2 while electricity consumption in the
residential sector increased 7.7 percent. Overall, the industrial sector
accounts for 57.8 percent of consumption and the residential sector 26
percent.
2 Electricity Sector Prospect 2012–2026, México, SENER 2012: 63.
At the end of 2011, México’s national installed capacity was 61,568
MW, of which 52,512 MW was for the grid (‘public service’), including
11,907 MW owned by independent power producers (IPPs) and 9,056
MW by other private producers. Electricity from clean sources represented
roughly 15 percent of total generation.
México’s Constitution presents the main legal provisions for the
development and use of energy.3 Also, various laws regulate the energy
sector, the most important of which are the Law on Public Electricity Service
and the Petroleos México Law. The federal government has increased
efforts to promote energy from renewable sources in order to mitigate
climate change effects, diversify supply, and improve the security of the
country’s resources. The main legislation on renewable energy includes the
Law on the Use of Renewable Energy and Energy Financing, the Law on
Promotion and Development of Bioenergy, the Law on the Sustainable Use
of Energy, and the Law on Rural Energy.
Energy Regulations in the Private Sector
The Public Service Electricity Law provides the legal framework for the
generation and import of electricity. Private participation is only allowed
in the following cases (however, recent changes to the Constitution and
legislation being discussed in Congress will greatly amend the sector):4
1. Electricity produced from co-generation that is intended for individuals or
private entities that own the facilities
2. Independent Production Energy (PIE), which is electricity generated from a
3 Legal and regulatory framework of the energy sector in México available at: http://www.cre.gob.mx/articulo.aspx?id=12
4 Official Site of the Energy Regulatory Commission, available at: http://www.cre.gob.mx/pagina_a.aspx?id=23
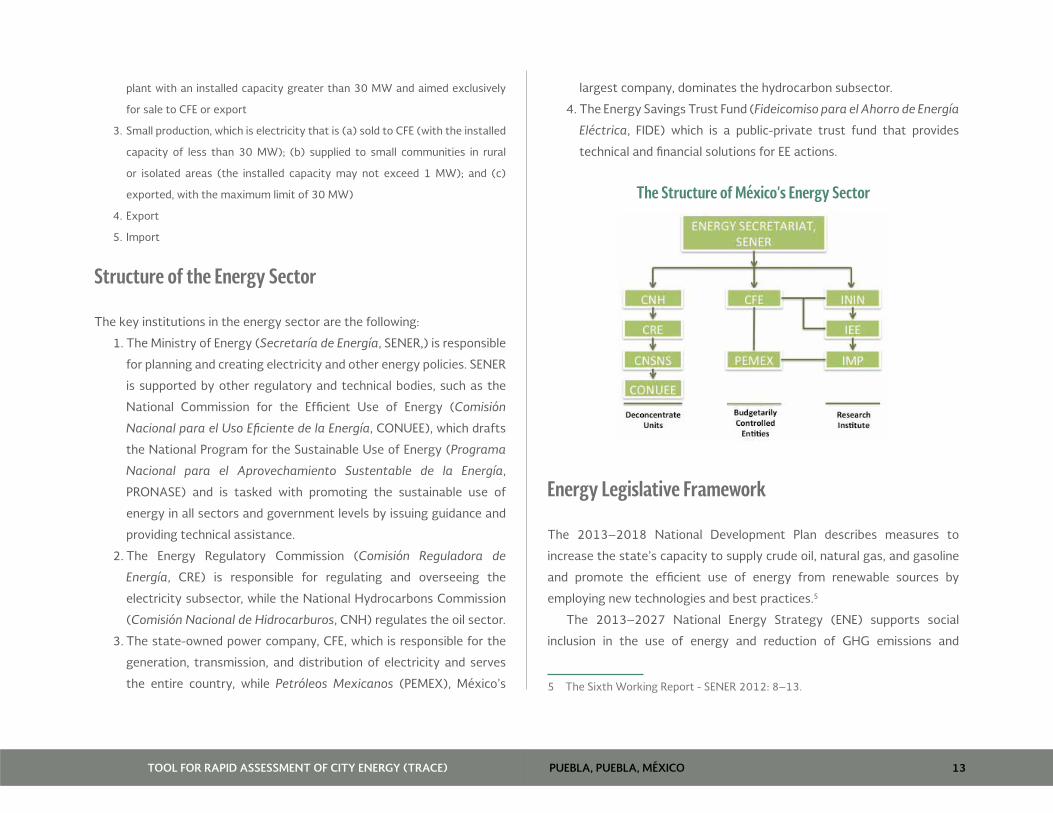
PUEBLA, PUEBLA, MÉXICOTOOL FOR RAPID ASSESSMENT OF CITY ENERGY (TRACE) 13
plant with an installed capacity greater than 30 MW and aimed exclusively
for sale to CFE or export
3. Small production, which is electricity that is (a) sold to CFE (with the installed
capacity of less than 30 MW); (b) supplied to small communities in rural
or isolated areas (the installed capacity may not exceed 1 MW); and (c)
exported, with the maximum limit of 30 MW)
4. Export
5. Import
Structure of the Energy Sector
The key institutions in the energy sector are the following:
1. The Ministry of Energy (Secretaría de Energía, SENER,) is responsible
for planning and creating electricity and other energy policies. SENER
is supported by other regulatory and technical bodies, such as the
National Commission for the Efficient Use of Energy (Comisión
Nacional para el Uso Eficiente de la Energía, CONUEE), which drafts
the National Program for the Sustainable Use of Energy (Programa
Nacional para el Aprovechamiento Sustentable de la Energía,
PRONASE) and is tasked with promoting the sustainable use of
energy in all sectors and government levels by issuing guidance and
providing technical assistance.
2. The Energy Regulatory Commission (Comisión Reguladora de
Energía, CRE) is responsible for regulating and overseeing the
electricity subsector, while the National Hydrocarbons Commission
(Comisión Nacional de Hidrocarburos, CNH) regulates the oil sector.
3. The state-owned power company, CFE, which is responsible for the
generation, transmission, and distribution of electricity and serves
the entire country, while Petróleos Mexicanos (PEMEX), México’s
largest company, dominates the hydrocarbon subsector.
4. The Energy Savings Trust Fund (Fideicomiso para el Ahorro de Energía
Eléctrica, FIDE) which is a public-private trust fund that provides
technical and financial solutions for EE actions.
The Structure of México’s Energy Sector
Energy Legislative Framework
The 2013–2018 National Development Plan describes measures to
increase the state’s capacity to supply crude oil, natural gas, and gasoline
and promote the efficient use of energy from renewable sources by
employing new technologies and best practices.5
The 2013–2027 National Energy Strategy (ENE) supports social
inclusion in the use of energy and reduction of GHG emissions and
5 The Sixth Working Report - SENER 2012: 8–13.
PUEBLA, PUEBLA, MÉXICOTOOL FOR RAPID ASSESSMENT OF CITY ENERGY (TRACE) 14
other negative impacts on health and the environment related to energy
production and consumption.6 The ENE’s overall goal is to develop a
more sustainable and competitive energy sector, meet energy demand,
contribute to the country’s economic growth, and thus improve all
Mexicans’ quality of life.
Recent Developments in the Energy Sector
The energy sector has experienced serious problems in recent years. Oil
production has declined while consumption has continued to increase.
However, investments have recently grown, to compensate for the decline,
and new regulations encourage greater energy production from renewable
sources. In the power sector, 35 percent of electricity is to be generated
from non-fossil sources by 2024. Refineries have undergone major
restructuring, and a large program was introduced to expand the transport
of natural gas.
From 2000 to 2011, energy consumption rose by an average of 2
percent a year, while primary energy production declined by 0.3 percent.
Oil production reached its peak from 2000 to 2004, and then declined
to 2.5 million barrels a day in 2012, despite the fact that hydrocarbon
exploration and production-related investments tripled over the 12
preceding years (from 77,860 million to 251,900 million pesos). Proven
oil reserves also decreased by more than 30 percent, from 20,077 million
barrels of oil equivalent (Mmboe) to 13,810 Mmboe. Further, estimated
reserves dropped by 27.2 percent, from 16,965 Mmboe to 12,353
Mmboe. In recent years, México has become a net importer of gasoline,
diesel, natural gas, liquefied petroleum gas (LPG), and petrochemical
6 National Energy Strategy 2013–2027. SENER 2013: 63–64.
products. If this trend continues, the country will probably face an energy
deficit by 2020.
According to SENER, overall energy consumption in 2011 was 4,735.71
Petajoules (PJ).7 Transport is the most energy-intensive sector, accounting
for almost 50 percent of total consumption. Industry represented 28.8
percent, while the residential sector was 28 percent and agriculture was
about 16 percent. The commercial and public sectors represented less
than 3 percent and 0.6 percent, respectively. The demand for gasoline
and naphtha rose by 31.7 percent due to both population and economic
growth.
According to the National Inventory of Greenhouse Gas Emissions
(INEGI), from 1990 to 2006, the consumption of fossil fuels for energy was
the main GHG source, accounting for 60.7 percent of the total. In 2011,
the total was 498.51 Tg CO2eq, 3.5 percent less than in 2010. Energy
consumption by the transport sector emitted the highest amount (nearly
40 percent), followed by power generation (30.8 percent) and industry
(12.6 percent). México’s goal is to reduce emissions by 30 percent (under
the business-as-usual scenario) by 2020.
Federal and Local Government Authority Regarding Public Utility Services
The Law on Fiscal Coordination regulates the relationship between states
and municipalities with regard to financial and fiscal issues. It establishes
their respective contributions to the federal budget, and defines the fiscal
institutions at the state, municipal and federal levels. Some public utility
services are regulated at the national level through several federal entities,
7 National Energy Balance 2011 - México. SENER. 2012: 39–49.
PUEBLA, PUEBLA, MÉXICOTOOL FOR RAPID ASSESSMENT OF CITY ENERGY (TRACE) 15
such as the Secretariat of Communications and Transport (SCT) for
freight transport, the National Water Commission (CONAGUA) for water,
and Secretariat of the Environment and Natural Resources (SEMARNAT)
for solid waste. In addition, the recently created Secretariat of Agricultural,
Territorial, and Urban Development (SEDATU) is tasked with promoting
urban transport policies.
The federal government provides support for public service projects
and related infrastructure. Municipalities usually obtain this support for
economic, social, real estate, and infrastructure projects (for example,
transport, waste, water, public lights, municipal buildings, and power).
For example, 75 percent of municipal budgets are usually funded by the
national government, while less than 3 percent is financed by the state,
and the rest is from local revenues.
Some TRACE areas are regulated by the federal government, while
others are managed by local authorities, as described below.
1. Transport
Public transport is coordinated and funded by federal and state authorities
while the national government has a monopoly over air, rail, and sea
transport. In a few cases, municipalities (in the states of Guanajuato,
Baja California, Coahuila, and Quintana Roo) are responsible for public
transport. Since 2008, federal funds have been available for integrated
public transport systems through the Programa Federal de Transporte
Masivo (PROTRAM). In these, the sector is organized by private operators
under contracts, and local authorities provide oversight. The latter are
also responsible for enforcing public transport regulations while private
transport is usually regulated by state governments.
2. Solid Waste
At the national level, solid waste is regulated by SEMARNAT. At the local
level, it is under public authorities and private contractors. Landfills are
usually managed by private operators. Public companies usually collect
solid waste from residences while private operators deal with industrial
and commercial waste.
3. Water
The water sector is regulated by CONAGUA and all water sources are
considered the property of the state. Cities pay levies to CONAGUA for
extracting water from wells. A service agency under the local government
typically manages the distribution of potable water, wastewater treatment,
sewage, and drains.
4. Power and Heat
The power sector is under CFE, which is responsible for the overall production,
transmission, and distribution of electricity. However, municipalities can
partner with private companies for self-supply electricity projects. Given
the climate, most cities do not require heating.
5. Municipal Buildings
The municipal building stock managed by cities consists mainly of public
administration offices. Schools and hospitals are usually under federal and
state authorities.
PUEBLA, PUEBLA, MÉXICOTOOL FOR RAPID ASSESSMENT OF CITY ENERGY (TRACE) 16
6. Streetlights
Power for streetlights is usually provided by CFE while the assets are
operated, maintained, and owned by local authorities. In some cities,
private contractors maintain the systems. Most municipalities charge
a public lighting tax known as Derecho sobre Alumbrado Publico (DAP).
Under DAP, all electricity users (including residential clients and private
companies) are required to pay for public streetlights through a levy that
is included in the monthly electricity bill or local taxes. CFE collects the fee
for the municipalities; the amount varies from state to state.
Puebla’s energy efficiency and environment Initiatives
The state of Puebla has developed several initiatives to improve EE and
mitigate climate change effects. For example, the Puebla State Climate
Change Law would allow authorities to dedicate funds for, awareness-
raising campaigns, capital investments and guidelines to mitigate climate
change (for example, reducing industry’s GHG emissions) and urban
environment plans (for example, to settle urban communities in low-risk
areas and restore ecosystems). Puebla’s Strategy for Mitigation of Climate
Change created a commission and council at the state level to develop
climate change-related policies.
Puebla’s air quality is of a medium grade according to the Mexican
Metropolitan Index of Air Quality (IMECA), which rates it on average at 42
points out of 100. A 2010 Federal Commission on Health Risks COFREPIS
showed that the cost of medical treatment in Puebla for pollution-related
illnesses (such as respiratory problems) can be as high as 813 million pesos
(over US$61 million). To address the health issues, the state created the Air
Quality Program Management ‘Proaire 2012–2020’ to reverse air quality
deterioration and reduce emissions. However, recent economic growth has
created higher energy demand and use of more fossil fuels, which increased
pollution/emissions. Thus, the program brings together stakeholders, such
as the local government, academia, and civil society, to identify the best
solutions. Besides enforcing industrial environmental standards, the city
(under the program) requires vehicles to have mandatory emission control
tests and install emission control devices.
The Puebla Municipal Climate Action Plan (PACMUN) is a tool that was
created to develop policies that will reduce GHG emissions and respond
to climate change. The initiative calls for adopting efficient technologies,
such as electromagnetic induction in public lights, promoting BRTs, and
expanding pedestrian walkways and bike lanes. It seeks funds to develop
activities to reduce GHGs, and promote research and new technologies
related to climate change mitigation. Also, it aims to (a) reduce Puebla’s
CO2 emissions by 2 percent in the next five years, (b) update the database
on GHG emissions, (c) review the emissions inventory in different sectors,
(d) execute at least five climate change-related initiatives until 2014, and
(e) monitor results in the short, medium, and long term.
The Energy Security and Sustainability Program for the State of Puebla
aims to foster EE projects and clean energy technologies. One of the city’s
latest initiatives set a target of 200 m2 of green area per person, which
means 20 percent of the city area would be converted to green space.

PUEBLA, PUEBLA, MÉXICO 17TOOL FOR RAPID ASSESSMENT OF CITY ENERGY (TRACE)
SECTOR DIAGNOSTICS
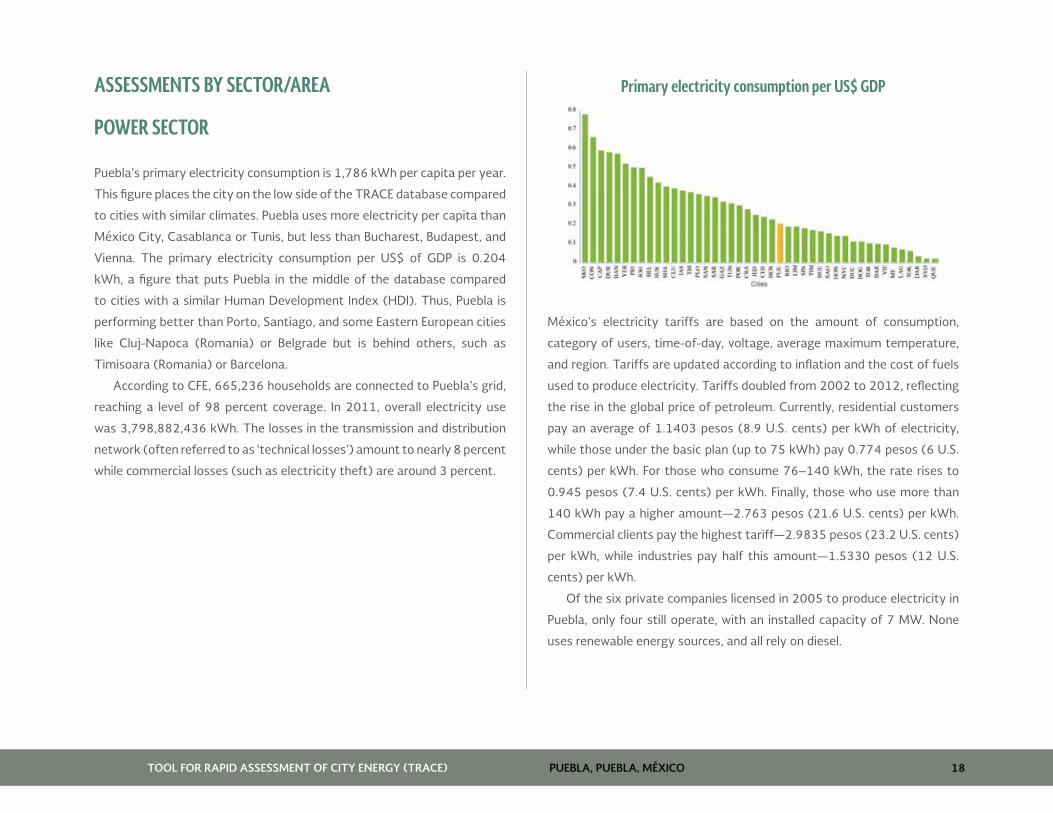
PUEBLA, PUEBLA, MÉXICOTOOL FOR RAPID ASSESSMENT OF CITY ENERGY (TRACE) 18
ASSESSMENTS BY SECTOR/AREA
POWER SECTOR
Puebla’s primary electricity consumption is 1,786 kWh per capita per year.
This figure places the city on the low side of the TRACE database compared
to cities with similar climates. Puebla uses more electricity per capita than
México City, Casablanca or Tunis, but less than Bucharest, Budapest, and
Vienna. The primary electricity consumption per US$ of GDP is 0.204
kWh, a figure that puts Puebla in the middle of the database compared
to cities with a similar Human Development Index (HDI). Thus, Puebla is
performing better than Porto, Santiago, and some Eastern European cities
like Cluj-Napoca (Romania) or Belgrade but is behind others, such as
Timisoara (Romania) or Barcelona.
According to CFE, 665,236 households are connected to Puebla’s grid,
reaching a level of 98 percent coverage. In 2011, overall electricity use
was 3,798,882,436 kWh. The losses in the transmission and distribution
network (often referred to as ‘technical losses’) amount to nearly 8 percent
while commercial losses (such as electricity theft) are around 3 percent.
Primary electricity consumption per US$ GDP
México’s electricity tariffs are based on the amount of consumption,
category of users, time-of-day, voltage, average maximum temperature,
and region. Tariffs are updated according to inflation and the cost of fuels
used to produce electricity. Tariffs doubled from 2002 to 2012, reflecting
the rise in the global price of petroleum. Currently, residential customers
pay an average of 1.1403 pesos (8.9 U.S. cents) per kWh of electricity,
while those under the basic plan (up to 75 kWh) pay 0.774 pesos (6 U.S.
cents) per kWh. For those who consume 76–140 kWh, the rate rises to
0.945 pesos (7.4 U.S. cents) per kWh. Finally, those who use more than
140 kWh pay a higher amount—2.763 pesos (21.6 U.S. cents) per kWh.
Commercial clients pay the highest tariff—2.9835 pesos (23.2 U.S. cents)
per kWh, while industries pay half this amount—1.5330 pesos (12 U.S.
cents) per kWh.
Of the six private companies licensed in 2005 to produce electricity in
Puebla, only four still operate, with an installed capacity of 7 MW. None
uses renewable energy sources, and all rely on diesel.
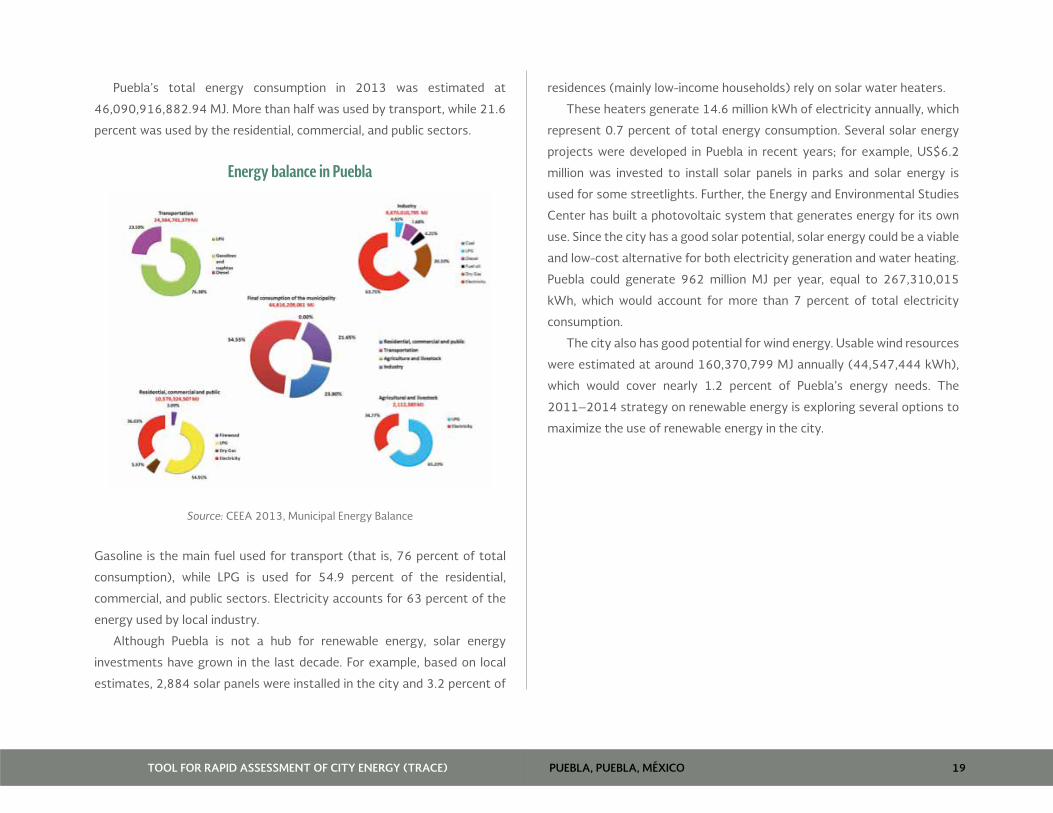
PUEBLA, PUEBLA, MÉXICOTOOL FOR RAPID ASSESSMENT OF CITY ENERGY (TRACE) 19
Puebla’s total energy consumption in 2013 was estimated at
46,090,916,882.94 MJ. More than half was used by transport, while 21.6
percent was used by the residential, commercial, and public sectors.
Energy balance in Puebla
Source: CEEA 2013, Municipal Energy Balance
Gasoline is the main fuel used for transport (that is, 76 percent of total
consumption), while LPG is used for 54.9 percent of the residential,
commercial, and public sectors. Electricity accounts for 63 percent of the
energy used by local industry.
Although Puebla is not a hub for renewable energy, solar energy
investments have grown in the last decade. For example, based on local
estimates, 2,884 solar panels were installed in the city and 3.2 percent of
residences (mainly low-income households) rely on solar water heaters.
These heaters generate 14.6 million kWh of electricity annually, which
represent 0.7 percent of total energy consumption. Several solar energy
projects were developed in Puebla in recent years; for example, US$6.2
million was invested to install solar panels in parks and solar energy is
used for some streetlights. Further, the Energy and Environmental Studies
Center has built a photovoltaic system that generates energy for its own
use. Since the city has a good solar potential, solar energy could be a viable
and low-cost alternative for both electricity generation and water heating.
Puebla could generate 962 million MJ per year, equal to 267,310,015
kWh, which would account for more than 7 percent of total electricity
consumption.
The city also has good potential for wind energy. Usable wind resources
were estimated at around 160,370,799 MJ annually (44,547,444 kWh),
which would cover nearly 1.2 percent of Puebla’s energy needs. The
2011–2014 strategy on renewable energy is exploring several options to
maximize the use of renewable energy in the city.
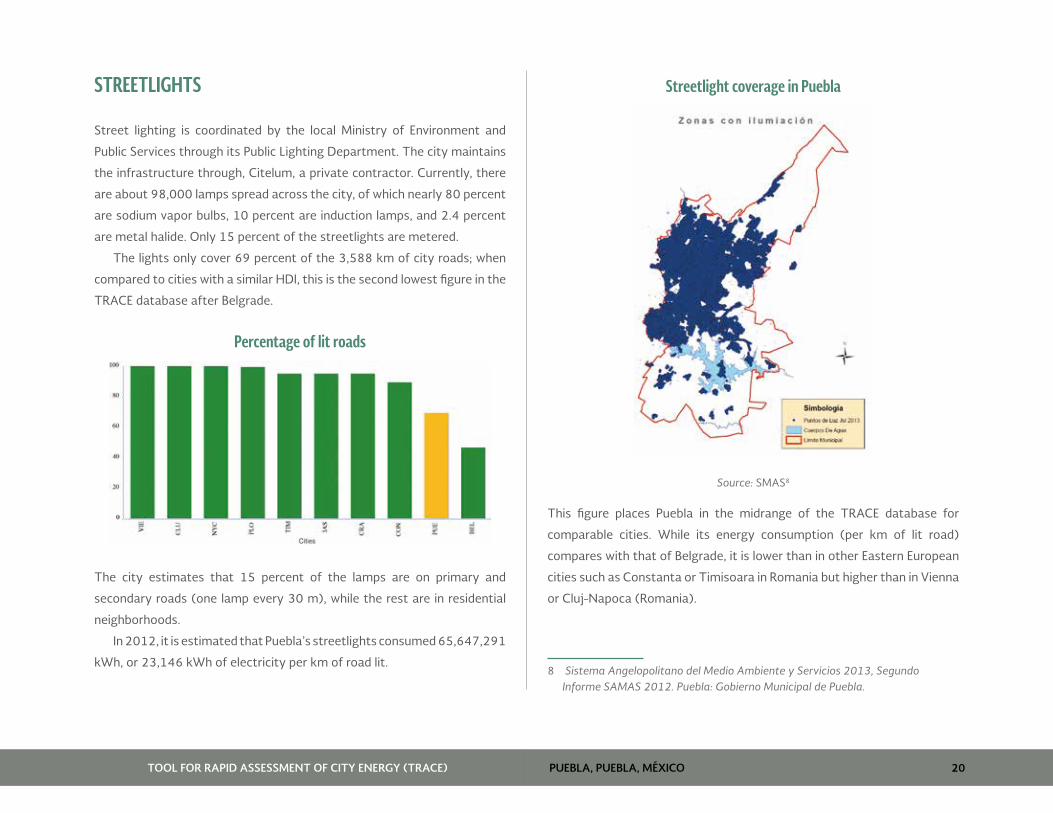
PUEBLA, PUEBLA, MÉXICOTOOL FOR RAPID ASSESSMENT OF CITY ENERGY (TRACE) 20
STREETLIGHTS
Street lighting is coordinated by the local Ministry of Environment and
Public Services through its Public Lighting Department. The city maintains
the infrastructure through, Citelum, a private contractor. Currently, there
are about 98,000 lamps spread across the city, of which nearly 80 percent
are sodium vapor bulbs, 10 percent are induction lamps, and 2.4 percent
are metal halide. Only 15 percent of the streetlights are metered.
The lights only cover 69 percent of the 3,588 km of city roads; when
compared to cities with a similar HDI, this is the second lowest figure in the
TRACE database after Belgrade.
Percentage of lit roads
The city estimates that 15 percent of the lamps are on primary and
secondary roads (one lamp every 30 m), while the rest are in residential
neighborhoods.
In 2012, it is estimated that Puebla’s streetlights consumed 65,647,291
kWh, or 23,146 kWh of electricity per km of road lit.
Streetlight coverage in Puebla
Source: SMAS8
This figure places Puebla in the midrange of the TRACE database for
comparable cities. While its energy consumption (per km of lit road)
compares with that of Belgrade, it is lower than in other Eastern European
cities such as Constanta or Timisoara in Romania but higher than in Vienna
or Cluj-Napoca (Romania).
8 Sistema Angelopolitano del Medio Ambiente y Servicios 2013, Segundo Informe SAMAS 2012. Puebla: Gobierno Municipal de Puebla.
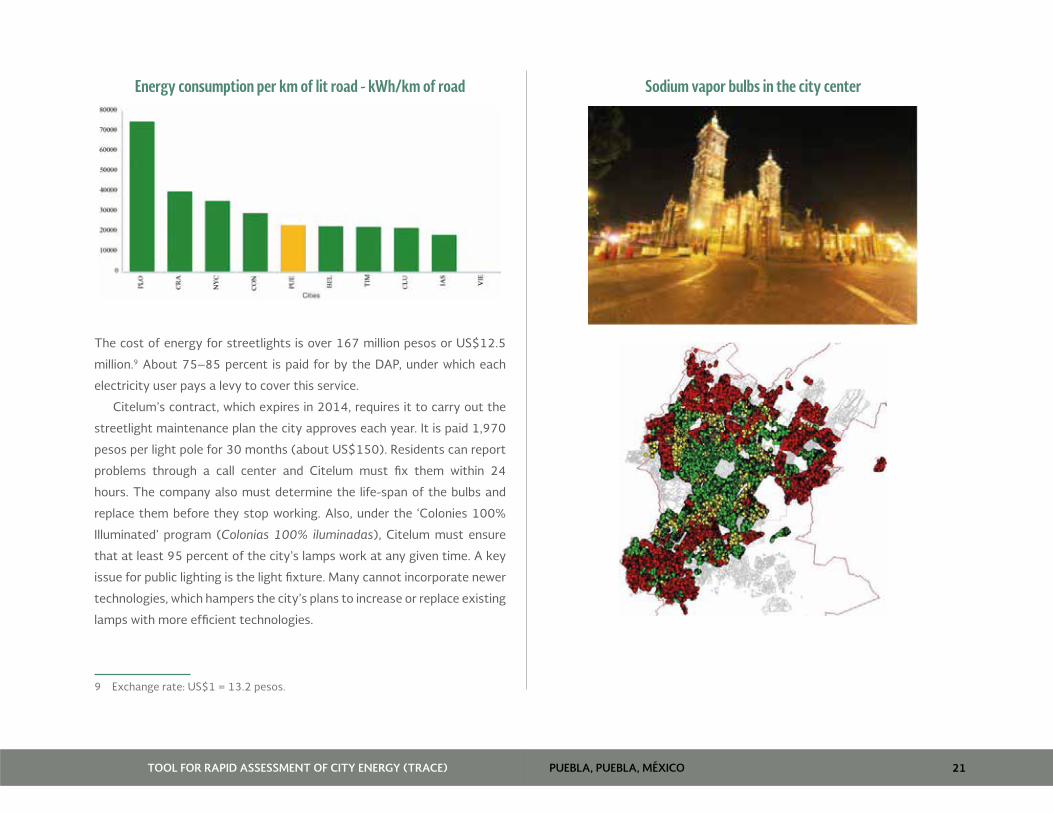
PUEBLA, PUEBLA, MÉXICOTOOL FOR RAPID ASSESSMENT OF CITY ENERGY (TRACE) 21
Energy consumption per km of lit road - kWh/km of road
The cost of energy for streetlights is over 167 million pesos or US$12.5
million.9 About 75–85 percent is paid for by the DAP, under which each
electricity user pays a levy to cover this service.
Citelum’s contract, which expires in 2014, requires it to carry out the
streetlight maintenance plan the city approves each year. It is paid 1,970
pesos per light pole for 30 months (about US$150). Residents can report
problems through a call center and Citelum must fix them within 24
hours. The company also must determine the life-span of the bulbs and
replace them before they stop working. Also, under the ‘Colonies 100%
Illuminated’ program (Colonias 100% iluminadas), Citelum must ensure
that at least 95 percent of the city’s lamps work at any given time. A key
issue for public lighting is the light fixture. Many cannot incorporate newer
technologies, which hampers the city’s plans to increase or replace existing
lamps with more efficient technologies.
9 Exchange rate: US$1 = 13.2 pesos.
Sodium vapor bulbs in the city center

PUEBLA, PUEBLA, MÉXICOTOOL FOR RAPID ASSESSMENT OF CITY ENERGY (TRACE) 22
In recent years, the city has tried to upgrade the system, for example,
buying magnetic induction and metal halide lamps and using LEDs for some
ornamental and seasonal lights. Also, a pilot streetlight dimming program
was adopted on Avenida Juárez, one of the main roads, where the lamps
are dimmed from 8 p.m. to 3 a.m., depending on traffic. In the near future,
the city also plans to expand coverage by 10,000 lamps in areas that are
still not lit or where service is deficient.
Also, the city intends to replace sodium vapor bulbs with LEDs with
money from its budget and a credit line from the federal government. This
program will help municipalities upgrade/improve their lighting systems,
thus significantly reducing electricity consumption.
A pre-feasibility study is underway to assess the potential energy
savings if LEDs were installed. Some technical problems that might arise
with a widespread switch to LEDs are the fluctuations in electricity voltage,
lack of meters, and incompatibility of existing technologies and fixtures.
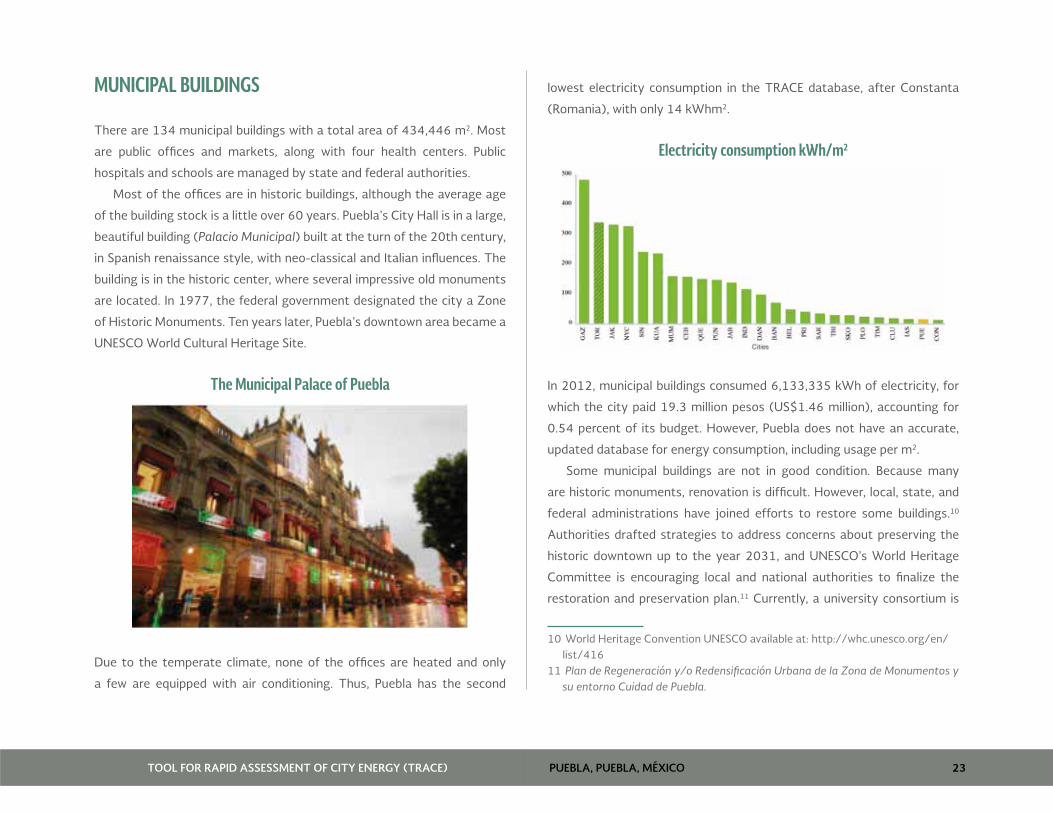
PUEBLA, PUEBLA, MÉXICOTOOL FOR RAPID ASSESSMENT OF CITY ENERGY (TRACE) 23
MUNICIPAL BUILDINGS
There are 134 municipal buildings with a total area of 434,446 m2. Most
are public offices and markets, along with four health centers. Public
hospitals and schools are managed by state and federal authorities.
Most of the offices are in historic buildings, although the average age
of the building stock is a little over 60 years. Puebla’s City Hall is in a large,
beautiful building (Palacio Municipal) built at the turn of the 20th century,
in Spanish renaissance style, with neo-classical and Italian influences. The
building is in the historic center, where several impressive old monuments
are located. In 1977, the federal government designated the city a Zone
of Historic Monuments. Ten years later, Puebla’s downtown area became a
UNESCO World Cultural Heritage Site.
The Municipal Palace of Puebla
Due to the temperate climate, none of the offices are heated and only
a few are equipped with air conditioning. Thus, Puebla has the second
lowest electricity consumption in the TRACE database, after Constanta
(Romania), with only 14 kWhm2.
Electricity consumption kWh/m2
In 2012, municipal buildings consumed 6,133,335 kWh of electricity, for
which the city paid 19.3 million pesos (US$1.46 million), accounting for
0.54 percent of its budget. However, Puebla does not have an accurate,
updated database for energy consumption, including usage per m2.
Some municipal buildings are not in good condition. Because many
are historic monuments, renovation is difficult. However, local, state, and
federal administrations have joined efforts to restore some buildings.10
Authorities drafted strategies to address concerns about preserving the
historic downtown up to the year 2031, and UNESCO’s World Heritage
Committee is encouraging local and national authorities to finalize the
restoration and preservation plan.11 Currently, a university consortium is
10 World Heritage Convention UNESCO available at: http://whc.unesco.org/en/list/416
11 Plan de Regeneración y/o Redensificación Urbana de la Zona de Monumentos y su entorno Cuidad de Puebla.

PUEBLA, PUEBLA, MÉXICOTOOL FOR RAPID ASSESSMENT OF CITY ENERGY (TRACE) 24
working on updating the Partial Program for the Historic Centre as well as
designing a plan to achieve the goals set for the next 15 years.
Historic buildings in downtown Puebla
A state initiative to help the city offices become more efficient was approved
in 2011. The program supports measures with regard to energy, water,
and solid waste, including building maintenance and refurbishing plans. So
far, the program has lowered energy consumption in three buildings.12
Local authorities are encouraging city residents and building owners to
develop solar energy facilities, since the region has great solar potential.
Moreover, solar energy investments are becoming increasingly attractive
in México as technology costs have dropped and electricity tariffs have
increased.
12 Programa de Excelencia Ambiental - Ecoeficiencias, Secretaria de Desarrollo Rural, Sustentabilidad y Ordenamiento Territorial, SDRSOT, 2013.
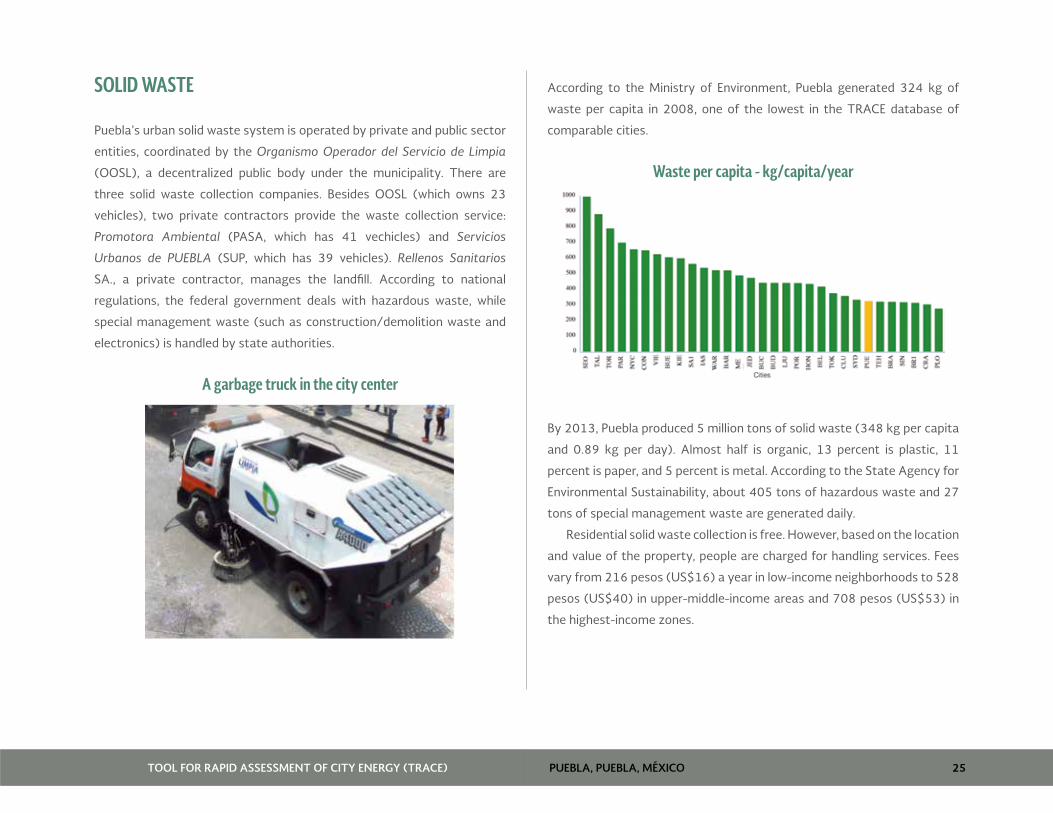
PUEBLA, PUEBLA, MÉXICOTOOL FOR RAPID ASSESSMENT OF CITY ENERGY (TRACE) 25
SOLID WASTE
Puebla’s urban solid waste system is operated by private and public sector
entities, coordinated by the Organismo Operador del Servicio de Limpia
(OOSL), a decentralized public body under the municipality. There are
three solid waste collection companies. Besides OOSL (which owns 23
vehicles), two private contractors provide the waste collection service:
Promotora Ambiental (PASA, which has 41 vechicles) and Servicios
Urbanos de PUEBLA (SUP, which has 39 vehicles). Rellenos Sanitarios
SA., a private contractor, manages the landfill. According to national
regulations, the federal government deals with hazardous waste, while
special management waste (such as construction/demolition waste and
electronics) is handled by state authorities.
A garbage truck in the city center
According to the Ministry of Environment, Puebla generated 324 kg of
waste per capita in 2008, one of the lowest in the TRACE database of
comparable cities.
Waste per capita - kg/capita/year
By 2013, Puebla produced 5 million tons of solid waste (348 kg per capita
and 0.89 kg per day). Almost half is organic, 13 percent is plastic, 11
percent is paper, and 5 percent is metal. According to the State Agency for
Environmental Sustainability, about 405 tons of hazardous waste and 27
tons of special management waste are generated daily.
Residential solid waste collection is free. However, based on the location
and value of the property, people are charged for handling services. Fees
vary from 216 pesos (US$16) a year in low-income neighborhoods to 528
pesos (US$40) in upper-middle-income areas and 708 pesos (US$53) in
the highest-income zones.
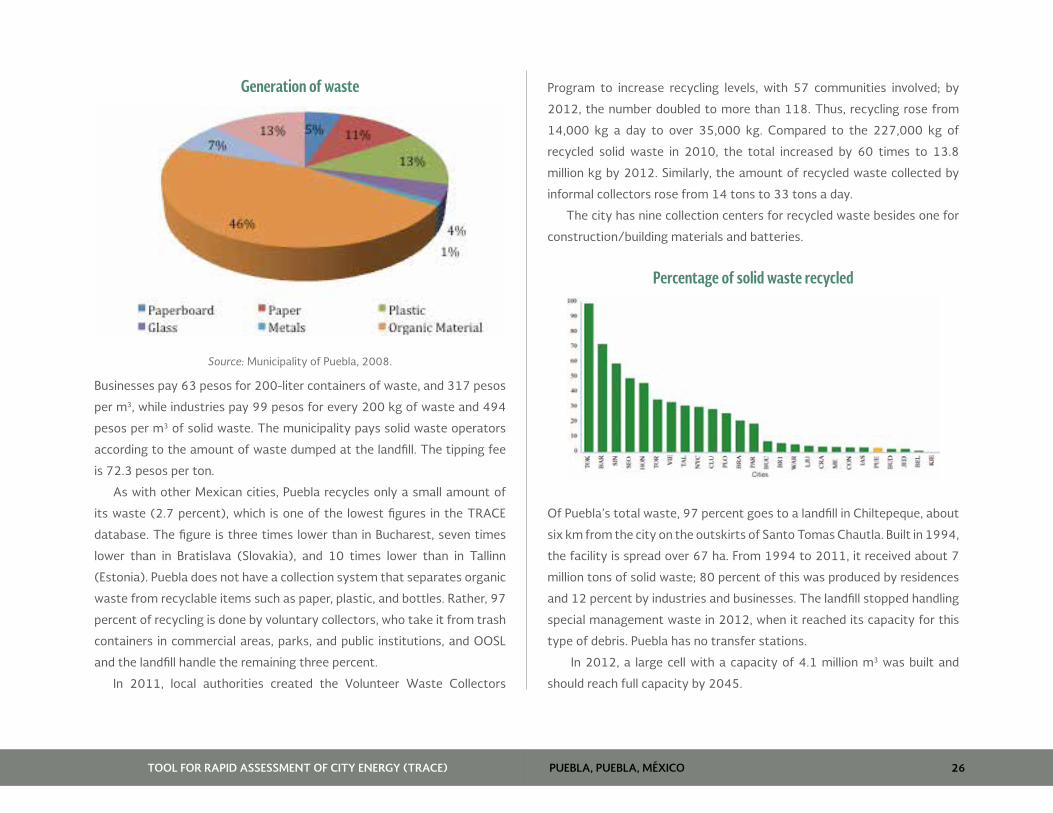
PUEBLA, PUEBLA, MÉXICOTOOL FOR RAPID ASSESSMENT OF CITY ENERGY (TRACE) 26
Generation of waste
Source: Municipality of Puebla, 2008.
Businesses pay 63 pesos for 200-liter containers of waste, and 317 pesos
per m3, while industries pay 99 pesos for every 200 kg of waste and 494
pesos per m3 of solid waste. The municipality pays solid waste operators
according to the amount of waste dumped at the landfill. The tipping fee
is 72.3 pesos per ton.
As with other Mexican cities, Puebla recycles only a small amount of
its waste (2.7 percent), which is one of the lowest figures in the TRACE
database. The figure is three times lower than in Bucharest, seven times
lower than in Bratislava (Slovakia), and 10 times lower than in Tallinn
(Estonia). Puebla does not have a collection system that separates organic
waste from recyclable items such as paper, plastic, and bottles. Rather, 97
percent of recycling is done by voluntary collectors, who take it from trash
containers in commercial areas, parks, and public institutions, and OOSL
and the landfill handle the remaining three percent.
In 2011, local authorities created the Volunteer Waste Collectors
Program to increase recycling levels, with 57 communities involved; by
2012, the number doubled to more than 118. Thus, recycling rose from
14,000 kg a day to over 35,000 kg. Compared to the 227,000 kg of
recycled solid waste in 2010, the total increased by 60 times to 13.8
million kg by 2012. Similarly, the amount of recycled waste collected by
informal collectors rose from 14 tons to 33 tons a day.
The city has nine collection centers for recycled waste besides one for
construction/building materials and batteries.
Percentage of solid waste recycled
Of Puebla’s total waste, 97 percent goes to a landfill in Chiltepeque, about
six km from the city on the outskirts of Santo Tomas Chautla. Built in 1994,
the facility is spread over 67 ha. From 1994 to 2011, it received about 7
million tons of solid waste; 80 percent of this was produced by residences
and 12 percent by industries and businesses. The landfill stopped handling
special management waste in 2012, when it reached its capacity for this
type of debris. Puebla has no transfer stations.
In 2012, a large cell with a capacity of 4.1 million m3 was built and
should reach full capacity by 2045.
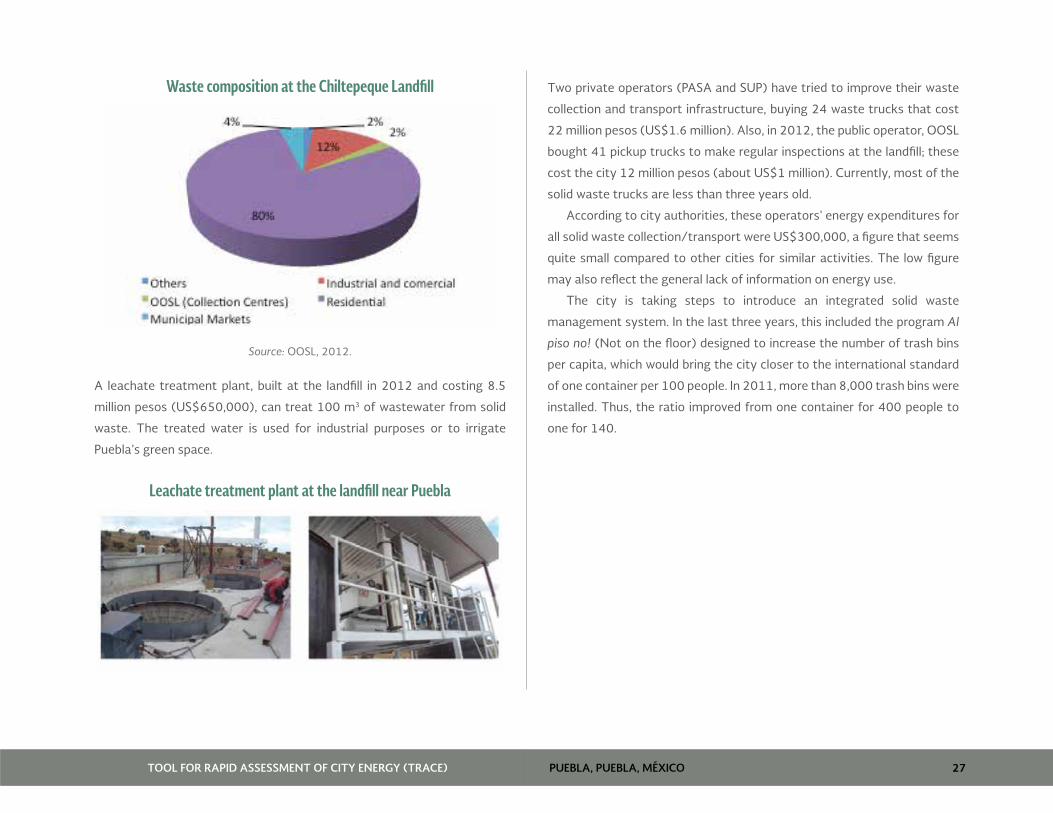
PUEBLA, PUEBLA, MÉXICOTOOL FOR RAPID ASSESSMENT OF CITY ENERGY (TRACE) 27
Waste composition at the Chiltepeque Landfill
Source: OOSL, 2012.
A leachate treatment plant, built at the landfill in 2012 and costing 8.5
million pesos (US$650,000), can treat 100 m3 of wastewater from solid
waste. The treated water is used for industrial purposes or to irrigate
Puebla’s green space.
Leachate treatment plant at the landfill near Puebla
Two private operators (PASA and SUP) have tried to improve their waste
collection and transport infrastructure, buying 24 waste trucks that cost
22 million pesos (US$1.6 million). Also, in 2012, the public operator, OOSL
bought 41 pickup trucks to make regular inspections at the landfill; these
cost the city 12 million pesos (about US$1 million). Currently, most of the
solid waste trucks are less than three years old.
According to city authorities, these operators’ energy expenditures for
all solid waste collection/transport were US$300,000, a figure that seems
quite small compared to other cities for similar activities. The low figure
may also reflect the general lack of information on energy use.
The city is taking steps to introduce an integrated solid waste
management system. In the last three years, this included the program Al
piso no! (Not on the floor) designed to increase the number of trash bins
per capita, which would bring the city closer to the international standard
of one container per 100 people. In 2011, more than 8,000 trash bins were
installed. Thus, the ratio improved from one container for 400 people to
one for 140.

PUEBLA, PUEBLA, MÉXICOTOOL FOR RAPID ASSESSMENT OF CITY ENERGY (TRACE) 28
Trash bins in Puebla
Recently, the city and private sector launched a joint program, Basura por
Seguridad (Trash for Safety), to increase the amount of recycled trash.
The city sells the plastic, paper, and metal collected by residents to private
entities, and the proceeds go to a fund to increase public safety.
The increased waste at the landfill is a growing concern. Initially, a waste
treatment plant to convert solid waste into energy was proposed, but the
plan was dropped due to laws that reduced its economic attractiveness to
independent energy producers of waste-to-energy schemes. Thus, the city
is exploring the option of producing biofuel through thermal treatment,
and selling it to the local petrochemical industry.
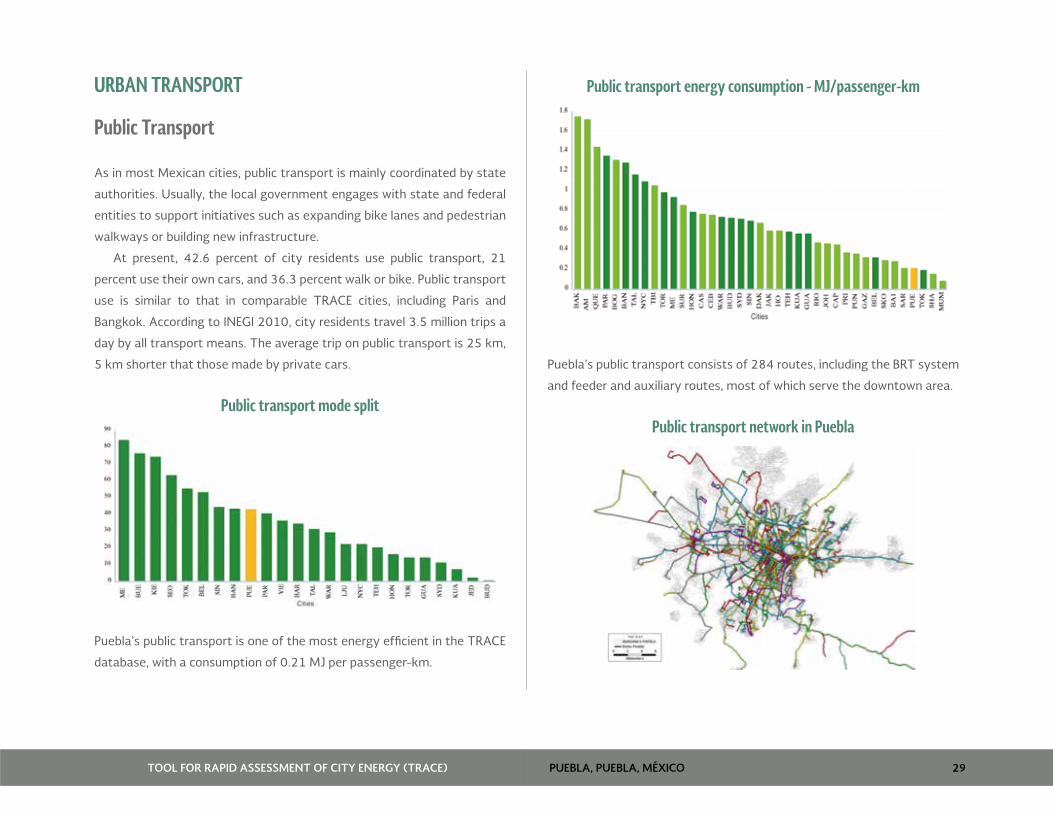
PUEBLA, PUEBLA, MÉXICOTOOL FOR RAPID ASSESSMENT OF CITY ENERGY (TRACE) 29
URBAN TRANSPORT
Public Transport
As in most Mexican cities, public transport is mainly coordinated by state
authorities. Usually, the local government engages with state and federal
entities to support initiatives such as expanding bike lanes and pedestrian
walkways or building new infrastructure.
At present, 42.6 percent of city residents use public transport, 21
percent use their own cars, and 36.3 percent walk or bike. Public transport
use is similar to that in comparable TRACE cities, including Paris and
Bangkok. According to INEGI 2010, city residents travel 3.5 million trips a
day by all transport means. The average trip on public transport is 25 km,
5 km shorter that those made by private cars.
Public transport mode split
Puebla’s public transport is one of the most energy efficient in the TRACE
database, with a consumption of 0.21 MJ per passenger-km.
Public transport energy consumption - MJ/passenger-km
Puebla’s public transport consists of 284 routes, including the BRT system
and feeder and auxiliary routes, most of which serve the downtown area.
Public transport network in Puebla
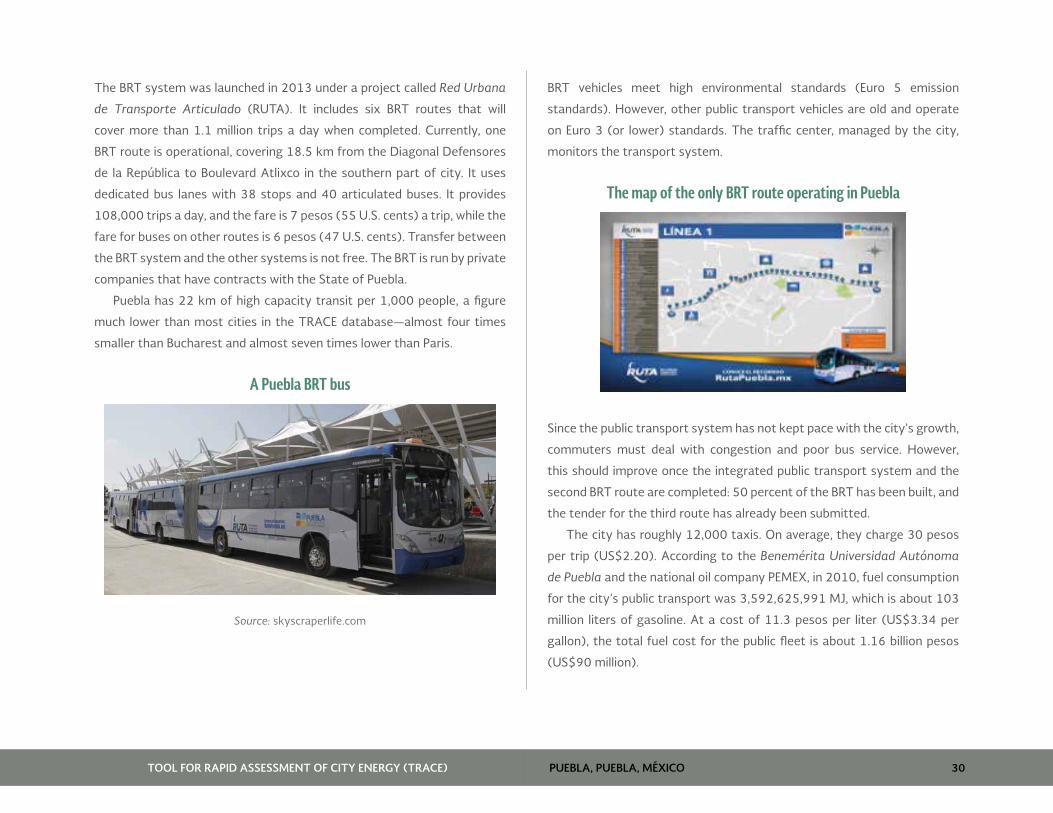
PUEBLA, PUEBLA, MÉXICOTOOL FOR RAPID ASSESSMENT OF CITY ENERGY (TRACE) 30
The BRT system was launched in 2013 under a project called Red Urbana
de Transporte Articulado (RUTA). It includes six BRT routes that will
cover more than 1.1 million trips a day when completed. Currently, one
BRT route is operational, covering 18.5 km from the Diagonal Defensores
de la República to Boulevard Atlixco in the southern part of city. It uses
dedicated bus lanes with 38 stops and 40 articulated buses. It provides
108,000 trips a day, and the fare is 7 pesos (55 U.S. cents) a trip, while the
fare for buses on other routes is 6 pesos (47 U.S. cents). Transfer between
the BRT system and the other systems is not free. The BRT is run by private
companies that have contracts with the State of Puebla.
Puebla has 22 km of high capacity transit per 1,000 people, a figure
much lower than most cities in the TRACE database—almost four times
smaller than Bucharest and almost seven times lower than Paris.
A Puebla BRT bus
Source: skyscraperlife.com
BRT vehicles meet high environmental standards (Euro 5 emission
standards). However, other public transport vehicles are old and operate
on Euro 3 (or lower) standards. The traffic center, managed by the city,
monitors the transport system.
The map of the only BRT route operating in Puebla
Since the public transport system has not kept pace with the city’s growth,
commuters must deal with congestion and poor bus service. However,
this should improve once the integrated public transport system and the
second BRT route are completed: 50 percent of the BRT has been built, and
the tender for the third route has already been submitted.
The city has roughly 12,000 taxis. On average, they charge 30 pesos
per trip (US$2.20). According to the Benemérita Universidad Autónoma
de Puebla and the national oil company PEMEX, in 2010, fuel consumption
for the city’s public transport was 3,592,625,991 MJ, which is about 103
million liters of gasoline. At a cost of 11.3 pesos per liter (US$3.34 per
gallon), the total fuel cost for the public fleet is about 1.16 billion pesos
(US$90 million).
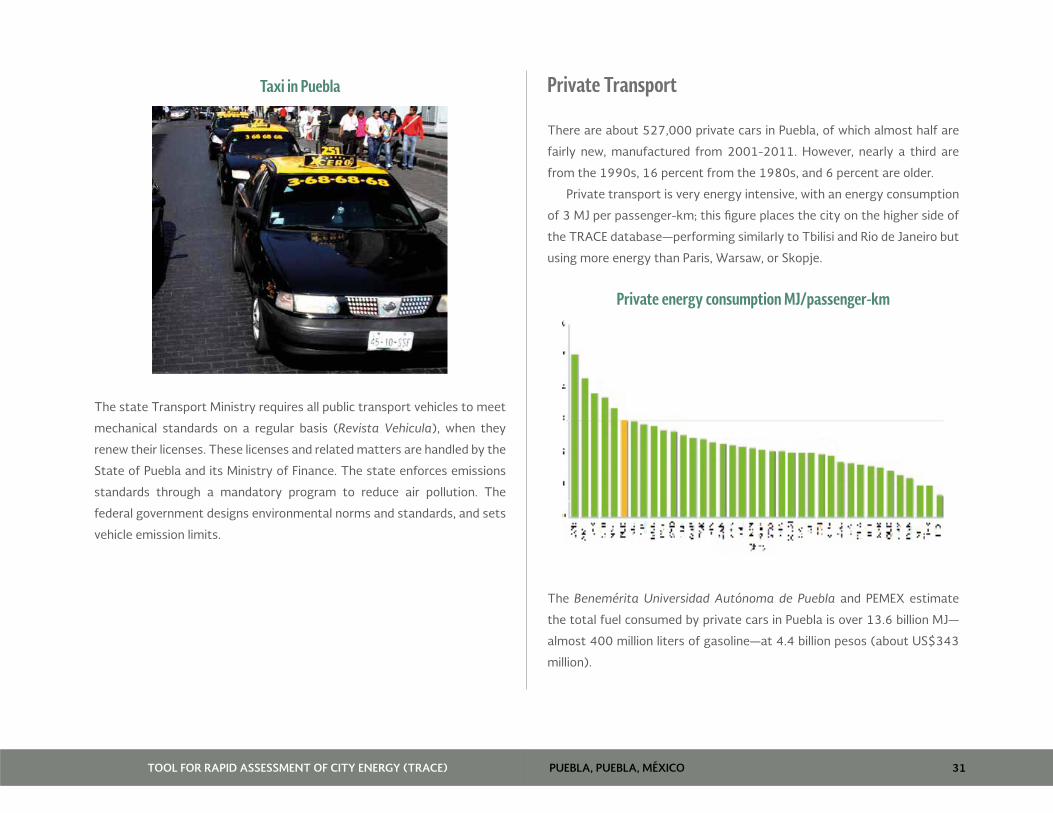
PUEBLA, PUEBLA, MÉXICOTOOL FOR RAPID ASSESSMENT OF CITY ENERGY (TRACE) 31
Taxi in Puebla
The state Transport Ministry requires all public transport vehicles to meet
mechanical standards on a regular basis (Revista Vehicula), when they
renew their licenses. These licenses and related matters are handled by the
State of Puebla and its Ministry of Finance. The state enforces emissions
standards through a mandatory program to reduce air pollution. The
federal government designs environmental norms and standards, and sets
vehicle emission limits.
Private Transport
There are about 527,000 private cars in Puebla, of which almost half are
fairly new, manufactured from 2001-2011. However, nearly a third are
from the 1990s, 16 percent from the 1980s, and 6 percent are older.
Private transport is very energy intensive, with an energy consumption
of 3 MJ per passenger-km; this figure places the city on the higher side of
the TRACE database—performing similarly to Tbilisi and Rio de Janeiro but
using more energy than Paris, Warsaw, or Skopje.
Private energy consumption MJ/passenger-km
The Benemérita Universidad Autónoma de Puebla and PEMEX estimate
the total fuel consumed by private cars in Puebla is over 13.6 billion MJ—
almost 400 million liters of gasoline—at 4.4 billion pesos (about US$343
million).
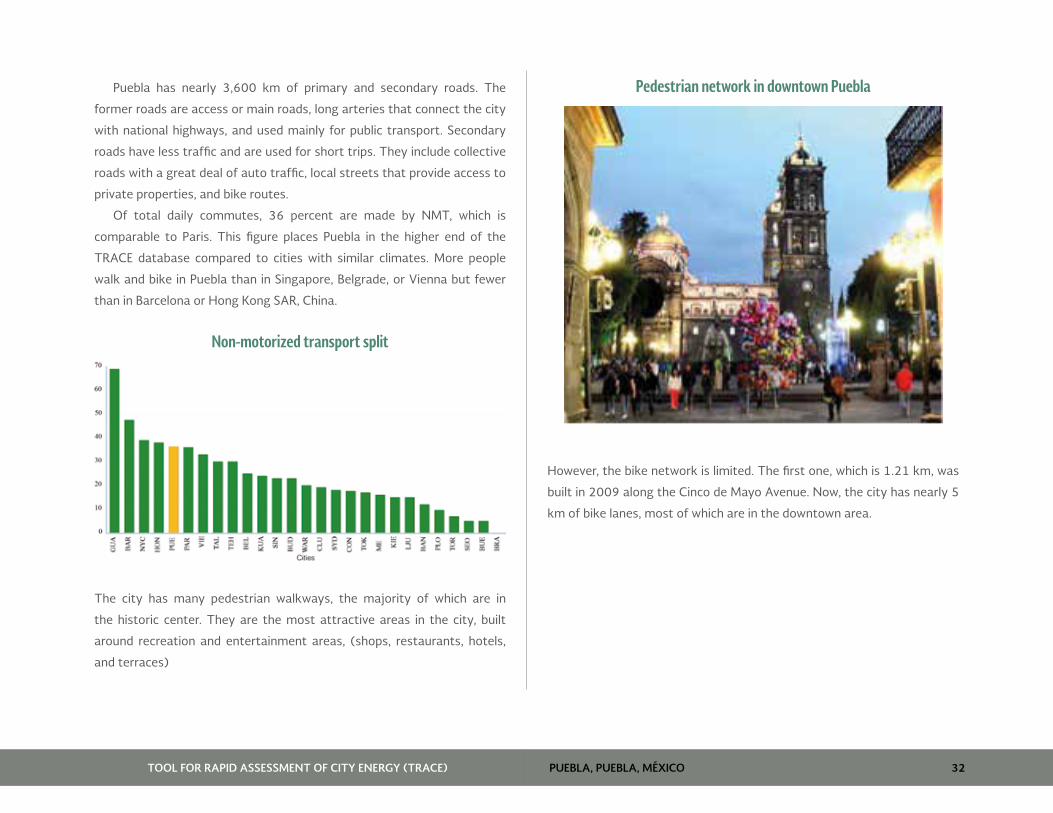
PUEBLA, PUEBLA, MÉXICOTOOL FOR RAPID ASSESSMENT OF CITY ENERGY (TRACE) 32
Puebla has nearly 3,600 km of primary and secondary roads. The
former roads are access or main roads, long arteries that connect the city
with national highways, and used mainly for public transport. Secondary
roads have less traffic and are used for short trips. They include collective
roads with a great deal of auto traffic, local streets that provide access to
private properties, and bike routes.
Of total daily commutes, 36 percent are made by NMT, which is
comparable to Paris. This figure places Puebla in the higher end of the
TRACE database compared to cities with similar climates. More people
walk and bike in Puebla than in Singapore, Belgrade, or Vienna but fewer
than in Barcelona or Hong Kong SAR, China.
Non-motorized transport split
The city has many pedestrian walkways, the majority of which are in
the historic center. They are the most attractive areas in the city, built
around recreation and entertainment areas, (shops, restaurants, hotels,
and terraces)
Pedestrian network in downtown Puebla
However, the bike network is limited. The first one, which is 1.21 km, was
built in 2009 along the Cinco de Mayo Avenue. Now, the city has nearly 5
km of bike lanes, most of which are in the downtown area.
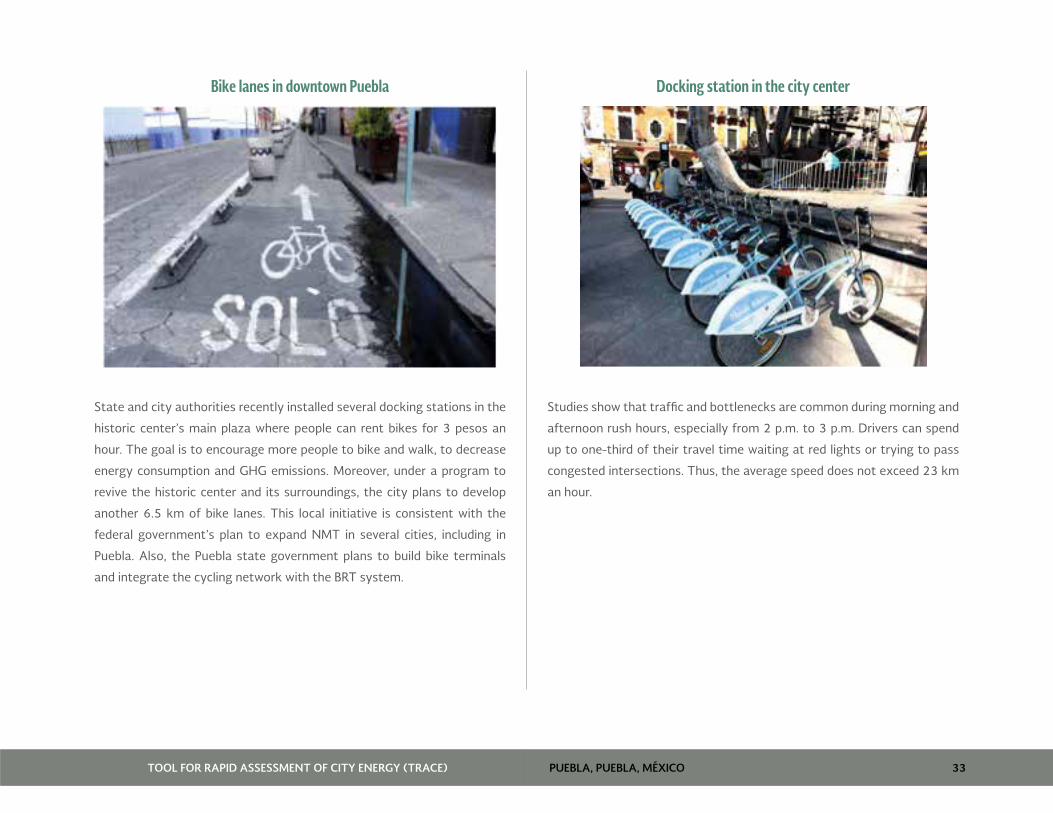
PUEBLA, PUEBLA, MÉXICOTOOL FOR RAPID ASSESSMENT OF CITY ENERGY (TRACE) 33
Bike lanes in downtown Puebla
State and city authorities recently installed several docking stations in the
historic center’s main plaza where people can rent bikes for 3 pesos an
hour. The goal is to encourage more people to bike and walk, to decrease
energy consumption and GHG emissions. Moreover, under a program to
revive the historic center and its surroundings, the city plans to develop
another 6.5 km of bike lanes. This local initiative is consistent with the
federal government’s plan to expand NMT in several cities, including in
Puebla. Also, the Puebla state government plans to build bike terminals
and integrate the cycling network with the BRT system.
Docking station in the city center
Studies show that traffic and bottlenecks are common during morning and
afternoon rush hours, especially from 2 p.m. to 3 p.m. Drivers can spend
up to one-third of their travel time waiting at red lights or trying to pass
congested intersections. Thus, the average speed does not exceed 23 km
an hour.
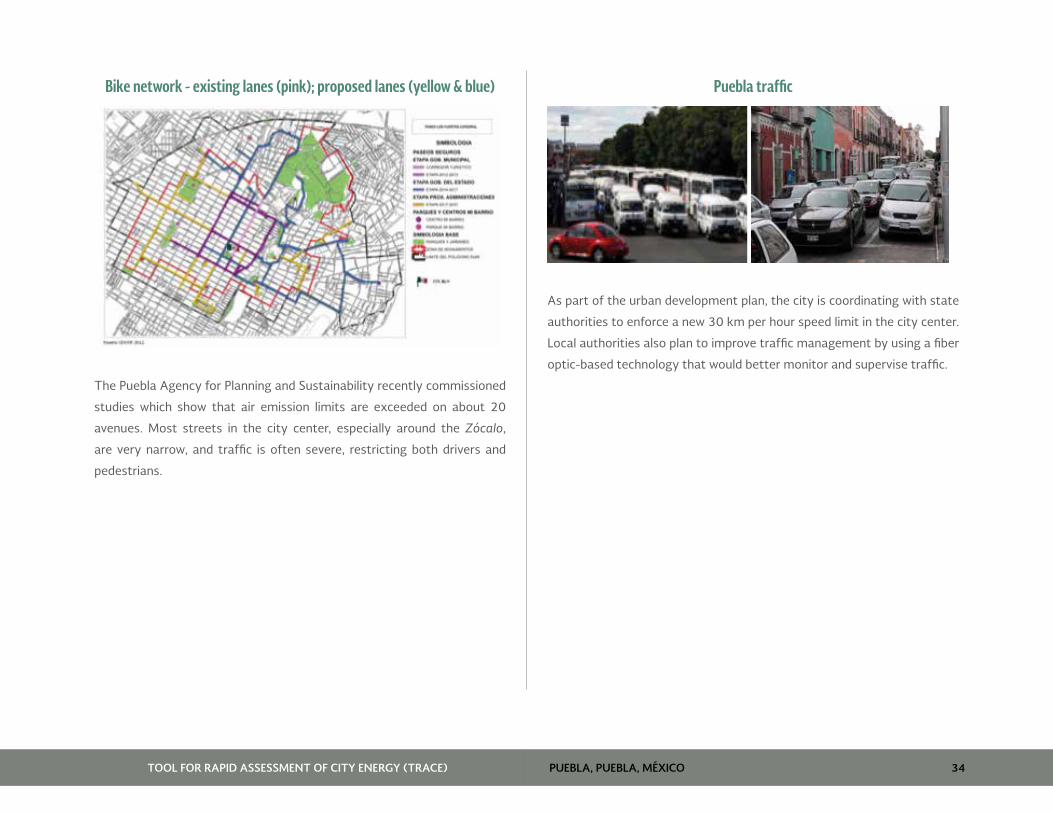
PUEBLA, PUEBLA, MÉXICOTOOL FOR RAPID ASSESSMENT OF CITY ENERGY (TRACE) 34
Bike network - existing lanes (pink); proposed lanes (yellow & blue)
The Puebla Agency for Planning and Sustainability recently commissioned
studies which show that air emission limits are exceeded on about 20
avenues. Most streets in the city center, especially around the Zócalo,
are very narrow, and traffic is often severe, restricting both drivers and
pedestrians.
Puebla traffic
As part of the urban development plan, the city is coordinating with state
authorities to enforce a new 30 km per hour speed limit in the city center.
Local authorities also plan to improve traffic management by using a fiber
optic-based technology that would better monitor and supervise traffic.

PUEBLA, PUEBLA, MÉXICOTOOL FOR RAPID ASSESSMENT OF CITY ENERGY (TRACE) 35
WATER SECTOR
Potable Water
Puebla’s water sector is managed by a decentralized public entity,
(Sistema Operador de los Servicios de Agua Potable y Alcantarillado de
Puebla [SOAPAP]). The company provides water to 441,838 households,
covering 33.9 percent of the municipal area over a distribution network of
3,136 km. Due to the lack of infrastructure, the company cannot reach
all neighborhoods. Thus, several private water systems serve some city
districts.
Puebla uses groundwater sources from two rivers (Atoyac and Alseca),
but most of the water comes from the Alto Atoyac aquifer (spread over
1,470 km2), which supplies 352 million m3 of water annually.
Water is supplied to Puebla through pumping and gravitational
networks. It is pumped from deep-water wells to overhead storage tanks
of high capacity, and then distributed to end users. There are 171 public
wells with an overall capacity of nearly 4,000 L/s and several water tanks
spread across the city. Also, industries are served by 25 private wells with
an installed capacity of 357 L/s.
Water tank truck
Some of the water sources have high levels of salt and sulfur and must be
treated. There are four water treatment plants with an installed capacity
of 715 L/s located near Puebla. The sulfur treatment plant can treat 190
L/s.
Water distribution is divided into two main areas. One is split into three
regions, while the other is in eight, which are divided into 33 neighborhoods,
each located near a large water tank.
Residents use 172 L per capita each day, roughly the same as in México
City. This is among the lowest levels in the TRACE database among similar
cities. Puebla consumes more water than Tallinn or Barcelona but much
less than Ljubljana, Vienna, or Budapest.
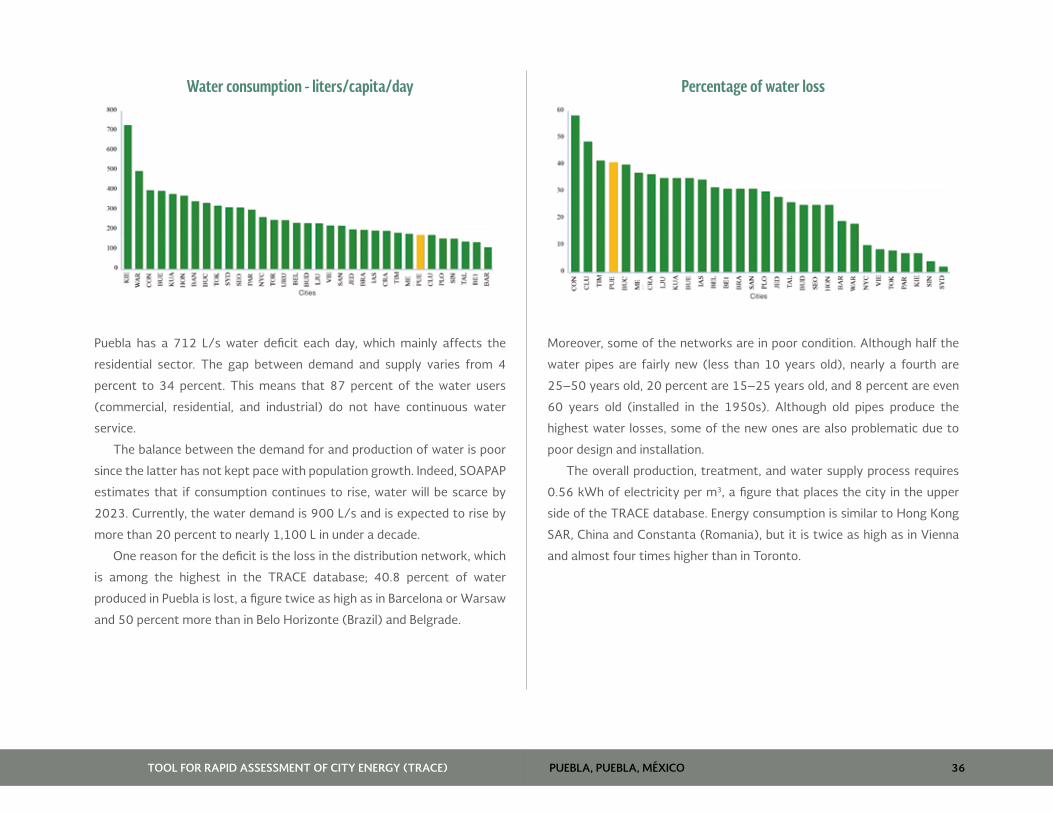
PUEBLA, PUEBLA, MÉXICOTOOL FOR RAPID ASSESSMENT OF CITY ENERGY (TRACE) 36
Water consumption - liters/capita/day
Puebla has a 712 L/s water deficit each day, which mainly affects the
residential sector. The gap between demand and supply varies from 4
percent to 34 percent. This means that 87 percent of the water users
(commercial, residential, and industrial) do not have continuous water
service.
The balance between the demand for and production of water is poor
since the latter has not kept pace with population growth. Indeed, SOAPAP
estimates that if consumption continues to rise, water will be scarce by
2023. Currently, the water demand is 900 L/s and is expected to rise by
more than 20 percent to nearly 1,100 L in under a decade.
One reason for the deficit is the loss in the distribution network, which
is among the highest in the TRACE database; 40.8 percent of water
produced in Puebla is lost, a figure twice as high as in Barcelona or Warsaw
and 50 percent more than in Belo Horizonte (Brazil) and Belgrade.
Percentage of water loss
Moreover, some of the networks are in poor condition. Although half the
water pipes are fairly new (less than 10 years old), nearly a fourth are
25–50 years old, 20 percent are 15–25 years old, and 8 percent are even
60 years old (installed in the 1950s). Although old pipes produce the
highest water losses, some of the new ones are also problematic due to
poor design and installation.
The overall production, treatment, and water supply process requires
0.56 kWh of electricity per m3, a figure that places the city in the upper
side of the TRACE database. Energy consumption is similar to Hong Kong
SAR, China and Constanta (Romania), but it is twice as high as in Vienna
and almost four times higher than in Toronto.
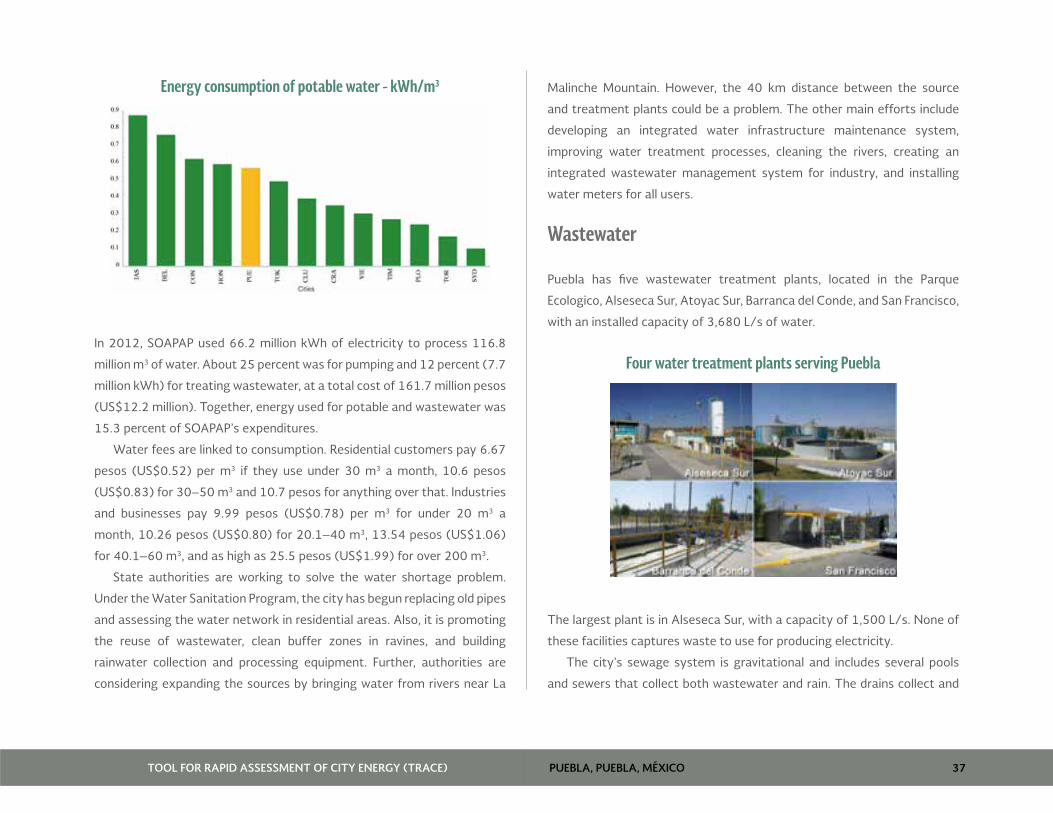
PUEBLA, PUEBLA, MÉXICOTOOL FOR RAPID ASSESSMENT OF CITY ENERGY (TRACE) 37
Energy consumption of potable water - kWh/m3
In 2012, SOAPAP used 66.2 million kWh of electricity to process 116.8
million m3 of water. About 25 percent was for pumping and 12 percent (7.7
million kWh) for treating wastewater, at a total cost of 161.7 million pesos
(US$12.2 million). Together, energy used for potable and wastewater was
15.3 percent of SOAPAP’s expenditures.
Water fees are linked to consumption. Residential customers pay 6.67
pesos (US$0.52) per m3 if they use under 30 m3 a month, 10.6 pesos
(US$0.83) for 30–50 m3 and 10.7 pesos for anything over that. Industries
and businesses pay 9.99 pesos (US$0.78) per m3 for under 20 m3 a
month, 10.26 pesos (US$0.80) for 20.1–40 m3, 13.54 pesos (US$1.06)
for 40.1–60 m3, and as high as 25.5 pesos (US$1.99) for over 200 m3.
State authorities are working to solve the water shortage problem.
Under the Water Sanitation Program, the city has begun replacing old pipes
and assessing the water network in residential areas. Also, it is promoting
the reuse of wastewater, clean buffer zones in ravines, and building
rainwater collection and processing equipment. Further, authorities are
considering expanding the sources by bringing water from rivers near La
Malinche Mountain. However, the 40 km distance between the source
and treatment plants could be a problem. The other main efforts include
developing an integrated water infrastructure maintenance system,
improving water treatment processes, cleaning the rivers, creating an
integrated wastewater management system for industry, and installing
water meters for all users.
Wastewater
Puebla has five wastewater treatment plants, located in the Parque
Ecologico, Alseseca Sur, Atoyac Sur, Barranca del Conde, and San Francisco,
with an installed capacity of 3,680 L/s of water.
Four water treatment plants serving Puebla
The largest plant is in Alseseca Sur, with a capacity of 1,500 L/s. None of
these facilities captures waste to use for producing electricity.
The city’s sewage system is gravitational and includes several pools
and sewers that collect both wastewater and rain. The drains collect and
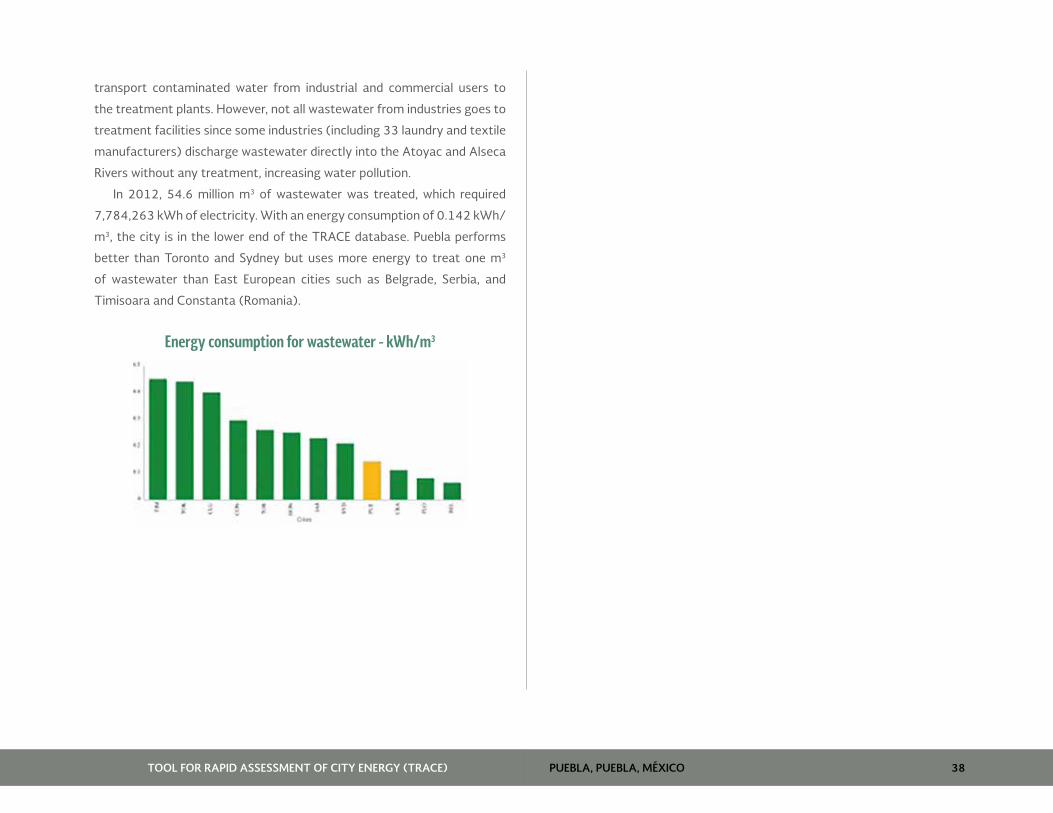
PUEBLA, PUEBLA, MÉXICOTOOL FOR RAPID ASSESSMENT OF CITY ENERGY (TRACE) 38
transport contaminated water from industrial and commercial users to
the treatment plants. However, not all wastewater from industries goes to
treatment facilities since some industries (including 33 laundry and textile
manufacturers) discharge wastewater directly into the Atoyac and Alseca
Rivers without any treatment, increasing water pollution.
In 2012, 54.6 million m3 of wastewater was treated, which required
7,784,263 kWh of electricity. With an energy consumption of 0.142 kWh/
m3, the city is in the lower end of the TRACE database. Puebla performs
better than Toronto and Sydney but uses more energy to treat one m3
of wastewater than East European cities such as Belgrade, Serbia, and
Timisoara and Constanta (Romania).
Energy consumption for wastewater - kWh/m3

PUEBLA, PUEBLA, MÉXICO 39TOOL FOR RAPID ASSESSMENT OF CITY ENERGY (TRACE)
ENERGY EFFICIENCY RECOMMENDATIONS
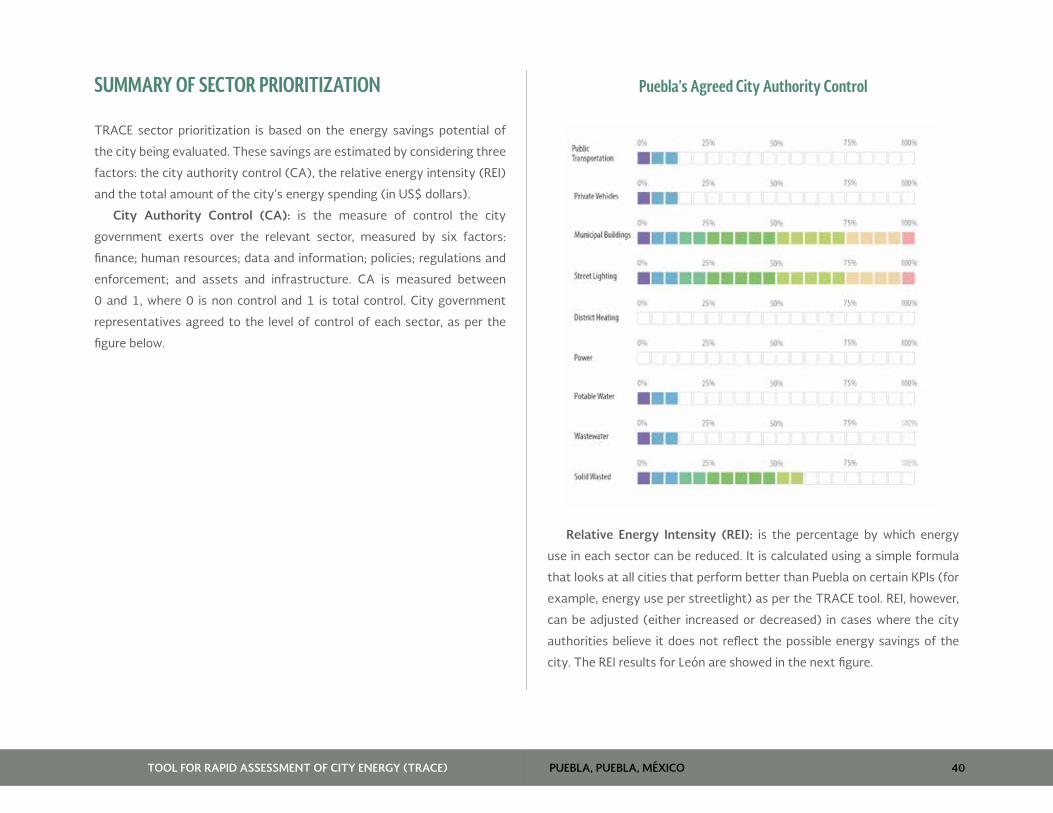
PUEBLA, PUEBLA, MÉXICOTOOL FOR RAPID ASSESSMENT OF CITY ENERGY (TRACE) 40
SUMMARY OF SECTOR PRIORITIZATION
TRACE sector prioritization is based on the energy savings potential of
the city being evaluated. These savings are estimated by considering three
factors: the city authority control (CA), the relative energy intensity (REI)
and the total amount of the city’s energy spending (in US$ dollars).
City Authority Control (CA): is the measure of control the city
government exerts over the relevant sector, measured by six factors:
finance; human resources; data and information; policies; regulations and
enforcement; and assets and infrastructure. CA is measured between
0 and 1, where 0 is non control and 1 is total control. City government
representatives agreed to the level of control of each sector, as per the
figure below.
Puebla’s Agreed City Authority Control
Relative Energy Intensity (REI): is the percentage by which energy
use in each sector can be reduced. It is calculated using a simple formula
that looks at all cities that perform better than Puebla on certain KPIs (for
example, energy use per streetlight) as per the TRACE tool. REI, however,
can be adjusted (either increased or decreased) in cases where the city
authorities believe it does not reflect the possible energy savings of the
city. The REI results for León are showed in the next figure.
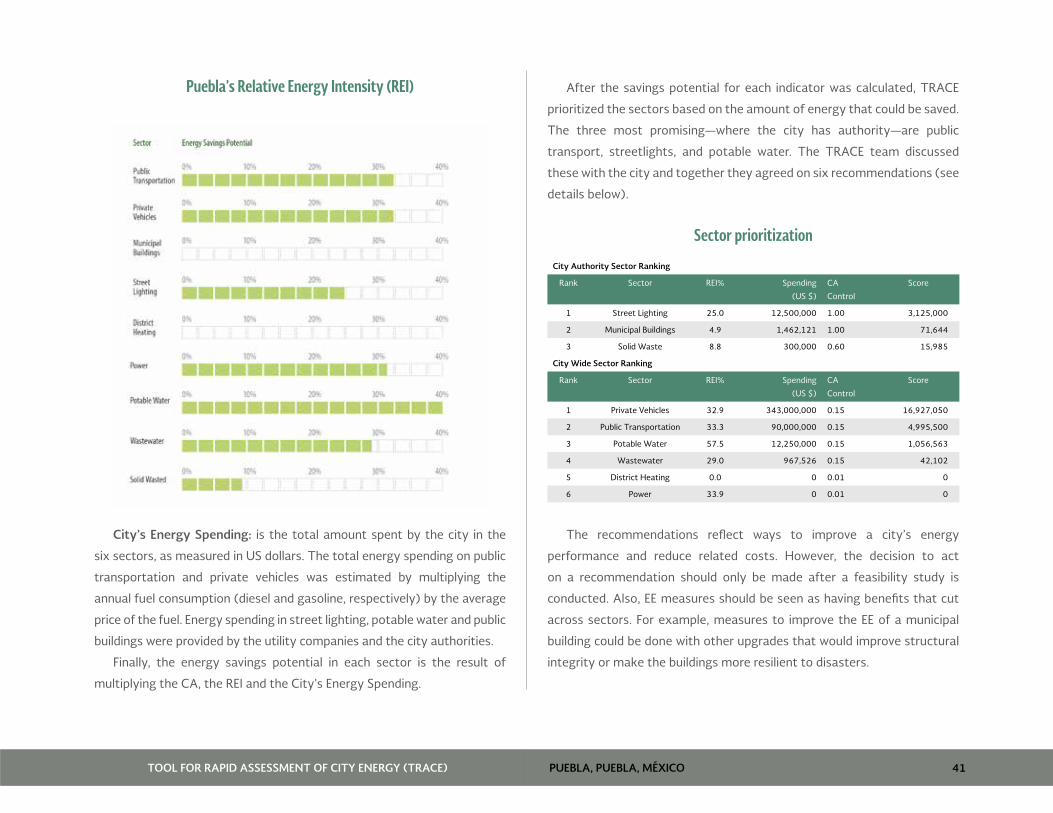
PUEBLA, PUEBLA, MÉXICOTOOL FOR RAPID ASSESSMENT OF CITY ENERGY (TRACE) 41
Puebla’s Relative Energy Intensity (REI)
City’s Energy Spending: is the total amount spent by the city in the
six sectors, as measured in US dollars. The total energy spending on public
transportation and private vehicles was estimated by multiplying the
annual fuel consumption (diesel and gasoline, respectively) by the average
price of the fuel. Energy spending in street lighting, potable water and public
buildings were provided by the utility companies and the city authorities.
Finally, the energy savings potential in each sector is the result of
multiplying the CA, the REI and the City’s Energy Spending.
After the savings potential for each indicator was calculated, TRACE
prioritized the sectors based on the amount of energy that could be saved.
The three most promising—where the city has authority—are public
transport, streetlights, and potable water. The TRACE team discussed
these with the city and together they agreed on six recommendations (see
details below).
Sector prioritization
City Authority Sector Ranking
Rank Sector REI% Spending
(US $)
CA
Control
Score
1 Street Lighting 25.0 12,500,000 1.00 3,125,000
2 Municipal Buildings 4.9 1,462,121 1.00 71,644
3 Solid Waste 8.8 300,000 0.60 15,985
City Wide Sector Ranking
Rank Sector REI% Spending
(US $)
CA
Control
Score
1 Private Vehicles 32.9 343,000,000 0.15 16,927,050
2 Public Transportation 33.3 90,000,000 0.15 4,995,500
3 Potable Water 57.5 12,250,000 0.15 1,056,563
4 Wastewater 29.0 967,526 0.15 42,102
5 District Heating 0.0 0 0.01 0
6 Power 33.9 0 0.01 0
The recommendations reflect ways to improve a city’s energy
performance and reduce related costs. However, the decision to act
on a recommendation should only be made after a feasibility study is
conducted. Also, EE measures should be seen as having benefits that cut
across sectors. For example, measures to improve the EE of a municipal
building could be done with other upgrades that would improve structural
integrity or make the buildings more resilient to disasters.
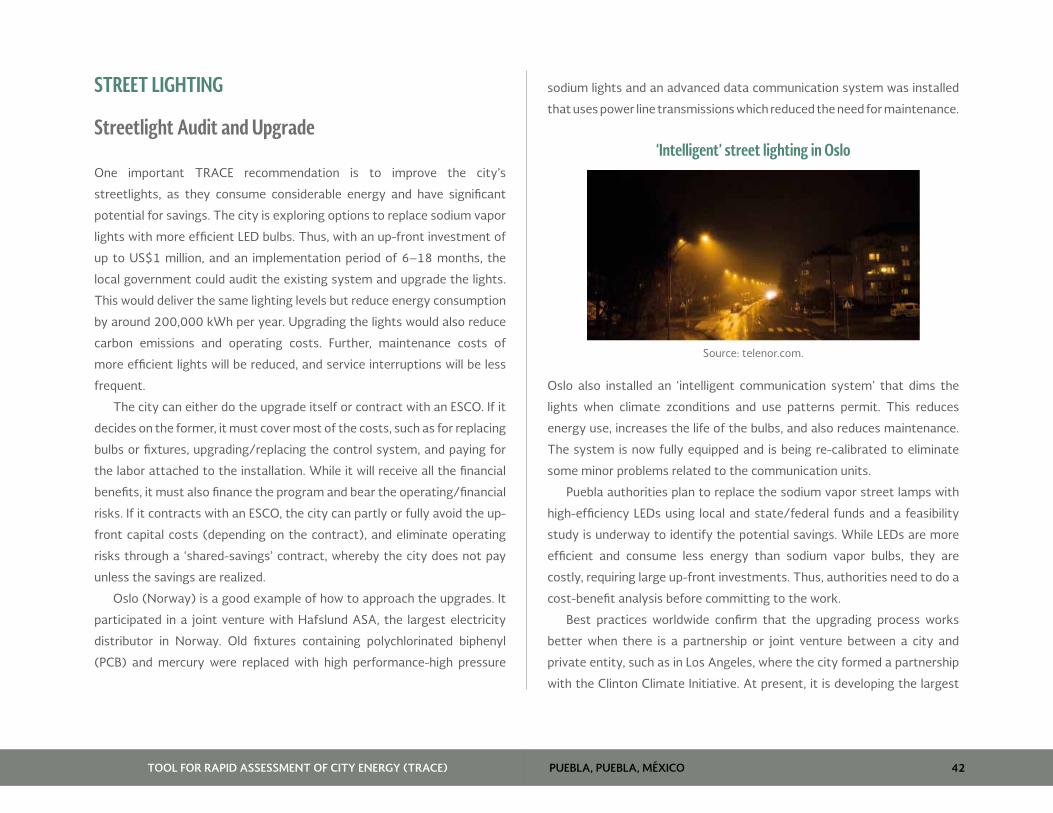
PUEBLA, PUEBLA, MÉXICOTOOL FOR RAPID ASSESSMENT OF CITY ENERGY (TRACE) 42
STREET LIGHTING
Streetlight Audit and Upgrade
One important TRACE recommendation is to improve the city’s
streetlights, as they consume considerable energy and have significant
potential for savings. The city is exploring options to replace sodium vapor
lights with more efficient LED bulbs. Thus, with an up-front investment of
up to US$1 million, and an implementation period of 6–18 months, the
local government could audit the existing system and upgrade the lights.
This would deliver the same lighting levels but reduce energy consumption
by around 200,000 kWh per year. Upgrading the lights would also reduce
carbon emissions and operating costs. Further, maintenance costs of
more efficient lights will be reduced, and service interruptions will be less
frequent.
The city can either do the upgrade itself or contract with an ESCO. If it
decides on the former, it must cover most of the costs, such as for replacing
bulbs or fixtures, upgrading/replacing the control system, and paying for
the labor attached to the installation. While it will receive all the financial
benefits, it must also finance the program and bear the operating/financial
risks. If it contracts with an ESCO, the city can partly or fully avoid the up-
front capital costs (depending on the contract), and eliminate operating
risks through a ‘shared-savings’ contract, whereby the city does not pay
unless the savings are realized.
Oslo (Norway) is a good example of how to approach the upgrades. It
participated in a joint venture with Hafslund ASA, the largest electricity
distributor in Norway. Old fixtures containing polychlorinated biphenyl
(PCB) and mercury were replaced with high performance-high pressure
sodium lights and an advanced data communication system was installed
that uses power line transmissions which reduced the need for maintenance.
‘Intelligent’ street lighting in Oslo
Source: telenor.com.
Oslo also installed an ‘intelligent communication system’ that dims the
lights when climate zconditions and use patterns permit. This reduces
energy use, increases the life of the bulbs, and also reduces maintenance.
The system is now fully equipped and is being re-calibrated to eliminate
some minor problems related to the communication units.
Puebla authorities plan to replace the sodium vapor street lamps with
high-efficiency LEDs using local and state/federal funds and a feasibility
study is underway to identify the potential savings. While LEDs are more
efficient and consume less energy than sodium vapor bulbs, they are
costly, requiring large up-front investments. Thus, authorities need to do a
cost-benefit analysis before committing to the work.
Best practices worldwide confirm that the upgrading process works
better when there is a partnership or joint venture between a city and
private entity, such as in Los Angeles, where the city formed a partnership
with the Clinton Climate Initiative. At present, it is developing the largest

PUEBLA, PUEBLA, MÉXICOTOOL FOR RAPID ASSESSMENT OF CITY ENERGY (TRACE) 43
streetlight upgrade program ever carried out, which will replace traditional
lights with environmentally friendly LEDs. The project is expected to reduce
CO2 emissions by 40,500 tons and cut costs by US$10 million annually
through 40 percent energy savings and reduced maintenance costs.
Procurement Guide for New Streetlights
A second TRACE recommendation is for Puebla to produce new
procurement guidelines for streetlights, which could produce a more
efficient system. The city would set strict rules about what the streetlight
provider or company responsible for maintaining the infrastructure must
provide, which would also reduce costs. City authorities could consider
a manual for street lighting design similar to the one prepared by IESNA
(Illuminating Engineering Society of North America), which specified best
practices for visibility and safety guidelines. The manual should establish
parameters for illumination, pole spacing, and the type of lamp, as well as
dimming or illumination features for all types of city streetlights.
When choosing the contractor, the city should list specific requirements
for the design, illumination levels, installation, maintenance, and operating
costs. Contracts are best when given for a medium- to long-term period
(for example, a minimum of five years), allowing the contractor enough
time to recover investments. If done properly, the contract would promote
competition among the private companies to provide the lowest costs
possible.
Puebla streetlights
The Midlands region in the United Kingdom provides a good example
of effective procurement guidelines. Authorities set minimum, desired
specifications for streetlight technologies to reduce carbon emissions and
costs. Nine councils partnered with the Midlands Highways Alliance to
achieve EE savings for major and medium highways and professional civil
engineering services, by sharing best practices in maintenance contracts
and jointly procuring new technologies for streetlights and signals. The
project was estimated to save the region GBP 11 million (US$18.4 million)
in highway maintenance and improvements by 2011.

PUEBLA, PUEBLA, MÉXICOTOOL FOR RAPID ASSESSMENT OF CITY ENERGY (TRACE) 44
MUNICIPAL BUILDINGS
Benchmarking Municipal Buildings
A common TRACE recommendation is to prepare a municipal building
energy database, where all energy-related information can be tracked and
monitored. In most cities worldwide, local authorities do not keep reliable
records on energy use and costs related to these buildings. Often, cities do
not know the heat or electricity consumed per m2 and the related costs for
a given floor. Thus, it is not possible to know if EE investments are actually
effective. Similarly, Puebla does not have a reliable database on the floor
area and does not track the energy/electricity consumed and its costs. If
it were improved, it could help the city monitor energy consumption and
costs in public buildings and better implement EE programs.
Puebla’s state authorities are developing a project to help government
offices be more efficient regarding their consumption of electricity
and water and generation of solid waste. The program aims to interest
the building managers to improve maintenance services and promote
renovations. To date, the project has lowered energy consumption in
three buildings. TRACE is encouraging the city to continue these initiatives
and also develop a benchmark program for municipal buildings. TRACE
estimates that with an investment of about US$100,000, the city could
create a program that would reduce energy use by up to 200,000 kWh a
year.
The benchmarking could be done by a small team of 1–2 people from
the city or by consultants, and various departments should be involved,
including the Environment Directorate. The benchmarking would track
data on consumption of electricity, natural gas, and water, besides data
on building construction and renovations, floor space, forms of cooling/
heating (if used), energy bills for recent years, and lighting system modes.
With such information, it should be possible to identify the most suitable
energy-saving options. By regularly publishing the analysis and updating
the data, this could promote competition among building managers and
lead to a productive exchange of data and collaboration.
Old historic building in Puebla
Source: www.ovpm.org.
This is the first step for a program that could reduce the buildings’ energy
expenditures. The database is also valuable for comparing buildings and
determining the highest potential in terms of energy savings at the lowest
cost. The analysis would identify the most appropriate energy-saving
options that the city could support.
The TRACE database has several best practice examples for
benchmarking. The Ukrainian city of Lviv developed such a program that
has saved considerable energy. Lviv reduced annual energy consumption in
all 530 municipal public buildings by 10 percent and cut water consumption
by 12 percent through a monitoring/targeting program. In 2010, with

PUEBLA, PUEBLA, MÉXICOTOOL FOR RAPID ASSESSMENT OF CITY ENERGY (TRACE) 45
minimal costs, the program saved US$1.2 million. It provided city managers
with monthly consumption data for district heating, natural gas, electricity,
and water in all municipal buildings. This information allowed authorities to
set annual goals based on historical consumption. The data were reviewed
every month and deviations, as well as overall performance, were presented
to city residents through a public display campaign. Subsequently, the city
created a new energy management unit (EMU) and trained all personnel
responsible for the buildings’ utility use.
Municipal Buildings’ Audits and Upgrades
Once the municipal building benchmarks are prepared, the city could
consider an audit and upgrade project. The audits provide the information
on energy consumption for each building, which would include the types
of equipment that use the electricity, such as computers, lights, air
conditioning and heating systems, server rooms and coolers (for the
servers), and appliances (refrigerators, water coolers). Depending on
results, the city could allocate funds for EE upgrades, such as purchasing
new equipment and renovating some buildings.
Puebla has many old, magnificent historic buildings. Not all are in good
condition and some must be renovated. Although this can be difficult or
nearly impossible in some cases, restoration should be done with strict
specifications and be supervised by local and national authorities.
Government office in Puebla
Source: wikipedia.org
In recent years, national and local authorities created an ambitious plan
to renovate and preserve Puebla’s historic buildings and monuments by
2031. Currently, several stakeholders updated the partial program of the
historical center and prepared a plan that set targets for the next 15 years.
The upgrades can be done cost effectively by contracting with ESCOs,
which, under standard shared-savings contracts, pay the up-front costs
and share in the savings that follow. However, before it contracts with an
ESCO, the city should assign a staff person or hire someone to oversee the
EE projects.
The upgrades should first be done on buildings that are not historic
monuments. The benchmarking process and the data collected on office
buildings could help identify preliminary opportunities for EE activities,
including new computers, lighting systems, and other equipment. After
defining the requirements and the budget, the city should make a plan
to design the upgrades, identify the renovations and equipment to be
replaced for each building, and hire an ESCO.
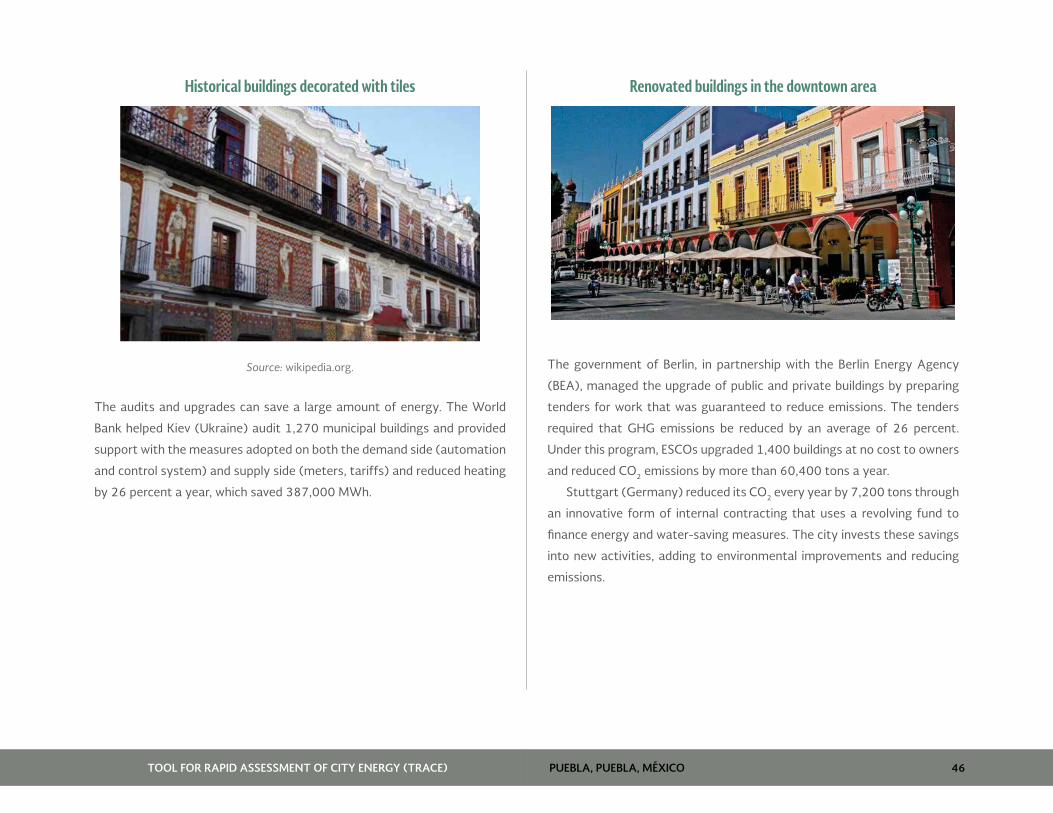
PUEBLA, PUEBLA, MÉXICOTOOL FOR RAPID ASSESSMENT OF CITY ENERGY (TRACE) 46
Historical buildings decorated with tiles
Source: wikipedia.org.
The audits and upgrades can save a large amount of energy. The World
Bank helped Kiev (Ukraine) audit 1,270 municipal buildings and provided
support with the measures adopted on both the demand side (automation
and control system) and supply side (meters, tariffs) and reduced heating
by 26 percent a year, which saved 387,000 MWh.
Renovated buildings in the downtown area
The government of Berlin, in partnership with the Berlin Energy Agency
(BEA), managed the upgrade of public and private buildings by preparing
tenders for work that was guaranteed to reduce emissions. The tenders
required that GHG emissions be reduced by an average of 26 percent.
Under this program, ESCOs upgraded 1,400 buildings at no cost to owners
and reduced CO2 emissions by more than 60,400 tons a year.
Stuttgart (Germany) reduced its CO2 every year by 7,200 tons through
an innovative form of internal contracting that uses a revolving fund to
finance energy and water-saving measures. The city invests these savings
into new activities, adding to environmental improvements and reducing
emissions.

PUEBLA, PUEBLA, MÉXICOTOOL FOR RAPID ASSESSMENT OF CITY ENERGY (TRACE) 47
Mandatory Energy Efficiency Codes for New Buildings
Puebla can promote EE in new buildings by enforcing guidelines or
introducing certification programs for using green building technologies.
Successful programs that created EE codes include LEED (in the US),
BREEAM (in the United Kingdom), and CASBEE (in Japan).
Although guidelines should focus on EE, they usually cover water
conservation, ‘green’ roofs (urban heat-island effects), indoor air quality,
and other related issues. The EE code can take various forms—voluntary
guidelines, minimum building standards, or incentive programs for private
developers—and promote higher quality building designs and construction.
This TRACE recommendation could be launched with an investment of
US$100,000 over two years and could result in energy savings of 200,000
kWh, besides lowering water consumption.
Before preparing the codes, city managers should evaluate green building
opportunities by assessing the climate, building types, real estate market,
and construction sector, and examine codes and guidelines in the region
and worldwide. A cost-benefit analysis can determine the relative merits
of codes for new construction versus strategies for green building design.
After this, the city should draft design guidelines based on a voluntary
approach and distribute them to the public—to be adopted voluntarily by
progressive developers, designers and building owners. Authorities can
also create a program to promote green building construction by providing
incentives in the form of taxes, credits, zoning benefits, or quicker loan
approvals to developers. If a voluntary or incentive-based approach does
not work, the guidelines can be re-formulated as mandatory codes that
include green building designs. In either case, draft guidelines should be
distributed to all stakeholders for feedback (for example, real estate and
construction companies and city residents).
Examples of best practices to improve construction and EE standards
for new buildings include Münster (Germany), which incorporated low-
energy building standards in sales contracts for city-owned land. This
transformed the market, leading to an 80 percent adoption rate of the
city’s EE requirements in all new buildings built in 2010, including those on
privately owned land.
Energy efficient LVM building in Münster
Source: wikimedia.org
Seattle (U.S.A.) developed strategies and action plans to promote
construction of efficient buildings. New city buildings over 5,000 sq. ft.
were required to meet Leadership in Energy and Environmental Design
(LEED) standards, and the city provided financial incentives for private
projects to comply. It also offered incentives for new buildings, such as
allowing downtown commercial or residential developments greater
heights and/or floor areas if certain green building standards (LEED silver

PUEBLA, PUEBLA, MÉXICOTOOL FOR RAPID ASSESSMENT OF CITY ENERGY (TRACE) 48
standard or higher) were met; or the city subsidized energy conservation
and design/consulting fees for LEED projects. From 2001 to 2005, Seattle
offered US$4.3 million for projects adopting LEED standards. As a result,
energy consumption dropped by 35 percent on average and by 6.9 million
KWh annually in LEED municipal buildings. Also, LEED buildings’ emissions
fell by 1,067 CO2eq tons per building while the annual average energy
savings were US$43,000.
SOLID WASTE
Intermediate Transfer Stations
Puebla can improve its solid waste system and reduce energy costs by
building transfer stations. With US$1 million, the city could build transfer
stations that would save 200,000 kWh annually. Not only would they
reduce GHG emissions and improve public safety and health, but they
would reduce traffic associated with waste vehicles and reduce the budget.
Transfer stations help lower the trips to the landfill and the distance
travelled per ton of waste, which translates into reducing the energy use.
Also, with fewer waste trucks traveling long distances to the landfill, there
would be less noise and dust in residential areas besides better roads and
air quality.
Together with private operators, the city should prepare a plan to
address the shortfalls in the waste collection system and detail the issues
involved with developing transfer stations. A map should identify places
where the transfer stations could be located and should be incorporated
into the city’s spatial planning strategy so it can allocate the land needed.
Further, private operators should help finance their construction. Once
they are built, authorities should monitor fuel consumption associated
with the quantity of solid waste collected.

PUEBLA, PUEBLA, MÉXICOTOOL FOR RAPID ASSESSMENT OF CITY ENERGY (TRACE) 49
Transfer and sorting station
Source: comtechrom.ro.
In Victoria (Canada), the Ministry of Environment hired a private engineering
firm to explore the most appropriate methodology, design, and operating
procedures for the new transfer stations and write guidelines. These
included cost models that compared direct hauls in collection trucks with
transfer hauls to the landfill. City managers used the model to assess
the benefits of transfer stations under various conditions and identify/
quantify operating and capital costs.
In Romania, integrated solid waste management plans (SWMPs) at
the county level are developed with financial support from the EU and
contributions from the local administrations that benefit from waste
collection services. The master plans included sorting and compost
stations and transfer stations to reduce the distance travelled by garbage
trucks to the landfill and other facilities.

PUEBLA, PUEBLA, MÉXICOTOOL FOR RAPID ASSESSMENT OF CITY ENERGY (TRACE) 50
Solid Waste Auditing and Planning
Puebla can improve its solid waste sector by identifying opportunities to
reduce energy consumption in the collection, transport, and disposal of
solid waste. Since the city does not have good data for this sector, an audit
could determine the amount of energy used for waste management and
identify opportunities to save energy. An annual environmental report
(AER) would assess all the solid waste infrastructure, for example, trucks,
trash bins, the landfill and leachate plant. The report would monitor energy
consumption per ton of waste collected, transported, and treated.
The solid waste operators should be required to submit data annually
on the solid waste collected, the fuel used for collection/transportation
activities, and waste management at the landfill. The city could also meet
with informal sector collectors to identify potential recycling activities.
The report should lay the foundation for a short- to medium-term
waste management strategy, describing the distribution and inventory of
city-wide solid waste infrastructure. Also, it would explore measures to
reduce energy associated with waste pre-treatment activities and could
thus target reductions in energy per ton or m3 of waste treated as well as
per ton of waste managed each year.
Waste truck operated by a private solid waste company in Puebla
Municipalities worldwide have adopted different methods to improve the
solid waste sector and save energy. For example, in Italy, waste services are
delivered through public entities known as ‘ATO’, funded by local authorities
that define the most appropriate services required to manage solid waste.
Often, new infrastructure is funded by the city, although private finance is
obtained through a form of public borrowing for large waste facilities. Italy
created an eco-tax for waste disposal that is used to generate revenues for
new infrastructure and waste monitoring activities. It brought in US$324
million from a tax on all packaging that is dedicated to financing new waste
infrastructure.
London achieved greater regional self-sufficiency by developing
new infrastructure and using new low-carbon technologies in waste
management (for example, transfer facilities to resource recovery parks).
In partnership with private waste operators, the Greater London Authority
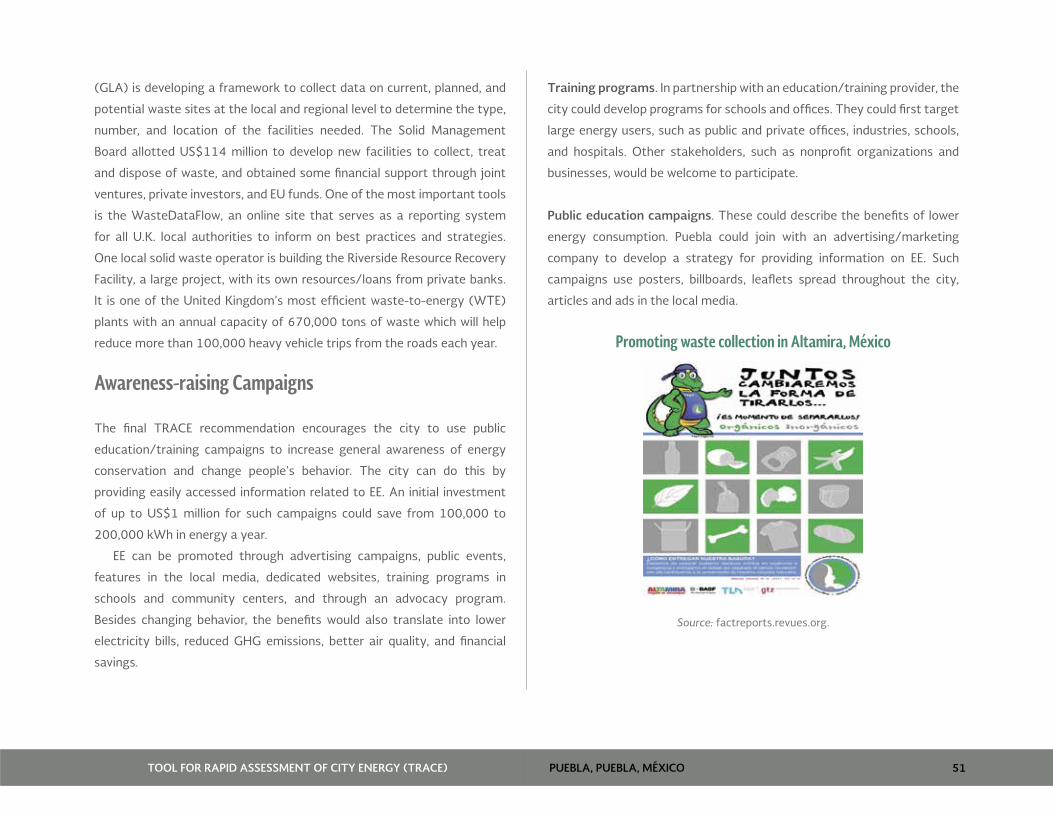
PUEBLA, PUEBLA, MÉXICOTOOL FOR RAPID ASSESSMENT OF CITY ENERGY (TRACE) 51
(GLA) is developing a framework to collect data on current, planned, and
potential waste sites at the local and regional level to determine the type,
number, and location of the facilities needed. The Solid Management
Board allotted US$114 million to develop new facilities to collect, treat
and dispose of waste, and obtained some financial support through joint
ventures, private investors, and EU funds. One of the most important tools
is the WasteDataFlow, an online site that serves as a reporting system
for all U.K. local authorities to inform on best practices and strategies.
One local solid waste operator is building the Riverside Resource Recovery
Facility, a large project, with its own resources/loans from private banks.
It is one of the United Kingdom’s most efficient waste-to-energy (WTE)
plants with an annual capacity of 670,000 tons of waste which will help
reduce more than 100,000 heavy vehicle trips from the roads each year.
Awareness-raising Campaigns
The final TRACE recommendation encourages the city to use public
education/training campaigns to increase general awareness of energy
conservation and change people’s behavior. The city can do this by
providing easily accessed information related to EE. An initial investment
of up to US$1 million for such campaigns could save from 100,000 to
200,000 kWh in energy a year.
EE can be promoted through advertising campaigns, public events,
features in the local media, dedicated websites, training programs in
schools and community centers, and through an advocacy program.
Besides changing behavior, the benefits would also translate into lower
electricity bills, reduced GHG emissions, better air quality, and financial
savings.
Training programs. In partnership with an education/training provider, the
city could develop programs for schools and offices. They could first target
large energy users, such as public and private offices, industries, schools,
and hospitals. Other stakeholders, such as nonprofit organizations and
businesses, would be welcome to participate.
Public education campaigns. These could describe the benefits of lower
energy consumption. Puebla could join with an advertising/marketing
company to develop a strategy for providing information on EE. Such
campaigns use posters, billboards, leaflets spread throughout the city,
articles and ads in the local media.
Promoting waste collection in Altamira, México
Source: factreports.revues.org.

PUEBLA, PUEBLA, MÉXICOTOOL FOR RAPID ASSESSMENT OF CITY ENERGY (TRACE) 52
Solid waste is one sector that Puebla’s communication strategy could easily
target. The city, public waste company (OOSL), and private operators
could organize public campaigns to raise awareness about separating
organic from recyclable wastes. Moreover, such campaigns could promote
the new recycling initiative Basura por Seguridad (waste for safety), a joint
initiative between the city and the private sector.
Public campaigns can also target water and transport. For example, the
city could encourage citizens to bike and walk, and rely less on private cars.
Promoting recycling
Source: www.pcwastemgmt.com.
Moreover, it can continue to promote bike-sharing programs at affordable
rates and launch initiatives to increase awareness about the benefits
of public transport. Such a campaign could focus on promoting public
transport as a reliable, fast, comfortable, cheap, and accessible mode,
compared to private vehicles.
Promoting public transport
Source: www.irenesoo.wordpress.com; www.bangalore.citizenmatters.in.
Awareness can also be raised by using local ‘advocates’ to teach people
about the importance/benefits of saving energy. The city could recruit
and train, on a voluntary basis, a few well-known individuals, including local
personalities in government, business, health, or entertainment, to serve
as spokespersons.
The city could then monitor progress and the number of people
participating in training programs, hits on EE websites, print/online articles,
and media features.
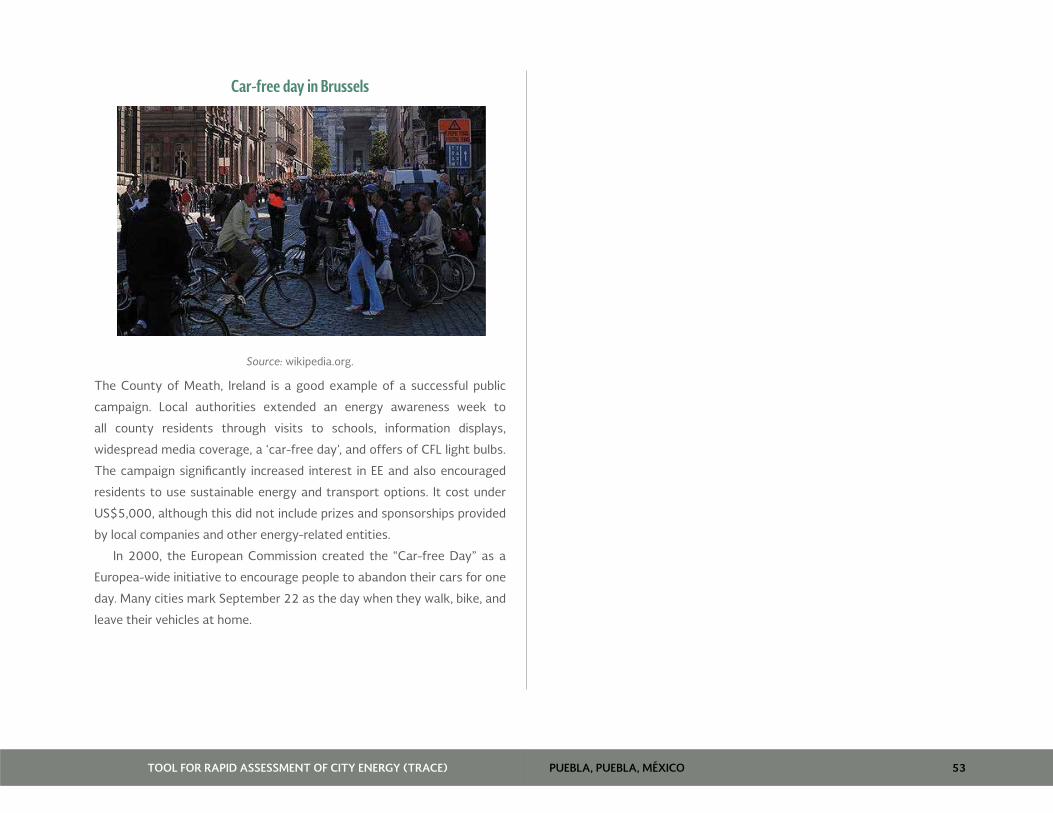
PUEBLA, PUEBLA, MÉXICOTOOL FOR RAPID ASSESSMENT OF CITY ENERGY (TRACE) 53
Car-free day in Brussels
Source: wikipedia.org.
The County of Meath, Ireland is a good example of a successful public
campaign. Local authorities extended an energy awareness week to
all county residents through visits to schools, information displays,
widespread media coverage, a ‘car-free day’, and offers of CFL light bulbs.
The campaign significantly increased interest in EE and also encouraged
residents to use sustainable energy and transport options. It cost under
US$5,000, although this did not include prizes and sponsorships provided
by local companies and other energy-related entities.
In 2000, the European Commission created the “Car-free Day” as a
Europea-wide initiative to encourage people to abandon their cars for one
day. Many cities mark September 22 as the day when they walk, bike, and
leave their vehicles at home.

PUEBLA, PUEBLA, MÉXICOTOOL FOR RAPID ASSESSMENT OF CITY ENERGY (TRACE) 54

PUEBLA, PUEBLA, MÉXICO 55TOOL FOR RAPID ASSESSMENT OF CITY ENERGY (TRACE)
ANNEX- TRACE PUEBLA RECOMMENDATIONS
PUEBLA, PUEBLA, MÉXICO 56TOOL FOR RAPID ASSESSMENT OF CITY ENERGY (TRACE)
DETAILED RECOMMENDATIONS FROM TRACE
Improving Energy Efficiency in Puebla, Puebla, México
Annex 1: Streetlights’ Audits and Upgrades 57
Annex 2: Streetlight Procurement Guide 61
Annex 3: Benchmarking Municipal Buildings 64
Annex 4: Municipal Buildings Audits and Upgrades 71
Annex 5: Mandatory Energy Efficiency Codes for New Buildings 75
Annex 6: Intermediate Transfer Stations 80
Annex 7: Planning for Waste Infrastructure 84
Annex 8: Awareness-raising Campaigns 90
Annex 9: Abbreviations for Cities in the TRACE Database 95

PUEBLA, PUEBLA, MÉXICO 57TOOL FOR RAPID ASSESSMENT OF CITY ENERGY (TRACE)
ANNEX 1: STREETLIGHT AUDITS AND UPGRADES
DESCRIPTION Incandescent bulbs used in streetlights are highly inefficient. They produce little light and much heat
from their significant power consumption. Also, they are often poorly designed and unnecessarily
spread light in all directions, including the sky. New bulb technologies can significantly increase their
efficiency as well as extend their life. This recommendation aims to both assess current lighting
efficiency and upgrade where needed.
The upgrades deliver the same lighting levels using less energy, and reduce carbon emissions and
operating costs. The increased life reduces maintenance and costs, and interruptions to service, thus
improving public health and safety.
ATTRIBUTES
Energy-saving Potential
>200,000 kWh/year
Initial Costs
US$100,000–US$1 million
Speed of Implementation
1–2 years
Wider Benefits
Reduced carbon emissions
Enhanced public health & safety
Increased employment opportunities
Financial savings
Implementation Options
Activity Method
Self-implementation
The main costs related to upgrading streetlights are to replace the bulbs, the control system, and
labor to install the items. These expenses, along with consulting fees, are funded by the city, which
means it receives all the financial benefits but bears the financial risks.
ESCO upgrades
The city engages an ESCO to carry out the project, which can involve part- and full-ownership of the
system and translates into varying levels of benefits in terms of reducing risks, up-front capital costs,
and financial savings over the project’s life. Using local ESCOs helps streamline the process and makes
the upgrade more feasible. Similarly, having a local, credible, and independent measurement and
verification agency minimizes contractual disputes by verifying performance. See the Akola Street
Lighting Case Study for details.

PUEBLA, PUEBLA, MÉXICO 58TOOL FOR RAPID ASSESSMENT OF CITY ENERGY (TRACE)
Activity Method
Supply and install contracts
Such contracts give the city flexibility to set performance standards and review contractors’ work as
part of a phased project. This approach requires up-front spending and an appropriate financing plan.
See the Los Angeles Case Study for details.
Long-term contracts
These free the city from financing pressures, but the financial savings achieved through EE are passed
on to the company conducting the upgrade. This strategy can benefit cities that do not have the
financial resources to cover the up-front costs and bring in an informed stakeholder to carry out the
process.
Joint ventures
Joint ventures allow a city to maintain a significant degree of control over upgrade projects while
sharing the risks with a partner experienced in streetlight issues. Such ventures are effective where
both parties can benefit from improved EE and do not have competing interests. See the Oslo Case
Study for details.
Monitoring Monitoring the progress and effectiveness of the recommendations is crucial to understanding their value over time. When the city adopts a recommendation,
it should define the targets that indicate the progress it expects in a given period and design a monitoring plan. The latter does not need to be complicated
or time-consuming but should, at least (1) identify information sources; (2) identify performance indicators that can measure and validate equipment/
processes; (3) set protocols for keeping records; (4) set a schedule to measure activity (daily, weekly, monthly); (5) assign responsibilities for each piece of
the process; (6) create a way to audit and review performance; and (7) create reporting and review cycles.
A measure related to this recommendation is
• Lumens/watt – Determine the average effectiveness of illumination provided by current streetlights.

PUEBLA, PUEBLA, MÉXICO 59TOOL FOR RAPID ASSESSMENT OF CITY ENERGY (TRACE)
Case studies
ESCO streetlight retrofit, Akola, India
Source: Energy Sector Management Assistance Program (ESMAP). 2009. “Good Practices in City Energy Efficiency: Akola Municipal Corporation, India -
Performance Contracting for Street Lighting Energy Efficiency.”
Akola contracted with an ESCO to replace over 11,500 streetlights (standard fluorescent, mercury vapor, sodium vapor) with T5 fluorescent lamps. The
contractor (called AEL) financed 100 percent of the investments, launched the project, maintained the new lights, and received part of the verified energy
savings to recover its investment. Under the contract, the city paid the ESCO 95 percent of the verified energy bill savings over the 6-year period it was
in effect. It also paid AEL an annual fee to maintain the lamps and fixtures. Initial investments were about US$120,000 and the upgrade was completed
in three months. The project saved 56 percent in energy costs a year, which meant total savings of US$133,000—a payback in less than 11 months!
Streetlight retrofits, Dobrich, Bulgaria
Source: http://www.eu-greenlight.org - Go to “Case Study”
In 2000, Dobrich audited its entire streetlight system, which resulted in a project the next year to modernize it. Mercury bulbs were replaced with high
pressure sodium lamps and compact fluorescent lamps (a total of 6,450 EE lamps). The control system was also upgraded, and two electric meters were
installed. These measures raised the illuminated area of the city to 95 percent and resulted in savings of 2,819,640 kWh a year (€91,400 a year).
Street Lighting LED Replacement Program, City of Los Angeles, USA
Source: Clinton Climate Initiative, http://www.clintonfoundation.org/what-we-do/clinton-climate-initiative/i/cci-la-lighting.
This project, which involved a partnership between the Clinton Climate Initiative (CCI) and the city of Los Angeles, is the largest streetlight upgrade by a
city to date, replacing traditional lights with environmentally friendly LEDs. It will reduce CO2 emissions by 40,500 tons and save US$10 million annually
through reduced maintenance costs and 40 percent reduced energy consumption.
The mayor and Bureau of Street Lighting collaborated with CCI’s Outdoor Lighting Program to review the latest technology, financing strategies,
and public-private implementation models for LED upgrades. CCI’s analysis of models and technology, and its financial advice, were key sources for
developing this comprehensive plan.

PUEBLA, PUEBLA, MÉXICO 60TOOL FOR RAPID ASSESSMENT OF CITY ENERGY (TRACE)
The project’s phased nature allowed the city to evaluate its approach each year which gave it flexibility when selecting contractors and the lights to
be upgraded. It also capitalized on its status to attract financial institutions that would offer favorable loans and funding mechanisms since they wanted
to create positive relationships with the city. Thus, the city was able to create a well-developed business case for the project.
Lighting Retrofit, City of Oslo
Source: Clinton Climate Initiative, Climate Leadership Group, C40 Cities, http://www.c40cities.org/bestpractices/lighting/oslo_streetlight.jsp.
Oslo formed a joint venture with Hafslund ASA, the largest electricity distribution company in Norway. Old fixtures containing PCB and mercury were
replaced with high performance-high pressure sodium lights, and an advanced data communication system was installed using power-line transmissions
that reduced the maintenance. They also installed ‘intelligent communication systems’ that dim lights when climate conditions and usage patterns
permit, which reduced energy use and increased the bulbs’ life, which also reduced maintenance (and related costs).
The system is fully equipped with all its components and is calibrated to correct some minor problems related to the communication units. Overall,
the system has performed well under normal operating conditions.
Tools & Guidance
European Lamp Companies Federation. ‘Saving Energy through Lighting’, A procurement guide for efficient lighting, including a chapter on street
lighting. http://www.elcfed.org/2_projects_buybright.html.
Responsible Purchasing Network (2009). “Responsible Purchasing Guide LED Signs, Lights and Traffic Signals”, A guidance document for maximizing
the benefits of upgrading exit signs, streetlights and traffic signals with high efficiency LED bulbs. http://www.everglow.us/pdf/rpn-led-purchasing-
guide.pdf.
ESMAP Public Procurement of Energy Efficiency Services - Guide of good procurement practice from around the world. http://www.esmap.org/Public_
Procurement_of_Energy_Efficiency_Services.pdf.
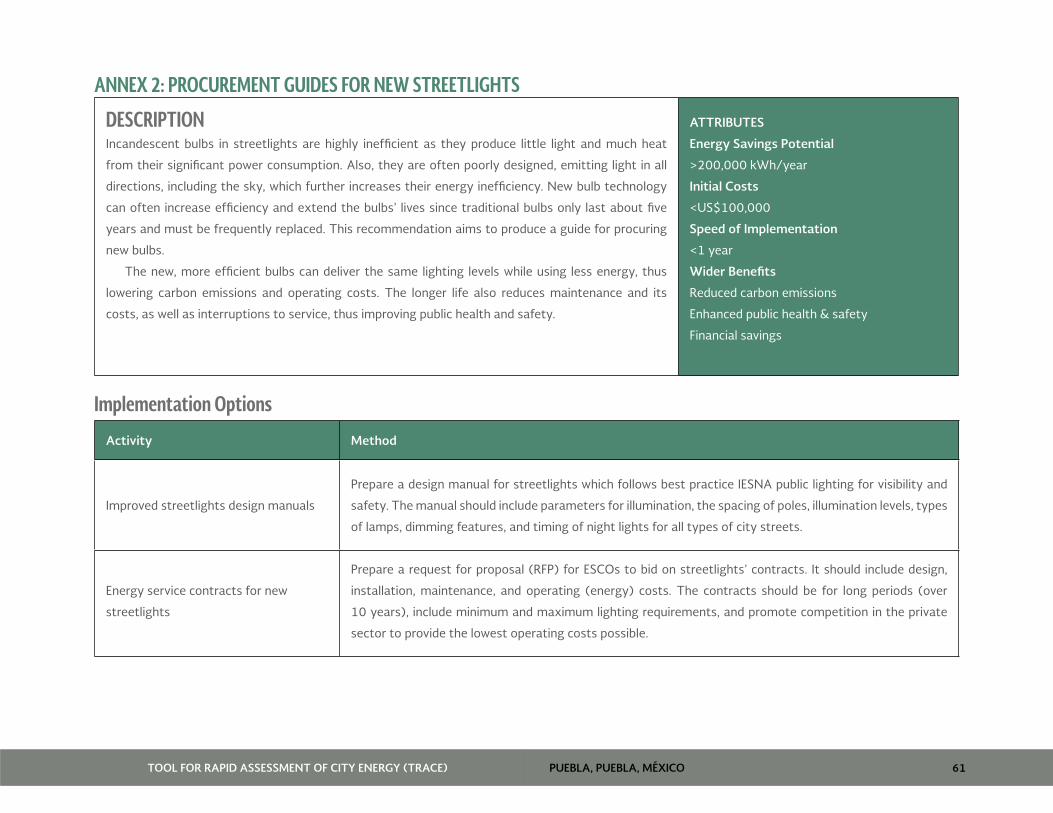
PUEBLA, PUEBLA, MÉXICO 61TOOL FOR RAPID ASSESSMENT OF CITY ENERGY (TRACE)
ANNEX 2: PROCUREMENT GUIDES FOR NEW STREETLIGHTS
DESCRIPTION Incandescent bulbs in streetlights are highly inefficient as they produce little light and much heat
from their significant power consumption. Also, they are often poorly designed, emitting light in all
directions, including the sky, which further increases their energy inefficiency. New bulb technology
can often increase efficiency and extend the bulbs’ lives since traditional bulbs only last about five
years and must be frequently replaced. This recommendation aims to produce a guide for procuring
new bulbs.
The new, more efficient bulbs can deliver the same lighting levels while using less energy, thus
lowering carbon emissions and operating costs. The longer life also reduces maintenance and its
costs, as well as interruptions to service, thus improving public health and safety.
ATTRIBUTES
Energy Savings Potential
>200,000 kWh/year
Initial Costs
<US$100,000
Speed of Implementation
<1 year
Wider Benefits
Reduced carbon emissions
Enhanced public health & safety
Financial savings
Implementation Options
Activity Method
Improved streetlights design manuals
Prepare a design manual for streetlights which follows best practice IESNA public lighting for visibility and
safety. The manual should include parameters for illumination, the spacing of poles, illumination levels, types
of lamps, dimming features, and timing of night lights for all types of city streets.
Energy service contracts for new
streetlights
Prepare a request for proposal (RFP) for ESCOs to bid on streetlights’ contracts. It should include design,
installation, maintenance, and operating (energy) costs. The contracts should be for long periods (over
10 years), include minimum and maximum lighting requirements, and promote competition in the private
sector to provide the lowest operating costs possible.

PUEBLA, PUEBLA, MÉXICO 62TOOL FOR RAPID ASSESSMENT OF CITY ENERGY (TRACE)
Activity Method
Life-cycle cost analysis in procurement Require all procurement for new and replacement streetlights or maintenance to provide a life-cycle analysis
of initial costs, maintenance costs, and energy costs over seven years.
Monitoring See rationale for monitoring, above.
Some measures related to this recommendation are
• US$/km: Benchmark the annual energy cost on a per liner km basis.
• Lumens/watt: Determine the average effectiveness of illumination for currently operating streetlights.
Case studies
Midlands Highway Alliance (MHA), UK
Source: http://www.emcbe.com/Highways-general/idea%20case%20study.pdf
Under the East Midlands Improvement and Efficiency Partnership (EMIEP), the Midlands Highways Alliance (MHA) will save the region GBP 11 million in
highway maintenance and improvements by 2011.
Supported by Constructing Excellence, the nine councils in the region and the highway agency became more efficient and reduced costs by using
best practice procurement plans for major and medium-sized highways. The professional civil engineering services shared best practice maintenance
contracts and jointly procured new technologies, such as for streetlights and signs, which lowered unit costs. The plans list the minimum and desired
specifications for streetlight technologies in order to reduce a specific level of carbon emissions and costs.

PUEBLA, PUEBLA, MÉXICO 63TOOL FOR RAPID ASSESSMENT OF CITY ENERGY (TRACE)
‘Lighting the Way’ Project, Australia
Source: http://www.iclei.org/fileadmin/user_upload/documents/ANZ/CCP/CCP-AU/EnergyToolbox/lightingtheway.pdf.
Committed to reducing the growth of GHG emissions, Australia has launched initiatives at all government levels to improve the efficiency of public lights,
which has involved trials of more efficient bulbs. Further, lights on minor roads are a major source of GHG emissions and many opportunities exist to
improve their quality and reduce costs/GHG emissions. Thus, stakeholders produced a procurement guide, ‘Lighting the Way’, which provides information
to help local governments (1) improve the lights on minor roads while reducing their GHG emissions, (2) lower costs, and (3) decrease liability and risks.
These outcomes can be achieved through EE solutions that provide better streetlight services and comply with Australian standards (AS/NZS 1158).
The document describes technical and other issues related to EE lights, and guides cities on techniques to improve their negotiations about public
lighting issues with distribution companies. Several types of lamps offer considerable advantages over the standard 80 watt mercury vapor lamps with
regard to energy use, lumen depreciation, light output, maintenance, lifespan, aesthetics, and performance in various temperatures.
Tools & Guidance
European Lamp Companies Federation. "Saving Energy through Lighting", A procurement guide for efficient lighting, including a chapter on streetlights.
http://buybright.elcfed.org/uploads/fmanager/saving_energy_through_lighting_jc.pdf.
New York State Energy Research and Development Authority. "How to Guide Effective Energy-Efficient Street Lighting" Available online from http://
www.rpi.edu/dept/lrc/nystreet/how-to-officials.pdf.
ESMAP Public Procurement of Energy Efficiency Services - Guide of good procurement practices from around the world. http://www.esmap.org/
Public_Procurement_of_Energy_Efficiency_Services.pdf.

PUEBLA, PUEBLA, MÉXICO 64TOOL FOR RAPID ASSESSMENT OF CITY ENERGY (TRACE)
ANEXO 3: BENCHMARKING DE EDIFICOS MUNICIPALES
DESCRIPTION This recommendation is to develop a municipal building energy benchmarking program that collects
and reports annually on the energy use and costs, water use and costs, floor areas, and names of
building managers (if any). The goal is to identify the city’s most energy-intensive buildings so as to
develop the best EE opportunities; also, it is to use the EE program resources most effectively and
spend time/money on the areas where EE can be most easily achieved. The program collects annual
data to measure the energy/carbon footprint for municipal operations.
This recommendation is best-suited to larger cities with the size/capacity to conduct such a
program. A starting point is to routinely monitor and analyze building energy consumption and identify
ways to improve EE. However, good benchmarks require detailed analyses because similar buildings
can actually be very different, regarding types of tenants and occupancy density (people per m2).
ATTRIBUTES
Energy-saving Potential
100,000–200,000 kWh/year
Initial Costs
<US$100,000
Speed of Implementation
1–2 years
Wider Benefits
Reduced carbon emissions
Efficient water use
Improved air quality
Financial savings
Implementation Options
Activity Method
Designar al líder del programa de
benchmarking
Appoint 1–2 staff or hire a consultant with the skills, experience, and personality needed to head the program
that is designed to gather a wide variety of data from many departments across the city administration.
Identify benchmarking
requirements
Define the information needed for an energy-benchmarking database. Besides electricity bills, other important
data:
• The building name and address
• Electricity, gas, and water utility account numbers
• Electricity, gas, and water utility bills for the past three years
• Building floor plans
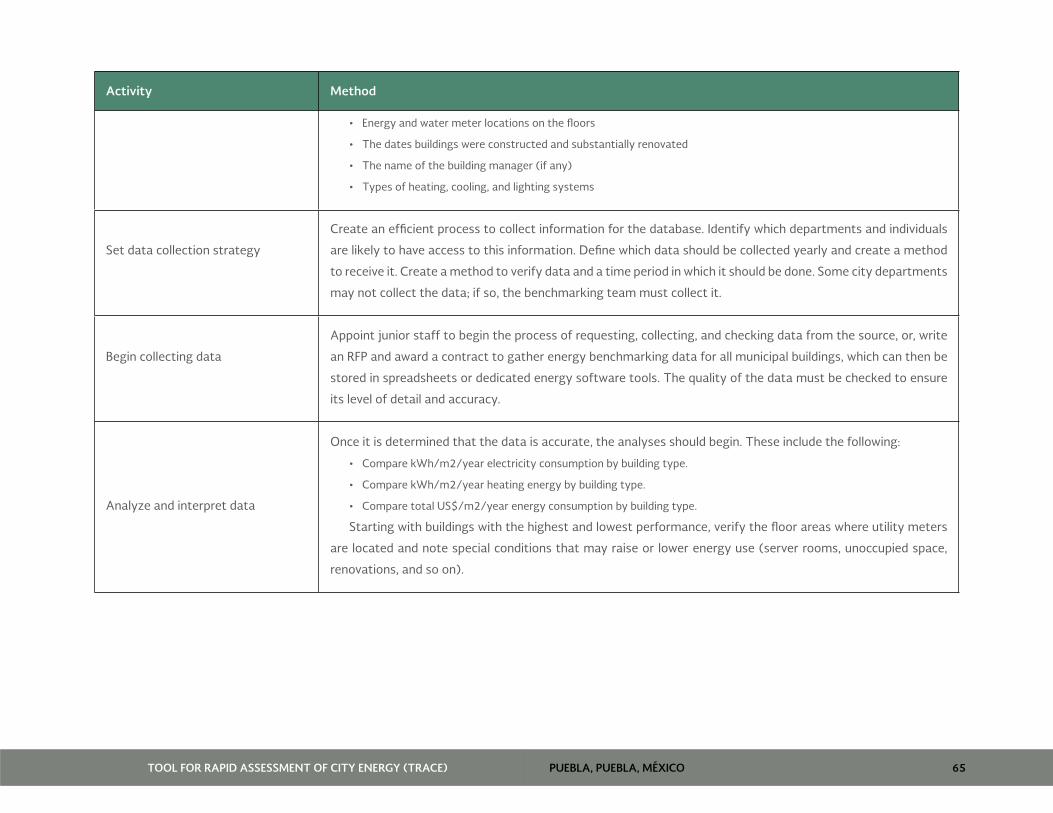
PUEBLA, PUEBLA, MÉXICO 65TOOL FOR RAPID ASSESSMENT OF CITY ENERGY (TRACE)
Activity Method
• Energy and water meter locations on the floors
• The dates buildings were constructed and substantially renovated
• The name of the building manager (if any)
• Types of heating, cooling, and lighting systems
Set data collection strategy
Create an efficient process to collect information for the database. Identify which departments and individuals
are likely to have access to this information. Define which data should be collected yearly and create a method
to receive it. Create a method to verify data and a time period in which it should be done. Some city departments
may not collect the data; if so, the benchmarking team must collect it.
Begin collecting data
Appoint junior staff to begin the process of requesting, collecting, and checking data from the source, or, write
an RFP and award a contract to gather energy benchmarking data for all municipal buildings, which can then be
stored in spreadsheets or dedicated energy software tools. The quality of the data must be checked to ensure
its level of detail and accuracy.
Analyze and interpret data
Once it is determined that the data is accurate, the analyses should begin. These include the following:
• Compare kWh/m2/year electricity consumption by building type.
• Compare kWh/m2/year heating energy by building type.
• Compare total US$/m2/year energy consumption by building type.
Starting with buildings with the highest and lowest performance, verify the floor areas where utility meters
are located and note special conditions that may raise or lower energy use (server rooms, unoccupied space,
renovations, and so on).

PUEBLA, PUEBLA, MÉXICO 66TOOL FOR RAPID ASSESSMENT OF CITY ENERGY (TRACE)
Activity Method
Create a benchmark
The results of the analyses must be used to create a benchmark that considers the factors affecting the city’s
energy use. These factors may vary significantly from city to city and among different buildings. They include:
• Types of tenants
• Occupancy density (persons/m2)
• Building energy management
This benchmarking is usually done in order to rate and label buildings according to their energy usage. See
the Singapore case study for details.
Publicize benchmarking findings
internally
One of the most important ways to promote EE in building operations is peer pressure since no building
owners/operators want to be seen as having the worst performing buildings. Thus, sharing data on building
energy intensity with other departments/operators will reduce energy use and encourage them to share their
experiences with others, city-wide.
Publish benchmarking publically
The boldest action is to present energy performance data to the public, press, voters, and potential political
opponents. This last stage of the program may occur many years after it begins, when the data shows that
progress has been made to achieve efficient government operations. The city can then challenge (or require, as
some cities have begun to do) private building owners to benchmark their properties and publish their findings.
Monitoring Monitoring the progress and effectiveness of recommendations is crucial to understand their value over time. Where the city administration adopts a
recommendation, it should define a target(s) that indicates the progress it expects in a given period and design a monitoring plan. The latter does not need
to be complicated or time consuming but should, at least (a) identify information sources; (b) identify performance indicators that can measure and validate
equipment/processes; (c) set protocols for keeping records; (d) set a schedule to measure activity (daily, weekly, monthly); (e) assign responsibilities for
each piece of the process; (f) create a way to audit and review performance; and (g) create reporting and review cycles.
Some measures related to this recommendation are
• kWhe/m2 - Determine annual electrical energy intensity by type of building (schools, offices, residences, or hospitals)

PUEBLA, PUEBLA, MÉXICO 67TOOL FOR RAPID ASSESSMENT OF CITY ENERGY (TRACE)
• kWht/m2 - Determine annual heating energy intensity by building type
• US$/m2 - Determine annual energy costs by building type
Case studies
Energy Efficiency in Public Buildings, Kiev, Ukraine
Source: ESMAP (2010). “Good Practices in City Energy Efficiency: Kiev, Ukraine - Energy Efficiency in Public Buildings”, available online from http://www.
esmap.org/esmap/node/656.
Under the Kiev Public Buildings Energy Efficiency Project, 1,270 public buildings—including health facilities, schools, and cultural facilities—were upgraded
with cost-effective EE systems and equipment. The project focused on the supply side, such as automation and control systems, as well as the demand side,
by installing meters, and weatherization, along with creating appropriate heating rates. The project was conducted by the Kiev City State Administration
(KCSA). Savings were estimated at 333,423 Gigacalories (Gcal)/year by 2006—normalized by degree/days in the baseline year—or about a 26 percent
savings compared to the buildings’ heat consumption before the project. These upgrades also improved the buildings’ comfort levels, helped foster an EE
services industry, and raised public awareness about the issues.
The project cost US$27.4 million and was financed through a World Bank loan, Swedish Government grant, and KCSA funds. Based on the project’s
success, many other Ukrainian cities have requested information and shown interest in launching similar programs.

PUEBLA, PUEBLA, MÉXICO 68TOOL FOR RAPID ASSESSMENT OF CITY ENERGY (TRACE)
Building Energy Efficiency Master Plan (BEEMP), Singapore
The Inter-Agency Committee on Energy Efficiency (IACEE) report presented key measures to improve the EE of buildings, industries, and transport
sectors. The Building Energy Efficiency Master Plan (BEEMP), created by the Building & Construction Authority (BCA), describes the initiatives taken by
the BCA to adopt the recommendations. The plan contains measures that span the whole life cycle of a building. It begins with a set of EE standards to
ensure buildings are designed right and continues with an energy management program to ensure they are operated efficiently throughout their life-
span. The BEEMP consists of the following programs:
• Review and update energy standards.
• Audit the energy use in selected buildings.
• Create energy efficiency indices (EEI) and performance benchmarks.
• Develop ways to better manage the energy use of public buildings.
• Insist on performance-based contracts.
• Conduct research and development.
Energy Smart Building Labeling Programme, Singapore
Source: http://www.e2singapore.gov.sg/buildings/energysmart-building-label.html.
The Energy Smart Building Labeling Program, developed by the Energy Sustainability Unit (ESU) of the National University of Singapore (NUS) and the
National Environment Agency (NEA), aims to promote EE and conservation by awarding owners of EE buildings with a label that recognizes this fact.
Authorities use the ‘Energy Smart Tool’, an online benchmarking system, to evaluate the energy performance of office buildings and hotels. The program
allows building owners to review their energy consumption patterns and compare them against industry norms. The Energy Smart Building Label is
reviewed every three years and is given at an annual awards ceremony. Besides reducing energy consumption and carbon emissions in the buildings
sector, the program does the following:
• Saves energy through enlightened energy management
• Brings greater comfort to building occupants
• Enhances a company’s corporate image
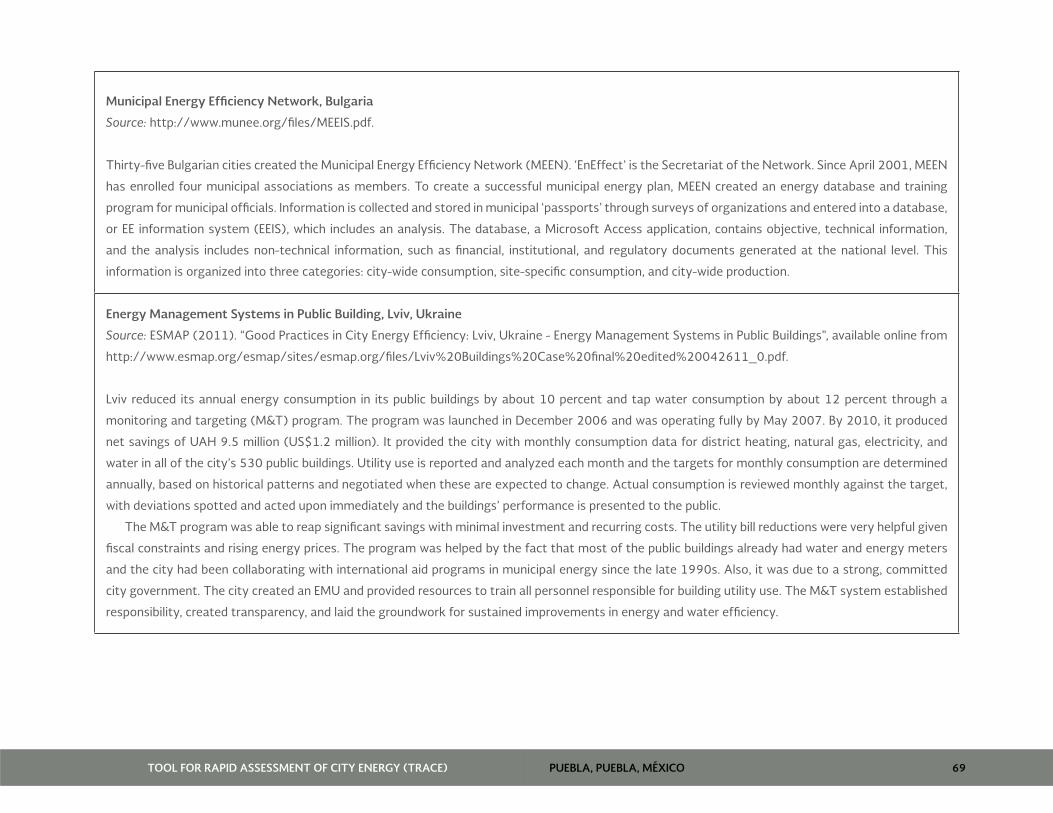
PUEBLA, PUEBLA, MÉXICO 69TOOL FOR RAPID ASSESSMENT OF CITY ENERGY (TRACE)
Municipal Energy Efficiency Network, Bulgaria
Source: http://www.munee.org/files/MEEIS.pdf.
Thirty-five Bulgarian cities created the Municipal Energy Efficiency Network (MEEN). ‘EnEffect’ is the Secretariat of the Network. Since April 2001, MEEN
has enrolled four municipal associations as members. To create a successful municipal energy plan, MEEN created an energy database and training
program for municipal officials. Information is collected and stored in municipal ‘passports’ through surveys of organizations and entered into a database,
or EE information system (EEIS), which includes an analysis. The database, a Microsoft Access application, contains objective, technical information,
and the analysis includes non-technical information, such as financial, institutional, and regulatory documents generated at the national level. This
information is organized into three categories: city-wide consumption, site-specific consumption, and city-wide production.
Energy Management Systems in Public Building, Lviv, Ukraine
Source: ESMAP (2011). “Good Practices in City Energy Efficiency: Lviv, Ukraine - Energy Management Systems in Public Buildings”, available online from
http://www.esmap.org/esmap/sites/esmap.org/files/Lviv%20Buildings%20Case%20final%20edited%20042611_0.pdf.
Lviv reduced its annual energy consumption in its public buildings by about 10 percent and tap water consumption by about 12 percent through a
monitoring and targeting (M&T) program. The program was launched in December 2006 and was operating fully by May 2007. By 2010, it produced
net savings of UAH 9.5 million (US$1.2 million). It provided the city with monthly consumption data for district heating, natural gas, electricity, and
water in all of the city’s 530 public buildings. Utility use is reported and analyzed each month and the targets for monthly consumption are determined
annually, based on historical patterns and negotiated when these are expected to change. Actual consumption is reviewed monthly against the target,
with deviations spotted and acted upon immediately and the buildings’ performance is presented to the public.
The M&T program was able to reap significant savings with minimal investment and recurring costs. The utility bill reductions were very helpful given
fiscal constraints and rising energy prices. The program was helped by the fact that most of the public buildings already had water and energy meters
and the city had been collaborating with international aid programs in municipal energy since the late 1990s. Also, it was due to a strong, committed
city government. The city created an EMU and provided resources to train all personnel responsible for building utility use. The M&T system established
responsibility, created transparency, and laid the groundwork for sustained improvements in energy and water efficiency.

PUEBLA, PUEBLA, MÉXICO 70TOOL FOR RAPID ASSESSMENT OF CITY ENERGY (TRACE)
Public Building Energy Management Program, Lviv, Ukraine
Source: http://www.ecobuild-project.org/docs/ws2-kopets.pdf.
As part of the Energy Efficiency Cities of Ukraine initiative, launched in 2007 in four cities, supported by MHME, NAER, and the European Association of
local authorities ‘Energie-Cites’, Lviv promoted a sustainable energy policy and action plans at the local level through a Public Building Energy Management
Program. This involves various agencies regularly gathering data about energy consumption that is then monitored and analyzed so as to identify easily
achievable improvements.
SMEU Software, Romania
The SMEU software was created to set priorities for municipal energy action plans and assess global energy costs and consumption. The software is
applied to gather energy data so decision-makers can analyze consumers’ energy use and predict the energy budget for the following period.
The software divides data into individual and interrelated modules. The city collects information on an annual basis, which lists the area being studied,
population, average temperatures, number of buildings, and number of dwellings in each area.
Tools & Guidance
Target Finder helps users establish an energy performance target for design projects and major building renovations. http://www.energystar.gov/
index.cfm?c=new_bldg_design.bus_target_finder
Portfolio Manager is an interactive energy management tool to track and assess energy and water consumption across the entire portfolio of buildings.
http://www.energystar.gov/index.cfm?c=evaluate_performance.bus_portfoliomanager
A presentation by BEA on Berlin's Energy Saving Partnership - "a Model of Success". June 29, 2010. http://siteresources.worldbank.org/
INTRUSSIANFEDERATION/Resources/305499-1280310219472/CArce_BEA_ENG.pdf

PUEBLA, PUEBLA, MÉXICO 71TOOL FOR RAPID ASSESSMENT OF CITY ENERGY (TRACE)
ANNEX 4: MUNICIPAL BUILDINGS’ AUDITS AND UPGRADES
DESCRIPTIONThis recommendation involves developing a program to audit buildings and explore opportunities for
EE upgrades. Once introduced, it would reduce a city’s energy costs for its offices and lower its carbon
footprint. The program will identify and introduce immediate payback items from which the savings
can be used to fund other municipal services.
ATTRIBUTES
Energy-saving Potential
>200,000 kWh/year
Initial Costs
>US$1 million
Speed of Implementation
1–2 years
Wider Benefits
Reduced carbon emissions
Improved air quality
Enhanced public health & safety
Increased employment opportunities
Financial savings
Implementation Options
Activity Method
Appoint a program head Identify an existing staff or hire a new person to head EE projects in municipal office buildings. He/
she must be able to work across agencies, understand building systems, and manage subcontractors.
Identify preliminary EE projects
With results from the benchmarking program or new data on office buildings collected by staff,
identify preliminary opportunities for EE such as new lighting/air conditioning/heating systems, new
computers, and server cooling opportunities.
Some buildings are more complex and have various types of systems, for example, some may
have simple AC window units, while others may have central AC systems with chillers, cooling towers,
air handlers, and ductwork.

PUEBLA, PUEBLA, MÉXICO 72TOOL FOR RAPID ASSESSMENT OF CITY ENERGY (TRACE)
Activity Method
Perform energy audits
Walk through various office buildings to identify specific EE opportunities, which may include
• Lighting systems,
• AC systems,
• Heating systems,
• Computers,
• Server rooms and cooling of servers,
• Appliances (water cooler, fridge, vending machines).
The municipal office EE spreadsheet includes areas where gains can be made, such as equipment
upgrades, behavioral changes (turning lights off, lowering heating temperatures, changing operating
times, and so on), and procurement guidelines.
Set budgets and requirements
Allocate budgets for EE upgrades in municipal office buildings. When upgrades are combined with
normal renovations, this is the best use of limited financing. For example, if a new roof is required,
it is a good opportunity to add insulation and a white roof, or, if new windows need to be installed,
they could be upgraded to those that offer insulation, using Office Building Energy Efficiency Program
funds. Or, contracts may be signed with ESCOs that will pay for the up-front cost of the upgrades and
then share from the savings.
Design upgrades Using the benchmark data and energy audits, design upgrades for each building, and replace the
equipment.
Hire a contractor to do the upgrades
Prepare an RFP for mechanical or electrical contractors to bid on the upgrade projects. Achieve
economies of scale and higher quality by combining a large number of similar upgrades across many
buildings. Or, prepare an RFP and award a contract to a private company (ESCO) that will guarantee
energy savings, provide the initial investment, and share future savings with the city.

PUEBLA, PUEBLA, MÉXICO 73TOOL FOR RAPID ASSESSMENT OF CITY ENERGY (TRACE)
Activity Method
Verify upgrades and performance
Walk through the building and verify that each construction project has been performed according
to the EE upgrade specifications. Continue collecting electricity and heating bills for each upgraded
building to compare them with historical data.
MonitoringSome measures related to this recommendation are:
• US$/m2 - Determine annual energy costs on a per-square-meter basis for all municipal office buildings;
• kWhe/m2 - Determine annual electrical energy consumption on a per-m2 basis for all municipal office buildings;
• kWht/m2 - Determine annual heating energy consumption on a per- m2 basis for all municipal office buildings;
• US$/y saved - Aggregate total energy savings generated through the life of the program.
Case studies
Model for Improving Energy Efficiency in Buildings, Berlin, Germany
Source: http://www.c40cities.org/bestpractices/buildings/berlin_efficiency.jsp.
Berlin, in partnership with the BEA, pioneered an excellent model to improve EE in its buildings. Together they managed the upgrade of public and private
buildings, preparing tenders for work that is guaranteed to reduce emissions. The tenders require the ESCOs that win the contracts to reduce CO2
emissions by an average of 26 percent. To date, 1,400 buildings have been upgraded, reducing CO2 emissions by 60,400 tons a year. With the ESCO
paying for the investments, these upgrades cost the building owners nothing and the energy savings were almost immediate.

PUEBLA, PUEBLA, MÉXICO 74TOOL FOR RAPID ASSESSMENT OF CITY ENERGY (TRACE)
Internal Contracting, Stuttgart, Germany
Source: http://www.c40cities.org/bestpractices/buildings/stuttgart_efficiency.jsp
Stuttgart reduces its CO2 emissions each year by about 7,200 tons through an innovative form of internal contracting, making use of a revolving fund
to finance energy and water-saving measures. The city then reinvests the savings into new activities, creating a cycle of environmental improvements
and reduced emissions.
EU and Display Campaign Case Studies
Source: http://www.display-campaign.org/page_162.html
The European Display Campaign is a voluntary scheme designed by energy experts from European towns and cities. When it began in 2003, it aimed
to encourage local authorities to publicly display the energy and environmental performances of city buildings—adopting the same energy label that is
used for household appliances. Since 2008, private companies have also been encouraged to use the ‘display’ for their corporate social responsibilities.
Tools & Guidance
EU LOCAL ENERGY ACTION Good practices 2005 - Brochure of good practice examples from energy agencies across Europe. http://www.
managenergy.net/download/gp2005.pdf
ESMAP Public Procurement of Energy Efficiency Services - Guide of good, worldwide procurement practices. http://www.esmap.org/Public_
Procurement_of_Energy_Efficiency_Services.pdf
Energy Conservation Building Codes provide minimum requirements for the EE design and construction of buildings and their systems. http://www.
emt-india.net/ECBC/ECBC-UserGuide/ECBC-UserGuide.pdf

PUEBLA, PUEBLA, MÉXICO 75TOOL FOR RAPID ASSESSMENT OF CITY ENERGY (TRACE)
ANNEX 5: MANDATORY ENERGY EFFICIENCY CODES FOR NEW BUILDINGS
DESCRIPTION These codes are city-specific green building guidelines or certification programs to promote the use of
the green technologies. The guidelines can be based on previously established systems such as LEED
(U.S.), BREEAM (U.K.), CASBEE (Japan), Green Mark (Singapore), Estidama (Abu Dhabi), and others.
They focus on EE and also cover water conservation, urban heat island effects (green roofs), indoor
air quality, and other aspects of green buildings. The programs can include voluntary guidelines,
minimum building standards, or incentive programs for private developers. The outcomes are higher
quality building designs and construction, EE for all city buildings, saving costs and water, and making
better buildings in which to live and work.
ATTRIBUTES
Energy-saving Potential
>200,000 kWh/year
Initial Costs
<US$100,000
Speed of Implementation
>2 years
Wider Benefits
Reduced carbon emissions
Efficient water use
Increased employment opportunities
Financial savings
Implementation Options
Activity Method
Assess opportunities Assess the climate, building types, real estate market and construction industry for green building
opportunities. Evaluate other global and regional guidelines and identify the most relevant strategies.
Perform cost-benefit analysis
Assess the general costs of each green building strategy in the city for new construction under code-
based designs versus green building designs. Calculate the added costs (for adhering to the codes) as
well as of savings and shared benefits—beyond those that are strictly financial.
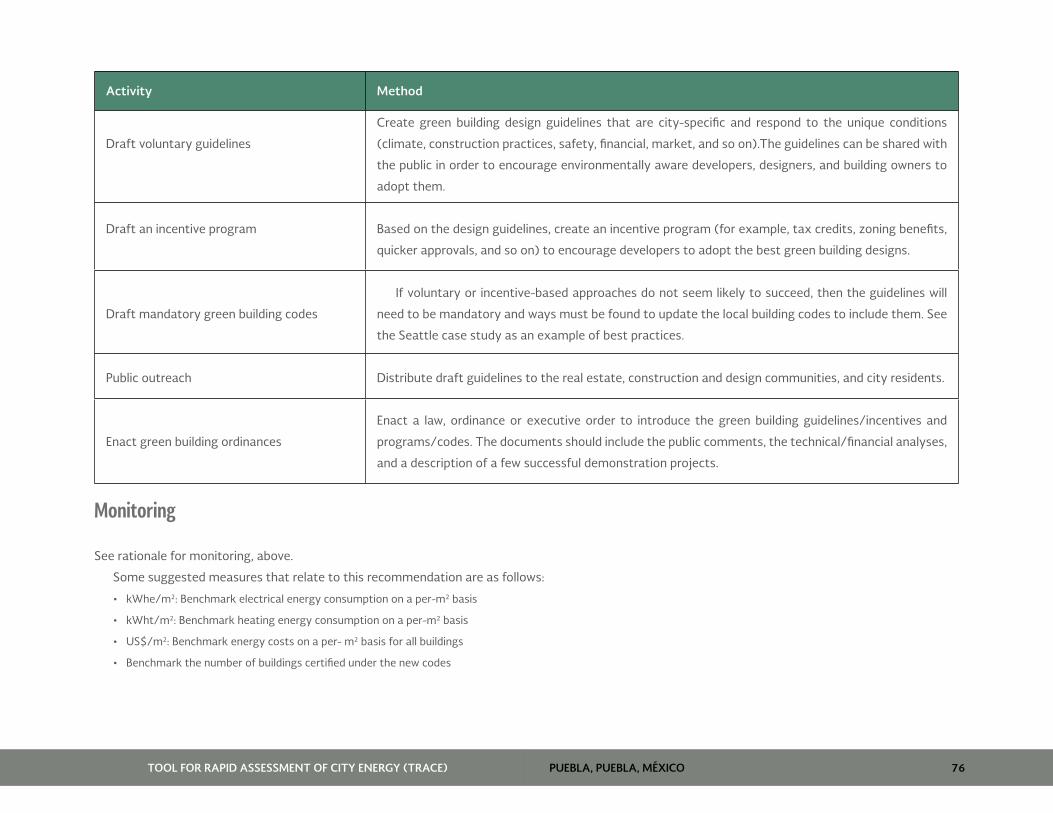
PUEBLA, PUEBLA, MÉXICO 76TOOL FOR RAPID ASSESSMENT OF CITY ENERGY (TRACE)
Activity Method
Draft voluntary guidelines
Create green building design guidelines that are city-specific and respond to the unique conditions
(climate, construction practices, safety, financial, market, and so on).The guidelines can be shared with
the public in order to encourage environmentally aware developers, designers, and building owners to
adopt them.
Draft an incentive program Based on the design guidelines, create an incentive program (for example, tax credits, zoning benefits,
quicker approvals, and so on) to encourage developers to adopt the best green building designs.
Draft mandatory green building codes
If voluntary or incentive-based approaches do not seem likely to succeed, then the guidelines will
need to be mandatory and ways must be found to update the local building codes to include them. See
the Seattle case study as an example of best practices.
Public outreach Distribute draft guidelines to the real estate, construction and design communities, and city residents.
Enact green building ordinances
Enact a law, ordinance or executive order to introduce the green building guidelines/incentives and
programs/codes. The documents should include the public comments, the technical/financial analyses,
and a description of a few successful demonstration projects.
Monitoring
See rationale for monitoring, above.
Some suggested measures that relate to this recommendation are as follows:
• kWhe/m2: Benchmark electrical energy consumption on a per-m2 basis
• kWht/m2: Benchmark heating energy consumption on a per-m2 basis
• US$/m2: Benchmark energy costs on a per- m2 basis for all buildings
• Benchmark the number of buildings certified under the new codes

PUEBLA, PUEBLA, MÉXICO 77TOOL FOR RAPID ASSESSMENT OF CITY ENERGY (TRACE)
Case studies
Energy Efficiency Codes in Residential Buildings, Tianjin, China.
Source: ESMAP (2011). “Good Practices in City Energy Efficiency: Tianjin, China -Enforcement of Residential Building Energy Efficiency Codes.” Available
online from http://www.esmap.org/esmap/node/1280.
Tianjin is one of the Chinese cities that has complied with building EE codes (BEECs). In its recent annual national inspections, the Ministry of Housing
and Urban and Rural Development (MoHURD) found that BEEC compliance in Tianjin’s new residential and commercial buildings was nearly 100 percent,
compared to the 80 percent average across nearly three dozen other large cities it inspected in 2008. Even more impressive, the residential code for the
buildings’ thermal integrity (DB29-1-2007) was 30 percent more stringent than the national BEEC (JGJ 26-95).
In 1997, Tianjin introduced its first mandatory residential EE code (DB29-1-97), which was similar to the 1995 national code developed for Chinese
cities in cold regions (JGJ 26-95), DB29-1-97 was enforced from 1998 to 2004. Enforcement actually began on January 1, 2005. It was based on an
earlier version which was updated and passed in June 2007. The case study covered the five years that DB29-1-2007 was enforced—from 2005 to
2009.
Tianjin’s efforts to go beyond the national BEEC were a departure from the norm, when cities usually follow central government regulations. Tianjin
began piloting residential BEECs in the late 1980s, although it took the city about 15 years to achieve a high degree of compliance. The city met and
surpassed the requirements because of the following: (1) a well-established building construction management system; (2) standard procedures for
enforcing compliance; (3) broad capacity of the construction sector to comply with the codes, with respect to technical skills and the availability of parts
and materials; (4) consumers’ ability and willingness to pay for the costs of compliance; and (5) local government resources, support, and commitment
to enforcing increasingly stringent BEECs.
Low-Energy Building Standards, Münster, Germany
Source: ESMAP (2011). “Good Practices in City Energy Efficiency: Low-Energy Building Standards Applied through the Sale of City-Owned Land, Münster,
Germany.” Available online from http://www.esmap.org/esmap/node/1170.
By mandating low-energy building standards through the sale of city-owned land, Münster transformed the market. Thus, 80 percent of all new buildings
constructed in 2010, even not on city-owned land, follow the city’s EE requirements.

PUEBLA, PUEBLA, MÉXICO 78TOOL FOR RAPID ASSESSMENT OF CITY ENERGY (TRACE)
Austin Energy Green Building (AE/GB), Austin, U.S.A.
Source: http://www.austinenergy.com/energy%20efficiency/Programs/Green%20Building/index.htm
http://www.c40cities.org/bestpractices/buildings/austin_standards.jsp.
In 1991, the Austin Energy Green Building (AE/GB) program developed the first city-wide tool to evaluate the sustainability of U.S. buildings; it covers
single and multi-family homes, commercial, and government or utilities’ buildings. The program provides technical support to homeowners, architects,
designers, and builders, helping them design/construct sustainable buildings. Using tools developed to rate green buildings, specifically prepared for
Austin, along with the LEED and Green Globes national rating tools, the program’s staff help the design teams create goals, review plans and specifications,
recommend improvements, and rate the final products regarding effects on the environment and community.
AE/GB has saved US$2.2 million a year by reducing consumers’ energy costs. The initial program investment of US$1.2 million came from an annual
budget (including a US$50,000 grant from the U.S. Department of Energy). The AE/GB also reduced energy consumption by 142,427 MWh and reduced
demand on the utility’s generation resources by 82.8 MW. These savings have reduced the power plant’s CO2 emissions by 90,831 tons, NOx by 87.6
tons, and SOx by 17.4 tons.
Sustainable Building Action Plan, Seattle, U.S.A.
Source: http://www.c40cities.org/docs/casestudies/buildings/seattle_green.pdf
Under the Sustainable Building Policy, Seattle requires all new city buildings over 5,000 sq ft to meet new state LEED (Leadership in Energy and
Environmental Design) ratings, which measure the buildings’ sustainability. The city provided incentives to private developers if they meet the standards:
For example, Seattle introduced (1) the Sustainable Building Action Plan which contained strategies to promote green buildings; (2) a density ‘bonus’
that offered downtown commercial, residential, and mixed use developments greater height and/or floor space if a green building standard of LEED silver
or higher was met; and (3) the City LEED Incentive Program which provided financial help for energy conservation, natural drainage/water conservation,
and design and consulting fees for LEED projects.
From 2001 to 2005, the city’s incentives were over US$4.3 million for projects complying with LEED standards, which reduced energy by an average
of 35 percent and 6.9 million KWh/year for LEED municipal buildings. Other benefits included an average reduction of 1,067 CO2e tons per LEED building
and an annual average financial saving of US$43,000.

PUEBLA, PUEBLA, MÉXICO 79TOOL FOR RAPID ASSESSMENT OF CITY ENERGY (TRACE)
Green Building Guidelines, Cape Town, South Africa
Source: http://www.capetown.gov.za/en/EnvironmentalResourceManagement/publications/Documents/DRAFT City of Cape Town Green Building
Guidelines.pdf.
Cape Town plans to enact a law by 2012 calling for environmentally friendly building methods. The Draft Green Buildings Guidelines form the core of
the law, which promotes resource-efficient construction on new or renovated buildings to minimize the negative environmental impacts on the built
environment, and maximize positive social and economic impacts. In the long term, Cape Town will produce design manuals and other laws to ensure
that green buildings have a permanent place in the urban landscape.
The Green Building Guidelines are consistent with the Green Building Council of South Africa, which incorporated the Green Star Rating System of
Australia’s Green Building Council. It is expected that Cape Town will incorporate the Green Star Rating System in the future.
Cape Town’s guidelines for green buildings are city-specific, including advice on site selection, design and construction phases, sustainable resource
management, waste management, urban landscaping, human health and safety, and visual mitigation measures.
Tools & Guidance
http://www.epa.gov/region4/recycle/green-building-toolkit.pdf
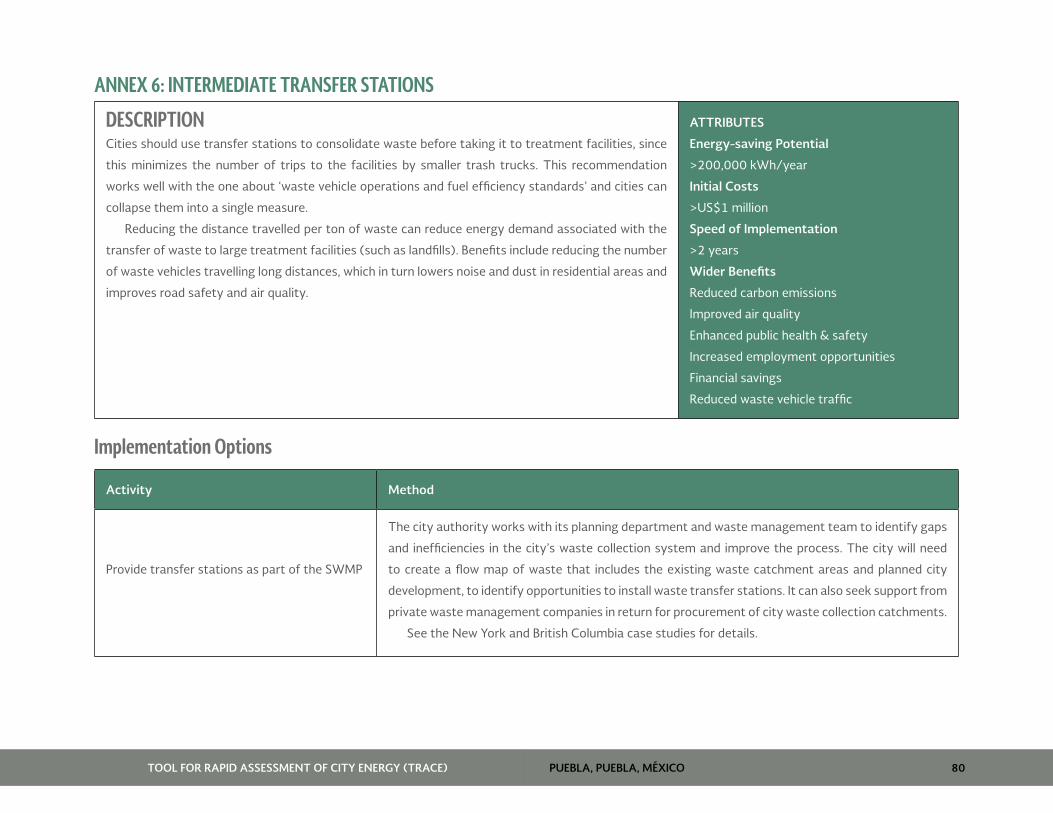
PUEBLA, PUEBLA, MÉXICO 80TOOL FOR RAPID ASSESSMENT OF CITY ENERGY (TRACE)
ANNEX 6: INTERMEDIATE TRANSFER STATIONS
DESCRIPTION Cities should use transfer stations to consolidate waste before taking it to treatment facilities, since
this minimizes the number of trips to the facilities by smaller trash trucks. This recommendation
works well with the one about ‘waste vehicle operations and fuel efficiency standards’ and cities can
collapse them into a single measure.
Reducing the distance travelled per ton of waste can reduce energy demand associated with the
transfer of waste to large treatment facilities (such as landfills). Benefits include reducing the number
of waste vehicles travelling long distances, which in turn lowers noise and dust in residential areas and
improves road safety and air quality.
ATTRIBUTES
Energy-saving Potential
>200,000 kWh/year
Initial Costs
>US$1 million
Speed of Implementation
>2 years
Wider Benefits
Reduced carbon emissions
Improved air quality
Enhanced public health & safety
Increased employment opportunities
Financial savings
Reduced waste vehicle traffic
Implementation Options
Activity Method
Provide transfer stations as part of the SWMP
The city authority works with its planning department and waste management team to identify gaps
and inefficiencies in the city’s waste collection system and improve the process. The city will need
to create a flow map of waste that includes the existing waste catchment areas and planned city
development, to identify opportunities to install waste transfer stations. It can also seek support from
private waste management companies in return for procurement of city waste collection catchments.
See the New York and British Columbia case studies for details.

PUEBLA, PUEBLA, MÉXICO 81TOOL FOR RAPID ASSESSMENT OF CITY ENERGY (TRACE)
Activity Method
Planning for waste management
The city’s planning department will need to integrate waste management into its spatial planning
strategies, allocating land for transfer stations and other facilities according to the SWMP.
Where appropriate, waste management regulations/guidelines should also be included in the
city’s development documents. For example, they should require land developments over a certain
size and with certain densities to integrate transfer stations into master plans. To ensure that sites
are suitable, the city’s waste management strategy, urban development, and environmental plans
must be coordinated.
See the Kuala Lumpur and Birmingham case studies for details.
MonitoringSee rationale for monitoring, above.
Some measures related to this recommendation are as follows:
• Determine the energy use per ton of waste to be collected, transported, and disposed of (MWh).
• Determine the energy used by a city to transport waste, by per ton of waste (MWh/t).
• Determine total annual mileage to transport waste (km).
• Determiner the kilometers travelled per ton of waste (km/t).
Assess the number and location of municipal waste transfer stations and map these against waste catchment areas. These can be based on the length
of the daily collection route, districts, or capability of the waste collection fleet.
Track city development and create maps of existing and potential waste transfer stations against expanding municipality catchment areas.
Ensure that distances from collection points to treatment facilities do not exceed the miles recommended by vehicle manufacturers.
Compare fuel use per volume or mass of waste transferred before and after the waste stations are built and operating.

PUEBLA, PUEBLA, MÉXICO 82TOOL FOR RAPID ASSESSMENT OF CITY ENERGY (TRACE)
Case studies
Solid Waste Management Plan, New York City
Source: http://www.plannyc.org/taxonomy/term/762.
New York’s mayor launched an SWMP in 2006 as a way to dramatically reduce the energy used for waste disposal, along with a cost-effective and
environmentally sound system for managing the city’s waste. The plan involved assessing existing transfer stations to maximize waste management
efficiency and create a more equitable distribution of waste storage, transfer, and disposal throughout the five boroughs.
By exporting 90 percent of the city’s residential waste by barge or rail (rather than by truck), the program will reduce waste truck miles by 2.7 million
a year and tractor-trailer miles by 3 million. This means using transfer stations in every borough, reopening eight transfer stations that were closed, and
building seven new marine transfer stations. The latter, which should be completed in 2013, are expected to reduce waste truck travel by 3.5 million
miles. However, some claim the marine transfer stations will increase the cost of waste disposal from US$77 per ton to US$107.
The city has had problems building the new transfer stations, which have been delayed by lawsuits and community organizations concerned about
increased truck traffic, air and noise pollution, and water dredging that may harm nearby wildlife. Thus, only two of the seven marine transfer stations
were being constructed by May 2010 and none of the barges were being used. In March 2009, the mayor signed a 30-year contract with a private waste
management company to oversee a program for moving waste from Brooklyn’s transfer stations to out-of-state landfills by train.
Municipal Solid Waste Guidelines, Victoria, Canada
Source: http://www.elp.gov.bc.ca/epd/epdpa/mpp/gfetsfms.html.
The regional authority (Ministry of Environment) funded a project to prepare guidelines for creating transfer stations for municipal solid waste. It
hired an engineering consultant in Victoria to produce the report on transfer station methodologies, using examples to recommend siting, design, and
operating guidelines. These include cost models that compare direct hauls in collection trucks with transfer hauls to a landfill, and rural landfills with
rural transfer stations. Such models can be used to decide if a transfer station is justified under particular conditions, as they detail operating and capital
costs based on case studies. The report covers issues that can arise and examples of transfer station operating/capital costs that apply to cities during
the implementation of their SWMPs.

PUEBLA, PUEBLA, MÉXICO 83TOOL FOR RAPID ASSESSMENT OF CITY ENERGY (TRACE)
Kuala Lumpur Waste Structure Plan 2020, Kuala Lumpur, Malaysia
Source: http://www.dbkl.gov.my/pskl2020/english/infrastructure_and_utilities/index.htm.
The Kuala Lumpur Structure Plan 2020 is the city’s strategic spatial development plan which includes guidelines on improving the quality of its
infrastructure and utility services. Solid waste collection/disposal services are integrated in the plan, which describes the coordination of existing landfill
sites and capacities, supported by new transfer stations. The plan noted the limited capacity of the Taman Beringin landfill, which led to the transfer of
waste to a private landfill outside the city in Air Hitam. A new transfer station at Taman Beringin is to be built to sort the waste that can be recycled and
compact the remaining waste before it is transported to Air Hitam. The plan also includes maps of the existing solid waste disposal sites and as well as
transfer stations that are to be built.
Veolia Environmental Services Waste Transfer, Birmingham, UK
Source: http://www.veoliaenvironmentalservices.co.uk/Birmingham/.
Veolia Environmental Services, a private waste management company, operates two major waste transfer stations in the north and south of Birmingham.
These play a key role in managing the city’s waste and are focal points for recycling. The transfer stations accept curbside collected waste from
Birmingham City Council refuse vehicles that is then consolidated into bulk loads and transported either to the recycling re-processor, the Energy
Recovery Facility (ERF) at Tyseley, or to a landfill.
A standard-size trash truck holds about eight tons of waste, while bulk vehicles hold up to 25 tons. This means that, with the transfer stations, vehicle
trips are reduced by a third; also, that trash collection vehicles do not have to travel across the city to deposit their loads but rather go to the nearest
transfer station. A considerable part of the trash at the ERF is moved at night to reduce traffic and improve the operation’s efficiency. Further, the transfer
stations act as bulk stations for the recyclable materials collected either from the curbside pick-up or from the household recycling centers. This reduces
vehicle movements, eases traffic, and lowers the environmental impact of transporting the recyclable materials.
Tools & Guidance
“Guidelines for Establishing Transfer Stations for Municipal Solid Waste.” http://www.env.gov.bc.ca/epd/epdpa/mpp/gfetsfms.html.
“Waste Transfer Stations: A manual for decision making.” (U.S. Environmental Protection Agency) http://www.epa.gov/osw/nonhaz/municipal/pubs/
r02002.pdf.
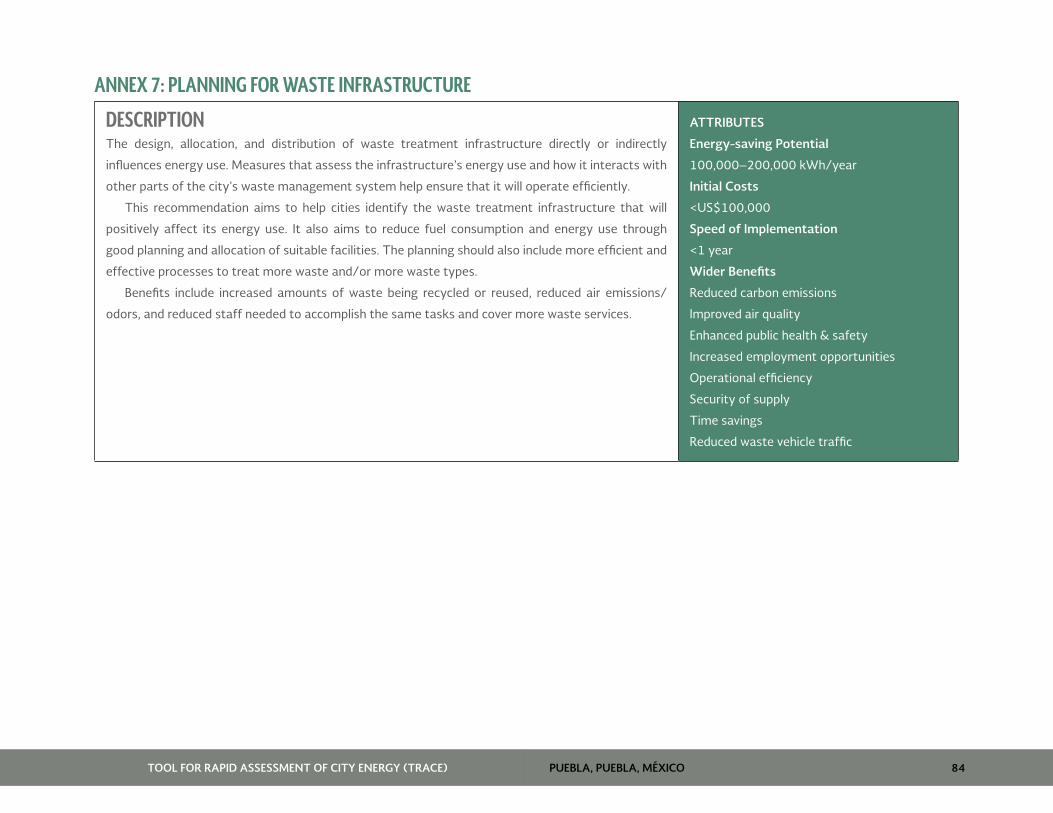
PUEBLA, PUEBLA, MÉXICO 84TOOL FOR RAPID ASSESSMENT OF CITY ENERGY (TRACE)
ANNEX 7: PLANNING FOR WASTE INFRASTRUCTURE
DESCRIPTION The design, allocation, and distribution of waste treatment infrastructure directly or indirectly
influences energy use. Measures that assess the infrastructure’s energy use and how it interacts with
other parts of the city’s waste management system help ensure that it will operate efficiently.
This recommendation aims to help cities identify the waste treatment infrastructure that will
positively affect its energy use. It also aims to reduce fuel consumption and energy use through
good planning and allocation of suitable facilities. The planning should also include more efficient and
effective processes to treat more waste and/or more waste types.
Benefits include increased amounts of waste being recycled or reused, reduced air emissions/
odors, and reduced staff needed to accomplish the same tasks and cover more waste services.
ATTRIBUTES
Energy-saving Potential
100,000–200,000 kWh/year
Initial Costs
<US$100,000
Speed of Implementation
<1 year
Wider Benefits
Reduced carbon emissions
Improved air quality
Enhanced public health & safety
Increased employment opportunities
Operational efficiency
Security of supply
Time savings
Reduced waste vehicle traffic
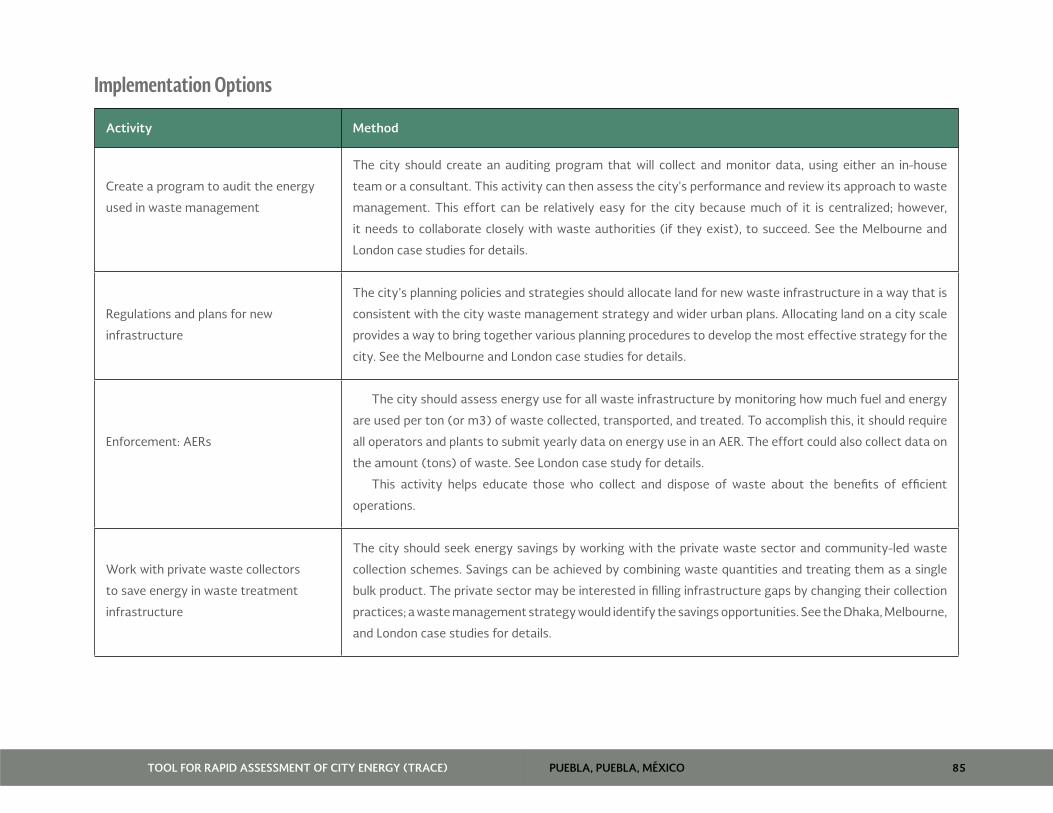
PUEBLA, PUEBLA, MÉXICO 85TOOL FOR RAPID ASSESSMENT OF CITY ENERGY (TRACE)
Implementation Options
Activity Method
Create a program to audit the energy
used in waste management
The city should create an auditing program that will collect and monitor data, using either an in-house
team or a consultant. This activity can then assess the city's performance and review its approach to waste
management. This effort can be relatively easy for the city because much of it is centralized; however,
it needs to collaborate closely with waste authorities (if they exist), to succeed. See the Melbourne and
London case studies for details.
Regulations and plans for new
infrastructure
The city’s planning policies and strategies should allocate land for new waste infrastructure in a way that is
consistent with the city waste management strategy and wider urban plans. Allocating land on a city scale
provides a way to bring together various planning procedures to develop the most effective strategy for the
city. See the Melbourne and London case studies for details.
Enforcement: AERs
The city should assess energy use for all waste infrastructure by monitoring how much fuel and energy
are used per ton (or m3) of waste collected, transported, and treated. To accomplish this, it should require
all operators and plants to submit yearly data on energy use in an AER. The effort could also collect data on
the amount (tons) of waste. See London case study for details.
This activity helps educate those who collect and dispose of waste about the benefits of efficient
operations.
Work with private waste collectors
to save energy in waste treatment
infrastructure
The city should seek energy savings by working with the private waste sector and community-led waste
collection schemes. Savings can be achieved by combining waste quantities and treating them as a single
bulk product. The private sector may be interested in filling infrastructure gaps by changing their collection
practices; a waste management strategy would identify the savings opportunities. See the Dhaka, Melbourne,
and London case studies for details.

PUEBLA, PUEBLA, MÉXICO 86TOOL FOR RAPID ASSESSMENT OF CITY ENERGY (TRACE)
Activity Method
Subsidies to encourage multi- modal
waste transfer systems
Authorities should offer land and/or tax incentives to encourage the transfer of waste by rail or barge, thus
reducing road traffic. National, regional or local funds should be accessed to help finance more efficient
waste treatment infrastructure. See the London and Italy case studies for details.
Monitoring See rationale for monitoring, above.
Some measures that relate to this recommendation are:
• Determine energy use per ton or cubic meter of waste treated city-wide and for each plant.
• Calculate the percent by which a plant reduces its energy use per ton of waste per year.
• Monitor fuel and energy use per ton or m3 of waste treated in the city, including energy used to collect, transport, and treat/monitor (separately, where possible).
• Require all plants to submit data on energy use in an AER (this is also an opportunity to determine waste tonnage data). Assess changes in energy use each year.
• Create a city waste management strategy (or assess and improve the current strategy), detailing the allocation of city-wide waste infrastructure.
• Reduce the energy used to pre-treat waste.
• Create a 5-year schedule to review the waste management strategy.
• Assess any involvement of third party waste operators collecting commercial or community waste in the municipality. Seek coordinated activities for mutual gains, for
example, increasing the volumes of waste to maximize EE in plants.

PUEBLA, PUEBLA, MÉXICO 87TOOL FOR RAPID ASSESSMENT OF CITY ENERGY (TRACE)
Case studies
The Metropolitan Waste and Resource Recovery Strategic Plan, Melbourne, Australia
Source: Metropolitan Waste Management Group. “The Metropolitan Waste and Resource Recovery Strategic Plan.” http://www.mwmg.vic.gov.au.
BVSDE. “Towards Zero Waste - A Material Efficiency Strategy for Victoria, Australia.” http://www.bvsde.paho.org/bvsacd/iswa2005/zero.pdf.
The Metropolitan Waste Management Group (MWMG), a state statutory body, produced the metropolitan infrastructure schedule as part of the wider
Metropolitan Waste and Resource Recovery Strategic Plan. Its aim was to examine and assess Melbourne’s waste infrastructure in order to identify
improvements that will allow MWMG to recover more waste in the future.
In creating the schedule, MWMG conducted studies of infrastructure needs, existing infrastructure, future recovery opportunities, and issues related
to upgrades or new infrastructure. Models were created to assess environmental, social, and economic impacts. Also, a private engineering consultant
was hired to analyze the options and identify opportunities to recover materials sent to the landfill, including municipal waste clustering opportunities.
The studies analyzed economic costs/benefits, life-cycle assessments (GHG emissions, energy and water consumption, air emissions, and waste to
landfill) and assessed transport options and impacts.
It was found that existing composting facilities, transfer stations, and Material Recovery Facilities were the main areas that could be improved. For
example, the options with the best results for ‘energy from fossil fuel use’ were two types of three-bin systems, one which included separate bins for
recyclables, garden waste and food (for anaerobic digestion), and remaining items (for landfill) or a system with separate bins for recyclables, garden
waste (for aerobic composting) and residuals (containing food, for thermal treatment). These options will be financed from household collection fees,
from US$137 to –US$158 per household each year.
The schedule (and the broad strategic plan) was supported by US$9 million in state funds. Also, a landfill levy of up to US$13.50 a ton helps fund the
waste infrastructure, innovation, development, and other improvements in efficiencies for the city’s waste management system.
London Municipal Waste Strategy, London, U.K.
Source: “The Mayor’s Draft Municipal Waste Management Strategy.” http://legacy.london.gov.uk/.
“Research and Information Plans 2006/07.” www.londoncouncils.gov.uk/London%20Councils/ResearchandINformationPlans0607FINA.pdf (must be
downloaded as a PDF file).
Cory Environmental. http://www.coryenvironmental.co.uk/page/RRRcasestudy1.htm

PUEBLA, PUEBLA, MÉXICO 88TOOL FOR RAPID ASSESSMENT OF CITY ENERGY (TRACE)
Clinton Climate Change Initiative, C40 Cities. http://www.c40cities.org/londonwasteworkshop/downloads/07%20-%20Shanks%20-%20ELWA%20
Case%20Study.pdf
Freight On Rail. http://www.freightonrail.org.uk/CaseStudyWasteByRail.htm
WasteDataFlow. http://www.wastedataflow.org/home.aspx
The London Municipal Waste Strategy aims to achieve greater regional self-sufficiency by developing new infrastructure, keeping the value of London’s
waste in the city, and focusing on new low-carbon technologies in waste management (for example, moving away from bulking and transfer facilities to
resource recovery parks). The Greater London Authority (GLA) is developing a London-wide scheme in partnership with waste authorities to collect data
on current, planned, and potential waste sites at the local and regional level to help the London Waste and Recycling Board determine the type, number,
and location of the facilities needed over a particular period. Financial assistance from the board (US$114 million) was provided to develop new facilities
for collecting, treating, and disposing of waste, supported by external funds from partners (joint ventures, private investors, and EU matching funds).
The mayor also works with waste authorities to promote more sustainable ways to transport waste, by maximizing the potential use of rail and water
transport.
The GLA combines its efforts with national organizations, local authorities, and private waste operators to achieve results. For example,
• GLA works with the national Department for Environment, Food and Rural Affairs (DEFRA), the Environmental Agency, and London councils on the annual collection
and dissemination of London waste statistics. WasteDataFlow is a web-based reporting system used by all UK local authorities, which provides information that can
be used nationally, regionally and by boroughs to inform best practices and strategy.
• Cory Environmental (CE) has a 30-year waste management contract from four London boroughs to handle household and business waste. To support and safeguard
its waste operations, CE is building the Riverside Resource Recovery Facility (RRR), claimed to be one of the UK’s most efficient energy-from-waste plants with an
annual throughput of 670,000 tons. The new operation will help remove more than 100,000 heavy vehicle trips from the roads each year. The project is financed by
a term facility of up to US$728 million from private banks, with US$124 million of equity finance provided by CE.
• The East London Waste Authority (EWLA) uses a private company to transport its solid household waste. The contract is through a private finance initiative (PFI)
for integrated waste management agreement, which provides US$204 million to construct the waste-by-rail transfer service from an upgraded railhead as well as
innovative technologies to improve ELWA’s waste treatment facilities.
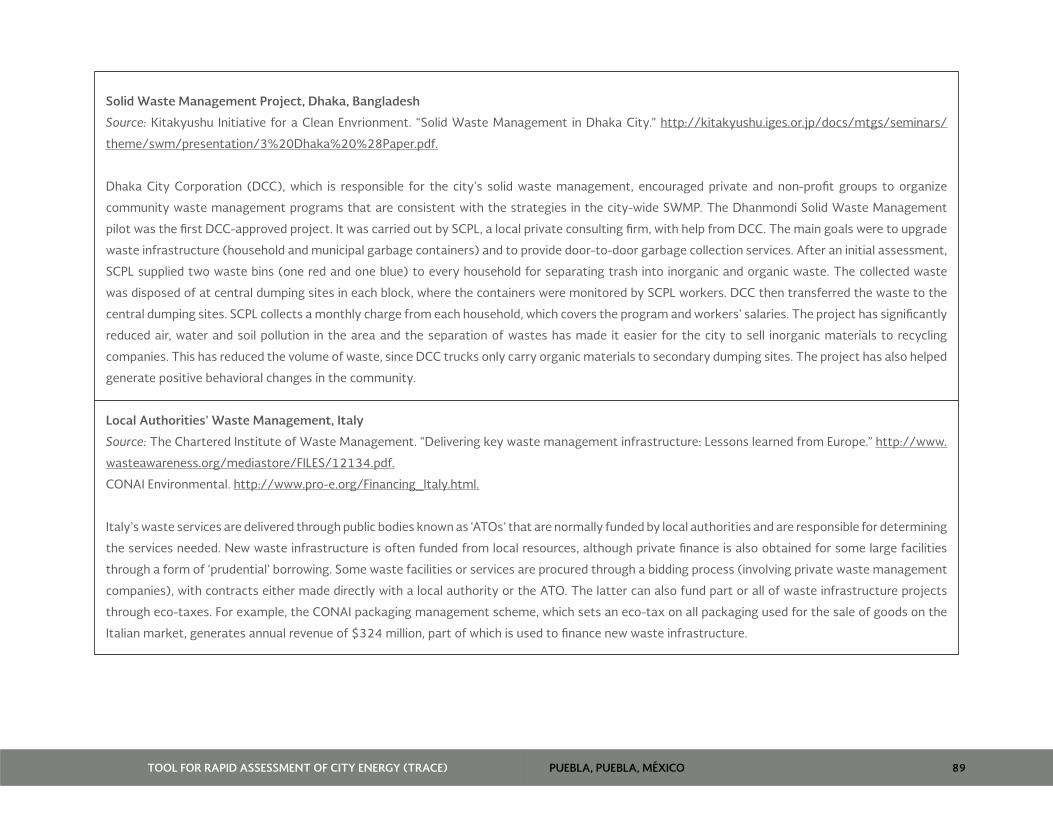
PUEBLA, PUEBLA, MÉXICO 89TOOL FOR RAPID ASSESSMENT OF CITY ENERGY (TRACE)
Solid Waste Management Project, Dhaka, Bangladesh
Source: Kitakyushu Initiative for a Clean Envrionment. “Solid Waste Management in Dhaka City.” http://kitakyushu.iges.or.jp/docs/mtgs/seminars/
theme/swm/presentation/3%20Dhaka%20%28Paper.pdf.
Dhaka City Corporation (DCC), which is responsible for the city’s solid waste management, encouraged private and non-profit groups to organize
community waste management programs that are consistent with the strategies in the city-wide SWMP. The Dhanmondi Solid Waste Management
pilot was the first DCC-approved project. It was carried out by SCPL, a local private consulting firm, with help from DCC. The main goals were to upgrade
waste infrastructure (household and municipal garbage containers) and to provide door-to-door garbage collection services. After an initial assessment,
SCPL supplied two waste bins (one red and one blue) to every household for separating trash into inorganic and organic waste. The collected waste
was disposed of at central dumping sites in each block, where the containers were monitored by SCPL workers. DCC then transferred the waste to the
central dumping sites. SCPL collects a monthly charge from each household, which covers the program and workers’ salaries. The project has significantly
reduced air, water and soil pollution in the area and the separation of wastes has made it easier for the city to sell inorganic materials to recycling
companies. This has reduced the volume of waste, since DCC trucks only carry organic materials to secondary dumping sites. The project has also helped
generate positive behavioral changes in the community.
Local Authorities’ Waste Management, Italy
Source: The Chartered Institute of Waste Management. “Delivering key waste management infrastructure: Lessons learned from Europe.” http://www.
wasteawareness.org/mediastore/FILES/12134.pdf.
CONAI Environmental. http://www.pro-e.org/Financing_Italy.html.
Italy’s waste services are delivered through public bodies known as ‘ATOs’ that are normally funded by local authorities and are responsible for determining
the services needed. New waste infrastructure is often funded from local resources, although private finance is also obtained for some large facilities
through a form of ‘prudential’ borrowing. Some waste facilities or services are procured through a bidding process (involving private waste management
companies), with contracts either made directly with a local authority or the ATO. The latter can also fund part or all of waste infrastructure projects
through eco-taxes. For example, the CONAI packaging management scheme, which sets an eco-tax on all packaging used for the sale of goods on the
Italian market, generates annual revenue of $324 million, part of which is used to finance new waste infrastructure.

PUEBLA, PUEBLA, MÉXICO 90TOOL FOR RAPID ASSESSMENT OF CITY ENERGY (TRACE)
ANNEX 8: AWARENESS-RAISING CAMPAIGNS
DESCRIPTION Public education and training campaigns increase awareness/understanding about the benefits of EE,
helping to change behavior, and contributing to overall energy savings. These can involve:
• Advertising campaigns,
• Public events,
• Articles in the local press,
• User-friendly websites providing information about EE,
• Training programs in schools, community centers and businesses,
• EE advocate programs.
Benefits include residents’ learning to be more energy efficient. Their changed behavior reduces
a city’s energy consumption. Wider benefits include reducing pressure on energy infrastructure,
lowering carbon emissions, and improving air quality.
ATTRIBUTES
Energy-saving Potential
100,000–200,000 kWh/year
Initial Costs
US$100,000–US$1 million
Speed of Implementation
<1 year
Wider Benefits
Reduced carbon emissions
Improved air quality
Enhanced public health & safety
Financial savings
Security of supply
Implementation Options
Activity Method
Targeted training programs
Working with staff or consultants experienced in such campaigns, the city develops training programs that can
be introduced in schools and offices, particularly targeted at big energy users, such as offices. The programs
can also partner with groups such as utility companies, businesses, and NGOs.
Public education campaigns
Working with advertising/marketing companies experienced in public education campaigns, the city develops
a strategy to provide information on EE to all residents through posters, billboards, and leaflets, public media
announcements and advertisements. The city can create a partnership with a business or utility company,
which could help finance the effort.
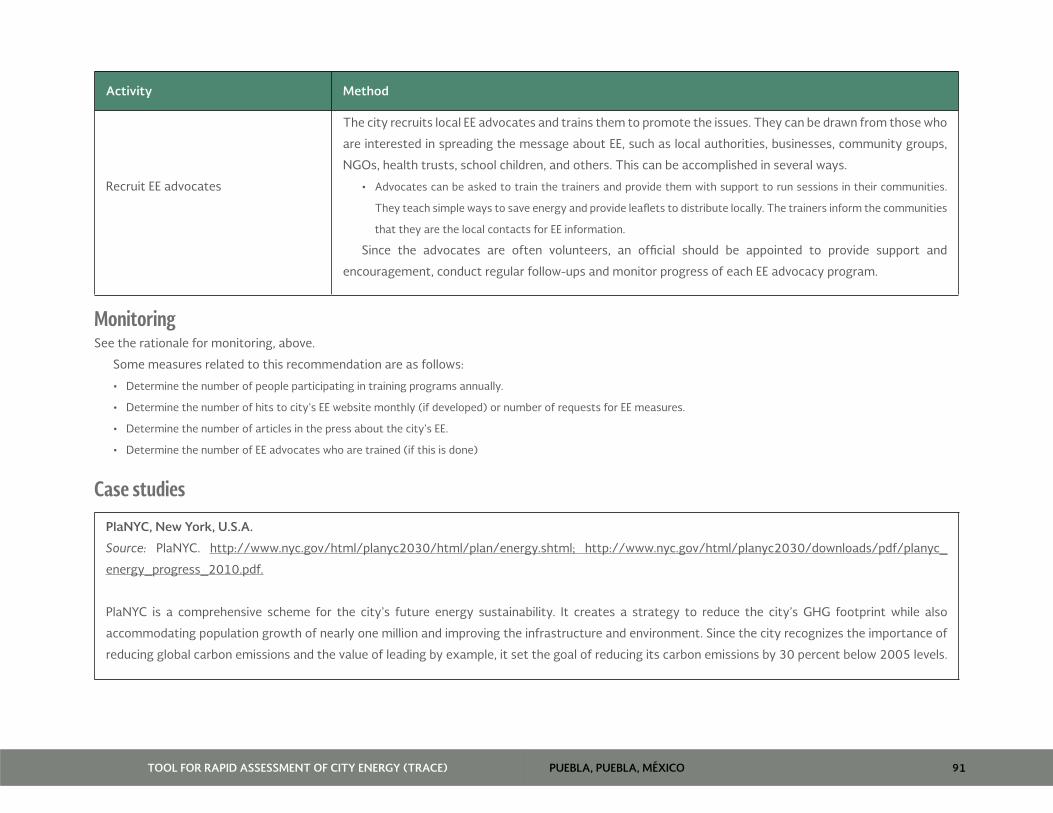
PUEBLA, PUEBLA, MÉXICO 91TOOL FOR RAPID ASSESSMENT OF CITY ENERGY (TRACE)
Activity Method
Recruit EE advocates
The city recruits local EE advocates and trains them to promote the issues. They can be drawn from those who
are interested in spreading the message about EE, such as local authorities, businesses, community groups,
NGOs, health trusts, school children, and others. This can be accomplished in several ways.
• Advocates can be asked to train the trainers and provide them with support to run sessions in their communities.
They teach simple ways to save energy and provide leaflets to distribute locally. The trainers inform the communities
that they are the local contacts for EE information.
Since the advocates are often volunteers, an official should be appointed to provide support and
encouragement, conduct regular follow-ups and monitor progress of each EE advocacy program.
Monitoring See the rationale for monitoring, above.
Some measures related to this recommendation are as follows:
• Determine the number of people participating in training programs annually.
• Determine the number of hits to city’s EE website monthly (if developed) or number of requests for EE measures.
• Determine the number of articles in the press about the city’s EE.
• Determine the number of EE advocates who are trained (if this is done)
Case studies
PlaNYC, New York, U.S.A.
Source: PlaNYC. http://www.nyc.gov/html/planyc2030/html/plan/energy.shtml; http://www.nyc.gov/html/planyc2030/downloads/pdf/planyc_
energy_progress_2010.pdf.
PlaNYC is a comprehensive scheme for the city’s future energy sustainability. It creates a strategy to reduce the city’s GHG footprint while also
accommodating population growth of nearly one million and improving the infrastructure and environment. Since the city recognizes the importance of
reducing global carbon emissions and the value of leading by example, it set the goal of reducing its carbon emissions by 30 percent below 2005 levels.

PUEBLA, PUEBLA, MÉXICO 92TOOL FOR RAPID ASSESSMENT OF CITY ENERGY (TRACE)
The city has an initiative to carry out extensive education, training, and quality control programs to promote EE. By 2010, it launched an energy
awareness campaign, and set up training, certification, and monitoring programs. The plan proposes that the measures be delivered through various
partnerships until an EE authority is established.
Energy Efficiency Office, Toronto, Canada
Source: City of Toronto. http://www.toronto.ca/energy/saving_tips.htm.
Toronto’s EE Office communicates energy-saving tips to households, businesses, and developers on its website. Also, it runs a program, ‘The Employee
Energy Efficiency at Work (E3@Work)’, that is designed to save money and promote EE by managing office equipment power loads. The program began
in 2002 and is being promoted to businesses and offices across the city. The goal is to reduce energy consumption and building operating costs, improve
energy security and reliability, and preserve the environment.
Low Carbon Singapore, Singapore
Source: Low Carbon Singapore. http://www.lowcarbonsg.com
‘Low Carbon Singapore’ is an online community dedicated to help Singapore reduce its carbon emissions and move towards the goal of a low carbon
economy. The project aims to educate individuals, communities, businesses and organizations on issues related to climate change, global warming, and
clean energy and provide information, news, tips, and resources on ways to reduce carbon, such as adopting clean energy and energy efficient behavior
and technology.
The Low Carbon Singapore information is published by Green Future Solutions, a Singapore-based business that promotes environmental awareness/
action through a network of green websites, events, presentations, publications, and consultants.
Carbon Management Energy Efficiency (CMEE) Programme, Walsall Council, U.K.
Source: Walsall Council. http://www.walsall.gov.uk/index/energy_awareness_staff_presentations.htm.
Walsall Council has been conducting energy awareness training with the Carbon Trust, under its Carbon Management Energy Efficiency (CMEE) program.
Its efforts include:
• Surveying the council’s least energy efficient buildings;

PUEBLA, PUEBLA, MÉXICO 93TOOL FOR RAPID ASSESSMENT OF CITY ENERGY (TRACE)
• Evaluating the feasibility of combined heat and power (CHP) generation at the council’s recreation centers;
• Raising staff awareness of energy issues through presentations to senior city managers, building and school managers, and various council general staff: 226 staff
were trained in this round using presentations developed by the Carbon Trust and adapted, with some environmental advocates, to reflect Walsall Council’s needs.
The aim of the CMEE program is to identify and achieve significant carbon savings throughout the council and thus, financial savings. By reducing its
energy use, the council will also reduce the number of carbon credits it must buy under the Carbon Reduction Commitment, which was introduced in
2010.
Siemens Energy Efficiency Academy, Brisbane, Australia
Source: Siemens. http://aunz.siemens.com/EVENTS/ENERGYEACADEMY/Pages/IN_EnergyEfficiencyAcademy.aspx; http://www.siemens.com/
sustainability/report/09/pool/pdf/siemens_sr_2009.pdf.
The Siemens Energy Efficiency Academy brings together leading international and local experts to share their insights on government policies, emerging
technologies, market forces, and best practices.
Besides adopting and showcasing its own energy efficient practices, it runs regular training programs for businesses on topics such as:
• Incentive schemes: Market mechanisms, grants and funding
• Award-winning business efforts to achieve EE
• EE policy in Australian government (at various levels)
• The next generation in EE technology
• Best practices for variable speed drives and power quality
• Monitoring energy use in industrial and commercial facilities

PUEBLA, PUEBLA, MÉXICO 94TOOL FOR RAPID ASSESSMENT OF CITY ENERGY (TRACE)
Energy Awareness Week, Meath, Ireland
Source: ManagEnergy. “EU LOCAL ENERGY ACTION: Good practices 2005.” http://www.managenergy.net/download/gp2005.pdf.
In 2004, the Meath Energy Management Agency’s (MEMA) extended its Energy Awareness Week to everyone who lived or worked in the county of
Meath, Ireland, using media campaigns to raise consumers’ understanding energy issues. This included visits to schools, information displays, widespread
media coverage, competitions, a ‘Car-free Day’ and an offer of free CFL light bulbs, which encouraged participation at all levels. The campaign dramatically
increased requests for information from the energy agency. The competitions and promotions also improved local knowledge of EE and encouraged
people to choose sustainable energy and transport options.
Energy Awareness Week activities were coordinated and carried out by MEMA with support from the Environment Department of Meath County
Council. The campaign cost US$4,470, which covered printing and copying promotional materials, prizes, and providing bright jackets for walking bus
participants. Local companies and Sustainable Energy Ireland (SEI) contributed sponsors and prizes.
Tools & Guidance
“EU LOCAL ENERGY ACTION: Good practices 2005.” http://www.managenergy.net/download/gp2005.pdf
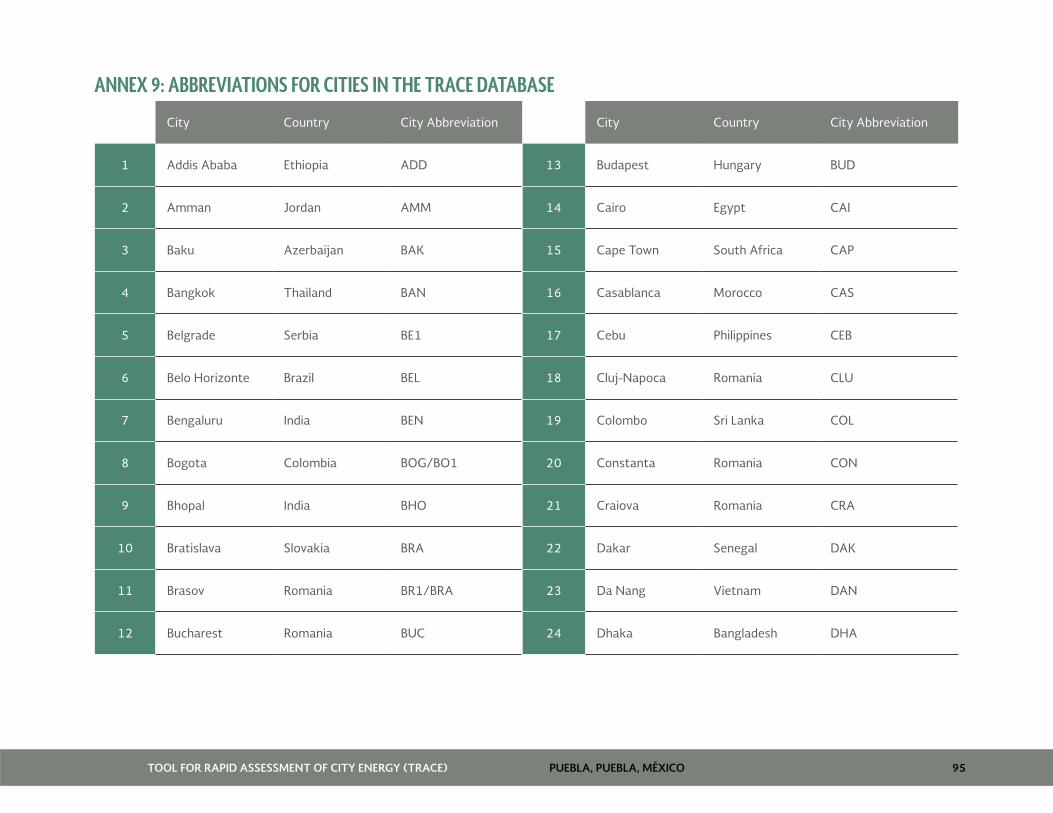
PUEBLA, PUEBLA, MÉXICO 95TOOL FOR RAPID ASSESSMENT OF CITY ENERGY (TRACE)
ANNEX 9: ABBREVIATIONS FOR CITIES IN THE TRACE DATABASE
City Country City Abbreviation City Country City Abbreviation
1 Addis Ababa Ethiopia ADD 13 Budapest Hungary BUD
2 Amman Jordan AMM 14 Cairo Egypt CAI
3 Baku Azerbaijan BAK 15 Cape Town South Africa CAP
4 Bangkok Thailand BAN 16 Casablanca Morocco CAS
5 Belgrade Serbia BE1 17 Cebu Philippines CEB
6 Belo Horizonte Brazil BEL 18 Cluj-Napoca Romania CLU
7 Bengaluru India BEN 19 Colombo Sri Lanka COL
8 Bogota Colombia BOG/BO1 20 Constanta Romania CON
9 Bhopal India BHO 21 Craiova Romania CRA
10 Bratislava Slovakia BRA 22 Dakar Senegal DAK
11 Brasov Romania BR1/BRA 23 Da Nang Vietnam DAN
12 Bucharest Romania BUC 24 Dhaka Bangladesh DHA
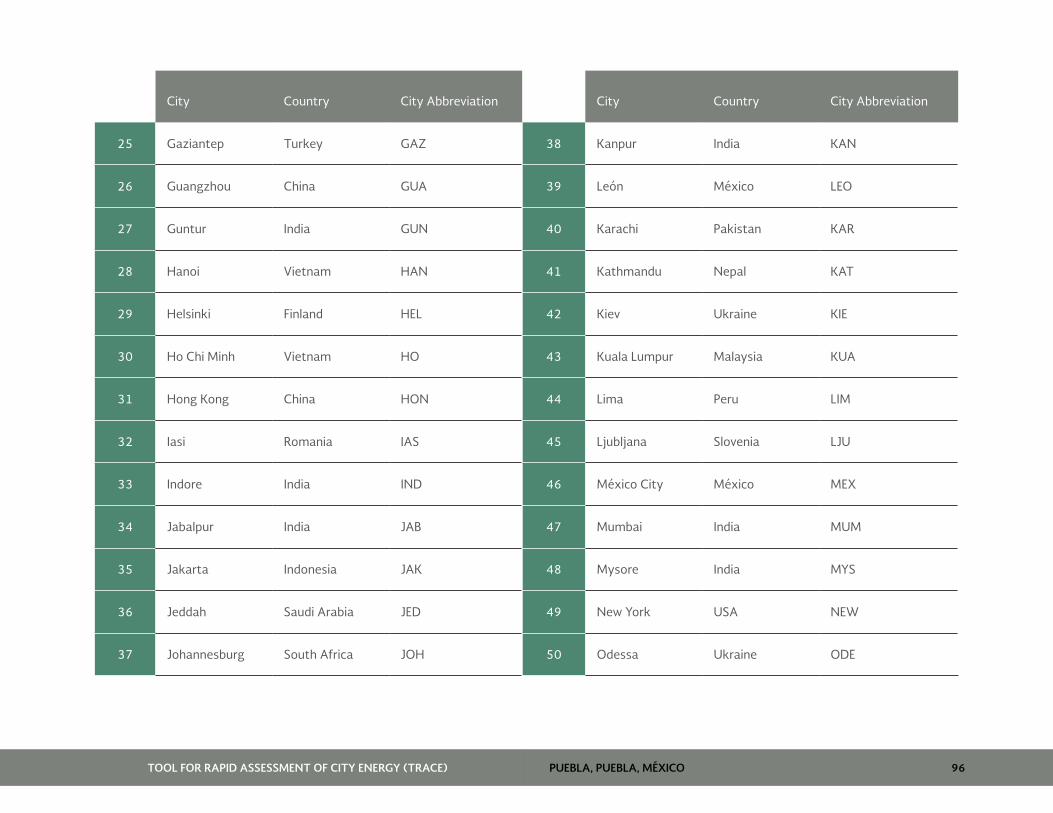
PUEBLA, PUEBLA, MÉXICO 96TOOL FOR RAPID ASSESSMENT OF CITY ENERGY (TRACE)
City Country City Abbreviation City Country City Abbreviation
25 Gaziantep Turkey GAZ 38 Kanpur India KAN
26 Guangzhou China GUA 39 León México LEO
27 Guntur India GUN 40 Karachi Pakistan KAR
28 Hanoi Vietnam HAN 41 Kathmandu Nepal KAT
29 Helsinki Finland HEL 42 Kiev Ukraine KIE
30 Ho Chi Minh Vietnam HO 43 Kuala Lumpur Malaysia KUA
31 Hong Kong China HON 44 Lima Peru LIM
32 Iasi Romania IAS 45 Ljubljana Slovenia LJU
33 Indore India IND 46 México City México MEX
34 Jabalpur India JAB 47 Mumbai India MUM
35 Jakarta Indonesia JAK 48 Mysore India MYS
36 Jeddah Saudi Arabia JED 49 New York USA NEW
37 Johannesburg South Africa JOH 50 Odessa Ukraine ODE
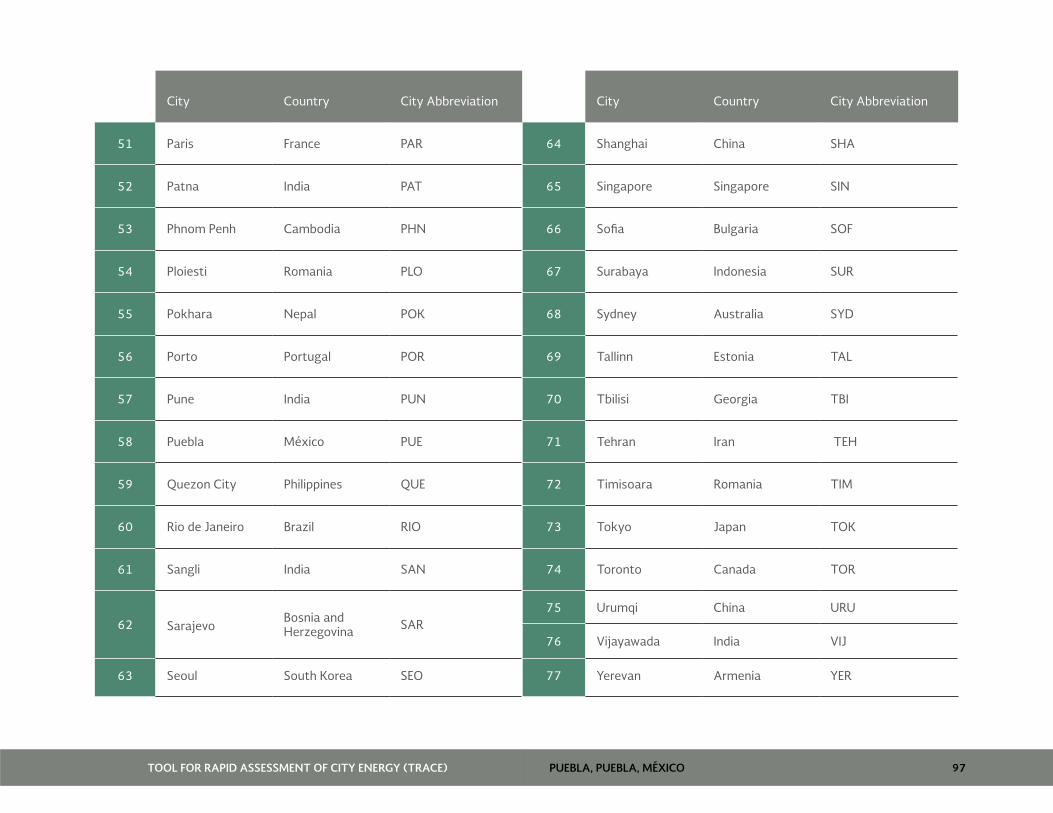
PUEBLA, PUEBLA, MÉXICO 97TOOL FOR RAPID ASSESSMENT OF CITY ENERGY (TRACE)
City Country City Abbreviation City Country City Abbreviation
51 Paris France PAR 64 Shanghai China SHA
52 Patna India PAT 65 Singapore Singapore SIN
53 Phnom Penh Cambodia PHN 66 Sofia Bulgaria SOF
54 Ploiesti Romania PLO 67 Surabaya Indonesia SUR
55 Pokhara Nepal POK 68 Sydney Australia SYD
56 Porto Portugal POR 69 Tallinn Estonia TAL
57 Pune India PUN 70 Tbilisi Georgia TBI
58 Puebla México PUE 71 Tehran Iran TEH
59 Quezon City Philippines QUE 72 Timisoara Romania TIM
60 Rio de Janeiro Brazil RIO 73 Tokyo Japan TOK
61 Sangli India SAN 74 Toronto Canada TOR
62 Sarajevo Bosnia and Herzegovina SAR
75 Urumqi China URU
76 Vijayawada India VIJ
63 Seoul South Korea SEO 77 Yerevan Armenia YER

PUEBLA, PUEBLA, MÉXICO 98TOOL FOR RAPID ASSESSMENT OF CITY ENERGY (TRACE)


BOG
OTÁ
D.C
.,C
OLO
MBI
ATool for Rapid Assessment of City Energy

Tool for Rapid Assessment of City Energy BOGOTÁ D.C.,
COLOMBIA

BOGOTÁ D.C., COLOMBIATOOL FOR RAPID ASSESSMENT OF CITY ENERGY
PREFACE – SECRETARY OF ENVIRONMENT, BOGOTÁ D.C.
Over the last years the infrastructure and population of Bogotá D.C.,
which are important aspects in the city’s attempt to live in harmony with
the environment, have developed. This materialized in axis 2 of “Bogotá
Humana 2012-2014”, the city’s development plan, which recognizes
Bogota as: “A city that faces climate change and is organized around
water”, but which has worked in an inter-sectorial way with national,
regional, and international agencies, to adapt and become more resilient
to environmental challenges.
The Secretary of Environment of Bogotá, has developed an action plan
to control, preserve and protect the natural resources of the District; to
improve citizens’ quality of life; and mitigate and adapt to local climate
change. This action plan includes legislative actions, and improved
management and inter-institutional coordination.
This dialogue about energy efficiency potential in different cities of
Latin America led to the opportunity to use the World Bank‘s TRACE Tool.
The tool describes those strategies that would allow Bogotá to quickly
and easily assess its energy efficiencies, identify those sectors with the
greatest potential for improvement, and establish the most appropriate
interventions in each sector.
The TRACE database with recommendations to city governments is an
important benchmarking tool that Bogotá can use to help make strategic
decisions. It allows the city to evaluate and reflect on the roles that
different energy sectors have, based on their local characteristics
Susana Muhammad
Secretary of Environment
Bogotá D.C.

BOGOTÁ D.C., COLOMBIATOOL FOR RAPID ASSESSMENT OF CITY ENERGY

BOGOTÁ D.C., COLOMBIATOOL FOR RAPID ASSESSMENT OF CITY ENERGY
PREFACE – WORLD BANK GROUP
City governments are in a unique position to lead the transition to more
efficient energy use and in the process improve their urban services, reduce
budgetary expenditures, and curb energy use and emissions.
Municipalities are typically large and visible energy consumers that
through their actions and good example can encourage energy efficiency
and help promote the market for energy efficient products and services.
While energy efficiency priorities will be different depending on factors
such as geography, climate, and the level of economic development, Latin
American cities appear to have significant potential to reduce energy
consumption, for example, in public lighting, municipal buildings, and the
provision of water and sanitation.
Although programs to support energy efficiency exist at the municipal
level, a fundamental question is why these measures are not undertaken
on a larger scale given the availability of proven technologies and when
financing is not a constraint. Among the common barriers to urban
energy efficiency investments are regulatory and legal constraints, lack
of knowledge of cost-effective interventions, and limited institutional
capacity to design and implement projects. This study is based on a rapid
assessment of municipal energy use and identifies where opportunities
for energy savings exist. With this information, and through the support
of other national programs, municipal authorities in cities like Bogota D.C.
will be in a better position to plan and implement cost-effective energy
efficiency measures.
The present study was part of a pilot program implemented by the
World Bank, in the cities of Bogotá D.C. (Colombia) and Leon and Puebla
(Mexico), in order to identify and implement energy efficiency measures.
This study evaluates a range of options to reduce energy use in municipal
services, including street lighting, public buildings, water supply and
sanitation, public transport, solid waste management, and within energy
utilities (electricity and gas).
This report focuses on energy use in the City of Bogotá D.C.. The hope
is that the findings from this study will provide useful lessons to other cities
that are interested in improving the efficiency of energy use. Both the
methodology and specific energy efficiency measures identified here are
likely to be illustrative of the potential in other cities in Colombia and Latin
America. The World Bank intends to draw on the findings from Bogotá D.C.
to provide global lessons for urban energy efficiency.
MALCOLM COSGROVE-DAVIES
Practice Manager
Energy and Extractives Global Practice
The World Bank Group

BOGOTÁ D.C., COLOMBIATOOL FOR RAPID ASSESSMENT OF CITY ENERGY
BOGOTÁ D.C., COLOMBIATOOL FOR RAPID ASSESSMENT OF CITY ENERGY
TABLE OF CONTENTS
Executive Summary ......................................................................... 8
Methodology ...................................................................................13
Background ......................................................................................16
Bogotá Sector Diagnostics ..........................................................21
Power Sector .............................................................................22
Urban Transport .......................................................................25
Streetlights ................................................................................37
Water Sector ..............................................................................40
Solid Waste ................................................................................48
Municipal Buildings ..................................................................52
Energy Efficiency Recommendations........................................55
Streetlights .................................................................................59
Water Leak Detection Program ............................................60
Awareness Raising Campaign ..............................................62
Urban Transport ........................................................................64
Annexes ............................................................................................65
ESMAP COPYRIGHT DISCLAIMER
Energy Sector Management Assistance Program (ESMAP) reports are
published to communicate the results of ESMAP’s work to the development
community with the lease possible delay. Some sources cited in this paper
may be informal documents that are not readily available.
The findings, interpretations, and conclusions expressed in this report
are entirely those of the author(s) and should not be attributed in any
manner to the World Bank, or its affiliated organizations, or to members
of its board of executive directors for the countries they represent, or to
ESMAP. The World Bank and ESMAP do not guarantee the accuracy of the
data included in this publication and accepts no responsibility
whatsoever for any consequence of their use. The boundaries, colors,
denominations, and other information shown on any map in this volume
do not imply on the part of the World Bank Group any judgment on the
legal status of any territory or the endorsement of acceptance of such
boundaries.
TRACE (Tool for Rapid Assessment of City Energy) was developed by
the ESMAP (Energy Sector Management Assistance Program), a World
Bank unit, and is available for download and free use at: http://esmap.
org/TRACE
BOGOTÁ D.C., COLOMBIA 8TOOL FOR RAPID ASSESSMENT OF CITY ENERGY
EXECUTIVE SUMMARY
This report, supported by the Energy Sector Management Assistance
Program (ESMAP), applies the Tool for the Rapid Assessment of City Energy
(TRACE) to examine urban energy use in Bogotá, Colombia. This study is
one of three requested—for Bogotá and Puebla and León, in México—and
conducted in 2013 by the World Bank’s Latin America and the Caribbean
Energy Unit to begin a dialogue on energy efficiency (EE) potential in Latin
America and the Caribbean cities. The TRACE assessments in Puebla and
León helped the Mexican Secretary of Energy (SENER) develop an urban
EE strategy.
TRACE is a simple, practical tool for making rapid assessments of
municipal energy use. It helps prioritize sectors that have the potential to
save significant amounts of energy and identifies appropriate EE measures
in six sectors—transport, municipal buildings, wastewater, streetlights,
solid waste, and power/heat. Globally, the six are often managed by the
cities, which have substantial influence over public utility services. In this
context, TRACE—which is a low-cost, user-friendly, and practical tool that
can be applied in any socioeconomic setting—offers local authorities the
information they need about energy performance and identifies areas
where more analysis would be useful. The tool includes about 65 EE efforts,
based on case studies and global best practices. It is targeted mainly at
local authorities and public utility companies but can also be used by state
or federal authorities to increase their knowledge about how to make
cities more energy efficient.
Because the TRACE is rapid, the analysis is somewhat limited. Its
recommendations should thus be seen as an indication of what can be done
to improve a city’s energy performance and reduce energy expenditures
in some areas; however, it does not assess the residential, industrial, or
commercial sectors. In many cities worldwide, the six TRACE areas are
under municipal jurisdiction, but in Latin America and the Caribbean, local
authorities often have only limited influence over sectors such as transport,
electricity, water, and sanitation.
TRACE produced several recommendations through an analysis to
help the city improve its EE in urban services. The study, which was made
along with local authorities, drawing upon analyses by local consultants,
looked into six sectors summarized below. However, it focuses on public
transport, streetlights, and potable water, which are considered the
ones with the highest potential to save energy and where the city has a
significant degree of control.
Overview of Energy Use in Bogotá
Two-thirds of the primary energy used in the TRACE areas is consumed
by public and private transport, and almost one-third is used by the power
sector. The remaining amount is consumed by streetlights (one percent),
the water sector, and municipal buildings. Since Bogotá did not provide
information on the fuel consumed by waste collection/management, the
analysis of public utility services under the city did not include this sector.
Regarding electricity consumption in the six sectors evaluated by the
TRACE tool, the following was determined for Bogotá: (1) as elsewhere in
the world, a large amount of energy is needed to fuel private vehicles and
buses; (2) assuming the data on water energy consumption is accurate,
the relatively low level of use can be explained by the fact that water
delivery is largely gravitational, from elevated reservoirs; also, that only
25 percent of the wastewater receives primary treatment; (3) over a third
of the electricity is consumed by the residential sector, 32 percent by
industry, and 26 percent by businesses; and (4) streetlights and municipal
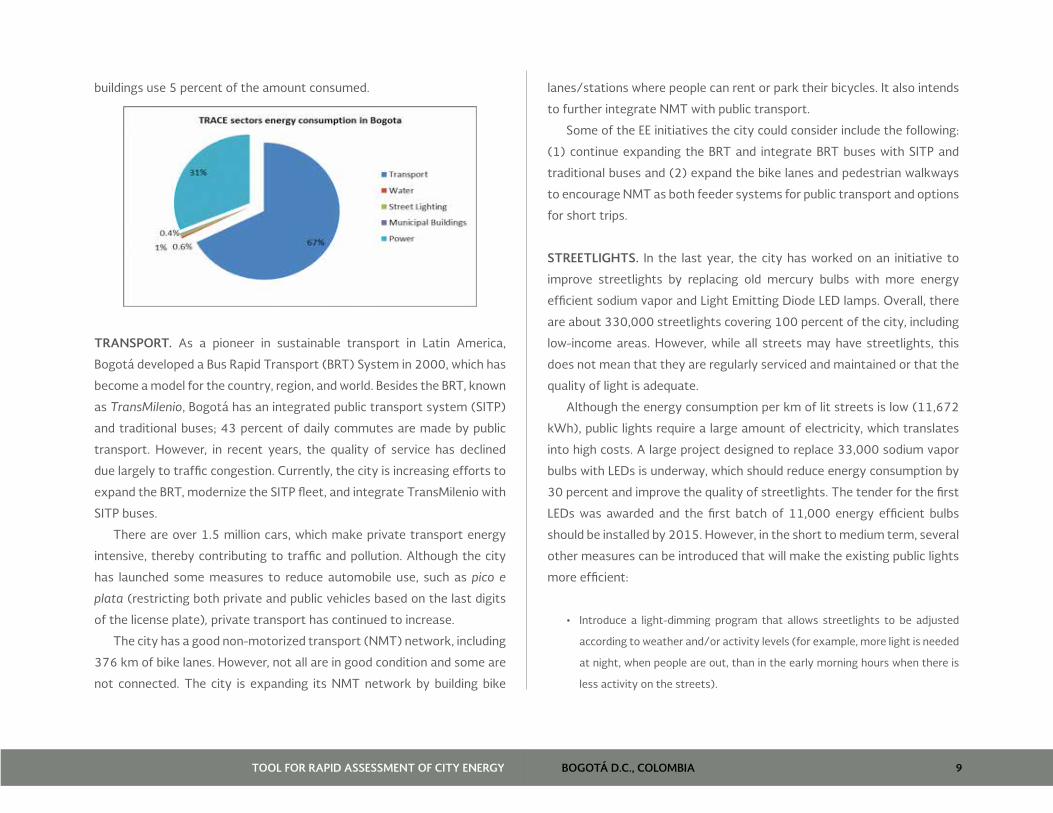
BOGOTÁ D.C., COLOMBIA 9TOOL FOR RAPID ASSESSMENT OF CITY ENERGY
buildings use 5 percent of the amount consumed.
TRANSPORT. As a pioneer in sustainable transport in Latin America,
Bogotá developed a Bus Rapid Transport (BRT) System in 2000, which has
become a model for the country, region, and world. Besides the BRT, known
as TransMilenio, Bogotá has an integrated public transport system (SITP)
and traditional buses; 43 percent of daily commutes are made by public
transport. However, in recent years, the quality of service has declined
due largely to traffic congestion. Currently, the city is increasing efforts to
expand the BRT, modernize the SITP fleet, and integrate TransMilenio with
SITP buses.
There are over 1.5 million cars, which make private transport energy
intensive, thereby contributing to traffic and pollution. Although the city
has launched some measures to reduce automobile use, such as pico e
plata (restricting both private and public vehicles based on the last digits
of the license plate), private transport has continued to increase.
The city has a good non-motorized transport (NMT) network, including
376 km of bike lanes. However, not all are in good condition and some are
not connected. The city is expanding its NMT network by building bike
lanes/stations where people can rent or park their bicycles. It also intends
to further integrate NMT with public transport.
Some of the EE initiatives the city could consider include the following:
(1) continue expanding the BRT and integrate BRT buses with SITP and
traditional buses and (2) expand the bike lanes and pedestrian walkways
to encourage NMT as both feeder systems for public transport and options
for short trips.
STREETLIGHTS. In the last year, the city has worked on an initiative to
improve streetlights by replacing old mercury bulbs with more energy
efficient sodium vapor and Light Emitting Diode LED lamps. Overall, there
are about 330,000 streetlights covering 100 percent of the city, including
low-income areas. However, while all streets may have streetlights, this
does not mean that they are regularly serviced and maintained or that the
quality of light is adequate.
Although the energy consumption per km of lit streets is low (11,672
kWh), public lights require a large amount of electricity, which translates
into high costs. A large project designed to replace 33,000 sodium vapor
bulbs with LEDs is underway, which should reduce energy consumption by
30 percent and improve the quality of streetlights. The tender for the first
LEDs was awarded and the first batch of 11,000 energy efficient bulbs
should be installed by 2015. However, in the short to medium term, several
other measures can be introduced that will make the existing public lights
more efficient:
• Introduce a light-dimming program that allows streetlights to be adjusted
according to weather and/or activity levels (for example, more light is needed
at night, when people are out, than in the early morning hours when there is
less activity on the streets).
BOGOTÁ D.C., COLOMBIA 10TOOL FOR RAPID ASSESSMENT OF CITY ENERGY
• Audit all streetlights to determine their type and condition.
When replacing the old lights (upgrades), the city needs to produce
a procurement guide and choose an efficient technology that can deliver
the same lighting levels and use less energy. The cost of LEDs has fallen to
the point where it is the best choice, but the financial savings will depend
on the age and efficiency of existing lights. It should be noted that the
upgrades will also reduce carbon emissions and operating costs.
WATER SECTOR. Water and sanitation are managed by a public company
under the local government. The water comes through a gravitational
system from the rivers in the mountains, thus requiring little energy for
pumping and treatment activities. With 100 percent water coverage,
Bogotá has a total of 1.8 million water connections, of which 1.6 million
are in the residential sector. More than 477 million m3 are produced each
year, of which only 273 million m3 are actually sold to customers; the rest
is lost or not billed. On average, the city uses 93.98 L per capita a day. In
the future, the city and water utility should join efforts to reduce some of
the 35 percent losses in the system, which occur mainly due to old, poorly
insulated pipes. The high-income communities subsidize the water tariffs
for low-income groups.
Bogotá’s water sector is one of the most efficient in the TRACE database,
with 0.23 kWh/m3, consuming relatively little energy to treat potable
water. However, the TRACE analysis did not consider the energy used for
irrigation and storm water as it examined only the electricity consumed
for municipal water and wastewater. Only 25 percent of the wastewater
is treated while the rest is discharged into the rivers, increasing pollution.
The city is addressing this by building new capacity that will provide 100
percent treatment by 2018. However, this means that the energy used to
treat wastewater will also increase, from the existing 0.05 kWh/m3 (for
the 25 percent of wastewater treated) to about 0.3 kWh/m3.
The EE measures recommended by TRACE to improve the water sector
include the following:
1. Introduce a program to detect and repair leaks.
2. Enforce a program that could reduce the treatment and pumping
costs by minimizing the required delivery pressure in the water pipes.
POWER SECTOR. The power sector is managed by the local electricity
provider, Codensa, a joint venture between the public and private sectors.
Electricity is produced by a network of hydropower plants outside the city
with an installed capacity of 2,575 MW and nearly 1.8 million households
have power connections. With a primary electricity consumption of 1,217
kWh of electricity per capita, Bogotá compares favorably to other cities
in the TRACE database with similar climates. The city also performs well
in terms of overall losses in the system. As with water and solid waste,
electricity tariffs are differentiated according to socioeconomic groups,
with rich communities subsidizing the electricity bills of lower-income ones.
SOLID WASTE. The solid waste sector is characterized by the following:
(1) it is managed by both private and public companies; (2) the city
generates 6,732 tons of waste daily, which represents 322 kg of solid
waste per capita, a figure that places Bogotá in the middle of the TRACE
database compared with cities with a similar Human Development Index
(HDI); (3) like many cities in the region, Bogotá does not separate its
waste (by type) and only 5.5 percent of solid waste is recycled; (4) as
in the water sector, higher-income groups subsidize the waste collection
tariffs for low-income communities; (5) the city recently replaced some
waste trucks with more efficient diesel vehicles comply with Euro IV and
BOGOTÁ D.C., COLOMBIA 11TOOL FOR RAPID ASSESSMENT OF CITY ENERGY
V emission standards; (6) the landfill, located 20 km from the city, is one
of the largest in Latin America and is equipped with a leachate treatment
plant and biogas collection facilities managed by third parties; and (7)
under the Basura Cero (Zero Waste) program, the city is carrying out an
ambitious activity to reduce the amount of waste dumped at the landfill by
2025, by promoting waste sorting at the source.
MUNICIPAL BUILDINGS. Bogotá has 1,664 municipal buildings, including
734 educational units, 91 public offices, and 172 health facilities, besides
various sports venues and cultural offices. The buildings are managed by
each of the city’s 20 subdistricts, and coordinated by the municipality.
However, as elsewhere in the world, the city does not have reliable data on
the overall floor space and energy consumption of its buildings.
Due to the mild climate, buildings do not need to be heated or cooled.
However, based on the TRACE analysis of six public offices, energy
consumption (98 kWh of electricity per m2) is higher than some cities in
the TRACE database; thus, the city could improve energy consumption by
a few easy-to-adopt measures such as a benchmarking and upgrades.
Matrix with EE Priorities and Proposed Programs
The matrix below presents the public sectors identified by the TRACE tool as
having the highest energy-saving potential and some of the measures the
city could consider to reduce consumption and improve overall efficiency.
The maximum energy saving potential is calculated by the TRACE tool
considering the total energy spending in the sector1 and other parameters
1 The total energy spending on public transportation and private vehicles was estimated by multiplying the annual fuel consumption (diesel and gasoline, respectively) by the average price of the fuel. Energy spending in street lighting,
such as the city authority control and the relative energy intensity of the
TRACE tool as is explained in the Summary of Section Priorization in the
Recommendation section.
The energy saving recommendations presented in the matrix were
presented, discussed and agreed with the city authorities and key
stakeholders, and represent only some of the possible measures to achieve
maximum potential savings. These are classified by cost, energy saving
potential and time of implementation, which are an estimation based on
previous experiences however further assessments should be conducted
to get the real cost of implementing the measures in Bogotá.
potable water and public buildings were provided by the utility companies and the city authorities.
Notes for the Matrix of EE Priorities a These amount refers to the maximum potential savings in the sector base on
the TRACE tool, assuming all possible recommendations are implemented. The
recommendations shown in the table were selected after discussions with the
municipal authorities and utility companies and could help achieve some of the
potential energy savings; however a detailed audit would need to be done to assess
with more precision the amount of energy savings each measure can achieve.
b Cost of Implementation estimated: low ($) = US$0 -US$100,000; medium ($$) =
US$100,000 – US$1,000,000; high ($$$) = > US$1,000,000
c Energy Saving Potential estimated: low (*), medium (**), high (***)
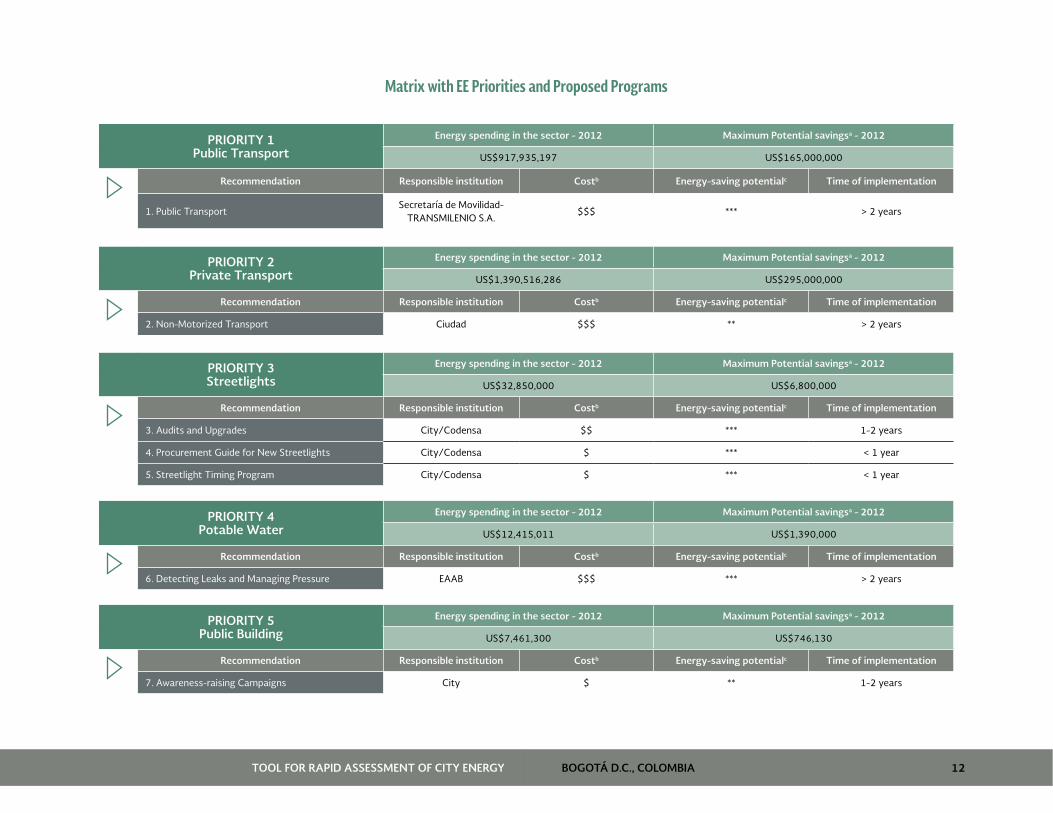
BOGOTÁ D.C., COLOMBIA 12TOOL FOR RAPID ASSESSMENT OF CITY ENERGY
Matrix with EE Priorities and Proposed Programs
PRIORITY 1Public Transport
Energy spending in the sector - 2012 Maximum Potential savingsa - 2012
US$917,935,197 US$165,000,000
Recommendation Responsible institution Costb Energy-saving potentialc Time of implementation
1. Public TransportSecretaría de Movilidad-
TRANSMILENIO S.A.$$$ *** > 2 years
PRIORITY 2Private Transport
Energy spending in the sector - 2012 Maximum Potential savingsa - 2012
US$1,390,516,286 US$295,000,000
Recommendation Responsible institution Costb Energy-saving potentialc Time of implementation
2. Non-Motorized Transport Ciudad $$$ ** > 2 years
PRIORITY 3Streetlights
Energy spending in the sector - 2012 Maximum Potential savingsa - 2012
US$32,850,000 US$6,800,000
Recommendation Responsible institution Costb Energy-saving potentialc Time of implementation
3. Audits and Upgrades City/Codensa $$ *** 1-2 years
4. Procurement Guide for New Streetlights City/Codensa $ *** < 1 year
5. Streetlight Timing Program City/Codensa $ *** < 1 year
PRIORITY 4Potable Water
Energy spending in the sector - 2012 Maximum Potential savingsa - 2012
US$12,415,011 US$1,390,000
Recommendation Responsible institution Costb Energy-saving potentialc Time of implementation
6. Detecting Leaks and Managing Pressure EAAB $$$ *** > 2 years
PRIORITY 5Public Building
Energy spending in the sector - 2012 Maximum Potential savingsa - 2012
US$7,461,300 US$746,130
Recommendation Responsible institution Costb Energy-saving potentialc Time of implementation
7. Awareness-raising Campaigns City $ ** 1-2 years
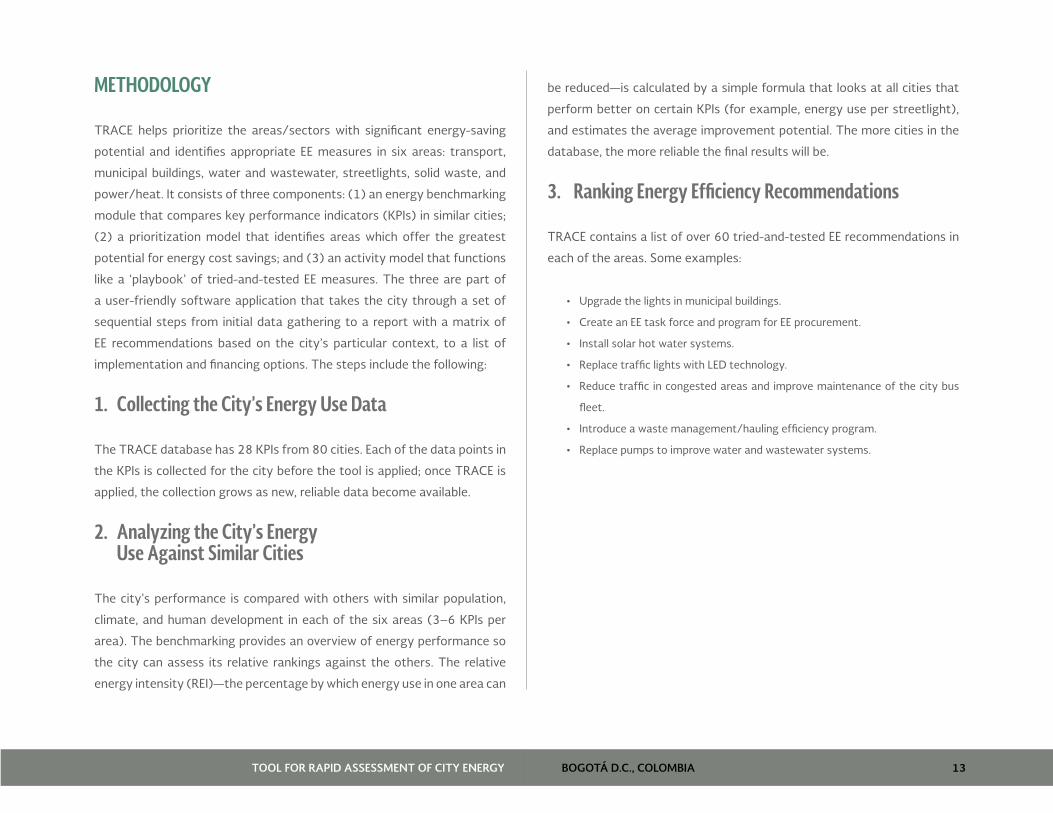
BOGOTÁ D.C., COLOMBIA 13TOOL FOR RAPID ASSESSMENT OF CITY ENERGY
METHODOLOGY
TRACE helps prioritize the areas/sectors with significant energy-saving
potential and identifies appropriate EE measures in six areas: transport,
municipal buildings, water and wastewater, streetlights, solid waste, and
power/heat. It consists of three components: (1) an energy benchmarking
module that compares key performance indicators (KPIs) in similar cities;
(2) a prioritization model that identifies areas which offer the greatest
potential for energy cost savings; and (3) an activity model that functions
like a ‘playbook’ of tried-and-tested EE measures. The three are part of
a user-friendly software application that takes the city through a set of
sequential steps from initial data gathering to a report with a matrix of
EE recommendations based on the city’s particular context, to a list of
implementation and financing options. The steps include the following:
1. Collecting the City’s Energy Use Data
The TRACE database has 28 KPIs from 80 cities. Each of the data points in
the KPIs is collected for the city before the tool is applied; once TRACE is
applied, the collection grows as new, reliable data become available.
2. Analyzing the City’s Energy Use Against Similar Cities
The city’s performance is compared with others with similar population,
climate, and human development in each of the six areas (3–6 KPIs per
area). The benchmarking provides an overview of energy performance so
the city can assess its relative rankings against the others. The relative
energy intensity (REI)—the percentage by which energy use in one area can
be reduced—is calculated by a simple formula that looks at all cities that
perform better on certain KPIs (for example, energy use per streetlight),
and estimates the average improvement potential. The more cities in the
database, the more reliable the final results will be.
3. Ranking Energy Efficiency Recommendations
TRACE contains a list of over 60 tried-and-tested EE recommendations in
each of the areas. Some examples:
• Upgrade the lights in municipal buildings.
• Create an EE task force and program for EE procurement.
• Install solar hot water systems.
• Replace traffic lights with LED technology.
• Reduce traffic in congested areas and improve maintenance of the city bus
fleet.
• Introduce a waste management/hauling efficiency program.
• Replace pumps to improve water and wastewater systems.
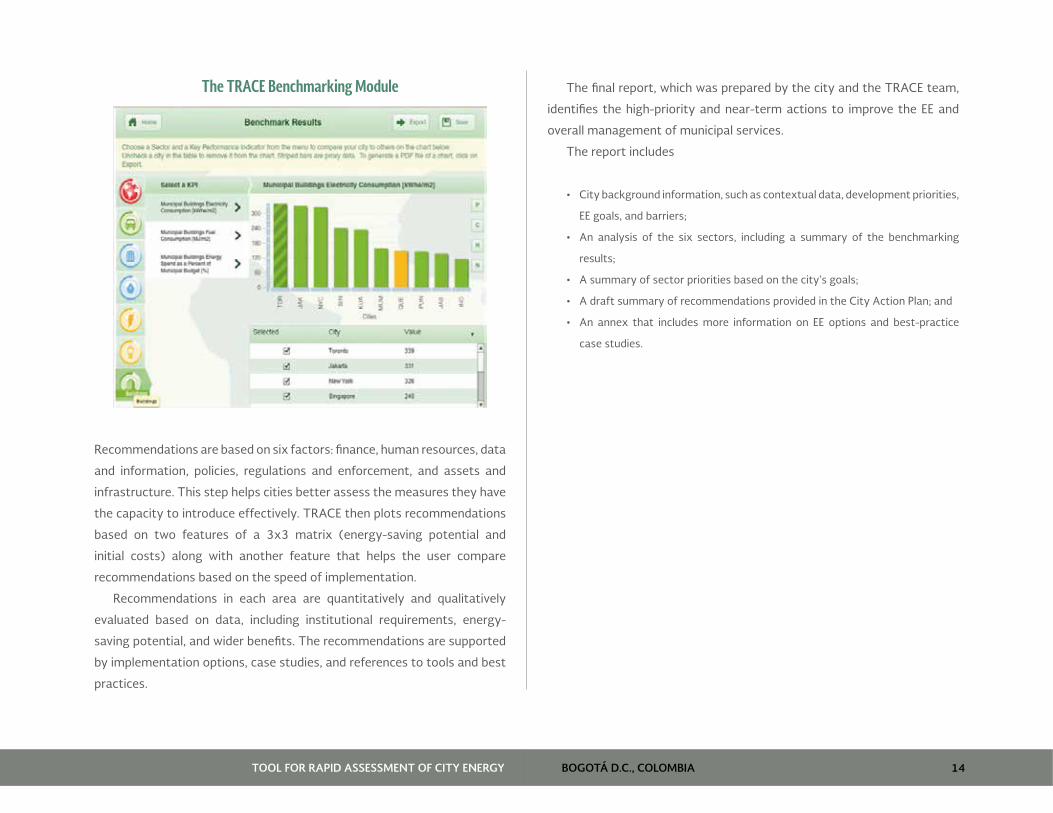
BOGOTÁ D.C., COLOMBIA 14TOOL FOR RAPID ASSESSMENT OF CITY ENERGY
The TRACE Benchmarking Module
Recommendations are based on six factors: finance, human resources, data
and information, policies, regulations and enforcement, and assets and
infrastructure. This step helps cities better assess the measures they have
the capacity to introduce effectively. TRACE then plots recommendations
based on two features of a 3x3 matrix (energy-saving potential and
initial costs) along with another feature that helps the user compare
recommendations based on the speed of implementation.
Recommendations in each area are quantitatively and qualitatively
evaluated based on data, including institutional requirements, energy-
saving potential, and wider benefits. The recommendations are supported
by implementation options, case studies, and references to tools and best
practices.
The final report, which was prepared by the city and the TRACE team,
identifies the high-priority and near-term actions to improve the EE and
overall management of municipal services.
The report includes
• City background information, such as contextual data, development priorities,
EE goals, and barriers;
• An analysis of the six sectors, including a summary of the benchmarking
results;
• A summary of sector priorities based on the city’s goals;
• A draft summary of recommendations provided in the City Action Plan; and
• An annex that includes more information on EE options and best-practice
case studies.
BOGOTÁ D.C., COLOMBIA 15TOOL FOR RAPID ASSESSMENT OF CITY ENERGY
TRACE Limitations
Because TRACE is relatively simple and easy to implement, its analyses are
somewhat limited. For example, it may identify streetlights as a priority
in terms of potential energy savings, but it does not detail the costs to
carry out rehabilitation projects. Thus, even if the energy-saving potential
is considered high, the costs may be even higher and investments may not
be viable. Also, although TRACE focuses on the service areas for which
the city is responsible, the tool cannot factor in the institutional/legislative
mechanisms that may be needed to launch specific EE actions.
While TRACE seems to apply well in Eastern European cities and
countries of the Commonwealth of Independent States (CIS), where
most public utilities are under the city governments (which gives them
substantial control over the TRACE areas), elsewhere, as in Latin America,
cities have less control over public utilities, either because they are
managed at a state or federal level or because the service is provided by a
contractor. For example, in 2013, TRACE was applied in Romania’s seven
largest cities where important services, such as public transport, district
heating, streetlights, and municipal buildings, were under local control. In
some, even where operation and maintenance (O&M) is outsourced to a
contractor (as with streetlights), the city owns the infrastructure and can
make the final decisions. Thus, in Romania, the TRACE studies helped local
and national authorities prepare local EE measures that were supported
with funds from the European Union, whose Europe 2020 Strategy aimed
to reduce greenhouse gas (GHG) emissions by 20 percent over the next
few years.
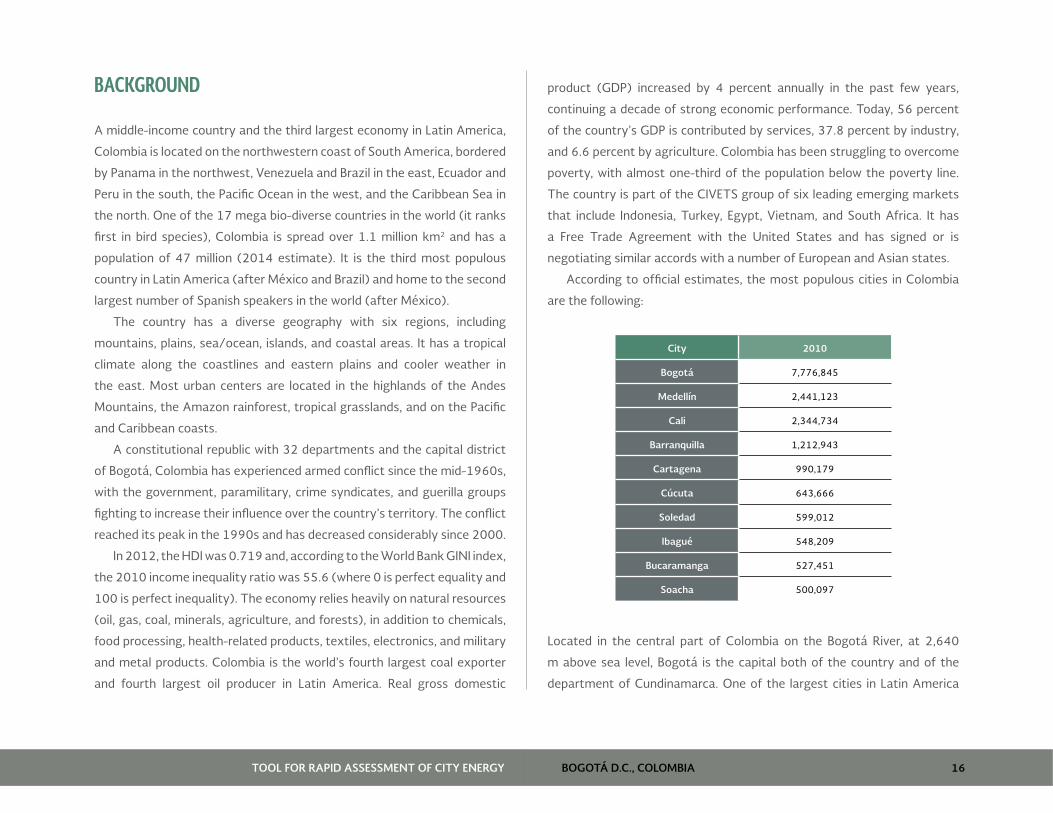
BOGOTÁ D.C., COLOMBIA 16TOOL FOR RAPID ASSESSMENT OF CITY ENERGY
BACKGROUND
A middle-income country and the third largest economy in Latin America,
Colombia is located on the northwestern coast of South America, bordered
by Panama in the northwest, Venezuela and Brazil in the east, Ecuador and
Peru in the south, the Pacific Ocean in the west, and the Caribbean Sea in
the north. One of the 17 mega bio-diverse countries in the world (it ranks
first in bird species), Colombia is spread over 1.1 million km2 and has a
population of 47 million (2014 estimate). It is the third most populous
country in Latin America (after México and Brazil) and home to the second
largest number of Spanish speakers in the world (after México).
The country has a diverse geography with six regions, including
mountains, plains, sea/ocean, islands, and coastal areas. It has a tropical
climate along the coastlines and eastern plains and cooler weather in
the east. Most urban centers are located in the highlands of the Andes
Mountains, the Amazon rainforest, tropical grasslands, and on the Pacific
and Caribbean coasts.
A constitutional republic with 32 departments and the capital district
of Bogotá, Colombia has experienced armed conflict since the mid-1960s,
with the government, paramilitary, crime syndicates, and guerilla groups
fighting to increase their influence over the country’s territory. The conflict
reached its peak in the 1990s and has decreased considerably since 2000.
In 2012, the HDI was 0.719 and, according to the World Bank GINI index,
the 2010 income inequality ratio was 55.6 (where 0 is perfect equality and
100 is perfect inequality). The economy relies heavily on natural resources
(oil, gas, coal, minerals, agriculture, and forests), in addition to chemicals,
food processing, health-related products, textiles, electronics, and military
and metal products. Colombia is the world’s fourth largest coal exporter
and fourth largest oil producer in Latin America. Real gross domestic
product (GDP) increased by 4 percent annually in the past few years,
continuing a decade of strong economic performance. Today, 56 percent
of the country’s GDP is contributed by services, 37.8 percent by industry,
and 6.6 percent by agriculture. Colombia has been struggling to overcome
poverty, with almost one-third of the population below the poverty line.
The country is part of the CIVETS group of six leading emerging markets
that include Indonesia, Turkey, Egypt, Vietnam, and South Africa. It has
a Free Trade Agreement with the United States and has signed or is
negotiating similar accords with a number of European and Asian states.
According to official estimates, the most populous cities in Colombia
are the following:
City 2010
Bogotá 7,776,845
Medellín 2,441,123
Cali 2,344,734
Barranquilla 1,212,943
Cartagena 990,179
Cúcuta 643,666
Soledad 599,012
Ibagué 548,209
Bucaramanga 527,451
Soacha 500,097
Located in the central part of Colombia on the Bogotá River, at 2,640
m above sea level, Bogotá is the capital both of the country and of the
department of Cundinamarca. One of the largest cities in Latin America

BOGOTÁ D.C., COLOMBIA 17TOOL FOR RAPID ASSESSMENT OF CITY ENERGY
and the 30th biggest in the world, Bogotá has a population of around 7.7
million, an increase of 10 percent compared to the 2005 census. The city
is spread across 1,600 km2, with a density of about 4,800 inhabitants
per km2. The metropolitan area consists of several localities with a total
population of 10.7 million. Bogotá has several airports, including the El
Dorado International Airport, which is the principal hub for domestic and
international flights.
The city has a subtropical highland climate, with an average temperature
of 14.5°C. The driest months are December, January, July, and August
while those with the most rain are April and May and September through
December. The warmest month is usually March, when the temperature
can reach 20°C. While temperatures are fairly consistent throughout the
year, weather conditions are unpredictable and can change radically even
during a single day, due to the El Niño and La Niña phenomena.
The city has 20 localities or districts which form an extensive network
of neighborhoods, including Usaquén, Chapinero, Santa Fe, San Cristóbal,
Usme, Tunjuelito, Bosa, Kennedy, Fontibón, Engativá, Suba, Barrios Unidos,
Teusaquillo, Los Mártires, Antonio Nariño, Puente Aranda, La Candelaria,
Rafael Uribe, Ciudad Bolívar, and Sumapaz. One-quarter of the municipal
area is rural. Most of the high-income communities are in the northern
and northeastern parts of the city, close to the foothills of the Eastern
Cordilliera. Most of the rural communities are in the south, which has some
of the poorest districts.
Rural and urban areas in Bogotá
v
Source: UAECD - IDECA - Portal de Mapas Bogotá.
The highest population density is in the south and southwest, which have
most of the low-income communities. Conversely, the northern area,
which has the wealthiest groups, has the lowest density. The industrial and
commercial areas, as well as the financial district, are in the northern and
downtown areas.
Bogotá is the country’s most important economic and industrial center
and receives most of the imported capital goods; it accounts for 26 percent
of national GDP. The local economy relies predominantly on the service
sector and real estate activities (15 percent), followed by commerce
(13 percent), and industry (12 percent). Other important sectors are
financial services, health care, construction, and telecommunications. The
unemployment rate is 9.5 percent.
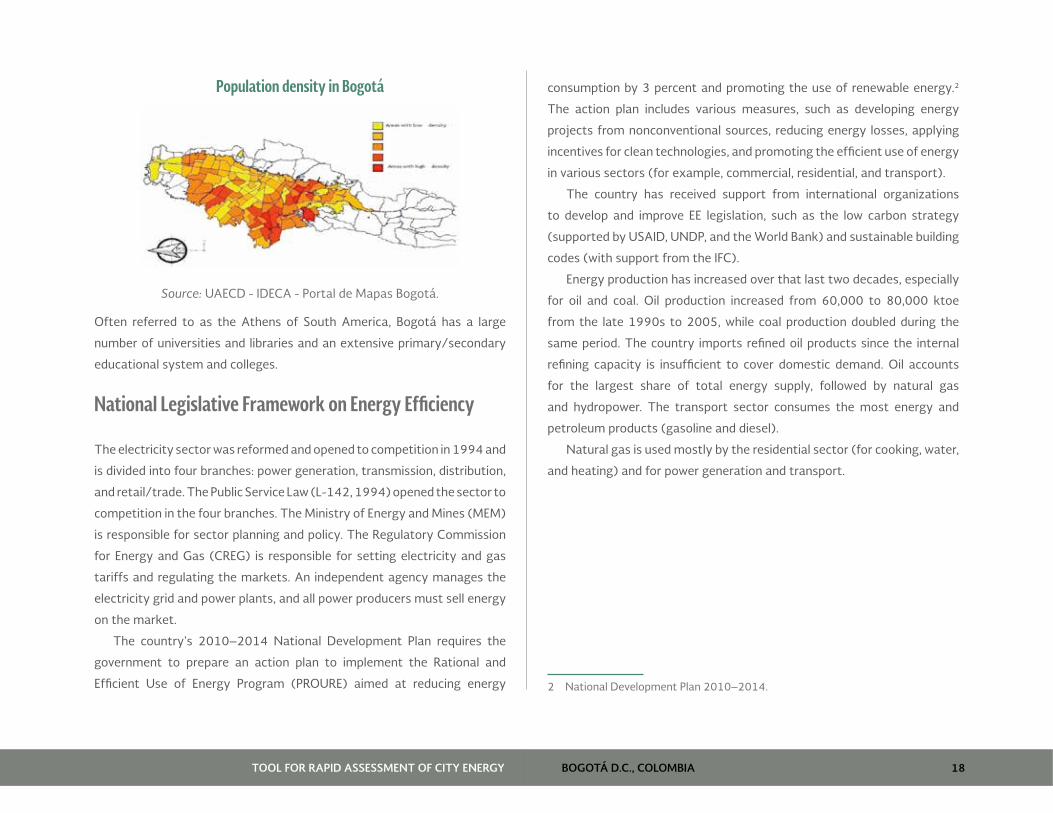
BOGOTÁ D.C., COLOMBIA 18TOOL FOR RAPID ASSESSMENT OF CITY ENERGY
Population density in Bogotá
Source: UAECD - IDECA - Portal de Mapas Bogotá.
Often referred to as the Athens of South America, Bogotá has a large
number of universities and libraries and an extensive primary/secondary
educational system and colleges.
National Legislative Framework on Energy Efficiency
The electricity sector was reformed and opened to competition in 1994 and
is divided into four branches: power generation, transmission, distribution,
and retail/trade. The Public Service Law (L-142, 1994) opened the sector to
competition in the four branches. The Ministry of Energy and Mines (MEM)
is responsible for sector planning and policy. The Regulatory Commission
for Energy and Gas (CREG) is responsible for setting electricity and gas
tariffs and regulating the markets. An independent agency manages the
electricity grid and power plants, and all power producers must sell energy
on the market.
The country’s 2010–2014 National Development Plan requires the
government to prepare an action plan to implement the Rational and
Efficient Use of Energy Program (PROURE) aimed at reducing energy
consumption by 3 percent and promoting the use of renewable energy.2
The action plan includes various measures, such as developing energy
projects from nonconventional sources, reducing energy losses, applying
incentives for clean technologies, and promoting the efficient use of energy
in various sectors (for example, commercial, residential, and transport).
The country has received support from international organizations
to develop and improve EE legislation, such as the low carbon strategy
(supported by USAID, UNDP, and the World Bank) and sustainable building
codes (with support from the IFC).
Energy production has increased over that last two decades, especially
for oil and coal. Oil production increased from 60,000 to 80,000 ktoe
from the late 1990s to 2005, while coal production doubled during the
same period. The country imports refined oil products since the internal
refining capacity is insufficient to cover domestic demand. Oil accounts
for the largest share of total energy supply, followed by natural gas
and hydropower. The transport sector consumes the most energy and
petroleum products (gasoline and diesel).
Natural gas is used mostly by the residential sector (for cooking, water,
and heating) and for power generation and transport.
2 National Development Plan 2010–2014.
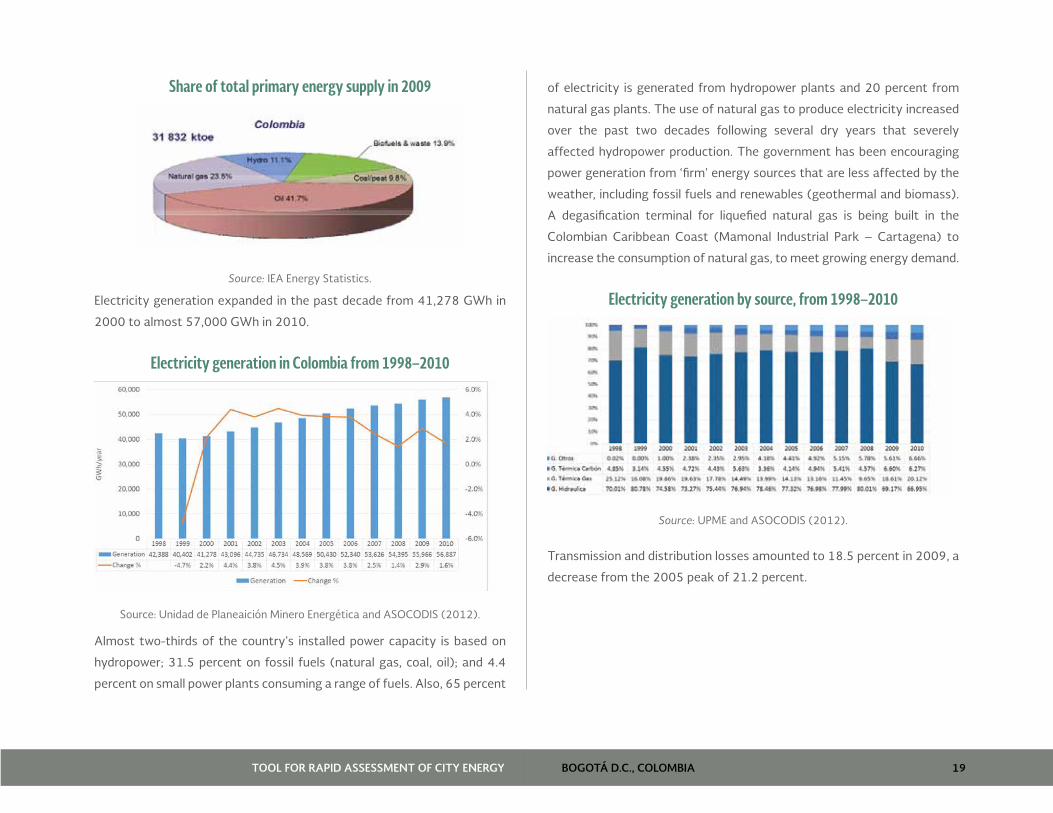
BOGOTÁ D.C., COLOMBIA 19TOOL FOR RAPID ASSESSMENT OF CITY ENERGY
Share of total primary energy supply in 2009
Source: IEA Energy Statistics.
Electricity generation expanded in the past decade from 41,278 GWh in
2000 to almost 57,000 GWh in 2010.
Electricity generation in Colombia from 1998–2010
Source: Unidad de Planeaición Minero Energética and ASOCODIS (2012).
Almost two-thirds of the country’s installed power capacity is based on
hydropower; 31.5 percent on fossil fuels (natural gas, coal, oil); and 4.4
percent on small power plants consuming a range of fuels. Also, 65 percent
of electricity is generated from hydropower plants and 20 percent from
natural gas plants. The use of natural gas to produce electricity increased
over the past two decades following several dry years that severely
affected hydropower production. The government has been encouraging
power generation from ‘firm’ energy sources that are less affected by the
weather, including fossil fuels and renewables (geothermal and biomass).
A degasification terminal for liquefied natural gas is being built in the
Colombian Caribbean Coast (Mamonal Industrial Park – Cartagena) to
increase the consumption of natural gas, to meet growing energy demand.
Electricity generation by source, from 1998–2010
Source: UPME and ASOCODIS (2012).
Transmission and distribution losses amounted to 18.5 percent in 2009, a
decrease from the 2005 peak of 21.2 percent.
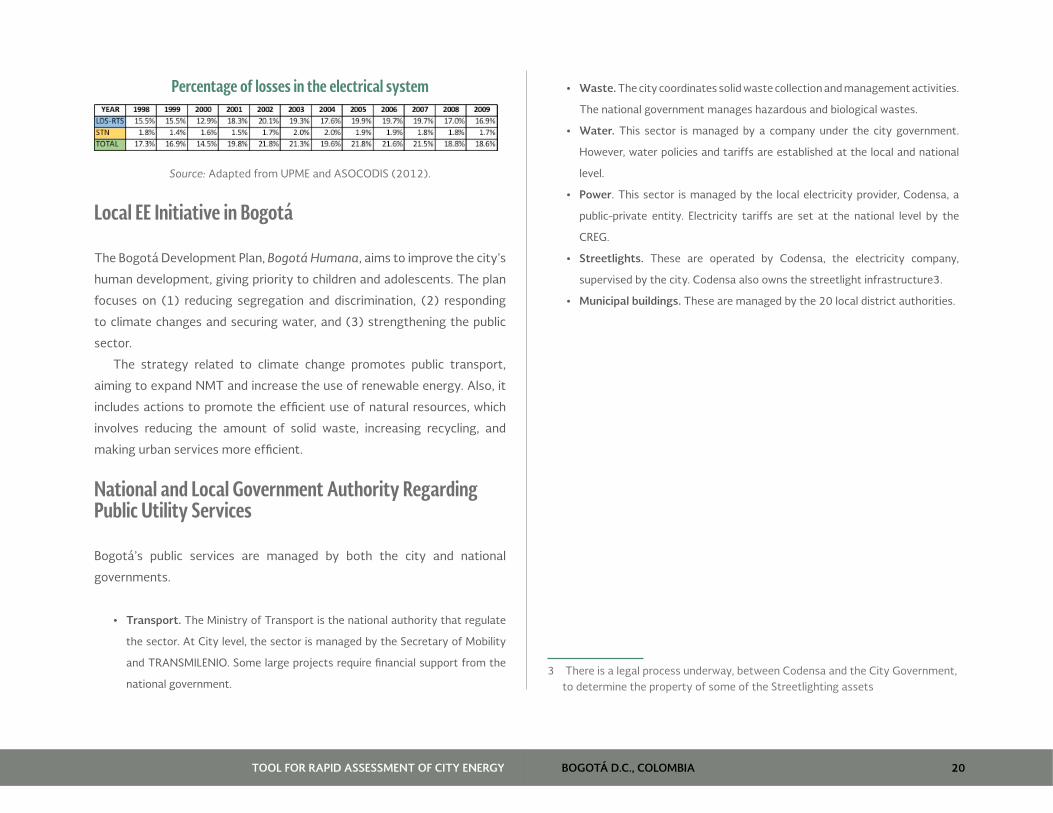
BOGOTÁ D.C., COLOMBIA 20TOOL FOR RAPID ASSESSMENT OF CITY ENERGY
Percentage of losses in the electrical system
Source: Adapted from UPME and ASOCODIS (2012).
Local EE Initiative in Bogotá
The Bogotá Development Plan, Bogotá Humana, aims to improve the city’s
human development, giving priority to children and adolescents. The plan
focuses on (1) reducing segregation and discrimination, (2) responding
to climate changes and securing water, and (3) strengthening the public
sector.
The strategy related to climate change promotes public transport,
aiming to expand NMT and increase the use of renewable energy. Also, it
includes actions to promote the efficient use of natural resources, which
involves reducing the amount of solid waste, increasing recycling, and
making urban services more efficient.
National and Local Government Authority Regarding Public Utility Services
Bogotá’s public services are managed by both the city and national
governments.
• Transport. The Ministry of Transport is the national authority that regulate
the sector. At City level, the sector is managed by the Secretary of Mobility
and TRANSMILENIO. Some large projects require financial support from the
national government.
• Waste. The city coordinates solid waste collection and management activities.
The national government manages hazardous and biological wastes.
• Water. This sector is managed by a company under the city government.
However, water policies and tariffs are established at the local and national
level.
• Power. This sector is managed by the local electricity provider, Codensa, a
public-private entity. Electricity tariffs are set at the national level by the
CREG.
• Streetlights. These are operated by Codensa, the electricity company,
supervised by the city. Codensa also owns the streetlight infrastructure3.
• Municipal buildings. These are managed by the 20 local district authorities.
3 There is a legal process underway, between Codensa and the City Government, to determine the property of some of the Streetlighting assets

BOGOTÁ D.C., COLOMBIA 21TOOL FOR RAPID ASSESSMENT OF CITY ENERGY
BOGOTÁ SECTOR DIAGNOSTICS
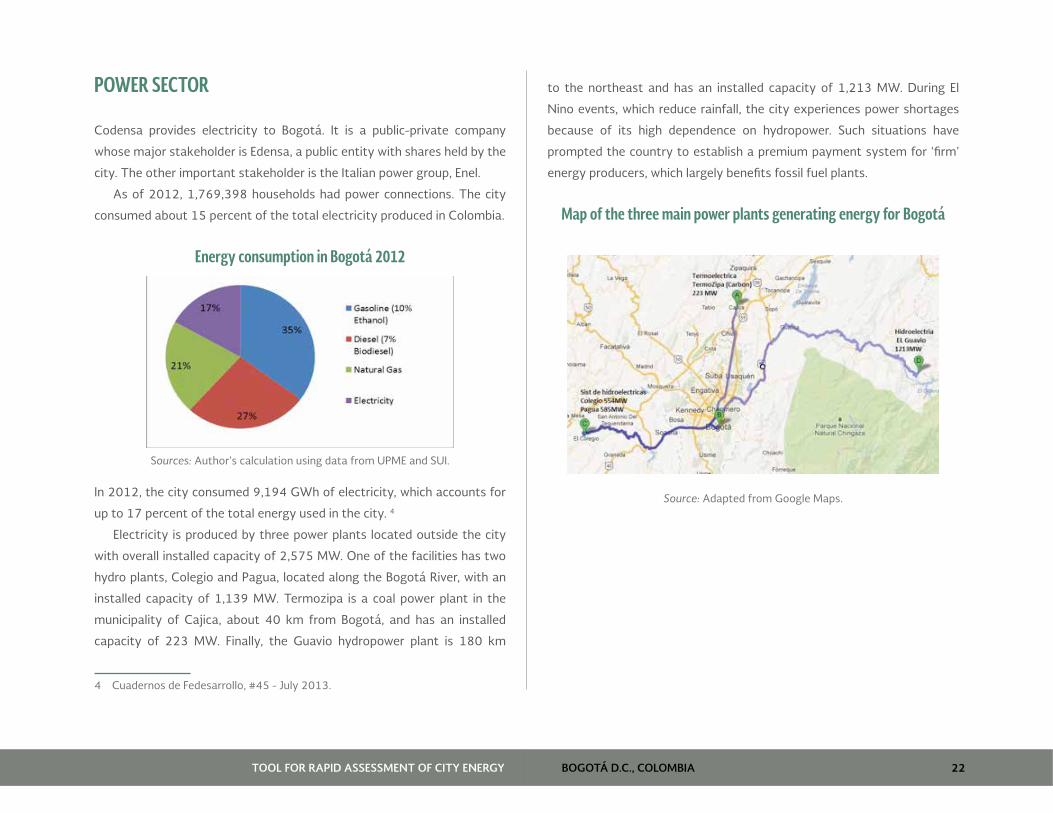
BOGOTÁ D.C., COLOMBIA 22TOOL FOR RAPID ASSESSMENT OF CITY ENERGY
POWER SECTOR
Codensa provides electricity to Bogotá. It is a public-private company
whose major stakeholder is Edensa, a public entity with shares held by the
city. The other important stakeholder is the Italian power group, Enel.
As of 2012, 1,769,398 households had power connections. The city
consumed about 15 percent of the total electricity produced in Colombia.
Energy consumption in Bogotá 2012
Sources: Author’s calculation using data from UPME and SUI.
In 2012, the city consumed 9,194 GWh of electricity, which accounts for
up to 17 percent of the total energy used in the city. 4
Electricity is produced by three power plants located outside the city
with overall installed capacity of 2,575 MW. One of the facilities has two
hydro plants, Colegio and Pagua, located along the Bogotá River, with an
installed capacity of 1,139 MW. Termozipa is a coal power plant in the
municipality of Cajica, about 40 km from Bogotá, and has an installed
capacity of 223 MW. Finally, the Guavio hydropower plant is 180 km
4 Cuadernos de Fedesarrollo, #45 - July 2013.
to the northeast and has an installed capacity of 1,213 MW. During El
Nino events, which reduce rainfall, the city experiences power shortages
because of its high dependence on hydropower. Such situations have
prompted the country to establish a premium payment system for ‘firm’
energy producers, which largely benefits fossil fuel plants.
Map of the three main power plants generating energy for Bogotá
Source: Adapted from Google Maps.
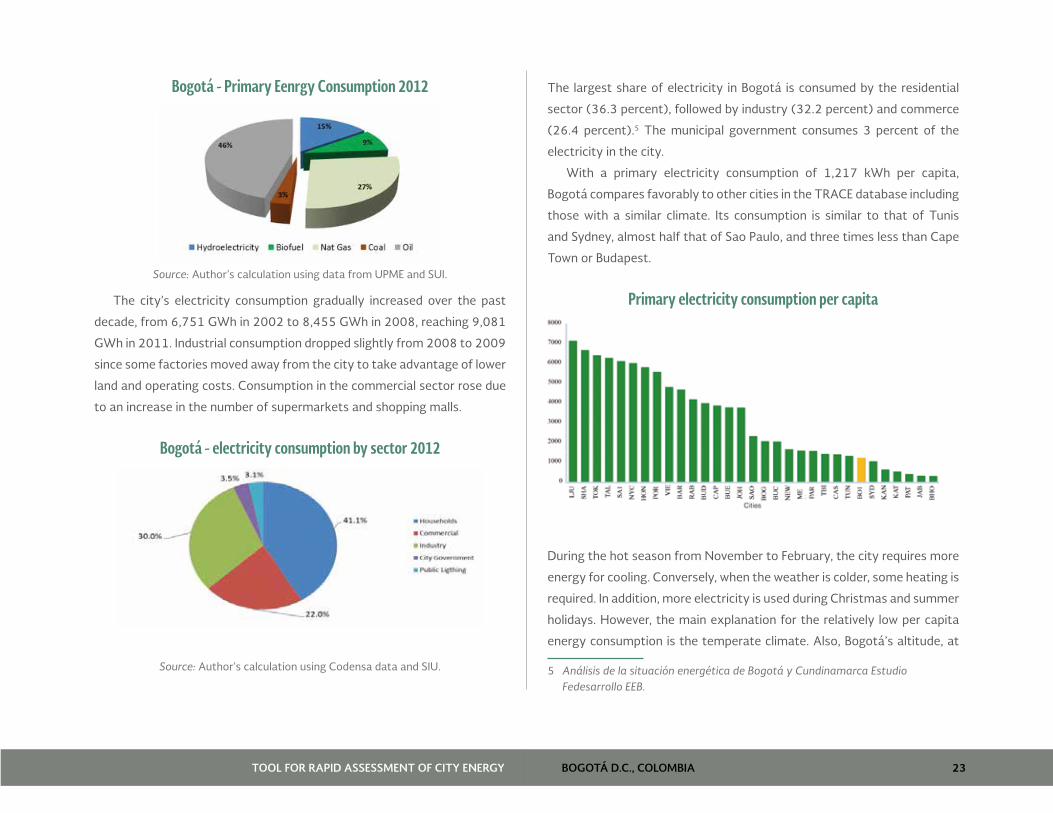
BOGOTÁ D.C., COLOMBIA 23TOOL FOR RAPID ASSESSMENT OF CITY ENERGY
Bogotá - Primary Eenrgy Consumption 2012
Source: Author’s calculation using data from UPME and SUI.
The city’s electricity consumption gradually increased over the past
decade, from 6,751 GWh in 2002 to 8,455 GWh in 2008, reaching 9,081
GWh in 2011. Industrial consumption dropped slightly from 2008 to 2009
since some factories moved away from the city to take advantage of lower
land and operating costs. Consumption in the commercial sector rose due
to an increase in the number of supermarkets and shopping malls.
Bogotá - electricity consumption by sector 2012
Source: Author’s calculation using Codensa data and SIU.
The largest share of electricity in Bogotá is consumed by the residential
sector (36.3 percent), followed by industry (32.2 percent) and commerce
(26.4 percent).5 The municipal government consumes 3 percent of the
electricity in the city.
With a primary electricity consumption of 1,217 kWh per capita,
Bogotá compares favorably to other cities in the TRACE database including
those with a similar climate. Its consumption is similar to that of Tunis
and Sydney, almost half that of Sao Paulo, and three times less than Cape
Town or Budapest.
Primary electricity consumption per capita
During the hot season from November to February, the city requires more
energy for cooling. Conversely, when the weather is colder, some heating is
required. In addition, more electricity is used during Christmas and summer
holidays. However, the main explanation for the relatively low per capita
energy consumption is the temperate climate. Also, Bogotá’s altitude, at
5 Análisis de la situación energética de Bogotá y Cundinamarca Estudio Fedesarrollo EEB.
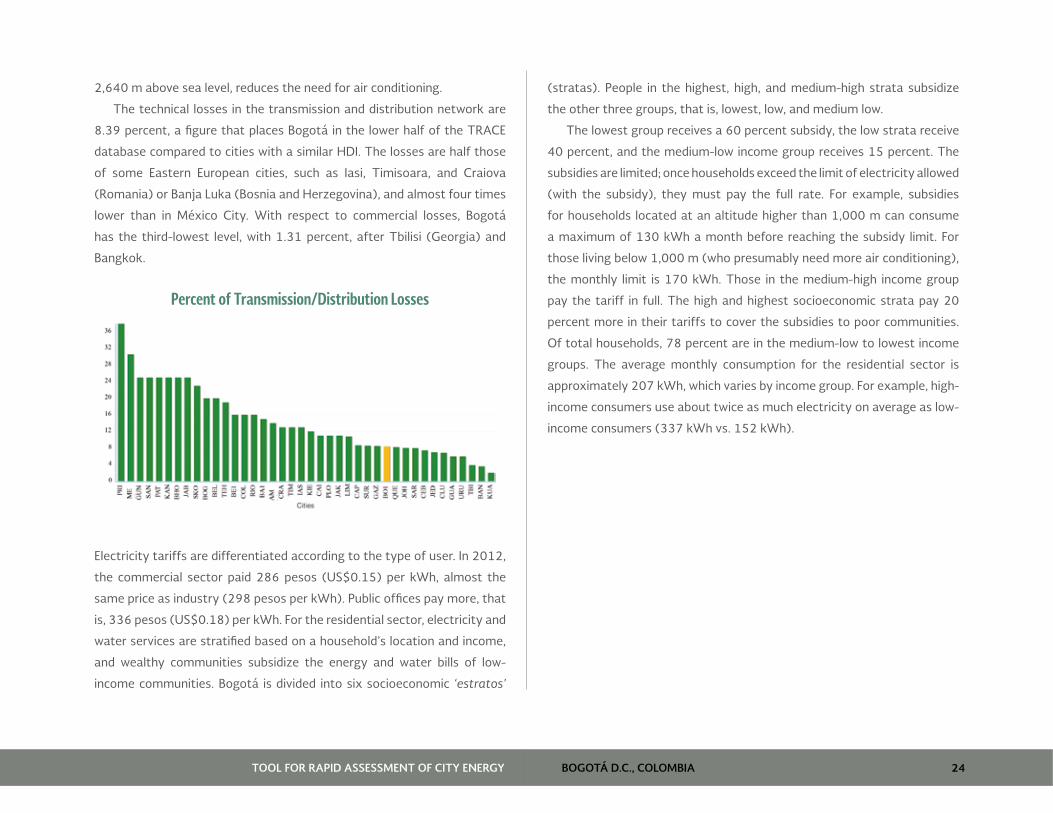
BOGOTÁ D.C., COLOMBIA 24TOOL FOR RAPID ASSESSMENT OF CITY ENERGY
2,640 m above sea level, reduces the need for air conditioning.
The technical losses in the transmission and distribution network are
8.39 percent, a figure that places Bogotá in the lower half of the TRACE
database compared to cities with a similar HDI. The losses are half those
of some Eastern European cities, such as Iasi, Timisoara, and Craiova
(Romania) or Banja Luka (Bosnia and Herzegovina), and almost four times
lower than in México City. With respect to commercial losses, Bogotá
has the third-lowest level, with 1.31 percent, after Tbilisi (Georgia) and
Bangkok.
Percent of Transmission/Distribution Losses
Electricity tariffs are differentiated according to the type of user. In 2012,
the commercial sector paid 286 pesos (US$0.15) per kWh, almost the
same price as industry (298 pesos per kWh). Public offices pay more, that
is, 336 pesos (US$0.18) per kWh. For the residential sector, electricity and
water services are stratified based on a household’s location and income,
and wealthy communities subsidize the energy and water bills of low-
income communities. Bogotá is divided into six socioeconomic ‘estratos’
(stratas). People in the highest, high, and medium-high strata subsidize
the other three groups, that is, lowest, low, and medium low.
The lowest group receives a 60 percent subsidy, the low strata receive
40 percent, and the medium-low income group receives 15 percent. The
subsidies are limited; once households exceed the limit of electricity allowed
(with the subsidy), they must pay the full rate. For example, subsidies
for households located at an altitude higher than 1,000 m can consume
a maximum of 130 kWh a month before reaching the subsidy limit. For
those living below 1,000 m (who presumably need more air conditioning),
the monthly limit is 170 kWh. Those in the medium-high income group
pay the tariff in full. The high and highest socioeconomic strata pay 20
percent more in their tariffs to cover the subsidies to poor communities.
Of total households, 78 percent are in the medium-low to lowest income
groups. The average monthly consumption for the residential sector is
approximately 207 kWh, which varies by income group. For example, high-
income consumers use about twice as much electricity on average as low-
income consumers (337 kWh vs. 152 kWh).
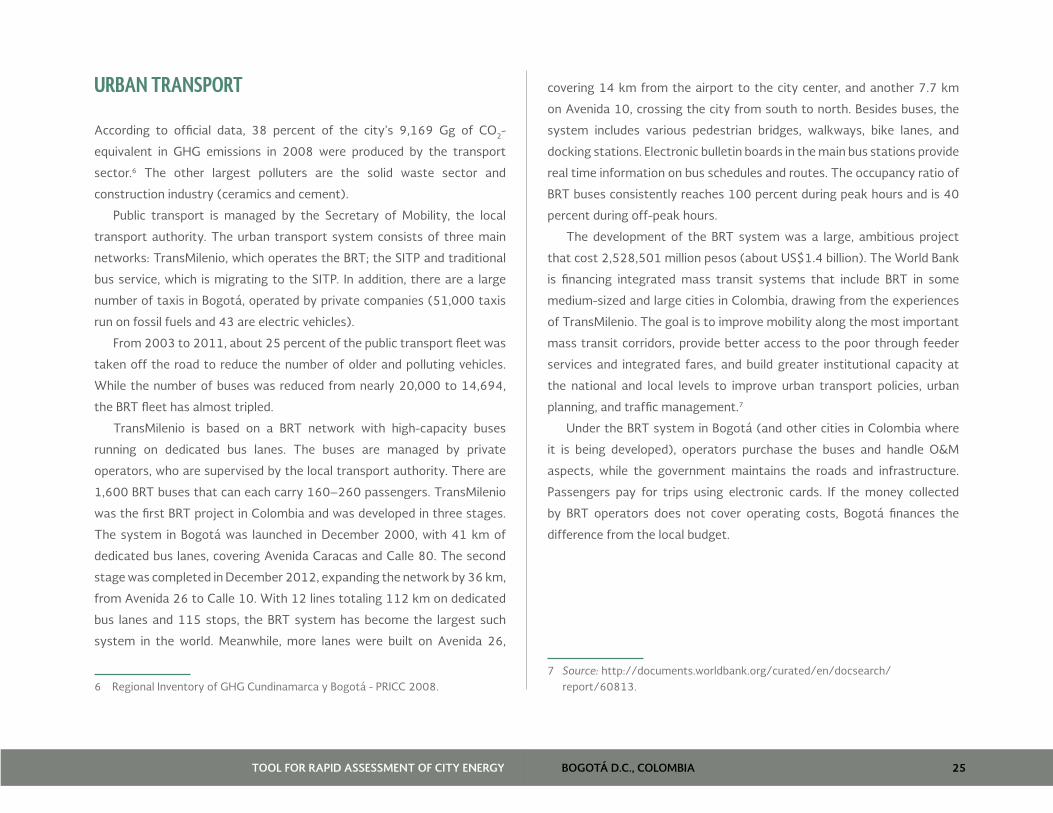
BOGOTÁ D.C., COLOMBIA 25TOOL FOR RAPID ASSESSMENT OF CITY ENERGY
URBAN TRANSPORT
According to official data, 38 percent of the city’s 9,169 Gg of CO2-
equivalent in GHG emissions in 2008 were produced by the transport
sector.6 The other largest polluters are the solid waste sector and
construction industry (ceramics and cement).
Public transport is managed by the Secretary of Mobility, the local
transport authority. The urban transport system consists of three main
networks: TransMilenio, which operates the BRT; the SITP and traditional
bus service, which is migrating to the SITP. In addition, there are a large
number of taxis in Bogotá, operated by private companies (51,000 taxis
run on fossil fuels and 43 are electric vehicles).
From 2003 to 2011, about 25 percent of the public transport fleet was
taken off the road to reduce the number of older and polluting vehicles.
While the number of buses was reduced from nearly 20,000 to 14,694,
the BRT fleet has almost tripled.
TransMilenio is based on a BRT network with high-capacity buses
running on dedicated bus lanes. The buses are managed by private
operators, who are supervised by the local transport authority. There are
1,600 BRT buses that can each carry 160–260 passengers. TransMilenio
was the first BRT project in Colombia and was developed in three stages.
The system in Bogotá was launched in December 2000, with 41 km of
dedicated bus lanes, covering Avenida Caracas and Calle 80. The second
stage was completed in December 2012, expanding the network by 36 km,
from Avenida 26 to Calle 10. With 12 lines totaling 112 km on dedicated
bus lanes and 115 stops, the BRT system has become the largest such
system in the world. Meanwhile, more lanes were built on Avenida 26,
6 Regional Inventory of GHG Cundinamarca y Bogotá - PRICC 2008.
covering 14 km from the airport to the city center, and another 7.7 km
on Avenida 10, crossing the city from south to north. Besides buses, the
system includes various pedestrian bridges, walkways, bike lanes, and
docking stations. Electronic bulletin boards in the main bus stations provide
real time information on bus schedules and routes. The occupancy ratio of
BRT buses consistently reaches 100 percent during peak hours and is 40
percent during off-peak hours.
The development of the BRT system was a large, ambitious project
that cost 2,528,501 million pesos (about US$1.4 billion). The World Bank
is financing integrated mass transit systems that include BRT in some
medium-sized and large cities in Colombia, drawing from the experiences
of TransMilenio. The goal is to improve mobility along the most important
mass transit corridors, provide better access to the poor through feeder
services and integrated fares, and build greater institutional capacity at
the national and local levels to improve urban transport policies, urban
planning, and traffic management.7
Under the BRT system in Bogotá (and other cities in Colombia where
it is being developed), operators purchase the buses and handle O&M
aspects, while the government maintains the roads and infrastructure.
Passengers pay for trips using electronic cards. If the money collected
by BRT operators does not cover operating costs, Bogotá finances the
difference from the local budget.
7 Source: http://documents.worldbank.org/curated/en/docsearch/report/60813.
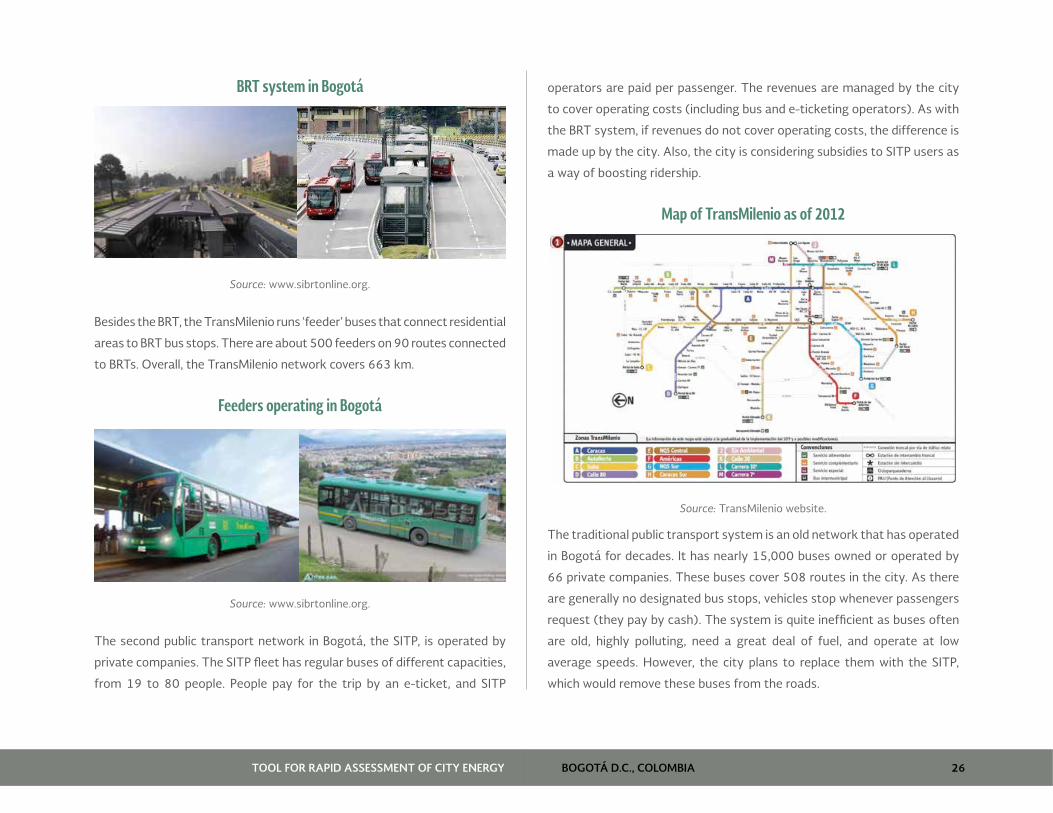
BOGOTÁ D.C., COLOMBIA 26TOOL FOR RAPID ASSESSMENT OF CITY ENERGY
BRT system in Bogotá
Source: www.sibrtonline.org.
Besides the BRT, the TransMilenio runs ‘feeder’ buses that connect residential
areas to BRT bus stops. There are about 500 feeders on 90 routes connected
to BRTs. Overall, the TransMilenio network covers 663 km.
Feeders operating in Bogotá
Source: www.sibrtonline.org.
The second public transport network in Bogotá, the SITP, is operated by
private companies. The SITP fleet has regular buses of different capacities,
from 19 to 80 people. People pay for the trip by an e-ticket, and SITP
operators are paid per passenger. The revenues are managed by the city
to cover operating costs (including bus and e-ticketing operators). As with
the BRT system, if revenues do not cover operating costs, the difference is
made up by the city. Also, the city is considering subsidies to SITP users as
a way of boosting ridership.
Map of TransMilenio as of 2012
Source: TransMilenio website.
The traditional public transport system is an old network that has operated
in Bogotá for decades. It has nearly 15,000 buses owned or operated by
66 private companies. These buses cover 508 routes in the city. As there
are generally no designated bus stops, vehicles stop whenever passengers
request (they pay by cash). The system is quite inefficient as buses often
are old, highly polluting, need a great deal of fuel, and operate at low
average speeds. However, the city plans to replace them with the SITP,
which would remove these buses from the roads.
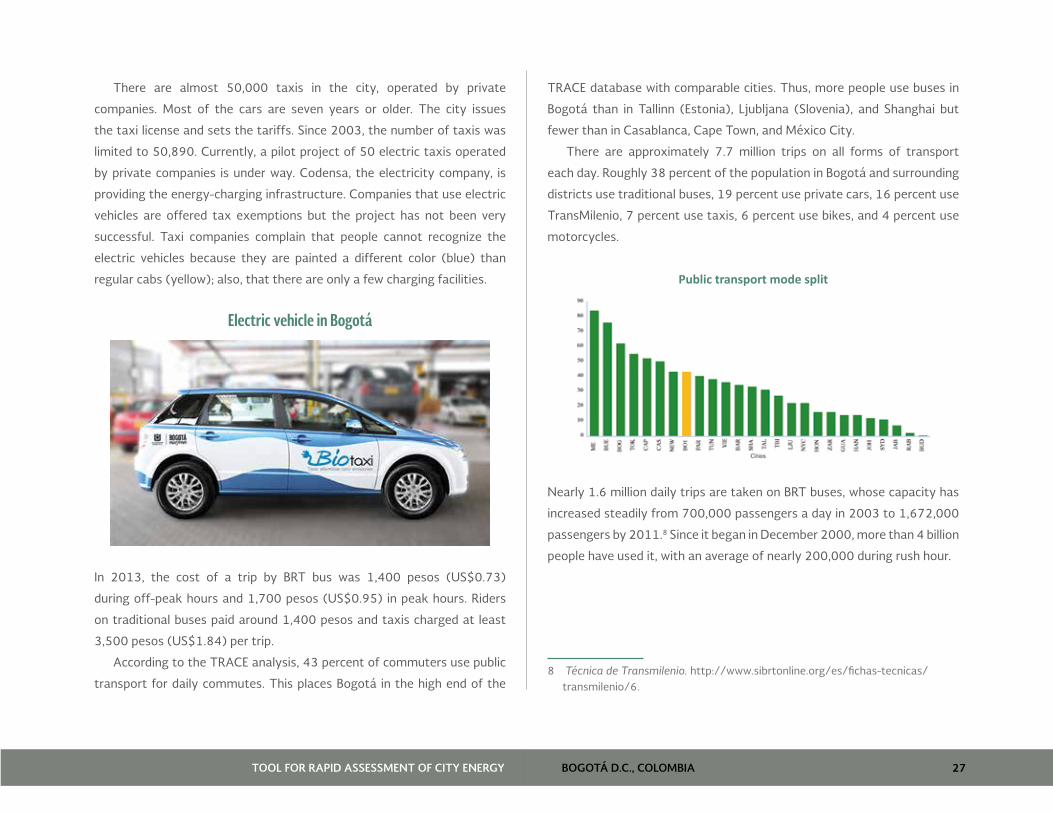
BOGOTÁ D.C., COLOMBIA 27TOOL FOR RAPID ASSESSMENT OF CITY ENERGY
There are almost 50,000 taxis in the city, operated by private
companies. Most of the cars are seven years or older. The city issues
the taxi license and sets the tariffs. Since 2003, the number of taxis was
limited to 50,890. Currently, a pilot project of 50 electric taxis operated
by private companies is under way. Codensa, the electricity company, is
providing the energy-charging infrastructure. Companies that use electric
vehicles are offered tax exemptions but the project has not been very
successful. Taxi companies complain that people cannot recognize the
electric vehicles because they are painted a different color (blue) than
regular cabs (yellow); also, that there are only a few charging facilities.
Electric vehicle in Bogotá
In 2013, the cost of a trip by BRT bus was 1,400 pesos (US$0.73)
during off-peak hours and 1,700 pesos (US$0.95) in peak hours. Riders
on traditional buses paid around 1,400 pesos and taxis charged at least
3,500 pesos (US$1.84) per trip.
According to the TRACE analysis, 43 percent of commuters use public
transport for daily commutes. This places Bogotá in the high end of the
TRACE database with comparable cities. Thus, more people use buses in
Bogotá than in Tallinn (Estonia), Ljubljana (Slovenia), and Shanghai but
fewer than in Casablanca, Cape Town, and México City.
There are approximately 7.7 million trips on all forms of transport
each day. Roughly 38 percent of the population in Bogotá and surrounding
districts use traditional buses, 19 percent use private cars, 16 percent use
TransMilenio, 7 percent use taxis, 6 percent use bikes, and 4 percent use
motorcycles.
Public transport mode split
Nearly 1.6 million daily trips are taken on BRT buses, whose capacity has
increased steadily from 700,000 passengers a day in 2003 to 1,672,000
passengers by 2011.8 Since it began in December 2000, more than 4 billion
people have used it, with an average of nearly 200,000 during rush hour.
8 Técnica de Transmilenio. http://www.sibrtonline.org/es/fichas-tecnicas/transmilenio/6.
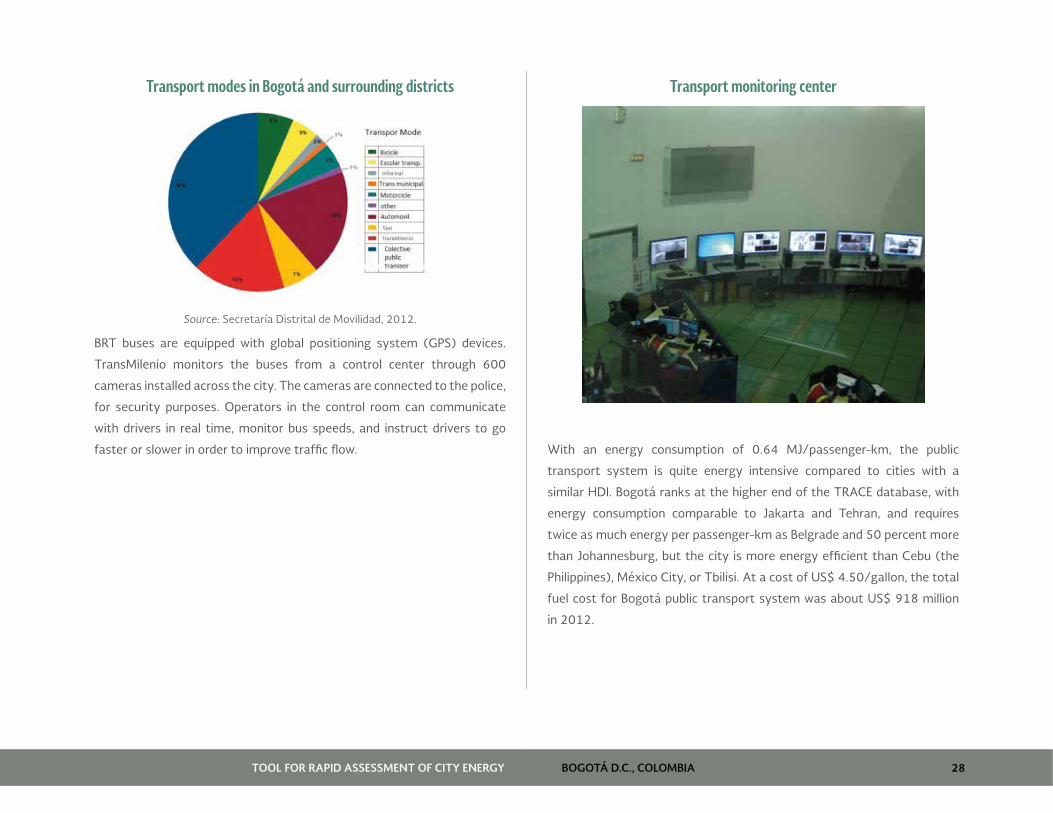
BOGOTÁ D.C., COLOMBIA 28TOOL FOR RAPID ASSESSMENT OF CITY ENERGY
Transport modes in Bogotá and surrounding districts
Source: Secretaría Distrital de Movilidad, 2012.
BRT buses are equipped with global positioning system (GPS) devices.
TransMilenio monitors the buses from a control center through 600
cameras installed across the city. The cameras are connected to the police,
for security purposes. Operators in the control room can communicate
with drivers in real time, monitor bus speeds, and instruct drivers to go
faster or slower in order to improve traffic flow.
Transport monitoring center
With an energy consumption of 0.64 MJ/passenger-km, the public
transport system is quite energy intensive compared to cities with a
similar HDI. Bogotá ranks at the higher end of the TRACE database, with
energy consumption comparable to Jakarta and Tehran, and requires
twice as much energy per passenger-km as Belgrade and 50 percent more
than Johannesburg, but the city is more energy efficient than Cebu (the
Philippines), México City, or Tbilisi. At a cost of US$ 4.50/gallon, the total
fuel cost for Bogotá public transport system was about US$ 918 million
in 2012.
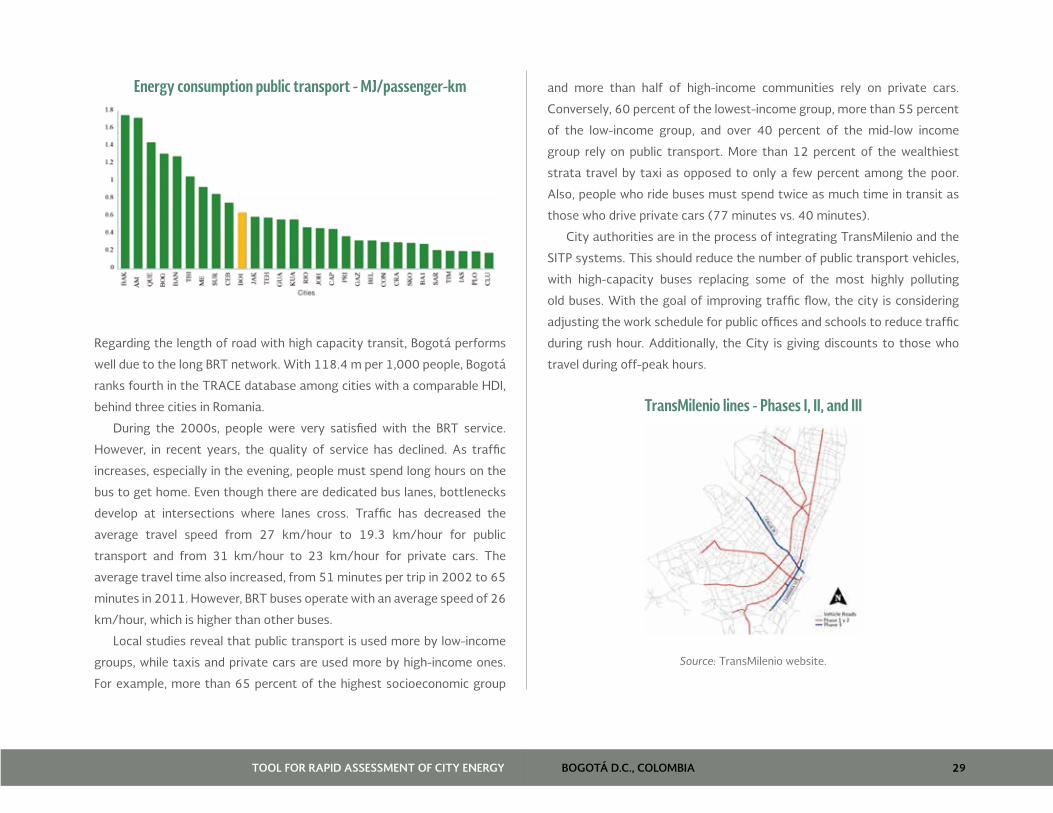
BOGOTÁ D.C., COLOMBIA 29TOOL FOR RAPID ASSESSMENT OF CITY ENERGY
Energy consumption public transport - MJ/passenger-km
Regarding the length of road with high capacity transit, Bogotá performs
well due to the long BRT network. With 118.4 m per 1,000 people, Bogotá
ranks fourth in the TRACE database among cities with a comparable HDI,
behind three cities in Romania.
During the 2000s, people were very satisfied with the BRT service.
However, in recent years, the quality of service has declined. As traffic
increases, especially in the evening, people must spend long hours on the
bus to get home. Even though there are dedicated bus lanes, bottlenecks
develop at intersections where lanes cross. Traffic has decreased the
average travel speed from 27 km/hour to 19.3 km/hour for public
transport and from 31 km/hour to 23 km/hour for private cars. The
average travel time also increased, from 51 minutes per trip in 2002 to 65
minutes in 2011. However, BRT buses operate with an average speed of 26
km/hour, which is higher than other buses.
Local studies reveal that public transport is used more by low-income
groups, while taxis and private cars are used more by high-income ones.
For example, more than 65 percent of the highest socioeconomic group
and more than half of high-income communities rely on private cars.
Conversely, 60 percent of the lowest-income group, more than 55 percent
of the low-income group, and over 40 percent of the mid-low income
group rely on public transport. More than 12 percent of the wealthiest
strata travel by taxi as opposed to only a few percent among the poor.
Also, people who ride buses must spend twice as much time in transit as
those who drive private cars (77 minutes vs. 40 minutes).
City authorities are in the process of integrating TransMilenio and the
SITP systems. This should reduce the number of public transport vehicles,
with high-capacity buses replacing some of the most highly polluting
old buses. With the goal of improving traffic flow, the city is considering
adjusting the work schedule for public offices and schools to reduce traffic
during rush hour. Additionally, the City is giving discounts to those who
travel during off-peak hours.
TransMilenio lines - Phases I, II, and III
Source: TransMilenio website.
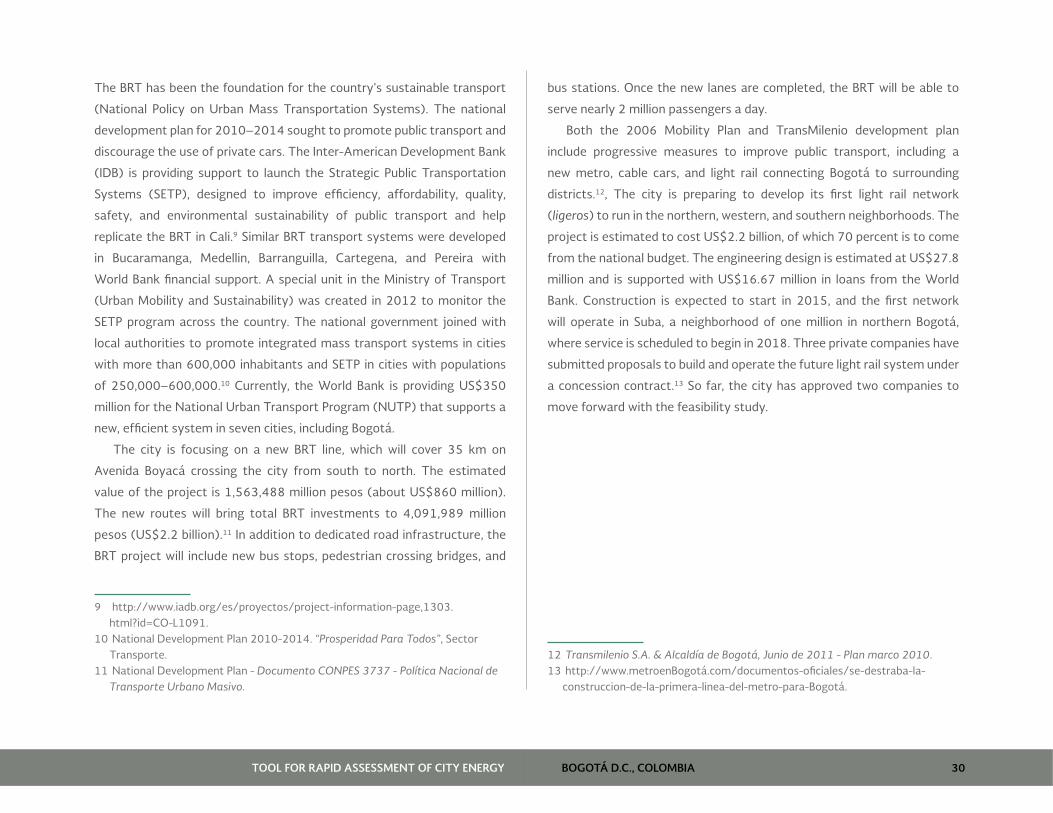
BOGOTÁ D.C., COLOMBIA 30TOOL FOR RAPID ASSESSMENT OF CITY ENERGY
The BRT has been the foundation for the country’s sustainable transport
(National Policy on Urban Mass Transportation Systems). The national
development plan for 2010–2014 sought to promote public transport and
discourage the use of private cars. The Inter-American Development Bank
(IDB) is providing support to launch the Strategic Public Transportation
Systems (SETP), designed to improve efficiency, affordability, quality,
safety, and environmental sustainability of public transport and help
replicate the BRT in Cali.9 Similar BRT transport systems were developed
in Bucaramanga, Medellin, Barranguilla, Cartegena, and Pereira with
World Bank financial support. A special unit in the Ministry of Transport
(Urban Mobility and Sustainability) was created in 2012 to monitor the
SETP program across the country. The national government joined with
local authorities to promote integrated mass transport systems in cities
with more than 600,000 inhabitants and SETP in cities with populations
of 250,000–600,000.10 Currently, the World Bank is providing US$350
million for the National Urban Transport Program (NUTP) that supports a
new, efficient system in seven cities, including Bogotá.
The city is focusing on a new BRT line, which will cover 35 km on
Avenida Boyacá crossing the city from south to north. The estimated
value of the project is 1,563,488 million pesos (about US$860 million).
The new routes will bring total BRT investments to 4,091,989 million
pesos (US$2.2 billion).11 In addition to dedicated road infrastructure, the
BRT project will include new bus stops, pedestrian crossing bridges, and
9 http://www.iadb.org/es/proyectos/project-information-page,1303.html?id=CO-L1091.
10 National Development Plan 2010-2014. “Prosperidad Para Todos”, Sector Transporte.
11 National Development Plan - Documento CONPES 3737 - Política Nacional de Transporte Urbano Masivo.
bus stations. Once the new lanes are completed, the BRT will be able to
serve nearly 2 million passengers a day.
Both the 2006 Mobility Plan and TransMilenio development plan
include progressive measures to improve public transport, including a
new metro, cable cars, and light rail connecting Bogotá to surrounding
districts.12, The city is preparing to develop its first light rail network
(ligeros) to run in the northern, western, and southern neighborhoods. The
project is estimated to cost US$2.2 billion, of which 70 percent is to come
from the national budget. The engineering design is estimated at US$27.8
million and is supported with US$16.67 million in loans from the World
Bank. Construction is expected to start in 2015, and the first network
will operate in Suba, a neighborhood of one million in northern Bogotá,
where service is scheduled to begin in 2018. Three private companies have
submitted proposals to build and operate the future light rail system under
a concession contract.13 So far, the city has approved two companies to
move forward with the feasibility study.
12 Transmilenio S.A. & Alcaldía de Bogotá, Junio de 2011 - Plan marco 2010.13 http://www.metroenBogotá.com/documentos-oficiales/se-destraba-la-
construccion-de-la-primera-linea-del-metro-para-Bogotá.
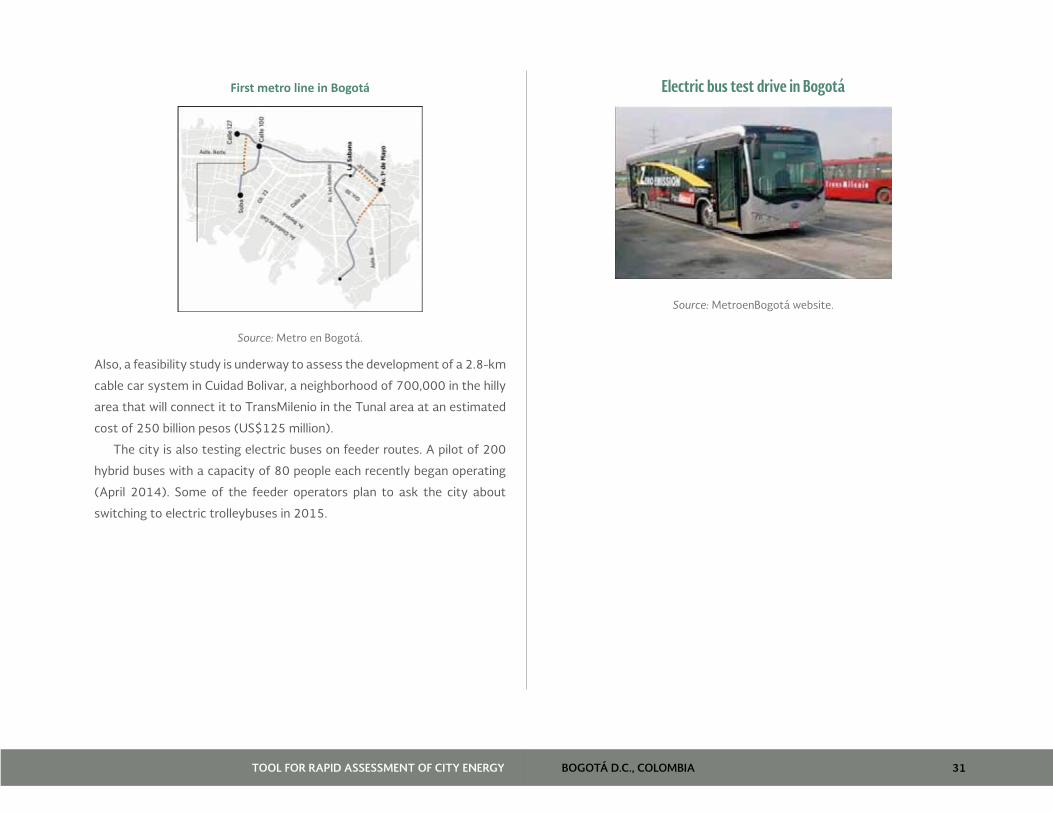
BOGOTÁ D.C., COLOMBIA 31TOOL FOR RAPID ASSESSMENT OF CITY ENERGY
First metro line in Bogotá
Source: Metro en Bogotá.
Also, a feasibility study is underway to assess the development of a 2.8-km
cable car system in Cuidad Bolivar, a neighborhood of 700,000 in the hilly
area that will connect it to TransMilenio in the Tunal area at an estimated
cost of 250 billion pesos (US$125 million).
The city is also testing electric buses on feeder routes. A pilot of 200
hybrid buses with a capacity of 80 people each recently began operating
(April 2014). Some of the feeder operators plan to ask the city about
switching to electric trolleybuses in 2015.
Electric bus test drive in Bogotá
Source: MetroenBogotá website.
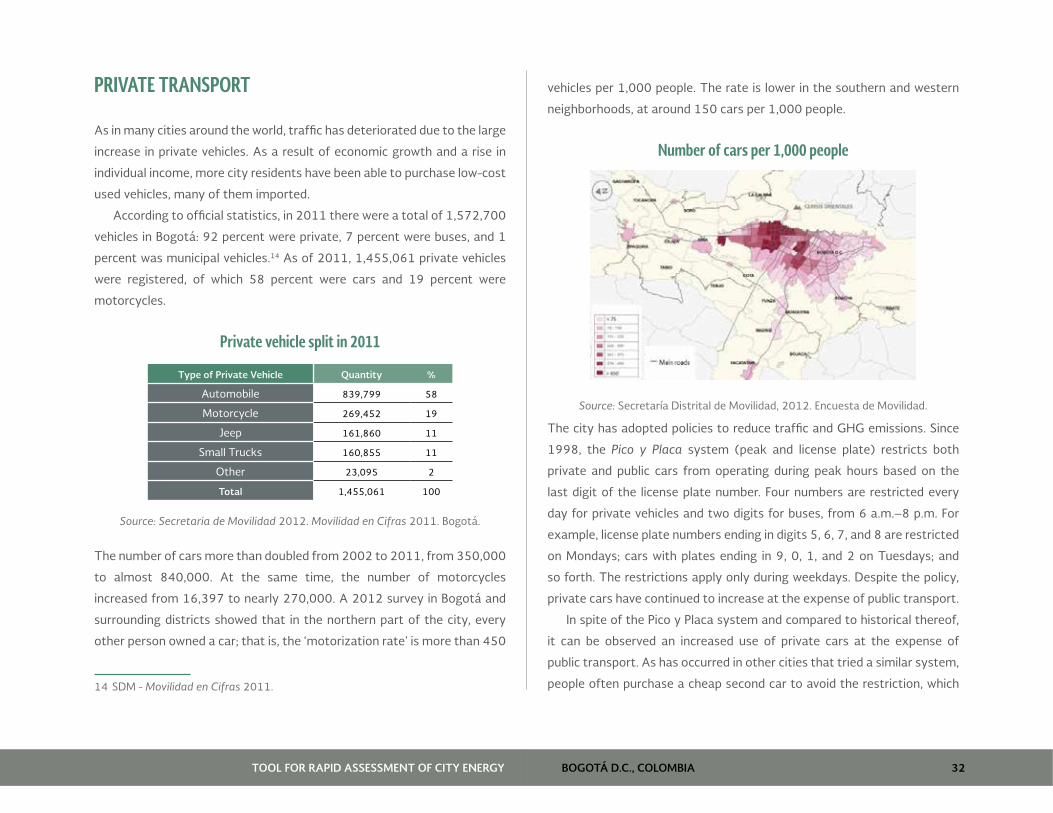
BOGOTÁ D.C., COLOMBIA 32TOOL FOR RAPID ASSESSMENT OF CITY ENERGY
PRIVATE TRANSPORT
As in many cities around the world, traffic has deteriorated due to the large
increase in private vehicles. As a result of economic growth and a rise in
individual income, more city residents have been able to purchase low-cost
used vehicles, many of them imported.
According to official statistics, in 2011 there were a total of 1,572,700
vehicles in Bogotá: 92 percent were private, 7 percent were buses, and 1
percent was municipal vehicles.14 As of 2011, 1,455,061 private vehicles
were registered, of which 58 percent were cars and 19 percent were
motorcycles.
Private vehicle split in 2011
Type of Private Vehicle Quantity %
Automobile 839,799 58
Motorcycle 269,452 19
Jeep 161,860 11
Small Trucks 160,855 11
Other 23,095 2
Total 1,455,061 100
Source: Secretaria de Movilidad 2012. Movilidad en Cifras 2011. Bogotá.
The number of cars more than doubled from 2002 to 2011, from 350,000
to almost 840,000. At the same time, the number of motorcycles
increased from 16,397 to nearly 270,000. A 2012 survey in Bogotá and
surrounding districts showed that in the northern part of the city, every
other person owned a car; that is, the ‘motorization rate’ is more than 450
14 SDM - Movilidad en Cifras 2011.
vehicles per 1,000 people. The rate is lower in the southern and western
neighborhoods, at around 150 cars per 1,000 people.
Number of cars per 1,000 people
Source: Secretaría Distrital de Movilidad, 2012. Encuesta de Movilidad.
The city has adopted policies to reduce traffic and GHG emissions. Since
1998, the Pico y Placa system (peak and license plate) restricts both
private and public cars from operating during peak hours based on the
last digit of the license plate number. Four numbers are restricted every
day for private vehicles and two digits for buses, from 6 a.m.–8 p.m. For
example, license plate numbers ending in digits 5, 6, 7, and 8 are restricted
on Mondays; cars with plates ending in 9, 0, 1, and 2 on Tuesdays; and
so forth. The restrictions apply only during weekdays. Despite the policy,
private cars have continued to increase at the expense of public transport.
In spite of the Pico y Placa system and compared to historical thereof,
it can be observed an increased use of private cars at the expense of
public transport. As has occurred in other cities that tried a similar system,
people often purchase a cheap second car to avoid the restriction, which
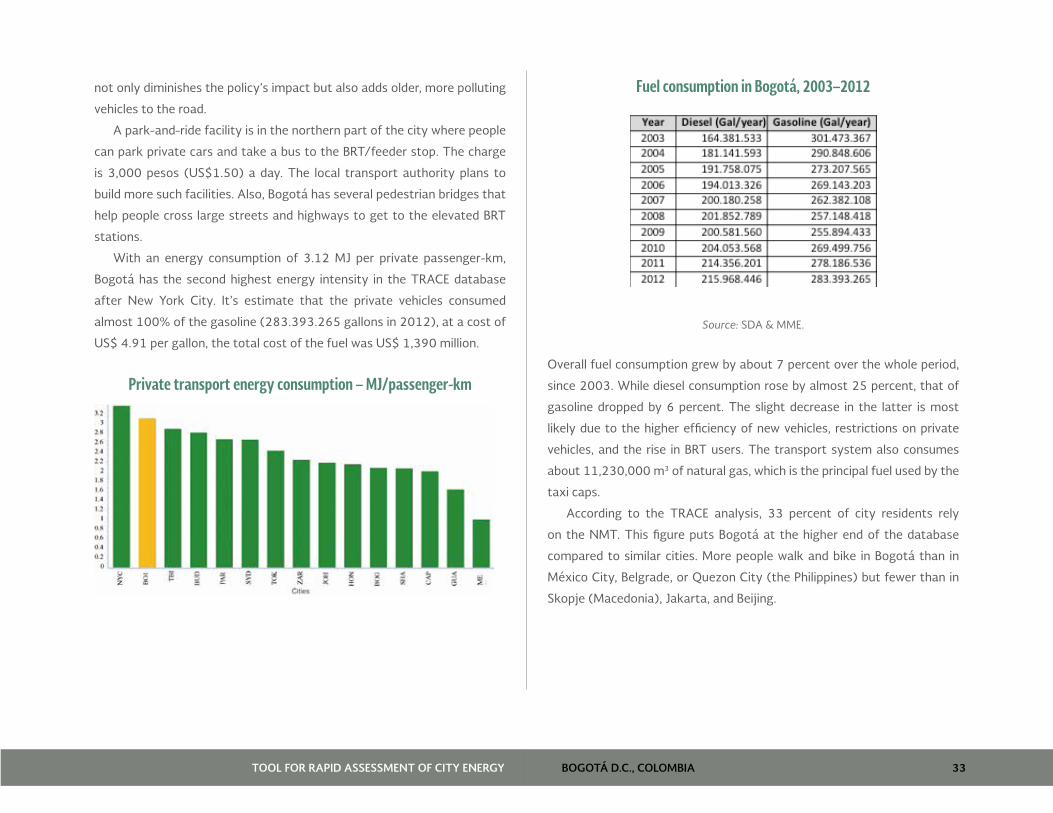
BOGOTÁ D.C., COLOMBIA 33TOOL FOR RAPID ASSESSMENT OF CITY ENERGY
not only diminishes the policy’s impact but also adds older, more polluting
vehicles to the road.
A park-and-ride facility is in the northern part of the city where people
can park private cars and take a bus to the BRT/feeder stop. The charge
is 3,000 pesos (US$1.50) a day. The local transport authority plans to
build more such facilities. Also, Bogotá has several pedestrian bridges that
help people cross large streets and highways to get to the elevated BRT
stations.
With an energy consumption of 3.12 MJ per private passenger-km,
Bogotá has the second highest energy intensity in the TRACE database
after New York City. It’s estimate that the private vehicles consumed
almost 100% of the gasoline (283.393.265 gallons in 2012), at a cost of
US$ 4.91 per gallon, the total cost of the fuel was US$ 1,390 million.
Private transport energy consumption – MJ/passenger-km
Fuel consumption in Bogotá, 2003–2012
Source: SDA & MME.
Overall fuel consumption grew by about 7 percent over the whole period,
since 2003. While diesel consumption rose by almost 25 percent, that of
gasoline dropped by 6 percent. The slight decrease in the latter is most
likely due to the higher efficiency of new vehicles, restrictions on private
vehicles, and the rise in BRT users. The transport system also consumes
about 11,230,000 m3 of natural gas, which is the principal fuel used by the
taxi caps.
According to the TRACE analysis, 33 percent of city residents rely
on the NMT. This figure puts Bogotá at the higher end of the database
compared to similar cities. More people walk and bike in Bogotá than in
México City, Belgrade, or Quezon City (the Philippines) but fewer than in
Skopje (Macedonia), Jakarta, and Beijing.
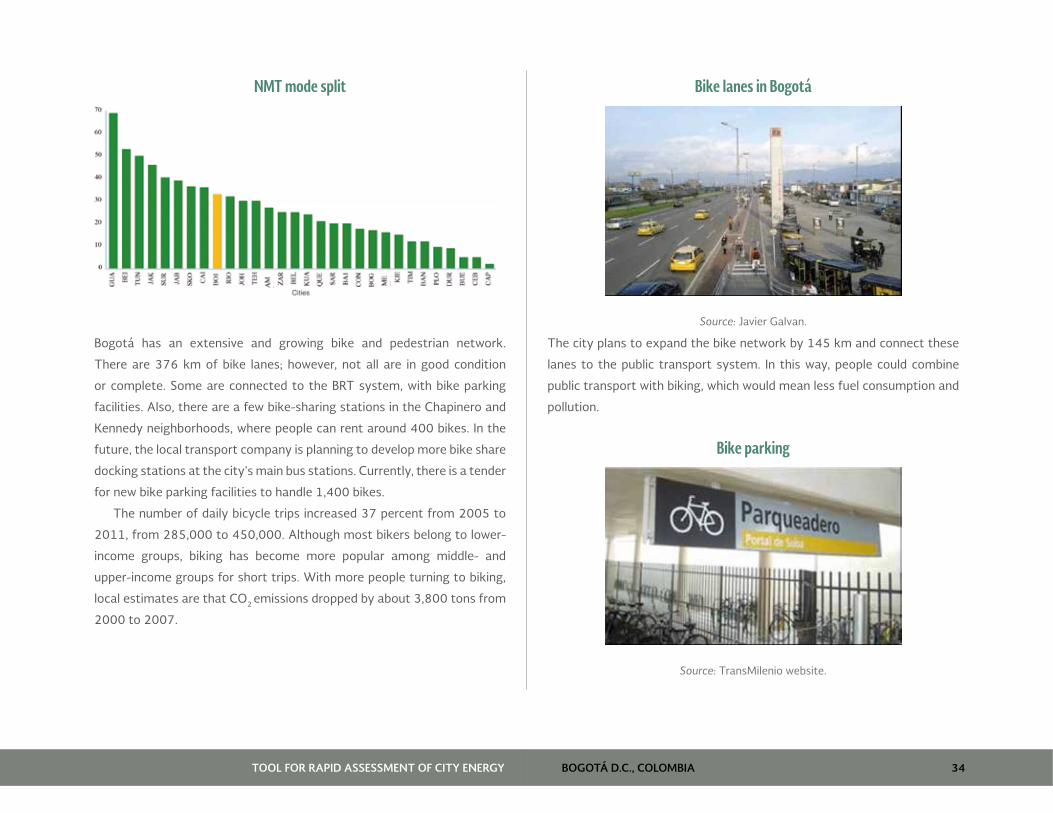
BOGOTÁ D.C., COLOMBIA 34TOOL FOR RAPID ASSESSMENT OF CITY ENERGY
NMT mode split
Bogotá has an extensive and growing bike and pedestrian network.
There are 376 km of bike lanes; however, not all are in good condition
or complete. Some are connected to the BRT system, with bike parking
facilities. Also, there are a few bike-sharing stations in the Chapinero and
Kennedy neighborhoods, where people can rent around 400 bikes. In the
future, the local transport company is planning to develop more bike share
docking stations at the city’s main bus stations. Currently, there is a tender
for new bike parking facilities to handle 1,400 bikes.
The number of daily bicycle trips increased 37 percent from 2005 to
2011, from 285,000 to 450,000. Although most bikers belong to lower-
income groups, biking has become more popular among middle- and
upper-income groups for short trips. With more people turning to biking,
local estimates are that CO2 emissions dropped by about 3,800 tons from
2000 to 2007.
Bike lanes in Bogotá
Source: Javier Galvan.
The city plans to expand the bike network by 145 km and connect these
lanes to the public transport system. In this way, people could combine
public transport with biking, which would mean less fuel consumption and
pollution.
Bike parking
Source: TransMilenio website.
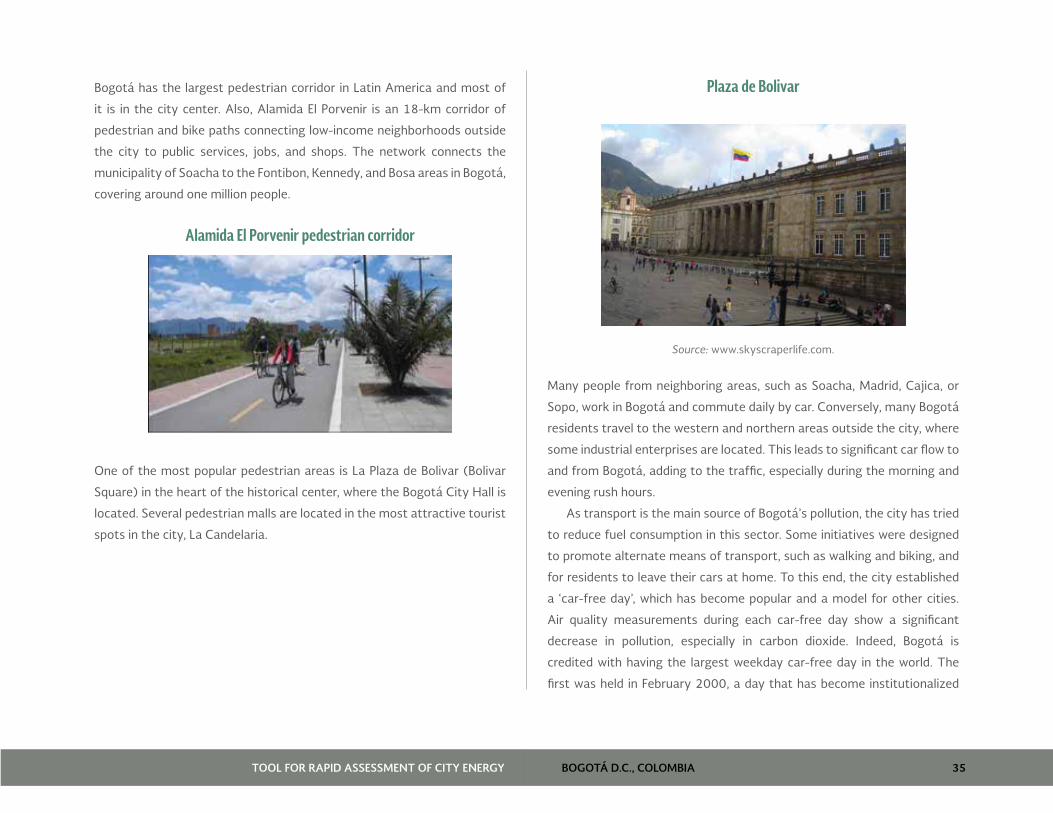
BOGOTÁ D.C., COLOMBIA 35TOOL FOR RAPID ASSESSMENT OF CITY ENERGY
Bogotá has the largest pedestrian corridor in Latin America and most of
it is in the city center. Also, Alamida El Porvenir is an 18-km corridor of
pedestrian and bike paths connecting low-income neighborhoods outside
the city to public services, jobs, and shops. The network connects the
municipality of Soacha to the Fontibon, Kennedy, and Bosa areas in Bogotá,
covering around one million people.
Alamida El Porvenir pedestrian corridor
One of the most popular pedestrian areas is La Plaza de Bolivar (Bolivar
Square) in the heart of the historical center, where the Bogotá City Hall is
located. Several pedestrian malls are located in the most attractive tourist
spots in the city, La Candelaria.
Plaza de Bolivar
Source: www.skyscraperlife.com.
Many people from neighboring areas, such as Soacha, Madrid, Cajica, or
Sopo, work in Bogotá and commute daily by car. Conversely, many Bogotá
residents travel to the western and northern areas outside the city, where
some industrial enterprises are located. This leads to significant car flow to
and from Bogotá, adding to the traffic, especially during the morning and
evening rush hours.
As transport is the main source of Bogotá’s pollution, the city has tried
to reduce fuel consumption in this sector. Some initiatives were designed
to promote alternate means of transport, such as walking and biking, and
for residents to leave their cars at home. To this end, the city established
a ‘car-free day’, which has become popular and a model for other cities.
Air quality measurements during each car-free day show a significant
decrease in pollution, especially in carbon dioxide. Indeed, Bogotá is
credited with having the largest weekday car-free day in the world. The
first was held in February 2000, a day that has become institutionalized
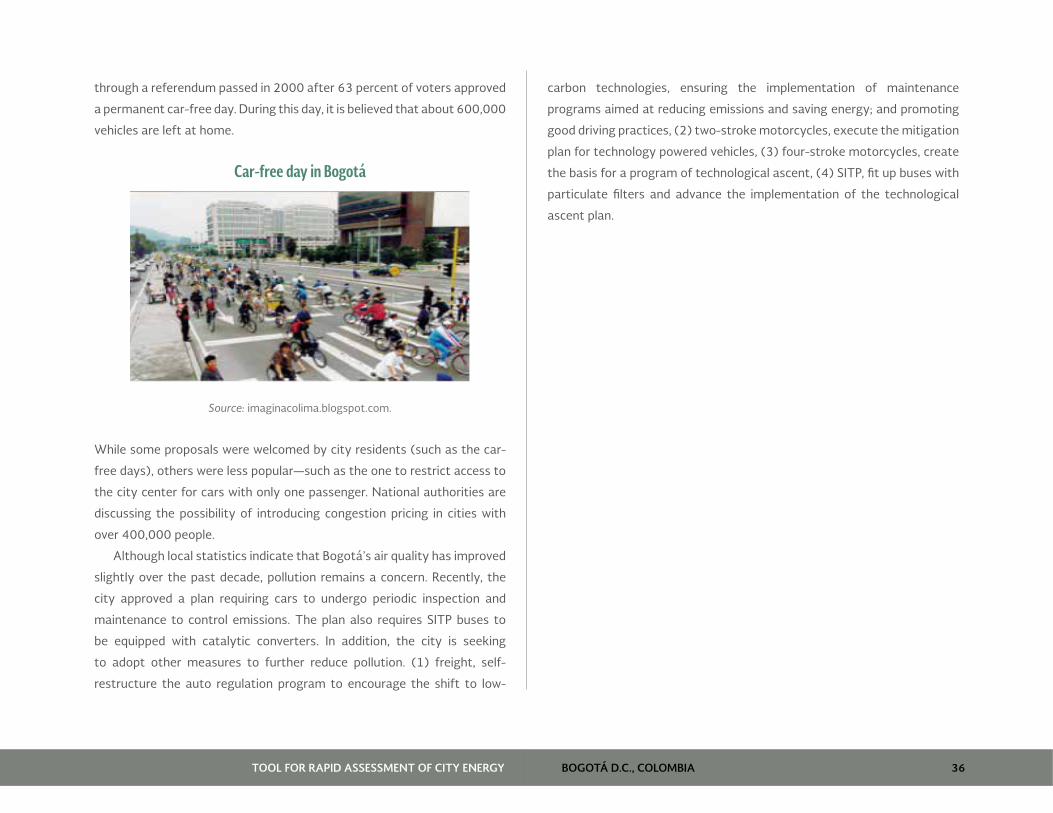
BOGOTÁ D.C., COLOMBIA 36TOOL FOR RAPID ASSESSMENT OF CITY ENERGY
through a referendum passed in 2000 after 63 percent of voters approved
a permanent car-free day. During this day, it is believed that about 600,000
vehicles are left at home.
Car-free day in Bogotá
Source: imaginacolima.blogspot.com.
While some proposals were welcomed by city residents (such as the car-
free days), others were less popular—such as the one to restrict access to
the city center for cars with only one passenger. National authorities are
discussing the possibility of introducing congestion pricing in cities with
over 400,000 people.
Although local statistics indicate that Bogotá’s air quality has improved
slightly over the past decade, pollution remains a concern. Recently, the
city approved a plan requiring cars to undergo periodic inspection and
maintenance to control emissions. The plan also requires SITP buses to
be equipped with catalytic converters. In addition, the city is seeking
to adopt other measures to further reduce pollution. (1) freight, self-
restructure the auto regulation program to encourage the shift to low-
carbon technologies, ensuring the implementation of maintenance
programs aimed at reducing emissions and saving energy; and promoting
good driving practices, (2) two-stroke motorcycles, execute the mitigation
plan for technology powered vehicles, (3) four-stroke motorcycles, create
the basis for a program of technological ascent, (4) SITP, fit up buses with
particulate filters and advance the implementation of the technological
ascent plan.
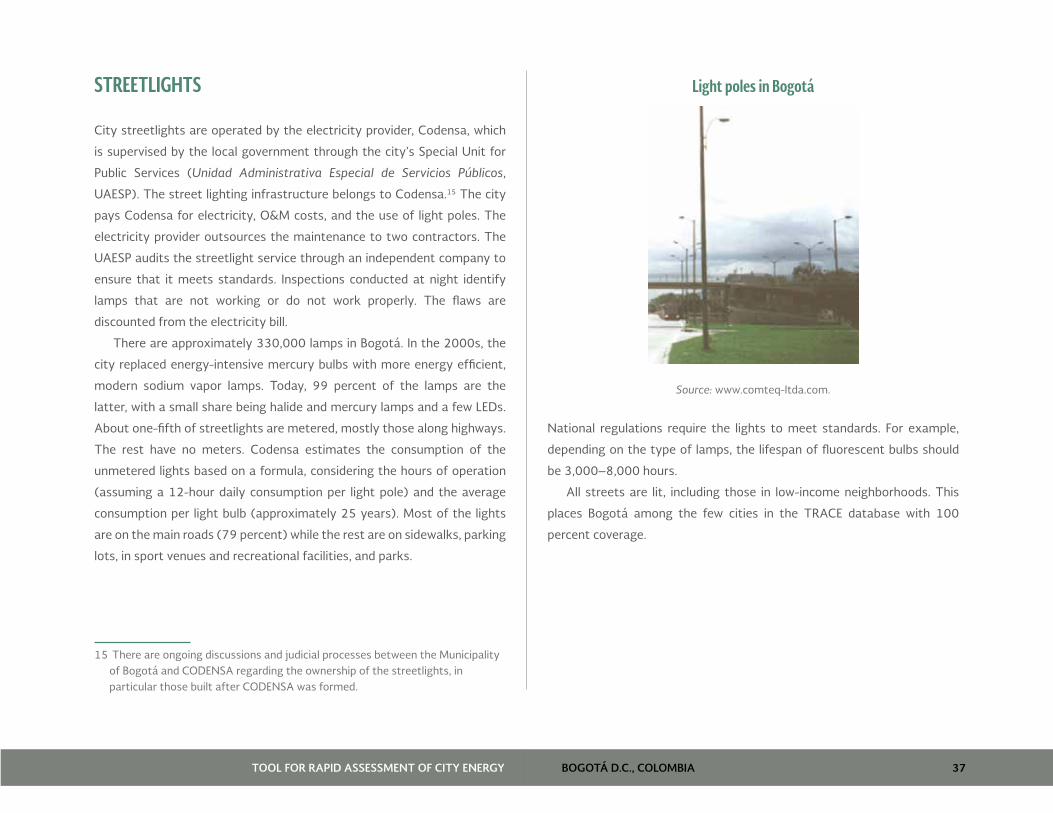
BOGOTÁ D.C., COLOMBIA 37TOOL FOR RAPID ASSESSMENT OF CITY ENERGY
STREETLIGHTS
City streetlights are operated by the electricity provider, Codensa, which
is supervised by the local government through the city’s Special Unit for
Public Services (Unidad Administrativa Especial de Servicios Públicos,
UAESP). The street lighting infrastructure belongs to Codensa.15 The city
pays Codensa for electricity, O&M costs, and the use of light poles. The
electricity provider outsources the maintenance to two contractors. The
UAESP audits the streetlight service through an independent company to
ensure that it meets standards. Inspections conducted at night identify
lamps that are not working or do not work properly. The flaws are
discounted from the electricity bill.
There are approximately 330,000 lamps in Bogotá. In the 2000s, the
city replaced energy-intensive mercury bulbs with more energy efficient,
modern sodium vapor lamps. Today, 99 percent of the lamps are the
latter, with a small share being halide and mercury lamps and a few LEDs.
About one-fifth of streetlights are metered, mostly those along highways.
The rest have no meters. Codensa estimates the consumption of the
unmetered lights based on a formula, considering the hours of operation
(assuming a 12-hour daily consumption per light pole) and the average
consumption per light bulb (approximately 25 years). Most of the lights
are on the main roads (79 percent) while the rest are on sidewalks, parking
lots, in sport venues and recreational facilities, and parks.
15 There are ongoing discussions and judicial processes between the Municipality of Bogotá and CODENSA regarding the ownership of the streetlights, in particular those built after CODENSA was formed.
Light poles in Bogotá
Source: www.comteq-ltda.com.
National regulations require the lights to meet standards. For example,
depending on the type of lamps, the lifespan of fluorescent bulbs should
be 3,000–8,000 hours.
All streets are lit, including those in low-income neighborhoods. This
places Bogotá among the few cities in the TRACE database with 100
percent coverage.
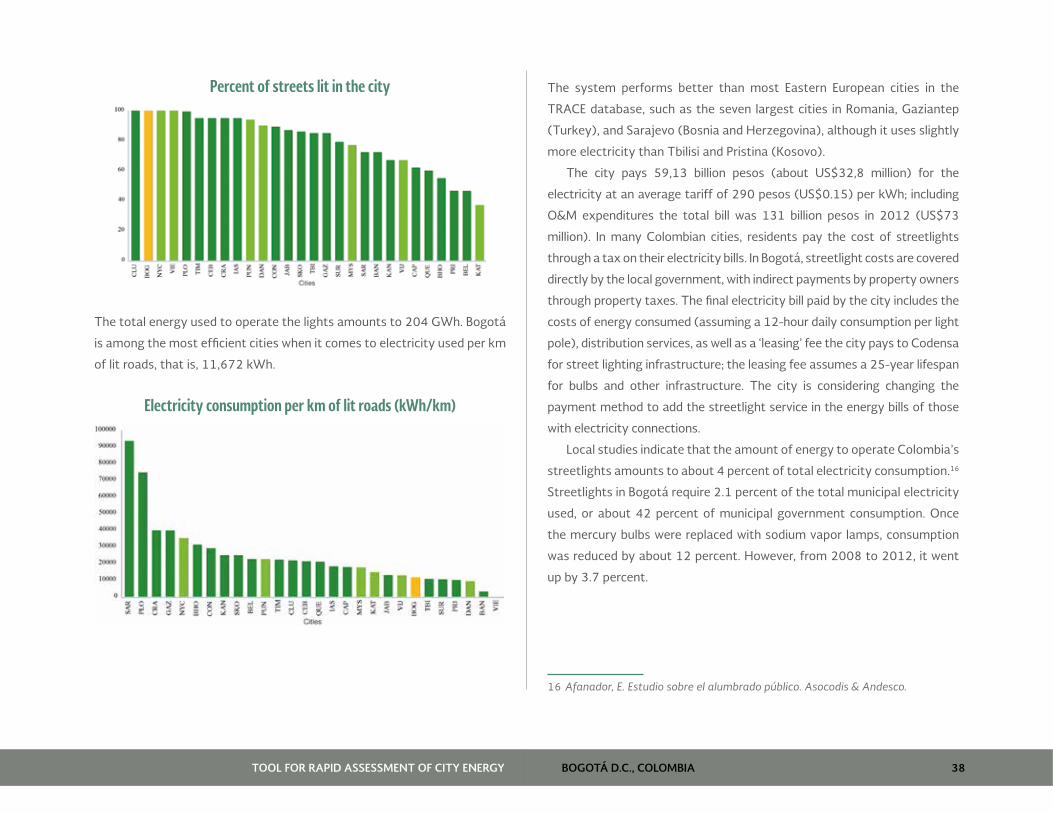
BOGOTÁ D.C., COLOMBIA 38TOOL FOR RAPID ASSESSMENT OF CITY ENERGY
Percent of streets lit in the city
The total energy used to operate the lights amounts to 204 GWh. Bogotá
is among the most efficient cities when it comes to electricity used per km
of lit roads, that is, 11,672 kWh.
Electricity consumption per km of lit roads (kWh/km)
The system performs better than most Eastern European cities in the
TRACE database, such as the seven largest cities in Romania, Gaziantep
(Turkey), and Sarajevo (Bosnia and Herzegovina), although it uses slightly
more electricity than Tbilisi and Pristina (Kosovo).
The city pays 59,13 billion pesos (about US$32,8 million) for the
electricity at an average tariff of 290 pesos (US$0.15) per kWh; including
O&M expenditures the total bill was 131 billion pesos in 2012 (US$73
million). In many Colombian cities, residents pay the cost of streetlights
through a tax on their electricity bills. In Bogotá, streetlight costs are covered
directly by the local government, with indirect payments by property owners
through property taxes. The final electricity bill paid by the city includes the
costs of energy consumed (assuming a 12-hour daily consumption per light
pole), distribution services, as well as a ‘leasing’ fee the city pays to Codensa
for street lighting infrastructure; the leasing fee assumes a 25-year lifespan
for bulbs and other infrastructure. The city is considering changing the
payment method to add the streetlight service in the energy bills of those
with electricity connections.
Local studies indicate that the amount of energy to operate Colombia’s
streetlights amounts to about 4 percent of total electricity consumption.16
Streetlights in Bogotá require 2.1 percent of the total municipal electricity
used, or about 42 percent of municipal government consumption. Once
the mercury bulbs were replaced with sodium vapor lamps, consumption
was reduced by about 12 percent. However, from 2008 to 2012, it went
up by 3.7 percent.
16 Afanador, E. Estudio sobre el alumbrado público. Asocodis & Andesco.
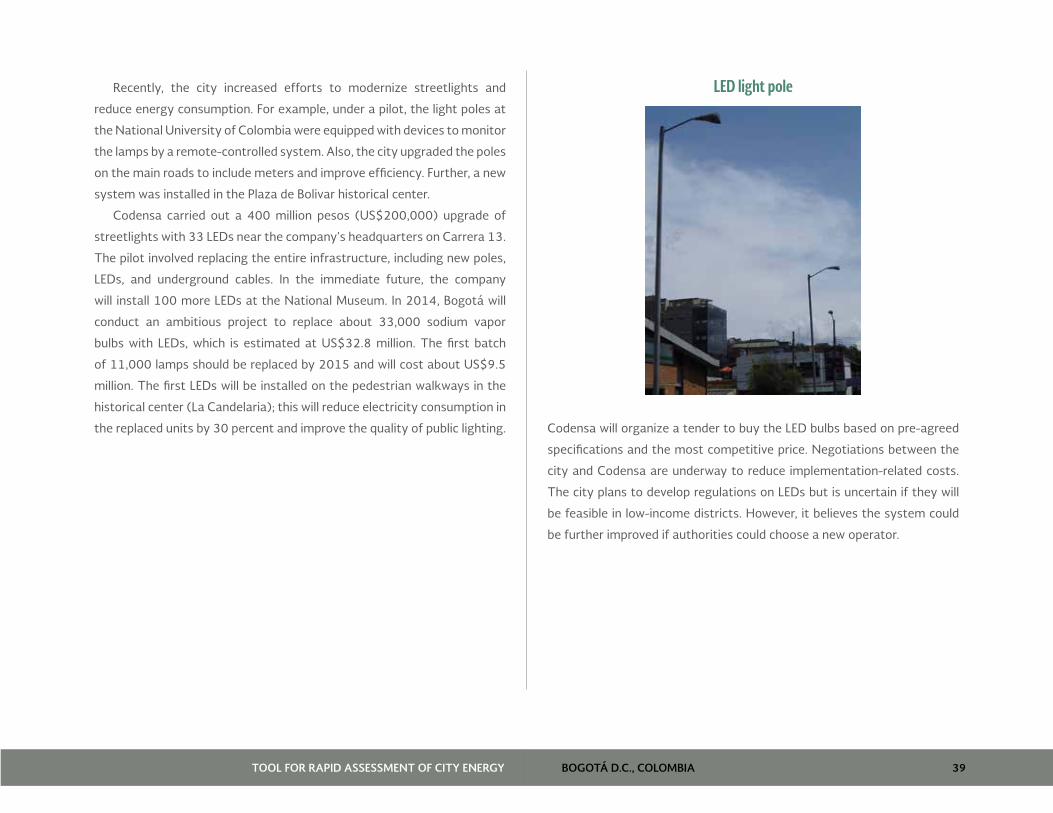
BOGOTÁ D.C., COLOMBIA 39TOOL FOR RAPID ASSESSMENT OF CITY ENERGY
Recently, the city increased efforts to modernize streetlights and
reduce energy consumption. For example, under a pilot, the light poles at
the National University of Colombia were equipped with devices to monitor
the lamps by a remote-controlled system. Also, the city upgraded the poles
on the main roads to include meters and improve efficiency. Further, a new
system was installed in the Plaza de Bolivar historical center.
Codensa carried out a 400 million pesos (US$200,000) upgrade of
streetlights with 33 LEDs near the company’s headquarters on Carrera 13.
The pilot involved replacing the entire infrastructure, including new poles,
LEDs, and underground cables. In the immediate future, the company
will install 100 more LEDs at the National Museum. In 2014, Bogotá will
conduct an ambitious project to replace about 33,000 sodium vapor
bulbs with LEDs, which is estimated at US$32.8 million. The first batch
of 11,000 lamps should be replaced by 2015 and will cost about US$9.5
million. The first LEDs will be installed on the pedestrian walkways in the
historical center (La Candelaria); this will reduce electricity consumption in
the replaced units by 30 percent and improve the quality of public lighting.
LED light pole
Codensa will organize a tender to buy the LED bulbs based on pre-agreed
specifications and the most competitive price. Negotiations between the
city and Codensa are underway to reduce implementation-related costs.
The city plans to develop regulations on LEDs but is uncertain if they will
be feasible in low-income districts. However, it believes the system could
be further improved if authorities could choose a new operator.

BOGOTÁ D.C., COLOMBIA 40TOOL FOR RAPID ASSESSMENT OF CITY ENERGY
WATER SECTOR
The water sector is managed by Empresa de Acueducto Y Alcantarillado
de Bogotá, known as EAAB, a city public utility company. The company
is in charge of producing, treating, and distributing water and providing
wastewater services. The water supply system includes water reservoirs,
pumps, distribution networks, treatment, and storage facilities. The
company is outsourcing maintenance to third parties. Currently, EAAB
supplies nearly 100 percent of Bogotá with potable drinking water on
a continuous basis to over 1.8 million water connections in residential,
industrial, and commercial areas. The company provides sewerage services
to 99.2 percent of the city, covering nearly 1.8 million clients.
Most of the water supplied to Bogotá comes from above-ground
sources—from the Rio Bogotá and Chingaza system located at high
altitudes. In 1972, EAAB began an inter-basin transfer project from the
Chingaza basin to Bogotá to meet the needs of the city’s rapidly growing
population. The program was completed in 1997 and consists of two
reservoirs (Chuza and San Rafael), the Francisco Wiesner treatment plant,
and tunnels to transport raw and treated water. Today, the system is one
of the great water engineering projects of Latin America.
To provide power to its different facilities, EAAB has developed three
small hydro power plants with a total installed capacity of 20 MW. A
new plant of 20 MW is in the pipeline. In general, energy consumption for
pumping is relatively low as much of the water flows through a gravitational
system to the pumping facilities.
The water system operates with 57 water tanks, with a total storage
capacity of 572,000 m3, and 33 pumps with an overall capacity of 30
GWh per year. There are also 34 km of transmission pipes and 477 km of
distribution pipes. In addition, the system has several tunnels that carry
water from the rivers to the treatment plants. There are eight reservoirs,
with a total capacity of 1,238 million m3. The largest network of three
reservoirs belongs to the Tibitoc River basin, north of Bogotá, with a total
of 894 million m3. The Chingaza water system includes two reservoirs that
can store up to 332 million m3. Finally, the smallest network is La Regadera,
south of Bogotá, with a capacity of 12.4 million m3.
Water supply system in Bogotá
Source: Alcaldia de Bogotá.
EAAB manages four treatment plants with a total capacity of 26 m3/s.
The largest facility is Wiesner, part of the Chingaza system. The plant can
supply 70 percent of the water required in Bogotá at 14 m3/s. Usually, the
facility supplies the city for nine months a year. However, when the water
transmission tunnel is undergoing maintenance (about three months a
year), the plant pumps water from the San Rafael Dam.
The second largest facility with a treatment capacity of 10.5 m3/s,
Tibitoc is responsible for 28 percent of the city’s water supply. Tibitoc
was constructed upstream of the city on the Rio Bogotá in 1959, with a
capacity of 3.5 m3/s and later was upgraded to 5 m3/s. Finally, La Regadera
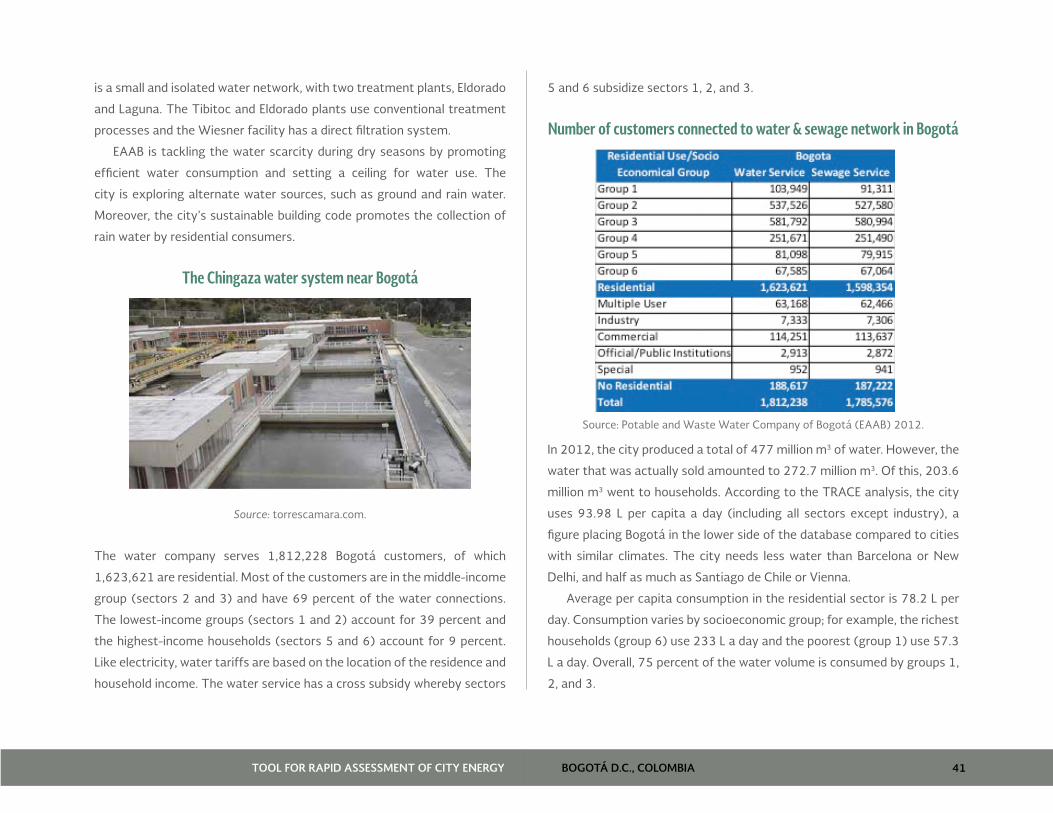
BOGOTÁ D.C., COLOMBIA 41TOOL FOR RAPID ASSESSMENT OF CITY ENERGY
is a small and isolated water network, with two treatment plants, Eldorado
and Laguna. The Tibitoc and Eldorado plants use conventional treatment
processes and the Wiesner facility has a direct filtration system.
EAAB is tackling the water scarcity during dry seasons by promoting
efficient water consumption and setting a ceiling for water use. The
city is exploring alternate water sources, such as ground and rain water.
Moreover, the city’s sustainable building code promotes the collection of
rain water by residential consumers.
The Chingaza water system near Bogotá
Source: torrescamara.com.
The water company serves 1,812,228 Bogotá customers, of which
1,623,621 are residential. Most of the customers are in the middle-income
group (sectors 2 and 3) and have 69 percent of the water connections.
The lowest-income groups (sectors 1 and 2) account for 39 percent and
the highest-income households (sectors 5 and 6) account for 9 percent.
Like electricity, water tariffs are based on the location of the residence and
household income. The water service has a cross subsidy whereby sectors
5 and 6 subsidize sectors 1, 2, and 3.
Number of customers connected to water & sewage network in Bogotá
Source: Potable and Waste Water Company of Bogotá (EAAB) 2012.
In 2012, the city produced a total of 477 million m3 of water. However, the
water that was actually sold amounted to 272.7 million m3. Of this, 203.6
million m3 went to households. According to the TRACE analysis, the city
uses 93.98 L per capita a day (including all sectors except industry), a
figure placing Bogotá in the lower side of the database compared to cities
with similar climates. The city needs less water than Barcelona or New
Delhi, and half as much as Santiago de Chile or Vienna.
Average per capita consumption in the residential sector is 78.2 L per
day. Consumption varies by socioeconomic group; for example, the richest
households (group 6) use 233 L a day and the poorest (group 1) use 57.3
L a day. Overall, 75 percent of the water volume is consumed by groups 1,
2, and 3.
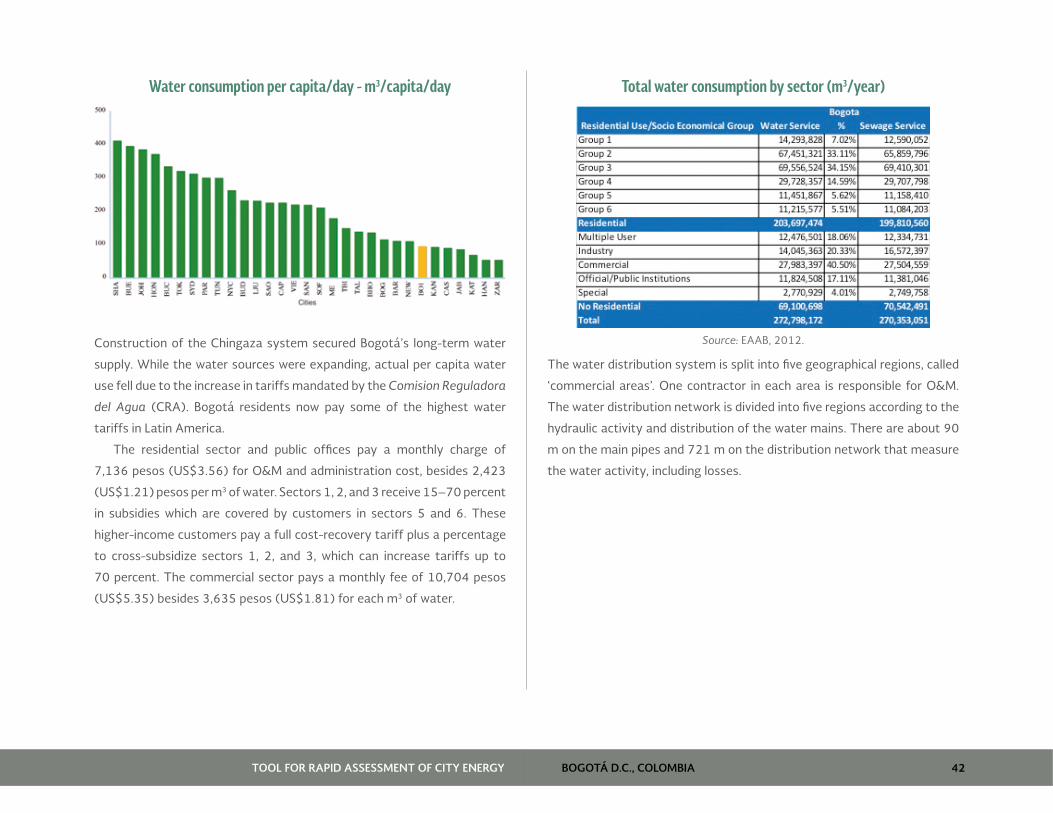
BOGOTÁ D.C., COLOMBIA 42TOOL FOR RAPID ASSESSMENT OF CITY ENERGY
Water consumption per capita/day - m3/capita/day
Construction of the Chingaza system secured Bogotá’s long-term water
supply. While the water sources were expanding, actual per capita water
use fell due to the increase in tariffs mandated by the Comision Reguladora
del Agua (CRA). Bogotá residents now pay some of the highest water
tariffs in Latin America.
The residential sector and public offices pay a monthly charge of
7,136 pesos (US$3.56) for O&M and administration cost, besides 2,423
(US$1.21) pesos per m3 of water. Sectors 1, 2, and 3 receive 15–70 percent
in subsidies which are covered by customers in sectors 5 and 6. These
higher-income customers pay a full cost-recovery tariff plus a percentage
to cross-subsidize sectors 1, 2, and 3, which can increase tariffs up to
70 percent. The commercial sector pays a monthly fee of 10,704 pesos
(US$5.35) besides 3,635 pesos (US$1.81) for each m3 of water.
Total water consumption by sector (m3/year)
Source: EAAB, 2012.
The water distribution system is split into five geographical regions, called
‘commercial areas’. One contractor in each area is responsible for O&M.
The water distribution network is divided into five regions according to the
hydraulic activity and distribution of the water mains. There are about 90
m on the main pipes and 721 m on the distribution network that measure
the water activity, including losses.
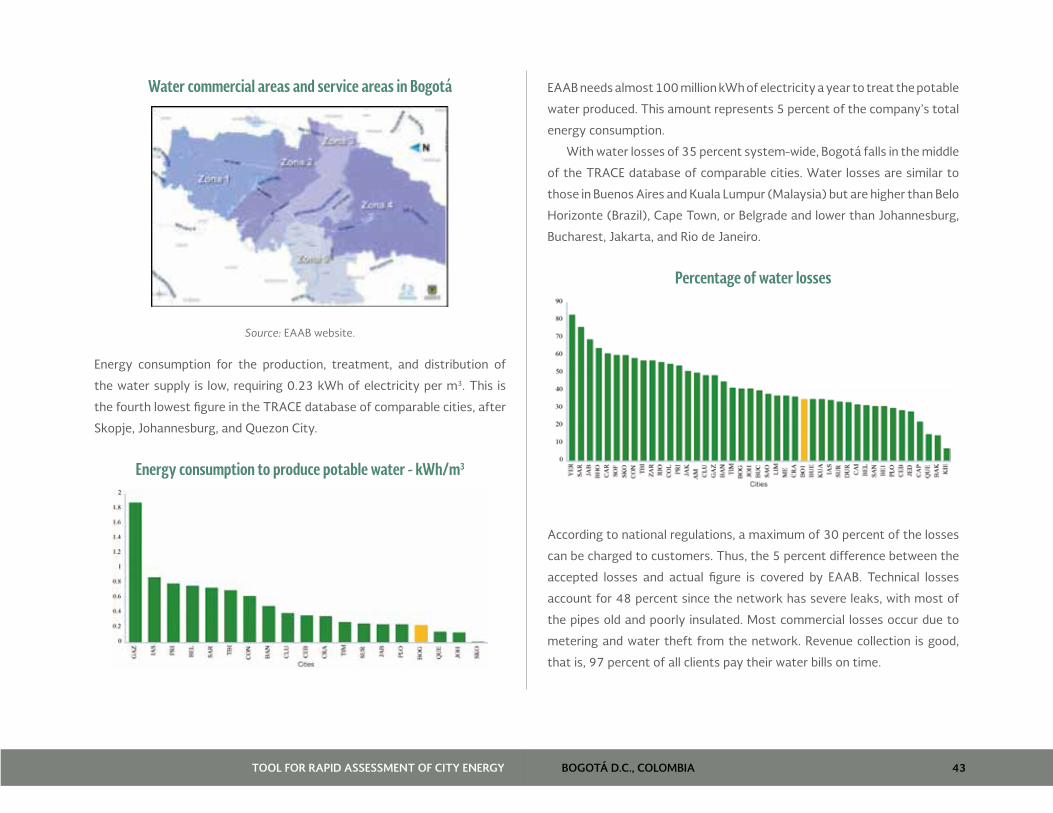
BOGOTÁ D.C., COLOMBIA 43TOOL FOR RAPID ASSESSMENT OF CITY ENERGY
Water commercial areas and service areas in Bogotá
Source: EAAB website.
Energy consumption for the production, treatment, and distribution of
the water supply is low, requiring 0.23 kWh of electricity per m3. This is
the fourth lowest figure in the TRACE database of comparable cities, after
Skopje, Johannesburg, and Quezon City.
Energy consumption to produce potable water - kWh/m3
EAAB needs almost 100 million kWh of electricity a year to treat the potable
water produced. This amount represents 5 percent of the company’s total
energy consumption.
With water losses of 35 percent system-wide, Bogotá falls in the middle
of the TRACE database of comparable cities. Water losses are similar to
those in Buenos Aires and Kuala Lumpur (Malaysia) but are higher than Belo
Horizonte (Brazil), Cape Town, or Belgrade and lower than Johannesburg,
Bucharest, Jakarta, and Rio de Janeiro.
Percentage of water losses
According to national regulations, a maximum of 30 percent of the losses
can be charged to customers. Thus, the 5 percent difference between the
accepted losses and actual figure is covered by EAAB. Technical losses
account for 48 percent since the network has severe leaks, with most of
the pipes old and poorly insulated. Most commercial losses occur due to
metering and water theft from the network. Revenue collection is good,
that is, 97 percent of all clients pay their water bills on time.

BOGOTÁ D.C., COLOMBIA 44TOOL FOR RAPID ASSESSMENT OF CITY ENERGY
EAAB has been replacing the water pumps and performing better
maintenance so as to reduce water and energy losses. Most of the high,
energy-intensive pumps supply water to the hilly areas of the city. From
2011 to 2013, the city reduced the electricity used for pumping by 9
percent. EAAB is also planning to expand the network and gradually
increase the maximum capacity of water production, from 26 m3/s to 38
m3/s by 2047.17
17 EAAB Master plan available at www.acueducto.com.co/wpsv61/wps/html/resources/empresa/PPLANMAESTRO300409.pps

BOGOTÁ D.C., COLOMBIA 45TOOL FOR RAPID ASSESSMENT OF CITY ENERGY
WASTEWATER
EAAB also operates the wastewater system. Currently, the city has only
one wastewater plant though some local industries treat their own sewage.
Only 25 percent of the wastewater is treated; the rest is discharged into
the Bogotá River through canals and wetlands.
EAAB has carried out some initiatives to separate rainwater from
wastewater so that the latter can be properly treated before sending it to
water bodies. It is cheaper to have a combined rainwater and wastewater
system, but such a system is not conducive to effective wastewater
treatment. Currently, Bogotá has a network of rainwater and wastewater
pipes that drain into the Bogotá River. The wastewater is discharged into
a few small rivers—the Fucha, Tunjuelo, and Salitre (or Juan Amarillo
River)—which are highly polluted, and from there drains into the Bogotá
River. Accordingly, the Bogotá River has become highly polluted, posing
environmental and health risks.
The first section of the Salitre wastewater treatment plant that was
built in 2000 has the capacity for primary treatment at 4 m3/s. The plant
serves two million people in Northern Bogotá. There are 1,785,576 sewage
connections in the city, of which nearly 1,600,000 are in the residential
sector.
The sludge collected by the sewage treatment plant is used to produce
350,000 m3 of biogas each month. Most of this is used to heat water and
operate the plant’s anaerobic digesters. The bio-solids dehydration process
can generate 165 tons/day of organic materials that are transported and
used as the topsoil of the El Corzo , a EAAB owned land, which is in the
suburbs of the city.
The four small rivers crossing Bogotá
Source: Blog del Plan de Ordenamiento y Manejo de Cuencas POMCA.
In 2012, 167.9 million m3 of wastewater was treated, which required 13.9
million kWh of electricity. Considering the limited amount of wastewater
that is treated (25 percent), the data on electricity consumption may
not accurately reflect per capita energy consumption per m3. Currently,
it provides a low estimate of 0.052 kWh per m3 which would be the most
efficient in the TRACE database. When the new treatment facility is
completed in 2018, the city will be able to treat more wastewater, which
will require more energy. Estimates indicate that in the coming years,
Bogotá will need about 0.3 kWh to treat 1 m3 of wastewater, comparable
to cities in Eastern Europe or Johannesburg. In 2012, the overall energy
expenditure for potable and wastewater was about 26 billion pesos or
US$14.3 million (US$12,4 million in Potable water and US$1,9 in Waste
water).

BOGOTÁ D.C., COLOMBIA 46TOOL FOR RAPID ASSESSMENT OF CITY ENERGY
Expected energy consumption for wastewater treatment - kWh/m3
The residential sector and public offices pay a monthly flat fee of 3,636
pesos (US$1.81) in addition to 1,559 pesos (US$0.77) per m3 of water.
Industries’ flat fee is 4,763 pesos (US$2.38) in addition to 2,229 pesos
(US$1.11) per m3 of wastewater, and commercial clients pay a monthly
flat fee of 5,452 pesos (US$2.72) plus 2,338 pesos (US$1.16) per m3.
The wastewater sector uses the same cross-subsidy as the water sector.
Since 2004, the city has tried to reduce the pollution flowing into the
Bogotá River under a plan to the year 2020.18 The program is being carried
out along with the environmental agency and other stakeholders.
18 National Development Plan COMPES 3177 – July 15, 2002
Only 25 percent of wastewater is treated in Bogotá
Under the National Environment Ministry (MADS) plan, sanitation
companies are to prepare wastewater management schemes for all cities
along the Bogotá River. A special fund for the Bogotá River basin receives 7.5
percent of the property taxes collected. With loans from international or
multilateral banks and money from the local budget, Bogotá has expanded
the wastewater system by developing underground collection pipes, along
with building a new section of the Salitre plant and new pumping stations.
EAAB and the regional environmental agency (Corporacion
Autonoma Regional, CAR) are carrying out a US$1.5 billion program
to improve conditions in the Bogotá River. The water company is
building large interceptors to convey wastewater to Canoas and
has begun designing a primary treatment plant. CAR has launched
a US$487 million Rio Bogotá Environmental Recuperation and
Flood Control Project with co-financing of US$250 million from the
World Bank. The goal is to transform 68 km of the Bogotá River into
an environmental asset for the metropolitan region by improving

BOGOTÁ D.C., COLOMBIA 47TOOL FOR RAPID ASSESSMENT OF CITY ENERGY
water quality, reducing the risk of floods, restoring riparian habitats,
and creating multifunctional areas that will provide an ecological
habitat, as well as opportunities for public use.
Wastewater treatment facility in Bogotá
The expansion of the Salitre wastewater treatment plant should be
completed in 2018, at a cost of US$390 million. After this, the treatment
capacity would rise from 4 m3/s to 8 m3/s. The treatment will also be
upgraded, from primary to secondary levels with activated sludge, which
will require more energy. Further, construction of a new treatment facility,
Canoas PTAR, is expected to begin in 2015. When the projects are
complete, the wastewater treated should increase from 25–30 percent
to 100 percent and the quality should improve. Salitre will treat about
one-third of the raw wastewater, and the new Canoas facility based on
activated sludge, will treat the remaining two-thirds.
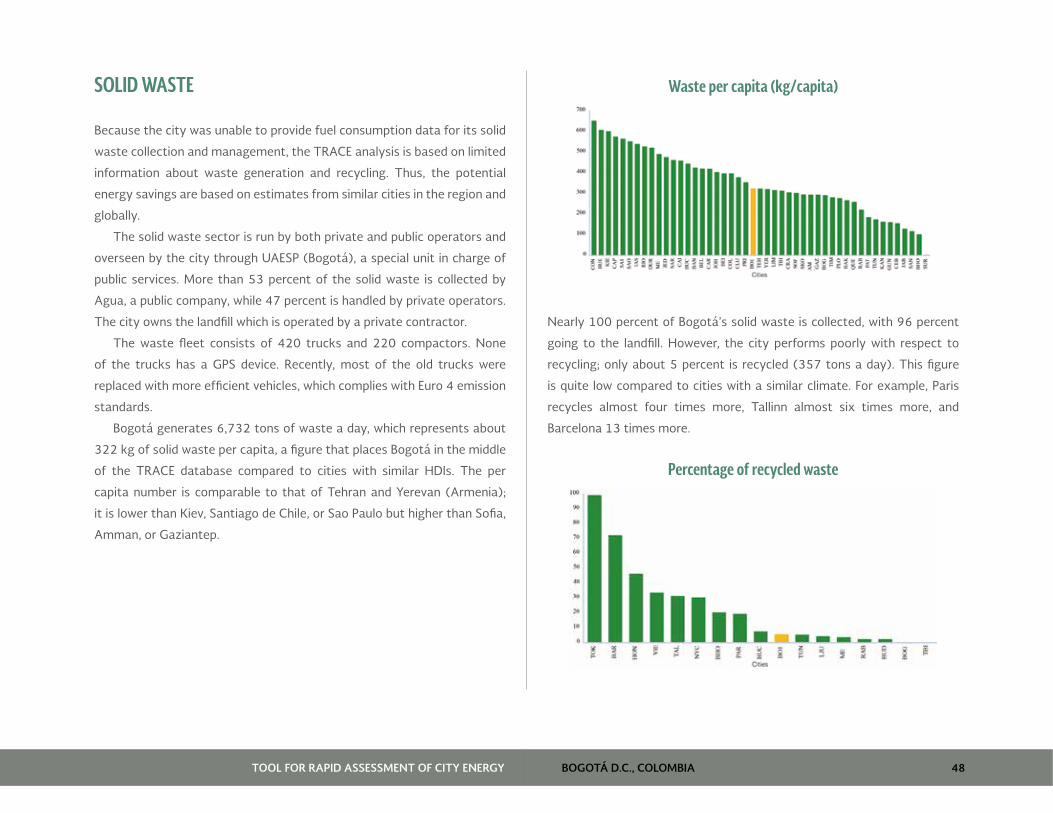
BOGOTÁ D.C., COLOMBIA 48TOOL FOR RAPID ASSESSMENT OF CITY ENERGY
SOLID WASTE
Because the city was unable to provide fuel consumption data for its solid
waste collection and management, the TRACE analysis is based on limited
information about waste generation and recycling. Thus, the potential
energy savings are based on estimates from similar cities in the region and
globally.
The solid waste sector is run by both private and public operators and
overseen by the city through UAESP (Bogotá), a special unit in charge of
public services. More than 53 percent of the solid waste is collected by
Agua, a public company, while 47 percent is handled by private operators.
The city owns the landfill which is operated by a private contractor.
The waste fleet consists of 420 trucks and 220 compactors. None
of the trucks has a GPS device. Recently, most of the old trucks were
replaced with more efficient vehicles, which complies with Euro 4 emission
standards.
Bogotá generates 6,732 tons of waste a day, which represents about
322 kg of solid waste per capita, a figure that places Bogotá in the middle
of the TRACE database compared to cities with similar HDIs. The per
capita number is comparable to that of Tehran and Yerevan (Armenia);
it is lower than Kiev, Santiago de Chile, or Sao Paulo but higher than Sofia,
Amman, or Gaziantep.
Waste per capita (kg/capita)
Nearly 100 percent of Bogotá’s solid waste is collected, with 96 percent
going to the landfill. However, the city performs poorly with respect to
recycling; only about 5 percent is recycled (357 tons a day). This figure
is quite low compared to cities with a similar climate. For example, Paris
recycles almost four times more, Tallinn almost six times more, and
Barcelona 13 times more.
Percentage of recycled waste
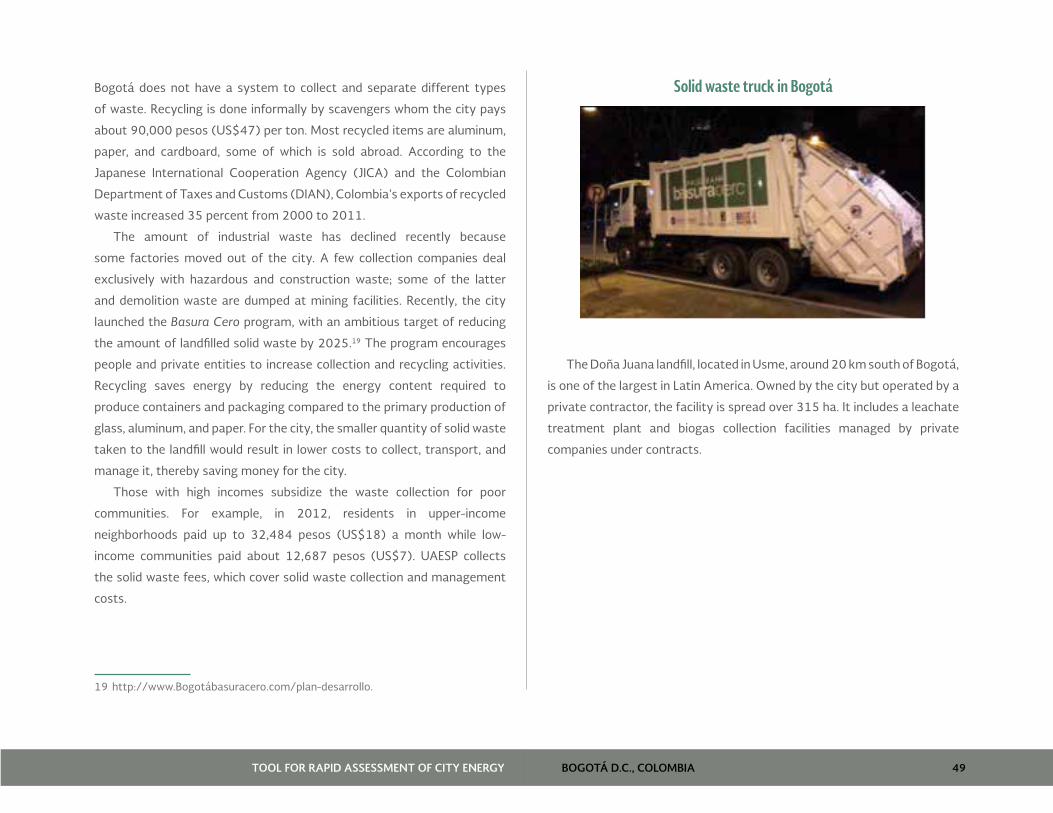
BOGOTÁ D.C., COLOMBIA 49TOOL FOR RAPID ASSESSMENT OF CITY ENERGY
Bogotá does not have a system to collect and separate different types
of waste. Recycling is done informally by scavengers whom the city pays
about 90,000 pesos (US$47) per ton. Most recycled items are aluminum,
paper, and cardboard, some of which is sold abroad. According to the
Japanese International Cooperation Agency (JICA) and the Colombian
Department of Taxes and Customs (DIAN), Colombia’s exports of recycled
waste increased 35 percent from 2000 to 2011.
The amount of industrial waste has declined recently because
some factories moved out of the city. A few collection companies deal
exclusively with hazardous and construction waste; some of the latter
and demolition waste are dumped at mining facilities. Recently, the city
launched the Basura Cero program, with an ambitious target of reducing
the amount of landfilled solid waste by 2025.19 The program encourages
people and private entities to increase collection and recycling activities.
Recycling saves energy by reducing the energy content required to
produce containers and packaging compared to the primary production of
glass, aluminum, and paper. For the city, the smaller quantity of solid waste
taken to the landfill would result in lower costs to collect, transport, and
manage it, thereby saving money for the city.
Those with high incomes subsidize the waste collection for poor
communities. For example, in 2012, residents in upper-income
neighborhoods paid up to 32,484 pesos (US$18) a month while low-
income communities paid about 12,687 pesos (US$7). UAESP collects
the solid waste fees, which cover solid waste collection and management
costs.
19 http://www.Bogotábasuracero.com/plan-desarrollo.
Solid waste truck in Bogotá
The Doña Juana landfill, located in Usme, around 20 km south of Bogotá,
is one of the largest in Latin America. Owned by the city but operated by a
private contractor, the facility is spread over 315 ha. It includes a leachate
treatment plant and biogas collection facilities managed by private
companies under contracts.
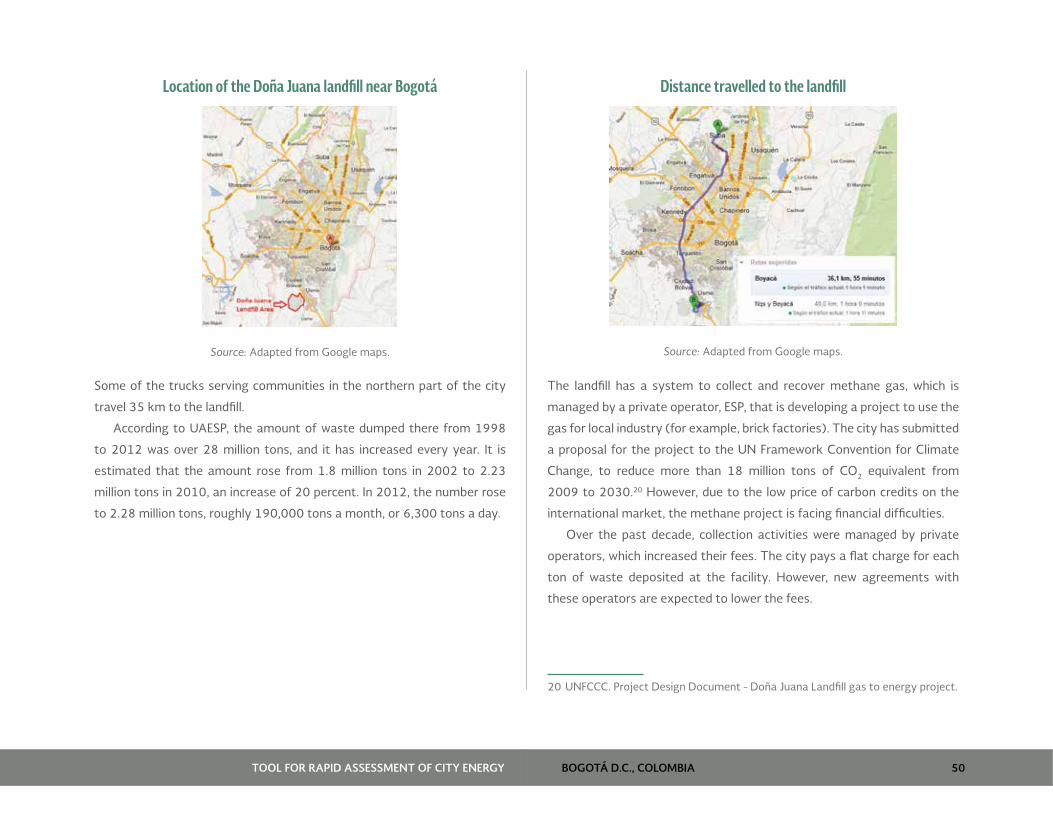
BOGOTÁ D.C., COLOMBIA 50TOOL FOR RAPID ASSESSMENT OF CITY ENERGY
Location of the Doña Juana landfill near Bogotá
Source: Adapted from Google maps.
Some of the trucks serving communities in the northern part of the city
travel 35 km to the landfill.
According to UAESP, the amount of waste dumped there from 1998
to 2012 was over 28 million tons, and it has increased every year. It is
estimated that the amount rose from 1.8 million tons in 2002 to 2.23
million tons in 2010, an increase of 20 percent. In 2012, the number rose
to 2.28 million tons, roughly 190,000 tons a month, or 6,300 tons a day.
Distance travelled to the landfill
Source: Adapted from Google maps.
The landfill has a system to collect and recover methane gas, which is
managed by a private operator, ESP, that is developing a project to use the
gas for local industry (for example, brick factories). The city has submitted
a proposal for the project to the UN Framework Convention for Climate
Change, to reduce more than 18 million tons of CO2 equivalent from
2009 to 2030.20 However, due to the low price of carbon credits on the
international market, the methane project is facing financial difficulties.
Over the past decade, collection activities were managed by private
operators, which increased their fees. The city pays a flat charge for each
ton of waste deposited at the facility. However, new agreements with
these operators are expected to lower the fees.
20 UNFCCC. Project Design Document - Doña Juana Landfill gas to energy project.
BOGOTÁ D.C., COLOMBIA 51TOOL FOR RAPID ASSESSMENT OF CITY ENERGY
Although the city could not provide data on fuel consumption for
solid waste collection/management, the TRACE team identified potential
savings. For example, Bogotá could save substantial amounts of money
by insisting that the companies hauling solid waste use alternative routes
that would lower fuel use per ton of waste collected and transported.
The city plans to review the current solid waste collection system and is
considering three options: (1) keep the status quo (with public and private
operators); (2) organize the collection system under a public company; or
(3) open the process to competition between private and public entities.
Also, the city wants to formalize the collection of waste to be recycled
(with ‘informal’ scavengers) and is evaluating options for making the
separation of types of waste mandatory for households. It is also thinking
of developing a pilot to establish a composting facility together with the
farmers’ market.
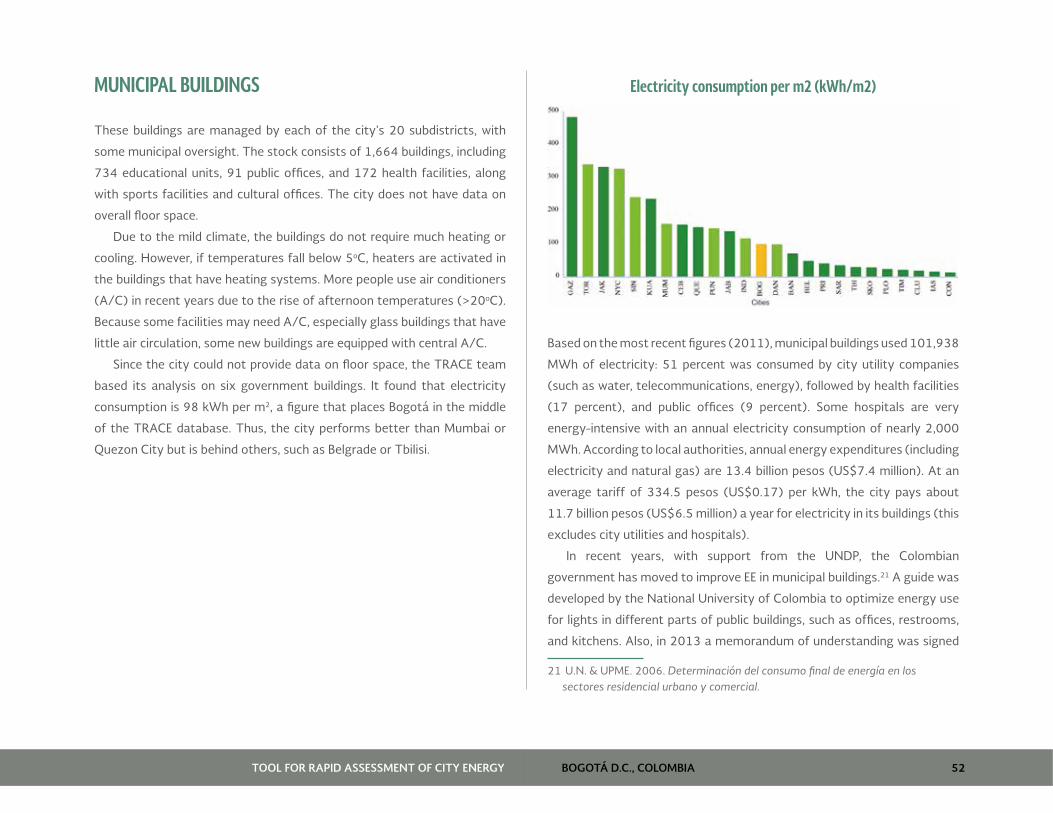
BOGOTÁ D.C., COLOMBIA 52TOOL FOR RAPID ASSESSMENT OF CITY ENERGY
MUNICIPAL BUILDINGS
These buildings are managed by each of the city’s 20 subdistricts, with
some municipal oversight. The stock consists of 1,664 buildings, including
734 educational units, 91 public offices, and 172 health facilities, along
with sports facilities and cultural offices. The city does not have data on
overall floor space.
Due to the mild climate, the buildings do not require much heating or
cooling. However, if temperatures fall below 5oC, heaters are activated in
the buildings that have heating systems. More people use air conditioners
(A/C) in recent years due to the rise of afternoon temperatures (>20oC).
Because some facilities may need A/C, especially glass buildings that have
little air circulation, some new buildings are equipped with central A/C.
Since the city could not provide data on floor space, the TRACE team
based its analysis on six government buildings. It found that electricity
consumption is 98 kWh per m2, a figure that places Bogotá in the middle
of the TRACE database. Thus, the city performs better than Mumbai or
Quezon City but is behind others, such as Belgrade or Tbilisi.
Electricity consumption per m2 (kWh/m2)
Based on the most recent figures (2011), municipal buildings used 101,938
MWh of electricity: 51 percent was consumed by city utility companies
(such as water, telecommunications, energy), followed by health facilities
(17 percent), and public offices (9 percent). Some hospitals are very
energy-intensive with an annual electricity consumption of nearly 2,000
MWh. According to local authorities, annual energy expenditures (including
electricity and natural gas) are 13.4 billion pesos (US$7.4 million). At an
average tariff of 334.5 pesos (US$0.17) per kWh, the city pays about
11.7 billion pesos (US$6.5 million) a year for electricity in its buildings (this
excludes city utilities and hospitals).
In recent years, with support from the UNDP, the Colombian
government has moved to improve EE in municipal buildings.21 A guide was
developed by the National University of Colombia to optimize energy use
for lights in different parts of public buildings, such as offices, restrooms,
and kitchens. Also, in 2013 a memorandum of understanding was signed
21 U.N. & UPME. 2006. Determinación del consumo final de energía en los sectores residencial urbano y comercial.
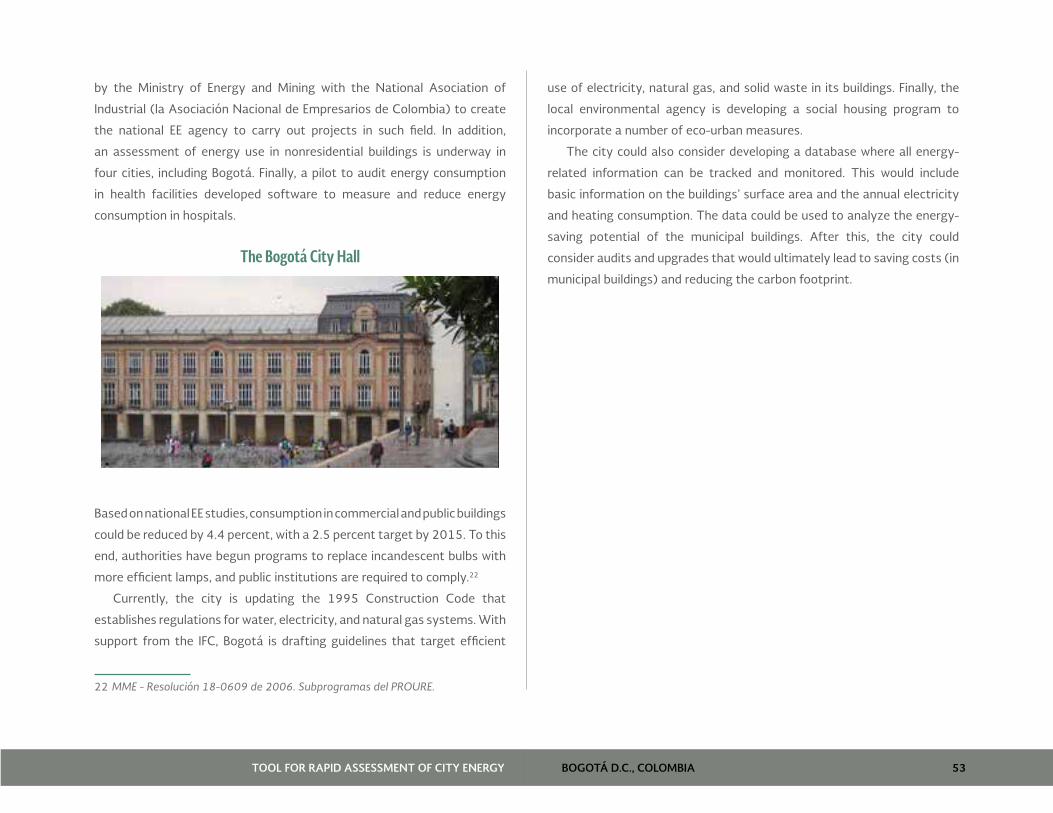
BOGOTÁ D.C., COLOMBIA 53TOOL FOR RAPID ASSESSMENT OF CITY ENERGY
by the Ministry of Energy and Mining with the National Asociation of
Industrial (la Asociación Nacional de Empresarios de Colombia) to create
the national EE agency to carry out projects in such field. In addition,
an assessment of energy use in nonresidential buildings is underway in
four cities, including Bogotá. Finally, a pilot to audit energy consumption
in health facilities developed software to measure and reduce energy
consumption in hospitals.
The Bogotá City Hall
Based on national EE studies, consumption in commercial and public buildings
could be reduced by 4.4 percent, with a 2.5 percent target by 2015. To this
end, authorities have begun programs to replace incandescent bulbs with
more efficient lamps, and public institutions are required to comply.22
Currently, the city is updating the 1995 Construction Code that
establishes regulations for water, electricity, and natural gas systems. With
support from the IFC, Bogotá is drafting guidelines that target efficient
22 MME - Resolución 18-0609 de 2006. Subprogramas del PROURE.
use of electricity, natural gas, and solid waste in its buildings. Finally, the
local environmental agency is developing a social housing program to
incorporate a number of eco-urban measures.
The city could also consider developing a database where all energy-
related information can be tracked and monitored. This would include
basic information on the buildings’ surface area and the annual electricity
and heating consumption. The data could be used to analyze the energy-
saving potential of the municipal buildings. After this, the city could
consider audits and upgrades that would ultimately lead to saving costs (in
municipal buildings) and reducing the carbon footprint.

BOGOTÁ D.C., COLOMBIA 54TOOL FOR RAPID ASSESSMENT OF CITY ENERGY

BOGOTÁ D.C., COLOMBIA 55TOOL FOR RAPID ASSESSMENT OF CITY ENERGY
ENERGY EFFICIENCY RECOMMENDATIONS
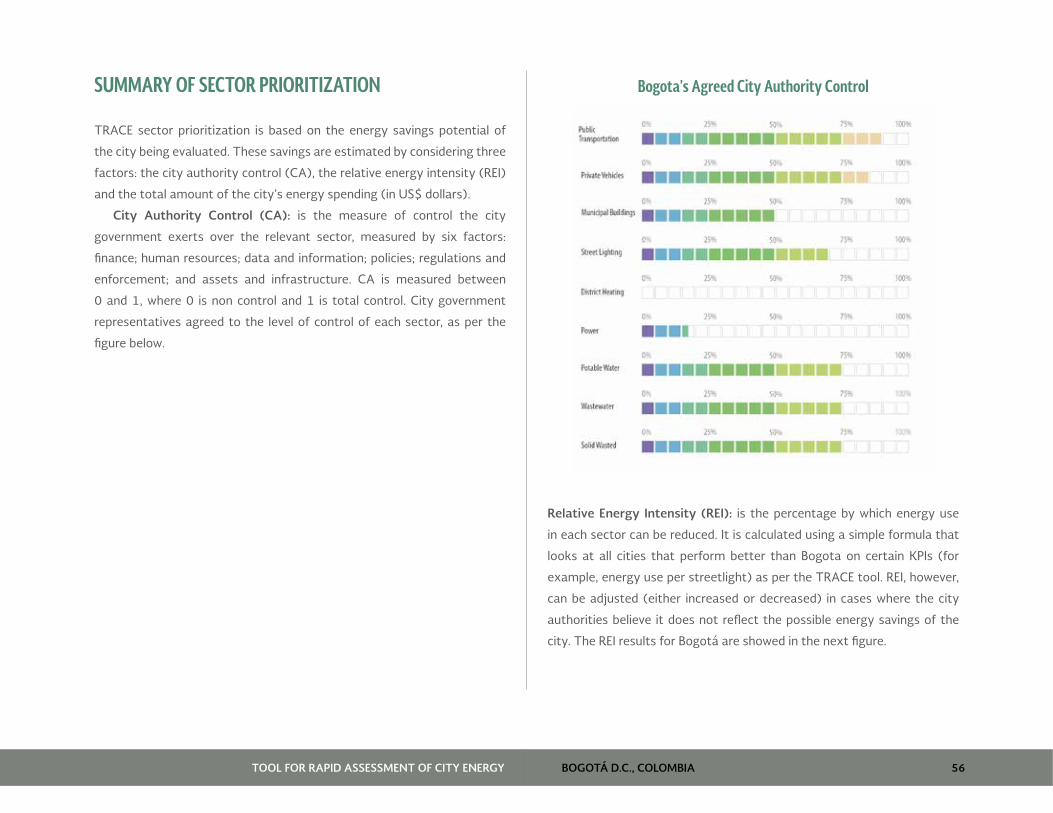
BOGOTÁ D.C., COLOMBIA 56TOOL FOR RAPID ASSESSMENT OF CITY ENERGY
SUMMARY OF SECTOR PRIORITIZATION
TRACE sector prioritization is based on the energy savings potential of
the city being evaluated. These savings are estimated by considering three
factors: the city authority control (CA), the relative energy intensity (REI)
and the total amount of the city’s energy spending (in US$ dollars).
City Authority Control (CA): is the measure of control the city
government exerts over the relevant sector, measured by six factors:
finance; human resources; data and information; policies; regulations and
enforcement; and assets and infrastructure. CA is measured between
0 and 1, where 0 is non control and 1 is total control. City government
representatives agreed to the level of control of each sector, as per the
figure below.
Bogota’s Agreed City Authority Control
Relative Energy Intensity (REI): is the percentage by which energy use
in each sector can be reduced. It is calculated using a simple formula that
looks at all cities that perform better than Bogota on certain KPIs (for
example, energy use per streetlight) as per the TRACE tool. REI, however,
can be adjusted (either increased or decreased) in cases where the city
authorities believe it does not reflect the possible energy savings of the
city. The REI results for Bogotá are showed in the next figure.
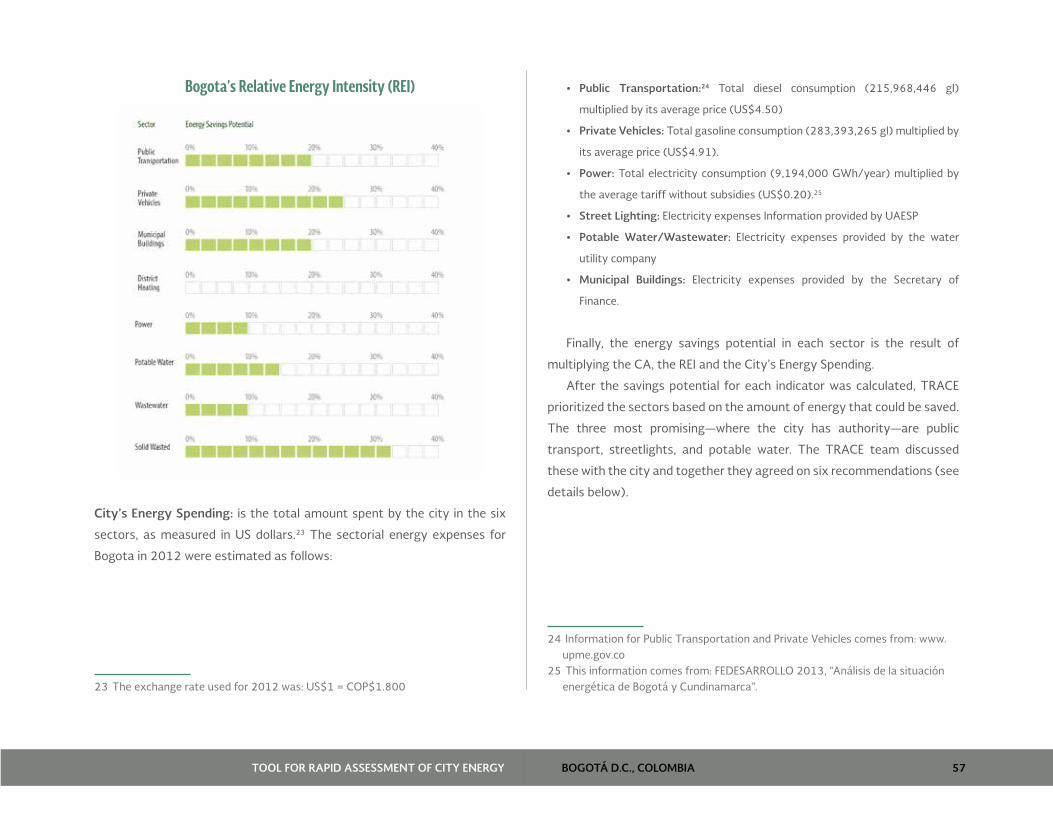
BOGOTÁ D.C., COLOMBIA 57TOOL FOR RAPID ASSESSMENT OF CITY ENERGY
Bogota’s Relative Energy Intensity (REI)
City’s Energy Spending: is the total amount spent by the city in the six
sectors, as measured in US dollars.23 The sectorial energy expenses for
Bogota in 2012 were estimated as follows:
23 The exchange rate used for 2012 was: US$1 = COP$1.800
• Public Transportation:24 Total diesel consumption (215,968,446 gl)
multiplied by its average price (US$4.50)
• Private Vehicles: Total gasoline consumption (283,393,265 gl) multiplied by
its average price (US$4.91).
• Power: Total electricity consumption (9,194,000 GWh/year) multiplied by
the average tariff without subsidies (US$0.20).25
• Street Lighting: Electricity expenses Information provided by UAESP
• Potable Water/Wastewater: Electricity expenses provided by the water
utility company
• Municipal Buildings: Electricity expenses provided by the Secretary of
Finance.
Finally, the energy savings potential in each sector is the result of
multiplying the CA, the REI and the City’s Energy Spending.
After the savings potential for each indicator was calculated, TRACE
prioritized the sectors based on the amount of energy that could be saved.
The three most promising—where the city has authority—are public
transport, streetlights, and potable water. The TRACE team discussed
these with the city and together they agreed on six recommendations (see
details below).
24 Information for Public Transportation and Private Vehicles comes from: www.upme.gov.co
25 This information comes from: FEDESARROLLO 2013, “Análisis de la situación energética de Bogotá y Cundinamarca”.
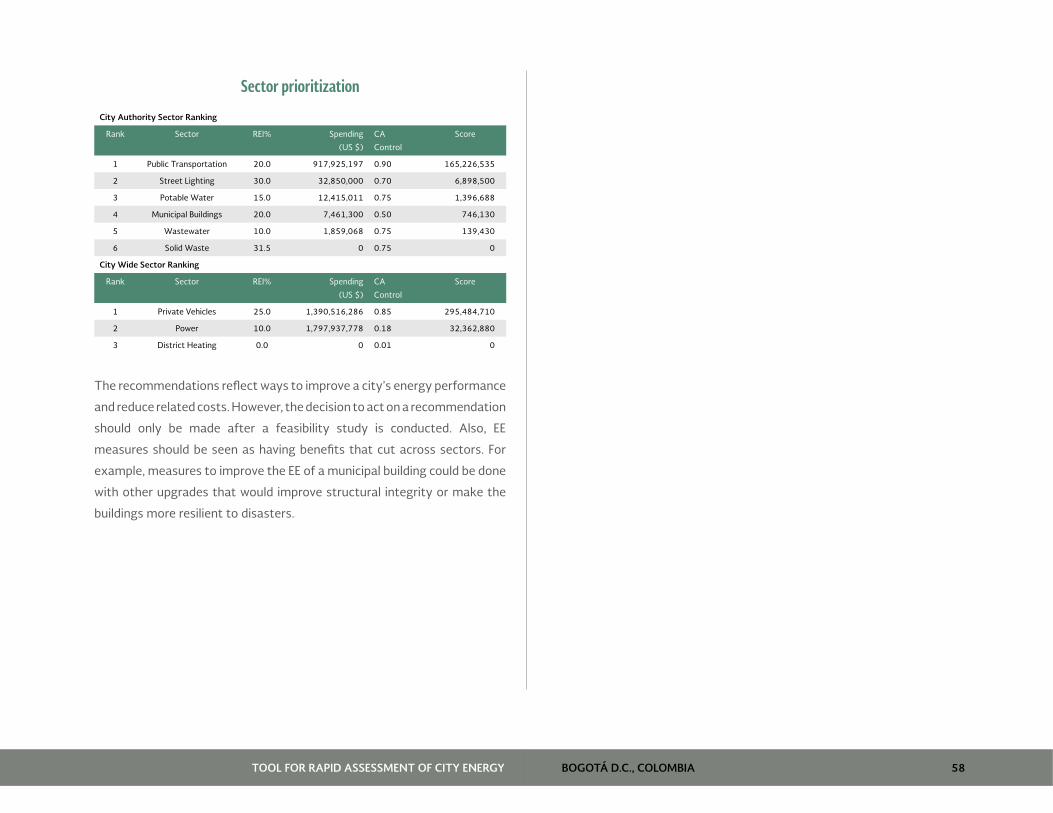
BOGOTÁ D.C., COLOMBIA 58TOOL FOR RAPID ASSESSMENT OF CITY ENERGY
Sector prioritization
City Authority Sector Ranking
Rank Sector REI% Spending
(US $)
CA
Control
Score
1 Public Transportation 20.0 917,925,197 0.90 165,226,535
2 Street Lighting 30.0 32,850,000 0.70 6,898,500
3 Potable Water 15.0 12,415,011 0.75 1,396,688
4 Municipal Buildings 20.0 7,461,300 0.50 746,130
5 Wastewater 10.0 1,859,068 0.75 139,430
6 Solid Waste 31.5 0 0.75 0
City Wide Sector Ranking
Rank Sector REI% Spending
(US $)
CA
Control
Score
1 Private Vehicles 25.0 1,390,516,286 0.85 295,484,710
2 Power 10.0 1,797,937,778 0.18 32,362,880
3 District Heating 0.0 0 0.01 0
The recommendations reflect ways to improve a city’s energy performance
and reduce related costs. However, the decision to act on a recommendation
should only be made after a feasibility study is conducted. Also, EE
measures should be seen as having benefits that cut across sectors. For
example, measures to improve the EE of a municipal building could be done
with other upgrades that would improve structural integrity or make the
buildings more resilient to disasters.

BOGOTÁ D.C., COLOMBIA 59TOOL FOR RAPID ASSESSMENT OF CITY ENERGY
STREETLIGHTS
Audits and Upgrades
Streetlights reflect the second-largest energy-saving potential. The city
already replaced the mercury public lights with more efficient sodium
vapor lamps and has now begun to replace 10 percent of those bulbs
(approximately 33,000 lamps) with efficient, environmentally friendly
LEDs.
Codensa owns most of the streetlight infrastructure and along with
the city is upgrading the system. Codensa has the financial resources to
cover the replacements. If it chooses to upgrade more than 10 percent,
it could explore other financial alternatives, such as using an energy
service company (ESCO). Through such an arrangement, the city could
likely finance the cost of replacing the bulbs with LEDs through the energy
savings of the retrofit program.
Meters are important to improve the efficiency of public lights.
However, measuring their energy use can be challenging because in some
areas, residential buildings and streetlights share the same electricity
distribution cables. Thus, the billing for streetlights from Codensa to the
city may not be based on real consumption but rather on 12-hour daily
average consumption estimates per light pole. The city could benefit from
metering streetlight consumption, although this issue needs to be further
analyzed.
Procurement Guide for New Streetlights
Bogotá could produce a procurement guide for the LED upgrades that
would ensure compliance with technical standards. The guidelines for
a new lighting technology could recommend products that deliver the
same lighting levels while using less energy and that also reduce carbon
emissions and operating costs. If the guide takes a life-cycle approach, it
could lower maintenance, costs, and interruptions to service. It is estimated
that developing a green procurement guide with a modest investment of
under US$100,000 could save 200,000 kWh in energy a year.
This recommendation builds on the city’s current plans to replace 10
percent of its sodium vapor bulbs with LEDs. Thus, the city could consider
preparing guidelines to establish rules for new infrastructure.
Ten percent of street lamps will be replaced with LED bulbs
The city could update the current manual for streetlights manual and
use international guidelines, such as those of the Illuminating Engineering
Society of North America (IESNA), which define best practices for
visibility and safety. The procurement guide needs to set clear standards
for illumination levels, the spacing of poles, and type of lamp, as well as
dimming requirements at night for all types of streets/public spaces.

BOGOTÁ D.C., COLOMBIA 60TOOL FOR RAPID ASSESSMENT OF CITY ENERGY
Streetlight Timing and Dimming
The timing and dimming of streetlights is a simple, inexpensive way to
reduce electricity use without compromising safety. Both functions save
energy and money, reducing the bulbs’ brightness at times of low road or
street use. For example, Kuala Lumpur used a timing system on a 66 km
highway which resulted in 45 percent energy savings.
TRACE estimates that an initial investment of US$100,000 over one
year could bring 100,000–200,000 kWh in energy savings.
A small antenna is plugged into the electronic ballast of the light heads
with no need for added wiring (the technology is wireless). The individual
bulb is controlled by an electronic system from a central unit that adjusts
the dimming to suit road conditions. It also tracks lamp failures and creates
a database for future reference. By dimming the lights gradually, eyes
adjust to lower lighting levels, and the dimming is barely noticed.
Streetlights in Kuala Lumpur are managed from a central unit
Source: www.kslights.com550.
Water Leak Detection Program
The city’s water leaks are severe due to the age and condition of the pipes,
and in the long term, it will be necessary to replace obsolete and leaking
pipes.
However, before embarking on a huge rehabilitation project that will
take many years and require large investments, the water operator, EAAB,
and the city should consider short- to medium-term solutions to reduce
water losses that would also save energy and lower the risk of ground
contamination in sewage systems. For an initial investment of up to US$1
million, the city could introduce a program that uses modern techniques
such as ground microphones and digital leak correlators, as well as demand
management valves and meters. Also, it could launch a leak detection and
water pressure management program in extraction works and pipelines,
long-distance water transmission mains, and distribution networks.
Excess water pressure could be reduced by installing flow modulation
valves on gravity networks and/or pump controls and pressure sensors
to regulate pump performance to suit daily variations in flow demand.
This would sustain maximum efficiency and minimize energy use. A
complementary pressure management program could help reduce
treatment and pumping costs by minimizing the required delivery pressure
and leaks. Such a program is most suitable for large networks with many
small leaks that are difficult and expensive to locate and repair.
Bogotá could partner with various organizations and/or coalitions of
local nonprofit entities to gain from their experience and expertise so
as to make the most appropriate changes in the city’s pipe or pumping
infrastructure. Besides the technical measures, a public outreach campaign
could encourage residents to take part in water conservation efforts.

BOGOTÁ D.C., COLOMBIA 61TOOL FOR RAPID ASSESSMENT OF CITY ENERGY
The city of Iasi in Romania is a good example where the local authorities
minimized water losses and improved overall efficiency. The local water
company partnered with a U.S.-based environmental provider to develop
a US$120,000 pilot leak detection and water conservation program as
a prerequisite for launching a much larger program to rehabilitate the
infrastructure.
Digital water leak monitor
Source: halmapr.com.
Eventually, the program helped reduce water losses by 8 million m3 and
saved up to US$3 million a year.

BOGOTÁ D.C., COLOMBIA 62TOOL FOR RAPID ASSESSMENT OF CITY ENERGY
AWARENESS RAISING CAMPAIGN
Another TRACE recommendation is designed to help people become more
aware of the benefits of EE. To this end, the city could use public education
and training campaigns to increase awareness and understanding of
energy conservation and ultimately influence behavior.
Awareness campaigns could target public utility services, such as water
and solid waste, using techniques of the sort related to TransMilenio. The
city could promote advertising campaigns, public events, and features
in the local media; dedicated websites; training programs in schools and
community centers; and even an EE advocacy program. Besides changing
residents’ behavior, the indirect benefits would mean less pressure on
energy infrastructure, reduced GHG emissions, better air quality, and
financial savings.
Regarding training, the city could partner with an education provider
to develop a program in schools and offices. Although the city’s per
capita water consumption is fairly good (less than 100 L per capita a
day), there is room for improvement. The program would mainly target
large energy users, such as public and private offices, industrial facilities,
schools and hospitals, and residents. Other stakeholders, such as nonprofit
organizations, utility companies, and businesses, could also join the effort.
Promoting water efficiency in Miami
Source: miamidade.gov.
Public education campaigns could publicize the benefits related to less
energy consumption. The city could join with an advertising or marketing
firm to develop a strategy for providing information on EE. The campaigns
could use posters, billboards, leaflets distributed throughout the city, and
articles and advertisements in the local media.
Solid waste is another area where campaigns would be useful. The
city and the solid waste operators could join efforts to promote recycling
through leaflets and posters, which could also publicize the city’s ambitious
Basura Cero program, aimed at reducing the amount of solid waste dumped
at the landfill to zero, by 2025.

BOGOTÁ D.C., COLOMBIA 63TOOL FOR RAPID ASSESSMENT OF CITY ENERGY
Promoting Zero Waste in Bogotá
Source: Bogotá.gov.co.
Promoting public transport
Source: www.keepcalm.o-matic.co.uk; www.bangalore.citizenmatters.in.
Another way to raise awareness is to use local EE advocates who teach
people about the importance and benefits of saving energy. The city
could recruit and train, on a voluntary basis, a few well-known individuals,
including local authority figures (for example, in government, businesses,
or health) or music or film stars, to serve as spokespersons and monitor
progress. It can even monitor the number of people participating in training
programs, hits on EE websites, print/online articles, and media features.
BOGOTÁ D.C., COLOMBIA 64TOOL FOR RAPID ASSESSMENT OF CITY ENERGY
URBAN TRANSPORT
Because public transport is the largest energy consumer in the city, there
would appear to be opportunities to save energy. Based on the TRACE
analysis, the sector could reduce consumption by 20 percent, mainly
through a shift from private vehicles to public transport and NMT. The
city has been improving the system’s efficiency through the SITP initiative,
expanding TransMilenio, developing the first metro line, and expanding
NMT networks. Additional efforts to reduce congestion could take the
form of road pricing, where vehicles are charged to operate on city streets
during peak hours, as has been done successfully in Singapore. At the
same time, the city can continue to improve the quality of public transport,
especially for the popular, well-used BRT system. To this end, Bogotá is
expanding the BRT with 35 km of new routes and is also pursuing, with
private investors, a light rail system that would connect the northern,
western, and southern neighborhoods.
Another important area to improve is NMT, which involves expanding
pedestrian walkways and the nearly 400 km of bike lanes. The city
aims to connect the lanes with the public transport systems, to serve
as alternative feeders to the TransMilenio and SITP systems. This move
might be furthered if the city created bike parking areas near bus and
other transit stops to facilitate transfer between the modes. Also, the city
has experimented with bike-share programs, which have been popular in
other cities, and would be another incentive for bicycle use.
To promote the BRT, the city could provide reduced fares for riders who
undertake part of their journeys by bike or on foot.

BOGOTÁ D.C., COLOMBIA 65TOOL FOR RAPID ASSESSMENT OF CITY ENERGY
ANNEX - TRACE RECOMMENDATIONS
BOGOTÁ D.C., COLOMBIA 66TOOL FOR RAPID ASSESSMENT OF CITY ENERGY
DETAILED RECOMMENDATIONS FROM TRACE
Improving Energy Efficiency in Bogotá, Colombia
Annex 1: Streetlight Audits and Upgrades 67
Annex 2: Procurement Guide for New Streetlights 71
Annex 3: Streetlight Timing 74
Annex 4: Detecting Water Leaks and Managing Pressure 77
Annex 5: Awareness-raising Campaigns 84
Annex 6: Abbreviations for Cities in the TRACE Database 90

BOGOTÁ D.C., COLOMBIA 67TOOL FOR RAPID ASSESSMENT OF CITY ENERGY
ANNEX 1: STREETLIGHT AUDITS AND UPGRADES
DescriptionIncandescent bulbs used in streetlights are highly inefficient. They produce little light and much heat
from their significant power consumption. Also, they are often poorly designed and unnecessarily
disperse light in all directions, including the sky. New bulb technologies can substantially increase
their efficiency as well as extend their life. This recommendation aims to both assess current lighting
efficiency and upgrade where needed.
The upgrades deliver the same lighting levels using less energy and reduce carbon emissions and
operating costs. The increased life reduces maintenance and costs and interruptions to service, thus
improving public health and safety
ATTRIBUTES
Energy-saving Potential
>200,000 kWh/year
First Cost
US$100,000–US$1,000,000
Speed of Implementation
1–2 years
Co-Benefits
Reduced carbon emissions
Enhanced public health & safety
Increased employment opportunities
Financial savings
Implementation Options
Activity Method
Self-implementation
The main costs related to upgrading streetlights are to replace the bulbs, the control system, and labor to
install the items. These expenses, along with consulting fees, are funded by the city, which means it receives all
the financial benefits but bears the financial risks.
Energy services company (ESCO)
upgrades
The city engages an ESCO to carry out the project, which can involve part and full ownership of the system and
translates into various levels of benefits in terms of reducing risks, up-front capital costs, and financial savings
over the project’s life. Using local ESCOs helps streamline the process and makes the upgrade more feasible.
Similarly, having a local, credible, and independent measurement and verification agency minimizes contractual
disputes by verifying performance. See the Akola Street lighting Case Study for details.
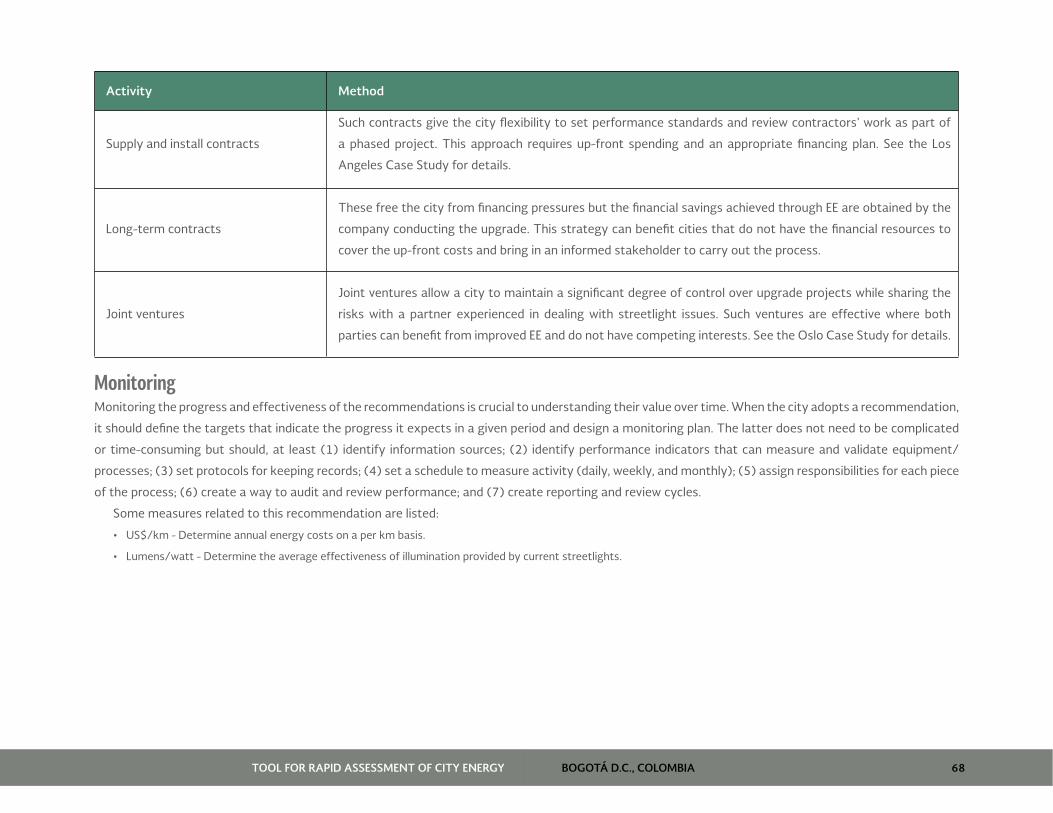
BOGOTÁ D.C., COLOMBIA 68TOOL FOR RAPID ASSESSMENT OF CITY ENERGY
Activity Method
Supply and install contracts
Such contracts give the city flexibility to set performance standards and review contractors’ work as part of
a phased project. This approach requires up-front spending and an appropriate financing plan. See the Los
Angeles Case Study for details.
Long-term contracts
These free the city from financing pressures but the financial savings achieved through EE are obtained by the
company conducting the upgrade. This strategy can benefit cities that do not have the financial resources to
cover the up-front costs and bring in an informed stakeholder to carry out the process.
Joint ventures
Joint ventures allow a city to maintain a significant degree of control over upgrade projects while sharing the
risks with a partner experienced in dealing with streetlight issues. Such ventures are effective where both
parties can benefit from improved EE and do not have competing interests. See the Oslo Case Study for details.
Monitoring Monitoring the progress and effectiveness of the recommendations is crucial to understanding their value over time. When the city adopts a recommendation,
it should define the targets that indicate the progress it expects in a given period and design a monitoring plan. The latter does not need to be complicated
or time-consuming but should, at least (1) identify information sources; (2) identify performance indicators that can measure and validate equipment/
processes; (3) set protocols for keeping records; (4) set a schedule to measure activity (daily, weekly, and monthly); (5) assign responsibilities for each piece
of the process; (6) create a way to audit and review performance; and (7) create reporting and review cycles.
Some measures related to this recommendation are listed:
• US$/km - Determine annual energy costs on a per km basis.
• Lumens/watt - Determine the average effectiveness of illumination provided by current streetlights.

BOGOTÁ D.C., COLOMBIA 69TOOL FOR RAPID ASSESSMENT OF CITY ENERGY
Case Studies
ESCO streetlight retrofit, Akola, India
Source: ESMAP (Energy Sector Management Assistance Program). 2009. “Good Practices in City Energy Efficiency: Akola Municipal Corporation, India -
Performance Contracting for Street lighting Energy Efficiency.”
Akola contracted with an ESCO to replace over 11,500 streetlights (standard fluorescent, mercury vapor, and sodium vapor) with T5 fluorescent lamps.
The contractor, AEL, financed 100 percent of the investments, launched the project, maintained the new lights, and received part of the verified energy
savings to recover its investment. Under the contract, the city paid AEL 95 percent of the verified energy bill savings over the six-year period it was in
effect. It also paid AEL an annual fee to maintain the lamps and fixtures. Initial investments were about US$120,000 and the upgrade was completed
in three months. The project saved 56 percent in energy costs a year, which meant a total savings of US$133,000—a payback in less than 11 months!
Streetlight retrofits, Dobrich, Bulgaria
Source: http://www.eu-greenlight.org - Go to ‘Case Study’.
In 2000, Dobrich audited its entire streetlight system, which resulted in a project the next year to modernize it. Mercury bulbs were replaced with high
pressure sodium (HPS) lamps and compact fluorescent lamps (a total of 6,450 EE lamps). The control system was also upgraded, and two electric
meters were installed. These measures delivered an illumination level of 95 percent and saved 2,819,640 kWh a year (€91,400 a year).
Street Lighting LED Replacement Program, Los Angeles, US
Source: Clinton Climate Initiative, http://www.clintonfoundation.org/what-we-do/clinton-climate-initiative/i/cci-la-lighting.
This project, which involved a partnership between the Clinton Climate Initiative (CCI) and the city of Los Angeles, is the largest streetlight upgrade by a
city to date, replacing traditional lights with environmentally friendly LEDs. It will reduce CO2 emissions by 40,500 tons and save US$10 million annually,
through reduced maintenance costs and 40 percent reduced energy consumption.
The mayor and Bureau of Street Lighting collaborated with the CCI’s Outdoor Lighting Program to review the latest technology, financing strategies,
and public-private implementation models for LED upgrades. CCI’s analysis of models and technology, and its financial advice, were key sources for
developing this comprehensive plan.

BOGOTÁ D.C., COLOMBIA 70TOOL FOR RAPID ASSESSMENT OF CITY ENERGY
The project’s phased nature allowed the city to evaluate its approach each year which gave it flexibility when selecting contractors and the lights to
be upgraded. It also capitalized on its status to attract financial institutions that would offer favorable loans and funding mechanisms since they wanted
to create positive relationships with the city. Thus, the city was able to create a well-developed business case for the project.
Lighting Retrofit, Oslo, Norway
Source: Clinton Climate Initiative, Climate Leadership Group, C40 Cities, http://www.c40cities.org/bestpractices/lighting/oslo_streetlight.jsp.
Oslo formed a joint venture with Hafslund ASA, the largest electricity distribution company in Norway. Old fixtures containing PCB and mercury were
replaced with high-performance HPS lights and an advanced data communication system was installed using power-line transmissions that reduced the
maintenance. They also installed ‘intelligent communication systems’ that dim lights when climate conditions and usage patterns permit. This reduced
energy use and increased the bulbs’ life, which also reduced maintenance (and related costs).
The system is fully equipped with all its components and is calibrated to correct some minor problems related to the communication units. Overall,
the system has performed well under normal operating conditions.
Tools & Guidance
Responsible Purchasing Network (2009). "Responsible Purchasing Guide LED Signs, Lights and Traffic Signals", A guidance document for maximizing
the benefits of retrofitting exit signs, streetlights and traffic signals with high efficiency LED bulbs. http://www.seattle.gov/purchasing/pdf/
RPNLEDguide.pdf.
ESMAP Public Procurement of Energy Efficiency Services - Guide of good procurement practice from around the world. http://www.esmap.org/Public_
Procurement_of_Energy_Efficiency_Services.pdf.

BOGOTÁ D.C., COLOMBIA 71TOOL FOR RAPID ASSESSMENT OF CITY ENERGY
ANNEX 2: PROCUREMENT GUIDE FOR NEW STREETLIGHTS
DescriptionIncandescent bulbs in streetlights are highly inefficient as they produce little light and much heat
from their significant power consumption. Also, they are often poorly designed, emitting light in all
directions, including the sky, which further increases their energy inefficiency. New bulb technology
can often increase efficiency and extend the bulbs’ lives since traditional bulbs only last about five
years and must be frequently replaced. This recommendation aims to produce a guide for procuring
new bulbs.
The new, more efficient bulbs can deliver the same lighting levels while using less energy, thus
lowering carbon emissions and operating costs. The longer life also reduces maintenance and its
costs, as well as interruptions to service, thus improving public health and safety.
ATTRIBUTES
Energy-saving Potential
>200,000 kWh/year
First Cost
<US$100,000
Speed of Implementation
<1 year
Co-Benefits
Reduced carbon emissions
Enhanced public health & safety
Financial savings
Implementation Options
Activity Method
Improved streetlights design manuals
Prepare a design manual for streetlights which follows best practice IESNA public lighting for visibility
and safety. The manual should include parameters for illumination, the spacing of poles, illumination
levels, types of lamps, dimming features, and timing of night lights for all types of city streets.
Energy service contracts for new streetlights
Prepare a request for proposal (RFP) for ESCOs to bid on streetlight contracts. It should include design,
installation, maintenance, and operating (energy) costs. The contracts should be for long periods
(over 10 years) and include minimum and maximum lighting requirements. The contracts should
promote competition in the private sector to provide the lowest operating costs possible.
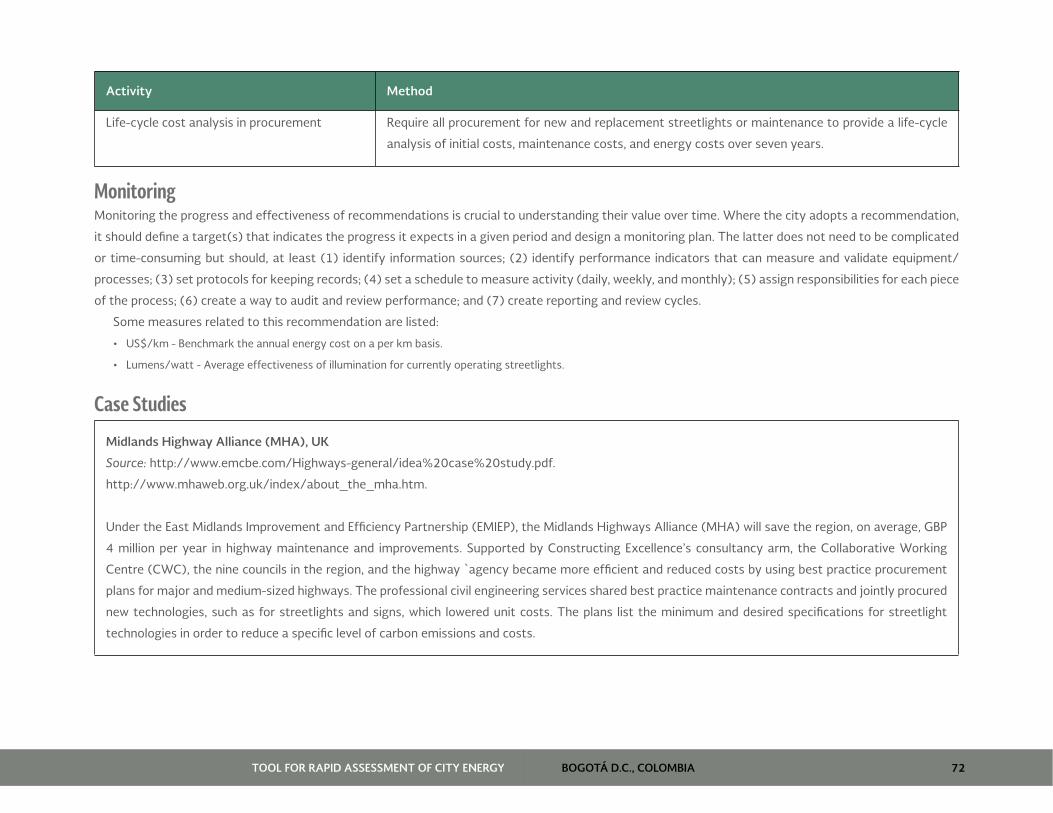
BOGOTÁ D.C., COLOMBIA 72TOOL FOR RAPID ASSESSMENT OF CITY ENERGY
Activity Method
Life-cycle cost analysis in procurement Require all procurement for new and replacement streetlights or maintenance to provide a life-cycle
analysis of initial costs, maintenance costs, and energy costs over seven years.
MonitoringMonitoring the progress and effectiveness of recommendations is crucial to understanding their value over time. Where the city adopts a recommendation,
it should define a target(s) that indicates the progress it expects in a given period and design a monitoring plan. The latter does not need to be complicated
or time-consuming but should, at least (1) identify information sources; (2) identify performance indicators that can measure and validate equipment/
processes; (3) set protocols for keeping records; (4) set a schedule to measure activity (daily, weekly, and monthly); (5) assign responsibilities for each piece
of the process; (6) create a way to audit and review performance; and (7) create reporting and review cycles.
Some measures related to this recommendation are listed:
• US$/km - Benchmark the annual energy cost on a per km basis.
• Lumens/watt - Average effectiveness of illumination for currently operating streetlights.
Case Studies
Midlands Highway Alliance (MHA), UK
Source: http://www.emcbe.com/Highways-general/idea%20case%20study.pdf.
http://www.mhaweb.org.uk/index/about_the_mha.htm.
Under the East Midlands Improvement and Efficiency Partnership (EMIEP), the Midlands Highways Alliance (MHA) will save the region, on average, GBP
4 million per year in highway maintenance and improvements. Supported by Constructing Excellence’s consultancy arm, the Collaborative Working
Centre (CWC), the nine councils in the region, and the highway `agency became more efficient and reduced costs by using best practice procurement
plans for major and medium-sized highways. The professional civil engineering services shared best practice maintenance contracts and jointly procured
new technologies, such as for streetlights and signs, which lowered unit costs. The plans list the minimum and desired specifications for streetlight
technologies in order to reduce a specific level of carbon emissions and costs.

BOGOTÁ D.C., COLOMBIA 73TOOL FOR RAPID ASSESSMENT OF CITY ENERGY
‘Lighting the Way’ Project, Australia
Source: http://www.iclei.org/fileadmin/user_upload/documents/ANZ/CCP/CCP-AU/EnergyToolbox/lightingtheway.pdf.
Australia is committed to reducing the growth of GHG emissions and initiatives are underway at all government levels to improve the efficiency of public
lights; these have involved trials of more efficient bulbs. Further, illuminating minor roads is a major source of GHG emissions for local governments, and
many opportunities exist to improve both the quality of the lights and reduce costs and GHG emissions. Thus, stakeholders produced a procurement
guide, ‘Lighting the Way’, which provides information that helps local governments to (1) improve the lights on minor roads while reducing their GHG
emissions, (2) lower costs, and (3) decrease liability and risks. These outcomes can be achieved through EE solutions that provide better streetlight
service and comply with Australian standards (AS/NZS 1158).
The document describes technical and other issues related to EE lights and guides cities on techniques to improve their negotiations about public
lighting issues with distribution companies. Several types of lamps offer considerable advantages over the standard 80 watt mercury vapor lamps with
regard to energy use, lumen depreciation, light output, maintenance, lifespan, aesthetics, and performance in various temperatures.
Tools & Guidance
European Lamp Companies Federation. "Saving Energy through Lighting", A procurement guide for efficient lighting, including a chapter on street
lighting. http://buybright.elcfed.org/uploads/fmanager/saving_energy_through_lighting_jc.pdf.
New York State Energy Research and Development Authority. "How to guide to Effective Energy-Efficient Street lighting." Available online from http://
www.rpi.edu/dept/lrc/nystreet/how-to-officials.pdf.
ESMAP Public Procurement of Energy Efficiency Services - Guide of good procurement practice from around the world. http://www.esmap.org/Public_
Procurement_of_Energy_Efficiency_Services.pdf.

BOGOTÁ D.C., COLOMBIA 74TOOL FOR RAPID ASSESSMENT OF CITY ENERGY
ANNEX 3: STREETLIGHT TIMING PROGRAM
DescriptionPublic lights usually only perform ‘on’ and ‘off’ functions and switch between these two settings in the
early evening and early morning. However, demand for light varies, with periods where little light is
needed, such as in the middle of the night. A program with timers or dimmers tailored to meet specific
needs in different areas can significantly reduce energy consumption and yet deliver appropriate levels
of light that provide safety and security. These devices, called ‘intelligent monitoring systems’, can
be used to adapt the levels of light according to weather and activity levels. The recommendation
involves identifying public space use patterns and adjusting the lighting levels accordingly. Often, the
timing programs are part of a full audit and upgrade program, but for cities that already have energy-
efficient public lights, a timing program may be a small but effective measure.
Timing programs can reduce energy consumption, carbon emissions, and operating costs. They
also increase the light bulbs’ life, reduce maintenance and associated costs, and allow faults to be
detected quickly, which translates into quick replacement and overall improvement of the streetlight
service.
ATTRIBUTES
Energy-saving Potential
>200,000 kWh/year
First Cost
<US$100,000
Speed of Implementation
<1 year
Co-Benefits
Reduced carbon emissions
Enhanced public health & safety
Increased employment opportunities
Financial savings
Implementation Options
Activity Method
Determine timing needs and products Prepare a study to identify the types of streets and lights that would benefit from timing and dimming
during late night hours.
Install timers and dimmers on existing lights Allocate funds to install dimming and timing equipment. Expand these upgrades over several years to
cover 100 percent of all streetlights. See the Kirklees and Oslo case studies for details.

BOGOTÁ D.C., COLOMBIA 75TOOL FOR RAPID ASSESSMENT OF CITY ENERGY
Activity Method
Set standards for new lights
Create the standards for new public lights that conform to global best practices for EE and IESNA
guidelines.
Monitor and publish energy savings Measure the energy saved each year by this program and encourage private owners to use the same
technology.
Monitoring Monitoring the progress and effectiveness of the recommendations is crucial to understanding their value over time. When the city adopts a recommendation,
it should define the targets that indicate the progress it expects in a given period and design a monitoring plan. The latter does not need to be complicated
or time-consuming but should, at least (1) identify information sources; (2) identify performance indicators that can measure and validate equipment/
processes; (3) set protocols for keeping records; (4) set a schedule to measure activity (daily, weekly, monthly); (5) assign responsibilities for each piece of
the process; (6) create a way to audit and review performance; and (7) create reporting and review cycles.
Some measures related to this recommendation are listed:
• Define the hours each year that streetlights are illuminated at maximum output.
• Define the hours each year that streetlights are illuminated at less than 50 percent of maximum output.
Case Studies
Control system for public lighting, Kirklees, UK
Source: http://www.kirklees.gov.uk/community/environment/green/greencouncil/LightingStoryboard.pdf.
Instead of turning streetlights off at certain times of the day, as is done in other cities, Kirklees chose to dim lights to varying levels. It adopted this course
(not turning the lights off completely) so as to prevent crime. Dimming equipment that used wireless technology was installed on each light pole. This
required only adding a small antenna to the lamp heads, which was plugged into the electronic ballast with no need for more wiring. Generally the lights
are switched on 100 percent at 7 p.m., dimmed to 75 percent at 10 p.m., and to 50 percent at midnight. At 5 a.m., they are increased again to 100

BOGOTÁ D.C., COLOMBIA 76TOOL FOR RAPID ASSESSMENT OF CITY ENERGY
percent. By dimming the lights gradually, people can adjust to lower lighting levels, and the dimming is barely noticed. The remote monitoring system
also provides accurate information and allows streetlight engineers to identify failed lamps quickly. This reduces the need for engineers to carry out night
inspections and also other on-site maintenance costs. The dimming can save up to 30 percent of the electricity used annually. By replacing 1,200 lights,
Kirklees estimates savings of about US$3 million in energy costs a year.
Intelligent outdoor city lighting system, Oslo, Norway
Source: http://www.echelon.com/solutions/unique/appstories/oslo.pdf.
An ‘intelligent’ outdoor lighting system replaced fixtures containing PCB and mercury with high-performance HPS lights. These are monitored and
controlled by an advanced data communication system which operates over the existing 230 V power lines using special technology. An operations
center remotely monitors and logs the streetlights’ energy use and running time. It collects information from traffic and weather sensors and uses an
internal astronomical clock to calculate the availability of natural light from the sun and moon. This data is then used to automatically dim some or all
the lights. Controlling light levels this way not only saved a significant amount of energy (estimated at 62 percent) but extended lamp life, thus reducing
replacement costs. The city used the monitoring system to identify lamp failures, often fixing them before being notified by residents. By predicting
the lights’ failure based on a comparison of actual running hours against expected lamp life, repair crews have become more efficient. The city paid
about US$12 million to replace 10,000 lights and saves about US$450,000 in operating costs a year. However, it is estimated that if the program was
expanded through the entire city, the greater economies of scale would yield a payback in less than five years.
Motorway intelligent lights upgrade, Kuala Lumpur, Malaysia
Source: http://www.lighting.philips.com.my/v2/knowledge/case_studies-detail.jsp?id=159544.
This project upgraded the lights on the highways leading to the Kuala Lumpur International Airport, which cover 66 km. The main requirement was
that each lamp should be dimmed independently from the others. This called for a network linking all 3,300 posts to a central control facility. Further,
maintenance needed to be more efficient and visibility needed to be set at levels that did not compromise vision. The project used tele-management
controls which made it possible to switch or control each light from a central point. It also allows the system to dim specific lights to levels that are
appropriate for road conditions, receive instant messages when lights fail, and create a database where all information is stored. The project significantly
reduced energy consumption besides the 45 percent saved due to the dimming circuits.

BOGOTÁ D.C., COLOMBIA 77TOOL FOR RAPID ASSESSMENT OF CITY ENERGY
ANNEX 4: DETECTING WATER LEAKS AND MANAGING PRESSURE
DescriptionThis recommendation is designed to develop a leak detection and pressure management program to
minimize losses along
• Extraction works and pipelines,
• Long distance water transmission mains,
• Distribution networks,
• Sewage pumping mains,
• District cooling networks, and
• Irrigation networks.
It is thought that most systems already detect leaks visually; however, this provides limited information
and benefits. Thus, the recommendation offers a proactive and more thorough leak detection program
to locate and repair leaks. The following techniques could be used:
• Ground microphones
• Digital leak noise correlators
• Acoustic loggers
• Demand-management valves, meters, and zoning
• Mobile leak detection programs
• Basic acoustic sounding techniques
Also, excess pressure can be reduced by installing
• Valves that moderate flows on gravity networks, and
• Controls and/or pressure sensors to moderate a pump’s relative performance to suit the daily variation in
flow demand, thus maintaining maximum efficiency and minimum energy use.
ATTRIBUTES
Energy-saving Potential
100,000–200,000 kWh/year
First Cost
US$100,000–US$1,000,000
Speed of Implementation
1–2 years
Co-Benefits
Reduced carbon emissions
Efficient water use
Enhanced public health & safety
Increased employment opportunities
Financial savings
Security of supply
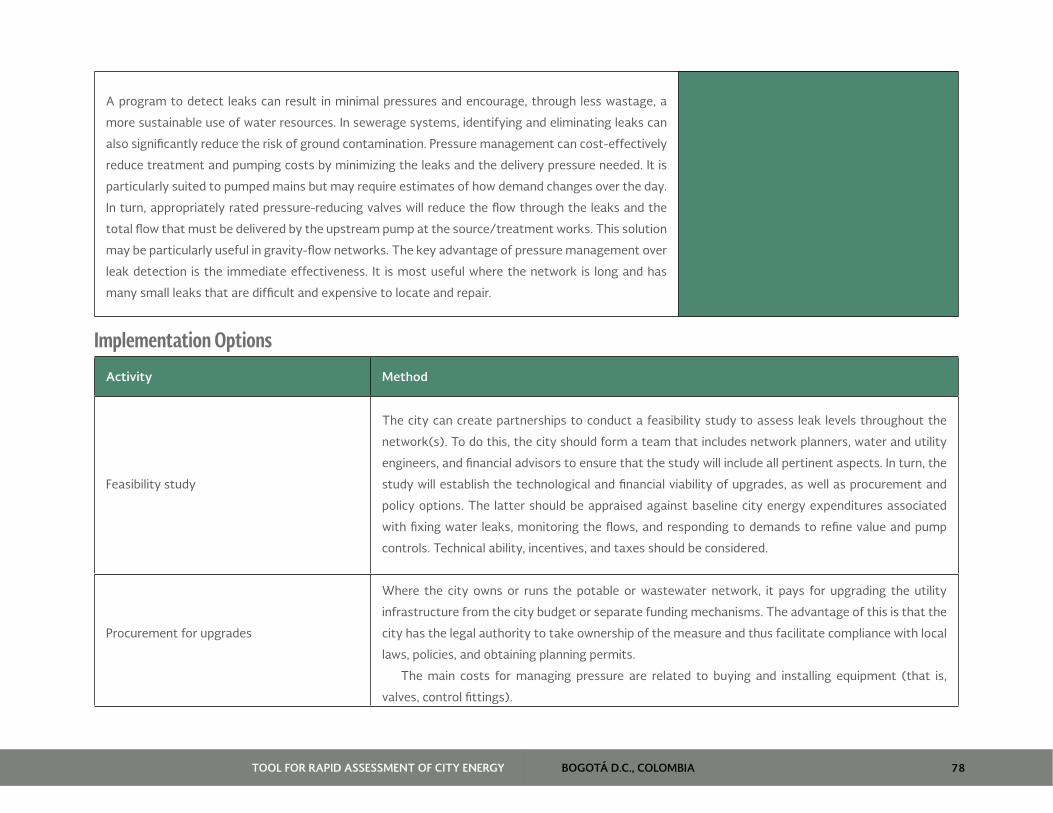
BOGOTÁ D.C., COLOMBIA 78TOOL FOR RAPID ASSESSMENT OF CITY ENERGY
A program to detect leaks can result in minimal pressures and encourage, through less wastage, a
more sustainable use of water resources. In sewerage systems, identifying and eliminating leaks can
also significantly reduce the risk of ground contamination. Pressure management can cost-effectively
reduce treatment and pumping costs by minimizing the leaks and the delivery pressure needed. It is
particularly suited to pumped mains but may require estimates of how demand changes over the day.
In turn, appropriately rated pressure-reducing valves will reduce the flow through the leaks and the
total flow that must be delivered by the upstream pump at the source/treatment works. This solution
may be particularly useful in gravity-flow networks. The key advantage of pressure management over
leak detection is the immediate effectiveness. It is most useful where the network is long and has
many small leaks that are difficult and expensive to locate and repair.
Implementation Options
Activity Method
Feasibility study
The city can create partnerships to conduct a feasibility study to assess leak levels throughout the
network(s). To do this, the city should form a team that includes network planners, water and utility
engineers, and financial advisors to ensure that the study will include all pertinent aspects. In turn, the
study will establish the technological and financial viability of upgrades, as well as procurement and
policy options. The latter should be appraised against baseline city energy expenditures associated
with fixing water leaks, monitoring the flows, and responding to demands to refine value and pump
controls. Technical ability, incentives, and taxes should be considered.
Procurement for upgrades
Where the city owns or runs the potable or wastewater network, it pays for upgrading the utility
infrastructure from the city budget or separate funding mechanisms. The advantage of this is that the
city has the legal authority to take ownership of the measure and thus facilitate compliance with local
laws, policies, and obtaining planning permits.
The main costs for managing pressure are related to buying and installing equipment (that is,
valves, control fittings).
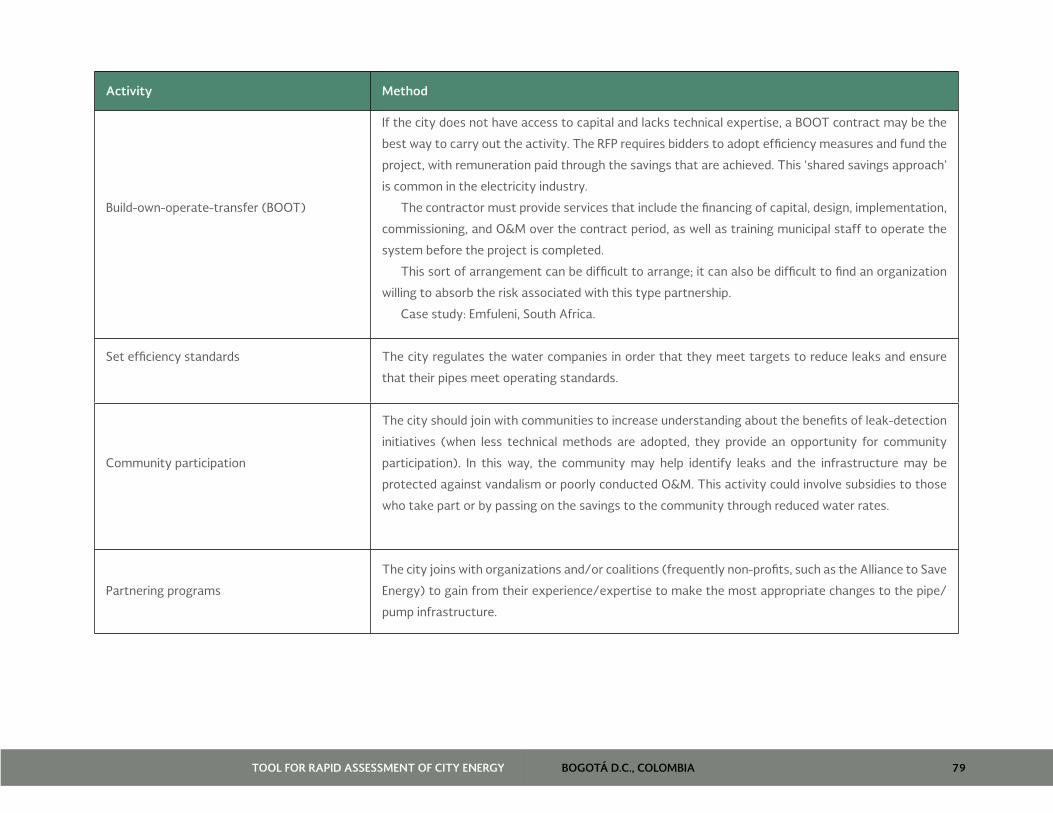
BOGOTÁ D.C., COLOMBIA 79TOOL FOR RAPID ASSESSMENT OF CITY ENERGY
Activity Method
Build-own-operate-transfer (BOOT)
If the city does not have access to capital and lacks technical expertise, a BOOT contract may be the
best way to carry out the activity. The RFP requires bidders to adopt efficiency measures and fund the
project, with remuneration paid through the savings that are achieved. This ‘shared savings approach’
is common in the electricity industry.
The contractor must provide services that include the financing of capital, design, implementation,
commissioning, and O&M over the contract period, as well as training municipal staff to operate the
system before the project is completed.
This sort of arrangement can be difficult to arrange; it can also be difficult to find an organization
willing to absorb the risk associated with this type partnership.
Case study: Emfuleni, South Africa.
Set efficiency standards The city regulates the water companies in order that they meet targets to reduce leaks and ensure
that their pipes meet operating standards.
Community participation
The city should join with communities to increase understanding about the benefits of leak-detection
initiatives (when less technical methods are adopted, they provide an opportunity for community
participation). In this way, the community may help identify leaks and the infrastructure may be
protected against vandalism or poorly conducted O&M. This activity could involve subsidies to those
who take part or by passing on the savings to the community through reduced water rates.
Partnering programs
The city joins with organizations and/or coalitions (frequently non-profits, such as the Alliance to Save
Energy) to gain from their experience/expertise to make the most appropriate changes to the pipe/
pump infrastructure.

BOGOTÁ D.C., COLOMBIA 80TOOL FOR RAPID ASSESSMENT OF CITY ENERGY
Activity Method
Such organizations often carry out research, educational programs, and the design/implementation
of EE projects. Also, they advocate policies and develop/promote technology and/or build public-
private partnerships.
Difficulties can arise when the partners do not have access to or influence over the funds required
to implement the initiatives.
Case study: Galati & Iasi, Romania; Phnom Penh, Cambodia.
Monitoring Monitoring the progress and effectiveness of the recommendations is crucial to understanding their value over time. When the city adopts a recommendation,
it should define the targets that indicate the progress it expects in a given period and design a monitoring plan. The latter does not need to be complicated
or time-consuming but should, at least (1) identify information sources; (2) identify performance indicators that can measure and validate equipment/
processes; (3) set protocols for keeping records; (4) set a schedule to measure activity (daily, weekly, monthly); (5) assign responsibilities for each piece of
the process; (6) create a way to audit and review performance; and (7) create reporting and review cycles.
Some measures related to this recommendation are listed:
• Calculate the percentage of unaccounted-for water (UFW): This involves measuring the percentage of water lost (out of the total water treated) due to leaks, waste,
theft, mechanical errors in meters at the source, or human errors in recording the meter data.
• Calculate the percentage of water leaked per km of water main per day during the reporting period.
• Measure the length of water mains inspected for leaks.
• Measure the number of properties affected by low water pressure due to the old pipe network or repairs being made during the reporting period.
Case Studies
Pilot Leak Detection and Abatement Program, La i, Romania
Source: http://www.resourcesaver.com/ewebeditpro/items/O50F1144.pdf.
http://pdf.usaid.gov/pdf_docs/Pnada703.pdf.

BOGOTÁ D.C., COLOMBIA 81TOOL FOR RAPID ASSESSMENT OF CITY ENERGY
With an EcoLinks Challenge Grant of US$46,820, Regia Autonom Jude ean Apa-Canal Ia i (RAJAC) partnered with a U.S. environmental technology
firm, Cavanaugh & Associates, to develop a pilot leak detection/abatement program, whose total cost was US$118,074. The program (1) trained RAJAC
personnel to detect leaks, (2) began a leak detection system, (3) developed a water conservation program, and (4) launched a public outreach campaign.
The leak detection pilot program was a prerequisite for carrying out a water conservation program. The staff’s understanding of new technology
was significantly increased through training and seminars and the public awareness-raising program encouraged consumers to participate in water
conservation efforts. Environmental and economic benefits resulted from the more efficient use of water and energy. In the short term, it was estimated
that three of the leaks identified in the pilot were responsible for a water loss of 60,000 m3/year and a revenue loss of US$24,000. Since the equipment
used during the pilot cost about US$20,000 and no further significant investments were needed to eliminate leaks, the payback period for the equipment
was less than one year. This project contributed to a larger effort to improve water efficiency throughout Iasi County that will ultimately reduce water
loss by 8 million m3 and provide savings of US$3 million a year; however, this level of savings will require significant investment in infrastructure.
USAID-funded Ecolinks Project, Gala i, Romania
Source: http://www.munee.org/node/62.
As part of a USAID-funded Ecolinks Project, the Cadmus Group assessed the city’s water supply system and discovered that energy conservation
measures could save roughly US$250,000 a year in electricity costs. Low-cost measures include trimming impellers to better match pumps and motors
with required flows and pressures. Moderate-cost measures include detecting and reducing leaks and replacing some pumps.
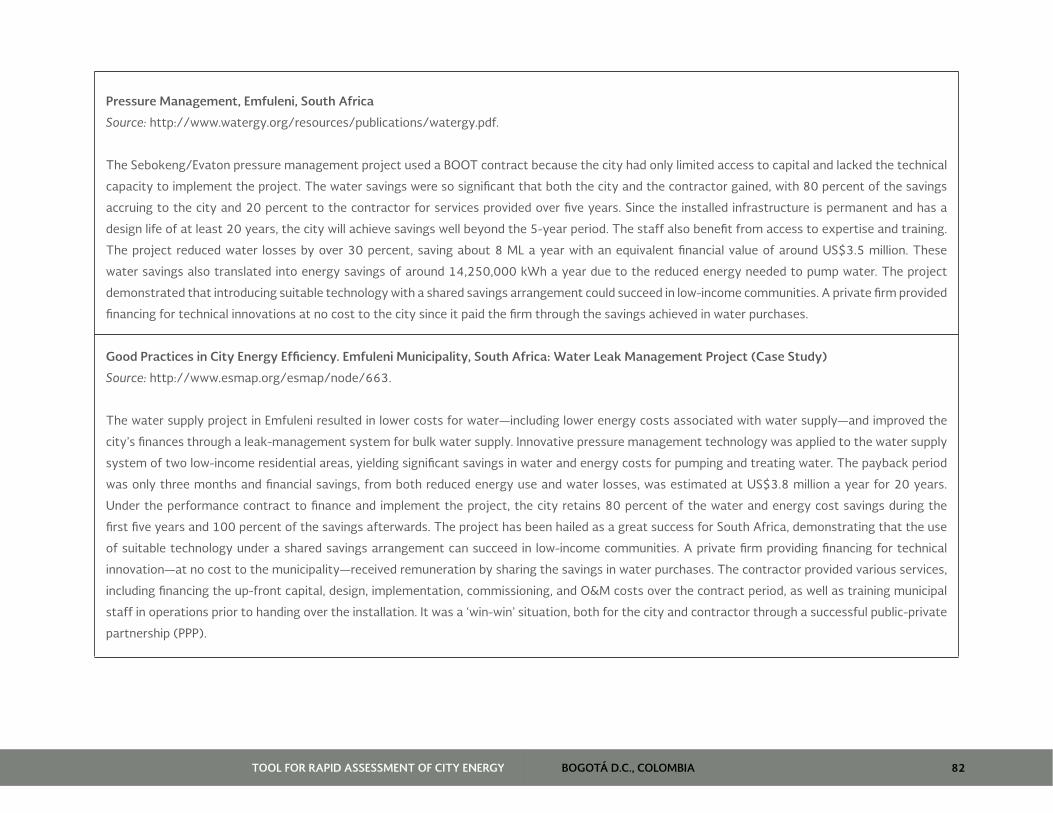
BOGOTÁ D.C., COLOMBIA 82TOOL FOR RAPID ASSESSMENT OF CITY ENERGY
Pressure Management, Emfuleni, South Africa
Source: http://www.watergy.org/resources/publications/watergy.pdf.
The Sebokeng/Evaton pressure management project used a BOOT contract because the city had only limited access to capital and lacked the technical
capacity to implement the project. The water savings were so significant that both the city and the contractor gained, with 80 percent of the savings
accruing to the city and 20 percent to the contractor for services provided over five years. Since the installed infrastructure is permanent and has a
design life of at least 20 years, the city will achieve savings well beyond the 5-year period. The staff also benefit from access to expertise and training.
The project reduced water losses by over 30 percent, saving about 8 ML a year with an equivalent financial value of around US$3.5 million. These
water savings also translated into energy savings of around 14,250,000 kWh a year due to the reduced energy needed to pump water. The project
demonstrated that introducing suitable technology with a shared savings arrangement could succeed in low-income communities. A private firm provided
financing for technical innovations at no cost to the city since it paid the firm through the savings achieved in water purchases.
Good Practices in City Energy Efficiency. Emfuleni Municipality, South Africa: Water Leak Management Project (Case Study)
Source: http://www.esmap.org/esmap/node/663.
The water supply project in Emfuleni resulted in lower costs for water—including lower energy costs associated with water supply—and improved the
city’s finances through a leak-management system for bulk water supply. Innovative pressure management technology was applied to the water supply
system of two low-income residential areas, yielding significant savings in water and energy costs for pumping and treating water. The payback period
was only three months and financial savings, from both reduced energy use and water losses, was estimated at US$3.8 million a year for 20 years.
Under the performance contract to finance and implement the project, the city retains 80 percent of the water and energy cost savings during the
first five years and 100 percent of the savings afterwards. The project has been hailed as a great success for South Africa, demonstrating that the use
of suitable technology under a shared savings arrangement can succeed in low-income communities. A private firm providing financing for technical
innovation—at no cost to the municipality—received remuneration by sharing the savings in water purchases. The contractor provided various services,
including financing the up-front capital, design, implementation, commissioning, and O&M costs over the contract period, as well as training municipal
staff in operations prior to handing over the installation. It was a ‘win-win’ situation, both for the city and contractor through a successful public-private
partnership (PPP).

BOGOTÁ D.C., COLOMBIA 83TOOL FOR RAPID ASSESSMENT OF CITY ENERGY
Water Pressure Management Program, Sydney, Australia
Source: http://www.sydneywater.com.au/OurSystemsAndOperations/WaterPressureManagement/index.cfm.
Sydney Water has a water pressure management program to target areas where pressure levels are well above average and there are many water main
breaks. Because excessive water pressure can lead to breaks and cause leaks, the aim is to adjust water pressure in the supply system to achieve more
consistent levels which, in turn, reduce the number of water main breaks, improve the reliability of the system, and conserve water. The program is an
important part of Sydney Water’s leak prevention scheme and the New South Wales Government’s Metropolitan Water Plan.
Water Supply and Drainage Project, Phnom Penh, Cambodia
Source: http://www.adb.org/water/actions/CAM/PPWSA.asp.
http://www.adb.org/water/actions/CAM/Internal-Reforms-Fuel-Performance.asp.
The Phnom Penh Water Supply and Drainage Project (PPWSA) of Asian Development Bank (ADB) provided the opportunity for PPWSA, the government-
owned water supply utility, to partner with ADB and demonstrate its capacity to introduce water sector reforms. To phase out non-revenue water (where
consumers gain access to water for free), PPWSA started metering all water connections. It gradually equipped each network with pressure and flow
rate data transmitters that provide online data for analyzing big leaks in the system. It also created a training center to respond to in-house training
needs. PPWSA renovated old pipes using state-of-the-art materials and labor from PPWSA staff. PPWSA also institutionalized performance monitoring,
producing progress reports and indicators on a regular basis and annually auditing its accounts/procedures. The project promoted the transfer of more
managerial autonomy to PPWSA to enable it to use its own funds on maintenance and rehabilitation programs. The result was that PPWSA became
financially and operationally autonomous, achieved full cost recovery, and turned into an outstanding public utility in the region.

BOGOTÁ D.C., COLOMBIA 84TOOL FOR RAPID ASSESSMENT OF CITY ENERGY
ANNEX 5: AWARENESS-RAISING CAMPAIGNS
DescriptionPublic education and training campaigns increase awareness/understanding about the benefits of EE,
helping to change behavior, and contribute to overall energy savings. These can involve
• Advertising campaigns;
• Public events;
• Articles in the local press;
• User-friendly websites providing information about EE;
• Training programs in schools, community centers, and businesses; and
• Launching of an EE advocate program.
Benefits include residents’ learning to be more energy efficient. Their changed behavior reduces a
city’s energy consumption. Wider benefits include reducing pressure on energy infrastructure, lowering
carbon emissions, and improving air quality.
ATTRIBUTES
Energy-saving Potential
100,000–200,000 kWh/year
First Cost
US$100,000–US$1,000,000
Speed of Implementation
<1 year
Co-Benefits
Reduced carbon emissions
Improved air quality
Enhanced public health & safety
Financial savings
Security of supply
Implementation Options
Activity Method
Targeted training programs
Working with staff or consultants experienced in such campaigns, the city develops training programs
that can be introduced in schools and offices, particularly targeted at big energy users, such as offices.
The programs can also partner with groups such as utility companies, businesses, and nongovernmental
organizations (NGOs).
Public education campaigns
Working with advertising/marketing companies experienced in public education campaigns, the city
develops a strategy to provide information on EE to all residents through posters, billboards, leaflets,
public media announcements, and advertisements. The city can create a partnership with a business or
utility company, which could help finance the effort.

BOGOTÁ D.C., COLOMBIA 85TOOL FOR RAPID ASSESSMENT OF CITY ENERGY
Activity Method
Energy efficiency advocates
The city recruits local EE advocates and trains them to promote the issues. They can be drawn from
those who are interested in spreading the message about EE, such as local authorities, businesses,
community groups, NGOs, health trusts, school children, and others. This can be accomplished in several
ways.
• Advocates can be asked to train the trainers and provide them with support to run sessions in their communities.
They teach the simple ways to save energy and provide leaflets to distribute locally. The trainers must inform
the community that they are the local contacts for EE information.
Since the advocates are often volunteers, an official should be appointed to provide support and
encouragement, conduct regular follow-ups, and monitor progress of each EE advocacy program.

BOGOTÁ D.C., COLOMBIA 86TOOL FOR RAPID ASSESSMENT OF CITY ENERGY
Monitoring Monitoring the progress and effectiveness of recommendations is crucial to understand their value over time. When the city adopts a recommendation, it
should define a target(s) that indicates the progress it expects in a given period and design a monitoring plan. The latter does not need to be complicated
or time-consuming but should, at least (1) identify information sources; (2) identify performance indicators that can measure and validate equipment/
processes; (3) set protocols for keeping records; (4) set a schedule to measure activity (daily, weekly, and monthly); (5) assign responsibilities for each piece
of the process; (6) create a way to audit and review performance; and (7) create reporting and review cycles.
Some measures related to this recommendation are listed:
• Determine the number of people participating in training programs annually.
• Determine the number of hits to the city’s EE website monthly (if developed) or number of requests for EE measures.
• Determine the number of articles in the press about the city’s EE.
• Determine the number of EE advocates who are trained (if this is done).
Case Studies
PlaNYC, New York, U.S.A.
Source: http://www.nyc.gov/html/planyc/html/home/home.shtml; www.nyc.gov/html/planyc2030/downloads/pdf/planyc_energy_progress_2010.pdf.
PlaNYC is a comprehensive scheme for the city’s future energy sustainability. It creates a strategy to reduce the city’s GHG footprint while also
accommodating population growth of nearly one million by 2030 and improving the infrastructure and environment. Since the city has recognized the
importance of reducing global carbon emissions, and the value of leading by example, it set the goal of reducing its carbon emissions by 30 percent below
2005 levels by 2030.
The city has an initiative to carry out extensive education, training, and quality control programs to promote EE. By 2010, it launched an energy
awareness campaign and set up training, certification, and monitoring programs. The plan proposes that the measures be delivered through various
partnerships until an EE authority is established.

BOGOTÁ D.C., COLOMBIA 87TOOL FOR RAPID ASSESSMENT OF CITY ENERGY
Energy Efficiency Office, Toronto, Canada
Source: City of Toronto. http://www.toronto.ca/energy/saving_tips.htm.
Toronto’s EE Office communicates energy-saving tips to households, businesses, and developers on its website. Also, it runs a program, ‘The Employee
Energy Efficiency at Work (E3@Work)’, that is designed to save money and promote EE by managing office equipment power loads. The program began
in 2002 and is being promoted to businesses and offices across the city. The goal is to reduce energy consumption and building operating costs, improve
energy security and reliability, and preserve the environment.
Low Carbon Singapore, Singapore
Source: Low Carbon Singapore. http://www.lowcarbonsg.com.
‘Low Carbon Singapore’ is an online community dedicated to help Singapore reduce its carbon emissions and move toward the goal of a low carbon
economy. The project aims to educate individuals, communities, businesses, and organizations on issues related to climate change, global warming, and
clean energy and provide information, news, tips, and resources on ways to reduce carbon, such as adopting clean energy and energy efficient behavior
and technology. The Low Carbon Singapore material is published by Green Future Solutions, a Singapore-based business that promotes environmental
awareness/action through a network of green websites, events, presentations, publications, and consultants.
Carbon Management Energy Efficiency (CMEE) Programme, Walsall Council, U.K.
Source: Walsall Council. http://www.walsall.gov.uk/index/energy_awareness_staff_presentations.htm.
Walsall Council has been conducting energy awareness training with the Carbon Trust, under its Carbon Management Energy Efficiency (CMEE) program,
including
• Surveying the council’s least energy efficient buildings;
• Evaluating the feasibility of combined heat and power (CHP) generation at the council’s recreation centers; and
• Raising staff awareness about energy issues through presentations to senior city managers, building and school managers, and various council general staff: 226
staff were trained in this round (2008/2009) using presentations developed by the Carbon Trust and adapted, with some environmental advocates, to reflect
Walsall Council’s needs.

BOGOTÁ D.C., COLOMBIA 88TOOL FOR RAPID ASSESSMENT OF CITY ENERGY
The aim of the CMEE program is to identify and achieve significant carbon savings throughout the council and thus, financial savings. By reducing its energy
use, the council will also reduce the number of carbon credits it must buy under the Carbon Reduction Commitment, which was introduced in 2010.
Siemens Energy Efficiency Academy, Brisbane, Australia
Source: Siemens. http://aunz.siemens.com/EVENTS/ENERGYEACADEMY/Pages/IN_EnergyEfficiencyAcademy.aspx. http://www.siemens.com/
sustainability/report/09/pool/pdf/siemens_sr_2009.pdf.
The Siemens Energy Efficiency Academy brings together leading international and local experts to share their insights on government policies, emerging
technologies, market forces, and best practices.
Besides adopting and showcasing its own energy efficient practices, it runs regular training programs for businesses on topics such as
• Incentive schemes: Market mechanisms, grants, and funding;
• Award-winning business efforts to achieve EE;
• EE policy in Australian government (at various levels);
• The next generation in EE technology;
• Best practices for variable speed drives27 and power quality; and
• Monitoring energy use in industrial and commercial facilities.
27 VSD - A device that regulates the speed and rotational force, output torque of mechanical equipment.

BOGOTÁ D.C., COLOMBIA 89TOOL FOR RAPID ASSESSMENT OF CITY ENERGY
Energy Awareness Week, Meath, Ireland
Source: ManagEnergy. “EU LOCAL ENERGY ACTION: Good practices 2005.” http://www.managenergy.net/download/gp2005.pdf.
In 2004, the Meath Energy Management Agency’s (MEMA) extended its Energy Awareness Week to everyone who lived or worked in the county
of Meath, Ireland, using media campaigns to raise consumers’ understanding of energy issues. This included visits to schools, information displays,
widespread media coverage, competitions, a ‘Car-Free Day’, and an offer of free CFL light bulbs, which encouraged participation at all levels. The campaign
dramatically increased requests for information from the energy agency. The competitions and promotions also improved local knowledge of EE and
encouraged people to choose sustainable energy and transport options.
Energy Awareness Week activities were coordinated and carried out by MEMA with support from the Environment Department of Meath County
Council. The campaign cost US$4,470, which covered printing and copying promotional materials, prizes, and providing bright jackets for walking bus
participants.28 Local companies and Sustainable Energy Ireland (SEI) contributed sponsors and prizes.
Tools & Guidance
“EU LOCAL ENERGY ACTION: Good practices 2005.” http://www.managenergy.net/download/gp2005.pdf.
28 Student transport for school children who, chaperoned by two adults, who walk to school.
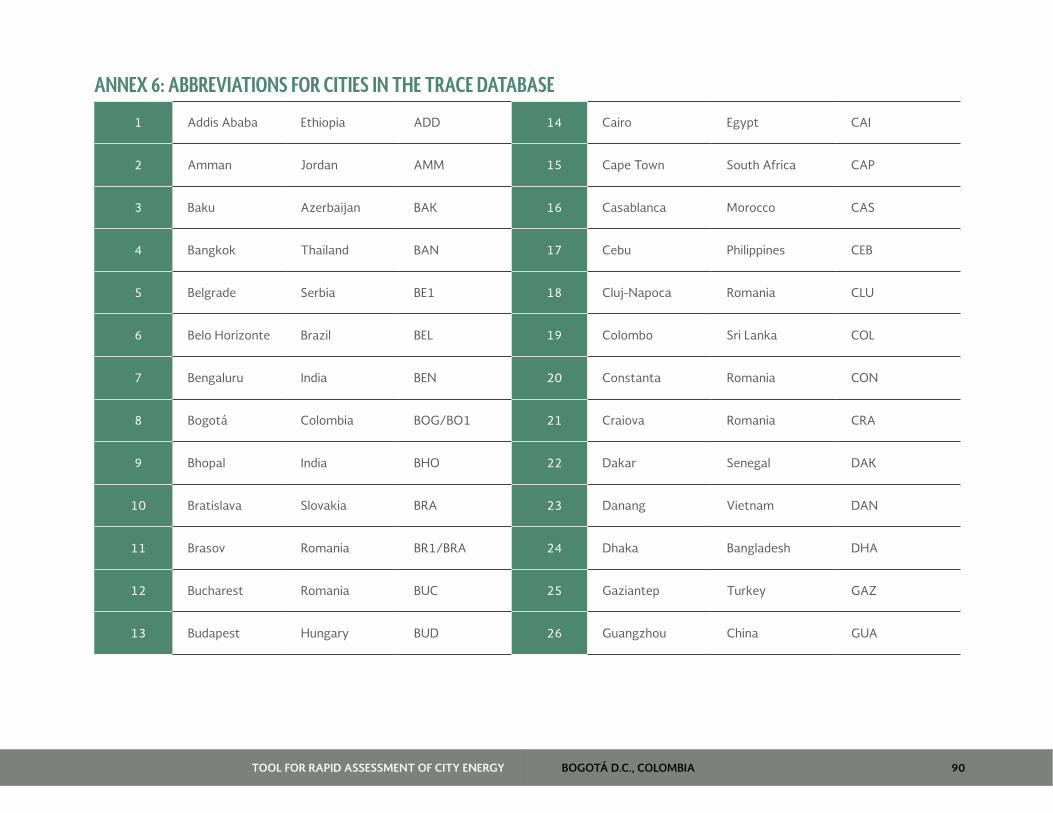
BOGOTÁ D.C., COLOMBIA 90TOOL FOR RAPID ASSESSMENT OF CITY ENERGY
ANNEX 6: ABBREVIATIONS FOR CITIES IN THE TRACE DATABASE
1 Addis Ababa Ethiopia ADD 14 Cairo Egypt CAI
2 Amman Jordan AMM 15 Cape Town South Africa CAP
3 Baku Azerbaijan BAK 16 Casablanca Morocco CAS
4 Bangkok Thailand BAN 17 Cebu Philippines CEB
5 Belgrade Serbia BE1 18 Cluj-Napoca Romania CLU
6 Belo Horizonte Brazil BEL 19 Colombo Sri Lanka COL
7 Bengaluru India BEN 20 Constanta Romania CON
8 Bogotá Colombia BOG/BO1 21 Craiova Romania CRA
9 Bhopal India BHO 22 Dakar Senegal DAK
10 Bratislava Slovakia BRA 23 Danang Vietnam DAN
11 Brasov Romania BR1/BRA 24 Dhaka Bangladesh DHA
12 Bucharest Romania BUC 25 Gaziantep Turkey GAZ
13 Budapest Hungary BUD 26 Guangzhou China GUA
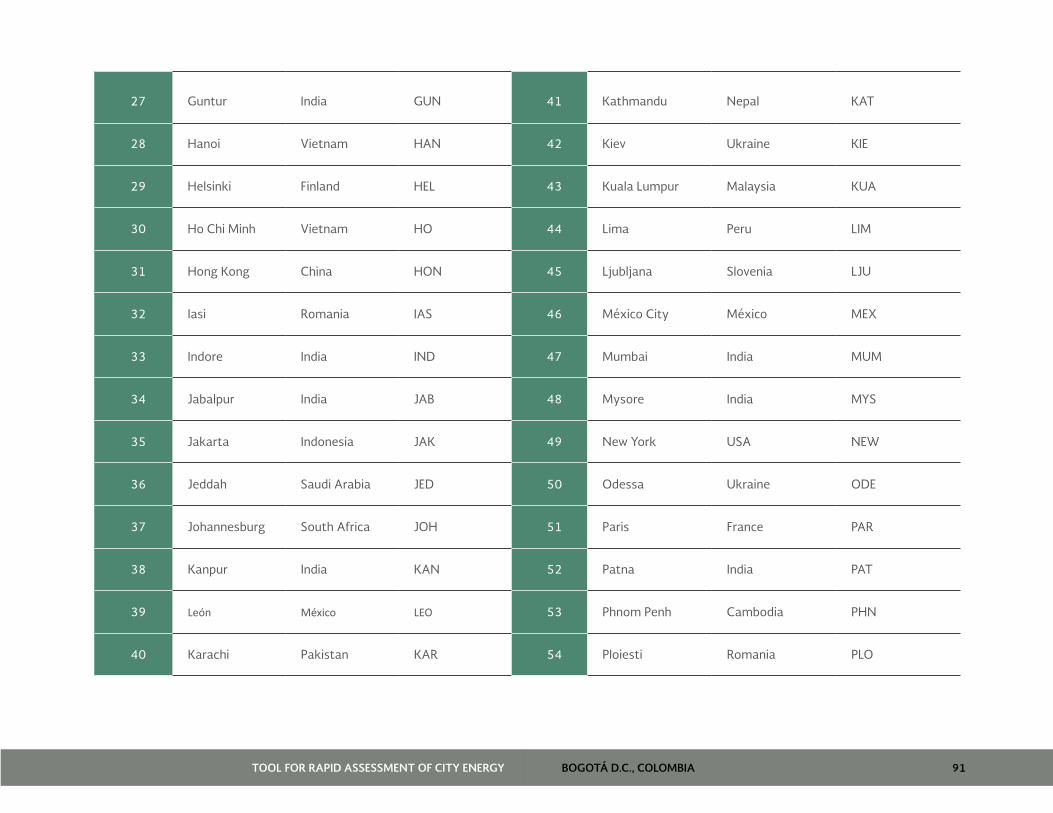
BOGOTÁ D.C., COLOMBIA 91TOOL FOR RAPID ASSESSMENT OF CITY ENERGY
27 Guntur India GUN 41 Kathmandu Nepal KAT
28 Hanoi Vietnam HAN 42 Kiev Ukraine KIE
29 Helsinki Finland HEL 43 Kuala Lumpur Malaysia KUA
30 Ho Chi Minh Vietnam HO 44 Lima Peru LIM
31 Hong Kong China HON 45 Ljubljana Slovenia LJU
32 Iasi Romania IAS 46 México City México MEX
33 Indore India IND 47 Mumbai India MUM
34 Jabalpur India JAB 48 Mysore India MYS
35 Jakarta Indonesia JAK 49 New York USA NEW
36 Jeddah Saudi Arabia JED 50 Odessa Ukraine ODE
37 Johannesburg South Africa JOH 51 Paris France PAR
38 Kanpur India KAN 52 Patna India PAT
39 León México LEO 53 Phnom Penh Cambodia PHN
40 Karachi Pakistan KAR 54 Ploiesti Romania PLO
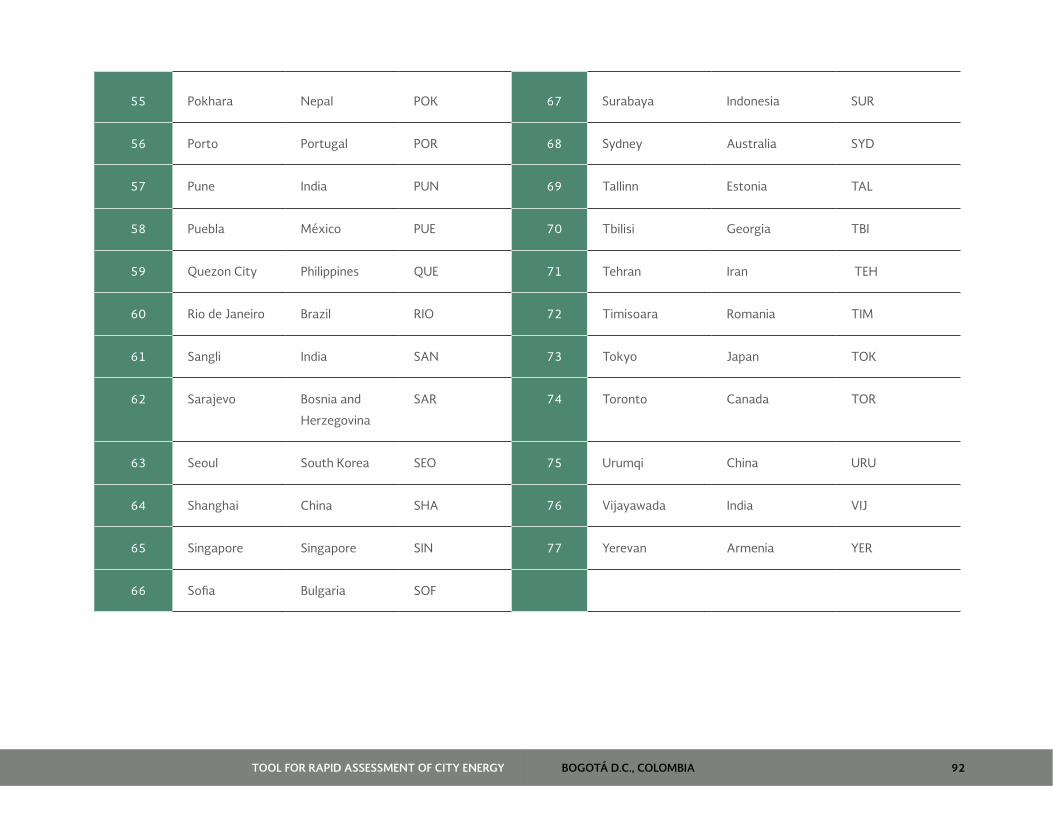
BOGOTÁ D.C., COLOMBIA 92TOOL FOR RAPID ASSESSMENT OF CITY ENERGY
55 Pokhara Nepal POK 67 Surabaya Indonesia SUR
56 Porto Portugal POR 68 Sydney Australia SYD
57 Pune India PUN 69 Tallinn Estonia TAL
58 Puebla México PUE 70 Tbilisi Georgia TBI
59 Quezon City Philippines QUE 71 Tehran Iran TEH
60 Rio de Janeiro Brazil RIO 72 Timisoara Romania TIM
61 Sangli India SAN 73 Tokyo Japan TOK
62 Sarajevo Bosnia and
Herzegovina
SAR 74 Toronto Canada TOR
63 Seoul South Korea SEO 75 Urumqi China URU
64 Shanghai China SHA 76 Vijayawada India VIJ
65 Singapore Singapore SIN 77 Yerevan Armenia YER
66 Sofia Bulgaria SOF


Related Documents