1 23 Environmental Monitoring and Assessment An International Journal Devoted to Progress in the Use of Monitoring Data in Assessing Environmental Risks to Man and the Environment ISSN 0167-6369 Volume 185 Number 10 Environ Monit Assess (2013) 185:8197-8213 DOI 10.1007/s10661-013-3167-6 Trace metal fractionation in the Pichavaram mangrove–estuarine sediments in southeast India after the tsunami of 2004 Rajesh Kumar Ranjan, Gurmeet Singh, Joyanto Routh & Al Ramanathan

Welcome message from author
This document is posted to help you gain knowledge. Please leave a comment to let me know what you think about it! Share it to your friends and learn new things together.
Transcript
1 23
Environmental Monitoring andAssessmentAn International Journal Devoted toProgress in the Use of Monitoring Datain Assessing Environmental Risks toMan and the Environment ISSN 0167-6369Volume 185Number 10 Environ Monit Assess (2013)185:8197-8213DOI 10.1007/s10661-013-3167-6
Trace metal fractionation in thePichavaram mangrove–estuarine sedimentsin southeast India after the tsunami of 2004
Rajesh Kumar Ranjan, Gurmeet Singh,Joyanto Routh & Al Ramanathan
1 23
Your article is protected by copyright and all
rights are held exclusively by Springer Science
+Business Media Dordrecht. This e-offprint
is for personal use only and shall not be self-
archived in electronic repositories. If you wish
to self-archive your article, please use the
accepted manuscript version for posting on
your own website. You may further deposit
the accepted manuscript version in any
repository, provided it is only made publicly
available 12 months after official publication
or later and provided acknowledgement is
given to the original source of publication
and a link is inserted to the published article
on Springer's website. The link must be
accompanied by the following text: "The final
publication is available at link.springer.com”.
Trace metal fractionation in the Pichavaram mangrove–estuarinesediments in southeast India after the tsunami of 2004
Rajesh Kumar Ranjan & Gurmeet Singh &
Joyanto Routh & Al Ramanathan
Received: 21 May 2012 /Accepted: 5 March 2013 /Published online: 22 March 2013# Springer Science+Business Media Dordrecht 2013
Abstract The geochemistry of coastal sediments ofsouthern India was altered after the tsunami in 2004. Afive-step sequential extraction procedure was applied toassess the effects of tsunami on mobility and redistribu-tion of selected elements (Cd, Cr, Cu, Fe, Mn, Ni, Pb,and Zn). Ten surface sediments and three cores wereanalyzed for different metal fractions (exchangeable,carbonate, reduced, oxidized, and residual). Total metalconcentrations increased in mangrove sediments afterthe tsunami, but their spatial distribution did not showsignificant variation (except Mn). The sediments weremixed by the tsunami, and there was lack of variation inmetal concentrations in different fractions with depth
(except Pb and Mn). High concentrations of Pb and Znoccurred in the oxide fractions, whereas Cu, Cr, Cd, andNi were high in the organic and sulfide-rich fractions.Metals in the residual fraction (lattice bound) had thehighest concentration suggesting their non-availabilityand limited biological uptake in the system. Most of themetals (except Mn) do not constitute a risk based on thedifferent geochemical indices.
Keywords Tsunami .Metals .Mangrove sediments .
Bioavailability . Risk assessment
Introduction
Mangroves are intertidal forests thriving in tropical andsub-tropical coastal areas between 25°N and 25°S andcover an area of 1.7–2.0×10⁵km2 (Borges et al. 2003).Mangrove sediments are characterized by high organicmatter (OM) content of poor nutrient quality, high sul-fide, and low oxygen levels. Because of the capacity ofmangrove sediments to trap suspended material from thewater column (Furukawa et al. 1997) and the strongaffinity of OM to sequester metals, these sediments havea high capacity to accumulate various inorganic andorganic pollutants (Tam and Wong 2000). In particular,mangrove sediments act as long-term sinks for variousmetals because: (1) the fine grain size of these sedimentsfavors sorption of metals trapped in the dense root net-work of mangrove vegetation and (2) stability of sulfide-rich minerals under anoxic conditions (Huerta-Diaz andMorse 1992). Yim and Tam (1999) highlighted toxicityof various metals (e.g., Cu, Zn, Cd, Cr, and Ni), which
Environ Monit Assess (2013) 185:8197–8213DOI 10.1007/s10661-013-3167-6
Electronic supplementary material The online version of thisarticle (doi:10.1007/s10661-013-3167-6) containssupplementary material, which is available to authorized users.
R. K. Ranjan (*)Centre for Environmental Sciences, Central Universityof Bihar, Patna 800014, Indiae-mail: [email protected]
R. K. Ranjan :G. Singh :A. RamanathanSchool of Environmental Sciences, Jawaharlal NehruUniversity, New Delhi 110067, India
G. Singhe-mail: [email protected]
A. Ramanathane-mail: [email protected]
J. RouthDepartment of Water and Environmental Studies,Linköping University, Linköping 58183, Swedene-mail: [email protected]
Author's personal copy
pose negative effects to both mangrove vegetation andsoil microbial activities. Notably, these metals tend toaccumulate in mangrove plant tissues and pose long-term damaging effects in the food chain throughbiomagnification (Tam and Wong 2000; Agoramoorthyet al. 2008). Hence, scientific studies on metal cycling inmangrove ecosystems have received remarkable atten-tion by numerous authors (Furukawa et al. 1997; Yimand Tam 1999; Tam and Wong 2000; Marchand et al.2012).
In coastal ecosystems, tsunamis cause significantchanges (Scheffers and Kelletat 2003; Szczucinski etal. 2005; Ranjan et al. 2008a, b). The impacts are notonly restricted to damage caused due to the directimpact of waves but they also include long-term con-sequences. For example, the devastating tsunami inSoutheast Asia in December 2004 deposited offshoresediments enriched in trace metals and transportedthem deep into the coastal regions when these areaswere inundated by seawater (Szczucinski et al. 2005;Seralathan et al. 2006; Babu et al. 2007; Srinivasalu etal. 2008). Located in the southeastern coastal region inpeninsular India, the Pichavaram mangrove–estuarinecomplex was widely impacted by the tsunami(Kathiresan and Rajendran 2005; Seralathan et al.2006; Senthilkumar et al. 2008; Fig. 1). Notably, thePichavaram mangroves along with the vegetation cov-er in Vellar estuary decreased direct impact of thetsunami and averted some of the damage (Kathiresanand Rajendran 2005). Nonetheless, in estuarine areas(Vellar and Coleroon estuaries), off-shore sedimentsup to 1 m in height were deposited, whereas in man-grove forests depending on the forest cover and dis-tance from sea, <40–50 cm of offshore sediments wasdeposited (Seralathan et al. 2006). Preliminary studiescarried out after the December 2004 tsunami reportedhigh contamination of Cd and moderate to strongcontamination of Cr, Pb, and Ni in coastal sedimentsfrom this area (Ranjan et al. 2008a, b; Srinivasalu et al.2008; Satheeshkumar et al. 2011). However, for envi-ronmental impact assessment, determination of thetotal metal concentration in sediments is not enough(McLaughlin et al. 2000; Krupadam et al. 2006;Marchand et al. 2012). Instead, knowledge regardingthe association of metals with different geochemicalfractions (carbonate, oxide, sulfide, OM, and residual)is far more critical to understand their distributionpatterns, long-term fate, and their potential uptake bythe biota.
The present study aims to understand the prove-nance and mobility of metals in the Pichavarammangrove–estuarine complex impacted by theDecember 2004 tsunami. The study follows our pre-liminary investigations on total metal concentrationsin the Pichavaram mangrove–estuarine complex(Ranjan et al. 2008a, b). To the best of our knowl-edge, metal fractionation has not been attempted inthe Pichavaram sediments, or for that matter, inother tsunami affected regions worldwide. We select-ed a suite of metals Cd, Cr, Cu, Fe, Mn, Ni, Pb, andZn, which are commonly investigated during envi-ronment impact assessments of contaminated sites.Furthermore, we investigated the impact of the tsu-nami on redistribution of these metals in differentgeochemical phases and the potential risks they posebased on different geochemical indices.
Study area
The Pichavaram mangroves are located between theVellar and Coleroon estuaries (latitude 11°23′ to 11°30′N, longitude 79°45′ to 79°50′E) in Tamil Nadu,southeast India (Fig. 1). Spreading over an area of11 km2, the site is covered by tide-dominated forests(50%), urban waterways (40%), andmud and sand flats(Kathiresan 2000). The annual temperature ranges from18 to 36 °C. The forests include 13 species of mangroveflora; Avicennia and Rhizophora are common plants(Kathiresan 2000). Pichavaram has lost 75 % of itsgreen cover in the last century, and of the existingforests, only 10 % has dense mangrove vegetation,whereas the remaining 90 % of total area is graduallydegrading (Kathiresan 2000).
The lithology includes gneiss, charnokite, granite,quartzite, limestone, and alluvium (Ramanathan et al.1993). Alluvium is dominant in the western part,whereas fluviomarine beach sands cover the easternpart. Input from the Cauvery River sustains the distrib-utaries of Coleroon River. The Cauvery River flowsthrough densely populated areas and transports fertil-izers, pesticides, and pollutant metals (Ramanathan etal. 1993). The Coleroon Estuary is heavily impacted byanthropogenic pollution, with high concentrations ofCr, Cd, Fe, Mn, and Zn (Ramanathan et al. 1999). Themangroves are also affected by aquaculture farmingmainly due to logging and deforestation (Cho et al.2004).
8198 Environ Monit Assess (2013) 185:8197–8213
Author's personal copy
Material and methods
Sample locations
Following the tsunami and after accessibility wasestablished to the Pichavaram mangrove–estuarinecomplex, we surveyed the area in January 2005.Sampling was done at locations impacted by the dev-astating tsunami (based on our survey and information
from the forest department and local governmentagencies). Some of these sites have been investigatedover the last few years to study the impact of the tsunamion issues ranging from loss of lives, general destructionof property and mangrove forests, and redistribution ofpollutants (e.g., Kathiresan and Rajendran 2005; Babuet al. 2007; Seralathan et al. 2006; Ranjan et al. 2008a,b). In addition, some of these sites were previouslyreported to have been affected by pollution activities
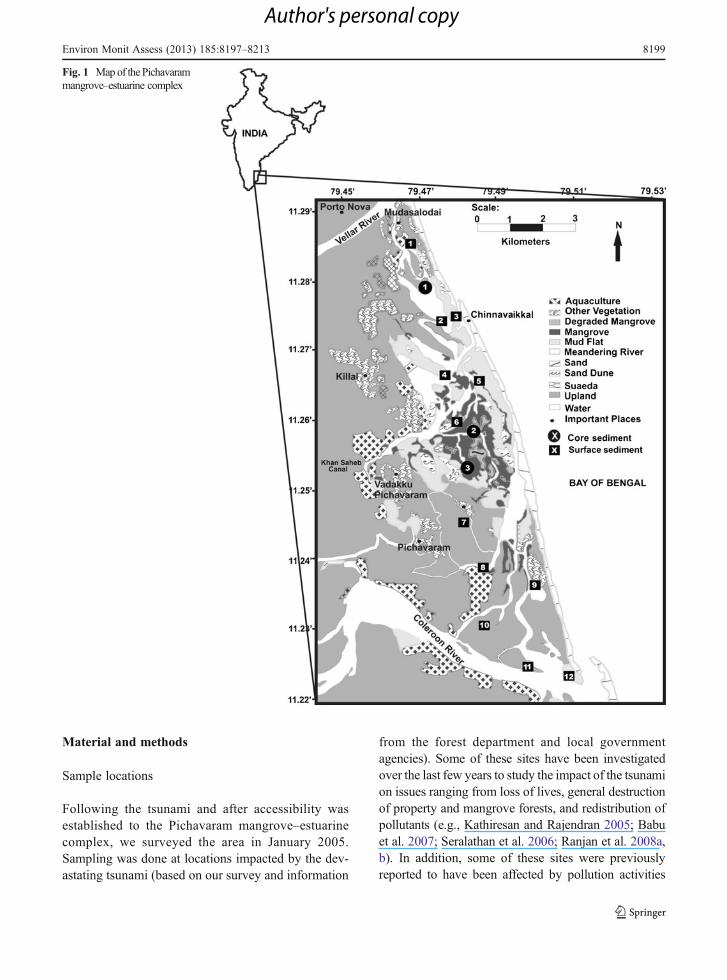
Fig. 1 Mapof the Pichavarammangrove–estuarine complex
Environ Monit Assess (2013) 185:8197–8213 8199
Author's personal copy
(Ramanathan et al. 1999). Ten surface (S1 to S10)sediments and three cores (C1, C2, and C3) werecollected from mangrove–estuarine complex, whichwas broadly divided into three zones (Fig. 1):
1. The Vellar Estuary influenced by the Vellar Rivercorresponded to a less vegetated and/or degradedmangrove. This area is grazed by cattle and loggedfor firewood. Surface sediments (S1, S2 (MGRTittu)), and S3 (Chinnavaikal) and core C1 (40 cmlong) were collected from this zone.
2. The dense mangrove forest is relatively undisturbedand pristine and designated a Forest Reserve. Thesurface sediments (S4, S5, S6, and S7) and two cores(C2 and C3, which were 50 and 40 cm long, respec-tively) were collected from this zone; core 2 wascollected from the area with dense vegetation cover.
3. The Coleroon Estuary influenced by the ColeroonRiver is a degraded mangrove covered by stunted(<1 m tall) Avicennia marina behind a Rhizophorafringe. The surface sediments (S8, S9, and S10)were collected from this area.
Sample collection and preservation
Surficial sediment samples (ca. 1 kg, 5 cm from surface)were collected in polyethylene bags using a stainlesssteel scooper. A hand-driven stainless steel corer with aninternal diameter of 7 cm was used for collecting thecores (35–45 cm in length). The cores were sliced atregular 5-cm interval and were immediately transferredinto polyethylene zip lock plastic bags. All sampleswere stored on ice-box in the field. The samples wererefrigerated at 4 °C in the laboratory on return untilfurther analyses. The samples were air-dried, finelyground, and homogenized for metal extractions. Thisis not ideal for sample preservation, but unfortunately,we did not have access to anaerobic glove box andfreeze-drying facilities in the laboratory.
Sediment geochemical analysis
Sediment samples were subjected to basic geochemi-cal analysis following different standard procedures.Halide free sediments were analyzed in Carlo-Erbaelemental analyzer (detection limit was 0.01 %) fortotal carbon (TC) and total sulfur (TS) content.Further, the organic matter was removed using 30 %(v/v) H2O2 (Jackson 1973), and the samples were used
for the determination of inorganic carbon (IC).Organic carbon (OC) was calculated by the differenceOC ¼ TC� ICð Þ. Total metal analyses in the surfaceand core sediments were carried out as per Shapiro(1975); 0.1 g of finely ground sample was digestedusing three acids (2 ml of HNO3/HCl in 1:3 ratio and5 ml HF) at 100 °C for 1.5 h; 5.6 g of boric acid crystal(H3BO3) was added and the final sample volume wasmade up to 100 ml by adding double-distilled water.The gelatinous precipitate of borosilicate was separat-ed by centrifugation followed by filtration withWhatman 0.45-μm cellulose nitrate filter paper.
Sequential extraction procedure
The five-step sequential extraction procedure by Tessieret al. (1979) was followed. Despite the fact that manyresearchers have indicated several weaknesses in thismethod (selectivity of extractant, re-adsorption, and pre-cipitation), it is still widely used for understanding metalfractionation (Adriano 2001). Five fractions weretargeted viz. readily available fractions (exchangeableand carbonate bound phases), redox-sensitive fractions(oxide bound and sulfide/organic bound phases), andlattice bound fraction (residual phase).
Extraction was carried out with 1.0 g of sediment;after each step, the sample was separated by centrifug-ing at 5,000 rpm for 40 min. The supernatant wascollected for metal analyses. This was followed bywashing the residue with double-distilled water andshaking the extractant for 20 min followed bycentrifuging. The supernatant was discarded and theresidue was used for the next extraction step:
Exchangeable fraction (F1): The samples wereextracted at room temperature for 1 h with 8 mlof magnesium chloride (1 M MgCl2 at pH 7.0)with continuous agitation.Carbonate bound fraction (F2): Residue from theF1 fraction was leached at room temperature with8 ml of 1 M NaOAc adjusted to pH 5.0 withacetic acid. Continuous agitation of the slurrywas maintained for 5 h.Oxide bound fraction (F3): Residue from the F2fraction was extracted with 20 ml of 0.04 MNH2OH.HCl in 25 % (v/v) acetic acid. The digestionwas done at 96±3 °C with continuous stirring for 6 h.Sulfide and organic bound fractions (F4): Threemilliliters of 0.02 M HNO3 along with 5 ml of
8200 Environ Monit Assess (2013) 185:8197–8213
Author's personal copy
30 % H2O2 (pH adjusted to 2 with HNO3) wasadded to the residue from F3 fraction and heatedat 85±3 °C for 2 h. Three milliliters of 30 % H2O2
was added and the heating continued for 3 h. Oncooling, 5 ml of NH4OAc was added, and theextract shaken for 30 min.Residual fraction (F5): 0.1 g of sample was takenfrom the sediment residue left after extraction offraction 4, and it was digested by the method usedfor total metal digestion (see “Sediment geochemicalanalysis”).
Two blanks (procedural blank and step blank) wereanalyzed with each set of eight samples. In order toevaluate the results, the sediment was subjected tototal metal digestion by the same method as in fractionF5. The % recovery of trace metals was calculated as:
%Recovery ¼P
F1þ F2þ F3þ F4þ F5ð Þ � Tmð ÞTmð Þ � 100
where F1, F2, F3, F4, and F5 were the different fractionsand Tm was total metal extracted by digestion with aquaregia: HF mixture. The samples were analyzed on anAtomic Absorption Spectrophotometer (Shimadzu AA6800) using an air-acetylene flame. The prescribed de-tection limits were as follows: Cd (0.01–2.00 μg/g), Cr(0.06–30.0 μg/g), Cu (0.04–10.0 μg/g), Fe (0.02–20.0 μg/g), Mn (0.03–6.00 μg/g), Ni (0.2–20.0 μg/g),Pb (0.20–30.0 μg/g), and Zn (0.01–2.00 μg/g). Theaccuracy of total metal digestion procedure wasassessed using Certified Reference Material (CRMMESS-2) digested in the same manner as in the totalmetal extraction procedure.
Spatial variations in metal fractionation were testedfor significance using a two-way analysis of variance onSPSS (version 16). In addition, impact of the mixingwith respect to depth was assessed using a linear mixingmodel ENCOVA (SPSS; version 16). The model as-sumed that observations for samples within a core wererepeated measurements on the same core. However,samples within a core differed from each other withrespect to their depth. Depth corresponding to the mid-point of a section was considered as the depth of thatsample. If yij denoted the observation on the jth sampleof the ith core, the model could be expressed as:
yij ¼ μþ t i þ a � xij þ "ij i ¼ 1; 2; 3; j ¼ 1; 2 . . . 9:
where τi was the effect of the ith core; xij denoted thedepth of the jth section of the ith core; ∈ij was the error.
The core effects were assumed to be random error forsamples within a core were correlated, whereas the errorbelonging to the samples of two different cores wereindependent. The effects of depth on concentration ofvarious metals were indicated by α (see SupplementaryData, Table 2).
Results
The average concentration of total carbon, organiccarbon, and total sulfur in the sediments was observedas 14.46±4.0, 10.18±3.48, and 7.22±0.08 mg/g, re-spectively. The organic carbon was approximately70 % of the total carbon. The further details of sedi-ment characteristics have been presented elsewhere in(Ranjan et al. (2008a, b).
Results of the metal analyses in CRM-MESS 2(average concentration of four separate extractions)are shown in Table 1. The results showed a goodprecision (<10 %) and accuracy (recovery=100±5 %) for most elements. A high recovery was obtainedfor Cr, whereas recovery of Fe and Mn was relativelylow. Average recoveries for Cu, Cd, Ni, Pb, and Znwere acceptable (n=4, significance level 0.05).
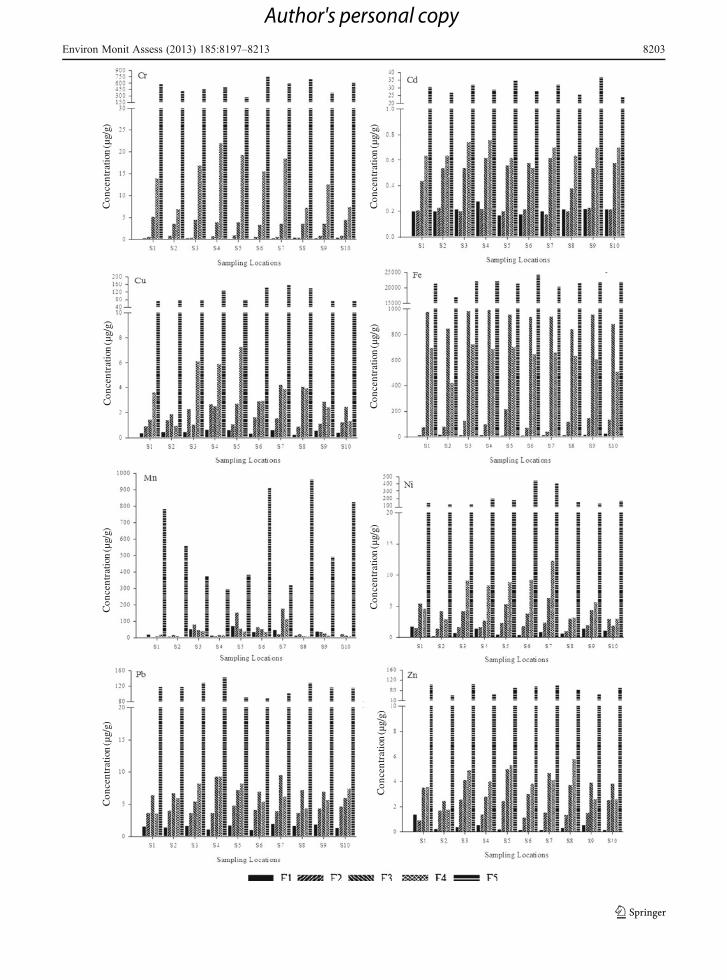
Recovery of total metal concentration varied from95 to 114 % with that of metal fractionation. Cd, Cr,Fe, Ni, and Pb indicated relatively low recovery thanthose of Cu, Mn, and Zn (see Supplementary Data,Fig. 1). Most of surface sediment samples showed thehighest proportion of metal concentration in residualfraction, F5 (Figs. 2 and 3a–h) irrespective of thespecific metals analyzed in this study.
Characteristics of the sampling locations played animportant role in partitioning of metal within the sed-iment. Readily available fractions (F1 and F2) werethe second most dominant fractions for Cd, Pb, and Znin surface sediments collected from the Vellar estuary.In contrast, organic/sulfide bound fraction (F4) wasthe dominant fraction for Cd, Cr, Cu, Fe, Ni, Pb, andZn in surface sediment samples collected from man-grove areas. The Fe and Cr concentrations were higherin surface sediment samples collected from theColeroon than those from the Vellar estuary.Concentration of Mn was higher in mangrove sedi-ments for all fractions than those of samples collectedfrom the Vellar and Coleroon estuaries.
Cd concentration was low in F1 and F2 fractionsfor all three cores and did not show specific variation
Environ Monit Assess (2013) 185:8197–8213 8201
Author's personal copy
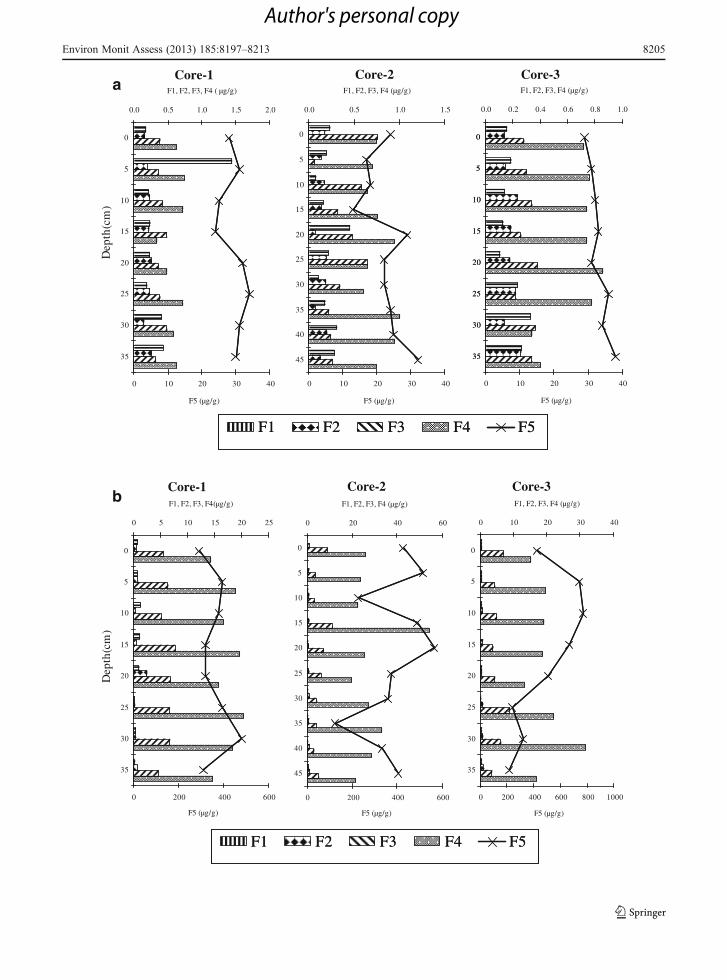
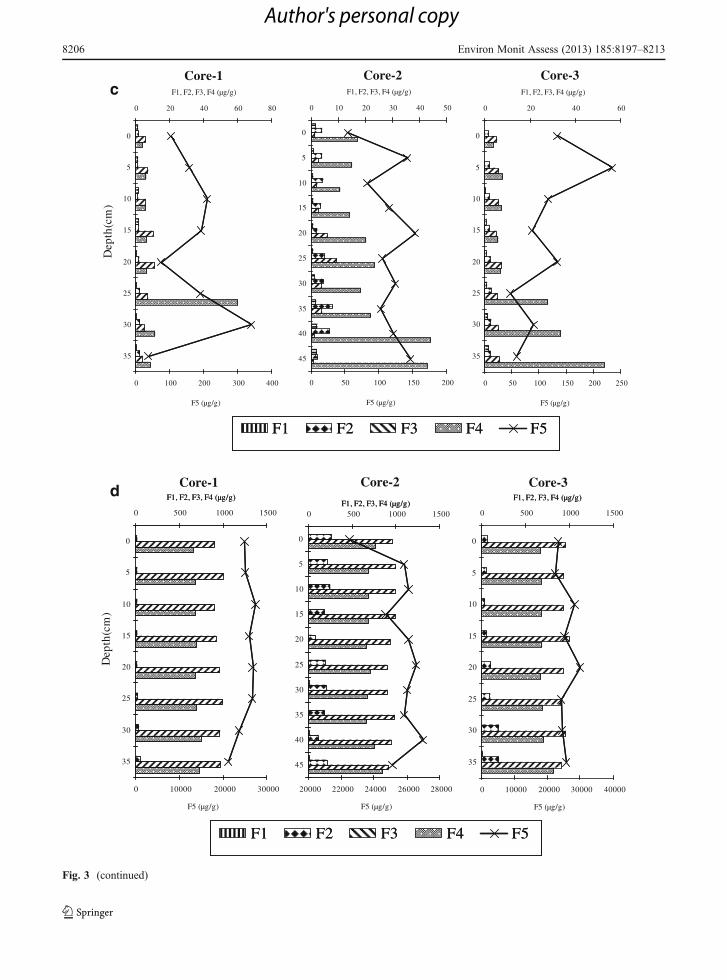
along the depth (Fig. 3a). However, in core 3, Cd washigh in F4 fraction but decreased below 20 cm. In core3, Cr increased in F4 fraction below 30 cm. In core 2,maximum concentration of Cr was observed in the F4fraction at 15 cm. Likewise, variation of Cu with depthbetween the different fractions was also absent. Adecrease in Cu concentrations in F5 fraction was ob-served in all the cores. In contrast, in the F4 fraction,Cu increased with depth in all the cores (Fig. 3c).Nickel showed irregular trends in cores 1 and 2,whereas in core 3 an increase with depth was ob-served. There were no significant depth-wise varia-tions in Ni concentrations in all the fractions for allcores. Likewise, no specific trends of Pb variationwere observed. The F3 and F4 fractions showed anincrease in Pb around 15–20 cm in core 1, while incore 2 the change occurred at 10–15 and 25–30 cm,respectively. In core 3, the F4 fraction showed maxi-mum concentration of Pb at 20 cm. In core 2, high Znconcentrations occurred at 35 cm in F1, F2, and F3fractions.
There was no significant spatial variation of metalsin surface sediments except for Mn (p≤0.05).However, geochemical partitioning of metals with re-spect to the different fractions (F1 to F5) was statisti-cally significant (p≤0.05; see Supplementary DataTable 2). The effect of depth on concentration ofvarious metals indicated by α was not significant formost of the metals (except fraction F1 for Fe, F3 forZn, and F4 for Cu).
Discussion
Previous studies showed that distribution of metals inthe Pichavarammangrove–estuarine complex have beenimpacted by natural and anthropogenic activities(Ramanathan et al. 1999; Ranjan et al. 2008b). In par-ticular, sediment texture and various physical and chem-ical properties of sediments in Pichavaram were alteredby rapid mixing and deposition of sediments by thetsunami (Kathiresan and Rajendran 2005; Babu et al.
2007; Seralathan et al. 2006, Ranjan et al. 2008a, b). Thenewly deposited sediments by retreating seawater wereessentially a mixture of both estuarine sediments andsoils from nearby agriculture fields (Ranjan et al.2008b). The absence of control of sediment grain sizeover elemental distribution suggested rigorous mixingof sediment in mangrove ecosystem due to energetictsunami water (Ranjan et al. 2008a). Notably, physicaldisturbances are more significant in sandy areas as wellas in places with limited vegetation cover. On contrary,physical disturbances are considerably less in denseforest region. This possibly could be due to the highbinding capacity of intricate root systems of mangrovespecies (Kathiresan 2000; Kathiresan and Rajendran2005). Below we have individually discussed the trendsand partitioning of metals (Cr, Cu, Fe, Mn, Ni, Pb, andZn) in different fractions (F1 to F5) in surface sedimentsand cores from the Pichavaram mangrove–estuarinecomplex. The sources of these metals are due to ongoinganthropogenic activities in the adjacent area and off-shore sediments deposited by the tsunami. The metals,however, are partitioned in different patterns in sedimentprofile, which are based on their geochemical affinitieswith each other. The specific trends with respect to themetal fractionation confirm their abundance in differentfractions.
An overall increase in total metal concentrations(Cd, Cr, Cu, Fe, Mn, Ni, Pb, and Zn) was observedin the surface sediment. Metal concentration was thehighest in F5 fraction, which indicates the strongassociation of these metals within their crystal lattice.Notably spatial variation in metals between differentfractions in surface sediment of all sampling locationswas not significant (at significance level 0.05) (seeSupplementary Data, Table 1). This suggests that thetsunami disturbed the whole area and redistributed themetals with the newly deposited material. The impactwas more pronounced in core 1 because it was
Table 1 Analyzed vs. prescribed values of various trace metals (in micrograms per gram) for CRM-MESS-2 (n=4 observations)
Cr Cu Pb Zn Cd Ni Mn Fe
Mess 2 106 39 22 17 24 49 362 43,540
Observed values 152±26 34±5.8 21±2.0 16±3.5 23±2.3 51±2.9 330±22 38,027±3,769
�Fig. 2 Distribution of metals (in micrograms per gram) ingeochemical fractions at different sampling locations in surfacesediments from the Pichavaram mangrove–estuarine complex
8202 Environ Monit Assess (2013) 185:8197–8213
Author's personal copy
Con
cent
ratio
n (µ
g/g)
Con
cent
ratio
n (µ
g/g)
Con
cent
ratio
n (µ
g/g)
Con
cent
ratio
n (µ
g/g)
Con
cent
ratio
n (µ
g/g)
Con
cent
ratio
n (µ
g/g)
Con
cent
ratio
n (µ
g/g)
Con
cent
ratio
n (µ
g/g)
Environ Monit Assess (2013) 185:8197–8213 8203
Author's personal copy
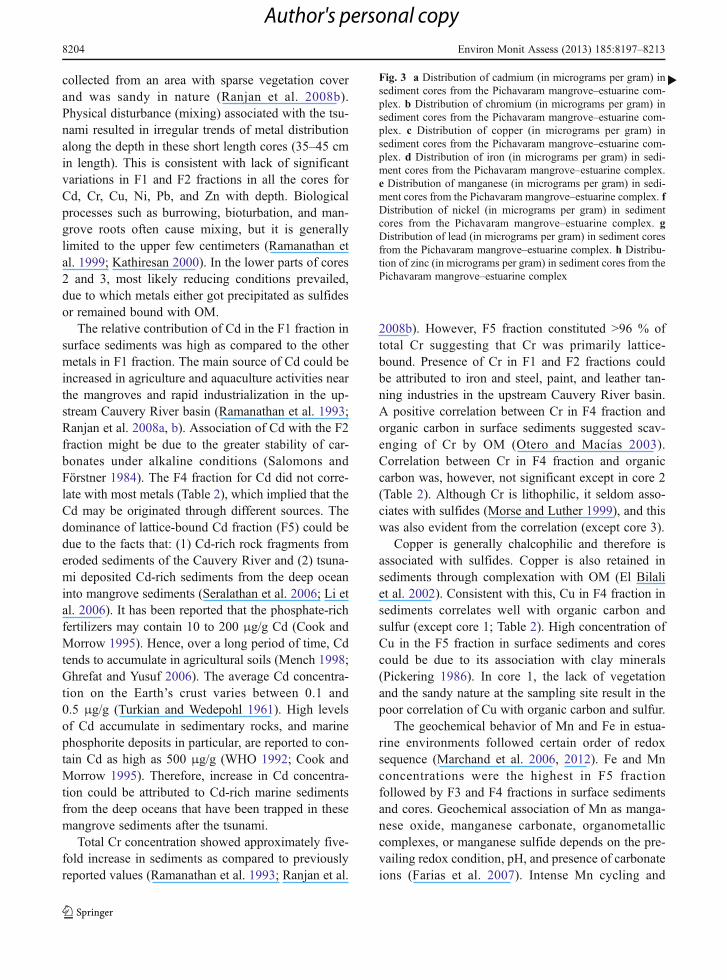
collected from an area with sparse vegetation coverand was sandy in nature (Ranjan et al. 2008b).Physical disturbance (mixing) associated with the tsu-nami resulted in irregular trends of metal distributionalong the depth in these short length cores (35–45 cmin length). This is consistent with lack of significantvariations in F1 and F2 fractions in all the cores forCd, Cr, Cu, Ni, Pb, and Zn with depth. Biologicalprocesses such as burrowing, bioturbation, and man-grove roots often cause mixing, but it is generallylimited to the upper few centimeters (Ramanathan etal. 1999; Kathiresan 2000). In the lower parts of cores2 and 3, most likely reducing conditions prevailed,due to which metals either got precipitated as sulfidesor remained bound with OM.
The relative contribution of Cd in the F1 fraction insurface sediments was high as compared to the othermetals in F1 fraction. The main source of Cd could beincreased in agriculture and aquaculture activities nearthe mangroves and rapid industrialization in the up-stream Cauvery River basin (Ramanathan et al. 1993;Ranjan et al. 2008a, b). Association of Cd with the F2fraction might be due to the greater stability of car-bonates under alkaline conditions (Salomons andFörstner 1984). The F4 fraction for Cd did not corre-late with most metals (Table 2), which implied that theCd may be originated through different sources. Thedominance of lattice-bound Cd fraction (F5) could bedue to the facts that: (1) Cd-rich rock fragments fromeroded sediments of the Cauvery River and (2) tsuna-mi deposited Cd-rich sediments from the deep oceaninto mangrove sediments (Seralathan et al. 2006; Li etal. 2006). It has been reported that the phosphate-richfertilizers may contain 10 to 200 μg/g Cd (Cook andMorrow 1995). Hence, over a long period of time, Cdtends to accumulate in agricultural soils (Mench 1998;Ghrefat and Yusuf 2006). The average Cd concentra-tion on the Earth’s crust varies between 0.1 and0.5 μg/g (Turkian and Wedepohl 1961). High levelsof Cd accumulate in sedimentary rocks, and marinephosphorite deposits in particular, are reported to con-tain Cd as high as 500 μg/g (WHO 1992; Cook andMorrow 1995). Therefore, increase in Cd concentra-tion could be attributed to Cd-rich marine sedimentsfrom the deep oceans that have been trapped in thesemangrove sediments after the tsunami.
Total Cr concentration showed approximately five-fold increase in sediments as compared to previouslyreported values (Ramanathan et al. 1993; Ranjan et al.
2008b). However, F5 fraction constituted >96 % oftotal Cr suggesting that Cr was primarily lattice-bound. Presence of Cr in F1 and F2 fractions couldbe attributed to iron and steel, paint, and leather tan-ning industries in the upstream Cauvery River basin.A positive correlation between Cr in F4 fraction andorganic carbon in surface sediments suggested scav-enging of Cr by OM (Otero and Macías 2003).Correlation between Cr in F4 fraction and organiccarbon was, however, not significant except in core 2(Table 2). Although Cr is lithophilic, it seldom asso-ciates with sulfides (Morse and Luther 1999), and thiswas also evident from the correlation (except core 3).
Copper is generally chalcophilic and therefore isassociated with sulfides. Copper is also retained insediments through complexation with OM (El Bilaliet al. 2002). Consistent with this, Cu in F4 fraction insediments correlates well with organic carbon andsulfur (except core 1; Table 2). High concentration ofCu in the F5 fraction in surface sediments and corescould be due to its association with clay minerals(Pickering 1986). In core 1, the lack of vegetationand the sandy nature at the sampling site result in thepoor correlation of Cu with organic carbon and sulfur.
The geochemical behavior of Mn and Fe in estua-rine environments followed certain order of redoxsequence (Marchand et al. 2006, 2012). Fe and Mnconcentrations were the highest in F5 fractionfollowed by F3 and F4 fractions in surface sedimentsand cores. Geochemical association of Mn as manga-nese oxide, manganese carbonate, organometalliccomplexes, or manganese sulfide depends on the pre-vailing redox condition, pH, and presence of carbonateions (Farias et al. 2007). Intense Mn cycling and
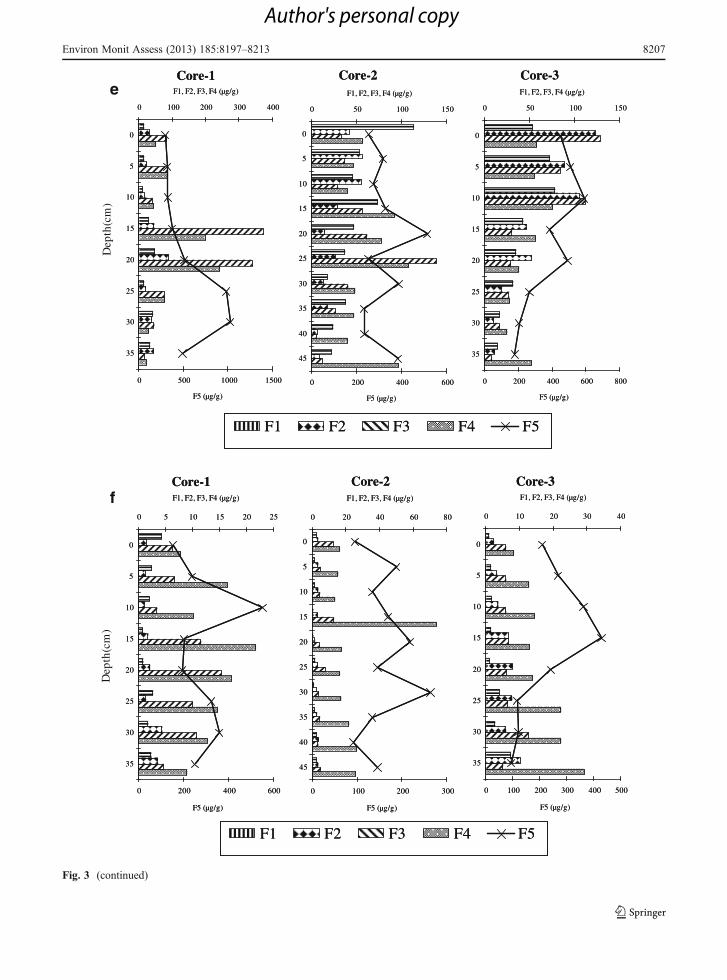
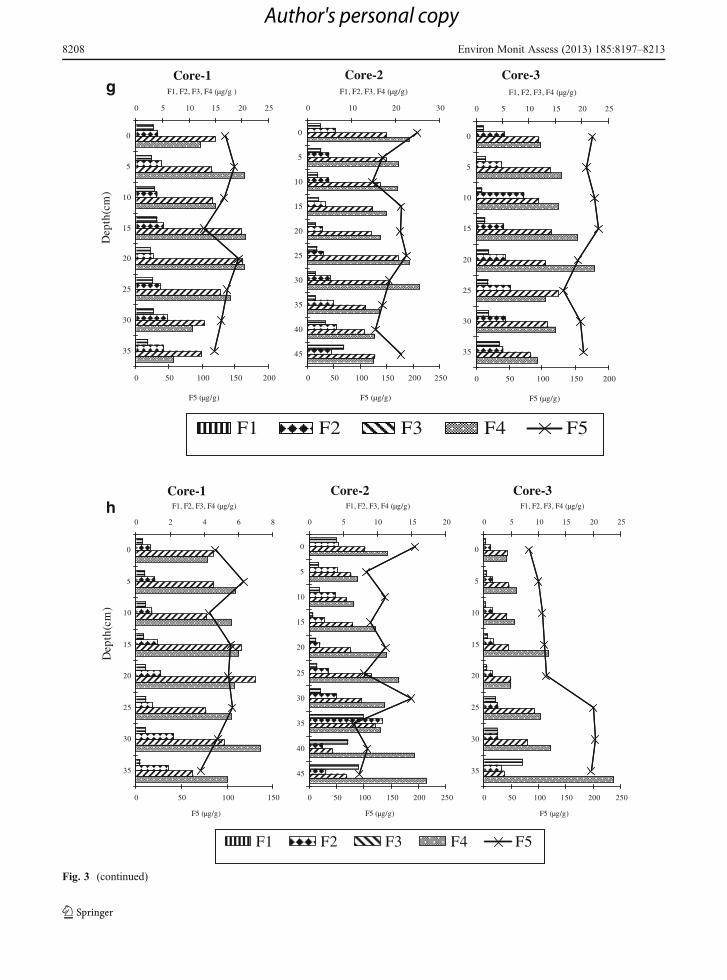
�Fig. 3 a Distribution of cadmium (in micrograms per gram) insediment cores from the Pichavaram mangrove–estuarine com-plex. b Distribution of chromium (in micrograms per gram) insediment cores from the Pichavaram mangrove–estuarine com-plex. c Distribution of copper (in micrograms per gram) insediment cores from the Pichavaram mangrove–estuarine com-plex. d Distribution of iron (in micrograms per gram) in sedi-ment cores from the Pichavaram mangrove–estuarine complex.e Distribution of manganese (in micrograms per gram) in sedi-ment cores from the Pichavaram mangrove–estuarine complex. fDistribution of nickel (in micrograms per gram) in sedimentcores from the Pichavaram mangrove–estuarine complex. gDistribution of lead (in micrograms per gram) in sediment coresfrom the Pichavaram mangrove–estuarine complex. h Distribu-tion of zinc (in micrograms per gram) in sediment cores from thePichavaram mangrove–estuarine complex
8204 Environ Monit Assess (2013) 185:8197–8213
Author's personal copy
Dep
th(c
m)
F1 F2 F3 F4 F5
Core-3Corea
-1 Core-2
0.0 0.5 1.0 1.5 2.0
0
5
10
15
20
25
30
35
F1, F2, F3, F4 ( µg/g)
0 10 20 30 40
F5 (µg/g)
0.0 0.5 1.0 1.5
0
5
10
15
20
25
30
35
40
45
F1, F2, F3, F4 (µg/g)
0 10 20 30 40
F5 (µg/g)
0.0 0.2 0.4 0.6 0.8 1.0
0
5
10
15
20
25
30
35
F1, F2, F3, F4 (µg/g)
0 10 20 30 40
F5 (µg/g)
F1 F2 F3 F4 F5
0
5
10
15
20
25
30
35
Dep
th(c
m)
F1 F2 F3 F4 F5
Core-3Coreb
-1 Core-2
0 5 10 15 20 25
0
5
10
15
20
25
30
35
F1, F2, F3, F4(µg/g)
0 200 400 600
F5 (µg/g)
0 20 40 60
0
5
10
15
20
25
30
35
40
45
F1, F2, F3, F4 (µg/g)
0 200 400 600
F5 (µg/g)
0 10 20 30 40
0
5
10
15
20
25
30
35
F1, F2, F3, F4 (µg/g)
0 200 400 600 800 1000
F5 (µg/g)
F1 F2 F3 F4 F5
Environ Monit Assess (2013) 185:8197–8213 8205
Author's personal copy
Dep
th(c
m)
F1 F2 F3 F4 F5
Core-3Corec
d
-1 Core-2
0 20 40 60 80
0
5
10
15
20
25
30
35
F1, F2, F3, F4 (µg/g)
0 100 200 300 400
F5 (µg/g)
0 10 20 30 40 50
0
5
10
15
20
25
30
35
40
45
F1, F2, F3, F4 (µg/g)
0 50 100 150 200
F5 (µg/g)
0 20 40 60
0
5
10
15
20
25
30
35
F1, F2, F3, F4 (µg/g)
0 50 100 150 200 250
F5 (µg/g)
F1 F2 F3 F4 F5
Dep
th(c
m)
Core-3Core-1 Core-2
F1 F2 F3 F4 F5
0 500 1000 1500
0
5
10
15
20
25
30
35
F1, F2, F3, F4 (µg/g)
0 10000 20000 30000
F5 (µg/g)
0 500 1000 1500
0
5
10
15
20
25
30
35
40
45
F1, F2, F3, F4 (µg/g)
20000 22000 24000 26000 28000
F5 (µg/g)
0 500 1000 1500
0
5
10
15
20
25
30
35
F1, F2, F3, F4 (µg/g)
0 10000 20000 30000 40000
F5 (µg/g)
F1 F2 F3 F4 F5
F1, F2, F3, F4 (µg/g)F1, F2, F3, F4 (µg/g)
F1, F2, F3, F4 (µg/g)
Fig. 3 (continued)
8206 Environ Monit Assess (2013) 185:8197–8213
Author's personal copy
Dep
th(c
m)
F1 F2 F3 F4 F5
Core-3Core-1 Core-2
0 100 200 300 400
0
5
10
15
20
25
30
35
F1, F2, F3, F4 (µg/g)
0 500 1000 1500
F5 (µg/g)
0 50 100 150
0
5
10
15
20
25
30
35
40
45
F1, F2, F3, F4 (µg/g)
0 200 400 600
F5 (µg/g)
0 50 100 150
0
5
10
15
20
25
30
35
F1, F2, F3, F4 (µg/g)
0 200 400 600 800
F5 (µg/g)
F1 F2 F3 F4 F5
Core-3Coree
f
-1 Core-2
0 100 200 300 400
0
5
10
15
20
25
30
35
F1, F2, F3, F4 (µg/g)
0 500 1000 1500
F5 (µg/g)
0 50 100 150
0
5
10
15
20
25
30
35
40
45
F1, F2, F3, F4 (µg/g)
0 200 400 600
F5 (µg/g)
0 50 100 150
0
5
10
15
20
25
30
35
F1, F2, F3, F4 (µg/g)
0 200 400 600 800
F5 (µg/g)
Dep
th(c
m)
F1 F2 F3 F4 F5
Core-3Core-1 Core-2
0 5 10 15 20 25
0
5
10
15
20
25
30
35
F1, F2, F3, F4 (µg/g)
0 200 400 600
F5 (µg/g)
0 20 40 60 80
0
5
10
15
20
25
30
35
40
45
F1, F2, F3, F4 (µg/g)
0 100 200 300
F5 (µg/g)
0 10 20 30 40
0
5
10
15
20
25
30
35
F1, F2, F3, F4 (µg/g)
0 100 200 300 400 500
F5 (µg/g)
F1 F2 F3 F4 F5
Core-3Core-1 Core-2
0 5 10 15 20 25
0
5
10
15
20
25
30
35
F1, F2, F3, F4 (µg/g)
0 200 400 600
F5 (µg/g)
0 20 40 60 80
0
5
10
15
20
25
30
35
40
45
F1, F2, F3, F4 (µg/g)
0 100 200 300
F5 (µg/g)
0 10 20 30 40
0
5
10
15
20
25
30
35
F1, F2, F3, F4 (µg/g)
0 100 200 300 400 500
F5 (µg/g)
Fig. 3 (continued)
Environ Monit Assess (2013) 185:8197–8213 8207
Author's personal copy
Dep
th(c
m)
F1 F2 F3 F4 F5
Core-3Core-1 Core-2
0 5 10 15 20 25
0
5
10
15
20
25
30
35
F1, F2, F3, F4 (µg/g )
0 50 100 150 200
F5 (µg/g)
0 10 20 30
0
5
10
15
20
25
30
35
40
45
F1, F2, F3, F4 (µg/g)
0 50 100 150 200 250
F5 (µg/g)
0 5 10 15 20 25
0
5
10
15
20
25
30
35
F1, F2, F3, F4 (µg/g)
0 50 100 150 200
F5 (µg/g)
Dep
th(c
m)
F1 F2 F3 F4 F5
Core-3Core-1 Core-2
0 2 4 6 8
0
5
10
15
20
25
30
35
F1, F2, F3, F4 (µg/g)
0 50 100 150
F5 (µg/g)
0 5 10 15 20
0
5
10
15
20
25
30
35
40
45
F1, F2, F3, F4 (µg/g)
0 50 100 150 200 250
F5 (µg/g)
0 5 10 15 20 25
0
5
10
15
20
25
30
35
F1, F2, F3, F4 (µg/g)
0 50 100 150 200 250
F5 (µg/g)
g
h
Fig. 3 (continued)
8208 Environ Monit Assess (2013) 185:8197–8213
Author's personal copy
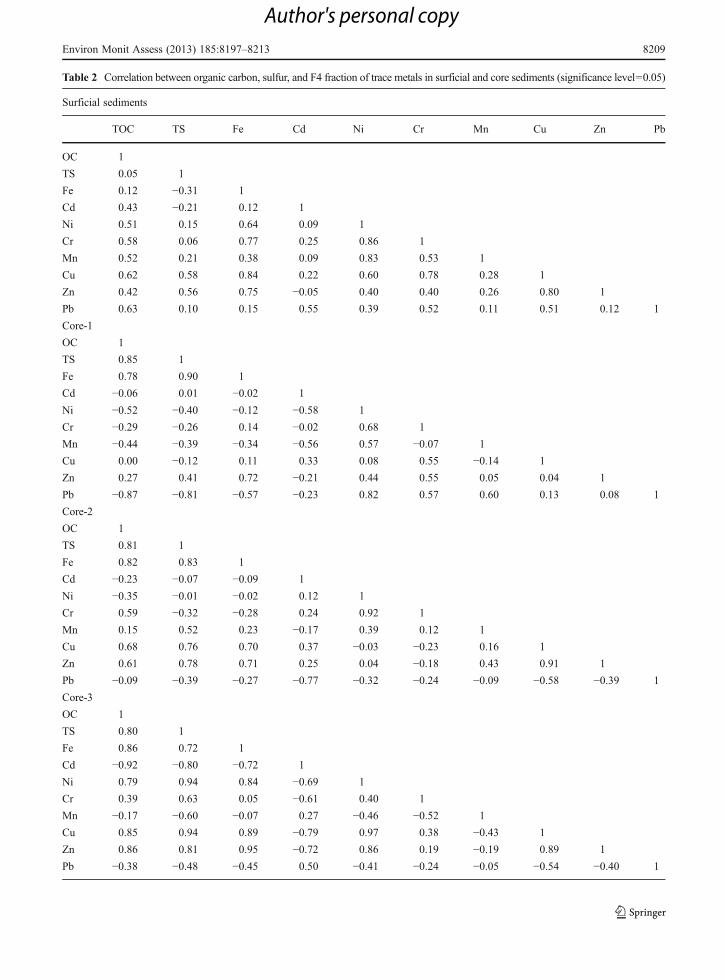
Table 2 Correlation between organic carbon, sulfur, and F4 fraction of trace metals in surficial and core sediments (significance level=0.05)
Surficial sediments
TOC TS Fe Cd Ni Cr Mn Cu Zn Pb
OC 1
TS 0.05 1
Fe 0.12 −0.31 1
Cd 0.43 −0.21 0.12 1
Ni 0.51 0.15 0.64 0.09 1
Cr 0.58 0.06 0.77 0.25 0.86 1
Mn 0.52 0.21 0.38 0.09 0.83 0.53 1
Cu 0.62 0.58 0.84 0.22 0.60 0.78 0.28 1
Zn 0.42 0.56 0.75 −0.05 0.40 0.40 0.26 0.80 1
Pb 0.63 0.10 0.15 0.55 0.39 0.52 0.11 0.51 0.12 1
Core-1
OC 1
TS 0.85 1
Fe 0.78 0.90 1
Cd −0.06 0.01 −0.02 1
Ni −0.52 −0.40 −0.12 −0.58 1
Cr −0.29 −0.26 0.14 −0.02 0.68 1
Mn −0.44 −0.39 −0.34 −0.56 0.57 −0.07 1
Cu 0.00 −0.12 0.11 0.33 0.08 0.55 −0.14 1
Zn 0.27 0.41 0.72 −0.21 0.44 0.55 0.05 0.04 1
Pb −0.87 −0.81 −0.57 −0.23 0.82 0.57 0.60 0.13 0.08 1
Core-2
OC 1
TS 0.81 1
Fe 0.82 0.83 1
Cd −0.23 −0.07 −0.09 1
Ni −0.35 −0.01 −0.02 0.12 1
Cr 0.59 −0.32 −0.28 0.24 0.92 1
Mn 0.15 0.52 0.23 −0.17 0.39 0.12 1
Cu 0.68 0.76 0.70 0.37 −0.03 −0.23 0.16 1
Zn 0.61 0.78 0.71 0.25 0.04 −0.18 0.43 0.91 1
Pb −0.09 −0.39 −0.27 −0.77 −0.32 −0.24 −0.09 −0.58 −0.39 1
Core-3
OC 1
TS 0.80 1
Fe 0.86 0.72 1
Cd −0.92 −0.80 −0.72 1
Ni 0.79 0.94 0.84 −0.69 1
Cr 0.39 0.63 0.05 −0.61 0.40 1
Mn −0.17 −0.60 −0.07 0.27 −0.46 −0.52 1
Cu 0.85 0.94 0.89 −0.79 0.97 0.38 −0.43 1
Zn 0.86 0.81 0.95 −0.72 0.86 0.19 −0.19 0.89 1
Pb −0.38 −0.48 −0.45 0.50 −0.41 −0.24 −0.05 −0.54 −0.40 1
Environ Monit Assess (2013) 185:8197–8213 8209
Author's personal copy
measurable rates of Fe-Mn reduction occur in man-grove roots (Alongi et al. 2005), and this was consis-tent with the higher concentrations of Fe and Mn in F3and F4 fraction in sampling locations in mangroveforests. Alongi et al. (2005) reported that disturbancessuch as cattle grazing and lack of vegetation signifi-cantly impacts the distribution of Mn in Pichavaram(Alongi et al. 2005). This was further supported by thesignificant spatial variability, relatively higher concen-tration of Mn in F4 fraction, and strong positive cor-relation with OM in surface sediments (Table 2). Nosignificant variation in Fe and Mn concentrations withdepth in the different fractions suggests intensivemixing of sediments. Increase of Mn in the F3 fractionin cores 1 to 3 possibly supports the idea of enhancedoxygen percolation and precipitation of Mn oxides(Huerta-Diaz and Morse 1992).
Pyrite and sulfidic minerals contain high levels ofNi (Morse and Luther 1999). Dominance of Ni in F5fraction suggested that Ni was primarily lattice-bound.The low concentration of Ni in F2 fraction in sedimentwas probably because Ni rarely forms thermodynam-ically stable minerals with carbonates (Koretsky et al.2007). Moreover, the affinity of Ni for sorption tocarbonates is smaller than other substrates, includingclay minerals, Fe–Mn oxides, and OM (Green-Pedersen et al. 1997). The increase in Ni in F4 fractionin core 3 results from association of Ni with sulfides inestuaries (Li et al. 2005; Marchand et al. 2012).Likewise, Farias et al. (2007) reported that in man-grove environments, sulfide is generally in abundanceunder reducing condition, favoring precipitation of Nias insoluble sulfides.
In natural ecosystem, a significant part of Pb orig-inates from weathering of rocks rich in Fe–Mn oxides(Jones and Turkie 1997). Like other elements, Pb wasmost abundant in the F5 fraction, which was primarilylattice bound. Lead was not abundant in the F1 frac-tion. Concentration of Pb was, however, high in F3fraction, where it formed stable complexes with Fe–Mn oxides (Jones and Turkie 1997). Lead was alsoabundant in F4 fraction, where it associated well withOM and sulfides (Morse and Luther 1999; Cappuynsand Swennen 2005).
Concentration of Zn in the F1 and F2 fractions waslow, but abundant in F5 fraction like other metals.Relatively high concentrations of Zn in the F3 andF4 fractions showed that mobility of Zn wasinfluenced by redox conditions and availability of T
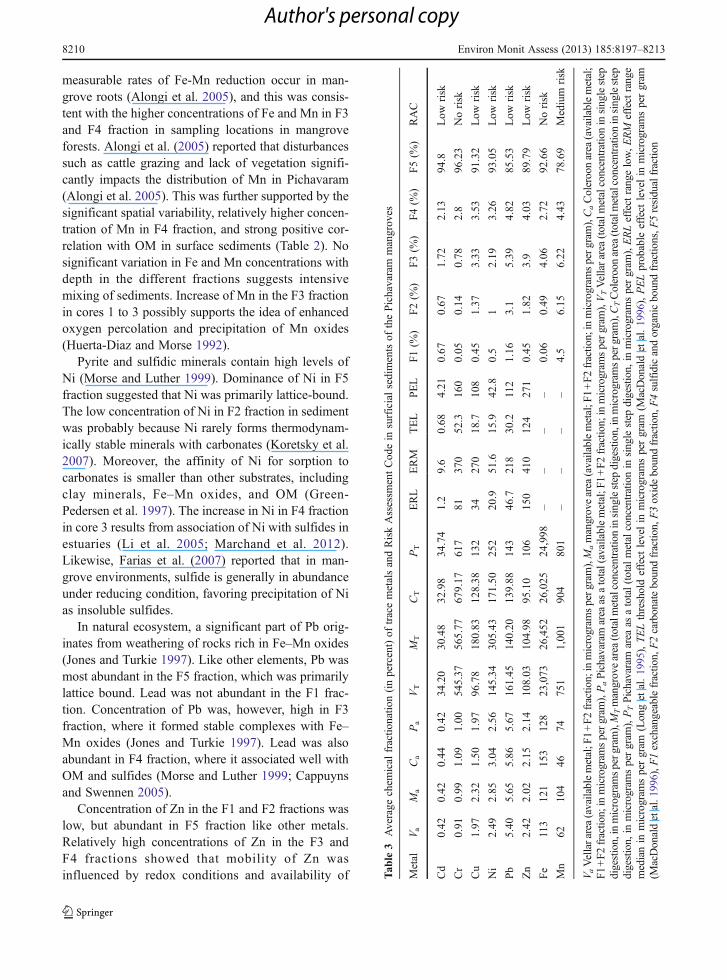
able
3Average
chem
ical
fractio
natio
n(inpercent)of
tracemetalsandRiskAssessm
entCod
ein
surficialsedimentsof
thePichavaram
mangrov
es
Metal
V aM
aCa
Pa
VT
MT
CT
PT
ERL
ERM
TEL
PEL
F1(%
)F2(%
)F3(%
)F4(%
)F5(%
)RAC
Cd
0.42
0.42
0.44
0.42
34.20
30.48
32.98
34.74
1.2
9.6
0.68
4.21
0.67
0.67
1.72
2.13
94.8
Low
risk
Cr
0.91
0.99
1.09
1.00
545.37
565.77
679.17
617
8137
052
.316
00.05
0.14
0.78
2.8
96.23
Norisk
Cu
1.97
2.32
1.50
1.97
96.78
180.83
128.38
132
3427
018
.710
80.45
1.37
3.33
3.53
91.32
Low
risk
Ni
2.49
2.85
3.04
2.56
145.34
305.43
171.50
252
20.9
51.6
15.9
42.8
0.5
12.19
3.26
93.05
Low
risk
Pb
5.40
5.65
5.86
5.67
161.45
140.20
139.88
143
46.7
218
30.2
112
1.16
3.1
5.39
4.82
85.53
Low
risk
Zn
2.42
2.02
2.15
2.14
108.03
104.98
95.10
106
150
410
124
271
0.45
1.82
3.9
4.03
89.79
Low
risk
Fe
113
121
153
128
23,073
26,452
26,025
24,998
––
––
0.06
0.49
4.06
2.72
92.66
Norisk
Mn
6210
446
7475
11,00
190
480
1–
––
–4.5
6.15
6.22
4.43
78.69
Medium
risk
V aVellararea(availablemetal;F
1+F2fractio
n;inmicrogram
sperg
ram),M
amangrovearea
(availablemetal;F
1+F2fractio
n;inmicrogram
sperg
ram),CaColeroonarea
(availablemetal;
F1+F2fractio
n;inmicrogram
spergram
),PaPichavaram
area
asatotal(availablemetal;F
1+F2
fractio
n;inmicrogram
spergram
),VTVellararea
(totalmetalconcentrationinsinglestep
digestion,inmicrogram
spergram),M
Tmangrovearea
(totalmetalconcentrationinsinglestep
digestion,inmicrogram
spergram),CTColeroonarea
(totalmetalconcentrationinsinglestep
digestion,
inmicrogram
spergram
),PTPichavaram
area
asatotal(totalmetalconcentrationin
singlestep
digestion,
inmicrogram
spergram
),ERLeffectrangelow,E
RM
effectrange
medianin
microgram
spergram
(Longet
al.1995),TELthresholdeffect
levelin
microgram
spergram
(MacDonaldet
al.1996),PELprobable
effect
levelin
microgram
spergram
(MacDonaldetal.1996),F
1exchangeablefractio
n,F2carbonateboundfractio
n,F3oxideboundfractio
n,F4sulfidicandorganicboundfractio
ns,F
5residualfractio
n
8210 Environ Monit Assess (2013) 185:8197–8213
Author's personal copy
OM (Cappuyns and Swennen 2005). Zinc ischalcophilic (Achterberg et al. 1997) and correlateswell in F4 fraction with sulfur (Table 2) in surfacesediments. Likewise, there is good correlation be-tween Zn in F4 fraction with organic matter and sulfurin cores 2 and 3 (Table 2).
Risk assessment
Risk Assessment Code (RAC) assesses metal concen-trations in the exchangeable and carbonates fractionscombined that are potentially bioavailable (Jain 2004;Hseu 2006; Yan et al. 2010). RAC values are catego-rized as: <1 %—no risk, 1–10 %—low risk, 11–30 %—medium risk, 31–50 %—high risk, and >75 %—veryhigh risk. The 10th effect range low (ERL) and 50theffect range median (ERM) percentile values were usedto establish the sediment quality guidelines (Long et al.1995). Threshold effects range (TEL), an estimate ofminimal effects, and probable effects range (PEL), anestimate above which adverse effects occur(MacDonald et al. 1996), were also calculated. Metalfractionation and RAC indicate that most of the metalsconcentrate in the residual fraction. Total concentrationof metals in the residual fraction for Cd, Cr, Cu, Pb, andNi (except Zn) are high at all locations and exceed theERL–ERM guidelines (Long et al. 1995). A majorfraction of the metals (>80 %) in sediments concentratein the residual fraction and are mostly not available forbiological uptake (Table 3). These potentially bioavail-able fractions (i.e., F1+F2) are below the ERL–ERM,PEL, and TEL values (Long et al. 1995; MacDonald etal. 1996). The only exception is Mn, which exhibitshigher bioavailability and poses a medium risk (RAC;Table 3).
The potential bioavailability of metals investigatedin this study for the Pichavaram mangrove–estuarinecomplex is contentious. A recent study on metal up-take by halophytes in Pichavaram indicates high con-centrations of metals in leaves (Agoramoorthy et al.2008). A probable explanation could be the limitedflushing of freshwater by the Vellar and ColeroonRivers that accumulated pollutants in plants spanningover several years/decades (Ramanathan et al. 1999).Prolonged uptake of micronutrients by roots accumu-lates these elements despite their potential low bio-availability. This is more apparent in mangroves,which are less affected by the wave action.
Conclusions
Total metal concentrations in the Pichavaram–estua-rine complex in this study are high compared to pre-vious studies. The lack of spatial variability of metalsin surface sediments and cores is due to mixing by thetsunami waves. Distribution of metals in differentgeochemical fractions (except Mn and Pb) does notshow a specific trend. With increase in depth, there isincrease of OM and sulfur bound fractions, and there-fore, chalcophilic metals like Cu, Cd, Cr, and Niaccumulate in F4 fraction. Most metals accumulatein the residual fraction and pose low risks to ecosys-tem in near future.
Acknowledgments We acknowledge the Principal Chief Con-servator of Forests, Government of Tamil Nadu and DivisionalForest Officer, Villupuram for permission to sample thePichavaram mangroves. We thank Sanjeev Bakshi (CUB, Patna)with the statistical analysis. Thoughtful reviews by both re-viewers significantly helped in improving the manuscript.RKR acknowledges Sat Paul Mittal Trust. Funding was provid-ed by FORMAS.
References
Achterberg, E. P., van den Berg, C. M. G., Boussemart, M., &Davison, W. (1997). Speciation and cycling of trace metalsin Esthwaite Water: a productive English lake with season-al deep-water anoxia. Geochimica et Cosmochimica Acta,61, 5233–5253.
Adriano, D. C. (2001). Trace elements in the terrestrial envi-ronments: biogeochemistry bioavailability, and risks ofmetals (pp. 47–71). New York: Springer.
Agoramoorthy, G., Chen, F.-A., & Hsu, M. J. (2008). Threat ofheavy metal pollution in halophytic and mangrove plants ofTamil Nadu, India. Environmental Pollution, 155, 320–326.
Alongi, D. M., Ramanathan, A. L., Kannan, L., Tirendi, F.,Trott, L. A., & Prasad, M. B. K. (2005). Human induceddisturbances on benthic microbial metabolism in thePichavaram mangroves, the Vellar–Coleroon estuarinecomplex, India. Marine Biology, 147, 1033–1044.
Babu, N., Suresh Babu, D. S., & Mohan Das, P. N. (2007).Impact of tsunami on texture and mineralogy of a majorplacer deposit in southwest coast of India. EnvironmentalGeology, 52, 71–80.
Borges, A. V., Djenidi, S., Lacroix, G., Theate, J., Delille, B., &Frankignoule, M. (2003). Atmospheric CO2 fluxes frommangrove surrounding waters. Geophysical ResearchLetter, 30, 12–14.
Cappuyns, V., & Swennen, R. (2005). Kinetics of element releaseduring combined oxidation and pH leaching of anoxic riversediments. Applied Geochemistry, 20, 1169–1179.
Environ Monit Assess (2013) 185:8197–8213 8211
Author's personal copy
Cho, H.Y., Lakshumanan, C., & Natesan, U. (2004). Coastalwetland and shoreline change mapping of Pichavaram,south east coast of India using satellite data, 2004—MapAsia Conference, Beijing, China.
Cook, M.E., & Morrow, H. (1995). Anthropogenic sources ofcadmium in Canada. National Workshop on CadmiumTransport Into Plants, Canadian Network of ToxicologyCentres, Ottawa, Ontario, Canada, June 20-21, 1995.
El Bilali, L., Rasmussen, P. E., Hall, G. E. M., & Fortin, D.(2002). Role of sediment composition in trace metal distri-bution in lake sediments. Applied Geochemistry, 17, 1171–1181.
Farias, C. O., Hamacher, C., Wagener, A. D. L. R., de Campos,R. C., & Godoy, J. M. (2007). Trace metal contaminationin mangrove sediments, Guanabara Bay, Rio de Janeiro,Brazil. Journal of the Brazilian Chemical Society, 18,1194–1206.
Furukawa, K., Wolanski, E., & Mueller, H. (1997). Currents andsediments transport in mangrove forests. Estuarine,Coastal and Shelf Science, 44, 301–310.
Ghrefat, H., & Yusuf, N. (2006). Assessing Mn, Fe, Cu, Zn andCd pollution in bottom sediments of Wadi Al-Arab Dam,Jordan. Chemosphere, 65, 2114–2121.
Green-Pedersen, H., Jensen, B. T., & Pind, N. (1997). Nickeladsorption on MnO2, Fe (OH)3, montmorillonite, humicacid and calcite: a comparative study. EnvironmentalTechnology, 18, 807–815.
Hseu, Z. Y. (2006). Extractability and bioavailability of zincover time in three tropical soils incubated with biosolids.Chemosphere, 63, 762–771.
Huerta-Diaz, M. A., & Morse, J. W. (1992). Pyritization of tracemetals in anoxic marine sediments. Geochimica etCosmochimica Acta, 56, 2681–2702.
Jackson, M. L. (1973). Soil chemical analysis. New Delhi:Prentice Hall of India.
Jain, C. K. (2004). Metal fractionation study on bed sedimentsof River Yamuna, India. Water Research, 38, 569–578.
Jones, B., & Turkie, A. (1997). Distribution and speciation ofheavy metals in surfacial sediments from the Tees Estuary,northwest England. Marine Pollution Bulletin, 34, 768–779.
Kathiresan, K. (2000). A review of studies on Pichavarammangrove, southeast India. Hydrobiologia, 30, 185–205.
Kathiresan, K., & Rajendran, N. (2005). Coastal mangroveforests mitigated tsunami. Estuarine, Coastal and ShelfScience, 65, 601–606.
Koretsky, C. M., Haveman, M., Beuving, L., Cuellar, A.,Shattuck, T., & Wagner, M. (2007). Spatial variation ofredox and trace metal geochemistry in a mineralotrophicfen. Biogeochemistry, 86, 33–62.
Krupadam, R. J., Smita, P., & Wate, S. R. (2006). Geochemicalfractionation of heavy metals in sediments of the Tapiestuary. Geochemical Journal, 40, 513–522.
Li, H., Feng, Y., Lu, S., & Du, Z. (2005). Bio-leaching ofvaluable metals from marine nodules under anaerobic con-dition. Minerals Engineering, 18, 1421–1422.
Li, Y., Yu, Z., Song, X., & Mu, Q. (2006). Trace metal concen-trations in suspended particles, sediments and clams(Ruditapes philippinarum) from Jiaozhou bay of China.Environmental Monitoring and Assessment, 121, 491–501.
Long, E. R., MacDonald, D. D., Smith, S. L., & Calder, E. D.(1995). Incidence of adverse biological effects withinranges of chemical concentrations in marine and estuarinesediments. Environmental Management, 19, 81–97.
MacDonald, D., Carr, R., Calder, F., Long, E., & Ingersoll, C.(1996). Development and evaluation of sediment qualityguidelines for Florida coastal waters. Ecotoxicology, 5,253–278.
Marchand, C., Lallier-Vergès, E., Baltzer, F., Albe’rica, P.,Cossa, D., & Baillif, P. (2006). Heavy metals distributionin mangrove sediments along the mobile coastline ofFrench Guiana. Marine Chemistry, 98, 1–17.
Marchand, C., Fernandez, J.-M., Moreton, B., Landi, L., Lallier-Vergès, E., & Baltzer, F. (2012). The partitioning of tran-sitional metals (Fe, Mn, Ni, Cr) in mangrove sedimentsdownstream of a ferralitized ultramafic watershed (NewCaledonia). Chemical Geology, 300(301), 70–80.
McLaughlin, M. J., Hamon, R. E., McLaren, R. G., Speir, T. W.,& Rogers, S. L. (2000). Review: a bioavailability-basedrationale for controlling metal and metalloid contaminationof agricultural land in Australia and New Zealand.Australian Journal of Soil Research, 38, 1037–1086.
Mench, M. J. (1998). Cadmium availability to plants in relationto major long-term changes in agronomy systems.Agriculture, Ecosystems and Environment, 67, 175–187.
Morse, J. W., & Luther, G. W. (1999). Chemical influences ontrace metal–sulphide interactions in anoxic sediments.Geochimica et Cosmochimica Acta, 63, 3373–3378.
Otero, X. L., & Macías, F. (2003). Spatial variation in pyritizationof trace metals in salt-marsh soils. Biogeochemistry, 62, 59–86.
Pickering, W. F. (1986). Metal ion speciation—soil and sedi-ments (a review). Ore Geology Reviews, 1, 83–146.
Ramanathan, A. L., Vaidhyanathan, P., Subramanian, V., & Das,B. K. (1993). Geochemistry of the Cauvery estuary, eastcoast of India. Estuaries, 16, 459–474.
Ramanathan, A. L., Subramanian, V., Ramesh, R., Chidambaram,S., & James, A. (1999). Environmental geochemistry of thePichavaram mangrove ecosystem (tropical), southeast coastof India. Environmental Geology, 37, 223–233.
Ranjan, R. K., Ramanathan, A. L., & Singh, G. (2008a).Evaluation of geochemical impact of tsunami onPichavaram mangrove ecosystem, southeast coast ofIndia. Environmental Geology, 55, 687–697.
Ranjan, R. K., Ramanathan, A. L., Singh, G., & Chidambaram,S. (2008b). Assessment of metal enrichments intsunamigenic sediments of Pichavaram mangroves, south-east coast of India. Environmental Monitoring andAssessment, 147, 389–411.
Salomons, W., & Förstner, V. (1984). Metals in the hydrocycle(p. 349). New York: Springer.
Satheeshkumar, G., Hameed, P. S., Meeramaideen, M., &Kannan, V. (2011). A post-tsunami study on the distribu-tion and bioaccumulation of natural radionuclides inPichavaram mangrove environment (South East Coast ofIndia) and dose to local human population. RadiationProtection and Environment, 34, 96–103.
Scheffers, A., & Kelletat, D. (2003). Sedimentologic and geo-morphic tsunami imprints worldwide—a review. Earth-Science Reviews, 63, 83–92.
8212 Environ Monit Assess (2013) 185:8197–8213
Author's personal copy
Senthilkumar, B., Purvaja, R., & Ramesh, R. (2008). Seasonaland tidal dynamics of nutrients and chlorophyll a in atropical mangrove estuary, southeast coast of India.Indian Journal of Marine Sciences, 37, 132–140.
Seralathan, P., Srinivasalu, S. , Ramanathan, A. L.,Rajamanickam, G. V., Nagendra, R., Singarasubramanian,S. R., et al. (2006). Post tsunami sediments characteristicsof Tamilnadu Coast. In G. V. Rajamanickam (Ed.), 26thDecember 2004 tsunami causes, effects remedial measures,pre and post tsunami disaster management, a geoscientificperspective (pp. 124–149). New Delhi: New Academic.
Shapiro, X. L. (1975). Rapid analysis of silicate, carbonate andphosphate rocks, revised edition. USGS, Bulletin, 1401, 1–54.
Srinivasalu, S., Thangadurai, N., Jonathan, M. P., Armstrong-Altrin, J. S., Ayyamperumal, T., & Ram-Mohan, V. (2008).Evaluation of trace-metal enrichments from the 26December 2004 tsunami sediments along the southeastcoast of India. Environmental Geology, 53, 1711–1721.
Szczucinski, W., Niedzielski, P., Rachlewicz, G., Sobczynski,T., Ziola, A., Kowalski, A., et al. (2005). Contamination oftsunami sediments in a coastal zone inundated by the 26
December 2004 tsunami in Thailand. EnvironmentalGeology, 49, 321–331.
Tam, N. F. Y., & Wong, W. S. (2000). Spatial variation of heavymetals in surface sediments of Hong Kong mangroveswamps. Environmental Pollution, 110, 195–205.
Tessier, A., Campbell, P. G. C., & Bisson, M. (1979). Sequentialextraction procedure for the speciation of particulate tracesmetals. Analytical Chemistry, 51, 844–851.
Turkian, K. K., & Wedepohl, K. H. (1961). Distribution of theelements in some major units of the earth crust. BulletinGeological Society of America, 72, 175–192.
World Health Organisation (WHO) (1992). EnvironmentalHealth Criteria 134—Cadmium International Programmeon Chemical Safety (IPCS) Monograph.
Yan, C., Li, Q., Zhang, X., & Li, G. (2010). Mobility andecological risk assessment of heavy metals in surface sed-iments of Xiamen Bay and its adjacent areas, China.Environmental Earth Science, 60, 1469–1479.
Yim, M. W., & Tam, N. F. Y. (1999). Effects of wastewater-borne heavy metals on mangrove plants and soil microbialactivities. Marine Pollution Bulletin, 39, 179–186.
Environ Monit Assess (2013) 185:8197–8213 8213
Author's personal copy
Related Documents