PROMOTEURS : L. BOCK, Ch. SCHVARTZ Année civile : 2008 COMMUNAUTE FRANÇAISE DE BELGIQUE ACADEMIE UNIVERSITAIRE WALLONIE-EUROPE FACULTE UNIVERSITAIRE DES SCIENCES AGRONOMIQUES DE GEMBLOUX TRACE ELEMENTS IN SOILS AND VEGETABLES IN A PERIURBAN MARKET GARDEN IN YUNNAN PROVINCE (P.R. CHINA): EVALUATION AND EXPERIMENTATION Yanqun ZU Dissertation originale présentée en vue de l’obtention du grade de docteur en sciences agronomiques et ingénierie biologique

Welcome message from author
This document is posted to help you gain knowledge. Please leave a comment to let me know what you think about it! Share it to your friends and learn new things together.
Transcript

PPRROOMMOOTTEEUURRSS :: LL.. BBOOCCKK,, CChh.. SSCCHHVVAARRTTZZ AAnnnnééee cciivviillee :: 22000088
COMMUNAUTE FRANÇAISE DE BELGIQUE ACADEMIE UNIVERSITAIRE WALLONIE-EUROPE
FACULTE UNIVERSITAIRE DES SCIENCES AGRONOMIQUES DE GEMBLOUX
TRACE ELEMENTS IN SOILS AND VEGETABLES IN A PERIURBAN MARKET GARDEN IN YUNNAN PROVINCE (P.R. CHINA):
EVALUATION AND EXPERIMENTATION
Yanqun ZU
Dissertation originale présentée en vue de l’obtention du grade de docteur en sciences agronomiques et ingénierie biologique


i
COMMUNAUTE FRANÇAISE DE BELGIQUE ACADEMIE UNIVERSITAIRE WALLONIE-EUROPE
FACULTE UNIVERSITAIRE DES SCIENCES AGRONOMIQUES DE GEMBLOUX
TRACE ELEMENTS IN SOILS AND VEGETABLES IN A PERIURBAN MARKET GARDEN IN YUNNAN PROVINCE (P.R. CHINA):
EVALUATION AND EXPERIMENTATION
Yanqun ZU
Dissertation originale présentée en vue de l’obtention du grade de docteur en sciences agronomiques et ingénierie biologique
PROMOTEURS : L. BOCK, Ch. SCHVARTZ Année civile : 2008

ii
© Aux termes de la loi belge du 30 juin 1994, sur le droit de l'auteur et les droits voisins, seul l'auteur a le droit de reproduire partiellement ou complètement cet ouvrage de quelque façon et forme que ce soit ou d'en autoriser la reproduction partielle ou complète de quelque manière et sous quelque forme que ce soit. Toute photocopie ou reproduction sous autre forme est donc faite en violation de la dite loi et de des modifications ultérieures.

iii
ZU Yanqun (2008) - Trace elements in soils and vegetables in a periurban market garden in Yunnan Province (P.R. China): evaluation and experimentation (Ph.D. Thesis). Gembloux Agricultural University, Gembloux, Belgium. 203 p., 55 tabl., 84 fig., 17 annexes
Summary
This research was conducted in order to evaluate natural trace element (TE) contents and anthropogenic
contamination in soils and vegetables in Chenggong County (Yunnan Province, China). In this way, trace
element contents in soils have been analysed to assess TE contamination in soils and vegetables, and transfer
of TE from soil to vegetables. Agricultural practises have been proposed to amend the quality of vegetables.
We identified three geomorphopedological units: lacustrine unit, transition unit and mountain unit.
In the mountain unit, soil texture is clay more often from the weathering of limestone and marlstone. Soil
colour is red or reddish brown with acid reaction.
In the transition unit, soil texture is loamy clay. Soil colour is red-brown with acid reaction.
In the lacustrine unit, soil texture mainly is sandy developed from lacustrine-alluvial deposits. Soil colour
is brown and is slightly acid.
Total TE contents in the topsoil are higher than usual and even Kunming Prefecture soil. TE contents indicate
a high contaminated level when considered globally. Pb, Cd and Zn present however individually low
contaminated levels, and Cu presents a medium contaminated level. TE contents decrease from northeast to
southwest, which is consistent with the elevation gradient. Significant differences of TE contents are observed
according to distance from Chenggong town in the lacustrine unit and with distance from the mountain in the
transition unit. TE accumulation is usually observed along roads. TE contents in subsoil are related to soil
colour, texture, parent materials and mottles. Accumulation of Pb and Zn in topsoil and of Cu and Cd in
subsoil are observed.
The highest contents are observed for Pb in cauliflower, Cd in lettuce and Chinese cabbage, and Cu and Zn in
pea. The order of TE accumulation in plants varies according to the plant species and organ. According to
relations between TE contents in Chinese cabbage and extraction sequential fractions of TE in soils, different
soil fractions are suggested as soil assessment indicators.
Lime and pig manure have been applied to modify the soil pH and to decrease the mobility of TE in situ. With
increasing in lime rate and pH, contents of acetic-acid extractable TE fractions in soil decrease. Enrichment
coefficients related to TE availability (AEC) of Pb and Cu are stable and are not changed by lime or pig
manure. AEC of Cd and Zn which are high in low pH, decrease with increased pH and application rates of
lime and pig manure.
When application rates of lime and pig manure increase, TE contents in Chinese cabbage decrease and
biomass of Chinese cabbage increases. Application rates of lime and pig manure are recommended, but their
quality should also be taken into account.
Keywords: Trace elements; Assessment; Transfer; Soils; Vegetables; Chinese cabbage; Lime; Pig manure.

iv
ZU Yanqun (2008) - Eléments en trace dans les sols et les légumes d’une zone maraîchère périurbaine de la Province du Yunnan (RP de Chine) : évaluation et expérimentation (Thèse de doctorat en anglais). Faculté Universitaire des Sciences Agronomiques de Gembloux, Belgique. 203 p., 55 tabl., 84 fig., 17 annexes
Résumé
Cette recherche a pour objet l'étude de la teneur naturelle en éléments traces métalliques (ET) et de la
contamination anthropique des sols et des productions légumières dans le Comté de Chenggong (Province du
Yunnan, RP de Chine).
Pour cela, la variabilité des teneurs en fonction des conditions géomorphopédologiques a été analysée, ainsi
que les transferts des ET du sol vers les végétaux. Cette approche a permis ensuite d'aborder l'évaluation de la
qualité des sols et des légumes, puis de proposer des pratiques agricoles alternatives dans le but d'améliorer la
qualité des légumes produits.
La zone d'étude a été divisée en 3 unités géomorphopédologiques:
• unité de montagne où les sols brun rouge à rouge résultent notamment de l'altération de calcaires et
de marnes. Une texture argileuse et une réaction acide dominent.
• unité de piedmont (dite de transition) où les sols de couleur jaune clair à jaune rougeâtre résultent
principalement de l'altération de grès et de shales. Une texture limono-argileuse en surface et
argileuse en profondeur, ainsi qu’une réaction acide dominent.
• unité lacustre, à proximité du Dianchi Lake, dont les sols de couleur brun foncé sont essentiellement
développés à partir de sédiments lacustres. Une texture sableuse domine en surface, ainsi qu'une
réaction faiblement acide à neutre.
Les teneurs en ET rencontrées en surface des sols de la zone d'étude sont plus élevées que les teneurs
moyennes observées dans les sols du monde ou même de la préfecture de Kunming. Evaluées séparément
pour chaque ET, les teneurs rencontrées correspondent à des niveaux de contamination jugés faibles pour Pb,
Cd et Zn, moyen pour Cu. Considérées simultanément, ces teneurs permettent de déterminer un indice de
contamination global correspondant à un niveau de contamination élevé. Les teneurs en ET décroissent
globalement du nord-est vers le sud-ouest, suivant le gradient d'altitude. Ces teneurs varient également de
façon significative en fonction de l'éloignement de la montagne dans l'unité de transition et de l'éloignement
de l'agglomération de Chenggong dans l'unité lacustre . Une accumulation en ET est souvent observée le long
des routes. Dans le sous-sol, les teneurs en ET sont liées à la couleur, à la texture, au matériau parental, et aux
marques d'altération. Les teneurs sont plus élevées en surface pour Pb et Zn, et en profondeur pour Cu et Cd.
Les teneurs les plus élevées pour Pb sont observées dans le chou-fleur, pour Cd dans la laitue et le chou
chinois, pour Cu et Zn dans le pois.L'ordre d'accumulation des ET dans la plante dépend de l'espèce et de
l'organe considérés. En fonction des corrélations observées entre les teneurs du chou chinois et les résultats
obtenus avec différentes modalités d'extraction des ET du sol, des indicateurs d'évaluation de la qualité du sol
ont été proposés.

v
Un amendement carbonaté et du fumier de porc ont été épandus afin de réduire in situ la mobilité des ET.
L'augmentation de l'apport d'amendement carbonaté permet d'augmenter le pH du sol et de diminuer la
fraction extraite avec l'acide acétique dilué (AA) pour chaque élément. Les AEC, rapports teneur dans la
plante : teneur dans le sol extractible à l’AA, sont stables pour Pb et Cu et ne sont modifiés par aucun des 2
apports. Cependant, les AEC de Zn et de Cu, élevés quand le pH du sol est acide, diminuent si le pH devient
plus alcalin, ainsi qu'avec les apports d'amendement carbonaté et de fumier de porc.
Quand les apports d'amendement carbonaté et de fumier de porc augmentent, les teneurs en ET du chou
chinois diminuent et sa biomasse augmente. Un épandage d'amendement carbonaté est donc recommandé.
Cependant la plus grande attention doit être portée à la qualité des fumiers de porcs dont les teneurs en Zn et
Cu ne sont pas négligeables.
Mots clés: Eléments traces, Evaluation, Transferts, Sols, Légumes, Chou chinois, Amendement carbonaté, Fumier de porc.


vi
ACKNOWLEDGEMENTS
I would like to thank the France-China advanced Research Programme (Programme Number: PRA01-02) for
providing me with the opportunity to carry out this research work, the Natural Science Foundation of China,
the Research Foundation for Academic Leader in Yunnan Province (China), the International Co-operation
Foundation of Yunnan Province (China), the China Scholarship Council (CSC) and Yunnan Agricultural
University for massive support. I also extend my thanks to the Gembloux Agricultural University (Belgium)
and Institut Supérieur d’Agriculture (ISA) de Lille (France) for providing me with much support.
I sincerely thank my supervisors Professor Laurent Bock (Belgium) and Professor Christian Schvartz (France)
for their encouragement and invaluable comments given during this study. I wish to thank Professor Michael
A. Fullen (England) for his valuable comments and English writing improvement. I am also grateful to
Dr. Gilles Colinet (Belgium) for his great technical assistance with field investigation, analytical work and
comments.
I would also like to thank Professor André Thewis (Belgium), Professor Roger Paul (Belgium), Professor
Jean-Marie Marcoen (Belgium) and Dr. Bruno Campanella (Belgium) for their valuable comments. I am
grateful to Professor Daniel Lacroix (Belgium), Professor Professor Li Yongmei (China), Professor Li Yuan
(China), Lin Kehui (China) and Professor Shi Zhou (China) for their professional advice and comments.
During my study and research, many people helped me and I am very grateful to them. I would especially like
to thank Marianne Guhur for vegetable survey in 2002, Céline Poncin for the surveys of toposequences and
soil descriptions in 2004, and Caroline Ducobu for surveys of toposequences and Chinese cabbage survey in
2006. Also many thanks go to Du Caiyan, Zi Xianneng, Yang Weilin, Tang Fajing, Chen Jianjun, Li Hongyi
and Chen Haiyan. Their hard work and help are unforgettable.
Finally, I would like to thank my family and friends for supporting and encouraging me to complete this work,
especially my mother (Mrs. Zhou Cixiu), my son (Mr. Li Zuran) and my husband (Dr. Li Yuan). Without their
support, it would have been impossible for me to finish this work and thesis. I express my deep love and
thanks to them.


vii
LIST OF ABBREVIATION
A: Acetic-acid extractable trace element fractions;
AEC: Available Enrichment Coefficient;
asl: Above Sea Level;
B: Hydroxyamine hydrochloride extractable trace
element fractions;
BCF: Bioaccumulation Factor = (TE contents in
plant)/(TE contents in soil);
BHC: Benzene Hexachloride;
C: Hydrogen peroxide and ammonium acetate
extractable trace element fractions;
C0: Nugget;
C0+C: Sill;
CAC: Codex Alimentarius Commission;
CEC: Cation Exchange Capacity;
CK: Control;
DM: Dry Materials;
FA: Fulvic Acid;
FAO: Food and Agriculture Organization;
FM: Fresh Materials;
FPOT: First Pot experiment;
GAU: Gembloux Agricultural University;
GDP: Gross Domestic Product;
GIS: Geographical Information System;
GMO: Genetically Modified Organisms;
GPS: Global Positioning System;
H1: Topsoil
H2: Subsoil
HA: Humic Acid;
HACCP: Hazard Analysis and Critical Control
Point;
L: Lacustrine unit;
L-ACd: A-fraction Cd content in the lacustrine unit;
L-ACu: A-fraction Cu content in the lacustrine unit;
L-APb: A-fraction Pb content in the lacustrine unit;
L-AvaiCd: Available Cd content in the lacustrine
unit;
L-AvaiCu: Available Cu content in the lacustrine
unit;
L-AvaiPb: Available Pb content in the lacustrine
unit;
L-AvaiZn: Available Zn content in the lacustrine
unit;
L-AZn: A-fraction Zn content in the lacustrine unit;
L-BCd: B-fraction Cd content in the lacustrine unit;
L-BCu: B-fraction Cu content in the lacustrine unit;
L-BPb: B-fraction Pb content in the lacustrine unit;
L-BZn: B-fraction Zn content in the lacustrine unit;
L-CCd: C-fraction Cd content in the lacustrine unit;
L-CCu: C-fraction Cu content in the lacustrine unit;
LCd: Cd content in the lacustrine unit;
LCEC: CEC in the lacustrine unit;
L-CPb: C-fraction Pb content in the lacustrine unit;
L-Cu: Cu content in the lacustrine unit;
L-CZn: C-fraction Zn content in the lacustrine unit;
LFD: Field experiment in the lacustrine unit;
LPb: Pb content in the lacustrine unit;
LpH: pH in the lacustrine unit;
L-Physical clay: Physical clay in the lacustrine unit;
L-PiCd: Pi of Cd in the lacustrine unit;
L-PiCu: Pi of Cu in the lacustrine unit;
L-PiPb: Pi of Pb in the lacustrine unit;
L-PiZn: Pi of Zn in the lacustrine unit;
LPOT: Pot experiment with soil from the lacustrine
unit;
LSOC: SOC in the lacustrine unit;
LZn: Zn content in the lacustrine unit;
M-Physical clay: Physical clay in the mountain unit;
M: Mountain unit;
MCd: Cd content in the mountain unit;
MCEC: CEC in the mountain unit;
MCu: Cu content in the mountain unit;
MFD: Field experiment in the mountain unit;
MPb: Pb content in the mountain unit;
MpH: pH in the mountain unit;
M-PiCd: Pi of Cd in the mountain unit;
M-PiCu: Pi of Cu in the mountain unit;

vii
M-PiPb: Pi of Pb in the mountain unit;
M-PiZn: Pi of Zn in the mountain unit;
MPOT: Pot experiment with soil from mountain
unit;
MSOC: SOC in the mountain unit;
MZn: Zn content in the mountain unit;
NOS: Not suitable level;
NS: No significant results;
P: Integrative index of contamination;
P1-5: Profile No.1, 2, 3, 4 and 5;
P1d, P1Y: Permian system;
PCA: Principal Component Analysis;
PCBs: Polychorinated Biphenyls;
Pi: Signal index of contamination;
PSD: Particles Size Distribution;
Q: Quaternary system; Q2: Early Pleistocene;
Q3: Middle Pleistocene; Q4: Holocene;
Q4l: lacustrine; Qlal: alluvial lacustrine;
RMB: RenMinBi, Chinese currency;
RRCT: Ratio of A-fraction TE contents in
Treatments to those in CK;
RTS: Ratio of trace element contents in Topsoil to
those in Subsoil;
SA: Data Set of soil samples from regional
approach;
SB: Data Set of soil samples responding to
vegetable samples;
SD: Standard Deviation;
SE: Standard Error;
SEF: Sequential Extraction Fractions;
SOC: Soil Organic Carbon;
T: Transition unit;
T-ACd: A-fraction Cd content in the transition unit;
T-ACu: A-fraction Cu content in the transition unit;
T-APb: A-fraction Pb content in the transition unit;
T-AvaiCd: Available Cd content in the transition
unit;
T-AvaiCu: Available Cu content in the transition
unit;
T-AvaiPb: Available Pb content in the transition
unit;
T-AvaiZn: Available Zn content in the transition
unit;
T-AZn: A-fraction Zn content in the transition unit;
T-BCd: B-fraction Cd content in the transition unit;
T-BCu: B-fraction Cu content in the transition unit;
T-BPb: B-fraction Pb content in the transition unit;
T-BZn: B-fraction Zn content in the transition unit;
T-CCd: C-fraction Cd content in the transition unit;
T-CCu: C-fraction Cu content in the transition unit;
TCd: Cd content in the transition unit;
TCEC: CEC in the transition unit;
T-CPb: C-fraction Pb content in the transition unit;
TCu: Cu content in the transition unit;
T-CZn: C-fraction Zn content in the transition unit;
TE: Trace Elements;
TFD: Field experiment in the transition unit;
Topo.: Toposequence;
Total-N: Total Nitrogen;
TPb: Pb content in the transition unit;
TpH: pH in the transition unit;
T-Physical clay: Physical clay in the transition unit;
T-Pi Cd: Pi of Cd in the transition unit;
T-Pi Cu: Pi of Cu in the transition unit;
T-Pi Pb: Pi of Pb in the transition unit;
T-Pi Zn: Pi of Zn in the transition unit;
TPOT: Pot experiment with soil from transition unit;
TSOC: SOC in the transition unit;
TZn: Zn content in the transition unit;
WHO: World Health Organization;
X: Parameter in X axle;
Y: Parameter in Y axle;
YAU: Yunnan Agricultural University;
YR: Yellow-Red colour according Munsell charts;

viii
LIST OF CONTENTS
I: INTRODUCTION ....................................................................................................................................... 1
II: LITERATURE REVIEW.......................................................................................................................... 4
2.1. INTRODUCTION...................................................................................................................................... 5
2.2. CURRENT SITUATION OF CHINA’S CULTIVATED LAND AND AGRICULTURAL PRODUCT
SECURITY................................................................................................................................................. 5
2.2.1. CURRENT SITUATION OF CHINA’S CULTIVATED LAND............................................................................... 5
2.2.2. PRESSURES ON CHINA’S CULTIVATED LAND................................................................................................. 6
2.2.3. CURRENT SITUATION OF AGRICULTURAL PRODUCT SECURITY IN CHINA.......................................... 10
2.3. TRACE ELEMENT CONTAMINATION AND SOIL ........................................................................... 13
2.3.1. DEFINITION AND SOURCES OF TRACE ELEMENTS...................................................................................... 13
2.3.2. DISTRIBUTION OF TRACE ELEMENTS IN SOIL.............................................................................................. 15
2.3.3. FACTORS INFLUENCING THE MOBILITY OF TRACE ELEMENTS.............................................................. 20
2.4. TRACE ELEMENTS AND THE FOOD CHAIN ................................................................................... 23
2.5. ASSESSMENT ........................................................................................................................................ 27
2.5.1. ASSESSMENT OF AGRICULTURAL PRODUCTS.............................................................................................. 27
2.5.2. ASSESSMENT OF VEGETABLE AND CROP QUALITY SECURITY............................................................... 30
2.5.3. ASSESSMENT OF SOIL QUALITY....................................................................................................................... 33
2.6. EFFECTS OF AGRONOMIC PRACTISES ON THE MOBILITY OF TRACE ELEMENTS.............. 36
2.7. CONCLUSIONS ...................................................................................................................................... 41
III: GENERAL METHODOLOGY ............................................................................................................ 43
3.1. INTRODUCTION.................................................................................................................................... 44
3.2. GENERAL DESCRIPTION .................................................................................................................... 44
3.2.1 GENERAL DESCRIPTION OF YUNNAN PROVINCE ......................................................................................... 44
3.2.2. DESCRIPTION OF THE RESEARCH AREA: CHENGGONG COUNTY............................................................ 54
3.3. PRESENTATION OF THE METHODOLOGY...................................................................................... 63
3.3.1. EXISTING DOCUMENTS ...................................................................................................................................... 66
3.3.2. FIELD SURVEY ...................................................................................................................................................... 70
3.4. METHODS............................................................................................................................................... 70
3.5. DISCUSSION AND CONCLUSIONS.................................................................................................... 73
VI: NATURAL TRACE ELEMENT CONTENTS AND ANTHROPOGENIC CONTAMINATION OF
SOILS ............................................................................................................................................................. 75
4.1. INTRODUCTION.................................................................................................................................... 76
4.2. MATERIALS AND METHODS ............................................................................................................. 76
4.2.1. SUMMARY OF METHODS.................................................................................................................................... 76

ix
4.2.2. COMPARATIVE ANALYSIS OF DATA FROM GEMBLOUX AGRICULTURAL UNIVERSITY AND
YUNNAN AGRICULTURAL UNIVERSITY....................................................................................................... 77
4.3. RESULTS................................................................................................................................................. 78
4.3.1. SOIL SURVEY AND SOIL IDENTIFICATION..................................................................................................... 78
4.3.2. HORIZONTAL DISTRIBUTION OF TOTAL TRACE ELEMENTS..................................................................... 89
4.3.3. VERTICAL DISTRIBUTION OF TOTAL TRACE ELEMENTS.........................................................................102
4.4. DISCUSSION ........................................................................................................................................ 111
4.4.1. SOIL IDENTIFICATION IN THE THREE UNITS...............................................................................................111
4.4.2. HORIZONTAL DISTRIBUTION OF TRACE ELEMENTS AND ANTHROPOGENIC EFFECTS...................112
4.4.3. TRACE ELEMENT VERTICAL DISTRIBUTION AND ESTIMATION OF NATURAL AND CONTAMINATED
VALUES...............................................................................................................................................................114
4.5. CONCLUSIONS .................................................................................................................................... 116
V: SOIL ASSESSMENT AND TRANSFER FROM SOILS TO VEGETABLES ................................ 121
5.1. INTRODUCTION.................................................................................................................................. 122
5.2. MATERIALS AND METHODS ........................................................................................................... 122
5.3. RESULTS .............................................................................................................................................. 125
5.3.1. SOIL ASSESSMENT .............................................................................................................................................125
5.3.2. TRACE ELEMENT CONTENTS IN PLANT AND PLANT ASSESSMENT......................................................128
5.3.3. RELATIONSHIPS BETWEEN SOIL AND PLANT TOTAL TRACE ELEMENT CONTENTS........................132
5.3.4. SOIL AVAILABLE TRACE ELEMENTS AND TRACE ELEMENT SEQUENTIAL EXTRACTION FRACTIONS
..............................................................................................................................................................................133
5.3.5. RELATIONSHIPS BETWEEN AVAILABLE TRACE ELEMENTS AND TRACE ELEMENT SEQUENTIAL
EXTRACTION FRACTIONS IN SOIL AND TRACE ELEMENT CONTENTS IN THE EATEN PART OF
CHINESE CABBAGE..........................................................................................................................................141
5.4. DISCUSSION ........................................................................................................................................ 146
5.4.1. RELATIONSHIP BETWEEN SOIL ASSESSMENT AND PLANT ASSESSMENT...........................................146
5.4.2. BIOAVAILABILITY OF TRACE ELEMENTS FROM SOILS TO VEGETABLES...........................................150
5.5. CONCLUSIONS.................................................................................................................................... 152
VI: EXPERIMENTS TO LIMIT TRACE ELEMENT TRANSFER FROM SOILS TO PLANTS ... 154
6.1. INTRODUCTION.................................................................................................................................. 155
6.2. MATERIALS AND METHODS ........................................................................................................... 155
6.2.1. CHINESE CABBAGE AND LAND REQUIREMENTS.......................................................................................155
6.2.2. LIME AND ITS APPLICATION ...........................................................................................................................157
6.2.3. ORGANIC MATTER AND ITS APPLICATION..................................................................................................158
6.2.4. POT EXPERIMENTS.............................................................................................................................................163
6.2.5. FIELD EXPERIMENTS.........................................................................................................................................165
6.3. RESULTS .............................................................................................................................................. 165
6.3.1. EFFECTS OF LIME APPLICATION ....................................................................................................................165
6.3.2. EFFECTS OF LIME AND PIG MANURE APPLICATION ON TRACE ELEMENT TRANSFER FROM SOIL TO
THE EATEN PART OF CHINESE CABBAGE......................................................................................................168

x
6.3.3. EFFECTS OF LIME AND PIG MANURE APPLICATION ON QUALITY AND BIOMASS OF
CHINESECABBAGE...............................................................................................................................................174
6.4. DISCUSSION ........................................................................................................................................ 180 6.4.1. SOIL pH AND ACETIC-ACID EXTRACTABLE TRACE ELEMENT CONTENTS IN RESPONSE TO LIME
APPLICATION ......................................................................................................................................................180
6.4.2. CHANGES IN TRANSFER OF TRACE ELEMENTS FROM SOIL TO CHINESE CABBAGE WITH LIME AND
PIG MANURE APPLICATION...........................................................................................................................181
6.4.3. TRACE ELEMENT CONTENTS AND BIOMASS OF CHINESE CABBAGE...................................................182
6.5. CONCLUSIONS.................................................................................................................................... 184
VII: GENERAL CONCLUSIONS............................................................................................................. 186
REFERENCES ............................................................................................................................................ 191


xi
LIST OF FIGURES
Figure 2.1: Evaluation of area of cultivated land in China and cultivated land area per capita ........................ 6
Figure 2.2: Consumption of fertilizers, pesticides and plastic films in China from 1995 to 2003 .................... 8
Figure 3.1: Map of China ................................ ............................................................................................... 45
Figure 3.2: The three geomorphological units in Yunnan Province................................................................ 47
Figure 3.3: The soil types of Yunnan Province ............................................................................................... 48
Figure 3.4: The distribution of soil types in Yunnan Province........................................................................ 48
Figure 3.5: The distribution of percentage of different types of cultivated land to total cultivated land area in
Yunnan Province ............................................. ............................................................................................... 49
Figure 3.6: The distribution of percentage of cultivated land area with different slope degree to total cultivated
land area in Yunnan Province.......................... ............................................................................................... 49
Figure 3.7: The distribution of areas under different crops in Yunnan Province ............................................ 50
Figure 3.8: The area and yield of main crops from 1950-2000 in Yunnan Province ...................................... 51
Figure 3.9: Location of Chenggong County and the research area ................................................................. 54
Figure 3.10: Geological Map of the research area, Chenggong County.......................................................... 58
Figure 3.11: The lateral distribution of soil in Chenggong County................................................................. 60
Figure 3.12: Conceptual model of information data structure......................................................................... 64
Figure 3.13: Topographical Map..................... ............................................................................................... 65
Figure 3.14: Satellite Imagery ......................... ............................................................................................... 66
Figure 3.15: The location of soil samples of the detailed approach in the lacustrine unit............................... 69
Figure 3.16: The location of soil samples of the detailed approach in the transition unit ............................... 69
Figure 4.1: The location of pedological observations in Chenggong County ................................................. 79
Figure 4.2: General toposequence ................... ............................................................................................. 119
Figure 4.3: Relief of toposequence 6............... ............................................................................................... 80
Figure 4.4: Relief of toposequence 10............. ............................................................................................... 82
Figure 4.5: Relief of toposequence 16............. ............................................................................................... 83
Figure 4.6: pH distributions of topsoil samples in the research area and the three units................................. 86
Figure 4.7: pH and SOC contents in three toposequences in the three units ................................................... 86
Figure 4.8: Physical clay contents of topsoil samples in the research area and the three units ....................... 87
Figure 4.9: SOC contents of topsoil samples in the research area and the three units .................................... 88
Figure 4.10: CEC of topsoil samples in the research area and the three units................................................. 88
Figure 4.11: Percentages of samples numbers within range TE contents to total sample numbers in topsoil 90
Figure 4.12: Pb, Cd, Cu and Zn contents of topsoil in the three units............................................................. 92
Figure 4.13: Pb, Cu and Zn contents in three toposequences in the three units .............................................. 92
Figure 4.14: Contour map of Pb contents and semivariogram analysis of topsoil in the research area .......... 94
Figure 4.15: Contour map of Cd contents of topsoil in the research area ....................................................... 95
Figure 4.16: Contour map of Cu contents of topsoil in the research area ....................................................... 96
Figure 4.17: Contour map of Zn content and semivariogram analysis of topsoil in the research area............ 97
Figure 4.18: Percentages of sample numbers within range TE contents to total sample numbers in subsoil 103

xii
Figure 4.19: TE contents in subsoil (H2) with different colour..................................................................... 104
Figure 4.20: TE contents in subsoil in toposequences 11, 12 and 13 ............................................................ 105
Figure 4.21: TE contents in subsoil in the three units ................................................................................... 106
Figure 4.22: TE contents in subsoil with different stones ............................................................................. 107
Figure 4.23: Total TE contents in topsoil and subsoil ................................................................................... 108
Figure 4.24: Percentage of sample numbers within range RTS to total top/sub pair numbers...................... 108
Figure 4.25: Total TE contents in topsoil and subsoil in the lacustrine unit ................................................. 109
Figure 4.26 Total TE contents in topsoil and subsoil in the transition unit ................................................... 110
Figure 4.27: Total TE contents in topsoil and subsoil in the mountain unit.................................................. 110
Figure 4.28: PCA of pH, SOC and CEC of topsoil ....................................................................................... 113
Figure 5.1: Location of vegetable samples in the research area .................................................................... 123
Figure 5.2: Ratio of mean total TE contents in topsoil to that in world and Kunming soils ......................... 125
Figure 5.3: Ratio of mean total TE content in topsoil in the three units to that in world and Kunming soils127
Figure 5.4: Pi of Pb, Cd, Cu and Zn in the three units................................................................................... 128
Figure 5.5: TE mean contents in the eaten part of vegetables ....................................................................... 129
Figure 5.6: TE contents (mg/kg FM) in the eaten part of Chinese cabbage in the lacustrine and transition units
......................................................................... ............................................................................................. 131
Figure 5.7: Relationships between contents of Cd and Zn in soil and in Chinese cabbage........................... 133
Figure 5.8: Available TE contents in topsoil in the lacustrine and transition units ....................................... 135
Figure 5.9: Percentage of TE contents of A, B, C fractions in soils.............................................................. 136
Figure 5.10: SEF contents of Pb in topsoil in the two units .......................................................................... 137
Figure 5.11: SEF contents of Cd in topsoil in the two units.......................................................................... 138
Figure 5.12: SEF contents of Cu in topsoil in the two units.......................................................................... 139
Figure 5.13: SEF contents of Zn in topsoil in the two units .......................................................................... 140
Figure 5.14: Relationships between Pb contents in Chinese cabbage and B-fraction Pb contents in soil..... 141
Figure 5.15: Relationships between Cd contents in Chinese cabbage and available Cd contents in soil ...... 142
Figure 5.16: Relationships between Cu contents in Chinese cabbage and SEF Cu contents in the lacustrine
unit................................................................... ............................................................................................. 143
Figure 5.17: Relationships between Zn contents in Chinese cabbage and available Zn contents in soil ...... 143
Figure 5.18: Relationships between Zn contents in Chinese cabbage and SEF Zn contents in soil.............. 144
Figure 5.19: Relationships between total and available TE contents in soil ................................................. 145
Figure 5.20: Assessment of soils and the eaten part of vegetables in the research area, according to Chinese
standard values ................................................ ............................................................................................. 148
Figure 6.1: Variants of Chinese cabbage......... ............................................................................................. 156
Figure 6.2: Percentage of area of main crops in China in 2003 .................................................................... 156
Figure 6.3: Soil pH with lime application ....... ............................................................................................. 165
Figure 6.4: Relationships between rate of lime and pH after 1, 5, 10 and 15 weeks..................................... 166
Figure 6.5: Soil pH with different rate of lime application at week 15 ......................................................... 166
Figure 6.6: A-fraction Pb contents after 1 month .......................................................................................... 167
Figure 6.7: A-fraction contents of Cd and Zn after 3 and 6 months.............................................................. 168
Figure 6.8: RRCT of Cd and Zn after 3 and 6 months .................................................................................. 168

xiii
Figure 6.9: Relationships between A-fraction TE contents in soil and TE contents in Chinese cabbage in
MPOT.............................................................. ............................................................................................. 170
Figure 6.10: AEC in pot experiments with lime application ......................................................................... 171
Figure 6.11: AEC in pot experiments with pig manure application .............................................................. 172
Figure 6.12: AEC in MPOT with application of lime + pig manure ............................................................. 173
Figure 6.13: AEC of Cu and Zn in pot experiments with application of lime + pig manure ........................ 174
Figure 6.14: Relationship between Pb contents in Chinese cabbage and rate of lime application in FPOT . 175
Figure 6.15: TE contents in Chinese cabbage with lime application in MFD............................................... 176
Figure 6.16: TE contents in Chinese cabbage with pig manure application in TFD and LFD...................... 177
Figure 6.17: Effect of lime application on biomass of Chinese cabbage in FPOT........................................ 179
Figure 6.18: Biomass of Chinese cabbages in TFD and LFD ....................................................................... 179


xiv
LIST OF TABLES
Table 2.1: Factors influencing the regional level distribution of trace elements in soils ................................ 16
Table 2.2: Vertical distribution types and factors influencing trace elements in soils .................................... 19
Table 2.3: Chinese food hygiene standards for TE in vegetables.................................................................... 32
Table 2.4: The maximum levels (mg/kg FM) for TE in vegetables in China.................................................. 33
Table 2.5: China national standards for soil environmental quality of total TE contents (GB15618-1996)
(mg/kg) ............................................................ ............................................................................................... 34
Table 2.6: Maximum levels (mg/kg FM) of total TE contents for vegetable soils (HJ332-2006) and vegetable
soil in greenhouses (HJ333-2006) ................................................................................................................... 34
Table 2.7: Maximum levels of total TE contents for soil of non-environmental contaminated vegetables (GB/T
18407.1-2001) ................................................................................................................................................. 35
Table 2.8: Maximum levels of total TE contents for soil of green vegetables production area (NY/T 391-2000)
......................................................................................................................................................................... 35
Table 2.9: Standard grades of single index and integrative index for soil contaminated by trace elements ... 35
Table 3.1: Main features of the seven mesoclimatic zones in Yunnan Province ............................................ 46
Table 3.2: Background values (mg/kg) of TE in soil (A layer) and parent materials (C layer) in Yunnan
Province........................................................................................................................................................... 52
Table 3.3: TE contents (mg/kg) in soils .......................................................................................................... 52
Table 3.4: Mean contents (mg/kg) of Pb, Cd, Cu and Zn in Yunnan soils in 1996......................................... 53
Table 3.5: TE contents (mg/kg) in agricultural materials................................................................................ 54
Table 3.6: Soil classification of Chenggong County....................................................................................... 59
Table 3.7: Areas of food crops in 2003 ........................................................................................................... 61
Table 3.8: Areas of vegetables, flowers and fruits in 2003 ............................................................................. 62
Table 3.9: Total TE contents in soil of Chenggong County ............................................................................ 63
Table 3.10: General description of framework................................................................................................ 65
Table 3.11: Summary of soil sampling strategy .............................................................................................. 70
Table 3.12: Summary of soil analysis methods............................................................................................... 72
Table 4.1: Soil sampling strategy .................................................................................................................... 76
Table 4.2: Data (mean ± SD) based on methods in laboratories of GAU and YAU ....................................... 77
Table 4.3: Particle size distribution of topsoil and texture according FAO ..................................................... 81
Table 4.4: Basic information for 32 pairs of top/subsoil samples in the research area ................................... 84
Table 4.5: Basic information for the five profiles in Chenggong County ....................................................... 85
Table 4.6: Regression analysis between TE contents and soil properties ....................................................... 90
Table 4.7: TE contents (mg/kg) in topsoil in detailed approach samples in the lacustrine unit ...................... 98
Table 4.8: TE contents (mg/kg) in five greenhouses in the lacustrine unit ..................................................... 99
Table 4.9: TE contents (mg/kg) in topsoil of detailed approach samples in the transition unit .................... 101
Table 4.10: TE contents (mg/kg) in five greenhouses in the transition unit.................................................. 102
Table 4.11: Relationships between TE contents in topsoil and subsoil......................................................... 111

xv
Table 4.12: Summary for factors influencing TE contents in the research area............................................ 118
Table 5.1: Presentation of eaten parts and non-consumed parts of the vegetables........................................ 124
Table 5.2: Soil TE contamination assessment in the research area ............................................................... 126
Table 5.3: TE contents in the eaten part of vegetables (mg/kg FM) ........................................................... 129
Table 5.4: TE contents in the non-consumed part of vegetables (mg/kg FM) ............................................ 132
Table 5.5: Available TE contents (mg/kg) in soils for Chinese cabbage growing ........................................ 134
Table 5.6: SEF TE contents (mg/kg) in soil for Chinese cabbage growing .................................................. 136
Table 5.7: Relationships between TE fraction contents in soil and TE contents in Chinese cabbage........... 144
Table 5.8: Agricultural practice information for planting Chinese cabbage in Chenggong County ............. 147
Table 5.9: Percentage of samples with TE contents exceeding standard values ........................................... 148
Table 5.10: Suggested indicators for soil assessment for Chinese cabbage production................................ 152
Table 6.1: Application rate of lime in acid soil (kg/ha)................................................................................. 158
Table 6.2: Characteristics of undisturbed soil used in experiments .............................................................. 160
Table 6.3: Treatments of lime in FPOT......................................................................................................... 161
Table 6.4: Treatments of lime and pig manure in pot and field experiments................................................. 162
Table 6.5: TE contents in lime and pig manure (mg/kg)............................................................................. 162
Table 6.6: pH with lime application after 1, 5, 10 and 15 weeks .................................................................. 165
Table 6.7: A-fraction TE content ranges (mg/kg) in soils in LPOT, TPOT and MPOT ............................... 169
Table 6.8: Conclusion on transfer from soil to plant in LPOT, TPOT and MPOT ....................................... 174
Table 6.9: Contents of Pb, Cd and Zn (mg/kg DM) and biomass ± SD (g FM/pot) in Chinese cabbage with
lime application in FPOT .............................................................................................................................. 175
Table 6.10: TE contents (mg/kg DM) ± SD in the eaten part of Chinese cabbage in three field experiments....
....................................................................................................................................................................... 178
Table 6.11: Biomass (kg FM/plot) and TE accumulated amounts (mg DM/plot) in Chinese cabbage in TFD
and LFD......................................................................................................................................................... 180
Table 6.12: Conclusions on the effects of lime and pig manure on the quality and biomass of Chinese cabbage
....................................................................................................................................................................... 185

xvi
LIST OF PLATES
Plate 3.1: Field survey in Chenggong County................................................................................................. 66
Plate 3.2: Augering in the field........................................................................................................................ 68
Plate 6.1: Market for manure in Chenggong County..................................................................................... 158
Plate 6.2: Pot experiments and Chinese cabbage seed bag............................................................................ 160
Plate 6.3: Application of lime and pig manure in the field............................................................................ 163
Plate 6.4: Field experiments .......................................................................................................................... 164


xvii
LIST OF ANNEXES
ANNEX 3.1. LABORATORY METHODS.
ANNEX 4.1. PARTICAL SIZE DISTRIBUTION OF TOPSOIL (H1) AND SUBSOIL (H2).
ANNEX 4.2. GENERAL REGIONAL DATA ANALYSIS.
ANNEX 4.3. DISTRIBUTION OF TE CONTENTS OF TOPSOIL IN REGIONAL APPROACH.
ANNEX 4.4. RELATIONSHIPS BETWEEN TE CONTENTS AND SOIL CHARACTERISTICS.
ANNEX 4.5. DISTRIBUTIONS OF TOTAL TE CONTENTS IN DETAILED APPROACH.
ANNEX 4.6. VERTICAL DISTRIBUTION OF TE.
ANNEX 4.7. ANALYSIS RESULTS BASED ON DATA OF GAU+YAU.
ANNEX 5.1. GENERAL ANALYSIS DATA OF SOILS RESPONDING TO VEGETABLE SAMPLES.
ANNEX 5.2. GENERAL ANALYSIS DATA OF CHINESE CABBAGE AND ITS RESPONDING SOILS.
ANNEX 5.3. RESULTS OF TRACE ELEMENT CONTENTS OF VEGETABLE SAMPLES.
ANNEX 5.4. RELATIONSHIPS BETWEEN TRACE ELEMENT CONTENTS IN CHINESE CABBAGE
AND TE FRACTION CONTENTS IN SOIL.
ANNEX 5.5. RELATIONSHIP BETWEEN C-Pb AND SOC.
ANNEX 5.6. PCA OF TE FRACTION CONTENTS IN SOIL.
ANNEX 6.1: RELATIONSHIPS BETWEEN A-FRACTION CONTENTS OF CD AND ZN AND PH
AFTER 15 WEEKS IN FPOT. ANNEX 6.2. TRACE ELEMENT CONTENTS IN CHINESE CABBAGE IN 3 POT EXPERIMENTS.
ANNEX 6.3. A-FRACTION TRACE ELEMENT CONTENTS IN 3 POT EXPERIMENTS.


1
I: INTRODUCTION
Increasing attention being paid to the food security and ecological environmental security,
sustainable agricultural development is becoming a key issue (Dudka & Miller, 1999; Chen H.M.,
et al., 2006). There are many challenges to protection of cultivated land*, which has become a
major factor affecting sustainable agricultural development and sustainable economic
development in the world (Zhu G.Y., et al., 2006).
The factors limiting the suitability land to be cultivated include decline of soil quantity,
degradation of soil quality, soil erosion, drought, poor fertility, salinization and soil contamination
(Zhao Q.G., et al., 2006). With the environmental concern becoming increasingly prominent,
degradation of soil quality is becoming more and more prominent, especially soil contamination,
such as trace element (TE) contamination. Soil TE contamination has been occurring for centuries.
Widespread concern has arisen over the implications of human health problems from increasing
TE contamination in soils in recent years (Mejare & Bulow, 2001; Chen H.M., 2005).
TE in soil cannot be decomposed by microbial or chemical degradation, so, total contents and
eco-toxicity of TE persist in soils for a long time after introduction. These TE may affect soil
ecosystem safety, agricultural product quality and human health through food chain (Dudks &
Miller, 1999; Guo G.L., et al., 2006). Focusing on TE contents in soil, its distribution,
transformation and transferring from soil to agricultural production, the evaluation for soil TE
contamination will be helpful for the sustainable use of cultivated land and the improvement of
human health (Fu B.D. & Zhang X.Q., 2004).
Improvement of soil quality is a key of sustainable agriculture. There has been ever-increasing
interest in developing technologies for contaminated site remediation. Remediation and
purification of soil contaminated by TE include physical remediation, chemical remediation,
bioremediation and phytoremediation (Baker, 1981; Zhou Q.X. & Song Y.F., 2004). But
* “Cultivated land” means lands that are used for agricultural crops, including paddy fields, upland fields, vegetables plots, as well as for mulberry fields, tea plantations and orchards.

INTRODUCTION
2
considering the land efficiency and intensive agricultural practices, especially in periurban area, in
situ agricultural remediation practices using exterior amendments should be a promising method
for cleaning up slightly contaminated soils (Ding Y., 2000; Wang X., 1998).
In China, there is much progress, especially in agricultural production and economic development
(Zhao Q.G., et al., 2006). However, confronted with the Chinese demography, the availability of
cultivated land is a limiting factor. Environment problems are also becoming increasingly
prominent, in terms of food safety and human health. Soil contamination, especially TE
contamination, has been reported in some cities, such as Beijing, Shanghai, Naijing, Shenzhen,
Shenyang, Xi’an and Urumqi (Chen T.B., et al., 2006; Wang Y.G., et al., 2003; Zhang C.L. & Bai
H.Y. 2001; Wang L.F. & Bai J.G., 1994; Ma W.X., et al., 2000).
Yunnan Province is located in south-western China. Soil TE contamination has received
increasing attention due to high TE background values (Duan C.Q., et al., 2006).
Chenggong County is located ~20 km south-east of Kunming City, the capital of Yunnan Province
and suits well to our purpose, which is to study the consequences of soil TE contents on plant
quality and to find ways to improve this quality:
It is the main base for market garden in Kunming Prefecture and thus plays a major role in
vegetable supply in China.
Three-quarters of farmland are devoted to vegetable production, which is the major source of
income for this County.
According to previous studies, its topsoil exhibits Zn, Cd and Cu contents higher than the
background values for Kunming Prefecture and contents in vegetables may exceed legal
standard values.
It is possible to find out agricultural ways to decrease TE contents in vegetables and avoid
severe food contamination.

INTRODUCTION
3
By field investigation and experiments, this research aims to:
Observe the contents and understand distribution of TE (Pb, Cd, Cu and Zn) in soils and
vegetables. It is important for understanding the state of soil quality and its evolution and will
be useful for predicting the soil quality evolution and to improve managements;
Assess TE contents in soils and vegetables according to legal Chinese thresholds and collect
relevant information about the severity of contamination of market garden soils by TE and
subsequent risks for human health.
Find out possible ways to decrease TE contents in vegetables and improve vegetable safety.
In general, this research aims at understanding and assessing TE contents in vegetable, and
improves agricultural practises. This research will be an important reference for intensive
periurban vegetable production and sustainable vegetable land use. Meanwhile, vegetable quality
security and sustainable economic growth will be improved.


4
II: LITERATURE REVIEW
2.1. INTRODUCTION.................................................................................................5 2.2. CURRENT SITUATION OF CHINA’S CULTIVATED LAND AND AGRICULTURAL PRODUCT SECURITY ............................................................5
2.2.1. Current situation of China’s cultivated land ................................................5 2.2.2. Pressures on China’s cultivated land ...........................................................6 2.2.3. Current situation of agricultural product security in China .......................10
2.3. TRACE ELEMENT CONTAMINATION AND SOIL...................................13 2.3.1. Definition and sources of trace elements ...................................................13 2.3.2. Distribution of trace elements in soil .........................................................15 2.3.3. Factors influencing the mobility of trace elements....................................20
2.4. TRACE ELEMENTS AND THE FOOD CHAIN ...........................................23 2.5. ASSESSMENT ....................................................................................................27
2.5.1. Assessment of agricultural products ..........................................................27 2.5.2. Assessment of vegetable and crop quality security ...................................30 2.5.3. Assessment of soil quality .........................................................................33
2.6. EFFECTS OF AGRONOMIC PRACTISES ON THE MOBILITY OF TRACE ELEMENTS ................................................................................................36 2.7. CONCLUSIONS .................................................................................................41


LITERATURE REVIEW
5
2.1. INTRODUCTION
Land demand is growing dramatically, bringing about greater pressures and challenges for
protection of cultivated land in China. As cultivated land areas are progressively decreasing, their
protection has become a key issue regarding sustainable development in China (Zhao Q.G., et al.,
2006). Cultivated land is limited by various factors, such as erosion, drought, low fertility,
salinization, degradation of soil quality and soil contamination. With the development of
globalization, urbanization and industrialization, environmental concern is becoming prominent,
especially soil contamination (Zhou Q.X. & Song Y.F., 2004; Adriano, 2001; Majid & Argue,
2001; Mankoonga et al., 2002; Bolan et al., 2003).
Soil quality has been paid more attention. Appropriate land use for soils contaminated by trace
elements (TE) should be decided by risk assessment of TE contents. The evaluation of soil
contamination by TE is therefore a prerequisite for the development of sustainable and safe
agriculture (Zhu G.Y., et al., 2006; Sterckeman, et al., 2004; Liaghati, et al., 2003). Classical
remediation includes physical, chemical and biological reactions (Baath, et al., 1998; Dermatas &
Meng X.G., 2003). In order to save limited cultivated land, while producing safe vegetables in
periurban areas, agricultural-based remediation, including use of chemicals and crop rotation,
should be recommended.
2.2. CURRENT SITUATION OF CHINA’S CULTIVATED
LAND AND AGRICULTURAL PRODUCT SECURITY
2.2.1. Current situation of China’s cultivated land
According to the 2nd Soil Survey of China in 1994, the total area of soil represents 8.798 ×10⁸ ha
or 91.4% of Chinese territory. Some 2/3 could be used for agriculture, forestry and husbandry,
some 1/3 is deserts or hilly regions. Areas under cultivation represents only 21.3% of the total area
dedicated to agriculture and forestry, which is less than Asia (23.8%), the United States (25.7%),
France (40.6%) or The United Kingdom (30.3%) (Jiang Z.D., 2004). Twelve soil orders have been

LITERATURE REVIEW
6
recognized and the effective cultivated land area is 1.376 × 10⁸ ha; including paddy fields (23.1%
of cultivated land) and upland fields (76.9% of cultivated land).
On the one hand, according to slope degree and irrigation, four grades of cultivated land may be
distinguished in China, including 1st grade (41.6%), 2nd grade (34.6%), 3rd grade (20.3%) and the
remainder (3.5%), which should be used for forest. On the other hand, cultivated land also could
be classified into high yield, medium yield and low yield lands in terms of quality and
productivity. In China, area of high yield, medium yield and low yield lands occupies 21.5%,
37.2% and 41.3%, respectively (Lv, 2001). Pressures on cultivated land are becoming increasingly
serious (Zhang Z.F. & Chen B.M., 2002).
2.2.2. Pressures on China’s cultivated land
A. Area of cultivated land decreasing annually
From 1996-2004, the cultivated land area decreased obviously, by 0.77% each year (Figure 2.1).
The total loss reached 1.053 × 10⁷ ha. The average cultivated land area per capita (0.094 ha) in
2004 was 40% lower than in the world (0.25-0.3 ha). Some 20% of counties in China have only
0.053 ha per capita on average, which is lower than the limiting value (0.054 ha) defined by FAO
(Zhou S.L. & Lu C.F., 2005; Zhang Q.L., et al., 2005) (Figure 2.1). The loss is mainly due to
construction appropriation, conversing cultivated land to forest or grass, regulation of agricultural
production structure (readjustment) and natural disaster damage.
Figure 2.1: Evaluation of area of cultivated land in China and cultivated land area per capita
(Zhou S.L. & Lu C.F., 2005; Zhang Q.L., et al., 2005).

LITERATURE REVIEW
7
B. Differences in distribution of resources of cultivated land
Characteristics of cultivated land vary among regions, because of natural conditions, economic
development level, human activities and management measures. Cultivated land area in the
eastern part represents 94.2% of the total cultivated land of China (Zhao Q.G., et al., 2002; Ai J.Q.,
2001). Uncultivated arable land area is only 9.88 × l04 ha, and per capita 0.0076 ha, which is
mainly distributed in middle and western China.
C. Degradation of soil productivity with intensive agricultural practices
Soil quality is a key condition for soil productivity. Soil quality is influenced by natural factors
and human activities. On the one hand, agricultural activities have improved soil quality, such as
irrigation, soil salinization control and water logging control. On the other hand, degradation of
soil quality is becoming a serious problem, such as soil erosion, nutrient deficiency and soil
contamination.
Soil erosion by water and wind is identified as the main kind of degradation of soil quality at the
world scale. In China, areas affected by soil erosion represent 3.65 × l08 ha, 37% of land area, and
the quantity of eroded soil was 5 × l010 t in 2004 (Zhou S.L. & Lu C.F., 2005). The loss of
nutrients each year was 2.7 × 10⁷ t OM, 5.5 × 10⁶ t N, 6.0 × 10³ t P2O5 and 5.0 × 10⁶ t K2O. The
area concerned by soil erosion in 2004 was 1.34 × l07 ha in Yunnan Province, or 36.8% of the
Province (Zhao Q.G., et al., 2002). According to nutrient contents, some 2.29 × l07 ha of upland
fields and 4.44 × l06 ha of paddy fields present organic matter (OM) deficiency. Some 2.8 × l07 ha
of upland fields and 5.05 × l06 ha of paddy fields present potential nitrogen deficiency. The area of
soils with P deficiency reaches 4.73 × l07 ha for upland fields and 1.99 × l07 ha for paddy fields.
D. Degradation of soil quality due to contamination
Soil contamination is caused mainly by industrial wastes, acid rain, unsuitable fertilization,
transportation, pesticides and agricultural plastic films.

LITERATURE REVIEW
8
Soil contamination caused by wastewater irrigation
Output of wastewater is >4 × l010 t each year in China. The area of wastewater irrigated land is
3.333 × 10⁶ ha, of which 6.67 × 10⁵ ha soil are contaminated, especially by Cd and Hg. Some
4 × 10⁴ ha are contaminated by Cd, with 130 mg/kg; and 5 × 10⁷ kg of grains being contaminated
by Cd each year. Some 3.33 × 10⁴ ha are contaminated by Hg; and 1.95 × 10⁸ kg of grains being
contaminated by Hg each year. The loss of grains each year is estimated to be 3.75 × 10⁹ kg due to
wastewater irrigation, including 2.5 × 10⁹ kg of grains contaminated by TE.
Soil contamination caused by industrial wastes
The industrial solid wastes amounts to 7.2 × 10⁸ t each year. The total quantity of solid wastes is
8.6 × 10⁹ t and piled in 6 × l04 ha of cultivated land to soil and water contamination. Some 1 × l07
ha of cultivated soils are contaminated by industrial wastes, and lead to grain yield decrease of 1.2
× l010 kg (Zhou S.L. & Lu C.F., 2005). On the other hand, soil acidification is becoming
increasingly serious due to industrial activities. South-western and southern China are the sensitive
regions to acid rain.
Soil contamination caused by unsuitable application of pesticides and fertilizers
In China, annual consumption of fertilizers, pesticides and plastic films increased from 1995 to
2003 (Figure 2.2), and generated a contamination of 8.667 × l06 ha of cultivated soil, leading to >1
billion US dollars economic losses. Plastic films are decomposed very slowly in soil, 30% of
residual plastic films accumulate in fields, resulting in soil contamination.
Figure 2.2: Consumption of fertilizers, pesticides and plastic films in China from 1995 to 2003 (Zhao Q.G., et al., 2006).

LITERATURE REVIEW
9
In China, the average rate of pesticide application ranges between 2.34-14.0 kg/ha (Wu M., 2003).
Some 50-60% of pesticides remain in soils; the ratio of efficiency is <30% (He L.L. & Li Y.,
2003). Some 13-16 × l06 ha of cultivated land are contaminated by pesticides. Organic chloride is
one of the important pesticide families, which was forbidden about 20 years ago, but still
measured in soils and crop products. Benzene hexachloride (BHC) was tested in 99% out of all
vegetable and soil samples in Guangzhou. Polychorinated biphenyls (PCBs) contents ranged
between 6-151 g/kg in soil in Shenyang City (Gao X.Y., et al., 2006).
Current situation of soil trace element contamination in China
According to the reports of the Ministry of Environmental Protection of China in 1999, one fifth
of cultivated land is contaminated, of which 30-80% is contaminated by TE in some places,
although the geological TE background levels are low. Some 25 × l06 ha of cultivated lands are
contaminated by TE in China (Wei J.F., et al., 1999; Cheng S.P., 2003).
Wastewater irrigation is very common in China, especially in the north-western, because water
resources are lacking (Zhang Z.P. & Wang X.J., 1998; Nan Z.R. & Li J.J., 2001). According to the
survey of the Ministry of Agriculture of China, 64.8% of wastewater irrigated lands are
contaminated by TE, 46.7% at low grade, 9.7% at medium grade and 8.4% at high grade (Zhou
Q.X. & Song Y.F., 2004). Wastewater irrigation has undertaken for 20 years in Zhangshi
irrigation district of Shenyang City, resulting in contamination of 2500 ha of cultivated land, the
Cd contents in grains being 25-35 times the standard value (0.2 mg/kg, GB5009.15) (Liao Z.,
1993).
Beside wastewater irrigation, industrial emission and waste fertilization are also contributing to
the primary factors influencing TE contamination in soil. TE in atmosphere from industrial
emission, petrol with lead and dust-sandstorms are precipitated to soil (Cheng S.P., 2003). The
amounts of Hg, Cd and Pb from atmosphere fallout into soil are 4.48, 5.79 and 347 g/ha/year,
respectively (Zhang N., 2001). Fertilizing sludge in farm fields, has led to an increase of TE such
as Cd, Pb, Cu and Zn, in which the mean contents of Cd in soil are 10-16 mg/kg (Guo G.L., et al.,

LITERATURE REVIEW
10
2006). In general, the main TE contamination are due to Cd, Pb, Cu and Hg contamination in soils
in China. The sources are wastewater irrigation, industrial wastes, industrial emission, municipal
wastes and fertilizers.
2.2.3. Current situation of agricultural product security in China
Current situation of agricultural product security
In order to ensure agricultural product security, considerable progress has been made to promote
quantity and quality of agricultural products. However, contamination of agricultural products still
endangers security and export. Some 21% of total grain in the world is produced in China with
just 15% of the grain sowing area of the world. Thus 7% of cultivated land area in the world
supports 22% of the world population. At the end of the 1990s, outputs of main agricultural
products are continuing to increase. At the same time, the output of other agricultural products
increased obviously, such as output of fruits and vegetables achieved 6,658 × 104 tonnes and
48,337 × 104 tonnes in 2001, respectively. China is self-sufficient in agricultural products.
On the other hand, quality of agricultural products has improved to high levels in China.
Quantities with excellent grade quality of rice and wheat reach 25% and 20% of the total output
according to relative standards, respectively. Some 1/3 of fruits and 20% of tea are of excellent
grade quality. Pesticides and harmful substances have been effectively controlled in vegetables. In
2002, some 97.7% of vegetables samples were up to standards in Beijing, Tianjing, Shanghai and
Shenzhen, according to the standards of Codex Alimentarius Commission (CAC). However,
contamination of agricultural products still exists, because of environment contamination, resource
deficiency and unsuitable agricultural practises. TE and pesticides transfer from soil to agricultural
products. Pollutants in water and atmosphere also accumulate or deposit into agricultural products,
resulting in decreased quality. Unsuitable agricultural practises, such as unsuitable pesticide
spraying and fertilizer application, cause pollutant accumulation in agricultural products.
Antiseptic and package materials with harmful substances also lead to decreased agricultural
products quality (Bi R.T., et al., 2004).

LITERATURE REVIEW
11
The main pollutants in agricultural products are nitrate, nitrite, TE, harmful microbes, pesticides,
and plant growth regulators. The most serious contaminating pesticides exist in Cruciferae,
Solanaceae and Cucurbitaceous vegetables, especially in Chinese cabbage, leeks and cucumber.
TE contamination in vegetables has been paid more attention in China, especially in periurban
intensive vegetable production districts (Zhang M. & Gong Z.T., 1996; Du W., et al., 1999).
Current situation of trace element contamination in vegetables
Vegetable quality has been investigated in China, including effect of TE on vegetables in some
areas of China. Mean contents of Pb and Cd in melon were 0.105 mg/kg and 0.005 mg/kg in
Chongqing City (Chen Y.C., et al., 2003), 0.074 mg/kg and 0.007 mg/kg in Shanghai City (Wang
Y.G., et al., 1997), and 0.317 mg/kg and 0.022 mg/kg in Baoding City (Gao X.Y., et al., 2002),
respectively. Some 13.3% of vegetable samples exceeded the Cd standard, and 12% of that
exceeded Pb standard in Shanghai (Wang Y.G., et al., 1997). Pb was the main contaminating TE
in vegetables in Xi’an, 48% of vegetable samples exceeded the Pb standard (Ma W.X., et al.,
2000). TE contents in mustard in Nanjing were 1.41 mg/kg for Pb, 0.25 mg/kg for Cd, 5.77 mg/kg
for Cu and 25.49 mg/kg for Zn, respectively (Zhang C.L. & Bai H.Y., 2001). The Hg contents in
13% of vegetables and fruits, 16% of seafood samples were higher than the standards held in
Qingdao of China. Pb, Hg, Zn and Cd contents in vegetables in Shenyang exceeded standard
values, while Cd, Pb and Zn contents in vegetable soil were 7.06, 3.96 and 3.87 times of soil
background values (Wang L.F. & Bai J.G., 1994).
Absorption of TE by vegetables depends on many factors, such as TE characteristics, TE contents
in soil and the selectivity of vegetables to TE (Xu S.P., et al., 1999, Feng G.Y., et al., 1993). Soil
pH, soil texture, OM content and TE fractions in soil also influence TE availability for vegetables
(Liu F., et al., 2004; Zhou L.X. & Wong J.W.C., 2001).
Interspecific differences in accumulation ability to TE of vegetables exist (Wang L.F. & Bai J.G.,
1994). Leaf vegetables easily absorb Cd and Hg, legumes Zn, Cu, Pb and As, and melons easily
adsorb Cr. Mustard has the highest ability to uptake Cd, Cu and Pb, celery for Cd, Hg, As and Cr,
and spinach and tarragon for Cd and Zn. String bean and potato have high BCF (Bioaccumulation

LITERATURE REVIEW
12
factor = TE contents in plant/TE contents in soil) to Pb. The order of accumulation ability is leaf
vegetables, legumes, melon vegetables, eggplant vegetables, root and stem vegetables, depend on
heredity characteristics. The surfaces of leaves could also absorb pollutants from atmospheric
deposition. Wang Y.G., et al. (1997) evaluated Cd accumulation of vegetables with BCF, showed
high BCF of Cd in leaf vegetables, with high accumulation ability, such as spinach, celery and
Chinese cabbage. Chinese cabbage, chilli, eggplant and radish have the highest BCF of Cd, whilst
white gourd, cucumber, cabbage and tomato have the lowest Cd BCF (Chen T.M. et al., 2006;
Song B., et al., 2006). Hierarchical cluster analysis indicated that plant samples could be separated
into three groups based on Pb BCF in vegetables. Round beans trellis (Vigna unguiculata), radish
(Raphanus sativas), Chilli (Capsicum annuum) and bakchoi (Brassica chinensis), which
constituted the first group, had the highest Pb BCF. Chinese cabbage (Brassica pekinsis), eggplant
(Solanm sp.), Chinese green onion, tomato (Lycopersicon esculentum) and cabbage (Brassica
oleracea), have medium Pb BCF, while leaf beet (Beta vulgaris) and some special species
vegetables have low Pb BCF. On the other hand, the TE ability to be absorbed and accumulated in
vegetables is different, the order is Cr<Pb<As<Hg<Zn<Cu<Cd (Xie Z.M., et al., 2006).
Interspecific and intraspecific differences in Cd uptake and accumulation of Brassica are
significant. Beijing Xiaoza 55 (Chinese cabbage) has the highest shoot Cd content (61.4 mg/kg).
Cd content in Hong Kong Baihua’s (Chinese kale) shoot is only 18.6 mg/kg. The BCF of Xiaoza
55 (Chinese cabbage) can reach 3.07. But that of Hong Kong Baihua’s (Chinese kale) and
Jinqiuhong 2 is just 0.93 and 0.97, respectively. Considering the differences of accumulation
ability to TE, vegetables with less accumulation ability could be planted on slightly contaminated
soil, to decrease TE accumulation into the food chain, and vegetables with high accumulation
ability only being planted on non-contaminated soil (Yao H.M., et al., 2006).
TE in vegetable soils are mainly Cu, Zn, Pb, Cd, Cr, Hg and As, coming from pesticides, sludge,
inorganic fertilizers and even organic fertilizers due to animal food and medicines with TE.
Vegetable quality security still poses problems for human health in China. The main harmful
substances are TE, pesticide residuals, nitrate and nitrite, which are relative to soil quality,
irrigation water quality, monitoring technology and agricultural practices.

LITERATURE REVIEW
13
2.3. TRACE ELEMENT CONTAMINATION AND SOIL
2.3.1. Definition and sources of trace elements
Concepts of trace elements
Trace elements (TE) correspond to a group of elements, which density is >5 g cm-3, and are toxic
potentially to plants when the available content is in excess. TE usually in covalent compounds are
highly toxic. Pb, Cd, Hg, Cr and As are the most important toxic elements.
Human beings might be exposed to metallic hazards, due to abnormally high natural contents in
food or water. The use of metallic cookware increases the risk of adverse effects. With the coming
of the industrial age, occupational diseases became more frequent (Adriano, 2001). Later, diseases
related to industrial contaminants were recognized. Other sources of exposure include the release
of V into the atmosphere from oil combustion and the release of Hg from coal combustion. Thus,
while some TE are essential nutrients, they also serve as industrial and environmental hazards if
the homeostatic mechanism maintaining them within physiologic limits is unbalanced. Other
elements serve no biological purpose, while still others have the potential to produce
environmental diseases. Disease potential of elements is related to their ability to accumulate in
the body (Voegelin, et al., 2003).
Toxic levels of TE (such as Cd, Pb, Zn, Cu and Hg) occur in some natural as well as agricultural
soils, due to mining, smelting, some common agricultural practices (such as excessive use of
fertilizers) and waste disposal practices. Nowadays, TE have become one of the major
environmental hazards. TE cannot be degraded either chemically or biologically, hence they are
ultimately indestructible (Mejare & Bulow, 2001).
Fractions of trace elements in soil
TE in soil may be split among five fractions, including water soluble and exchangeable, carbonate
bound, iron-manganese oxide bound, organic bound and residual fractions (Tessier, et al., 1979).
Iron-manganese oxide bound fraction is wrapped up by iron-manganese oxides and could be

LITERATURE REVIEW
14
released under conditions of reduction. Iron-manganese oxide bound fraction is not easily
absorbed by plants, because iron-manganese oxide with huge specific surface has strong
adsorptive force (Wei J.F., et al., 1999). Organic bound fraction can set TE free under conditions
of oxidation, due to organic matter oxidative decomposition. Different TE has different bound
ability to organic matter. Residual fraction is bound to silicate mineral of quartz, clay and feldspar.
So, they are stable and difficult to be absorbed by plants (Wu X.M., et al., 2003a, b). Most TE
exist in the residual fraction (Mo Z., et al., 2002).
There are significant relationships between total TE contents and fraction contents. Relationships
between total Cu, soluble Cu and exchangeable Cu were observed in 68 soils (Sauve & McBride,
1989). Total Pb influences iron-manganese oxide bound Pb, soluble Pb and exchangeable Pb
fractions in 88 soils around Pb mine areas. According to the soil survey results around Wuhu Steel
Factory, total TE contents had significant positive relationships with exchangeable, carbonate
bound and residual fractions (Li Z., et al., 2005). Meanwhile, carbonate and iron-manganese oxide
bound fractions are able to transform back to exchangeable and soluble fractions with the root
dissolving secretion. This process is relative to soil types, crop species and TE contents.
Generally, water soluble and exchangeable fractions are the most bio-available. Fractions could
change with soil pH, organic matter content and CEC.
Sources of trace elements in soil
The consequences of TE are economically important, as they can induce soil and plant
contaminations from anthropogenic activities, such as mining, smelting, waste disposal, fertilizers,
pesticides and wastewater irrigation, in addition to contributions from mineral weathering of
parent materials. Natural metallic Cu was found and used by the ancients. Cu compounds have
been used in medicine and agriculture, for example, verdigris (cupric carbonate basic) as pesticide:
Bordeaux mixture (cupric hydroxycarbonate) combats mildew as a fungicide.
Cd is considered as a toxic pollutant. Agricultural soils in general are contaminated with Cd to a
certain extent where P fertilizers are applied (Cakmak, et al. 2000), because phosphate fertilizers
contain considerable amounts of Cd: 70-150 mg Cd per kg P2O5. Cd is produced as a by-product

LITERATURE REVIEW
15
of Zn or Pb production. Its industrial uses include plating for other metals (iron, steel, and copper),
in alloys, pigments for glass and paint and nuclear reactors as a neutron absorber and insecticides.
Pb enters the environment by escape during smelting of its sulphate ore, galena, as through use in
storage batteries, pipes and conducts, solder and pewter, and especially the addition of tetraethyl
Pb to petrol. Peroxide Pb, monoxide Pb, hydroxycarbonate and sulphate Pb are the principal white
paint pigments. Millions of tonnes of Pb arsenate were applied for insect control in the first four
decades of the 20th century. High contents in urban air have been reported in heavy automotive
traffic, 38.0 µg/m3 (natural mean content of atmospheric Pb is 0.79 µg/m3) (Wang H.X., 2002).
The natural Pb in fresh water has been estimated at ~1-10 µg/L. The natural content of Pb in soils,
exclusive of areas near Pb deposits, has a range of 2-200 mg/kg, with mean of ~16 mg/kg.
The other TE also can be derived from industrial wastes, municipal domestic wastes, smelting,
vehicle exhausting, pesticide and fertilizer application. In general, trace elements are distributed
widely in soils, water and the atmosphere. When it is used unreasonably, is posed risks to plant
and human health.
2.3.2. Distribution of trace elements in soil
Trace elements exist in different fractions in soil, some of them may move in horizontal and
vertical directions; and resulting in distribution of TE within the soil. TE biological availability
and harm to the environmental and ecological system are relative with TE transformation ability.
Distribution of TE is linked to variability of soil characteristics, environment factors, distribution
of human activities and land use. Soil characteristics are relative to geomorphology, soil formation
processes and climate (Wu Y.Y. & Wang X., 1998; Zhang S., et al., 1994; Koretsk, et al., 2007).
There are two levels of investigation, regional and local. Regional level distribution is mainly
influenced by morphological factors, such as parent material, soil types and relief, whilst local
level distribution is influenced by anthropogenic activities and soil characteristics
(non-pedological factors).

LITERATURE REVIEW
16
A. Regional level distribution of trace elements in soil
The regional distribution level of TE is associated with parent materials and relief. Land use
results in “island” distributions (Table 2.1). The variability of TE (Cu, Cr, Pb, Cd, Hg and As)
contents was studied in central Hailun areas in Inner Mongolia (Wang J.K., et al., 2003).
Distribution of TE from east to west was observed, which was mainly influenced by parent
materials and soil types. The variability of Cu was more significant than of Cr. “Island”
distributions of Cu, Cr and Pb were significant and existed widely, especially near Hailun County
town.
Table 2.1: Factors influencing the regional level distribution of trace elements in soils
Distance or Area Trace elements Influencing factors References 1,000 km Cu, Zn, Ni, Hg Soil types, relief, land use Wang X.J., et al., 2005
45,000 km2 Cr, Cu, As, Hg, Zn, Ni, Cd, Pb
Soil types, lithology Navas & Machin, 2002
860 km2 Cd,Cu,Mn, Ni, Pb, Zn
Regolithic substrates, morphogenetic characteristics, fuel combustion, solid wastes, liquid wastes
Romic & Romic, 2002
1,865 km2 Pb, Cd, Cu, Zn, Ni, Co, Cr, Hg, As
Parent materials, soil types Wang X.J., et al., 2005
500 km2 Cu, Ni, Zn, Cr Parent materials, organic matter, anthropogenic input
Thuy, et al., 2000
250 km2 Pb Tillage, traffic, vegetation Panichayapichet, et al., 2007
Land use also influences the regional distribution of TE. Distributions of Cd, Cr and Hg were
isotropic, whilst Pb and As were anisotropic (1,865 km2) in Shenzhen (Wang X.J., et al., 2005).
The SE-NW distribution of Cu, Co, Ni, V and As corresponded to the distribution of parent
materials and soil types. Cr, Zn, Sr, Pb, Ni, Co, Cd, Mn and Cu contents in topsoil from the
northern slope of Qomolangma (Everest) were linked to geochemical characteristics of different
rocks (Zhang Y.L. & Wang Z.F., 2007). Distribution of TE fractions is consistent with geological
distribution of brown soil in Beijing. Exchangeable and carbonate bound TE contents decreased
from south to north, and east to west. While Fe-Mn oxide bound TE increased from east to west
(Luo J.F., et al., 1993). The distributions of fractions of TE were observed in different soil types
(Liu Y.Y., et al., 2006).

LITERATURE REVIEW
17
Soil characteristics and waste deposits could affect TE distribution in soil. TE (Cu, Cr, Cd, Pb, Ni,
Zn) distributions among the sequential extraction fractions were affected by sediment properties,
such as pH (Zn), clay (Cd), readily reducible Fe oxides (Pb) and organic matter content (Cu) in
sediments in the Fusaro volcanic coastal lagoon of southern Italy (Pacifico, et al., 2007).
Distribution of TE in vegetable soil was influenced by transportation (Pb), municipal domestic
wastewater (Zn), wastewater irrigation (Zn), organic matter application (Cu) and geomorphology
(Cd) in Nanjing (Zhang Q.L., et al., 2005). As, Cu, Pb and Zn contents in soil around the mining
and smelting area of Tharsis, Riotinto and Huelva, Iberian pyrite Belt, SW Spain varied with
erosion and transportation distance (Chopin & Alloway, 2007).
Not only agricultural soils but also urban soils are consistent with soil pH, coarse particle contents,
and soil organic matter. The overall contamination degree, as indicated by the contamination index
calculated from the different accumulation of TE, was high for the industrial, old residential and
central commercial zones in Nanjing City. Both the soil properties and TE contents exhibited a
very remarkable variability. Some “islands” with extremely contaminated level might exist in
some locations with emission impacts (Wu X.M., 2003a; b). Highly contaminated soils are mainly
distributed in the northwest-southeast orientated areas, including most of the north, central and
part of the southeast regions of Hangzhou City (Fu J.L., et al., 2005). Industrial activities and age
of the residential areas were the most important factors affecting TE accumulation in soils.
Industrial region located at north of the city, and the main wind was from north. Pb, Cu and Zn
accumulations in the residential areas were linked with coal, dust, paints and sludge (Yin J., 2000).
Regional distribution of TE is linked to soil types, parent materials, relief and anthropogenic
activities.
B. Local level distribution of trace elements in soil
Horizontal distribution with local level
When exogenous TE increases rapidly, the TE distribution may change significantly at local level
(Uhlig, et al., 2001; Van Oort, et al., 2006). With wastewater irrigation, TE in wastewater will be

LITERATURE REVIEW
18
adsorbed into soil and accumulated at field entrances, resulting in TE contents increase. So it is
important to assess variation of soil quality at local level.
Distance from contamination sources and transportation also affects local TE distribution. The
maximum contents of Cu and Zn occurred near Yinzhuan in 1991 and near Yangzhuan Steel
Factory in 2003 in the northern industrial region of Xuzhou City, which was linked with Yinzhuan
factory closing, while Yangzhuan factory had still been producing (Liu H.X. & Han B.P., 2004).
Trace elements often accumulate in soil contiguous to highways, railway and tramway lines. The
spread range of TE from highway was >140-150 m, and contents of TE decreased when the
distance from highway increased in Ning-Han highway (Nanjing-Hanzhou) (Zhang C.L. & Bai
H.Y., 1998). In steel factories, the influencing range of TE accumulation in topsoil was >300 m
(Jiang L.Y., et al., 2002). Remobilization of soil stored TE close to roads can cause significant
environmental contamination of urban road systems and eventually stream sediments (Sutherland
& Tolosa, 2001).
Vertical distribution in local level
Trace elements in soil parent materials become active and movable during soil weathering and
formation. Because of vertical variation of influencing factors, TE contents in profile are different,
and result in the vertical distribution. TE in transported from topsoil to subsoil through leaching,
then deposits in certain layers. However, biological cycles will bring some TE back from subsoil
to topsoil or TE could be adsorbed by organic matter or soil particles. Therefore, the vertical
distribution of TE reflects soil formation processes and elemental cycles, indicating contamination
degree with anthropogenic activities (Table 2.2).

LITERATURE REVIEW
19
Table 2.2: Vertical distribution types and factors influencing trace elements in soil Types Trace elements Influencing factors References
Cd, Co, Cu, Mn, Ni, Pb, Zn Organic matter Heinrich, 2007 Pb Organic matter Michopoulos, et al., 2005 Topsoil
accumulation Cu, Zn, Ni, Hg
Soil types, climate, organic matter
Wang X.J., et al., 2005
Zn, Co, Cr, Ni, Cu, Pb Sulphides, organic matter Koretsky, et al., 2007 Cu, Zn, Cr, Pb, Cd, Ag Land use McCray, et al., 2001 Pb, Cu, Zn Organic matter, iron oxides Kabala & Szaeszen, 2002 As, Pb, Mo, Hg, Cd pH Bellett, et al., 1991
Transportation (vertical leaching)
Pb, Zn Iron colloids, clay-iron coatings
Oort, et al., 2006
Accumulation in topsoil
Accumulation of TE in topsoil widely exists in cultivated soil, which should be linked to climate,
anthropogenic activities and organic matter accumulation in topsoil (Liu F., et al., 2004; Heinrich,
2007). TE contents decreased with soil depth increase in Inner Mongolia (Wang X.J., et al., 2005).
In arid zones, the exogenous TE mainly accumulate in topsoil. On the one hand, leaching is weak,
due to the dry climate and biological cycles draw up TE to topsoil. On the other hand, TE from
transportation, atmospheric deposits, wastes, pesticides and fertilizers also accumulate in the
topsoil. Organic matter was found as a crucial factor of Pb binding in topsoil of 25 soil profiles of
forested Dystric Cambisols developed from granite and gneiss in the area of the Sudetes
Mountains (SW Poland) (Kabala & Scerszen, 2002). The main layer of TE accumulation is 0-20
cm in topsoil (Zhang M. & Gong Z.T., 1996; Feng G.Y., 1993).
Leaching down the profile
Because TE have affinity with organic matter, they may move down the profile accompanying
organic matter (Kabala & Scerszen, 2002). Particle size distribution also affects the vertical
distribution in the profile. The varying tendency of Co, Cr and Ni contents in the profile layer was
associated with the fine (<20 µm) mineral fraction, and Sn, Ti and Zn with the fine mineral
fraction and organic matter, and Cd, Cu and Pb with organic matter in France (Sterckeman, et al.,
2004). Vertical distribution in pore water and solid phase geochemistry were investigated in
urbanized minerotrophic peat sediments located in south-western Michigan, USA. Tessier
extractions indicated that the total extractable quantity of all elements analysed in this study
LITERATURE REVIEW
20
decreased with depth, and that most of the non-residual Pb, Zn, Cu, Cr, Co, Cd and U was
typically associated with the organic fraction of the sediments at all depths. Non-residual Mn, in
contrast, was significantly associated with carbonates in the upper 15-25 cm of the sediments, and
predominantly associated with the organic fraction only in deeper sediments (Koretsky, et al.,
2006).
Different levels of leaching transport are found for different elements under the influence of
infiltration of irrigation, or precipitation and other anthropogenic activities (Nan Z.R., et al., 2000;
Liu H.X. & Han B.P, 2004). Geographic setting also influences vertical TE distribution. For
example, the varying of TE in profiles was less in undisturbed soils, but near Cities, TE was
mainly distributed at 0-50 cm depth, because of wastewater irrigation, sludge application and
atmospheric deposits in Fujian Province (Wang Y.C., et al., 1996). The depth of leaching of Hg
and Cd was 40 cm and Pb 20 cm. The residual fraction was the main part in topsoil and subsoil,
while the exchangeable fraction was easily to move (Xiao Z., et al., 2005). Cao S.P. (2004)
described vertical distribution characteristics of TE contamination in soil profiles for eight
landscape units in Tianjin City. The TE (As, Pb, Mo, Hg and Cd) contents varied with soil
profiles. Soil profiles near the city were heavily contaminated by Cd, Hg, Cu and Pb, which were
concentrated at a 0-50 cm. Wastewater irrigation, sludge application and city dust precipitation
were the main causes of TE contamination. As and Mo were concentrated in the <80 cm soil layer,
and deposited with Fe and Mn in this layer, because of high solubility of As and Mo with high
topsoil pH.
2.3.3. Factors influencing the mobility of trace elements
Mobility and distribution of TE in soil mainly depend on soil morphological factors (soil parent
materials, soil texture, relief and soil types) and non-pedological factors (irrigation ways,
cultivation practises, fertilizer rates and pesticide rates). Besides TE contents and soil chemical
characteristics, mobility of TE is influenced by soil pH, organic matter, parent materials, clay
contents, rhizosphere, Eh, climate, agricultural practices and exogenous TE.

LITERATURE REVIEW
21
Effect of soil pH on mobility of trace elements
Soil pH is the main factor influencing the mobility and release of TE in soils, especially to explain
the vertical distribution in soil profiles (Zhao R., et al., 2001; Bellett, et al., 1991). TE change to
available fraction with decreasing pH. The adsorption and desorption of TE can be affected by pH.
The mobility and availability of TE have negative relationships with soil pH (Eriksson, 1989; He
& Singh, 1994). Available TE contents (soluble, exchangeable and carbonate bound contents)
decrease with pH increase, and Fe-Mn oxide bound TE fraction has a significant positive
relationship with soil pH (Liu X., et al., 2002a; Wang X. & Zhou Q.X., 2003). When pH increases
from 4.5-7.0, exchangeable Cd, Zn and Pb decreased, Fe-Mn oxide bound fraction slightly
increased and OM bound and residual fractions were stable in vegetable soils (Zhang X.X., et al.,
2003). The effects of acidity and ion contents of acid rain on TE in acidic soils indicate that TE
contents in soil solutions are controlled by the pH of acid rain and ion exchange reactions, the pH
of acid rain is the main factor influencing the mobility, release and vertical leaching of TE in soils
(Guo Z.H., et al., 2003; Rautengarten, et al., 2004).
Effect of organic matter on mobility of trace elements
Effects of organic matter (OM) on TE mobility include ion exchange adsorption and chelation.
OM could change the adsorption ability of soil to TE. OM is an adsorbent, which decreases or
changes the activity and transportation of TE in soil (Liu Q. & Wang Z.J., 1996; Kabala &
Szersezn, 2002; Lee, et al., 1997; Chen N.C. & Chen H.M., 1996; Shuman & Wang J., 1997).
Voegelin et al. (2003) regarded that organic matter may vary the activity of TE in soil, depending
on adsorption of humic acid and solubility of TE-humic acid chelated substance. Organic bound
Hg increased and available Hg decreased with increasing humic acid in purple soil (Hatter &
Naidu, 1995). Available TE decreased significantly with organic fertilizer applied to soil (Zhang
Y.L., et al., 2003; Hua L., et al., 1998). Carbonate bound TE contents were positively related with
organic matter contents, and soluble organic matter increased the available contents and
transportation of TE in soils in Hebei Province (Liu X., et al., 2003).
Water soluble Cd and exchangeable Cd increased from 27-54% with 320 g/kg sphagnum peat
application in soils, and Fe-Mn oxide bound Cd decreased from 19-13% (He & Singh, 1994).

LITERATURE REVIEW
22
Composition of organic fertilizer may be an important factor. Soluble organic matter increases the
mobility and biological activity of TE, such as fulvic acids. But high molecular organic
compounds (humin) adsorb TE and decrease the mobility and biological activity of TE.
Soil pH can affect organic matter constituents and oxide colloids, which will cause variability of
TE fractions (Li Z.L. & Xue C.Z., 1994; Kirkham, 1977). When pH is low, the ratio of fulvic acid
content in organic matter is high, resulting in TE leaching to subsoil and TE contents decreased in
topsoil in Shenzhen City (Wang X.J., et al., 2005). With lime application and pH increase,
exchangeable and organic bound fractions of TE decreased and residual TE increased (Zhang
X.X., et al., 2003).
Effect of particle size distribution and parent materials on mobility of trace elements
The distribution of particle size in soil affects adsorption, mobility and transportation of TE,
especially clay content in soil (Sterckeman, et al., 2004; Veogelin, et al., 2003). The physical and
chemical adsorptions increase with clay content in soil. Physical clay (<0.01 mm) content has
negative significant relationships with organic and Fe-Mn oxide bound TE in Fluvio-aquic soils
(Liu X. & Liu S.Q., 2003). TE contents in different layers in profiles increase with clay content.
Parent material was the key factor controlling the distribution of TE in Tianjian City (Xu S.P., et
al., 1999; Cao S.P., 2004). TE in the soils derived from colluvium deposit of igneous rocks,
granite rocks and sedimentary parent materials were easily to leach, and contents of TE in C layers
were higher than in the A layers, because of strong weathering. The TE contents in the soils
derived from alluvial parent materials were 1 - 1.5 times higher than from residual parent
materials. Due to the parent material of the plain area being primarily from the nearby mountain
area, separation based on particle size may be the major reason for this difference. Synthesized by
parent materials, influencing factors of mobility of TE include clay content, pH and organic matter
content, the order is: clay content>pH>organic matter content in soils in Inner Mongolia (Wang
X.J., et al., 2005).

LITERATURE REVIEW
23
Cultivated process, waste water irrigation, sludge application, city dust precipitation and other
anthropogenic activities also are the causes for mobility and distribution of TE (Zhang Z.P. &
Wang X.J., 1998; Romic & Romic, 2002; Panichayapichet, et al., 2007). Although there are many
models to assess TE mobility in soil, it is important to pay more attention to their transfer to the
food chain, considering their effects on human health.
2.4. TRACE ELEMENTS AND THE FOOD CHAIN
A. Bioavailability and absorption of trace elements by plants
TE in soil are able to be absorbed by roots of plants, then transferred to each part of the plant, such
as stem, leaves and seeds. Cu, Pb and Zn are not localized at the root surface, but are the highest
within cells of the stele (the vascular bundles) in electron-dense granules (Vesk, et al., 1999). The
endodermis casparian strip provides a barrier to the movement of TE into the stele. Once in the
leaves, however, TE is mostly in the xylem, followed by the mesophyll and then epidermal tissue.
In higher plants, the greater part of TE is stored in the roots and their transport to the shoot is
prevented. For example, some 86.7% of Pb in cucumber (Fodor, et al, 1996a) and ~98% of Pb in
stinging nettle (Fodor, et al., 1996b) remained in the root.
When TE are transported from root tissue to aerial tissue, they are accumulated in leaves and
stems. The degree of upward translocation depends on the species of plant, the particular metal
and environmental conditions (Fitzgerald, et al., 2003). TE (Cu, Pb and Zn) contents in individual
leaves of both Spartina alterniflora and Phragmites australis did increase greatly from new leaves
to senescence leaves (Weis, et al., 2003).
There are many factors which affect TE accumulation in plants. Different fractions of TE have
different availability. Soluble and exchangeable TE are the most available. Eh and pH conditions
can cause changes in fractions and solubility of TE, then increases in accumulation in plants.
Another factor that can affect TE accumulation in plants is the presence of microbial symbionts,
such as rhizosphere bacteria. Mycorrhizae (symbiotic fungi associated with roots) provides an
interface between roots and soil, increase the absorptive surface area of root hairs, and are

LITERATURE REVIEW
24
effective at assimilating TE that may be present at toxic contents in the soil in some conditions
(Meharg & Carney, 2000; Khan, et al, 2000).
Bioavailability of TE is also affected by nutrient availability. Nitrogen may strongly influence the
TE absorption in plants by changing the rhizosphere pH. NO3- strongly reduces uptake and TE
accumulation, whereas ammonium nutrition enhances their levels in plant tissues. It has been
shown that ammonium nutrition causes the net extrusion of protons and soil acidification; whereas
nitrate nutrition leads to protons consumption, increasing soil pH (Krupa, et al., 1997).
B. Effects on organisms
A buildup of toxic TE in the food chain results from massive quantities of TE being discharged
into the environment, in which plants constitute an important link (Wiersma, et al., 1986; Dudks &
Miller, 1999). Although TE contents are low sometimes, TE could be transported and
concentrated through the food chain, and accumulated in the human body, leading to chronic
poisoning with long-term exposure.
Toxic effect of TE that have no biological function on plants exists. Plants can tolerate certain
contents of potentially toxic TE, but toxicity and eventualy lethality level can be reached when TE
contents exceed specific levels. For the different potentially toxic TE, there are different toxicity
thresholds. TE is selectively accumulated or particularly hazardous to humans, but less to plants.
Due to accumulation through the food chain, their potential toxicity to humans is great in
comparison with their effects on plants. Cd is probably of most widespread concern, as it is readily
accumulated from soils by plants and may thereby enter the food chain (Chen H.M., et al., 2000)
and accumulate in humans (Baker, 1981).
Effects of TE on growth are consistent with their effects on longevity, fertility and the viability of
offspring. Toxicity includes hypertension, atherosclerosis, as well as alterations in carbohydrate,
lipid metabolism, glycosuria, proteinuria, shortened longevity, reproductive abnormalities and
weight loss in older persons (Varga, et al., 1997; 1999). One of the toxic effects of TE is to
decrease the body weight of aging human individuals. Topical exposure to certain occupational

LITERATURE REVIEW
25
metal hazards may result in irritation of the skin and eyes or sensitization reactions, or provide an
avenue of absorption, resulting in systemic toxicity. The neurological aspects of poisoning from
many TE indicate that the nervous system is an important target organ with respect to metal
toxicity, often this is not related to selective accumulation in the central nervous system. Cellular
toxicity increases with atomic weight within Cr, Mn, Ni, Cu, Zn, Ge, Gr, As and Se groups, but
decreases in V. Apart from possible human extrapolation, genetic information including for plants
is vital from the standpoints of safeguarding biodiversity and ecosystem health (Wurgler &
Kramer, 1992; Anderson, et al., 1994).
Genetic toxicology of TE has been implicated in human cancer, birth defects and mutations
(Flessel, 1977; Hartwig, 1995; Vansuyt, et al., 1997). Epidemiologic studies of industrial and
agricultural workers, especially from Europe, suggest that As and Ni are potent carcinogens. Skin
cancer has apparently occurred in areas with high As content in water. Liver cancer is also
believed to have been induced by arsenicals. Cd levels are significantly elevated in the serum,
liver and kidneys of patients with bronchial carcinomas, and chronic exposure to Cr increases the
incidence of lung cancer (Rossman, et al., 1987).
Biodiversity index of microbes decreases with integrative index of contamination increases (Li Y.,
et al., 1999; Yang J.L, et al., 2003). The ratio of fungus/bacteria decreased in soil contaminated by
Cu, Zn, Cd and Pb (Pennanen, et al., 1996). Low contents of TE stimulate microbial growth, and
high contents of TE cause decline of microbial biomass (Fliebbach, et al., 1994). TE influences
the behaviour, physiological process, heredity of organisms and biodiversity.
C. Effects on plants and crops
Soil TE affects the growth and development of plants and crops. TE stress symptoms on plant can
be divided into visible and only measurable symptoms. Concerning phenology, the most usual but
one of the least specific symptoms of TE toxicity is to limit growth, breeding, biomass, yield and
quality.

LITERATURE REVIEW
26
TE influenced the absorption of other nutrient elements (Siedlecka, et al., 2001). TE can affect
nitrogen absorption, assimilation, transfer and metabolism. TE change bacteria activity, resulting
in changes in the nitrate and ammonium contents in soil. Plasma membrane is the first place of TE
action. The altered plasmalemma H+-ATPase function would also explain the metal-induced
perturbation of the uptake of nitrogen. The inhibition of TE on key enzymes of the nitrogen
assimilatory pathway can alter nitrogen uptake (Zu Y.Q., et al., 2008).
TE may cause apparent morphological changes in plants. One of the most usual symptoms of TE
stress in the chlorosis of the leaves is due to the decrease of the chlorophyll contents (Fodor, et al.,
1996; Zornoza, et al., 1999). Since the chlorophyll contents may fundamentally influence the
functioning of the photosynthetic apparatus and thus affecting the whole plant metabolism, it is a
really important factor in assessing the impact of TE stress on plants. In more serious cases (more
susceptible plants or higher metal contents) necrotic spots or whole leaf necrosis appears. Cd
significantly decreases shoot and root weight, shoot height, root length and tillering number in
wheat genotypes, but growth inhibition is different between root and shoot, and among genotypes
(Zhang G., et al., 2000).
The physiological symptoms of TE toxicity include membrane permeability, water and ion uptake,
transportation and translocation, transpiration, root exudation, enzyme activities, nitrogen
metabolism, photosynthetic processes (electron transport, fluorescence induction, phosphorylation,
CO2 fixation), respiration, cell division and expansion, all kinds of synthetic processes and cell
homeostasis.
TE adsorbed in the cell walls do not exert any effect on metabolism. It is evident that stress factors
increase the activity of cell wall peroxidases and stimulate lignifications. The cell wall becomes
increasingly rigid due to this process, its ability to expand. The water uptake of the cells decreases
or stops and only the exchange of solutes may occur. It is also known that the proteins (α- and
β-expansions) facilitate expansion of the cell wall by TE.

LITERATURE REVIEW
27
Free radical production due to the effect of TE can lead to lipid peroxidation and the destruction of
membranes. However, plants possess numerous defensive mechanisms, so the loss of
semi-permeability appears only at excessive contents. The toxic impact of TE on higher plants has
numerous common features: growth inhibition, accelerated senescence and chlorosis. The
common are the most general mechanism of TE stress defence, such as phytochelatin synthesis,
proline accumulation and changes in activity of antioxidative enzymes (Kumar, et al., 1990;
Siedlecka, et al,. 2001). Cd can occur in free ionic state, so that it has a significantly toxic effect in
plants. Cd may exert its inhibitory effect in the cells in two different ways: it may bind to specific
groups on proteins and lipids inhibiting their normal function, and it may induce free radical
fraction inducing oxidative stress (Stroinski, 1999).
Effects of TE on plants depend on TE contents, sensitivity of plants and plant species. Some plants
are able to acclimate the negative effects of TE, resulting in specific and unspecific responses
which may lead to tolerance (Wang K.R. & Gong H.Q., 2000). Plants have developed numerous
mechanisms that make them maintain or restore the activity of many enzymes, thus creating a new
homeostasis and to adapt to the TE stress, such as hyperaccumulators. As TE could be transferred
from plant to human beings along the food chain, and will be harmful to human health, it is
important to assess the agricultural production security.
2.5. ASSESSMENT
2.5.1. Assessment of agricultural products
Agricultural product security
Agricultural product security includes agricultural product quantity security and agricultural
product quality security. On the one hand, quantity of agricultural product may meet the
requirement of the human population. On the other hand, agricultural product should be sanitary
and contamination free. Agricultural product quality security is consistent with grain safety and
food safety, including quality security of plant products and animal products (grain, oil, milk,

LITERATURE REVIEW
28
vegetables, aquatic products and mushrooms), processing products and by-products, which may
meet the standards of sanitary and food security.
Agricultural technologies, such as pesticide application, fertilizer application and irrigation, have
ensured quantity security of agricultural product. But unsuitable application ways of pesticides and
fertilizers may lead to contamination of agricultural product; even affecting development of
sustainable agriculture. Some new technologies, such as GMO technology (genetically modified
organisms), ohmic heating technology and enzyme technology, could increase the output of
agricultural product, improve resistance to stress and prolong crop storage time. However, changes
in nutritious substances and tastes will take place unpredictably, resulting in negative effects on
human health, the ecological environment and agricultural product quality. So, based on
international acceptable methods, the security of new technological agricultural products should
be evaluated.
Because China is largely an agricultural country, both traditional and new technologies should be
used to improve sustainable agriculture and produce uncontaminated agricultural product, green
food and organic food, based on their security assessment and management. Assessment of
agricultural product security is based on the standards of some substances, which can ensure the
quality of agricultural products and improve trade of agricultural products in the international
market. Facing more strict standards of food safety and green trade, more attention has to be paid
to assessment of agricultural product security in the future.
Assessment system of China’s agricultural product security
Hazard Analysis Critical Control Point (HACCP), which began in the USA in the 1960s, was
conducted throughout the world after the Codex Alimentarius Commission (CAC) of FAO/WHO
recommendations in 1963. HACCP became the standards for food security all over the world.
Many countries and organisms formulate standard systems for agricultural product quality, which
mainly include TE levels, maximum pesticide residual levels, maximum toxin levels, maximum
harmful microbe levels, food additive standards, package material standards, standards for food
testing methods and food label standards. For TE, Hg, Pb, Cr, Cd, Ni, Cu, Zn, Fe, Al, As and Se

LITERATURE REVIEW
29
are mainly considered. In China, agricultural products are classified according to three levels:
non-environmental contaminated food, green food and organic food.
Non-environmental contaminated food refers to agricultural products and manufactured
products free from contamination and safety corresponding with manufacture standards and
sanitary standards, and which are verified by provincial government. TE and pesticide contents in
agricultural products are lower than standard limits.
In 2006 “The Code of Primary Products Quality Security” was promulgated and put into practice,
which urged agricultural product quality. <The Farmland Environmental Quality Evaluation
Standards for Edible Agricultural Products> (HJ332-2006) has been put into practice on 1
February 2006. Trade standards for non-environmental contaminated food and national standards
for agricultural product quality are promulgated by the Ministry of Agriculture (China), at the
same time, which is the base of verification of agricultural product quality.
National standards for agricultural product quality include manufacturing environment standards
and quality standards. Manufacturing environment standards for agricultural products
(GB/T18407-2001) involve four national standard specifications, i.e. safety qualification for
agricultural product - environmental requirements for origin of non-environmental contaminated
vegetables (GB18407.1-2001), fruits (GB18407.2-2001), meat of livestock and poultry
(GB18407.3-2001) and aquatic products (GB18407.4-2001). Quality standards for agricultural
products (GB18406-2001) also include four national standard specifications. They are safety
qualifications for agricultural products, requirements for non-environmental contaminated
vegetables (GB18406.1-2001), fruits (GB18406.2-2001), meat of livestock and poultry
(GB18406.3-2001) and aquatic products (GB18406.4-2001).
“Green food” refers to food with free from contamination, safe of excellent quality and high
nutritional value, which is verified by the China Green Food Development Centre, the “green
food” standard is also promulgated by the Ministry of Agriculture (China), including A level and
AA level. In the A level of “green food”, it is permitted to apply chemical materials in the

LITERATURE REVIEW
30
manufacturing process. In the AA level of “green food”, it is not permitted to apply any chemical
substances, such as pesticides, inorganic fertilizers, animal food additives or food additives. Green
food projects were put into practice in China in 1990, and carried forward to the international
market in 1997. But AA level of green food still has some differences with organic food. Standard
systems for green food includes environmental quality standards, general standards for food
production and management, standards for pesticides, fertilizers, chemical hormones and
additives, standards for product quality, general standards for food labelling and documents for
product management.
The basic requirements for production area of green agricultural products and manufacture
products are no direct contamination sources from industries, upstream and windward. Crops,
livestock and poultry, aquatic products and food processing should correspond with green food
operation procedures. Agricultural product quality should meet national standards for green food.
Packing appearance should correspond with general standards for the labelling of foods.
Organic food refers to agricultural products and processing products corresponding with
organic producing standards and verification by the China Organic Food Certification Centre. Any
chemical substances, such as pesticides, fertilizers, hormones, plant growth adjusters and food
additives, cannot be applied.
2.5.2. Assessment of vegetable and crop quality security
A. China’s vegetable quality security
The planting area of vegetables is 1,300 × 104 ha each year, and the total output is 4.05 × 10⁹
tonnes in China. Vegetable quality is becoming increasingly important for human health and more
attention must be paid to vegetable quality security. The main problems concerning vegetable
quality in China include:
Environmental problems lead to vegetable contamination, from atmospheric, irrigation water
and soil sources. In China, most vegetable areas are located in periurban areas. SO2, HF, nitrogen
oxides and Cl2 are discharged by vehicles, deposited on agricultural soil and vegetable surfaces,

LITERATURE REVIEW
31
and cause soil and vegetable contamination. Industry wastewater and municipal wastewater with
F-, Pb and Hg flow directly on vegetable land. Municipal domestic waste contaminated by TE is
piled near vegetable land.
Pesticides are frequently applied to vegetables. So, pesticide residues are very serious. In the
world, the ratio of insecticides, fungicides, herbicides and others are 28, 19, 48 and 5%,
respectively. But in China, the ratios are 72, 11, 15 and 2%, respectively. About 35% of
insecticides are acute poison in the market in China, such as organo-phosphorus insecticides
(Chen H.M., et al., 2006). The tolerance of disease to fungicides increases with climate change
and intensive agricultural operations. The times of pesticide application increases from 5 to 30
each growth period. The loss of vegetables which were contaminated by pesticides achieved 10
billion dollars in China in the last 10 years (He L.L. and Li Y., 2003).
Inorganic fertilizers are applied unsuitably, resulting in decreased vegetable quality. Especially,
contents of nitrate and nitrite are over standard limits in vegetables. Nitrate contents of 27% of
vegetables samples were over the standard limit in Guangdong Province (Luo X.M. & Zhu B.,
2003). Nitrate is accumulated in different parts of vegetables.
Standard systems are not perfect, and are not always consistent with international standards.
B. Assessment of China’s vegetable quality security
Assessment of vegetable quality depends on three levels, including harmful substance contents,
nutritious substance contents and outward appearance. Corresponding to soil quality standards, the
standard systems of agricultural products and vegetables are Chinese food hygiene standards,
<Safety Qualification for Non-environmental contaminated Vegetables> (GB18406.1-2001),
<Maximum Standards for Green Food > (for example, Chinese cabbage group, NY/T 654-2002)
and <Maximum Levels of Contaminants in Food> (GB 2762-2005).
In order to ensure agricultural product security, Chinese food hygiene standards were proposed by
the Chinese Centre for Disease Control and Prevention in 1994, in which TE standards for
vegetables are included. The maximum levels for vegetables have been proposed in 2005 in China
(Table 2.3) (<Maximum Levels of Contaminants in Foods> (GB 2762-2005)).

LITERATURE REVIEW
32
About <Safety Qualification for Non-environmental Contaminated Vegetables>
(GB18406.1-2001), the maximum levels for TE are consistent with Chinese food hygiene
standards for As, Hg, Cd, Pb and Cr (Table 2.3). Considering the different accumulation of TE in
different vegetables, there are food sanitation standards for each group of vegetables, such as
Chinese cabbage, which is the same as that for non-environmental contaminated vegetables,
except for Cr (Table 2.3). Comparing with the European standard (REG (EU) No 466/2001), the
standard values of Pb and Cd for vegetables are the same as maximum levels of GB 2762-2005.
Table 2.3: Chinese food hygiene standards for TE in vegetables China national food sanitation standards Maximum levels (mg/kg FM)
Element Standards (mg/kg FM) Reference Standards and reference
As≤ 0.5 <Tolerance Limit of Arsenic in Foods>
(GB 4810-94)
0.5 (GB4810-84);
0.05a (GB 2762-2005)
Hg≤ 0.01 < Tolerance Limit of Mercury in Foods >
(GB 2762-94) 0.01 (GB2762-81)
Cd≤ 0.05 < Tolerance Limit of Cadmium in Foods >
(GB 15021-1994)
0.05 (GB238-84); 0.05d,0.1e,0.2f
(GB 2762-2005)
Pb≤ 0.2 < Tolerance Limit of Lead in Foods >
(GB 14935-94)
0.2 (GB14935-94);
0.1b , 0.3c (GB 2762-2005)
Cr≤ 0.5 < Tolerance Limit of Chromium in Foods>
(GB 14961-94)
Cu≤ 10.0 < Tolerance Limit of Copper in Foods >
(GB 15199-94) 10 (GB15199-94)
Zn≤ 20.0 < Tolerance Limit of Zinc in Foods>
(GB 13106-91) 20 (GB13106-94)
a: inorganic As content; b: vegetables except stem vegetables and leaf vegetables; c: stem vegetables and leaf
vegetables; d: vegetables except e and f; e: root-stem vegetables; f: leaf vegetables, celery and mushrooms;
As for green vegetables, there are different maximum levels for each group of vegetables, such as
Chinese cabbage, eggplant and tomato. Maximum levels of TE for green food, understanding the
Chinese cabbage group, are shown in Table 2.4.

LITERATURE REVIEW
33
Table 2.4: The maximum levels (mg/kg FM) for TE in vegetables in China
Non-environmental contaminated Food Green food
Element Vegetables
(GB18406.1-2001)
Chinese cabbage
(NY 5003-2001)
Chinese cabbage
(NY/T 654-2002)
As ≤0.5 ≤0.5 ≤0.2 Hg ≤0.01 ≤0.01 ≤0.01 Cd ≤0.05 ≤0.05 ≤0.05 Pb ≤0.2 ≤0.2 ≤0.1 Cr ≤0.5
In general, vegetable quality security is a requirement of international markets and customers, and
is a guarantee for human health. The development of vegetable production in China depends on
the development of non-environmental contaminated vegetables, green vegetables and organic
vegetables, improved by new technologies of fertilizer application and vegetable disease control,
monitoring, controlling and management.
2.5.3. Assessment of soil quality
Soil quality refers to the suitability of soil to be used and its adequacy to other environmental
functional factors, especially the health of human beings and other organisms, and economic
development. Soil quality assessment depends on land use, ecological systems, geological context,
soil types and soil characteristics.
For management in sustainable agriculture, assessment of soil quality is very important.
Assessment of the current situation of soil quality includes background value surveys,
contamination assessment and “soil health” assessment*. Assessment of environmental effects
refers to the effect of soil contamination on other environmental functional factors. Prediction
assessment is to evaluate change tendency of soil quality, in order to control and abate soil
contamination. Risk assessment is to evaluate the potential danger of pollutants to human health.
However, assessment of soil quality should be based on standard values of soil quality. It is
important to establish suitable soil quality standards and soil health quality standards with legal
* “Soil health” is an assessment of the ability of a soil to meet its range of ecosystem functions as appropriate to its environment.
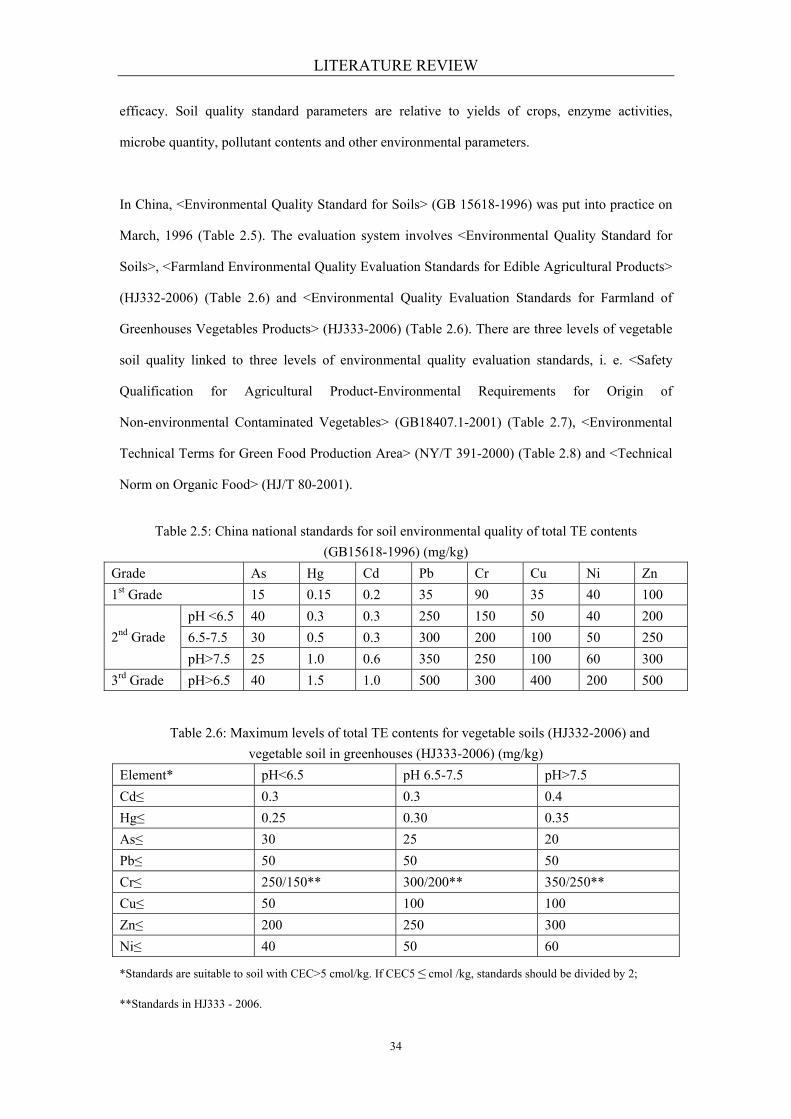
LITERATURE REVIEW
34
efficacy. Soil quality standard parameters are relative to yields of crops, enzyme activities,
microbe quantity, pollutant contents and other environmental parameters.
In China, <Environmental Quality Standard for Soils> (GB 15618-1996) was put into practice on
March, 1996 (Table 2.5). The evaluation system involves <Environmental Quality Standard for
Soils>, <Farmland Environmental Quality Evaluation Standards for Edible Agricultural Products>
(HJ332-2006) (Table 2.6) and <Environmental Quality Evaluation Standards for Farmland of
Greenhouses Vegetables Products> (HJ333-2006) (Table 2.6). There are three levels of vegetable
soil quality linked to three levels of environmental quality evaluation standards, i. e. <Safety
Qualification for Agricultural Product-Environmental Requirements for Origin of
Non-environmental Contaminated Vegetables> (GB18407.1-2001) (Table 2.7), <Environmental
Technical Terms for Green Food Production Area> (NY/T 391-2000) (Table 2.8) and <Technical
Norm on Organic Food> (HJ/T 80-2001).
Table 2.5: China national standards for soil environmental quality of total TE contents
(GB15618-1996) (mg/kg) Grade As Hg Cd Pb Cr Cu Ni Zn 1st Grade 15 0.15 0.2 35 90 35 40 100
pH <6.5 40 0.3 0.3 250 150 50 40 200 6.5-7.5 30 0.5 0.3 300 200 100 50 250 2nd Grade pH>7.5 25 1.0 0.6 350 250 100 60 300
3rd Grade pH>6.5 40 1.5 1.0 500 300 400 200 500
Table 2.6: Maximum levels of total TE contents for vegetable soils (HJ332-2006) and vegetable soil in greenhouses (HJ333-2006) (mg/kg)
Element* pH<6.5 pH 6.5-7.5 pH>7.5 Cd≤ 0.3 0.3 0.4 Hg≤ 0.25 0.30 0.35 As≤ 30 25 20 Pb≤ 50 50 50 Cr≤ 250/150** 300/200** 350/250** Cu≤ 50 100 100 Zn≤ 200 250 300 Ni≤ 40 50 60
*Standards are suitable to soil with CEC>5 cmol/kg. If CEC5 ≤ cmol /kg, standards should be divided by 2;
**Standards in HJ333 - 2006.

LITERATURE REVIEW
35
Table 2.7: Maximum levels of total TE contents for soil of non-environmental contaminated
vegetables (GB/T 18407.1-2001) (mg/kg)
Element pH<6.5 pH 6.5-7.5 pH>7.5 Hg≤ 0.3 0.5 1.0 As≤ 40 30 25 Pb≤ 100 150 150 Cd≤ 0.3 0.3 0.6 Cr6+≤ 150 200 250
Table 2.8: Maximum levels of total TE contents for soil of green vegetables production area
(NY/T 391-2000) (mg/kg)
Upland fields Paddy fields Element
pH <6.5 pH 6.5-7.5 pH >7.5 pH <6.5 pH 6.5-7.5 pH >7.5 Cd≤ 0.3 0.3 0.4 0.3 0.3 0.4 Hg≤ 0.25 0.3 0.35 0.3 0.4 0.4 As≤ 25 20 20 20 20 15 Pb≤ 50 50 50 50 50 50 Cr≤ 120 120 120 120 120 120 Cu≤ 50 60 60 50 60 60
<Technical norm on organic food > (HJ/T80-2001) is used for organic vegetable production. But
there are no soil TE standards proposed for organic vegetable production. In order to assess the
comprehensive contamination degree of TE, the signal index (Pi) and integrative index (P) of
contamination could be used (GB 2762-2005) (Table 2.9) (Liu F.Z., 2001; Wang Y.G., et al.,
2001).
Table 2.9: Standard grades of single index and integrative index for soil contaminated by trace
elements (GB 15618-1996; Huang G.F. & Wu Q.T., 2000; Liu F.Z., 2007)
Grade Pi P Contamination condition 1 Pi ≤1.0 P≤1.0 Pa≤0.85 Pb ≤0.7 No contamination
2 1.0<Pi ≤2.0 1.0<P≤2.0 0.85< Pa ≤1.71 0.7< Pb ≤1.4 Low grade contamination (low contaminated level)
3 2.0<Pi ≤3.0 2.0<P≤3.0 1.71< Pa ≤2.56 1.4< Pb ≤2.1 Medium grade contamination (medium contaminated level)
4 Pi >3.0 P≤3.0 Pa ≤2.56 Pb >2.1 High grade contamination (high contaminated level)
P=[(P’2i+P2max)/2]1/2, P’i: the mean Pi; Pmax: the maximum of Pi; Pi: the signal index of contamination.
If Ci≤Xs, Pi=Ci/Si (Xs is the 1st grade standard value), Ci is the analysis content, and Si is the standard value; If
Xs<Ci≤Xm, Ci/Si=1+(Ci-Xs)/(Xm-Xs)(Xm is the 2nd grade standard value); If Xm<Ci≤Xh,
Ci/Si=2+(Ci-Xm)/(Xh-Xm) (Xh is the 3rd grade standard value); If Ci>Xh, Ci/Si=3+(Ci-Xh)/(Xh-Xm).

LITERATURE REVIEW
36
Huang G.F. & Wu Q.T. (2000) modified the value of P (Table 2.9, Pa), and suggested that for
green food production area, the Nationa1 Soil Environmenta1 Quality Standard (GB156l8 - 1996)
is used as the soil quality assessment standards, in replace background values.
Liu F.Z. (2007) proposed that two stages of evaluation for TE contamination in soil, i.e. evaluation
for farmland soil TE contamination and evaluation for soil of agricultural production area.
Evaluation for farmland soil TE contamination is based on background values, showing the
accumulation of TE. The methods include single index (Pi) evaluation and integrative index (Pb)
evaluation (Table 2.9).
Evaluation for soil of agricultural production area is based on maximum standard levels for
available TE in soil, which is linked to relationships between TE contents in soil and in food parts
of vegetables, and the suitability of soil for vegetables.
2.6. EFFECTS OF AGRONOMIC PRACTISES ON THE
MOBILITY OF TRACE ELEMENTS
In order to control soil TE contamination, prevention should be recommended at the beginning.
Firstly, contamination sources should be controlled and suitably managed. Wastewater irrigation
and sludge applications should be careful and cautious. Fertilizers and pesticides containing TE
should be forbidden or limited. Secondly, assessment of soil environmental capacity† to pollutants
is necessary to prevent soil TE contamination. Finally, control measures should be taken into
account, which include physical remediation, chemical remediation, bioremediation and
phytoremediation.
Physical remediation includes “exchanging soil” technology, “covering clean soil” technology,
“turning over soil” technology and “diluting soil” technology. Those technologies are expensive,
and suitable only for small areas. Chemical remediation mainly includes soil leaching,
flushing/washing and soil amelioration. Soil buffer capacity and effect of self purification are
† TE content expressed in kg/ha

LITERATURE REVIEW
37
improved through lime, phosphate, furnace slag and organic matter application. In situ fixation of
TE using exterior amendments is a promising technology for cleaning up contaminated soils
(Zhou Q.X. & Song Y.F., 2004; Guo G.L., et al., 2006). In situ application of soil additives
modifying the physicochemical properties of the contaminating TE bound with the development
of biological communities and plants is a very useful alternative remediation method, based on
risk reduction and time and cost efficiency (Diels, et al., 2002).
Bioremediation refers to microbes and animals which could decrease TE contents in soil and fix
them through activities, adsorption and precipitation. Phytoremediation is relative to plants which
extract TE from soil and clean up soil. On the one hand, hyperaccumulators could extract TE from
soil effectively, especially in high grade contaminated soil and mining areas. On the other hand,
non-food plant instead of food crops could decrease TE in the food chain in medium or low grade
contaminated soil.
Periurban areas, special belts including urbanization, industrialization and agriculture, have
developed markedly in China. With the rapid development of the economy and human activities,
soil contamination has become more serious. in this place. Status of soil contamination and its
eco-environmental impacts should be considered. Corresponding strategies to control the mobility
of TE in soil in situ should be taken.
A. Availability of fixing additives
Fixing additives are suitable for low level contaminated soil, which fix TE and decrease the TE
bioavailability. In the fixation processes, cation exchange, adsorption and precipitation are the
main phenomena that can activate the primary mechanism of TE immobilization. However it is
unable to decrease total TE contents, or decrease TE contents to safe levels for human health in
highly contaminated soil. The typical fixation agents include alkaline amendments, phosphates,
organic manure and industrial co-products based synthetics (Guo G.L., et al., 2006; Wang W.J., et
al., 2006).

LITERATURE REVIEW
38
Alkaline amendment application
Low pH is accompanied by increased bioavailability of TE and soil calcium deficiency. So, to
increase the pH of soil is an effective way for acid soils. Alkaline amendments, including
limestone (CaCO3 95-98%), lime (CaO), alkaline furnace and basic slag, are the typical
amendments used for in situ immobilization. There are used to decrease the TE contents in soil
solution, TE extractability, metal mobility and leaching ability, increase transformation of soluble
TE to residual fraction, and finally decrease TE contents in plant tissues (Bolan et al., 2003; Guo
G.L., et al., 2006).
Quicklime (CaO) is put into soil resulting in large pH increases (Dermatas & Meng X.G., 2003).
Al toxicity could be eliminated, and activity of microbes and availability of phosphate are
improved with lime application. Meanwhile, pathogenic bacteria, insect eggs and weeds will be
killed, and clubroot could be prevented from radish and Chinese cabbage due to lime alkalinity.
Lime application is regarded as useful practice for controlling TE transfer from soil to plant (Chen
N.C. & Chen H.M., 1996; Xia H.P., 1997; Mathur, et al., 1991). Lime improves carbonate and
hydroxide precipitates and decreases TE availability. When pH increases, Cd bound with clay and
oxides (Wen Y.M., 1999), and most water-soluble Cd enters into the solid phase. Residual and
oxide bound Cd increases with lime application (Liao M., et al., 1998). Cd Bioavailability was
decreased by pH>6 (Liao M, et al., 1999). There were negative relationships between pH and Cd
and Zn bioavailability (He & Singh, 1994). Rate of lime application is relative to initial soil
types.
The mechanism for pH influencing availability of TE is as follows:
With increasing pH, negative charges on the surface of clay mineral, hydrated oxides and
organic matter increase and TE contents in soil decrease.
With increasing pH, the stability of chelates of TE-organic matter increases.
With increasing pH, specific adsorption of oxides to TE is enhanced.
With increasing pH, hydroxide precipitates are easily formed.

LITERATURE REVIEW
39
Organic additive application
Organic additives could improve soil structure and combine with TE to decrease bioavailability of
TE as a slow release nutrient source. Most organic additives are from farmyard manure, poultry
manure, sewage sludge, domestic refuse and straw (Suran, et al,, 1998; Guo G.L., et al., 2006).
Available Cd can decrease by 40% with organic fertilizer application (Zhang Y.L., et al., 2003).
Bark and sawdust are effective because of their high tannin contents. The polyhydroxy groups of
tannin are considered as the active sites in the adsorption process of TE (Vazquez, et al., 1994;
Suran, et al., 1998).
The mechanism for organic matter influencing TE availability lies in:
Humus in organic fertilizer combines with TE to form stable chelate (metal-HA complex)
(HA: humic acid), especially humin.
There is dilution of organic fertilizer to decrease TE contents in soil.
Some elements in organic fertilizer have antagonism with TE.
Organic fertilizer improves plant growth and affects TE adsorption.
Soluble organic matter in organic fertilizer could increase available TE contents in soil, for
example metal-FA (FA: fulvic acid) complex (Zu Y.Q., et al., 2003; Weng L.P., et al., 2002).
Sphagnum peat was used as organic fertilizer in sandy soil, soluble Cd and exchangeable Cd
increased from 27-54% and Fe-Mn oxide bound Cd decreased from 19-13%, respectively (He &
Singh, 1993). Application of organic fertilizer containing excess TE should be forbidden.
Other fixing additive
There are interactions between TE and nutrient elements (N, P, K, Fe, Ca and Mg). On the one
hand, TE influence nutrient elements absorbed by plants. On the other hand, nutrient element
application will also decrease absorption and TE stress on plants (An Z.Z., et al., 2002; Serrano,
1990; Zu YQ, et al., 2008). NH4+-N could cause H+ exosmosises and soil acidification in the
rhizosphere, while NO3--N causes H+ absorption and pH increase in soil. So, NO3
--N fertilizer
applied will restrain absorption of Pb, Zn, Mn and Cu by plants (Cox & Reisenauer, 1997; Tills &
Alloway, 1981; Kumar, et al., 1990; Weber, et al., 1991).

LITERATURE REVIEW
40
Interactions between P and TE were observed (Zimdahl & Foster, 1976; Karblane, 1994).
Phosphate fertilizer decreased Cd content by 41% in potato and ryegrass, which includes CaHPO3,
Ca(H2PO3)2, K2HPO4, H3PO4 and (NH4)HPO4 (Karblene, 1994; He & Singh, 1982). Fe and TE
also have interactions. Fe deficiency in soil could cause increases in Cd, Cu, Co, Cr, Ni, Mn and
Zn contents in plants (Misra & Romani, 1991; Siedlecka & Baszyn’ski, 1993; Ouzounidou, 1995;
Schmidt, et al., 1997; Lagriffoul, et al., 1998). Cd absorbed by ryegrass could be restrained by Ca,
Mn and Zn (Jarris, 1976), and Mn caused decreases in Cd absorption (Harrison, et al., 1983).
B. Decrease in accumulation of trace elements by crop rotation with vegetables
Crop rotation is a useful measure in agricultural production practice. To tackle TE contamination
in soil, especially in intensive agricultural areas, it has an important role and excellent effects.
Trees, flowers, grass and cash crops are chosen to plant in low TE contaminated soil, and shoots
of sorghum and corn could be used to produce alcohol and press for plant fibre (Ding Y., 2000;
Wang X., 1998). Wang K.R. & Gong H.Q. (2000) proposed a strategy of agro-ecological
regulation and safe utilization in farmland contaminated by Cd, which used Cd-tolerant cash crops
to replace sensitive crops, bound with agricultural remediation practises. Some plants have strong
physiological resistance to Cd, such as Brassica napus, Arachis hypogaea, and Saccharum
offrunarum. Meanwhile, Cd contents in oil and sugar are low and have little effect on their edible
quality, so, it is possible to cultivate these crops in some slightly Cd contaminated farmlands. But
the straw and remains of oil crops and sugarcane residue should be treated as pollutants, as they
are not suitable as manure or stock food.
Fibre crops, such as Gossypium hirsutum, Hibiscus cannabinus, Boehmerium nivea and Morus
alba, are resistant to Cd contaminated soil to different degrees. There are basically no
unfavourable effects of Cd contaminated soil on the products of fibre crops. Moreover, there is
hardly any Cd entering the food chain through these crops. Cd content of soil decreased by 27.6%
after 5 years when ramie (Boehmeria nivea (L.) Gaud.) grew in Cd 100 mg/kg soil (Lin K.F.,
1996). Therefore, considering the strategy of agro-ecological regulation and safe-and-efficient

LITERATURE REVIEW
41
utilization of Cd contaminated farmlands, these fibre crops should replace those sensitive crops in
contaminated regions.
Vegetable rotation has obvious effects for low TE contaminated soil. Vegetables are divided
among three levels according to BCF for Cd, i.e. low accumulation vegetables (BCF <1.5,
cucumber, China bean, cauliflower, kale, white gourd), medium accumulation vegetables (BCF
<4.5, lettuce, potato, radish, green onion, onion, and tomato) and high accumulation vegetables
(BCF >4.5, spinach, celery, Chinese cabbage). In highly contaminated areas, low accumulation
vegetables should be chosen; in medium grade contaminated area, vegetables should be chosen
with low and medium accumulation. Cabbage and cauliflower planted in Spring, tomato,
cucumber and China bean in Summer, kale, cauliflower, cucumber and China bean in Autumn in
the Shanghai suburban area decreased Cd contents in vegetables by ~68% compared to Cd
contents in vegetables prior to this rotation (Wang Y.G., et al., 1997).
To some extent, low percentage of soluble parts and unstable transformation of TE in soils result
in difficulty in fixation of TE. In situ fixation with exterior amendments within low TE contents in
soils may offer a promising option, especially for the low contaminated level derived from
agricultural sources. Possible release of metal ions from fixed contexts under environmental
stresses, such as acidic flows, temperature fluctuation and accelerated weathering processes, could
be simulated in a kinetic way, which should obtain the detailed information for environmental risk
assessment.
2.7. CONCLUSIONS
Total cultivated land area in China only occupies 15.1% of land area. Soil erosion, drought,
nutrient deficiency, salinization and soil contamination lead to degradation of cultivated land. The
main TE contamination is due to Cd, Pb, Cu and Hg contamination in soil in China. The sources
of soil TE include wastewater irrigation, industrial wastes, industrial emissions, municipal waste,
phosphate fertilizers and organic fertilizers linked to animal food and medicines with TE.

LITERATURE REVIEW
42
TE have become one of the major environmental hazards which cannot be degraded chemically or
biologically, hence, they are ultimately indestructible. In the following sections, five fractions of
TE in soil will be distinguished: water soluble and exchangeable, carbonate bound,
iron-manganese oxide bound, organic bound and residual fractions. Mobility of TE in soil
(horizontally and vertically) depends mainly on soil morphological factors (soil parent materials,
soil texture, relief and soil types) and non-pedological factors (irrigation, cultivated practises,
fertilizers and pesticides).
Organisms may absorb TE and suffer toxic effects of TE accumulation. TE influences the
behaviour, physiological process, heredity of organisms and biodiversity. TE transfer from soil to
vegetables and crops, then affect crop growth, breeding, biomass, yield and quality. Effects of TE
on plants depend on TE contents, plant sensitivity and plant species. Some plants have developed
numerous mechanisms to maintain or restore the activity of enzymes, then to create a new
homeostasis and adapt to TE stress, such as hyperaccumulators.
Considering sustainable cultivated land use and food security, assessment of agricultural products
and soil quality is necessary. The evaluation system of agricultural products involves
environmental quality standards for soils, edible agricultural products and farmland of greenhouse
vegetable product. There are three levels of vegetable soil quality which are linked to three levels
of environmental quality evaluation standards, which are environmental requirements for the
origin of non-environmental contaminated vegetables, environmental technical terms for green
food production areas and technical norms for organic food.
Physical remediation, chemical remediation, bioremediation and phytoremediation are the main
remediation mechanisms for soil contaminated by TE. Fixing additive application and crop
rotation measures, belonging to in situ fixation techniques in low TE contaminated soil, are
consistent with intensive agricultural districts with limited cultivated land, especially in periurban
areas.

43
III: GENERAL METHODOLOGY
3.1. INTRODUCTION ..............................................................................................44
3.2. GENERAL DESCRIPTION..............................................................................44
3.2.1. General description of Yunnan Province ....................................................................44 3.2.2. Description of the research area: Chenggong County.............................................54
3.3. PRESENTATION OF THE METHODOLOGY.............................................63
3.3.1. Existing documents ................................................................................................................65 3.3.2. Field survey ............................................................................................................................66
3.4. METHODS..........................................................................................................70
3.5. DISCUSSION AND CONCLUSIONS..............................................................73


GENERAL METHODOLOGY
44
3.1. INTRODUCTION
The research area is located in Chenggong County, which is one of the most important vegetable
production areas in Yunnan Province (the south-western border Province of China). There are
special natural conditions, soil types, land uses, soil pressures and vegetable production situations
in the research area.
In order to investigate soil TE contamination in the research area, the methodology is consistent
with soil types, relief and vegetable production practises. Aims of this chapter are:
1) Introduce the basic information of the research area.
2) Explain the methodology.
3) Present the analytical methods used.
3.2. GENERAL DESCRIPTION
3.2.1. General description of Yunnan Province
Yunnan is located on the south-western border of China, covers an area of 3,832.1 × 104 ha and
lies between 21°8’32’’ and 29°15’8’’ North and 97°31’39’’ and 106°11’47’’ East (Figure 3.1).

GENERAL METHODOLOGY
45
Figure 3.1: Map of China
(Source: http://www.perso.wanadoo.fr/cruells/chine/index-cartes.html).
Generally, northwest Yunnan is connected with the Qinghai-Tibet Plateau and strongly influenced
by Himalayas in their late development. The Yunnan crust has been expressing very intense
mobility and strong earthquakes still occasionally occur in Yunnan. The climate of Yunnan
Province is mild, features small differences in temperature during the year, has only two obvious
differentiated seasons, resulting from the alternate influence of the tropical summer monsoon and
air masses from the Qinghai-Tibet plateau. Over 70 % of annual rain falls during the rainy season,
from June to October, whereas rain can be very scarce during the dry season. From southern to
north-western ends of the Province, seven mesoclimatic zones exist (Table 3.1).
Kunming

GENERAL METHODOLOGY
46
Table 3.1: Main features of the seven mesoclimatic zones in Yunnan Province
(Source: Yunnan Province Planting Areas, 1992)
Coldest month temperature range (oC)
Climatic zones
Mean value Lowest value
Days with temperature > 10 oC
Cumulative temperature (> 10 oC)
Harvest frequency (times)
North tropics >15 >3 >360 >7,500 3 / year
South subtropics 10 - 15 0 - 3 320 - 360 6,000 - 7,500 3 / year
Middle subtropics 8 - 10 - 3 - 0 280 - 320 5,000 - 6,000 5 / 2 years
North subtropics 6 - 8 - 5 - - 3 220 - 280 4,200 - 5,000 2 / year
South temperate 1 - 6 - 8 - - 5 160 - 220 3,200 - 4,200 2 / year
Middle temperate 0 - 2 - 10 - - 8 100 - 160 1,600 - 3,000 3 / 2 years
Plateau climate <0 <-10 <100 <1,600 1 / year
The Province average elevation is 2,000 m, whereas the Meily Snow Mountain peaks at 6,740 m,
the elevation in Hekou (near the Vietnamese border) is 76 m. Yunnan Province is mainly formed
of mountainous areas, only 6% of the total area is considered as flat. From a geomorphological
viewpoint, three great geomorphological units can be distinguished in Yunnan Province, which
are the eastern Karst Plateau, Central Red Plateau and Western Hengduanshan Mountain
(extension of Qinghai-Tibet Plateau) (Figure 3.2).

GENERAL METHODOLOGY
47
Figure 3.2: The three geomorphological units in Yunnan Province
(Source: Booklet of Yunnan Map, 2002).
Yunnan is largely endowed with mineral and biological resources, it is called the: “kingdom of
non-ferrous metals”, “natural garden” and “kingdom of plants”. The total population is
44,830,000 inhabitants (2006). About 85% of the population lives in rural area and about one half
is concentrated in basin areas.
Yunnan soils
The total area of soil is 3,522.9 × 104 ha in Yunnan Province (Figure 3.3). Red soils are the most
widespread, accounting for 32.2% of the total area. Red soils show a patchy distribution all over
the Province. Laterite soils are mainly encountered in southern areas ≤1,200-1,500 m. Purple soils
(14.1%) are mainly distributed in the central region, alternating with red soils. Lateritic red soils
(14.6%) become predominant up to an elevation of 2,300 m. Yellow soils increase with altitude,
as a result of the combination of high precipitation and low temperature. In the region between
2,500-3,000 m altitude, brown soils dominate, whereas in the north and north-western high
mountains (>3,500 m elevation), the main soils are dark brown earths and grass marshland. Purple
shale exists from the Mesozoic Era (as parent material) at elevations <2,300 m (Figure 3.4).

GENERAL METHODOLOGY
48
Figure 3.3: The soil types of Yunnan Province (Source: Zhao Q.G., et al., 2006).
Figure 3.4: The distribution of soil types in Yunnan Province
(Source: Zhao Q.G., et al., 2006).

GENERAL METHODOLOGY
49
Cultivated land in Yunnan Province
The total cultivated land is 633.97 × 10⁴ ha (16.5% of the total Province area), including paddy
fields (138.21 × 10⁴ ha) and uplands (468.85 × 10⁴ ha) in 2000 (Figure 3.5). The sloping upland is
the most common land. Area of cultivated land with slope degree <2° is 72.38 × 10⁴ ha, or 11.6%
of the total area. There are 47.6% (306.83 × 10⁴ ha) of cultivated land with slopes >15° (Figure
3.6).
Figure 3.5: The distribution of percentage of different types of cultivated land to total
cultivated land area in Yunnan Province (Source: Zhao Q.G., et al., 2006).
Figure 3.6: The distribution of percentage of cultivated land area with different slope degree
to total cultivated land area in Yunnan Province (Source: Zhao Q.G., et al., 2006).
The importance of agriculture in Yunnan Province
Agriculture is of prime importance for the Yunnan economy. Some 80% of the total population
depend upon agricultural incomes. In 2006, the total gross domestic product (GDP) was 4,001.87
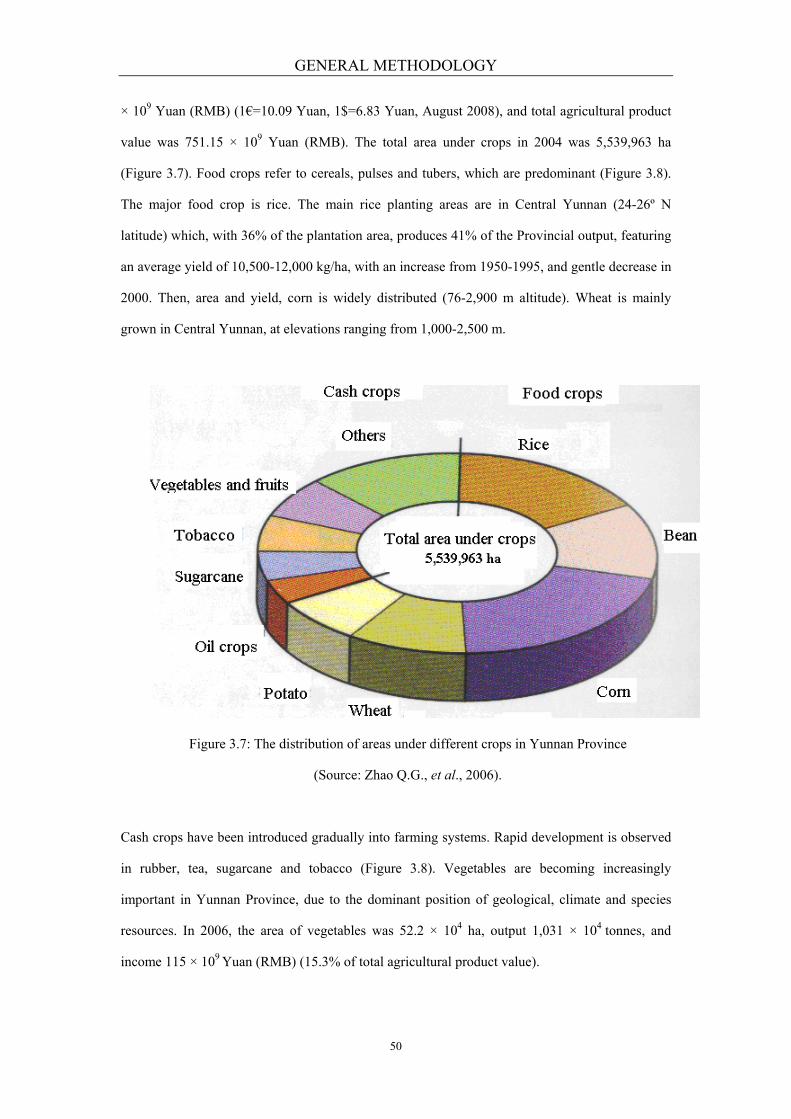
GENERAL METHODOLOGY
50
× 109 Yuan (RMB) (1€=10.09 Yuan, 1$=6.83 Yuan, August 2008), and total agricultural product
value was 751.15 × 10⁹ Yuan (RMB). The total area under crops in 2004 was 5,539,963 ha
(Figure 3.7). Food crops refer to cereals, pulses and tubers, which are predominant (Figure 3.8).
The major food crop is rice. The main rice planting areas are in Central Yunnan (24-26º N
latitude) which, with 36% of the plantation area, produces 41% of the Provincial output, featuring
an average yield of 10,500-12,000 kg/ha, with an increase from 1950-1995, and gentle decrease in
2000. Then, area and yield, corn is widely distributed (76-2,900 m altitude). Wheat is mainly
grown in Central Yunnan, at elevations ranging from 1,000-2,500 m.
Figure 3.7: The distribution of areas under different crops in Yunnan Province
(Source: Zhao Q.G., et al., 2006).
Cash crops have been introduced gradually into farming systems. Rapid development is observed
in rubber, tea, sugarcane and tobacco (Figure 3.8). Vegetables are becoming increasingly
important in Yunnan Province, due to the dominant position of geological, climate and species
resources. In 2006, the area of vegetables was 52.2 × 10⁴ ha, output 1,031 × 104 tonnes, and
income 115 × 109 Yuan (RMB) (15.3% of total agricultural product value).

GENERAL METHODOLOGY
51
Figure 3.8: The area and yield of main crops from 1950-2000 in Yunnan Province
(Source: Zhao Q.G., et al., 2006).
Pressures on Yunnan soil
Decrease in cultivated land surface is the greatest challenge for the soil resources of Yunnan
Province, because of soil erosion, mud-rock flow, slip and soil contamination. The area of soil
affected by erosion is 141,334 ha, or 36.9% of the total land area (Zhao Q.G., et al., 2006). Some
83.45 × 10⁴ ha of agricultural land are annually damaged by mud-rock flow and slip. Soil
contamination also is a very serious pressure in Yunnan Province, due to domestic waste,
pesticides, fertilizers, wastewater and plastic film residues (Liu H.J., et al., 2006). Industrial
activities are allowed by the natural resources in non-ferrous metals. Pesticides and fertilizers are
applied unsuitably, causing pesticide residues, nitrate/nitrite and TE contaminations. Pesticides
are used on 75-120 kg/ha each year in the main vegetable areas in Yunnan Province. In 2000,
54.2% of vegetable samples contained pesticide residues in Kunming market, 22.6% in 2003
(Duan C.Q., et al., 2006).
Increasingly attention has been paid to soil TE contaminations. In south-east Yunnan Province,
soil with high background values of TE should be avoided for planting vegetables. Because

GENERAL METHODOLOGY
52
vegetable production is always near cities and towns, TE from industrial wastes, municipal
domestic refuse and wastewater also cause soil contamination in Yunnan Province.
High background values of trace elements
As shown in Tables 3.2 and 3.3, the soil background values are quite high in Yunnan, especially
in Kunming Prefecture, compared to that in China, even in the world. On average in Kunming,
contents of Pb, Cu, Zn and Cd are higher than in the rest of China. Contents of Pb in topsoil (A
layer) are higher than in parent materials (C layer).
The high background values are relative to mineral resources, which are abundant in Yunnan
Province. The mineral main resources are Cu, Fe, Pb, Zn and P. For example, there is a
distribution belt of Cu mines from north-west to south-east, resulting in high Cu contents in soil.
Pb/Zn mines are distributed widely in Yunnan Province, causing high Pb, Zn and Cd contents in
soil.
Table 3.2: Background values (mg/kg) of TE in soil (A layer) and parent materials (C layer)
in Yunnan Province (Source: Duan C.Q., et al., 2006)
A layer Element
Range Mean C layer
Pb 2.2 - 108.2 44.8 40.1 Cd 0.003 - 1.059 0.241 0.243 Cu 3.5 - 145.6 49.2 49.1 Zn 0.4 - 211.6 95.0 103.6 As 0.6 - 64.8 18.9 21.2 Cr 1.0 - 160.0 78.4 87.3 Hg 0.003 - 0.150 0.054 0.080 Ni 0.4 - 104.2 45.2 58.4
Table 3.3: TE contents (mg/kg) in soils (Source: Duan C.Q., et al., 2006)
World Soils China soils Yunnan soils Kunming soils Element
Range Mean Range Mean Range Mean Mean Pb 2 - 300 35.0 1.5 - 52.1 24.0 2.2 - 108.2 37.9 43.3
Cd 0.010 - 2.000 0.060 0.001 - 0.460 0.070 0.075 - 0.331 0.116 0.177
Cu 2 - 250 20.0 7.3 - 55.1 20.0 3.5 - 145.6 34.0 44.6
Zn 1 - 900 40.0 5.0 - 143.8 74.4 0.4 - 211.6 77.7 99.2

GENERAL METHODOLOGY
53
Anthropogenic sources of trace elements
Contents of TE are different among soil types in Yunnan Province (Table 3.4). TE contents in soil
are increasing in some regions (Wang H.S., et al., 2006; Zha T. & Li Z.Y., 2003). It seems that
agricultural soils contaminated by TE suffer from the use of contaminated water for irrigation.
These pesticides often contain with TE as active materials, for example, Zn-based (Zineb,
Mancozeb) or Cu-based (CuSO4). Some 26,000-30,000 tonnes of pesticides are used each year, in
which 40% of pesticides are applied on vegetables in Yunnan Province.
Table 3.4: Mean contents (mg/kg) of Pb, Cd, Cu and Zn in Yunnan soils in 1996
(Source: Wang H.S., et al., 2006)
Soil Pb Cd Cu Zn
Mean 52.8 1.430 38.7 89.8
Red soil 50.3 1.510 50.6 92.3
Paddy soil 62.1 1.430 37.8 87.2
Alluvial soil 39.6 1.070 49.3 98.4
The use of phosphate fertilizers and other materials contaminated by TE were also observed
(Table 3.5). For instance, the mean contents of TE in rock phosphate are 3.8 mg/kg for Cd, 242.1
mg/kg for Pb, 54.2 mg/kg for Cu and 225.3 mg/kg for Zn (Hua Z.Z. & Duan Q.Z., 2001). Cd
contents in phosphate mines in China are 0.1-571 mg/kg (mainly 0.2-2.5 mg/kg) and correspond
to a medium level (Lu R.S., 1998). However, it represents a small part of the total quantity of
phosphate fertilizers used by farmers, compared to calcium superphosphate [Ca(H2PO4)2 · H2O],
fused calcium magnesium phosphate [α-Ca3 (PO4)2 · H2O] and CaH4(PO4)2 · H2O. Average
amounts of phosphate fertilizers are ~ 40 kg/ha/year in Yunnan, 260 kg//ha/year in Kunming
Prefecture, ~438 kg/ha/year around Dianchi Lake.

GENERAL METHODOLOGY
54
Table 3.5: TE contents (mg/kg) in agricultural materials (Source: Wang H.X., 2002)
Element Solid
wastes
Farmyard
manure
Phosphate
fertilizers
Nitrogen
fertilizers
Lime Pesticides Urban
sludge
Ash
Cd 0.010 - 100 0.100 - 0.800 0.100 - 190 0.050 - 8.500 0 - 0.040 - <1 - 3,410 0.200 - 14
Cu 13 - 3,580 2 - 172 1 - 300 - 2 - 125 - 50 - 8,000 45 - 616
Pb 1.3 - 2,240 0.4 - 27 4 - 1,000 2 - 120 20 - 1,250 11 - 26 2 - 7,000 3.1 - 241
Zn 82 - 5,894 15 - 566 50 - 1,450 1 - 42 10 - 450 - 91 - 49,000 14 - 406
Facing these pressures, measures should be taken to maintain safe agricultural production and
guarantee human health.
3.2.2. Description of the research area: Chenggong County
3.2.2.1 Natural conditions
Chenggong County is located to the south-east of Kunming City, which is located in the middle of
the Yunnan Province. Dianchi Lake is next to the west border line of Chenggong County (Figure
3.9).
Figure 3.9: Location of Chenggong County and the research area
(Source: Map Collection of Yunnan Province of China, original scale: 1:550,000).

GENERAL METHODOLOGY
55
Chenggong County covers 4.79 × 10⁴ ha, which lies between 25o 59’ 32’’-24o 24’ 0’’ N and 102o
59’ 15’’-102o 45’ 30’’ E. The total soil area is 33,236 ha. Agricultural production has been
untaken for ~2,000 years. The main agricultural crops are rice, fruits, vegetables and flowers.
The climate belongs to the north-subtropical climate zone, which has the features of the tropical
monsoon. Over 70% of annual rain fall during the rainy season, running from June to October. As
a result, rainfall can be very scarce during the dry season from November to May. There are small
differences in temperature during the year. The average temperature is 14.7 oC annually, with the
coldest mean temperature of 7.8 oC in January, and the warmest mean temperature of 19.8 oC in
July. The average temperature of east mountain areas is 1.7 oC lower than in the lacustrine plains.
Total precipitation is 778 mm annually, and the highest rainfall is 152 mm in August, whilst the
lowest rainfall is ~10 mm in January. According to the situation, the rainfall in the mountain areas
is more than in the lacustrine plains.
Evaporation is 2,129 mm annually, which is 2.7 times higher than precipitation. The average
relative humidity is 74% and the lowest relative humidity is 63%, in Spring. The average wind
speed is 2.7 m/s, which is mainly from the south-west. The highest speed wind is ~20 m/s in
March. The average sunshine time is 2,194 hours annually.
3.2.2.2. Geomorphology, Geology and Pedology Geomorphology
The general orientation of relief is EN-WS in Chenggong County. The eastern and the northern
areas are middle-mountain areas, which are transition or hilly land, and the western area is the
lakeside, forming a relief gradient from the north-east to south-west. Elevation ranges from 1,775
m-2,820 m in Chenggong County. There are three geomorphological units (Poncin, 2003) (Figure
3.10):
Lacustrine unit, which is the main agricultural area from 1,775 m-1,900 m elevation, next to
Dianchi Lake.
Transition unit, which is flat, but has some isolated hills with 1,900 m-2,300 m elevation. The
vegetation is fruit trees and vegetables.

GENERAL METHODOLOGY
56
Middle mountain unit, which is the main forestry and husbandry area with 2,300 m-2,820 m
elevation.
Geology
Strata of Chenggong County and the research area
The strata in Yunnan are developed completely. There are exposed strata from Proterozoic Era to
the Quaternary Period, except the Archaeozoic Era. The degrees of stratigraphic development
being different in each area, groups being complex and useful sedimentary minerals are
abundant (Yunnan Bureau of Geology and Mineral Resources, 1990).
There are many strata in Chenggong County from Palaeozoic to Cainozic era, and the distribution
of Palaeozoic era stratum is the most frequent in the east Liangwanshan Mountain area, including
limestone of Sinian, sandstone, shale and siltstones of Cambrianage, Devonian-Carboniferous
calcareous rock, Permian limestone and basalt (Figure 3.10). In hilly land area, the most important
stratum is Tertiary dark-grey argillaceous sandstones and conglomerate. In south-western Jian
Mountain and some isolated mountains, the main strata are Sinian limestone, Cambrian
sandstones, and Carboniferous-Permian limestone and basalt. There are Quaternary sands and
gravels, calcium clay, slime, and peat covering the Tertiary strata.
Geology of the research area
Strata of the research area include the Cambrian system (Є1C), Permian system (P1d, P1Y) and
Quaternary system (Q) (Figure 3.10). Between the lacustrine area and the transition area, there are
some isolated hills from the Cambrian system. The main constituent rocks are shale and quartz
sandstone mixed with some argillaceous siltstone.
The Permian system is located on the eastern mountain area named Bailongtan Mountain,
including P1d and P1Y units. The P1d unit is composed of quartz sandstone, argillites and siltstone
mixed with dolomite and limestone. The P1Y unit is carbonate stone and dolomite mixed with
limestone.

GENERAL METHODOLOGY
57
The Quaternary system (Q) is distributed in lacustrine and transition units. Lacustrine unit is Q4
(Holocene) including Q4l (lacustrine) and Qlal (alluvial lacustrine). The lithological composition is
yellow-gravel, clay, silt and coarse sand mixed with peat-mud, slime and turf. It is a typical
lacustrine deposit. Qlal (alluvial lacustrine) is composed of colourful gravel and clay-silt. The
upper layer belongs to lacustrine deposits and the lower layer belongs to alluvial deposits. The
transition unit has Q2 (Early Pleistocene), Q3 (Middle Pleistocene) and Q4 (Holocene). The
lithology is composed of sand and gravel with an 0.8 m layer of red soil.
Soil-forming parent materials
The soil types come from five groups of parent materials in the research area (Yunnan Bureau of
Geology and Mineral Resources, 1990):
Soils from lacustrine sediments distributed in lacustrine and transition units, correspond to
the main farming area. Lacustrine sediments are part of the Quaternary system. At the end of
the Tertiary and early Quaternary, the eastern land raised and the Dianchi Lake basin
subsided, resulting in the soil gradually de-swamping. Sediments are composed of clay, silt
and fine sand; their main distribution area is along the Dianchi lakeside.
Lacustrine sediments - alluvial mixed deposits are distributed in the transition area with
elevation from 1,887-1,900 m. They consist of clay, silt and fine sand, but the particle size is
a little larger than in the lacustrine materials. The texture is heavy loam and light clay.
Soils from diluvium deposits are the main upland soils with red or light red colours. They
can keep water and nutrients very well. Sometimes, small iron-manganese concretion
particles can be found in these soils. Diluvium deposits include gravel, sand and clay on hill
sides. It is the main area of fruits and vegetable production.
Soils from sandstone and shale weathering are distributed in the transition unit. The features
are less organic matter, abundant silt, high water permeability with acid reaction and
yellow-red or light yellow colour.
Soils from carbonate limestone and marlstone weathering can be found in the mountain unit.
They have clay texture, lower nutrient contents with acid reaction and red or red-brown
colour. Residual-slope deposits are distributed in this area, which accumulate on footslopes
after the weathering of parent materials.

GENERAL METHODOLOGY
58
Figure 3.10: Geological map of the research area, Chenggong County (Source: Department of Soil
and Land Resources of Yunnan Province, original scale: 1:50,000, 1991).
Pedology
Soil types
In Chenggong County, there are five soil groups, which are brown soil, red soil, purple soil,
alluvial soil and paddy soil (Yunnan Bureau of Geology and Mineral Resources, 1990).
Meanwhile, 10 subgroups and 18 soil genus are observed (Table 3.6). Red soil is the most familiar
soil group, with 25,174 ha, or 75.74% of the total soil area. The second one is paddy soil, with
5,210 ha (15.68% of the total soil area). Then purple soil, brown soil and alluvial soil are 2,157 ha
(6.49%), 358 ha (1.08%) and 337 ha (1.01%), respectively. In the research area, the soil groups are
mainly red soil, alluvial soil and paddy soil.
Lakes
Legend: Quaternary: lacustrine deposit;
slope deposit ; sand clay
Permian: dolomite + basalt
Permian: dolomite
Carboniferous: mud stone with calcic
podzol + sandy stone
Permian: dolomite + mudstone
Cambrian: shale with interbedded
sandstone
N

GENERAL METHODOLOGY
59
Table 3.6: Soil classification of Chenggong County
(Source: Yearbook of Chenggong County, 2004)
Soil order Soil great group Subgroup Area (ha)
Alfisol Brown soil Brown earth 358
Brown red soil 1,849 Ferralsol Red soil
Red earth 23,325
Alluvial soil with dark colour 241 Alluvial soil
Alluvial soil with light colour 96 Entisol
Purple soil Purple earth 2,157
Submergic paddy soil 1,402
Hydragric paddy soil 2,885
Gleyic paddy soil 580 Anthrosol Paddy soil
Swamp paddy soil 343
Lateral distribution of soil
Soil types change with elevation in Chenggong County. The paddy soil is distributed from
1,887-2,300 m. Red soil is distributed from 2,300-2,600 m elevation, the subgroup is the brown
red soil and red earth is the transition type from brown to red in the limestone mountain area.
Then brown soil is distributed in cold mountain areas between 2,600-2,800 m elevation (Figure
3.11).

GENERAL METHODOLOGY
60
1,775 m (Lake)
Figure 3.11: The lateral distribution of soil in Chenggong County
(Source: Kunming Soil Investigation Office, 1984).
3.2.2.3 Land use and problems
Description of land use
Out of the total land area in Chenggong County, mountain, transition and lacustrine areas are
49.5, 33.1 and 17.4%, respectively. The population was 158,085 in 2003 with 125,181 (79.19%)
in rural areas, whilst average cultivated land area was ~0.03 ha/person. The areas of food crops
were 1,706.67 ha and total yield in 2003 was 9,080 t, including wheat, broad beans, peas, sweet
potatoes, rice, corn and others (Table 3.7) (Yearbook of Chenggong County, 2004).
1,887m
1,900m
2,050m
2,300m
2,600m
2,800m
Paddy soil
Red soil
Brown soil Limestone brown earth
Basalt brown earth
Brown red soil and red earth
Submergic paddy soil Hydragric paddy soil Gleyic paddy soil Swamp paddy soil
Soil group Soil subgroup Elevation

GENERAL METHODOLOGY
61
Table 3.7: Areas of food crops in 2003 (Source: Yearbook of Chenggong County, 2004)
Crops Areas (ha) % of total areas Rice 200 11.8 Corn 667 39.1 Sweet potato 347 20.3 Pea 100 5.8 Broad bean 57 3.3 Wheat 69.7 4.1 Bean 66. 7 3.8 Other food crops 233.3 13.7
Four geographical areas are classified according to land use types in Chenggong County, which
are:
Food crop-vegetable area is in the lacustrine unit on paddy soil and alluvial soil. This unit is
located on the west of the Kunming-Luoyang Road, and near Dianchi Lake, at 1,887-1,900 m
elevation. The area is 7,700 ha or 17% of the total area. The multiple crop index and yield are
high, and irrigation is convenient. Presently, crops are vegetables and flowers.
Fruit-the food crop area is in the transition unit on red soil. This unit is located east of
Kunming-Luoyang Road, at 1,900-2,050 m elevation. The area is 15,400 ha or 34% of the total
area. The relief is flat and the slope 4-8o. Irrigation is difficult. The yield is lower than in the
lacustrine unit, and presently the main crops are wheat, corn, beans and vegetables.
Forest-food crop - husbandry is in the mountain unit on red soil and purple soil. The elevation
is 2,050-2,300 m. The temperature and yield are low. This unit is more suitable for forest than
for agriculture. The main crops are potatoes, corn, wheat and rape.
Forest-husbandry area is in the mountain unit on brown soil. The relief is high with abrupt
slopes at 2,300-2,820 m elevation, resulting in a cold climate. The main crops are potatoes, rape
and buckwheat.
With the development of agriculture, vegetables and flowers are planted in the main agricultural
production area, especially in the lacustrine unit. In 2003, the area of vegetables was 10,333 ha,
flowers 167 ha and fruit 5,533 ha (Table 3.8). Over 60 species of vegetables and flowers are

GENERAL METHODOLOGY
62
grown, the main vegetables being Chinese cabbage, salad, celery, chilli and sweat pea. The main
fruits are pear, apple and peach (Table 3.8).
Table 3.8: Areas of vegetables, flowers and fruits in 2003
(Source: Yearbook of Chenggong County, 2004)
Plants Areas (ha)
Economic income (× 109 Yuan RMB*) Main species Areas
(ha) Chinese cabbage 1,400
Salad 1,467 Celery 1,500 Chilli 627 Sweat Pea 640
Vegetables 10,333 2.87
Cauliflower 1,040 Rose 407 Carnation 345 Flowers 1,667 2.26 Lily 41 Pear 979 Apple 377 Fruits 5,533 0.23 Peach 503
*Yuan RMB: Chinese currency money unit (1€=10.09 Yuan, 1$=6.83 Yuan, August 2008).
Main land use problems
The main land use problems in Chenggong County are:
Areas of cultivated land are decreasing every year, due to city development and soil erosion.
Soil fertility and pH of some soils are low, resulting in low production levels.
Soil contamination is becoming increasingly serious, and soil quality is influenced by water
and air contamination.
Attention has been paid to soil contamination in Yunnan Province (Hua Z.Z. & Duan Q.Z., 2001).
The ranges of total TE contents in soil were 27.18-265.78 mg/kg for Pb, 0.30-1.25 mg/kg for Cd
and 13.89-171.68 mg/kg for Cu, in Dianchi Lake watershed (Vegetable Office of Chenggong
County, 2001) (Table 3.9). Cd contents in Dayu and Daying villages were higher than the
background value of Kunming Prefecture. In 1999, samples from three villages out of five
showed Zn and Cu contents above the background values of Kunming Prefecture.

GENERAL METHODOLOGY
63
Table 3.9: Total TE contents in soil of Chenggong County
(Source: Vegetable Office of Chenggong County, 2001)
Contents (mg/kg) Village Year
Pb Cd Cu Zn 1998 25.9 0.380 175 112
Dayu 1999 23.3 0.080 91.1 92.2 1998 28.5 0.076 45.5 76.8
Haiyan 1999 35.3 0.096 38 98.7 1998 29.8 0.267 155 99.5
Daying 1999 31.7 0.205 145 111
Maizi 1999 34.4 0.098 86.4 118 Wanxicong 1999 23.9 0.089 182 139 Background values in Kunming Prefecture
43.3 0.177 44.6 99.2
Considering the situation of vegetable production and soil TE contamination in Chenggong
County, it should be important to understand the sources of TE and assess the degree of TE
contamination in soils and vegetables, then to improve the quality and sustainable vegetable
production in Chenggong County.
3.3. PRESENTATION OF THE METHODOLOGY
In this study, information was collected through field survey and laboratory analysis, processed
and expressed using a Geographical Information System (GIS) and statistical analyses. A
geomorphopedological approach has been used, which links the soil characteristics of each map
unit with geology (rocks as soil parent material) and geomorphology (relief forms). Conceptual
models of information data structure are shown in Figure 3.12. The outline conceptual framework
of this study is shown in Table 3.10.

GENERAL METHODOLOGY
64
Figure 3.12: Conceptual model of information data structure.

GENERAL METHODOLOGY
65
Table 3.10: General description of framework
3.3.1. Existing documents
There are few accurate and recent soil documents in Chenggong County, including one set of
Topographical maps from 1976 (Figure 3.13), a Geological Map at 1:50,000 scale from 1991
(Figure 3.10), and Satellite Imagery from February 2004 (Figure 3.14).
Figure 3.13: Topographical Map (Source: Department of Survey and Map of Yunnan
Province, Original scale: 1:25,000, 1976).
Scale Tasks Regional approach
Analysis of 130 plots for overview of soil contaminated by TE (56 km2)
Horizontal distribution Detailed
approach
Variability analysis of intra-unit and intra-plot/greenhouse to address the problems of soil with TE variation (0.5-1 km2 and 5 × 5 greenhouses)
Top/subsoil Detailed analysis in 32 pairs of plots (extracted from 130 plots) to assess contamination and natural background values
Field surveys
Vertical distribution
Profile Analysis of 5 profiles for soil characteristics at vertical scale
Pot Choice of soils from the three units for pot experiments in order to decrease TE contents in Chinese cabbage
Experiments Field
Choice of plots/greenhouse from the three units for field experiments in order to decrease TE contents in Chinese cabbage
Mountain
unit
Transition unitLacustrine
unit

GENERAL METHODOLOGY
66
Figure 3.14: Satellite Imagery (Source: Department of Survey and Map of Yunnan Province,
Original scale: 1:50,000, 2004).
3.3.2. Field survey
A series of field surveys were conducted to collect geological, geomorphological and pedological
information in 2004-2006 (Plate 3.1). To match and synthesize the information from different
documents, these documents had to be placed into the same co-ordinate system. In surveys, the
positions were determined with a portable GPS (Global Positioning System) (Magellan, US) (10
m accuracy); the co-ordinates of some points (e.g. main paths, roads) were taken in Chenggong
County to georeference the topographical and geological maps.
Plate 3.1: Field survey in Chenggong County.

GENERAL METHODOLOGY
67
Geological survey: lithology and geomorphology
On the basis of the Geological Map of Chenggong County (Figure 3.10), a lithological survey was
carried out in 2004 by Professor Daniel Lacroix and Dr Gilles Colinet from Gembloux
Agricultural University. The main lithological formation were identified and some rock samples
taken for further observation. Based on the original topographical map (Figure 3.13) and aerial
photos examined under the stereoscope, the field check was conducted. Altitude was recorded at
additional positions using a portable GPS.
Pedological survey
The scope, intensity and scale of the pedological survey were decided based on data required and
the purposes of the evaluation. The aims of the survey are to define land qualities in terms of TE
(Pb, Cd, Cu and Zn) and effect factors. In this study, soil surveys were carried out through
horizontal (regional and detailed) and vertical approaches.
A. Augering along toposequences
Hand augering down to 80-120 cm where possible, was conducted along 17 toposequences in
2004-2006 (Figure 4.1, Plate 3.2). Six toposequences along Dianchi Lake are expressed as
Toposequences 1-6. Nine toposequences in transition unit are expressed as Toposequences 7-15.
Both toposequences 16 and 17 illustrate the mountain unit. Field observations for soil volumes
included texture by hand analysis, colour (Munsell charts), stoniness and pH with a test kit. Soil
samples of 130 topsoil and 32 pairs top/subsoil samples were collected for laboratory analysis.
Chemical properties (pH, physical clay, SOC, Total-N, CEC) and TE contents (Pb, Cd, Cu, Zn)
were analysed at Gembloux Agricultural University (GAU) and Yunnan Agricultural University
(YAU).

GENERAL METHODOLOGY
68
Plate 3.2: Augering in the field.
B. Detailed observations
In order to better assess the effects of agricultural practises at detailed scales, two sites for detailed
investigation were selected, the representatively of which was assessed by augerings (Figure 4.1,
Figure 3.15, Figure 3.16). One site was selected in the lacustrine unit and the other in the
transition unit. As the land is covered by greenhouses, the size of these greenhouses was taken
into account to decide the sampling locations.
The analysis of variability was organized in two steps:
Step 1: variability within 1 km2. Survey area (1 km²) in the lacustrine unit is chosen between
four villages (Jianwei, Gucheng, Kele, Shibei) (Figure 4.1).Variability at this detailed scale was
analysed by a composite sampling, with 100 points in a 1000 × 1000 m surface along a grid of
100 × 100 m fitted to the size of the greenhouses (according to their size, 3 greenhouses × 20-22
greenhouses) in the lacustrine unit. Samples were collected in the greenhouse in the 100 grids
(Figure 3.15). For the transition unit, the number of samples (7 × 7 = 49) and the area (700 × 700
m, 0.49 km²) were chosen according to the relief between two villages (Yuhua, Xiazhuan) (Figure
3.16, Figure 4.1).
Step 2: variability within one grid. Analysis of the variability within 1 greenhouse and among
five greenhouses close together, from which 25 samples were collected by 5 samples in each
greenhouse. The results are available for both places.

GENERAL METHODOLOGY
69
Figure 3.15: The location of soil samples of the detailed approach in the lacustrine unit.
Figure 3.16: The location of soil samples of the detailed approach in the transition unit.
C. 32 pairs of top/subsoil sample observation
Topsoil and subsoil pairs consist of the first horizon of the soil and the horizon ranging between
60-80 cm. When the horizon at this depth is too different from the surface horizon, samples from
the same parental material were taken. Some 32 pairs of top/subsoil samples were analysed in
order to evaluate vertical differences in soil characteristics, TE contents, natural background
values and the origin of contamination. The topsoil of the primary 32 top/subsoil pair samples is
included in the 130 topsoil samples.

GENERAL METHODOLOGY
70
D. Soil profile description
Based on the results of augering descriptions and field observations, five main soil types were
selected and soil profiles were described in detail, including two profiles (P1, P2) in the lacustrine
unit and three (P3, P4, P5) in the transition unit (Figure 4.1).
3.4. METHODS
Soil sampling
On the basis of the soil identification and methodology described in Section 3.3, the soil sampling
strategy is summarized in Table 3.11. Soil augering and soil profile samples were collected from
different horizons. Topsoil samples for regional approach were collected from 0-15 cm depth,
which is an elementary sample. Topsoil samples for the detailed approaches were also collected
from 0-15 cm depth, composite topsoil samples; each of them being composed of nine
sub-samples taken at random from a 10 × 10 m area in the centre of plot and two samples from
two opposite sides of the plot. Top/subsoil pair samples were collected from 0-15 cm and 60-80
cm. One kg samples taken from these collective sites were air-dried.
Table 3.11: Summary of soil sampling strategy
Soil sampling Depth (cm) Sampling Method Numbers Analysis
Laboratory
Regional topsoil 0 - 15 Elementary sample 130 GAU, YAU
Subsoil 60 - 80 Elementary sample 32 GAU,YAU
Profile 0 - 80 (- 185) Elementary sample 5 GAU, YAU
Detailed approach 0 - 15 Composite sample 149 (100+49) YAU
Greenhouse topsoil 0 - 15 Composite sample 50 (25 + 25) YAU

GENERAL METHODOLOGY
71
Soil preparation
Gembloux Agricultural University
Air-dried samples were gently broken up in a porcelain mortar and passed through a 2.0 mm sieve
for soil property and available TE content analysis. A sub-sample was then crushed to 0.25 mm in
the same mortar for carbon content and total TE content analyses.
Yunnan Agricultural University
The method was the same as GAU, except for size fraction <1.0 mm used in Chinese methods
instead of <2.0 mm.
Laboratory soil analysis methods
Laboratory work was jointly carried out at Gembloux Agricultural University (GAU) and Yunnan
Agricultural University (YAU). Therefore sub-samples were transported to these two laboratories.
Soil pH, soil organic carbon (SOC), total nitrogen (T-N), CEC, physical clay (<0.01 mm), total TE
contents (Pb, Cd, Cu, Zn), sequential extraction fraction (SEF) TE contents (Pb, Cd, Cu, Zn) and
available TE contents (Pb, Cd, Cu, Zn) were analysed (Table 3.12). The analysis procedures are
described in details in Annex 3.1.

GENERAL METHODOLOGY
72
Table 3.12: Summary of soil analysis methods
Analysis procedures Parameter
GAU YAU Numbers of
analysed samples
pH water
2/5 soil suspension (2 mm)(a)
Extraction: water (2 h shaking)
Centrifugation (10 min)
Measurement: pH potentiometer
2/5 soil suspension (1 mm)
Extraction: water (10 min)
Measurement: Whatman pH meter
130
(regional topsoil)
CEC
Metson method (2 mm)
Saturation: NH4OAC 1N pH 7 (2 h shaking)
Centrifugation (10 min)
Supernatant: NaOH replace NH4+
Measurement: titrate with HCI
BaCI2 method (1 mm)
Saturation: BaCl2 1 N pH 7 (2 h
shaking)
Centrifugation (20 min)
Supernatant: H2SO4 replace Cl-
Measurement: titrate with NaOH
88
(regional topsoil)
SOC
Springer - Klee method (0.25 mm)
Oxidant: K2Cr2O7 + H2SO4
Measurement: titrate the excess of oxidant
with Mohr’s salt
Walkley - Black method (0.25 mm)
Oxidant: K2Cr2O7 + H2SO4
Measurement: titrate the excess of
oxidant with Fe2SO4
130
(regional topsoil)
Physical clay
<0.01 mm physical clay
<0.001 mm clay
Pre-treatment: Na OH 0.5 M (15 min)
(1 mm)
Measurement: hydrometer
88
(regional topsoil)
T-N
Macro - Kjeldahl method (0.25 mm)
Mineralization: Na2SO4.Se + H2SO4
Distillation: alkaline condition and trapped
with H3BO3
Measurement: titrate (NH4)3BO3 with HCI
130
(regional topsoil)
Total TE content
Aqua regia method (0.25 mm)
Extraction: Aqua regia
Measurement: AAS*
Aqua regia - HCIO4 method (0.25 mm)
Extraction: Aqua regia - HCIO4
Measurement: AAS
130 + 32
(All soil samples)
SEF**TE content
Tessier method (1 mm)
Extraction; acetic acid + hydroxyl
ammonium chloride + hydrogen
peroxide-ammonium acetate
Measurement: AAS
21
(Chinese cabbage
soil)
Available TE
EDTA method (2 mm)
Extraction: EDTA (0.02 N) + NH4OAc
(Ammonium acetate 0.5 N), 1 h shaking
Measurement: AAS
21
(Chinese cabbage
soil)
AAS*: Atomic Absorption Spectrophotometer; SEF**: sequential extraction fraction

GENERAL METHODOLOGY
73
Plant sampling and laboratory analysis methods
These methods are described in Section 5.3.
Pot and field Experiments
Designs of pot and field Experiments are described in Section 6.3.
3.5. DISCUSSION AND CONCLUSIONS
Chenggong County is one of most important vegetable and flower production areas in Yunnan
Province. Geomorphological units, soil types and land use history in the research area influence
the soil sampling strategies.
First, soil toposequences and the regional approach of soil sampling are based on the relief in the
research area, subdivided into mountain, transition and lacustrine units, as identified by
topographic maps and augering observation. This sampling strategy of the regional approach was
taken in 2004 and 2006. Because of the development of Kunming City, some fields located in
mountain and transition units being under construction in 2005, some sampling sites moved to
lacustrine and transition units which still remained under vegetable production in 2006. With the
further development of Kunming City, more attention should be paid to those fields due to the
more intensive vegetable production and potential threats from municipal wastes.
Then, in order to understand the source of TE, it is necessary to trace the charge of background
values in subsoil and profiles of different soil types. Two aspects should be considered, including
the site of pair sampling and the depth of subsoil sampling. The sites of pairs and profiles were
decided according to the augering observations, soil types, the geomorphological units and the
new city location.
The depth of subsoil sampling was different in lacustrine and transition units due to the
underground water level and soil formation process. In the lacustrine unit, the underground water
level is <1 m, and the closer to Dianchi Lake, the higher the level. The subsoil sampling was the

GENERAL METHODOLOGY
74
layer just above the underground water level, to avoid the effect of water on TE transformation.
But it may be not enough to reflect the background value. In the transition unit, soils were deeper
and the samples were mainly taken at 60-80 cm depth, without necessarily reaching the parent
material. This strategy should be difficult for estimating the effect of the background values on
TE contents, although it still could be used for understanding the potential effects of background
values and transportation behaviour.
For the detailed approach, two sites are chosen in lacustrine and transition units, which
correspond to the new city development and the new distribution of vegetable production. In the
lacustrine unit, the detailed approach site concerns four villages close to the Chenggong town,
making the typical representative for anthropogenic effects. The situation existed in the transition
unit which is between two villages close to the mountain, making the representative for
anthropogenic and diluvium deposit effects.


75
IV: NATURAL TRACE ELEMENT CONTENTS AND
ANTHROPOGENIC CONTAMINATION OF SOILS
4.1. INTRODUCTION...............................................................................................76 4.2. MATERIALS AND METHODS .......................................................................76
4.2.1. Summary methods .....................................................................................76 4.2.2. Comparative analysis of data from Gembloux Agricultural University and Yunnan Agricultural University ..........................................................................77
4.3. RESULTS ............................................................................................................78 4.3.1. Soil survey and soil identification..............................................................78
4.3.1.1. Topsoil augering description...........................................................78 4.3.1.2. Pedogeochemical background and soil profile description ............83 4.3.1.3. Description of soil chemical properties ..........................................85
4.3.2. Horizontal distribution of total trace elements...........................................89 4.3.2.1. Regional approach ..........................................................................89 4.3.2.2. Relationships between trace element contents and pH, SOC, CEC90 4.3.2.3. Total trace element contents versus geomorphology......................91 4.3.2.4. Detailed approach ...........................................................................97
4.3.3. Vertical distribution of total trace elements.............................................102 4.3.3.1. Trace element contents in subsoil .................................................102 4.3.3.2. Relationships between total trace element contents in subsoil and soil morphological properties ....................................................................103 4.3.3.3. Relationships between total trace element contents in topsoil and subsoil ........................................................................................................107
4.4. DISCUSSION ....................................................................................................111 4.4.1. Soil identification in the three units .........................................................111 4.4.2. Horizontal distribution of trace elements and anthropogenic effects ......112 4.4.3. Trace element vertical distribution and estimation of natural and contaminated values...........................................................................................114
4.5. CONCLUSIONS ...............................................................................................116


NATURAL TE CONTENTS AND ANTHROPOGENIC CONTAMINATION OF SOILS
76
4.1. INTRODUCTION
Trace elements (TE) have become one of the major environmental hazards, which are not
chemically or biologically degraded (Adriano, 2001). Definitions and sources of TE have been
described in Section 2.3, including factors influencing TE mobility.
This chapter assesses natural TE contents and anthropogenic contamination in soil. TE in subsoil
are investigated to assess pedological background values, and TE in topsoil to trace anthropogenic
effects. Influencing factors of TE variability are also included in this section.
4.2. MATERIALS AND METHODS
4.2.1. Summary methods
Based on geomorphological investigations, the soil sampling strategy involved 130 topsoil
samples distributed along 17 toposequences, 199 topsoil samples from two systematic detailed
surveys and two greenhouse-scale samplings, 32 top/subsoil pairs and 5 profiles (Table 4.1a).
Laboratory parameters included total TE contents and soil properties (pH, clay content, SOC, T-N
and CEC), according to GAU or YAU procedures (Section 3.3, Annex 3.1, Table 4.1b).
Table 4.1: Soil sampling strategy
Table 4.1a: Soil sampling numbers
Soil sampling strategy Sampling Numbers Total numbers 17 toposequences
Regional approach Topsoil samples (elementary) General observation
130
L*=100 Detailed approach Grid topsoil samples (composite)
T**=49 149
L=25 Greenhouses Topsoil samples (elementary)
T=25 50
Topsoil: 32 Top/subsoil pairs Top/subsoil samples (elementary)
Subsoil: 32 64
*Lacustrine unit; ** Transition unit.

NATURAL TE CONTENTS AND ANTHROPOGENIC CONTAMINATION OF SOILS
77
Table 4.1b: Numbers of soil samples analysed in GAU and YAU
Soil sampling strategy Parameter GAU YAU Total contents of Pb, Cu and Zn 88 42* Total contents of Cd 0 130 pH, SOC, T-N 88 42* Physical clay contents 0 88
Regional approach
CEC 0 88 Detailed approach Total contents of TE 0 149 Greenhouses Total contents of TE 0 50 Top/subsoil pairs Total contents of TE 64
*Data not used for analysis in this thesis.
The data were analysed with descriptive statistics (Excel 2003). T-tests were carried out (P<0.05
or P<0.01 level) using SPSS and DPS v6.55. The regression analysis and principal component
analysis (PCA) are used for models of TE contents with variable soil and other factors by SPSS
and XLSTAT at P <0.05 or P <0.01 level. Boxplots of data distribution were analysed with
STATISTICA 6.0. Geostatistical analysis of point information and mapping were performed with
Surfer 8 (Golden software surfer academic version 8.0) and Geo-ATATer. In case of absence of
spatial continuity, interpolation was realized according to Shepard's method of inverse power
distance.
4.2.2. Comparative analysis of data from Gembloux Agricultural
University and Yunnan Agricultural University
In order to check if these two data sets can be merged, 48 topsoil samples analysed in both
laboratories were chosen to compare mean pH, SOC and total TE results (Table 4.2).
Table 4.2: Data (mean ± SD) based on methods in laboratories of GAU and YAU
Parameter GAU YAU pH 5.8 ± 0. 9 6.1 ± 0.9 * SOC (%) 2.12 ± 0.76 2.48 ± 0.89* Pb (mg/kg) 48.66 ± 9.54 43.89 ± 8.27 ** Cd (mg/kg) 0.10 ± 0.18 0.64 ± 0.12** Cu (mg/kg) 133.21 ± 60.44 107.44 ± 44.65 * Zn (mg/kg) 122.11 ± 36.78 117.77 ± 25.41
* and ** mean significant difference with P<0.05 and P<0.01 with T-tests, n=48.

NATURAL TE CONTENTS AND ANTHROPOGENIC CONTAMINATION OF SOILS
78
It appears that means are significantly different for pH, SOC, Pb, Cd and Cu contents between the
two data sets with T-tests analysis. A part of explanation could be the different definition about
fine-earth size between GAU and YAU. Although the difference in percentage between particle
size of 2 and 1 mm is <5% (Annex 4.1), on the basis of lower standard deviation (SD), we have
decided to select 88 sample data sets (pH, SOC, Pb, Cu and Zn contents) only from GAU.
Nevertheless, as GAU, Cd results are often below the detection limit, we have also selected a 130
sample data set of Cd from YAU.
4.3. RESULTS
4.3.1. Soil survey and soil identification
4.3.1.1. Topsoil augering description
In the research area, three geomorphical units: lacustrine unit, transition unit and mountain unit,
have been identified and characterized by soil augering observations along 17 toposequences
(Figures 4.1, 4.2-see the end of IV).
A. Lacustrine unit
The six toposequences (1-6) of the lacustrine unit are presented in Figure 4.1. They are located
near Dianchi Lake where soils are developed from lacustrine and alluvium deposits, according to
parent materials belonging to Q4l (lacustrine with yellow-gravel, clay, silt and coarse sand mixed
with peat-mud, slime and turf) and Qlal (alluvial lacustrine-colourful gravel and clay-silt).
The augerings and general observations are shown in Annex 4.2. Five toposequences (1-5) parallel
to each other are laid down from the border of the transition unit across the lacustrine deposits,
and to Dianchi Lake. Samples No. 18 and 19 of toposequence 1, sample No. 29 of toposequence 2
and samples No. 21 and 22 of toposequence 3 were taken near Dianchi Lake. The depth to
groundwater was only 30-60 cm. The texture of toposequences 1-5 was sandy clay, loam or loamy
clay, according to observations. The soil colour was brown or dark red. Stoniness was <15%,
while lithology of the stones was sandstone.

NATURAL TE CONTENTS AND ANTHROPOGENIC CONTAMINATION OF SOILS
79
Samples in lacustrine unit: Topo.1: 16, 17, 18, 19; Topo.2: 29, 31, 32; Topo.3: 20, 21, 22; Topo.4: 28, 40, 42;
Topo.5: 39, 41, 43; Topo.6: 23, 24, 25, 26, 27;
Samples in transition unit: Topo.7: 82, 83, 84, 85; Topo.8: 86, 87, 88; Topo.9: 79, 80, 81; Topo.10: 74, 75, 76, 77,
78; Topo.11: 100, 101, 102, 103; Topo.12: 109, 110, 113; Topo.13: 89, 90, 104, 105;
Topo.14: 106, 107, 108, 114; Topo.15: 127, 128, 129;
Samples in mountain unit border: Topo.16: 122, 123, 124, 125, 126; Topo.17: 118, 119, 120, 121;
Figure 4.1: The location of pedological observations in Chenggong County.
P1 P2 P3 P4
Detailed approach site in lacustrine unit Detailed approach site in transition
P5 Profiles:

NATURAL TE CONTENTS AND ANTHROPOGENIC CONTAMINATION OF SOILS
80
Toposequence 6 was orientated from northeast to southwest across a hill with sample No. 25, and
No. 27 on the foot-slope. Main rocks of the isolated hill were shale and quartz-rich sandstone
mixed with some argillaceous siltstone (Figure 4.3). The soil colour is brown; the stoniness is
<15% with some sandstone fragments.
Figure 4.3: Relief of toposequence 6.
The particle size distribution (PSD) of topsoil in lacustrine unit is shown in Table 4.3. The texture
was loam more often according to measurements, even if the clay fraction ranged between
23.4-44.3%, and the sand fraction was >30%.

NATURAL TE CONTENTS AND ANTHROPOGENIC CONTAMINATION OF SOILS
81
Table 4.3: Particle size distribution of topsoil and texture according FAO (2006)
Percentages of particle (%) Unit Sample No. Clay
(<0.002mm) Silt (0.002-0.05mm)
Sand (0.05-2mm)
FAO texture
17 44.3 24.4 31.3 Clay 18 26.3 14.5 59.2 Sandy clay loam Lacustrine 22 23.4 36.3 40.3 Loam 75 71.6 22.6 5.8 Heavy clay 76 76.0 8.1 15.9 Heavy clay 77 51.6 32.7 15.7 Clay 79 52.8 23.4 23.8 Clay 84 57.7 23.3 19.0 Clay
Transition
85 42.4 22.5 35.1 Clay 122 76.7 17.0 6.3 Heavy clay 123 68.7 17.8 13.5 Heavy clay Mountain 125 81.0 6.7 12.3 Heavy clay
B. Transition Unit
The nine toposequences (7-15) have been surveyed according to the relief in the transition unit
(Figure 4.1). This unit makes the transition between the lacustrine unit and the mountain unit.
Augerings and general observations of toposequences 7-15 are shown in Annex 4.2. Soils are
formed on diluvium deposits. The parent materials in toposequences 7 and 9 belong to Q2, in
toposequence 10 to Q3. The Holocene Q4, which characterizes toposequences 8 and 10, is
composed of sands and gravels.
Toposequences 7 and 8 and toposequences 9 and 10 were, respectively, located on the northern
and the southern side of the main road (Chenggong-Yiliang) (Figure 4.1). Soil sample No. 88 of
toposequence 8 was characterized by an abundance of redox features. Samples usually presented a
loamy clay texture. For example, the texture of samples No. 74, No. 77, No. 78 of toposequence
10 was loamy clay, of sample No. 76 sandy clay texture, and of sample No. 75 clay texture
according to observation (Figure 4.4). The soil colour was brown or dark red. Stoniness was <15%
and the lithology of stones was sandstone.

NATURAL TE CONTENTS AND ANTHROPOGENIC CONTAMINATION OF SOILS
82
Figure 4.4: Relief of toposequence 10.
The soil texture in toposequences 11-15 is loam and clay according to observations. The soil
colour was usually brown. The PSD of soils is shown in Tables 4.3. The soils present high
amounts of clay. According to measurements and the FAO classification, all soils belong to clay
or heavy clay textural classes.
C. Mountain unit
The two toposequences (16 and 17) in the mountain unit are described (Figure 4.1). Toposequence
16 was chosen to represent soils developing from limestone and marlstone, and toposequence 17
for soils from diluvium deposits. The rocks about toposequence 16 belong to the Permian system,
(P1d) unit composed of quartz-rich sandstone, clayite, siltstone mixed with dolomite and
limestone, and P1Y unit of carbonate stones and dolomite mixed with limestone. Rocks in
toposequence 17 belong to Early Pleistocene (Q2) or Middle Pleistocene (Q3). This unit was
composed of diluvium (gravel, coarse sand, silt and clay) and diluvium-alluvium deposits
(gravelly loam, clay-silt and some roots of plants).
Toposequence 16 was located between the Bailongtan Mountain (2075 m above sea leave (asl))
and an isolated hill (1961 m asl) (Figure 4.5). The augering observations of toposequence 16 are
shown in Annex 4.2. The colour of the five soil samples was dark reddish brown except, sample

NATURAL TE CONTENTS AND ANTHROPOGENIC CONTAMINATION OF SOILS
83
No.122 with bright reddish brown. All samples present clay texture according to observation and
<15% of stones (except sample No. 126).
Figure 4.5: Relief of toposequence 16.
Toposequence 17 is located between Xiaojianshan Mountain (2049 m asl) and another isolated hill
(1996 m asl), and the auguering features are shown in Annex 4.2. The colour of four samples was
reddish brown, except sample No. 121 with dark red. No. 120 and No. 121 present sandy clay
texture, while No. 119 was loamy clay and No.118 was clay texture according to observations.
Table 4.3 shows PSD in mountain unit. The clay fraction is often the most important. The clay
content in toposequence 16 was higher than in toposequence 17. The texture of toposequence 16
was heavy clay, according to measurements and the FAO classification.
4.3.1.2. Pedogeochemical background and soil profile description
Some 32 pairs of top/subsoil samples have been chosen for comparison as follows: 8 pairs in the
lacustrine unit, 21 pairs in the transition unit and 3 pairs in the mountain unit (Annex 4.1, Table
4.4).
In the lacustrine unit, texture of samples No. 22 and 29 varied from loam in topsoil to sand in
subsoil, because of the proximity of Dianchi Lake. Texture of other samples varies from loam or
sandy clay in topsoil to clay in subsoil, except for samples No. 17 and 18 being sandy clay in both
horizons. Subsoil Texture is clay and sandy clay more often according to observations. The colour
of subsoil is usually brown and darker than in topsoil.

NATURAL TE CONTENTS AND ANTHROPOGENIC CONTAMINATION OF SOILS
84
In the transition unit, texture varied from loam or loamy clay mainly in topsoil to clay in subsoil,
except for toposequence 10, in which texture of sample No. 75 (foot of hill) and No. 76 (hilltop)
varies from clay and sand clay to loamy clay according to observations. The colour changed from
brown in topsoil to reddish brown, or remains brown in the subsoil. However, colour of samples
No. 77, 85, 89 and 105 on slope was similar both in topsoil and subsoil. The texture in mountain
unit is mainly clay on top and subsoil according to observations. The colour was reddish brown in
both horizons.
Table 4.4: Basic information for 32 pairs of top/subsoil samples in the research area
Colour (Munsell chart) Texture Colour
(Munsell chart) Texture Unit No.
Topsoil Subsoil Topsoil Subsoil Unit No.
Topsoil Subsoil Topsoil Subsoil
17 10YR3/3 10YR3/2 Sandy clay Sandy clay 90 7.5YR4/4 7.5YR3/2 Clay Clay 18 5YR4/4 5YR3/1 Sandy clay Sandy clay 100 5YR4/4 2.5YR4/4 Loam Clay 20 10YR4/3 10YR5/4 Loamy clay Clay 101 7.5YR4/4 7.5YR4/4 Loam Clay 22 7.5YR3/4 10YR4/6 Sandy clay Clay 102 10YR4/3 2.5YR4/2 Clay Clay 23 10YR4/4 10YR4/1 Loamy clay Clay 105 5YR5/6 5YR5/6 Clay Clay 29 5YR3/6 5YR4/4 Loam Sandy Silt 109 5YR4/8 2.5YR3/6 Loam/clay Clay 45 7.5YR5/4 10YR4/4 Loam Clay 110 7.5YR4/4 5YR4/4 Loam Clay
Lacu
strin
e
46 5YR4/4 10YR3/3 Loam Sandy 113 7.5YR5/6 5YR3/6 Loam Clayish loam75 10YR3/4 5YR3/4 Clay Loamy clay 115 7.5YR4/4 5YR4/6 Loam Clay 76 5YR4/8 2.5YR3/6 Sandy clay Loamy clay 127 7.5YR4/4 7.5YR3/4 Loam Clayish loam77 10YR4/4 10YR4/4 Loamy clay Clay 128 7.5YR4/4 10YR4/4 Loamy clay Loamy clay 79 5YR3/6 7.5YR4/6 Loamy clay Clay 129 2.5YR4/4 5YR4/4 Clay Clay 81 10YR4/4 5YR4/4 Loamy clay Loamy clay
Tran
sitio
n
130 5YR4/6 5YR3/4 Loamy clay Clay 84 5YR3/6 2.5YR3/6 Loamy clay Clay 122 2.5YR4/6 2.5YR7/2 Clay Sandy clay 85 10YR4/4 10YR5/4 Loamy clay Sandy clay 123 2.5YR3/6 2.5YR3/6 Clay Clay
Tran
sitio
n
89 5YR3/4 5YR3/4 Clay Clay Mou
nta
in
125 2.5YR3/6 2.5YR3/6 Clay Clay
Five profiles have been described, P1 and P2 in the lacustrine unit, while P3, P4 and P5 in the
transition unit (Figure 4.1, Table 4.5). Soil texture in P1, P3 and P4 was clay in all profile horizons.
Texture in P2 varied from clay to clay loam and sandy clay, showing high clay content in horizon
1-17 cm and high sand content in <66 cm horizon, suggesting three different soil parent materials.
Texture of soils in P5 was clay, except for the 117-126 cm horizon, with 0.3% clay content and
84.5% silt content.

NATURAL TE CONTENTS AND ANTHROPOGENIC CONTAMINATION OF SOILS
85
The soil colour in P1 and P2 was brown and darker, while soil colour in P3 and P4 was brown and
varies, becoming brighter with increased depth. Soil colour in P5 is brown more often, except for
horizon 117-126 cm (brown).
Table 4.5: Basic information for the five profiles in Chenggong County
Profile Latitude Longitude Altitude (m) Horizon (cm) Soil colour
(Munsell charts) Percentages of clay, silt and sand (%)
0 - 15 (30) 7.5YR5/4 51.9 28.8 19.3 15 (30) - 40 7.5YR4/4 52.4 27.5 20.1 P1 24º52’54’’ 102º47’30’’ 1888 40 - 80 10YR4/4 54 28.2 17.8 0 - 8 (17) 5YR4/4 54.9 25.8 19.3 8 (18) - 33 5YR4/4 33 - 43 (46) 5YR4/6 17.8 55.8 26.4 43 (46) -53 (66) 7.5YR5/6 53 (66) -80 (87) 7.5YR4/6 18.8 16.3 64.9
P2 24º52’10’’ 102º46’49’’ 1887
80 (87) - 120 10YR3/3 22.5 19.8 57.7 0 - 16 (23) 7.5YR4/4 56.4 33.8 9.8 16 (23) -33 (44) 7.5YR4/4 33 (44) -60 (67) 5YR4/4 53.5 37.8 8.7
P3 24º50’06’’ 102º49’14’’ 1923
60 (67) - 100 5YR4/6 49 40.4 10.6 0 - 20 (23) 7.5YR4/4 55.8 29 15.2 20 (23) -35 (40) 7.5YR4/4 57.5 34.8 7.7 35 (40) - 64 (74) 5YR4/4 51.6 36.2 12.2 P4 24º51’46’’ 102º51’34’’ 1944
64 (74) - 83 (95) 5YR3/6 76 18 6 0 - 12 (14) 5YR5/6 52.7 27.7 19.6 12 (14) -105 (117) 2.5YR4/6 45.5 27.7 26.9 105 (117) -113 (126) 7.5YR3/4 0.3 84.3 15.4
P5 24º51’21’’ 102º49’20’’ 1925
113 (126) -167 (185) 5YR3/2 56.8 32.1 11.2
4.3.1.3. Description of soil chemical properties
Soil pH
According to the results of topsoil investigation in 2004 and 2006, pH ranged from 4.1-7.8 and the
mean pH is 6.2 (Figure 4.2). The pH of 62.5% of samples is <6.5 (Figure 4.6, Annex 4.2).
Comparing the geomorphical units, the mean value (6.8) in the lacustrine unit is higher than in the
other two units. The mean pH in the transition and mountain units is 5.8 and 6.3, respectively
(Figure 4.6).

NATURAL TE CONTENTS AND ANTHROPOGENIC CONTAMINATION OF SOILS
86
Figure 4.6: pH distributions of topsoil samples in the research area and the three units
(L: lacustrine unit; T: Transition unit; M: Mountain unit).
Considering the relief, pH of samples No. 26 and 27 of toposequence 6, located on the western
side of a hill close to Dianchi Lake, was higher than that of the other three samples located on the
eastern side of this hill (Figure 4.7). The pH of samples increased from top (sample No. 76 and 78)
to foot (sample No. 74) of the hill along the slope in toposequence 10, and was less different in
toposequence 16.
pH and SOC in toposequence 6(lacustrine unit)
0
2
4
6
8
26 27 25 24 23Sample No.
pH v
alue
and
SO
Cco
nten
t (%
)
pHSOC
pH and SOC in toposequence 10(transition unit)
0
2
4
6
8
78 74 75 77 76Sample No.
pH v
alue
and
SOC
con
tent
(%) pH
SOC
pH and SOC in toposequence 16(mountain unit)
0
2
4
6
8
125 126 124 123 122Sample No.
pH v
alue
and
SO
Cco
nten
t (%
)
pHSOC
Figure 4.7: pH and SOC contents in three toposequences in the three units.

NATURAL TE CONTENTS AND ANTHROPOGENIC CONTAMINATION OF SOILS
87
Physical clay
Mean physical clay (<0.01mm) was 52%, ranging from 20-84% (Annex 4.2). Physical clay of
52% of samples ranged between 40-60%. The mean physical clay is 45, 56, 58% in the lacustrine,
transition and mountain units, respectively (Figure 4.8). Comparing the geomorphological units,
the mountain unit shows high physical clay contents.
Figure 4.8: Physical clay contents of topsoil samples in the research area and the three units.
SOC and C/N
SOC contents ranged from 0.5-3.7% with a mean 1.5% in topsoil (Figure 4.2, Annex 4.2). SOC
contents of 59.1% of samples are between 1-2, and 2.3% >3.0 (Figure 4.9). In the lacustrine unit,
mean SOC content was 1.8% with a range between 0.5-3.2%, which is higher than in the transition
unit (mean 1.4%), and in the mountain unit (mean 1.3%) (Figure 4.7). SOC contents of samples in
toposequences 10 and 16 increase from the top to the foot of the hill, except for No. 125 (Figure
4.7).

NATURAL TE CONTENTS AND ANTHROPOGENIC CONTAMINATION OF SOILS
88
Figure 4.9: SOC contents of topsoil samples in the research area and the three units.
The mean total nitrogen content was 1.6 g/kg in the lacustrine unit, which is higher than in the
transition and the mountain units, with consistency to SOC content. The mean C/N ratio was ~10
in the lacustrine and the transition units, while it was 13 in the mountain unit, which suggests a
difference in organic matter quality and evolution (Figure 4.2, Annex 4.2).
Cation exchange capacity (CEC)
Soils have a mean CEC of 24.1 cmol/kg, ranging from 8.6-88.5 cmol/kg (Figure 4.2, Annex 4.2).
CEC of 54.7% of samples ranged between 10-25 cmol/kg (Figure 4.10). Mean CEC is 29.1, 20.6
and 28.3 cmol/kg in the lacustrine, transition and mountain units, respectively (Figure 4.10).
Comparing geomorphological units, the lacustrine unit shows high CEC. The high CEC may be
related to higher SOC in the lacustrine unit and higher physical clay content in the mountain unit.
Figure 4.10: CEC of topsoil samples in the research area and the three units.

NATURAL TE CONTENTS AND ANTHROPOGENIC CONTAMINATION OF SOILS
89
To summarize, due to different soil parent materials and intensity of agricultural production, the
chemical characteristics of soils are variable. In the lacustrine unit, pH, SOC and CEC are higher,
while SOC content is the lowest in the mountain unit.
4.3.2. Horizontal distribution of total trace elements
4.3.2.1. Regional approach
Topsoil samples in the lacustrine, transition and mountain units were chosen to assess the regional
horizontal distribution of TE. The results summarized by geomorphological units are presented in
Annex 4.2, Annex 4.3, Figure 4.2 and Figure 4.11.
Pb: The mean content is 56.7 mg/kg, with range from 27-212.4 mg/kg. In 61.4% of samples, Pb
contents are from 40-60 mg/kg, and in two samples located in the lacustrine unit near Dianchi
Lake, Pb contents are >200 mg/kg.
Cd: The mean content is 0.47 mg/kg, with range from trace-4.0 mg/kg. In 43.1% of samples, Cd
contents are from 0.1-1.0 mg/kg. In 54 out of 130 samples (41.5%), Cd contents are <0.1mg/kg,
and 35.4% of samples have a trace of Cd.
Cu: The mean content is 125.7 mg/kg, with range from 20.7-231.7 mg/kg. In 80.7% of samples,
Cu contents are from 50-200 mg/kg, and 13 out of 88 (14.8%) with Cu >200 mg/kg.
Zn: The mean content is 114.2 mg/kg, with range from 43.1-238.5 mg/kg. In 44.3% of samples,
Zn contents are from 100-150 mg/kg.

NATURAL TE CONTENTS AND ANTHROPOGENIC CONTAMINATION OF SOILS
90
Figure 4.11: Percentages of sample numbers within range TE contents
to total sample numbers in topsoil.
4.3.2.2. Relationships between trace element contents and pH, SOC, CEC
Relationships between TE contents and soil properties were analysed and only significant linear
relationships considered (Table 4.6, Annex 4.4).
Table 4.6: Regression analysis between TE contents and soil properties
Y X Equation R2 F Sig.f N SOC Y=30.01+12.72 x 0.092 6.200* 0.015 88
Pb LSOC Y = 34.18+6.30 x 0.192 6.414* 0.017 31 SOC Y=0.11+0.19x 0.049 6.776** 0.011 88 LSOC Y = -0.163+0.27 x 0.173 9.186** 0.004 31 TSOC Y= -0.11+0.32 x 0.161 13.866** <0.001 47 CEC<25 Y= -0.17+3.73E-02 x 0.107 7.417** 0.008 51
Cd
pH, SOC, CEC Y = -0.18-5.12×10⁻²*pH+0.43*SOC+6.82×10⁻³*CEC 0.190 4.697** 0.005 88 Cu TCEC Y = 16.72+6.10 x 0.470 31.987** <0.001 47
* and ** mean significance with P<0.05 or P<0.01.

NATURAL TE CONTENTS AND ANTHROPOGENIC CONTAMINATION OF SOILS
91
pH:
If excluding special sample (Pb: 212.4 mg/kg), negative linear relationships between pH and total
Pb content (F=1.821, sig.f=0.182) exist; and negative relationships between pH and total Cu
(F=3.158, sig.f=0.081) were also observed, although no significant linear relationship between TE
contents and pH is observed. A special sample located near Dianchi Lake with pH 7.5 to be
influenced by the effect of irrigation water from Dianchi Lake.
SOC:
Significantly positive relationships between SOC and total Pb, total Cd are observed (Table 4.6).
The similar linear relationships are still observed in the lacustrine unit for Pb and Cd, and in the
transition unit for Cd.
CEC:
Positive linear relationships are observed between CEC and total Cu content in the transition unit,
CEC (<25 cmol/kg) and total Cd content.
4.3.2.3. Total trace element contents versus geomorphology
Figure 4.2 shows the results summarized by geomorphological units (see the end of IV).
Pb:
The mean content in the mountain unit is higher than in the transition and lacustrine units (M>T
(L)) (Figure 4.12). In toposequences 10 and 16, Pb contents decreased from hilltop to foot of hill
(Figures 4.12, 4.4, 4.5). Pb contents were stable beside the two sides of the hill in toposequence 6
(Figures 4.13, 4.3). An exception occurs with the high Pb content in sample No. 26 close to
Dianchi Lake.

NATURAL TE CONTENTS AND ANTHROPOGENIC CONTAMINATION OF SOILS
92
Figure 4.12: Pb, Cd, Cu and Zn contents of topsoil in the three units.
Figure 4.13: Pb, Cu and Zn contents in three toposequences in the three units.

NATURAL TE CONTENTS AND ANTHROPOGENIC CONTAMINATION OF SOILS
93
Pb is accumulated in some samples in the research area (Figure 4.14, Annex 4.3). There were
relatively high Pb contents from north-east to south-west, which includes Bailongtan village
(north-east, mountain unit), Sanchakou village (middle, transition unit) and Yuhua village
(south-west, transition unit). There are two small areas with high Pb contents near Kele village
(west, lacustrine unit) and Zhongzhuan village (south, transition unit).
Using semivariogram analysis, the spherical model is suitable to Pb distribution (Figure 4.14). The
range is 630 m, nugget (C0) 0.151 and sill (C0+C) 1.054. The proportion of C0/(C0+C) is 14.2%,
which is <25%, meaning a strong spatial correlation of Pb is mainly influenced by morphological
factors, such as relief and parent materials (C0/(C0+C)<25% means a strong spatial correlation;
25%<C0/(C0+C)<75%, a medium spatial correlation; and C0/(C0+C)>75% a weak spatial
correlation (Wang X.J., et al., 2005; Goovaerts & Webster, 1994; Tao S., 1995, 1998; Ndiaye &
Machin, 1999)).

NATURAL TE CONTENTS AND ANTHROPOGENIC CONTAMINATION OF SOILS
94
Figure 4.14: Contour map of Pb contents and semivariogram analysis of topsoil
in the research area.
Cd:
The mean content in the mountain unit is higher than in the transition and lacustrine units (M>T>L)
(Figure 4.12). Considering toposequences, Cd contents in toposequence 16 decreased from 4
mg/kg in the hilltop (No. 122) to 2.3 mg/kg on the hillside (No. 123) and 0.49 mg/kg on the foot
(No. 124) of the hill, although Cd contents in some samples in toposequence 10 and toposequence
6 are trace.
About the spatial distribution of Cd in the research area, high Cd contents locate in a small area
near Bailongtan village (north-east, the mountain unit) relative to high rock background values. Cd
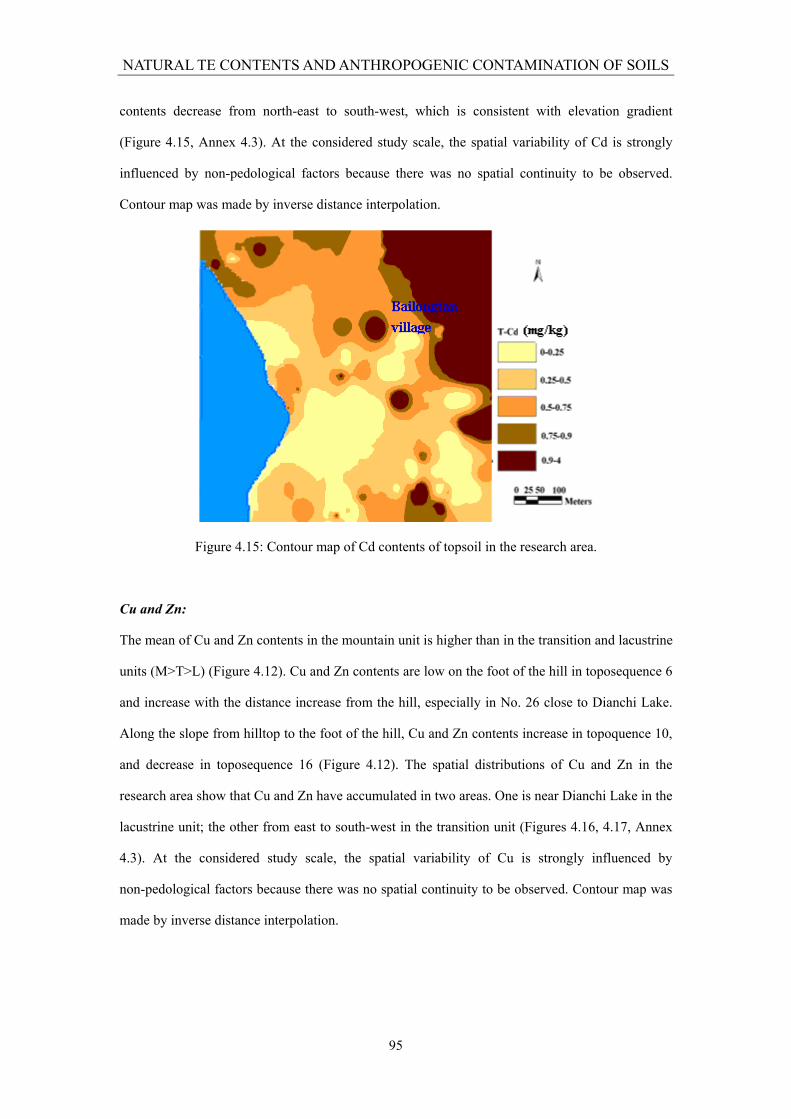
NATURAL TE CONTENTS AND ANTHROPOGENIC CONTAMINATION OF SOILS
95
contents decrease from north-east to south-west, which is consistent with elevation gradient
(Figure 4.15, Annex 4.3). At the considered study scale, the spatial variability of Cd is strongly
influenced by non-pedological factors because there was no spatial continuity to be observed.
Contour map was made by inverse distance interpolation.
Figure 4.15: Contour map of Cd contents of topsoil in the research area.
Cu and Zn:
The mean of Cu and Zn contents in the mountain unit is higher than in the transition and lacustrine
units (M>T>L) (Figure 4.12). Cu and Zn contents are low on the foot of the hill in toposequence 6
and increase with the distance increase from the hill, especially in No. 26 close to Dianchi Lake.
Along the slope from hilltop to the foot of the hill, Cu and Zn contents increase in topoquence 10,
and decrease in toposequence 16 (Figure 4.12). The spatial distributions of Cu and Zn in the
research area show that Cu and Zn have accumulated in two areas. One is near Dianchi Lake in the
lacustrine unit; the other from east to south-west in the transition unit (Figures 4.16, 4.17, Annex
4.3). At the considered study scale, the spatial variability of Cu is strongly influenced by
non-pedological factors because there was no spatial continuity to be observed. Contour map was
made by inverse distance interpolation.

NATURAL TE CONTENTS AND ANTHROPOGENIC CONTAMINATION OF SOILS
96
Figure 4.16: Contour map of Cu contents of topsoil in the research area.
Using semivariogram analysis, the exponential model is suitable to Zn distribution (Figure 4.17).
The range is 870 m, nugget (C0) 0.278 and sill (C0+C) 1.005. The proportion of C0/(C0+C) is
27.7%, meaning the medium spatial correlation of Zn is influenced by both morphological factors
(relief and soil parent materials) and non-pedological factors (pesticides, fertilizers, irrigation and
traffic).

NATURAL TE CONTENTS AND ANTHROPOGENIC CONTAMINATION OF SOILS
97
Figure 4.17: Contour map of Zn contents and semivariogram analysis of topsoil
in the research area.
4.3.2.4. Detailed approach
According to soil properties in the research area, two relatively integrating sub-regions have been
selected in order to better assess anthropogenic effects (Figures 4.1 and 3.16).
4.3.2.4.1. Lacustrine unit
A. Total trace element contents
The TE contents in lacustrine unit are presented in Table 4.7 and Annex 4.5.
Pb: Mean content is 10.5 mg/kg, ranging between 4.1-24.2 mg/kg. There are significant
differences between Pb contents in L8, L9 and in other lines (Figure 3.15). There are relatively
high Pb contents in the northern part of this site, where there is a road. The car exhaust may

NATURAL TE CONTENTS AND ANTHROPOGENIC CONTAMINATION OF SOILS
98
influence Pb contents in soil near the road. High Pb contents also locate in a small area near Kele
village (west, lacustrine unit).
Cd: Cd contents of samples of 5 lines are trace, with high contents in L2. There are significant
differences between L2 and other lines, except L8. Cd contents do not vary significantly in this
site.
Cu: Mean content is 84.6 mg/kg, ranging between 75.8-98.5 mg/kg. There are significant
differences between L7 and other lines, except L9. Cu contents do not vary significantly. Some
small areas with relative high Cu contents are located at the north-west part of this site, close to
Jiangwei village.
Zn: Mean Zn content is 83.5 mg/kg, ranging 53.6-107.7 mg/kg. There are significant differences
between line L1-5 and line L6-9. There is a relative high Zn area at the northern part of this site
along a road.
There are significant differences of contents of Pb, Cd, Cu and Zn between lines from south to
north, with increase in distance from Chenggong town. However, there is no significant difference
between Pb, Cd, Cu and Zn contents between rows from west to east, according to T-tests.
Table 4.7: TE contents (mg/kg) in topsoil in detailed approach samples in the lacustrine unit
Pb Cd Cu Zn Lines
Mean Median Range Mean Median Range Mean Median Range Mean Median Range
L0-0-9 4.8c 5.8 0 - 8.6 Trace trace trace 82.0bc 84.2 49.3 - 95.9 94.3ab 97.0 58.2 - 114.5
L1-0-9 9.2bc 8.9 2.6 - 17. 4 Trace trace trace 87.8bc 85.9 73.7 - 104.8 53.6d 48.0 39.3 - 84.5
L2-0-9 6.1bc 5.7 2.9 - 11.5 0.150a 0 0 - 0.790 83.0bc 83.0 71.1 - 96.7 59.9d 51.4 319 - 98.4
L3-0-9 7.5bc 2.7 0 - 52.1 Trace trace trace 75.8c 76.8 66.4 - 84.5 55.9d 54.4 23.7 - 95.9
L4-0-9 4.1c 4.2 0 - 13.1 0.047b 0 0 - 0.466 79.2bc 81.3 53.8 - 99.8 67.5cd 64.6 47.2 - 87.9
L5-0-9 6.3bc 7.4 0.6 - 9.4 Trace trace trace 77.8bc 81.1 58.5 - 92.7 77.6bc 75.5 43.4 - 111.4
L6-0-9 9.4bc 8.4 5 - 16.3 Trace trace trace 85.2bc 96.0 1.3 - 114.4 107.7a 102.3 82 - 149.4
L7-0-9 11.9b 8.4 0 - 26.1 0.006b 0 0 - 0.056 98.5a 98.9 58.1 - 126.6 106.9a 102.9 74.6 - 139.5
L8-0-9 21.6a 22.1 14 - 28 0.063ab 0.049 0 - 0.205 80.9c 84.5 9.1 - 120.4 104.1a 103.7 93.8 - 117.5
L9-0-9 24.2a 24.5 19.9 - 29.3 0.026b 0 0 - 0.153 95.9ab 98.0 80.4 - 110.9 106.8a 107.9 75.4 - 120.6
* Mean content with different letter means significant difference (P<0.05), according to T-tests, n=10.

NATURAL TE CONTENTS AND ANTHROPOGENIC CONTAMINATION OF SOILS
99
B. Trace element contents in five greenhouses close together
Pb: Mean content in 5 greenhouses is 5.0 mg/kg, ranging between 2.4-13.3 mg/kg, with the
highest, 13.3 mg/kg, in greenhouse No. 1. There are significant differences of Pb contents between
greenhouse No. 1 and the other greenhouses (Table 4.8).
Cd: Content is trace in greenhouses.
Cu: Mean content in 5 greenhouses is 90.8 mg/kg, ranging between 83.7-101.5 mg/kg, with the
highest, 101.5 mg/kg, in greenhouse No. 1. There are significant differences of Cu contents
between greenhouses No. 1, 3 and 4.
Zn: Mean content in 5 greenhouses is 91.1 mg/kg, ranging between 83.0-95.0 mg/kg, with the
highest in greenhouse No. 1. No significant difference of total Zn contents between greenhouses is
observed.
To summarize, although 5 greenhouses are near each other, contents of Pb, Cu and Zn in
greenhouse No. 1 are the highest, while TE contents in the other four greenhouses are similar.
Table 4.8: TE contents (mg/kg) in five greenhouses in the lacustrine unit
Greenhouse Contents Pb Cu Zn Mean 13.3a 101.5a 95.0a
Median 11.3 106.9 99.4 1 Range 0 - 25.9 87.7 - 109.0 74.6 - 106.8
Mean 3.4b 89.8ab 94.7a
Median 3.1 90.5 98.8 2 Range 1.8 - 5.6 76.9 - 99.7 83.6 - 104.8
Mean 3.7b 87.2b 83.0a
Median 4.5 94.1 86.5 3 Range 0 - 6.9 72.1 - 101.9 63.5 - 99.4
Mean 2.5b 83.7b 91.1a
Median 2.8 86.5 89.2 4 Range 0 - 4.3 72.2 - 89.7 82.1 - 103.3
Mean 2.4b 91.7ab 91.5a
Median 2.3 94.2 88.3 5 Range 0.6 - 3.9 80.6 - 98.8 78.3 - 105.0
* Mean content with different letter means significant difference (P<0.05), according to T-tests, n=5.

NATURAL TE CONTENTS AND ANTHROPOGENIC CONTAMINATION OF SOILS
100
4.3.2.4.2. Transition unit
A.Total trace element contents
TE contents in the transition unit are summarized in Table 4.9 and Annex 4.5.
Pb: Mean content is 17.5 mg/kg, with range from 10.5-35.9 mg/kg. The mean Pb content in T0
(26.1 mg/kg), close to the mountain (Figure 3.16), is higher than in other rows, which could be
linked to the rock background value. No significant difference is observed between rows and lines.
Pb contents decrease from south to north, which is consistent with elevation gradient.
Cd: Mean content is 0.298 mg/kg, with range from trace to 2.264 mg/kg. The mean Cd content in
T1 (0.692 mg/kg), close to the mountain, is higher than in other rows. Mean of Cd content in T6 is
the lowest. No significant difference is observed between lines (Table 4.9). Samples with high Cd
contents (T0 and T1) are located at southeast part near the mountain with high rock background
value. Cd contents decrease from south-east to north-west, which is consistent with elevation
gradient.
Cu: Mean content is 137.4 mg/kg, with range from 53.9-223.0 mg/kg. The mean Cu content in T3
(172.6 mg/kg) is higher than in other rows, which could be linked to a road close to T3.
Zn: Mean content is 117.7 mg/kg, with range from 48.1-192.1 mg/kg. The mean Zn content in T1
(138.5 mg/kg) and T3 (146.7 mg/kg) is significantly higher than in other rows, which could be
linked to rock background value (T1) and a road close to T3 (Table 4.9).
No significant difference in contents of Cu and Zn is observed between lines. Accumulation of Cu
and Zn are from west to east located in the middle of the area selected for this detailed approach
and relative to a road across this area.

NATURAL TE CONTENTS AND ANTHROPOGENIC CONTAMINATION OF SOILS
101
Table 4.9: TE contents (mg/kg) in topsoil of detailed approach samples in the transition unit
Pb Cd Cu Zn Lines
Mean Median Range Mean Median Range Mean Median Range Mean Median Range
T0-0-6 20.1a 28.1 18.8 - 29.3 0.392a b0.347 0.266 - 0.565 128.99b133.49 49.25 - 95.85 123.38ab 120.99 58.18 - 114.45
T1-0-6 17.7b 16.6 14.4 – 21 0.692a 0.407 0.259 - 2.264 148.8ab 152.7 97 - 156.9 138.5a 137.5 92.4 - 192.1
T2-0-6 16.3bc 15.6 14.6 - 19 0.275bc 0.251 0.214 - 0.392 148.8ab 144.5 101.6 - 182.7 128.6ab 121.8 110.1 - 166.3
T3-0-6 18.7b 17.9 16.6 – 23 0.274bc 0.221 0.154 - 0.565 172.8a 170.3 131.6 - 202.5 146.7a 152.1 125.4 - 169.6
T4-0-6 13.7c 153 10.5 - 15.5 0.167bc 0.184 0.094 - 0.244 137.3b 136.1 89.5 - 165.3 107.6b 108.7 66.2 - 133.6
T5-0-6 13.4c 13.5 12.2 - 14.1 0.236bc 0.139 Tr. - 0.856 137.7b 125.5 110.4 - 155.1 105.9b 104.5 60.0 - 1589
T6-0-6 16.8bc 16.5 11.5 - 27.5 0.049c 0.064 Tr. - 0.131 89.6b 86.8 53.9 - 133.1 72.9c 73.4 48.1 - 95.7
* Mean content with different letter means significant difference (P<0.05), according to T-tests, n=7.
B. Trace element contents in five greenhouses close together
Pb: Mean content in 5 greenhouses is 15.70 mg/kg, ranging from 14.29-21.79 mg/kg, with the
highest in greenhouse No. 5. There are significant differences of Pb contents between No. 5, 1 and
3 (Table 4.10).
Cd: Cd content is trace in 5 greenhouses.
Cu: Mean content in 5 greenhouses is 177.21 mg/kg, ranging from 144.52-203.87 mg/kg, with the
highest in greenhouse No. 2. There is significant difference of Cu contents between No. 1 and No.
2.
Zn: Mean content in five greenhouses is 141.09 mg/kg, ranging from 110.33-155.94 mg/kg, with
the highest in greenhouse No. 5. There are significant differences of Zn contents between No. 1
and the other greenhouses.
To sum up, contents of Pb and Zn in greenhouse No. 5 are the highest, and Cu in No. 2. While in
No. 1, contents of Pb, Cu and Zn are the lowest. It is suggested that TE could still be brought
about from agricultural practices.

NATURAL TE CONTENTS AND ANTHROPOGENIC CONTAMINATION OF SOILS
102
Table 4.10: TE contents (mg/kg) in five greenhouses in the transition unit
Greenhouse Contents Pb Cu Zn Mean 14.3b 144.5c 110.3b
Median 15.374 158.8 121.6 1 Range 9.1 - 17.5 87.2 - 188.1 67.6 - 140.4
Mean 177ab 203.9a 154.9a
Median 16.7 206.6 157.9 2 Range 16.4 - 21.6 185.7 - 222.9 142.2 - 167.0
Mean 16.6b 168.4bc 140.1a
Median 17.6 176.4 145.9 3 Range 10.9 - 20.2 132.9 - 193.0 112.6 - 152.4
Mean 18.2ab 173.3abc 144.2a
Median 18.9 174.8 147.9 4 Range 13.9 - 20.2 125.9 - 208.2 112.5 - 166.2
Mean 21.8a 195.9ab 155.9a
Median 19.6 195.7 150.1 5
Range 19.0 - 30.6 185.0 - 217.3 130.8 - 195.4
* Mean content with different letter means significant difference (P<0.05), according to T-tests, n=5.
4.3.3. Vertical distribution of total trace elements
4.3.3.1. Trace element contents in subsoil
TE contents in subsoil are shown in Figure 4.2, Figure 4.18 and Annex 4.6.
Pb: Mean content is 58.2 mg/kg, ranging from 33.4-116.8 mg/kg. In 65.6% samples, Pb contents
are between 40-60 mg/kg. In 2 out of 32 samples (6.2%), which are located in the mountain unit,
Pb contents are >100 mg/kg.
Cd: Mean content is 0.89 mg/kg, ranging from trace to 2.30 mg/kg. In 59.4% samples, Cd
contents are between 0.1-1.0 mg/kg and Cd contents of 34.4% samples are >1.0 mg/kg, distributed
in the three units.
Cu: Mean content is 129.2 mg/kg, ranging from 26.8-218.2 mg/kg. In 43.7% samples, Cu contents
are between 100-200 mg/kg, in 31.3% samples Cu contents are between 50-100 mg/kg. In 6 out of
32 samples (18.8%), located in the transition unit, Cu contents are >200 mg/kg.
Zn: Mean content is 97.0 mg/kg, range from 15.7-176.3 mg/kg. In 53.1% samples, Zn contents are
between 50-100 mg/kg, in 28.1% samples Zn contents are between 100-150 mg/kg. In 3 out of 32
samples (9.4%), Zn contents are >150 mg/kg.

NATURAL TE CONTENTS AND ANTHROPOGENIC CONTAMINATION OF SOILS
103
Figure 4.18: Percentages of sample numbers within range TE contents to total sample numbers
in subsoil
4.3.3.2. Relationships between total trace element contents in subsoil and soil morphological properties
Colour:
According to field observations, colour of subsoil is brown or reddish brown, including 10YR,
7.5YR, 5YR and 2.5YR based on Munsell Codes. In 28.1% of samples, colour is 10YR with mean
Pb: 46.8, Cd: 0.7, Cu: 102.5 and Zn: 79.9 mg/kg, Colour of 12.5% of samples is 7.5 YR with
mean Pb: 51.6, Cd: 0.88, Cu: 160.3 and Zn: 118.6 mg/kg. Colour of 12.5% of samples is 5 YR,
with mean Pb: 54.3, Cd: 0.72, Cu: 132.8 and Zn 93.4: mg/kg. In 25% of samples, colour is 2.5 YR,
with mean Pb: 79.9, Cd: 1.36, Cu: 138.2 and Zn: 110.3 mg/kg.
The relationships between TE contents and colour show 10 YR samples with lowest TE contents,
2.5 YR samples with highest contents of Pb and Cd, and 7.5 YR samples with highest contents of

NATURAL TE CONTENTS AND ANTHROPOGENIC CONTAMINATION OF SOILS
104
Cu and Zn. Except for 7.5 YR samples, TE contents increase with colour from brown to reddish
brown (Figure 4.19).
TE contents in subsoil samples with colour (7.5YR + 10YR) (Pb: 48.3, Cd: 0.76, Cu: 120.3 and
Zn: 91.8 mg/kg) are lower than with colour (5YR + 2.5YR) (Pb: 65.0, Cd: 0.99, Cu: 135.09 and
Zn: 100.5 mg/kg).
Figure 4.19: TE contents in subsoil (H2) with different colour.
Relief:
In the lacustrine unit, the mean TE contents in subsoil are Pb: 4l.55, Cd: 0.72, Cu: 82.4 and Zn:
69.4 mg/kg. Three (No. 22, 29, 46) out of 8 samples close to Dianchi Lake, in which mean TE
contents (Pb: 45.7, Cd: 0.81, Cu: 83.2 and Zn: 79.1 mg/kg) are higher in samples far from the
Lake (Pb: 43.2, Cd: 0.57, Cu: 80.2 and Zn: 65.2 mg/kg).
The mean of TE contents in the transition unit are Pb: 53.4, Cd: 0.74, Cu: 160.8 and Zn: 94.8
mg/kg. Mean TE contents in samples originating from two hilltops are lower than in samples
originating from the intermediate foot slope, except for Pb (50.3 mg/kg on hilltop, 57.1 mg/kg on
foot slope) (Figure 4.20).

NATURAL TE CONTENTS AND ANTHROPOGENIC CONTAMINATION OF SOILS
105
Pb content in Toposequence 11,12 and 13
0102030405060708090
Top1 Foot Top2
location of sample
Pb c
onte
nt (m
g/kg
)
Toposequence 11Toposequence 12Toposequence 13
Cd content in Toposequence 11,12 and 13
0
0.2
0.4
0.6
0.8
1
Top1 Foot Top2
location of sample
Cd c
onte
nt (m
g/kg
)
Toposequence 11Toposequence 12Toposequence 13
Cu content in Toposequence 11,12 and 13
0
50
100
150
200
250
Top1 Foot Top2
location of sample
Cu c
onte
nt (m
g/kg
)
Toposequence 11Toposequence 12Toposequence 13
Zn content in Toposequence 11,12 and 13
020406080
100120140160
Top1 Foot Top2
location of sample
Zn c
onte
nt (m
g/kg
)
Toposequence 11Toposequence 12Toposequence 13
Figure 4.20: TE contents in subsoil in toposequences 11, 12 and 13.
The mean of TE contents in the mountain unit are Pb: 108.20, Cd: 2.2, Cu: 114.8 and Zn: 155.00
mg/kg. TE contents in the mountain unit are higher than in the lacustrine and transition units
(M>T>L), except for Cu (T>M>L) (Figure 4.21).

NATURAL TE CONTENTS AND ANTHROPOGENIC CONTAMINATION OF SOILS
106
Figure 4.21: TE contents in subsoil in the three units.
Parent materials and stoniness:
Stoniness is <15% in subsoil. Pb and Cd contents (Pb: 45.8 and Cd: 0.45 mg/kg) are lower with no
stoniness than with stoniness (Pb: 59.5 and Cd: 0.94 mg/kg). For Cu and Zn, it is just the opposite.
Cu (174.9 mg/kg) and Zn (118.6 mg/kg) contents are higher with no stoniness than with stoniness
(Cu: 124.3 and Zn: 94.8 mg/kg).
Sandstone and limestone are the main types of stones in the subsoil. Mean TE contents in samples
with sandstone are lower than in samples with limestone, except for Cu. The other special
“stoniness” is shell, in which mean TE contents of subsoil are lower than with sandstone and
limestone, except for Zn (Figure 4.22).

NATURAL TE CONTENTS AND ANTHROPOGENIC CONTAMINATION OF SOILS
107
Cd content in subsoil with differnt stones
0
0.5
1
1.5
2
2.5
H2Cd
Cd c
onte
nt (m
g/kg
)
ShellSandstoneLimestone
Figure 4.22: TE contents in subsoil with different stones.
Texture:
In 20 out of 32 samples (62.5%), texture is clay in subsoil. Mean TE contents with clay texture are
Pb: 59.7, Cd: 0.85, Cu: 129.2 and Zn: 93.2 mg/kg, which are higher than in samples with sandy
texture (Pb: 42.6 mg/kg, Cd: 0.55 mg/kg, Cu: 82.1 mg/kg, Zn: 71 mg/kg), and in samples with
sandy loam texture (Pb: 37.6, Cd: 0.68, Cu: 85.8 and Zn: 91.7 mg/kg).
Mottles:
According to mottles in subsoil, samples are classified into two groups, one group with many
black, red or yellow mottles due to organic matter and redox reactions, and the other group with
few mottles. Mean TE contents with many mottles are for Pb: 52.6, Cd: 0.70, Cu: 142.1 and Zn:
97.4 mg/kg, which is lower than for Cu (161.5 mg/kg) and Zn (108.8 mg/kg) in samples with few
mottles, higher than for Cd (0.57 mg/kg) and similar for Pb (52.8 mg/kg).
4.3.3.3. Relationships between total trace element contents in topsoil and subsoil
The mean Pb and Zn contents in topsoil are higher than in subsoil. But the mean contents of Cd
and Cu are almost the similar in topsoil and subsoil (Figure 4.23).

NATURAL TE CONTENTS AND ANTHROPOGENIC CONTAMINATION OF SOILS
108
Figure 4.23: Total TE contents in topsoil and subsoil.
The ratio of mean TE contents in top/subsoil (RTS) is shown in Annex 4.6. Mean RTS of Pb and
Zn are 1.47 (0.74-11.51) and 1.38 (0.76-8.13), respectively. RTS of Pb, Zn in 84.4% of samples
are >1.0. The highest RTS of Pb are located in the transition (11.51) and lacustrine units (3.73).
The highest RTS of Zn is located in the mountain unit (8.13). The mean RTS of Cd and Cu are
1.30 (0.70-8.43) and 1.03 (0.73-1.65), respectively. Some 75.9 % of samples are with Cd RTS
≤1.0, while 78.3% of samples are with Cu RTS ≤1.0 (Figure 4.24).
Figure 4.24: Percentage of sample numbers within range RTS to total top/sub pair numbers.

NATURAL TE CONTENTS AND ANTHROPOGENIC CONTAMINATION OF SOILS
109
In the lacustrine unit: Mean TE contents in topsoil are higher than in subsoil (Figure 4.25). The
mean RTS is >1, with Pb: 1.48, Cd: 1.18, Cu: 1.11 and Zn: 1.45. Some 87.5% of samples with
RTS>1.0 for Pb and Zn are observed. It is suggested that TE accumulate in topsoil.
Figure 4.25: Total TE contents in topsoil and subsoil in the lacustrine unit.
In the transition unit: Mean Pb and Zn contents in topsoil are higher than in subsoil (Figure
4.26). The RTS is Pb: 1.51, Cd: 0.98, Cu: 0.97 and Zn: 1.39. One sample with the highest RTS of
Pb (11.51) is located on the foot slope (Toposequence 10), and Cd (8.44) and Zn (8.13) located on
toposequence 15. It is suggested that in the transition unit there is a Pb and Zn accumulation in
topsoil.

NATURAL TE CONTENTS AND ANTHROPOGENIC CONTAMINATION OF SOILS
110
Figure 4.26 Total TE contents in topsoil and subsoil in the transition unit.
In the mountain unit: The mean TE contents in topsoil are higher than that in subsoil (Figure
4.27). The mean RTS is Pb: 1.16, Cd: 1.24, Cu: 1.20 and Zn: 1.16.
Figure 4.27: Total TE contents in topsoil and subsoil in the mountain unit.
To summarize, TE accumulation in topsoil is more often observed. There are strongly significant
positive relationships between Cd, Cu and Zn contents in topsoil and subsoil (Table 4.11, Annex
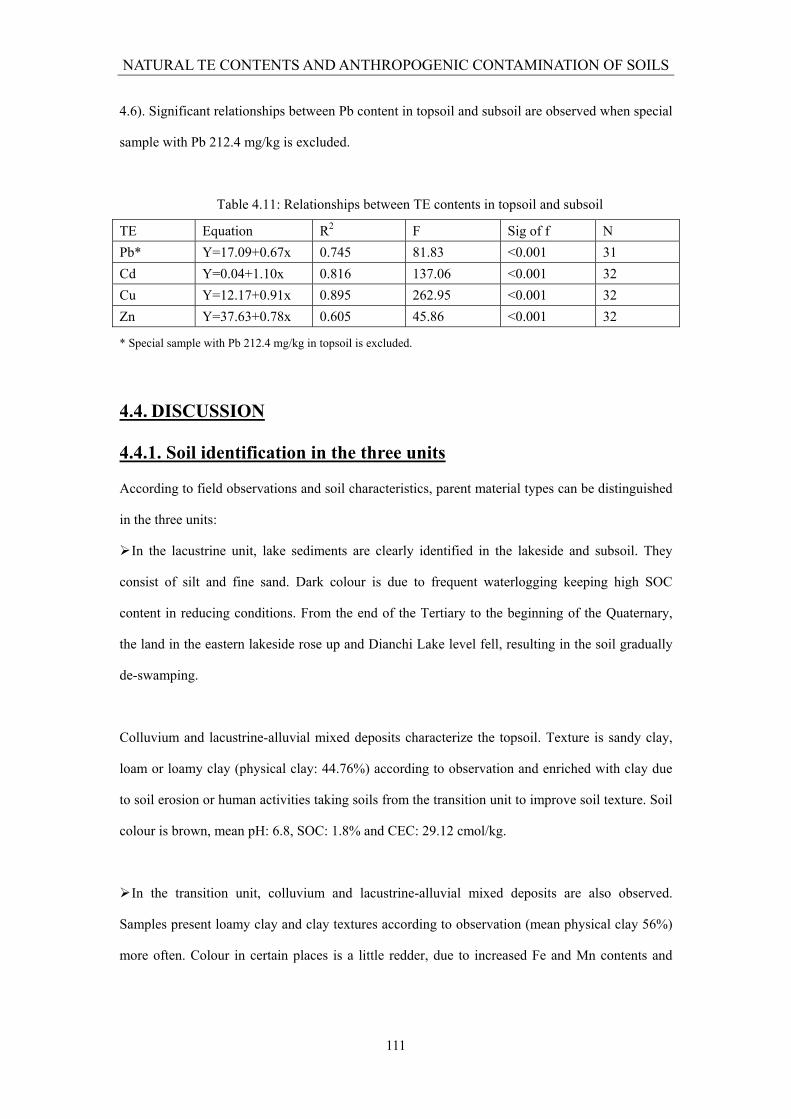
NATURAL TE CONTENTS AND ANTHROPOGENIC CONTAMINATION OF SOILS
111
4.6). Significant relationships between Pb content in topsoil and subsoil are observed when special
sample with Pb 212.4 mg/kg is excluded.
Table 4.11: Relationships between TE contents in topsoil and subsoil
TE Equation R2 F Sig of f N Pb* Y=17.09+0.67x 0.745 81.83 <0.001 31 Cd Y=0.04+1.10x 0.816 137.06 <0.001 32 Cu Y=12.17+0.91x 0.895 262.95 <0.001 32 Zn Y=37.63+0.78x 0.605 45.86 <0.001 32
* Special sample with Pb 212.4 mg/kg in topsoil is excluded.
4.4. DISCUSSION
4.4.1. Soil identification in the three units
According to field observations and soil characteristics, parent material types can be distinguished
in the three units:
In the lacustrine unit, lake sediments are clearly identified in the lakeside and subsoil. They
consist of silt and fine sand. Dark colour is due to frequent waterlogging keeping high SOC
content in reducing conditions. From the end of the Tertiary to the beginning of the Quaternary,
the land in the eastern lakeside rose up and Dianchi Lake level fell, resulting in the soil gradually
de-swamping.
Colluvium and lacustrine-alluvial mixed deposits characterize the topsoil. Texture is sandy clay,
loam or loamy clay (physical clay: 44.76%) according to observation and enriched with clay due
to soil erosion or human activities taking soils from the transition unit to improve soil texture. Soil
colour is brown, mean pH: 6.8, SOC: 1.8% and CEC: 29.12 cmol/kg.
In the transition unit, colluvium and lacustrine-alluvial mixed deposits are also observed.
Samples present loamy clay and clay textures according to observation (mean physical clay 56%)
more often. Colour in certain places is a little redder, due to increased Fe and Mn contents and

NATURAL TE CONTENTS AND ANTHROPOGENIC CONTAMINATION OF SOILS
112
rubefaction. High pH and SOC are noticed on foot slopes. Mean pH in topsoil is 5.8, SOC content
is 1.4%, and mean CEC is 20.61 cmol/kg.
In the mountain unit, soils result from the weathering of limestone, marlstone and diluvium
deposits. Soils present clay texture (physical clay: 58%). The reaction is acid (pH: 6.3) and due to
decarbonation (Poncin, 2004). According to saturation ratio decreasing in subsoil, and Al3+
increased in subsoil (Poncin, 2004), low pH is related to the strong leaching of base ions and
accumulation of Al3+. The pH of samples is low on the foot slope. Colour is reddish brown more
often in all horizons due to iron-manganese concretion particles and high Fe contents (Poncin,
2004). SOC content in topsoil is 1.3% and mean CEC is 28.30 cmol/kg.
4.4.2. Horizontal distribution of trace elements and anthropogenic
effects
Trace element contents in regional horizontal approach
TE contents in topsoil are respectively Pb: 49.5, Cd: 1.148, Cu: 104.4 and Zn: 106.9 mg/kg. TE
contents are influenced by soil characteristics. TE contents in soils appear linked to pH and cation
retention. Negative relationships between pH and Pb (Cu) contents are observed. Positive
relationships between SOC and Pb (Cd) contents, CEC and Cu contents are observed. The
variation of Pb could be explained by SOC from one soil to another, Cd by SOC and CEC, and Cu
by CEC. Meanwhile, pH and CEC present a significant relationship according to PCA (Figure
4.28). In fact, a positive relationship between pH and CEC exists with regression analysis
(CEC=5.83+4.87pH, R2=0.288, F=23.41 sig.f<0.001, n=88).

NATURAL TE CONTENTS AND ANTHROPOGENIC CONTAMINATION OF SOILS
113
Figure 4.28: PCA of pH, SOC and CEC of topsoil.
Trace elements versus geomorphology
The mean TE contents in the mountain unit are higher than in the transition and the lacustrine
units (M>T(L) for Pb, M>T>L for Cd, Cu Zn. From north-east to south-west, TE contents are
from high to low, which is consistent with elevation gradient. Relief and soil types play key roles
in the TE regional distribution. The high TE mean contents in the mountain unit can be linked to
the high rock background values. The parent material is another key factor controlling the
distribution of TE to some extent, especially in the limestone area.
On the other hand, total TE contents in topsoil are also affected by human activities. The spherical
model is suitable to Pb and the exponential model suitable for Zn with semivariogram analysis,
besides strong spatial variability of Cu and Cd. The proportion of C0/(C0+C) of Pb is 14.2%,
which means the variability of Pb is mainly influenced by morphological factors (relief and soil
parent materials). The proportion of C0/(C0+C) of Zn is 27.7%, which means the variability of Zn
is mainly influenced by non-pedological factors (pesticides, fertilizers, irrigation and road traffic)
mixed with morphological factors (relief and soil parent materials).

NATURAL TE CONTENTS AND ANTHROPOGENIC CONTAMINATION OF SOILS
114
Variability of detailed approach to trace element contents
Significant differences of TE contents between lines are observed from south to north with the
distance changing from Chenggong town in the lacustrine unit in 1 km2 grid. Near the city, TE
contents are mainly relative to water irrigation, sludge applications and atmospheric deposits.
Relative high Pb and Zn contents are observed at the northern part of lacustrine unit, along the
road from Gucheng to Jiangwei villages. Meanwhile, accumulations of Cu and Zn in the centre of
the transition unit are relative to a road across this site. It is suggested there are sources of TE from
the road, such as Bordeaux mixture, pesticides with Cu and Zn piled aside the road, organic
fertilizers with high Cu and Zn contents piled beside the road origin from animal food additives,
and car exhaust from vehicles.
From south to north in the transition unit, Pb and Cd contents are from high to low, which is
consistent with elevation gradient and linked to the high rock background values near the
mountain. However, there is no significant difference of Pb, Cd, Cu and Zn contents between rows
(from west to east), which could be relative to the similar agricultural practices and organic matter
application methods in those detailed approach sites.
Variability of trace elements in 5 greenhouses close together
Although five greenhouses are close to each other, significant differences of Pb, Cu and Zn
contents exist, whilst Cd contents are trace. TE could be continually brought about from
agricultural practices, especially organic fertilizer applications.
4.4.3. Trace element vertical distribution and estimation of natural
and contaminated values
Trace element contents in subsoil
TE contents in subsoil have relationships with soil properties, such as colour, relief, stoniness,
parent materials, texture and mottles. TE contents in subsoil samples with colour ≤5YR are higher

NATURAL TE CONTENTS AND ANTHROPOGENIC CONTAMINATION OF SOILS
115
than in samples with colour >5YR. Except for 7.5 YR, TE contents increase with colour from
brown to reddish brown. Reddish brown soils have abundant Fe2O3 to fix TE, and low pH in
reddish brown soil should be linked to high TE contents.
Considering the relief, changes in TE contents in subsoil are linked to sites of samples, parent
materials, textures and stoniness. For example, TE contents in samples close to Dianchi Lake are
higher than in samples far from the Lake in the lacustrine unit. Mean TE contents in samples
located on the hilltop are lower than in samples located on the foot of the hill in the transition unit,
except for Pb, which should be relative to human activities and soil erosion from hilltop to foot
slope.
Sandstone and limestone are the main types of stones in subsoil, besides shell. TE contents show
limestone>sandstone>shell, especially high Pb and Cd contents in subsoil with stoniness <15%,
and high Cu and Zn contents in subsoil with no stoniness. The same as Cu and Zn in subsoil with
few mottles are higher than in group with many mottles. Therefore, Cu and Zn have different
behaviour than Pb and Cd in subsoil, linked to stoniness and mottles. Pb and Cd should be
maintained more strongly with weathering products. Mean TE contents in subsoil with clay
texture are higher than in subsoil with sandy texture and sandy loam texture, which should be
relative to TE fixed to clay.
Relationships between trace element contents in topsoil and subsoil
Accumulation of TE exists in topsoil, especially Pb and Zn. Mean Pb and Zn contents in topsoil
are higher than in subsoil. Mean RTS of Pb and Zn is 1.47 and 1.38, respectively. Some 84.4% of
samples are RTS ≥1.0 (Pb, Zn). Accumulation of TE in topsoil exists in cultivated soil widely, and
linked to climate, anthropogenic activities and organic matter applications to topsoil.
Cd and Cu are mobile in dissolved forms, and transfer easily from topsoil to subsoil. Mean
contents of Cd and Cu are almost the similar in topsoil and subsoil. Some 75.9% (Cd) and 78.3%
(Cu) of samples are with RST ≤1.0. On the one hand, Cd and Cu are easy to transfer under the
influence of precipitation and anthropogenic activities. Especially, Cu and Cd will be more readily

NATURAL TE CONTENTS AND ANTHROPOGENIC CONTAMINATION OF SOILS
116
transferable in soil with high moisture and ground water in the lacustrine unit. On the other hand,
because TE has strong affinity with organic matter, and TE could move along the profile
accompanying organic matter is distribution along the profile. Anthropogenic activities are still
continuing to introduce TE to topsoil.
4.5. CONCLUSIONS
Soil types and soil identification:
Soil texture varies from loam in the lacustrine unit to clay in the transition unit, then to heavy clay
in the mountain unit (based on the FAO texture system). Soil colour is brown, and darker near the
Lake and redder in the mountain unit. Mean pH is 6.2, indicating soils are slightly acid in the
research area. Mean SOC is 1.5%, physical clay (<0.01 mm): 51.88% and CEC: 24.09 cmol/kg.
Comparing the geomorphological units, mean pH, SOC and CEC in the lacustrine unit appear to
be slightly higher than in the other two units, which is linked to different soil parent materials and
more intense agricultural practices. In the three units, texture of samples in subsoil is mainly clay,
besides sandy clay near the Lake. Colour in subsoil is darker brown in the lacustrine unit, and
reddish brown in the transition and mountain units.
Horizontal distribution of trace elements and anthropogenic effects:
Contents of regional trace elements: The mean Pb, Cd, Cu and Zn contents in topsoil are 56.7,
0.47, 125.7 and 114.2 mg/kg, respectively. The pH, SOC and CEC are the principal components
influencing soil TE contents. Variation in Pb could be affected by SOC, Cd by SOC and CEC,
while Cu by CEC.
Geomorphology of regional trace element contents: From north-east to south-west, contents of
Pb, Cd and Zn are from high to low, which is consistent with elevation gradient. The mean
contents of Pb, Cd, Cu and Zn in the mountain unit are higher than in the transition and lacustrine
units (M>T(L) for Pb, M>T>L for Cd, Cu and Zn.

NATURAL TE CONTENTS AND ANTHROPOGENIC CONTAMINATION OF SOILS
117
Variability of detailed approaches to trace element contents: Significant differences of TE
contents are observed from south to north with distance from Chenggong town in the lacustrine
unit and from the mountain in the transition unit. But, there is no significant difference between
TE contents from west to east with distance from Dianchi Lake in the lacustrine unit and between
two villages in the transition unit. However, accumulation of TE is usually along roads.
Meanwhile, even though greenhouses are close to each other, there are still significant differences
of Pb, Cu and Zn contents, except Cd contents are trace.
Vertical distribution of trace element contents: The mean TE contents in subsoil are Pb: 58.2, Cd:
0.89, Cu: 129.1 and Zn: 97.0 mg/kg.
Relationships between trace element contents in subsoil and soil morphological properties:
Except for 7.5 YR, TE contents increase with colour from brown to reddish brown. TE contents in
subsoil in the mountain unit are higher than in the lacustrine and transition units (M>T>L), except
for Cu (T>M>L). Mean TE contents in subsoil samples with limestone are higher than samples
with sandstone and shell. Mean TE contents in subsoil samples with clay texture are higher than in
samples with sandy texture and sandy loam texture. Cu and Zn contents in subsoil with few
mottles are higher than with many mottles, while Pb is close to each other, and Cd is lower.
Relationships between trace element contents in topsoil and subsoil: Although strong significant
relationships between TE contents in topsoil and subsoil are observed, mean Pb and Zn contents in
topsoil are higher than in subsoil, most of RTS of Pb and Zn ≥1.0. Mean contents of Cd and Cu
are similar in topsoil and subsoil, most of RTS of Cd and Cu ≤1.0.
To summary, the factors influencing TE content in the research area are influenced by
morphological factors (relief and soil parent materials) and non-pedological factors (pesticides,
fertilizers, irrigation and road traffic) (Table 4.12).

NATURAL TE CONTENTS AND ANTHROPOGENIC CONTAMINATION OF SOILS
118
Table 4.12: Summary for factors influencing TE contents in the research area
Factors Pb Cd Cu Zn
M>T(L) (topsoil and subsoil
contents)
M>T>L (topsoil and
subsoil contents)
M>T>L (topsoil contents);
T>M>L (subsoil contents)
M>T>L (topsoil and subsoil
contents)
High on hilltop in M* High on hilltop in M High on hilltop in M High on hilltop in M
Accumulation in M (regional
approach)
Accumulation in M
(regional approach)
Accumulation on eastern
(regional approach)
Accumulation on eastern
(regional approach)
Accumulation near M
(detailed approach)
2.5YR>10YR (subsoil) 2.5YR>10YR (subsoil) 2.5YR>10YR (subsoil) 2.5YR>10YR (subsoil)
Stoniness>no stoniness
(subsoil)
Stoniness>no stoniness
(subsoil)
Limestone>sandstone>shell
(subsoil)
Limestone>sandstone>
shell (subsoil)
Limestone
(sandstone)>shell (subsoil)
Limestone>sandstone>shell
(subsoil)
Clay>sandy (loam) (subsoil) Clay>sandy (loam)
(subsoil)
Clay>sandy (loam)
(subsoil)
Clay>sandy (loam) (subsoil)
Many mottles>few
mottles (subsoil)
C0/(C+C0) = 14.2% C0/(C+C0) = 27.7%
Morphological
factors
RTS<1 RTS<1
Positive relationship with
SOC
Positive relationship
with SOC
Accumulation near villages
and roads (regional and
detailed approaches)
Accumulation near villages
and roads (regional and
detailed approaches)
Accumulation near villages
and roads (regional and
detailed approaches)
Greenhouse differences Greenhouse differences Greenhouse differences
C0/(C+C0) = 27.7%
Non-pedological
factors
RTS>1 RTS>1
* L: lacustrine unit; T: transition unit; M: mountain unit.


NATURAL TE CONTENTS AND ANTHROPOGENIC CONTAMINATION OF SOILS
119
Figure 4.2: General toposequence
Parameters Lacustrine unit Transition unit Mountain unit
Elevation (m) 1,881 – 1,897 1,883 – 1,976 1,940 – 1,995
Slopes (%) 0 – 1 0 – 15 0 – 30 Outcrop Purple shale + sandstone Purple shale + sandstone Sandstone + limestone + dolomite
Parent rock (geological map) Lacustrine and slope deposit: sand clay Lacustrine and slope deposit: sand clay (+ shale with interbedded sandstone (hills)) diluvium deposit: sand clay + dolomite + basalt
Surface soil colour 10 YR; 7.5 YR,; 5 YR 5 YR; 7.5 YR;10 Y R; 2.5 YR 5 YR ; 2.5YR
Land cover Vegetables (cabbages, celery, lettuce, radish,…) greenhouses Vegetables (with and without greenhouses) + eucalyptus (hills) + fruit trees Vegetables (without greenhouses) + fruit trees
Geopedology Clay (%) Topsoil // subsoil 23 – 45 // 18 – 35 42 – 58 // 36 – 76 68.7 – 81.0 // 67.6 – 77.9
pH H2O Topsoil // subsoil 4.1 – 7.8 // 7.3 – 8.2 4.4 – 7.1 // 6.4 – 7.0 4.4 – 7.8 // 4.5 – 7.9 Synthesis
CEC (cmol/kg) Topsoil // subsoil 8.6 – 88.5 // 15.3 – 20.6 8.9 – 38.1 // 14.6 – 24.8 17.9 – 37.1 // 25.5 – 30.5
SOC (%) Topsoil // subsoil 0.5 – 3.2 // 0.1 – 2.5 0.7 – 3.0 // 0.1 – 1.6 0.5 – 3.7 // 0.2 – 1.5 Agropedology
C/N Topsoil // subsoil 6 – 25 // 7 – 12 3 – 16 // 8 – 17 6 – 27 // 15 - 23
Cd (mg/kg) Topsoil // subsoil 0 – 1.9 // 0 – 1.2 0 – 1.8 // 0 – 1.8 1.6 – 4.0 // 1.8 – 2.3
Cu (mg/kg) Topsoil // subsoil 61.2 – 103.6 // 37.8 – 105.8 25 – 217.5 // 26.8 – 218.2 129.3 – 177.6 // 107.8 – 158.3
Pb (mg/kg) Topsoil // subsoil 35.2 – 212.4 // 33.4 – 57.0 30.9 – 82.8 // 41.1– 91.0 87.6 – 181.6 // 89.2 – 116.8 Environmental
Zn (mg/kg) Topsoil // subsoil 77.1 – 129.5 // 42.7 – 91.7 43.1 – 162.8 // 15.7 – 158.2 82 – 220.3 // 74.6 – 176.3
Limiting factors Redox reaction - Relief/pH
Reference toposequences 1 6 7 15 16 17
Elevation exaggeration: 5 times
West East
Lacustrine unit Transition unit Mountain unit
basalt

NATURAL TE CONTENTS AND ANTHROPOGENIC CONTAMINATION OF SOILS
120

121
V: SOIL ASSESSMENT AND TRANSFER FROM SOILS TO
VEGETABLES
5.1. INTRODUCTION.............................................................................................122 5.2. MATERIALS AND METHODS......................................................................122 5.3. RESULTS...........................................................................................................125
5.3.1. Soil assessment .........................................................................................125 5.3.2. Trace element contents in plant and plant assessment ..............................128 5.3.3. Relationships between soil and plant total trace element contents ...........132 5.3.4. Soil available trace elements and trace element sequential extraction fractions...............................................................................................................133 5.3.5. Relationships between available trace elements and trace element sequential extraction fractions in soil and trace element contents in the eaten part of Chinese cabbage .............................................................................................141
5.4. DISCUSSION ....................................................................................................146 5.4.1. Relationship between soil assessment and plant assessment ....................146 5.4.2. Bioavailability of trace elements from soils to vegetables .......................150
5.5. CONCLUSIONS ...............................................................................................152


SOIL ASSESSMENT AND TRANSFER FROM SOILS TO VEGETABLES
122
5.1. INTRODUCTION Trace elements (TE) in soil originate from natural sources and anthropogenic activities (Nan Z.R.,
et al., 2002; Michalska & Asp, 2001). Especially in periurban intensive vegetable garden soils, TE
contents in soil increase with agricultural practises (Yusuf, et al., 2003; Jansson & Oborn, 2000).
In order to guarantee human health, it is necessary to assess soil quality and vegetable security.
Soil assessment and vegetable assessment have been described in Section 2.5.
Contaminated soil and plant assessments have been undertaken in several periurban vegetable
production areas around some major Chinese cities, such as Beijing, Shanghai and Naijing (Wang
Y.G. & Zhang S.R., 2001; Zhang Q.L., et al., 2005). Chenggong County, located near Kunming
City, is an important vegetable production area in Yunnan Province. By field investigation, this
part of the research aims to: 1) assess soil and vegetable TE contents, according to Chinese legal
thresholds, and 2) evaluate the potential transfers of TE from soils to vegetables.
5.2. MATERIALS AND METHODS In order to assess the degree of soil contamination by TE, total TE contents of topsoil samples
were measured, as described in Section 4.3.2. Signal index of contamination (Pi) and integrative
index of contamination (P) of TE, described in Section 2.5.3, have been used according to soil
quality standard values in China (GB15618-1996 and HJ332-2006). Vegetables growing in various
conditions of soil contamination are compared in terms of TE contents.
Vegetable sampling
TE contents were measured in seven vegetable species (63 samples), including cauliflower, celery,
lettuce, tomato, radish, Chinese cabbage and peas (6 fields for each and 27 fields for Chinese
cabbage samples) (Figure 5.1, Annex 5.2). Chinese cabbage, cauliflower and celery are very
important in terms of the most often consumed vegetables. Chinese cabbage is retained because of
its strong accumulation of TE (Wang Y.G. & Zhang S.R., 2001; Chen H.M., et al., 2006),
especially Cd, and its enormous consumption by the Chinese. Lettuce, tomato and radish are
interesting because they are representative of plants differently consumed, stem, fruit and roots,
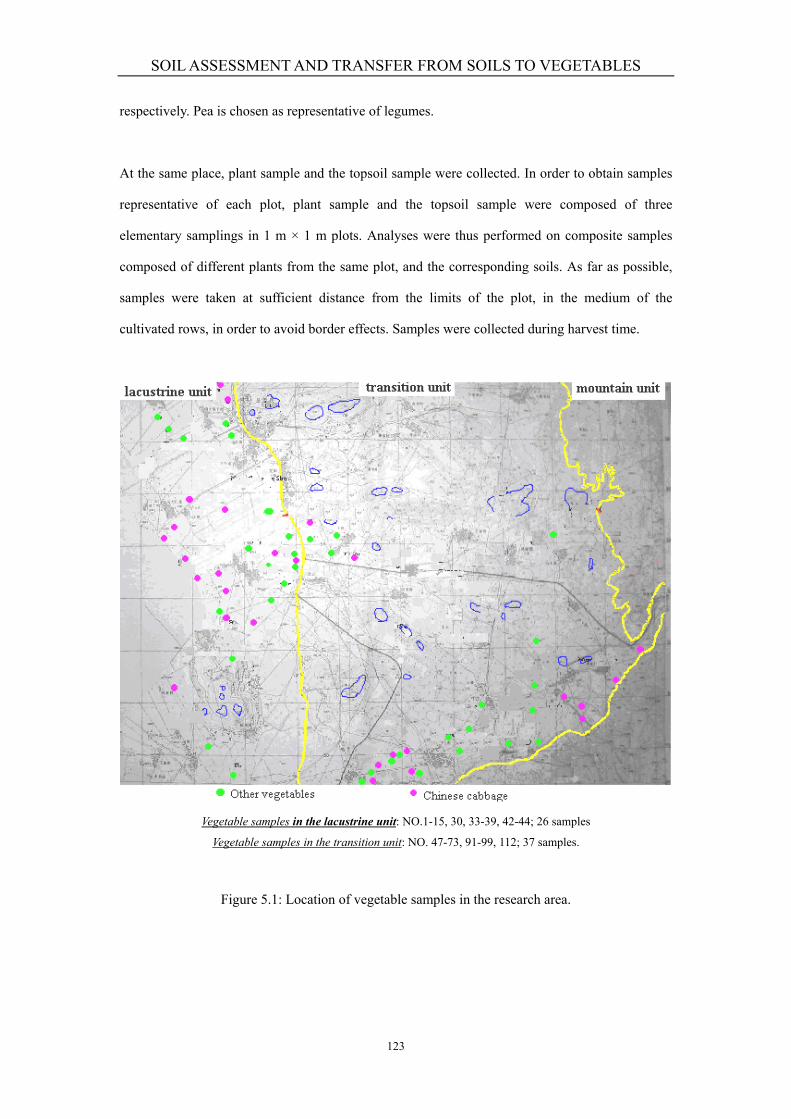
SOIL ASSESSMENT AND TRANSFER FROM SOILS TO VEGETABLES
123
respectively. Pea is chosen as representative of legumes.
At the same place, plant sample and the topsoil sample were collected. In order to obtain samples
representative of each plot, plant sample and the topsoil sample were composed of three
elementary samplings in 1 m × 1 m plots. Analyses were thus performed on composite samples
composed of different plants from the same plot, and the corresponding soils. As far as possible,
samples were taken at sufficient distance from the limits of the plot, in the medium of the
cultivated rows, in order to avoid border effects. Samples were collected during harvest time.
Vegetable samples in the lacustrine unit: NO.1-15, 30, 33-39, 42-44; 26 samples
Vegetable samples in the transition unit: NO. 47-73, 91-99, 112; 37 samples.
Figure 5.1: Location of vegetable samples in the research area.

SOIL ASSESSMENT AND TRANSFER FROM SOILS TO VEGETABLES
124
Preparation of vegetable samples
Vegetable samples were separated in the two parts, i.e. eaten part and non-consumed part (Table
5.1). Each part was washed three times with tap water, in order to remove soil particles at the
surface, so that only the fraction incorporated in plant tissues was taken into account when
analysing TE contents. The composite sample was cut into small pieces, dried at 105 °C for 1 h,
and at 65-70°C for 2 days, until it could be ground to powder with a glass pestle in a porcelain
mortar.
Table 5.1: Presentation of eaten parts and non-consumed parts of the vegetables
Vegetables Eaten parts Non-consumed parts Cauliflower The flower The leaves and lignin-rich skin of the floral
peduncle Celery The tender parts of the stem The leaves and the fibrous parts of the stem Chinese cabbage The tender leaves The exterior leaves Lettuce The stem The leaves Pea The seeds and the pods The leaves Radish The root The leaves Tomato The fruit The leaves and the stem
Determination methods
Trace element contents in vegetable: Dry ash method (GB/T 5009.12, 13, 14, 15-1996)
10 g of plant powder in a 100 ml quartz-beaker, put in muffle furnace, increase the temperature to
200°C, for 1 hour, then to 560°C for 12 hours. l0 ml HClO4 : HNO3 (1:1) are added when ash is
cooled down. Ashes are dried, cooled and add 5 ml 1 N HCl to dissolve the deposition. After
cooling, samples are filtered through filter paper and diluted to 50 ml with deionized water. Then
they are analysed by graphite furnace atomic absorption spectrometry.
Statistical analysis
The general description data are analysed with descriptive statistics and expressed as means using
Excel 2003 and STATISTICA 6.0. The regression analysis is carried out for linear models of TE
contents and other factors by SPSS and XLSTAT at P <0.05 or P <0.01 levels. Only significant
relationships are considered.

SOIL ASSESSMENT AND TRANSFER FROM SOILS TO VEGETABLES
125
5.3. RESULTS
5.3.1. Soil assessment
General approach of the research area
Two sets of data are used for soil assessment. One set of data (SA) is from topsoil samples of the
regional approach, the other set of data (SB) is selected for corresponding plants. First, 88 topsoil
samples are used for general soil assessment of Pb, Cu and Zn and 130 topsoil samples for Cd
(SA). Mean TE contents in topsoil are 2-7 times of mean TE contents in world soils (Figure 5.2,
Table 3.3). Especially, the ratio of mean Cd and Cu contents in topsoil to that in world soils are 7.5
and 5.6, respectively, which show that the most serious problematical elements could be Cd and
Cu. Compared to mean TE contents in Kunming soils (Table 3.3), the ratio is still >1, especially
Cd and Cu (>2) (Figure 5.2).
012345678
Pb Cd Cu Zn
Rat
io
Ratio of total content to that in world soilsRatio of total content to that in Kunming soils
Figure 5.2: Ratio of mean total TE contents in topsoil to that in world and Kunming soils.
Pi and P of topsoil TE are also considered for soil TE contamination assessment according to
Chinese standard values (GB15618-1996). The results are shown in Table 5.2 and Annex 5.1.
Pb: Comparing to soil quality standard values of Pb (Table 2.7), Pb contents in the research area
are lower than standard in level II, which indicates a low contaminated level. Mean Pi (1.09) and
median Pi (1.07) of Pb are <2, ranging from 0.77-1.83, confirm this low contamination level.
Cd: Cd contents present great variability. Mean Pi of Cd is 1.03, which corresponds to a low

SOIL ASSESSMENT AND TRANSFER FROM SOILS TO VEGETABLES
126
contaminated level, even if there are some samples with medium or high contaminated levels.
Cu: Cu contents are close to standard value of class III. Mean Pi (2.24) and median Pi (2.01) of
Cu are >2, corresponding to medium contaminated level. Considering the distribution of Cu, high
Pi for some samples are found in the research area.
Zn: Pi of Zn is similar to Pi of Pb. Mean (1.07) and median (1.05) Pi for Zn are <2. Soil
contamination by Zn does not appear very serious.
The integrative index of contamination (P) of TE is 5.94 (Table 5.2), which indicates high
contaminated level. The main contaminating elements are Cd and Cu. High P of TE in soil is due
to high Cd and Cu contents.
Table 5.2: Soil TE contamination assessment in the research area Signal index of contamination (Pi)
Unit Statistic
Pb Cd Cu Zn N
Median 1.05 0 2.01 1.05 Mean 1.09 1.03 2.24 1.07 Min 0.77 0 0.59 0.43
All
Max 1.83 8.29 4.03 1.92
88
Median 1.05 0.20 1.86 1.04 Mean 1.09 0.98 1.87 1.03 Min 0.77 0 0.59 0.53
Lacustrine unit
Max 1.83 5.29 2.80 1.92
31
Median 1.08 0 2.15 1.01 Mean 1.08 0.82 2.42 1.07 Min 0.84 0 0.71 0.43
Transition unit
Max 1.22 5.12 4.03 1.57
47
Median 1.09 0 2.21 1.18 Mean 1.16 1.83 2.52 1.18 Min 1.03 0 1.65 0.73
Mountain unit
Max 1.68 8.29 3.81 1.80
10
Integrative index of contamination (P)
5.94 88
Non contamination; Low contaminated level; Medium contaminated level; High contaminated level;
Then, taking into account 63 vegetable samples, SB is used to assess soil contamination. Mean Pi
of TE is for Pb: 1.19 (1-1.76), Cd: 1.88 (0-4.55), Cu: 1.91 (0.56-4.03) and Zn: 1.33 (0.52-2.04)

SOIL ASSESSMENT AND TRANSFER FROM SOILS TO VEGETABLES
127
(Annex 5.1). As far as SA, Pi of Pb, Cd, Cu and Zn is <2, and corresponds also to low
contaminated level by these elements, according to soil quality standard values (GB15618-1996).
The value of P=3.41, indicates a high contaminated level due to some samples with high Cd and
Cu contents. Meanwhile, based on Farmland Environmental Quality Evaluation Standards for
Edible Agricultural Production for vegetable production (HJ 332-2006), some 60.3% of samples
exceed the standard value of soil for vegetable growth for Pb (50 mg/kg), 58.7% for Cd (0.3
mg/kg), 73.0% for Cu (50 mg/kg) and 9.5% for Zn (200 mg/kg).
Differences between the three units
Considering the different units, ratios of Cd and Cu to that in world soils are higher in the
mountain unit than in the transition unit and lacustrine unit (M>T>L), and ratios of Pb and Zn to
that in world soils in the three units are similar (Figure 5.3). Mean Cd contents are 11.7 times of
world soils and 3.9 times of Kunming soils in the mountain unit and 7.2 times and 2.4 times in the
lacustrine unit. Ratio of total Zn contents to Kunming soils is ~1.3 times in the three units, just
close to the background value in Kunming Prefecture.
Figure 5.3: Ratio of mean total TE content in topsoil in the three units to that in world and
Kunming soils.
Pi gradients for Cd and Cu follow the order: mountain unit>transition unit>lacustrine unit
(M>T>L). Pi of Pb and Zn is between 1-2, and is similar in the three units (Figure 5.4).

SOIL ASSESSMENT AND TRANSFER FROM SOILS TO VEGETABLES
128
Figure 5.4: Pi of Pb, Cd, Cu and Zn in the three units.
5.3.2. Trace element contents in plant and plant assessment
A: Eaten part
Vegetables: 63 samples, including 27 Chinese cabbage samples, are taken to assess plant TE
contents. TE contents refer to fresh materials (FM) in order to compare to Chinese standard values
for vegetables.
Pb: Pb contents range between 0.08-4.12 mg/kg FM (Table 5.3). Some 95.2% of samples both in
the lacustrine and transition units exceed the standard value for Pb (0.2 mg/kg FM,
GB14935-1994) in vegetables. There are some differences between the vegetables: the highest Pb
contents are in cauliflower (2.64 mg/kg FM), and the lowest in tomato (0.27 mg/kg FM) (Figure
5.5).

SOIL ASSESSMENT AND TRANSFER FROM SOILS TO VEGETABLES
129
Table 5.3: TE contents in the eaten part of vegetables (mg/kg FM) (n=6) Vegetables Statistic Pb Cd Cu Zn
Mean 0.45 0.02 5.88 10.60 Celery
Range 0.28 - 0.73 0.01 - 0.05 3.48 - 6.88 6.48 - 15 Mean 0.33 0.03 0.97 3.45
Chinese cabbage* Range 0.22 - 0.96 Trace - 0.13 0.23 - 5.19 1.74 - 14.16 Mean 0.37 0.04 5.42 5.03
Lettuce Range 0.09 - 0.58 Trace - 0.16 1.53 - 9.26 1.37 - 13.35 Mean 0.79 0.03 8.58 9.53
Radish Range 0.08 - 1.25 Trace - 0.06 3.20 - 18.60 5.20 - 13.70 Mean 1.05 0.01 17.35 19.30
Pea Range 0.10 - 2.26 Trace - 0.05 5.92 - 27 7.84 - 32.32 Mean 0.27 0.01 0.65 2.69
Tomato Range 0.20 - 0.37 Trace - 0.01 0.60 - 0.77 0.73 - 5.78 Mean 2.64 0.01 16.62 8.41
Cauliflower Range 1.26 - 4.12 Trace - 0.04 9.37 - 23.36 2.04 - 16.48
China standard values for vegetables ≤0.2 ≤0.05 ≤10 ≤20 * n=27 for Chinese cabbage.
Figure 5.5: TE mean contents in the eaten part of vegetables.
Cd: Cd contents range between trace and 0.16 mg/kg FM. Some 9.5% of samples exceed the
standard value for Cd(0.05mg/kg FM, GB15201-1994) in vegetables, these samples are located in
the lacustrine unit. The highest Cd contents are in lettuce and Chinese cabbage, and the lowest in
tomato (0.01 mg/kg FM) (Figure 5.5).
Cu: Cu contents range between 0.60-27.00 mg/kg FM. Some 19.1% of samples exceed the
standard value for Cu (10 mg/kg FM, GB15199-1994) in vegetables; these samples are located in
the transition unit. The highest Cu contents are in pea (17.35 mg/kg FM), and the lowest in tomato
(0.65 mg/kg FM) (Figure 5.5).

SOIL ASSESSMENT AND TRANSFER FROM SOILS TO VEGETABLES
130
Zn: Zn contents range between 0.73-32.32 mg/kg FM. Some 3.2% of samples in the lacustrine
unit exceed the standard value for Zn (20 mg/kg FM, GB13106-1991) in vegetables. The highest
Zn contents are in pea (19.30 mg/kg FM), and lowest in tomato (2.69 mg/kg FM) (Figure 5.5).
For eaten parts, the highest TE contents are found in:
Cauliflower for Pb.
Lettuce and Chinese cabbage for Cd.
Pea for Cu and Zn.
While, the lowest TE contents are found in tomato.
Chinese cabbage: Mean TE contents are 0.33 mg/kg FM (0.22-0.96 mg/kg FM) for Pb, 0.03
mg/kg FM (trace-0.13 mg/kg FM) for Cd, 0.97 mg/kg FM (0.23-5.19 mg/kg FM) for Cu and 3.45
mg/kg FM (1.74-14.16 mg/kg FM) for Zn (Annex 5.2).
Pb contents of 100% of cabbages located in the lacustrine and transition units are higher than the
standard value (0.2 mg/kg FM). Some 11.1% of cabbages (3 samples from the lacustrine unit)
present Cd contamination. Cu and Zn contents in cabbages are lower than standard values of Cu
and Zn. TE contents for the eaten part of Chinese cabbage in the lacustrine unit are higher than in
the transition unit (L>T) (Figure 5.6).

SOIL ASSESSMENT AND TRANSFER FROM SOILS TO VEGETABLES
131
Figure 5.6: TE contents (mg/kg FM) in the eaten part of Chinese cabbage in the lacustrine and
transition units
B: Non-consumed part
TE contents range between 0.02-5.28 mg/kg FM for Pb, trace-0.93 mg/kg FM for Cd, 1.44-38.46
mg/kg FM for Cu and 1.17-29.23 mg/kg FM for Zn (Table 5.4). Some 91.7% of samples for Pb
and 83.3% for Cd exceed the standard values for vegetables, 22.2% for Cu and 19.4% for Zn. The
contamination by Pb and Cd are very serious in the non-consumed part of vegetables (Table 5.4,
Annex 5.3).

SOIL ASSESSMENT AND TRANSFER FROM SOILS TO VEGETABLES
132
Table 5.4: TE contents in the non-consumed part of vegetables (mg/kg FM) (n=6) Vegetables Statistic Pb Cd Cu Zn
Mean 0.49 0.35 7.18 19.50 Celery
Range 0.02 - 0.69 0.01 - 0.68 6.54 - 7.92 6.46 - 23.74 Mean 0.44 0.15 3.76 4.72 Chinese
cabbage Range 0.29 - 1.00 0.11 - 0.30 1.44 - 6.99 1.78 - 12.07 Mean 1.06 0.06 10.29 7.51
Lettuce Range 0.18 - 2.20 Trace - 0.19 3.22 - 14.46 1.17 - 11.05 Mean 1.20 0.58 10.37 11.70
Radish Range 0.04 - 2.06 0.42 - 0.70 4.80 - 20.49 4.81 - 17.73 Mean 1.89 0.13 26.12 18.16
Pea Range 0.78 - 2.83 0.03 - 0.33 9.42 - 38.46 8.10 - 29.34 Mean 4.05 0.49 4.35 11.41
Tomato Range 2.68 - 5.28 0.12 - 0.93 2.46 - 5.20 10.29 - 12.82 Mean 2.07 0.12 17.00 9.44
Cauliflower Range 0.99 - 2.91 0.01 - 0.33 8.51 - 33.83 5.63 - 11.19
5.3.3. Relationships between soil and plant total trace element
contents
When the whole of Chinese cabbage samples are analysed, there is no significant correlation
between total Pb and Cu contents in soil and in the eaten part of Chinese cabbage. Cd and Zn
contents in Chinese cabbage increase with Cd and Zn contents in soil, and significant positive
linear relationships are observed (Cd: Y=0.42+0.88x, F=5.64, R2=0.184, sig.f=0.026, n=21; Zn:
Y=-66.01+0.94x, F=16.13, R2=0.392, sig.f<0.001, n=21) (Figure 5.7). Even if significant, these
correlations are weak. Available TE and TE sequential extraction fraction (SEF) in soil should
better assess TE transfer from soil to plants.

SOIL ASSESSMENT AND TRANSFER FROM SOILS TO VEGETABLES
133
Figure 5.7: Relationships between contents of Cd and Zn in soil and in Chinese cabbage.
5.3.4. Soil available trace elements and trace element sequential
extraction fractions
Some 21 topsoil samples of Chinese cabbage fields are chosen within the lacustrine and transition
units to analyse available TE and TE contents of sequential extraction fractions (SEF: A, B and C)
(Annex 5.2). A-fraction is acetic-acid extractable TE, which includes soluble, exchangeable and
carbonate bound TE. B-fraction is hydroxylamine hydrochloride extractable TE, which includes
Fe-Mn oxide bound and a part of organic bound TE. C-fraction is hydrogen peroxide and
ammonium acetate extractable TE, which is partly organic bound TE.

SOIL ASSESSMENT AND TRANSFER FROM SOILS TO VEGETABLES
134
A. Available contents of trace elements
The mean available TE contents are 7.4 for Pb, 0.19 for Cd, 16.9 for Cu, and 12.2 mg/kg for Zn
(Table 5.5).
Table 5.5: Available TE contents (mg/kg) in soils for Chinese cabbage growing
Unit Statistic Pb Cd Cu Zn N
Mean 9.3 0.21 14.3 15.3 Lacustrine
unit Range 6.2 - 16 0.11 - 0.56 8.1 - 20 6.5 - 43 11
Mean 5.3 0.16 19.7 8.8 Transition
unit Range 4.1 - 6.6 0.10 - 0.23 18 - 23 6.8 - 14 10
Mean 7.4 0.19 16.9 12.2 All
Range 4.1 - 16 0.10 - 0.56 8.1 - 23 6.5 - 43 21
The mean available contents of Pb, Cd and Zn in the lacustrine unit are higher than in the
transition unit (L>T). We observe high available Pb and Zn contents in certain places of the
lacustrine unit including the highest Pb content (16 mg/kg). Distribution areas of high available Cd
and Cu are found in both units. Nevertheless, the mean available Cu contents in the lacustrine unit
are lower than in the transition unit (T>L) (Annex 5.2, Figure 5.8). Therefore, the available Pb, Cd
and Zn contents are higher in the lacustrine unit than in the transition unit (L>T), and inversely for
Cu (T>L).

SOIL ASSESSMENT AND TRANSFER FROM SOILS TO VEGETABLES
135
Figure 5.8: Available TE contents in topsoil in the lacustrine and transition units.
B. Trace element contents of sequential extraction fractions
Pb: The mean contents are 1.38 mg/kg for A, 6.53 mg/kg for B and 5.80 mg/kg for C fractions
(Table 5.6, Annex 5.2), with the B-fraction higher than the C- and A-fractions (B>C>A) (Figure
5.9).

SOIL ASSESSMENT AND TRANSFER FROM SOILS TO VEGETABLES
136
Table 5.6: SEF TE contents (mg/kg) in soil for Chinese cabbage growing
Pb Cd Cu Zn Unit Statistic
A B C A B C A B C A B C N
Mean 1.4 6.3 5.3 0.08 0.16 0.05 1.2 2.2 13.9 2.1 17.1 15.8 L*
Range 0.7 - 2.6
3.5 - 12.1
1.6 - 8.9
0.07 - 0.09
0.11 - 0.22
0.02 - 0.1
1.0 - 1.5
0.8 - 4.4
6.2 - 26.4
0.4 - 12
8.5 - 44
9.9 - 38.9
11
Mean 1.4 6.8 6.3 0.05 0.11 0.04 1.3 7.2 23.4 1.6 15.8 24.4 T
Range 0.7 - 2.9
4.2 - 10
4.6 - 11.3
0 - 0.07
0.08 - 0.16
0.01 - 0.08
1.0 - 1.5
5.5 - 9.5
0.4 -3 0.6
1.0 - 2.8
13.3 - 20
18.9 - 32
10
Mean 1.34 6.5 5.8 0.06 0.13 0.05 1.3 4.6 18.4 1.9 16.5 19.9 All
Range 0.7 - 2.9
3.5 - 12.1
1.6 - 11.3
0 - 0.09
0.08 - 0.22
0 - 0.10
1.0 - 1.5
0.8 - 9.5
0.4 - 30.6
0.4 - 12
8.5 - 44
9.9 - 38.9
21
*L: lacustrine unit; T: transition unit.
Figure 5.9: Percentage of TE contents of A, B, C fractions in soils.
The mean A-Pb contents in the lacustrine unit are close to that in the transition unit. The mean
B-Pb contents in the lacustrine and transition units do not show significant differences. High C-Pb
contents are found in both units (Figure 5.10). Thus, there is no significant difference between Pb
fractions in both units.

SOIL ASSESSMENT AND TRANSFER FROM SOILS TO VEGETABLES
137
Figure 5.10: SEF contents of Pb in topsoil in the two units.
Cd: The mean contents are 0.06 mg/kg for A, 0.13 mg/kg for B and 0.045 mg/kg for C-fractions
(Table 5.6, Annex 5.2). The highest content fraction is B-fraction, followed by A and C-fractions
(B>A>C), which is suggested differences in bioavailability (Figure 5.9). Mean A and B-fraction
contents in the lacustrine unit are higher than in the transition unit. High Cd contents of C-fraction
are found in both units (Figure 5.11).

SOIL ASSESSMENT AND TRANSFER FROM SOILS TO VEGETABLES
138
Figure 5.11: SEF contents of Cd in topsoil in the two units.
Cu: The mean contents are 1.25 mg/kg for A, 4.57 mg/kg for B and 18.4 mg/kg for C-fractions
(Table 5.6). The highest Cu content part is C-fraction, followed by the B and A-fractions (C>B>A)
(Figure 5.9). The SEF Cu contents in the transition unit are higher than in the lacustrine unit
(Figure 5.12). High Cu contents of A and B-fractions are near Dianchi Lake, and high Cu contents
in C fractions are found in both units.

SOIL ASSESSMENT AND TRANSFER FROM SOILS TO VEGETABLES
139
Figure 5.12: SEF contents of Cu in topsoil in the two units.
Zn: The mean Zn contents are 1.85 mg/kg for A, 16.49 mg/kg for B and 19.89 mg/kg for
C-fractions (Table 5.6, Table 5.6). The highest Zn content part is C-fraction, followed by the B and
A-fractions (C>B>A) (Figure 5.9). The mean A and B-fraction contents in the lacustrine unit are
higher than in the transition unit. Mean C-fraction contents in the transition unit are higher than in
the lacustrine unit, and high Zn contents of C-fraction are found in both units (Figure 5.13).

SOIL ASSESSMENT AND TRANSFER FROM SOILS TO VEGETABLES
140
Figure 5.13: SEF contents of Zn in topsoil in the two units.
Therefore, the A-fraction TE contents are higher in the lacustrine unit than in the transition unit
(L>T), except for Cu (T>L). High contents of A-fraction are found more often in the lacustrine
unit. As for the available TE contents, anthropogenic activities are still continuing as a source of
TE in topsoil. High B-fraction contents are observed in the transition unit and the high contents of
C-fraction are found in both units.

SOIL ASSESSMENT AND TRANSFER FROM SOILS TO VEGETABLES
141
5.3.5. Relationships between available trace elements and trace
element sequential extraction fractions in soil and trace element
contents in the eaten part of Chinese cabbage
When relationships between available TE and SEF TE contents in soil and TE contents in Chinese
cabbage are analysed, significant linear relationships are found.
Pb: Globally, a significant negative relationship between Pb in Chinese cabbage and B-fraction Pb
contents in soil is observed. A similar relationship is observed in the lacustrine unit. But there is no
significant relationship between Pb contents in Chinese cabbage and SEF Pb contents in soil in the
transition unit (Table 5.7, Figure 5.14). It is suggested that the Fe-Mn oxide concretions in soil
could trap Pb and reduce plant absorption.
Figure 5.14: Relationships between Pb contents in Chinese cabbage and B-fraction Pb contents in soil.
Cd: There is a significant positive relationship between Cd contents in Chinese cabbage and
available Cd contents in soil. In the lacustrine unit, the correlation between available Cd and
vegetable Cd is also very strongly significant (Table 5.7, Figure 5.15, Annex 5.4). But, when the
sample with the highest available Cd is not considered, the relationship is not significant. No
significant relationship between Cd contents in Chinese cabbage and SEF Cd fractions in soil is
observed.

SOIL ASSESSMENT AND TRANSFER FROM SOILS TO VEGETABLES
142
Figure 5.15: Relationships between Cd contents in Chinese cabbage
and available Cd contents in soil.
Cu: Globally, no significant relationship between Cu content in Chinese cabbage and SEF Cu in
soil is observed. There is a significant positive relationship between B-fraction contents in soils
and Cu contents in Chinese cabbage in the lacustrine unit. A significant positive relationship
between C-fraction and Cu in Chinese cabbage is also observed in the lacustrine unit, when a
sample with high Cu content (7.7 mg/kg) is excluded (Table 5.7, Figure 5.16, Annex 5.4). No
significant relationship in the transition unit is observed. It is suggested that B and C-fraction in
soil could be absorbed by Chinese cabbage and thus become bioavailable.

SOIL ASSESSMENT AND TRANSFER FROM SOILS TO VEGETABLES
143
Figure 5.16: Relationships between Cu contents in Chinese cabbage and SEF Cu contents in the
lacustrine unit.
Zn: Significant positive relationships between Zn content in Chinese cabbage and available Zn
contents, A-fraction and B-fraction contents in soil are observed, but no significant relationship is
observed when the highest Zn content (4.2 mg/kg) is excluded in Chinese cabbage. Similar
relationships are observed in the lacustrine unit, besides a positive relationship between Zn
contents in Chinese cabbage and C-fraction (Table 5.7, Figure 5.17, Figure 5.18, Annex 5.4). No
significant relationship is observed in the transition unit. It is also suggested that B and C-fractions
in soil could be absorbed by Chinese cabbage and thus become bioavailable.
Figure 5.17: Relationships between Zn contents in Chinese cabbage
and available Zn contents in soil.

SOIL ASSESSMENT AND TRANSFER FROM SOILS TO VEGETABLES
144
Figure 5.18: Relationships between Zn contents in Chinese cabbage and SEF Zn contents in soil. Table 5.7: Relationships between TE fractions contents in soil and TE contents in Chinese cabbage
TE (Y) Unit Fraction in soil (X) Equation F R2 Sig.f N All* B fraction Y=6.70-0.16X 11.027 0.367 0.004 21
Pb Lacustrine B fraction Y=6.83-0.16X 7.372 0.450 0.024 11 All Available Y=0.11+2.04X 27.744 0.594 <0.001 21
Cd Lacustrine Available Y=0.093+2.10X 16.726 0.650 0.003 10
B fraction Y=4.32+0.59X 5.302 0.371 0.047 11 Cu Lacustrine
C fraction Y=4.39+0.075X 5.326 0.401 0.049 10 Available Y=22.23+2.37X 32.819 0.633 <0.001 21 A fraction Y=34.08+9.24X 37.477 0.664 <0.001 21 All B fraction Y=2.21+2.79X 36.673 0.659 <0.001 21 Available Y=19.84+2.50X 26.399 0.746 <0.001 11 A fraction Y=37.87+9.52X 49.418 0.846 <0.001 11 B fraction Y=6.18+3.03 41.139 0.820 <0.001 11
Zn
Lacustrine
C fraction Y=-3.88+3.92X 59.230 0.868 <0.001 11 * All Chinese cabbage samples in the lacustrine and transition units.
These results show that available and B-fraction TE contents in soil present the most satisfactory
relationships with plant contents. However, relationships between available TE and total TE are
weak for Pb and Zn, if high results are excluded (Figure 5.19, Annex 5.4).

SOIL ASSESSMENT AND TRANSFER FROM SOILS TO VEGETABLES
145
Figure 5.19: Relationships between total and available TE contents in soil.
Plants only can absorb the bioavailable fractions of TE in soils. The correlation analyses show that
different fractions of TE have different contributions to TE contents in Chinese cabbage. These
observations underline the fact that it is very important to take into account total, available and
SEF contents of TE in soil to understand the accumulation of TE in vegetables.
The available and SEF contents of TE in soils could influence TE contents in vegetables,
especially in Chinese cabbage. Pb contents in Chinese cabbage decrease with B-fraction Pb
contents in soil. Cd and Zn contents in Chinese cabbage increase with available contents of Cd and
Zn in soil. The B and C-fractions seem to increase the absorption of Cu and Zn by vegetables.
Bioavailability of TE of course could be influenced by soil characteristics, such as pH, organic
matter content and soil texture.

SOIL ASSESSMENT AND TRANSFER FROM SOILS TO VEGETABLES
146
5.4. DISCUSSION
5.4.1. Relationship between soil assessment and plant assessment
Trace element contents in vegetables and plant assessment
There are some differences of TE contents among vegetables. The highest TE content in
cauliflower is Pb, Cd in lettuce and Chinese cabbage, Cu and Zn in pea. But the lowest Pb, Cd, Cu
and Zn contents are in tomato. Different species of vegetables show different TE accumulation
ability. In this investigation, leaf vegetables easily absorb Cd, and legumes accumulate Cu and Zn.
The order of accumulation ability depends on species and varieties. Moreover, Pb, Cd, Cu and Zn
contents in Chinese cabbage samples seem to be different from one land unit to another. Samples
with Pb, Cd and Zn contents in Chinese cabbage exceed of standard value are in the lacustrine unit,
which is consistent with high soil available Pb, Cd and Zn contents in the lacustrine unit.
Moreover, samples with Cu contents exceeding standard values are located in the transition unit,
which is consistent with high soil available Cu contents in this unit.
In order to understand the effect of agricultural practises on TE accumulation in the research area
of Chenggong County, questionnaires were distributed to farmers (21 families) who planted
Chinese cabbage in the 21 plots in the research area in 2006. The results show that the cultivated
area for a family is limited (0.03-0.45 ha), most (52.4%) of families cultivated area between
0.05-0.08 ha. Rotations include 3-4 cultures each year, mainly: Chinese
cabbage-celery-cabbage-spinach, Chinese cabbage-cabbage-celery-flowers, Chinese
cabbage-celery-Chinese cabbage-celery. The yields of Chinese cabbage range between
30,000-112,500 kg/ha, most (76.2%) of them are >45,000 kg/ha. The irrigation water is from
Dianchi Lake in the lacustrine unit and from wells in the transition unit. More attention should be
paid to the quality of irrigation water.
Due to this intensive system, pesticides and fertilizers are important. Pesticides are sprayed 2-3
times per culture. Application rate of compound fertilizers (mainly 15-15-15) are 750-1,125 kg/ha.
The main single inorganic fertilizers are urea and super-phosphate. Organic fertilizers are mainly
cow manure and pig manure, at a rate ranging between 11,250-82,500 kg/ha, most (57.1%) of

SOIL ASSESSMENT AND TRANSFER FROM SOILS TO VEGETABLES
147
them being 33,750-60,000 kg/ha (Table 5.8). From questionnaire answers, it seems that the
numbers of pesticide application and fertilizer rate per culture in the lacustrine unit are higher than
in the transition unit. Anthropogenic activities should be relative to high TE contents, especially in
the lacustrine unit.
Table 5.8: Agricultural practice information for planting Chinese cabbage in Chenggong County
Yield (kg/ha) Fertilizers (kg/ha)
Inorganic Unit No. Crop rotation system (times/year)
Chinese cabbage
Intercropping vegetable
Irrigation water
Pesticides (times/growing season) Compound Single
Organic
30 4 63,750 48,750 Dianchi Lake 4 - 5 750 525 (urea) 22,500
33 4 46,500 39,000 Dianchi Lake 1 750 300 (urea) 11,250
34 3 - 4 63,000 68,000 Well 2 - 3 750 1,200 (super-phosphate)
37,500 (cow manure)
35 3 - 4 63,000 69,000 Dianchi Lake 2 - 3 750 1,200 (super-phosphate)
15,000 (cow manure)
36 4 63,000 49,500 Dianchi Lake 2 - 3 1125 No 15,000 (cow manure)
37 4 - 5 112,500 33,750 Dianchi Lake 1 1125 2,250 (super-phosphate)
18,750 (cow manure)
38 4 63,750 48,750 Dianchi Lake 3 - 4 750 No 15,000 39 4 63,000 49,500 Dianchi Lake 1 750 No 11,250 42 3 - 4 75,000 75,000 Well 2 - 3 525 375 (urea) 33,750 43 4 56,250 60,000 Dianchi Lake 1 1850 No 82,500
L*
44 4 37,500 30,000 Dianchi Lake 1 375 (urea) 56,250
91 4 37,500 30,000 Well 1 no 975 (ammonium carbonate)
22,500
92 4 42,750 63,000 Well 1 375 975 (potassium nitrate)/ 150 (urea)
37,500
93 4 56,250 41,250 Well 2 525 525 (super-phosphate) /975 (urea)
41,250 (cow manure)
94 4 45,000 37,500 Well 2 375 No 26,250 95 4 30,000 26,250 Well 2 600 No 33,750
96 4 37,500 32,250 Well 1 no 750 (urea)/ 750 (potassium sulphate)
65,625
97 3 75,000 56,250 Well 1 750 525 (urea) 57,000 98 3 - 4 75,000 750,000 Well 1 750 No 52,500
99 3 56,250 37,500 Well 2 750 No 48,750 (cow manure)
T
112 3 45,000 30,000 well 1 no 225 (urea) 56,250 (cow manure)
*L: lacustrine unit; T: transition unit.
For the non-consumed part of vegetables, Pb, Cd, Cu and Zn contents are higher than in eaten
parts. In 91.7% of non-consumed part, Pb contents exceed standard value for vegetables, and
83.3% for Cd, 22.2% for Cu and 19.4% for Zn. The contamination by Cd and Pb are very serious

SOIL ASSESSMENT AND TRANSFER FROM SOILS TO VEGETABLES
148
in the non-consumed part. In Chenggong County, the non-consumed part is used to make
fertilizers or just piled beside the plots or even are used for animal feeding, which should result in
TE using recycled back to the soil. More attention should be paid to the reuse of the
non-consumed part of vegetables.
Relationship between soil assessment and plant assessment
Pb: Pb contamination in all vegetable samples and Chinese cabbage samples is the most serious.
However, proportion of samples which are at Pb suitable (S) level for soil is not consistent with Pb
suitable level in vegetables (Table 5.9, Figure 5.20). So maybe the Pb in vegetables is not just
absorbed from the soil. Pb in vegetables may be come partly from the air, because the road
network and traffic are really important in this area.
Table 5.9: Percentage of samples with TE contents exceeding standard values
Percentage (%) Pb Cd Cu Zn
Soil for vegetables growing 60.3 (38/63)* 58.7 (37/63) 73.0 (46/63) 9.5 (6/63)
Vegetables 95.2 (60/63) 9.3 (8/63) 19.1 (12/63) 3.2 (2/63)
Soil for Chinese cabbage growing 11.1 (3/21) 4.8 (1/21) 100 (21/21) 4.8 (1/21)
Chinese cabbage 100 (21/21) 11.1 (3/21) 0 (0/21) 0 (0/21)
*(Sample numbers exceeding standard value/total sample numbers).
Figure 5.20: Assessment of soils and the eaten part of vegetables in the research area, according to
Chinese standard values (Proportions of samples which are at suitable (S) and not suitable (NOS) levels for
food production (soil) and consumption (plants)).

SOIL ASSESSMENT AND TRANSFER FROM SOILS TO VEGETABLES
149
Cd: A positive relationship is observed between Cd contents in Chinese cabbage and in soil.
However, some 58.7% of samples exceed the standard value (0.3 mg/kg, pH<7.5) of soil for
vegetable production, which is inconsistent with 9.3% of vegetables not suitable with Cd (Figure
5.20). That is suggested that soil Cd present a high potential risk of transfer to vegetables, which is
consistent with high available Cd and A-fraction contents in soil.
Cu: Soil Cu contamination is medium and 19.1% of vegetable samples are higher than the
standard value for Cu. Some 100% of soils with Chinese cabbage samples exceed the standard
value for Cu in soil for vegetable production, but no sample of Chinese cabbage is higher than
standard values for Cu. That means that soil Cu would be the potential source to transfer from
soils to vegetables, though no significant relationship between total Cu contents in soil and Cd
contents in vegetables exists. The proportion of soil samples which are at unsuitable level with Cu
(NOS) is high (Table 5.9, Figure 5.20). The whole of soils corresponding to vegetable production
presents contamination in Cu with a high risk of transfer towards vegetables.
Zn: Positive relationships are observed between Zn contents in vegetables, in Chinese cabbage
and in soils. Assessments of Zn in soil and in vegetables both indicate low contaminated level,
meaning that the assessment of Zn in soil and in vegetables is consistent in the research area.
Assessment methods based on Chinese national thresholds
The integrative index of contamination (P) of TE is >3, due to high Cd and Cu contents, which
indicate high TE contaminated level. P value is very high, because special samples with high Pi of
Cd and Cu led to Pi max being extremely high in the formulation. Pi max is >3 here, in which the
formulation Pi = 3 + (Ci-Xh)/Xh should be used instead of formulation Pi = 3 + (Ci-Xh)/(Xh-Xm)
(Section 2.5.3). It is suggested that the calculated formulation of signal index and integrative index
of contamination should be improved to avoid the effect of extreme samples.
Water content of vegetable also will affect TE contents in fresh materials and vegetable
assessment. For example, the lowest TE contents in tomato link to high water content in tomato

SOIL ASSESSMENT AND TRANSFER FROM SOILS TO VEGETABLES
150
fruit. Therefore, it should be better to express TE threshold values in dry materials. The percentage
of Pb, Cd and Cu at unsuitable level for soils and vegetables are not consistent. The reason may be
relative to standard values for soils and vegetables. Pb standard values in soil for vegetable growth
(50 mg/kg) may be too high for soil of Chinese cabbage production; or too low for Chinese
cabbage (0.2 mg/kg FM). On the contrary, Cd (0.3 mg/kg) and Cu (50 mg/kg) standard values in
soil for vegetable growth may be too low for soil of Chinese cabbage production or too high (Cd
0.05 mg/kg FM; Cu 10 mg/kg FM) for Chinese cabbage. Therefore, modification of standard
values is necessary for Chinese cabbage.
5.4.2. Bioavailability of trace elements from soils to vegetables
Available trace elements and trace element contents of sequential extraction fractions in soils
TE contents in sequential extraction fractions show:
B-fraction contents are higher than C and A-fractions (B>C>A) for Pb and Cd.
C-fraction contents are higher than B and A-fractions (C>B>A) for Cu and Zn.
C-Pb contents excluding the highest (11.3 mg/kg) have positive linear relationship with SOC
(Annex 5.5). It is suggested that organic fertilizers should enhance C-Pb contents. There is no
significant relationship between C-Cd, -Cu and -Zn contents and SOC. That could be due to the
high SOC and application rate of organic fertilizers in the research area.
For geomorphological units, available TE and SEF TE contents show:
Available TE and A-fraction TE contents are higher in the lacustrine unit than in the transition
unit (L>T), except for A-Cu (T>L).
C and B-fraction TE contents are higher in the transition unit than in the lacustrine unit
(T>L).

SOIL ASSESSMENT AND TRANSFER FROM SOILS TO VEGETABLES
151
Relationships between available trace elements and trace element contents of sequential
extraction fractions in soil and trace element contents in vegetables
Pb: A significant negative relationship is observed between Pb in Chinese cabbage and B-Pb in
soil. Fe-Mn oxides could trap Pb in soil and influence Pb bioavailability. C-Pb seems to play the
same role to trap Pb in soil according to PCA (Annex 5.6).
Cd: A significant relationship is observed between Cd contents in Chinese cabbage and available
Cd contents in soil. It is suggested that Cd is easily transferred and Cd contents in Chinese
cabbage is influenced by available Cd. Available Cd is well correlated with SEF Cd, according to
PCA (Annex 5.6).
Cu: According to the national standards for soil quality, the whole of soil for Chinese cabbage
growing presents contamination in Cu with a considerable risk of transfer towards the plants.
Available Cu, B and C-Cu contents are in the same group according to PCA (Annex 5.6).
Significantly positive relationships are observed between Cu contents in Chinese cabbage and B
and C-Cu in soils in the lacustrine unit. That should be related to the soluble organic matter
increasing the mobility and biological activity of TE, for example fulvic acid. B and C-Cu in soil
should be taken into account as a potential source of Cu.
Zn: Significant positive linear relationships are observed between Zn contents in Chinese cabbage
and available and SEF Zn contents in soil. Available Zn, and B-Zn are in the same group
according to PCA (Annex 5.6). It is suggested that TE contents in Chinese cabbage are easily
influenced by Zn contents in soil, and could be influenced by human activities.
The total, available and SEF TE contents in soils could influence TE contents in vegetables,
especially in Chinese cabbage, as follows:
Pb contents in Chinese cabbage decrease as B-Pb increases.
Cd contents in Chinese cabbage increase with soil available Cd increase.
B and C-Cu seem to increase Cu absorption by vegetables, especially in the lacustrine unit.
Zn contents in Chinese cabbage increase with increasing total, available and SEF Zn contents
in soils.

SOIL ASSESSMENT AND TRANSFER FROM SOILS TO VEGETABLES
152
Moreover, Pb, Cd, Cu and Zn contents in Chinese cabbages seem to be different from one land
unit to another. The cabbages in the lacustrine unit absorb more TE than those located in the
transition unit, due to higher available and A-fraction TE contents. In order to assess soil
suitability, available and SEF TE contents better indicate the TE potential risk for vegetables.
Different soil TE fractions could be suggested (√) for soil assessment indicators, according to their
relationships with TE contents in Chinese cabbage (Table 5.10).
Table 5.10: Suggested indicators for soil assessment for Chinese cabbage production
Indicator Pb Cd Cu Zn
Available √ √
A-fraction √
B-fraction √ √ √
C-fraction √
Although significant relationships between available and SEF TE contents in soil and TE contents
in Chinese cabbage exist, estimating TE standard values cannot be suggested using our data. On
the one hand, TE contents in Chinese cabbage exceed standard value for Pb and all are below
standard values for Cu and Zn. On the other hand, the objectives of this research are not to
establish standard values. Thus, it is necessary to make continuous research and obtain new data
sets to establish standard values and to assess their relations with soil characteristics.
5.5. CONCLUSIONS Soil assessment: Total TE mean contents in topsoil are 2-7 times of TE contents in world soils and
higher than in Kunming soils.
The Pi of Pb, Zn and Cd are <2, indicating low contaminated level, and it is similar in the three
units. Pi of Cu >2 indicates medium contaminated level for all soil samples and <2 indicates low
contaminated level in soil corresponding to vegetable samples. Some samples with high Pi of Cd
and Cu are observed, and found in the three units. Pi gradient of Cd and Cu is mountain
unit>transition unit>lacustrine unit (M>T>L). Meanwhile, the integrative index of contamination
(P) of TE is >3, indicating high contaminated levels due to high Pi of Cd and Cu.

SOIL ASSESSMENT AND TRANSFER FROM SOILS TO VEGETABLES
153
Trace element contents in vegetables and plant assessment: In 95.2% of vegetable samples, Pb
contents in the eaten part exceed the standard value for vegetables. In 9.5, 19.1 and 3.2%,
respectively, of vegetable samples, Cd, Cu and Zn contents of eaten part exceed standard values.
Pb contamination in vegetables and Chinese cabbage is the most serious. The highest contents are
observed for Pb in cauliflower, Cd in lettuce and Chinese cabbage and Cu and Zn in pea. But the
lowest contents of Pb, Cd, Cu and Zn all are in tomato. Mean TE contents in Chinese cabbage are
0.33 mg/kg FM for Pb, 0.02 mg/kg FM for Cd, 0.97 mg/kg FM for Cu and 3.45 mg/kg FM for Zn.
Pb, Cd, Cu and Zn contents in the non-consumed part of vegetables are more than in eaten part.
For the non-consumed part of vegetables, 91.7% for Pb, 83.3% for Cd, 22.2% for Cu and 19.4%
for Zn exceed the standard values for vegetables. The contamination of Cd and Pb are very serious
in the non-consumed part of vegetables.
Trace element transfer from soils to vegetables:
The available TE contents are 7.4 for Pb, 0.19 for Cd, 16.9 for Cu and 12.2 mg/kg for Zn.
A-fraction TE contents are 1.38 for Pb, 0.06 for Cd, 1.25 for Cu and 1.85 mg/kg for Zn.
B-fraction TE contents are 6.53 for Pb, 0.13 for Cd, 4.57 for Cu and 16.49 mg/kg for Zn.
C-fraction TE contents are 5.80 for Pb, 0.045 for Cd, 18.4 for Cu and 19.89 mg/kg for Zn.
For SEF TE contents, B-fraction TE contents are higher than C and A-fraction TE contents
(B>C>A) for Pb and Cd, and C-fraction TE contents are higher than B and A-fraction TE contents
(C>B>A) for Cu and Zn. Available and A-fraction TE contents in the lacustrine unit are higher
than in the transition unit (L>T). Pb contents in Chinese cabbage decrease with B-Pb increase. Cd
contents in Chinese cabbage increase with available Cd increase. Increased B and C-Cu seem to
increase Cu absorption by vegetables, especially in the lacustrine unit. Zn contents in Chinese
cabbage increase with total, available and SEF contents of Zn in soil.

154
VI: EXPERIMENTS TO LIMIT TRACE ELEMENT
TRANSFER FROM SOILS TO PLANTS
6.1. INTRODUCTION.............................................................................................155 6.2. MATERIALS AND METHODS .....................................................................155
6.2.1. Chinese cabbage and land requirements ..................................................155 6.2.2. Lime and its application...........................................................................157 6.2.3. Organic matter and its application ...........................................................158 6.2.4. Pot experiments........................................................................................159 6.2.5. Field experiments.....................................................................................163
6.3. RESULTS ..........................................................................................................165 6.3.1. Effects of lime application .......................................................................165
6.3.1.1. Effects of lime application on soil pH ..........................................165 6.3.1.2. Effects of lime application on acetic-acid extractable trace elements in soil..........................................................................................................167
6.3.2. Effects of lime and pig manure application on trace element transfer from soil to the eaten part of Chinese cabbage...........................................................169 6.3.3. Effects of lime and pig manure application on quality and biomass of Chinese cabbage.................................................................................................174
6.4. DISCUSSION ....................................................................................................180 6.4.1. Soil pH and acetic-acid extractable trace element contents in response to lime application..................................................................................................180 6.4.2. Changes in transfer of trace elements from soil to Chinese cabbage with lime and pig manure application........................................................................181 6.4.3. Trace element contents and biomass of Chinese cabbage .......................182
6.5. CONCLUSIONS ...............................................................................................184


EXPERIMENTS TO LIMIT TE TRANSFER FROM SOILS TO PLANTS
155
6.1. INTRODUCTION
With the rapid development of the economy and human activities, soil TE contamination is
becoming more serious in periurban areas. Strategies to control the mobility of soil TE in situ
should be applied considering the precious soil resources (Dermatas & Meng XG, 1996; Alpaslan
& Yukselen, 2002). Agronomic practices for controlling mobility of TE have been described in
Section 2.6.
In order to decrease TE contents in vegetables produced on soils contaminated by TE in the
intensive periurban area in Chenggong County, field experiments were conducted in lacustrine,
transition and mountain units. Pot experiments were conducted in YAU with the same soil as field
experiments. Aims are to evaluate:
1) Effects of lime and pig manure on TE mobility.
2) Growth of Chinese cabbage amended with lime and pig manure.
Possible ways will be investigated to decrease TE in Chinese cabbage to safe contents.
6.2. MATERIALS AND METHODS
6.2.1. Chinese cabbage and land requirements
Chinese cabbage (Brassica campestris subspecies pekinensis (Lour) Olssom, Brassicaceae),
presents four variants: Chinese cabbage spreading leaves (A) (var. dissoluta), Chinese cabbage
semi-wrapping leaves (B) (var. infarota Li), Chinese cabbage with white leaves inside (C) (var
.laxa Tsen et Lee) and Chinese cabbage wrapping leaves (D) (var. cephalata Tsen et Lee) (Liu
Y.S., 1998) (Figure 6.1).

EXPERIMENTS TO LIMIT TE TRANSFER FROM SOILS TO PLANTS
156
Figure 6.1: Variants of Chinese cabbage.
Vegetables are important in China, and they form a major income for many farmers. The
vegetable area represented 12% of crop area in China in 2003 (Figure 6.2). Chinese cabbage is
called the “national vegetable” and is one of the favourite vegetables in China. Some 4% of
Chinese cabbage total area was planted in Yunnan Province in 2003, whilst the main plant areas
were in southern and central China.
Figure 6.2: Percentage of area of main crops in China in 2003
(Source: Zhao Q.G., et al., 2006).
Chinese cabbage has two growth stages: vegetative and reproductive. The growing period is 70-90
days (sometimes 100 days). The factors influencing organoleptic qualities of Chinese cabbage
include texture and nutrient contents. Usually, the water content in Chinese cabbage is 93-95.7%.
Some 19-23.2% of dry materials are crude protein, 2.1-3.1% being total sugar, and 1.8-2.8% being
reducing sugar. Vitamin C contents are 15.2-25.4 mg/100g (Liu Y.S., 1998).
Growth of Chinese cabbage requires specific conditions of soil and climate. Chinese cabbage is
planted in an area with temperature between 7-25 oC, lasting 70-80 days. The most suitable soils

EXPERIMENTS TO LIMIT TE TRANSFER FROM SOILS TO PLANTS
157
for Chinese cabbage are loam or light loam with sand/clay ratio of 2:3, and with pH ranging
between 6.5-7.0, and the ideal content of physical sand (>0.01 mm) ranges between 76-78% and
physical clay (<0.01 mm) ranges between 22-24%. The root system of Chinese cabbage is shallow
and grows fast, so it is important to keep the soil loose and fertile. Total N, P2O5 and K2O
quantities required for the production of 1000 kg FM Chinese cabbage are 1.8-2.6 kg, 0.8-1.2 kg
and 3.2-3.7 kg, respectively. Ideal ratio of N: P2O5: K2O is 1:0.5:2. It is usually planted in
Autumn. The suitable period to sow is from the middle of August to October, and to harvest in
November to December in Kunming Prefecture. The width of inter-rows is 50-65 cm and spacing
inter-plants is 35-50 cm. Ideal density of Chinese cabbage is 30,000-37,500 per ha (Liu Y.S.,
1998).
More attention should be paid to the chemical contents of Chinese cabbage, due to its high ability
to accumulate harmful substances. The quality of Chinese cabbage depends on environmental
quality, soil characteristics and cultivars. TE contents in Chinese cabbage are becoming an
increasingly serious barrier for improving quality and export. Chinese cabbage is one of the
highest TE accumulative vegetables, while intraspecific differences in TE accumulation exist. Dai
H.L., et al. (2007) reported the Zn accumulation of four Chinese cabbage cultivars. Accumulation
and transfer of Zn in Fengkang 78 and Fengyuan Gaokang 2 cultivars are higher than in the other
two, i.e. Fengkang 80 and Fengkang 90. The accumulation of TE in Chinese cabbage is influenced
by soil types, organic matter content and pH. In general, it is important to improve Chinese
cabbage quality and decrease TE contents in Chinese cabbage for vegetable production, export,
economic income and human health.
6.2.2. Lime and its application
Lime is one of several alkaline amendments to increase soil pH of acid soil and to decrease TE
mobility and leaching ability. The mechanism for pH influencing availability of TE has been
described in Section 2.6. Lime includes limestone (CaCO3), quick lime (CaO) and hydrated lime
(Ca (OH)2). Quick lime is widely used in agricultural practices in China. Quick lime changes
easily to small powder (hydrated lime) with water, which should be well mixed with soil in the

EXPERIMENTS TO LIMIT TE TRANSFER FROM SOILS TO PLANTS
158
field. Application rates of lime in acid red soils are recommended by the Nanjing Institute of Soil
Science, Chinese Academy of Sciences (Table 6.1).
Table 6.1: Application rate of lime in acid soil (kg/ha)
(Source: Nanjing Institute of Soil Science, Chinese Academy of Sciences)
pH Clay soil Loam soil Sandy soil
4.5 - 5.0 2,250 1,500 750 - 1,125
5.0 - 6.0 1,125 - 1,875 750 - 1,125 375 - 750
6.0 750 375 - 750 375
6.2.3. Organic matter and its application
TE could be bound with Organic matter which decrease their bioavailability in soil. The
mechanism for organic matter influencing availability of TE has been described in Section 2.6.
Organic fertilizers can be used to improve soil. They mainly include farmyard manure, poultry
manure, sewage sludge, domestic refuse and straw (Suran, et al., 1998; Guo G.L., et al., 2006).
Pig, cow and poultry manures, which could be easily brought from the market (Plate 6.1), are the
most popular organic fertilizers in Chenggong County.
Plate 6.1: Market for manure in Chenggong County.

EXPERIMENTS TO LIMIT TE TRANSFER FROM SOILS TO PLANTS
159
6.2.4. Pot experiments
Experimental Design:
Four pot experiments were conducted in the laboratory. The first pot experiment (FPOT) only used
lime application. In this experiment, the soil taken from the lacustrine unit of Chenggong County
has been chosen with low pH, in order to give oriented information for other experiments, even if
conducted with less acid soils.
Lime is used to increase soil pH. Soil moisture was kept at field capacity in FPOT for 3 months
after lime application. Then Chinese cabbage (Qingdao 83-1) was planted in soil for another 3
months. Meanwhile, soil pH was analysed each week, and contents of the acetic-acid extractable
Pb, Cd, Zn (A-fraction) in soils were analysed at the end of 1st, 3rd and 6th month. Biomass of
Chinese cabbage and contents of Pb, Cd and Zn in Chinese cabbage were analysed when Chinese
cabbages were harvested at the end of the 6th month. Each pot is filled with 5 kg air-dried soil (<2
mm) mixed well with lime powders (<2 mm). FPOT included seven treatments, and was
performed in quadruplicate for each treatment.
The latter pot experiments were used for lime and pig manure application in order to increase pH
and fix the soil TE. Soils were from lacustrine (LPOT), transition (TPOT) and mountain (MPOT)
units (Plate 6.2). Lime and pig manure powders (<2 mm), which were gently broken up and
passed through a 2.0 mm sieve after being air-dried, were mixed with air-dried soil (<2 mm) and
soil moisture was kept at field capacity for 1 week. Chinese cabbage was planted in soils for 3
months when Chinese cabbages were harvested in the field in order to have the same growing time
between pot experiments and field experiments. Then contents of Pb, Cd, Cu and Zn in the eaten
part of Chinese cabbage and the acetic-acid extractable TE (A-fraction) in soils were determined.

EXPERIMENTS TO LIMIT TE TRANSFER FROM SOILS TO PLANTS
160
Plate 6.2: Pot experiments and Chinese cabbage seed bag.
Soil characteristics:
Characteristics of soil of FPOT, LPOT, TPOT and MPOT are shown in Table 6.2.
Table 6.2: Characteristics of soil used in experiments
Experiments pH
OM
(%)
Total N
(%)
CEC
(cmol/kg)
Available P
(mg/kg)
Available K
(mg/kg)
Total Pb
(mg/kg)
Total Cd
(mg/kg)
Total Cu
(mg/kg)
Total Zn
(mg/kg)
FPOT 4.9 6.7 0.38 27.4 201.1 503.1 40.4 0.98 112 187.3 MPOT/MFD 4.8 2.1 0.12 26.8 65.3 135.6 30.5 0.91 119.3 94.1 TPOT/TFD 6.8 2.3 0.24 31.1 104.9 668.9 16.9 0.37 108.3 129.6 LPOT/LFD 6.2 2.2 0.11 35.2 98.4 290.2 17.7 0.29 61.6 68.9

EXPERIMENTS TO LIMIT TE TRANSFER FROM SOILS TO PLANTS
161
Amount of lime and pig manure:
Considering that the application rate of lime in acid red soils recommended by the Nanjing
Institute of Soil Science is 2,250 kg/ha in clay soil with pH 4.5-5.0, treatments of FPOT were
established to frame and check this value (L4), as shown in Table 6.3.
Table 6.3: Treatments of lime in FPOT
Treatments Amount
CK L1 L2 L3 L4 L5 L6
Lime (g/kg DM soil) 0 0.2 0.4 0.6 1.0 1.5 2.5
Lime* (kg/ha) 0 450 900 1,350 2,250 3,375 5,625
* Weight of soil is estimated with 2,250 t/ha.
According to the results obtained with the different samples with lime application in FPOT,
different lime treatments were chosen according to different initial pH. Meanwhile, due to no
significant differences of pH between L1, L2 and L3 observed in FPOT, treatments in MPOT were
modified to T1 (0.5 mg/kg), T2 (1.0 mg/kg), T3 (1.5 mg/kg) and T4 (3.0 mg/kg) with pH 4.8,
which is relative to (L2 - L3), L4, L5 and (L6) in FPOT.
Pig manure amounts were chosen according to field questionnaires (Section 5.4.2). The main
organic fertilizers are pig manure and cow manure. Application rates range between
11,250-82,500 kg/ha in Chenggong County. The treatments of pig manure were based on the
popular amount 33,750 kg/ha in this research. The treatments of MPOT were shown in Table 6.4,
which were CK (control), T1, T2, T3, T4; T1P1, T2P1, T3P1, T4P1; T1P2, T2P2, T3P2, T4P2.
Lime treatments in LPOT and TPOT with pH 6.2 and pH 6.8 were T2 (1.0 mg/kg) and T4 (3.0
mg/kg). The treatments were CK (control), T2, T4; P1 ; P2 ; T2P1, T4P1; T2P2, T4P2 (Table 6.4).
Each pot is filled with 5 kg air-dried soil (<2 mm) mixed well with lime and pig manure powders
(<2 mm). Each treatment was conducted in triplicate. Contents of TE in lime and pig manure are
shown in Table 6.5. Lime and pig manure were brought in different local markets in the three
same units, and so could then be of different quality, especially Cu and Zn contents.

EXPERIMENTS TO LIMIT TE TRANSFER FROM SOILS TO PLANTS
162
Table 6.4: Treatments of lime and pig manure in pot and field experiments
Lime Pig manure Treatments Control (CK)
T1 T2 T3 T4 P1 P2
Amount (g/kg) 0 0.5 1.0 1.5 3.0 7.5 15
Amount* (kg/ha) 0 1,125 2,250 3,375 6,750 16,875 33,750
* Weight of soil is estimated with 2,250 t/ha.
Table 6.5: TE contents in lime and pig manure (mg/kg)
Materials Pot experiments Pb Cd Cu Zn
FPOT 1.4 0.02 0.7 4.8
MPOT 14.1 trace 0.6 31.0
TPOT 2.0 0.21 0.8 5.4 Lime
LPOT 2.3 0.08 1.6 5.6
MPOT 11.6 0.17 101.2 77.4
TPOT 21.3 0.69 375.9 336.7 Pig manure
LPOT 7.6 0.25 86.9 214.8
Measures and analysis:
Analysis methods of pH, total and A-fraction TE contents in soil are described in Section 3.4.
Analysis methods of TE contents in vegetables are shown in Section 5.3. In order to overcome the
effect of water content, TE contents in this chapter are expressed with dry materials. Biomass of
Chinese cabbage in FPOT is expressed in fresh materials per each pot at harvest.
The general description data are analysed with descriptive statistics and expressed in means (using
Excel 2003). The statistical differences are analysed with T-tests by Excel at P <0.05 or P <0.01.
The regression analysis is carried out for linear models using SPSS at P <0.05 or P <0.01.

EXPERIMENTS TO LIMIT TE TRANSFER FROM SOILS TO PLANTS
163
6.2.5. Field experiments
Experimental design:
Lime and organic manure were applied in field in lacustrine, transition and mountain units (Plate
6.3).
Plate 6.3: Application of lime and pig manure in the field.
As in pot experiments, lime and pig manure were used, respectively, to increase pH and organic
matter in the lacustrine (LFD), transition (TFD) and mountain (MFD) units. Soil was cultivated
with soil moisture kept at field capacity for 1 week. Then seeds of Chinese cabbage (Qingdao 83-1)
were planted and Chinese cabbage grown for ~3 months (Plate 6.4).
According to the greenhouse size and plot size, the area of each sub-plot is 10 m2 in the lacustrine
unit, 16 m2 in the transition unit and 20 m2 in the mountain unit. There were triplicate sub-plots
randomly arranged in the plot. The width of inter-rows was 45 cm and spacing inter-plants was 35
cm.
lime Pig manure

EXPERIMENTS TO LIMIT TE TRANSFER FROM SOILS TO PLANTS
164
Plate 6.4: Field experiments.
Soil characteristic:
Soil characteristics and TE contents were the same as pot experiments (Table 6.2).
Amount of lime and pig manure:
Treatments were the same as for pot experiments (Table 6.4). TE contents in lime and pig manure
were also the same as for pot experiments (Table 6.5).
Measures and analysis:
The biomass of Chinese cabbage and contents of Pb, Cd, Cu and Zn in the eaten part of Chinese
cabbage were analysed at harvest stage. Biomass is expressed in fresh materials per each plot, and
TE contents in this chapter are expressed in dry materials at harvest.

EXPERIMENTS TO LIMIT TE TRANSFER FROM SOILS TO PLANTS
165
6.3. RESULTS
6.3.1. Effects of lime application
6.3.1.1. Effects of lime application on soil pH
After lime application in FPOT, soil pH fluctuated during the first 5 weeks and became more
stable after the 10th week (Table 6.6, Figure 6.3). Biological activities and organic matter
evolution were influenced during the first 5 weeks after lime application.
Table 6.6: pH ± SD with lime application after 1, 5, 10 and 15 weeks (n=4)
Time Control (CK) L1 L2 L3 L4 L5 L6
1 week 5.0 ± 0.1 5.3 ± 0.1 5.4 ± 0.1 6.0 ± 0.1 6.0 ± 0.1 6.3 ± 0.4 6.9 ± 0.1
5 weeks 5.7 ± 0.2 5.8 ± 0.2 5.7 ± 0.1 6.0 ± 0.2 6.3 ± 0.1 6.3 ± 0.1 6.6 ± 0.1
10 weeks 5.3 ± 0.2 5.7 ± 0.6 5.4 ± 0.1 5.5 ± 0.1 5.7 ± 0.2 5.8 ± 0.1 6.2 ± 0.2
15 weeks 5.3 ± 0.1 5.8 ± 0.2 5.8 ± 0.1 5.8 ± 0.1 6.1 ± 0.2 6.3 ± 0.2 6.5 ± 0.1
Figure 6.3: Soil pH with lime application.
Significant positive linear relationships between pH at week 1 (R2=0.950, n=7, P<0.001), week 5
(R2=0.896, n=7, P<0.001), week 10 (R2=0.736, n=7, P<0.001), and week 15 (R2=0.896, n=7,
P<0.001) and application rate of lime were observed (Figure 6.4). It is suggested that lime

EXPERIMENTS TO LIMIT TE TRANSFER FROM SOILS TO PLANTS
166
effectively increased soil pH in Chenggong County, and decreased the potential transfer of soil TE
from soil to vegetables.
55.25.45.65.8
66.26.46.66.8
7
0 0.5 1 1.5 2 2.5 3
Rate of lime application (g/kg)
Soil
pH
pH1pH5pH10pH15
Figure 6.4: Relationships between rate of lime and pH
after 1 (pH1), 5 (pH5), 10 (pH10) and 15 (pH15) weeks.
At week 15, significant differences among control (CK) and treatments were observed, except for
L1 (Figure 6.5). No significant differences existed between L1, L2 and L3.
Figure 6.5: Soil pH with different rate of lime application at week 15.

EXPERIMENTS TO LIMIT TE TRANSFER FROM SOILS TO PLANTS
167
6.3.1.2. Effects of lime application on acetic-acid extractable trace
elements in soil
Acetic-acid extractable (A-fraction) TE includes soluble, exchangeable and carbonate bound
fractions.
Pb: A-fraction contents decreased with increase in application rate of lime after 1 month (5 weeks)
(Y=3.48-0.51X, R2=0.723, P<0.05, n=7) (Figure 6.6). A-fraction Pb contents were trace after 3
(15 weeks) and 6 months.
00.5
11.5
22.5
33.5
4
0 0.5 1 1.5 2 2.5 3Rate of lime application (g/kg)
A-f
ract
ion
Pb c
onte
nt (
mg/
kg)
Figure 6.6: A-fraction Pb contents after 1 month.
Cd and Zn: A-fraction contents decreased with increase in application rate of lime after 3 and 6
months (Figure 6.7). However, no significant difference between A-fraction contents in 3 and 6
months was observed. There were significant negative relationships between A-fraction of Cd, Zn
and application rate of lime after 6 months (Cd: Y=0.97-0.28X, R2=0.768, P<0.05, n=7; Zn:
Y=10.8-2.83X, R2=0.793, P<0.05, n=7). It is suggested that A-fraction contents of Cd and Zn are
strongly influenced by lime and soil pH (Annex 6.1).

EXPERIMENTS TO LIMIT TE TRANSFER FROM SOILS TO PLANTS
168
00.20.40.60.8
11.21.4
0 0.5 1 1.5 2 2.5 3
Rate of lime application (g/kg)
A-fr
actio
n C
d c
onte
nt (m
g/kg
)3th month
6th month
02468
101214
0 0.5 1 1.5 2 2.5 3Rate of lime application (g/kg)
A-f
ract
ion
Zn c
onte
nt (m
g/kg
) 3th month
6th month
Figure 6.7: A-fraction contents of Cd and Zn after 3 and 6 months.
Comparing with the A-fraction of Cd and Zn in the control (CK) after 3 and 6 months, ratio of
A-fraction contents of Cd and Zn in treatments relative to those in CK (RRCT) decreased
significantly with application rate of lime after 6 months (Cd: Y=0.96-0.27X, F=10.16, R2=0.717,
P<0.05, n=6; Cu: Y=0.83-0.20X, F=12.88, R2=0.763, P<0.05, n=6) (Figure 6.8).
Figure 6.8: RRCT of Cd and Zn after 3 and 6 months.
Cu: At the FPOT, Cu was not considered. With the development of soil investigations in this
research (Section 4.3), attention was paid latter to Cu.

EXPERIMENTS TO LIMIT TE TRANSFER FROM SOILS TO PLANTS
169
6.3.2. Effects of lime and pig manure application on trace element
transfer from soil to the eaten part of Chinese cabbage
Three pot experiments (LPOT, TPOT, MPOT) were used to understand TE transfer from soil to
Chinese cabbage under lime and pig manure application. TE contents in the eaten part of Chinese
cabbage and A-fraction TE contents in soil were analysed after 3 months when Chinese cabbages
were harvested in the field, in order to have the same growing time between pot experiments and
field experiments.
TE contents in the eaten part of Chinese cabbage were shown in Annex 6.1. Contents range from
0.6-7.4 mg/kg DM for Pb in Chinese cabbage in three pot experiments, from 0.07-2.28 mg/kg DM
for Cd, from 2.9-18.4 mg/kg DM for Cu and from 22.3-78.1 mg/kg DM for Zn. Contents of
A-fraction TE in soils were shown in Annex 6.2 and Table 6.7. Contents of A-fraction Pb and Cd,
which were trace in TPOT and LPOT, were from 0.3-0.4 mg/kg and from 0.03-0.05 mg/kg in
MPOT. Contents of A-fraction Cu and Zn were from 0.2-15.1 mg/kg and from 0.6-49.3 mg/kg in
three pot experiments, respectively.
Table 6.7: A-fraction TE content ranges (mg/kg) in soils in LPOT, TPOT and MPOT
Pot experiments Pb Cd Cu Zn
LPOT Trace Trace 0.2 - 2.5 13.5 - 49.3
TPOT Trace Trace 0.9 - 4.9 2.8 - 6.1
MPOT 0.3 - 0.4 0.03 - 0.05 1.6 - 15.1 0.6 - 1.2
A: Relationships between acetic-acid extractable trace elements in soil and trace elements in
Chinese cabbage
Lime: Positive relationships between acetic-acid extractable (A-fraction) TE contents in soil and
TE contents in Chinese cabbage were observed, except for Cd (F=8.68, R2=0.743, sig.f=0.060, n=5),
when lime is applied in MPOT (Figure 6.9).

EXPERIMENTS TO LIMIT TE TRANSFER FROM SOILS TO PLANTS
170
(Y=0.97+15.10x, F= 13.67, R2=0.820, sig.f= 0.034, n=5)
(Y=3.29+0.98x, F=210.27, R2=0.986, sig.f<0.001, n=5) (Y=-89.62+141.06x, F=80.02, R2=0.964, sig.f=0.003,n=5)
Figure 6.9: Relationships between A-fraction TE contents in soil and TE contents
in Chinese cabbage in MPOT.
Pig manure: Contents of A-Cu and A-Zn fractions with treatment of high pig manure (P2) in
TPOT and LPOT were lower than with low pig manure (P1) (Annex 6.2). That made Cu and Zn
contents in Chinese cabbage with treatment P2 lower than with treatment P1.
Lime + pig manure: Relationships between A-fraction TE contents in soil and TE contents in
Chinese cabbage were complex when lime and pig manure were applied together. Contents of
A-fraction Zn in soil and Zn in Chinese cabbage both decreased with increased rate of lime

EXPERIMENTS TO LIMIT TE TRANSFER FROM SOILS TO PLANTS
171
application in treatments of lime + pig manure. However, this relationship was not observed for
Cu.
B: Enrichment coefficient related to trace element availability (AEC)
AEC is the ratio of TE contents in the eaten part of Chinese cabbage to A-fraction TE contents in
soil, which can help understanding the transfer of TE from soil to plant. The value of this ratio
increases with transfer increases from soil to plant.
Lime: AEC of Pb ranged from 16.8-18.5 with no significant differences among control (CK) and
lime treatments in MPOT. AEC of Cd decreases with increase in rate of lime application in MPOT
(Figure 6.10). A-fraction Pb and Cd were trace in soils of TPOT and LPOT, Thus, it is impossible
to compare AEC of Pb and Cd in TPOT and LPOT. AEC of Cu ranged from 1.2-1.3 in MPOT,
TPOT and LPOT with no significant difference between control (CK) and lime treatments.
AEC of Zn decreased with increased rate of lime application (Figure 6.10). Comparing with 3 pot
experiments, AEC of Zn in MPOT was higher than in TPOT and LPOT with treatments of T2 (1
g/kg) and T4 (3 g/kg) (Figure 6.10).
Figure 6.10: AEC in pot experiments with lime application.
05
10152025303540455055606570
Zn-MPOT Zn-TPOT Zn-LPOT
AEC
in th
ree
pot e
xper
imen
ts CK1 g/kg3 g/kg
aa
b
aaaaaa

EXPERIMENTS TO LIMIT TE TRANSFER FROM SOILS TO PLANTS
172
Pig manure: AEC of Cu (2.96-6.99) and Zn (6.8-10.1) were higher in TPOT than in LPOT (Cu:
1.7-2.98, Zn: 0.87-2.01). AEC of Cu and Zn with pig manure application is higher than in the
control (CK) (Figure 6.11).
Figure 6.11: AEC in pot experiments with pig manure application.
Lime + pig manure: AEC of Pb in MPOT ranged from 17.1-19.6 with no significant difference
among treatments of lime + pig manure (Figure 6.12). AEC of Cd ranged from 17.6-59.7. AEC of
Cd with lime application was higher than with lime + pig manure. No significant differences
between AEC of Cu, which is between 1.2-2.7, were observed with treatments of lime + pig
manure. AEC of Zn, which with lime + pig manure application was higher than in the treatment of
lime, except for T1, is between 53-81.3.
0
2
4
6
8
10
12
Cu-TPOT
Cu-LPOT
Zn-TPOT
Zn-LPOT
AEC
of T
POT
and
LPO
TCK7.5 g/kg15 g/kg
bb
a
a
bc
a
b
a
ba a

EXPERIMENTS TO LIMIT TE TRANSFER FROM SOILS TO PLANTS
173
Figure 6.12: AEC in MPOT with application of lime + pig manure.
Comparing the three units, AEC of Cu was higher in the lacustrine unit than in the transition and
mountain units (L>T>M). AEC of Zn was the opposite, higher in the mountain unit than in the
transition and lacustrine units (L<T<M) (Figure 6.13).
0
1020
30
4050
60
7080
90
Pb Cd Cu Zn
AEC
of T
E in
MPO
TT1T1-P1T1-P2
aa
a
a
b a
b a a
bb
a
0
10
20
30
40
50
60
70
80
90
Pb Cd Cu Zn
AEC
of T
E in
MPO
T
T2T2-P1T2-P2
aaa b b
a
a a a
aaa
0
10
20
30
40
50
60
70
80
90
Pb Cd Cu Zn
AEC
of T
E in
MPO
T
T3T3-P1T3-P2
a a a b b
a
aa a
c
b
a
0
10
20
30
40
50
60
70
80
90
Pb Cd Cu Zn
AEC
of T
E in
MPO
T
T4T4-P1T4-P2
aaa b b
a
a a a
b
a
a

EXPERIMENTS TO LIMIT TE TRANSFER FROM SOILS TO PLANTS
174
Figure 6.13: AEC of Cu and Zn in pot experiments with application of lime + pig manure.
In summary, the relative importance of transfer from soil to plant is shown in Table 6.8, with an
adjacent (+), (-), and (=) and (NS) for no significant results.
Table 6.8: Conclusion on transfer from soil to plant in LPOT, TPOT and MPOT
Lime Pig manure Lime + pig manure TE
LPOT TPOT MPOT LPOT TPOT MPOT LPOT TPOT MPOT
Pb NS NS = NS NS NS NS NS =
Cd NS NS - NS NS NS NS NS -
Cu = = = + + NS = = =
Zn - - - + + NS + + +
6.3.3. Effects of lime and pig manure application on quality and
biomass of Chinese cabbage
FPOT and three field experiments (MFD, TFD, LFD) were undertaken for this research on the
effects of lime and pig manure application on TE contents in the eaten part and biomass of
Chinese cabbage cultivated in field conditions.
0
5
10
15
20
25
T2P1 T4P1 T2P2 T4P2
Treatments of lime+pig manure
AEC
of C
uLPOTTPOTMPOT
0
10
20
3040
50
60
70
80
T2P1 T4P1 T2P2 T4P2
Treatments of lime+pig manure
AEC
of Z
n
LPOTTPOTMPOT
a
ba
a
bb b b
a
b b
a
b
c
a
b
c
a
c
b
a
b
c
a

EXPERIMENTS TO LIMIT TE TRANSFER FROM SOILS TO PLANTS
175
A: Trace element contents in the eaten part of Chinese cabbage
FPOT: Contents of Pb, Cd and Zn in the eaten part of Chinese cabbage were determined when
harvested in FPOT. Contents of Pb, Cd and Zn decreased with application rate of lime (Table 6.9).
A significant linear negative relationship between Pb contents and application rate of lime was
observed (Y=12.21-2.19x, F=6.73, R2=0.574, P<0.05, n=7) (Figure 6.14).
Table 6.9: Contents of Pb, Cd and Zn (mg/kg DM) and biomass ± SD (g FM/pot) in Chinese
cabbage with lime application in FPOT (n=4)
Treatments CK L1 L2 L3 L4 L5 L6 Pb 12.5 ± 1.6 14.8 ± 2.0 9.8 ± 2.0 9.3 ± 2.5 9.8 ± 1.4 8.0 ± 0.7 7.8 ± 0.1 Cd 3.2 ± 1.7 1.6 ± 0.5 1.6 ± 0.4 2.9 ± 1.2 1.5 ± 1.4 1.3 ± 1.1 1.0 ± 1.8 Zn 69.8 ± 4.9 56.6 ± 2.7 40.1 ± 1.9 51.4 ± 10.8 54.3 ± 8.4 50.0 ± 4.1 43.8 ± 2.1 Biomass 22.0 ± 2.0 55.7 ± 3.1 68.3 ± 2.4 63.7 ± 3.4 71.6 ± 3.5 70.5 ± 8.8 82.4 ± 4.5
Figure 6.14: Relationship between Pb contents in Chinese cabbage and rate of lime application in
FPOT.
Field experiments:
Lime: TE contents decreased with increased rate of lime application. Pb contents were higher than
standard values for Chinese cabbage, except for treatment T3 and T4 in the mountain unit (MFD).
In LFD and TFD, Pb contents in Chinese cabbage were lower than standard values, except for P2
and T4P1 in TFD. Cd, Cu and Zn contents were lower than control (CK) and standard values of

EXPERIMENTS TO LIMIT TE TRANSFER FROM SOILS TO PLANTS
176
Chinese cabbage with lime treatments in TFD and LFD (Figure 6.15, Table 6.10). It is suggested
that treatments T3 (3,375 kg/ha) and T4 (6,750 kg/ha) could be used to improve TE contents in
Chinese cabbage to meet the standard values.
0
1
2
3
4
5
6
7
8
1 2 3 4
Treatments
Pb c
onte
nt in
Chi
nese
cab
bage
(mg/
kg D
M)
LimeLime+low pig manureLime+high pig manureCK
0
0.2
0.4
0.6
0.8
1
1.2
1.4
1.6
1 2 3 4
Treatments
Cd
cont
ent i
n C
hine
se c
abba
ge(m
g/kg
DM
)
LimeLime+low pig manureLime+high pig manureCK
0
1
2
3
4
5
6
7
8
1 2 3 4
Treatments
Cu
cont
ent i
n C
hine
se c
abba
ge(m
g/kg
DM
)
LimeLime+ low pig manureLime+ high pig manureCK
0
10
20
30
40
50
60
70
1 2 3 4Treatments
Zn c
onte
nt in
Chi
nese
cab
bage
(mg/
kgD
M)
LimeLime+ low pig manureLime+high pig manureCK
Figure 6.15: TE contents in Chinese cabbage with lime application in MFD
( Standard value estimated with water content of 95% in Chinese cabbage).
Pig manure: TE contents with treatments of pig manure were lower than in CK, except for Pb in
TFD and Cd and Zn in LFD (Figure 6.15, Table 6.10). TE contents with low pig manure were
lower than with high pig manure, except for Pb in TFD and Cd and Zn contents in LFD (Figure
6.16). However, no significant difference in TE contents between low pig manure and high pig
manure application was observed.

EXPERIMENTS TO LIMIT TE TRANSFER FROM SOILS TO PLANTS
177
Figure 6.16: TE contents in Chinese cabbage with pig manure application in TFD and LFD.
( Standard value estimated with water content of 95% in Chinese cabbage)
Lime + pig manure: TE contents decreased with rate of lime application of treatments of lime +
pig manure. On the one hand, TE contents with lime + pig manure were higher than with lime
application in three field experiments (Figure 6.15, Table 6.10). On the other hand, Pb and Cd
contents with high pig manure were lower than with low pig manure, whilst Zn contents were
similar in MFD. No significant difference in TE contents between low pig manure and high pig
manure was observed in TFD and LFD. It is suggested that lime alone should be better than lime +
pig manure together, and low pig manure application alone (16,875 kg/ha) should be enough to
decrease TE contents in Chinese cabbage at effective low cost compared with high pig manure.
Therefore, it is possible to decrease TE contents in Chinese cabbage with lime application, but pig
manure application could result in Pb and Cd contents in Chinese cabbage exceeding standard
values in the mountain unit. This poses the problem of the quality of pig manure used. This pig
manure could be slightly acid and contain TE, especially Cu and Zn from animal feed.

EXPERIMENTS TO LIMIT TE TRANSFER FROM SOILS TO PLANTS
178
Table 6.10: TE contents (mg/kg DM) ± SD in the eaten part of Chinese cabbage in three field
experiments (n=3)
Experiments Treatments Pb Cd Cu Zn
Control (CK) 5.5 ± 1.0 1.48 ± 0.09 6.0 ± 1.6 64.3 ± 6.5
T1 4.9 ± 0.8 0.87 ± 0.06 3.2 ± 1.5 59.3 ± 6.3
T2 4.6 ± 1.1 0.83 ± 0.10 3.6 ± 2.1 49.7 ± 5.8
T3 3.4 ± 0.6 0.75 ± 0.02 3.5 ± 1.3 48.0 ± 9.1 Lime
T4 3.3 ± 0.1 0.74 ± 0.03 2.6 ± 1.9 47.3 ± 7.6
T1P1 7.5 ± 0.6 1.25 ± 0.09 4.3 ± 2.1 60.8 ± 8.2
T2P1 7.4 ± 0.3 1.12 ± 0.08 4.0 ± 0.9 55.7 ± 6.5
T3P1 5.3 ± 0.8 1.11 ± 0.04 6.7 ± 0.8 54.5 ± 4.3
Lime + low pig
manure (P1)
T4P1 5.3 ± 0.6 1.01 ± 0.06 4.6 ± 0.6 61.6 ± 3.2
T1P2 5.1 ± 0.4 1.08 ± 0.05 4.5 ± 1.3 64.5 ± 9.8
T2P2 5.7 ± 1.0 0.81 ± 0.08 3.4 ± 1.2 55.6 ± 8.7
T3P2 5.3 ± 1.1 0.85 ± 0.09 3.1 ± 0.6 57.5 ± 5.6
MFD
Lime + high pig
manure (P2)
T4P2 5.1 ± 0.6 1.04 ± 0.10 5.2 ± 2.0 47.8 ± 4.6
Control (CK) 3.7 ± 0.6 0.45 ± 0.03 16.8 ± 3.1 57.1 ± 5.2
T2 2.7 ± 0.4 0.41 ± 0.06 13.4 ± 3.6 58.8 ± 6.3 Lime
T4 2.1 ± 0.4 0.34 ± 0.04 12.9 ± 2.5 38.4 ± 4.3
P1 3.3 ± 0.3 0.27 ± 0.05 13.4 ± 4.2 49.5 ± 5.9 Pig manure
P2 4.3 ± 0.9 0.27 ± 0.10 12.7 ± 6.2 55.0 ± 9.1
T2P1 3.1 ± 0.7 0.37 ± 0.11 13.5 ± 2.3 57.7 ± 8.1 Lime + low pig
manure (P1) T4P1 4.2 ± 0.9 0.23 ± 0.03 11.6 ± 2.1 55.6 ± 6.5
T2P2 3.9 ± 0.2 0.49 ± 0.09 12.6 ± 2.6 45.6 ± 5.7
TFD
Lime + high pig
manure (P2) T4P2 2.8 ± 0.6 0.23 ± 0.05 11.2 ± 2.0 55.0 ± 5.9
Control (CK) 2.4 ± 0.3 0.58 ± 0.06 9.5 ± 1.6 46.6 ± 7.8
T2 2.1 ± 0.5 0.55 ± 0.03 10.2 ± 2.9 44.5 ± 5.3 Lime
T4 1.7 ± 0.4 0.54 ± 0.10 9.1 ± 2.1 45.9 ± 6.1
P1 1.9 ± 0.3 0.61 ± 0.05 9.6 ± 0.6 49.3 ± 8.0 Pig manure
P2 1.8 ± 0.2 0.75 ± 0.04 8.4 ± 0.9 48.5 ± 5.7
T2P1 1.6 ± 0.5 0.77 ± 0.08 10.6 ± 1.2 48.9 ± 5.3 Lime + low pig
manure (P1) T4P1 1.3 ± 0.6 0.59 ± 0.06 9.5 ± 1.6 45.7 ± 6.4
T2P2 2.2 ± 0.4 0.74 ± 0.11 10.3 ± 2.1 49.1 ± 7.0
LFD
Lime + high pig
manure (P2) T4P2 1.7 ± 0.2 0.45 ± 0.06 10.0 ± 1.8 44.9 ± 5.4
* Chinese standard values estimated: Pb: 4, Cd: 1, Cu: 200 and Zn: 400 mg/kg DM estimated with water content =
95% in Chinese cabbage.
B: Biomass
FPOT: Biomass of Chinese cabbage increased with rate of lime application in FPOT
(Y=-12.3X2+47.16X+37.95, R2=0.717, P<0.05, n=7), which means that lime application would be

EXPERIMENTS TO LIMIT TE TRANSFER FROM SOILS TO PLANTS
179
used to improve Chinese cabbage growth (Table 6.9, Figure 6.17). Hence, 0.4 g/kg (900 kg/ha)
lime should be sufficient for obtaining suitable biomass, according to this curve (Figure 6.17).
0102030405060708090
0 0.5 1 1.5 2 2.5 3Rate of lime application (g/kg)
Bio
mas
s (g
FM/p
ot)
Figure 6.17: Effect of lime application on biomass of Chinese cabbage in FPOT.
Field experiments: Biomass also increased with lime and pig manure application in the field
(Figure 6.18, Table 6.11). In LFD and TFD, biomass of all treatments was higher than in CK.
Figure 6.18: Biomass of Chinese cabbages in TFD and LFD.

EXPERIMENTS TO LIMIT TE TRANSFER FROM SOILS TO PLANTS
180
Considering biomass and TE contents, TE accumulation in Chinese cabbage (TE content ×
biomass) with treatments was lower than in control (CK) in LFD and TFD, except for Pb and Cd
in TFD (Table 6.11). Pb accumulation in TFD with treatments of pig manure and lime +pig
manure was higher than or close to CK. Cd accumulation in T2P2 was higher than CK.
Table 6.11: Biomass (kg FM/plot) ± SD and TE accumulated amounts (mg DM/plot) in Chinese
cabbage in TFD and LFD (n=3)
Accumulated amounts Experiment Treatments Biomass
Pb Cd Cu Zn
Control (CK) 183.3 ± 12.3 34.3 4.1 153.7 523.7
T2 208.8 ± 12.6 27.7 4.3 139.7 613.9 Lime
T4 211.7 ± 13.6 21.7 3.6 136.1 406.0
P1 211.7 ± 20.1 34.4 2.9 142.2 523.5 Pig manure
P2 213.9 ± 20.2 46.4 2.9 135.6 588.5
T2P1 223.3 ± 22.4 35.1 4.1 151.1 644.6 Lime + low pig
manure (P1) T4P1 208.3 ± 23.1 43.9 2.4 120.7 578.7
T2P2 228.9 ± 23.5 44.2 5.6 143.7 521.8
TFD
Lime + high pig
manure (P2) T4P2 230.1 ± 20.1 31.9 2.6 133.7 633.3
Control (CK) 101.7 ± 11.2 12.2 2.9 48.3 236.9
T2 103.2 ± 12.0 11.0 2.8 52.4 229.6 Lime
T4 103.6 ± 13.2 8.5 2.8 47.2 238.1
P1 106.7 ± 13.6 10.2 3.3 51.3 263.1 Pig manure
P2 106.3 ± 12.5 9.6 4.0 44.5 257.6
T2P1 117.3 ± 13.2 9.1 4.5 62.0 286.7 Lime + low pig
manure (P1) T4P1 117.3 ± 15.0 7.8 3.5 55.4 268.0
T2P2 107.8 ± 12.2 11.6 4.0 55.3 264.4
LFD
Lime + high pig
manure (P2) T4P2 109.8 ± 12.0 9.2 2.5 54.9 246.6
6.4. DISCUSSION
6.4.1. Soil pH and acetic-acid extractable trace element contents in
response to lime application
Significant positive linear relationships between application rate of lime and pH after weeks 1, 10
and 15 were observed. It is confirmed that lime application could increase soil pH in Chenggong
EXPERIMENTS TO LIMIT TE TRANSFER FROM SOILS TO PLANTS
181
County. This is consistent with the observation that liming has been used traditionally as a soil
amendment to increase alkalinity and reduce TE mobility.
During the first 5 weeks, pH fluctuated. For example, pH of L1 increased and pH of L6 decreased.
Many biological processes should occur during this period under lime application. Lime
application improves organic matter decomposition, increases biological activities, resulting in pH
variations (Dermatas & Meng X.G., 2003; Tang L.N. & Xiong D.Z., 2003). This may be also a
question of dissolution rate of lime. After 5 weeks, a new balance of soil processes was reached
and pH became stable. It is suggested that effects of lime on pH and TE mobility do not happen
immediately, but need at least 5 weeks. But the experiment is not long enough to show the
duration of the effect on pH.
Lime application increases soil pH, resulting in decreasing contents of A-fraction Pb, Cd and Zn.
Significant negative relationships between contents of A-fraction Cd and Zn and rate of lime
application were observed after 6 months. It is suggested that contents of A-fraction Cd and Zn are
influenced by lime and pH. RRCT decreased with rate of lime application after 6 months.
Contents of A-fraction TE in soil with lime application can be kept at low levels compared with
control (CK), resulting in the low potential availability of TE transfer from soil to plant. Because
no significant difference in contents of A-fraction Cd and Zn between 3 and 6 months was
observed in FPOT, contents of A-fraction Cd and Zn were influenced by pH and kept stable under
plant growth, although root exudates from plant may cause variations in soil pH.
6.4.2. Changes in transfer of trace elements from soil to Chinese
cabbage with lime and pig manure application
Significant positive relationships between A-fraction TE in soil and TE contents in Chinese
cabbage were observed. It is suggested that Chinese cabbage more easily absorbs A-fraction TE
and accumulates TE. This fraction mainly includes water soluble and exchangeable TE.

EXPERIMENTS TO LIMIT TE TRANSFER FROM SOILS TO PLANTS
182
No significant difference in AEC of Pb and Cu between CK and lime treatments in MPOT was
observed. It is suggested that AEC of Pb and Cu is stable and could not be changed by lime. Due
to no significant differences in AEC of Pb and Cu between lime and pig manure application, AEC
of Pb and Cu should not be influenced by pig manure. Zimdahl & Foster (1976) believed that
organic matter addition did not offer much promise as a method to reduce Pb availability to plants.
However, this research shows addition of lime and organic matter could decrease Pb and Cu
availability in soil, but do not change AEC of Pb and Cu in Chinese cabbage.
AEC of Cd and Zn decreased with increased rate of lime application in MPOT. AEC of Zn in
MPOT was higher than in TPOT and LPOT, which should be relative to original low pH in the
mountain unit. That means that AEC of Cd and Zn was high in low pH, and decreased with
increased pH. AEC of Cu and Zn increased with increased pig manure. AEC of Cd and Zn varied
with lime and pig manure application. AEC of Cd and Zn with lime application was higher than
with lime + pig manure. AEC of Cd and Zn decreased with lime and pig manure application
together, resulting in decreased TE accumulation.
6.4.3. Trace element contents and biomass of Chinese cabbage
A. Trace element contents in Chinese cabbage
In FPOT and field experiments, TE contents in Chinese cabbage decreased with rate of lime
application. A significant negative linear relationship between Pb contents and rate of lime
application was observed. Pb contents in Chinese cabbage with T3 and T4 in the mountain unit
were lower than Chinese standard values. Cd, Cu and Zn contents were lower than control (CK)
and standard values of Chinese cabbage with lime treatments. It is suggested that treatments of
lime at 3,375 and 6,750 kg/ha could be used to decrease TE contents in Chinese cabbage to meet
standard value and improve its quality. Activity of microbes and availability of phosphate are
improved with lime application (Meng C.F., et al., 2004). Meanwhile, pathogenic bacteria, pest
eggs and weeds will be killed, and clubroot could be prevented from Chinese cabbage due to
alkalinity. Lime application is regarded as a useful practice for controlling TE transfer from soil to
plant (Chen N.C. & Chen H.M., 1996; Xia H.P., 1997). Ideal pH 6.5-7.0 should be a target for this

EXPERIMENTS TO LIMIT TE TRANSFER FROM SOILS TO PLANTS
183
area. This will improve both Chinese cabbage growth and quality related more specially to TE
contents.
With pig manure application, contents of Pb and Cd in Chinese cabbage with high pig manure
were lower than with low pig manure; Zn contents were similar in MFD. No significant difference
in TE contents between with low pig manure and high pig manure was observed in TFD and LFD.
The mechanism for OM influencing availability of TE lies in humus in organic mater bound with
TE to form stable chelates (metal-HA complex), especially humin. Because of dilution of organic
fertilizer, TE contents in Chinese cabbage decreased in soil. Meanwhile, some elements in organic
fertilizer have antagonism with TE.
With lime + low pig manure, TE contents in Chinese cabbage decreased with rate of lime
application in the three units. But differences in TE contents between low lime + low pig manure
(T2P1) and high lime + low pig manure (T4P1) are not significant in LFD and TFD, possibly due
to the “higher” original pH. TE contents in Chinese cabbage decreased with rate of lime
application in all three units with lime + high pig manure. Zn contents in TFD were high, which
could be relative to high Zn contents in pig manure, whilst contents of Pb, Cd and Cu in LFD were
higher than the control (CK). High pig manure should result in TE content increase. Massive
amounts of organic matter would be required to achieve small increases in soil organic content and
exert an effect on TE accumulation by plants. Further research is necessary to determine the effect
of organic material applications on TE availability. Despite differences in opinion, organic matter
with low TE contents does have a protective value and fixed TE. Hence, it is possible to increase
pH in soil and decrease TE contents in Chinese cabbage with lime and pig manure application
without TE.
B. Biomass of Chinese cabbage
Biomass of Chinese cabbage increased with rate of lime and pig manure application. Application
of lime and pig manure would improve Chinese cabbage growth. Organic fertilizers may improve
soil structure, and decrease TE mobility, and then improve plant growth. Crops grow well when
soil pH is between 6.5-7.0 and nutrients are more available. The yield of crops increases with soil

EXPERIMENTS TO LIMIT TE TRANSFER FROM SOILS TO PLANTS
184
pH increase in the optimal pH range. However, although TE accumulation of each plot decreased
more often with biomass increase, Pb accumulation in TFD with the pig manure and lime + pig
manure treatments were great or close to control level (CK), and Cd accumulation of treatment
T2P2 was higher than the control (CK). That should be relevant to the quality of lime and pig
manure. Especially, Pb and Cd contents in pig manure in TFD were 2.81 times and 2.76 times of
that in LFD, respectively. Cd contents in lime in TFD were 2.63 times of LFD. Quality of lime
and organic fertilizers should be taken into account when they were used for amendment additives
in situ to soil contaminated by TE. More attention should be paid to Pb, Cd , Cu and Zn contents
in pig manure.
6.5. CONCLUSIONS
With increases in lime and pH, contents of acetic-acid extractable TE in soil and TE contents in
Chinese cabbage decrease. AEC of Pb and Cu is stable and could not be changed, and the AEC of
Cd and Zn decrease with lime application. AEC of Cd and Zn was high in low pH, and decreased
with increased pH. Treatments of lime at 3,375 kg/ha could be used to improve the quality of
Chinese cabbage. With pig manure application, Pb and Cd contents with high pig manure were
lower than with low pig manure. Zn contents were similar in MFD. AEC of Pb and Cu was stable
and could not be changed, and of Cd and Zn decreased with pig manure application.
With lime + low pig manure application together, AEC of Pb and Cu could not be influenced, and
the AEC of Cd and Zn decreased. TE contents in Chinese cabbage decreased and biomass of
Chinese cabbage increased. More attention should be paid to TE accumulation in Chinese cabbage.
Lime and pig manure would be more effective with low pH in the mountain unit. Optimal rate of
lime (T3: 3,375 kg/ha) and pig manure (P1: 16,875 kg/ha) should be considered by farmers as
effective at low cost and with beneficial effects on soil structure. In general, TE contents in the
eaten part of Chinese cabbage and biomass may be changed with lime and pig manure application,
including decreasing TE contents and improving the quality of Chinese cabbage (+), increase and
affect the quality of Chinese cabbage (-). Moreover, some results were not significant (NS) (Table
6.12).
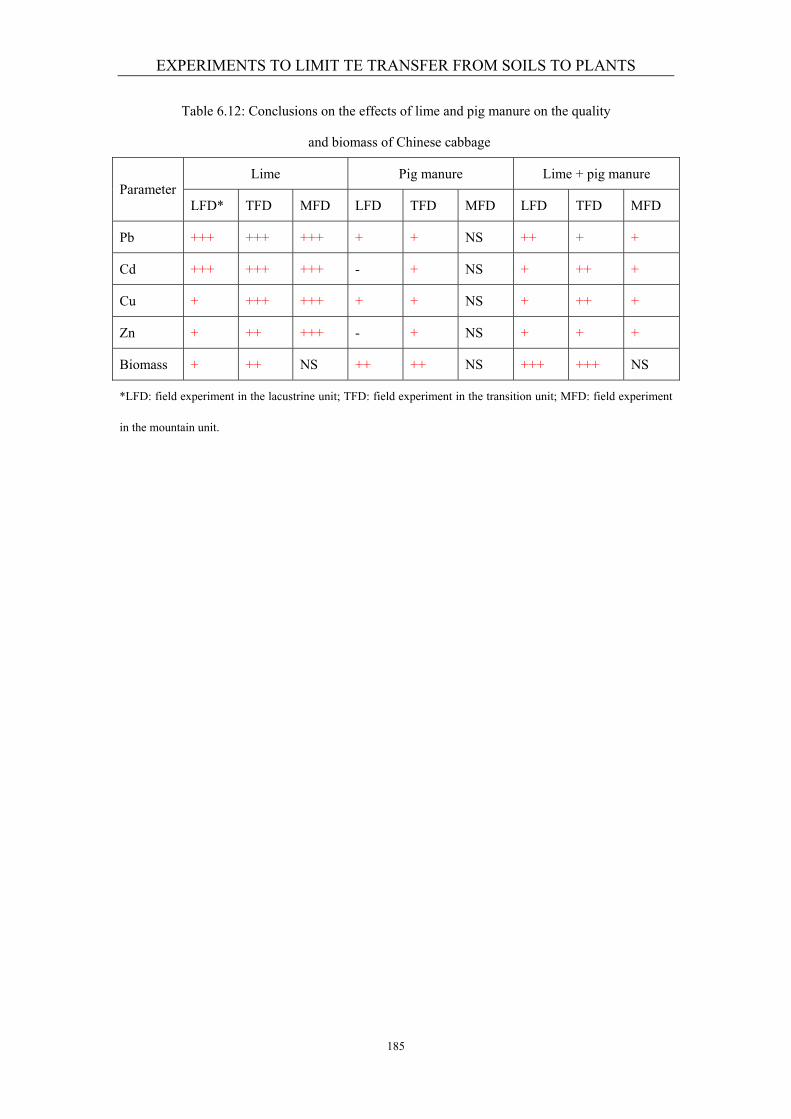
EXPERIMENTS TO LIMIT TE TRANSFER FROM SOILS TO PLANTS
185
Table 6.12: Conclusions on the effects of lime and pig manure on the quality
and biomass of Chinese cabbage
Lime Pig manure Lime + pig manure Parameter
LFD* TFD MFD LFD TFD MFD LFD TFD MFD
Pb +++ +++ +++ + + NS ++ + +
Cd +++ +++ +++ - + NS + ++ +
Cu + +++ +++ + + NS + ++ +
Zn + ++ +++ - + NS + + +
Biomass + ++ NS ++ ++ NS +++ +++ NS
*LFD: field experiment in the lacustrine unit; TFD: field experiment in the transition unit; MFD: field experiment
in the mountain unit.


186
VII: GENERAL CONCLUSIONS Field investigations were conducted in 2002-2006 in Chenggong County, in order to understand
natural TE contents and anthropogenic contamination in soil, to assess TE contamination in soils
and vegetables, as well as the transfer of TE from soils to vegetables in Chenggong County.
Geomorphopedological investigations lead to the research area being divided into three units:
lacustrine unit, transition unit and mountain unit.
Geomorphological soil characteristics: Topsoil texture of samples tended to sandy and loam near
Dianchi Lake, and clay close to the mountain. Soil colour is brown and dark near the lake, while
red in the mountain unit. Mean pH, physical clay (<0.01 mm), SOC content and CEC are 6.2,
~51.9%, 1.5% and 24.1 cmol/kg, respectively. In the three units, subsoil texture is mainly clay.
Sandy clay texture is also found near the lake. Subsoil colour is dark brown in the lacustrine unit,
while reddish brown in the transition and mountain units.
TE total contents: As a whole, mean TE contents in topsoil are 56.7 for Pb, 0.47 for Cd, 125.7 for
Cu and 114.2 mg/kg for Zn. TE contents decrease from north-east to south-west, which is
consistent with the elevation gradient. Thus, the mean contents of Pb, Cd, Cu and Zn in the
mountain unit are higher than in the transition and lacustrine units: M>T(L) for Pb, M>T>L for Cd,
Cu and Zn.
The detailed approach has shown that there are significant differences of TE contents from south
to north with distance from Chenggong town in the lacustrine unit and with distance to the
mountain in the transition unit. However, there is no significant difference between TE contents
from west to east with distance from Dianchi Lake in the lacustrine and between the two selected
villages in the transition unit. TE accumulation is usually observed along the road in the two
selected sites. Although the greenhouses are close to each other, significant differences of Pb, Cu
and Zn contents in soil still exist, except for Cd (for which content it is only trace).

GENERAL CONCLUSIONS
187
As a whole, mean TE contents in subsoil are Pb: 58.2, Cd: 0.89, Cu: 129.1 and Zn: 97.0 mg/kg.
TE contents in subsoil with red colour and clay texture are higher than with brown colour and
sandy texture (sandy loam). Mean TE contents in subsoil are higher with limestone than with
sandstone and shell. Contents of Cu and Zn in subsoil with few mottles are higher than with more
mottles, but it is the opposite for Cd. Most of the ratio of TE contents in top/subsoil (RTS) for Pb
and Zn are ≥1.0, and most of RTS for Cd and Cu are ≤1.0, which indicates relative accumulation
of Pb and Zn in topsoil and Cu and Cd in subsoil.
Soil assessment based on total contents: Mean total TE contents in the topsoil are 2-7 times of TE
contents observed in world soils and even Kunming Prefecture soils. The signal index of
contamination (Pi) of TE are <2, indicating to low contaminated levels, except for Cu which
presents a medium contaminated level. Pi of Cd and Cu in the mountain unit are higher than in the
lacustrine and transition units (M>L>T). The integrative index of contamination (P) of TE is >3,
indicating a globally high contaminated level.
Vegetable quality: For 95.2% of the vegetable samples, mean Pb contents in eaten parts exceed
the Chinese standard value. This situation is observed with only 9.5% of the samples for Cd,
19.1% for Cu and 3.2% for Zn. The highest contents are observed for Pb in cauliflower, Cd in
lettuce and Chinese cabbage, Cu and Zn in pea. But tomato has the lowest contents of Pb, Cd, Cu
and Zn. Mean TE contents in Chinese cabbage are 0.33 for Pb, 0.02 for Cd, 0.97 for Cu and 3.45
mg/kg FM for Zn.
Soil-plant relationship: Two different ways to estimate the bioavailability of soil TE for Chinese
cabbage have been tested: available and sequential extraction fraction (SEF) TE contents.
The mean available TE contents are 7.4 for Pb, 0.19 for Cd, 16.9 for Cu and 12.2 mg/kg for
Zn.
A-fraction TE contents are 1.38 for Pb, 0.06 for Cd, 1.25 for Cu and 1.85 mg/kg for Zn.
B-fraction TE contents are 6.53 for Pb, 0.13 for Cd, 4.57 for Cu and 16.49 mg/kg for Zn.
C-fraction TE contents are 5.80 for Pb, 0.045 for Cd, 18.4 for Cu and 19.89 mg/kg for Zn.

GENERAL CONCLUSIONS
188
SEF TE contents show that B-fraction TE contents are higher than C-fraction and A-fraction
(B>C>A) for Pb and Cd, and C-fraction TE contents are higher than B-fraction and A-fraction
(C>B>A) for Cu and Zn.
Available and A-fraction TE contents in the lacustrine unit are higher than in the transition unit
(L>T). Pb contents in Chinese cabbage decrease with B-fraction Pb increase. Cd contents in
Chinese cabbage increase with increase in available Cd. Increasing in B and C-fractions Cu seems
to increase Cu absorption by vegetables, especially in the lacustrine unit. Zn contents in Chinese
cabbage increase with increase in total, available and SEF contents of Zn. In order to assess soil
suitability, available TE and SEF TE contents better indicate the potential risk for vegetables.
Different soil TE fractions are suggested for soil assessment indicators.
Experiment approach: Pot and field experiments have been conducted to propose modified
additives in order to decrease the TE contents in Chinese cabbage and improve its quality. Lime
and pig manure have been applied to modify soil pH and more generally to reduce the mobility of
TE in situ. The results show that pH fluctuates during the first 5 weeks and then remains stable.
With increasing lime rate and pH, contents of acetic-acid extractable fraction (A-fraction) TE in
soil decrease. Enrichment coefficients relative to TE availability (AEC) of Pb and Cu are stable
and are not changed by lime or pig manure. AEC of Cd and Zn, which are high in low pH,
decrease with increasing pH and application rate of lime and pig manure.
TE contents in Chinese cabbage decrease with rate of lime and pig manure application. Lime and
pig manure would be more effective on low pH soil in the mountain unit. Biomass of Chinese
cabbage increases with rate of lime and pig manure application. Quality of lime and organic
fertilizers should be taken into account when they are used for trapping TE in soil contaminated by
TE.
Limitations of the research: This research, which began with the programme PRA 01-02, lasted
four years. Many shortcomings should be overcome in the future. Soil and vegetables samples
were taken during two years. Pot and field experiments were also conducted during different years.

GENERAL CONCLUSIONS
189
The first pot experiment was conducted in Autumn 2003, field experiments in the mountain unit
being conducted in Spring 2004 and others in Autumn 2006. That makes some difficulty in
comparing results. Especially, it was the rainy season when Chinese cabbage grew in the field in
the mountain unit, and it suffered from disease just before harvest, making it difficult to evaluate
biomass. Meanwhile, lime and pig manure were bought in the markets just before application. It is
difficult to know immediately their TE contents, which makes the results more complicated.
For the field experiments, the suitable plots were difficult to choose. On the one hand, the farmers
should agree to apply lime and pig manure as treatments. On the other hand, in order to obtain
more significant results, it is should be better to work with soil with low pH and high TE contents.
The area of plots was not the same in the three units, which were limited by greenhouses and
boundaries.
Suggestions for future research: Many research projects should be conducted in the future:
Indicators of available TE and SEF TE in soil are recommended, which need more field
investigations to obtain the threshold values according to soil pH and soil types.
Application rate of lime is recommended in the mountain unit, which also should be
thoroughly verified in the field.
It is necessary to decide vegetables standard values in dry materials, due to the different
water content in vegetables. More attention should be paid to TE accumulation in vegetables
and food chain links to human health.
More attention should be paid to the quality of pig manure and other organic fertilizers
applied in Chenggong County. On the one hand, quality of animal food additives should be
strict with acidity and TE contents meet relative standards, especially Cu and Zn contents
which are used in animal food. On the other hand, supervision and management from
government should consider TE contents in markets of organic fertilizers. It should be
considered which kind of organic fertilizer could be used and what to do with the pig manure.
The non-consumed part of vegetables should be treated carefully due to high TE contents, if
not, TE will continue to be recycled within soils. It is important to find possible methods to
treat the non-consumed part of vegetables. Furthermore, increasing quantities of sludge will

GENERAL CONCLUSIONS
190
be applied into agricultural soil. Attention should be paid to their quality and how to use
them.
Because TE in soil and vegetables is still introduced from atmospheric deposits, Dianchi
Lake, fertilizers and pesticides, detailed research about the sources of TE should be
undertaken.
With the development of Kunming City, persistent monitoring of soil quality and vegetable
quality should be maintained, as a key to guarantee human health.
It would be useful to co-operate with different counties, including research strategy,
analytical methods and TE standard values.
In general, results have been obtained to evaluate TE contents in soil, assess soil quality and
vegetable quality, and improve Chinese cabbage quality, even though some shortcomings exist.
More research should be taken into sources of soil TE, quality of organic fertilizers, suitable
utilization of the non-consumed part of vegetables, recommended standard values for soil and
vegetables, and amendment methods for soil contaminated by TE in the future.


191
REFERENCES 1. Adriano, D.C. 2001. Trace Elements in Terrestrial Environments; Biogeochemistry,
Bioavailability and Risk of metals. 2nd edn, Springer, New York. p. 866. 2. Ai, J.Q. 2003. Effect of dynamic equilibrium of the total cultivated land. Reform, 6: 45-51. 3. Alpaslan, B. and Yukselen, M.A. 2002. Remediation of lead contaminated soils by
stabilization/solidification. Water, Air and Soil Pollution, 133(1/4): 253-263. 4. An, Z.Z., Wang, X.C. and Shi, W.M. 2002. Plant physiological responses to the interactions
between heavy metal and nutrients. Soil and Environmental Sciences, 11(4): 392-396 (in Chinese).
5. Anderson, T.A., Kruger, E.L. and Coats, J.R. 1994. Enhanced degradation of a mixture of three herbicides in the rhizosphere of an herbicide-tolerant plant. Chemosphere 28: 1551-1557.
6. Baath, E., Diaz-Ravina, M., Frostegard, A. and Campbell, C.D. 1998. Effect of metal-rich sludge amendments on soil microbial community. Applied and Environmental Microbiology. 64: 238-245.
7. Baker, A.J.M. 1981. Accumulators and excluders, strategies in the response of plants to heavy metals. Journal of Plant Nutrition, 3, 643-654.
8. Bellett, M.F., Fitzpatrick, E.A. and Cresser, M. 1991. Long-term changes in the Cu, Pb and Zn content of forest soil organic horizons from north-east Scotland. Water, Air and Soil pollution, 59: 179-191.
9. Bi, R. T., Wang, B. and Duan, Y. H. 2004. Establishment and application of farm land resource management information systems - A case study of Yongi City. Acta Pedologica Sinica, 41(6): 962-968 (in Chinese).
10. Bolan, N.S., Adriano, D.C., Mani, A.P. and Duraisamy, A. 2003. Immobilization and phytoavailability of cadmium in variable charge soils. II. Effect of lime compost. Plant and Soil, 251: 187-198.
11. Booklet of Yunnan map. 2002. China Map Press, Beijing, China. 12. Cakmak, I., Welch, R.M., Erenoglu, B., Romhelu, B., Romheld, V., Norvell, W.A. and
Kochian, L. V. 2000. Influence of varied zinc supply on re-translocation of cadmium (109Cd) and rubidium (86Rb) applied on mature leaf of durum wheat seedlings. Plant and Soil, 219, 279-284.
13. Cao, S.P. 2004. Vertical distribution of heavy metal pollutant in soil profiles of Tianjin. Contributions to Geology and Mineral Resources Research, 19 (4): 270-274 (in Chinese).
14. Chen, B. M. 2004. Study and countermeasures for protection of arable land and basic farm land. Journal of China Agricultural cultural Resources and Regional Planning, 25 (5): l-4 (in Chinese).
15. Chen, H.M. 2005. Environmental Soil Science. Science Press, Beijing,China. p. 216-223 (in Chinese).
16. Chen, H.M., Zheng, C.R., and Tu, C. 2000. Chemical methods and phytoremediation of soil contaminated with heavy metals. Chemosphere, 41: 229-234.
17. Chen, H.M., Zheng, C.R., Zhou, D.M., Wang, S.Q. and Lin, Y.S. 2006. Soil environmental quality: A review. Journal of Agro-Environment Science, 25 (4): 821-827 (in Chinese).

REFERENCES
192
18. Chen, N.C. and Chen, H.M.1996. Soil-plant system of heavy metal pollution. Science Press, Beijing, China. p. 309-333 (in Chinese).
19. Chen, T.B., Song, B., Zheng, Y.M., Huang, Z.C., Lei, M. and Liao, X.Y. 2006. A survey of lead concentrations in vegetables and soils in Beijing and their health risks. Scientia Agricultura Sinica, 39 (8): 1589-1597 (in Chinese).
20. Chen, Y.C., Zhao, Z.J., Sun, P.S., Zhou, H., Ouyang, J., Chen, H., Zhang, X. and Yin, J. 2003. Distribution and control of heavy metals by additives in soil-vegetable system in Chongqing. Journal of Agro-environment Science, 22 (1): 44-47 (in Chinese).
21. Cheng, S.P. 2003. Heavy metal pollution in China: origin, pattern and control. Environment Science and Pollution Research, 10 (3): 192-198.
22. Chopin, E.I.B. and Alloway, B.J. 2007. Distribution and mobility of trace elements in soils and vegetation around the mining and smelting areas of Tharsis, Riotinto and Huelva, Iberian Pyrite Belt, SW Spain. Water Air and Soil pollution, 182 (1-4): 245-261.
23. Cox, W.J. and Reisenauer, H.M. 1997. Ammonium effects on nutrient cation absorption by wheat. Agronomics Journal, 69: 868-871.
24. Dai, H.L., Xu, W.H., Xiong, Z.T. and Liu, J.Z. 2007. Effects of Zn stress on NPK uptake and Zn accumulation in four varieties of Chinese cabbage. Journal of Southwest Agricultural University (Nature Science), 28 (3): 410-413, 417 (in Chinese).
25. Dermatas, D. and Meng, X.G. 1996. “Stabilization/Solidification (S/S) of heavy metal contaminated soils by means of a quicklime-based treatment approach”, Stabilization and solidification of hazardous, radioactive, and mixed wastes, ASTM ATP 1240. American Society for Testing and Materials (ASTM), Philadelphia, PA, 499-513.
26. Dermatas, D. and Meng, X.G. 2003. Utilization of fly ash for stabilization/solidification of heavy metal contaminated soils. Engineering Geology, 70: 377-394.
27. Diels, L., Van der Lelie N. and Bastiaens, L. 2002. New developments in treatment of heavy metal contaminated soils. Review Environment Science Biology/Technology, 1: 75-82.
28. Ding, Y. 2000. The management of polluted soils by heavy metals. Environment and Development, 15 (2): 25-28 (in Chinese).
29. Du, W., Zhang, X., and Jiang, W. 1999. The significance and the determination of the chromium content of the food in Qingdao District. Research Trace Elements and Health, 16 (3): 42-43 (in Chinese).
30. Duan, C.Q., Wang, H.H. and Yang, S.L. 2006. Pollution-free vegetable production: Theory and Practices. Science Press, Beijing, China (in Chinese).
31. Dudka, S. and Miller, W.P. 1999. Accumulation of potential toxic elements in plants and their transfer to human food chain. Journal of Environmental Science and Health, B34: 681-708.
32. Eriksson, J.E. 1989. The influence of pH, soil type and time on adsorption by plants of Cd added to the soil. Water, Air and Pollution, 48: 317-335.
33. FAO-ISRIC (International Soil Reference and Information Certre). 2006. Guidelines for soil description. 4th edition. Roman.
34. Feng, G.Y., Zhang, J. and Wu, J.P. 1993. Review of environmental quality on heavy metal element pollution vegetable soils in the Baoshan district, Shanghai. Journal of Shanghai Agricultural College, 11 (1): 35-42 (in Chinese).
35. Fitzgerald, E.J., Caffrey, J.M., Nesaratnam, S.T. and McLoughlin, P. 2003. Copper and lead concentrations in salt marsh plants on the Suir Estuary, Ireland. Environment Pollution, 123:

REFERENCES
193
67-74. 36. Flessel, C. P. 1977. Metal as mutagens. Advances in Experimental Medicine and Biology, 91,
117-128. 37. Fliepbach, A. Martens, R. and Reber, H. 1994. Soil microbial biomass and activity in soils
treated with heavy metal contaminated sewage sludge. Soil Biological Biochemistry, 26: 1201-1205.
38. Fodor, F., Sarvari, E., Lang, F., Szigeti, Z. and Cseh, E. 1996 a. Effects of Pb and Cd on cucumber depending on the Fe-complex in the culture solution. Journal of Plant Physiology, 148: 434-439.
39. Fodor, F., Cseh, E., Dao Thi Phuong, D. and Zaray, Gy. 1996 b. Uptake and mobility of lead in Urtica dioica L. Acta Phytogeographica Scientica, 81: 106-108.
40. Fu, B.D. and Zheng, X. Q. 2004. Re-discussion dynamic equilibrium of the total cultivated land in China. China Land Science, l8 (4): 38-42 (in Chinese).
41. Fu, J.L., Zhang. M.K., Li, R.A. 2005. GIS-assisted assessment and spatial variation of heavy metal pollution in soils of residential areas of Hangzhou City. Chinese Journal of Soil Science, 36 (8): 575-578 (in Chinese).
42. Gao, X.Y., Tang, Z.Y., Li, J.H. and Wang, L. 2006. Current situation of soil environmental pollution and countermeasures of prevention and control in China. Jiansu Environmental Science and Technology, 19 (2): 52-55 (in Chinese).
43. Gao, R.T., Liu, Y.Z., Liu, S.Q. and Xie, J.Z. 2002. Effects of heavy metal pollution in soil on nutrition quality of vegetable in Baoding. Journal of Agro-environment Science, 21 (4): 325-327 (in Chinese).
44. Goovaerts, P., and Webster, R. 1994. Scale-dependent correlation between topsoil copper and cobalt concentrations in Scotland. European Journal Soil Science, 45: 79-95.
45. Guo, Z.H., Huang, C.Y. and Liao, B.H. 2003. Effects of simulated acid rain on Cd, Cu and Zn release and their form transformation in polluted soils. Chinese Journal of Applied Ecology, 14(9): 1547-1550 (in Chinese).
46. Guo, G.L., Zhou, Q.X. and Ma, L.Q., 2006. Availability and assessment of fixing additives for the in situ remediation of heavy metal contaminated soils: A review. Environmental Monitoring and Assessment, 116: 513-528.
47. Hartwig, A. 1995. Current aspects in metal genotoxicity. BioMetals. 8 (1) 3-11. 48. Hatter, R.D. and Naidu, R. 1995. Role of metal-organic complexion in metal sorption by soils.
Advances in Agronomy. Academic Press, London, UK. 49. He, L.L., Li, Y. 2003. The comprehensive control of soil polluted by pesticide in farmland.
Journal of Yunnan Agricultural University, 18 (4): 430-434 (in Chinese). 50. He, Q.B. and Singh, B.R. 1994. Crop uptake of cadmium from phosphorus fertilizers. I. Yield
and cadmium content. Water, Air and Soil Pollution, 74: 251-265. 51. Heinrich, A. 2007. The application of multivariate statistical methods for the evaluation of
soil profiles. Journal of Soils and Sediments, 7 (1): 45-52. 52. Hua, L., Chen, S.B. and Bai, L.Y. 1998. Effect of organic matter on soil Cd and Zn.
Agro-Environmental Protection, 17 (2): 55-59 (in Chinese). 53. Hua, Z.Z. and Duan, Q.Z. 2001. Condition of fertilizer utilization in Yunnan Province
practice and popularisation of high concentration phosphate complex. Yunnan Science and Technology Publishing Company, Kunming, China (in Chinese).

REFERENCES
194
54. Huang, G.F. and Wu, Q.T. 2000. Recommendation of amendment on standards of soil environmental quality for green-food production area. Agro-environmental Protection, 19 (2): 123-125 (in Chinese).
55. Jansson. G. and Oborn, I. 2000. Cadmium content of Swedish carrots and the influence of soil factors. Acta Agricultural Scan Section B. Soil and Plant Science, 50:49-56.
56. Jiang, L.Y., Yang, X.E., Ye, H.B., Shi, W.Y. and Jiang, Y.Y. 2002. Effect of copper refining on spatial distribution of heavy metal in surrounding soils and crop. Journal of Zhejiang University (Agriculture & Life Sciences), 28 (6): 689-693 (in Chinese).
57. Jiang, Z.D. 2004. The structure and the optimal approaches for agricultural land use in China. Guangdong Land Science, 3 (4): 12-14 (in Chinese).
58. Kabala, C. and Szerszen, L. 2002. Profile distribution of lead, zinc, and copper in Dystric Cambisols developmented from granite and gneiss of the Sudetes Mountains in Poland. Water, Air and Soil Pollution, 138: 307-317.
59. Karblane, H. 1994. The effect of organic lime and phosphorus fertilizers on Pb, Cd and Hg content in plant. Proceedings of the Estonian Academy of Sciences Ecology, 6: 52-56.
60. Khan, A.G., Kuek, C., Chaudhry, T.M., Koo, C.S. and Hayes, W. 2000. Role of plants, mycorrhizae and phytochelators in heavy metal contaminated land remediation. Chemosphere, 41: 197-207.
61. Kirkham, M.B.1977. Organic matter and heavy metal uptake. Compost Science, 18 (1): 18-21.
62. Koretsk, C.M., Haveman, M., Beuving, L., Cuellar, A., Shattuck, T. and Wagner, M. 2007. Spatial variation of redox and trace metal geochemistry in a minerotrophic fen. Biogeochemistry, 86 (1): 33-62.
63. Koretsky, C.M., Haas, J.R., Ndenga, N.T. and Miller, D. 2006. Seasonal variations in vertical redox stratification and potential influence on trace element speciation in minerotrophic peat sediments. Water, Air and Soil Pollition, 173: 373-403.
64. Krupa Z., Siedlecka A. And Skorzynska P. 1997. Heavy metal interactions with plant nutrients, in H Bruno Schiefer, D V M, Donals G.L., Shirly C Buzik B.S.P. (eds), Understanding Toxicology, CRC Press, 287-301.
65. Kumar, V., Yadav, D.V. and Yadav, D.S. 1990. Effects of nitrogen sources and copper levels on yield, nitrogen and copper contents of wheat (Triticum aestivum L.). Plant and Soil, 126, 79-83.
66. Kunming Soil Investigation Office, 1984. Chenggong soil (unpublished). 67. Lagriffoul, A., Mocquot, B., Mench, M. and Vangronsveld, J. 1998. Cadmium toxicity effects
on growth, mineral and chlorophyll contents, and activities of stress related enzymes in young maize plants (zea mays L.). Plant and Soil, 200: 241-250.
68. Lee, B.D., Carter, B.J., Basta, N.T. and Weaver, B. 1997. Factors influencing heavy metals distribution in six Oklahoma benchmark soils. Soil Science Society of America Journal, 61: 218-223.
69. Li, Y., Yang, J.L. and Wang, X.L. 1999. The effect of UV-B radiation on the population quantity of spring wheat rhizosphere microorganisms. China Environmental Science, 19 (2): 157-160 (in Chinese).
70. Li, Z.L. and Xue, C.Z. 1994. Sewage irrigation soil Pb, Cd morphology. Agricultural Environmental Protection, 13 (4): 152-157 (in Chinese).

REFERENCES
195
71. Liaghati, T., Preda, M. and Cox M. 2003. Heavy metal distribution and controlling factors within coastal plain sediments, Bells Creek catchment, southeast Queensland, Australia. Environment International, 29: 935-948.
72. Liao, M., Huang, C.Y. and Xie, Z.M. 1999. Effect of pH on transport and transformation of cadmium in soil water system. Acta Scientiae Circumstantiae, 910: 81-86 (in Chinese).
73. Liao, M., Huang, C.Y. and Xie, Z.M. 1998. Exerting the lime lowers different and female quality soil the Cd toxicity mechanism research in the different and female quality soil. Agro-Environmental Protection, 17 (3): 101-103 (in Chinese).
74. Liao, Z. 1993. The Environmental Chemistry and Biological effects of microelements. China Environmental Science Press, Beijing, China (in Chinese).
75. Lin, K.F. 1996. Ramie absorption characteristics of cadmium and cadmium soil improved test. Agricultural Environmental Protection, 15 (1): 1-4, 8 (in Chinese).
76. Liu, F., Wang, H.T. and Wang, D.L. 2004. Spatial distribution of heavy metals from the Laizhou Bay Littoral wetland. Advances in Marine Science, 22 (4): 476-482 (in Chinese).
77. Liu, F.Z. 2001. Booklet of Agriculture Monitoring. Chinese Standard Press, Beijing, China (in Chinese).
78. Liu, F.Z., Shi, R.G., Xu, Y.P. and Cai, Y.M. 2007. Study on soil environmental suitability assessment for agricultural producing area. Journal of Agro-environment Science, 26 (1): 6-14 (in Chinese).
79. Liu, G.L. 1991. China Organic Fertilizers. Agricultural Publishing Company, Beijing, China. p. 56-60 (in Chinese).
80. Liu, H. J., Tan, K. and Luo, Z. C. 2004. Protection and sustainable utilization of cultivated land source in Hunan Province. Soils, 36 (3): 232-234 (in Chinese).
81. Liu, H.X. and Han, B.P. 2004. Evolutional feature of heavy metals in soils in northern suburban of Xuzhou. Journal of Agro-environment Science, 23 (6): 1177-1181 (in Chinese).
82. Liu, Q. and Wang, Z.J. 1996. Morphology and heavy metal toxicity and bioavailability of study on the relationship between progresses. Environmental Science, 17 (1): 89-92 (in Chinese).
83. Liu, X., Liu, S.Q. and Wang, S.A. 2003. Distribution of cadmium and lead forms and its affecting factors in soils of Hebei Province. Acta Pedologica Sinica, 40 (3): 393-400 (in Chinese).
84. Liu, X., Liu, S.S. and Wang, S.A. 2002a. Relationship between Cd and soil enzyme activity in soil in Hebei Province. Journal of Hebei Agricultural University, 25 (1): 5-6 (in Chinese).
85. Liu, X., Liu, S.Q. and Wang, S.A. 2002b. The relationship between heavy metal forms and soil enzymatic activities in the main soils of Hebei Province. Journal of Hebei Agricultural University, 25 (1): 33-37 (in Chinese).
86. Liu, Y.S. 1998. Chinese cabbage in China. China Agriculture Press, Beijing, China. p. 10-79, 350-355 (in Chinese).
87. Liu, Y.Y., Liu, M. and Liu, H.F. 2006. Distribution of heavy metals in urban soil of Urumqi City. Arid Land Geography, 1 (29): 120-123 (in Chinese).
88. Lu, R.S. 1998. The principle of the soil-plant with fertilizer application. Press of Chemistry Industry, Beijing, China. p. 443 (in Chinese).
89. Luo, J.F., Xia, Z.L. and Meng, W.Q. 1998. Geographical differentiation of heavy metal state in soils (Cd, Pb and Cu). Geographical Research, 17 (3): 265-272 (in Chinese).

REFERENCES
196
90. Luo, X.M. and Zhu, B. 2003. Southwest China Journal of Analyses of State of Nitrite Pollution in Vegetables from Chengdu and Chongqing. Agricultural Sciences, 16 (2): 79-81 (in Chinese).
91. Lv, J. 2001. Improvement and protection of agricultural soil. Zhengjiang University Press, Hanzhou, China (in Chinese).
92. Ma, W.X. and Duan, M. and Li, L. 2000. Assessment of pollution of heavy metals on vegetables from outskirts of Xi’an. Agro-Environmental Protection, 19 (2): 96-98 (in Chinese).
93. Majid, A. and Argue, S. 2001. Remediation of heavy metal contaminated solid wastes using agglomeration techniques. Minerals Engineering, 14 (11): 1513-1525.
94. Mankoonga, W., Hwangb, E.Y., Parka, J.S. and Choic, J.K. 2002. Bioremediation of diesel-contaminated soil with composting. Environment Pollution, 119: 23-31.
95. Marschner, H. 1995. Mineral Nutrition of Higher Plants. Academic Press, London, UK. 6-73. 96. Mathur, B.S., Rana, N.K. and Lal, S. 1991. Effect of rhizosphere application of lime on crop
yield, soil properties, nutrient uptake and economics. Journal of the Indian Society of Soil Science, 39 (3): 523-529.
97. McBride, M.B.1989. Reactions controlling heavy metal solubility in soil. Advances in Soil Science, 10: 48-56.
98. McCray, E.L., King, J. W., Peter, G. Appleby, P.G. and Hunt, A.S. 2001. Historical trace metal accumulation in the sediments of an urbanized region of the Lake Champlain Watershed, Burlington, Vermont. Water, Air and Soil Pollution, 125 (1): 201-230.
99. Meharg, A.A. and Cairney, J.W. 2000. Co-evolution of mycorrhizal symbionts and their hosts to metal-contaminated environments. Advanced Ecology Research, 30: 69-112.
100. Mejare, M. and Bulow, L. 2001. Metal binding proteins and peptides in bioremediation and phytoremediation of heavy metals. Trends in Biotechology, 19: 67-73.
101. Meng, C.F., Lu, X.N., Cao, Z.H., Hu, Z.Y. and Ma, W.Z. 2004. Long-term effects of lime application on soil acidity and crop yields on a red soil in Central Zhejiang. Plant and Soil, 265 (1-2): 101-109 (in Chinese).
102. Michalska, M. and Asp, H. 2001. Influence of lead and cadmium on growth, heavy metal uptake, and nutrient concentration of three lettuce cultivars grown in hydroponic culture. Community - Soil Science - Plant Analysis, 32 (3&4): 571-583.
103. Michopoulos, P., Baloutsos, G., Economou, A., Nikolis, N., Bakeas, E.B. and Thomaidis, N.S. 2005. Biogeochemistry of lead in an urban forest in Athens, Greece. Biogeochemistry, 73 (2): 345-357.
104. Misra, A. and Ramani, S. 1991. Inhibition of iron absorption by zinc induced Fe-deficiency in Japanese mint. Acta Physiology Plant, 13: 37-42.
105. Mo, Z., Wang, C.X. and Chen, Q. 2002. Form distribution and transformation of heavy metals of Cu, Pb, Zn, Cr and Cd in soils. Agro-environmental Protection, 21 (1): 9-12 (in Chinese).
106. Nan, Z.R. and Li, J.J. 2000. Study on the distribution and behavior of selected metals (Cd, Ni, Pb) in cultivated soil profils in arid zone (Take Baiyin region as an example). Arid Zone Research, 17 (4): 39-45 (in Chinese).
107. Nan, Z.R., Zhao, C.Y., Li, J.J., Chen, F.H. and Sun, W. 2002. Relations between soil properties and selected heavy metal concentrations in spring wheat (Triticum aestivum L.)

REFERENCES
197
grown in contaminated soils. Water, Air and Soil Pollution, 133: 205-213. 108. Nanjing Agricultural College. 1980. Agricultural Chemical Analysis of Soil. Agriculture
Publishing Company, Beijing, China. p. 99-100 (in Chinese). 109. National Bureau of Statistics of China. 1999. Statistic Data of Corps in China for 50 Years.
China Statistics Press, Beijing, China (in Chinese). 110. Navas, A. and Machin, J. 2002. Spatial distribution of heavy metals and arsenic in soils of
Aragon (northeast Spain): controlling factors and environmental implications. Applied Geochemistry, 17: 961-973.
111. Ndiaye, B. and Isabel, D. 1999. Geostatistical analysis of hydrogeology and agricultural land reclamation in the Senegal River delta. Journal of the American Water Resources Association, 35 (2): 265-276.
112. Oort, F.V., Jongmans, A.G., Citeau, I., Lamy, I. and Chevallier, P. 2006. Microscale Zn and Pb distribution patterns in subsurface soil horizons: an indication for metal transport dynamics. European Journal of Soil Science, 57: 154-166.
113. Ouzounidou, G. 1995. Cu-ions mediated changes in growth, chlorophyll and other ion contents in a Cu-tolerant Koeleria Splendens. Biological Plant, 37: 71-78.
114. Pacifico, R., Adamo, P., Cremisini, C., Spaziani, F. and Ferrara, L. 2007. A geochemical analytical approach for the evaluation of heavy metal distribution in lagoon sediments. Journal of Soils and Sediments, 7 (5): 313-325.
115. Panichayapichet, P., Nitisoravut, S. and Simachaya, W. 2007. Spatial distribution and transport of heavy metals in soil, ponded-surface wter and grass in a Pb-contaminated watershed as related to land-use practices. Environment Monitoring Assessment, 135(1-3): 181-193.
116. Peng, K.M., Lv, J.L. and Chen, J.R. 1990. Agricultural Chemistry. Agricultural Press, Beijing, China (in Chinese).
117. Pennanen, T., Frostegard, A. and Baath, E. 1996. Phospholipid fatty acid composition and heavy metal tolerance of soil microbial communities along two heavy metal polluted gradients in coniferous forests. Applied and Environmental Bicrobiology, 62: 420-428.
118. Poncin, C. 2004. Etablissement d’un référentielle géomorphopédologique en zone périurbaine (Kunming, Yunnan, Chine), Mémoire de fin d’etudes, Faculté universitaire des Sciences agronomiques de Gembloux, Belgique.
119. Rautengarten, A.M., Schnoor, J. L., Anderberg, S., Olendrzynski, K. and Stigliani, W. M. 2004. Soil sensitivity due to acid and heavy metal deposition in East Central Europe. Water, Air and Soil Pollution, 85 (2): 737-742.
120. Report of Agricultural Environment Protection Monitoring Department.1999. Heavy Metal Contents in Soil (unpublished) (in Chinese).
121. Report of Kunming City. 1999. Yunnan Science and Technology Publishing Company, Kunming, China. p. 4-35,163-171, 1023-1086 (in Chinese).
122. Romic, M. and Romic, D. 2003. Heavy metals distribution in agricultural top soils in an urban area. Environmental Geology, 43: 795-805.
123. Rossman, T.G., Zelikof, J.T. Agarwal, S. and Kneip, T.J. 1987. Genetic toxicology of metal compounds: an examination of appropriate cellular models. Toxioclogy and Environmental Chemistry, 14: 251-262.
124. Schmidt, W., Bartels, M., Tittej, J. and Fuhner, C. 1997. Physiological effects of copper on

REFERENCES
198
iron acquisition process in plantago. New Phytologist, 135: 659-666. 125. Serrano, R. 1990. Plasma membrane ATPase, in L. Larsson and I.M. Moller (eds.). The Plant
Plasma Membrane, Springer-Verlag, Berlin. 127-154. 126. Shuman, L. M. and Wang, J. 1997. Effect of rice variety on zinc, cadmium, iron and
manganese contents in rhizosphere and non-rhizosphere soil fractions. Community - Soil Science - Plant Ana1ysis, 28: 23-36.
127. Siedlecka, A., Tukendorf, A., Skorzynska-Polit, E., Maksymiec, W., Wojcik M., Baszynski, T. and Krupa, Z. 2001. Selected angiosperms families to heavy metals in the environment, in M.N.V. Prasad (ed.), Metals in the Environment: Analysis by Biodiversity, Marcel Dekker Inc., New York. 171-217.
128. Siedlecka, A. and Baszyn’ski, T. 1993. Inhibition of electron flow around photosystems I in chloroplasts of Cd-treated maize plants is due to Cd-induced iron deficiency. Physiology Plant, 83: 199-202.
129. Song, B., Chen, T.B., Zheng, Y.M., Huang, Z.C., Zheng, G.D. and Luo, J.F. 2006. A survey of cadmium concentrations in vegetables and soils in Beijing and their health risks. Journal of Environmental Sciences, 26 (8): 1343-1353 (in Chinese).
130. Sterckeman, T., Douay, F., Baize, D., Fourrier, H., Proix, N. and Schvartz, C. 2004. Factors affecting trace element concentrations in soils developed on recent marine deposits from northern France. Applied Geochemistry, 19: 89-103.
131. Stroinski, A. 1999. Some physiological and biochemical aspects of plant resistance to cadmium effects. I. Antioxidative system. Acta Physiology Plant, 21: 175-188.
132. Suran, E., Beiley, Trudy, J. and Olin, R. 1998. A review of potentially low-cost sorbents for heavy metals. Water Research, 33 (11): 2469-2479.
133. Sutherland, R.A. and Tolosa, C.A. 2001. Variation in total and extractable elements with distance from roads in an urban watershed, Honolulu, Hawaii. Water, Air and Soil Pollution, 12: 315-338.
134. Sutherland, R.A. and Tack, F.M.G. 2002. Determination of Al, Cu, Fe, Mn, Pb and Zn in certified reference materials using the optimized BCR sequential extraction procedure. Analysis Chemistry Acta, 454: 103-113.
135. Tang, H.J. and Chen, Y.Q. 2000. Theory and Practice of Sustainable Land Use in China. China Agricultural Science and Technology Press, Beijing, China (in Chinese).
136. Tang, L.N. and Xiong, D.Z. 2003. Effects of appling lime on the properties of acid soil and the leaves quality in flue-cured tobacco. Chinese Journal of Eco-Agriculture, 3: 156-162 (in Chinese).
137. Tao, S. 1995. Kriging and mapping of copper, lead and mercury contents in surface soil in the Shenzhen area. Water, Air and Soil Pollution, 83: 161-172.
138. Tao, S. 1998. Factor score mapping of soil trace element contents for the Shenzhen area. Water, Air and Soil Pollution, 104: 415-425.
139. Tessier, A., Campbell, P.G.C. and Bisson, M. 1979. Sequential extraction procedure for the speciation of particulate trace metals. Analytical Chemistry, 5l (7): 844-851.
140. Thuy, H.T.T., Tobschall, H.J. and An, P.V. 2000. Distribution of heavy metals in urban soils- a case study of Danang-Hoian area (Vietnam). Environmental Geology, 39 (6): 603-610.
141. Tills, A.R. and Alloway, B.J. 1981.The effect of ammonium and nitrate nitrogen source on copper uptake and animo acid status of cereals. Plant and Soil, 62: 279-290.

REFERENCES
199
142. Uhlig, C., Salemaa, M., Vanha-Majamaa, I. and Derome, J. 2001. Element distribution in Empetrum nigrum microsites at heavy metal contaminated sites in Harjavalta, western Finland. Environmental Pollution, 112: 435-442.
143. Van Oort, F., Jongmans, A.G., Citeau, L., Lamy, I and Chevallier, P. 2006. Microscale Zn and Pb distribution patterns in subsurface soil horizons: an indication for metal transport dynamic. European Journal of Soil Science, 57: 154-166.
144. Vansuyt, G., Lopez, F., Inze, D., Briat, J.F. and Fourcroy, P. 1997. Iron triggers a rapid induction of asscorbate gene expression in Brassica napus. FEBS (Federation of European Biochemical Societies) Letters, 410: 195-200.
145. Varga, A., Martinez, R.M.G., Zaray, G. and Fodor, F. 1999. Investigation of effects of cadmium, lead, nickel and vanadium contamination on the uptake and transport processes in cucumber polants by TXRE spectrometry. Spectrochimica Acta Part B: Atomic Spectroscopy, 54: 1455-1462.
146. Varga, A., Zaray, G., Fodor, F. and Cseh, E. 1997. Study on interaction of iron and lead during their uptake process in wheat roots by total-reflective X-ray flourescence spectrometry. Spectrochimica Acta Part B: Atomic Spectroscopy, 52: 1027-1032.
147. Vazquez, G., Antorrena, G., Gonzalez, J. and Doval, M.D. 1994. Adsorption of heavy metal ions by chemically modified Pinus pinaster bark. Bioresource Technology, 48: 251-255.
148. Vesk, P.A., Nockolds, C.E. and Allaway, W.G. 1999. Metal localization in water hyacinth roots from an urban wetland. Plant Cell Environment, 22: 149-58.
149. Voegelin, A., Barrnettler, K. and Kretzschmar, R. 2003. Heavy metal release from contaminated soils: Comparison of colunm leaching and batch extraction results. Journal of Environmental Quality, 32: 865-875.
150. Wang, H.X. 2002. Pollution Ecology. Advanced Education Press, Beijing, China (in Chinese).
151. Wang, Y.G. and Zhang, S.R. 2001. Theory and Practice on Avoiding Contamination of Vegetable Production. Agricultural Publishing Company, Beijing, China. p. 170-206 (in Chinese).
152. Wang, H.S., Yan, T.T., Wu, S.C., Yang, M.B., Li, Z.Y. and Lei, M. 2006. Spatial-temporal difference of soil environmental quality in different basic farmland in Yunnan. Yunnan Environmental Science, 25 (2): 53-56 (in Chinese).
153. Wang, J.K., Zhao, Y.C., Zhang, X.D. and Wang, Q.B. 2003. Studies on the spatial variability of heavy metal contents in black soils in central areas of Hailun. Chinese Journal of Soil Science, 34 (5): 398-403 (in Chinese).
154. Wang, K.R. and Gong, H.Q. 2000. Tolerance of cultivated plants towards cadmium and utilization of Cd-polluted soils in agriculture. Agro-environmental Protection, 19 (4): 196-199 (in Chinese).
155. Wang, L.F. and Bai, J.G. 1994. Vegetable pollution in Sun City investigates, prevents and cures path research. Agriculture Environmental Protection, 13 (2): 84-88 (in Chinese).
156. Wang, W.J., Guo, X.S., Wu, J. and Zhu, H.B. 2006. Effects of applying dolomite on crop yield and soil chemical properties in acid yellow-red soils areas. Chinese Journal of Soil Science, 4: 132-138 (in Chinese).
157. Wang, X. 1998. Different crops on heavy metal pollutants absorption characteristics of composites. Agricultural Environmental Protection, 17 (5): 193-196 (in Chinese).

REFERENCES
200
158. Wang, X. and Zhou, Q.X. 2003. Distribution of forms for cadmium, lead, copper and zinc in soil and its influences by modifiers. Journal of Agro-environment Science, 22 (5): 541-545 (in Chinese).
159. Wang, X.J., Li, B.G. and Tao, S. 2005. The trace metal content of soil spatial analysis. Science Press, Beijing, China (in Chinese).
160. Wang, X.M., Liu, D.Y., Tu, J.F., Li, Z. and Wang, Y.B. 2005. Cd, Cu, Zn and Pb contents and forms in soils and rape seeds around Wuhu Plant. Chinese Journal of Applied Ecology, 16 (10): l924-1931 (in Chinese).
161. Wang, Y.C., Su, N.H. and Zhang, J.B. 1996. The environmental chemistry characteristics of heavy meta1s in cultivated land in Fujian Province. Journal of Fujian Agricultural University, 25 (1): 66-71 (in Chinese).
162. Wang, Y.G., Lu, S.L. and Wu, Q.L. 1997. A primary study on tolerance limits of some pollutants in green food vegetables in the Shanghai region. Acta Agricultural Shanghai, 13 (3): 16-20 (in Chinese).
163. Weber, M.B., Schat, H., Ten Bookum-Van Der Maarel, W.M. 1991. The effect of copper toxicity on the contents of nitrogen compounds in Silvena vulgaris (Moench) Garcke. Plant and Soil, 133: 101-109.
164. Wei, J.F., Wu, D.Q. and Peng, J.L. 1999. A study on heavy metal speciation in sediments from Guangzhou water body. Soil and Enviromnental Sciences, 8 (1): 10-14 (in Chinese).
165. Weis, J.S., Windham, L. and Weis, P. 2003. Patterns of metal accumulation in leaves of the tidal marsh plants Spartina alterniflora Loisel and Phragmites australis Cav. Trin ex Steud. over the growing season. Wetlands, 23: 459-465.
166. Wen, Y.M. 1999. Uses control and environment capacity of the living creature usefulness of the soil heavy metals of the city dirty mire. The sixth boundary cross-straits environmental protection seminar, Shanghai, China. p. 1116-1121 (in Chinese).
167. Weng, L.P., Temminghoff, E.J.M., Lofts, S., Tipping, E. and Riemsdijk, W.H.V. 2002. Complexation with dissolved organic matter and solubility control of heavy metals in a sandy soil. Environmental Science and Technology, 36 (22): 4804-4810 (in Chinese).
168. Wiersma, D. and van der Veen, N. G. 1986. Cadmium, lead, mercury, and arsenic concentrations in crops and corresponding soils in The Netherlands. Journal of Agriculture and Food Chemistry, 34, 1067-1074.
169. Wu, M. 2003. Pesticide contamination of soil and the impact of control measures. Farming and Cultivation, 6: 49-50 (in Chinese).
170. Wu, X.M., Pan, G.X., Jiang, H.Y. and Ju, Y.F. 2003a. The basic properties and heavy metal pollution of urban soils in Naijing. Ecology and Environment, 12 (1): 19-23 (in Chinese).
171. Wu, X.M. and Pan, G.X. 2003b. Regression analysis of influence factors of heavy metals in city soil. Acta Pedologica Sinica, 40 (6): 921-929 (in Chinese).
172. Wu, Y.Y. and Wang, X. 1998. Transformation dynamics of Cd, Pb, Cu, Zn and As in agricultural ecosystems. Acta of Environment Science, 18 (4): 407-414 (in Chinese).
173. Wurgler, F.E. and Kramers, P.G.N. 1992. Environmental effects of benotoxins (eco-genotoxicology). Mutgenesis, 7: 321-327.
174. Xia, H.P. 1997. Soil-plant system cadmium progress. Applied and Environmental Biology, 3 (3): 289-298 (in Chinese).
175. Xiao, Z., He, P.J. and Shao, M. 2005. Effect of the total amount and speciation of heavy

REFERENCES
201
metals on its mobility in municipal solid waste landfill. Environmental Chemistry, 24 (3): 265-269.
176. Xie, Z.M., LI, J., Chen, J.J. and Wu, W.H. 2006. Study on guidelines for health risk to heavy metals in vegetable plantation soils in China. Asian Journal of Ecotoxicology, 1 (2): 172-178.
177. Xu, S.P., Tao, S., Cao, J., Li, B.G., Shen, W.R. and Zhang, W.J. 1999. Vertical distribution of trace element contents in soil in Tianjian area. China Environmental Science, 19 (3): 226-229 (in Chinese).
178. Yang, J.L., Zu, Y.Q., Hong, C.Q. and Li, Y. 2003. Relationship between microorganisms and heavy metals in vegetable soil in Chengong County. Ecology and Environment, 12 (3): 281-284 (in Chinese).
179. Yao, H.M., Du, T.T. and Su, D.C. 2006. Cadmium uptake and accumulation in vegetable species in Brassica Cruciferae. Chinese Agricultural Science Buttetin, 22 (1): 291-294.
180. Yearbook of Chenggong County. 2004. Yunnan Science and Technology Publishing Company, Kunming, China (in Chinese).
181. Yin, J. 2001. Assessment method of soil environmental quality for production base of green-food based on GIS. Agro-environmental Protection, 20 (6): 446-448 (in Chinese).
182. Yunnan Bureau of Geology and Mineral Resources. 1990. Regional Geological Survey, China Geological Publishing House, Beijing, China (in Chinese).
183. Yunnan Province Planting Areas. 1992. Compilation of Data Issued by Agriculture, Stock Raising & Fishery Offices. Yunnan Science and Technology Publishing Company, Kunming, China (in Chinese).
184. Yunnan Province's General Investigation Office. 1991. Yunnan Soils Map Collection. Yunnan Science and Technology Publishing Company, Kunming, China (in Chinese).
185. Yunnan Yearbook, Yunnan Science and Technology Publishing Company, Kunming, p. 1999. 171-173, 366-367, 430-438, 215-217, 282-283, 475 (in Chinese).
186. Yusuf, A.A., Arowolo, T.A. and Bamgbose, O. 2003. Cadmium, copper and nickel levels in vegetables from industrial and residential areas of Lagos City, Nigeria. Food and Chemical Toxicology, 41: 375-378.
187. Zha, T. and Li, Z.Y. 2003. Restricted factors and eliminating strategy of clean vegetable production in Yunnan Province. Research of Agricultural Modernization, 24 (4): 290-293 (in Chinese).
188. Zhang, C.L. and Bai, H.Y. 2001. Valuing soil and vegetable polluted by heavy metal in the suburb of Nanning. Journal of Guangxi Agriculture and Soil Science, 20 (3): 186-200 (in Chinese).
189. Zhang, C.L. and Bai, H.Y. 1998. An approach to the characteristics of heavy metal phase as well as the capacity of desorption and adsorption in soils about heavy metal pollution formed by highways. Environmental Chemistry, 17 (6): 564-568.
190. Zhang, M. and Gong, Z.T. 1996. Contents and distribution of some heavy metal elements in the vegetable cultivated soils in China. Acta Pedologica Sinica, 33 (1): 85-93 (in Chinese).
191. Zhang, N. 2001. Effects of air settlement on heavy metal accumulation in soil. Soil and Environmental Science, 10 (2): 91-93 (in Chinese).
192. Zhang, Q.L., Shi, X.Z., Huang, B., Yu, D.S. Wang, H.J., Blombaeck, K. and Oboern, I. 2005. Characteristics of spatial variability of soil available lead, zinc, copper and cadmium in a vegetable base in the suburbs of Nanjing. Soils, 37 (1): 41-47 (in Chinese).

REFERENCES
202
193. Zhang, S., Wang, L.J. and Zhang, C.S. 1994. Neutron Activation Analysis of Rare Earth Elements Environmental Technology and Bio-geochemistry: Modern Nuclear Analytical Techniques in Environmental Science and the Application. Atomic Energy Press, Beijing, China (in Chinese).
194. Zhang, X.X., Luo, Q.D., Zheng, R.S., Li, Y. and Wang, G. 2003. Effects of liming on soil Cd fractionation and Cd uptake by vegetables in heavy metal contaminated soil. Fujian Journal of Agricultural Sciences, 18 (3): 151-154 (in Chinese).
195. Zhang, Y.L., Shen, Q.R., Xie, X.J. and Sun, Z.H. 2003. Effect of pig manure and rice straw on biological activity of Cd-contaminated soil. Chinese Journal of Applied Ecology, 14 (11): 1997-2000 (in Chinese).
196. Zhang, Y.L. and Wang, Z.F. 2007. The spatial distribution of trace elements in topsoil from the northern slope of Qomolangma (Everest) in China. Environmental Geology, 52 (4): 679-684.
197. Zhang, Z.F. and Chen, B.M. 2002. Primary analysis on land readjustment potentiality. Journal of Natural Resources, 17 (6): 664-669 (in Chinese).
198. Zhang, Z.P. and Wang, X.J. 1998. Conditional simulation for spatial distribution of trace elements in soils. Acta Pedologica Sinica, 35 (3): 423-429 (in Chinese).
199. Zhang, G., Fukami, M. and Sekimoto, H. 2000. Genotypic differences in effects of cadmium on growth and nutrient compositions in wheat. Journal of Plant Nutrition, 23: 1337-1350 (in Chinese).
200. Zhao, Q.G., Zhou, B.Z., Yang, H. and Liu, S.L. 2002. Safety problem of Chinese cultivated land. Soils, 34 (6): 293-302 (in Chinese).
201. Zhao, Q.G., Zhou, S.L., Wu, S.H. and Ren, K. 2006. Cultivated land researches and strategies for its sustainable utilization and protection in China. Acta Pedologica Sinica, 43 (4): 662-272 (in Chinese).
202. Zhao, R., Zhang, L. and Den, B.S. 2001. Effect of pH on absorption and formation of Cu in loess. Environmental Science, 22 (3): 78-83 (in Chinese).
203. Zhou, L.X. and Wong, J.W.C. 2001. Effects of dissolved organic matter from sludge and sludge compost on soil copper sorption. Journal Environment Quality, 30: 878-883 (in Chinese).
204. Zhou, Q.X. and Song, Y.F. 2004. Contaminated soil remediation principles and methods. Science Press, Beijing, China (in Chinese).
205. Zhou, S.L. and Lu, C.F. 2005. Study on the characteristic and cause of vegetable soil acidification in the area of southern Jiangsu Province. Journal of Henan Normal University (Natural Sciences), 33 (1): 69-72 (in Chinese).
206. Zhu, G.Y., Li, Y.F. and Fan, X.F. 2006.Assessment and countermeasures of sustainable cultivated land use in China. Journal of Heilongjiang August First Land Reclamation University, l8 (4): 94-98 (in Chinese).
207. Zimdahl, R.L. and Foster, J.M. 1976.The influence of applied phosphorus, manure, or lime on uptake of lead from soil. Journal of Environmental Quality, 5: 31-34.
208. Zornoza, P., Robles, S. and Martin, N. 1999. Alleviation of nickel toxicity by ammonium supply to sunflower plants. Plant and Soil, 208: 221-226.
209. Zu, Y.Q. 2005. Environmental Description of the Chenggong County, Kunming, Yunnan, China. Travail de fin d’études (DEA). Faculte Universitaire des Sciences Agronomiques de

REFERENCES
203
Gembloux, 77p. 11 annexes. 210. Zu, Y.Q., Li, Y. and Chen, H.Y. 2003. Research on factors influencing concentractions of Pb,
Cd, Cu, and Zn in vegetables. Journal of Agro-environment Science, 22 (3): 289-292 (in Chinese).
211. Zu, Y.Q., Li, Y., Bock, L., Schvartz, C., Colinet, G. and Hu, W.Y. 2008. Interactions between heavy metals and nitrogen and their ecological effects. Journal of Agro-environmental Science, 27 (1): 1-8 (in Chinese).
Related Documents


![China Yunnan [Water]](https://static.cupdf.com/doc/110x72/55a4df8b1a28aba00e8b4658/china-yunnan-water.jpg)


