This article appeared in a journal published by Elsevier. The attached copy is furnished to the author for internal non-commercial research and education use, including for instruction at the authors institution and sharing with colleagues. Other uses, including reproduction and distribution, or selling or licensing copies, or posting to personal, institutional or third party websites are prohibited. In most cases authors are permitted to post their version of the article (e.g. in Word or Tex form) to their personal website or institutional repository. Authors requiring further information regarding Elsevier’s archiving and manuscript policies are encouraged to visit: http://www.elsevier.com/copyright

Welcome message from author
This document is posted to help you gain knowledge. Please leave a comment to let me know what you think about it! Share it to your friends and learn new things together.
Transcript
This article appeared in a journal published by Elsevier. The attachedcopy is furnished to the author for internal non-commercial researchand education use, including for instruction at the authors institution
and sharing with colleagues.
Other uses, including reproduction and distribution, or selling orlicensing copies, or posting to personal, institutional or third party
websites are prohibited.
In most cases authors are permitted to post their version of thearticle (e.g. in Word or Tex form) to their personal website orinstitutional repository. Authors requiring further information
regarding Elsevier’s archiving and manuscript policies areencouraged to visit:
http://www.elsevier.com/copyright
Author's personal copy
Trace element composition of near-surface silica deposits—A powerful tool fordetecting hydrothermal mineral and energy resources
I. Tonguç Uysal a,!, Massimo Gasparon a,b, Robert Bolhar c, Jian-xin Zhao c, Yue-xing Feng c, Greg Jones d
a Queensland Geothermal Energy Centre of Excellence, The University of Queensland, Queensland 4072, Australiab School of Earth Sciences, The University of Queensland, Queensland 4072, Australiac Radiogenic Isotope Facility, Centre for Microscopy and Microanalysis, The University of Queensland, Queensland 4072, Australiad Thomson Resources Ltd., PO Box 956, Crows Nest, NSW 1585, Australia
a b s t r a c ta r t i c l e i n f o
Article history:Received 5 July 2010Received in revised form 31 October 2010Accepted 3 November 2010Available online 11 November 2010
Editor: R.L. Rudnick
Keywords:SinterTrace elementDrummond basinEpithermalGeothermal
Extensive Paleozoic sinter deposits occur at the surface associated with sub-surface quartz veining andepithermal Au mineralisation in the Drummond Basin, Australia. We investigated the trace elementcomposition of the sinter deposits and quartz veins in an attempt to develop a new geochemical explorationguide for geological resources. The Drummond Basin hydrothermal silica deposits are unique in havinganomalously enriched incompatible element (Cs, Li, Be, U, Th and REE) concentrations in comparison tohydrothermal quartz veins from various granitic-pegmatitic systems elsewhere. The development of relativeCe de!ciencies (Ce/Ce*normb1) in silica deposits indicate preferential mobilisation of REE over Ce from sourcerocks by oxidised hydrothermal "uids, leading to relative Ce enrichment in the source material (e.g., rhyoliteintrusions). Sinters and quartz veins and some volcanic source rocks show a conspicuous positive Y anomalyrelative to REE. This is interpreted in terms of Y fractionation due to "uorine complexation with REE duringhydrothermal activity. The majority of sinter and quartz samples within or near the Au mineralisation zoneare more enriched in mobile elements (Cs, Li, Rb and Be) than the silica deposits from areas distal to themineralised area. Normalised Y–REE patterns of the sinter deposits, quartz veins, and wall rocks provideimportant information on the physico-chemical environment of epithermal mineral deposition in geothermalsystems. Trace element systematics as revealed in the current study, particularly in relation to the alkalielement mobility, have signi!cant implications for !nding new prospect areas and evaluating the potential ofexisting prospect areas for epithermal metal deposits and active geothermal !elds.
© 2010 Elsevier B.V. All rights reserved.
1. Introduction
Silica is the most abundant chemical compound in the Earth'supper crust; yet the trace element geochemistry of Si has not beenutilised routinely in addressing geological problems, in particular inthe exploration of geological resources. This is mainly due to thecrystal structure of silica and the small size of the Si4+ ion, allowingonly small amounts of trace elements to be incorporated into thecrystal lattice. A very limited number of studies have investigated thetrace element contents in quartz speci!cally to evaluate thepetrogenetic and geochemical evolution of selected metamorphic,hydrothermal and pegmatitic environments (Götze et al., 2004;Monecke et al., 2002). Siliceous sinters are pristine rocks thatprecipitate from spring waters heated by deep-seated magmachambers. Sinters are unique surface deposits re"ecting the operationof ancient and modern geothermal systems. Their occurrences implysub-surface geothermal water temperatures in excess of 175 °C
(Fournier and Rowe, 1966). Geothermal systems responsible for thesinter precipitation are commonly associated with generation ofepithermal ore deposits (Clark and Williamsjones, 1990; Henley andEllis, 1983; Nicholson, 1989). For this reason silica sinters provide animportant guide to the exploration of epithermal precious-metaldeposits of ancient systems, as well as to the location of concealedgeothermal energy sources in modern environments where surfacethermal activity has declined or ceased. While textural characteristicsof sinter deposits may be helpful in identifying them (Herdianita et al.,2000; White et al., 1989), their recognition is not straightforward anddistinguishing between them and other siliceous lithologies is oftenambiguous. Siliceous lithologies of various origins occur ubiquitouslyon the ground surface as rock chips or soil material having beeneroded from deeper geological units that can be mistaken for silicasinters. The aim of the present study is to characterise the traceelement compositions of silica sinters to provide geochemical criteriafor exploration of geothermal energy sources and ancient geothermal-epithermal precious metal deposits. In the current study, weinvestigated silica sinters and hydrothermal quartz veins as well asthe associated volcanic rocks, silici!ed hydrothermal breccias,phyllosilicate alteration minerals, and some soil samples from the
Chemical Geology 280 (2011) 154–169
! Corresponding author.E-mail address: [email protected] (I.T. Uysal).
0009-2541/$ – see front matter © 2010 Elsevier B.V. All rights reserved.doi:10.1016/j.chemgeo.2010.11.005
Contents lists available at ScienceDirect
Chemical Geology
j ourna l homepage: www.e lsev ie r.com/ locate /chemgeo
Author's personal copy
Paleozoic Drummond Basin of Australia by ICP-MS trace elementanalysis and Rb-Sr isotopic dating. Sinter as an amorphous silicacompound is particularly prone to dissolution shortly after itsdeposition and thus pre-Tertiary sinter outcrops are often not wellpreserved. In contrast, the Drummond Basin sinters are unique owingto their good preservation, possibly due to burial soon after deposition(White et al., 1989).
2. Geological setting
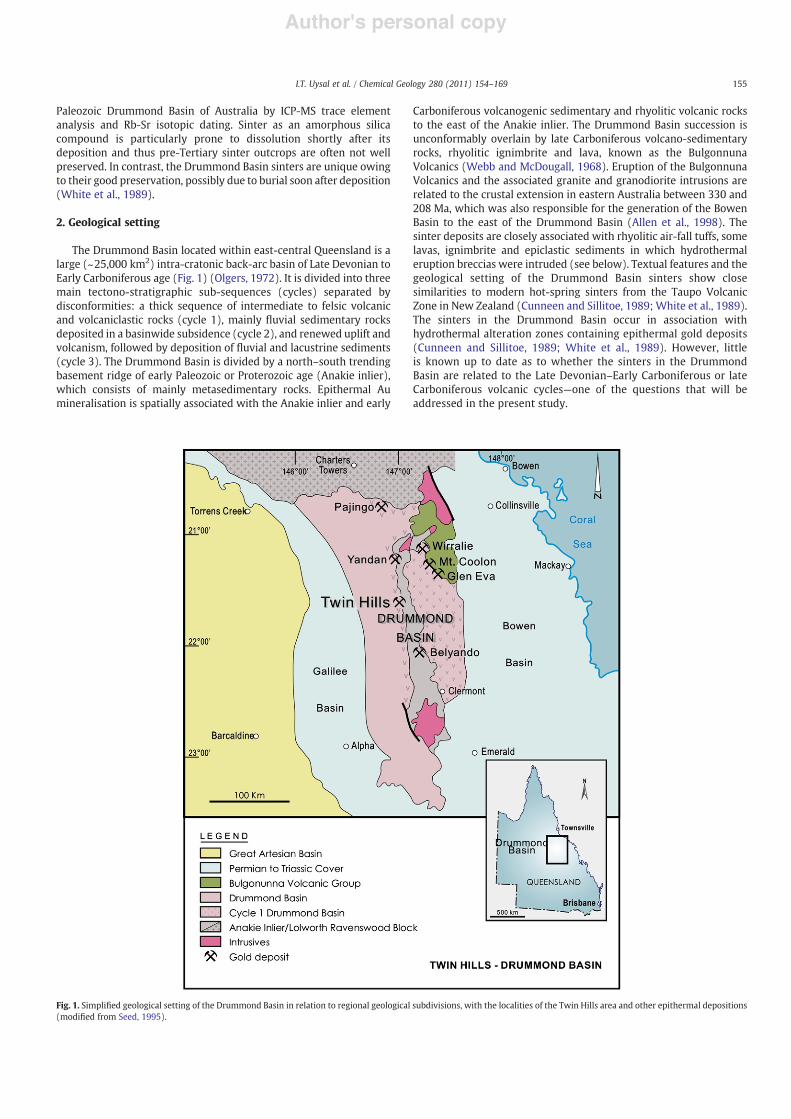
The Drummond Basin located within east-central Queensland is alarge (~25,000 km2) intra-cratonic back-arc basin of Late Devonian toEarly Carboniferous age (Fig. 1) (Olgers, 1972). It is divided into threemain tectono-stratigraphic sub-sequences (cycles) separated bydisconformities: a thick sequence of intermediate to felsic volcanicand volcaniclastic rocks (cycle 1), mainly "uvial sedimentary rocksdeposited in a basinwide subsidence (cycle 2), and renewed uplift andvolcanism, followed by deposition of "uvial and lacustrine sediments(cycle 3). The Drummond Basin is divided by a north–south trendingbasement ridge of early Paleozoic or Proterozoic age (Anakie inlier),which consists of mainly metasedimentary rocks. Epithermal Aumineralisation is spatially associated with the Anakie inlier and early
Carboniferous volcanogenic sedimentary and rhyolitic volcanic rocksto the east of the Anakie inlier. The Drummond Basin succession isunconformably overlain by late Carboniferous volcano-sedimentaryrocks, rhyolitic ignimbrite and lava, known as the BulgonnunaVolcanics (Webb and McDougall, 1968). Eruption of the BulgonnunaVolcanics and the associated granite and granodiorite intrusions arerelated to the crustal extension in eastern Australia between 330 and208 Ma, which was also responsible for the generation of the BowenBasin to the east of the Drummond Basin (Allen et al., 1998). Thesinter deposits are closely associated with rhyolitic air-fall tuffs, somelavas, ignimbrite and epiclastic sediments in which hydrothermaleruption breccias were intruded (see below). Textual features and thegeological setting of the Drummond Basin sinters show closesimilarities to modern hot-spring sinters from the Taupo VolcanicZone in New Zealand (Cunneen and Sillitoe, 1989; White et al., 1989).The sinters in the Drummond Basin occur in association withhydrothermal alteration zones containing epithermal gold deposits(Cunneen and Sillitoe, 1989; White et al., 1989). However, littleis known up to date as to whether the sinters in the DrummondBasin are related to the Late Devonian–Early Carboniferous or lateCarboniferous volcanic cycles—one of the questions that will beaddressed in the present study.
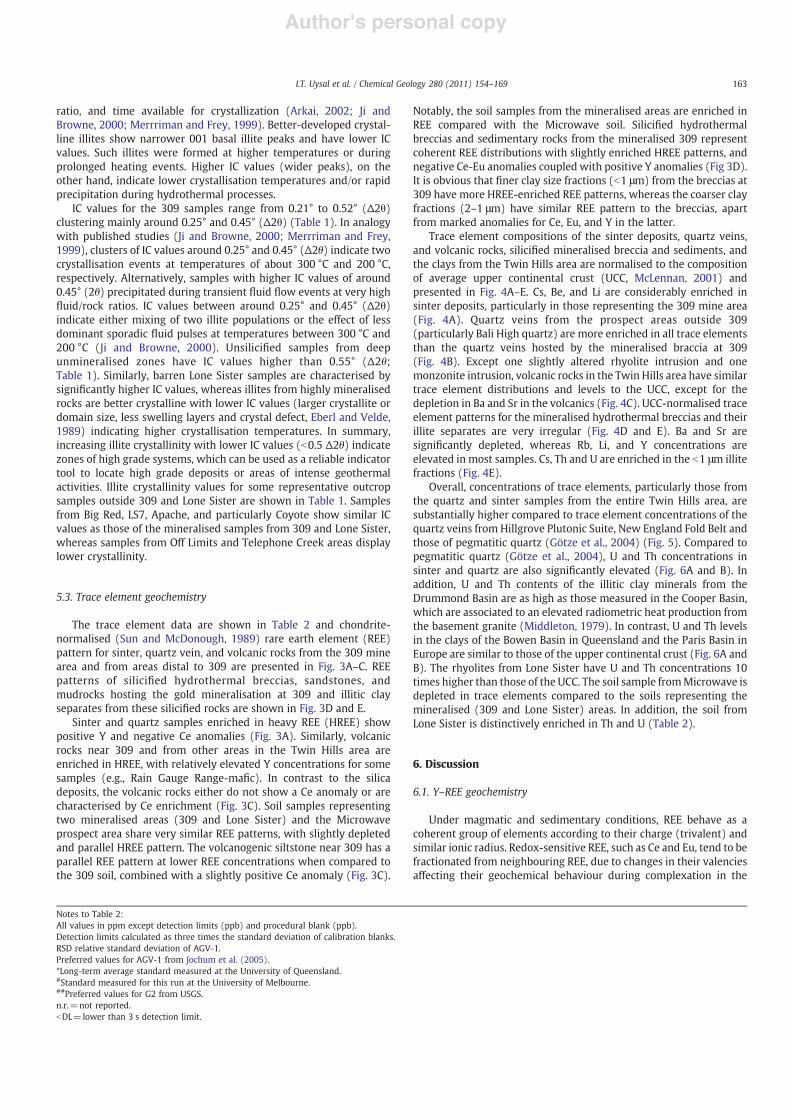
Fig. 1. Simpli!ed geological setting of the Drummond Basin in relation to regional geological subdivisions, with the localities of the Twin Hills area and other epithermal depositions(modi!ed from Seed, 1995).
155I.T. Uysal et al. / Chemical Geology 280 (2011) 154–169
Author's personal copy
3. Sampling and sample materials
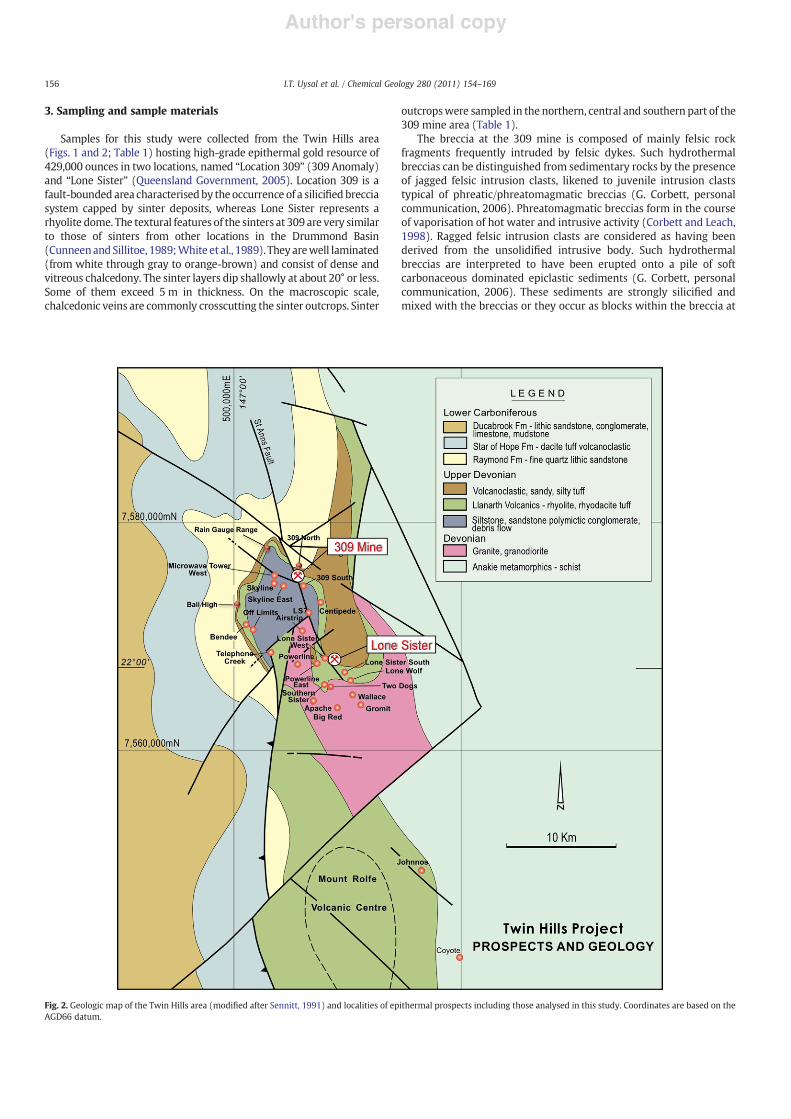
Samples for this study were collected from the Twin Hills area(Figs. 1 and 2; Table 1) hosting high-grade epithermal gold resource of429,000 ounces in two locations, named “Location 309” (309 Anomaly)and “Lone Sister” (Queensland Government, 2005). Location 309 is afault-bounded area characterisedby the occurrence of a silici!ed brecciasystem capped by sinter deposits, whereas Lone Sister represents arhyolite dome. The textural features of the sinters at 309 are very similarto those of sinters from other locations in the Drummond Basin(Cunneenand Sillitoe, 1989;White et al., 1989). They arewell laminated(from white through gray to orange-brown) and consist of dense andvitreous chalcedony. The sinter layers dip shallowly at about 20° or less.Some of them exceed 5 m in thickness. On the macroscopic scale,chalcedonic veins are commonly crosscutting the sinter outcrops. Sinter
outcropswere sampled in the northern, central and southern part of the309 mine area (Table 1).
The breccia at the 309 mine is composed of mainly felsic rockfragments frequently intruded by felsic dykes. Such hydrothermalbreccias can be distinguished from sedimentary rocks by the presenceof jagged felsic intrusion clasts, likened to juvenile intrusion claststypical of phreatic/phreatomagmatic breccias (G. Corbett, personalcommunication, 2006). Phreatomagmatic breccias form in the courseof vaporisation of hot water and intrusive activity (Corbett and Leach,1998). Ragged felsic intrusion clasts are considered as having beenderived from the unsolidi!ed intrusive body. Such hydrothermalbreccias are interpreted to have been erupted onto a pile of softcarbonaceous dominated epiclastic sediments (G. Corbett, personalcommunication, 2006). These sediments are strongly silici!ed andmixed with the breccias or they occur as blocks within the breccia at
Fig. 2. Geologic map of the Twin Hills area (modi!ed after Sennitt, 1991) and localities of epithermal prospects including those analysed in this study. Coordinates are based on theAGD66 datum.
156 I.T. Uysal et al. / Chemical Geology 280 (2011) 154–169
Author's personal copy
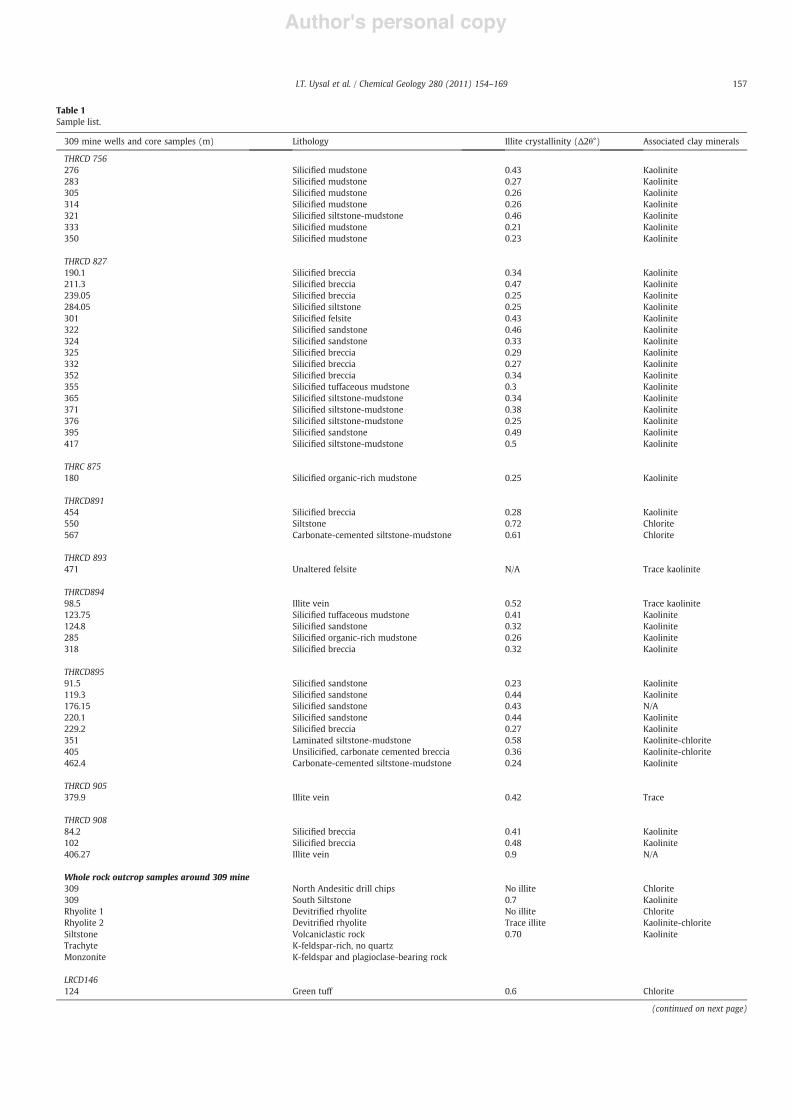
Table 1Sample list.
309 mine wells and core samples (m) Lithology Illite crystallinity (!2"°) Associated clay minerals
THRCD 756276 Silici!ed mudstone 0.43 Kaolinite283 Silici!ed mudstone 0.27 Kaolinite305 Silici!ed mudstone 0.26 Kaolinite314 Silici!ed mudstone 0.26 Kaolinite321 Silici!ed siltstone-mudstone 0.46 Kaolinite333 Silici!ed mudstone 0.21 Kaolinite350 Silici!ed mudstone 0.23 Kaolinite
THRCD 827190.1 Silici!ed breccia 0.34 Kaolinite211.3 Silici!ed breccia 0.47 Kaolinite239.05 Silici!ed breccia 0.25 Kaolinite284.05 Silici!ed siltstone 0.25 Kaolinite301 Silici!ed felsite 0.43 Kaolinite322 Silici!ed sandstone 0.46 Kaolinite324 Silici!ed sandstone 0.33 Kaolinite325 Silici!ed breccia 0.29 Kaolinite332 Silici!ed breccia 0.27 Kaolinite352 Silici!ed breccia 0.34 Kaolinite355 Silici!ed tuffaceous mudstone 0.3 Kaolinite365 Silici!ed siltstone-mudstone 0.34 Kaolinite371 Silici!ed siltstone-mudstone 0.38 Kaolinite376 Silici!ed siltstone-mudstone 0.25 Kaolinite395 Silici!ed sandstone 0.49 Kaolinite417 Silici!ed siltstone-mudstone 0.5 Kaolinite
THRC 875180 Silici!ed organic-rich mudstone 0.25 Kaolinite
THRCD891454 Silici!ed breccia 0.28 Kaolinite550 Siltstone 0.72 Chlorite567 Carbonate-cemented siltstone-mudstone 0.61 Chlorite
THRCD 893471 Unaltered felsite N/A Trace kaolinite
THRCD89498.5 Illite vein 0.52 Trace kaolinite123.75 Silici!ed tuffaceous mudstone 0.41 Kaolinite124.8 Silici!ed sandstone 0.32 Kaolinite285 Silici!ed organic-rich mudstone 0.26 Kaolinite318 Silici!ed breccia 0.32 Kaolinite
THRCD89591.5 Silici!ed sandstone 0.23 Kaolinite119.3 Silici!ed sandstone 0.44 Kaolinite176.15 Silici!ed sandstone 0.43 N/A220.1 Silici!ed sandstone 0.44 Kaolinite229.2 Silici!ed breccia 0.27 Kaolinite351 Laminated siltstone-mudstone 0.58 Kaolinite-chlorite405 Unsilici!ed, carbonate cemented breccia 0.36 Kaolinite-chlorite462.4 Carbonate-cemented siltstone-mudstone 0.24 Kaolinite
THRCD 905379.9 Illite vein 0.42 Trace
THRCD 90884.2 Silici!ed breccia 0.41 Kaolinite102 Silici!ed breccia 0.48 Kaolinite406.27 Illite vein 0.9 N/A
Whole rock outcrop samples around 309 mine309 North Andesitic drill chips No illite Chlorite309 South Siltstone 0.7 KaoliniteRhyolite 1 Devitri!ed rhyolite No illite ChloriteRhyolite 2 Devitri!ed rhyolite Trace illite Kaolinite-chloriteSiltstone Volcaniclastic rock 0.70 KaoliniteTrachyte K-feldspar-rich, no quartzMonzonite K-feldspar and plagioclase-bearing rock
LRCD146124 Green tuff 0.6 Chlorite
(continued on next page)
157I.T. Uysal et al. / Chemical Geology 280 (2011) 154–169
Author's personal copy
shallower levels, whereas at the deepest levels of boreholes no brecciaoccurs and the sediments are not silici!ed. Breccia and silici!edsediments were sampled as core material from exploration holes atthe 309 mine area (Table 1). An EW-trending normal fault separatesthe hydrothermal breccias to the north from basement carbonaceousUpper Devonian volcanoclastic rocks and volcanics, siltstone andsandstones to the south (Fig. 2). One sample was taken from thissiltstone (Table 1). Steeply north and south dipping, narrow (b10 cm)extensional quartz veins at 309 mine occur parallel to this faultsystem. These veins host the Aumineralisation, most commonly at thecontact with wall rocks (breccia) (G. Corbett, personal communica-tion, 2006). We also sampled the quartz veins from cores intersectingthe highly mineralised boreholes at 309. One quartz vein sample wastaken from the underground 309 mine. The sampled volcanic rocksinclude hydrothermally altered K-feldspar-rich rocks (Table 1).Samples Rhyolite 1, Rhyolite 2 and trachyte (Table 1) were collectedfrom an area located ~100 m to the south of 309 (Fig. 2). The rhyoliteswere intruded in the epiclastic siltstone, whereas the trachyte isinterlayered with the sediments. A fresh and unaltered felsite coresample at 471 mwas taken from the declined borehole THRC 893. We
also collected some siliceous samples from various locations in theTwin Hill region, which are distal to 309 and Lone Sister (see Fig. 2).Two chalcedonic samples having a similar appearance to the sinterwere taken from prospect areas “Microwave” and “Centipede” (Fig. 2).Quartz vein samples as well as whole rock samples were taken froman outcrop where K-feldspar-rich felsic and dark (ma!c) alkalinevolcanic rocks occur together (Rain Gauge Range samples, Table 1).Whole rock samples were collected from some other prospect areaswhere no signi!cant quartz veining occurs at the surface (Table 1).Samples from those areas were analysed only for their alterationmineralogy for comparison with those from 309. Soil samples weretaken for mineralogical and trace element analysis from 309, LoneSister, and Microwave.
In addition, to compare the sinter and quartz geochemistry fromour study with quartz from a completely different geologicalenvironment and region, we collected quartz veins from the HillgrovePlutonic Suite, New-England Fold Belt, New South Wales (CathedralRock National Park: CNP-1 and CNP-2, east of Armidale near the townof Ebor) (Landenberger et al., 1995). This area is unmineralised butthe sampled quartz veins in the Hillgrove Plutonic Suite are hosted by
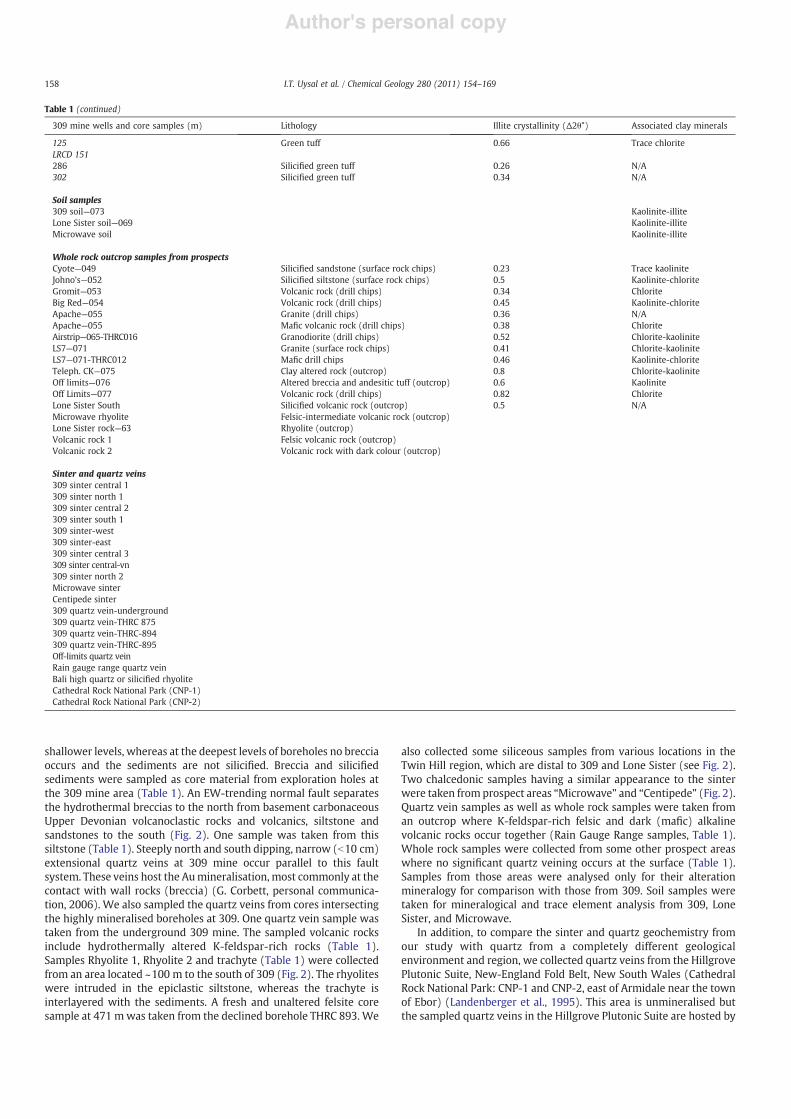
Table 1 (continued)
309 mine wells and core samples (m) Lithology Illite crystallinity (!2"°) Associated clay minerals
125 Green tuff 0.66 Trace chloriteLRCD 151286 Silici!ed green tuff 0.26 N/A302 Silici!ed green tuff 0.34 N/A
Soil samples309 soil—073 Kaolinite-illiteLone Sister soil—069 Kaolinite-illiteMicrowave soil Kaolinite-illite
Whole rock outcrop samples from prospectsCyote—049 Silici!ed sandstone (surface rock chips) 0.23 Trace kaoliniteJohno's—052 Silici!ed siltstone (surface rock chips) 0.5 Kaolinite-chloriteGromit—053 Volcanic rock (drill chips) 0.34 ChloriteBig Red—054 Volcanic rock (drill chips) 0.45 Kaolinite-chloriteApache—055 Granite (drill chips) 0.36 N/AApache—055 Ma!c volcanic rock (drill chips) 0.38 ChloriteAirstrip—065-THRC016 Granodiorite (drill chips) 0.52 Chlorite-kaoliniteLS7—071 Granite (surface rock chips) 0.41 Chlorite-kaoliniteLS7—071-THRC012 Ma!c drill chips 0.46 Kaolinite-chloriteTeleph. CK—075 Clay altered rock (outcrop) 0.8 Chlorite-kaoliniteOff limits—076 Altered breccia and andesitic tuff (outcrop) 0.6 KaoliniteOff Limits—077 Volcanic rock (drill chips) 0.82 ChloriteLone Sister South Silici!ed volcanic rock (outcrop) 0.5 N/AMicrowave rhyolite Felsic-intermediate volcanic rock (outcrop)Lone Sister rock—63 Rhyolite (outcrop)Volcanic rock 1 Felsic volcanic rock (outcrop)Volcanic rock 2 Volcanic rock with dark colour (outcrop)
Sinter and quartz veins309 sinter central 1309 sinter north 1309 sinter central 2309 sinter south 1309 sinter-west309 sinter-east309 sinter central 3309 sinter central-vn309 sinter north 2Microwave sinterCentipede sinter309 quartz vein-underground309 quartz vein-THRC 875309 quartz vein-THRC-894309 quartz vein-THRC-895Off-limits quartz veinRain gauge range quartz veinBali high quartz or silici!ed rhyoliteCathedral Rock National Park (CNP-1)Cathedral Rock National Park (CNP-2)
158 I.T. Uysal et al. / Chemical Geology 280 (2011) 154–169
Author's personal copy
felsic rocks with a similar mineralogical composition to the rocks inthe Drummond Basin. This will allow us to compare quartz veins frommineralised and barren regions.
4. Methods
Mineralogical studies were performed using X-ray diffraction(XRD) and optical microscopy. The XRD analyseswere carried out on aX-Ray diffractometer equipped with parallel beam geometry andCuKa radiation, operated at 40 kV and 40 mA at a scanning rate of1°2!/min. The samples were prepared for separation of the clayfraction by gently crushing the rocks to sand size, followed bydisaggregation in distilled water using an ultrasonic bath. Differentclay size fractions (b2 #m, b1 #m, and 2–1 #m) were obtained bycentrifugation based on Stoke's Law, and the decanted suspensionswere placed on a glass slide. Following XRD analysis of air-driedsamples, the oriented clay-aggregate mounts were placed in anethylene–glycol atmosphere at 30–40 °C overnight prior to additionalXRD analyses. Illite crystallinity (IC) is de!ned as the “full width at halfmaximum” of the basal 10 Å XRD illite peak (Arkai, 2002; Frey, 1987)expressed in !2! values.
For trace element analysis, the samples were dissolved usingHF+HNO3 in Te"on beakers on a hot plate. The dissolved sampleswere converted to nitrites and spiked with a multi-element internalstandard solution (6Li, 61Ni, 103Rh, 115In, 187Re, 209Bi, and 235U) in 2%HNO3. Trace elements were analysed by Inductively Coupled Plasma–Mass Spectrometry (ICP-MS) on a Thermo X7. Sample preparation andanalytical procedures used were identical to those of Eggins et al.(1997), except that Tm was not used as an internal standard andduplicate low-pressure digestions of W-2, a US Geological Surveydiabase standard, were used as the calibration standard. AGV1, AGV2and G2 were run as unknown. Detection limits and procedural blankswere negligible (Table 2), and therefore no blank correction wasapplied. The 156CeO/140Ce ratio for the run was 0.016. Long-termprecision (RSD), based on duplicate analyses of the duplicate digestionsof AGV1, is shown in Table 2, while precision for the run, based on !veduplicate analyses ofW-2was better than 3% for most elements, exceptfor Li, Zn, Mo, Cd, and Cs, which ranged between 5% (Li, Cd, and Cs) and15% (Zn).
A subset of the samples was independently digested and analysedat the University of Melbourne for quality assurance. The 6Li spike wasnot used at the University of Melbourne, and this accounts for thedifferences observed in Li concentrations between the two laboratories.
For the Rb–Sr dating, illitic clay separates were leached for15 minutes at room temperature in 1 N distilled HCl (Clauer et al.,1993). Leachate and residue were separated by centrifuging. Theresidue was rinsed repeatedly with deionised water, dried andreweighed. Leachate, residue, and untreated samples were spikedwith 85Rb–84Sr mixed tracer and dissolved in a mixture of distilled HFand HNO3. The Sr-enriched fraction was separated using cationexchange resins. Sr isotopic ratios were measured on a VG Sector-54thermal ionisation mass spectrometer. Sr was loaded in 1 N H3PO4 ona Ta single !lament. Sr isotopic ratios were corrected for massdiscrimination using 86Sr/88Sr=0.1194. During the course of thisstudy, the value obtained for the 87Sr/86Sr ratio of standard NBS 987was 0.710246±0.000007 (2$, n=4). Rb-Sr isochron ages werecalculated using the ISOPLOT program (Ludwig, 2003).
5. Results
5.1. Alteration mineralogy
Thepetrographyand alterationmineralogy ofmineralisedwall rocksin 309 (below the sinters) and Lone Sister, as well as unmineraliseddeeper and distal rockswere examined. In thin section, the sinter at 309is made up by cryptocrystalline silica containing numerous microcrys-
talline quartz veinlets. No mineral phases other than quartz wereobserved in thin section of the sinter deposits as well as quartz veins.XRD analysis of sinters and quartz veins con!rm that they consist ofpure quartz. Although undetectable in thin section and XRD, occurrenceof mineral inclusions in micrometer scale in sinters and quartz veins ispossible. Previous studies have shown that most trace elements that weinvestigated in this study(rare earth elements, Cs, Rb,U, Th) occureitherin suchmineral inclusions ormore commonly in "uid inclusions (Götzeet al., 2004 and references therein). In some cases, quartz veins areassociated with "uorite that occurs as a patchy disseminated mineral,vein and breccia-!lling material.
Thin section observations and XRD patterns of the clay separatesfrom the breccia and epiclastic rocks (sandstone and mudrocks) in309 show that illite is a major alteration product (more than 60%). TheXRD 001 peak position of the illite does not change after ethyleneglycol treatment, which indicates that either no smectite is present orthe smectite content is b5% (Srodon and Eberl, 1984). In thin section,illite occurs as replacement of glassy-cryptocrystalline and micro-crystalline matrix as well as vein !lling in hydrothermal breccia andsedimentary rocks. Kaolinite is also common, but less abundant.According to the XRD patterns, the kaolinite is represented by nacrite,which is a high temperature (200–300 °C) polytype and foundgenerally in hydrothermal environments (Bailey, 1980; Chen et al.,2001; Palinkas et al., 2009). In thin section, kaolinite occurs asreplacement of K-feldspar and as precipitation in pore spaces withinthe microcrystalline matrix. Chlorite is not observed in samples frommineralised zones (see below). Adularia is observed in some high-grade samples as elongate anhedral crystals, always associated withillite. Alteration of the volcanoclastic and breccia host rocks duringwhich clay minerals (illite and kaolinite) and adularia formed canrelease silica in the "uid from which quartz precipitated. In addition,the intimate association between the intrusive activity, brecciaformation and silici!cation indicates that the silica was sourcedpartly from magmatic-hydrothermal "uids.
Deeper and barren samples show less intense hydrothermalalteration. One felsite sample from the deeper part (471 m) of holeTHRCD 893 contains unaltered euhedral plagioclase (albite) andK-feldspar, with only minor kaolinite but no illite according to XRD.Some other deep samples from unsilici!ed laminated siltstone-mudstones with carbonate cement contain chlorite, whereas chloriteis not present in the mineralised samples.
Some samples were collected outside the mineralised area in 309further north and south. A drill chip sample from the north (TARE A-066) contains only chlorite with no illite alteration (309 North, Fig. 2).K-rich rhyolite intrusions that crop out south of 309 (309 South, Fig. 2)show only some chlorite and kaolinite alteration with insigni!cantillite formation and intensive devitri!cation with the formation ofsecondary quartz and K-feldspar spherulites.
Four samples were analysed from Lone Sister. Two samples weretaken from highly mineralised and barren zones respectively(LRCD146 and LRCD 151). All samples contain illite as major clayalteration product, but with different crystallinity values (see below).Chlorite is present only in the barren samples.
XRD analysis of whole rock powders for soil samples from 309,Lone Sister and Microwave shows that the soil samples consist oflargely quartz with minor kaolinite. The sample from 309 containsalso traces of hematite. The b2-#m clay separates of the soil sampleshave similar mineralogical composition, with kaolinite being presentas a major phase, while illite occurs in minor amounts.
5.2. Illite crystallinity
Illite crystallinity is a useful indicator of the temperature gradientin active geothermal systems and for locating fossil hydrothermalsystems associated with ore deposition (Ji and Browne, 2000). Illitecrystallinity is controlled by crystallisation temperature, water/rock
159I.T. Uysal et al. / Chemical Geology 280 (2011) 154–169
Author's personal copy
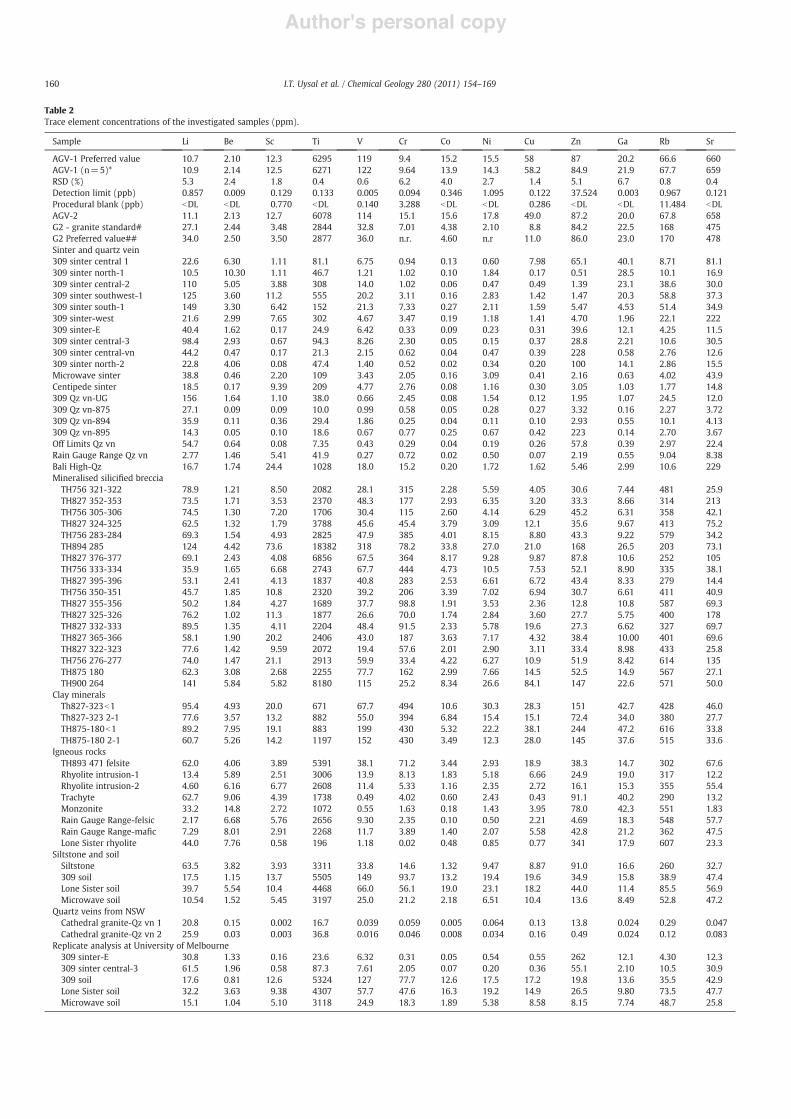
Table 2Trace element concentrations of the investigated samples (ppm).
Sample Li Be Sc Ti V Cr Co Ni Cu Zn Ga Rb Sr
AGV-1 Preferred value 10.7 2.10 12.3 6295 119 9.4 15.2 15.5 58 87 20.2 66.6 660AGV-1 (n=5)* 10.9 2.14 12.5 6271 122 9.64 13.9 14.3 58.2 84.9 21.9 67.7 659RSD (%) 5.3 2.4 1.8 0.4 0.6 6.2 4.0 2.7 1.4 5.1 6.7 0.8 0.4Detection limit (ppb) 0.857 0.009 0.129 0.133 0.005 0.094 0.346 1.095 0.122 37.524 0.003 0.967 0.121Procedural blank (ppb) bDL bDL 0.770 bDL 0.140 3.288 bDL bDL 0.286 bDL bDL 11.484 bDLAGV-2 11.1 2.13 12.7 6078 114 15.1 15.6 17.8 49.0 87.2 20.0 67.8 658G2 - granite standard# 27.1 2.44 3.48 2844 32.8 7.01 4.38 2.10 8.8 84.2 22.5 168 475G2 Preferred value## 34.0 2.50 3.50 2877 36.0 n.r. 4.60 n.r 11.0 86.0 23.0 170 478Sinter and quartz vein309 sinter central 1 22.6 6.30 1.11 81.1 6.75 0.94 0.13 0.60 7.98 65.1 40.1 8.71 81.1309 sinter north-1 10.5 10.30 1.11 46.7 1.21 1.02 0.10 1.84 0.17 0.51 28.5 10.1 16.9309 sinter central-2 110 5.05 3.88 308 14.0 1.02 0.06 0.47 0.49 1.39 23.1 38.6 30.0309 sinter southwest-1 125 3.60 11.2 555 20.2 3.11 0.16 2.83 1.42 1.47 20.3 58.8 37.3309 sinter south-1 149 3.30 6.42 152 21.3 7.33 0.27 2.11 1.59 5.47 4.53 51.4 34.9309 sinter-west 21.6 2.99 7.65 302 4.67 3.47 0.19 1.18 1.41 4.70 1.96 22.1 222309 sinter-E 40.4 1.62 0.17 24.9 6.42 0.33 0.09 0.23 0.31 39.6 12.1 4.25 11.5309 sinter central-3 98.4 2.93 0.67 94.3 8.26 2.30 0.05 0.15 0.37 28.8 2.21 10.6 30.5309 sinter central-vn 44.2 0.47 0.17 21.3 2.15 0.62 0.04 0.47 0.39 228 0.58 2.76 12.6309 sinter north-2 22.8 4.06 0.08 47.4 1.40 0.52 0.02 0.34 0.20 100 14.1 2.86 15.5Microwave sinter 38.8 0.46 2.20 109 3.43 2.05 0.16 3.09 0.41 2.16 0.63 4.02 43.9Centipede sinter 18.5 0.17 9.39 209 4.77 2.76 0.08 1.16 0.30 3.05 1.03 1.77 14.8309 Qz vn-UG 156 1.64 1.10 38.0 0.66 2.45 0.08 1.54 0.12 1.95 1.07 24.5 12.0309 Qz vn-875 27.1 0.09 0.09 10.0 0.99 0.58 0.05 0.28 0.27 3.32 0.16 2.27 3.72309 Qz vn-894 35.9 0.11 0.36 29.4 1.86 0.25 0.04 0.11 0.10 2.93 0.55 10.1 4.13309 Qz vn-895 14.3 0.05 0.10 18.6 0.67 0.77 0.25 0.67 0.42 223 0.14 2.70 3.67Off Limits Qz vn 54.7 0.64 0.08 7.35 0.43 0.29 0.04 0.19 0.26 57.8 0.39 2.97 22.4Rain Gauge Range Qz vn 2.77 1.46 5.41 41.9 0.27 0.72 0.02 0.50 0.07 2.19 0.55 9.04 8.38Bali High-Qz 16.7 1.74 24.4 1028 18.0 15.2 0.20 1.72 1.62 5.46 2.99 10.6 229Mineralised silici!ed breccia
TH756 321-322 78.9 1.21 8.50 2082 28.1 315 2.28 5.59 4.05 30.6 7.44 481 25.9TH827 352-353 73.5 1.71 3.53 2370 48.3 177 2.93 6.35 3.20 33.3 8.66 314 213TH756 305-306 74.5 1.30 7.20 1706 30.4 115 2.60 4.14 6.29 45.2 6.31 358 42.1TH827 324-325 62.5 1.32 1.79 3788 45.6 45.4 3.79 3.09 12.1 35.6 9.67 413 75.2TH756 283-284 69.3 1.54 4.93 2825 47.9 385 4.01 8.15 8.80 43.3 9.22 579 34.2TH894 285 124 4.42 73.6 18382 318 78.2 33.8 27.0 21.0 168 26.5 203 73.1TH827 376-377 69.1 2.43 4.08 6856 67.5 364 8.17 9.28 9.87 87.8 10.6 252 105TH756 333-334 35.9 1.65 6.68 2743 67.7 444 4.73 10.5 7.53 52.1 8.90 335 38.1TH827 395-396 53.1 2.41 4.13 1837 40.8 283 2.53 6.61 6.72 43.4 8.33 279 14.4TH756 350-351 45.7 1.85 10.8 2320 39.2 206 3.39 7.02 6.94 30.7 6.61 411 40.9TH827 355-356 50.2 1.84 4.27 1689 37.7 98.8 1.91 3.53 2.36 12.8 10.8 587 69.3TH827 325-326 76.2 1.02 11.3 1877 26.6 70.0 1.74 2.84 3.60 27.7 5.75 400 178TH827 332-333 89.5 1.35 4.11 2204 48.4 91.5 2.33 5.78 19.6 27.3 6.62 327 69.7TH827 365-366 58.1 1.90 20.2 2406 43.0 187 3.63 7.17 4.32 38.4 10.00 401 69.6TH827 322-323 77.6 1.42 9.59 2072 19.4 57.6 2.01 2.90 3.11 33.4 8.98 433 25.8TH756 276-277 74.0 1.47 21.1 2913 59.9 33.4 4.22 6.27 10.9 51.9 8.42 614 135TH875 180 62.3 3.08 2.68 2255 77.7 162 2.99 7.66 14.5 52.5 14.9 567 27.1TH900 264 141 5.84 5.82 8180 115 25.2 8.34 26.6 84.1 147 22.6 571 50.0
Clay mineralsTh827-323b1 95.4 4.93 20.0 671 67.7 494 10.6 30.3 28.3 151 42.7 428 46.0Th827-323 2-1 77.6 3.57 13.2 882 55.0 394 6.84 15.4 15.1 72.4 34.0 380 27.7TH875-180b1 89.2 7.95 19.1 883 199 430 5.32 22.2 38.1 244 47.2 616 33.8TH875-180 2-1 60.7 5.26 14.2 1197 152 430 3.49 12.3 28.0 145 37.6 515 33.6
Igneous rocksTH893 471 felsite 62.0 4.06 3.89 5391 38.1 71.2 3.44 2.93 18.9 38.3 14.7 302 67.6Rhyolite intrusion-1 13.4 5.89 2.51 3006 13.9 8.13 1.83 5.18 6.66 24.9 19.0 317 12.2Rhyolite intrusion-2 4.60 6.16 6.77 2608 11.4 5.33 1.16 2.35 2.72 16.1 15.3 355 55.4Trachyte 62.7 9.06 4.39 1738 0.49 4.02 0.60 2.43 0.43 91.1 40.2 290 13.2Monzonite 33.2 14.8 2.72 1072 0.55 1.63 0.18 1.43 3.95 78.0 42.3 551 1.83Rain Gauge Range-felsic 2.17 6.68 5.76 2656 9.30 2.35 0.10 0.50 2.21 4.69 18.3 548 57.7Rain Gauge Range-ma!c 7.29 8.01 2.91 2268 11.7 3.89 1.40 2.07 5.58 42.8 21.2 362 47.5Lone Sister rhyolite 44.0 7.76 0.58 196 1.18 0.02 0.48 0.85 0.77 341 17.9 607 23.3
Siltstone and soilSiltstone 63.5 3.82 3.93 3311 33.8 14.6 1.32 9.47 8.87 91.0 16.6 260 32.7309 soil 17.5 1.15 13.7 5505 149 93.7 13.2 19.4 19.6 34.9 15.8 38.9 47.4Lone Sister soil 39.7 5.54 10.4 4468 66.0 56.1 19.0 23.1 18.2 44.0 11.4 85.5 56.9Microwave soil 10.54 1.52 5.45 3197 25.0 21.2 2.18 6.51 10.4 13.6 8.49 52.8 47.2
Quartz veins from NSWCathedral granite-Qz vn 1 20.8 0.15 0.002 16.7 0.039 0.059 0.005 0.064 0.13 13.8 0.024 0.29 0.047Cathedral granite-Qz vn 2 25.9 0.03 0.003 36.8 0.016 0.046 0.008 0.034 0.16 0.49 0.024 0.12 0.083
Replicate analysis at University of Melbourne309 sinter-E 30.8 1.33 0.16 23.6 6.32 0.31 0.05 0.54 0.55 262 12.1 4.30 12.3309 sinter central-3 61.5 1.96 0.58 87.3 7.61 2.05 0.07 0.20 0.36 55.1 2.10 10.5 30.9309 soil 17.6 0.81 12.6 5324 127 77.7 12.6 17.5 17.2 19.8 13.6 35.5 42.9Lone Sister soil 32.2 3.63 9.38 4307 57.7 47.6 16.3 19.2 14.9 26.5 9.80 73.5 47.7Microwave soil 15.1 1.04 5.10 3118 24.9 18.3 1.89 5.38 8.58 8.15 7.74 48.7 25.8
160 I.T. Uysal et al. / Chemical Geology 280 (2011) 154–169
Author's personal copy
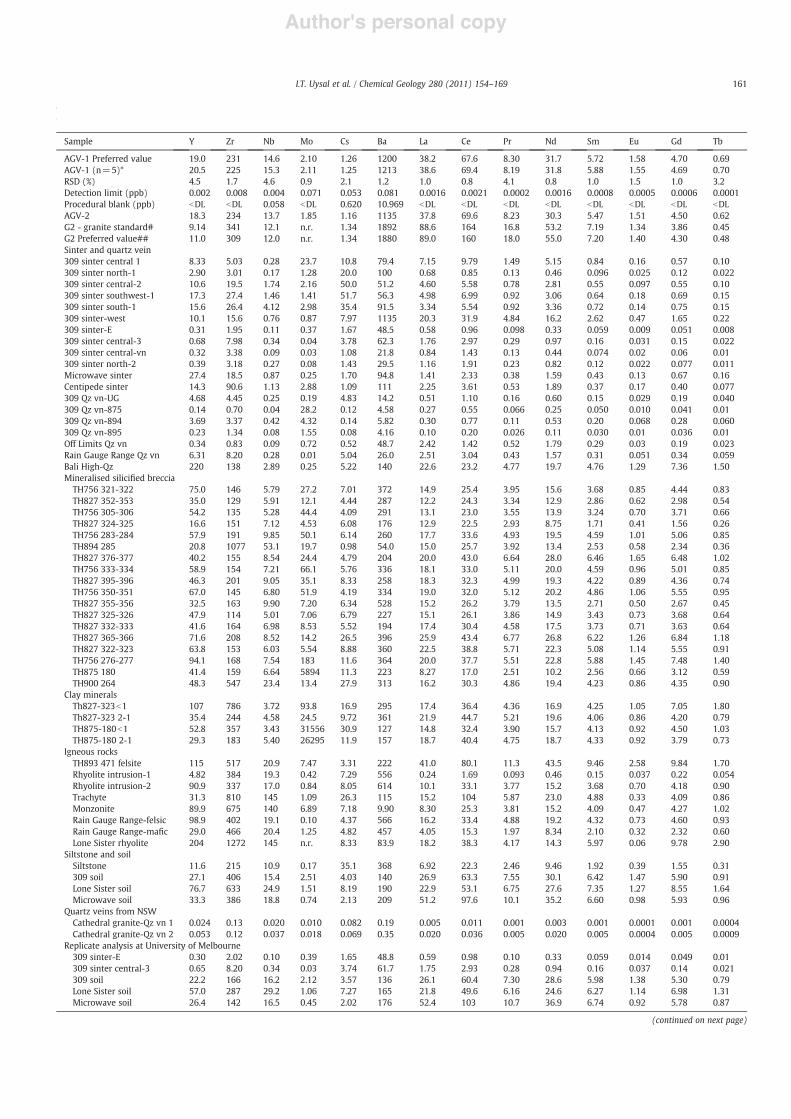
Table 2Trace element concentrations of the investigated samples (ppm).
Sample Y Zr Nb Mo Cs Ba La Ce Pr Nd Sm Eu Gd Tb
AGV-1 Preferred value 19.0 231 14.6 2.10 1.26 1200 38.2 67.6 8.30 31.7 5.72 1.58 4.70 0.69AGV-1 (n=5)* 20.5 225 15.3 2.11 1.25 1213 38.6 69.4 8.19 31.8 5.88 1.55 4.69 0.70RSD (%) 4.5 1.7 4.6 0.9 2.1 1.2 1.0 0.8 4.1 0.8 1.0 1.5 1.0 3.2Detection limit (ppb) 0.002 0.008 0.004 0.071 0.053 0.081 0.0016 0.0021 0.0002 0.0016 0.0008 0.0005 0.0006 0.0001Procedural blank (ppb) bDL bDL 0.058 bDL 0.620 10.969 bDL bDL bDL bDL bDL bDL bDL bDLAGV-2 18.3 234 13.7 1.85 1.16 1135 37.8 69.6 8.23 30.3 5.47 1.51 4.50 0.62G2 - granite standard# 9.14 341 12.1 n.r. 1.34 1892 88.6 164 16.8 53.2 7.19 1.34 3.86 0.45G2 Preferred value## 11.0 309 12.0 n.r. 1.34 1880 89.0 160 18.0 55.0 7.20 1.40 4.30 0.48Sinter and quartz vein309 sinter central 1 8.33 5.03 0.28 23.7 10.8 79.4 7.15 9.79 1.49 5.15 0.84 0.16 0.57 0.10309 sinter north-1 2.90 3.01 0.17 1.28 20.0 100 0.68 0.85 0.13 0.46 0.096 0.025 0.12 0.022309 sinter central-2 10.6 19.5 1.74 2.16 50.0 51.2 4.60 5.58 0.78 2.81 0.55 0.097 0.55 0.10309 sinter southwest-1 17.3 27.4 1.46 1.41 51.7 56.3 4.98 6.99 0.92 3.06 0.64 0.18 0.69 0.15309 sinter south-1 15.6 26.4 4.12 2.98 35.4 91.5 3.34 5.54 0.92 3.36 0.72 0.14 0.75 0.15309 sinter-west 10.1 15.6 0.76 0.87 7.97 1135 20.3 31.9 4.84 16.2 2.62 0.47 1.65 0.22309 sinter-E 0.31 1.95 0.11 0.37 1.67 48.5 0.58 0.96 0.098 0.33 0.059 0.009 0.051 0.008309 sinter central-3 0.68 7.98 0.34 0.04 3.78 62.3 1.76 2.97 0.29 0.97 0.16 0.031 0.15 0.022309 sinter central-vn 0.32 3.38 0.09 0.03 1.08 21.8 0.84 1.43 0.13 0.44 0.074 0.02 0.06 0.01309 sinter north-2 0.39 3.18 0.27 0.08 1.43 29.5 1.16 1.91 0.23 0.82 0.12 0.022 0.077 0.011Microwave sinter 27.4 18.5 0.87 0.25 1.70 94.8 1.41 2.33 0.38 1.59 0.43 0.13 0.67 0.16Centipede sinter 14.3 90.6 1.13 2.88 1.09 111 2.25 3.61 0.53 1.89 0.37 0.17 0.40 0.077309 Qz vn-UG 4.68 4.45 0.25 0.19 4.83 14.2 0.51 1.10 0.16 0.60 0.15 0.029 0.19 0.040309 Qz vn-875 0.14 0.70 0.04 28.2 0.12 4.58 0.27 0.55 0.066 0.25 0.050 0.010 0.041 0.01309 Qz vn-894 3.69 3.37 0.42 4.32 0.14 5.82 0.30 0.77 0.11 0.53 0.20 0.068 0.28 0.060309 Qz vn-895 0.23 1.34 0.08 1.55 0.08 4.16 0.10 0.20 0.026 0.11 0.030 0.01 0.036 0.01Off Limits Qz vn 0.34 0.83 0.09 0.72 0.52 48.7 2.42 1.42 0.52 1.79 0.29 0.03 0.19 0.023Rain Gauge Range Qz vn 6.31 8.20 0.28 0.01 5.04 26.0 2.51 3.04 0.43 1.57 0.31 0.051 0.34 0.059Bali High-Qz 220 138 2.89 0.25 5.22 140 22.6 23.2 4.77 19.7 4.76 1.29 7.36 1.50Mineralised silici!ed breccia
TH756 321-322 75.0 146 5.79 27.2 7.01 372 14.9 25.4 3.95 15.6 3.68 0.85 4.44 0.83TH827 352-353 35.0 129 5.91 12.1 4.44 287 12.2 24.3 3.34 12.9 2.86 0.62 2.98 0.54TH756 305-306 54.2 135 5.28 44.4 4.09 291 13.1 23.0 3.55 13.9 3.24 0.70 3.71 0.66TH827 324-325 16.6 151 7.12 4.53 6.08 176 12.9 22.5 2.93 8.75 1.71 0.41 1.56 0.26TH756 283-284 57.9 191 9.85 50.1 6.14 260 17.7 33.6 4.93 19.5 4.59 1.01 5.06 0.85TH894 285 20.8 1077 53.1 19.7 0.98 54.0 15.0 25.7 3.92 13.4 2.53 0.58 2.34 0.36TH827 376-377 40.2 155 8.54 24.4 4.79 204 20.0 43.0 6.64 28.0 6.46 1.65 6.48 1.02TH756 333-334 58.9 154 7.21 66.1 5.76 336 18.1 33.0 5.11 20.0 4.59 0.96 5.01 0.85TH827 395-396 46.3 201 9.05 35.1 8.33 258 18.3 32.3 4.99 19.3 4.22 0.89 4.36 0.74TH756 350-351 67.0 145 6.80 51.9 4.19 334 19.0 32.0 5.12 20.2 4.86 1.06 5.55 0.95TH827 355-356 32.5 163 9.90 7.20 6.34 528 15.2 26.2 3.79 13.5 2.71 0.50 2.67 0.45TH827 325-326 47.9 114 5.01 7.06 6.79 227 15.1 26.1 3.86 14.9 3.43 0.73 3.68 0.64TH827 332-333 41.6 164 6.98 8.53 5.52 194 17.4 30.4 4.58 17.5 3.73 0.71 3.63 0.64TH827 365-366 71.6 208 8.52 14.2 26.5 396 25.9 43.4 6.77 26.8 6.22 1.26 6.84 1.18TH827 322-323 63.8 153 6.03 5.54 8.88 360 22.5 38.8 5.71 22.3 5.08 1.14 5.55 0.91TH756 276-277 94.1 168 7.54 183 11.6 364 20.0 37.7 5.51 22.8 5.88 1.45 7.48 1.40TH875 180 41.4 159 6.64 5894 11.3 223 8.27 17.0 2.51 10.2 2.56 0.66 3.12 0.59TH900 264 48.3 547 23.4 13.4 27.9 313 16.2 30.3 4.86 19.4 4.23 0.86 4.35 0.90
Clay mineralsTh827-323b1 107 786 3.72 93.8 16.9 295 17.4 36.4 4.36 16.9 4.25 1.05 7.05 1.80Th827-323 2-1 35.4 244 4.58 24.5 9.72 361 21.9 44.7 5.21 19.6 4.06 0.86 4.20 0.79TH875-180b1 52.8 357 3.43 31556 30.9 127 14.8 32.4 3.90 15.7 4.13 0.92 4.50 1.03TH875-180 2-1 29.3 183 5.40 26295 11.9 157 18.7 40.4 4.75 18.7 4.33 0.92 3.79 0.73
Igneous rocksTH893 471 felsite 115 517 20.9 7.47 3.31 222 41.0 80.1 11.3 43.5 9.46 2.58 9.84 1.70Rhyolite intrusion-1 4.82 384 19.3 0.42 7.29 556 0.24 1.69 0.093 0.46 0.15 0.037 0.22 0.054Rhyolite intrusion-2 90.9 337 17.0 0.84 8.05 614 10.1 33.1 3.77 15.2 3.68 0.70 4.18 0.90Trachyte 31.3 810 145 1.09 26.3 115 15.2 104 5.87 23.0 4.88 0.33 4.09 0.86Monzonite 89.9 675 140 6.89 7.18 9.90 8.30 25.3 3.81 15.2 4.09 0.47 4.27 1.02Rain Gauge Range-felsic 98.9 402 19.1 0.10 4.37 566 16.2 33.4 4.88 19.2 4.32 0.73 4.60 0.93Rain Gauge Range-ma!c 29.0 466 20.4 1.25 4.82 457 4.05 15.3 1.97 8.34 2.10 0.32 2.32 0.60Lone Sister rhyolite 204 1272 145 n.r. 8.33 83.9 18.2 38.3 4.17 14.3 5.97 0.06 9.78 2.90
Siltstone and soilSiltstone 11.6 215 10.9 0.17 35.1 368 6.92 22.3 2.46 9.46 1.92 0.39 1.55 0.31309 soil 27.1 406 15.4 2.51 4.03 140 26.9 63.3 7.55 30.1 6.42 1.47 5.90 0.91Lone Sister soil 76.7 633 24.9 1.51 8.19 190 22.9 53.1 6.75 27.6 7.35 1.27 8.55 1.64Microwave soil 33.3 386 18.8 0.74 2.13 209 51.2 97.6 10.1 35.2 6.60 0.98 5.93 0.96
Quartz veins from NSWCathedral granite-Qz vn 1 0.024 0.13 0.020 0.010 0.082 0.19 0.005 0.011 0.001 0.003 0.001 0.0001 0.001 0.0004Cathedral granite-Qz vn 2 0.053 0.12 0.037 0.018 0.069 0.35 0.020 0.036 0.005 0.020 0.005 0.0004 0.005 0.0009
Replicate analysis at University of Melbourne309 sinter-E 0.30 2.02 0.10 0.39 1.65 48.8 0.59 0.98 0.10 0.33 0.059 0.014 0.049 0.01309 sinter central-3 0.65 8.20 0.34 0.03 3.74 61.7 1.75 2.93 0.28 0.94 0.16 0.037 0.14 0.021309 soil 22.2 166 16.2 2.12 3.57 136 26.1 60.4 7.30 28.6 5.98 1.38 5.30 0.79Lone Sister soil 57.0 287 29.2 1.06 7.27 165 21.8 49.6 6.16 24.6 6.27 1.14 6.98 1.31Microwave soil 26.4 142 16.5 0.45 2.02 176 52.4 103 10.7 36.9 6.74 0.92 5.78 0.87
(continued on next page)
161I.T. Uysal et al. / Chemical Geology 280 (2011) 154–169
Author's personal copy
Table 2 (continued)
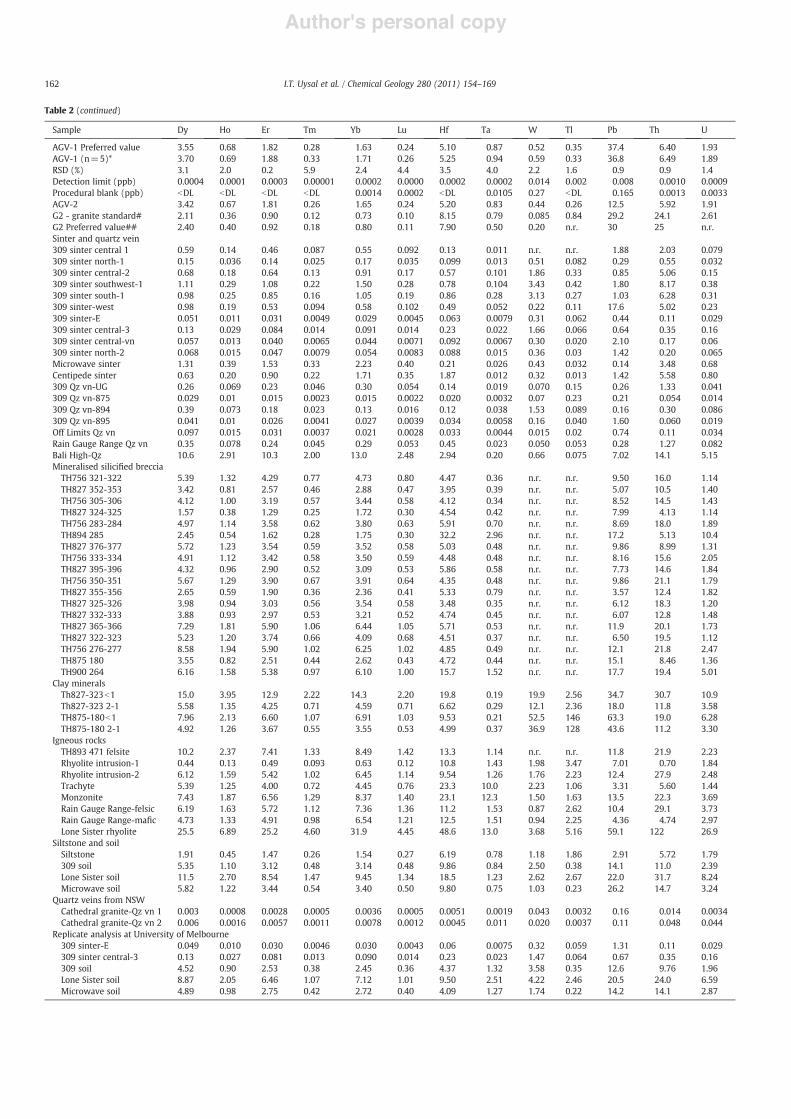
Sample Dy Ho Er Tm Yb Lu Hf Ta W Tl Pb Th U
AGV-1 Preferred value 3.55 0.68 1.82 0.28 1.63 0.24 5.10 0.87 0.52 0.35 37.4 6.40 1.93AGV-1 (n=5)* 3.70 0.69 1.88 0.33 1.71 0.26 5.25 0.94 0.59 0.33 36.8 6.49 1.89RSD (%) 3.1 2.0 0.2 5.9 2.4 4.4 3.5 4.0 2.2 1.6 0.9 0.9 1.4Detection limit (ppb) 0.0004 0.0001 0.0003 0.00001 0.0002 0.0000 0.0002 0.0002 0.014 0.002 0.008 0.0010 0.0009Procedural blank (ppb) bDL bDL bDL bDL 0.0014 0.0002 bDL 0.0105 0.27 bDL 0.165 0.0013 0.0033AGV-2 3.42 0.67 1.81 0.26 1.65 0.24 5.20 0.83 0.44 0.26 12.5 5.92 1.91G2 - granite standard# 2.11 0.36 0.90 0.12 0.73 0.10 8.15 0.79 0.085 0.84 29.2 24.1 2.61G2 Preferred value## 2.40 0.40 0.92 0.18 0.80 0.11 7.90 0.50 0.20 n.r. 30 25 n.r.Sinter and quartz vein309 sinter central 1 0.59 0.14 0.46 0.087 0.55 0.092 0.13 0.011 n.r. n.r. 1.88 2.03 0.079309 sinter north-1 0.15 0.036 0.14 0.025 0.17 0.035 0.099 0.013 0.51 0.082 0.29 0.55 0.032309 sinter central-2 0.68 0.18 0.64 0.13 0.91 0.17 0.57 0.101 1.86 0.33 0.85 5.06 0.15309 sinter southwest-1 1.11 0.29 1.08 0.22 1.50 0.28 0.78 0.104 3.43 0.42 1.80 8.17 0.38309 sinter south-1 0.98 0.25 0.85 0.16 1.05 0.19 0.86 0.28 3.13 0.27 1.03 6.28 0.31309 sinter-west 0.98 0.19 0.53 0.094 0.58 0.102 0.49 0.052 0.22 0.11 17.6 5.02 0.23309 sinter-E 0.051 0.011 0.031 0.0049 0.029 0.0045 0.063 0.0079 0.31 0.062 0.44 0.11 0.029309 sinter central-3 0.13 0.029 0.084 0.014 0.091 0.014 0.23 0.022 1.66 0.066 0.64 0.35 0.16309 sinter central-vn 0.057 0.013 0.040 0.0065 0.044 0.0071 0.092 0.0067 0.30 0.020 2.10 0.17 0.06309 sinter north-2 0.068 0.015 0.047 0.0079 0.054 0.0083 0.088 0.015 0.36 0.03 1.42 0.20 0.065Microwave sinter 1.31 0.39 1.53 0.33 2.23 0.40 0.21 0.026 0.43 0.032 0.14 3.48 0.68Centipede sinter 0.63 0.20 0.90 0.22 1.71 0.35 1.87 0.012 0.32 0.013 1.42 5.58 0.80309 Qz vn-UG 0.26 0.069 0.23 0.046 0.30 0.054 0.14 0.019 0.070 0.15 0.26 1.33 0.041309 Qz vn-875 0.029 0.01 0.015 0.0023 0.015 0.0022 0.020 0.0032 0.07 0.23 0.21 0.054 0.014309 Qz vn-894 0.39 0.073 0.18 0.023 0.13 0.016 0.12 0.038 1.53 0.089 0.16 0.30 0.086309 Qz vn-895 0.041 0.01 0.026 0.0041 0.027 0.0039 0.034 0.0058 0.16 0.040 1.60 0.060 0.019Off Limits Qz vn 0.097 0.015 0.031 0.0037 0.021 0.0028 0.033 0.0044 0.015 0.02 0.74 0.11 0.034Rain Gauge Range Qz vn 0.35 0.078 0.24 0.045 0.29 0.053 0.45 0.023 0.050 0.053 0.28 1.27 0.082Bali High-Qz 10.6 2.91 10.3 2.00 13.0 2.48 2.94 0.20 0.66 0.075 7.02 14.1 5.15Mineralised silici!ed breccia
TH756 321-322 5.39 1.32 4.29 0.77 4.73 0.80 4.47 0.36 n.r. n.r. 9.50 16.0 1.14TH827 352-353 3.42 0.81 2.57 0.46 2.88 0.47 3.95 0.39 n.r. n.r. 5.07 10.5 1.40TH756 305-306 4.12 1.00 3.19 0.57 3.44 0.58 4.12 0.34 n.r. n.r. 8.52 14.5 1.43TH827 324-325 1.57 0.38 1.29 0.25 1.72 0.30 4.54 0.42 n.r. n.r. 7.99 4.13 1.14TH756 283-284 4.97 1.14 3.58 0.62 3.80 0.63 5.91 0.70 n.r. n.r. 8.69 18.0 1.89TH894 285 2.45 0.54 1.62 0.28 1.75 0.30 32.2 2.96 n.r. n.r. 17.2 5.13 10.4TH827 376-377 5.72 1.23 3.54 0.59 3.52 0.58 5.03 0.48 n.r. n.r. 9.86 8.99 1.31TH756 333-334 4.91 1.12 3.42 0.58 3.50 0.59 4.48 0.48 n.r. n.r. 8.16 15.6 2.05TH827 395-396 4.32 0.96 2.90 0.52 3.09 0.53 5.86 0.58 n.r. n.r. 7.73 14.6 1.84TH756 350-351 5.67 1.29 3.90 0.67 3.91 0.64 4.35 0.48 n.r. n.r. 9.86 21.1 1.79TH827 355-356 2.65 0.59 1.90 0.36 2.36 0.41 5.33 0.79 n.r. n.r. 3.57 12.4 1.82TH827 325-326 3.98 0.94 3.03 0.56 3.54 0.58 3.48 0.35 n.r. n.r. 6.12 18.3 1.20TH827 332-333 3.88 0.93 2.97 0.53 3.21 0.52 4.74 0.45 n.r. n.r. 6.07 12.8 1.48TH827 365-366 7.29 1.81 5.90 1.06 6.44 1.05 5.71 0.53 n.r. n.r. 11.9 20.1 1.73TH827 322-323 5.23 1.20 3.74 0.66 4.09 0.68 4.51 0.37 n.r. n.r. 6.50 19.5 1.12TH756 276-277 8.58 1.94 5.90 1.02 6.25 1.02 4.85 0.49 n.r. n.r. 12.1 21.8 2.47TH875 180 3.55 0.82 2.51 0.44 2.62 0.43 4.72 0.44 n.r. n.r. 15.1 8.46 1.36TH900 264 6.16 1.58 5.38 0.97 6.10 1.00 15.7 1.52 n.r. n.r. 17.7 19.4 5.01
Clay mineralsTh827-323b1 15.0 3.95 12.9 2.22 14.3 2.20 19.8 0.19 19.9 2.56 34.7 30.7 10.9Th827-323 2-1 5.58 1.35 4.25 0.71 4.59 0.71 6.62 0.29 12.1 2.36 18.0 11.8 3.58TH875-180b1 7.96 2.13 6.60 1.07 6.91 1.03 9.53 0.21 52.5 146 63.3 19.0 6.28TH875-180 2-1 4.92 1.26 3.67 0.55 3.55 0.53 4.99 0.37 36.9 128 43.6 11.2 3.30
Igneous rocksTH893 471 felsite 10.2 2.37 7.41 1.33 8.49 1.42 13.3 1.14 n.r. n.r. 11.8 21.9 2.23Rhyolite intrusion-1 0.44 0.13 0.49 0.093 0.63 0.12 10.8 1.43 1.98 3.47 7.01 0.70 1.84Rhyolite intrusion-2 6.12 1.59 5.42 1.02 6.45 1.14 9.54 1.26 1.76 2.23 12.4 27.9 2.48Trachyte 5.39 1.25 4.00 0.72 4.45 0.76 23.3 10.0 2.23 1.06 3.31 5.60 1.44Monzonite 7.43 1.87 6.56 1.29 8.37 1.40 23.1 12.3 1.50 1.63 13.5 22.3 3.69Rain Gauge Range-felsic 6.19 1.63 5.72 1.12 7.36 1.36 11.2 1.53 0.87 2.62 10.4 29.1 3.73Rain Gauge Range-ma!c 4.73 1.33 4.91 0.98 6.54 1.21 12.5 1.51 0.94 2.25 4.36 4.74 2.97Lone Sister rhyolite 25.5 6.89 25.2 4.60 31.9 4.45 48.6 13.0 3.68 5.16 59.1 122 26.9
Siltstone and soilSiltstone 1.91 0.45 1.47 0.26 1.54 0.27 6.19 0.78 1.18 1.86 2.91 5.72 1.79309 soil 5.35 1.10 3.12 0.48 3.14 0.48 9.86 0.84 2.50 0.38 14.1 11.0 2.39Lone Sister soil 11.5 2.70 8.54 1.47 9.45 1.34 18.5 1.23 2.62 2.67 22.0 31.7 8.24Microwave soil 5.82 1.22 3.44 0.54 3.40 0.50 9.80 0.75 1.03 0.23 26.2 14.7 3.24
Quartz veins from NSWCathedral granite-Qz vn 1 0.003 0.0008 0.0028 0.0005 0.0036 0.0005 0.0051 0.0019 0.043 0.0032 0.16 0.014 0.0034Cathedral granite-Qz vn 2 0.006 0.0016 0.0057 0.0011 0.0078 0.0012 0.0045 0.011 0.020 0.0037 0.11 0.048 0.044
Replicate analysis at University of Melbourne309 sinter-E 0.049 0.010 0.030 0.0046 0.030 0.0043 0.06 0.0075 0.32 0.059 1.31 0.11 0.029309 sinter central-3 0.13 0.027 0.081 0.013 0.090 0.014 0.23 0.023 1.47 0.064 0.67 0.35 0.16309 soil 4.52 0.90 2.53 0.38 2.45 0.36 4.37 1.32 3.58 0.35 12.6 9.76 1.96Lone Sister soil 8.87 2.05 6.46 1.07 7.12 1.01 9.50 2.51 4.22 2.46 20.5 24.0 6.59Microwave soil 4.89 0.98 2.75 0.42 2.72 0.40 4.09 1.27 1.74 0.22 14.2 14.1 2.87
162 I.T. Uysal et al. / Chemical Geology 280 (2011) 154–169
Author's personal copy
ratio, and time available for crystallization (Arkai, 2002; Ji andBrowne, 2000; Merrriman and Frey, 1999). Better-developed crystal-line illites show narrower 001 basal illite peaks and have lower ICvalues. Such illites were formed at higher temperatures or duringprolonged heating events. Higher IC values (wider peaks), on theother hand, indicate lower crystallisation temperatures and/or rapidprecipitation during hydrothermal processes.
IC values for the 309 samples range from 0.21° to 0.52° (!2")clustering mainly around 0.25° and 0.45° (!2") (Table 1). In analogywith published studies (Ji and Browne, 2000; Merrriman and Frey,1999), clusters of IC values around 0.25° and 0.45° (!2!) indicate twocrystallisation events at temperatures of about 300 °C and 200 °C,respectively. Alternatively, samples with higher IC values of around0.45° (2!) precipitated during transient "uid "ow events at very high"uid/rock ratios. IC values between around 0.25° and 0.45° (!2")indicate either mixing of two illite populations or the effect of lessdominant sporadic "uid pulses at temperatures between 300 °C and200 °C (Ji and Browne, 2000). Unsilici!ed samples from deepunmineralised zones have IC values higher than 0.55° (!2!;Table 1). Similarly, barren Lone Sister samples are characterised bysigni!cantly higher IC values, whereas illites from highly mineralisedrocks are better crystalline with lower IC values (larger crystallite ordomain size, less swelling layers and crystal defect, Eberl and Velde,1989) indicating higher crystallisation temperatures. In summary,increasing illite crystallinity with lower IC values (b0.5 !2!) indicatezones of high grade systems, which can be used as a reliable indicatortool to locate high grade deposits or areas of intense geothermalactivities. Illite crystallinity values for some representative outcropsamples outside 309 and Lone Sister are shown in Table 1. Samplesfrom Big Red, LS7, Apache, and particularly Coyote show similar ICvalues as those of the mineralised samples from 309 and Lone Sister,whereas samples from Off Limits and Telephone Creek areas displaylower crystallinity.
5.3. Trace element geochemistry
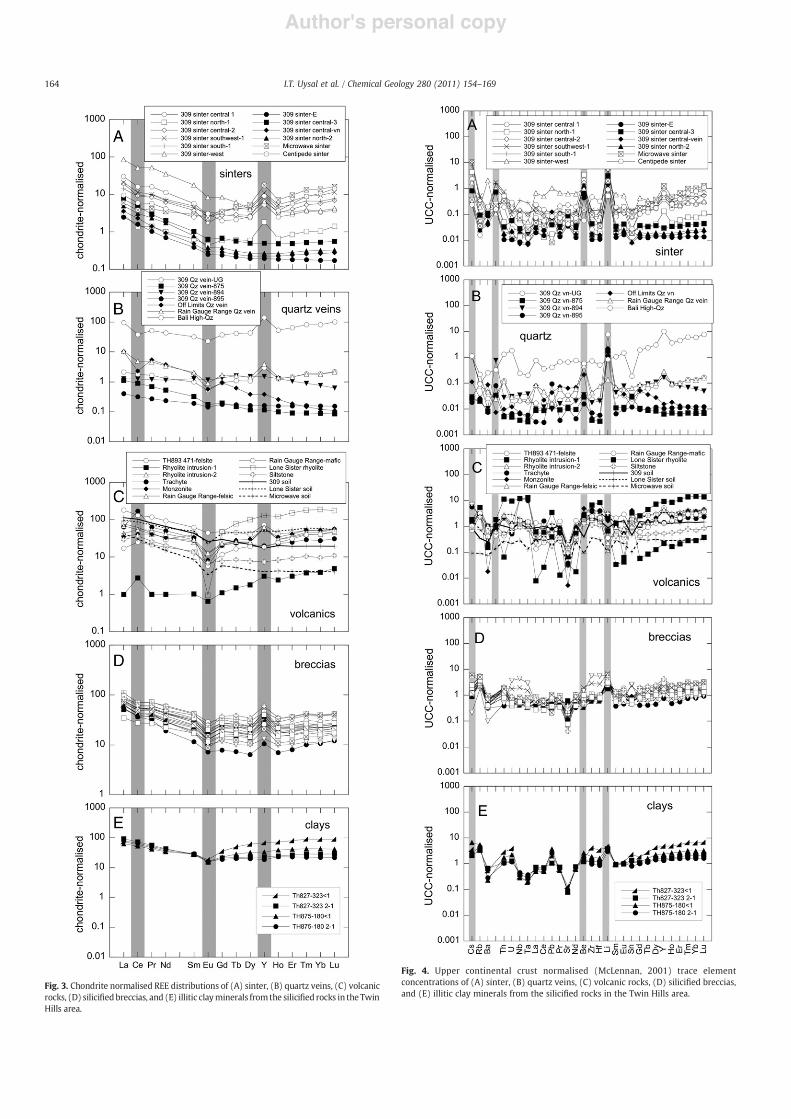
The trace element data are shown in Table 2 and chondrite-normalised (Sun and McDonough, 1989) rare earth element (REE)pattern for sinter, quartz vein, and volcanic rocks from the 309 minearea and from areas distal to 309 are presented in Fig. 3A–C. REEpatterns of silici!ed hydrothermal breccias, sandstones, andmudrocks hosting the gold mineralisation at 309 and illitic clayseparates from these silici!ed rocks are shown in Fig. 3D and E.
Sinter and quartz samples enriched in heavy REE (HREE) showpositive Y and negative Ce anomalies (Fig. 3A). Similarly, volcanicrocks near 309 and from other areas in the Twin Hills area areenriched in HREE, with relatively elevated Y concentrations for somesamples (e.g., Rain Gauge Range-ma!c). In contrast to the silicadeposits, the volcanic rocks either do not show a Ce anomaly or arecharacterised by Ce enrichment (Fig. 3C). Soil samples representingtwo mineralised areas (309 and Lone Sister) and the Microwaveprospect area share very similar REE patterns, with slightly depletedand parallel HREE pattern. The volcanogenic siltstone near 309 has aparallel REE pattern at lower REE concentrations when compared tothe 309 soil, combined with a slightly positive Ce anomaly (Fig. 3C).
Notably, the soil samples from the mineralised areas are enriched inREE compared with the Microwave soil. Silici!ed hydrothermalbreccias and sedimentary rocks from the mineralised 309 representcoherent REE distributions with slightly enriched HREE patterns, andnegative Ce-Eu anomalies coupled with positive Y anomalies (Fig 3D).It is obvious that !ner clay size fractions (b1 #m) from the breccias at309 have more HREE-enriched REE patterns, whereas the coarser clayfractions (2–1 #m) have similar REE pattern to the breccias, apartfrom marked anomalies for Ce, Eu, and Y in the latter.
Trace element compositions of the sinter deposits, quartz veins,and volcanic rocks, silici!ed mineralised breccia and sediments, andthe clays from the Twin Hills area are normalised to the compositionof average upper continental crust (UCC, McLennan, 2001) andpresented in Fig. 4A–E. Cs, Be, and Li are considerably enriched insinter deposits, particularly in those representing the 309 mine area(Fig. 4A). Quartz veins from the prospect areas outside 309(particularly Bali High quartz) are more enriched in all trace elementsthan the quartz veins hosted by the mineralised braccia at 309(Fig. 4B). Except one slightly altered rhyolite intrusion and onemonzonite intrusion, volcanic rocks in the Twin Hills area have similartrace element distributions and levels to the UCC, except for thedepletion in Ba and Sr in the volcanics (Fig. 4C). UCC-normalised traceelement patterns for the mineralised hydrothermal breccias and theirillite separates are very irregular (Fig. 4D and E). Ba and Sr aresigni!cantly depleted, whereas Rb, Li, and Y concentrations areelevated in most samples. Cs, Th and U are enriched in the b1 #m illitefractions (Fig. 4E).
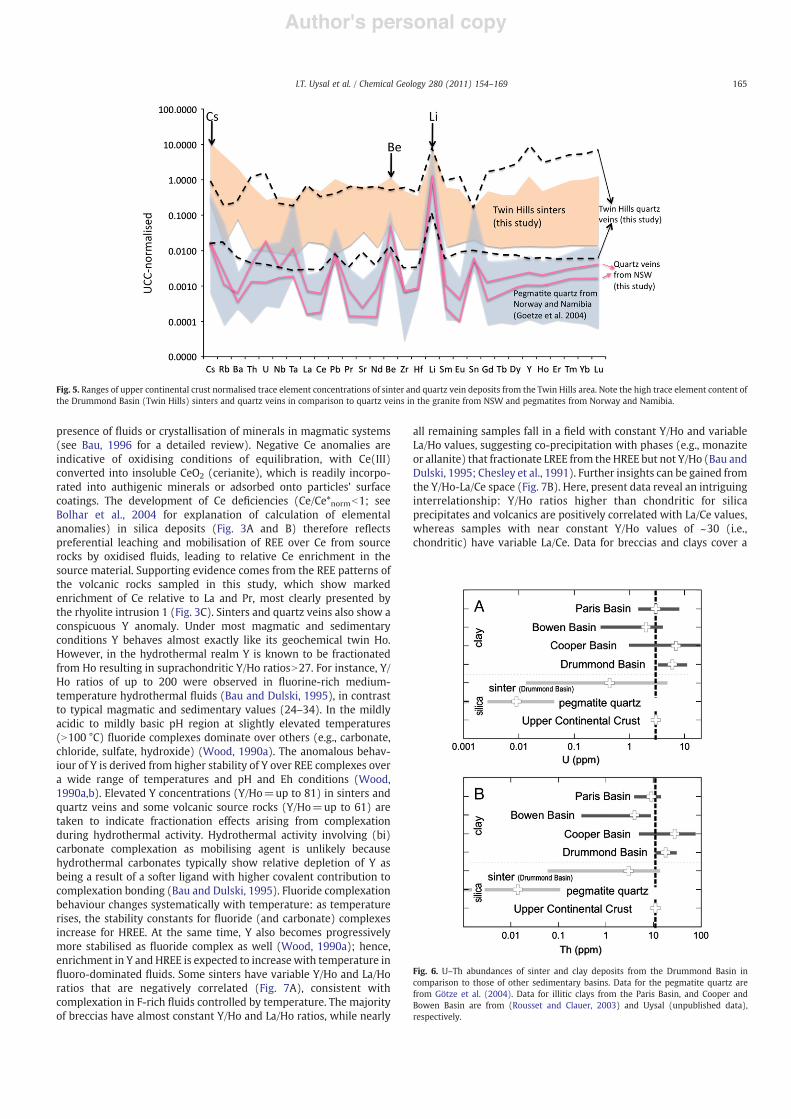
Overall, concentrations of trace elements, particularly those fromthe quartz and sinter samples from the entire Twin Hills area, aresubstantially higher compared to trace element concentrations of thequartz veins from Hillgrove Plutonic Suite, New England Fold Belt andthose of pegmatitic quartz (Götze et al., 2004) (Fig. 5). Compared topegmatitic quartz (Götze et al., 2004), U and Th concentrations insinter and quartz are also signi!cantly elevated (Fig. 6A and B). Inaddition, U and Th contents of the illitic clay minerals from theDrummond Basin are as high as those measured in the Cooper Basin,which are associated to an elevated radiometric heat production fromthe basement granite (Middleton, 1979). In contrast, U and Th levelsin the clays of the Bowen Basin in Queensland and the Paris Basin inEurope are similar to those of the upper continental crust (Fig. 6A andB). The rhyolites from Lone Sister have U and Th concentrations 10times higher than those of the UCC. The soil sample fromMicrowave isdepleted in trace elements compared to the soils representing themineralised (309 and Lone Sister) areas. In addition, the soil fromLone Sister is distinctively enriched in Th and U (Table 2).
6. Discussion
6.1. Y–REE geochemistry
Under magmatic and sedimentary conditions, REE behave as acoherent group of elements according to their charge (trivalent) andsimilar ionic radius. Redox-sensitive REE, such as Ce and Eu, tend to befractionated from neighbouring REE, due to changes in their valenciesaffecting their geochemical behaviour during complexation in the
Notes to Table 2:All values in ppm except detection limits (ppb) and procedural blank (ppb).Detection limits calculated as three times the standard deviation of calibration blanks.RSD relative standard deviation of AGV-1.Preferred values for AGV-1 from Jochum et al. (2005).*Long-term average standard measured at the University of Queensland.#Standard measured for this run at the University of Melbourne.##Preferred values for G2 from USGS.n.r.=not reported.bDL=lower than 3 s detection limit.
163I.T. Uysal et al. / Chemical Geology 280 (2011) 154–169
Author's personal copy
Fig. 4. Upper continental crust normalised (McLennan, 2001) trace elementconcentrations of (A) sinter, (B) quartz veins, (C) volcanic rocks, (D) silici!ed breccias,and (E) illitic clay minerals from the silici!ed rocks in the Twin Hills area.
Fig. 3. Chondrite normalised REE distributions of (A) sinter, (B) quartz veins, (C) volcanicrocks, (D) silici!edbreccias, and (E) illitic clayminerals fromthe silici!ed rocks in the TwinHills area.
164 I.T. Uysal et al. / Chemical Geology 280 (2011) 154–169
Author's personal copy
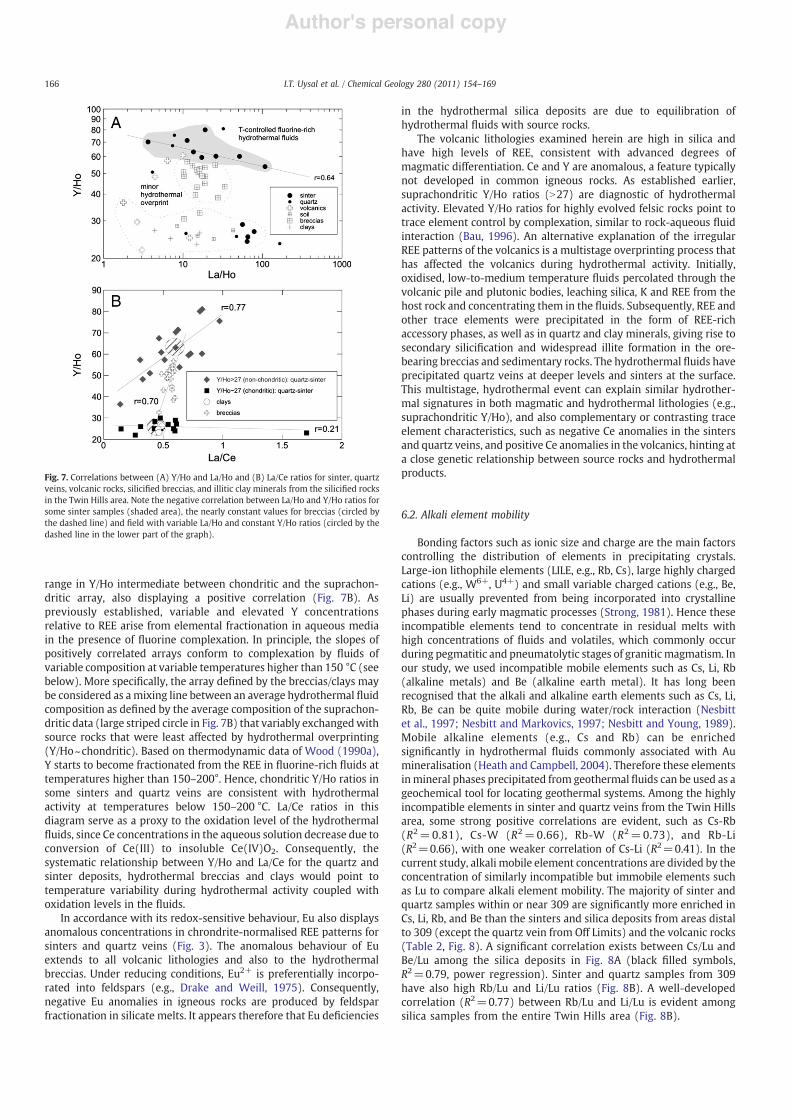
presence of "uids or crystallisation of minerals in magmatic systems(see Bau, 1996 for a detailed review). Negative Ce anomalies areindicative of oxidising conditions of equilibration, with Ce(III)converted into insoluble CeO2 (cerianite), which is readily incorpo-rated into authigenic minerals or adsorbed onto particles' surfacecoatings. The development of Ce de!ciencies (Ce/Ce*normb1; seeBolhar et al., 2004 for explanation of calculation of elementalanomalies) in silica deposits (Fig. 3A and B) therefore re"ectspreferential leaching and mobilisation of REE over Ce from sourcerocks by oxidised "uids, leading to relative Ce enrichment in thesource material. Supporting evidence comes from the REE patterns ofthe volcanic rocks sampled in this study, which show markedenrichment of Ce relative to La and Pr, most clearly presented bythe rhyolite intrusion 1 (Fig. 3C). Sinters and quartz veins also show aconspicuous Y anomaly. Under most magmatic and sedimentaryconditions Y behaves almost exactly like its geochemical twin Ho.However, in the hydrothermal realm Y is known to be fractionatedfrom Ho resulting in suprachondritic Y/Ho ratiosN27. For instance, Y/Ho ratios of up to 200 were observed in "uorine-rich medium-temperature hydrothermal "uids (Bau and Dulski, 1995), in contrastto typical magmatic and sedimentary values (24–34). In the mildlyacidic to mildly basic pH region at slightly elevated temperatures(N100 °C) "uoride complexes dominate over others (e.g., carbonate,chloride, sulfate, hydroxide) (Wood, 1990a). The anomalous behav-iour of Y is derived from higher stability of Y over REE complexes overa wide range of temperatures and pH and Eh conditions (Wood,1990a,b). Elevated Y concentrations (Y/Ho=up to 81) in sinters andquartz veins and some volcanic source rocks (Y/Ho=up to 61) aretaken to indicate fractionation effects arising from complexationduring hydrothermal activity. Hydrothermal activity involving (bi)carbonate complexation as mobilising agent is unlikely becausehydrothermal carbonates typically show relative depletion of Y asbeing a result of a softer ligand with higher covalent contribution tocomplexation bonding (Bau and Dulski, 1995). Fluoride complexationbehaviour changes systematically with temperature: as temperaturerises, the stability constants for "uoride (and carbonate) complexesincrease for HREE. At the same time, Y also becomes progressivelymore stabilised as "uoride complex as well (Wood, 1990a); hence,enrichment in Y and HREE is expected to increase with temperature in"uoro-dominated "uids. Some sinters have variable Y/Ho and La/Horatios that are negatively correlated (Fig. 7A), consistent withcomplexation in F-rich "uids controlled by temperature. The majorityof breccias have almost constant Y/Ho and La/Ho ratios, while nearly
all remaining samples fall in a !eld with constant Y/Ho and variableLa/Ho values, suggesting co-precipitation with phases (e.g., monaziteor allanite) that fractionate LREE from the HREE but not Y/Ho (Bau andDulski, 1995; Chesley et al., 1991). Further insights can be gained fromthe Y/Ho-La/Ce space (Fig. 7B). Here, present data reveal an intriguinginterrelationship: Y/Ho ratios higher than chondritic for silicaprecipitates and volcanics are positively correlated with La/Ce values,whereas samples with near constant Y/Ho values of ~30 (i.e.,chondritic) have variable La/Ce. Data for breccias and clays cover a
Fig. 5. Ranges of upper continental crust normalised trace element concentrations of sinter and quartz vein deposits from the Twin Hills area. Note the high trace element content ofthe Drummond Basin (Twin Hills) sinters and quartz veins in comparison to quartz veins in the granite from NSW and pegmatites from Norway and Namibia.
Fig. 6. U–Th abundances of sinter and clay deposits from the Drummond Basin incomparison to those of other sedimentary basins. Data for the pegmatite quartz arefrom Götze et al. (2004). Data for illitic clays from the Paris Basin, and Cooper andBowen Basin are from (Rousset and Clauer, 2003) and Uysal (unpublished data),respectively.
165I.T. Uysal et al. / Chemical Geology 280 (2011) 154–169
Author's personal copy
range in Y/Ho intermediate between chondritic and the suprachon-dritic array, also displaying a positive correlation (Fig. 7B). Aspreviously established, variable and elevated Y concentrationsrelative to REE arise from elemental fractionation in aqueous mediain the presence of "uorine complexation. In principle, the slopes ofpositively correlated arrays conform to complexation by "uids ofvariable composition at variable temperatures higher than 150 °C (seebelow). More speci!cally, the array de!ned by the breccias/clays maybe considered as amixing line between an average hydrothermal "uidcomposition as de!ned by the average composition of the suprachon-dritic data (large striped circle in Fig. 7B) that variably exchangedwithsource rocks that were least affected by hydrothermal overprinting(Y/Ho~chondritic). Based on thermodynamic data of Wood (1990a),Y starts to become fractionated from the REE in "uorine-rich "uids attemperatures higher than 150–200°. Hence, chondritic Y/Ho ratios insome sinters and quartz veins are consistent with hydrothermalactivity at temperatures below 150–200 °C. La/Ce ratios in thisdiagram serve as a proxy to the oxidation level of the hydrothermal"uids, since Ce concentrations in the aqueous solution decrease due toconversion of Ce(III) to insoluble Ce(IV)O2. Consequently, thesystematic relationship between Y/Ho and La/Ce for the quartz andsinter deposits, hydrothermal breccias and clays would point totemperature variability during hydrothermal activity coupled withoxidation levels in the "uids.
In accordance with its redox-sensitive behaviour, Eu also displaysanomalous concentrations in chrondrite-normalised REE patterns forsinters and quartz veins (Fig. 3). The anomalous behaviour of Euextends to all volcanic lithologies and also to the hydrothermalbreccias. Under reducing conditions, Eu2+ is preferentially incorpo-rated into feldspars (e.g., Drake and Weill, 1975). Consequently,negative Eu anomalies in igneous rocks are produced by feldsparfractionation in silicate melts. It appears therefore that Eu de!ciencies
in the hydrothermal silica deposits are due to equilibration ofhydrothermal "uids with source rocks.
The volcanic lithologies examined herein are high in silica andhave high levels of REE, consistent with advanced degrees ofmagmatic differentiation. Ce and Y are anomalous, a feature typicallynot developed in common igneous rocks. As established earlier,suprachondritic Y/Ho ratios (N27) are diagnostic of hydrothermalactivity. Elevated Y/Ho ratios for highly evolved felsic rocks point totrace element control by complexation, similar to rock-aqueous "uidinteraction (Bau, 1996). An alternative explanation of the irregularREE patterns of the volcanics is a multistage overprinting process thathas affected the volcanics during hydrothermal activity. Initially,oxidised, low-to-medium temperature "uids percolated through thevolcanic pile and plutonic bodies, leaching silica, K and REE from thehost rock and concentrating them in the "uids. Subsequently, REE andother trace elements were precipitated in the form of REE-richaccessory phases, as well as in quartz and clay minerals, giving rise tosecondary silici!cation and widespread illite formation in the ore-bearing breccias and sedimentary rocks. The hydrothermal "uids haveprecipitated quartz veins at deeper levels and sinters at the surface.This multistage, hydrothermal event can explain similar hydrother-mal signatures in both magmatic and hydrothermal lithologies (e.g.,suprachondritic Y/Ho), and also complementary or contrasting traceelement characteristics, such as negative Ce anomalies in the sintersand quartz veins, and positive Ce anomalies in the volcanics, hinting ata close genetic relationship between source rocks and hydrothermalproducts.
6.2. Alkali element mobility
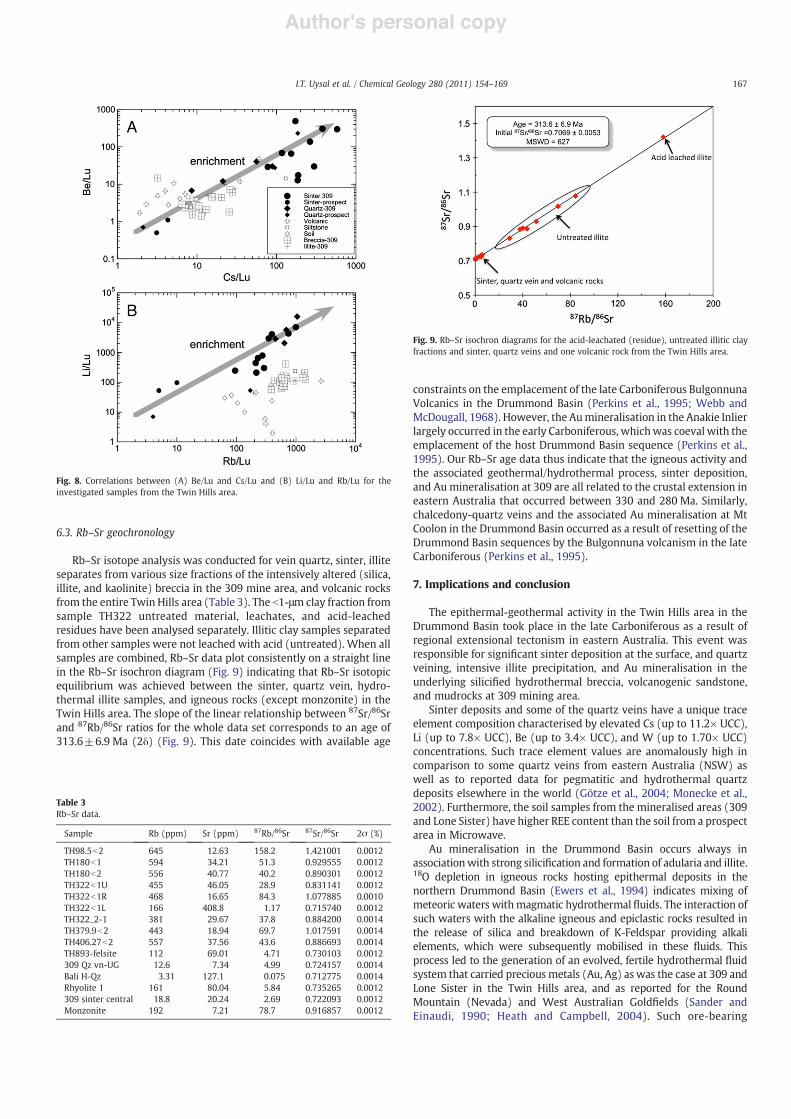
Bonding factors such as ionic size and charge are the main factorscontrolling the distribution of elements in precipitating crystals.Large-ion lithophile elements (LILE, e.g., Rb, Cs), large highly chargedcations (e.g., W6+, U4+) and small variable charged cations (e.g., Be,Li) are usually prevented from being incorporated into crystallinephases during early magmatic processes (Strong, 1981). Hence theseincompatible elements tend to concentrate in residual melts withhigh concentrations of "uids and volatiles, which commonly occurduring pegmatitic and pneumatolytic stages of graniticmagmatism. Inour study, we used incompatible mobile elements such as Cs, Li, Rb(alkaline metals) and Be (alkaline earth metal). It has long beenrecognised that the alkali and alkaline earth elements such as Cs, Li,Rb, Be can be quite mobile during water/rock interaction (Nesbittet al., 1997; Nesbitt and Markovics, 1997; Nesbitt and Young, 1989).Mobile alkaline elements (e.g., Cs and Rb) can be enrichedsigni!cantly in hydrothermal "uids commonly associated with Aumineralisation (Heath and Campbell, 2004). Therefore these elementsinmineral phases precipitated from geothermal "uids can be used as ageochemical tool for locating geothermal systems. Among the highlyincompatible elements in sinter and quartz veins from the Twin Hillsarea, some strong positive correlations are evident, such as Cs-Rb(R2=0.81), Cs-W (R2=0.66), Rb-W (R2=0.73), and Rb-Li(R2=0.66), with one weaker correlation of Cs-Li (R2=0.41). In thecurrent study, alkali mobile element concentrations are divided by theconcentration of similarly incompatible but immobile elements suchas Lu to compare alkali element mobility. The majority of sinter andquartz samples within or near 309 are signi!cantly more enriched inCs, Li, Rb, and Be than the sinters and silica deposits from areas distalto 309 (except the quartz vein from Off Limits) and the volcanic rocks(Table 2, Fig. 8). A signi!cant correlation exists between Cs/Lu andBe/Lu among the silica deposits in Fig. 8A (black !lled symbols,R2=0.79, power regression). Sinter and quartz samples from 309have also high Rb/Lu and Li/Lu ratios (Fig. 8B). A well-developedcorrelation (R2=0.77) between Rb/Lu and Li/Lu is evident amongsilica samples from the entire Twin Hills area (Fig. 8B).
Fig. 7. Correlations between (A) Y/Ho and La/Ho and (B) La/Ce ratios for sinter, quartzveins, volcanic rocks, silici!ed breccias, and illitic clay minerals from the silici!ed rocksin the Twin Hills area. Note the negative correlation between La/Ho and Y/Ho ratios forsome sinter samples (shaded area), the nearly constant values for breccias (circled bythe dashed line) and !eld with variable La/Ho and constant Y/Ho ratios (circled by thedashed line in the lower part of the graph).
166 I.T. Uysal et al. / Chemical Geology 280 (2011) 154–169
Author's personal copy
6.3. Rb–Sr geochronology
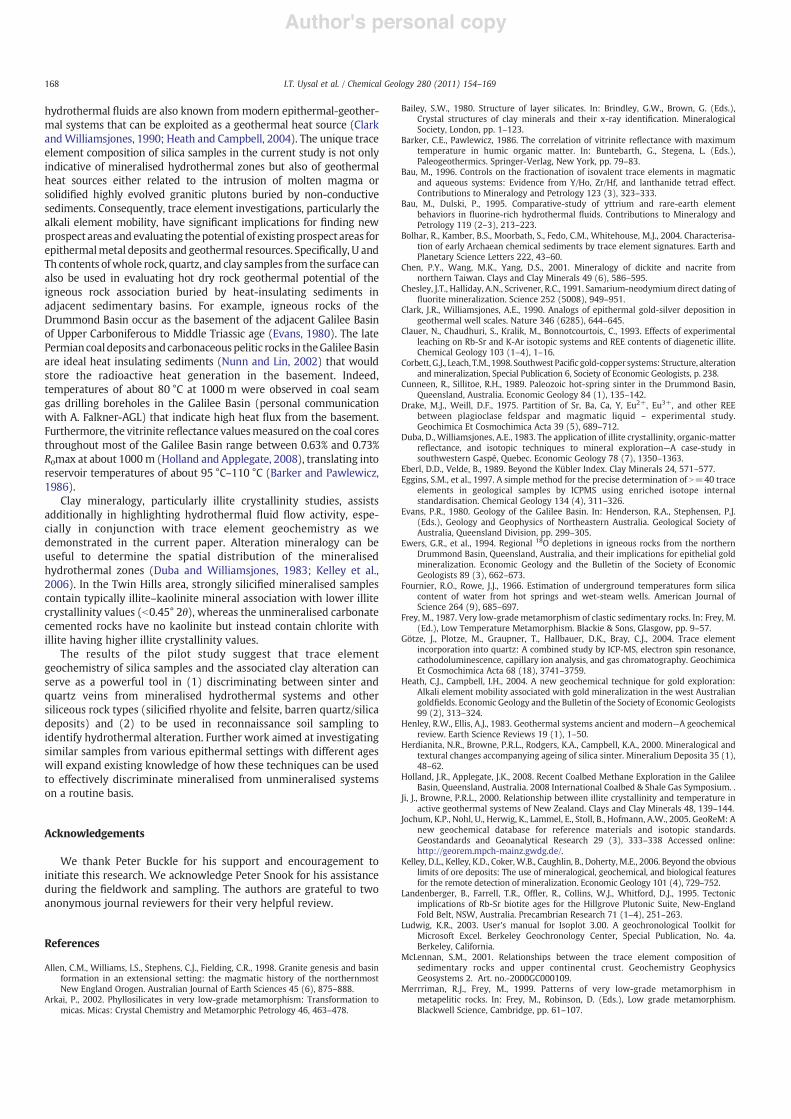
Rb–Sr isotope analysis was conducted for vein quartz, sinter, illiteseparates from various size fractions of the intensively altered (silica,illite, and kaolinite) breccia in the 309 mine area, and volcanic rocksfrom the entire Twin Hills area (Table 3). The b1-#m clay fraction fromsample TH322 untreated material, leachates, and acid-leachedresidues have been analysed separately. Illitic clay samples separatedfrom other samples were not leached with acid (untreated). When allsamples are combined, Rb–Sr data plot consistently on a straight linein the Rb–Sr isochron diagram (Fig. 9) indicating that Rb–Sr isotopicequilibrium was achieved between the sinter, quartz vein, hydro-thermal illite samples, and igneous rocks (except monzonite) in theTwin Hills area. The slope of the linear relationship between 87Sr/86Srand 87Rb/86Sr ratios for the whole data set corresponds to an age of313.6±6.9 Ma (2%) (Fig. 9). This date coincides with available age
constraints on the emplacement of the late Carboniferous BulgonnunaVolcanics in the Drummond Basin (Perkins et al., 1995; Webb andMcDougall, 1968). However, the Aumineralisation in the Anakie Inlierlargely occurred in the early Carboniferous, whichwas coeval with theemplacement of the host Drummond Basin sequence (Perkins et al.,1995). Our Rb–Sr age data thus indicate that the igneous activity andthe associated geothermal/hydrothermal process, sinter deposition,and Au mineralisation at 309 are all related to the crustal extension ineastern Australia that occurred between 330 and 280 Ma. Similarly,chalcedony-quartz veins and the associated Au mineralisation at MtCoolon in the Drummond Basin occurred as a result of resetting of theDrummond Basin sequences by the Bulgonnuna volcanism in the lateCarboniferous (Perkins et al., 1995).
7. Implications and conclusion
The epithermal-geothermal activity in the Twin Hills area in theDrummond Basin took place in the late Carboniferous as a result ofregional extensional tectonism in eastern Australia. This event wasresponsible for signi!cant sinter deposition at the surface, and quartzveining, intensive illite precipitation, and Au mineralisation in theunderlying silici!ed hydrothermal breccia, volcanogenic sandstone,and mudrocks at 309 mining area.
Sinter deposits and some of the quartz veins have a unique traceelement composition characterised by elevated Cs (up to 11.2! UCC),Li (up to 7.8! UCC), Be (up to 3.4! UCC), and W (up to 1.70! UCC)concentrations. Such trace element values are anomalously high incomparison to some quartz veins from eastern Australia (NSW) aswell as to reported data for pegmatitic and hydrothermal quartzdeposits elsewhere in the world (Götze et al., 2004; Monecke et al.,2002). Furthermore, the soil samples from the mineralised areas (309and Lone Sister) have higher REE content than the soil from a prospectarea in Microwave.
Au mineralisation in the Drummond Basin occurs always inassociationwith strong silici!cation and formation of adularia and illite.18O depletion in igneous rocks hosting epithermal deposits in thenorthern Drummond Basin (Ewers et al., 1994) indicates mixing ofmeteoric waters withmagmatic hydrothermal "uids. The interaction ofsuch waters with the alkaline igneous and epiclastic rocks resulted inthe release of silica and breakdown of K-Feldspar providing alkalielements, which were subsequently mobilised in these "uids. Thisprocess led to the generation of an evolved, fertile hydrothermal "uidsystem that carried precious metals (Au, Ag) as was the case at 309 andLone Sister in the Twin Hills area, and as reported for the RoundMountain (Nevada) and West Australian Gold!elds (Sander andEinaudi, 1990; Heath and Campbell, 2004). Such ore-bearing
Fig. 9. Rb–Sr isochron diagrams for the acid-leachated (residue), untreated illitic clayfractions and sinter, quartz veins and one volcanic rock from the Twin Hills area.
Fig. 8. Correlations between (A) Be/Lu and Cs/Lu and (B) Li/Lu and Rb/Lu for theinvestigated samples from the Twin Hills area.
Table 3Rb–Sr data.
Sample Rb (ppm) Sr (ppm) 87Rb/86Sr 87Sr/86Sr 2$ (%)
TH98.5b2 645 12.63 158.2 1.421001 0.0012TH180b1 594 34.21 51.3 0.929555 0.0012TH180b2 556 40.77 40.2 0.890301 0.0012TH322b1U 455 46.05 28.9 0.831141 0.0012TH322b1R 468 16.65 84.3 1.077885 0.0010TH322b1L 166 408.8 1.17 0.715740 0.0012TH322_2-1 381 29.67 37.8 0.884200 0.0014TH379.9b2 443 18.94 69.7 1.017591 0.0014TH406.27b2 557 37.56 43.6 0.886693 0.0014TH893-felsite 112 69.01 4.71 0.730103 0.0012309 Qz vn-UG 12.6 7.34 4.99 0.724157 0.0014Bali H-Qz 3.31 127.1 0.075 0.712775 0.0014Rhyolite 1 161 80.04 5.84 0.735265 0.0012309 sinter central 18.8 20.24 2.69 0.722093 0.0012Monzonite 192 7.21 78.7 0.916857 0.0012
167I.T. Uysal et al. / Chemical Geology 280 (2011) 154–169
Author's personal copy
hydrothermal "uids are also known frommodern epithermal-geother-mal systems that can be exploited as a geothermal heat source (ClarkandWilliamsjones, 1990; Heath and Campbell, 2004). The unique traceelement composition of silica samples in the current study is not onlyindicative of mineralised hydrothermal zones but also of geothermalheat sources either related to the intrusion of molten magma orsolidi!ed highly evolved granitic plutons buried by non-conductivesediments. Consequently, trace element investigations, particularly thealkali element mobility, have signi!cant implications for !nding newprospect areas and evaluating thepotential of existingprospect areas forepithermalmetal deposits and geothermal resources. Speci!cally, U andTh contents ofwhole rock, quartz, and clay samples from the surface canalso be used in evaluating hot dry rock geothermal potential of theigneous rock association buried by heat-insulating sediments inadjacent sedimentary basins. For example, igneous rocks of theDrummond Basin occur as the basement of the adjacent Galilee Basinof Upper Carboniferous to Middle Triassic age (Evans, 1980). The latePermiancoaldeposits andcarbonaceouspelitic rocks in theGalilee Basinare ideal heat insulating sediments (Nunn and Lin, 2002) that wouldstore the radioactive heat generation in the basement. Indeed,temperatures of about 80 °C at 1000 m were observed in coal seamgas drilling boreholes in the Galilee Basin (personal communicationwith A. Falkner-AGL) that indicate high heat "ux from the basement.Furthermore, the vitrinite re"ectance valuesmeasured on the coal coresthroughout most of the Galilee Basin range between 0.63% and 0.73%Romax at about 1000m (Holland and Applegate, 2008), translating intoreservoir temperatures of about 95 °C–110 °C (Barker and Pawlewicz,1986).
Clay mineralogy, particularly illite crystallinity studies, assistsadditionally in highlighting hydrothermal "uid "ow activity, espe-cially in conjunction with trace element geochemistry as wedemonstrated in the current paper. Alteration mineralogy can beuseful to determine the spatial distribution of the mineralisedhydrothermal zones (Duba and Williamsjones, 1983; Kelley et al.,2006). In the Twin Hills area, strongly silici!ed mineralised samplescontain typically illite–kaolinite mineral association with lower illitecrystallinity values (b0.45° 2!), whereas the unmineralised carbonatecemented rocks have no kaolinite but instead contain chlorite withillite having higher illite crystallinity values.
The results of the pilot study suggest that trace elementgeochemistry of silica samples and the associated clay alteration canserve as a powerful tool in (1) discriminating between sinter andquartz veins from mineralised hydrothermal systems and othersiliceous rock types (silici!ed rhyolite and felsite, barren quartz/silicadeposits) and (2) to be used in reconnaissance soil sampling toidentify hydrothermal alteration. Further work aimed at investigatingsimilar samples from various epithermal settings with different ageswill expand existing knowledge of how these techniques can be usedto effectively discriminate mineralised from unmineralised systemson a routine basis.
Acknowledgements
We thank Peter Buckle for his support and encouragement toinitiate this research. We acknowledge Peter Snook for his assistanceduring the !eldwork and sampling. The authors are grateful to twoanonymous journal reviewers for their very helpful review.
References
Allen, C.M., Williams, I.S., Stephens, C.J., Fielding, C.R., 1998. Granite genesis and basinformation in an extensional setting: the magmatic history of the northernmostNew England Orogen. Australian Journal of Earth Sciences 45 (6), 875–888.
Arkai, P., 2002. Phyllosilicates in very low-grade metamorphism: Transformation tomicas. Micas: Crystal Chemistry and Metamorphic Petrology 46, 463–478.
Bailey, S.W., 1980. Structure of layer silicates. In: Brindley, G.W., Brown, G. (Eds.),Crystal structures of clay minerals and their x-ray identi!cation. MineralogicalSociety, London, pp. 1–123.
Barker, C.E., Pawlewicz, 1986. The correlation of vitrinite re"ectance with maximumtemperature in humic organic matter. In: Buntebarth, G., Stegena, L. (Eds.),Paleogeothermics. Springer-Verlag, New York, pp. 79–83.
Bau, M., 1996. Controls on the fractionation of isovalent trace elements in magmaticand aqueous systems: Evidence from Y/Ho, Zr/Hf, and lanthanide tetrad effect.Contributions to Mineralogy and Petrology 123 (3), 323–333.
Bau, M., Dulski, P., 1995. Comparative-study of yttrium and rare-earth elementbehaviors in "uorine-rich hydrothermal "uids. Contributions to Mineralogy andPetrology 119 (2–3), 213–223.
Bolhar, R., Kamber, B.S., Moorbath, S., Fedo, C.M., Whitehouse, M.J., 2004. Characterisa-tion of early Archaean chemical sediments by trace element signatures. Earth andPlanetary Science Letters 222, 43–60.
Chen, P.Y., Wang, M.K., Yang, D.S., 2001. Mineralogy of dickite and nacrite fromnorthern Taiwan. Clays and Clay Minerals 49 (6), 586–595.
Chesley, J.T., Halliday, A.N., Scrivener, R.C., 1991. Samarium-neodymiumdirect dating of"uorite mineralization. Science 252 (5008), 949–951.
Clark, J.R., Williamsjones, A.E., 1990. Analogs of epithermal gold-silver deposition ingeothermal well scales. Nature 346 (6285), 644–645.
Clauer, N., Chaudhuri, S., Kralik, M., Bonnotcourtois, C., 1993. Effects of experimentalleaching on Rb-Sr and K-Ar isotopic systems and REE contents of diagenetic illite.Chemical Geology 103 (1–4), 1–16.
Corbett, G.J., Leach, T.M., 1998. Southwest Paci!c gold-copper systems: Structure, alterationand mineralization, Special Publication 6, Society of Economic Geologists, p. 238.
Cunneen, R., Sillitoe, R.H., 1989. Paleozoic hot-spring sinter in the Drummond Basin,Queensland, Australia. Economic Geology 84 (1), 135–142.
Drake, M.J., Weill, D.F., 1975. Partition of Sr, Ba, Ca, Y, Eu2+, Eu3+, and other REEbetween plagioclase feldspar and magmatic liquid – experimental study.Geochimica Et Cosmochimica Acta 39 (5), 689–712.
Duba, D., Williamsjones, A.E., 1983. The application of illite crystallinity, organic-matterre"ectance, and isotopic techniques to mineral exploration—A case-study insouthwestern Gaspé, Quebec. Economic Geology 78 (7), 1350–1363.
Eberl, D.D., Velde, B., 1989. Beyond the Kübler Index. Clay Minerals 24, 571–577.Eggins, S.M., et al., 1997. A simple method for the precise determination of N=40 trace
elements in geological samples by ICPMS using enriched isotope internalstandardisation. Chemical Geology 134 (4), 311–326.
Evans, P.R., 1980. Geology of the Galilee Basin. In: Henderson, R.A., Stephensen, P.J.(Eds.), Geology and Geophysics of Northeastern Australia. Geological Society ofAustralia, Queensland Division, pp. 299–305.
Ewers, G.R., et al., 1994. Regional 18O depletions in igneous rocks from the northernDrummond Basin, Queensland, Australia, and their implications for epithelial goldmineralization. Economic Geology and the Bulletin of the Society of EconomicGeologists 89 (3), 662–673.
Fournier, R.O., Rowe, J.J., 1966. Estimation of underground temperatures form silicacontent of water from hot springs and wet-steam wells. American Journal ofScience 264 (9), 685–697.
Frey, M., 1987. Very low-grade metamorphism of clastic sedimentary rocks. In: Frey, M.(Ed.), Low Temperature Metamorphism. Blackie & Sons, Glasgow, pp. 9–57.
Götze, J., Plotze, M., Graupner, T., Hallbauer, D.K., Bray, C.J., 2004. Trace elementincorporation into quartz: A combined study by ICP-MS, electron spin resonance,cathodoluminescence, capillary ion analysis, and gas chromatography. GeochimicaEt Cosmochimica Acta 68 (18), 3741–3759.
Heath, C.J., Campbell, I.H., 2004. A new geochemical technique for gold exploration:Alkali element mobility associated with gold mineralization in the west Australiangold!elds. Economic Geology and the Bulletin of the Society of Economic Geologists99 (2), 313–324.
Henley, R.W., Ellis, A.J., 1983. Geothermal systems ancient and modern—A geochemicalreview. Earth Science Reviews 19 (1), 1–50.
Herdianita, N.R., Browne, P.R.L., Rodgers, K.A., Campbell, K.A., 2000. Mineralogical andtextural changes accompanying ageing of silica sinter. Mineralium Deposita 35 (1),48–62.
Holland, J.R., Applegate, J.K., 2008. Recent Coalbed Methane Exploration in the GalileeBasin, Queensland, Australia. 2008 International Coalbed & Shale Gas Symposium. .
Ji, J., Browne, P.R.L., 2000. Relationship between illite crystallinity and temperature inactive geothermal systems of New Zealand. Clays and Clay Minerals 48, 139–144.
Jochum, K.P., Nohl, U., Herwig, K., Lammel, E., Stoll, B., Hofmann, A.W., 2005. GeoReM: Anew geochemical database for reference materials and isotopic standards.Geostandards and Geoanalytical Research 29 (3), 333–338 Accessed online:http://georem.mpch-mainz.gwdg.de/.
Kelley, D.L., Kelley, K.D., Coker,W.B., Caughlin, B., Doherty, M.E., 2006. Beyond the obviouslimits of ore deposits: The use of mineralogical, geochemical, and biological featuresfor the remote detection of mineralization. Economic Geology 101 (4), 729–752.
Landenberger, B., Farrell, T.R., Of"er, R., Collins, W.J., Whitford, D.J., 1995. Tectonicimplications of Rb-Sr biotite ages for the Hillgrove Plutonic Suite, New-EnglandFold Belt, NSW, Australia. Precambrian Research 71 (1–4), 251–263.
Ludwig, K.R., 2003. User's manual for Isoplot 3.00. A geochronological Toolkit forMicrosoft Excel. Berkeley Geochronology Center, Special Publication, No. 4a.Berkeley, California.
McLennan, S.M., 2001. Relationships between the trace element composition ofsedimentary rocks and upper continental crust. Geochemistry GeophysicsGeosystems 2. Art. no.-2000GC000109.
Merrriman, R.J., Frey, M., 1999. Patterns of very low-grade metamorphism inmetapelitic rocks. In: Frey, M., Robinson, D. (Eds.), Low grade metamorphism.Blackwell Science, Cambridge, pp. 61–107.
168 I.T. Uysal et al. / Chemical Geology 280 (2011) 154–169
Author's personal copy
Middleton, M.F., 1979. Heat "ow in the Moomba, Big lake gas !elds of the Cooper Basinand implications for hydrocarbon maturation. Bulletin of the Australian Society ofExploration Geophysics 10, 149–155.
Monecke, T., Kempe, U., Gotze, J., 2002. Genetic signi!cance of the trace elementcontent in metamorphic and hydrothermal quartz: A reconnaissance study. Earthand Planetary Science Letters 202 (3–4), 709–724.
Nesbitt, H.W., Markovics, G., 1997.Weathering of granodioritic crust, long-term storageof elements in weathering pro!les, and petrogenesis of siliciclastic sediments.Geochimica Et Cosmochimica Acta 61 (8), 1653–1670.
Nesbitt, H.W., Young, G.M., 1989. Formation and diagenesis of weathering pro!les.Journal of Geology 97 (2), 129–147.
Nesbitt, H.W., Fedo, C.M., Young, G.M., 1997. Quartz and feldspar stability, steady andnon-steady-state weathering, and petrogenesis of siliciclastic sands and muds.Journal of Geology 105 (2), 173–191.
Nicholson, K., 1989. Early Devonian geothermal systems in northeast Scotland—Exploration targets for epithermal gold. Geology 17 (6), 568–571.
Nunn, J.A., Lin, G., 2002. Insulating effect of coals and organic rich shales: Implicationsfor topography-driven "uid "ow, heat transport, and genesis of ore deposits in theArkoma Basin and Ozark Plateau. Basin Research 14, 129–145.
Olgers, F., 1972. Geology of the Drummond Basin, Queensland. BMR journal ofAustralian geology and geophysics 78.
Palinkas, S.S., et al., 2009. Dickite and kaolinite in the Pb–Zn–Ag sulphide deposits ofnorthern Kosovo (Trepca and Crnac). Clay Minerals 44 (1), 67–79.
Perkins, C., Walshe, J.L., Morrison, G., 1995. Metallogenic episodes of the Tasman foldbelt system, eastern Australia. Economic Geology and the Bulletin of the Society ofEconomic Geologists 90 (6), 1443–1466.
Queensland Government, 2005. Natural resources and mines: Opportunities forproduction, exports and exploration Queensland's gold, silver and base metals.Queensland Mining Journal, 1–20. June 2005.
Rousset, D., Clauer, N., 2003. Discrete clay diagenesis in a very low-permeable sequenceconstrained by an isotopic (K–Ar and Rb–Sr) study. Contributions to Mineralogyand Petrology 145 (2), 182–198.
Sander, M.V., Einaudi, M.T., 1990. Epithermal deposition of gold during transition frompropylitic to potassic alteration at RoundMountain, Nevada. Economic Geology andthe Bulletin of the Society of Economic Geologists 85 (2), 285–311.
Seed, M., 1995. Discovery history, geology and geochemistry of the Tandan golddeposits. In: Beams, S.D. (Ed.), Mineral Deposits of Northeast Queensland: Geologyand Geochemistry Proceedings of the 17th International Geochemical ExplotationSymposium. EGRU, Townsville, Quennsland, pp. 79–90.
Sennitt, C.M., 1991. Aspects of epithermal gold mineralization, Twin Hills, Queensland.Unpublished Masters thesis, James Cook University, 234 pp.
Srodon, J., Eberl, D.D., 1984. Illite. In: Bailey, S.W. (Ed.), Micas. Reviews in mineralogy.Mineralogical Society of America, pp. 495–544.
Strong, D.F., 1981. Ore deposit models—5. A model for granophile mineral deposits.Geoscience Canada 8, 155–161.
Sun, S.s., McDonough, W.F., 1989. Chemical and isotopic systematics of oceanic basalts:Implications for mantle compositions and processes. In: Saunders, A.D., Norry, M.J.(Eds.), Magmatism in the Ocean Basins Geol. Soc. Lond. Spec. Publ, pp. 313–346.
Webb, A.W., McDougall, I., 1968. The geochronology of the igneous rocks of EasternQueensland. Australian Journal of Earth Sciences 15, 313–346.
White, N.C., Wood, D.G., Lee, M.C., 1989. Epithermal sinters of Paleozoic age in northQueensland, Australia. Geology 17 (8), 718–722.
Wood, S.A., 1990a. The aqueous geochemistry of the rare-earth elements and yttrium.1. Review of available low-temperature data for inorganic complexes and theinorganic REE speciation of natural-waters. Chemical Geology 82 (1–2), 159–186.
Wood, S.A., 1990b. The aqueous geochemistry of the rare-earth elements and yttrium.2. Theoretical predictions of speciation in hydrothermal solutions to 350 °C atsaturation water-vapor pressure. Chemical Geology 88 (1–2), 99–125.
169I.T. Uysal et al. / Chemical Geology 280 (2011) 154–169
Related Documents