ESPON 2013 1 TRACC Transport Accessibility at Regional/Local Scale and Patterns in Europe Applied Research 2013/1/10 Inception Report | Version 30/07/2010

Welcome message from author
This document is posted to help you gain knowledge. Please leave a comment to let me know what you think about it! Share it to your friends and learn new things together.
Transcript

ESPON 2013 1
TRACC Transport Accessibility
at Regional/Local Scale and Patterns in Europe
Applied Research 2013/1/10
Inception Report | Version 30/07/2010

ESPON 2013 2
This report presents a more detailed overview of
the analytical approach to be applied by the pro-
ject. This Applied Research Project is conducted
within the framework of the ESPON 2013 Pro-
gramme, partly financed by the European Re-
gional Development Fund.
The partnership behind the ESPON Programme
consists of the EU Commission and the Member
States of the EU27, plus Iceland, Liechtenstein,
Norway and Switzerland. Each partner is repre-
sented in the ESPON Monitoring Committee.
This report does not necessarily reflect the opin-
ion of the members of the Monitoring Commit-
tee.
Information on the ESPON Programme and pro-
jects can be found on www.espon.eu
The web site provides the possibility to
download and examine the most recent docu-
ments produced by finalised and ongoing
ESPON projects.
This basic report exists only in an electronic
version.
© ESPON & Spiekermann & Wegener, Urban
and Regional Research (S&W), 2010.
Printing, reproduction or quotation is authorised
provided the source is acknowledged and a
copy is forwarded to the ESPON Coordination
Unit in Luxembourg.

ESPON 2013 3
List of authors
Klaus Spiekermann (S&W)
Michael Wegener (S&W)
Viktor Květoň (PrF UK)
Miroslav Marada (PrF UK)
Carsten Schürmann (RRG)
Oriol Biosca (Mcrit)
Andreu Ulied Segul (Mcrit)
Harri Antikainen (FOGIS)
Ossi Kotavaara (FOGIS)
Jarmo Rusanen (FOGIS)
Dorota Bielańska (TRT)
Francesca Fermi (TRT)
Davide Fiorello (TRT)
Tomasz Komornicki (IGIPZ PAN)
Piotr Rosik (IGIPZ PAN)

ESPON 2013 4
Table of contents
Page
1 Introduction ................................................................................................. 6
2 Objectives ................................................................................................... 7
3 Conceptual framework ................................................................................ 10
4 Research approach ..................................................................................... 21
4.1 Methodology/indicators ......................................................................... 21
4.2 Network and socio-economic data ........................................................ 23
4.3 European accessibility: travel ................................................................ 25
4.4 European accessibility: freight transport ................................................ 28
4.5 Regional accessibility ............................................................................ 31
4.6 Impacts of accessibility .......................................................................... 34
4.7 Policy implications ................................................................................. 39
5 Review of existing accessibility studies ....................................................... 42
5.1 European wide accessibility models ...................................................... 42
5.2 National/regional accessibility models ................................................... 48
6 Selection of regional case studies ............................................................... 49
6.1 Selection process .................................................................................. 49
6.2 Macro regions with case study areas .................................................... 53
7 Assessment of data situation ...................................................................... 69
7.1 Networks ............................................................................................... 69
7.2 Socio-economic data ............................................................................. 74
7.3 Regional data ........................................................................................ 76
7.4 EU candidate countries and Western Balkan ........................................ 81
8 Project planning .......................................................................................... 84
8.1 Detailed timetable ................................................................................. 84
8.2 Work towards Interim Report ................................................................. 84
8.3 Use of existing ESPON results .............................................................. 84
8.4 Distribution of research tasks among partners ...................................... 84
8.5 Barriers for project implementation ....................................................... 87
8.6 Deliveries and outputs envisaged ......................................................... 87
9 References .................................................................................................. 89

ESPON 2013 5
Figures
Figure 1 Work Packages and Tasks
Figure 2 The regions of the SASI model in Europe
Figure 3 The structure of the SASI model
Figure 4 The sequence of submodels in SASI
Figure 5 Selected macro regions for case studies.
Tables
Table 1 Dimensions of accessibility
Table 2 Accessibility indicators
Table 3. Dimensions of European accessibility models
Table 4. Equity and dynamic statements of European accessibility models
Table 5 Selected macro regions and case study areas
Table 6 Criteria for the evaluation of the Europe-wide transport network data
Table 7 Evaluation of network datasets.
Table 8 Summary of network database assessment.
Table 9 Available data for regional case studies.
Table 10 Corresponding NUTS levels in EU candidate countries and Western Balkans.
Table 11 NUTS-3 data availability in EU candidate countries and Western Balkan Countries
Table 12 Timetable of project activities
Table 13 Research tasks and Project Partner responsibility
ESPON 2013 6
1 Introduction
The ESPON project TRACC (Transport accessibility at regional/local scale and patterns in
Europe) aims at taking up and updating the results of existing studies on accessibility at the
European scale, to extend the range of accessibility indicators by further indicators responding to
new policy questions, to extend the spatial resolution of accessibility indicators and to explore the
likely impacts of policies at the European and national scale to improve global, European and re-
gional accessibility in the light of new challenges, such as globalisation, energy scarcity and cli-
mate change.
The Transnational Project Group (TPG) for the ESPON project TRACC consists of the following
seven Project Partners:
- Spiekermann & Wegener, Urban and Regional Research (S&W), Dortmund, Germany (Lead
Partner)
- Charles University of Prague, Faculty of Science, Department of Social Geography and Re-
gional Development (PrF UK), Prague, Czech Republic
- RRG Spatial Planning and Geoinformation, Oldenburg i.H., Germany
- MCRIT, Barcelona, Spain
- University of Oulu, Department of Geography (FOGIS), Oulu, Finland
- TRT Trasporti e Territorio, Milan, Italy
- S. Leszczycki Institute of Geography and Spatial Organisation, Polish Academy of Sciences
(IGIPZ PAN), Warsaw, Poland
This report is the Inception Report of the TRACC project and was developed shortly after the
commencement of the research work. The Inception Report is the main planning document for
the project. It contains a detailed overview of the research approach and methodology to be ap-
plied in the project and its breakdown into individual research tasks. The report contains a first
review of the main literature on European accessibility studies and a first assessment of available
data sources for network and socio-economic data. The Inception Report informs also about the
selection of case study areas that will be used to calculate regional/local accessibility. The report
closes with a chapter containing detailed project planning.

ESPON 2013 7
2 Objectives
Accessibility is the main 'product' of a transport system. It determines the locational advantage of
an area (i.e. in ESPON a region, a city or a corridor) relative to all areas (including itself). Indica-
tors of accessibility measure the benefits households and firms in an area enjoy from the exis-
tence and use of the transport infrastructure relevant for their area.
The important role of transport infrastructure (i.e. networks and transport services) for spatial de-
velopment in its most simplified form implies that areas with better access to the locations of input
materials and markets will, ceteris paribus, be more productive, more competitive and hence
more successful than more remote and isolated areas.
However, the impact of transport infrastructure on spatial development has been difficult to verify
empirically. There seems to be a clear positive correlation between transport infrastructure en-
dowment or the location in interregional networks and the levels of economic indicators such as
GDP per capita. However, in most countries this correlation may merely reflect historical agglom-
eration processes rather than causal relationships effective today.
Attempts to explain changes in economic indicators, i.e. economic growth and decline, by trans-
port investment have been much less successful.
The reason for this failure may be that in countries with an already highly developed transport
infrastructure further transport network improvements bring only marginal benefits. A different
situation can be observed in some regions of the new EU member states where the lack of mod-
ern infrastructure (motorways, high-speed trains) is still a major barrier to economic development
and where the rapid increase of freight flows by road on the main transport corridors between
western and eastern Europe was not followed by new road, rail or multimodal transport invest-
ment.
While there is uncertainty about the magnitude of the impact of transport infrastructure on spatial
development, there is even less agreement on its direction. It is debated whether transport infra-
structure improvements contribute to spatial polarisation or decentralisation. From a theoretical
point of view, both effects can occur. A new motorway or high-speed rail connection between a
peripheral and a central region makes it easier for producers in the peripheral region to market
their products in the large cities, however, it may also expose the region to the competition of
more advanced products from the centre and so endanger formerly secure regional monopolies.
These developments have to be seen in the light of changes in the field of transport and commu-
nications which will fundamentally change the way transport infrastructure influences spatial de-
velopment. Several trends combine to reinforce the tendency to diminish the impacts of transport
infrastructure on regional development:
- An increased proportion of international freight comprises high-value goods for which transport
cost is much less than for low-value bulk products. For modern industries the quality of trans-
port services has replaced transport cost as the most important factor.
- Transport infrastructure improvements which reduce the variability of travel times, increase
travel speeds or allow flexibility in scheduling are becoming more important for improving the
competitiveness of service and manufacturing industries and are therefore valued more highly
in locational decisions than changes resulting only in cost reductions.
- Telecommunications have reduced the need for some freight transports and person trips but
they also increase the demand for transport by their ability to create new markets.
- With the shift from heavy-industry manufacturing to high-tech industries and services other less
tangible location factors have come to the fore and have at least partly displaced traditional
ones. These new location factors include factors related to leisure, culture, image and environ-

ESPON 2013 8
ment, i.e. quality of life, and factors related to access to information and specialised high-level
services and the institutional and political environment.
On the other hand, there are also tendencies that increase the importance of transport infra-
structure:
- The introduction of totally new, superior levels of transport such as the high-speed rail system
create new locational advantages, but also disadvantages for regions not served by the new
networks.
- Another factor adding to the importance of transport is the general increase in the volume of
goods movements (due to changes in logistics such as just-in-time delivery) and travel (due to
growing affluence and leisure time).
Both above tendencies are being accelerated by the increasing integration of national economies
within the European Union and by the continuing globalisation of the world economy.
Key policy questions
In this situation the project is to address the following key policy question from a European point
of view:
- What are the differences between accessibility at three different levels (regional, European and
global) considering the four modes road, rail, water and air?
- What is the link between accessibility at the different levels and for different modes of European
regions and their economic development? How has this link changed over time? Does the
strength of this link differ across the EU?
- What could be the territorial impact of rising energy prices on the future developments of road,
rail, water and air transport?
- What could be the impact of various transport scenarios on climate change, access patterns
and economic development?
In addition the project is to look into the regional dimension of accessibility often neglected in pre-
vious studies of accessibility:
- What does regional accessibility/connectivity look like at the regional level? For example, how
many jobs/people can be reached in 45 minutes travel time (by road or by train), how many city
centres can be reached by flying out in the morning and returning in the evening?
- In which type of regions is the level of European accessibility very different from their regional
accessibility?
From a research point of view, the following key research questions are to be addressed:
- What is the accessibility of European regions for travel by different modes (road, rail, air) at the
European level?
- What is the accessibility of European regions for air travel at the global level?
- What is the potential of intermodal travel, in particular the combination of high-speed rail and
air?
- What would be the impacts of different policies to make rail more competitive on the modal
share of travel and travel accessibility?
- What would be the impacts of different policies to make rail and water more competitive on the
modal share of freight transport and freight accessibility?

ESPON 2013 9
- What are the most favoured urban centres and most disadvantaged regions with respect to
travel accessibility (island, mountain areas)?
Project objectives
From these key policy and research questions the main objectives of the project are derived:
- to take up and update the results of existing studies on accessibility at the European scale us-
ing most recent available network and socio-economic data,
- to extend the range of accessibility indicators by further indicators responding to new policy
questions and further developing the quality and validity of the existing indicators,
- to extend the spatial resolution of accessibility indicators by calculating, besides European ac-
cessibility, also global and regional accessibility,
- to explore the likely impacts of available policies at the European and national scale to improve
global, European and regional accessibility in the light of new challenges, such as globalisation,
energy scarcity and climate change.
Geographical coverage of all analyses should be according to the project specification NUTS-3 or
equivalent regions in all countries participating in the ESPON 2013 Programme plus ideally the
EU candidate countries Croatia, FYR Macedonia and Turkey and the other countries of the
Western Balkans Bosnia and Herzegovina, Serbia, Montenegro, Albania and Kosovo.
When calculating accessibility indicators transport connections to destinations outside the study
area are to be considered. When calculating European accessibility, also links to destinations in
neighbouring countries, such as Belarus, Moldova, Russia and Ukraine, are to be considered,
and when calculating global accessibility, links to destinations in all world regions.

ESPON 2013 10
3 Conceptual framework
In this section first an introduction into the state of the art of calculating accessibility indicators is
given showing the major dimensions of accessibility, the most frequently types of accessibility
indicators and important extension of these. Based on this conceptual framework, the research
concept of the project is outlined.
Accessibility: dimensions
Accessibility indicators may be sensitive to the following dimensions: origins, destinations, im-
pedance, constraints, barriers, type of transport, modes, spatial scale, equity and dynamics.
These dimensions are summarised in Table 1.
Origins
Accessibility indicators are calculated for areas such as regions or cities. From a pure semantic
point of view, an area is called accessible if it can be easily reached from other areas. However,
in practice a reverse view is used: an area is called highly accessible if many attractive destina-
tions can be reached from it in a short time. In that sense the area can be considered the origin of
trips to destinations of interest. In both perspectives the notion of accessibility is closely linked to
movement, and so it matters who moves. Different actors such as business travellers, tourists or
commuters are attracted by different destinations and have different travel preferences and travel
budgets. By the same token different firms have different views of destinations as purveyors, cus-
tomers or other firms and require different transport services depending on the kind of goods they
ship. Accessibility indicators therefore have to be calculated with different types of actors or
transport users in mind.
Destinations
Different actors are attracted by different destinations. Business travellers find their clients most
likely in city centres. Tourists are attracted by tourist attractions such as beach resorts, mountains
or historical towns. Commuters are interested in job opportunities. Consumer-oriented firms want
to reach their customers, whereas business-oriented firms deliver their goods and services to
other firms. Accessibility indicators therefore have to be calculated with respect to different desti-
nations such as economic activities, population or tourist attractions.
Impedance
Simple accessibility indicators consider only transport infrastructure in the area itself, expressed
by measures such as total length of motorways or number of railway stations, or in the vicinity of
the area, expressed by measures such as access to the nearest nodes of interregional networks
like motorway exits, intercity stations, freight terminals or airports. More complex accessibility in-
dicators distinguish between destinations in the area itself and those in other areas. The effort
needed to overcome that distance is measured as spatial impedance. Spatial impedance is calcu-
lated as a function of distance or time or money or a combination of the latter two (generalised
cost). There are two different approaches:
- Euclidean distance. If no transport network is considered, geographical or Euclidean distance
between areas is taken as spatial impedance: Origins and destinations are assumed to be con-
centrated in nodal points in the centre of the areas called centroids, so distances between the
centroids are calculated. In this case other attributes such as travel time, travel cost, capacity,
congestion, convenience, reliability or safety have no meaning. The mean length of internal
trips in the origin area is estimated as a function of its size.

ESPON 2013 11
Table 1. Dimensions of accessibility
Dimension Comments
Origins Accessibility indicators may be calculated from the point of view of different
population groups such as social or age groups, different occupations such
as business travellers or tourists or different economic actors such as indus-
tries or firms.
Destinations Accessibility indicators may measure the location of an area with respect to
opportunities, activities and assets such as population, economic activities,
universities or tourist attractions. The activity function may be rectangular (all
activities beyond a certain size), linear (of size) or non-linear (to express ag-
glomeration effects).
Impedance The spatial impedance term may be a function of one or more attributes of
the links between areas such as distance (Euclidean or network distance),
travel time, travel cost, convenience, reliability or safety. The impedance
function applied may be linear (mean impedance), rectangular (all destina-
tions within a given impedance) or non-linear (e.g. negative exponential).
Constraints The use of the links between areas may be constrained by regulations (speed
limits, access restrictions for certain vehicle types of maximum driving hours)
or by capacity constraints (road gradients or congestion).
Barriers In addition to spatial impedance also non-spatial, e.g. political, economic, le-
gal, cultural or linguistic barriers between areas may be considered. In addi-
tion, non-spatial linkages between areas such as complementary industrial
composition may be considered.
Types of
transport
Only travel or only freight transport, or both, may be considered in the analy-
sis.
Modes Accessibility indicators may be calculated for road, rail, inland waterways or
air. Multimodal accessibility indicators combine several modal accessibility
indicators. Intermodal accessibility indicators include trips by more than one
mode.
Spatial scale Accessibility indicators at the continental, transnational or regional scale may
require data of different spatial resolution both with respect to area size and
network representation, intra-area access and intra-node terminal and trans-
fer time.
Equity Accessibility indicators may be calculated for specific groups of areas in or-
der to identify inequalities in accessibility between rich and poor, central and
peripheral, urban and rural, nodal and interstitial areas.
Dynamics Accessibility indicators may be calculated for different points in time in order
to show changes in accessibility induced by TEN projects or other transport
policies, including their impacts on convergence or divergence in accessibil-
ity between areas.

ESPON 2013 12
- Network impedance. If one or more transport networks are considered, the travel time or cost
along the minimum path between areas over the network(s) are taken as spatial impedance be-
tween the areas. Besides distance, link attributes such as travel time, travel cost, capacity, con-
gestion, convenience, reliability or safety may be considered. Origins and destinations are as-
sumed to be concentrated in the centroids, and the centroids are linked to the nearest network
node by non-network access links. The mean length or travel time or cost of access links and
internal trips in the origin area is estimated as a function of the size of the area as above.
If the assumption that origins and destinations of areas are concentrated in their centroids is
abandoned, additional access links are estimated between the micro locations of origins and des-
tinations in the areas and their centroids.
Constraints
The use of the links between areas may be constrained by regulations (speed limits, access re-
strictions for certain vehicle types of maximum driving hours) or by capacity constraints (road
gradients or congestion). It is relatively straightforward to take account of regulation constraints
when calculating accessibility. Speed limits can be directly converted to link travel times. Regula-
tions on maximum driving hours can be converted to a barrier at the link on the minimum path
where the maximum driving time is exceeded. Taking account of capacity constraints when calcu-
lating accessibility is more difficult since it requires the consideration of link capacity and network
flow characteristics. To restrict the use of certain links by certain vehicle types (e.g. of Swiss
transalpine roads by 40-ton lorries) is only possible if different lorry types are distinguished in the
accessibility model. To take account of road congestion would actually require a full-scale traffic
assignment model, something rarely available when calculating accessibility. As a workaround
sometimes time penalties are assigned to links passing through urbanised areas.
Barriers
In addition to spatial impedance also non-spatial, e.g. political, economic, legal, cultural or linguis-
tic barriers between areas may be considered:
- Political barriers are, for instance, national boundaries with delays at the borders for passport
control, visas, customs declarations, etc. Significant reductions of barriers between countries of
the European Union have been achieved through the Schengen Protocol. However, movement
of people from immigration countries across the external boundaries of the European Union has
become more restricted.
- Economic barriers are customs, tariffs and other fees imposed on the exchange of goods and
services between different countries. Due to the Maastricht Treaty, economic barriers between
EU countries have been greatly reduced.
- Legal barriers are non-tariff restrictions imposed on movement of people and goods between
countries through different standards, safety regulations, legal provisions, employment restric-
tions, etc.
- Cultural barriers are invisible barriers discouraging the exchange of people or goods because of
different traditions, values, life styles and perceptions at two sides of a border between or within
countries.
- Linguistic barriers are invisible barriers discouraging the exchange of people or goods across a
border between countries or regions with different languages.
By the same token, non-spatial linkages between areas may be considered. For instance, eco-
nomic exchange between regions with complementary industrial composition will be more inten-
sive than it is to be expected form their distance and size. Barriers may also be expressed as

ESPON 2013 13
negative linkages. For instance, exchange of people and goods between regions with the same
culture and language will be more intensive than between regions with different cultures and lan-
guages.
Types of transport
The majority of accessibility indicators are expressed in terms of travel. However, if origins and
destinations are economic activities (firms or employment), clearly exchange of goods and ser-
vices is intended. Accessibility for freight transport is explicitly addressed where freight transport
is explicitly modelled. Advanced freight accessibility indicators take account of freight-specific
terminals such as intermodal terminals or ports or freight-specific modes such as inland water-
ways. There are to date only few studies on freight accessibility.
Modes
Network-based accessibility indicators may be calculated for road, rail, ferry, inland waterways or
air and can be unimodal, multimodal or intermodal: Unimodal accessibility indicators consider
only one mode. Multimodal accessibility indicators are aggregates of two or more unimodal ac-
cessibility indicators. Intermodal accessibility indicators consider trips by more than one mode
taking account of transfers between modes. Among the accessibility indicators reported in the
literature, intermodal accessibility indicators are rare, except for rail and maritime freight transport
where the start and end of a trip is assumed to be by road..
Spatial resolution
Origins and destinations are located in areas representing regions or cities. However, accessibil-
ity indicators can be calculated only for points, which are defined either by geographical coordi-
nates (when calculating Euclidean distance) or as network nodes (when calculating network im-
pedance). It is therefore not useful to classify accessibility indicators as area-oriented or nodal. All
accessibility indicators are nodal, and if accessibility indicators for areas are required, some gen-
eralisation is needed.
The most common generalisation is to assume that all origin and destination activities are con-
centrated in nodal points in the centre of the areas called centroids. This generalisation is accept-
able if the areas are small or if only the accessibility of the city centres is of interest in the study.
However, there are important issues of spatial equity concerned with the decline of accessibility
with increasing distance from network nodes. If accessibility is represented as a continuous three-
dimensional surface, the nodes of the (high-speed) networks are 'mountains' representing, for
instance, high-speed rail stations in the city centres, whereas the areas away from the network
nodes are 'valleys' representing the 'grey zones' with low accessibility between the network
nodes. Accessibility indicators that are to show not only the 'mountains' but also the 'valleys' need
to be more spatially disaggregate.
The most straightforward way of calculating more disaggregate accessibility indicators is to in-
crease the number of areas. This is, however, frequently not possible because high-resolution
socio-economic data are not available.
Another way to calculate spatially disaggregate accessibility indicators is to disaggregate the
socio-economic data from large areas to much smaller uniform raster cells or pixels probabilisti-
cally using land cover information from geographical information systems or remote sensing im-
ages as ancillary information. By calculating accessibility indicators for each of these pixels,
quasi-continuous accessibility surfaces showing not only the 'mountains' of high accessibility but
also the adjacent 'valleys' of low accessibility can be created. As with larger areas, estimates of

ESPON 2013 14
non-network travel times or cost between pixel centroids and nearest network nodes need to be
made.
Equity
Issues of spatial equity arise with respect to differences in accessibility both within and between
areas:
- At a regional scale, the decline in accessibility from centroids or network nodes to interstitial ar-
eas affects decisions on the linkage between interregional and intraregional transport networks.
- At a European scale, spatial equity is related to the territorial cohesion objective of the European
Union to reduce disparities in income between regions. To analyse territorial cohesion, accessi-
bility indicators may be calculated for specific groups of regions or cities to identify inequalities
in accessibility between rich and poor, central and peripheral, urban and rural, nodal and inter-
stitial areas.
In addition, accessibility indicators can be used to study peripherality. The political and economic
significance of peripherality issues has grown as a result of the enlargement of the European Un-
ion by the accession of the new member states in central and eastern Europe. A peripheral re-
gion is a region which is distant in terms of travel time and travel cost from opportunities, activities
or assets existing in other regions – in short, a peripheral region is characterised by low accessi-
bility. Accessibility indicators are conditioned by a number of factors. Transport networks cover
the territory of the European Union unevenly and differ in relevance with respect to the require-
ments of individual regions, partly due to the fact that the regional division of labour and social
stratification has been adapted to differences in accessibility.
This implies that accessibility indicators which may be highly relevant to core regions might be of
secondary relevance for peripheral regions. This has implications for policy-making: the priorities
for improving accessibility are likely to differ between peripheral and core regions. However, even
if the interests of peripheral regions were given more weight in European transport policy, it is
unlikely that the locational disadvantage of peripheral regions will ever be completely compen-
sated by transport infrastructure. To analyse the difference between accessibility due to 'pure'
geographical position and accessibility in transport networks, accessibility indicators based on
Euclidean distance may be used as benchmarks against which improvements in network acces-
sibility can be measured.
Dynamics
Accessibility is not static. Accessibility based on Euclidean distance changes with the distribution
of socio-economic variables. Network-based accessibility changes both with socio-economic
variables and with transport networks or levels of service of transport. To analyse the dynamics of
accessibility, accessibility indicators can be calculated for different points in time, for instance to
show changes in accessibility induced by TEN projects or other transport policies. By comparing
the spatial distribution of accessibility with and without the projects or policies, it can be assessed
whether the projects or policies would lead to convergence or divergence in accessibility between
areas. A critical issue here is to apply meaningful measures of convergence and divergence, as
commonly used cohesion indicators measure only relative and not absolute differences between
distributions. However, with appropriate cohesion indicators, accessibility analysis can be used to
monitor and forecast the achievement of cohesion goals of the European Union.

ESPON 2013 15
Generic accessibility indicators
In this section a classification of accessibility indicators is proposed that encompasses a great
variety of possible indicators in three generic types.
In general terms, accessibility is a construct of two functions, one representing the activities or
opportunities to be reached and one representing the effort, time, distance or cost needed to
reach them:
)(f)(g ij
j
ji cWA
where Ai is the accessibility of area i, Wj is the activity W to be reached in area j, and cij is the
generalised cost of reaching area j from area i. The functions g(Wij) and f(cij) are called activity
functions and impedance functions, respectively. They are associated multiplicatively, i.e. are
weights to each other. That is, both are necessary elements of accessibility. Ai is the total of the
activities reachable in areas j weighted by the ease of getting from i to j. It is easily seen that this
is a general form of potential, a concept dating back to Newton's Law of Gravitation. According to
the Law of Gravitation, the attraction of a distant body is equal to its mass divided by its squared
distance. The gravity model of regional science is somewhat more general, it states that the at-
traction of a distant location is proportional to its size (e.g. population) weighted by a decreasing
function of its distance.
In the context of accessibility, the 'size' are the activities or opportunities in areas j (including area
i itself), and the 'distance' is the spatial impedance cij. The interpretation here is that the greater
the number of attractive destinations in areas j is and the more accessible areas j are from area i,
the greater is the accessibility of area i. This definition of accessibility is referred to as destination-
oriented accessibility. In a similar way an origin-oriented accessibility can be defined: The more
people live in areas j and the easier they can visit area i, the greater is the accessibility of area i.
Because of the symmetry of most transport connections, destination-oriented and origin-oriented
accessibility tend to be highly correlated.
However, the generic equation of accessibility above is more general than the gravity model. Dif-
ferent types of accessibility indicators can be generated by specifying different forms of functions
g(Wj) and f(cij):
- Travel cost. If only destinations of a certain kind, e.g. cities beyond a certain size, are consid-
ered (the activity function is rectangular), and the impedance function is travel time or travel
cost itself (i.e. the impedance function is linear), the accessibility indicator is total or average
travel cost to a predefined set of destinations.
- Daily accessibility. If only destinations within a certain travel time are considered (the imped-
ance function is rectangular), and the destinations are taken as is (the activity function is linear),
the accessibility indicator measures the number of potential destinations (customers, business
contacts, tourist attractions, etc.) that can be reached in a given time, e.g. a day.
- Potential. If the impedance function takes travel behaviour into account, i.e. the diminishing in-
clination to travel long distances (the impedance function is nonlinear, e.g. exponential), the ac-
cessibility indicator is a potential indicator. The activity function may take account of agglomera-
tion effects or economies of scale (i.e. may be nonlinear, e.g. a power function).
Table 2 shows the most frequent specifications of g(Wj) and f(cij) for the three types of access-
ibility indicator, where Wmin and cmax are constants and and parameters:

ESPON 2013 16
Table 2. Accessibility indicators
Type of accessibility
Activity function
)(g jW
Impedance function
)(f ijc
Travel cost
Travel cost to a set of
activities min
min
if 0
if 1
WW
WWW
j
jj
ijc
Daily accessibility
Activities in a given
travel time
jW max
max
if 0
if 1
cc
cc
ij
ij
Potential
Activities weighted by
a function of travel cost
jW
)(exp ijc
Travel cost
This indicator is based on the assumption that not all possible destinations are relevant for the
accessibility of an area but only a specified set. This set may, for instance, consist of all cities
over a specified size or level of attraction Wmin. The indicator measures the accumulated general-
ised travel costs to the set of destinations. In the simplest case no distinction is made between
larger and smaller destinations, i.e. all destinations in the set get equal weight irrespective of their
size and all other destinations are weighted zero (the activity function is rectangular). In many
applications, however, destinations are weighted by size (the activity function is linear). The im-
pedance function is always linear, i.e. does not take into account that more distant destinations
are visited less frequently.
Travel cost indicators are popular because they are easy to interpret, in particular if they are ex-
pressed in familiar units such as average travel cost or travel time. Their common disadvantage is
that they lack a behavioural foundation because they ignore that more distant destinations are
visited less frequently and that therefore their values depend heavily on the selected set of desti-
nation, i.e. the arbitrary cut-off point of the Wj included.
Daily accessibility
This indicator is based on the notion of a fixed budget for travel, generally in terms of a maximum
time interval in which a destination has to be reached to be of interest. The rationale of this ac-
cessibility indicator is derived from the case of a business traveller who wishes to travel to a cer-
tain city, conduct business there and return home in the evening. Maximum travel times of three
to five hours one-way are used. Because of its association with a one-day business trip this type
of accessibility is often called 'daily accessibility'.
The daily accessibility indicator is equivalent to a potential accessibility (see below) with a linear
activity function and a rectangular impedance function, i.e. within the selected travel time limit
destinations are weighted only by size, whereas beyond that limit no destinations are considered
at all. Daily accessibility indicators, like the travel cost indicators above, have the advantage of
being expressed in easy-to-understand terms, e.g. the number of people one can reach in a given
number of hours. However, they also share their disadvantage that they heavily depend on the
arbitrarily selected maximum travel time beyond which destinations are no more considered.

ESPON 2013 17
Potential accessibility
This indicator is based on the assumption that the attraction of a destination increases with size
and declines with distance or travel time or cost. Therefore both size and distance of destinations
are taken into account. The size of the destination is usually represented by area population or
some economic indicator such as total area GDP or total area income. The activity function may
be linear or nonlinear. Occasionally the attraction term Wj is weighted by an exponent greater
than one to take account of agglomeration effects, i.e. the fact that larger facilities may be dispro-
portionally more attractive than smaller ones. One example is the attractiveness of large shopping
centres which attract more customers than several smaller ones that together match the large
centre in size. The impedance function is nonlinear. Generally a negative exponential function is
used in which a large value of the parameter indicates that nearby destinations are given
greater weight than remote ones.
Indicators of potential accessibility are superior to travel cost accessibility and daily accessibility
in that they are founded on sound behavioural principles of stochastic utility maximisation. Their
disadvantages are that they contain parameters that need to be calibrated and that their values
cannot be easily interpreted in familiar units such as travel time or number of people. Therefore
potential indicators are frequently expressed in percent of average accessibility of all areas or, if
changes of accessibility are studied, in percent of average accessibility of all areas in the base
year of the comparison.
Extensions
There is a large number of extensions of the above generic accessibility indicators. Three of them
will be addressed in this project:
Multimodal accessibility
All three types of accessibility indicator can be calculated for any mode. At a European scale, ac-
cessibility indicators for road, rail and air are most frequently calculated. In most studies accessi-
bility indicators were calculated for passenger travel only; there are to date only few studies cal-
culating freight accessibility indicators. Differences between modes are usually expressed by us-
ing different generalised costs taking into account travel time, travel distance and convenience of
travel. In addition, there may be a fixed travel cost component as well as cost components taking
account of network access at either end of a trip, waiting and transfer times at stations, waiting
times at borders or congestion in metropolitan areas.
Modal accessibility indicators may be presented separately in order to demonstrate differences in
accessibility between modes. Or they may be integrated into one indicator expressing the com-
bined effect of alternative modes for a location. There are essentially two ways of integration. One
is to select the fastest mode to each destination, which in general will be air for distant destina-
tions and road or rail for short- or medium-distance destinations, and to ignore the remaining
slower modes. Another way is to calculate an aggregate accessibility measure combining the in-
formation contained in the modal accessibility indicators by replacing the generalised cost cij by
the 'composite' generalised cost
m
ijmij cc )(expln 1
where cijm is the generalised cost of travel by mode m between i and j and is a parameter indi-
cating the sensitivity of travellers to travel cost. This formulation of composite travel cost is supe-
rior to average travel cost because it makes sure that the removal of a mode with higher cost (i.e.
closure of a rail line) does not result in a – false – reduction in aggregate travel cost. This way of

ESPON 2013 18
aggregating travel costs across modes is theoretically consistent only for potential accessibility.
No consistent ways of calculating multimodal accessibility indicators for travel cost and daily ac-
cessibility exist.
Intermodal accessibility
A further refinement is to calculate intermodal accessibility. Intermodal accessibility indicators
take account of trips involving two or more modes. Intermodal accessibility indicators are most
relevant for logistic chains in freight traffic such as rail freight with feeder transport by lorry at ei-
ther end. Intermodal accessibility indicators in passenger travel involve mode combinations such
as Rail-and-Fly or car rentals at railway stations and airports. The intermodal generalised cost
function consequently contains further additional components to take account of intermodal wait-
ing and transfer times, cost and inconvenience. The calculation of intermodal accessibility indica-
tors requires the capability of minimum path search in a multimodal network.
Regional accessibility
Intermodality is also an issue when calculating intra-area or regional accessibility. Most accessi-
bility studies so far have concentrated on the accessibility of cities, i.e. network nodes which are
assumed to represent the whole metropolitan area or even a larger region. This presents two
problems:
- Accessibility indicators calculated for network nodes ignore that accessibility is continuous in
space. The decline of accessibility from the central node (centroid) of a region to smaller towns
and less urbanised parts of the region is not considered.
- The quality of the interconnections between the high-speed interregional and the low-speed lo-
cal transport networks cannot be taken into account. Yet the ease of getting from home or office
to the nearest station of the high-speed rail network or the next international airport may be
more important for the accessibility of a location than the speed of the long-distance connection
from there.
In addition the estimation of access times from locations within the area to the centroid as well as
of travel times between locations within the area itself ('self-potential'), which greatly influence the
accessibility of an area, increases in difficulty with spatial aggregation. There have been numer-
ous proposals for approximate solutions to the problem of 'self-potential'. Most of them concen-
trate on the selection of an appropriate fictitious 'internal' distance or travel time estimated as a
function of the radius of the area. A really satisfactory solution of the problem of calculating intra-
area accessibility requires high-resolution data on the spatial distribution of activities in the region.
If also the quality of the intraregional transport network and its connection with the long-distance
interregional networks are to be assessed, detailed information on the intraregional road and pub-
lic transport networks and the transfer possibilities at railway stations and airports are required.
Research concept
The project will be based on and extend the state of the art of accessibility analysis in Europe
presented in the previous sections:
- It will take up and update the results of existing studies on accessibility at the European scale
using most recent available network and socio-economic data.
- It will extend the range of accessibility indicators by further indicators responding to new policy
questions and further developing the quality and validity of the existing indicators.

ESPON 2013 19
- It will extend the spatial resolution of accessibility indicators by calculating accessibility indica-
tors for both the global and the regional scale.
- It will explore the likely impacts of available policies at the European and national scale to im-
prove global, European and regional accessibility in the light of new challenges, such as global-
isation, energy scarcity and climate change.
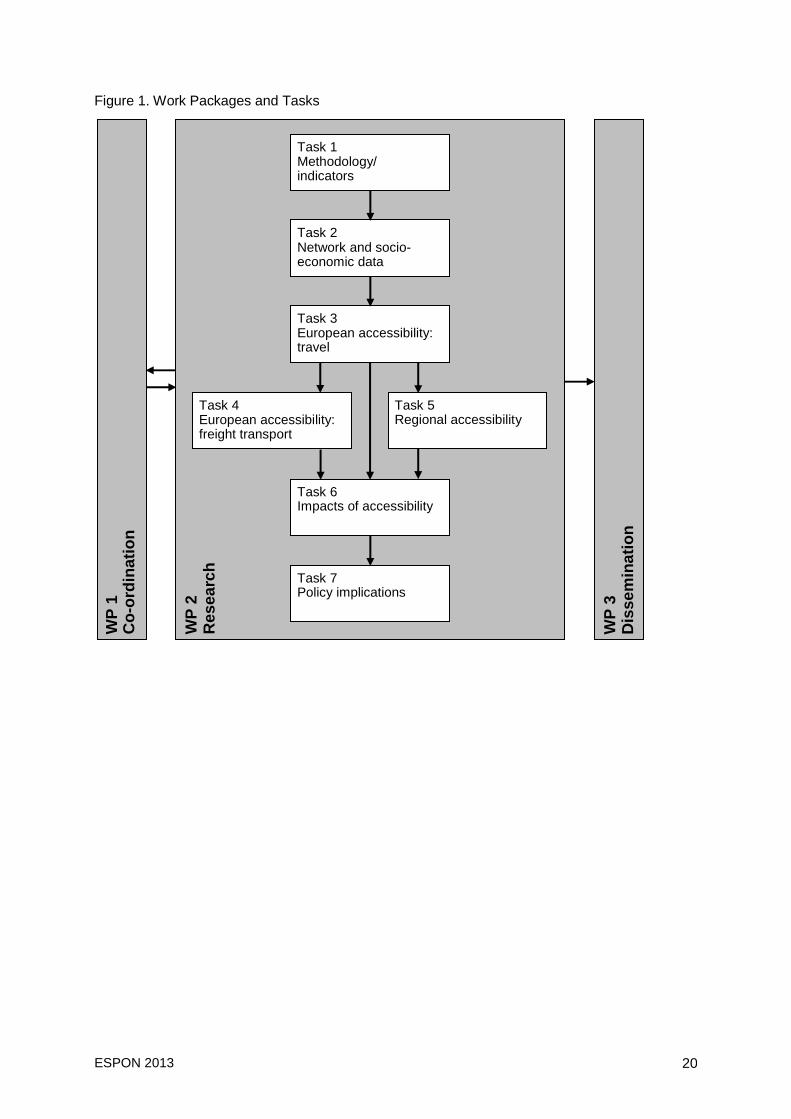
To achieve this, the research in the project will be divided into seven Tasks:
- Task 1: Methodology/indicators
- Task 2: Network and socio-economic data
- Task 3: European accessibility: travel
- Task 4: European accessibility: freight transport
- Task 5: Regional accessibility
- Task 6: Impacts of accessibility
- Task 7: Policy implications
With this concept the project starts from the standard accessibility indicators developed in
ESPON 1.2.1, 1.1.1, 2.1.1 and 1.1.3 and the recent Accessibility Updates and extends these to
first freight accessibility and global accessibility and then to the regional/local level of intraregional
accessibility in regional case studies. By exploring several alternative ways of calculating re-
gional/local accessibility indicators and comparing them with European accessibility indicators,
the added value of more detailed accessibility indicators will be assessed.
The expected results of the project will be
- a consistent set of European network and regional socio-economic data
- a database of various accessibility indicators at NUTS-3 level
- evidence on the relationship between accessibility and regional development (GDP per capita,
energy consumption and greenhouse gas emissions by transport)
- case studies of regional accessibility in different types of regions
- exploratory research on Europe-wide regional accessibility
- policy-relevant findings, policy conclusions and suggestions for further research
Geographical coverage of the analyses will be NUTS-3 or equivalent regions in all countries par-
ticipating in the ESPON 2013 Programme plus the EU candidate countries Croatia and FYR Ma-
cedonia and the other countries of the Western Balkans Bosnia and Herzegovina, Serbia, Monte-
negro, Albania and Kosovo and larger regions in neighbouring countries and the rest of the world.
Smaller areas will be used in the regional case studies (see Chapter 7).
Figure 1 shows the Work Packages and Tasks of the project and the main linkages between
them.
ESPON 2013 20
Figure 1. Work Packages and Tasks
WP
2
Res
ea
rch
Task 3 European accessibility: travel
Task 5 Regional accessibility
Task 7 Policy implications
Task 2 Network and socio- economic data
Task 1 Methodology/ indicators
Task 4 European accessibility: freight transport
Task 6 Impacts of accessibility
WP
1
Co
-ord
ina
tio
n
WP
3
Dis
se
min
ati
on

ESPON 2013 21
4 Research approach
This chapter describes the research activities of the project in detail. For each of the seven Tasks
the key research questions, the methodology and the expected results are given. Each Task is
further broken down into Subtasks.
4.1 Methodology/indicators
There are numerous notions of accessibility. Accessibility is a very complex concept that has mul-
tiple dimensions, such as origins and destinations, spatial impedance, constraints and barriers,
types of transport purposes and transport modes, spatial scale, equity and dynamics (see Table
1). In consequence, there is a huge variety of accessibility indicators addressing these dimen-
sions in very different ways for different scientific or policy purposes.
The objective of the first Task of the project is therefore to review the existing methods and indi-
cators for different types of transport, transport modes and spatial scales, to improve the methods
to measure European accessibility by calculating other indicators than potential accessibility and
to extend them by calculating not only European travel accessibility as done so far but also freight
accessibility and global and regional accessibility.
Task 1 Methodology/Indicators
The Task will start with a thorough review of the state of the art of accessibility research. There
are several Europe-wide accessibility models available, and there exist an even larger number
and variety of accessibility models at the regional and local scale. There is a vast range of journal
articles and research reports on how to measure accessibility at different spatial scales, for differ-
ent types of travel and transport and by different travel and transport modes. Based on this re-
view, this Task is to define the methodology of the project.
The following key research questions will be addressed:
- What is the state of the art of accessibility modelling at the global, European and regional
scale?
- What is the state of the art of existing models to forecast the impacts of accessibility changes
on regional economic development?
- How can existing ways of measuring accessibility be improved?
- What are feasible options to integrate different transport modes into intermodal accessibility
indicators?
- What are innovative ways of measuring accessibility at different spatial scales?
- What can be considered as a core set of accessibility indicators for ESPON?
Subtask 1.1 European and global accessibility models and indicators
There are several Europe-wide accessibility models available. Only few of them address accessi-
bility in a global context. This Subtask will review existing accessibility models at the European
and global scale. The review will categorise existing models with respect to methods and indica-
tors structured along the different dimensions of accessibility. First conclusions on the usability of
the analysed methods and indicators for the project will be drawn.

ESPON 2013 22
Particular attention will be paid to earlier work on European accessibility in the Study Programme
on European Spatial Planning (SPESP) and in previous ESPON projects 1.2.1, 1.1.1, 2.1.1, 1.1.3
and the recent Accessibility Updates.
First results of this review are summarised in Chapter 5 of this report.
Subtask 1.2 Regional and local accessibility models and indicators
There exist an even larger number and variety of accessibility models at the regional and local
scale. This Subtask will review accessibility models at the regional and local scale. The review
will categorise the models with respect to methods and indicators structured along the different
dimensions of accessibility. First conclusions on the usability of the analysed methods and indica-
tors for the project will be drawn.
Subtask 1.3 Models to forecast the impacts of accessibility on regions
Accessibility is an important location factor for households and firms and so influences regional
development. Accessibility also affects the demand for transport and hence energy consumption
and greenhouse gas emissions. Methods to forecast the impacts of transport infrastructure in-
vestments and other transport policies to improve accessibility and regional economic perform-
ance are therefore of high relevance for policy making. This Subtask will review existing models
that address the relationship between transport infrastructure investments and other transport
policies on accessibility, regional economic development, energy consumption and greenhouse
gas emissions by transport and make recommendations for the modelling of scenarios in Task 6.
Subtask 1.4 Core set of accessibility indicators
This Subtask will draw conclusions from the reviews in the previous Subtasks to define a core set
of accessibility indicators to be implemented in the project. A set of criteria for the selection of ac-
cessibility indicators for the core set will be developed addressing issues such as theoretical rele-
vance, policy relevance, comprehensiveness and feasibility. Specific attention will be given to the
improvement of accessibility indicators developed in earlier ESPON projects.
Expected results
The results of this Task will include overviews on the state of the art of accessibility research from
the global to the local scale and of assessing the impacts of accessibility improvements on re-
gional development, energy consumption and greenhouse gas emissions by transport. This will
lead to a proposal for of a set of core accessibility indicators for the ESPON Programme, which
will be implemented in the subsequent Tasks.
4.2 Network and socio-economic data
The calculation of accessibility indicators and the modelling of regional impacts of accessibility
improvements require network and socio-economic data. Transport networks data are needed for
road, rail, water and air networks, for both passenger travel and freight transport. The network
data must contain the necessary attributes for the calculation of the accessibility indicators de-
fined in Task 1, must have the necessary geographical coverage and spatial resolution and must
describe the network evolution in past years and in the form of scenarios of the further develop-
ment of the Trans-European Transport Networks (TEN-T) and the national outline plans in future
years to allow the analysis of the dynamics of accessibility and the impacts of transport infrastruc-

ESPON 2013 23
ture investments and other transport policies on accessibility and regional development, energy
consumption and greenhouse gas emissions.
In addition accessibility models require regional socio-economic data of the study area in the
needed sectoral, spatial and temporal resolution to be used as destinations in the models.
Task 2 Network and socio-economic data
At the European level several transport network databases exist that might be used for this pro-
ject. At the regional level the Project Partners have access to regional transport network data that
can be used as starting points for the regional case studies.
The objectives of this Task are to evaluate existing network and socio-economic databases in the
light of the requirements for the calculation of the accessibility indicators defined in Task 1 and to
compile appropriate databases for the subsequent Tasks. Key research questions in Task 2 are:
- Which existing European network data can be used for the project, and which additional net-
work data will have to be collected?
- Which existing socio-economic data can be used for the project, and which additional socio-
economic data will have to be collected?
- Which regional transport network databases exist at Project Partners, and to which degree do
they need to be enhanced to meet the project requirements?
- Which statistical data are at hand at Project Partners, and which alternative data sources need
to be investigated to set up a comprehensive database for the individual regional case studies?
- What is the data situation in the EU candidate countries and in Western Balkan countries both
with respect to transport network data and statistical data at regional level, allowing extension of
the Europe-wide models to include these countries in the analysis?
Following these research questions, Task 2 is subdivided into four subtasks:
Subtask 2.1 European network data
This Subtask will review available European network databases, such as TRANS-TOOLS, Euro-
stat GISCO/DG Move, ESRI's Digital Charts of the World (DGTW), OpenStreetMap (OSM), Nav-
teq, TeleAtlas, OAG and the network data of the Project Partners. First, it will develop evaluation
criteria for the assessment of network databases, such as general data availability, available
modes, spatial coverage, network density and network topology, actuality and temporal dimen-
sion (past and actual years), information on travel times, speeds and/or costs, data format, price
and legal restrictions, model requirements and flexibility, and whether the database contains also
past and future network states. Second, based on this evaluation, decisions about the network
database(s) to be used and/or developed in Subtask 2.3 will be made.
Specific attention will be given in this Subtask to the data situation in the EU candidate countries
and Western Balkan countries, whether or not the assessed network databases also cover these
countries.
The outcome of this Subtask is an overview about existing European network databases and an
evaluation of their potentials for being used for the Europe-wide passenger travel and freight
transport modelling in Tasks 3 and 4. A recommendation will be given which database shall be
used and implemented in the European wide travel and freight modelling.
During the evaluation process the Project Partners will strive to harmonise the used databases as
far as possible across all models, but, following the different model requirements, the database

ESPON 2013 24
shall also be customised to the models as far as needed. Data harmonisation is needed in order
to ensure comparability of the model results later on.
Subtask 2.2 Socio-economic data
This Subtask will review the availability of Europe-wide socio-economic data to be used as desti-
nations for the calculation of the accessibility indicators defined in Task 1, such as population,
employment or GDP per capita, in the required sectoral, spatial and temporal resolution and will
make recommendations for developing the project database of socio-economic data in Subtask
2.3. The actual list of required socio-economic data on the one hand depends on the model re-
quirements of the Europe-wide accessibility models and on the other hand is subject to the inno-
vative accessibility indicators identified in Task 1. For innovative accessibility indicators, raster-
based representations of activities, e.g. population, will be developed.
Similar to the network databases, the socio-economic data need to be harmonised for all models
to allow comparisons of results and indicators, with respect to the spatial resolution (i.e. NUTS
level), the temporal dimension (base year, past years/time series, future horizons/projections),
data definitions and data units.
Specific attention will be given also in this Subtask to the data situation in the EU candidate coun-
tries and Western Balkan countries, whether or not the required socio-economic data are avail-
able in these countries in the required spatial and temporal disaggregation. Special concern will
be given to the spatial level for which the data are available, as this level should ideally match the
spatial level of the models applied in the European member states.
Subtask 2.3 European network and socio-economic data
Based on the review in Subtasks 2.1 and 2.2, this Subtask will compile the network and socio-
economic data necessary for the accessibility and impact modelling at the global and European
scale. The data will cover all countries participating in the ESPON 2013 Programme plus the EU
candidate countries Croatia and FYR Macedonia and the other countries of the Western Balkans
Bosnia and Herzegovina, Serbia, Montenegro, Albania and Kosovo plus larger regions in
neighbouring countries and other parts of the world, as far as the data availability allows to in-
clude these countries.
Subtasks 2.3 will also pre-process the collected data in a way to forward standardised, harmo-
nised and complete datasets to the models. In agreement with the model requirements of Tasks 3
and 4, the data will be forwarded to the models in the agreed data format and data structure.
Subtask 2.4 Regional network and socio-economic data
This Subtask will compile the network and socio-economic data for the regional case studies
once the case studies have been selected. The data will cover road, rail and water networks as
well as population, work places, etc., and major transport nodes, such as long-distance railway
stations, airports, seaports and logistics centres in the case study regions.
Most of these data are already available with the Project Partners, however, certain data gaps
and data insufficiencies will be identified in this Subtask, and alternative data sources will be ap-
proached to enhance existing data.
In certain cases it might become necessary to contact national data providers to clarify legal is-
sues, i.e. to obtain permission to use the data in the framework of ESPON TRACC.
Unlike the network and socio-economic data to be used for the Europe-wide modelling, which
should be harmonised as far as possible, there will be no centralised and harmonised database

ESPON 2013 25
for all regional case studies, but, reflecting the individual character of each case study, there will
be individual databases for each case study or macro region compiled by the Project Partners.
Nonetheless it will be important to harmonise the regional case studies to some degree, i.e. in
terms of the spatial resolution used (for instance, NUTS-5 level), the spatial extent and the set of
indicators calculated, to allow for comparisons of results.
Expected results
The final outcomes of this Task are network and socio-economic datasets customised for all ac-
cessibility and impact modelling in this project at all scales addressed based on the comprehen-
sive overview and assessment of available network and socio-economic databases.
At the European scale the databases will be harmonised as far as possible across all models,
while at the regional scale there will be individual databases for each case study.
Task 2 will also provide an overview about data availability in the EU candidate countries and
Western Balkan countries, helping to address the question whether or not the Europe-wide mod-
els can be extended to these countries.
Several databases to be used for the development of the internal project databases may be sub-
ject to intellectual property rights. This is particularly likely for the transport network databases.
Most of them may be legally used in the project. However, to what extent the network databases
compiled in the project may become part of the overall ESPON database will be subject to further
investigation.
4.3 European accessibility: travel
Fast and reliable travel over long distances has become the signature of modernity and one of
the essential prerequisites for the competitiveness of regions and regional economic develop-
ment. In a globalised world, international gateways, such international airports have become ori-
gins and destinations of equal importance as the locations of central business centres of global
cities.
Because of this, transport has continued to grow faster than GDP per capita. In particular road
transport, because of its efficiency and flexibility, has grown much faster than transport by rail and
is today the fastest growing source of energy consumption and greenhouse gas emissions of all
sectors of human activity. Only air travel, in particular long-distance intercontinental trips, has ex-
perienced similar growth rates.
European transport policy therefore has to find a tradeoff between promoting accessibility for
travel in the interest of quality of life and competitiveness and at the same time making travel
more sustainable in the interest of energy conservation and the achievement of greenhouse gas
reduction targets.
Task 3 European accessibility: travel
This Task is to provide the knowledge needed for making rational policy choices for this tradeoff.
For this the following research questions are to be answered:
- What is the accessibility of European regions for travel by different modes (road, rail, air) at the
European level?
- What is the accessibility of European regions for air travel at the global level?
- What is the potential of intermodal travel, in particular the combination of high-speed rail and
air?

ESPON 2013 26
- What would be the impacts of different policies to make rail more competitive on the modal
share of travel and travel accessibility?
- What are the most favoured urban centres and most disadvantaged regions with respect to
travel accessibility (island, mountain areas)?
The method for calculating travel accessibility indicators will start from the potential accessibility
indicators with population and GDP as destination activities. developed and applied in ESPON
1.2.1, 1.1.1, 2.1.1 and 1.1.3 and the recent Accessibility Updates for ESPON.
In those studies the potential accessibility indicator for road, rail, air and multimodal travel was
calculated for the years 2001 and 2006. The first part of the calculation of European travel acces-
sibility will be to calculate this type of potential accessibility indicator for the year 2011 based on
updates of the networks and the accessibility model used previously (Subtask 3.1). This allows
the comparison of the development of European accessibility over a period of ten years.
Then, these standard accessibility indicators will be extended in three directions:
- First, the critique on the standard potential accessibility indicator, i.e. that each region is repre-
sented only by a centroid, will be addressed by using instead of centroids a raster representa-
tion of population based on the EEA population grid as destinations in the accessibility model.
The appropriate size of the raster cells will have to be determined; reasonable sizes might
range between 2.5x2.5 km and 10x10 km. This refined accessibility model will be run with the
same networks as before, i.e. the model will provide raster-based potential accessibility pat-
terns for the years 2001, 2006 and 2011. The results of this disaggregate accessibility approach
will be compared with the standard centroid-based indicators to assess the advantages of hav-
ing more spatial detail with the disadvantage of higher computation efforts. This extension will
be part of Subtask 3.1
- Other types of accessibility indicators than potential accessibility, such as intermodal accessibil-
ity (road/air and rail/air), daily accessibility (number of population reached in one day) and aver-
age travel time/distance to major destinations (see Chapter 3) will be calculated and their ex-
planatory power and policy-relevance compared with those of the standard potential accessibil-
ity. Intermodal accessibility indicators will require an intermodal network database, for average
travel time/distance and daily accessibility special software will be developed (Subtask 3.2).
- Global accessibility indicators measure accessibility to destinations in other continents outside
Europe by air, but also selected road and rail connections to Asia. It will be examined whether
potential accessibility or simpler connectivity indicators are more appropriate. The indicators will
consider travel time and travel cost to the nearest airport and waiting times and political, cultural
and language barriers at borders (Subtask 3.3).
Geographical coverage of the analysis are NUTS-3 or equivalent regions in all countries partici-
pating in the ESPON 2013 Programme plus the EU candidate countries Croatia and FYR Mace-
donia and the other countries of the Western Balkans Bosnia and Herzegovina, Serbia, Montene-
gro, Albania and Kosovo (see Chapter 7). When calculating European accessibility, also destina-
tions in neighbouring countries, such as Belarus, Moldova, Russia, Turkey and Ukraine will be
considered, when calculating global accessibility, destinations in all world regions.
The analysis will be performed using the most recent available network and socio-economic data
(see Chapter 7). Where possible accessibility data from previous ESPON projects (ESPON 1.2.1,
ESPON 2.1.1 and the latest Accessibility Update for ESPON) will be included and updated
It will be examined to what degree policies to change the parameter of accessibility, such as
transport network improvements, in particular high-speed rail connections, continued European
integration or rising transport costs due to taxation, road pricing or higher fuel costs will influence
the patterns of travel accessibility.

ESPON 2013 27
The results of the different accessibility indicators will also be used to develop typologies of Euro-
pean and global accessibility patterns..
Subtask 3.1 European travel accessibility
This Subtask will calculate potential travel accessibility by road, rail and air and multimodal ac-
cessibility to destinations in Europe and neighbouring countries. The indicators will consider travel
time and travel cost and waiting times at borders and political, cultural and language barriers. As
an alternative to centroid-based also raster-based accessibility indicators taking account of the
intraregional distribution of population will be tested. It will be examined to what degree policies to
change these parameters, such as transport network improvements, in particular high-speed rail
connections, continued European integration or rising travel costs due to taxation, road pricing or
higher fuel costs will influence the patterns of travel accessibility.
Subtask 3.2 European travel accessibility measured by other indicators
This Subtask will calculate further indicators of travel accessibility other than potential accessibil-
ity by road, rail and air to destinations (population and GDP) in Europe and neighbouring coun-
tries, such as
- average travel time/distance to major destinations
- daily accessibility (number of businesses reached in one day)
- intermodal accessibility (road/air and rail/air)
These indicators will consider travel time and travel cost and political, cultural and language bar-
riers at borders. It will be examined to what degree policies to change these parameters, such as
transport network improvements, in particular high-speed rail connections, continued European
integration or rising transport costs due to taxation, road pricing or higher fuel costs will influence
the patterns of travel accessibility.
This Subtask will also provide a platform for innovation and experiments with new types of acces-
sibility indicators and advanced ways of visualisation of results. As such new types of indicators
basically require the same input data as more traditional types of indicators, the additional effort
focuses less on data issues but on concepts, ideas and experiments, i.e. the specification and
implementation of such new indicators will be part of the process.
Subtask 3.3 Global travel accessibility
This Subtask will calculate intercontinental travel accessibility to destinations (population and
GDP) in other continents outside Europe. The most relevant mode will be air, but also road and
rail connections to Asia, such as the Trans-Siberian Railway and the Bosphorus Bridge, will be
considered. It will be examined whether potential accessibility or simpler connectivity indicators
are more appropriate. The indicators will consider travel time and travel cost to the nearest airport
and waiting times and political, cultural and language barriers at borders. It will be examined to
what degree policies to change these parameters, such as transport network improvements, in
particular high-speed rail connections, continued European integration or rising transport costs
due to taxation, road pricing or higher fuel costs will influence the patterns of travel accessibility.
Expected results
The results of Task 3 will be a unique set of standard and new accessibility indicators imple-
mented for the European territory. These indicators will show the development of accessibility
patterns in Europe for the last decade and for possible future situations. The accessibility pattern

ESPON 2013 28
will be transformed into European and global accessibility typologies. The results will be pre-
sented in maps of the ESPON territory and the Western Balkan showing the spatial distribution of
the different travel accessibility indicators by road, rail, air and combinations of these modes at
the global and European level.
4.4 European accessibility: freight transport
One of the elements that have shaped globalisation in the recent decades is the decline of freight
transport costs. This has allowed companies to outsource several phases of the production chain
at different scales: regional, national and international. Because of this fragmentation of the value
chain, freight transport has become the fastest growing type of transport. In particular freight
transport by road, because of its efficiency and flexibility, has grown much faster than freight
transport by rail and waterways and is today the fastest growing source of energy consumption
and greenhouse gas emissions of all sectors of human activity. Only freight transport by air, in
particular on long-distance intercontinental connections, has experienced similar growth rates.
Fast and reliable freight transport from production to markets has therefore become one element
of regional competitiveness and economic development. International gateways, such as sea-
ports and airports have become origins and destinations of equal importance as the locations of
production and consumption. In brief: accessibility for freight transport has become more and
more significant. At the same time, much less attention has been devoted in the literature to pro-
duce freight accessibility indicators.
Task 4 European accessibility: freight transport
This Task of the project is aimed at producing accessibility indicators for freight that take into ac-
count specific features of goods movement such as:
- Terminal operations can explain a significant share of travel time (especially for some commod-
ity groups).
- Many non-road consignments are actually intermodal.
- In some cases borders are less easily permeable than for passengers.
In the following, the main methodological aspects that will be dealt with are presented. The meth-
odology is introduced with reference to the different accessibility indicators that will be consid-
ered: European accessibility measured as potential accessibility, European accessibility meas-
ured by other indicators and global accessibility.
Subtask 4.1 European freight potential accessibility
This subtask will calculate freight accessibility for selected commodities by road, rail, water
(inland waterways and short-sea shipping) and air to destinations in Europe and neighbouring
countries.
As a first step, general criteria will be defined, such as:
- Which elements should define the impedance function of the potential accessibility?
- Which elements should define the attractiveness of destinations?
- Which different commodity types should be adopted?
- How to deal with intermodality?
- How to compute a multimodal accessibility index?

ESPON 2013 29
With respect to impedance, the first choice to be explored will be whether to use travel time or
travel cost or both, i.e. generalised cost as impedance. For better sensitivity of the impedance
term to alternative conditions (e.g. increase of energy cost, transport policies like road charging)
both cost and time might be separated. In particular, terminal costs and times should be explicitly
considered, but also travel costs could be split into more elements where possible and relevant.
For instance, in case of lorries, time components could include onboard time, waiting time at bor-
ders and resting times due to maximum number of driving hours, whereas cost components could
distinguish energy cost and toll cost. Also times and costs of loading and unloading could be part
of generalised costs.
As destinations alternative measures will be considered including GDP per capita, number of
jobs, number of productive units, etc.
A segmentation into different commodity types should reflect differences with respect to imped-
ance or destinations. For instance, travel time could be very different for different types of goods.
One criterion for segmentation could be handling categories (i.e. bulk, container, general cargo).
Intermodality is a „natural‟ condition of most non-road freight consignments. In many cases rail
transport means combined transport (rail and road). Maritime and air freight are also linked to
land transport from/to ports and airports. Impedance for non-road modes will therefore be calcu-
lated as impedance of mode chains adding time and cost between zone centroids and terminals
whenever relevant.
For multimodal accessibility index, the first candidate will be the composite cost defined in Chap-
ter 3. Alternative measures will be considered if interesting suggestions of other approaches will
be found.
The approach selected will depend both on theoretical and practical considerations. On the the-
ory side the outcome of Task 1, in which methods and indicators will be reviewed, will provide
relevant information and suggestions. On the practical side the availability of data and the effort
needed to combine them will play a key role in designing and approach that is both rigorous and
not too ambitious or disproportionate for this project.
Once these methodological issues will be sorted out, the further step will consist of collecting the
data required for computing the accessibility indicators. Here the results of the review f data
availability in Task 2 will be relevant. The TRANS-TOOLS model is expected to be a major
source of information for times and costs for different modes although its data could need some
integration from other sources. Namely, TRANS-TOOLS does not simulate air freight transport
nor ports and intermodal terminals are explicitly coded in the network. Also a sound methodology
to reflect changes in travel time and cost will be established.
Subtask 4.2 European freight accessibility measured by other indicators
This Subtask will calculate further indicators of European freight accessibility for the same modes
considered for the potential accessibility indicators. Alternative indicators should be useful to em-
phasise specific aspects of accessibility and to monitor specific policy aspects. It might well be
that different indicators will be relevant for different modes of transport.
Examples of other alternative indicators that might be produced are:
- Number of regions that can be reached in 24 hours (relevance: all modes but maritime);
- Number of jobs or productive units that can be reached in 24 hours (relevance: all modes but
maritime);
- Number of jobs or productive units that can be reached within legal driving time with just one
driver (relevance: road);

ESPON 2013 30
- Weight of non-distance related components (e.g. loading/unloading, waiting time at customs) on
overall generalised cost (relevance: all modes)
- Availability of alternative modes to reach destinations (or terminal, like ports) within a certain
time threshold (relevance: multimodal, maritime);
The final list of other indicators to be provided will be made in the light of data availability.
Subtask 4.3 Global freight accessibility
This Subtask will calculate intercontinental freight accessibility to destinations in continents out-
side Europe. Obviously it will not be possible to calculate global accessibility indicators for all
European regions to all non-European destinations. Therefore relevant origin/destination pairs will
be selected, for instance major overseas terminals.
It will be examined whether potential accessibility or simpler connectivity indicators are more ap-
propriate. The concepts and definitions developed for European accessibility in Subtask 4.1 will
provide a starting point, but additional methodological and data availability issues will be ad-
dressed about measuring times and costs for overseas routes (e.g. cost and time for tranship-
ment at ports) and attractiveness of destinations (e.g. is GDP of destinations more suitable than
the amount of trade? If trade is preferable, should it be measured in value or quantity?). Answer-
ing this kind of questions will allow to select the indicators for freight global accessibility.
Freight global accessibility will mainly concern maritime and air transport, although road and rail
could enter in the analysis for specific destinations. For instance, road freight could be considered
for destinations in the Middle East or North Africa, while it will be explored whether significant rail
freight service between countries participating in the ESPON 2013 Programme and countries
outside Europe exist or might exist such so accessibility by rail is worth to be computed.
A specific analysis on global accessibility will be carried out for intermodal freight accessibility of
the hinterlands of the European ports. This analysis will use the strategic model SIMPORT devel-
oped by MCRIT that was used to investigate the relative competitiveness of the port of Barcelona,
and more in general of Mediterranean ports, in relation to trade coming from outside Europe,
mostly from the emerging markets in Asia.
Expected results
The results will be presented in maps of the ESPON territory showing the spatial distribution of
the different freight accessibility indicators computed for the various modes and with reference to
the different types of accessibility (European potential accessibility, European accessibility meas-
ured with other indicators, global accessibility).
First, the indicators will provide an overview of the current situation of the ESPON territory with
respect to freight accessibility, answering questions, such as:
- What is the accessibility of European regions for freight by different transport modes?
- What is the accessibility of European regions for freight at the global level?
- What are the most favoured and most disadvantaged regions with respect to freight accessibil-
ity (urban centres, island, mountain areas)?
Second, the indicators will allow to measure the impact of alternative scenarios on regional ac-
cessibility. Scenarios can include policies such as transport network improvements, reductions of
transhipment times, road pricing as well as exogenous trends like continued European integration
or higher resource energy costs.

ESPON 2013 31
4.5 Regional accessibility
Global and European accessibility are important location factors for firms and working and leisure
travel of people. However, for the daily life of citizens regional/local accessibility to jobs, services
and public facilities, may be more important than global or European accessibility. On the other
hand, to get access to long-distance and international transport services, travellers have to rely
on local and regional transport networks. Accessibility, as social and economic development fac-
tor, nowadays depends on the regional connection to long-distance transport and communication
networks as well as to the physical or geographic distance to large economic centres.
Task 5 Regional accessibility
The objective of this Task is to measure and analyse accessibility at the regional scale for differ-
ent types of regions in Europe. The following research questions are to be addressed:
- What specific access conditions to long-distance and international transport networks exist in
the European regions? How are accessibility and connectivity at the regional/local level, i.e.
which activities can be reached in typical daily travel times?
- What are characteristic patterns of regional/local accessibility, i.e. accessibility to different travel
modes and what are key infrastructural bottlenecks and barriers at the regional level for long-
distance trips?
- How does accessibility by public transport compare to accessibility by road at the regional/local
level?
- What would be the advantage of including intermodal accessibility indicators in the analysis of
regional/local accessibility as well as including regional/local indicators in the European acces-
sibility measures?
- In which type of regions is the level of European accessibility similar or different to their intrare-
gional accessibility, i.e. are regions with good European accessibility able to translate it into
good intraregional accessibility?
Subtask 5.1 Typology of regional accessibility patterns
A review of accessibility studies at the intraregional scale will be performed to find characteristic
patterns of accessibility at the regional/local scale. Due to the expertise and geographical distribu-
tion of the Project Partners, accessibility studies will be analysed in all ESPON member states,
with special emphasis to the macro regions selected for the case studies.
The literature review will cover different types of spatial development areas, such as urban, semi-
urban and rural areas, but also islands and mountain regions, remote regions, and different kinds
of economically based areas such as tourist, service, industrial or post-industrial centres, etc.
Based on the accessibility patterns found, a typology of regional/local accessibility will be defined
that will be used to characterise the different accessibility patterns in different types of regions.
Subtask 5.2 Selection of regional case studies
A number of case study areas at macro regional level (NUTS-0 or NUTS-1) will be selected in this
subtask for analysis. The selection criteria to be developed will assure a good geographic cover-
age of macro regions from Northern Europe to the Mediterranean and from peripheral regions to
regions in the European core.

ESPON 2013 32
Within each macro region, specific areas will selected (at NUTS-3 or NUTS-2 level) for a detailed
analysis of regional/local accessibility patterns. The selection of these case study regions within
the macro regions will ensure that different types of regions with different accessibility patterns
cover the whole diversity of Europe. Selected case studies will include mountain areas, islands,
archipelagos, central and remote rural areas, urban centres within rural landscapes, highly popu-
lated metropolitan regions, tourist areas, transborder regions, etc.
A first selection of macro regions and case study regions has already been made. The selection
process and the selected regions are described in Chapter 6 of this report.
Subtask 5.3 Case studies on regional accessibility patterns
This Subtask will analyse the accessibility patterns in the selected case study regions, linked to
integrated territorial policymaking practice at the regional level. Based on the definitions of acces-
sibility indicators in Task 1, the selection of accessibility indicators calculated in the regional case
studies will be harmonised to achieve as comparable outputs as possible.
Each regional case study will consist of three main parts.
- First, a qualitative assessment of territorial and transport infrastructure plans affecting the case
study area (at regional, national and EU levels) will be undertaken. The analysis will be done
also in relation to the 2010-2020 Transport White Paper and TEN revision.
- Second, qualitative analyses of the regional transport system with respect to existing access
points, bottlenecks, and physical barriers will be done.
- Third, the accessibility indicators computed at NUTS-5 level for the macro regions (e.g. en-
dowment, peripherality, connectivity, potential accessibility, level of service) will be analysed in
more detail for each case study area. Part of the analyses will be a comparison of accessibility
by car and by public transport as well as intermodal transport opportunities.
Subtask 5.4 Europe-wide modelling of regional accessibility
This Subtask will introduce an alternative way to calculating regional accessibility. Based on net-
work and raster-based population databases covering all Europe, it will calculate accessibility in-
dicators at the regional scale for all regions of the ESPON Space. These indicators will mainly be
based on car travel. Examples for such Europe-wide indicators at the regional scale are travel
times to the next airports or to intercity or high-speed rail stations or the number of persons or
workplaces that can be reached within a certain maximum travel time, e.g. within 30 or 60 min-
utes. The regional accessibility indicators so derived will be compared with the regional accessi-
bility indicators calculated in the regional case studies.
The connection of a given place within a region to networks can be measured in terms of dis-
tance, time or generalised cost to get access to network entering nodes and the potential utility
that these entering nodes or terminals may deliver to travellers (e.g. measured as the amount of
people or the market accessible for daily round-trips, say shorter than 3.5 hours door-to-door).
Indicators based on this concept have been applied at European and regional level during the
last twenty years using the Indicator of Connection (ICON) complementary to other concepts and
methods that will be reviewed in Subtask 5.1.
The mathematical formulation of ICON was defined as simple, flexible and intuitive as possible in
order to make it easily applicable and understandable by decision makers. For each network
i=1...n, i.e. rail network, airport network, port network, etc., a network-specific value of ICON is
calculated. These partial values are summed up in proportion to their relative contribution to
transport endowment. The relative proportions (pi) can be adjusted in relation to the economic

ESPON 2013 33
value added of each transport sector or, in a first approach, estimated according to the current
modal split. The aggregated value of ICON is then:
The main advantage of this formulation is the intuitive meaning of the ICON aggregated value,
which is not an abstract index but a measure dimensionally equivalent to each partial ICON value
or weighted access time to a network expressed in hours or minutes. On the other hand, the
weighted addition is consistent with the strategic and long-term assessment aim of ICON, since it
assumes independence between the contributions of each network to the regional endowment.
Deficits in a given network resulting in high values of ICON reduce development opportunities.
Subtask 5.5 European vs. regional accessibility
This Subtask will compare the regional accessibility calculated in the regional case studies with
those calculated by the method developed in Subtask 5.4 and with the European accessibility
calculated in Tasks 3 and 4.
Differences between these and the likely causes of these differences will be analysed to find out
which types of region follow the general European accessibility pattern and which types of re-
gions need to be given particular attention due to a mismatch between European and regional
accessibility.
Expected results
This Subtask will provide an updated view on regional and local accessibility patterns in Europe.
It will result in a typology of regional/local accessibility patterns in different types of regions.
The main delivery of the Task will be the reports on the regional case studies with harmonised
analyses of regional/local accessibility. In addition, regional accessibility indicators calculated by
the raster method developed in Subtask 5.4 will be presented for NUTS-3 or equivalent regions in
all countries participating in the ESPON 2013 Programme plus the EU candidate countries Croa-
tia and FYR Macedonia and other countries of the Western Balkans Bosnia and Herzegovina,
Serbia, Montenegro, Albania and Kosovo.
Finally the results of the comparison between the regional accessibility calculated by different
methods and between regional accessibility and European accessibility will be presented. All re-
sults will be visualised in maps showing the main accessibility patterns.

ESPON 2013 34
4.6 Impacts of accessibility
The important role of accessibility for regional development is one of the fundamental principles
of spatial economics. In its most simplified form it implies that regions with better access to the
locations of input materials and markets will, ceteris paribus, be more productive, more competi-
tive and hence more successful than more remote and isolated regions.
However, the relationship between accessibility and economic development is more complex.
There are successful regions in the European core confirming the theoretical expectation that ac-
cessibility matters. However, there are also centrally located regions suffering from industrial de-
cline and high unemployment. On the other side of the spectrum the poorest regions, as theory
would predict, are at the periphery, but there are also prosperous peripheral regions, such as the
Nordic countries. To make things even more difficult, some of the economically fastest growing
regions are among the most peripheral ones, such as some regions in the new EU member
states.
Accessibility is therefore a central policy variable for spatial policy at all spatial levels from the
European to the regional scale. Policies to improve regional accessibility by transport infrastruc-
ture investments belong to the most effective policies to stimulate regional competitiveness and
economic development. But because more transport also means more energy consumption and
greenhouse gas emissions, accessibility also has an ambiguous character.
European transport policy therefore has to find a tradeoff between promoting accessibility for
passenger and freight transport in the interest of competitiveness and at the same time making
transport more sustainable in the interest of energy conservation and the achievement of green-
house gas reduction targets.
Task 6 Impacts of accessibility
This Task of the project is to provide the knowledge needed for making rational policy choices for
this tradeoff taking not only accessibility itself but also its wider socio-economic and environ-
mental impacts into account. For this the following research questions are to be answered:
- How is accessibility related to regional economic development, employment, energy consump-
tion and greenhouse gas emissions by transport?
- What will be long-term scenarios of European transport policy with respect to transport infra-
structure improvements and other transport policies, such as taxation or road pricing?
- What will be the impacts of long-term scenarios of European transport policy on accessibility,
regional economic development, energy consumption and greenhouse gas emissions by trans-
port?
- What will be the impacts of rising energy prices on the future development of transport and
hence accessibility, regional economic development, energy consumption and greenhouse gas
emissions by transport?
Subtask 6.1 Accessibility and regional development
This Subtask will analyse the relationship between different types of accessibility as calculated in
Tasks 3 and 4 and regional economic development in terms of economic development (GDP) and
the environment (energy consumption and greenhouse gas emissions). Particular attention will be
given to the most favoured regions (urban centres) and most disadvantaged regions (islands and
mountain regions) and whether the gap in income between these types of regions tends to in-
crease or be reduced. The analysis will review the state of the art of theory development (see
Chapter 3) and recent literature on existing accessibility studies (see Chapter 5).

ESPON 2013 35
Subtask 6.2 Long-term scenarios of European transport
This Subtask will identify long-term scenarios of European transport policy in terms of transport
infrastructure investments and other transport policies, such as taxation and road pricing, and
assumptions about future developments in vehicle technology and alternative fuels and fuel price
increases. A business-as-usual scenario will assume the implementation of the Trans-European
Transport Networks (TEN-T) priority projects. Alternative policy scenarios will assume faster or
delayed implementation of the TEN-T projects in combination with different taxation and road
pricing policies and different assumptions about vehicle technology, alternative fuels and fuel
prices. Key assumptions of scenarios developed in other EU projects, such as ADAM or ITREN-
2030 will be considered.
Subtask 6.3 Spatial impacts of European transport scenarios
The Europe-wide regional economic model SASI (Socio-economic and Spatial Impacts)
(Wegener and Bökemann, 1998; Wegener, 2008) will be used to forecast the likely impacts of the
policy scenarios defined in Sub-Task 6.2. The SASI model was applied in several EU projects,
such as IASON (Bröcker et al., 2004), ESPON 2.1.1 (Bröcker et al., 2005), ESPON 1.1.3 (2006),
ESPON 1.4.4 (Spiekermann et al., 2007), AlpenCorS (Spiekermann and Wegener, 2005) and
STEPs (Fiorello et al., 2006).
The SASI model is a recursive simulation model of socio-economic development of regions in
Europe subject to exogenous assumptions about the economic and demographic development of
the European Union as a whole and transport infrastructure investments and transport system
improvements, in particular of the trans-European transport networks.
The model differs from other approaches to model the impacts of transport on regional develop-
ment by modelling not only production (the demand side of regional labour markets) but also
population and migration (the supply side of regional labour markets). The sectoral production
functions of SASI include production factors (some of them delayed) representing regional capi-
tal, labour market potential, economic structure, sector-specific accessibility indicators and soft
location factors, such as research and development and quality of life.
The geographical coverage of the model includes all countries participating in the ESPON 2013
Programme plus the EU candidate countries Croatia and FYR Macedonia and the other countries
of the Western Balkans Bosnia and Herzegovina, Serbia, Montenegro, Albania and Kosovo (see
Figure 2). The spatial dimension of the model is established by subdividing these countries into
1,330 NUTS-3 or equivalent regions and connecting these by road, rail and air networks. When
calculating European accessibility, also destinations in neighbouring countries, such as Belarus,
Moldova, Russia, Turkey and Ukraine are considered, when calculating global accessibility, des-
tinations in all world regions.
The target year of the simulations is 2031. The temporal dimension of the model is established by
dividing time into periods of one year duration. By modelling relatively short time periods both
short- and long-term lagged impacts can be taken into account. In each simulation year the seven
submodels of the SASI model are processed in a recursive way, i.e. sequentially one after an-
other. This implies that within one simulation period no equilibrium between model variables is
established; i.e. all endogenous effects in the model are lagged by one or more years.
The transport networks used by the SASI model originated in the trans-European transport net-
work GIS database developed at the Institute of Spatial Planning of the University of Dortmund,
and now maintained and further developed by RRG (2010). The strategic road, rail and water-
ways networks used by the SASI model are subsets of this database, comprising the trans-
European networks specified in Decision 1692/96/EC of the European Parliament and of the
Council (European Communities, 1996) and amended in Decision 884/2004 (European Union,

ESPON 2013 36
2004), further specified in the TEN Implementation Report (European Commission, 1998) and the
revisions of the TEN guidelines provided by the European Commission (1999; 2002a; 2003a) and
by the European Communities (2001), information and decisions on priority projects (European
Commission, 1995; 1999; 2002b; 2003b; 2004; European Union, 2004), on the TINA networks as
identified and further promoted by the TINA Secretariat (1999, 2002), the Helsinki Corridors as
well as selected additional links in eastern Europe and other links to guarantee connectivity of
NUTS-3 level regions. The strategic air network is based on the TEN and TINA airports and other
important airports in the remaining countries and contains all flights between these airports and
reflects the state of air travel in 2006.
Figure 2. The regions of the SASI model in Europe

ESPON 2013 37
Figure 3 visualises the structure of the SASI model.
Figure 3. The structure of the SASI model
The SASI model has six forecasting submodels: European Developments, Regional Accessibility,
Regional GDP, Regional Employment, Regional Population and Regional Labour Force. A sev-
enth submodel calculates Socio-Economic Indicators with respect to equity and cohesion:
- The European Developments submodel processes exogenous assumptions about the wider
economic and policy framework of the simulations, such as (i) the performance of the European
economy as a whole, (ii) net migration across Europe's borders, (iii) transfer payments by the
European Union via the Structural Funds and the Common Agricultural Policy or by national
governments to support specific regions, (iv) European integration in terms of lowering barriers
between countries, such as border waiting times and political, cultural and language barriers
and (v) the development of trans-European transport networks (TEN-T) in policy scenarios, i.e.
time-sequenced programmes for addition or upgrading of links of the trans-European road, rail
and air networks or other transport policies, such as taxation or road pricing.
- The Regional Accessibility submodel calculates regional accessibility indicators expressing the
locational advantage of each region with respect to relevant destinations in the region and in
other regions as a function of the generalised travel cost needed to reach these destinations by
the strategic road, rail and air networks.
- The Regional GDP submodel calculates regional economic development by production func-
tions incorporating various accessibility indicators as additional production factor for six eco-
nomic sectors: agriculture, manufacturing, construction, trade/transport/tourism, financial ser-
vices and other services.

ESPON 2013 38
- The Regional Employment submodel calculates regional employment by industrial sector de-
rived from regional GDP by industrial sector and regional labour productivity.
- The Regional Population submodel forecasts regional population by five-year age groups and
sex through natural change (fertility, mortality) and migration.
- The Regional Labour Force submodel calculates the regional labour force derived from regional
population and regional labour force participation partly endogenously affected by changes in
job availability or unemployment.
- The Socio-economic Indicators submodel calculates equity or cohesion indicators describing
the distribution of accessibility and GDP per capita across the regions. Cohesion indicators are
macroanalytic indicators combining the indicators of individual regions into one measure of their
spatial concentration. Changes in the cohesion indicators predicted by the model for future
transport policies reveal whether these policies are likely to reduce or increase existing dispari-
ties in accessibility and GDP per capita between the regions. In the SASI model five cohesion
indicators are calculated: (i) coefficient of variation, (ii) Gini coefficient, (iii) geometric/arithmetic
mean, (iv) correlation between relative change and level and (v) correlation between absolute
change and level.
In each simulation period the seven submodels are processed sequentially a shown in Figure 4:
Figure 4. The sequence of submodels in SASI

ESPON 2013 39
A more detailed description of the SASI model, its data requirements and output indicators is
available in Wegener (2008).
Model development
For application in the present project the SASI model will be extended by a simple model of long-
distance passenger and freight transport in order to calculate basic environmental indicators,
such as energy consumption and greenhouse gas emissions of transport.
The network and socio-economic data of the model will be updated by the most recent available
network and socio-economic data. Where possible, data from previous ESPON projects (ESPON
1.2.1, 1.1.1, 2.1.1. and 1.1.3 and the recent Accessibility Updates will be used (see Chapter 7.2).
The system of regions will be converted to the latest 2006 NUTS-3 classification (Eurostat, 2007)
and equivalent regions in non-EU countries, including a higher spatial resolution in the candidate
countries Croatia and FYR Macedonia and the other countries of the Western Balkans Bosnia
and Herzegovina, Serbia, Montenegro, Albania and Kosovo. Turkey will continue to be treated as
an external region (see Chapter 7.4).
The target year of the simulations will continue to be 2031. However, it will be examined whether
an experimental extension of the simulations until 2050 will be feasible.
Expected results
For each region of the study area the model forecasts the development of accessibility and GDP
per capita, employment and population and energy consumption and greenhouse gas emissions
of transport.
In addition cohesion indicators expressing the impacts of transport infrastructure investments and
transport system improvements on the convergence (or divergence) of accessibility and socio-
economic development in the regions of the European Union are calculated.
The results will be scatter diagrams of the relationship between accessibility and economic de-
velopment and environmental indicators and time series diagrams and maps showing the devel-
opment over time and spatial distribution of accessibility, GDP per capita, energy consumption
and greenhouse gas emissions by transport.
4.7 Policy implications
Accessibility is a prerequisite for economic competitiveness and quality of life in European re-
gions. There exists a broad consensus between European policy documents, from the European
Spatial Development Perspective (1999), the White Paper on European Transport Policy (2001),
the Territorial Agenda of the European Union (2007), the Green Paper on Urban Mobility (2007)
to the Green Paper on Territorial Cohesion (2008) that improvement of accessibility is a major
objective of European spatial policy.
However, there are goal conflicts involved. If mainly the transport corridors between the major
agglomerations are improved, this may be good for the global competitiveness of Europe as a
whole but may increase the differences in accessibility between the core centres and peripheral
regions. Conversely, if mainly transport links to and between peripheral regions are improved,
that may reduce their disadvantage but may retard the growth of the European economy as a
whole. Moreover, each new infrastructure will tend to attract more traffic and so accelerate the
growth of energy consumption and greenhouse gas emissions by transport, if transport technolo-
gies and market regulations remains the same.

ESPON 2013 40
Task 7 Policy implications
It is the objective of this Task to create awareness of this goal conflict of European transport pol-
icy and provide guidance for rational tradeoffs between the conflicting goals of competitiveness,
territorial cohesion and environmental sustainability.
Subtask 7.1 Policy-relevant findings
This Subtask will summarise the findings of the project in relation to the goals of the European
Union competitiveness, territorial cohesion and environmental sustainability for different types of
regions, such as urban areas, rural areas, mountain areas, islands, coastal areas and outermost
regions, and their development opportunities and policy options taking account of the cohesion
policy orientations as expressed in the Community Strategic Guidelines on Cohesion 2007-2013
and the Fourth Report on Cohesion. The summary will be based on the accessibility analyses of
Tasks 3 and 4, the case studies of Task 5 and the model scenarios of Task 6.
The Community Strategic Guidelines on Cohesion 2007-2013 (2005) represent a framework
which the member states and regions are invited to use when developing national and regional
programmes, in particular with a view to assessing their contribution to the objectives of the
European Union in terms of cohesion, growth and jobs. A central element of the guidelines is the
assumption that transport infrastructure is a necessary condition for economic and employment
growth in the Union, having a direct impact on the attractiveness of regions for businesses and
people. Territorial accessibility is therefore perceived as an enabler of economic prosperity.
The Fourth Report on economic and social cohesion (2007) supports of the spirit of the Commu-
nity Strategic Guidelines, and argues that in order to improve the crucial aspects of economic and
social cohesion and the development of quality employment, it is essential to ensure complemen-
tarity between the Union‟s cohesion policies and other Community policy areas, in particular
transport, but also macroeconomics and other services.
The report states how improved accessibility tends to create new job opportunities for rural as
well as urban populations. Improving the accessibility of regions to the fullest extent requires not
only investment in the main routes, but also in secondary networks and public transport to ensure
that local areas are properly connected. But positive effects will be captured only as long as
populations have the necessary education and skill levels. The potential advantages from improv-
ing accessibility therefore depends on the competitiveness of the regions concerned and some
regions are liable to lose out as they become more open to competition from elsewhere.
It is an objective of this subtask to check results from Tasks 3 and 4, the case studies of Task 5
and the model scenarios of Task 6 against these general policy assumptions.
Subtask 7.2 Policy conclusions
This task will evaluate the policy instruments available to the European Union and its member
states to maintain and improve the different types of regional accessibility in order to draw as
much benefit for regional development from accessibility with the smallest possible negative im-
plications for territorial cohesion and the environment and formulate policy conclusions which can
stimulate and enlighten the ongoing political discourse on transport and accessibility policy for
decision makers, experts and the wider public.
The European Common Transport Policy (CTP) is an essential component of the political project
of the European Union. However, transport infrastructure has been considered a common politi-
cal area of the European Union only since the Maastricht Treaty of 1992, when the concept of
trans-European transport networks was introduced for the first time, with a special emphasis on
interconnection and interoperability of the diverse national networks.

ESPON 2013 41
The TEN-T policy (to be updated during 2011) is intended to increase the co-ordination in the
planning of infrastructure projects by the member states. Although there has been progress to-
wards the Common Transport Policy (CTP) objectives of eliminating infrastructure bottlenecks
through the TEN-T programme, progress has been relatively slow, partly due to the scale, com-
plexity and cost of the projects. Most of the 30 TEN-T priority projects involve large amounts of
investment, especially rail projects. According to the CTP Evaluation (EC 2009), substantial pro-
gress has been made towards meeting the objective of the CTP of creation of a competitive inter-
nal market for transport services by liberalisation of the transport market. Market opening has
been very successful in the air sector, and there are signs that market opening in the rail sector is
starting to bring some success. In other sectors, further reforms are required to fully implement
liberalisation.
The White Paper on Transport of the EU is the document of strategic reflection providing the con-
ceptual and philosophical framework for the CTP. Successive versions of this document have had
substantial influence on EU, national and regional policies. While the first White Book of 1992 set
the objective to liberalise the transport markets, the second White Book of 2001 proposed the a
massive modal change from road to rail to combat climate change. Today, the objective of de-
coupling economic growth from mobility growth has proven its complexity according to the mid-
term revision of the White Book in 2006. The communication by the European Commission in
2009 triggering the debate for the 2011 White Book revision proposed that the CTP should pur-
sue an integrated sustainable, safe and comfortable, globally accessible and efficient transport
system focussing on technology development, management improvement and infrastructure in-
vestment on those links providing the highest returns to European mobility, regional development
and territorial cohesion.
Subtask 7.2 will confront the CTP, TEN-T policy and the Transport White Paper with the capacity
to maintain and improve the different types of regional accessibility, to formulate conclusions to
contribute to the ongoing political discourse on transport and accessibility policy, the redefinition
of TEN-T policy and the new Transport White Paper in 2011.
The policy conclusions will be differentiated by type of region. Special attention will be given to
peripheral and most isolated regions, such as island or mountain regions. The 4th Report on Co-
hesion relates accessibility conditions in these regions to their level of wealth: islands, where ac-
cessibility often constitutes a particular problem because their size of population is in many cases
too small to support a reasonable level of infrastructure and basic services; ultra-peripheral re-
gions, which have among the lowest levels of GDP per head in the EU (with the exceptions of
Madeira and the Canary Islands); mountain areas, which being extremely diverse in terms of
socio economic trends and economic performance, are threatened by international road traffic
when they are highly accessible, but tend to depopulate and to show poor indicators when they
are difficult to access.
Policy recommendations for the new EU member states will take into account the different phase
in economic development of the new member states compared with the old member states, which
may justify a policy primarily promoting improvements of accessibility of their capital cities during
a transition period following the phase strategy of spatial development proposed in ESPON 1.1.3.
As stated by the Community Strategic Guidelines on Cohesion 2007-2013, infrastructure invest-
ment needs to be adapted to the specific needs and level of economic development of the re-
gions and countries concerned.
Subtask 7.3 Further research needs
In the final Subtask, avenues for further applied research on the theme of accessibility at the
global, European and regional scale with respect to data needs and required methodologies will
be formulated.

ESPON 2013 42
5 Review of existing accessibility studies
Over the last decades a vast number of accessibility studies addressing European core-periphery
issues have been published. This chapter extends earlier reviews (Rietveld and Bruinsma, 1998;
Wegener et al., 2001). It starts with short summaries of prominent European accessibility studies
and compares these along the dimensions of accessibility identified in Chapter 3 and with respect
to equity and cohesion and gives an outlook on national and regional studies to be examined in
later phases of the project.
5.1 European accessibility studies
There is a growing number of accessibility models addressing Europe-wide accessibility. This
section briefly introduces European accessibility models developed in the last three decades and
classifies them and compares the accessibility indicators they produce by applying the dimen-
sions of accessibility presented in Chapter 3. The dimensions equity and dynamics will be dis-
cussed separately. The order of the models presented is chronological.
Keeble et al. (1982, 1988) in a project for DGXVI of the European Commission analysed eco-
nomic core-peripherality differences between the regions of the Community and investigated
whether any differences can be explained by relative location. For this purpose, they developed a
gravity potential model with regional GDP as destination activity and road distance costs as im-
pedance. The results were expressed as economic potential index and presented in maps as
contour lines.
Törnqvist had already in the 1970s developed the notion of 'contact networks' based on the hy-
pothesis that the number of interactions with other cities by visits such as business trips is a good
indicator of the position of a city in the urban hierarchy. Based on this, Cederlund et al. (1991)
and Erlandsson and Törnqvist (1993) calculated daily accessibility indicators of European cities
expressed as the number of people that can be reached from a city by a return trip during a work
day with four hours minimum stay using the fastest available mode (outbund accessibility).
The Bundesforschungsanstalt für Landeskunde und Raumordnung (Lutter et al., 1992, 1993) in a
study for DG Regio of the European Commission calculated the accessibility of NUTS-3 regions
in the then twelve member states of the European Community as average travel time by intermo-
dal transport (road, rail, air) to 194 economic centres in Europe. In the same study they used also
other destinations such as the next three agglomerations, the next high-speed train stop or the
next airport. In addition, they calculated a daily accessibility indicator expressed as the number of
people that can be reached in three hours using the fastest connection. Modes considered in-
cluded road, rail and air with and without planned infrastructure investments (new motorways,
high-speed rail lines and more frequent flight connections).
Bruinsma and Rietveld (1993) calculated the population potential of European cities with similar
results as Keeble et al. (1982; 1988) once again demonstrating the spatial correlation between
economic and population centres.
Spiekermann and Wegener developed three-dimensional surfaces of daily and potential rail ac-
cessibility for Europe using raster-based GIS technology (Spiekermann and Wegener, 1994;
1996; Vickerman et al., 1999), road and air accessibility were added later (Schürmann et al.,
1997; Fürst et al., 2000). The quasi-homogenous accessibility surfaces were achieved by subdi-
viding Europe into some 70,000 square raster cells of 10 km width and calculating accessibility
indicators for each raster cell with respect to all other raster cells. Population of raster cells was
estimated by allocating the population of NUTS-3 regions to raster cells with the help of a hypo-
thetical negative-exponential gradient of population density around population centres. Access
travel time from each raster cell to the nearest network node was approximated using an airline
travel speed of 30 km/h.

ESPON 2013 43
Chatelus and Ulied (1995) developed several accessibility indicators for the evaluation of trans-
European networks at the level of NUTS-2 regions in the EU15 plus Norway. One of them, the
FreR(M) indicator, measures the average cost to reach a market area of a certain population size
by lorry. The impedance term is generalised road transport cost including cost of the driver's time,
cost per kilometre and a fixed cost component. The CON(T) indicator accumulates population of
NUTS-2 regions of EU15 plus Norway and Switzerland reachable within a maximum travel time of
three hours by any combination of car, rail and air with transfer times between modes explicitly
considered. The CON(T) index was used to assess transport infrastructure scenarios with respect
to competitiveness, cohesion and sustainability. The FreR(T) index is a freight accessibility indi-
cator expressing the size of the market that can be reached in a certain travel time, e.g. the popu-
lation that can be reached overnight or in 12, 36, 60 or 84 hours by the fastest connection using
road, rail or combined traffic with driving time restrictions for lorry drivers observed.
Gutiérrez et al. (1996) and Gutiérrez and Urbano (1996) calculated average travel time by road
and rail from about 4,000 nodes of a multimodal European transport network to 94 agglomer-
ations with a population of more than 300,000 with and without planned infrastructure improve-
ments. Road travel times included road and car ferry travel times modified by a link-type specific
coefficient and a penalty for crossing nodes representing congested population centres. Rail
travel times included timetable travel time plus road access time and penalties for changes be-
tween road and rail (60 minutes), rail and ferry (180 minutes) and change of rail gauge between
Spain and France (30 minutes).
Copus (1997, 1999), in studies for the Highlands and Islands European Partnership Programme
and for DG Regio of the European Commission developed peripherality indicators for NUTS-2
and NUTS-3 regions based on road-based potential measures of the Keeble type. The model
takes account of different average speeds for different classes of road, realistic ferry crossing and
check-in times, EU border crossing delays and statutory drivers' rest breaks. Accessibility is pre-
sented as a peripherality index derived as the inverse standardised to the interval between zero
(most central) and one hundred (most peripheral).
In a report for the Study Programme on European Spatial Planning of DG REGIO, Wegener et al.
(2001) proposed reference indicators describing the geographical position of European NUTS-3
regions. Besides geographical, physical and cultural indicators, three accessibility indicators were
proposed. The first two measure accessibility by road and rail to population, the last one accessi-
bility by air to economic activity (expressed by gross domestic product, or GDP). Accessibility to
population is seen as an indicator for the size of market areas for suppliers of goods and services
and accessibility to GDP as an indicator of the size of market areas for suppliers of high-level
business services. Accessibility is presented as percent of European average accessibility.
Schürmann and Talaat (2000) produced an index of peripherality for the Third Cohesion Report of
the European Commission (2001) with a geographical information system. Potential type indica-
tors are calculated for passenger and freight transport by road using GDP or population or labour
force as destination activity. Travel times for lorries were computed separately from car travel
times to take account of speed limits for lorries, delays at borders and ferry ports and statutory
drivers' rest periods. The indicators are calculated for NUTS-3 regions and for equivalent regions
of the candidate countries and Norway and Switzerland. The indicators were aggregated to
NUTS-2, NUTS-1 and NUTS-0 regions. The peripherality index is presented in two ways: either
standardised on the European average (as in Wegener et al., 2001) or to an interval between
zero and one hundred (as in Copus, 1997, 1999).
In 2004 a research team led by Nordregio (2004) in a project for DG Regio analysed the socio-
economic situation of mountain areas in the EU and potential accession and other countries. The
study analysed different accessibility indicators, among them population potential, airline dis-
tances to national capital cities and the next three cities with more than 100,000 inhabitants, ac-

ESPON 2013 44
cess to airports, universities and hospitals. Two spatial levels were used: All indicators were cal-
culated at municipal level and then aggregated to mountain areas. First all indicators were stan-
dardised at the European average, but also at the respective national averages. Access to public
facilities was initially calculated as shortest travel time by car to the nearest facility and then con-
verted to the proportion of population at more than one hour from the nearest facility.
Another study by Nordregio (Gløersen et al., 2006) analysed the accessibility of peripheral,
sparsely populated regions in Finland, Norway and Sweden in the European Union. Due to their
extremely peripheral location, these regions rely on transport hubs such as airports and seaports;
therefore number of destinations and frequency of services of flight and ferry connections were
analysed. In addition, access to universities and hospitals was analysed as the proportion of
population living within 60 minutes from these facilities.
In a study for the Directorate-General for Internal Policies of the Union of the European Parlia-
ment (European Parliament, 2007) a 2.5x2.5 km raster system for the entire European Union plus
Norway and Switzerland was used to calculate a comprehensive set of road potential accessibility
indicators to population, GDP and service facilities, such as airports, high-speed train stations,
universities and hospitals. The results at raster level were aggregated to NUTS-3 and NUTS-2
level, and indicators, such as number and proportion of population within 60 minutes travel time
were derived and mapped.
Spiekermann and Schürmann (2007) updated the accessibility indicators for road and rail used in
several ESPON projects and EU documents with 2006 network data. More recently, the work was
extended to air and multimodal accessibility.
Comparison
The European accessibility models reviewed above yield a wide range of approaches with re-
spect to various dimensions of accessibility. They differ in many respect, but there are also some
commonalties (see Table 3):
- More than half of the models use potential type indicators, the remaining models use travel
costs or daily accessibility indicators. A few models are able to calculate more than one type of
indicator.
- The origins for which accessibility indicators are calculated are usually NUTS-2 or NUTS-3 cen-
troids, very few studies have a more detailed representation of space.
- The destination activities are usually population or GDP for potential type accessibility indica-
tors and a pre-defined set of agglomerations for the travel cost indicators. For daily accessibility
indicators both population and public facilities, such as airports, high-speed train stations, uni-
versities or hospitals are used as destinations.
- Nearly all models use travel time as impedance term, only few models apply travel costs or a
combinations of both as generalised cost.
- Only few models consider constraints on the impedance term. Models that consider freight
transport use statutory drivers' rest breaks as constraints.
- Only few accessibility models consider barriers, such as waiting times at national borders. Only
Keeble et al. use trade barriers, such as tolls.
- Nearly all accessibility models are based on passenger travel, only few models consider freight
transport.
- Half of the models consider one mode only, in most cases road. The other models have net-
works for different modes, however, only two use intermodal travel times

ESPON 2013 45
Table 3. Dimensions of European accessibility models
Authors Indicator
type
Origins Destinations Impedance Constraints Barriers Type of
transport
Modes Spatial
scope
Keeble et al. (1982; 1988)
Potential NUTS-2 centroids
GDP in NUTS-2 regions and other Euro-pean coun-tries
Road distance
- Sea crossings, trade barriers
- Road EU9 EU12
Cederlund et al.
(1991) and Er-landsson and Törnqvist (1993)
Travel time, Daily
Cities Cities Travel time - - Travel Fastest mode
EU12
Lutter et al. (1993)
Travel cost, Daily
NUTS-3 centroids
194 centres next 3 agglo-merations, airports etc.
Travel time - - Travel Road, rail air, inter-modal
EU12
Bruinsma and Rietveld (1993)
Potential Cities Cities Travel time - - Travel Air EU27+2
Spiekermann and Wegener (1994, 1996)
Daily, potential
10 km raster cells
Population in 10 km raster cells
Travel time Travel cost
- - Travel Rail EU27+2
Chatelus and Ulied (1995)
Travel cost, Daily
NUTS-2 centroids
Population in NUTS-2 re-gions
Travel cost Statutory drivers' rest breaks
- Travel freight
Road, rail air inter-modal
EU15 +2
Gutierrez and
Urbano (1996)
Travel cost 4,000 nodes 94 agglomera-
tions
Travel time Congestion in
urban areas
Change of rail
gauge
Travel Road
rail
EU12

ESPON 2013 46
Table 4. Dimensions of European accessibility models (continued)
Authors Indicator
type
Origins Destinations Impedance Constraints Barriers Type of
transport
Modes Spatial
scope
Copus (1997, 1999)
Potential NUTS-2 / NUTS-3 centroids
GDP, popula-tion, labour in NUTS-2/3 regions
Travel time Statutory drivers' rest breaks
Border delays Travel Road EU15+2+12
Wegener et al., (2001)
Potential NUTS-3 centroids
Population and GDP in 10 km raster cells
Travel time Travel cost
- Border delays Travel Road
Rail Air
EU15
Schürmann and Talaat (2000)
Potential NUTS-3 centroids
GDP, popula-tion, workforce in NUTS-3 regions
Travel time Statutory drivers' rest breaks
Border delays
Travel Freight
Road EU15+12
Nordregio (2004)
Daily Municipality Mountain area
Municipality Facilities
Travel time - - Travel Road EU27+2+5
Gløersen et al. (2006)
Daily Municipality Airports Seaports Universities Hospitals
Travel time - - Travel Road Air Ferry
EU27+2
European Par-liament (2007)
Potential Raster cells 2.5x2.5 km
NUTS-3
NUTS-2
Population GDP Airports HSR stations Universities Hospitals
Travel time - - Travel Road EU27+2
Spiekermann and Schürmann (2007)
Potential NUTS-3 centroids
NUTS-3 population
Travel time - Border delays Travel Road Rail Air
EU27+2

ESPON 2013 47
Equity and cohesion
Table 4 summarises the main results of the accessibility models with respect to spatial disparity
and its changing patterns over time.
It can be seen that all European accessibility studies expose the existing core-periphery pattern
of accessibility in Europe and all indicate that over time the gap in accessibility between core and
peripheral regions has increased.
A distinction can be made between potential and daily accessibility. Whereas potential accessibil-
ity has improved in the former cohesion countries in southern Europe and increasingly also in the
new member states in central and eastern Europe, daily accessibility, in particular where busi-
ness trips are concerned, has increased mainly in central regions with good air connections.
Table 4. Equity and dynamic statements of European accessibility models
Authors Spatial disparities Changing pattern through time
Keeble et al. (1982; 1988)
Core-periphery pattern Disparities in accessibility have in-creased in past periods
Cederlund et al.
(1991) and Erlands-son and Törnqvist (1993)
Core-periphery pattern Disparities in accessibility have in-creased in past periods
Lutter et al. (1993) Existing, but scope depends on des-tination activities considered
Travel time benefits for peripheral regions, daily accessibility increases in central regions
Bruinsma and Riet-veld (1993)
Core-periphery pattern Increasing disparities in accessibility
Spiekermann and Wegener (1994, 1996)
Clear core-periphery pattern plus clear centre-hinterland disparities in all European countries
Increasing disparities induced by TEN
Chatelus and Ulied (1995)
Clear core-periphery pattern Decreasing disparities
Gutierrez and Urbano (1995, 1996)
Clear core-periphery pattern Decreasing disparities induced by TEN
Copus (1997, 1999) Clear core-periphery pattern Dynamics not considered
Wegener et al., (2001)
Different core-periphery patterns for different transport modes
Increasing or decreasing disparities is an outcome of the indicator
Schürmann and Ta-laat (2000)
Clear core-periphery pattern for road transport
Improvements mainly for EU candi-date countries
Nordregio (2004) Great disadvantage in accessibility of mountainous regions
Increasing disadvantage of moun-tainous regions
Gløersen et al. (2006)
Great differences in accessibility be-tween core and periphery
Increasing peripherality of remote regions
European Parliament (2007)
Great differences in accessibility be-tween core and periphery
Increasing peripherality of remote regions
Spiekermann and Schürmann (2007)
Great differences in accessibility be-tween core and periphery
Cohesion improving in relative terms but declining in absolute terms

ESPON 2013 48
Another important distinction can be made between whether changes in accessibility are meas-
ured in relative or in absolute terms. Whereas in relative terms (e.g. in percent) accessibility has
improved more in the peripheral regions, in absolute terms accessibility in the core regions in
western Europe has continued to grow more.
Assessment
An overall assessments of accessibility models is difficult. The general tendency is that none of
the models is really able to serve all purposes:
- Most models focus on personal transport and ignore freight transport although freight transport
might be more relevant for peripheral regions. Spiekermann and Neubauer (2002) in their re-
view of European accessibility studies found only two out of ten studies dealing with freight ac-
cessibility. However, empirical work has shown that road accessibility by using car or trucks is
very high correlated and that car accessibility can be used as a proxy for truck accessibility.
- Most models do only have an implicit relation to certain sectors of the economy, i.e. by concen-
trating on personal transport the models are closely related to the service sector and neglecting
that transport has differential relations with different sectors (see Vickerman, 1999).
- Following that, the reality of the business environment in peripheral rural areas is hardly repre-
sented in the European accessibility models.
- Some models, those working with travel cost indicators, support the case for public investment
in infrastructure by demonstrating increased cohesion. Other models, mainly of the potential
type, are much more cautious or even forecast increased regional disparities as outcome of
transport infrastructure investments.
To conclude, despite the vast range of models, there is currently no model presented in the litera-
ture that would match all requirements for the different dimensions. Models that are superior in a
certain dimension are behind in others. There is no model available that would be able to calcu-
late accessibility for a spatially detailed representation of pan-Europe for personal and freight
transport for all transport modes including multi- and intermodal trips for different indicator types
and destination activities and that has a database that allows assessments for different points in
time, i.e. past, current and future accessibility patterns.
5.2 National and regional accessibility studies
The number and diversity of accessibility studies at the national and regional level in European
countries is even larger than those Europe-wide studies.
In national and regional studies of accessibility other origins and destinations become relevant. If
a balanced polycentric urban system is a goal of national spatial planning, accessibility of cities at
the second or third level of the urban systems are of interest. In countries with stagnant or declin-
ing populations, the provision of minimum standards of basic services of general interest in peri-
urban or rural areas are quickly becoming a problem of high political importance. This makes ac-
cessibility studies with local public facilities as destinations, such as schools, food shops, doctors
and pharmacies, an important future field of applied research.
It is beyond the scope of work in the short period until the Inception Report to undertake a full re-
view of such studies in all countries of the ESPON space.
Reviews of existing studies in the macro regions in which case studies will be conducted will be
undertaken in conjunction with the case study regions (see Chapter 6).

ESPON 2013 49
6 Selection of regional case studies
Global and European accessibility are important location factors for firms and working and leisure
travel of people. However, for the daily life of citizens regional/local accessibility to jobs, services
and public facilities, may be more important than global or European accessibility. Task 5 of the
TRACC project is therefore concerned with regional accessibility (see Chapter 4.5). A major part
of Task 5 is the development and execution of a broad set of regional and local case studies in
order to gain systematic knowledge on accessibility patterns in different types of regions through-
out Europe.
This chapter presents the process of selecting appropriate regional case studies as well as a brief
introduction to the selected case study regions.
6.1 Selection process
The case study areas to be selected for regional accessibility modeling within TRACC should
cover a wide range of different types of regions in different parts of Europe. In addition, one of the
technical objectives is that the methodologies to be implemented in the case study regions should
be as similar as possible in order to allow a comparison of the resulting accessibility patterns, i.e.
should not be disturbed by artefacts induced by methodological differences.
However, the comparison of regional and local accessibility pattern in different parts of Europe
would be difficult if the case study regions would be limited to a single NUTS-3 region, i.e. such
accessibility patterns would have to be compared without having information on regional
accessibility in the surrounding regions of the case study region.
In addition, there are data constraints which are mainly related to network data. It is currently
impossible to set up a harmonised network database for Europe, in particular for public transport,
from which subsets could be extracted for regional case studies. Consequently, regional case
studies have to be developed from existing regional network databases.
Based on these considerations the TRACC project performed a pragmatic process for the
selection of case study regions:
- First, a set of macro regions at NUTS-0 or NUTS-1 level was compiled for which Project Part-
ners have already a fairly good database for accessibility modeling (see Chapter 7) and which
at the same time represent very different parts of Europe.
- Second, within each macro region a number of case study regions at NUTS-2 or NUTS-3 level
were identified which represent very different types of regions within the macro region.
During the quantitative parts of the case studies, the regional accessibility models will ideally be
run for the macro region at NUTS-5 level with harmonised indicator definitions to provide overall
knowledge on the regional accessibility pattern in the different macro regions. Based on this
framework the case study areas will be analysed and discussed in more detail. By doing it this
way, the different case study areas will be comparable all over Europe.
The selection process resulted in a good geographic coverage of macro regions from Northern
Europe to the Mediterranean, from eastern parts of Europe to western parts and from peripheral
regions to central core regions (Figure 5). Each Project Partner is responsible for one macro
region resulting in seven macro regions in total. The selected macro regions form an arc
stretching from the far North almost down to Gibraltar. The chosen macro regions are the
EURAM transborder region along the Mediterranean coast in Spain and France, Northern Italy,
Bavaria in Germany, Czech Republic, Poland, Scandinavia and Finland.

ESPON 2013 50
Figure 5. Selected macro regions for case studies.
Within each macro region between three and six case study areas for in-depth analysis were
selected. The selection results in a good distribution of about in total 30 case study areas over
different types of regions ensuring the study of different kinds of territorial typologies with different
mobility patterns associated. Case study areas include mountain areas, islands, archipelagos,
fjord regions, remote and central rural areas, urban centres within rural landscapes, functional
urban areas of lower importance, highly populated metropolitan regions, touristic winter and
summer areas, transborder regions.
Table 5 presents the selected macro regions and the case study areas by giving brief
characteristics of the areas. A more detailed presentation of the selected regions follows in
Section 6.2.

ESPON 2013 51
Table 5. Selected macro regions and case study areas
Macro region Case study areas Characteristics
EURAM
Mediterranean
Arc Euroregion
Andorra
Pyrénées-Orientales
/ Girona
Barcelona
Alacant
Menorca
Andorra is a small independent mountain country enclave
with complex topography but important accessibility
requirements due to primary tourist industry targeted to
Spanish and French visitors.
Pyrénées Orientales / Girona is selected to study accessi-
bility at a transborder region between France and Spain.
Barcelona is selected as being representative of major
European metropolitan regions.
Alacant is selected as primary tourist region in Europe
located on a coastal area.
Menorca is selected as a sparsely populated island with
an important floating population in summertime. Being a
biosphere reserve, Menorca needs to make compatible
accessibility with environment preserving.
Northern Italy Milan urban area
Piacenza province
La Spezia province
City of Parma
Milan has been chosen as being representative of major
European metropolitan regions.
Piacenza case study will measure accessibility in a
province structured by radial lines centred in the capital
and crossed by major corridors at trans-regional level.
La Spezia case study is interesting to analyse accessibility
in a dense costal area with difficult mountainous charac-
teristics, with intense port activity and growing tourism
industry.
Parma case study is chosen to study accessibility in detail
at urban level. The case study will consider all modes,
from car and public transport, to cycling and walking.
Bavaria Munich region
Nuremberg region
Allgäu region
Donau-Wald region
The Munich region will give insights into accessibility
patterns in a large urban area with a monocentric spatial
structure.
The Nuremberg region will provide knowledge about
accessibility patterns in a medium-sized urban area with a
polycentric spatial structure.
The Allgäu region in the south-western parts of Bavaria
includes parts of the Alps and its foothills will depict
accessibility patterns of rural and mountainous areas.
The Donau-Wald region in the eastern parts of Bavaria
will provide findings concerning the accessibility situation
of rural areas.

ESPON 2013 52
Table 5. Selected macro regions and case study areas (continued)
Macro region Case study areas Characteristics
Czech
Republic
Prague
other case study
areas to be defined
The capital city of Prague is currently one of the most
dynamic and successful regions of Central Europe.
Remaining NUTS-2 regions in the Czech Republic can be
placed in four groups: catching up regions with the EU
average (South West region and Central Bohemia), low-
moderate economic growth regions (South-East region
and North-East region), lagging (Central Moravia) and
declining (Moravia-Silesia and North-West region).
Poland Warsaw region
Dolnośląskie
Zachodniopomorskie
(or Pomorskie)
Małopolskie
Warsaw is developing very fast while its road accessibility
is poor; it will change in 2012 after the realization of the
A2 motorway section to Warsaw.
Dolnośląskie is chosen due to the lack of motorways, but
the good railway connection to Warsaw and excellent
accessibility to European core areas.
Zachodniopomorskie (or Pomorskie) will be studied for
their interest due to the existence of ports, regional
airports, fragmented motorway sections and foreseen
accessibility changes in the next decade.
Małopolskie includes the tourist destinations of Kraków
(relatively good accessibility) and Poland‟s most popular
mountain resort Zakopane (poor accessibility).
Scandinavia Tromsø
Trondheim
Lillehammer
Oestersund
Falun
Oerebro
Tromsø and Trondheim represent both „Fjord Norway‟
with a specific topographic situation between the sea and
the mountains. They are regional service centres, with
extremely low population density around.
Lillehammer is chosen as a representative example of a
winter sports resort in „mountain Norway‟
Østersund and Falun/Borlänge are selected as typical
Swedish examples of regional cities, both covering water
areas and extensive forest areas, but with distinct urban
settlements in between.
Oerebro is selected as a major centre within a number of
other medium-size towns in the heart of Sweden with
good connections to the major agglomerations in Sweden.
Finland Lapland
Oulu region
Helsinki region
Lapland is chosen as a representative case of extreme
periphery in the European context, substantially different
to other rural regions in the rest of Europe.
Oulu region is chosen as representative of a competitive
growth centre located high up in the north, showing the
contrast between different kinds of regional types, i.e.
relatively developed urban and scarcely populated
peripheral areas.
Helsinki is an illustrative example of high and good quality
accessibility in spite of the physical remoteness in relation
to the rest of Europe.

ESPON 2013 53
6.2 Macro regions with case study areas
This section provides a brief presentation of each macro region selected with the target areas for
in-depth analysis. Each presentation includes a territorial and socioeconomic characterisation of
the case study and its transport infrastructure together with the reasons for the selection.
EURAM regional case study
The macro region
The Mediterranean Arc Euroregion, the EURAM, covers Spanish and French crossborder
regions, and Andorra. It is stretching over three different states, contains some autonomous
communities, about 10 regions and departments, several hundred counties, and about 2,000
municipalities. It has more than 1000 km of coastal areas, mountain regions with highs up to
3,000 m, four islands, highly populated metropolitan regions with densities up to 15,500 inh./km²,
and sparsely populated rural areas with densities below 10 inh./km².
Between 1998 and 2008, the EURAM population increased by 20 % up to 14.2 million inhabitants
and the number of jobs by 2.1 million (50 %). Approximately 13 % of the EURAM population are
now foreigners, most of them attracted to fill job vacancies generated during the period of strong
growth of 3.5 % GDP per year between 1997 and 2007, but a significant number were also
attracted by the climate and quality of life of the region. About one in every five immigrants to the
EURAM is from another EU-25 nation, and in some places the proportion stands at one in every
three, similar to the level found in the American Sunbelt.
The present territorial organisation of the EURAM involves a large number of jurisdictions and a
complex distribution of responsibilities and resources between administrations. This introduces
rigidities and inefficiencies in the public sector: on the one hand it hinders the attainment of scale
economies in the supply of public services and, on the other, the difficulties of reaching
consensus under very different political agendas often create insurmountable obstacles to carry
out major strategic projects.
The spatial structure
The population in the EURAM region is heavily concentrated along the coastal fringe along the
Mediterranean Sea. The three main agglomerations in the EURAM region are Barcelona‟s (5
million inhabitants), Valencia‟s (1.8 million inhabitants) and Alacant-Elx (0.8 million inhabitants).
Barcelona‟s metropolitan region concentrates some 5 million inhabitants which represents about
70 % of the population of Catalonia autonomous community in only 10 % of its territory. The
metropolitan region of Barcelona is composed of seven counties and 800 municipalities, and it
includes 18 cities with more than 50,000 inhabitants, only 7 with more than 100,000 inhabitants
The municipality of Barcelona itself has 1.6 million inhabitants.
Valencia‟s metropolitan region concentrates some 1.8 million inhabitants, representing 35 % of its
autonomous community population, while Alacant-Elx metropolitan region holds 760,000
inhabitants. Both regions together accommodate 50 % of the region‟s population in 10 % of its
territory.
The Balearic insular region is composed of four islands, Majorca, Minorca, Eivissa and
Formetera, and has 1.1 million inhabitants. It is a heavily frequented summer destination (as
many other EURAM coastal regions), having its transport and service infrastructures prepared for
some 10 million visitors yearly.

ESPON 2013 54
The department of Pyrénées-Orientales has 437,000 inhabitants. Its head city Perpignan houses
the largest fruit and vegetables market in Europe, managing some 1.5 million tonnes of products
yearly, and constituting an important logistics centre connected to air and to sea modes.
Andorra is an independent state in the heart of the Pyrenees with 85.000 inhabitants. It is located
at a high between 800 m and 3,000 m. Population is mainly settled in two narrow river valleys
between mountains. Being a major tourist, leisure and commercial centre oriented to both
Spanish and French visitors, it registers important flows of visitors, mostly by car (some 25,000
vehicles across its borders daily), and therefore transport infrastructures is a major concern.
Socioeconomic portrait
The EURAM has an important industrial tradition. The sector is characterised by the presence of
some multinational firms attracted during the 1980s and 1990. But it is essentially composed of a
broad network of small and medium-sized family firms in mature sectors, sometimes constituting
sectoral clusters such as ceramics, footwear, textiles, toy industry, furniture, or agri-food. The
relocation of some major multinational industrial firms may be inevitable; nonetheless, de-
industrialisation of the territory is a major political objective in the mid-term.
Agriculture accounts for 2 % of EURAM‟s GDP and employs 2 % of its active population.
Nevertheless, the agro-food industry is of considerable importance in the EURAM, producing 15
% of Spanish food exports and hosting some of the largest food production, transformation and
distribution firms of Spain. Agricultural land in the EURAM has a trend to decrease in extension.
With 60 million visitors per year, Spain ranks second only to France as the world‟s leading
tourism destination. Some 30 million visit the EURAM regions every year (15 million in Catalonia;
10 million in Balearic Islands; 5 million in Valencia). Tourism is expected to evolve towards the
provision of additional services related to education and training, health and wellbeing, sport and
leisure and cultural and business activities, and constitutes a strategic sector in the EURAM.
After the present downturn, the construction sector should slowly recover in the EURAM,
although growing at a slower pace than in the past decade. In 2004, Spain‟s six leading building
firms had a joint turnover of around 35 billion Euros, threefold increase with respect to 1999. The
construction sector is in a process of business diversification towards other economic sectors
such as concessions and infrastructure management, which account now in many cases for up to
50 % of their business turnover. Most of these major firms are immersed in a process of growing
internationalisation.
Transport aspects
Mobility for both passengers and freight in the EURAM will continue to grow in the future with the
pace of economy. Urban trips motivated by factors other than work and medium to long-distance
travel will increase and become more variable throughout the day and the territory, while
international and intercontinental travel may undergo exponential growth. In 1981, 28 %
individuals living in the Barcelona urban region worked outside their home municipality. By 2001
this percentage had risen to 47 %; forecasts indicate that this figure will rise to 60 % by 2026.
The long distance road corridors of the EURAM comprise essentially the Mediterranean axis
along the coast (integrated by two parallel motorways), three axes linking the cost to Zaragoza
(from Barcelona, Tarragona and Valencia) and two axes linking the coast to Madrid (from
Valencia and Alacant). All these axes are served by motorways, and some of them are tolled.
Road capacity in these corridors has already difficulties in fulfilling demand needs in many
sections, notably around metropolitan areas. Particularly during peak tourism seasons some
motorway and trunk road sections reach congestion levels that are unacceptable.

ESPON 2013 55
Within ten years, the Spanish high-speed train network has become one of the most developed in
the world, together with those of France and Japan. There are many new sections being built
across the Iberian peninsula and, following the inauguration of the Barcelona-Madrid line in 2008,
it is expected that by 2012 the line connects to France in Perpignan. The missing stretch from
Perpignan to Montpellier may not be connected, however, until after 2020. In the Community of
Valencia, the three provincial capitals will be both interlinked and connected to Madrid by the HST
in five years. The continuity of the high-speed Mediterranean corridor along the EURAM would be
ensured with a new Tarragona-Castelló section which is not scheduled yet.
The explosion of low-cost companies has led to a sharp rise in air traffic in the EURAM, linked to
the increase in tourism. Air traffic in the EURAM rose from 56 million passenger in 2000 to 87
million passenger 2007. In 2007, Barcelona handled around 33 million passenger, Palma 23
million passenger and Alacant 9 million passenger. The global traffic growth has benefited some
regional airports such as Girona, whose traffic has increased since 2000 by 644 % up to 5 million
passenger. The current capacity of the EURAM airport system, taking planned extensions into
account, is globally sufficient in the short and medium terms. Spanish airports are managed by a
public entity, Aena, with a centralized model.
The port of Valencia currently leads the container traffic in the Western Mediterranean with 3.6
MTEU in 2008 (+20 % compared to 2007), while the port of Barcelona handled 2.6 MTEU (+0 %
compared to 2007). While other competitive hubs like Algeciras or TangerMed are better located
geographically on the Suez-Gibraltar route, the ports of Barcelona-Tarragona and Valencia-
Sagunt still offer excellent opportunities to become maritime gateways for Southern Europe.
Pursing this strategy, all major ports in the Mediterranean basin are currently undergoing
extensions or planning them to capture a higher share of Asian imports to Europe, which are
currently handled by 75 % in the ports of Northern Europe.
If the EURAM is to become the Mediterranean‟s logistic gateway of Europe, the Mediterranean
corridor to Central Europe should be able to accommodate far greater flows of goods. The
provision of competitive rail services might contribute to reduce the pressure on motorways.
Despite public support, however, railways play a modest role in goods transport in the corridor.
Rail network is scarcer than in central Europe, while new lines require important investments due
to difficult topographies and heavily populated environments.
Expected results
Accessibility analysis will be performed in the EURAM region in a NUTS-5 resolution.
Accessibility runs will include accessibility to road and rail networks, to airports and ports. Results
will provide an image of accessibility in a coastal corridor confined between sea, and hilly
unpopulated hinterland areas. It will also provide contrast between different kinds of region types
such as mountainous, metropolitan, sea-side, and scarcely populated areas. More specifically,
- Andorra will provide insight on accessibility in a small independent mountain country enclave
with complex topography but important accessibility requirements due to primary tourist industry
targeted on Spanish and French visitors.
- Pyrénées Orientales / Girona will study accessibility in a transborder region.
- Barcelona will show accessibility in the most important urban agglomeration in the EURAM
- Alacant will provide knowledge on accessibility in a coastal region focused on international tour-
ism.
- Menorca case-study will analyze accessibility in an island, which being a biosphere reserve,
needs to make compatible accessibility with environment preserving.

ESPON 2013 56
Northern Italy regional case study
The macro region
The area the case studies belong to is located in the north-western part of Italy across three
regions: Lombardia, Emilia Romagna and Liguria. Northern Italy case study will deal with four
different case studies corresponding to the Milan urban area, to the province of la Spezia, to the
province of Piacenza and to the city of Parma.
The Milan urban area (corresponding to two NUTS-3 regions) consists of the Provinces of Milan
and Monza-Brianza. It has a total area of about 2,000 km², with a total population of about 3.9
million inhabitants: In terms of population it is part of the leading metropolitan area in Italy and
fifth in Europe. More than 1.3 million people live in the city of Milan, the core of the area.
The Piacenza Province (NUTS-3 region) is placed on the north-south corridor linking the city of
Milan with the rest of the Peninsula (Florence, Rome, Naples, etc.). The location makes the
Province especially influenced by the city of Milan, in terms of historical and economic aspects.
The province has about 288,000 inhabitants with a total area of 2,589 km².
Parma is one of the main cities in the Italian region of Emilia-Romagna (NUTS-2 region), capital
of the Province of Parma (NUTS-3 region). The area is characterized by flat countryside,
bounded west and east by two minor rivers marking the separation from the neighbouring
provinces of Piacenza and Reggio Emilia. Parma is placed on the North-south corridor linking the
city of Milan with the rest of the Peninsula. The city has about 180,000 inhabitants over a total
area of 261 km².
The Province of La Spezia (NUTS-3 region) is one of the four provinces of Liguria Region (NUTS-
2 region). The province has an area of about 881 km², and a total population of 223,503.
The spatial structure
The case studies in the macro region cover different types of land structures. Milan Province is a
flat and densely populated metropolitan area. In the Province of Piacenza flat countryside, hills
and small mountains alternate. Most of the people live in the capital city while the rest of the
Province is characterised by sparsely populated rural areas and small towns. Parma is a medium
size town surrounded by a low density peripheral area gravitating around the main centre. The
Province of La Spezia is characterized by diverse geographical areas: first, the gulf and the
seaside, the hills around the Magra valley (Val di Magra) and the hinterland mountains crossed
by various valleys. Like in all Ligurian provinces, land area is characterized by mountains and
hills, while plains are statistically undetectable. Less than one half of population lives in the capital
city while the rest is concentrated in many towns with rural characteristic, most of which is
located in hilly areas or foothills.
Socioeconomic portrait
The four case studies belong to Northern Italy, which is largely the most developed and rich
macro region in Italy. In particular, Milan is the most important economic area at Italian level with
more than 300,000 firms located (corresponding to about 42 % of the activities in the Lombardia
Region and 6 % of the Italian firms) generating nearly 10 % of the Italian GDP. Beginning with
1970s, the heavy industrial production decreased making room for the growth of services and
tertiary activities, particularly if qualified and with high value added. 15 % of Italian firms related to
the high-tech sectors resulting in about 30 % of employment in such sectors are located here.
During the 1990s technologic progress and global economy modified the traditional structure of
the production which is based now on a wide network of small firms together with a slight number
of medium firms. Currently, most of the firms and jobs are related to the service sector (about 69

ESPON 2013 57
%), while the industrial sector covers about 28 % and agriculture 2 % only. Nevertheless, the high
level of mechanisation and productivity of the agricultural sector gives it an important role in the
economy of the area despite the low number of jobs.
The economic structure of the Piacenza Province is primarily based on the industrial tradition of
the area, developed by small and medium-sized firms mainly focused on manufacture products
(including about 33 % of people working in the Province). Other important activities for the
economy of Piacenza are related to trade, services and construction sectors (respectively 22 %,
11 % and 10 % of workers).
Parma economy stands on the ground between all the Italian cities for the significant
interpenetration between agriculture and industry. Parma farmers (located in the Province)
produce food for industrial purposes: tomatoes, peas and sweet corn for canning, milk for the
dairy industry, the first among others the production of Parmigiano Reggiano cheese and
Prosciutto di Parma (Parma ham). The mechanical industry of the area of Parma is the national
leader in the production for industrial processing of agricultural commodities: equipment for the
canning industry, milk processing system, etc. In addition, two large multinational food companies
are located in Parma and its surroundings. Also, several large chemical and pharmaceuticals
multinational companies are located in Parma.
The economic structure of the La Spezia Province developed thanks to the Naval Military base,
located there since the second half of the nineteenth century. The gradual disengagement made
by the Navy in the area which begun in the eighties and is still ongoing has caused a critical
period for La Spezia economy, impacting negatively also on demographics aspects. Currently,
many efforts are still ongoing to promote new economic growth in different sectors: many military
areas have been converted for civil use, especially in the field of yachting, strongly in expansion
in this period and tourism is becoming a key point of the economy of the Province of La Spezia. In
terms of value added, agriculture accounts for 2 % while services sector covers more than 80 %
of the total amount; the residual part is in charge of the industrial sector.
Transport aspects
Transport infrastructures and services are generally well developed in Northern Italy, despite the
high population density coupled with many small firms and residences spread all over the territory
generate a large amount of transport demand that gives rise to congestion problems.
For this reason, especially in the Province of Milan additional road infrastructures are planned for
the next future, namely:
- the Brebemi motorway, linking the city of Milan to Brescia via Bergamo;
- the “Pedemontana” motorway, connecting the A4 motorway from Dalmine to the Malpensa air-
port crossing the provinces of Lecco, Monza and Como;
- the Outer Ring Road in the eastern part of Milan, planned to relieve the traffic on the A1 motor-
way directed towards the A4 motorway and vice versa.
Demand is largely concentrated around the city of Milan. More than 800,000 trips enter in the city
every day, mostly concentrated during morning peak hours (about 27 % between 8 a.m and 9
a.m.). Most of the trips attracted from the city are made by private car (60 %), while train and bus
are used for 21 % and respectively 8 % of the trips. The railway network is quite extensive and is
managed by different entities: the Ferrovie dello Stato and Le Nord (in the northern area of
Milan). The extra-urban rail system is pivoted around the Milan Central Station and Milan
Cadorna Station. Three airports (Linate city airport, Malpensa and Orio al Serio) serve the
metropolitan area.

ESPON 2013 58
The Province of Piacenza is located in a strategic place on the North-South corridor linking the
city of Milan with the rest of the Peninsula (Florence, Rome, Naples, etc.). Nevertheless, it could
be considered strategic on the West-East corridor as well, being on the road corridor linking Turin
and Liguria region with Brescia and the Eastern part of Italy bypassing the Milanese pole.
Therefore, the city of Piacenza in particular can be considered a strategic railway and motorway
junction. The Province does not have an airport on its territory: the nearest are those of Parma
and Milan.
The city of Parma is the pivot of local mobility and passengers commuting to or within the city
predominantly use private transport modes (about 59 % cars, 7 % motorcycles), while public
transport modes are used for about 16 % of the commuting trips (12 % by bus, 4 % by train).
Bicycles are used for more than 10 % of trips. For the connection with external regions, Parma is
well served by motorway and rail networks. A small airport (about 70,000 passenger/year) is also
existing providing several national (and few international) connections for passenger transport.
The Province of La Spezia is crossed by two main motorways: motorways A15 connects the
province to Parma, while motorway A12 links La Spezia to Genoa and Livorno. As well, there are
two railway lines on the territory of the La Spezia Province: the line from Parma to La Spezia and
the line from Genoa to Rome.
The Province does not have an airport on its territory: the nearest ones are those of Genoa and
Parma.
Expected results
For each of the four cases studies a multimodal transport model is available. The four models
have been developed independently, with specific features as far as elements like demand
segments, transport modes etc. are concerned. Nevertheless all models provide results on
transport generalised cost and attractiveness for a zoning system at NUTS-4 level or lower (within
for the municipalities of Milan, Piacenza, Parma and La Spezia) and for origins and destinations
outside the areas of the case studies. These elements will be available for producing accessibility
indicators at the local level.
Bavaria regional case study
The macro region
The Federal State of Bavaria is located in the southern parts of Germany. With an area of about
70,500 km², Bavaria is the largest NUTS-1 region in Germany. With a total population of 12.5
million people it is the second largest state of Germany, only the high-density state of North
Rhine-Westphalia has more inhabitants. Bavaria consists of seven NUTS-2 regions, 96 NUTS-3
regions and 2056 municipalities (LAU-2 regions).
In the macro region of Bavaria there are very different types of regions included ranging from a
high-density monocentric agglomeration and medium-sized polycentric agglomerations via semi-
urban surroundings of the agglomerations to rural structures with small and medium-sized cities
which include also mountainous areas, in particular the Alps.
Spatial structure
Munich is the capital of Bavaria and the largest city with a population of more than 1.3 million in
the municipality and about 2.5 million in the agglomeration. Nuremberg with about 0.5 million
inhabitants and Augsburg with 250,000 inhabitants follow next, but are clearly smaller in size.
There are only five more cities with a population of slightly more than 100,000. Two thirds of the

ESPON 2013 59
population live in small and medium-sized cities and rural areas of less than 20,000 inhabitants
per municipality.
Consequently, the spatial structure of the macro region of Bavaria is very heterogeneous. The
agglomerations of Munich and Nuremberg are major centres in a more urbanised arc starting in
the north-west of Bavaria and running through the two agglomerations towards the south. From
this arc towards the outer boundaries of Bavaria, the regions are getting less dense, more rural
and peripheral. In terms of area size, rural areas are dominating the macro region of Bavaria.
Socio-economic portrait
Bavaria is considered to be one of the most successful regions of Germany during the economic
transformation in the last decades. Since World War II Bavaria developed from an agrarian
economy to a high-tech economy with a concentration of modern industries in and around the
larger cities. GDP growth rates of Bavaria were usually higher than for Germany as a whole.
Compared to the average GDP (in PPS) of EU 27 the index for Bavaria is about 135.
Unemployment rates in Bavaria are the lowest in Germany and currently little above 4 percent.
Consequently, Bavaria has experienced steady population increases during the last decades
which are based on a positive migration balance, in particular also with all other German states.
Transport aspects
As most German regions, the macro region of Bavaria is very well served by the national
motorway network in which major investments have been made during the last decades. Within
Bavaria, a mesh-like motorway structure with only very few remaining gaps is connecting the
different parts of the state. Several motorways lead to other parts of Germany as well as to
international destinations such as Prague, Vienna or via the Brenner motorway to northern Italy.
The motorway network is amended by a dense system of national and state roads connecting
also small and medium-sized towns.
The public transport network is based on a relatively dense rail network system composed of
high-speed train services and regional and local train services. However, as in other parts of
Germany, the rail services in Bavaria were reduced in rural areas whereas agglomerations partly
saw investments in new infrastructure and services. The rail network is amended by tram and
underground networks in the agglomerations and by a dense bus network serving small and
medium-sized cities and rural areas. However, the frequency of many bus lines serving rural
areas is rather low so that some areas are only served in connection with bus transport of pupils
to school
Less important for the analysis of regional and local accessibility patterns are the air and
waterway connections of Bavaria. The Munich airport located more than 30 km northeast of the
city centre is one of the major German airport hubs and serving many national, international and
intercontinetal destinations. Though located far away from the sea, Bavaria is well integrated into
the European inland waterway system. Via the navigable rivers of Main flowing into the Rhine and
the Danube and the connecting Main-Danube-Canal Bavaria has waterway links to ports located
at the North Sea as well as at the Black Sea and the eastern parts of the Mediterranean Sea.
Expected results
The accessibility model will be set up for the entire macro region of Bavaria. Modes addressed
are road and public transport. The road network includes all roads including all residential streets.
The public transport network is derived from the public transport time table covering all public
transport services in Bavaria including all rail, underground, tram and bus services. The raster

ESPON 2013 60
model will be run for a raster representation of the Bavarian territory. For this, Bavaria was
disaggregated into some seven million raster cells of 1 ha in size. Population was also
disaggregated to these raster cells.
The accessibility model for the Bavarian macro region will be able to compute a wide variety of
accessibility indicators to be specified in the course of the TRACC project. Results can be
presented for the raster level and can be aggregated to municipalities. Results will be presented
for the whole macro region, but in more spatial detail also for some selected specific types of
regions. For this, four zoom-in case study areas within the macro region of Bavaria are foreseen:
- The Munich region will give insights into accessibility patterns in a huge urban area with a
monocentric spatial structure.
- The Nurenberg region will provide knowledge about accessibility patterns in a medium-sized
urban area with a polycentric spatial structure.
- The Allgäu region in the south-western parts of Bavaria including parts of the Alps and its foot-
hills will depict accessibility patterns of rural and mountainous areas.
- The Donau-Wald region in the eastern parts of Bavaria will provide findings concerning the ac-
cessibility situation of rural areas.
The accessibility analysis for the case study macro region of Bavaria and the zoom-in case
studies will provide understanding of regional and local accessibility patterns for a variety of
regional types including large agglomerations, urban-rural settings, rural areas and mountain
areas. By having a precise representation of road and public transport networks, the differences
of accessibility pattern for the two modes of transport in the different types of regions will become
visible.
Czech Republic regional case study
The macro region
The Czech Republic is a landlocked country situated in Central Europe. Its area comprises the
historical territories of Bohemia, Moravia and a part of Silesia. It shares borders with Poland (762
km), Germany (810 km), Austria (466 km) and Slovakia (252 km). The capital city is Prague. The
area covers 78,864 km² (21st position in Europe) with a population of 10.3 million (12th in
Europe). The average density of population is approximately 130 inhabitants/km². The Czech
Republic is located between two mountain systems. The western and central parts of the country
include the Czech Highlands, the eastern part is formed by the Carpathian mountain range.
The spatial structure
The Czech Republic can be divided into lower (municipalities) and higher (regions) territorial self-
government units. In 1997, a constitutional act established higher territorial self-government units
(the regions), which did not correspond to the regional demarcations valid between 1960 – 1989.
However, this act did not regularise the organisation or the structure or competences of bodies at
the regional level. Therefore the regional system functioned at the beginning only formally (de
iure). The state administration and self-government started to work at the regional level as late as
the autumn of 2000 (de facto). It means since the year 2000 the Czech Republic has the new
administrative structure - 14 Regions (NUTS-3).
Municipalities administer their territories within the framework of independent competence.
Besides, they execute delegated competences on behalf of the state. Within their self-
competence, all municipalities and towns have equal rights and obligations. Execution of the

ESPON 2013 61
delegated competences depends on the size of the municipality and the territory it administers.
Municipalities are divided into three groups, according to the scope of delegated
- Municipalities with the basic range of the transferred competency – of which there were 6 249
municipalities as at the 1st January 2008.
- Municipalities with authorised municipal offices – 388 municipalities whose municipal offices
exercise transferred competency, especially in the domain of offences, construction administra-
tion and agricultural land resources.
- Municipalities with extended powers – 205 municipalities, which exercise in their territory the
largest range of the transferred competency especially in the domain of issue of passports, driv-
ing and trading licences, waste management, transport and road management etc.
Besides these in the Czech Republic, there are some municipalities with registry offices (900),
with construction offices (722) and with tax offices (223). It is obvious that the recent structure of
state administration is complicated and too complex for its inhabitants.
The Czech Republic is characterised by a fragmented structure of its settlements, with a
historically given high number of municipalities. As was mentioned above there is a great number
of municipalities in the Czech Republic of which only a minor part can be regarded as towns
based on international standards. Nonetheless the urban areas play an important role in the
development of the entire regions. From the functionality viewpoint, the following urbanised areas
can be identified: Prague agglomeration, East-Bohemian agglomeration, North-Bohemian
conurbation, Liberec – Jablonec nad Nisou, Plzeň, České Budějovice, Karlovy Vary, Ostrava
agglomeration, Brno agglomeration, Central-Moravian conurbation, Zlín.
With regards to the potential for further development, the Czech spatial development policy
defines 12 main development areas. Far more frequent requests are made for zoning changes in
the following areas because they are centres for international or nationwide businesses: Prague,
Ostrava, Brno, Hradec Králové – Pardubice, Plzeň, Ústí nad Labem, Liberec, Olomouc, Zlín,
České Budějovice, Jihlava and Karlovy Vary. These development areas are linked by 11
development axes.
Socioeconomic portrait
Regional development and differences in the Czech Republic are strongly influenced by a unique
position of Prague in the Czech economy. The capital city of Prague (NUTS-2 region) is currently
one of the most dynamic and most successful regions of Central Europe. Prague is a key
administrative centre in the Czech Republic and has a modern services economy, specialising in
financial services and activities related to tourism. As the largest city by far in the Czech Republic,
it is also the location of the main national companies and the principal bodies concerned with
scientific research and education. Prague has become a favoured destination for foreign banking
activity during the transformation period and holds this position to present time. Prague belongs
among the five wealthiest regions in the whole European Union. At the same time Prague is the
wealthiest regions from the new members EU. On the other hand Prague has also number of
serious problems typical for high metropolitan regions as for example disrupted environment,
transport problem (traffic jam), pollution, criminality etc.
The remaining NUTS-2 regions in the Czech Republic can be placed in four groups.
- Regions with strong economic growth that are catching up with the EU average: South-West
(Jihozápad) and Central Bohemia (Střední Čechy)
- Regions of low-moderate economic growth: South-East (Jihovýchod) and North-East
(Severovýchod)

ESPON 2013 62
- Regions lagging because of very slow growth: Central Moravia (Střední Morava)
- Declining regions: Moravia-Silesia (Moravskoslezsko) and North-West (Severozápad)
Czech NUTS-2 regions are always made up of two or three NUTS-3 regions. NUTS-2 regions are
only statistical units without self-government and responsibility. On the other hand NUTS-3
regions (kraje) play a key role in the regional development.
Transport aspects
Due to its position in Central Europe, the Czech Republic is well-advantaged to make the most of
its good transport accessibility. The country is indeed covered with a dense network of railways
and roads, but it does not always meet the standards expected from transport.
Since 1990 the shares of the various modes of transport have transformed substantially, in
relation with a general transformation of the society and the country‟s accession to the EU. The
greatest decline in performance, and the volume carried, was noted by the railway, by public road
transport (passenger), and water transport. On the other hand, transport by heavy trucks over
12.5 tonnes increased substantially, as well as individual passenger and air transport. The
performance of all the transport modes with a negative impact on the environment increased.
Expected results
Accessibility analysis will be performed in the Czech Republic for a NUTS-5 resolution.
Accessibility analysis will include time accessibility (rail and road) to airports and important
economic settlement centres as well (which will be chosen). These analyses will provide images
of accessibility in different types of Czech regions (urban and metropolitan regions, rural,
mountain and periphery regions etc.), the final selection of case study areas within the macro
region still has to be made. Analysis could also show the accessibility in these types of regions to
main services (health, schools, administrative services etc.).
Poland regional case study
The macro region
Poland is a country located in Central Europe. It covers an area of 312,685 km² that makes
Poland the ninth largest country in Europe. Since the beginning of the 1990s population of Poland
has remained rather constant in size and equals about 38.1 million people (ranks eighth in
Europe and sixth in the European Union).
The territory of Poland has been divided into arbitrary 6 NUTS-1 regions (regiony) and 66 NUTS-
3 subregions (podregiony) for statistical purposes. The 16 NUTS-2 units correspond to the 16
voivodships (województwa). The voivodships are divided into 379 NUTS-4 districts or counties
(powiaty) including 65 cities with powiat status. The powiats are further subdivided into 2478
NUTS-5 municipalities or communes (gminy). The gmina is the basic unit of the country‟s
territorial structure. The gmina, powiat and voivodship councilmen as well as mayors of rural
gminas, mayors of urban gminas and mayors of major cities are elected in general, equal, direct
election.
The northern border of Poland runs partly (about 440 km) along the Baltic Sea coast. Poland
shares the rest of the border (3511 km) with its 7 neighbouring countries including, since 2004,
1908 km of internal EU border (since 2007 within the Schengen zone border) with Germany,
Czech Republic, Slovakia and Lithuania and, since 2007, about 1163 km of new Eastern
Schengen border with Ukraine, Belarus and Russia. The Sudety Mountains are located on the

ESPON 2013 63
Polish-Czech border and the Carpathian mountains are along Poland‟s border with Slovakia.
However, the majority of the country is a lowland.
The spatial structure
The Polish urban system is characterized by a polycentric structure. In comparison with other
European countries‟ urban systems, the capital of Poland (Warsaw) is less dominant in the Polish
urban hierarchy. Population of Warsaw is about 1.7 million people (only 4.5 % of the total
population of the country). Besides Warsaw, the population of Kraków, Łódź, Wrocław and
Poznań is more than 500.000 inh. and in 12 other cities population exceeds 200.000 inh.
The NUTS-2 population density differs from 59 persons per km² in north-eastern Poland
(Warmińsko-Mazurskie and Podlaskie voivodships) to more than 200 persons per km² in the
south-central of a country (217 persons per km² in Małopolskie and 377 persons per km² in
Śląskie voivodships). The average population density in Poland is about 122 persons per km².
Socioeconomic portrait
During the last two decades Polish GDP has expanded rapidly and Poland climbed up the ranks
to the sixth in the EU in terms of real GDP (PPS-based). The Polish economy avoided a decline
in GDP during the financial crisis and has created in the EU the highest GDP growth in 2009.
However, the restructuring of heavy industry and agricultural sector after 1989 led to the higher
rate of unemployment (20 % of the economically active population without job in 2002-2003). In
the following years the situation has improved and the unemployment rate decreased to the level
of 9.5 % in 2008. However, due to the financial crisis, it has increased once again to 11.9 % in
2009 (in the Warmińsko-Mazurskie voivodship still exceeds 20 %).
Poland‟s large internal market of 38 million consumers could help in being more independent of
world economy than the rest of Eastern European countries. However, as early as 1995, 70 % of
Polish export was directed to EU members (particularly to Germany).
The GDP structure is formed mainly by the service sector (65 %), followed by the industry (32 %)
and agriculture (3 %). The overemployment in agriculture (about 15 % of the workforce),
particularly in the eastern parts of the country, still remains an obstacle to modernisation.
Spatial structure of industry in Poland has its roots in the time when Poland was partitioned by the
Prussian, Austrian and Russian empires. The western and southern parts of Poland became
more industrialized than the central and eastern ones (with exception of metropolitan areas and
Świętokrzyskie voivodship). Despite the strong decline of coal mining and metallurgy in terms of
employment, the main industrial part of Poland remains industry conurbation of Upper Silesia
voivodship. The automobile industry has developed to a considerable extent in the south-western
Poland but most of the headquarters and foreign direct greenfield investments are located in
Warsaw and its surroundings or in the other largest metropolitan areas.
For several years Poland has experienced a large amount of emigration to the UK and Ireland
where 1 million Poles outnumber the other Eastern Europeans.
Transport aspects
Before 1989 the Polish transport system was characterized by freight traffic flows in the east/west
direction between Soviet Union and GDR and in the north/south direction between Polish
harbours and the Upper Silesian coal region. After 1989 the decline in freight transport and the
rapid increase in the private mobility and the motorization rate (much faster than GDP growth) led
to more than 400 motor vehicles per 1000 inhabitants in 2008. In spite of this process, the 1990s

ESPON 2013 64
was the decade of further delay in major decisions concerning transport infrastructure
investments. After 2000 Poland is making up for the lost time being in the process of the biggest
national motorway construction program in Europe.
The traffic is particularly concentrated in high population density areas – the Upper Silesia region
and Warsaw. The highest traffic is observed on the international roads: existing motorway
sections of the A4, A2 and A1, on E-75 (Upper Silesia-central Poland section) on E-77 (from
Gdańsk through Warsaw to Kraków) and on E-67 from (Wrocław through Warsaw to Polish-
Lithuanian border). The main transit road is the route from Germany through Poznań and Warsaw
to the Baltic States.
Poland suffers from lack of proper railway infrastructure. The large decrease of technical speeds
on many railway lines led to the modal shift from rail to road. According to the government's plan
Polish high speed railway will run from Warsaw to Poznań, Wrocław and Łódź (Y line) in 2020.
Poland's regional airports are catching up with the country's main airport in Warsaw after the
accession to the EU (nearly 55 % of all 20.8 million passengers in Polish airports flew through
regional ones in 2008). The main flight destinations are UK and Germany.
The harbour cargo operations, which are decreasing in recent years, are concentrated in Gdansk
and Gdynia (Pomorskie voivodeship), and on a smaller scale also in Szczecin and Świnoujście
(Zachodniopomorskie voivodeship).
Expected results
Accessibility analysis will be performed in Poland on the NUTS-5 level (isochronic accessibility
measure to main cities, road and railway networks, airports and ports) and on the NUTS-4 level
(road and railway potential accessibility). The results of the accessibility study will provide a
knowledge base on important difference in accessibility results obtained from European and
national perspective, particularly in case of south-western part of Poland (lack of motorway and
good railway connection to Warsaw and excellent accessibility to European core). The following
in-depth case studies are planned:
- Warsaw is developing very fast while its road accessibility is poor; it will change in 2012 after
the realization of the A2 motorway section to Warsaw.
- Dolnośląskie is chosen due to the lack of motorways, but the good railway connection to War-
saw and excellent accessibility to European core areas.
- Zachodniopomorskie (or Pomorskie) will be studied for their interest due to the existence of
ports, regional airports, fragmented motorway sections and foreseen accessibility changes in
the next decade.
- Małopolskie includes the tourist destinations of Kraków (relatively good accessibility) and Po-
land‟s most popular mountain resort Zakopane (poor accessibility).
Scandinavia regional case study
The macro region
While the countries of Norway and Sweden will be considered as the macro region, there will be
three regional case studies in each of the two countries: Tromsø in the far North and Trondheim
represent „fjord Norway‟, with their specific topographic situation between the sea and the
mountains in the backyards. Both cities represent regional centres offering all public and private
services, with extremely low population density around. The cities of Tromsø and Trondheim itself
experiences population increases over the last decade on the expense of population losses in the

ESPON 2013 65
regions around. Lillehammer is chosen as a representative example of a winter sports resort in
„mountain Norway‟ with linear settlement structures along the valley, and mountain areas around.
Lillehammer, being the regional centre in the heart of the mountains, also offers a wide range of
public and private services; unlike Tromsø and Trondheim, there is quite a large number of small
villages and second home areas in the hills around Lillehammer, leading to quite big differences
between summer and winter residents.
Østersund and Falun/Borlänge are selected as typical Swedish examples of regional cities, both
covering water areas and extensive forest areas, but with distinct urban settlements in between.
Both cities represent the regional centre for public and private services and facilities, with only
small villages in their hinterland, and a remote location in the national context. Both case study
area experienced population losses over the last decade. Örebro is selected representing a major
centre in the heart of Sweden, in between the great lakes of Vänern and Hjälmaren, with good
transport connections to both Stockholm in the East and Gothenburg in the south-west, and with
a stable population. Unlike the other two Swedish examples, there are a number of other
medium-size towns and centres in rather close proximity to Örebro (for instance, Arboga,
Eskilstuna, Linköping, Karlskoga).
The spatial structure
From a European perspective, Norway and Sweden are considered as peripheral regions with
extremely low population densities, long distances, low density of transport infrastructures,
extensive forest areas and barren lands. From a regional perspective, there are, though,
important differences in the settlement structures of these regions, and also the major modes of
transport differ widely.
Earlier studies on the Nordic countries revealed very distinct settlement patterns in the Nordic
countries (Gløersen et al., 2006). The example given is that within a 50 km radius cities might
have the same population potential and overall population density, however, based on very
different types of settlement structures. While in the example of Mikkeli (Finland) basically all the
territory is populated except for water areas with extremely low number of residents per 1x1 km
grid cell, in case of Östersund (Sweden) there is a clear distinction between the extensive urban
area, with partly very high numbers of residents per 1x1 km grid cell, and no residences in the
surrounding wilderness; finally due to the difficult topographic situation with fjords and mountains
around Tromsø (Norway) only few places along the fjords and valleys are populated, while the
other barren land remains unpopulated. Such very different settlement structures in the Nordic
countries will result in different accessibility patterns, which will be analysed in this case study.
Transport aspects
The main modes of transport differ significantly between the case study regions. While all
Swedish case study areas are well embedded into railway and national road networks,
connecting the cities in all directions, only Trondheim and Lillehammer in Norway have rail
access, but with only one (Lillehammer) or two (Trondheim) rail links. Even though only Örebro
has direct connection to motorways, the Swedish major road networks can be considered as
rather dense with a even higher density of complementary secondary roads, compared to the
Norwegian ones, where there are only few major routes, connecting through the valleys, which
almost lack any secondary roads, in consequence of the difficult topographic conditions. In turn,
the regional airports of Trondheim and Tromsø play a major role in the Norwegian airport system,
so as all airports in Norway, with a very high number of daily flights to Oslo and other
destinations. Flights to these destinations are, moreover, subsidised by the Norwegian
government to ensure accessibility of these remote areas. The cities of Östersund,

ESPON 2013 66
Falun/Borlänge and Örebro also have airports, but with less importance (in terms of number of
flights and destinations served).
Expected results
The accessibility model will be set up for the entire macro region (i.e. Norway and Sweden),
including road, railways, ferry and flight connections and tramways and subways. The spatial
base level will be a 1x1 km raster grid, for which travel times and accessibilities will be calculated.
The raster results will then be aggregated to municipality level. Based on this overall computation,
the analysis will zoom into the six regional case study areas to reveal small-scale local and
regional accessibility patterns. The results will be compared not only between the six case
studies, but also to the other parts of the macro region.
Finland regional case study
The macro region
Finland is the eighth largest country in Europe in terms of area and the most sparsely populated
country in the European Union. Around 5.4 million people live in Finland, with a majority being
concentrated in the southern part of the country. Situated in the Fennoscandian region of
Northern Europe, it is bordered by Sweden, Norway and Russia, while Estonia lies to its south
across the Gulf of Finland. Finland is a country of thousands of lakes and islands (almost 200.000
lakes and 200.000 islands), mostly flat with few hills, being its highest point the Halti at 1.324
metres in the northern tip of the country. In addition to the harsh climate, the amount of population
and economic activities have remained low due to the fact that the topography of the region
poses serious challenges to accessibility.
The selected case study areas will provide insight on the Helsinki metropolitan area, the Lapland
region and the Oulu region.
The spatial structure
Around 5.4 million people live in Finland, with a majority being concentrated in the southern part
of the country. The Greater Helsinki concentrates 25 % of the country‟s population, including
three cities with more than 100,000 inhabitants (Helsinki, Espoo and Vantaa). Other major cities
in the region are Tampere (210,000 inhabitants), Turku (175,000 inhabitants), Oulu (140,000
inhabitants), Jyväskylä (130,000 inhabitants) and Lahti (100,000 inhabitatns). There are no other
cities other than these with more than 100,000 inhabitants.
The Helsinki metropolitan region, roughly corresponding to the NUTS-3 level region of Uusimaa,
consists of 18 municipalities with a totall population of around 1.4 million people, making it the
most densely populated region in Finland. Most of the population lives in the capital city of
Helsinki and its three immediate neighbour cities. Due to being located at the coast along the Gulf
of Finland, the region encompasses a large number of islands of different sizes, but they do not
have any significant demographic role. Generally, the population density decreases fast as one
moves away from the city of Helsinki. The main transport corridors of course make exceptions to
this.
The Oulu region consists of ten municipalities located within the NUTS-3 region of Northern
Ostrobothnia, located in the mid of Finland on the shores of the Bothnian Bay. Oulu, the main
municipality of the region, has a population of about 140.000 inhabitants, making it the most
populous city in Northern Finland. The region is characterised by a single and relatively small
urban centre surrounded by rural areas. The population density drops rapidly as one moves away

ESPON 2013 67
from the city of Oulu, and large areas in the region are totally unpopulated. Settlements have
concentrated historically at the coast and at the mouths of rivers, a pattern which remains even
today, although a distinctive semi-urban area has been formed around the city of Oulu.
The NUTS-3 region of Lapland is the northernmost region of Finland, being a vast region
constituting almost a third of the entire country but housing only 180.000 inhabitants, a half of
which is concentrated in the three biggest population centres. This signifies that most of the
region is extremely sparsely populated, and indeed, large areas of the region are totally
unpopulated. The region of Lapland consists of overall 21 municipalities, which differ significantly
both in their area and population. The largest population centres are located in the south-western
part of the region, positioned mostly at the mouths of the great rivers running into the Bothnian
Bay. The northern parts of the region are extremely sparsely populated with only small local
centres.
Socioeconomic portrait
Helsinki‟s metropolitan region is Finland's major political, educational, financial, cultural and
research centre. Approximately 70 % of foreign companies operating in Finland have settled in
the Helsinki region. The employment rate in the region is high: 63 %, which is considerably higher
than in the rest of the country (57 %). Indeed, the region is more than self-sufficient in jobs.
Currently less than one percent of the population work in agriculture. Industry and services
account for 18.6 % and 80.8 % of the workplaces, respectively. The share of the industry has
been in constant decline for several decades, which is compensated by the growth in services-
related activities. The region accounts for about 35 % of the entire GDP of Finland. The GDP per
capita is over 46,000 € which is 135 % of the national average.
Most of the people in the Oulu region work either at the service sector (75 %) and industrial
sector (24 %). Traditionally the economy of the region has relied on the wood-processing
industry, which has benefited from the location close to the rivers. The relative importance of the
traditional industry has been in constant decline, and has been replaced especially by high-
technology industry. However, the industries have suffered from the economic downturns during
the past decade, resulting in relatively high unemployment (14.5 %), which is four percentage
units higher than the national average, especially among young people. However, related to the
fact that the age structure is tilted towards younger generations, which can be regarded as a
potential socioeconomic advantage for the region. The population of the region has been in
constant increase for a long period of time, due to immigration from the peripheral areas of
Northern Finland, but also the result of a high birth rate. Specifically, the population growth has
been strongest in the neighbouring municipalities of Oulu, and Oulu itself.
The region of Lapland is generally considered to be one of the least developed and most
peripheral parts of Finland, where many socioeconomic problems are apparent. For example, the
unemployment rate is several percentage points higher than the national average, and is the
second highest among the NUTS-3 regions of Finland. Generally, the population of the region is
in steady decline, and the age structure is becoming increasingly older. The population of the
region peaked in 1993, but since then the amount of population has decreased by almost 20 000
people. The negative trend has affected the entire region, except for the regional capital and
certain individual population centres benefiting from the expanding tourism industry. While 6 % of
the population work in the agricultural sector, 14 % do so in industry and construction, and
services account for the major share of the sources of livelihood. Tourism in particular has
become an important form of economic activity during the past few decades. Although the role of
industry has been in slow but steady decline, two paper mills and a large steelworks operate in
the south-west corner of the region.

ESPON 2013 68
Transport aspects
Due to its position as the capital of Finland since early 19th century, Helsinki and the surrounding
region is well connected to the rest of the country by roads, railways and air traffic. Especially the
railway network has been designed to connect Helsinki efficiently to the regional centres around
the country. The region includes the main international airport of Finland, located remotely from
Central Europe, while serving as an important connection hub between Europe and East Asia.
The most important port of Finland is also located in the region as well. In addition to very busy
freight traffic, there are passenger ferries operating mostly to Stockholm in Sweden, and Tallinn in
Estonia. Domestic passenger traffic by the sea is, however, almost non-existent.
The Oulu region, In spite of being located far from the main populated centres of Finland, and
extremely far away from Central Europe, can be considered to be relatively well accessible, at
least in the national context. Finnish fast speed trains operate to Oulu, but the current condition of
the railway and the congestion of the route reduce the actual benefit of the high-speed traffic. The
shortest travel time from Oulu to Helsinki is 6 hours by train. Railway connections are also
provided to many other regional centres especially in the south, but not at very short intervals.
The Oulu region is also located advantageously with respect to the road network, as the most
important highway running from Helsinki up north through the entire country run through the Oulu
region. The region has the second biggest airport in Finland by passenger volume. Port of Oulu is
one of the busiest harbours within the Bothnian Bay, but it only handles freight traffic.
Lapland has significantly varying conditions accessibility and transport conditions within the
region. The south-western part of the region is well connected to the rest of Finland by the road,
railway and air connections. The eastern and northern parts of the region, however, are almost
solely accessible by road. Two big harbours are located in the industrialised south-west part of
the region, serving the needs of the heavy industry. Unlike any other region in Finland, Lapland
has transborder connections to three other countries, but the low amount of population in the
northern regions of Sweden and Norway is a limiting factor to the volume of economic interaction.
Connections to Russia are relatively limited.
Expected results
Accessibility analysis will be performed at least at NUTS-5 resolution; the use of more accurate
resolutions is an option. Accessibility runs will include accessibility by road and rail, possibly also
including airline connections.
The case of Helsinki region is an illustrative example of high and good quality of accessibility in
spite of the physical remoteness. The typologies associated with this case study include at least
urban and semi-urban areas, in the northern context.
The Oulu region in Northern Finland represents the case of a competitive growth centre located
high up in the north. The region is particularly interesting from the accessibility point of view in the
sense that the urbanised area is closely surrounded by deeply rural and peripheral areas.
The region of Lapland represents a case of extreme periphery in the European context. The
importance of the accessibility in this kind of periphery should be taken in to account, due to the
difference in remoteness when compared to the rural regions in the rest of Europe, and also the
remoteness in the local habitation structure and infrastructure. The accessibility of these regions
remains a relatively unstudied question.

ESPON 2013 69
7 Assessment of data situation
In the initial project phase the current data situation with respect to trans-European transport net-
work databases and socio-economic data has been assessed and evaluated. The availability of
the required input data for the accessibility models is crucial for the overall success of project.
7.1 Network data
Several Europe-wide transport network data sources were identified that potentially could be
used for Europe-wide or regional modelling in ESPON TRACC:
- ESPON local data (ESPON LD)
- ESRI´s Digital Chart of the World (DCTW)
- Eurostat GISCO/DG Move
- Navteq
- OAG
- OpenStreetMap (OSM)
- RRG GIS Database
- TeleAtlas
- TRANS-TOOLS
- Eurogeographics (not included here because of too late arrival of information)
The list of network data comprises open („free of charge‟) datasets (ESRI´s Digital Chart of the
World, OpenStreetMap), project datasets (ESPON local data, TRANS-TOOLS), European Com-
mission datasets (Eurostat GISCO/DG Move), as well as databases of commercial data vendors
(Navteq, OAG, RRG GIS Database, TeleAtlas). The databases were assessed by evaluation cri-
teria developed in the project (Table 6). The criteria reflect the potential of the network data for
European accessibility travel and freight modelling. Table 7 provides the assessment results.
Concerning the available modes, most of the datasets comprise road and railways; only TRANS-
TOOLS and TeleAtlas and RRG provide flight and waterway networks. Freight terminals are only
provided by RRG, TRANS-TOOLS and (to some extent) OSM. OAG, as a special data source for
aviation only provides flight networks.
The spatial coverage of the databases is generally good, except for the ESPON Local Data,
which only comprises the Czech Republic, Hungary, Romania and Slovakia, and the GISCO net-
works and do not provide data for the Western Balkan and east European countries. Data for
North Africa, as required by the freight model, are included in all data sources except for the
ESPON LC, GISCO and RRG networks.
The network density, however, is very different. ESPON Local Data, Navteq, OAG and TeleAtlas
can provide high network density, including all network links and nodes. OpenStreetMap provides
generally high network densities in Western Europe, but in other parts the density is poor in rural
areas. The RRG GIS Database covers all trunk roads, but secondary roads only for selected ar-
eas, whereas it contains all railways and all navigable waterways in Europe. DCTW, GISCO and
TRANS-TOOLS cover only major links resulting in a rather low network density.
Five data sources come with built-in network topologies (GISCO, Navteq, RRG, TeleAtlas,
TRANS-TOOLS), whereas ESPON Local Data, DCTW and OSM do not provide network topolo-
gies; consequently, the topology would need to be established.
Most of the data sources provide the network data for an actual year (Navteq, OAG, OSM, RRG,
TeleAtlas), for other networks this information is not available (ESPON Local Data, GISCO,
TRANS-TOOLS). A temporal dimension, i.e. network evolution over time, however, is only avail-
able with the RRG GIS Database.

ESPON 2013 70
Table 6. Criteria for the evaluation of Europe-wide transport network data
Criterion Comment
Modes:
road, rail (incl. stations), air (incl. airports), water-ways, ferries (incl. ports)
For the Europe-wide accessibility modelling all four modes indicated are required. In addition, specific types of facilities such as intermodal freight terminals are needed for freight modelling, and functional connector links are required to link the centroids to the networks, and to link intermodal networks with each other.
Spatial coverage The dataset needs to cover all countries of the ESPON space, plus EU candidate countries plus countries of the Western Balkan. Furthermore, external zones of the accessibility models cover Eastern European countries (Belarus, Moldova, Ukraine, Russia). For the freight model even countries in Northern Africa are in-cluded as external zones.
Network density The networks need to have a certain density which is sufficient to connect all NUTS-3 region centroids. At least all trunk roads, all railway lines and all navigable waterways and ferries need to be included, as well as all scheduled flights in Europe. The minimum network density required is the density used in accessibility potential modelling for ESPON projects 1.2.1, 1.1.1, 2.1.1, 1.1.3 and the recent Accessibility Updates.
Network topology In order to avoid time-consuming procedures in which usually errors in the data-base would be detected, the datasets should already include built-in network to-pologies, i.e. a correct topology between the links and nodes of a network.
Actuality The databases need to have sufficient actuality (2008-2011). Older reference years cannot be used. Some accessibility indicators as the potential accessibility need to be calculated for 2011.
Temporal dimension In order to assess the impacts of transport policies, scenarios of future transport infrastructures until 2030 or 2050 need to be available in the networks, based on the TEN-T and national outline plans. The SASI model covers also a backcasting period starting in 1981, requiring network input data in five year intervals from 1981 onwards to the present.
Attributes: link types, lengths, travel times (rail), speed limits, degree of urbanization (road), frequency (ferries, flights), IATA codes (air-ports), costs, capacities
All links in the networks need to have at least attributes providing information on link lengths, link speeds (either average speed, or maximum speed), for rail and flight networks even timetable travel times are needed. For ferries and flights in-formation on service frequencies is required as well. Based on this information, minimum paths based on travel time can be computed by the accessibility models. Ideally, also cost and capacity information is provided with the networks. Capaci-ties, however, can often be deduced from link types.
Data format In order to facilitate a smooth integration of the network database, the data should already be available in a GIS format (like ArcView shapefile, MapInfo tab file etc.). Raster formats or ASCII formats cannot be used.
Price Ideally the dataset should be usable free of charge by ESPON TRACC. High data costs may be an exclusion criterion for the dataset.
Legal restrictions Any other legal restrictions that need to be considered.
Continuity Previous ESPON projects (1.2.1, 1.1.1,, 2.1.1, 1.1.3 and the recent Accessibility Updates) already generated a number of accessibility indicators, where ESPON TRACC is expected to update these indicators. In order to enable reliable com-parisons of the updated indicators with the previous ones, input data with similar characteristics should be used to ensure continuity without artefacts.
General data availability Some datasets may, for any reasons, generally not become available to ESPON, even if they comply with all requirements.
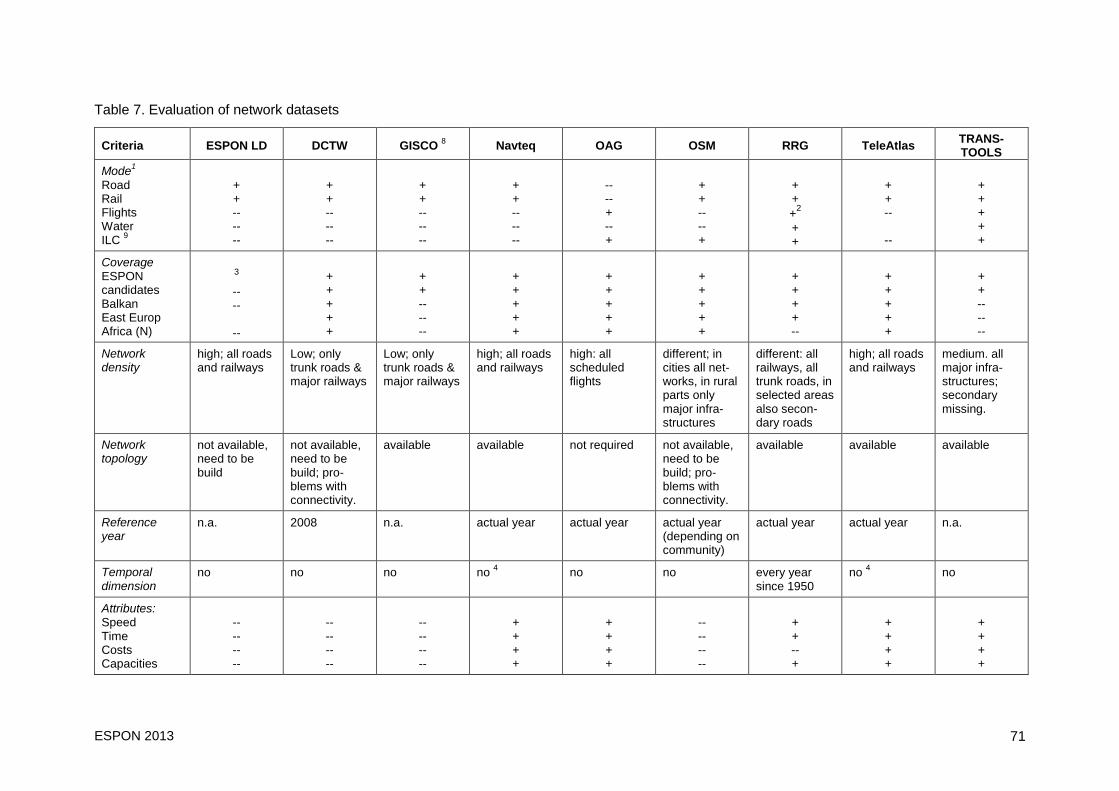
ESPON 2013 71
Table 7. Evaluation of network datasets
Criteria ESPON LD DCTW GISCO 8 Navteq OAG OSM RRG TeleAtlas
TRANS-TOOLS
Mode1
Road Rail Flights Water ILC
9
+ + -- -- --
+ + -- -- --
+ + -- -- --
+ + -- -- --
-- -- + -- +
+ + -- -- +
+ +
+2
+ +
+ + --
--
+ + + + +
Coverage ESPON candidates Balkan East Europ Africa (N)
3
-- --
--
+ + + + +
+ + -- -- --
+ + + + +
+ + + + +
+ + + + +
+ + + + --
+ + + + +
+ + -- -- --
Network density
high; all roads and railways
Low; only trunk roads & major railways
Low; only trunk roads & major railways
high; all roads and railways
high: all scheduled flights
different; in cities all net-works, in rural parts only major infra-structures
different: all railways, all trunk roads, in selected areas also secon-dary roads
high; all roads and railways
medium. all major infra-structures; secondary missing.
Network topology
not available, need to be build
not available, need to be build; pro-blems with connectivity.
available available not required not available, need to be build; pro-blems with connectivity.
available available available
Reference year
n.a. 2008 n.a. actual year actual year actual year (depending on community)
actual year actual year n.a.
Temporal dimension
no no no no 4 no no every year
since 1950 no
4 no
Attributes: Speed Time Costs Capacities
-- -- -- --
-- -- -- --
-- -- -- --
+ + + +
+ + + +
-- -- -- --
+ + -- +
+ + + +
+ + + +

ESPON 2013 72
Table 7. Evaluation of network datasets (continued)
Criteria ESPON LD DCTW GISCO 8 Navteq OAG OSM RRG TeleAtlas
TRANS-TOOLS
Data format Shapefile geodatabase
shapefile shapefile shapefile Web 5 shapefile Shapefile,
geodatabase shapefile shapefile
Price free free n.a. high free 7 free free
6 high free
Continuity compiled in other ESPON project, but no acc calc
--- internal EC usage (DG Move)
--- --- --- used to calcu-late previous ESPON acc indicators
--- used in vari-ous research projects
Data availabil-ity
yes yes Currently not avail., later WMS service
only upon licensing
huge efforts for data gath-ering from website
yes yes only upon licensing
yes
1 modes: required are routable modal networks, not just background layer.
2 flight network data collected by S&W in a previous study; however, flight networks tightly integrated into RRG GIS Database.
3 network data only available for Czech Republic, Hungary, Romania, and Slovakia.
4 upon request past years could be licensed separately
5 data to be extracted from website
6 free usage within ESPON TRACC project, since RRG is project partner
7 free when data manually compiled from website; otherwise license fee to be paid
8 information provided by Sorin Andrei (DG Move) on TENtec at a GIS Experts Meeting in Brussels, 7 July 10 (Andrei, 2010)
9 ILC = Intermodal logistics centre (intermodal terminal, freight village)

ESPON 2013 73
Relevant speed, time, cost and capacity attributes required for accessibility calculations can only
be provided by half of the databases (Navteq, OAG, RRG, TeleAtlas, TRANS-TOOLS), whereas
the other ones are missing any such information. Information on capacity, however, can also be
approximated from the link type fields (if available).
All databases offer the network data in a GIS format (ArcView shapefiles or Geodatabase). Ex-
cept for Navteq and TeleAtlas, all databases can be used for free in ESPON TRACC. However,
the GISCO datasets are currently not available, but at a later point in time GISCO/DG Move will
make the networks available as WMF service. Navteq and TeleAtlas data, as being two commer-
cial data vendors, need to be licensed for any usage. License fees depend on the actual scope of
usage, however, they can be generally considered as very high.
The RRG GIS Database and also the TRANS-TOOLS data have already been used in several
research projects, ESPON projects and consultant projects for various DGs of the European Un-
ion; the RRG data, moreover, have already been used to compute the previous ESPON potential
accessibility indicators, that way ensuring continuity if used in ESPON TRACC.
In Table 8 the detailed findings are evaluated. It is concluded that the TRANS-TOOLS database
should be used for modelling of European freight accessibility in TRACC, if necessary comple-
mented with additional information from the RRG GIS Database, whereas for modelling Europe-
wide accessibility travel the RRG GIS Database should be used (enriched with latest data for
flight networks). OSM and the ESPON Local Data may also provide additional information to
TRANS-TOOLS and RRG GIS Database. The TRANS-TOOLS network database is currently be-
ing updated and improved in the project ETIS+ with respect to the addition of international termi-
nals, improved interconnections between modes, and network topology of ferry lines and airlines.
Table 8. Summary of network database assessment
Data source Pros Cons Conclusions
TRANS-TOOLS, RRG
Free of charge, full coverage, all modes, required data for-mats, at European level suffi-ciently dense, already used in modelling, speed / cost / time info avail., network topology ok, RRG temporal, flexible
At regional level road net-works not dense enough
TRANS-TOOLS to be used as base network for freight modelling, RRG to be used as base network for travel modelling. RRG to com-plement TRANS-TOOLS with missing information
OSM, DCTW, ESPON Local Data
Free of charge, full coverage (except ESPON Local Data), road and rail modes, required data formats, OSM and ESPON Local Data sufficiently dense
Network topology problems, no info on speed / cost / time, no TEN info, no temporal dimension, no flight and wa-terway networks
OSM and ESPON Local Data to complement exist-ing network data for re-gional case studies, DCTW not to be used
Navteq, TeleAtlas, OAG
Full coverage, all modes except flights (Navteq, TeleAtlas), complete networks, topology ok, speed / time available, ac-tuality
No temporal dimension, com-mercial datasets, high prices, legal restrictions, no flexibility due to internal formats
Navteq & Teleatlas not to be used due to price and legal restrictions
GISCO / DG Move
Free of charge, full coding of TEN networks, full coverage except Western Balkans, road and rail modes, sufficiently dense for Europe-wide model-ling.
Currently not available, sev-eral required attributes not available
Currently data cannot be used

ESPON 2013 74
7.2 Socio-economic data
Potential data sources for the socio-economic data needed for the accessibility models are
- ESPON Database
- Eurostat Regio database
- National Statistical Offices
- Urban Audit
- Data at hand with project partners
First, existing data from the ESPON database will be investigated. If ESPON cannot provide cer-
tain datasets, the Eurostat Regio database or the National Statistical Offices will be reviewed.
Data from the Urban Audit and data available at the Project Partners may complement the data
collection.
The socio-economic data for the different models and analyses will be harmonised as much as
possible in order to avoid situations where different indicator results are tracked back to different
input data. Harmonisation will be done with respect to the following aspects: main data groups,
spatial level, spatial coverage, reference year(s) and temporal dimension.
Main data groups
Main data groups to be collected for the accessibility models include population data (total, by sex
and by age groups), employment (total and by sector), GDP (absolute, per capita), and number of
productive units and number of workplaces. Depending on the indicator selection in Task 1, other
data groups may be added if required in order to calculate certain types of accessibility indicators.
In addition, the SASI model to forecast impacts of transport policies requires additional simulation
data, which can be grouped into base-year data and time-series data (see Chapter 4.6).
Base-year data describe the state of the regions in the base year of the simulation (1981). Re-
gional base-year data provide base values for the regional GDP submodel and the regional popu-
lation submodel as well as base values for exogenous forecasts of changes in regional educa-
tional attainment and regional labour force participation. Required base year data include
- Regional GDP per capita by industrial sector in 1981
- Regional labour productivity (GDP per worker) by industrial sector in 1981
- Regional population by five-year age group and sex in 1981
- Regional educational attainment in 1981
- Regional labour force participation rate by sex in 1981
- Regional quality-of-life indicators in 1981
Time-series data describe exogenous developments or policies defined to control or constrain the
simulation. They are either collected or estimated from actual events for the time between the
base year and the present or are assumptions or policies for the future. Time-series are defined
for each simulation period, which are five year intervals from 1981 onwards. All GDP data are
converted to Euro of 2006. Some of these data are required at European level, some at national
level and some at regional (NUTS-3) levels, as follows:
- European data (34 countries)
- Total European GDP by industrial sector, 1981-2031
- Total European net migration, 1981-2031
- National data (34 countries)
- National GDP per worker by industrial sector, 1981-2031
- National fertility rates by five-year age group and sex, 1981-2031
- National mortality rates by five-year age group and sex, 1981-2031

ESPON 2013 75
- National educational attainment, 1981-2031
- National labour force participation by sex, 1981-2031
- Regional data (1,330 NUTS-3 regions)
- Regional endowment factors, 1981-2031
- Regional transfers, 1981-2031
Spatial level
The statistical data for the accessibility models are to be collected at NUTS-3 level according to
the latest 2006 NUTS classification (Eurostat, 2007) for the „internal‟ zones of the models; if re-
quired, data for NUTS-2, NUTS-1 or NUTS-0 levels can be aggregated from there. For the exter-
nal zones (see paragraph on spatial coverage below), data at country or macro region level will
be sufficient.
In order to calculate new innovative accessibility indicators, some of which may be calculated at
raster level, relevant statistical data at raster (grid) level are required. Because raster data are
usually not available from official statistics, two approaches can be chosen to derive a raster da-
tabase: first, statistical data from NUTS-3 level may be disaggregated by using actual land uses
as side information, or second, existing grid data from ESPON or from the European Environ-
mental Agency (EEA) can be used. The actually needed variables at raster level depend on the
selected set of innovative indicators and the data requirements to compute them, which will be
one output of Task 1.
The updated accessibility indicators will be calculated for the latest 2006 NUTS-3 classification.
The SASI model, being the model used to assess the impacts of transport investments in Task 6,
is currently being updated to this NUTS classification.
For the SASI model, in addition some data groups need to be collected at European and national
level, respectively (see above).
Spatial coverage
Both, accessibility travel and freight models as well as the SASI model cover the ESPON space,
i.e. EU27 plus Norway and Switzerland, as internal zones. The regions of the EU candidate coun-
tries Croatia and FYR Macedonia and of other countries of the Western Balkans will be included
as internal zones (see Chapter 7.4). Other European countries of Eastern Europe are treated as
„external‟ zones for the models. Additionally, the freight model also considers countries in North
Africa as external zones.
Reference years and temporal dimension
One of the main outputs of Task 3 will be the update of the existing potential accessibility indica-
tors to the year 2011. Thus, the required base data for 2011 need to be collected in 2011. An-
other reference year will be constituted by the freight model (Task 4) for which the year with the
latest available data, 2008, will be used. The socio-economic model (SASI model) to be used to
assess the spatial impacts of accessibility (Task 6) works with network data in intervals of five
years starting in 1981, i.e. empirical time series data for this period are required as well. Most of
these time series data are due to previous model applications, already available at the Project
Partners, but need to be converted to the latest 2006 NUTS classification.
In order to assess the impacts of European transport policies and infrastructure projects, a fore-
cast horizon is set to 2031 for the passenger travel and freight accessibility models. Another fore-
casting horizon for the freight model and the SASI model may me set to 2050.

ESPON 2013 76
ESPON database
The ESPON database available to all ESPON projects will be the main database for the socio-
economic data. The ESPON database is subdivided into six themes (directory names of the CD-
ROM in italics)
1. Basic statistical data for the ESPON space at NUTS-3 level
2. Grid data for the ESPON space and the EU candidate countries and Western Balkan (disag-
gregated socio-economic data on GDP, unemployment and active population)
3. Historical statistical data for the ESPON space, based on older NUTS classifications
4. Local data (statistical and geographical) for Bulgaria, Czech Republic, Hungary, Romania and
Slovakia at municipality level
5. Basis statistical data for the neighbouring EU candidate countries and Western Balkan at
NUTS-3 level
6. World data: geographical datasets.
The required datasets will be extracted from these themes, and compiled and processed in the
format required by the Europe-wide models.
Apart from the statistical data, the ESPON database also includes geographical boundaries for
the different NUTS levels (NUTS-3, 2, 1, and 0), for different NUTS versions, which can be used
for data illustrations and mapping. The he ESPON database provides also pre-processed mapkits
and map layouts in ArcGIS format at different scales and with different extent (ESPON Space,
ESPON Space and candidate countries, global mapkit, and local mapkit), which are to be used by
all ESPON projects.
7.3 Regional data
Whereas for the Europe-wide modelling (Tasks 3, 4 and 6) NUTS-3 has been identified as the
appropriate spatial resolution, the regional case studies to be conducted in Task 5 will work at
finer spatial resolutions (NUTS-5, raster). Thus, small scale regional data need to be collected.
Because of the different scope, extent and character of the case studies, no overall regional case
study database will be developed, but individual databases for each macro region will be set up in
the responsibility of the Project Partner in charge of the case study. Usually there will be several
case studies per macro region, so that there will be one case study database developed per part-
ner concerned.
Most of the required data is already available at the Project Partners, and can be used within
ESPON TRACC. Table 9 summarise the available data and data sources for the individual case
studies.
Concerning the network data, apart from some necessary database updates, in general networks
for all required modes are already available in GIS format at sufficient detail. Concerning the sta-
tistical data, for most case studies data are already available with high resolution (i.e. municipality
level, raster level); however, in several case some data are missing, or are available at higher
spatial level only. Each Project Partner will be responsible to collect and update the data neces-
sary for the regional case studies, at the required spatial scale.
It will have to be checked whether two Europe-wide available raster datasets, i.e. the EEA popu-
lation grid and the ESPON grid data, can be used as one harmonised data source for the case
studies in relation to socio-economic data.
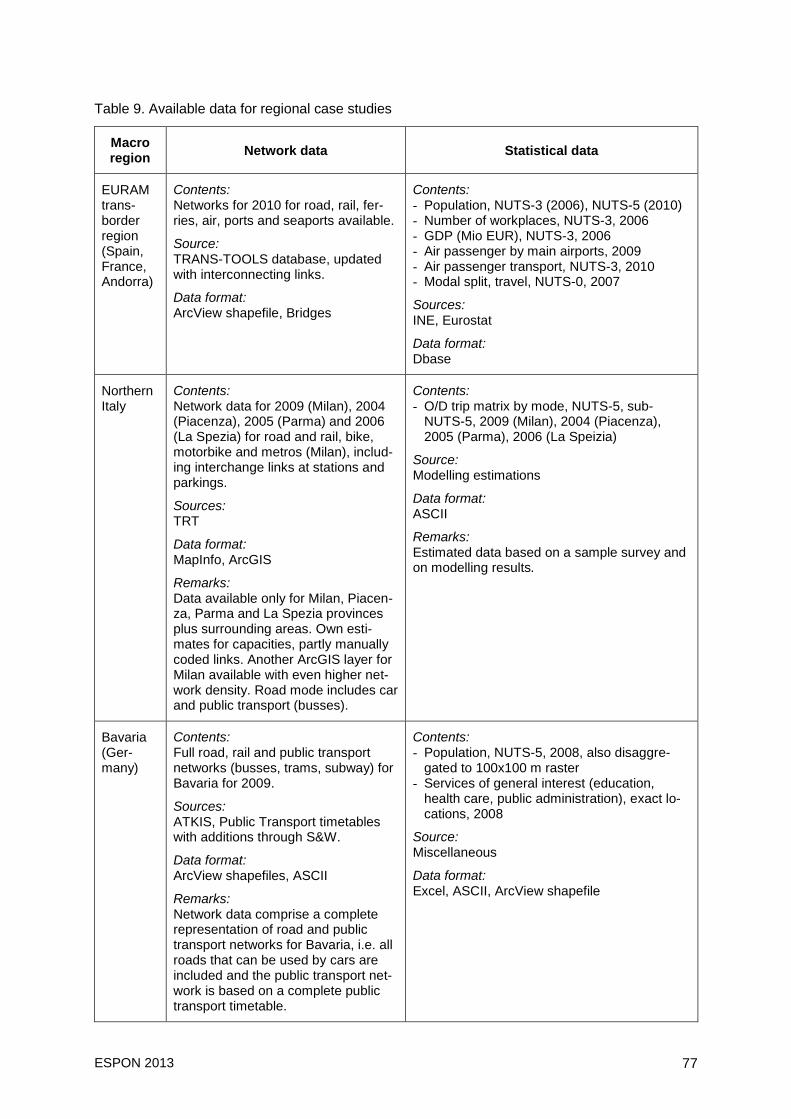
ESPON 2013 77
Table 9. Available data for regional case studies
Macro region
Network data Statistical data
EURAM trans-border region (Spain, France, Andorra)
Contents: Networks for 2010 for road, rail, fer-ries, air, ports and seaports available.
Source: TRANS-TOOLS database, updated with interconnecting links.
Data format: ArcView shapefile, Bridges
Contents: - Population, NUTS-3 (2006), NUTS-5 (2010) - Number of workplaces, NUTS-3, 2006 - GDP (Mio EUR), NUTS-3, 2006 - Air passenger by main airports, 2009 - Air passenger transport, NUTS-3, 2010 - Modal split, travel, NUTS-0, 2007
Sources:
INE, Eurostat
Data format: Dbase
Northern Italy
Contents: Network data for 2009 (Milan), 2004 (Piacenza), 2005 (Parma) and 2006 (La Spezia) for road and rail, bike, motorbike and metros (Milan), includ-ing interchange links at stations and parkings.
Sources: TRT
Data format: MapInfo, ArcGIS
Remarks: Data available only for Milan, Piacen-za, Parma and La Spezia provinces plus surrounding areas. Own esti-mates for capacities, partly manually coded links. Another ArcGIS layer for Milan available with even higher net-work density. Road mode includes car and public transport (busses).
Contents: - O/D trip matrix by mode, NUTS-5, sub-
NUTS-5, 2009 (Milan), 2004 (Piacenza), 2005 (Parma), 2006 (La Speizia)
Source: Modelling estimations
Data format: ASCII
Remarks:
Estimated data based on a sample survey and on modelling results.
Bavaria (Ger-many)
Contents: Full road, rail and public transport networks (busses, trams, subway) for Bavaria for 2009.
Sources: ATKIS, Public Transport timetables with additions through S&W.
Data format: ArcView shapefiles, ASCII
Remarks: Network data comprise a complete representation of road and public transport networks for Bavaria, i.e. all roads that can be used by cars are included and the public transport net-work is based on a complete public transport timetable.
Contents: - Population, NUTS-5, 2008, also disaggre-
gated to 100x100 m raster - Services of general interest (education,
health care, public administration), exact lo-cations, 2008
Source: Miscellaneous
Data format: Excel, ASCII, ArcView shapefile

ESPON 2013 78
Table 9. Available data for regional case studies (continued)
Macro region
Network data Statistical data
Czech Republic
Contents: Two network datasets available (1:500 000 and 1:150 000) for road, rail and air for 2006 for the whole of the Czech Republic. Road and rail attributes include, inter alias, road number, length and category.
Sources:
ArcČR500 (1:500,000), CEDA 150 (1:150,000), Road and Motorway Di-rectorate of the Czech Republic.
Data format: ArcView shapefile, Geodatabase, ArcInfo coverage
Remarks: Data not fully updated, several errors in network topology.
Contents: - Public transport supply, NUTS-3, 2001-2008 - Number of cars, NUTS-3, 2001-2008 - GDP, NUTS-2/3, 2001-2008 - Active population, NUTS-2/3, 2005-2008 - Unemployment, NUTS-3, 3002-2008 - Net domestic/foreign migration, NUTS-3,
2001-2008 - Urban/rural population, NUTS-3, 2001-2008 - Foreign direct investments by sectors,
NUTS-3, 2007 - Production by sector, NUTS-3, 2008 - GVA, NUTS-3, 2008 - Public investments, NUTS-3, 2008 - Land use data by class, NUTS-3, 2001-2008 - Number of operating firms, NUTS-3, 2008 - Household consumption of goods/services,
NUTS-3, 2008 - Regional budgets, NUTS-3, 2008 - Compensation of employees, NUTS-3, 2008 - Commuting flows between NUTS-3, 2008 - Group of environmental data, NUTS-3, 2008
Source: Czech Statistical Office, Ministry of Finance, Ministry of Internal Affairs, Ministry of Trans-portation
Data format: Excel, dbase
Poland Contents: Network data for 2009 available for the whole of Poland for roads, rail-ways, inland waterways incl. ports and seaports, and air, density opti-mised for voivodships. Road attrib-utes include road number, length, category, number of lanes, width, condition and congestion. Rail attrib-utes include technical speeds and lengths.
Sources: IGSO PAS, General Directorate for National Roads and Motorways of Poland, Voivodship Road Administra-tions, PKP Polish Railway Lines JSC
Data format: MapInfo
Remarks: Rail speeds not precise and for 2008 only; process triggered to obtain train timetable times for 2010 as NUTS-3 matrix.
Contents: - GDP/GVA, NUTS-2/3, 1999-2007 - Population (total, by age, by sex), NUTS-5,
1995-2009 - Employment, NUTS-2, 2000-2009 - Employment, NUTS-5, 1995-2009 - Land use data, NUTS-3, 2000-2006 - Many other data, NUTS-5
Sources: IGSO PAS, Central Statistical Office of Poland.
Data format: Excel, dbase

ESPON 2013 79
Table 9. Available data for regional case studies (continued)
Macro region
Network data Statistical data
Scandi-navia (Norway, Sweden)
Contents: Full road network data for 2009 pro-vided by the Norwegian and Swedish road authorities, including speed lim-its and road categories. Otherwise, RRG GIS Database to provide full railways, air, inland waterways and shipping networks including ports and seaports for 2010.
Sources: Norwegian Road Authority, Swedish Road Authority, RRG
Data format: ArcView shapefile, geodatabase
Contents: - Population by age group/sex, 1x1 km grid,
2000/2010 - Built-up areas, 1x1 km grid, 2000/2010 - Employment by sector, 1x1 km grid, 2000 - Labour market centres, 1x1 km grid, 2000 - Population, municipalities, 2000 - Ports, exact location, 2010 - Airports, exact location, 2010 - Major hospitals, exact location, 2010 - Universities, exact location, 2010 - Railway stations, exact location, 2010 - Tram and subway stations, exact location,
2010
Sources: Statistics Norway, Statistics Sweden RRG GIS Database
Data format: ArcView shapefile, geodatabase, dbase
Finland Contents: Network data for entire Finland for roads (2008), railways (2007), inland waterways, ports and seaports (2008), airports (2010) and fer-ries/shipping routes, plus border crossing points (2009).
Sources: Finnish Transport Agency (Digiroad & railways), Finnish Port Association, Finavia, Finnish Customs.
Data format: ArcView shapefiles, geodatabase.
Remarks: Airport locations are available, but no attribute or connectivity information is attached.
Contents: - Population, 1x1 km grid, 1970,
1980/1990/2000/2005-2008; municipalities 1951-2007
- Population by sex/age groups, 1x1 km grid, 2003/2007
- Education, 1x1 km grid, 2002/2006 - Income, 1x1 km grid, 2002/2006 - Households, 1x1 km grid, 2002/2006 - Sources of livelihood by 17 sectors, 1x1 km
grid, 2002/2006 - Employment, 1x1 km grid, 2001/2005 - Built-up areas, 1x1 km grid,
1970/1980/1990/2000/2005
Source: Statistics Finland
Data format: Shapefile

ESPON 2013 80
7.4 EU candidate countries and the Western Balkan
In order to include the EU candidate countries and the countries of the Western Balkan as inter-
nal zones for the Europe-wide accessibility models, both network data and socio-economic data
at a sufficient regional subdivision are required. In order to work with socio-economic data in GIS,
also appropriate region boundary layers are required. The ESPON 2013 Database project as-
sessed the data availability in these countries (Angelidis, 2010). Following is a brief overview of
the data situation with respect to these two data groups.
Network data
Both the RRG GIS Database and the TRANS-TOOLS database include network data for these
countries with sufficient network density from a European perspective (see Chapter 7.1). It still
needs to be checked whether all region centroids are connected properly to the network. If this is
not the case, individual network links will have to be added.
Regional subdivision
In order to include these countries into the models, a regional subdivision corresponding to the
NUTS-3 regions in the EU countries needs to be available. The ESPON 2013 Database project
(Angelidis, 2010, 4) confirms that Turkey, Croatia and FYROM already adopted the NUTS classi-
fication, including the NUTS-3 level, while the rest of the countries are currently in the process of
adoption, where existing administrative divisions can easily be associated with respective NUTS
levels. Table 10 provides an assignment of these divisions to the NUTS system.
Table 10. Corresponding NUTS levels in EU candidate countries and Western Balkans
Country
NUTS equivalent territorial divisions
NUTS-1 NUTS-2 NUTS-3
Albania Country Country 12 prefectures
Bosnia and
Herzegovina
Country or
FBiH, RS, Brsko districtx FBiH, RS, Brsko districtx 10 cantons
Croatia Country Regiia Counties
FYROM Country Country Statistical regions
Kosovo Country Country Country
Montenegro Country Country Country
Serbia Central Serbia, Voivodina Central Serbia, Voivodina 21 districts
Turkey Regions Sub-regions Provinces

ESPON 2013 81
The draft version of the ESPON Space and candidates mapkit developed by the ESPON 2013
Database project (Zanin et al., 2010) includes shapefiles for the equivalent NUTS classification in
these countries; however, as partly 'non-official' boundaries were used (Angelidis, 2010, 6), it still
needs to be investigated whether or not these shapefiles can be used in ESPON free of any legal
restrictions.
Socio-economic data
Most of the required socio-economic data at country level are already available at Project Part-
ners. At regional level (i.e. NUTS-3), the ESPON 2013 Database project made a rough assess-
ment of the data availability (Angelidis, 2010, 33ff; see Table 11 for full overview) , revealing
(i) a very good availability of population data (total population, by sex, by age groups, by educa-
tional attainment) for different points in time
(ii) a lack of household data
(iii) a lack of land use data and data on buildings and dwellings
(iv) a fairly good availability of data on employment, unemployment and active population, how-
ever, some of these data not more recent than 2000 or 2001 or even early or mid 1990s
(v) partial availability of GDP data
The lack of statistical land use data may be alleviated by using the CORINE land use data at
raster level, which is available for the Western Balkan countries (EEA, 2010). A lack of other sta-
tistical data may also be compensated by the „experimental‟ ESPON grid data (Milego and
Ramos, 2010), which provides raster data on GDP, active population and unemployment for all
countries of the ESPON space, plus the EU candidate countries and countries of the Western
Balkan. These grid data can either be used to disaggregate available datasets from the national
level to the NUTS-3 level, or the grid data can directly be aggregated to the NUTS-3 level.
Conclusions
The data situation in the EU candidate countries and Western Balkan countries with respect to
transport networks, administrative boundaries and basic socio-economic data can be considered
as generally good enough to include equivalent NUTS-3 regions of these countries as internal
zones into the accessibility models and the SASI model, even though for some data groups data
processing and data estimations will have to be done.
While the Western Balkan countries are located in Europe and are already surrounded by Euro-
pean Union member states, an inclusion of Turkey raises some other fundamental methodologi-
cal questions: If Turkey would become a full internal zone of the accessibility model and the SASI
model, countries in the Caucasus, countries in the Arab world (Near East and Middle East), and
also Russian regions in central Asia would have to become „external zones‟, as they have direct
boundaries with Turkey or because important transport routes are directly linked to Turkey. In
consequence, this would require to include these countries as external zones into the model (at
least at national level), and to collect all required data for them as well. Also, as most parts of
Turkey are located in Asia, the accessibility models will become inter-continental models, exceed-
ing the European territory. As this is not feasible in the time available in the project, the Turkish
regions will not become internal zones of the accessibility model and of the SASI model, but will
be included as external zones with higher spatial detail than so far.

ESPON 2013 82
Table 11. NUTS-3 data availability in EU candidate countries and Western Balkan Countries (Angelidis, 2010, 33ff, simplified)
Data - Indicators Albania Bosnia- Herzegovina (1)
Croatia FYROM Serbia Montenegro Kosovo (2) Turkey
NUTS-3 equivalent region
12 Prefectures 3 Districts (FBiH, RS, and Brsko)
21 Jupanija 8 Statisticki Regioni / SR
Districts 1 (total country) 7 Districts- 81 ILLER
Population census years 1985 - 2008
1999, 2001 1991 1991, 2001 1991, 2002 1991, 2002 (3) 1991, 2003 1991 1985, 1990, 1997, 2000 (4)
Total population 1989, 2001c 1991, 1995, 2001 -2002 2007 (FBiH)
1991, 1995, 2001, 2002 -2008
1991, 2002 1991, 1995, 2002, 1998- 2005.
1981, 1991, 2003 1981, 1991, 2006, 2007
1990, 2000
Population by sex: 2001 1991, 2000-2003, 2007 FBiH)
1991,1995,2001 2008
1991, 2002 1991, 1995, 1998-2007
1981, 1991, 2003 1991, 2006, 2007 1990, 2000
Population by age group
2001 1991, 2000-2003 2007 FBiH)
1991, 2001 1991, 2002 1991, 1995, 1998- 2005.
1991, 2003 1991, 2006, 2007 1990, 2000
Population by sex and age group
2001 1991 1991, 2001 1991, 2002 1991, 1995, 1998-2005
1991, 2003 1991 1990, 2000
Population per edu-cation level
2001 1991 1991, 2001 1991, 2002 1991, 1995, 1998-2005,
2003-2008, 2003 1991 1990, 2000
Total active popu-lation
2001 1991, 2007 1991, 2001
2002
1991, 2002 1991, 1995, 2002 1991, 2003 1991 1990, 2000
Active population by sex
2001 1991, 2007 1991, 2001 1991, 2002 1991, 1995, 2002 1991, 2003 1991 1990, 2000
Number of em-ployed per sons
2001 1991, 2007 1991, 2001 1991 2002 1991, 1995, 1998-2006, 2002, 2006
1991, 2003,
2004-2007
1991 1990, 2000
Number of unem-ployed persons
2001 1991, 2007 1991, 2001 1991, 2002 1991, 1995, 1998-2006, 2002, 2006
1991, 2003, 2004-2007
1991 2000, 2004- 2007
Employment per primary, secondary, tertiary sector
2001 1991, 2007 1991, 2001 1991, 2002, 1991, 1995, 1998-2006, 2002, 2006)
1991, 2003, 2004-2007
1991 1981-2001
GDP 2005-2007 (FBiH) 2004-2006 2000-2004 no data 1990, 2000
1 Federation of Bosnia and Herzegovina (FBiH), Republic of Srpska (RS), and Brsko District 3 Census not carried out in Kosovo and Metohia. 2 Under UN Security Council Resolution 1244 4 Turkey: 1997 only housing, 2000: only population census

ESPON 2013 83
8 Project planning
8.1 Detailed timetable
The detailed and updated timetable of the TRACC project for the three Work Packages Co-
ordination, Research and Dissemination is presented in Table 12.
8.2 Work towards Interim Report
The Interim Report is due six months after the delivery of this Inception Report. Project work will
mainly concentrate on Tasks 1, 2 and 5, which are mainly reviews and preparatory work for the
latter accessibility analyses at global, European and regional/local scale.
Work in Task 1 Methodology and Indicators includes the continuation and finalisation of the re-
view of European and global accessibility studies as well as the reviews of applied models and
indicators at the regional/local scale, a review of models to forecast the impacts of accessibility on
regions and the elaboration of a proposal for a core set of accessibility indicators to be applied in
TRACC.
Work in Task 2 Network and Socio-economic Data includes the continuation and finalisation of
the review of European network data and socio-economic data as well as work on the implemen-
tation of European network and socio-economic data and work on the implementation of network
and socio-economic databases for the regional case studies.
Work in Task 5 Regional Accessibility will be devoted to reviews of the results of regional and lo-
cal accessibility studies leading to a typology of regional accessibility patterns. In addition, the
selection of regional case study regions will be finalised and the work on these case studies will
commence.
In addition, preparatory and planning work for Tasks 3, 4 and 6 will commence. However, proper
work on these tasks will start after the delivery of the Interim Report.
All Project Partners will be involved in the work towards the Interim Report. There will be one
TPG meeting scheduled for late November or early December 2010 to discuss findings achieved
so far and to prepare for the Interim Report.
8.3 Use of existing ESPON results
The TRACC project will take advantage of existing ESPON results. Particular attention will be
paid to earlier work on European accessibility in the Study Programme on European Spatial
Planning (SPESP) and in previous ESPON projects 1.2.1, 1.1.1, 2.1.1 and 1.1.3 and the recent
Accessibility Updates. As described in Chapter 4, the TRACC project will use the main accessibil-
ity indicators developed in those projects, in particular the potential accessibility indicator and will
update these to the year 2011.
In addition, the TRACC project will be an intensive user of the ESPON database as well as of the
ESPON typologies developed by other ESPON projects. It will have to be found out whether the
TRACC project might also benefit of results of other projects such as the ones on globalisation,
on services of general interest or on attractivity of regions and cities.
8.4 Distribution of research tasks among partners
Table 13 shows the distribution of research tasks among project partners by indicating for each
Subtask the leading Project Partner and the degree of contributions (major, small or none) of
other Project Partners to that Subtask.
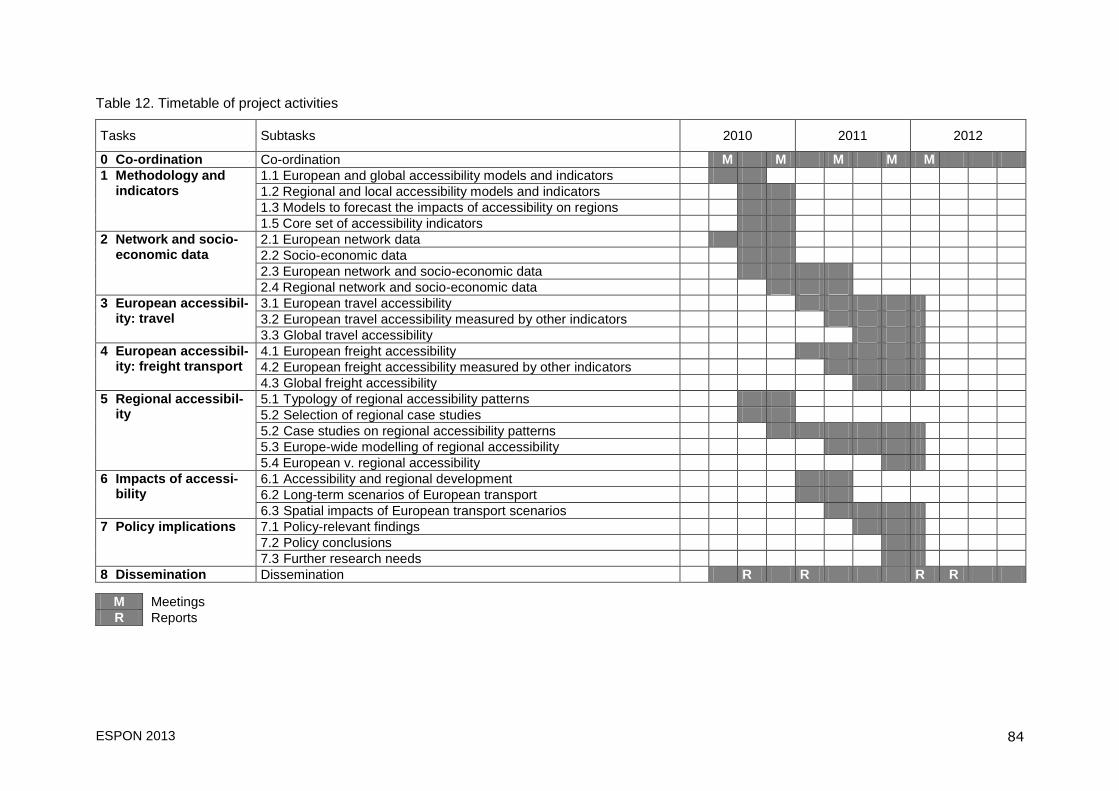
ESPON 2013 84
Table 12. Timetable of project activities
Tasks Subtasks 2010 2011 2012
0 Co-ordination Co-ordination M M M M M
1 Methodology and indicators
1.1 European and global accessibility models and indicators
1.2 Regional and local accessibility models and indicators
1.3 Models to forecast the impacts of accessibility on regions
1.5 Core set of accessibility indicators
2 Network and socio-economic data
2.1 European network data
2.2 Socio-economic data
2.3 European network and socio-economic data
2.4 Regional network and socio-economic data
3 European accessibil-ity: travel
3.1 European travel accessibility
3.2 European travel accessibility measured by other indicators
3.3 Global travel accessibility
4 European accessibil-ity: freight transport
4.1 European freight accessibility
4.2 European freight accessibility measured by other indicators
4.3 Global freight accessibility
5 Regional accessibil-ity
5.1 Typology of regional accessibility patterns
5.2 Selection of regional case studies
5.2 Case studies on regional accessibility patterns
5.3 Europe-wide modelling of regional accessibility
5.4 European v. regional accessibility
6 Impacts of accessi-bility
6.1 Accessibility and regional development
6.2 Long-term scenarios of European transport
6.3 Spatial impacts of European transport scenarios
7 Policy implications 7.1 Policy-relevant findings
7.2 Policy conclusions
7.3 Further research needs
8 Dissemination8 Dissemination8 R R R R
M Meetings
R Reports

ESPON 2013 85
Table 13. Research tasks and Project Partner responsibility
Tasks Subtasks S&W
(LP)
Prf UK
(PP2)
RRG
(PP3)
Mcrit
(PP4)
FOGIS
(PP5)
TRT
(PP6)
IGIPZ PAN (PP7)
0 Co-ordination Co-ordination Lead
1 Methodology and indicators
1.1 European and global accessibility models and indicators
Lead
1.2 Regional and local accessibility models and indicators
1.3 Models to forecast the impacts of accessibility on regions
1.4 Core set of accessibility indicators
2 Network and socio-economic data
2.1 European network data
Lead
2.2 Socio-economic data
2.3 European network and socio-economic data
2.4 Regional network and socio-economic data
3 European accessibil-ity: travel
3.1 European travel accessibility
Lead
3.2 European travel accessibility measured by other indicators
3.3 Global travel accessibility
4 European accessibil-ity: freight transport
4.1 European freight accessibility
Lead
4.2 European freight accessibility measured by other indicators
4.3 Global freight accessibility
5 Regional accessibility 5.1 Typology of regional accessibility patterns
Lead
5.2 Selection of regional case studies
5.3 Case studies on regional accessibility patterns
5.4 Europe-wide modelling of regional accessibility
5.5 European v. regional accessibility
6 Impacts of accessibil-ity
6.1 Accessibility and regional development
Lead
6.2 Long-term scenarios of European transport
6.3 Spatial impacts of European transport scenarios
7 Policy implications 7.1 Policy-relevant findings
Lead
7.2 Policy conclusions
7.3 Further research needs
8 Dissemination8 Dissemination8 Lead
Lead Task leader with major contribution
Major contribution
Small contribution

ESPON 2013 86
8.5 Barriers for project implementation
A potential barrier for project implementation for research projects dealing with accessibility indi-
cators is always the availability of proper network data. However, as shown in Chapter 7, the pro-
ject is in a very good situation with respect to Europe-wide as well as to regional network data. In
consequence, the TPG does not see any major barriers for the implementation of the TRACC
project.
8.6 Deliveries and outputs envisaged
The TRACC project is expected to disseminate its results to the wider political and scientific audi-
ence. To do so, there are a couple of formal requirements such as the different project reports
and the presentations at ESPON seminars and there will be a couple of other opportunities to
present results of the TRACC project.
Interim Report
The Interim Report will be due nine months after the start of the project. It will reflect the research
concept laid down in the Inception Report and the conclusions from the feedback from the Soun-
ding Board. The report will include preliminary and final results, such as
- a finalised review of European and global accessibility models and indicators
- a finalised review of regional and local accessibility models and indicators
- a finalised review of models to forecast the impacts of accessibility on regions
- a proposal for a core set of accessibility indicators
- a finalised review of European network data
- a finalised review of socio-economic data
- the implementation of European network and socio-economic database
- the implementation of regional network and socio-economic databases
- a typology of region accessibility patterns
- the final selection of regional case studies
as well as a detailed plan for the planned research during the next year of the project towards the
draft Final Report.
Draft Final Report
The Draft Final Report will be due 21 months after the beginning of the project. The report will
take into account the feedback on the Interim Report from an ESPON seminar and the Sounding
Board. The report will include the following draft results:
- European travel accessibility indicators
- European travel accessibility measured by other indicators
- global travel accessibility indicators
- European freight accessibility indicators
- European freight accessibility measured by other indicators
- global freight accessibility indicators
- results of the regional case studies
- long-term scenarios of European transport
- spatial impacts of European transport scenarios
The Draft Final Report will consist of an executive summary and a scientific report supported by
diagrams, tables and maps.

ESPON 2013 87
Final Report
The Final Report will be due five months after the Draft Final Report. It will be a revision of the
Draft Final Report on the basis of comments received and the final results achieved in the re-
search.
ESPON events
The project team will present the research concept and preliminary and final results at the internal
and external ESPON Seminars which take place twice a year as well as at other ESPON events
organised by the ESPON CU or the ESP Network or at events such as the DG REGIO Open
Days.
These dissemination activities will be planned in close co-operation with the ESPON CU to avoid
overlap with activities organised in Priority 4 of the ESPON 2013 Programme "Capitalisation,
ownership and participation: capacity building, dialogue and networking".
Conferences
The Project Partners will use every opportunity to present and discuss the research concept and
preliminary and final results at scientific conferences. Given the theme of the project, transport
accessibility and regional development, the Project Partners plan to give presentations on the
project at the following international conferences:
- World Conference on Transport Research (WCTR)
- Congress of the European Regional Science Association (ERSA)
- International Conference of the Regional Studies Association (RSA)
- Congress of the Association of European Schools of Planning (AESOP)
and at national conferences with similar focus. In addition it can be expected that Project Partners
will be invited to give presentations on the project not only at academic workshops or seminars
but to wider audiences and the general public.
Papers
The Project Partners will publish the results of the project in scientific journals and books during
and after the project.

ESPON 2013 88
9 References
Andrei, S. (2010): TENtec Information System. GIS Module and Methods to inlcude TRACECA
Data into TENtec Portal. Presentation held at TRACECA GIS Experts Seminar, Brussels, 7 July
2010.
Angelidis, M. (2010): Analysis of the Availability and the Quality of Data on Western Balkans and
Turkey. ESPON 2010 Database Project. Draft Report.
Bröcker, J., Capello, R., Lundqvist, L., Meyer, R., Rouwendal, J., Schneekloth, N., Spairani, A.,
Spangenberg, M., Spiekermann, K., van Vuuren, D., Vickerman, R. Wegener, M. (2005):
Territorial Impacts of EU Transport and TEN Policies. Final Report of ESPON 2.1.1. Kiel: Chris-
tian-Albrechts-Universität Kiel. http://www.espon.eu/export/sites/default/Documents/Projects/
ESPON2006Projects/PolicyImpactProjects/TransportPolicyImpact/fr-2.1.1_revised.pdf.
Bröcker, J., Meyer, R., Schneekloth, N., Schürmann, C., Spiekermann, K., Wegener, M. (2004):
Modelling the Socio-Economic and Spatial Impacts of EU Transport Policy. Deliverable D6 of
IASON (Integrated Appraisal of Spatial Economic and Network Effects of Transport Investments
and Policies). Kiel/Dortmund: Christian-Albrechts-Universität Kiel. http://www.spiekermann-
wegener.de/pro/pdf/IASON_D6.pdf.
Bruinsma, F., Rietveld, P. (1993): Urban agglomerations in European infrastructure networks,
Urban Studies 30, 919-934.
Cederlund, K., Erlandsson, U., Törnqvist, G. (1991): Swedish contact routes in the European ur-
ban landscape, Unpublished Working Paper. Lund: Department of Social and Economic Geogra-
phy, University of Lund,
Chatelus, G., Ulied, A. (1995): Union Territorial Strategies linked to the Transeuropean Transpor-
tation Networks. Final Report to DG VII. Paris/Barcelona: INRETS-DEST/MCRIT.
Copus, A. K. (1997) A New Peripherality Index for European Regions. Report prepared for the
Highlands and Islands European Partnership. Aberdeen: Rural Policy Group, Agricultural and Ru-
ral Economics Department, Scottish Agricultural College.
Copus, A. K. (1999) Peripherality and peripherality indicators, North. The Journal of Nordregio 10,
1, 11-15.
EEA – European Environmental Agency (2010): Corine Land Cover 2000 by Country.
Copenhagen: EEA. http://www.eea.europa.eu/data-and-maps/figures/corine-land-cover-2000-by-
country-1.
Erlandsson, U., Törnqvist, G. (1993): Europe in transition. In: Törnqvist, G. (Ed.): Sweden in the
World. National Atlas of Sweden. Stockholm: Almqvist & Wiksell International, 148-155.
ESPON 1.1.3 (2006): Enlargement of the European Union and the Wider European Perspective
as regards its Polycentric Spatial Structure. Final Report of ESPON 1.1.3. Stockholm: Royal Insti-
tute of Technology. http://www.espon.eu/export/sites/default/Documents/Projects/ESPON2006
Projects/ThematicProjects/Polycentricity/fr-1.1.1_revised-full.pdf.
European Commission (1995): Transeuropäisches Verkehrsnetz. Fakten und Zahlen. Luxem-
bourg: Office for Official Publications of the European Communities.
European Commission (1998): Trans-European Transportation Network. Report on the Imple-
mentation of the Guidelines. Basic Data on the Networks. Report to the European Parliament, the
Council, the Economic and Social Committee and the Committee of the Regions on the imple-
mentation of the guidelines for the development of the trans-European transport network (Deci-
sion 1692/96/EC).
ESPON 2013 89
European Commission (1999): 14 TEN Priority Projects. http://europa.eu.int/en/comm/dg07/
tentpp9807/index.htm.
European Commission (2002a): Revision of the Trans-European Transport Networks “TEN-T”.
Community Guidelines. http://europa.eu.int/comm/transport/themes/network/english/ten-t-en.html.
02-04-2002. Brussels: European Commission.
European Commission (2002b): Trans-European Transport Network. TEN-T priority projects.
Luxembourg: Office for Official Publications of the European Communities.
European Commission (2003a): A European Initiative for Growth. Investing Networks and Knowl-
edge for Growth and Jobs. Final Report to the European Council. COM(2003)690 final/2. Brus-
sels: Commission of the European Communities.
European Commission (2003b): Vorschlag für eine Entscheidung des Europäischen Parlaments
und des Rates zur Änderung des geänderten Vorschlages für eine Entscheidung des Europäi-
schen Parlaments und des Rates zur Änderung der Entscheidung Nr. 1692/96/EG über gemein-
schaftlich Leitlinien für den Aufbau eines transeuropäischen Verkehrsnetzes. Brüssel: Kommis-
sion der Europäischen Gemeinschaften.
European Communities (1996): Decision No. 1692/96/EC of the European Parliament and of the
Council of 23 July 1996 on the Community guidelines for the development of the trans-European
transport networks. Official Journal of the European Communities 39, L 228, 9, 1-104.
European Communities (2001): Decision No. 1346/2001/EC of the European Parliament and of
the Council of 22 May 2001 amending Decision No 1692/96/EC as regards seaports, inland ports
and intermodal terminals as well as project No 8 in Annex III. Official Journal of the European
Communities 44, L 185, 6.7.2001, 1-36.
European Parliament (ed.) (2007): Regional Disparities and Cohesion: What Strategies for the
Future? IP/B/REGI/IC/2006_201. Brussels: European Parliament.
European Union (2004): Decision No 884/2004/EC of the European Parliament and of the Coun-
cil of 29 April 2004 amending Decision No 1692/96/EC on Community guidelines for the devel-
opment of the trans-European transport network. Official Journal of the European Union L 167, 1–
38.
Eurostat (2007): Regions in the European Union. Nomenclature of Territorial Units for Statistics.
NUTS 2006/EU-27. 2007 Edition. Luxembourg: Office for Official Publications of the European
Communities.
Fiorello, D., Huismans, G., López, Marques, C., Steenberghen, T., Wegener, M., Zografos, G.
(2006): Transport Strategies under the Scarcity of Energy Supply. STEPs Final Report, edited by
A. Monzon and A. Nuijten. The Hague: Buck Consultants International. http://www.steps-eu.com/
reports.htm.
Gløersen, E.; Dubois, A.; Copus, A.; Schürmann, C. (2006): Northern Peripheral, Sparsely Popu-
lated Regions in the European Union and in Norway. Nordregio Report 2006:2. Stockholm:
Nordregio.
Gutiérrez, J., González, R., Gómez, G. (1996): The European high-speed train network: predicted
effects on accessibility patterns. Journal of Transport Geography 4, 227-238.
Gutiérrez, J., Urbano, P. (1996): Accessibility in the European Union: the impact of the trans-
European road network. Journal of Transport Geography 4, 15-25.
Keeble, D., Owens, P.L., Thompson, C. (1982) Regional accessibility and economic potential in
the European Community. Regional Studies 16, 419-432.
Keeble, D., Offord, J., Walker, S. (1988): Peripheral Regions in a Community of Twelve Member
States. Luxembourg: Commission of the European Communities.

ESPON 2013 90
Lutter, H., Pütz, T., Spangenberg, M. (1992): Accessibility and Peripherality of Community Re-
gions: The Role of Road, Long-Distance Railways and Airport Networks. Report to the European
Commission, DG XVI. Bonn: Bundesforschungsanstalt für Landeskunde und Raumordnung.
Lutter, H., Pütz, T., Spangenberg, M. (1993): Lage und Erreichbarkeit der Regionen in der EG
und der Einfluß der Fernverkehrssysteme. Forschungen zur Raumentwicklung 23. Bonn: Bundes-
forschungsanstalt für Landeskunde und Raumordnung.
Milego, R.; Ramos, M.J. (2010): Disaggregation of Socioeconomic Data into a Regular Grid:
Results of the Methodology Testing Phase. ESPON 2013 Database Project. Draft report.
Nordregio (ed.) (2004): Mountain Areas in Europe. Analysis of Mountain Areas in EU Member
States, Acceding and other European Countries. Nordregio Report 2004:1. Stockholm: Nordregio.
Rietveld, P., Bruinsma, F. (1998) Is Transport Infrastructure Effective? Transport Infrastructure
and Accessibility: Impacts on the Space Economy, Berlin/Heidelberg/New York, Springer
RRG (2010): RRG GIS Database User Manual. Dataset. Trans-European Transport Networks.
Oldenburg i.H.: RRG. http://www.brrg.de/database.php?language=en.
Schürmann, C., Spiekermann, K., Wegener, M. (1997): Accessibility Indicators. Berichte aus dem
Institut für Raumplanung 39. Dortmund: IRPUD.
Schürmann, C., Talaat, A. (2000): Towards a European Peripherality Index. Report for General
Directorate XVI Regional Policy of the European Commission. Berichte aus dem Institut für
Raumplanung 53. Dortmund: IRPUD.
Spiekermann, K. Neubauer, J. (2002): European Accessibility and Peripherality: Concepts, Mod-
els and Indicators. Nordregio Working Paper 2002:9. Stockholm: Nordregio.
Spiekermann, K., Schürmann, C. (2007): Update of Selected Potential Accessibility Indicators.
Final Report. Dortmund: Spiekermann & Wegener Urban and Regional Research. http://www.
espon.eu/export/sites/default/Documents/Projects/ESPON2006Projects/ScientificBriefingNetworki
ng/UpdateOn AccessibilityMaps/espon_accessibility_update_2006_fr_070207.pdf.
Spiekermann, K., Wegener, M. (1994) Trans-European Networks and unequal accessibility in
Europe, Paper presented at the NECTAR Working Group 3 Workshop 'Infrastructure and Periph-
eral Regions in Europe' at Molde College, Molde, Norway, 30 September and 1 October 1994
Spiekermann, K., Wegener, M. (1996): Trans-European networks and unequal accessibility in
Europe. European Journal of Regional Development 4, 35-42.
Spiekermann, K., Wegener, M. (2005): Modelling Regional Development in AlpenCorS: Scenario
Results. Final Report for AlpenCorS. Dortmund: Spiekermann & Wegener Urban and Regional
Research. http://www.spiekermann-wegener.de/pro/pdf/AlpenCorS_Final_Report.pdf.
Spiekermann, K., Wegener, M., Günther, K., Komornicki, K., Korcelli, P., Wisniewski, R., Fiorello,
D., Maffi, S., Martino, A., Zani, L. (2007): Preparatory Study on Feasibility of Flows Analysis. Final
Report of ESPON 1.4.4. Dortmund: Spiekermann & Wegener Urban and Regional Research.
http://www.espon.eu/export/sites/default/Documents/Projects/ESPON2006Projects/StudiesScienti
ficSupportProjects/Flows/fr-1.4.4_revised_23-3-2007.pdf.
TINA Secretariat (1999): TINA Transport Infrastructure Needs Assessment. Identification of the
Network Components for a Future Trans-European Transport Network in Bulgaria, Cyprus, Czech
Republic, Estonia, Hungary, Latvia, Lithuania, Poland, Romania, Slovakia and Slovenia. Final
Report. Vienna: TINA Secretariat.
TINA Secretariat (2002): Status of the Pan-European Transport Corridors and Transport Areas.
Developments and Activities in 2000 and 2001. Final Report. Vienna: TINA Secretariat.

ESPON 2013 91
Vickerman, R.W. (1999): The transport sector, new economic geography and economic devel-
opment in peripheral regions. In: Beuthe, M, Nijkamp, P. (Eds.): New Contributions to Transporta-
tion Analysis in Europe. Ashgate, 45-66.
Vickerman, R. W., Spiekermann, K., Wegener, M. (1999): Accessibility and economic develop-
ment in Europe. Regional Studies 33, 1, 1-15.
Wegener, M. (2008): SASI Model Description. Working Paper. Dortmund: Spiekermann &
Wegener Urban and Regional Research. http://www.spiekermann-wegener.de/mod/pdf/
AP_0801.pdf.
Wegener, M., Eskelinnen, H., Fürst, F., Schürmann, C., Spiekermann, K. (2001): Criteria for the
Spatial Differentiation of the EU Territory: Geographical Position. Forschungen 102.2, Bonn:
Bundesamt für Bauwesen und Raumordnung.
Zanin, Chr.; Lambert, N.; Ysebaert, R. (2010): Mapping Guide. Cartography for ESPON Projects.
ESPON 2013 Database Project. Draft Report as of June 2010.

The ESPON 2013 Programme is part-financed by the European Regional Development Fund, the EU Member States and the Partner States Iceland, Liechtenstein, Norway and Switzerland. It shall support policy development in relation to the aim of territorial cohesion and a harmonious development of the European territory.
Related Documents