PROJECT REPORT ON “REASONS BEHIND THE FAILURE OF JCT MILL IN MALERKOTLA MARKET” SUBMITTED TO SUBMITTED BY MS. Kuldeep Kaur Ankur jauhari Manish sajwan B.Tech(H)I.T.MBA A17B1 RA17B1A09/12 7470070011/82 LOVELY PROFESSIONAL UNIVERSITY PHAGWARA 1

Welcome message from author
This document is posted to help you gain knowledge. Please leave a comment to let me know what you think about it! Share it to your friends and learn new things together.
Transcript
8/6/2019 Tp Manish and Akur
http://slidepdf.com/reader/full/tp-manish-and-akur 1/51
PROJECT REPORT
ON
“REASONS BEHIND THE FAILURE OF JCT MILL IN MALERKOTLA
MARKET”
SUBMITTED TO SUBMITTED BY
MS. Kuldeep Kaur Ankur jauhari
Manish sajwanB.Tech(H)I.T.MBA
A17B1
RA17B1A09/12
7470070011/82
LOVELY PROFESSIONAL UNIVERSITY
PHAGWARA
1

8/6/2019 Tp Manish and Akur
http://slidepdf.com/reader/full/tp-manish-and-akur 2/51
Declaration
I declare that this Term paper is my own work. It is submitted in partial fulfillment of
the requirements for the degree of Masters of Business Administration at the Lovely
Professional University. It has not been submitted before for any degree or
examination at any other University. I further declare that I have obtained the
necessary authorization and consent
______________
Ankur Johri
Manish Sajwan
April 26, 2011
2

8/6/2019 Tp Manish and Akur
http://slidepdf.com/reader/full/tp-manish-and-akur 3/51
3

8/6/2019 Tp Manish and Akur
http://slidepdf.com/reader/full/tp-manish-and-akur 4/51
Acknowledgements
Working on this ambitious project has been enormously challenging and deeply
rewarding. We have thoroughly enjoyed the task set before me by the Lovely
Professional University. We are eternally grateful to: Our supervisor, Mrs. Kuldeep
Kaur for her invaluable patience, support and expert guidance. Our classmates and
friends who participated in the research for offering up their precious time ,who were
always so patient, supportive and understanding of this Endeavour.
Thank You
Ankur Johri
Manish Sajwan
4
8/6/2019 Tp Manish and Akur
http://slidepdf.com/reader/full/tp-manish-and-akur 5/51
Contents
Contents .................................................................................................................................. 5
INTRODUCTION ........................................................................................................................ 5
INDIAN TEXTILE INDUSTRY ................................................................................................... 7
SEGMENTS OF INDIAN TEXTILE INDUSTRY ........................................................................... 7
PROBLEMS FACED BY INDIAN TEXTILE INDUSTRY ................................................................ 9
CURRENT SCENARIO .......................................................................................................... 10
JCT ...................................................................................................................................... 1
OBJECTIVES .......................................................................................................................... 15
REVIEW OF LITERATURE ........................................................................................................ 15
DATA ANALYSIS AND INTERPRETATION ................................................................................. 27
Frequency .......................................................................................................................... 27
Discriminant Analysis ............................................................................................................ 33
Factor Analysis ................................................................................................................... 38
Cluster Analysis .................................................................................................................. 42
Dendrogram .................................................................................................................... 43
Questionnaire ..................................................................................................................... 48
INTRODUCTION
5

8/6/2019 Tp Manish and Akur
http://slidepdf.com/reader/full/tp-manish-and-akur 6/51
Time is changing and with it our needs are changing too and the main goal of
companies is to meet these changing needs profitably in minimal cost. To be
profitable companies try to capture the huge market segment and globalization helps
them in doing so. In many cases companies got success but in some cases they got
failures too. Just Like that JCT is failed to capture the market of Malerkotla. Now,
what are the factors or reasons behind the failure of company’s core competency
failed there? Either external factors or internal factors or both which cause the failure.
Company wants to know the reasons so that they can take corrective actions and
improve their strategy and establish their brand in Malerkotla.
Company seeks greater opportunities in Malerkotla market. As this
segment is sustainable, accessible, profitable, responsive and closer to the company.
It is one of the largest segments in Punjab. It saves a lot of expenses of company like
transportation cost, warehouse cost and decrease the response time between the
company and consumers. Absence of strong competitors is an opportunity for the
company. Company wants to establish their footholds in home market as they are
succeeded in achieved success in foreign market.
Currently Company established a new plant of worth 250 crore with
latest technology which will increase the efficiency of output and quality of theproduct. For that Malerkotla will be the best place to seek the consumer response
about the product developed in new plant.
6
8/6/2019 Tp Manish and Akur
http://slidepdf.com/reader/full/tp-manish-and-akur 7/51
INDIAN TEXTILE INDUSTRY
•Textile accounts for 14 % of India’s industrial production and around 27% of its
exports earnings. Textile industry in India covers a wide gamut of activities ranging
from production of raw material like cotton, jute, silk and wool to provide high quality
products such as fabrics and garments to consumers.
•Man made fibres account for around 40% share in a cotton dominated Indian textile
industry. India accounts for 15% of world‘s total cotton crop production and records
largest producer of silk.
• Industry uses a wide variety of fibres ranging from natural fibres like cotton, jute, silk
and wool to manmade fibres like polyester, viscose, acrylic and multiple blends of
such fibres and filament yarns.
•Textile industry plays a significant role in Indian economy by providing direct
employment to an estimated 35 million people, by contributing 4% of GDP and
accounting for 35% of gross export earnings. Textile sector contributes 14% of value
addition in manufacturing sector.
• It is the second largest employer after the agriculture sector in both rural and urban
areas. India has large pool of skilled labour, experienced in technology skills.
•Almost all sectors of textile industry have shown significant achievement. Sector has
shown a 3.66% CAGR over the last five years.
SEGMENTS OF INDIAN TEXTILE INDUSTRY
1. Woollen Textile
2. Cotton Textiles
3. Silk Textiles
4. Readymade Garments
5. Jute And Coir
6. Hand-Crafted Textile Like Carpets
7. Man Made Textiles
7
8/6/2019 Tp Manish and Akur
http://slidepdf.com/reader/full/tp-manish-and-akur 8/51
Indian textile industry in a very short span had made a distinct position globally,
alluring the globe towards the ‘World of Indian textiles’.
It’s not just the present that is shinning like a bright start but also the future, as the
textile export market of India is expected to reach a high of $50 billion by 2010. Thiswill eventually make a profit by 300%. In order to attain this target Indian textile
industry has already started improving their design skills, including a combination of
various fibres. Indian textile industry is all set to meet international standards and is
planning to invest $5 billion in machineries very soon.
Most of the international brands like Marks & Spencer, JC penny, Gap have started
procuring most of their fabrics from India. In fact, Wal-Mart, who had procured textile
worth $ 200 million last year, intends to procure $ 3 billion worth of textile this year.
The golden phase of the Indian textile industry has just begun where the world is
chasing it from all nooks and corners.
Key Success Factors
The key risk factors influencing the T&C industry are:
Increasing productivity by leveraging technology
Investing in IT
Investing in brand building
Focussing on international markets other than EU and US
Focussing on innovations
Achieving scale.
The share of shuttle-less looms in the Indian textiles industry is only 2-3% as against
a world average of 16.9%, thereby indicating a low degree of modernization in the
Indian weaving industry. Although the Indian spinning sector is relatively moremodernized, around 60% of installed spindles are more than 10 years old and open-
end (OE) rotors account for only 1% of total installed spindles. In the apparel sector,
India has much lower investment in special purpose machines, which perform specific
functions and add value to the product. Very few export establishments have
invested in cutting machines or finishing machines Apart from the spinning sector,
8
8/6/2019 Tp Manish and Akur
http://slidepdf.com/reader/full/tp-manish-and-akur 9/51
textile industry is dominated by unorganized industry on account of the policy
environment in the country. The industry players should look to increase their scale to
be more cost competitiveness.
Indian Textile Industry: Changing Profile
The Indian textile industry has embarked on an ambitious programme of
modernization and technological up gradation in recent years to transform the textile
sector from a state of low-technology level to a producer of high-technology products.
Technological up gradation in India has resulted in -
oA shift from commodity-based trading to high value-added fashion garments.
o
Vertical integration and horizontal consolidation of production process leading tolowering of manufacturing costs.
oImproved productivity gains.
oEfficient supply chain management.
oDevelopment of economies of scale.
PROBLEMS FACED BY INDIAN TEXTILE INDUSTRY
• The Indian texti le Industry had been plagued by obsolescence, labour
problems, raw material vagaries and lack of modernization including that of
spindles.
• The post fabric stage processing technology has also been lagging but is
now coming up fast with infusion of textile processing technology.
• SSI firms perform the majority of weaving and processing operations. The
level of weaving technology is of lower order and knitting units don't possess
capacity to perform dyeing, processing and f inishing to internat ional
standards.
9
8/6/2019 Tp Manish and Akur
http://slidepdf.com/reader/full/tp-manish-and-akur 10/51
• Textile exports during the period of April-February 2003-2004 amounted to $ 11,698
million as against $11,142 million during the same period, showing increase of around
5 percent.
CURRENT SCENARIO
•The global economy is passing through recession. The international trade in textiles
and clothing reached to $583 bn in 2007, which is expected to decline by $20-25 bn
in 2008.
•The Indian textile industry exports about 40% of its output, of this about 60% is
destined to USA and EU markets.
• It is expected that the textile and clothing exports from India may decline by 10-15%,
although countries like China, Bangladesh and Vietnam are expected to record
growth in their textile exports
•Steep rise in MSP of cotton and incentives on export of cotton have seriouslyimpacted the textile industry
•During the past few years, Indian textile industry has attracted huge investments. As
a result, the capacity in the entire chain has expanded beyond the current demand. In
the context of declining economic activities, even the domestic market is not able to
absorb the surplus generated by the industry so, it is tough time for the industry.
•The industry therefore has to strengthen its competitiveness to realize the Vision of
$50bn textile exports set out in the National Textile Policy 2000.
JCT
10
8/6/2019 Tp Manish and Akur
http://slidepdf.com/reader/full/tp-manish-and-akur 11/51
Textile unit of JCT one of the leading manufacturer of textiles and filament yarn, is the
flagship company of Thapar Group - was incorporated in the year 1946 at Phagwara
and went into commercial production in the year 1951. With operations in two distinct
businesses – cotton, synthetic & blended textiles and nylon filament yarn. The Textile
Division at Phagwara employs more than 700 workmen and gives indirect
employment to lacs of people. It has a consistent record of account of excellent
relations with the workmen which is mainly on account of its following the modern
concept of its mite to the physical health of society as well by way of international
players in the game of Football. JCT Limited was the first textile manufacturer in the
country to introduce eco-friendly fabrics made of organic cotton .JCT is synonymous
with quality. With stringent quality controls at every stage of the production process,
it is no wonder that the textile division of JCT is the first in the industry to be
accredited with the ISO 9002 certification.1
Top Management
•M.M. Thapar, Chairman
•Samir Thapar, Vice Chairman & MD
•Rajmohan Singh, Director (Operations)
•Sanjiva Jain, Sr.Vice President (Finance)
•H.K. Chopra, Sr. VP (Plant – Phagwara)
•Rajmohan Singh, Sr.Vice President (Retail)
•C. Venketesh., Vice President (Mktg – Textile)
•Vivek Saini, General Manager ( Mktg – Filament)
FOUNDER’S VISION
1 http://www.punjabispot.com/kapurthala/about-amritsar-punjab.html
11

8/6/2019 Tp Manish and Akur
http://slidepdf.com/reader/full/tp-manish-and-akur 12/51
“So long as we have confidence in the value of the goal and excitement at the
prospect of setting forth into unfamiliar territory and the will to do new things, I have
no doubt that the future of India and the future of Indian enterprise are both safe and
glorious.”
~ Lala Karam Chand Thapar (1900 – 1962)
Founder of the Thapar Group
Product Overview
JCT Limited has a product range of materials including 100% Cotton, 100%
Polyester, 100% Nylon as well as various blends like Cotton/Polyester, Cotton/Nylon
and Polyester/Viscose, Single and Plied Yarns (both with counts ranging from 6s to
100s) as well as Cotton Lycra and P/C Lycra Stretch material (which is Dupont USA
approved). Depending on the requirement, even bamboo and linen fibres are used to
create special effects.
The company pioneered the manufacture of Organic Cotton, a special eco-friendly
type of fabric that is available in up to 160cm of sheet width. This Organic Cotton is
grown on land free of any harmful chemicals, insecticides etc. and is regularly
exported to the USA. JCT Limited is certified with ISO 9001, Oeko-Tex 100 Class 2
and GOTS/Skal Certificate for fabrics of this nature, namely Wide Width Sheeting,
Dyed Bottom-Weight Twills, Dyed Shirting Twills, Natural Twills, Canvas and
Flannels.
The company’s strength lies is in bottom weights and piece dyed shirting for both
fashion and work wear in all age groups. They use a variety of weaves like Twills,
Plains, Dobbies, Ripstops, Cords, Satins, Oxfords, Ducks, Drills, Tussores, Ottomans
12
8/6/2019 Tp Manish and Akur
http://slidepdf.com/reader/full/tp-manish-and-akur 13/51
etc. End products include fashion wear, sportswear, outerwear, active wear for
Defence purposes and school uniforms. The organic cotton fabric meanwhile is used
for everything from infant wear to technical segments like medical wear.2
•Material : 100% Cotton, 100% Polyester, 100% Nylon Various blends of
Cotton/Polyester and Cotton/NylonBlends of Polyester/ Viscose, Cotton with Lycra,
Poly Cotton with Lycra. 100% Bamboo, Bamboo Cotton blends, Cotton Linen blends.
• Yarns : Count ranging from 6s to 100s, in single as well as plied yarns, Core Spun
Lycra and slub yarns.
•Weaves : Variety of weaves like Twills, Plains, Dobbies, Ripstops, Cords, Satins,
Oxfords, Ducks, Drills, Tussores, Ottomans etc.
•Weight : Cotton and Polycotton : 90 GSM to 450 GSM
Polyester and Nylon: 60 GSM to 250 GSM
•Finishes & Coatings : Microsanding, soft finish, peach finish, Calendaring. Water
and oil repellent, Teflon, Nano, Wrinke free/ easy care. Fire retardant, Inspect
repellent, UV resistant, Anti microbial. Stiff finish, Highly breathable, Moisture
Management, Rot proof, etc. PU coating, acrylic coating, Water repellent, fire
retardant, breathable coating, Silver and Gold coating, PVC Coating & various other
effects.
•Prints and Yarn Dyeds : Variety of designer prints for body fabrics and linings
(Camouflages, floral, blotches, etc.) . Designer yarn Dyeds for Bottom weights and
shirting.
•Organic Cotton : JCT is pioneer in manufacturing organic cotton fabrics in India -
specially designed eco-friendly fabrics.
JCT Limited’s Nylon Yarns are used for apparels, home textiles and semi-industrial
products. It also supplies high viscosity Nylon 6 Chips. These ranges of products can
be broadly classified into the following groups 3 –
•Flat Yarn on COP
2 http://www.jct.co.in/productandservices_textile.asp3 http://www.jct.co.in/productandservices_filament.asp#
13

8/6/2019 Tp Manish and Akur
http://slidepdf.com/reader/full/tp-manish-and-akur 14/51
• It is produced on Draw Twisting (DT) machine with metallic cops package and
widely used by weavers and knitters for women wear, scarf and base fabric.
•TEXTURED/CRIMP YARN : It is produced on texturising/Crimping machine. Its high
bulk makes it particularly suitable for hosiery and elastic tape applications.
•POY : Partially Oriented Yarn(POY) is used for air-texturising/Draw Texturising
applications.
•FOY : Fully Oriented Yarn(FOY), a recent development, is a cost effective product
on paper tube and is used for Twisting & Weaving.
•FDY : Fully Drawn Yarn(FDY) is characterized by large paper tube packages and
heat set yarn.
•DYED YARNS : Dyed yarn is available in two varieties – Hank Dyed and Dope
Dyed. Hank dyed yarn is produced by using conventional procedures and is available
in many shades. Dope dyed yarn is produced by using Coloured Master Batch Chips
and it is characterized by colour fastness.
•NYLON 6 CHIPS : Nylon 6 chips of high viscosity in the range of 2.6 to 3.2 R.V. are
available which are used in Engineering Plastics.
MARKET4
Segments: Work wear, Fashion wear, Sports wear, Outerwear, Defence, Institutional
Uniforms, Home Textile, Hospital and Hospitality Industry.
Markets: JCT has presence all over the world with exports to USA, Europe, Far East,
Middle East, Mauritius, and other countries. The fabric is made for leading
international brands complying with their standards.
4 http://www.jct.co.in/clients.asp
14

8/6/2019 Tp Manish and Akur
http://slidepdf.com/reader/full/tp-manish-and-akur 15/51
OBJECTIVES
Reasons behind the failure of JCT mill in MALERKOTLA market
a. To study the Malerkotla market needs, which leads to the failure (external).
b. To study supply chain factors which leads to the failure (Internal).
c. To offer suggestion for improvement to capture markets like in Malerkotla
REVIEW OF LITERATURE
Imran Sharif Chaudhry et al (2009) 5 have made study on “Factors Affecting Cotton
Production in Pakistan: Empirical Evidence from Multan District”. They examined thefactors affecting cotton production. In that study Cobb-Douglas Production Function
was used to assess the effects of various inputs like cultivation, seed and sowing,
irrigation, fertilizer, plant production and labour cost on yield.
Porter, Michael (1992) 6 Productivity also depends upon such factors as layout of
machines, mechanical transport for material handling and machine maintenance. As
a result of all these factors, productivity of the worker is largely governed by a proper machine allocation. This can easily be determined by work-study.
SITRA (1998) stated that the size of the mills decides the volume of business and
also the economic viability of the business unit. Selection of suitable size is important
for smooth conduct of business, over-capacity as well as under- capacity would bring
pressure on the business.
5 Imran Sharif Chaudhry, Muhammad Bashir Khan ( Bahauddin Zakariya University Multan,Pakistan )
and Mumtaz Anwar(University of the Punjab, Lahore, Pakistan)-“ Factors Affecting Cotton Productionin Pakistan: Empirical Evidence from Multan District”- Journal of Quality and Technology Management,Volume V,Issue I1, Dec, 2009, pg. 91-100.
6 Porter, Michael (1992): Quoted in G S Gokhale, 'Role of Productivity in Cotton Textile Mill Industry',
Productivity, Vol 33, No 1 April- June.
15
8/6/2019 Tp Manish and Akur
http://slidepdf.com/reader/full/tp-manish-and-akur 16/51
DHANAPAL C. & GANESAN G. (2010) 7 The Indian Textile Industry is the second
largest in the world, next to Chinese and is one of the largest foreign exchange
earners for the country. Textile is a key contributor to GDP to the order of 4%. The
textile sector employs over 20 million people and is the second largest employment
generator. Textile businesses are also affected by the global melt down. The industry
in India is experiencing an increase in the collaboration between national and
international companies. International apparel companies like Hugo Boss, Liz
Claiborne, Diesel,Ahlstorm, Kanz, Baird McNutt, etc have already started their
operations in India and these companies are trying to increase it to a considerable
level. National and the international companies that are involved in collaborations
include Rajasthan Spinning & Weaving Mills, Armani, Raymond, Levi Strauss, De
Witte Lietaer, Barbara, Jockey, Vardhman Group, Gokaldas, Vincenzo Zucchi, Arvind
brands, Benetton, Esprit, Marzotto, Welspun, etc. Therefore, it is the right time to
concentrate on operational cost to compete with the global leaders by concentrating
on the world class quality products. An empirical study is made on the cost aspects of
a textile mills discloses the possibility of cost reduction and improvement for
profitability. This paper presents proactive aspects and relationship of the production
with raw material consumption and yield .Cobb Douglas production function has been
used to find the behavour of costs with the production per spindle shift. It also
presents suggestions for improving productivity and profitability.
HEMBREE F. JOEL ,ETHRIDGE E. Don & NEEPER T. JRRAL(1986) 8 says that
effects of fiber properties(length,uniformity,strength,micronaire,white,yellow and trash
content ) on U.S. mill prices of cotton were estimated.USDA data on fiber properties
and mill prices on cottons from four production regions in th U.S. were used in the
statistical analysis.All the fiber properties were found to significamtly affect mill
prices;the fiber properties having the greatest influence were fiber strength length
and micronaire,followed by length uniformly yellowness whiteness and trash
content.These properties explained 18% of the total variation in mill prices between
1977/78 and 1983/84.
7 http://www.globalresearch.com.my/proceeding/icber2010_proceeding/PAPER_201_OperationalAnalysis.pdf 8 http://www.aaec.ttu.edu/CERI/Published%20Papers/Journal%20Article/MarketValuesofFiberPrpty.pdf
16
8/6/2019 Tp Manish and Akur
http://slidepdf.com/reader/full/tp-manish-and-akur 17/51
Doshi Gaurav (2006) 9 There is a pressure from the management to decrease the
conversion cost to its lowest possible level because of cut throat competition in both
the local and export markets. It is observed that if a spinning mill follows the steps
(Number the card cans, Check that all cards working on a mixing are represented in
the creel of the breaker draw frame, Use cans of two different colours at the two
deliveries of breaker draw frame, Place 4 cans of each colour in the creel of the
Finisher Draw frame, Check winding tension, Check that no roving bobbin with Uster,
Check that the drafting device at the fly frame, condition of each and every cot and
apron in the mill) recommend as above, they can function their ring frames at speeds
up to 25,000 rpm without either rising the breakage rate weakening yarn quality. The
recommendation provided on article is based on experts' experience of functioning
with many spinning mills in India and Indonesia increases spinning productivity.
Danish A. Hashim(2009)10 made research on” Cost and Productivity in Indian
Textiles” for Indian Council for Research on International Economic Relations. His
observations and findings are: There is an inverse relationship between the unit cost
and productivity: Industry and States,which witnessed higher productivity (growth)
experienced lower unit cost (growth) and viceversa.Better capacity utilization,
reductions in Nominal Rate of Protection and increased availability of electricity are
found to be favourably affecting the productivity in all the three industries.
Doshi Gaurav (2006) 11It is believed the quota regime has frozen the market share,
providing export opportunities even for high cost producers. Logistics and supply
chain would also play a crucial role as timely delivery would be an important
requirement for success in international trade. The logistics and supply chainmanagement of Indian textile firms are relatively weak and needs improvement and
9 http://ezinearticles.com/?Productivity-Of-A-Spinning-Mill&id=37286010 Danish A. Hashim (2004)- cost and productivity in Indian Textiles- Indian Council For Research On International
Economic Relations. Multan District” Journal of Quality and Technology Management, Volume V, Issue I1, Dec,
2009, pg. 91-100
11 http://ezinearticles.com/?Textiles-Exports:-Post-MFA-Scenario-Opportunities-and-Challenges&id=372738
17
8/6/2019 Tp Manish and Akur
http://slidepdf.com/reader/full/tp-manish-and-akur 18/51
efficiency. China has already created a world class export infrastructure. Given the
volume of projections for exports by India, it may be necessary to create additional
export infrastructure, especially investment for modernization of ports. In addition,
India needs to invest for creating brand equity, supply chain management and
apparel industry education. To sum up, the ability of Indian textile industry to take
advantage of quota phase-out would depend upon their ability to enhance overall
competitiveness through exploitation of economies of scale in manufacturing and
supply chain. The need of the hour therefore is to evolve a well chalked out strategy,
aimed at improvement in the levels of productivity and efficiency, quality control,
faster product innovation, quick response to changes in consumer preferences and
the ability to move up in the value chain by building brand names and acquiring
channels of distribution so as to outweigh the advantages of competitors in the long
run.
Doshi Gaurav (2006)12 In textile industry, protection from extreme environmental
conditions is a very crucial requirement. Phase Change Materials (PCM) is one such
intelligent material, It absorbs, stores or discharges heat in accordance with the
various changes in temperature and is more often applied to manufacture the smart
textiles. Since a huge amount has been invested in research and development in
these areas in the developed counties, it is expected that very soon all-season outfits
will be mass-produced. For example, in Britain, scientists have designed an acrylic
fibre by integrating microcapsules covering Phase Change Materials. These fibres
have been used for producing lightweight all-season blankets. Many garment making
companies in USA are now producing many of such garments, like thermal
underwear and socks for inner layer, knit shirt or coated fleece for insulating layer;
and a jacket with PCM interlines for outer layer, beside helmets, other head gears
and gloves. Such clothing can maintain warm and comfortable temperatures in theextreme of both weathers. There is no doubt that textile which integrate PCMs will
find their way into several uses in the near future.
12 http://ezinearticles.com/?Pcm-In-Textiles&id=367030
18
8/6/2019 Tp Manish and Akur
http://slidepdf.com/reader/full/tp-manish-and-akur 19/51
Doshi Gaurav (2006)13To get increased sales and better name amongst consumers
and fellow companies it is important to maintain a level of quality. Especially for the
businesses engaged in export business has to sustain a high level of quality to
ensure better business globally. Generally quality control standards for export are set
strictly, as this business is also holds the prestige of the country, whose company is
doing the export. Export houses earn foreign exchange for the country, so it becomes
mandatory to have good quality control of their products. main fabric properties that
are taken into consideration for garment manufacturing for export basis:
• . Overall look of the garment.
• . Right formation of the garment.
• . Feel and fall of the garment.
• . Physical properties.
• . Colour fastness of the garment.
• . Finishing properties
• . Presentation of the final produced garment.
Quality is ultimately a question of customer satisfaction. Good Quality increases the
value of a product or service, establishes brand name, and builds up good reputation
for the garment exporter, which in turn results into consumer satisfaction, high sales
and foreign exchange for the country. The perceived quality of a garment is the result
of a number of aspects, which together help achieve the desired level of satisfaction
for the customer. Therefore quality control in terms of garment, pre-sales service,
posts -sales service, delivery, pricing, etc are essentials for any garment exporter.
13 http://ezinearticles.com/?Quality-Control-Aspects-Of-Garment-Exports&id=373711
19

8/6/2019 Tp Manish and Akur
http://slidepdf.com/reader/full/tp-manish-and-akur 20/51
SITRA (1998)14 stated that the size of the mills decides the volume of business and
also the economic viability of the business unit. Selection of suitable size is important
for smooth conduct of business, over-capacity as well as under- capacity would bring
pressure on the business.
Doshi Gaurav (2006) 15Technical treatment of different textile materials is laid down
blizzard to the world. In this globalization of science and technology, new
technologies like fine chemicals, optical fibres, high polymer plastics, resins,
temperature-resistant textile fibres, fiber-reinforced composites etc have proved
improved alternative in the form of technical textiles and has updated the blueprint of
production; consumption and trade in a considerable way. The end user of personal
protection equipment is protector or consumer itself, hence according to the need of
PPE and by consideration of application of PPE in different environment; first and
foremost, consumer must be trained or guided by covering the thorough information
about what is personal protection equipment? In many countries there seems to be a
legislative strict restrictions or regulations on employers or workers to protect
themselves from hazardous workplace or environment and wearing personal
protection equipment necessarily. It is safe to create awareness among theemployees or workers of wearing personal protective equipment in hazardous areas
or workplace, and providing appropriate personal protection equipment, saves or
protects your business too.
Gokhale, G S (1992) 16an important factor that affects material productivity is the
quality of cotton that is used to produce a particular kind of yarn or cloth. Using too
good a cotton variety would contribute to excessive cost, but using cotton that is not
good enough would mean increased breakage, a heavier work load for the worker,
14 SITRA (1998): 'Productivity Performance in Spinning', SITRA Publication, South Indian
Cotton Textile Research Association, Coimbatore, p 4.
15 http://ezinearticles.com/?Protective-Clothing-Protects-Your-Business&id=372667
16 Gokhale, G S (1992) 'The Role of Productivity in Cotton Mill Sector', Journal of Productivity, January-March.
20

8/6/2019 Tp Manish and Akur
http://slidepdf.com/reader/full/tp-manish-and-akur 21/51
who consequently can only attend to a lesser number of machine units. The material
productivity is influenced by a number of factors such as quality of material used, type
of technology used, level of maintenance and life of machinery, count produced and
the like.
.
Ocampo Aimee(2011) 17Cotton prices have been increasing steadily for nearly a year
now, consequently pulling up the cost of related raw materials such as yarn and
fabrics. So while makers of apparel and textile-based products are relieved that
export orders are improving, escalating material expenses have made them cautious
about finalizing transactions. Many do not want to accept long-term contracts that will
bind them to a price point. This comes especially since it is difficult to estimate how
much material costs will change in the months to come. Some suppliers have chosen
to raise export quotes instead, albeit minimally. To compete with other companies
and retain existing clients, they cannot transfer all additional expenses to buyers and
have to absorb part of the extra costs. the cost of imported cotton ranged between 80
and 90 cents per pound. Now, those cotton suppliers are allegedly charging them for
current spot prices, which are from 150 to 160 cents per pound. This practice is being
done not only by overseas cotton suppliers, but by local providers as well.
Ware Jeffrey(2008) 18Choosing the fabric your clothing is made with is important.
This choice can make the difference in the look, comfort, durability, or practicality of
the purpose of the particular article of clothing. The choice of fabrics is never more
important that the clothes you wear every day at work. Your work uniform must be
comfortable yet durable. The average person will spend more time wearing their
uniform than any other article of clothing with maybe the exception of sleep clothing.
The fabric your uniform is made from is important and with today's fabrics you have a
wider choice than ever. Every fabric used to manufacture clothing today has its own
characteristics and uses. When choosing clothing as important as your uniform, it is
17 http://ezinearticles.com/?Volatile-Cotton-Prices-Dampen-2011-Projections&id=567022918 http://ezinearticles.com/?Fabrics-Used-To-Make-Material-In-Todays-Textile-Industry&id=1172925
21

8/6/2019 Tp Manish and Akur
http://slidepdf.com/reader/full/tp-manish-and-akur 22/51
important that you understand the characteristics of the different fabrics. This is the
first in a series of articles where we will explore the different fabrics and
manufacturing process of common fabrics. Cotton material is very easy to care for
and can be cleaned and dried under just about any conditions. Cotton fabric can be
machine washed in the hottest of water. It can be bleached without fraying. Cotton
fabric can be ironed at high temperatures without damage. As always you should
refer to the care label found on any garment before cleaning or ironing. Cotton is one
of the major factors in world prosperity and economic stability. Actively traded daily in
the futures market, cotton is a mainstay of the financial industry as well as the textile
industry. Cotton is grown worldwide with the leader in production being China
followed by the United States. Other major cotton producing countries include India,
Pakistan, Brazil, Turkey, and Greece.
Steel Ruid(2011)19 India's industrialization in various other sectors has been
successful due to the resources generated by the textile industry. The Indian textile
industry is the second largest industry across the world. As a result Indian textile art is
famous across the world. India is considered the third largest producer of cotton, as it
has the largest cotton acreage of 9 million hectares. India stands fourth in the
production of the stable fiber and sixth in the production of the filament yarn. Nearly30% of the India's export is from the textile industry that covers textiles and garments.
Textile industry comprises of various segments such as cotton textile including
handlooms, silk textiles, manmade textiles, woollen textile, readymade garments,
handicrafts including carpets, jute, coir, and many more
RESEARCH METHODOLOGY
The chapter of research methodology will indicate the objective of the study, its
universe, sampling design used, collection of data, statistical tools employed for
analysis of data and the limitation of the study
19 http://ezinearticles.com/?Indian-Fabric-Machinery-Industry&id=5703694
22

8/6/2019 Tp Manish and Akur
http://slidepdf.com/reader/full/tp-manish-and-akur 23/51
Title of the project
“REASONS BEHIND THE FAILURE OF JCT MILL IN MALERKOTLA MARKET”
Objective of the Study
Research without any objective is misleading. For any research work, however small
it may be, it has to be meaningful and it needs to have some objective. The present
study has been undertaken with the sole objective of analyzing the reasons that led to
the failure of JCT mills to take over the filament market of M.K. by JCT mills,
1) To study the Malerkotla market needs, which leads to the failure (external).2) To study supply chain factors which leads to the failure (Internal).
3) To offer suggestion for improvement to capture markets like in Malerkotla
PLAN ADOPTED FOR RESEARCH STUDY
Descriptive research was conducted using survey method. Primary data has been
collected by using a questionnaire. The questionnaire was designed on the basis of
the expectations of the filament consuming power mills of M.K..
The questionnaire contained questions relating to different aspects that had been
brought by the change in technology and economical changes & change in demand in
the area of M.K for handloom products leading to have the adverse effect on the
various mills in M.K
STATISTICAL TOOLS USED FOR DATA ANALYSIS
Data collected has been analyzed on the basis of weighted average score. The score
ranged from 5 to 1. The weights were assigned as 5 for ‘highly satisfied’ or ‘strongly
23
8/6/2019 Tp Manish and Akur
http://slidepdf.com/reader/full/tp-manish-and-akur 24/51
agree’, 4 for ‘satisfied’ or ‘agree’, 3 for ‘neither satisfied nor dissatisfied’ or ‘neither
agree nor disagree’, 2 for ‘dissatisfied’ or ‘disagree’ and 1 for ‘highly dissatisfied’ or
‘strongly disagree’. Tables and Bar graphs used for this purpose.
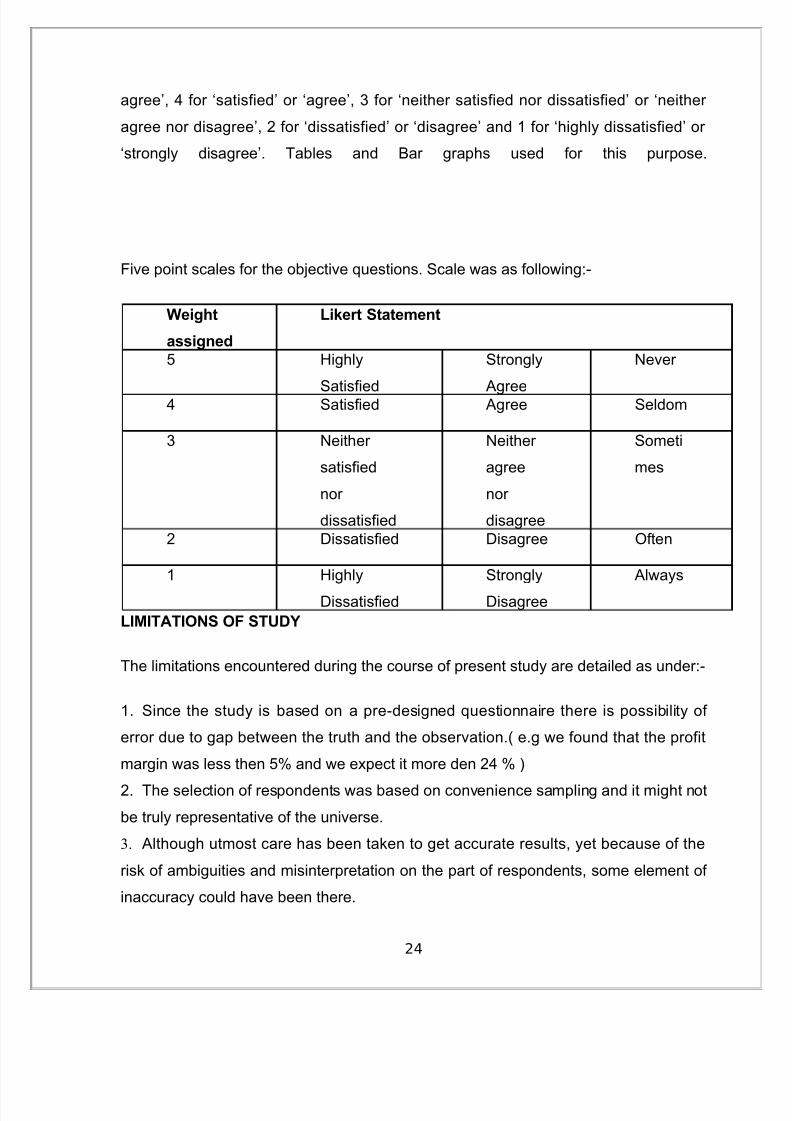
Five point scales for the objective questions. Scale was as following:-
Weight
assigned
Likert Statement
5 Highly
Satisfied
Strongly
Agree
Never
4 Satisfied Agree Seldom
3 Neither
satisfied
nor
dissatisfied
Neither
agree
nor
disagree
Someti
mes
2 Dissatisfied Disagree Often
1 Highly
Dissatisfied
Strongly
Disagree
Always
LIMITATIONS OF STUDY
The limitations encountered during the course of present study are detailed as under:-
1. Since the study is based on a pre-designed questionnaire there is possibility of
error due to gap between the truth and the observation.( e.g we found that the profit
margin was less then 5% and we expect it more den 24 % )
2. The selection of respondents was based on convenience sampling and it might not
be truly representative of the universe.
3. Although utmost care has been taken to get accurate results, yet because of the
risk of ambiguities and misinterpretation on the part of respondents, some element of
inaccuracy could have been there.
24
8/6/2019 Tp Manish and Akur
http://slidepdf.com/reader/full/tp-manish-and-akur 25/51
4. Since a small sample size was there, the possibility of sampling errors cannot be
ruled out in the study.
The constraint of time also prevented an in- depth research of the subject under
study.
25

8/6/2019 Tp Manish and Akur
http://slidepdf.com/reader/full/tp-manish-and-akur 26/51
26
8/6/2019 Tp Manish and Akur
http://slidepdf.com/reader/full/tp-manish-and-akur 27/51
DATA ANALYSIS AND INTERPRETATION
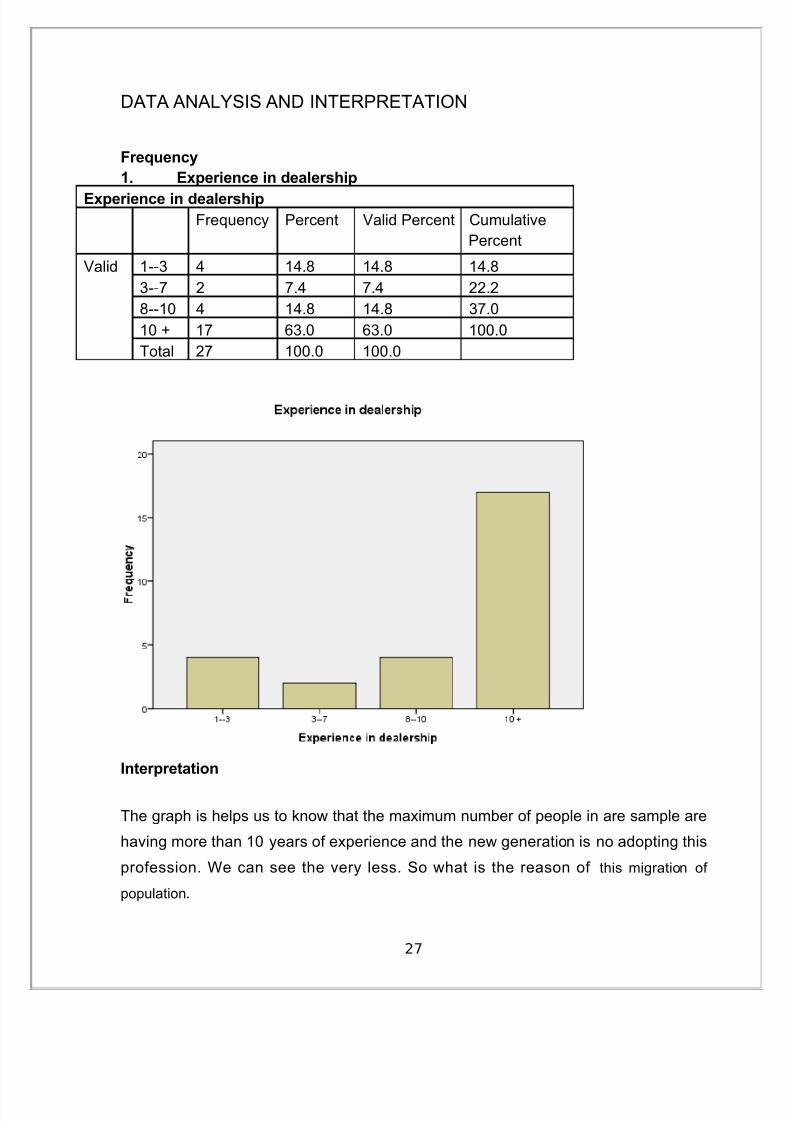
Frequency
1. Experience in dealership
Experience in dealershipFrequency Percent Valid Percent Cumulative
Percent
Valid 1--3 4 14.8 14.8 14.8
3--7 2 7.4 7.4 22.2
8--10 4 14.8 14.8 37.0
10 + 17 63.0 63.0 100.0
Total 27 100.0 100.0
Interpretation
The graph is helps us to know that the maximum number of people in are sample are
having more than 10 years of experience and the new generation is no adopting this
profession. We can see the very less. So what is the reason of this migration of
population.
27

8/6/2019 Tp Manish and Akur
http://slidepdf.com/reader/full/tp-manish-and-akur 28/51
2. Current Supplier
Name The Factory from where you buy current material
Frequency Percent Valid PercentCumulativePercent
Valid arihant 6 22.2 22.2 22.2
local 17 63.0 63.0 85.2
panipath 3 11.1 11.1 96.3
barnala 1 3.7 3.7 100.0
Total 27 100.0 100.0
Interpretation
Analysis of the above data reveal that the local suppliers are more active and more
preferred by these power mills instead of big players like ARIHANT MILL
(VARDHMAN) and the mills in Panipat and Barnala are not as effect source of
suppliers to these mills. O we can say that local traditional suppliers are preferred.
28
8/6/2019 Tp Manish and Akur
http://slidepdf.com/reader/full/tp-manish-and-akur 29/51
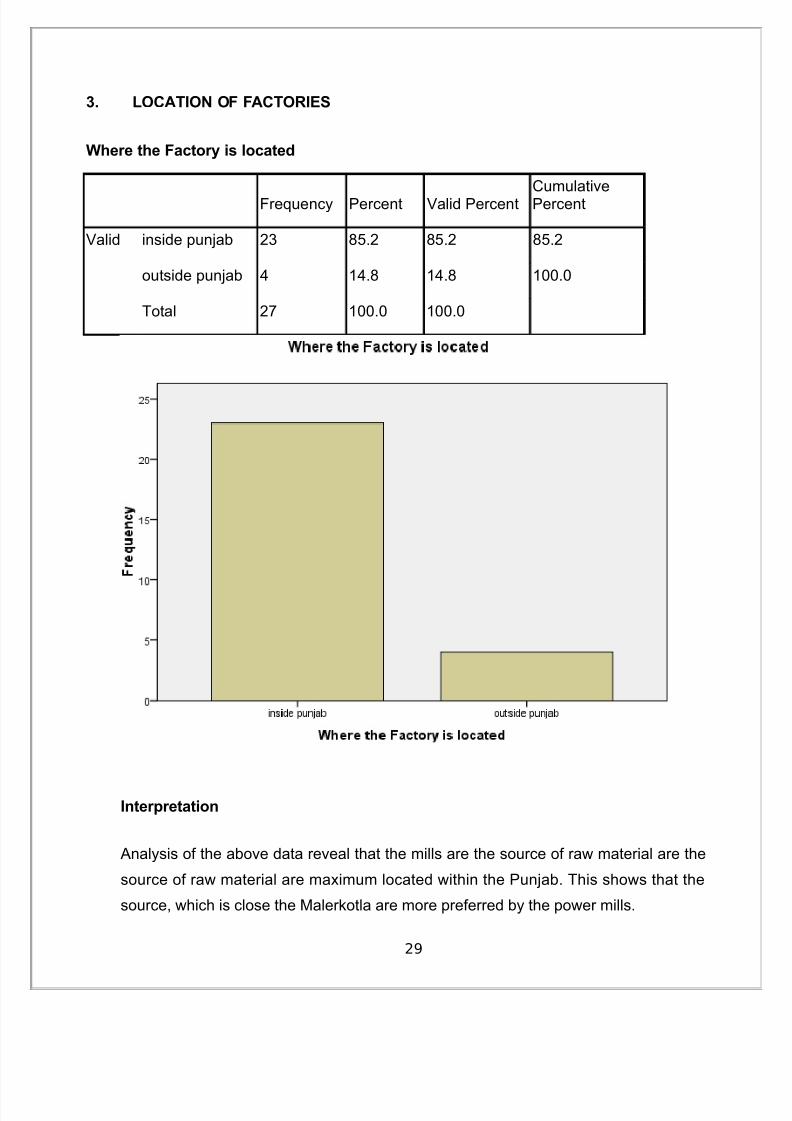
3. LOCATION OF FACTORIES
Where the Factory is located
Frequency Percent Valid PercentCumulativePercent
Valid inside punjab 23 85.2 85.2 85.2
outside punjab 4 14.8 14.8 100.0
Total 27 100.0 100.0
Interpretation
Analysis of the above data reveal that the mills are the source of raw material are the
source of raw material are maximum located within the Punjab. This shows that the
source, which is close the Malerkotla are more preferred by the power mills.
29

8/6/2019 Tp Manish and Akur
http://slidepdf.com/reader/full/tp-manish-and-akur 30/51
4. Expectations
What are the factors that you expect
Frequency Percent Valid PercentCumulativePercent
Valid Promotional schemes 1 3.7 3.7 3.7
Credit Facilities 26 96.3 96.3 100.0
Total 27 100.0 100.0
Interpretation
Analysis of the above data reveals that the expectation of these mill from supplier is
credit facilities . Most of them want that the suppliers should provide credit facilities to
them.
30
8/6/2019 Tp Manish and Akur
http://slidepdf.com/reader/full/tp-manish-and-akur 31/51
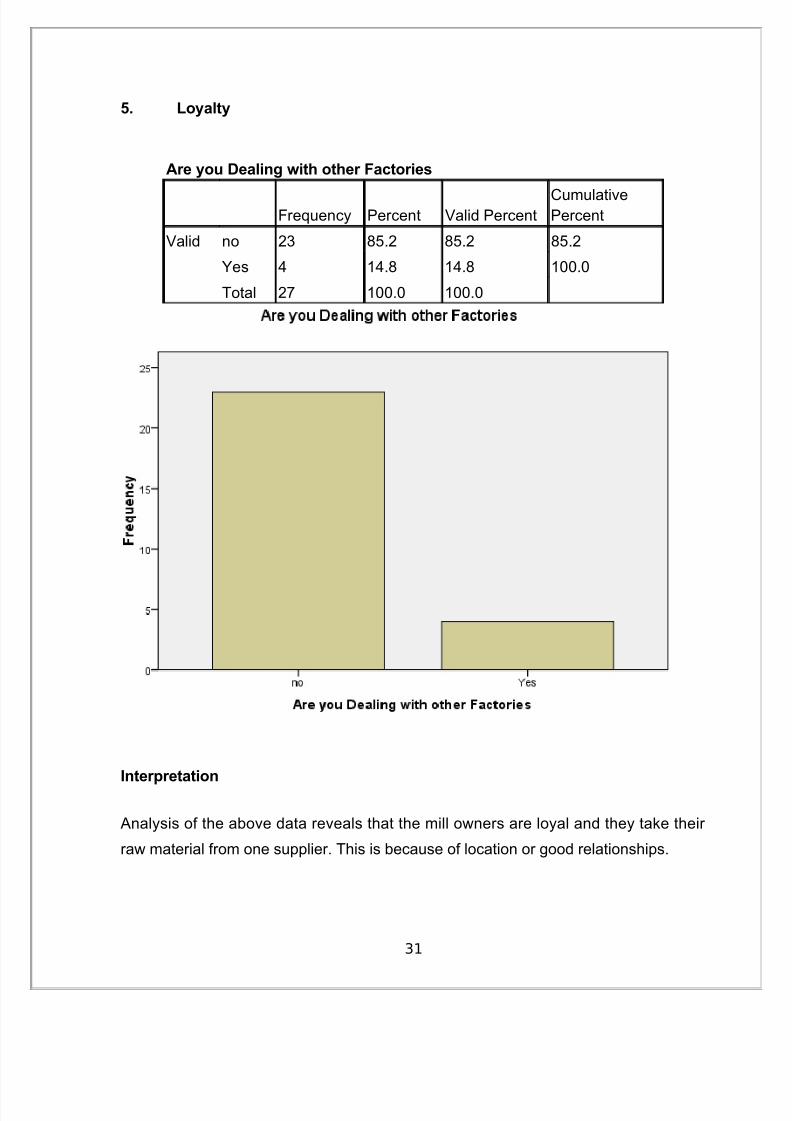
5. Loyalty
Are you Dealing with other Factories
Frequency Percent Valid PercentCumulativePercent
Valid no 23 85.2 85.2 85.2
Yes 4 14.8 14.8 100.0
Total 27 100.0 100.0
Interpretation
Analysis of the above data reveals that the mill owners are loyal and they take their
raw material from one supplier. This is because of location or good relationships.
31

8/6/2019 Tp Manish and Akur
http://slidepdf.com/reader/full/tp-manish-and-akur 32/51
6. Awareness about JCT
Are you aware of JCT Mills Phagwara
Frequency Percent Valid Percent
Cumulative
Percent
Valid no 15 55.6 55.6 55.6
Yes 12 44.4 44.4 100.0
Total 27 100.0 100.0
Interpretation
Analysis of the above data reveals that even though JCT is well known companyaround the world but more than 55.6% of sample is not aware of JCT MILL. SO we
can say that awareness may be the factor which may leads to the failure of JCT MILL
in Malerkotla.
32
8/6/2019 Tp Manish and Akur
http://slidepdf.com/reader/full/tp-manish-and-akur 33/51
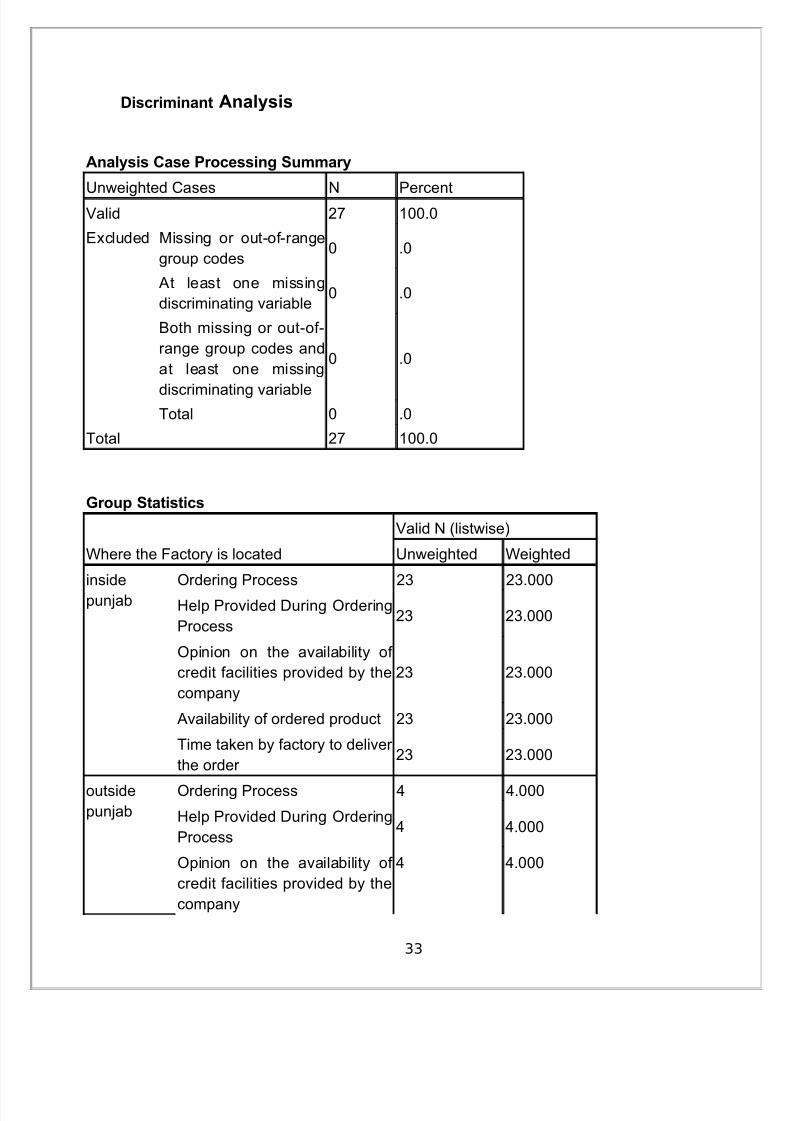
Discriminant Analysis
Analysis Case Processing Summary
Unweighted Cases N Percent
Valid 27 100.0
Excluded Missing or out-of-range
group codes0 .0
At least one missing
discriminating variable0 .0
Both missing or out-of-
range group codes and
at least one missing
discriminating variable
0 .0
Total 0 .0
Total 27 100.0
Group Statistics
Where the Factory is located
Valid N (listwise)
Unweighted Weighted
inside
punjab
Ordering Process 23 23.000
Help Provided During Ordering
Process23 23.000
Opinion on the availability of
credit facilities provided by the
company
23 23.000
Availability of ordered product 23 23.000
Time taken by factory to deliver
the order 23 23.000
outsidepunjab
Ordering Process 4 4.000
Help Provided During Ordering
Process4 4.000
Opinion on the availability of
credit facilities provided by the
company
4 4.000
33
8/6/2019 Tp Manish and Akur
http://slidepdf.com/reader/full/tp-manish-and-akur 34/51
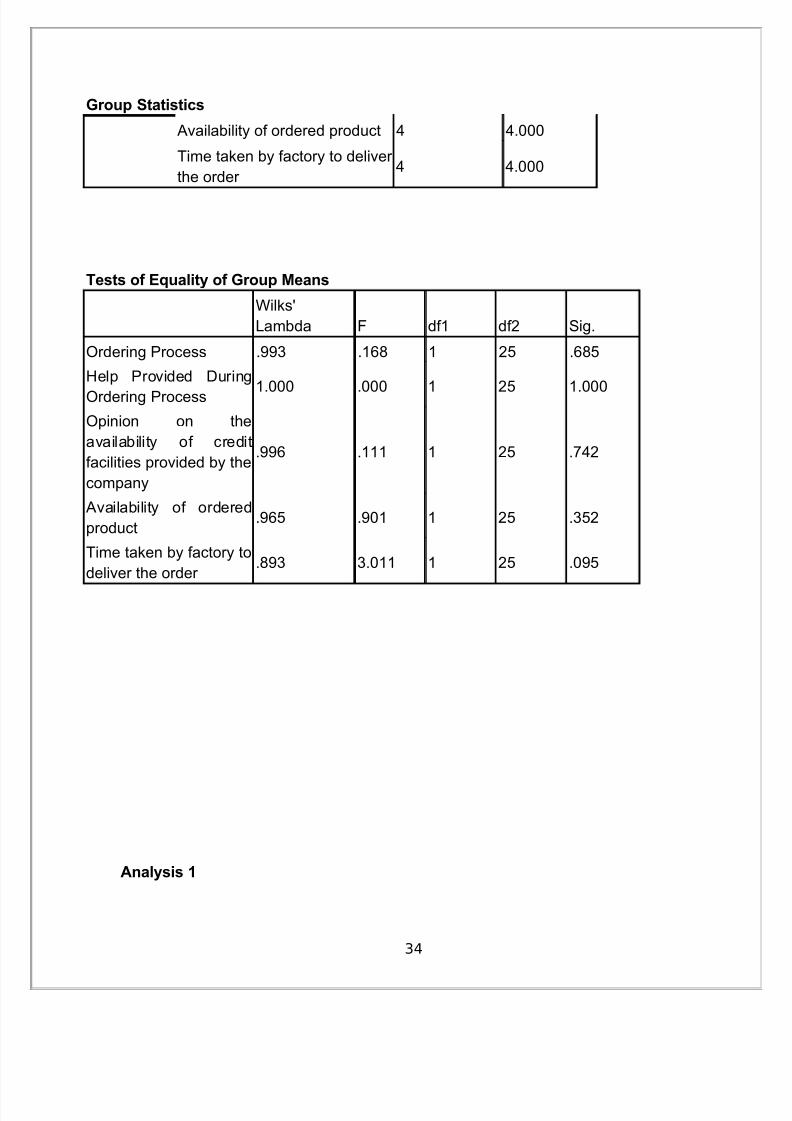
Group Statistics
Availability of ordered product 4 4.000
Time taken by factory to deliver
the order 4 4.000
Tests of Equality of Group Means
Wilks'
Lambda F df1 df2 Sig.
Ordering Process .993 .168 1 25 .685
Help Provided During
Ordering Process 1.000 .000 1 25 1.000
Opinion on the
availability of credit
facilities provided by the
company
.996 .111 1 25 .742
Availability of ordered
product.965 .901 1 25 .352
Time taken by factory to
deliver the order .893 3.011 1 25 .095
Analysis 1
34
8/6/2019 Tp Manish and Akur
http://slidepdf.com/reader/full/tp-manish-and-akur 35/51
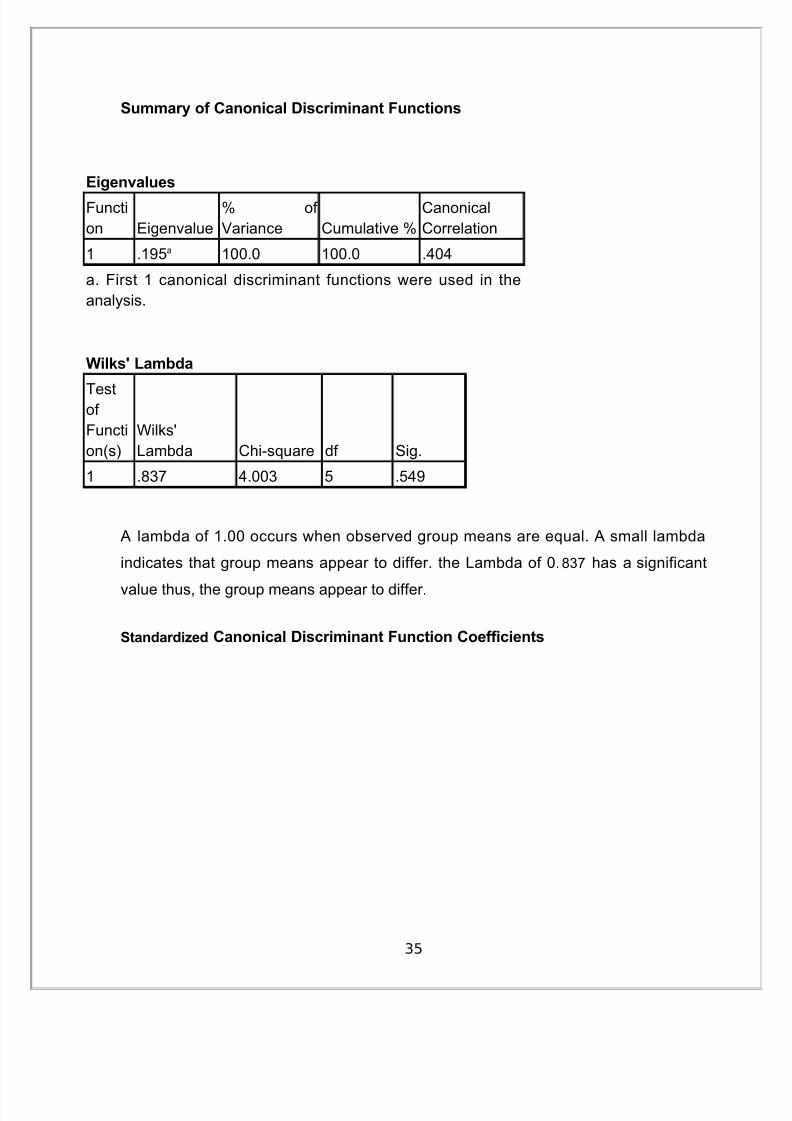
Summary of Canonical Discriminant Functions
Eigenvalues
Functi
on Eigenvalue
% of
Variance Cumulative %
Canonical
Correlation
1 .195a 100.0 100.0 .404
a. First 1 canonical discriminant functions were used in the
analysis.
Wilks' Lambda
Testof
Functi
on(s)
Wilks'
Lambda Chi-square df Sig.
1 .837 4.003 5 .549
A lambda of 1.00 occurs when observed group means are equal. A small lambda
indicates that group means appear to differ. the Lambda of 0.837 has a significant
value thus, the group means appear to differ.
Standardized Canonical Discriminant Function Coefficients
35

8/6/2019 Tp Manish and Akur
http://slidepdf.com/reader/full/tp-manish-and-akur 36/51
Function
1
Ordering Process -.256
Help Provided During
Ordering Process-.037
Opinion on the
availability of credit
facilities provided by the
company
.304
Availability of ordered
product-.563
Time taken by factory to
deliver the order .845
Classification Statistics
Classification Processing Summary
Processed 27
Excluded Missing or out-of-rangegroup codes
0
At least one missing
discriminating variable0
Used in Output 27
36
8/6/2019 Tp Manish and Akur
http://slidepdf.com/reader/full/tp-manish-and-akur 37/51
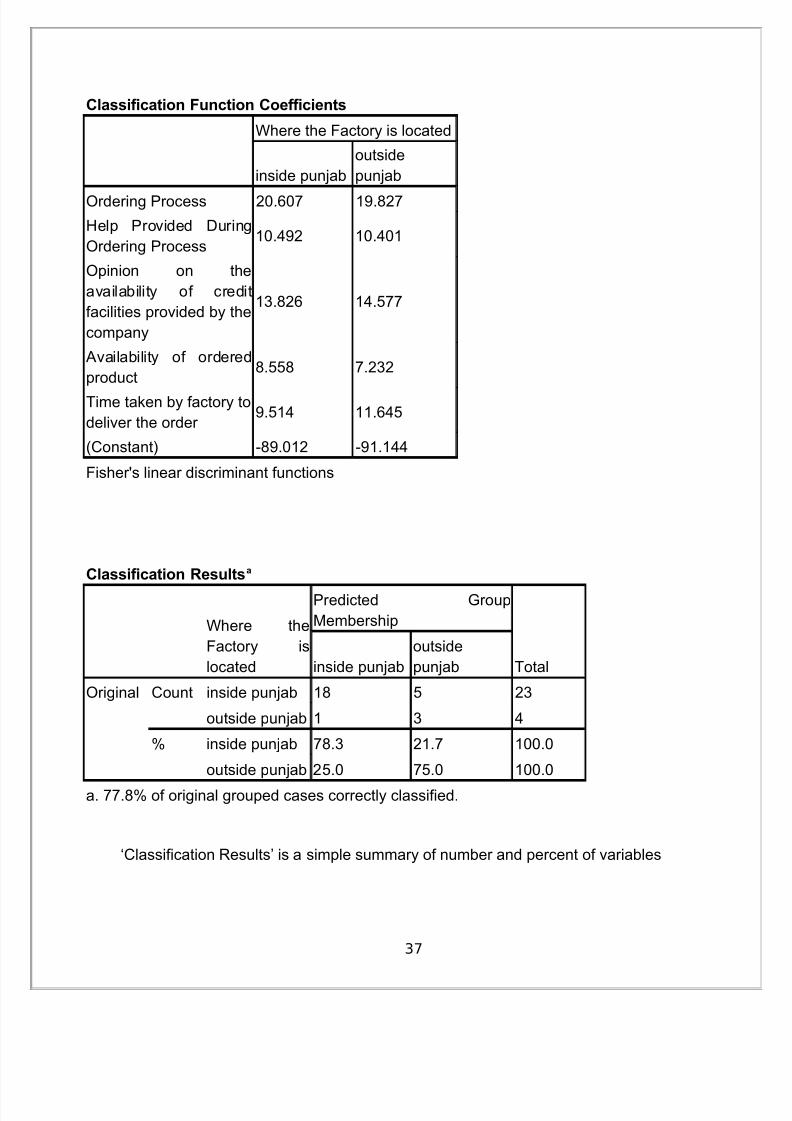
Classification Function Coefficients
Where the Factory is located
inside punjab
outside
punjab
Ordering Process 20.607 19.827
Help Provided During
Ordering Process10.492 10.401
Opinion on the
availability of credit
facilities provided by the
company
13.826 14.577
Availability of ordered
product8.558 7.232
Time taken by factory to
deliver the order 9.514 11.645
(Constant) -89.012 -91.144
Fisher's linear discriminant functions
Classification Resultsa
Where the
Factory is
located
Predicted Group
Membership
Totalinside punjab
outside
punjab
Original Count inside punjab 18 5 23
outside punjab 1 3 4
% inside punjab 78.3 21.7 100.0
outside punjab 25.0 75.0 100.0
a. 77.8% of original grouped cases correctly classified.
‘Classification Results’ is a simple summary of number and percent of variables
37
8/6/2019 Tp Manish and Akur
http://slidepdf.com/reader/full/tp-manish-and-akur 38/51
classified correctly and incorrectly. It shows that the inside punjab are more accurately
classified with 78.3% of the cases correct. For the outside Punjab 75% of cases were
correctly classified. Overall, 77.8% of the original cases was correctly classified.
Factor Analysis
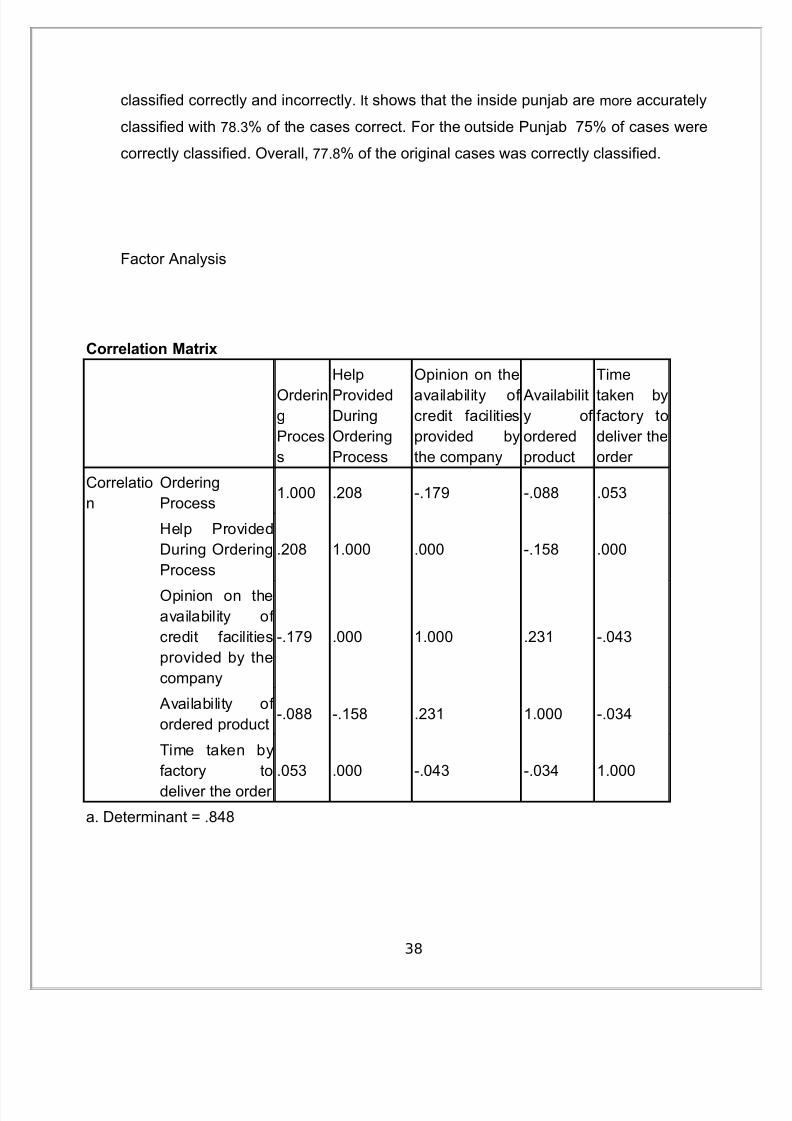
Correlation Matrix
Ordering
Proces
s
Help
ProvidedDuring
Ordering
Process
Opinion on the
availability of credit facilities
provided by
the company
Availability of
ordered
product
Time
taken byfactory to
deliver the
order
Correlatio
n
Ordering
Process1.000 .208 -.179 -.088 .053
Help Provided
During Ordering
Process
.208 1.000 .000 -.158 .000
Opinion on the
availability of
credit facilities
provided by the
company
-.179 .000 1.000 .231 -.043
Availability of
ordered product-.088 -.158 .231 1.000 -.034
Time taken by
factory to
deliver the order
.053 .000 -.043 -.034 1.000
a. Determinant = .848
38

8/6/2019 Tp Manish and Akur
http://slidepdf.com/reader/full/tp-manish-and-akur 39/51
KMO and Bartlett's Test
Kaiser-Meyer-Olkin Measure of Sampling
Adequacy..514
Bartlett's Test of
Sphericity
Approx. Chi-Square 3.878
Df 10
Sig. .953
the Kaiser-Meyer-Olkin (KMO) and Bartlett's test. The KMO measures the sampling
adequacy which should be greater than 0.5 for a satisfactory factor analysis to
proceed. Looking at the table below, the KMO measure is .514
39

8/6/2019 Tp Manish and Akur
http://slidepdf.com/reader/full/tp-manish-and-akur 40/51
from the output is a table
of communalities which
shows how much of thevariance in the variables
has been accounted for
by the extracted factors.
40
Communalities
Initial Extraction
Ordering Process 1.000 .455Help Provided During
Ordering Process1.000 .728
Opinion on the
availability of credit
facilities provided by the
company
1.000 .624
Availability of ordered
product1.000 .431
Time taken by factory todeliver the order
1.000 .241
8/6/2019 Tp Manish and Akur
http://slidepdf.com/reader/full/tp-manish-and-akur 41/51
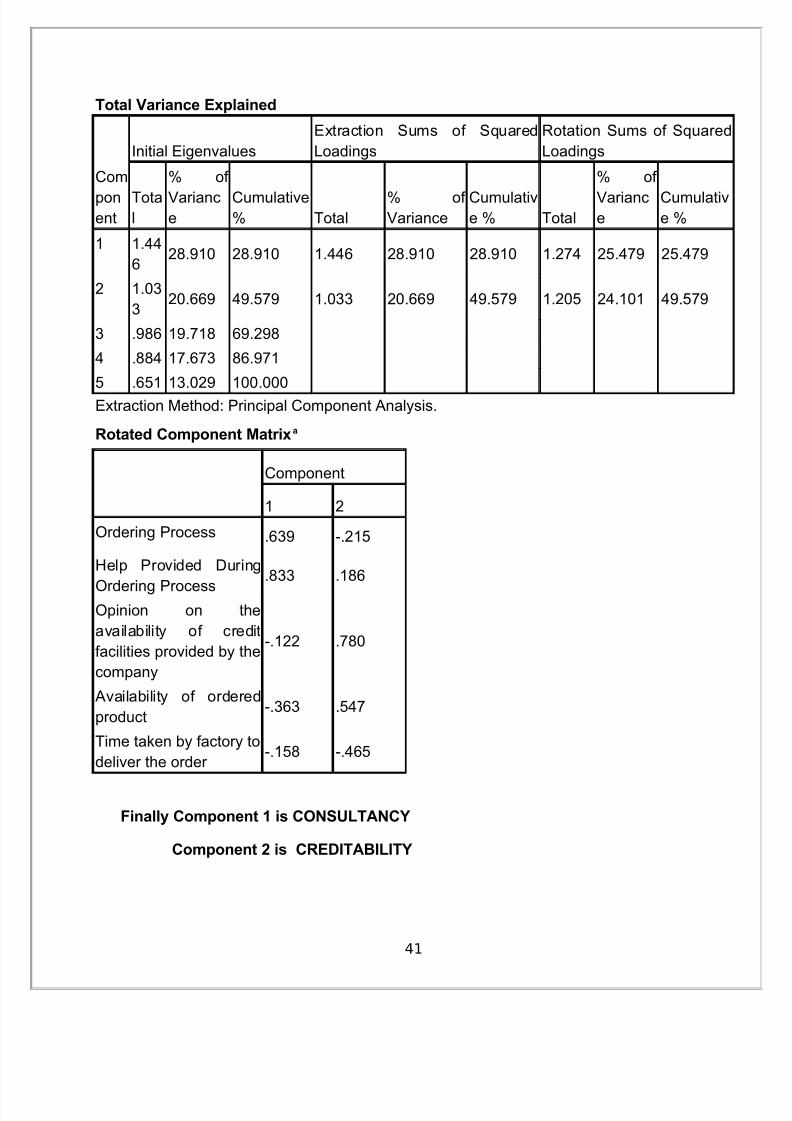
Total Variance Explained
Com
ponent
Initial Eigenvalues
Extraction Sums of Squared
Loadings
Rotation Sums of Squared
Loadings
Total
% of
Variance
Cumulative% Total
% of Variance
Cumulative % Total
% of
Variance
Cumulative %
1 1.44
628.910 28.910 1.446 28.910 28.910 1.274 25.479 25.479
2 1.03
320.669 49.579 1.033 20.669 49.579 1.205 24.101 49.579
3 .986 19.718 69.298
4 .884 17.673 86.971
5 .651 13.029 100.000
Extraction Method: Principal Component Analysis.
Rotated Component Matrixa
Component
1 2
Ordering Process .639 -.215
Help Provided During
Ordering Process
.833 .186
Opinion on the
availability of credit
facilities provided by the
company
-.122 .780
Availability of ordered
product-.363 .547
Time taken by factory to
deliver the order -.158 -.465
Finally Component 1 is CONSULTANCY
Component 2 is CREDITABILITY
41
8/6/2019 Tp Manish and Akur
http://slidepdf.com/reader/full/tp-manish-and-akur 42/51
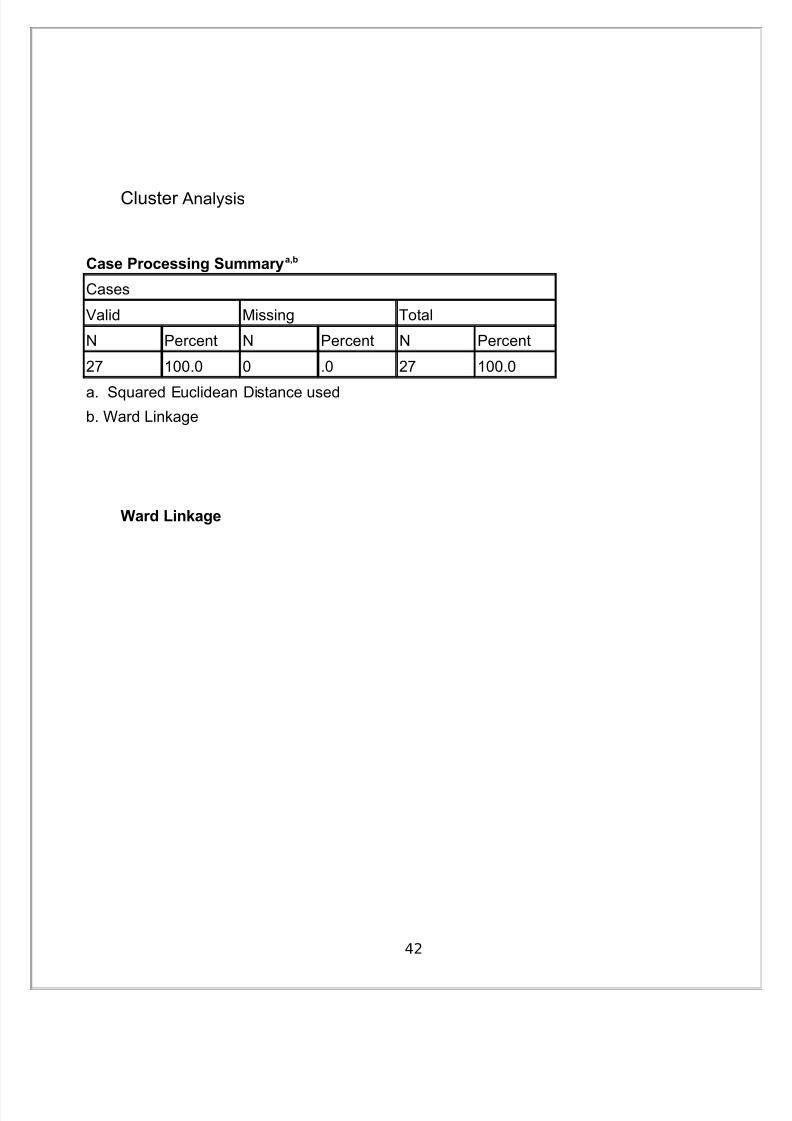
Cluster Analysis
Case Processing Summarya,b
Cases
Valid Missing Total
N Percent N Percent N Percent
27 100.0 0 .0 27 100.0
a. Squared Euclidean Distance usedb. Ward Linkage
Ward Linkage
42
8/6/2019 Tp Manish and Akur
http://slidepdf.com/reader/full/tp-manish-and-akur 43/51
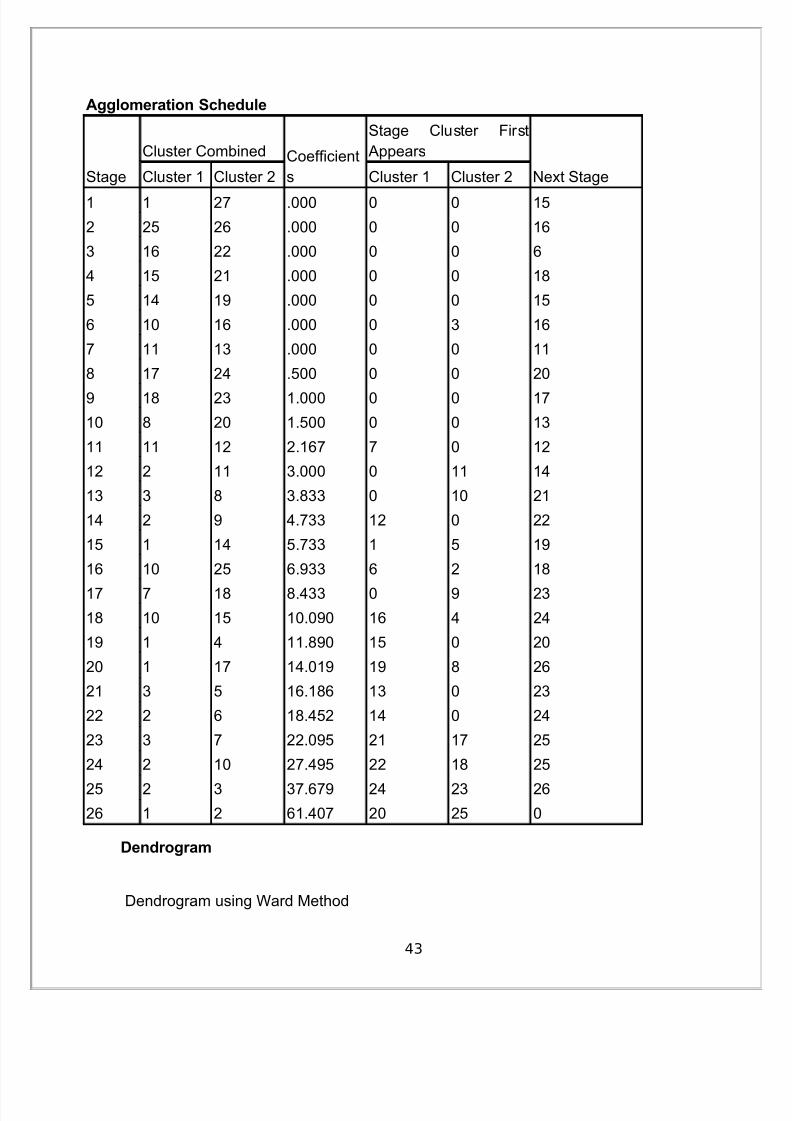
Agglomeration Schedule
Stage
Cluster Combined Coefficient
s
Stage Cluster First
Appears
Next StageCluster 1 Cluster 2 Cluster 1 Cluster 2
1 1 27 .000 0 0 15
2 25 26 .000 0 0 16
3 16 22 .000 0 0 6
4 15 21 .000 0 0 18
5 14 19 .000 0 0 15
6 10 16 .000 0 3 16
7 11 13 .000 0 0 11
8 17 24 .500 0 0 20
9 18 23 1.000 0 0 17
10 8 20 1.500 0 0 13
11 11 12 2.167 7 0 12
12 2 11 3.000 0 11 14
13 3 8 3.833 0 10 21
14 2 9 4.733 12 0 22
15 1 14 5.733 1 5 19
16 10 25 6.933 6 2 18
17 7 18 8.433 0 9 23
18 10 15 10.090 16 4 24
19 1 4 11.890 15 0 20
20 1 17 14.019 19 8 26
21 3 5 16.186 13 0 23
22 2 6 18.452 14 0 24
23 3 7 22.095 21 17 25
24 2 10 27.495 22 18 25
25 2 3 37.679 24 23 26
26 1 2 61.407 20 25 0
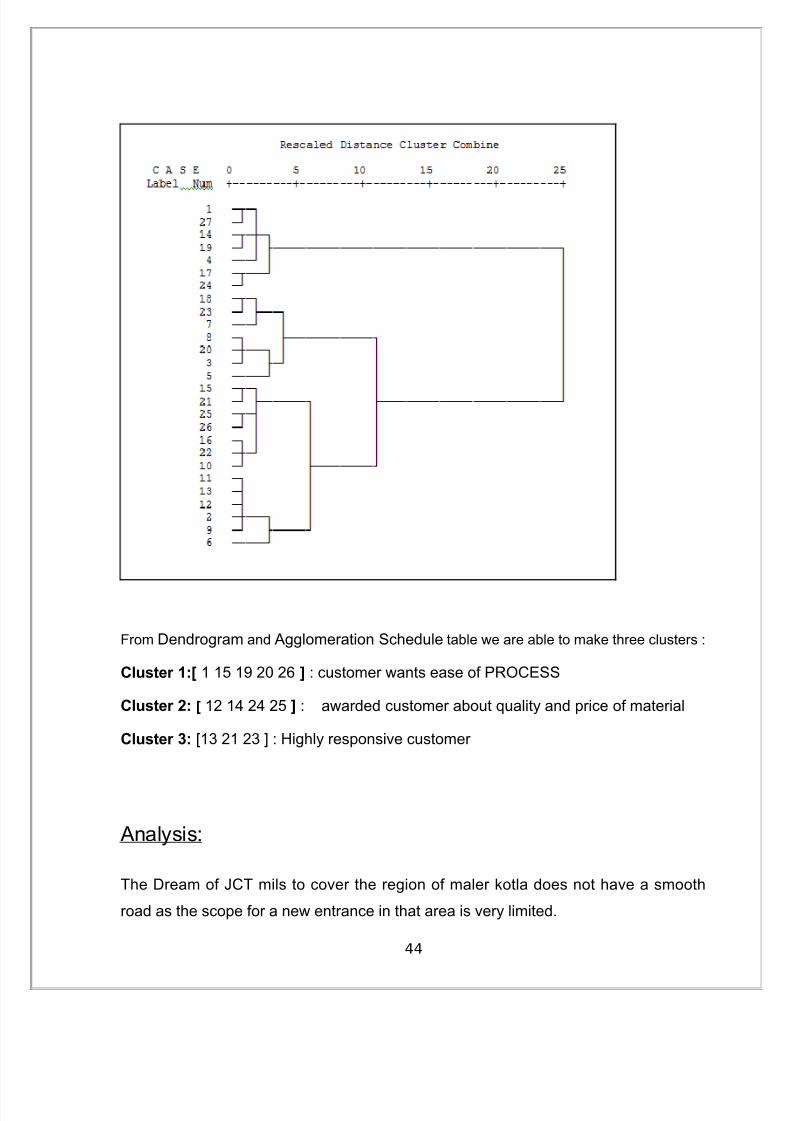
Dendrogram
Dendrogram using Ward Method
43
8/6/2019 Tp Manish and Akur
http://slidepdf.com/reader/full/tp-manish-and-akur 44/51
From Dendrogram and Agglomeration Schedule table we are able to make three clusters :
Cluster 1:[ 1 15 19 20 26 ] : customer wants ease of PROCESS
Cluster 2: [ 12 14 24 25 ] : awarded customer about quality and price of material
Cluster 3: [13 21 23 ] : Highly responsive customer
A nalysis:
The Dream of JCT mils to cover the region of maler kotla does not have a smooth
road as the scope for a new entrance in that area is very limited.
44
8/6/2019 Tp Manish and Akur
http://slidepdf.com/reader/full/tp-manish-and-akur 45/51
1) The entry barrier is high for JCT in Maler kotla.
2) The Risk involved is very much more with a very less return as in present
case the supply is very much more and the demand is very much less
3) the market is in its declined stage
4) Also most of the Handloom mills workers and Owner are not aware of JCT
mills,Phagwara.
5) the Demand of these products tends to getting low day by day, making a
dawn of Handloom mills in Maler Kotla.
6) Many of the handloom mills got closed down in recent years and employees
get a new job in government mills like sanik mill, maler kotla, Arihant mill, Maler
kotla,Swaraab Mill,Maler kotla.
7) High Potential competitors present in maler kotla itself e.g Arihant mills of
maler kotla is a firm of vardhman group which is a great brand name more better then
JCT mills
8) for delivering the products to handloom mills will not be cost effective for JCT
as they have to deliver the product and bear the transportation cost
9) JCT just established a new plant and invested a big amount on it,but for
setting up in maler kotla, they have to give there material on a big credits to the mills
which are already going into losses
10) Operating cost for handloom mills is too high leaving very less space for the
profits
11) Electricity problems are also a main issue as these handloom mills are
operated in small homes.
12) Workers switching to other occupations as they are getting more wages in
other fields.
13) The demand of the finished goods manufactured by handloom mills is very
low.
Conclusion:
45

8/6/2019 Tp Manish and Akur
http://slidepdf.com/reader/full/tp-manish-and-akur 46/51
1) JCT has to manufacture different products as it is manufacturing in today’s
date as the products in filament category manufactured by JCT is not consumed by
the handloom mills of maler kotla.
2) The Filament that Handloom mills uses in Maler kotla is of 6,7,8,9 no. but
JCT makes filament of more den 14 no. Here no. specifies the diameter of the thread.
3) To manufacture the demanded filaments JCT has to renew its whole
production layout and need to install new machines which is not feasible in present
scenario.
Bibliographic
1. Imran Sharif Chaudhry, Muhammad Bashir Khan and Mumtaz Anwar (2009)
(Factors
Affecting Cotton Production in Pakistan: Empirical Evidence from Multan District”
Journal of Quality and Technology Management, Volume V, Issue I1, pg. 91-100.
2. Gokarn, S (1998): 'Economic Reforms in India: Towards a Strategic Perspective' in
T Roy (ed),Economic Reforms: The Next Step, Vol II, Frank Bros, Delhi.
3. Nath, Pradosh and N Mrinalini (2000): 'Benchmarking the Best Practices of Non-
corporate R and D Organisations', Benchmarking: An International Journal, Vol 7,
November 2.
4. Roy, T (1996): 'Market-Resurgence, Deregulation and Industrial Response; Indian
Cotton Textiles in the 1990s', Economic and Political Weekly, XXXI(21), Review of
Industry, May. -(1998): 'Development or Distortion?
5. Sandesara, J C (1966): 'Scale and Technology in Indian Industry', Bulletin of the
Oxford University Institute of Economiics and Stati.tics, Vol 28, No 3. Textiles
Committee (Govt of India) (1999): 'Census of Textile Power Processing Industry in
India'. Economic and Political Weekly September 27, 2003.6. Saha, J and P R Shukla (1998): 'The Indian Primary Textile Industry' in P Chandra
(ed) (1998), Technology, Practices and Competitiveness: The Primary Textile
Industry in Canada, China and India, Himalaya Publishing House, Mumbai.
46
8/6/2019 Tp Manish and Akur
http://slidepdf.com/reader/full/tp-manish-and-akur 47/51
7.Applied and Decorative Arts: A Bibliographic Guide. Donald L. Ehresmann. 2d ed.
Englewood,CO: Libraries Unlimited, 1993.Detailed annotated bibliography. See
chapter 18: Textiles, pp. 450-509
.8.Bibliographica Textilia Historiae. Seth Siegelaub, ed. New York: International
General, 1997.Based on the library and archives of the Center for Social Research on
Old Textiles,Amsterdam. Entries alphabetical by author, with an index by subject and
country.
9.The Dictionary of Art. 34 vol. London: Macmillan, 1996.
10.The Dictionary of Needlework: An Encyclopedia of Artistic, Plain, and Fancy
Needlework.(Facsimile of 1882 edition) New York: Arno, 1972.
11.Guide to the Literature of Art History 2. Max Marmor and Alex Ross, eds. Chicago:
American Library Association, 2005.
12.Extensively annotated bibliography See “Rugs and Carpets,” Asian countries, p.
619-620;“Textiles, pp. 621- 649, especially listings for Early Christian-Byzantine and
Islamic, pp. 629-633; Asian countries, pp. 645-647 and Africa and Oceana, pp. 647-
648; and “Embroidery and Needlework,” p. 649.
Web Sites
METASITES
Artifact . Selective limited area search engine for the arts.
http://www.artifact.ac.uk.
Arts and Humanities Data Service (AHDS).
http://vads.ahds.ac.uk
Searchable image collections of British institutions, including Constance Howard
Resource and Research Centre in Textiles: Material Collection, and the London
College of Fashion Cordwainers (shoe makers) Collection. Registration required .
Costumer’s Manifesto: Costume and Textile Museums & Societies.
http://www.costumes.org/history/100pages/MUSEELNX.HTM
Extensive and excellent list of links. Some are to books for sale.
Textile Society of America: Resources.
http://textilesociety.org/resources_textilesites.htm
47

8/6/2019 Tp Manish and Akur
http://slidepdf.com/reader/full/tp-manish-and-akur 48/51
Textile-related web sites.
Textiles Through Time.
http://www.dfmg.com.tw/dhtml/site-link/tac-museum.htm
Long list of textile links, many no longer active.
Textile and Costume Collections on the Internet Webography.
http://isthmia.ohio-state.edu/teg/hist787/textiles.htm
(Document prepared for history course at Ohio State University, 2000, extensive, but
not updated).
MUSEUM SITES WITH SIGNIFICANT CONTENT
Antonio Ratti Textile Center , Metropolitan Museum of Art.
http://www.metmuseum.org/collections/department.asp?dep=20
Helen Louise Allen Textile Collection, University of Wisconsin.
http://www.sohe.wisc.edu/depts/hlatc
Annexure
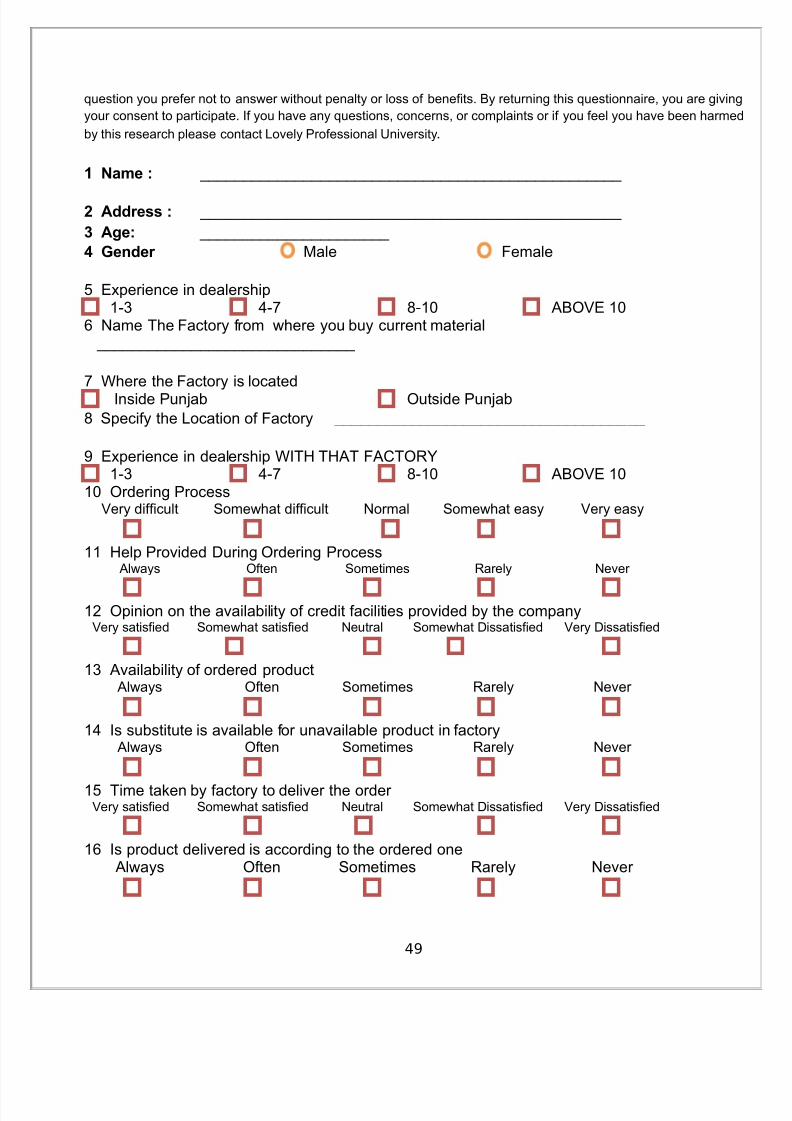
QuestionnaireDear Responded
The purpose of this research is to study the market needs of Malerkotla Market and analyzes the opportunities
available. We are doing this study to understand the factors, to which market is sensitive. Participation in this study
is voluntary. You can choose not to take part and you can also choose not to finish the questionnaire or omit any
48
8/6/2019 Tp Manish and Akur
http://slidepdf.com/reader/full/tp-manish-and-akur 49/51
question you prefer not to answer without penalty or loss of benefits. By returning this questionnaire, you are giving
your consent to participate. If you have any questions, concerns, or complaints or if you feel you have been harmed
by this research please contact Lovely Professional University.
1 Name : _________________________________________________
2 Address : _________________________________________________
3 Age: ______________________
4 Gender Male Female
5 Experience in dealership1-3 4-7 8-10 ABOVE 10
6 Name The Factory from where you buy current material______________________________
7 Where the Factory is locatedInside Punjab Outside Punjab
8 Specify the Location of Factory ____________________________________
9 Experience in dealership WITH THAT FACTORY1-3 4-7 8-10 ABOVE 10
10 Ordering ProcessVery difficult Somewhat difficult Normal Somewhat easy Very easy
11 Help Provided During Ordering ProcessAlways Often Sometimes Rarely Never
12 Opinion on the availability of credit facilities provided by the companyVery satisfied Somewhat satisfied Neutral Somewhat Dissatisfied Very Dissatisfied
13 Availability of ordered productAlways Often Sometimes Rarely Never
14 Is substitute is available for unavailable product in factoryAlways Often Sometimes Rarely Never
15 Time taken by factory to deliver the order Very satisfied Somewhat satisfied Neutral Somewhat Dissatisfied Very Dissatisfied
16 Is product delivered is according to the ordered oneAlways Often Sometimes Rarely Never
49
8/6/2019 Tp Manish and Akur
http://slidepdf.com/reader/full/tp-manish-and-akur 50/51
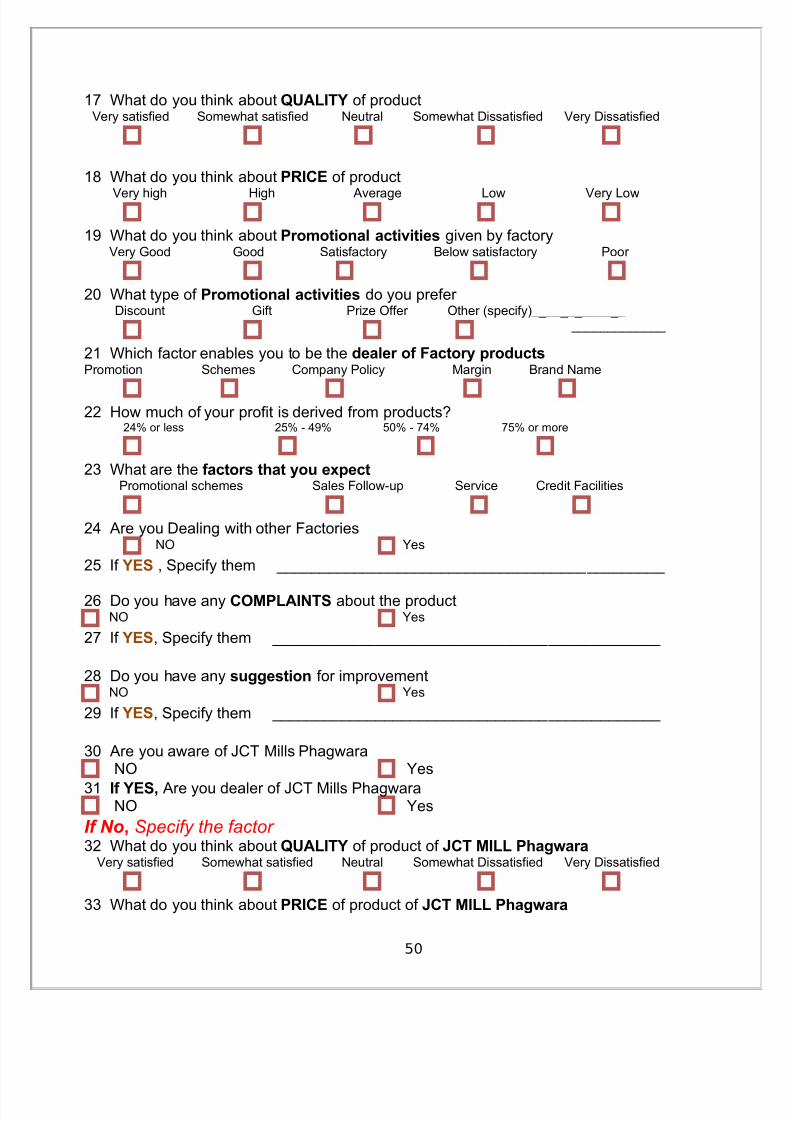
17 What do you think about QUALITY of productVery satisfied Somewhat satisfied Neutral Somewhat Dissatisfied Very Dissatisfied
18 What do you think about PRICE of product
Very high High Average Low Very Low
19 What do you think about Promotional activities given by factoryVery Good Good Satisfactory Below satisfactory Poor
20 What type of Promotional activities do you prefer Discount Gift Prize Offer Other (specify)_____________
_____________
21 Which factor enables you to be the dealer of Factory productsPromotion Schemes Company Policy Margin Brand Name
22 How much of your profit is derived from products?24% or less 25% - 49% 50% - 74% 75% or more
23 What are the factors that you expectPromotional schemes Sales Follow-up Service Credit Facilities
24 Are you Dealing with other FactoriesNO Yes
25 If YES , Specify them _____________________________________________
26 Do you have any COMPLAINTS about the productNO Yes
27 If YES, Specify them _____________________________________________
28 Do you have any suggestion for improvementNO Yes
29 If YES, Specify them _____________________________________________
30 Are you aware of JCT Mills PhagwaraNO Yes
31 If YES, Are you dealer of JCT Mills PhagwaraNO Yes
If No, Specify the factor 32 What do you think about QUALITY of product of JCT MILL Phagwara
Very satisfied Somewhat satisfied Neutral Somewhat Dissatisfied Very Dissatisfied
33 What do you think about PRICE of product of JCT MILL Phagwara
50
8/6/2019 Tp Manish and Akur
http://slidepdf.com/reader/full/tp-manish-and-akur 51/51
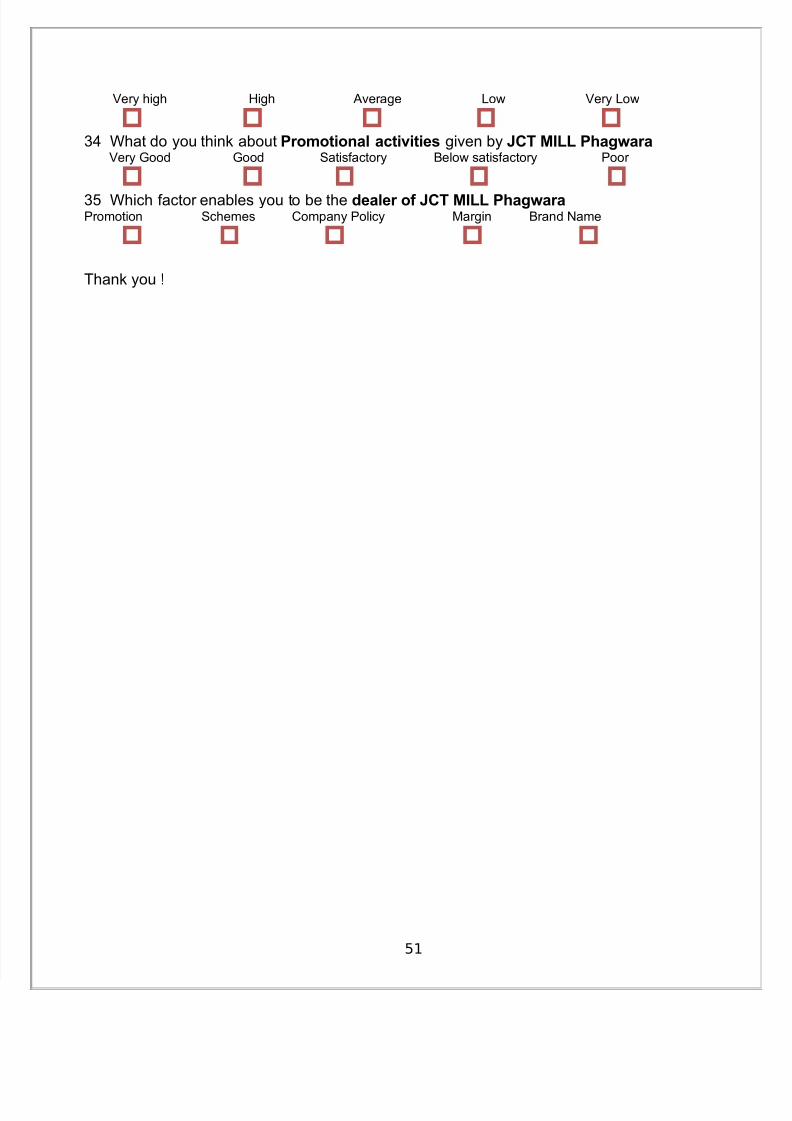
Very high High Average Low Very Low
34 What do you think about Promotional activities given by JCT MILL PhagwaraVery Good Good Satisfactory Below satisfactory Poor
35 Which factor enables you to be the dealer of JCT MILL PhagwaraPromotion Schemes Company Policy Margin Brand Name
Thank you !
Related Documents