Toyota Supply Chain Management
Sep 13, 2014
Welcome message from author
This document is posted to help you gain knowledge. Please leave a comment to let me know what you think about it! Share it to your friends and learn new things together.
Transcript

New York Chicago San Francisco Lisbon London Madrid Mexico CityMilan New Delhi San Juan Seoul Singapore Sydney Toronto
A STRATEGIC APPROACHTO THE PRINCIPLES OF
TOYOTA’S RENOWNED SYSTEM
SUPPLY CHAINMANAGEMENT
ANANTH V. IYERSRIDHAR SESHADRI
ROY VASHER
Copyright © 2009 by Ananth V. Iyer, Sridhar Seshadri, and Roy Vasher. All rights reserved. Except aspermitted under the United States Copyright Act of 1976, no part of this publication may be repro-duced or distributed in any form or by any means, or stored in a database or retrieval system, withoutthe prior written permission of the publisher.
ISBN: 978-0-07-162340-7
MHID: 0-07-162340-X
The material in this eBook also appears in the print version of this title: ISBN: 978-0-07-161549-5,MHID: 0-07-161549-0.
All trademarks are trademarks of their respective owners. Rather than put a trademark symbol afterevery occurrence of a trademarked name, we use names in an editorial fashion only, and to the benefit of the trademark owner, with no intention of infringement of the trademark. Where such designations appear in this book, they have been printed with initial caps.
McGraw-Hill eBooks are available at special quantity discounts to use as premiums and sales promotions, or for use in corporate training programs. To contact a representative please e-mail us [email protected].
This publication is designed to provide accurate and authoritative information in regard to the subjectmatter covered. It is sold with the understanding that neither the author nor the publisher is engagedin rendering legal, accounting, futures securities trading, or other professional service. If legal adviceor other expert assistance is required, the services of a competent professional person shouldbesought.
—From a Declaration of Principles jointly adopted by a Committeeof the American Bar Association and a Committee of Publishers
TERMS OF USE
This is a copyrighted work and The McGraw-Hill Companies, Inc. (“McGraw-Hill”) and its licensorsreserve all rights in and to the work. Use of this work is subject to these terms. Except as permittedunder the Copyright Act of 1976 and the right to store and retrieve one copy of the work, you may notdecompile, disassemble, reverse engineer, reproduce, modify, create derivative works based upon,transmit, distribute, disseminate, sell, publish or sublicense the work or any part of it withoutMcGraw-Hill’s prior consent. You may use the work for your own noncommercial and personal use;any other use of the work is strictly prohibited. Your right to use the work may be terminated if youfail to comply with these terms.
THE WORK IS PROVIDED “AS IS.” McGRAW-HILL AND ITS LICENSORS MAKE NO GUAR-ANTEES OR WARRANTIES AS TO THE ACCURACY, ADEQUACY OR COMPLETENESS OFOR RESULTS TO BE OBTAINED FROM USING THE WORK, INCLUDING ANY INFORMATION THAT CAN BE ACCESSED THROUGH THE WORK VIA HYPERLINK OROTHERWISE, AND EXPRESSLY DISCLAIM ANY WARRANTY, EXPRESS OR IMPLIED,INCLUDING BUT NOT LIMITED TO IMPLIED WARRANTIES OF MERCHANTABILITY ORFITNESS FOR A PARTICULAR PURPOSE. McGraw-Hill and its licensors do not warrant or guar-antee that the functions contained in the work will meet your requirements or that its operation willbe uninterrupted or error free. Neither McGraw-Hill nor its licensors shall be liable to you or anyoneelse for any inaccuracy, error or omission, regardless of cause, in the work or for any damages result-ing therefrom. McGraw-Hill has no responsibility for the content of any information accessed throughthe work. Under no circumstances shall McGraw-Hill and/or its licensors be liable for any indirect,incidental, special, punitive, consequential or similar damages that result from the use of or inabilityto use the work, even if any of them has been advised of the possibility of such damages. This limitation of liability shall apply to any claim or cause whatsoever whether such claim or cause arises in contract, tort or otherwise.

To my wife Vidhya and daughters Apsara and Rani, and in memory of my parents
Thank youAnanth
To my wife Shubha, daughters Padmavati and Sharada,and all my family
Thank youSridhar
To my wife Audrey; daughters Jody and Neely; my mother Emma, who at the time of this writing is 105; and all my family
All my loveRoy

This page intentionally left blank
Foreword by Hau L. Lee vii
Acknowledgments ix
Introduction xi
Chapter 1. Toyota Learning Principles and the v4L Framework 1
Chapter 2. Comprehensive Overview of Supply Chain 5
Chapter 3. Mix Planning 25
Chapter 4. Sales and Operations Planning 37
Chapter 5. Production Scheduling and Operations 55
Chapter 6. Parts Ordering 73
Chapter 7. Managing Suppliers 85
Chapter 8. Logistics 103
Chapter 9. Dealer and Demand Fulfillment 121
Chapter 10. Crisis Management 133
Chapter 11. The Toyota Way of Managing Supply Chains 147
Chapter 12. How to Apply Toyota Way Principles to Nonautomotive Supply Chains 173
Chapter 13. The Beer Game and the Toyota Supply Chain 185
Chapter 14. Reflections of Supply Chain Participants 201
Chapter 15. Reflections 215
Appendix 219
Index 221
Contents
v

This page intentionally left blank
vii
For decades, Toyota’s success in the marketplace has been admired by busi-ness practitioners and executives alike. The automaker is the envy ofothers within the automobile industry, but the company is also consid-
ered to be the symbol of excellence in business in general. The firm has been thefocus of research in academia.
The power of Toyota has been attributed to its two distinct core values: theToyota Way and the Toyota Production System (TPS). The Toyota Way has cre-ated a culture of respect for individuals, promoting innovation and fosteringcooperation. TPS has been the engine under which lean manufacturing, kan-bans, quality systems, just-in-time, and continuous improvement practices havebeen developed. Together, they have been the pillars for the foundation uponwhich Toyota has become so successful.
But the Toyota Way and TPS are just foundational pillars. There is anotherconcrete secret to the success of Toyota: the way the company runs its supplychain. The Toyota Way and TPS of course have been part of how Toyota hasdeveloped its supply chain principles and how the company has applied suchprinciples to work with its suppliers, dealers, and manufacturers. Based on theseprinciples, Toyota has coordinated the plans across the supply chain—and it has executed them well. Supply chain management excellence is the ultimateway in which Toyota has built its superior efficiency in operations.
I am delighted to see this book about Toyota’s supply chain managementwritten by two leading academics and an experienced Toyota executive. Thisbook reveals the powerful way that Toyota runs its supply chain, and it showsvividly how the Toyota Way and TPS have been ingrained in the processes usedby Toyota to run its supply chain. I submit that reading about Toyota Way andTPS is only a starting point for really learning the innovativeness and effective-ness of Toyota’s operations. The current book completes the picture.
Foreword
While TPS is the central theme of how Toyota runs its factories, the scope ofsupply chain management is much greater. It spans suppliers to Toyota as well aspossibly the suppliers’ suppliers, the distribution channel, the dealers, and ulti-mately, the consumers. The coordination, planning, and control of this extensivenetwork are a daunting task. The current book well describes how Toyota hasbeen very smart in examining three dimensions of supply chain management:geography, product, and time. This book gives us a treatment on how Toyota hasdesigned and operated supply chains to adapt to these three dimensions. Forexample, the needs for the Japanese and U.S. markets, the Camry versus theLexus, and at different points in time of the product life cycle, are different, andso different supply chain processes are needed.
I would urge the reader going through this book to keep two perspectivesin mind. First, it describes in great details how Toyota runs its supply chain. Asa result, there are many innovative ideas that Toyota uses, and many best prac-tices described. So the reader can pick up a lot of useful tips and revelations.Second, the structure of the book is extremely helpful to organize your thoughtsand evaluations of your own supply chain. The chapters that follow cover thewhole spectrum of what constitutes comprehensive supply chain management.So, going through the chapters gives you a framework to follow. In that sense,even if you extract the Toyota content out of the chapters, the book is a goodguideline to develop sound supply chain management practices.
One of the most useful conceptual frameworks in this book is the v4L con-struct. We see how Toyota manages its supply chain to ensure that the 4v’s—variety, velocity, variability, and visibility—can be controlled. In every chapter,for every supply chain operation, the authors describe how this can be done.Again, seeing how Toyota has done it is valuable and informative. But I alsothink that the reader can benefit from seeing how the authors developed thethought process behind what Toyota did to accomplish the objectives of gainingcontrol of the 4v’s. That knowledge by itself is highly educational.
For anyone who wants to learn the true secret of Toyota’s operational excel-lence, this book is a must-read. In addition, while learning about Toyota’s supplychain management, we also are given a journey of sound supply chain manage-ment in general.
In my personal research, I have come across Toyota’s supply chain manage-ment practices and have been very impressed by how thorough and innovativethe company has been since its inception in the 1930s. I must congratulate theauthors of this book, as they have done the most comprehensive, insightful, andpenetrating treatment of this subject.
Hau L. LeeThoma Professor of Operations, Information, and Technology
Graduate School of Business, Stanford UniversityStanford, CA
Forewordviii

ix
The authors express their appreciation to the management of ToyotaMotor Engineering & Manufacturing North America, Inc., for provid-ing access to their executives for interviews as well as for the tour of the
Georgetown manufacturing facility. Nancy Banks, manager external affairs, wasextremely helpful in coordinating the interviews and arranging for the planttour. Nancy also spent countless hours reviewing drafts of the book and provid-ing excellent feedback.
The interviews with Toyota executives provided deep insights into Toyota’smanagement of the supply chain. We would like to thank all of the intervieweesfor taking precious time out of their busy schedules to speak with us. GeneTabor and Jamey Lykins, general managers in Toyota’s Purchasing Division, dis-cussed how Toyota’s purchasing relationship with suppliers plays an importantrole to ensure a strong partnership with suppliers at all levels. David Burbidge,vice president of Production Control, provided an excellent overview ofProduction Control’s role in managing the supply chain. Mike Botkin, generalmanager of Logistics, shared with us his expertise of Toyota’s Logistics operation.
In addition, the interviews with executives from Toyota’s partners enlight-ened us on how the extended supply chain supports Toyota’s management phi-losophy. Jeffrey Smith, vice president and general manager for Toyota BusinessUnit Johnson Controls, Inc., has several years of working with Toyota aroundthe world and was able to provide the supplier perspective. Gary Dodd, formerpresident of Tire & Wheel Assembly, also discussed the supplier’s role andexplained the process of becoming a new Toyota supplier. To round out thesupply chain we spoke with Steve Gates, dealer principal, Toyota South inRichmond, Kentucky, to obtain an understanding of the dealer operations inthe Toyota environment. Steve is also a member of Toyota’s dealer council, so he
Acknowledgments

Acknowledgmentsx
was able to provide a comprehensive view not only of the dealer’s operation butalso the Toyota dealer network. Achim Paechtner, former senior manager ofToyota of Europe, provided a framework of how Toyota and other automobilecompanies operate in Europe. Achim’s understanding of the European marketswas extremely helpful.
We thank the Toyota Motor Corporation for endowing the TermProfessorship at the Stern School of Business without which Sridhar Seshadri,the first Toyota Motor Term professor, would never have met Roy Vasher andthis joint project would never have been undertaken. Ananth Iyer acknowledgesthe support of the Krannert School of Management at Purdue University whoseFall DCMME Manufacturing Conference, where Roy was a speaker in 2007,provided a forum for the authors to meet face-to-face for the first time.
We thank Mayank Agarwal, MBA student at the Stern School of Businessfor his extensive research into the automobile business. The research was used inthis book to confirm the benefits of Toyota’s supply chain management. Thefinal manuscript would not be complete without the assistance of LeslieCulpepper, who helped copyedit this manuscript.
xi
Toyota uses unique processes to effectively manage and operate thesupply chain. These processes span the supply chain and have enabledToyota to deliver remarkably consistent performance over decades. The
authors, a retired Toyota senior executive with hands-on experience and twosenior academics, have pooled their combined experience to both describe exist-ing processes as well as understand why they work. By combining the insightsof a practitioner with almost 20 years of Toyota’s execution and managementexperience and two academics with decades of research experience, we hope toprovide a unique presentation of the topic that can influence supply chain prac-tices at auto and nonmanufacturing companies.
The fundamental thesis of this book is that understanding process details,as well as the logic associated with their success, will enable adoption of theseideas in both manufacturing and service contexts. The material in the pages thatfollow provides insights into how Toyota uses learning (L) processes to imple-ment practices and principles, both within Toyota’s cross-functional organiza-tions as well as with Toyota’s partners (including suppliers and dealers)—inshort, across the extended supply chain. We show how integrated and synchro-nized processes enable careful balancing of variety, velocity, variability, and visibil-ity (4v’s) across the supply chain. Learning is linked to the 4v’s to form the v4Lframework. We will describe the v4L framework in more detail in Chapter 1.
In keeping with the “how-to” approach to these complex topics, mostchapters provide illustrative examples that both explain details as well as illumi-nate the logic behind the processes. The choice of topics is meant to focus onessential tactical and operational differences in the way Toyota manages its supplychain. Chapter 1 describes the v4L framework and the Toyota learning principles.Chapter 2 provides a comprehensive overview of processes that are part of the
Introduction

overall supply chain. That, in turn, is followed by topics in the sequence of activities in a supply chain. First, there’s “Mix Planning” (Chapter 3) to supportproduction stability and how this is translated into “Sales and OperationsPlanning” (Chapter 4). We then cover how sales requests are supported by“Production Scheduling and Operations” (Chapter 5), “Parts Ordering”(Chapter 6), and “Managing Suppliers” (Chapter 7). The inbound and outbound“Logistics” processes are described next (Chapter 8), followed by “Dealer andDemand Fulfillment” (Chapter 9) and dealer-related processes, which will com-plete the supply chain coverage. Finally, Chapter 10 covers how Toyota handles“Crisis Management.”
The detailed discussion of Toyota’s supply chain processes will be followedby chapters on “The Toyota Way of Managing Supply Chains” (Chapter 11) andhow that has been used to design and improve each of these steps, and “How toApply Toyota Way Principles to Nonautomotive Supply Chains” (Chapter 12).We have also included a chapter titled “The Beer Game and the Toyota SupplyChain” (Chapter 13), which describes the well-known bullwhip effect in supplychains and examines how following Toyota’s integration of processes across thesupply chain enables reduction of the bullwhip effect. Two “Reflections” chap-ters conclude the book: Chapter 14 examines the reflections of supply chain par-ticipants; Chapter 15 reflects on the Toyota experience in general and considerspotential future innovations in the automotive supply chain.
Although there are several excellent books that describe the Toyota produc-tion system, as well as a few that cover principles used in the Toyota supplychain, we believe there is a benefit to understanding process details in order toexecute processes consistent with the principles. The sources of material for thisbook include firsthand experience with applying these processes at Toyota, directinterviews with Toyota-experienced managers and suppliers, existing books onToyota’s processes, academic research, surveys, and empirical case studies.
Introductionxii
1
Toyota is well known for its approach to problem solving and continuousimprovement. Articles by practitioners, researchers, and participantshave made the tools and techniques of continuous improvement familiar
to every business executive. For example, phrases such as andon, heijunka, andkanban have become part of the day-to-day vocabulary of managers. In aninsightful commentary on these tools and techniques, Jeffrey Liker writes thatToyota’s success goes beyond these tools and techniques to what he calls “TheToyota Way.”1
Liker presents the Toyota Way as an all-encompassing method for design-ing and managing processes. Every student of Toyota also knows that the ToyotaWay is unique, not only in its approach to problem solving but also in perpetu-ating its way of thinking across different types of operations, organizations(including suppliers, logistics providers, and dealers), and worldwide locations.Underlying the success of Toyota is the company’s approach to scientificallyexamining problems, solving them, learning from the experience, and passingon that knowledge to others.
Toyota is a global auto company with many products and markets. Thecompany encompasses markets across the globe with different characteristics(e.g., the United States, Europe, and Japan) that warrant different supply chainconfigurations. In addition, differences among the Toyota, Lexus, and Scionvehicles warrant different supply chain processes. Although common processesunderpin these supply chains, variations across these supply chains provide addi-tional insights. We believe that an understanding of how all these supply chainscoexist in one company provides an excellent learning opportunity for a practic-ing supply chain manager to apply the v4L framework to his or her work.
Toyota Learning Principlesand the v4L Framework
Chapter 1
v4L FrameworkPerformance at Toyota is evaluated with equal weight given to both the processused to derive performance and the results achieved. This process focus aims togenerate a balance of key supply chain parameters—variety of products offered,velocity of product flow, variability of outcomes against forecast, and visibility ofprocesses to enable learning. The learning follows a carefully documented processthat promotes continuous improvement. At the end of every chapter a reflectionsection will be included that links the chapter to the v4L framework: balancingvariety, velocity, variability, and visibility across the supply chain. One way formanagers to understand Toyota’s concepts is to first ask how their company’ssupply chain achieves this balance. Often, variety is chosen with a focus onmarketing benefits with scant attention to supply chain implications, velocity,variability, and the like. This off-optimal choice of variety can have severe reper-cussions across the supply chain, which is often difficult to untangle. A carefulchoice of v4L parameters enables superior supply chain performance at Toyota.
Learning (L) PrinciplesToyota has mastered the art of learning and believes that the principles to attainmastery are universal. Moreover, Toyota has spread these ideas throughout itssupply chain in its leadership role. We shall review these ideas in later chaptersand provide a summary of methods that makes learning a practical and ongoingprocess at every level and every task in Toyota. Toyota’s way of making learn-ing happen not only conforms to the theory of learning (as we mention inChapter 11) but can be simply explained (as is often the case with things thatare very hard to accomplish!). The following are the main principles:
■ Create awareness. Unless problems are seen, they will not be solved.Systems need to be in place to report ideas, problems, deviations, andpotential issues to a direct team leader with no delay.
■ Establish capability. Unless someone is capable of solving a problem thatmight arise within the system boundaries set for him or her, that personwill be unable to contribute to the problem-solving process and will beunable to recognize the need for specialized help.
■ Make action protocols. Actions have to be taken within a set of con-straints, and they must conform to certain standards. Doing so will helpin the identification of the relation between action and results. It will aidin the codification of the knowledge for future use, with the same lan-guage and format used as well as similar content.
■ Generate system-level awareness. As experience with solving problemsis obtained, greater awareness of other areas that might be affected
Toyota Supply Chain Management2
by actions or that might impact one’s own performance needs to becreated.
■ Produce the ability to teach. As system-level awareness and experienceaccumulate, the capability to teach others about these methods needs tobe in place.
v4L PrinciplesThe v4L learning principles are combined across all Toyota supply chain man-agement processes to systematically focus on the v4L balance:
■ Variety is carefully chosen to balance market demands and operationalefficiency. Awareness of the impact of variety on the market demand andon manufacturing and supply chain costs enables all the entities acrossthe supply chain to be considered when decisions regarding variety arebeing made. In one sense, variety represents a crucial supply chain designchoice that has an impact across all supply chain participants. A key issuewhen variety is being chosen is the need to have feedback loops to ensurethat the selected variety represents the best response to current marketconditions. As we will discuss in each of the chapters, this is where thelearning features of Toyota’s process enable the constant loop of Plan,Do, Check, and Act (PDCA).
■ Velocity of supply chain flows is the next key concept, and it manifestsitself in all processes across the supply chain. A focus on maintaining asteady flow throughout the system enables capacity planning to be syn-chronized across the supply chain. The detailed process descriptions inthe following chapters will highlight how a rate-based approach serves asa linchpin for the planning processes across the system.
■ Variability of orders or deliveries across the supply chain is minimized byhow the individual processes are executed. Reducing variability enablesall of the supply chain flows to operate with low levels of inventory. Italso enables quality improvement processes to operate without interrup-tion, thus enabling continuous cost reductions and quality improve-ments. Notice that variety, velocity, and variability all interact to stabilizesupply chain performance.
■ Visibility of all processes is ensured with use of the right metrics and therequirement that a consensus be reached before plans are changed. AtToyota, performance metrics have a 50 percent weight for results and a 50 percent weight for process compliance. In other words, the goal is toreward not only short-term successes but also ensure that the correct pro-cesses are followed. Such an approach ensures that bottlenecks are visibleand responses immediate, changes are deliberate, velocity is maintained,
Toyota Learning Principles and the v4L Framework 3
variety is synchronized to demand, and variability is minimized. Visibilityenables continuous learning and feedback, thus guaranteeing that executionof processes remains synchronized with market realities.
We suggest that v4L highlight the intricate balance of all supply chainprocesses. How each of them is balanced by vehicle type or geography is a busi-ness choice that reflects Toyota’s competitiveness in that market. The choice ofthe v4L and the actions required to implement these choices are guided by thelearning principles. All companies should be asking themselves how their cur-rent choices reflect the impact of the v4L. A way to remember this concept is toask, is the supply chain’s v4L engine at my company appropriately tuned forcompetitive performance?
Endnote1. Jeffrey K. Liker, The Toyota Way. New York: McGraw-Hill, 2004.
Toyota Supply Chain Management4

5
The Toyota Production System (TPS) is the benchmark used throughoutthe world as the foundation for “lean” thinking. At Toyota, the TPSpractices and principles extend well beyond the factory walls to include
the extended supply chain and require some crucial choices to ensure supplychain efficiency. This chapter explains how Toyota plans and operates its supplychains globally. But first, a brief look at the extended global automobile supplychain is in order, which will enable you to understand the processes described inthe following chapters.
The automotive supply chain is very complex and consists of manyprocesses that, when linked together, form a supply chain from the customerback to the various tiers of suppliers. The physical processes consist of the pro-duction of parts at the suppliers, transportation of these parts to the assemblyplant of the original equipment manufacturer (OEM), assembly of parts into acompleted vehicle, distribution of completed vehicles to dealers, and finallydelivery to a customer. In addition to the physical processes, there are both pre-production and day-to-day operational support processes. To fully understandthese processes, some background on the auto industry is necessary. The follow-ing questions need to be answered:
■ What is the product?■ Who are the customers?■ What are the distribution models?
What Is the Product?A car or a truck can be described with its specifications. Each OEM uses aslightly different terminology to define a vehicle’s specifications. Toyota uses a
Comprehensive Overview of Supply Chain
Chapter 2

hierarchical method of vehicle specifications. The typical hierarchy of the vehi-cle specifications is shown in Table 2-1. The following are some examples ofvehicle specifications:
■ Make. Toyota, Lexus■ Models. Camry, Avalon, Tundra, Sienna, etc.■ Body style. Four-door sedan, two-door coupe, convertible, crew cab,
double cab, etc.■ Grade. XLE, LE, SE, etc. When a grade is selected, it usually includes
several standard equipment items. Typically the higher-grade vehiclesinclude many standard items. Sometimes when the grade is selected, theengine and transmission combination is included as standard equipment.
■ Engine. Six-cylinder, four-cylinder, etc.■ Transmission. Automatic, five-speed, etc.■ Factory options. Engine, transmission, sunroof, air-conditioning, naviga-
tion, radio, power windows, etc.■ Accessories. These items are like options, but they can be installed in the
factory or added after the vehicle is built. Examples are spoiler, towhitch, roof rack, and pinstripes.
In addition to the above specifications, exterior and interior colors must beincluded to complete the vehicle build specifications:
■ Exterior color. The outside color is usually one color; however, it couldbe two-toned.
■ Interior trim/color. The interior colors (e.g., black leather and gray cloth)are usually coordinated with exterior ones, but not all interior colorsalways will be available with all exterior colors.
So each vehicle is built with a unique set of specifications called a “buildcombination.” If all possible build combinations were produced, then the totalbuild combinations for a model would be in the millions. This variety wouldmake managing the supply chain an extremely complex and costly process;therefore, many automotive companies limit the number of build combinations
Toyota Supply Chain Management6
Table 2-1. Vehicle Specifications Hierarchy
Make Model Body Grade Options Accessories
Toyota Camry Sedan LE Sunroof SpoilerSedan XLE Navigation Floor mats
Tundra Crew cab XM Radio Tow hitchDouble cab Sunroof Bed liner
Lexus ES350 Sedan Navigation Floor mats
offered in each market area. Toyota has been extremely successful in balancingthe combinations that are made and sold by sales area. For example, oneapproach used at Toyota to reduce the build combinations is to include manystandard equipment options based on the model and grade that is selected. Themethodology on how to choose profitable levels of variety to be offered acrossmarket areas is explained in Chapter 3.
Who Are the Customers?Automobile companies have several categories of customers that need to be con-sidered. The following is a list of the types of customers and a brief descriptionof each:
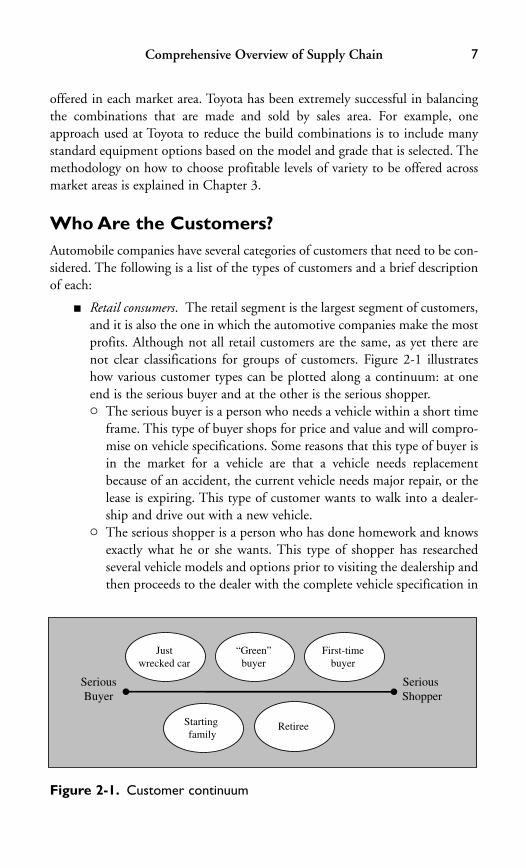
■ Retail consumers. The retail segment is the largest segment of customers,and it is also the one in which the automotive companies make the mostprofits. Although not all retail customers are the same, as yet there arenot clear classifications for groups of customers. Figure 2-1 illustrateshow various customer types can be plotted along a continuum: at oneend is the serious buyer and at the other is the serious shopper.� The serious buyer is a person who needs a vehicle within a short time
frame. This type of buyer shops for price and value and will compro-mise on vehicle specifications. Some reasons that this type of buyer isin the market for a vehicle are that a vehicle needs replacementbecause of an accident, the current vehicle needs major repair, or thelease is expiring. This type of customer wants to walk into a dealer-ship and drive out with a new vehicle.
� The serious shopper is a person who has done homework and knowsexactly what he or she wants. This type of shopper has researchedseveral vehicle models and options prior to visiting the dealership andthen proceeds to the dealer with the complete vehicle specification in
Comprehensive Overview of Supply Chain 7
SeriousBuyer
SeriousShopper
Justwrecked car
First-timebuyer
“Green”buyer
RetireeStartingfamily
Figure 2-1. Customer continuum

hand. Because the serious shopper is very particular about the vehiclehe or she wants, this customer will shop around or perhaps wait untila vehicle can be ordered “fresh from the factory.” Examples of the seri-ous shopper are a consumer who is young, a first-time buyer, and acar enthusiast.
� The area on the continuum from the serious buyer to the seriousshopper is by far where most customers can be found. Indeed, mostcustomers who walk into a dealership have not made up their mindson the exact vehicle specification or even if they are ready to buy avehicle.
■ Employees/suppliers:� Employees. Automotive companies allow employees, relatives, and (in
some cases) friends to purchase a limited number of vehicles per yearat a substantial discount. The employees must receive prior approvalbefore proceeding to a dealer to make a purchase or place an order.The purchase price is calculated automatically based on the discountallowed. The dealer may also receive some rebate to ensure that thedealer margin is maintained.
� Suppliers. Automotive companies may offer selected employees ofsuppliers a vehicle purchase program. This arrangement is similar tothe employee purchase program in that the purchaser must get priorapproval before proceeding to a dealer to purchase a vehicle. The pur-chase price is calculated automatically based on the discount allowed.The dealer may also receive some rebate to guarantee that the dealermargin is maintained.
■ Fleet:� Rental companies. The rental companies (Hertz, Avis, Enterprise,
etc.) negotiate a contract with each automobile company for annualvolume of each model. The detailed specifications of each monthlyvehicle order are submitted in advance, and the vehicles are scheduledfor production based on the delivery schedule requested by the rentalcompanies. Because space at most rental facilities is limited, the rentalcompanies need to minimize the overlap of new vehicles arriving andthe used vehicles being shipped out for auction or resale.
� Commercial fleet. These are private companies that provide a com-pany car for selected employees who require a vehicle to perform theirjob or for certain executives as a perk. Examples are senior manage-ment, sales representatives, taxi drivers, and delivery persons. Thesesmaller fleet customers may negotiate a deal with the automotivecompany or a dealer. In some cases there may be a long-term contractwith multiple automotive companies to provide specific models for a
Toyota Supply Chain Management8
company vehicle program. The company may offer employees anoption to select from a list of vehicles with specified options frommultiple automotive companies. Then, either based on a lease periodor on mileage, the employee will order a replacement vehicle.
� Government entities. All levels of government—federal, state, andlocal—purchase vehicles from the automotive companies. Contractsare usually negotiated with the automotive companies to providevehicles over a period of time. In many cases, special orders may needto be placed for vehicles with unique equipment such as police carsand fire trucks.
Clearly, streamlining the supply chain requires an understanding of the cus-tomer types and relative size and profitability of each segment. The following aresome examples that show how the customer types affect the supply chain:
■ At Toyota plants in Japan, a large percentage of the production orders areexported to countries all around the world. So these order requirementsare fixed and scheduled at least one month in advance for production.Toyota’s advantage is that it can allow its domestic dealers in Japan tochange a greater percentage of orders closer to production because theexport orders do not change. The export orders create a buffer to absorbthe domestic changes in orders.
■ At Dell, about 85 percent of the orders are for corporate customers.Corporate orders are forecast in advance and can be scheduled based onthe lead time for each corporate customer. The retail orders comingthrough the Internet can be fulfilled quickly even if demand is highlyvolatile, because the corporate orders can be shifted slightly to absorb thevariability in retail customer demand.
■ At Ford, when Hertz was a wholly owned subsidiary, at least 40 percentof some models were sold to Hertz. This arrangement enabled Ford touse the Hertz volume to fill in the valleys in demand during the yearwhen retail sales were slow.
Thus, customer types and order characteristics can be used to build a moreflexible supply chain.
What Are the Distribution Models?The term “distribution model” defines the method used to distribute vehiclesfrom the assembly plant to the dealers. There are many variations in the distri-bution model within the automotive industry. At Toyota, the distribution modelis different for various regions around the world. For example, the United States,Europe, and Japan all have different models, and in some cases the models vary
Comprehensive Overview of Supply Chain 9

within a regional area. Lee, Peleg, and Whang explain that just as Toyota has aset of central core values but allows individual divisions to customize to localconditions, when it comes to supplying to different geographies, different prod-ucts, or at different times in the product life cycle, “the company adapts thedesign and control of its demand chain so that it has the right demand chain forthe right product, in the right place, and at the right time.”1 In the UnitedStates, there are three distribution models:
■ North American production. In this model, vehicles are produced at theNorth American assembly plants and shipped to North American deal-ers. Once vehicles are released from the plant, they are moved to a mar-shaling yard. The function of the marshaling yard is to prepare thevehicles for shipment. Vehicles are shipped via train and truck to thedealerships. If vehicles are shipped by train, then they must be trans-ferred to trucks at a railhead near the dealership. If vehicles are shippedby truck, then they will be delivered directly to the dealership. While thevehicles are in the marshaling yard, some accessories can be added, a finalquality assurance check performed, prep performed on selected vehicles,and the price label affixed to the side window. “Prep” is a term thatdescribes the tasks that are normally performed at the dealer just prior tocustomer delivery. The total time it takes to distribute a vehicle once itleaves the assembly plant can range from two days to three weeks,depending on how far the dealer is located from the factory. In this dis-tribution model, vehicles are typically allocated and assigned to dealerstwo to four weeks prior to production. The vehicle inventory is stored atthe dealerships.
■ Overseas production distributed in North America. With this distributionmodel, vehicles produced in Japan are shipped via large vessels to portsin North America and then transported to dealerships. The port providesfunctions similar to the marshaling yards’; however, typically there areseveral accessories that are installed at the port to enable the dealers tocustomize the vehicles closer to delivery. It takes three to five weeks toship the vehicles from Japan to North American ports. It can takeanother two days to one week to transport to dealers via truck. Thereason why this delivery time is shorter than the time it takes to trans-port vehicles from the North American factories is that vehicles arrivingfrom Japan are shipped to a port that is located geographically close todealers. The ports are located in cities such as Portland, Oregon; LongBeach, California; Houston, Texas; Jacksonville, Florida; and Newark,New Jersey. The vehicles are normally allocated and assigned to dealerswhile they are in transit from Japan to the port; however, they must beallocated to a regional area prior to being loaded onto the ships. That
Toyota Supply Chain Management10

step is necessary because vehicles destined for the East Coast will beloaded onto different ships than ones destined for the West Coast. Aswith the North American model, vehicle inventory in this productionmodel is stored at the dealerships.
■ Scion model. Scion cars are produced in Japan and distributed in NorthAmerica in a manner similar to the distribution model described previ-ously; however, there are some significant differences that provide thedealers with much greater flexibility to customize the Scion cars for cus-tomers. The first difference is that Scion cars are shipped to the portswith only basic equipment installed at the factory and in limited colors.The second difference is that Scions are allocated but not shipped to thedealers until the dealer makes a request. That arrangement allows thedealer to select a base model and color, and then add accessories to cus-tomize it to meet the customer requirements. Most vehicle inventory isheld at the port, which allows flexibility for customization. That adapt-ability is consistent with the key strategy behind Toyota’s introduction ofthe Scion, namely, to keep a customer for life.2 As stated previously, thevehicle inventory is stored at the port with the exception of a limitednumber of vehicles located at dealers for display.
■ European distribution model. In Europe, the distribution model is verydifferent from North America, because most dealers are located in urbanareas and do not have room for vehicle stock. Therefore, once vehiclesare released from the plant, they move to a marshaling yard. The func-tion of the marshaling yard is only to stage the vehicles for shipment.Vehicles are shipped primarily by truck to a consolidation point called a“hub.” Generally there is at least one hub for each country; however,smaller countries may share a hub, and large countries may have multi-ple hubs. The hub serves to hold the vehicle inventory until a dealer signsa contract with a customer. At that time, an order is sent to the hub fora specific vehicle. Also, the dealer can request additional accessories to beinstalled at the hub prior to shipment. The transit time from a hub tothe dealer averages one week. In Europe, most vehicle inventory is storedat the hub, not at the dealerships.
■ Japanese distribution model. In Japan, the distribution model is similar tothat for Europe because most dealer retail outlets have very small storagelots. The difference is that in Japan each dealer has a consolidation centerwhere the vehicle inventory is stored until one of the dealer retail outletssells a vehicle. At that time an order is sent to the consolidation centerand the vehicle is shipped to the dealer retail outlet. Again, as in Europe,most vehicle inventory is kept at the consolidation center, not at thedealerships.
Comprehensive Overview of Supply Chain 11

Supply Chain OverviewThe supply chain has both physical components as well as operational and plan-ning processes.
Physical FlowsThe physical flow of the supply chain is shown in Figure 2-2. Parts are producedby suppliers and transported by inbound logistics to the assembly plant. At theassembly plant, the vehicle begins in the body shop, moves to the paint shop,then to assembly, and finally to inspection. Once the vehicle is produced, it istransported to the dealerships via outbound logistics. On paper this processlooks very simple; however, it is complex because a vehicle is very large andbulky, it is assembled from thousands of parts that are produced by hundreds of suppliers, and there are thousands of vehicle combinations that could be produced.
Suppliers Suppliers provide thousands of parts and components that go intothe vehicle. These parts and components are received via the inbound logisticsnetwork from hundreds of tier 1 suppliers. Tier 1 consists of the first-level sup-pliers that make parts and ship directly to the assembly plants. Because suppli-ers also have suppliers, and those suppliers have suppliers, the supply chaincontains several levels that are referred to as tier 1, tier 2, tier 3, and so on. Soyou can imagine how complex the inbound supply chain is for an automobileassembly plant. In addition, because suppliers are located in various geographicareas, the time for parts to arrive from each supplier to the assembly plant canvary greatly. Local suppliers may be only one or two days away from the assem-bly plant, whereas suppliers located overseas may require several weeks of trans-portation time.
Inbound Logistics After parts are produced by the suppliers, they are shipped tothe assembly plants. The process to ship these parts from the many suppliers toeach assembly plant is referred to as “inbound logistics.” At Toyota, parts aredelivered in two ways. Overseas parts coming from Japan are shipped via vessel
Toyota Supply Chain Management12
FactorySuppliers Inbound Logistics Body Paint Assembly Inspection
OutboundLogistics
Dealers
Figure 2-2. Physical flow

and then by railcar to the assembly plant. Once the railcar arrives at the assem-bly plant rail yard, the container is offloaded onto a truck and driven to theassembly dock.
Local parts produced in North America are shipped by truck using a dedi-cated logistics partner. Toyota takes complete responsibility for pickup andtransportation of parts from the suppliers to the plants, because Toyota’s just-in-time parts inventory practice requires extreme reliability of inbound logistics.Toyota organizes the suppliers into clusters based on geographic proximity. Thetruck routes are designed for parts to be picked up from multiple suppliers anddelivered to a regional cross-dock. To improve efficiency, the same truck willpick up parts not only from multiple suppliers but also from each supplier des-tined for different Toyota plants.
Once trucks arrive at the cross-dock, the parts are unloaded and staged foreach assembly plant. They are then loaded onto trucks that take parts directly toeach plant. Trucks are unloaded at the plant based on the progress of produc-tion. If the plant is operating on schedule, the trucks will wait only a few hoursin the plant yard. After the parts are unloaded, the truck is reloaded with thecorresponding empty returnable containers. These returnable containers flow inreverse through the cross-dock and back to the supplier to be reused for a futureshipment.
Production Vehicles are produced at the final assembly plant from the partsprovided by hundreds of suppliers. A typical assembly plant will have one ormore separate lines on which vehicles are assembled. The plant is subdividedinto shops. The vehicle is born in the body shop where the frame and body areformed. The body parts are stamped in the stamping shop by presses. The bodyshop is where numerous robots are used to weld the body parts together. Oncethe body is assembled, then the vehicle moves to the paint shop and its exterioris painted.
After the vehicle is painted, it moves down the line into final assembly. Atthat point most of the supplier-provided parts are installed to make a finishedvehicle. Each part is assigned a line location so that parts can be delivered fromthe dock to a line address based on a bar code label affixed to the parts containerby the supplier. After the vehicle is assembled, fuel is added and the vehicle isdriven off the assembly line. But at that point the process is not yet completebecause the vehicle still needs to go through several quality control steps alongwith final inspection. Once the vehicle completes the final inspection, it isreleased from the factory for shipment to the dealer.
Outbound Logistics Vehicles that are produced at an assembly plant must betransported to each dealer. This process is commonly referred to as “outbound
Comprehensive Overview of Supply Chain 13
logistics.” In the United States, vehicles are transported by two modes: railcarand truck. Because of the long distances that vehicles must travel, about 75percent of the vehicles travel via railcar and are then loaded onto trucks for deliv-ery to the dealers. The remaining 25 percent are delivered by truck to dealersthat are located within two to three days’ drive from the factory. In Europe, mostvehicles are shipped by truck; however, sometimes ships must be used whenthere is a large waterway that must be crossed.
Just outside the assembly plant, there is a large yard that is used to stage thevehicles prior to shipment. At Toyota, these yards are referred to as “marshalingyards.” In the United States, these yards perform three functions. Team membersinstall accessories, perform final quality assurance, and stage vehicles for shipment.Once the vehicle is ready for shipment, it is driven to either the railcar staging areaor the truck staging area.
For railcar shipments, there are two types of railcars: bi-level and tri-level.“Bi-level” means vehicles are loaded onto two levels within the railcar, and “tri-level” means vehicles are loaded onto three levels. The capacity of a bi-level rail-car is 9 to 10 vehicles; a tri-level, 14 to 15 vehicles. Therefore, vehicles are stagedin lanes according to the capacity of the railcar and the destination.
Vehicles shipped by truck are identified by the dealer and parked in a truckstaging area. The trucking company is responsible for selecting the vehicles to beloaded onto each truck based on the route plan for that truck. The truckingcompanies have a delivery performance objective to deliver all vehicles withintwo days. To ensure that both the trucking and rail companies have adequatecapacity to ship vehicles, the assembly plant needs to provide a day-to-day fore-cast of volume by destination.
Dealers Dealers play a key role in the supply chain because they are the faceof Toyota to the customer. They are responsible for selling the vehicles pro-duced by the manufacturer to the retail customers. In addition to sellingvehicles, dealers have an extremely important influence on customer satisfac-tion. Independent customer surveys such as the “J.D. Power survey”3 measurecustomer satisfaction in various categories. The two prime categories are (1)initial vehicle quality and (2) customer satisfaction regarding the sellingprocess. Customers that score the selling process low also tend to give lowerscores on the initial quality survey. A high J.D. Power score can be a valuablemarketing tool for an automobile manufacturer. Therefore, it is critical notonly that the vehicle quality itself be high but also that the customer buyingexperience be positive—or at least not negative. Two reasons that the Lexusvehicles always score high in the J.D. Power survey are that the vehicles areassembled with extreme attention to detail and that the customer is also pampered by the dealer.
Toyota Supply Chain Management14

It is imperative that a dealer invest sufficiently in a facility so that it canoperate efficiently and at the same time meet or exceed its sales objectives. A keyfactor in a lean supply chain is the optimum level of dealer stock. It is also crit-ical that a dealer have an adequate mix of stock so that most of the customerscan be persuaded to buy from stock and the dealer does not end up with toomany aged stock units. (Mix planning is discussed in Chapter 3.)
Vehicles are shipped to dealers from the assembly plants or from the port ofentry. They are delivered by truck. The delivery time window will vary by dealerdepending on dealer location and operating hours. Most dealers will acceptvehicles only during business hours; however, a dealer may not want to be inter-rupted during very busy times. Therefore, the trucking company must under-stand the dealer’s delivery time windows and schedule its deliveries accordingly.Most trucks will deliver a load of vehicles to multiple dealers, so the loadingsequence must be planned based on the delivery route.
One of the key responsibilities of the salesperson is to guide customerdemand. Toyota’s sales model is designed so that a high percentage of vehicles issold from a relatively low level of dealer stock. The objective is to stock 20 per-cent of build combinations that represent 80 percent of the sales for each marketarea. Some of the techniques that a dealer uses to achieve this end are to adver-tise and promote only the popular models and display these models in the show-room or in an area that is easy for the customer to see.
Once a vehicle is sold, the dealer must “prep” the vehicle for customer deliv-ery. That usually means the dealer has to install wheel covers, wash and clean thevehicle, fill the tank with fuel, and inspect the vehicle to ensure that there are nodefects. In addition, the dealer needs to prepare appropriate documents. At thetime of delivery, the dealer will instruct the customer on how to operate variousfeatures of the vehicle, complete the paperwork, accept payment or arrangefinancing, and in some cases take possession of the trade-in vehicle.
After the vehicle is delivered, the dealer submits a sales transaction to themanufacturer, which will relieve the stock, provide the dealer with credit for thesale, and start the customer warranty date.
Various operational processes are necessary to operate the supply chain;Figure 2-3 provides another view of the transformation process that takes placefrom parts produced by suppliers to vehicles ready for sale at dealers.
What is the difference between the supply chain of most car manufacturersand of Toyota? Visualize the Toyota supply chain operation as a giant Swissclock. The plant is the main mechanism of the clock. When a clock is openedto expose all of its working mechanisms, there are various-sized movements thatare all moving at different speeds but are integrated precisely to ensure that thecorrect date and time are displayed on the face. This continuous motion repeatsitself at numerous intervals: seconds, minutes, hours, days, months, and so on.
Comprehensive Overview of Supply Chain 15
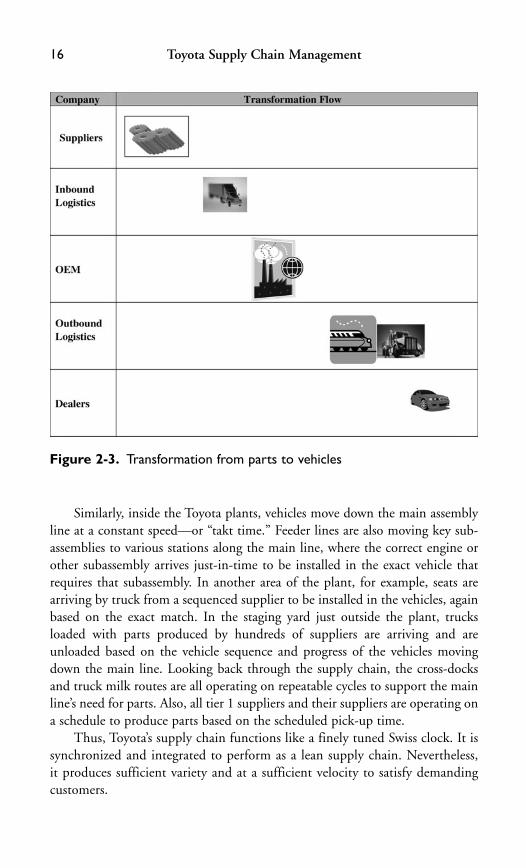
Similarly, inside the Toyota plants, vehicles move down the main assemblyline at a constant speed—or “takt time.” Feeder lines are also moving key sub-assemblies to various stations along the main line, where the correct engine orother subassembly arrives just-in-time to be installed in the exact vehicle thatrequires that subassembly. In another area of the plant, for example, seats arearriving by truck from a sequenced supplier to be installed in the vehicles, againbased on the exact match. In the staging yard just outside the plant, trucksloaded with parts produced by hundreds of suppliers are arriving and areunloaded based on the vehicle sequence and progress of the vehicles movingdown the main line. Looking back through the supply chain, the cross-docksand truck milk routes are all operating on repeatable cycles to support the mainline’s need for parts. Also, all tier 1 suppliers and their suppliers are operating ona schedule to produce parts based on the scheduled pick-up time.
Thus, Toyota’s supply chain functions like a finely tuned Swiss clock. It is synchronized and integrated to perform as a lean supply chain. Nevertheless, it produces sufficient variety and at a sufficient velocity to satisfy demandingcustomers.
Toyota Supply Chain Management16
Figure 2-3. Transformation from parts to vehicles
Operational ProcessesSeveral operational processes must be performed on a periodic basis to guaran-tee that the physical supply chain is operating efficiently and effectively. Theseprocesses integrate and synchronize the operational processes with the physicalprocesses to ensure a lean supply chain. The key processes are as follows:
■ Mix planning■ Sales ordering/forecasting■ Production scheduling■ Dealer allocation■ Parts ordering/forecasting■ Inbound logistics planning
For some perspective of what these processes entail, a thorough explanationof Toyota’s practices and principles follows. The detailed processes and the logicused to execute these processes will be described in Chapters 3 through 9.
Mix Planning Mix planning is the process of limiting the number of build com-binations that are ordered for stock in each market area. As mentioned earlier,“build combination” is a term that defines the unique set of specifications for avehicle. For mix planning purposes, vehicle specifications are divided into threecategories: factory-installed options, color, and accessories that can be installedafter a vehicle is built. Mix planning is initially performed on an annual basisprior to new model launch and can be adjusted monthly to reflect changes indemand and/or seasonal trends. For the United States market, the mix planningis done at the region level to ensure that the vehicles ordered for stock closelymeet the needs of the geographic area. For example, sport utility vehicles (SUVs)ordered for dealers located in the northern states would almost always beequipped with four-wheel drive, whereas SUVs ordered for southern states wouldbe ordered with two-wheel drive. Another example is vehicles ordered for Arizonabeing painted with light colors (certainly not black!) because of the heat.
In Europe, the mix planning is done country by country because many ofthe countries have unique requirements. For example, the United Kingdomrequires right-hand-drive vehicles whereas the countries on the Continentrequire left-hand-drive. Also, there are various regulations in different countries,significant climate differences from Norway to Spain, and substantial economicdifferences between Western and Eastern Europe.
Sales Ordering/Forecasting One of the functions of the sales division is to pro-vide a monthly production order and forecast. That is in the form of a rollingthree-month plan with the first production month categorized as a firm orderand the next two months as a forecast. The firm order requires the sales division
Comprehensive Overview of Supply Chain 17

to commit to the total volume of units for the month, whereas for the forecastmonths the volume can change. The content of the order month, however, canchange in terms of number of vehicles up to one to two weeks prior to produc-tion. The process starts with the sales and production divisions first agreeing to aplanned volume of units or vehicles that are going to be produced each month.Sales divisions determine their request by analyzing recent sales and stock levels.Sales divisions will also consider marketing promotions and seasonality changes.Both sales and production divisions collaborate to agree on the total plannedvehicle volume for each of the next three months. The total vehicle volume is fur-ther broken down by vehicle model and by plant. Next, sales divisions allocatethe total volume by model to each region based on sales performance. Then eachregion uses the mix plan along with the recent sales trends to create the quantityof each build combination for each month for each vehicle model. The mix planor target is compared to the actual mix of sales and the actual mix of stock to deter-mine which build combinations need to be ordered to maintain the target level ofmix for stock. In addition, the regions may need to make adjustments for any spe-cial dealer requests and also need to consider any special promotions or seasonaltrends; for example, sunroofs and convertibles sell better in spring and summer.
Once the forecast is made and the order is completed by each regional office,it is sent to the sales divisional headquarters. There it is checked before it is for-warded to the production divisional headquarters to create a production schedule.
Production Scheduling Production scheduling is the process of taking themonthly order and forecast from sales and assigning a production date andsequence to each vehicle. The objective is to create a production schedule that isleveled across each day of each production month using the heijunka principle.
Heijunka is a Japanese term that is defined as “smoothing.” The concept isto assign each vehicle option a smoothing weight based on its importance tomanufacturing. For example, engines will get a higher weight than color, becauseif they were not evenly scheduled over the month and there were a change in pro-duction of engines, that would have a greater negative impact on manufacturing.
The term “production month” is different from “calendar month.” For eachcalendar year, a production calendar is created. There will always be 52 or 53production weeks in a year. A week is assigned to a month, based on Monday’sdate. For example, if January 31 falls on Monday, then that complete week isconsidered January production. February production would start with theFebruary 7 week and end with the February 28 week. The only exception to thisrule is the week that includes January 1. The week that contains the January 1production day will always be week 1, even if January 1 does not begin on aMonday, which means it may contain some December days. Each productionmonth will contain an even four or five weeks.
Toyota Supply Chain Management18

After the production plan is complete, it is sent back to sales with a sched-uled build date for each vehicle. A copy is also sent to the parts ordering groupat each assembly plant.
Dealer Allocation Dealer allocation is the responsibility of the sales regions. Thedealer allocation process is usually performed twice each month for two weeksof production at a time. That occurs four to five weeks prior to the scheduledbuild dates for the vehicles that are being allocated.
Prior to the allocation process, dealers can update their profile with specificguidelines on the type of vehicles they either want—or in some cases do notwant—to be allocated. For example, dealers in northern cities may want a coldweather kit, and dealers in Arizona may not want dark-colored cars. This dealerprofile is important because each region covers a large geographic area of severalstates that may have different climates and demographics.
The allocation process is executed by each region for its dealers. The alloca-tion quantity for each vehicle model is based on a “fair-share method” (some-times referred to as “turn and earn”) to guarantee that each dealer is treatedfairly. The concept involves basing the allocation on how well each dealer is sell-ing its previous allocation compared to all other dealers. Another benefit of thismethod is that it ensures that the inventory is rebalanced across all dealers.
After the vehicles are allocated, they are assigned to the dealer and will bevisible to the dealer as pipeline orders. A pipeline order is a vehicle that is in thescheduled pipeline and will be built during the week identified with each vehi-cle. Each vehicle has a full set of specifications, including color. Therefore, thevehicle will be built as is unless the dealer submits a change request.
Parts Ordering/Forecasting The parts ordering process is actually two differentprocesses: one for local parts and another for overseas parts. The local processrequires that the vehicles scheduled for each day be placed in the exact sequencethat they would be built on the assembly line. The next step, after each vehicleis scheduled by day, is to sequence the vehicles into the ideal sequence in whichthey would be assembled. The concept used is to consider the impact of theschedule on the factory team members and equipment. It is important tosequence the vehicles so that vehicles that contain high workload or processcomplexity are not scheduled back to back.
Once the vehicles are aligned in sequence for each day, parts calculation isperformed for each vehicle. Then the parts installation time stamp is applied toeach part for each vehicle. One time stamp calculation follows:
■ Vehicle number 500 of the day is scheduled to line-off the end of theassembly line at 1 p.m.
Comprehensive Overview of Supply Chain 19

■ Part A is installed at a workstation 2 hours prior to line-off.■ Part B is installed 2 hours and 30 minutes prior to line-off.■ Part A would have a time stamp of 11 a.m. (1 p.m.–2 hours).■ Part B would have a time stamp of 10:30 a.m. (1 p.m.–2:30 hours).
Next each part’s lead time from the supplier to the lineside is determined.That will determine at what day and time the supplier will need to ship the partto arrive at the lineside just-in-time. Other factors, such as lot size, shippingfrequency, and adjustments, need to be considered as well when the parts orderis calculated.
Adjustments are made in two ways. One way is for a vehicle specification tobe changed by a dealer after parts have already been ordered from some suppli-ers. This occurs when a supplier’s lead time is longer than the freeze point forthe assembly plant. A freeze point is the last day prior to production on whichchanges can be made to vehicle specifications. The plant’s freeze point is basedon the 80 percent rule (i.e., the point is selected so that 80 percent of the sup-pliers have a lead time shorter than the freeze point). In other words, if the freezepoint specification is five days, then 80 percent of the suppliers’ deliveries shouldtake less than five days. The freeze point will vary by plant but will range from5 to 10 days. This still leaves 20 percent of the suppliers that are outside thefreeze; thus, there is a need to make adjustments based on the dealer’s changes.That is done by comparing the parts calculated each day to the previous day’scalculation, and if there is a difference and the part has already been ordered, anadjustment is made on the next order. A second adjustment is made by compar-ing the actual usage for each production day and the planned usage. The pur-pose of this adjustment is to catch any scrap or misused parts.
The order is transmitted to the suppliers daily. In addition to the dailyorder, a weekly forecast is sent to the supplier as a prenotice for the next 12weeks. It is extremely important for the suppliers to wait for the daily order toprepare the shipments. (The supplier’s role is discussed in Chapter 7.)
Logistics Planning Once the parts forecast is completed for the next productionmonth, a determination needs to be made about the most efficient routes for thelogistics partner to pick up the parts from all suppliers. A sophisticated softwareprogram is needed to simulate the various route options. Some of the inputsneeded and constraints are locations of each supplier, quantity of parts bysupplier by pick-up time, location of cross-docks, location of assembly plants,and cost per mile. Assurances need to be made that all delivery times for partswill be met and the cost of operating the fleet of trucks optimized. This processmay take numerous simulations before a route plan can be finalized.
Toyota Supply Chain Management20

Relationship of Processes to Physical FlowFigure 2-4 illustrates how these operational processes are integrated and syn-chronized to support the transformation flow of the physical parts and vehicles.
Planning ProcessesThe final processes necessary to complete the picture of the comprehensivesupply chain are performed one to three years prior to actual production. Theseprocesses are as follows:
1. Product planning and design2. Plant design for capacity and flexibility3. Package design for logistics4. Purchasing5. Annual sales and operations planning
Comprehensive Overview of Supply Chain 21
Figure 2-4. Transformation processes

Product Planning and Design Vehicle design starts about 36 months prior toproduction and is completed about 18 months prior to production. During thedesign phase the physical design and functional design are completed, in addi-tion to all parts and components. The designers and engineers must collaboratewith product planning, sales and marketing, purchasing, and manufacturing onthe new vehicle design. In addition, many of the suppliers collaborate with theengineers on selected components.
One of the factors to be considered during the vehicle design is the impact onthe supply chain. For example, the more parts that can be shared by multiple vehi-cles, the greater the efficiency, as there will be fewer part numbers and a highervolume of parts produced per part number. The result will be improved economiesof scale and the ability to source high-volume parts to multiple suppliers.
Another example is to reduce the number of parts that is directly associatedwith an option or color. That arrangement will increase the dealer’s flexibility tochange options or colors, because fewer parts will be impacted.
Plant Design for Capacity and Flexibility At Toyota, most final assembly plantsare designed to produce multiple vehicle models on multiple assembly lines.That design provides flexibility to shift production volume from a slow-sellingmodel to a faster-selling model to ensure that each plant maintains a stableproduction volume. In the event that the total volume needs to be adjustedeither up or down, then the average time allowed between vehicles that come offassembly (the “takt” time), can be adjusted to increase or slow down the linespeed. Line speed adjustment can be planned and implemented with one to twomonths lead time. In effect, this type of flexibility allows Toyota to change pro-duction capacity to meet market demand quickly.
Package Design for Logistics Inbound logistics must also be lean to supportToyota’s supply chain. Therefore, when parts packaging is designed, careful con-sideration must be taken to make sure that parts can be moved efficientlythrough the logistics network. In addition, Toyota has a strong “green” policy, soalmost all packaging uses returnable containers. The following are some of themajor packaging considerations:
■ Don’t “ship air.” Ensure that parts can be arranged in the container sothat cubic space utilization is optimized. For example, a part shaped likea hockey stick cannot be packaged efficiently.
■ Stackable. Design containers so that they can be stacked with manyother parts containers and can be interlocked so containers will not shiftduring transit.
■ Lot size. Order parts in small lots with frequent shipments.■ Quality. Guarantee that parts will not be damaged because of movement
during shipment.
Toyota Supply Chain Management22
Purchasing Purchasing is responsible for parts and component sourcing andmust work closely with engineering and quality. Purchasing considers manyfactors when selecting suppliers such as supplier capability and capacity, currentsupplier base, price, location, local content targets, and minority supplierobjectives.
In addition to these more obvious criteria, purchasing should also considerthe impact on the supply chain. Again, the focus should be on understandingthe relationships of options and colors to parts. One way to enable flexibility tochange options closer to production is to purchase these option-related partsfrom suppliers located close to the assembly plant. Managing suppliers requiresToyota to choose how to operate the assembly plant to stabilize supplier orders.That role requires implementation of all of the processes described earlier. Butit also requires leveraging the benefit of order stability to provide a competitiveproduct to the customer.
Annual Sales and Operations Planning Sales and manufacturing must collabo-rate on the annual plan for all vehicles sold and produced within a market (e.g.,North America or Europe). That process can be a very contentious one becausemanufacturing and sales goals naturally conflict. The manufacturing objective isto operate all plants at full capacity with stable volume and to minimize inter-ruption during model changeover. The sales objective is to maintain flexibilityin order to change production volume as market demand shifts and to avoidproducing too many vehicles of old models when a new model is scheduled tobe introduced. One common objective is to maximize profits; however, that iseasier said than done. (This topic will be discussed in detail in Chapter 4.)
Reflection PointsToyota has effectively implemented the Toyota Production System across theextended supply chain and has demonstrated its capability to be a learningorganization by the following:
■ Viewing the supply chain as a very broad and comprehensive set ofprocesses that must be designed to function cohesively
■ Promoting cross-functional teamwork to ensure that all internal andexternal parties are collaborating to kaizen both processes and operations
■ Streamlining the supply chain to be synchronized and integrated so thatit functions like a fine-quality Swiss clock
Although there are many examples of the v4L principles in this chapter, wewill wait and highlight them at the end of each of the chapters that discuss themin detail.
Comprehensive Overview of Supply Chain 23

Endnotes1. Hau Lee, Barchi Peleg, and Seungjin Whang, “Toyota: Demand Chain
Management,” Case GS-42, Stanford Graduate School of Business,Stanford University, Stanford, CA, 2005, p. 18.
2. The thinking goes something like this: A twenty-something person startsout purchasing a Scion, then gets married and moves up to a Camry, thenstarts a family and adds a sports utility vehicle or van, and then as anempty nester moves up to a Lexus.
3. J.D. Power and Associates Ratings, www.jpower.com/autos/car-ratings/,October 11, 2008.
Toyota Supply Chain Management24
25
Mix planning is an important process for companies that manufactureand distribute products to retailers in multiple market areas. Forvehicle manufacturers, this decision is extremely important because
of the complexity of a vehicle. This complexity creates millions of possible vehi-cle build combinations or variants. The objective of mix planning is to reducethe variants of each vehicle manufactured by several orders of magnitude, frommillions to hundreds.
Mix planning is a process that is undertaken during major model changepreparation. It can also be adjusted annually during minor model change and toa lesser degree during the model year. The model change mix planning is com-pleted about 12 months prior to new model introduction, to enable the follow-ing to happen:
■ Marketing strategies for each region to be synchronized with productofferings
■ Manufacturing to fill the supply chain pipeline with parts■ Sales regions to order vehicles to have in stock in time for new model
introduction
Mix planning at Toyota deals with choosing the specific mix of vehicles thatwill be offered at sales regions across the country. The goal of mix planning is tocarefully manage dealer-level product demand so as to enable stable productionat the manufacturing plant. That also translates into stable orders to suppliers.In other words, the aim of mix planning is “to nip some of the demand variabil-ity in the bud” through careful planning. The associated upstream stabilitybecause of mix planning permits a focus on improved quality, cost reductionusing kaizen, and ultimately higher value to customers that enables higher customer satisfaction and retention.
Studies suggest that Toyota cars offer approximately $2,500 in additionalvalue to the customer compared with competing midpriced, high-volume cars.
Mix Planning
Chapter 3
Toyota Supply Chain Management26
That additional value translates directly into a higher resale value that customersreceive for their Toyota cars compared to most manufacturers in the auto indus-try. We attribute this higher value to variety reduction, variability control,improved visibility across the chain, and higher velocity. Thus, in order for thev4L strategy to be viable it must generate significant value enhancement to allplayers. We will cover this topic in later chapters, but first we focus on howToyota does mix planning.
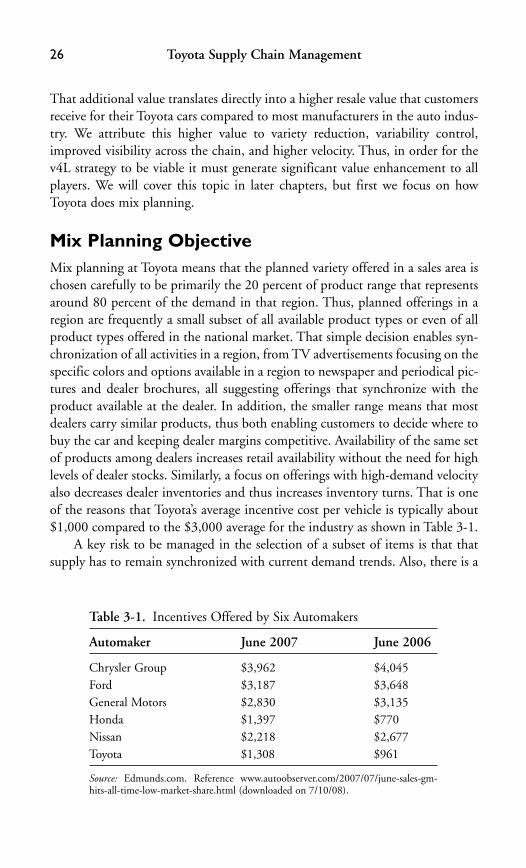
Mix Planning ObjectiveMix planning at Toyota means that the planned variety offered in a sales area ischosen carefully to be primarily the 20 percent of product range that representsaround 80 percent of the demand in that region. Thus, planned offerings in aregion are frequently a small subset of all available product types or even of allproduct types offered in the national market. That simple decision enables syn-chronization of all activities in a region, from TV advertisements focusing on thespecific colors and options available in a region to newspaper and periodical pic-tures and dealer brochures, all suggesting offerings that synchronize with theproduct available at the dealer. In addition, the smaller range means that mostdealers carry similar products, thus both enabling customers to decide where tobuy the car and keeping dealer margins competitive. Availability of the same setof products among dealers increases retail availability without the need for highlevels of dealer stocks. Similarly, a focus on offerings with high-demand velocityalso decreases dealer inventories and thus increases inventory turns. That is oneof the reasons that Toyota’s average incentive cost per vehicle is typically about$1,000 compared to the $3,000 average for the industry as shown in Table 3-1.
A key risk to be managed in the selection of a subset of items is that thatsupply has to remain synchronized with current demand trends. Also, there is a
Table 3-1. Incentives Offered by Six Automakers
Automaker June 2007 June 2006
Chrysler Group $3,962 $4,045Ford $3,187 $3,648General Motors $2,830 $3,135Honda $1,397 $770Nissan $2,218 $2,677Toyota $1,308 $961
Source: Edmunds.com. Reference www.autoobserver.com/2007/07/june-sales-gm-hits-all-time-low-market-share.html (downloaded on 7/10/08).
Mix Planning 27
natural tendency for the sales organization to attempt to justify why more isbetter. In other words, it is tempted to keep adding variants because doing sowill help create incremental sales. That effort requires the need for thoroughanalysis of selling trends by product type and features, as well as monitoring ofcompetitor offerings, in order to determine the optimum mix of variants. Thekey is that it is easier to add complexity or variants after the vehicle is introducedthan it is to remove them. Therefore, it is important to start out by erring on thelean side and if necessary adjusting variants on a periodic basis after severalmonths of sales history and trends can be evaluated. This method of adjustingmix during the monthly ordering process will be discussed in Chapter 4.
Complexity ReductionBefore mix planning can be undertaken, the product complexity needs to bereduced. That effort requires collaboration among design, sales and marketing,and manufacturing groups. The following is a summary of some methods thatare used to achieve complexity reduction.
Product Planning, Design, Sourcing
■ Look for opportunities to use common parts across products (i.e., shareradios). This step focuses on studies that suggest that over 80 percent ofmanufacturing costs are fixed at the design stage.1 So, preventing designersfrom adding variety when none is warranted is the first step. In addition,part commonality permits higher inventory turns for original parts as wellas spare parts, production flexibility for suppliers and the assembly plant,and economies of scale in purchasing, design, and production.
■ Consider making high-volume options standard (e.g., if air-conditioningis sold in 95 percent of all vehicles, it should be made a standard feature).Such a step focuses on trading off the forecasting difficulties whenchoices are left to consumers against the enhanced value perceived whencustomers are offered standard features. For example, antilock brakes andother standard safety features may not be valued by customers if offeredas separate choices but may well enhance the product preference ifoffered as standard. In addition, the forecasting of individual variants isoften more difficult than forecasting the total demand for a product.This gain in forecasting accuracy as well as improvement in perceivedvalue may well offset the lower margins because some features are discounted to customers who may not want them.
■ Eliminate options that do not sell well (e.g., if ashtrays are only orderedin 5 percent of vehicles, eliminate them as an option). This approach
Toyota Supply Chain Management28
focuses on simplifying designs even at the cost of losing some customersin order to make demand more predictable.
■ Minimize parts that vary by option and color—for example, does thewindow washer nozzle on the hood have to match the color, or can it beblack? In our example, supplier-part orders for the window washernozzle will be kept standard even if customer vehicles vary by color.Because the same supplier component may be used in many car types, itis a great example of assembly postponement applied to stabilize supplywhile providing variety.
■ Attempt to source optional parts to local suppliers to shorten lead time.Such an approach focuses on decreasing safety stock by lowering leadtime for difficult-to-forecast parts. In addition, because the forecast errorfor some options may be higher than for standard equipment, the leadtime impact on safety stock inventory for optional parts is higher thanfor standard equipment parts. Thus, a more responsive supplier foroption parts may well generate lower overall costs compared to an effi-cient long lead time supplier.
■ Design accessories that can be installed after the vehicle leaves the factoryat a hub or at a dealer to minimize impact on the factory and supplychain. Such a practice moves some accessorizing tasks to the point of saleor close to the point of sale and permits last-minute customization forthe customer. It is particularly relevant for cars like the Scion. The Scionis produced in Japan with almost no options or accessories. The vehiclesare then kept in stock at the ports until the dealers submit an order, atwhich time the accessories are installed and the vehicle is shipped to the dealer.
Marketing
■ Limit product offering for a market area. Vehicles sold in Europe and theUnited States should each offer a subset of products that best reflectslocal demand (e.g., manual transmission may be offered in Europe as anoption but not in the United States). Such synchronization of productsoffered to local preferences makes demand levels more predictable andthus improves supply chain performance. In addition, such an approachincreases the chance that demand can be satisfied directly from dealerstock, thus decreasing retail customer lead time.
■ Combine related options into packages (e.g., the safety package mayinclude side airbag, stability control, and auto window wiper). Bundlingof features permits the market segment as a whole to be targeted ratherthan individual feature choice. This process balances “up-selling”
whereby customers end up choosing more than they actually need, withstability on the supply side. In addition, by converting products into,perhaps, three offerings (economy, deluxe, and luxury), with associatedoption bundles, customer choice is simplified and the number of vari-ants sold at retail reduced.
■ Consider making high-volume options standard, not offering low-sellingoptions, or both.
Mix Planning by Sales RegionAfter the complexity reduction activities outlined previously have been com-pleted, the next step is for each sales division to work closely with its sales regionto determine which subset of the vehicle mix will be the high-volume sellers ineach region. This step is necessary because each sales region may have differentdemand characteristics. The following are some of the guidelines that are to beconsidered:
■ Limit stockkeeping units (SKUs). Determine which build combinationswill be stocked by a sales region. A sales region within a sales company’sterritory could be the southern region of the United States or Italy withinEurope.
■ Analyze past sales, competition offerings, and local regulations to predictdemand for future sales.
■ Use the 80/20 rule. The 80/20 rule identifies the SKUs that account for80 percent of the sales. This should be about 20 percent of the possibleSKUs.
■ Stock high-volume SKUs. Dealer stock should include only the 20percent of the SKUs that represent 80 percent of the volume.
■ Target marketing campaigns to support mix planning by region.Synchronizing offerings with marketing plans permits customer pref-erences to be “guided” whenever feasible. For example, featuring thesame subset of colors and features in print ads, TV ads, dealer show-rooms, and dealer inventory increases the chances that customers willchoose from the available colors and features and thus reduces the cus-tomers lost because of unavailability of special colors featured but notoffered.
■ Manage demand. Provide guidance to dealers on ways to respond todemand for vehicles that are not in stock:� The salesperson can gently persuade the customer to change his
mind and take one of the vehicles in stock. This is called “guided selling.” However, this technique could result in negative customer
Mix Planning 29
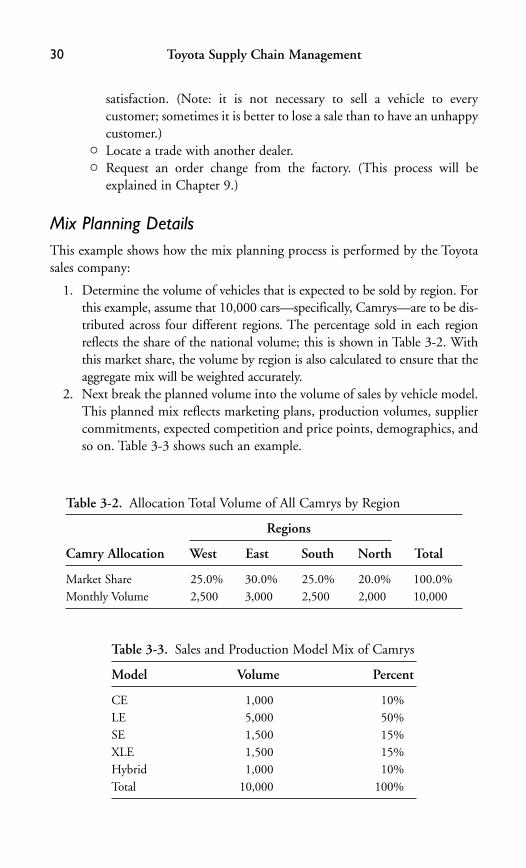
Toyota Supply Chain Management30
satisfaction. (Note: it is not necessary to sell a vehicle to every customer; sometimes it is better to lose a sale than to have an unhappycustomer.)
� Locate a trade with another dealer.� Request an order change from the factory. (This process will be
explained in Chapter 9.)
Mix Planning DetailsThis example shows how the mix planning process is performed by the Toyotasales company:
1. Determine the volume of vehicles that is expected to be sold by region. Forthis example, assume that 10,000 cars—specifically, Camrys—are to be dis-tributed across four different regions. The percentage sold in each regionreflects the share of the national volume; this is shown in Table 3-2. Withthis market share, the volume by region is also calculated to ensure that theaggregate mix will be weighted accurately.
2. Next break the planned volume into the volume of sales by vehicle model.This planned mix reflects marketing plans, production volumes, suppliercommitments, expected competition and price points, demographics, andso on. Table 3-3 shows such an example.
Table 3-2. Allocation Total Volume of All Camrys by Region
Regions
Camry Allocation West East South North Total
Market Share 25.0% 30.0% 25.0% 20.0% 100.0%Monthly Volume 2,500 3,000 2,500 2,000 10,000
Table 3-3. Sales and Production Model Mix of Camrys
Model Volume Percent
CE 1,000 10%LE 5,000 50%SE 1,500 15%XLE 1,500 15%Hybrid 1,000 10%Total 10,000 100%
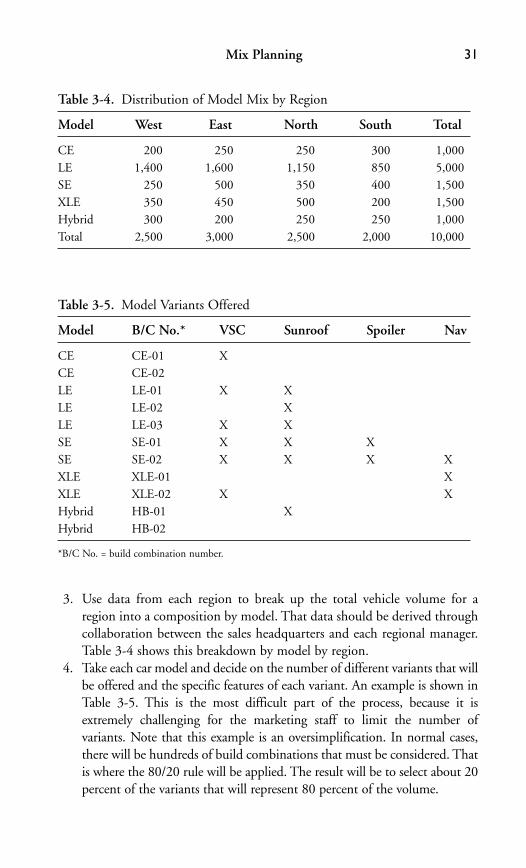
Mix Planning 31
3. Use data from each region to break up the total vehicle volume for aregion into a composition by model. That data should be derived throughcollaboration between the sales headquarters and each regional manager.Table 3-4 shows this breakdown by model by region.
4. Take each car model and decide on the number of different variants that willbe offered and the specific features of each variant. An example is shown inTable 3-5. This is the most difficult part of the process, because it isextremely challenging for the marketing staff to limit the number ofvariants. Note that this example is an oversimplification. In normal cases,there will be hundreds of build combinations that must be considered. Thatis where the 80/20 rule will be applied. The result will be to select about 20percent of the variants that will represent 80 percent of the volume.
Table 3-4. Distribution of Model Mix by Region
Model West East North South Total
CE 200 250 250 300 1,000LE 1,400 1,600 1,150 850 5,000SE 250 500 350 400 1,500XLE 350 450 500 200 1,500Hybrid 300 200 250 250 1,000Total 2,500 3,000 2,500 2,000 10,000
Table 3-5. Model Variants Offered
Model B/C No.* VSC Sunroof Spoiler Nav
CE CE-01 XCE CE-02LE LE-01 X XLE LE-02 XLE LE-03 X XSE SE-01 X X XSE SE-02 X X X XXLE XLE-01 XXLE XLE-02 X XHybrid HB-01 XHybrid HB-02
*B/C No. = build combination number.

Toyota Supply Chain Management32
5. Decide on which of these variants will be sold in each region, and determinethe mix of variants by region (Table 3-6). The mix by region will then beused to calculate the volume of each variant by region during the monthlyordering process. (This process will be discussed in detail in Chapter 4.)Note that in this example not all regions will decide to order stock for allvariants that were preselected by the sales division for the entire nationalmarket. However, they will still be able to make daily order changes orsubmit special orders for variants that appear on the national list.
6. Finally, take each of these quantities and decide the colors that will beoffered in each region and thus the specific quantities by color of each ofthese variants that is expected to be shipped to each region.
Toyota processes reduce complexity and limit the mix sold within sales regions.The metrics for mix planning are the number of build combinations by regionor country by model. Next we will examine how a mathematical model can beused to evaluate various mix planning strategies.
A Simulation ModelAlthough Toyota’s success may be proof that the 80/20 rule is valid, anotherissue that deserves focus is the empirical observation that SKUs that have lowersales volume have higher demand variability. In addition, the identity of theseSKUs might not be the same from region to region. Thus, staying with the top80 percent limits the variability seen by the plant; it also reduces inventories atthe dealer. That reduces cost, improves forecasting, and further contributes to
Table 3-6. Mix of Model Variants by Region
Mix of Each Model by Region
Model B/C No.* West East South North
CE CE-01 0% 0% 70% 20%CE CE-02 100% 100% 30% 80%LE LE-01 50% 0% 50% 0%LE LE-02 50% 0% 0% 70%LE LE-03 0% 100% 50% 30%SE SE-01 100% 50% 30%SE SE-02 100% 50% 70%XLE XLE-01 80% 20% 30%XLE XLE-02 20% 100% 80% 70%Hybrid HB-01 100% 40% 20% 30%Hybrid HB-02 0% 60% 80% 70%
*B/C No. = build combination number.

Mix Planning 33
reducing variability. Moreover, it focuses selling effort on a small set of modelsand thus can drive demand in the right direction.
Given these different possible reasons for mix planning, we will focus onone such reason to understand details. The Appendix will provide a specificexample; here we refer to the learning points from that example. Increasingproduct variety potentially attracts new customer segments to purchase theproduct and may thus increase the mean demand for the product. This increasein customer segments, however, may make the specific composition of demandfor products in a period less predictable. Such a decrease in predictability maybe understood (intuitively) as arising from the inability to predict the demandprocess for each customer segment. So the benefit associated with attractingmore customers to the product has to be balanced with the increased forecasterror for individual products offered. In such a context, it may be better to offera narrower range with more predictability. A more limited, more predictabledemand stream may then enable a stable supply chain to be created, which offersthe opportunity to increase customer value associated with a product.
A key question is, how much of the demand can be retained when varietyis decreased? If, instead of 50 percent of the potential being captured, thedemand drops to 30 percent, then it is worth considering how profitable thislowered variety is relative to increased variety.
What is the fundamental message of this model? Increasing product varietymay increase demand forecast error because of difficulties in forecastingdemand. It is the difficulty in understanding the composition of customerdemand that creates significant forecast error—that is, it is easier to forecastaggregate demand but quite difficult to forecast the variety. Thus, careful target-ing of customers and choice of product offerings can stabilize the system if thedemand is not affected significantly. The trade-off between stability and salesvolume has to be made prior to determination of the mix planning strategy.
Non-Toyota Examples of Mix PlanningA paper by Chan and Mauborgne on the “Blue Ocean Strategy”2 describes theprocess of pursuing differentiation and low cost. They describe a company that“generates cost savings by reducing factors that an industry traditionally com-petes on. Buyer value is lifted by raising or creating elements the industry neveroffered. Over time, costs are reduced further as scale economies kick in, as salesvolumes increase due to superior value provided.” An example that is providedfocuses on the choices by Casella Wines, an Australian wine company thatentered the U.S. wine industry in 2001, when the industry had over 1,600 winechoices in the market.
Unlike existing strategies, Casella decided to focus on simplicity and onattracting new customers who were not traditional wine drinkers in the United

Toyota Supply Chain Management34
States. The company thus decided to use one bottle type for red and one for white wines and offer only two types of each wine, simplify packaging, eliminatepromotions, and go after nonwine drinkers with a fruity flavor. It eliminated all technical jargon from wine bottles and used simple, bright colors. Retailemployees were encouraged by its ease of description to recommend it tocustomers. By eliminating a lot of the wine reputation–building costs faced bytraditional wine companies, Casella focused on new tastes that made it easy to purchase, while simultaneously lowering production costs. At the same time,Casella managed to charge more than budget wines while growing the market significantly. The narrowing of choices and simultaneous raising of satisfactionpermitted a significant increase in the volume sold and enabled the company toemerge as the fastest-growing brand in U.S. wine history, surpassing the wines ofFrance and Italy. In 2004, the company sold more than 11.2 million cases in theUnited States.
In the book Conquering Complexity in Your Business,3 Michael George andStephen Wilson discuss the impact of adding low-volume, less predictable offer-ings mixed with higher-volume products. If the low-volume products have greatervariability relative to the mean, while the high-volume products have a lower vari-ability relative to the mean, then offering all the products when their manufac-ture involves setups can decrease production cycle time efficiency for all products.Process cycle efficiency thus drops for all offerings when low-volume offerings areadded in the presence of setup costs. George and Wilson suggest the need toidentify the requisite level of variety that will optimize profitability by trading offthe cost impact with revenue consequences of different levels of variety.
Titleist is the world’s leading golf ball manufacturer. The key to becominga successful golf ball manufacturer is to achieve remarkable consistency in theplastic polymer used around the ball. Because all balls of the same type have tomaintain equal performance to enable competition to focus on golfer ability, thecompany strives to carefully control quality. At the same time, there is the needto offer golf balls for a range of golfer preferences. The company thus has anappropriate range of golf balls but constantly works to keep the range as narrowas possible and still fulfill needs of golfers of all skill levels as the world’s leadinggolf ball manufacturer.4 Narrow variety, consistent quality, and economies ofscale through appropriate pricing for performance all combine to enable Titleistto maintain its position as the leading golf ball manufacturer.
Reflection PointsHow does increased variety hurt a company? When variety is increased while customer service must be maintained, the forecasting of demand and theadjustment of the supply chain become key issues. At the same time, greater
Mix Planning 35
variety permits products to appeal to a larger set of market segments whose pref-erences are now met by the new SKUs. If this new segment can be predicted andincorporated into existing processes, there is an opportunity to increase profit-ability. However, if the new market segments introduce fickle consumers andconfuse existing customer segments, then adding SKUs may increase forecasterror substantially, thus significantly increasing supply costs.
Toyota has demonstrated its strength as a learning organization by contin-uously refining its capability to manage vehicle complexity and the model mixsold in each sales region and by spreading these processes across the globalorganization. Specific examples are linked to the v4L:
■ Variety is selected by region to represent the popular mix demanded at apoint in time. That permits wide availability of offerings among dealersfor customers and thus keeps dealer markups low.
■ Velocity of sales is maintained by choosing to order for stock a few vari-ants in each region. Those variants account for over 80 percent of thedemanded offerings. That improves inventory turns at dealers andreduces days of inventory in the dealer lot.
■ Variability of sales is decreased by synchronizing sales and operationsplanning to focus on a few variants by region. Those choices are adjustedin response to observed sales. Thus, supplier and production quantitiesare stable in the aggregate.
■ Visibility of the planning process across sales and operations enablesbuying at the regional level. The push system of allocating cars to dealersenables fast turns and thus low dealer inventories.
The thesis of the chapter is that optimal choice of the v4L enables Toyotato increase value. The learning methods of Toyota are applied throughout theprocess to enable value creation, specifically:
■ Create awareness. The quantification of variability makes planners awareif they are not meeting the 80/20 guideline. In some instances, Toyotaprefers to wait and see if the trends are permanent; for example, Toyotastudies trends to see if mix changes are permanent.
■ Establish capability. Limiting variability where it occurs—at the dock inthe case of the Scion, or at the design stage when it comes to limitingvariety—makes the system more capable of handling variation.
■ Make action protocols. The quantification of the variety and the carefulsequencing of planning steps, some top-down and some bottom-up,enables coordination.
■ Generate system-level awareness. The goal of mix planning is system-leveloptimization, where the system includes the customer and the entiresupply chain.

Endnotes1. D. E. Whitney, “Manufacturing by Design,” Harvard Business Review,
vol. 66, no. 4 (1988), pp. 83–91.2. Renee A. Mauborgne and W. Chan Kim, “Blue Ocean Strategy,” Harvard
Business Review, October 1, 2004.3. Michael L. George and Stephen A. Wilson, Conquering Complexity in Your
Business. New York: McGraw-Hill, 2004, p. 80.4. Conquering Complexity, p. 37.
Toyota Supply Chain Management36
37
Sales and operations planning (S&OP) is a critical component of thesupply chain planning process. It is linked upstream to the mix planningprocess and downstream to the production scheduling process. The goal
of S&OP is to generate a production plan that balances demand and supply ina profitable way. The end point of this process is an order for vehicles with fullspecifications that will be scheduled for production (see Chapter 5).
To understand the Toyota approach to sales and operations planning, anunderstanding of which entity in the supply chain submits the vehicle order isnecessary. Simply put, it is not the dealers. At Toyota, the regional offices submitthe vehicle orders once each month. Toyota uses a monthly allocation process to allocate the vehicles planned for production to each dealer—in other words,it uses a top-down approach. Many other automobile companies create pro-duction plans from the bottom up; that is, they collect the orders submitted bydealers and then create a production plan. There are pros and cons to bothapproaches; however, the top-down approach works well for Toyota because itenables Toyota to ensure that the resulting production plan is stable.
Sales and operations planning processes at Toyota are performed in twostages: annual planning and monthly ordering.
Annual PlanningThe objective of the annual planning process is to establish a rolling three-yearsales and production forecast. The process is repeated semiannually so that theforecast is updated based on the latest market and economic conditions. Theannual forecast is used throughout the company to project profits, establish cap-ital and operating budgets, evaluate plant and supplier capacity requirements,conduct annual price reviews with suppliers, and influence marketing strategies.
Sales and OperationsPlanning
Chapter 4

Annual Planning ProcessThe annual planning process is a collaborative process between the sales andmanufacturing divisions. The responsibilities of sales are to grasp the market and economic conditions, predict competitive product plans and strategies, andunderstand new product launches and marketing plans to create a sales forecastfor each model for each month and year. Manufacturing’s responsibilities are todetermine the operating capacity for each model and each plant, evaluate vari-ous model mix scenarios, and identify peaks and valleys in the production calendar that are created by model changeover schedules.
The process is executed over a period of several weeks twice a year. There isa push-pull momentum: sales submits its request for each model by month andyear, while manufacturing simultaneously attempts to mix and match the modelvolumes across the plants. Collaboration is required because typically the salesrequest is different from manufacturing’s capabilities and/or objectives.
Typical sales objectives are to remain flexible to respond quickly to marketchanges and to limit the use of incentives to sell vehicles. Some of manufactur-ing’s key objectives are to operate at full capacity and to produce high-profitvehicles. Because most plants produce multiple models and many models areproduced at multiple plants, numerous scenarios must be considered. Some sig-nificant conflicts may need to be resolved, which results in the push-pullmomentum, or the give-and-take exchange, between sales and manufacturing.The collaboration process focuses on adjusting the variables that can be used tobridge the gap. Some of these adjustments to the sales and operations plan areas follows:
■ Sales can plan to use incentives selectively to create demand for slow-selling models and for models that are scheduled for a major modelchangeover.
■ Sales can adjust marketing strategies to promote selected models. Forexample, special-edition models may be created to enhance a model’smarketability. This strategy is used mostly during the later years of amodel’s life. (Note: Most automobile models are produced for about fiveyears before there is a major model change.)
■ Manufacturing can upgrade facilities to increase capacity for selectedmodels.
■ Manufacturing can adjust the speed or takt time of the assembly line ata plant to increase or decrease production.
■ Manufacturing can vary the model mix within a plant.■ Manufacturing can vary the planned overtime by plant (e.g., schedule
overtime on Saturdays).
Toyota Supply Chain Management38

One example of collaboration between sales and manufacturing that gener-ated significant benefits occurred at the Toyota plant located in Fremont,California. The California plant could produce only 20 percent of the Corollamodels with sunroofs. The Corolla model was also produced at another Toyotaplant near Toronto, Canada, that did not have this constraint.
The demand from the West Coast for Corollas with sunroofs was very high.Unfortunately, the California plant could not produce enough vehicles withsunroofs to meet the demand, so some of those vehicles destined for the WestCoast had to be produced at the plant in Canada. The result was an extremelynegative impact on vehicle distribution. The vehicle distribution group pre-ferred to ship the Corollas produced in California to dealers west of theMississippi and the Corollas produced in Canada to the dealers east of theMississippi. The reasons are obvious: logistics costs are lower and the time to getthe cars from the plant to the dealers is shorter because of the geographic prox-imity of dealer locations to the assembly plant.
The dealers located in the West were requesting over 40 percent of theCorollas equipped with sunroofs. The consequence of the inability of theCalifornia plant to produce Corollas with sunroofs to meet this high demandwas that many cars produced in Canada were shipped across the country to theWest Coast and an equal number of Corollas without sunroofs were built inCalifornia and shipped back East. At each annual planning meeting, peoplefrom the sales group would argue that this situation was unacceptable andrequest the California plant to install additional equipment to eliminate thisconstraint. The plant management was very cost conscious and would notagree to invest the millions of dollars required to install the equipment. Thestalemate continued for several years until there was a detailed analysis done tocalculate the profit impact on both sales and the plant. It was determined thatCorollas that were ordered with sunroofs normally were equipped with otherhigher-profit options. Thus, the profit margin of the Corollas without sunroofswas significantly less than that of those with sunroofs. It was determined thatby increasing the mix of cars with sunroofs built in California from 20 percentto 40 percent, to respond to sales demand, the plant would recover its multi-million-dollar investment in a few months. When the plant managerrealized this missed profit opportunity, he quickly agreed to install the neces-sary equipment.
Another example of the types of decisions that are made during the annualplanning process is found in a July 2008 Toyota press release:1
July 10, 2008—Erlanger, KY—Toyota is responding to changes in consumerdemand and improving the production efficiency and stability of its NorthAmerican operations by adjusting production mix at three plants. The
Sales and Operations Planning 39
changes include the addition of the Prius hybrid sedan to its North Americanlineup. The changes are as follows:
■ The Prius will be built at a plant under construction in Blue Springs,Miss. Production is scheduled to begin in late 2010. Prius, which will jointhe Kentucky-built Camry Hybrid as the second Toyota hybrid built inNorth America, enables Toyota to better respond to increased consumerdemand for hybrid vehicles.
■ The Highlander mid-size SUV, originally scheduled to be built inMississippi, will now be manufactured in Princeton, Ind., beginning infall 2009.
■ Production of the Tundra full-size pick-up truck, currently built inIndiana and Texas, will be consolidated at the San Antonio plant inspring 2009.
This is an excellent example of how Toyota has the agility to make majorchanges in its production schedules in a relatively short time frame.
Component PlanningAfter several weeks of discussions and analysis, the annual plan is finalized bymodel by plant. Then the focus shifts to determining the ratio of key compo-nents of vehicles. For example, engines, transmissions, and similar options mayhave a capacity constraint at the supplier level. One of the complications ofplanning component volumes is that most components are used by multiplemodels across multiple plants worldwide. Again, there is a need to run severalscenarios to determine how to best balance component plant production planswith the various assembly plants. As you can imagine, this is like trying to solvea giant Rubik’s Cube.
Creating Buy-InAnother important point is that the sales and operations planning process cannotbe resolved simply by inputting variables into a computer and getting a mathe-matically accurate result. Certainly, computers play an important role in calculat-ing the various scenarios; however, the human interaction that takes place overthe hours, days, and weeks not only improves the quality of the annual plan butalso builds an overall consensus among sales and manufacturing groups that rein-forces teamwork. This creates an environment to achieve success by motivatingall parties to work together to ensure that the annual plan is a commitment forboth the sales and manufacturing organizations. Such collaboration is not thenormal process in different functional disciplines. They tend to stick to their
Toyota Supply Chain Management40
viewpoint—not because they somehow benefit from doing so, but because theydo not see the viewpoint of others. In such cases, there is much more reliance oncomputer results than on human interaction. So Toyota prefers a combinationapproach. That is part of the Toyota Way, in which the human-machine combi-nation is often assumed to produce the best possible result.
It is interesting to observe how many Toyota Way principles are demon-strated during the annual planning process. Teamwork and mutual respect arekey principles used throughout the planning process. Moreover, the processthrough which the annual plan is reviewed and updated semiannually is a goodexample of how Toyota practices one of the key Toyota Way principles: Plan,Do, Check, and Act (PDCA). The plan is developed and is used as a basis forday-to-day operations. Then it is checked after six months, and action is takento adjust the plan and/or make changes in plant or supplier capacity. Thisresults in a closed-loop control that is repeated over and over again. PDCA isalso applied to the planning process itself.
After each annual planning cycle, a reflection report is prepared to evaluatethe process. This report highlights what went right and what needs improve-ment. The items that need improvement are analyzed further to identify rootcauses and countermeasures that should be implemented.
Capacity PlanningCapacity planning consists of two aspects: the internal plant capacity review andthe supplier capacity review.
Internal Capacity PlanningEach assembly plant conducts a periodic review of its production capacity. Thepurpose is to calculate the upper and lower limits of its operations rate for eachproduct. The capacity planning activities are performed on an annual (or, insome cases, a semiannual) basis. However, most major investments to the facil-ities are usually implemented during the next major model change. For assem-bly plants, the products are the various vehicle models that are produced on eachassembly line. For component or unit plants, the products are the componentssuch as engines and transmissions. Using the annual plan volumes as a forecast,each production facility will consider the variables that impact capacity. A keyconstraint is how much the operations rate varies by assembly plant. The follow-ing are some of the variables that impact the operations rate and thus can beadjusted:
■ Direct labor and the flexibility to add workers—or reduce the workforce—and thus, adjust the production rate. Because Toyota strives to avoid lay-offs of Toyota employees, most Toyota plants employ some percentage of
Sales and Operations Planning 41
temporary workers to support the normal production level. If produc-tion needs to slow down because of slow demand, then temporary work-ers can be reduced. On the other hand, if production needs to beincreased, then, most likely, temporary workers would be added initially.If the increase appears to be permanent, then some temporary workerswould be converted to full-time employees.
■ Facility and equipment. Each process must be analyzed to determine theweakest link in the production process. In other words, even if one couldadd unlimited numbers of workers, there will be some equipment thatwould not be able to produce at a higher rate. It could be a machine thatis used to install a sunroof, perhaps an additional paint booth might needto be installed, and so on.
Supplier CapacitySo that potential weak links in the supply chain can be identified, suppliercapacity as well as internal capabilities must be evaluated. Because this is a jointresponsibility, purchasing and production control need to work with each sup-plier to identify any constraints that could restrict the supply of a part. Althoughmost companies focus attention on the upper limit of each supplier’s capacity, itis also important for a supplier to highlight any planned production cutbackthat would severely impact its ability to operate. Thus, a result of this capacityplanning study is for Toyota to document the upper and lower range of produc-tion for each part and supplier.
Proactive steps can be initiated to solve the capacity issue. For example, asupplier could be added if production volume for a part were increasing rapidly.Such a step would provide Toyota with a backup situation in the event its primary supplier has a problem. But there are other reasons that Toyota wouldconsider developing a dual source for some parts. Some of these considerationsare risks because of location of suppliers that could restrict supply (e.g., poorweather or the potential for flooding or earthquakes) or the financial stability ofthe supplier. Thus capacity planning provides a perspective of overall productionrate that can be executed across the supply chain.
Monthly OrderAt Toyota there is a monthly global process to receive the sales orders from eachsales company from around the world. That is translated into a production planfor each assembly plant as well as for each Toyota unit plant. Toyota’s cultureemphasizes a process that does not rely only on sophisticated computer systems.Although Toyota certainly utilizes numerous computer systems that process data
Toyota Supply Chain Management42
and crunch the numbers, the results provided by the computers are reviewedand discussed by a cross-functional team of sales and manufacturing managers.The process is an iterative one that ultimately generates a three-month rollingproduction plan for all Toyota assembly and unit plants worldwide. A jointfocus by both sales and manufacturing on the monthly order ensures that allperspectives are balanced and the logic for the decision is clarified.
Production CalendarOne prerequisite to creating the production plan is to determine the number ofproduction workdays in a production month. One of the reasons that a produc-tion month is not the same as a calendar month is because some of the processeswithin manufacturing are based on a weekly cycle. The concept of a productionmonth was implemented so that each month would consist of either four or fivecomplete weeks. Each year, a production calendar is created based on the follow-ing rules:
1. Each week is assigned a sequential number from 1 to 53.2. Week number 1 is always the week that includes the first production day
of the year. For example, if January 1 is on Wednesday and January 2 isthe first workday, then the week will be designated production week 1.Note: In this case, this week will actually include two days of December.Although this breaks the next rule, it is not considered an issue because inthe auto industry in the United States the last week of the year is a non-production week.
3. The month into which each Monday falls is used to determine which weeksare classified into a production month except for January. For example, ifApril 30 is a Monday, then the entire week is included in the April produc-tion month.
Because there are 52.2 weeks in a normal 365-day year, there will be someyears that contain 53 weeks. The production calendar is published prior to thebeginning of the calendar year and includes the production week classificationas well as company holidays observed by each plant. Use of a production calen-dar prevents confusion regarding planning across calendar months and preservesthe weekly planning process.
Production Planning ProcessOnce the production calendar is published, it can be used to create a monthlyproduction order for each plant. The monthly order process is a global processmanaged by Toyota Motor Corporation (TMC) in Japan. Each manufacturingassembly plant creates a preliminary operations plan that shows the quantity of
Sales and Operations Planning 43

each model that will be produced, including critical options such as engines andtransmissions. In addition, each unit plant creates an operations plan that showshow many engines, transmissions, and other options it can produce.
An example of an operations plan is shown in Table 4-1. In this example,one week of a month is shown; however, the complete plan would show allweeks in each of the three months that make up the rolling three-month plan.The key components of this plan are as follows:
■ Standard work hours. In this example, Monday is a holiday, so workhours are zero. For all other days, standard work hours are 16, becausemost plants work two 8-hour production shifts.
■ Overtime. Normally there is some limited amount of overtime that isprescheduled. In this example, it is two hours (or one hour per shift) perday. Day-to-day adjustments to the overtime are made just prior to thestart of each shift based on operational conditions at the plant.
■ Takt time. Takt time is a term that refers to the speed of the assem-bly line. This unit of measure is the amount of time it takes a vehi-cle to move from one station to the next. In this example, a takt timeof 60 seconds means that workers assigned to each station along theline have 60 seconds to complete their work. The rate of vehicles
Toyota Supply Chain Management44
Table 4-1. Sample Operations Plan
Item Days
Date 1 2 3 4 5 Total
Week Day Mon Tue Wed Thu Fri Week
Work HoursStandard hours 0 16 16 16 16 64Overtime hours 0 2 2 2 0 6Subtotal 0 18 18 18 16 70
OperationsTakt time (sec) 0 60 60 60 60Operations rate 0 95% 95% 95% 95%
ProductionVehicles per hour 0 57 57 57 57Vehicles per day 0 1,026 1,026 1,026 912 3,990Model 1 ratio 0 40% 40% 40% 40%Model 1 volume 0 410 410 410 365 1,595Model 2 ratio 0 60% 60% 60% 60%Model 2 volume 0 616 616 616 547 2,395
completed and driven off the line is one per minute or one every 60 seconds.
■ Operations rate. The percentage of the time that the assembly line is run-ning at the normal production rate is the operations rate. That is usuallyset at less than 100 percent in a Toyota plant, because Toyota emphasizesquality first. So all workers are encouraged to stop the line if any prob-lem occurs so that problems can be corrected before the vehicle gets produced. That measure also ensures that problems that may affect mul-tiple vehicles are identified and corrected early. The operations rate isreduced by the time required to fix the problem. Thus, if the takt timeis 60 seconds, 1 percent of the production is interrupted by a line stop-page, and it takes 5 minutes (300 seconds) to fix the problem, then theexpected operations rate � 60/(60 � 0.01 � 300) � 60/63 � 95.2%.
■ Vehicles per hour. This is calculated as seconds in an hour (360) dividedby takt time in seconds (60) times the operations rate.
■ Vehicles per day. This is calculated as total work hours per day times thenumber of vehicles per hour.
■ Model ratio. Most Toyota assembly plants produce multiple vehiclemodels. Therefore, the ratio of each model as a percent of the total of allmodels must be determined to create a production volume by model.
■ Model volume. This is calculated as model ratio times the productionvolume.
As you can see from the sample operations plan (Table 4-1), all of the com-ponents are variables that can be manipulated to create what-if scenarios thatcan be evaluated during the negotiation process. These metrics, or key perform-ance indicators (KPIs), are also used on a day-to-day basis to monitor the plantoperations.
The monthly planning process requires input from all sales and manufac-turing operations worldwide. Each sales company submits its request for pro-duction of each model by month. This information is transmitted to TMC in afile that contains a record for each vehicle, including full specifications.Although the sales request contains the full vehicle specifications, this initialplanning step considers volumes only by model and key components such asengines. The total worldwide demand is compared to the proposed operationsplan for each plant. Table 4-2 shows a sample of how vehicle and engine vol-umes by month are summarized by the global regions.
The next step is to balance the sales request with the production operationsproposal to determine the optimum sales and operations plan. Then the produc-tion volume and model mix for each plant is allocated to each of the global salesregions.
Sales and Operations Planning 45

Global/Regional AllocationEach of the sales companies receives a share of the production for each modeland each assembly plant from TMC for each of the rolling three months. Thus,each sales company (for example, Toyota Motor Sales, USA) must submit amonthly order and two months of forecast. The order month is designated as“N.” The first forecast month is “N � 1” and the second is “N � 2.” So, if Julyis the order month “N,” then August is “N � 1,” and September is “N � 2.”Some references classify these months as PPR1, PPR2, and PPR3, where PPRstands for “production plan requirements.”
Each sales company then subdivides its volume into an allocation for itsregions and/or countries. For example, in the United States, the allocation isbroken down into 12 regions, and in Europe it is allocated across more than 25countries. The volume by region by model will vary based on performanceversus sales objectives for each region.
Next we will examine how each region can manipulate the content of itsallocated vehicles to match its regional mix.
Final Sales Order PreparationThe headquarters for each sales company will aggregate the order of each of itsregions and transmit that information to TMC. During the aggregation process,the sales headquarters must do a final check to see to it that the total order com-plies with TMC’s guidelines.
Toyota Supply Chain Management46
Table 4-2. Worldwide Sales Request
Month Month � 1 Month � 2
Total 6 Cyl. 4 Cyl. Total 6 Cyl. 4 Cyl. Total 6 Cyl. 4 Cyl.
United States
Model 1 20,000 8,000 12,000 19,500 7,950 11,550 20,100 8,020 12,080
Model 2 15,000 0 15,000 16,000 0 16,000 15,500 0 15,500
Model 3 8,000 3,500 4,500 19,500 7,950 11,550 20,100 8,020 12,080
Model 4 10,000 10,000 0 11,000 11,000 0 10,000 10,000 0
Model 5 12,000 8,000 4,000 19,500 7,950 11,550 20,100 8,020 12,080
Europe
Model 1 5,000 1,000 4,000 5,200 1,100 4,100 4,800 1,000 3,800
Model 2 2,000 0 2,000 2,100 0 2,100 2,200 0 2,200
Model 3 8,000 3,500 4,500 9,500 3,000 6,500 9,000 8,020 980
Model 4 0 0 0 0 0 0 0 0 0
Model 5 12,000 8,000 4,000 19,500 7,950 11,550 20,100 8,020 12,080
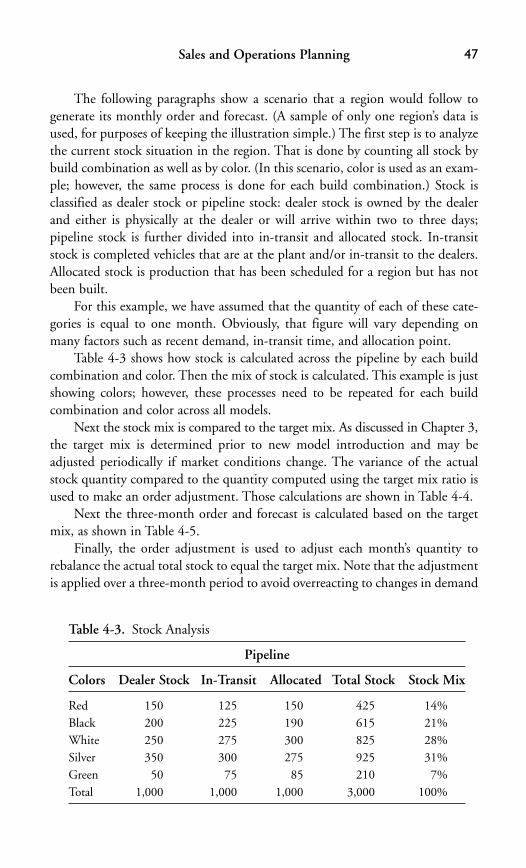
The following paragraphs show a scenario that a region would follow togenerate its monthly order and forecast. (A sample of only one region’s data isused, for purposes of keeping the illustration simple.) The first step is to analyzethe current stock situation in the region. That is done by counting all stock bybuild combination as well as by color. (In this scenario, color is used as an exam-ple; however, the same process is done for each build combination.) Stock isclassified as dealer stock or pipeline stock: dealer stock is owned by the dealerand either is physically at the dealer or will arrive within two to three days;pipeline stock is further divided into in-transit and allocated stock. In-transitstock is completed vehicles that are at the plant and/or in-transit to the dealers.Allocated stock is production that has been scheduled for a region but has notbeen built.
For this example, we have assumed that the quantity of each of these cate-gories is equal to one month. Obviously, that figure will vary depending onmany factors such as recent demand, in-transit time, and allocation point.
Table 4-3 shows how stock is calculated across the pipeline by each buildcombination and color. Then the mix of stock is calculated. This example is justshowing colors; however, these processes need to be repeated for each build combination and color across all models.
Next the stock mix is compared to the target mix. As discussed in Chapter 3,the target mix is determined prior to new model introduction and may beadjusted periodically if market conditions change. The variance of the actualstock quantity compared to the quantity computed using the target mix ratio isused to make an order adjustment. Those calculations are shown in Table 4-4.
Next the three-month order and forecast is calculated based on the targetmix, as shown in Table 4-5.
Finally, the order adjustment is used to adjust each month’s quantity torebalance the actual total stock to equal the target mix. Note that the adjustmentis applied over a three-month period to avoid overreacting to changes in demand
Sales and Operations Planning 47
Table 4-3. Stock Analysis
Pipeline
Colors Dealer Stock In-Transit Allocated Total Stock Stock Mix
Red 150 125 150 425 14%Black 200 225 190 615 21%White 250 275 300 825 28%Silver 350 300 275 925 31%Green 50 75 85 210 7%Total 1,000 1,000 1,000 3,000 100%

Toyota Supply Chain Management48
Table 4-4. Mix Analysis
Colors Total Stock Stock Mix Target Mix Target Stock Order Adj.
Red 425 14% 15% 450 25Black 615 21% 20% 600 �15White 825 28% 30% 900 75Silver 925 31% 25% 750 �175Green 210 7% 10% 300 90Total 3,000 100% 100% 3,000 0
Table 4-5. Baseline Three-Month Order and Forecast
Colors Target Mix Order (N) Forecast (N�1) Forecast (N�2) Total
Red 15% 150 150 150 450Black 20% 200 200 200 600White 30% 300 300 300 900Silver 25% 250 250 250 750Green 10% 100 100 100 300Total 100% 1,000 1,000 1,000 3,000
Table 4-6. Final Three-Month Order and Forecast
Colors Order Adj. Order (N) Forecast (N�1) Forecast (N�2) Total
Red 25 158 158 159 475Black �15 195 195 195 585White 75 325 325 325 975Silver �175 192 192 191 575Green 90 130 130 130 390Total 0 1,000 1,000 1,000 3,000
(Table 4-6). However, if the regional manager has some additional informationthat would indicate a more sudden change, he or she may make a decision tooverride this calculation.
These processes are then repeated for each package or build combination.As was discussed in Chapter 3, each region will limit the number of build combinations ordered for stock to the high-volume sellers. Table 4-7 shows howthe total number of units may be distributed across the four packages for thethree-month period.
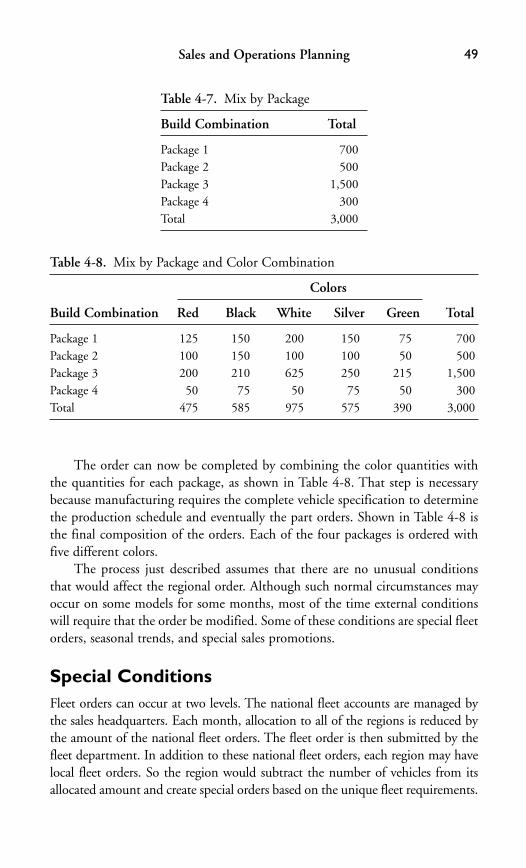
The order can now be completed by combining the color quantities withthe quantities for each package, as shown in Table 4-8. That step is necessarybecause manufacturing requires the complete vehicle specification to determinethe production schedule and eventually the part orders. Shown in Table 4-8 isthe final composition of the orders. Each of the four packages is ordered withfive different colors.
The process just described assumes that there are no unusual conditionsthat would affect the regional order. Although such normal circumstances mayoccur on some models for some months, most of the time external conditionswill require that the order be modified. Some of these conditions are special fleetorders, seasonal trends, and special sales promotions.
Special ConditionsFleet orders can occur at two levels. The national fleet accounts are managed bythe sales headquarters. Each month, allocation to all of the regions is reduced bythe amount of the national fleet orders. The fleet order is then submitted by thefleet department. In addition to these national fleet orders, each region may havelocal fleet orders. So the region would subtract the number of vehicles from itsallocated amount and create special orders based on the unique fleet requirements.
Sales and Operations Planning 49
Table 4-7. Mix by Package
Build Combination Total
Package 1 700Package 2 500Package 3 1,500Package 4 300Total 3,000
Table 4-8. Mix by Package and Color Combination
Colors
Build Combination Red Black White Silver Green Total
Package 1 125 150 200 150 75 700Package 2 100 150 100 100 50 500Package 3 200 210 625 250 215 1,500Package 4 50 75 50 75 50 300Total 475 585 975 575 390 3,000
Seasonal trends can also create a need to modify the mix of the order.Therefore, the targeted mix would change in a stair step manner to reflect projected seasonal changes. For example, convertibles and sunroofs sell betterin spring and summer months. Also, lighter colors are preferred in hotterweather.
Special sales promotions also can require that the order be modified. For example, air-conditioning may be included for free if you purchase a carwith a sunroof. Obviously, that would require the normal mix calculation to beoverridden to ensure that an adequate supply of cars with sunroofs and air-conditioning is ordered.
The point is that a computer system can be programmed to calculate themonthly order if there are no external factors. However, the process requireshuman intervention to evaluate the computer-generated order and make necessaryadjustments. That usually requires multiple iterations before the order is finalized.
A computer making trade-offs might ignore some subtle constraints such asoption combinations that are questionable. Human interaction certainly couldhave helped in the case reported in the Economist on January 31, 2002 (storytold by Hau Lee): “In the mid-1990s, [Volvo] the Swedish car manufacturerfound itself with excessive stocks of green cars. To move them along, the salesand marketing departments began offering attractive special deals, so green carsstarted to sell. But nobody had told the manufacturing department about thepromotions. It noted the increase in sales, read it as a sign that consumers hadstarted to like green, and ramped up production.”
Sales Aggregation and AdjustmentOnce each region has created its order, it is transmitted to the sales headquarterswhere it is aggregated to produce a national order to be sent to TMC. The orderis checked to ensure that each region has ordered the correct number for eachmodel. Next the order contents must be checked against the manufacturing con-straints to ensure that there are not any constraints that are exceeded. For exam-ple, there are several controlled specifications such as engines, transmissions, andwheels that may have upper and lower limits. These limits are based on capac-ity restrictions at Toyota unit plants and key suppliers. In the event that one ormore constraints are exceeded, the order can be modified by prorating theadjustment across all regions or, if necessary, manually making adjustments toselected regions.
Keep in mind that even though each region order consists of a package anda color mix that sells best in its particular region, the national aggregate mix willnormally be more evenly distributed. In addition, any change from month tomonth will be muted. Table 4-9 shows how a very different mix of build
Toyota Supply Chain Management50

combinations by sample of four regions will, when aggregated, create a moreeven mix of build combinations at a national level.
Once the sales order is completed, it is forwarded onto TMC in Japan. TMCaggregates all orders from all sales companies worldwide. Then the sales requestsare compared with the production operations plans submitted by each manufac-turing plant. High-level meetings attended by sales and production people areheld to resolve the differences between sales requests and production operationsplans. The result is that some last-minute adjustments will be made to ensure thatthe optimum production order is submitted. That collaboration process is similarto the annual planning process, with one big exception: the time frame to com-plete the negotiations is extremely tight. During the annual planning process, theelapsed time to resolve differences is measured in days or weeks, whereas duringthe monthly process the order must be finalized within one or two days.
One metric to measure accuracy of the forecast is to compare the final orderto the previous forecast and measure percent of change or forecast accuracy foreach option. If there are any extreme changes, they should be investigatedbecause they may be an indication of an order error.
How Does Toyota’s Method Compare to Other Planning Methods?In many firms, the sales and operations planning process focuses on materialsplanning constrained by capacity. Detailed accounts of different processesadopted by firms can be obtained from standard books, such as that ofVollmann, Berry, Whybark, and Jacobs.2 In manufacturing planning and con-trol literature, the coordination between sales and production takes place via the“production planning” process. In addition, some firms might use distributionor sales requirements planning to send shipments from the plant to differentregions or warehouses. As Vollmann and others point out, the modern term forsuch coordination is “sales and operations planning (S&OP).” That process beginswith a sales forecast for some predetermined horizon, say 12 to 18 months.
Sales and Operations Planning 51
Table 4-9. Aggregate Order by Region by Package
Build Combination East North South West Total Mix
Package 1 700 1,500 500 700 3,400 23%Package 2 500 1,000 2,000 1,000 4,500 30%Package 3 1,500 1,000 800 1,000 4,300 29%Package 4 300 1,500 700 300 2,800 19%Total 3,000 5,000 4,000 3,000 15,000 100%
Toyota Supply Chain Management52
Increase and decrease in inventory levels as well as resources are planned duringthis process. Limits are placed on the amount of possible increase within, say,three months and for the period three months and beyond. Typically, these plansare reviewed and revised on a monthly basis. In traditional production planningliterature, this step is also called “aggregate production planning.” The plans aremade for groups of similar products, called families, therefore said to be aggre-gated. The costs considered in production planning are the costs of carryinginventory and changing workforce level, as well as the cost of overtime. As withthe Toyota process, the goal is to determine overall sales rates, production rates,aggregate inventories, and backlogs.
As can be discerned from the description, a significant amount of coordina-tion needs to be carried out through meetings. In fact, many writers have empha-sized the need for organizational change for successful implementation of S&OP.Therefore, in recent years, the lack of coordination has been explicitly addressedby the introduction of a high-level sales and operations planning process calledthe “executive S&OP.” SAP,3 for example, offers two blends of S&OP: SAP SOPfor executive S&OP and SCM for near-term S&OP. Moreover, the S&OP is saidto be the business process for coordinating supply, demand, and financial plans.As Wallace and Stahl4 have stated, “The term ‘Sales & Operations Planning’ tra-ditionally referred to a decision-making process for balancing demand and supplyin aggregate. This is an executive-centered activity.” They go on to say that inrecent years the term S&OP has been broadened to include detailed planning atthe product and customer order level. It is also somewhat clear from the descrip-tion given previously that the planning process in other firms is not constrainedby “overall” guidelines beyond profit maximization or cost minimization. InToyota, these “overall” guidelines also control the overall process, namely, payingattention to stability, careful planning before reacting, and measurement of forecast accuracy and consensus building before making changes. These guidelinesemphasize the need to consider the impact beyond the immediate functional orfirm boundary. In our opinion, such explicit guidelines differentiate the S&OPprocess at Toyota from that of other firms. Moreover, the performance of the planand the planning process itself are measured against carefully selected metrics;they are not left to vague or conflicting interpretation.
Reflection PointsCan a firm that does not mass-produce adopt the Toyota S&OP principles? Themain principles adopted by Toyota are straightforward and summarized underthe v4L framework:
■ Variety of cars sold is managed by keeping the national aggregate mix ofpackages and colors stable across time.
Sales and Operations Planning 53
■ Velocity of sales in a region is adjusted to match feasible production rates(takt time) at plants. Capacity planning estimates define the upper andlower production rates across the supply chain.
■ Variability of production is managed by freezing sales commitments overspecified periods. Variability of sales is managed by adjusting sales incen-tives to deliver planned sales.
■ Visibility is ensured by tightly linking sales and operations plans, devel-oping them collaboratively with buy-in, and deploying them across thesystem.
The key learning principles used are as follows:
■ Create awareness. Deviations from plans are made immediately evidentby the use of key metrics. For example, if one of the constraints isexceeded, that fact is highlighted by one of the computer checks and forwarded to a planner to investigate.
■ Make action protocols. Methods for taking corrective action are clearlydocumented. For example, in case of a mismatch between operationsand sales plan, the sequence of actions is to first clearly identify the gapand then to consider the potential countermeasures, gain consensus oncorrective action, and implement changes.
■ Generate system-level awareness. Systemwide considerations are of theutmost importance. They are made through face-to-face interactions anddiscussions. Even computer-generated plans are carefully discussed. Weaklinks in the supply chain are identified and limits placed on variations ateach stage of the chain.
■ Practice PDCA—Plan, Do, Check, and Act—for the planning processitself is a method of taking corrective actions when a new problem isencountered. Changes in the planning process are made using the scien-tific principle.
Endnotes1. Toyota press release, July 10, 2008.2. Thomas E. Vollmann, William L. Berry, D. Clay Whybark, and F. Robert
Jacobs, Manufacturing Planning and Control Systems for Supply ChainManagement, 5th ed. New York: McGraw-Hill/Irwin, 2004.
3. SAP is one of the largest software firms in the world that provides inte-grated inter-enterprise software solutions for all types of industries.
4. T. F. Wallace and B. Stahl, Sales & Operations Planning: The Executive’sGuide. Cincinnati, OH: T. F. Wallace & Co., 2006.

This page intentionally left blank

55
Production scheduling requires close coordination between sales and plantoperations. In this chapter, we will explain how the production scheduleis used to provide consistent and continuous flow of materials and vehi-
cles throughout the supply chain. In Chapter 4 we described how informationis gathered, both top-down and bottom-up, to create a three-month order andforecast. Once a three-month order and forecast are received from the sales divi-sions, the next step is to create a production schedule for the assembly plants.Before a production schedule can be determined, we need to understand howvehicles flow through the assembly plant.
Assembly Plant OperationsA typical Toyota assembly plant is highly integrated. Figure 5-1 shows how avehicle flows through a Toyota plant.
Under one assembly plant roof you will find all of the following:
■ Stamping shop. The stamping shop is where the body parts for a vehicleare stamped out of huge coils of steel. Large stamping presses arearranged in a row connected by conveyors. At the start of one row ofpresses, sheets of steel are cut from the coil and fed into the first press.After the first press stamps the basic shape of the body part (for example,the hood or the door panel), it is routed to the next press, where the pressmay create a curved shape. From there, it is passed to a press thatpunches holes, until finally the finished part rolls off of the press line.Once a press line is configured to stamp a specific body part, it will runfor a period of time until an adequate quantity of parts is produced.Typically, the inventory of stamped parts to supply the body shop will be
Production Scheduling andOperations
Chapter 5

Toyota Supply Chain Management56
enough to generate only a few hours of production. The reason that thestamping line is run in batches is because dies must be changed withinthe presses to reconfigure the line to stamp a different part. But becauseToyota plants can change dies in a few minutes, several different partscan be stamped on each press line each day. Many writers have pointedout the practicality of Toyota’s practice of running batches through thisoperation, including Monden.1 Toyota forsakes the one-for-one idealwith the batch operation, when appropriate. However, unlike manybatch operations, very little is left to randomness. For example, typicalpress operations might waste several blanks before getting the first partright, which is counted as setup time and cost. In Toyota, that waste isavoided by making sure that the presses are maintained and function ata high level of precision. The next step in the process is the body shop.
■ Body shop. The body shop is where a vehicle is born—where it gets itsidentity. At body start, each vehicle gets a unique body number and isassigned a Vehicle Identification Number (VIN). The vehicles are startedin the planned line-off sequence, which is based on the productionschedule and sequence. From this point on, each vehicle is processedindividually throughout the production process. The body number isused to track the vehicle and look up the vehicle specifications so thatthe exact body style is welded together to form the completed body shell.The body shop is highly automated; most of the work is performed byrobots that are programmed to weld each of the vehicle panels togetherto form the body shell. Toyota has made particular innovations in thebody shop by using robots with the flexibility to build different types ofbody parts. From the body shop, the vehicle shell is moved by conveyorinto the paint shop. Improvements in robot flexibility have enabled an
Plastics
Stamping Body Paint Assembly Inspection Sales Line
Typical Toyota Assembly Plant FlowIn
vent
ory
Body Start
Line-Off
Pain
t Ban
k
AssemblyStart
Rep
air
Figure 5-1. Toyota assembly plant process
Production Scheduling and Operations 57
increase in the body shop process flow at Toyota. Note that at Toyotaplants, there is no body shell bank or in-process inventory between thebody shop and the paint shop. That is another innovation based onbuilding vehicles one by one in a planned sequence.
■ Paint shop. Color is applied to the vehicle at the paint shop. The shopconsists of multiple paint booths that use robots to spray-paint the bodyshells coming from the body shop. As the vehicle body shells enter thepaint shop, they are dipped in a solution that covers the body with a pro-tective coating. Then they are organized by color and sent to one of thepaint booths. Because of environmental considerations, vehicles arepainted in small batches of the same color. That approach reduces theamount of pollutants dispersed into the air, as it limits the number oftimes the paint nozzles must be flushed (which happens each time thecolor is changed). Also, some colors will require multiple coats, whichwill result in the vehicles getting out of the planned line-off sequence.Therefore, vehicles are moved to a paint bank prior to going into theassembly shop. A radio frequency tag is affixed to the vehicle in the paintshop with the unique body number encoded. That tag enables each vehi-cle to be tracked throughout the assembly process, which is importantbecause each vehicle’s specifications are used to identify parts that needto be installed on the vehicle as it moves along the line. The tag isattached at this step because it would be damaged by the paint ovens ifit were affixed prior to the paint shop. The next step is to select vehiclesfrom the paint bank to begin assembly.
■ Assembly shop. The assembly shop is the most labor-intensive shop.Most of the parts are installed by hand by team members working insmall teams. Each team is responsible for the work performed during oneprocess cycle at one workstation. The vehicles thus move from one sta-tion to the next at takt time intervals. Recall that takt time is the time ittakes one vehicle to be completed or lined off the assembly line. At theassembly start position, a team member selects vehicles from the paintbank to start in the assembly shop. Although a computer is used to sug-gest the start sequence, a team member actually makes the final decisionon which vehicle to start next. There are several objectives that must beconsidered in making this decision, among which are the following:� Keep vehicles in the original planned line-off sequence. Each vehicle
has a planned line-off date and time stamp that can be used to pickthe oldest first.
� Avoid starting vehicles back to back that have high workload impacton assembly team members. For example, sunroofs may require extrawork in one or more processes.
Toyota Supply Chain Management58
� Maintain the ratio of models on the assembly line. For example, if theline is producing two models and the ratio is 45 percent and 55 percent,then this mix should be maintained.
As the vehicles move down the assembly line, the team membersreceive their instructions (on manifests) about which parts to install oneach vehicle. These manifests are generated by the assembly line controlsystem via a scanner that reads the radio frequency tag. The approximatenumber of steps in assembling a car is 353. Out of these steps, fewer than10 use parts from sequence suppliers. In addition, sequence parts suppli-ers receive an electronic transmission that advises them of the exact line-off sequence. The information enables them to build the parts (e.g.,seats) based on the exact specifications of each vehicle and ship them inthe exact sequence to be installed on the line. Although, most sequencedparts are provided by external suppliers, some sequenced parts, such asplastic shop parts, are produced in-house.
■ Plastic shop. Although the plastic shop is not part of the in-line processof the assembly plant, it provides key components that must be synchro-nized with the assembly process, and it functions as an internal sequencedsupplier. An injection molding process is used to create plastic parts suchas instrument panels and bumpers. Because these parts are colored, theyneed to be sequenced to match the vehicle colors. As happens withsequenced suppliers, these plastic parts arrive at the assembly line on dol-lies in the exact sequence of the vehicles in which they are to be installed.
Now to return to the production line direct flow and examine the inspec-tion process:
■ Inspection. After the vehicle is completed and comes off the main assem-bly line, it is driven to the inspection line. The primary purpose of thisinspection is to conduct functionality tests on such components as theengine, transmission, brakes, and air bags. Next, cars are subject towater-pressure testing to ensure that the vehicle is leak proof. All teamsinvolved in the assembly process are instructed to stop the line in theevent a defect is detected or a problem identified. Thus it is not necessaryfor Toyota to perform rigorous inspection after a vehicle is completed. Ifa vehicle is identified as having a defect, then it will be diverted to arepair area so that the defect can be corrected before it leaves the plant.The final step before the vehicle leaves the plant is the sales line.
■ Sales line. The point at which a vehicle’s ownership is transferred fromthe manufacturing division to the sales division is the sales line. As thevehicle passes an imaginary point on the line, the manufacturing teammember scans the vehicle into the plant computer system to change the

status to “sold,” and the sales team member scans the vehicle into thesales computer to change the status to “bought.” That point is also wheremany of the so-called throw-ins are placed in the car trunk or glove box;those items would include floor mats, wheel covers, and manuals. Oncethe vehicle is lined off and bought by the sales division, the assemblyprocess is complete. The total time it takes a vehicle to move from bodystart to line-off obviously will vary by plant. However, it usually takesabout two calendar days, or three to four production shifts.
Another way to grasp an understanding of the production process is to takea tour of one of the Toyota plants. During the writing of this book, Ananth Iyerand Roy Vasher went on a guided tour of the Toyota Motor ManufacturingKentucky (TMMK) plant in Georgetown, Kentucky. Ananth Iyer captured thefollowing notes during the tour:
The Toyota factory at Georgetown, Kentucky, covers over 1,300 acres of landand employs about 7,000 team members. There are another 1,500 to 2,000people employed by vendors working on-site, such as food service, day-careworkers, etc.
The starting point at the plant is coils of steel delivered about every 30minutes, each coil weighs up to 24 tons. Toyota has 19 press lines and 33presses. Eight-hundred-ton presses operating at 80 strokes per minute createblanks. An example of how Toyota is continuing to kaizen its operations isthat a new stamping line is being installed that is expected to save over 32percent in energy costs and replace two existing lines.
The blanks are transferred by robots to a press that converts parts to req-uisite shapes. There are over 1,300 dies on site. These components are trans-ferred to a flow rack and conveyed to body weld. The body weld operationtakes 274 sheet metal parts and welds them to form a shell. There are over700 robots that perform more than 4,400 welds to create a shell. Team mem-bers rotate tasks every two hours so that they use a different muscle group fortheir work and reduce monotony.
Of the 20 hours it takes to make a car, around 9 hours are spent in thepaint shop. Every 55 seconds of takt time a car is completed. The plants atGeorgetown produce nearly 2,000 vehicles every day. Production in the lineis in a mixed sequence and varies by color, across Camry, Solara, and Avalon.The paint shop has 20 different colors of paint, but the most popular colorsin September 2008 were silver for the Camry and bright red for the Solara.In addition, one in every four Camry models produced is a hybrid.
When the car leaves the paint shop and arrives for assembly, sequencedsuppliers receive notification to deliver their parts in the exact sequence thatcars are produced. In addition, the doors are removed to permit easy access
Production Scheduling and Operations 59

and to prevent damage to the doors. The door components are assembled sep-arately. The exact door of a body rejoins the car at the end of the line.Assembly line associates operate in teams and use the andon cord (an andonis similar to the cord on a train that when pulled sends a signal) to shut down the line when a problem is detected. The team leader helps fix problems immediately, but if a problem is not fixed within a cycle time, theline is stopped.
The TMMK plant has andon cords pulled over 5,000 times each day.Each area has a different song pattern. Our trip itself saw many different lineinterruptions. The immediate attention to problems guarantees that qualityis built in during production for every car. But it also means that adhering tothe production plan is difficult. The role of inventory at the paint shop andat other points along the line is to enable the system to recover from disrup-tions that may change the assembly sequence.
All along the plant there were “blue walls” with information regardingthe daily production, productivity, and so on. The data enable managers to“walk the wall” and get a quick read of the plant’s operating performance.
The plant and its carefully planned and deliberate pace and methodicalexecution of tasks have provided a glimpse of a microcosm of the Toyota supplychain in operation.
Now to examine how the production schedule and sequence are created.Some of the metrics to monitor production are first-run ratio (the percentage ofvehicles that go through the line and are completed on the first pass withoutbeing pulled off the line), actual sequence versus planned sequence, and actualline-off time versus planned line-off time.
Production SchedulingThe production schedule is created once a month from the sales order and fore-cast. As discussed in Chapter 4, sales divisions submit a rolling three-monthorder and forecast each month. The Production Control division must create adaily production plan to execute the agreed-upon schedule.
Scheduling InputsFor the purpose of this discussion, assume that the next production month “N”is being scheduled. The “N” month is considered a firm order commitment, and“N � 1” and “N � 2” are considered preliminary forecasts. The differencebetween the firm orders versus the forecast is that once the firm order is submit-ted from sales to manufacturing, the volume of vehicles by model by plant is
Toyota Supply Chain Management60

Production Scheduling and Operations 61
frozen. In other words, sales divisions have committed to buying these units,and manufacturing has agreed to produce them. Nevertheless, the content of thevehicle specifications can be changed up to about a week prior to line-off.
The forecast for months N � 1 and N � 2 do not prevent changes involume or content. However, because of the 80/20 rule of mix planningdescribed in Chapter 3, the actual variation in individual options from monthto month will be somewhat muted when calculated on a daily rate basis.
Another input necessary to create the production schedule is the productioncalendar and the operations plan for each plant. As discussed in Chapter 4, theproduction calendar consists of four or five weeks for each month; however, theholiday schedule will vary by plant. For example, Thanksgiving is celebrated inCanada during October and during November in the United States. Each plantalso uses a different operating plan that quantifies the number of vehicles to bebuilt on each production day. The quantity per day may even vary by day of theweek. For example, planned overtime may be two hours per day from Mondayto Thursday and zero hours on Friday. Such flexibility demonstrates that Toyotamakes extra effort to accommodate the quality of life of team members.
The final input that is required is the constraints. Those constraints couldbe a limit on the type of engine that can be built on one of the assembly linesor that certain colors can be built only on one line. Another constraint could bea ramp-up or ramp-down of a specific option. That occurs when a new optionor color is introduced as a running change in midmonth. The constraints areestablished by each plant each month and reviewed by the production plannersto ascertain that they are necessary and reasonable. Feasible production scheduleshave to satisfy these constraints.
Scheduling ProcessThe first step in creating the production schedule is to use the sales order andforecast data to create individual records for each vehicle and assign a unique ref-erence number. That step is necessary because each vehicle has to be assigned toa production slot. Though eventually the Vehicle Identification Number (VIN)can be used to identify a unique vehicle, the VIN is not assigned until the vehi-cle is started in the body shop. Therefore, a Unique Reference Number (URN)is assigned to identify vehicles prior to production line-off.
A heijunka process is used to schedule the vehicles by day, by line, by plant.Heijunka (or smoothing) is a technique to avoid supply chain congestion, work-load imbalance, inventory batching, and the like. The software that includes the heijunka logic is proprietary, so the details will not be described. However,the concept of heijunka is to create a level, or smooth, production plan. Thisconcept of heijunka is also called “mixed-model production.” The benefit of

Toyota Supply Chain Management62
heijunka within the plant is to smooth capacity requirements and balance use ofresources. The concept extends beyond the shop floor. By smoothing the flow ofdependent parts, Toyota makes sure that its parts suppliers also see a level load.In fact, it ensures a level load for parts even from Japan or from distant suppli-ers by restricting the day-to-day variation to between �5 percent and –5 percentof the supplier’s order.
Usually some sales orders have specific build dates requested, so those ordersneed to be scheduled first. One such example is fleet orders. The large rentalcompanies such as Hertz, Avis, and National require that their monthly ship-ments arrive during a specified time period each month. Because of the limitedspace at most of their rental locations, they attempt to stagger their new vehiclearrivals and the shipments of the used vehicles. Therefore, these orders need tobe scheduled based on a date range such as the first week of a month. Anotherexample is an individual special customer order that needs to be prioritized.Such orders are usually scheduled early in the month so the customer will receivehis or her vehicle as soon as possible.
Next, the remaining orders are grouped by build combinations and spreadthroughout the month so that the number of identical orders will be evenly dis-tributed across the month. Then the sum of each option for each day is checkedagainst the constraints. That will result in a need to shuffle some orders aroundto ascertain whether the constraints are met. As you can imagine, doing so is liketrying to solve a Rubik’s Cube, because as you move one type of order to resolvea constraint on one option, it will create a constraint violation of another option.To avoid an endless loop when trying to obtain the perfect heijunka for eachoption, a priority weighting is assigned to each option to determine its ranking.Priority weighting is similar to rate-based planning; for example, demand can beimagined as a rate, production as a rate, and supply as a rate. Constraints oncapacity are limitations on rates of different important supplies. If those rates donot match, then there will be creation of inventories or back orders.
In addition to options, the destination of vehicles is also considered as oneof the heijunka factors because it is important to have an even flow of vehiclesto each region. Thus, the analogy of rates is carried forward to rates in differentdirections. The goal of heijunka is to balance these rates.
Once the heijunka process is completed, then each order is assigned thescheduled production day. The production day is deemed to mean the sched-uled line-off day (i.e., the day that production of the vehicle is completed). Thisproduction schedule is then sent back to the sales division to advise its membersof each vehicle’s Unique Reference Number. The production schedule is alsosent to each plant to make the actual production sequence.
A metric to measure the stability of the production plan is to measure thesmoothness of the heijunka by option.

Production SequenceEach plant must determine the exact production sequence within each productionday. The sequence is determined by the operational conditions within eachplant. Some of these conditions are color batching, workload associated withspecific labor-intensive options, and heijunka of the major options within a day.Similar to the heijunka logic, this logic is proprietary and is considered a blackbox. The daily production plan is the input, and the output is a productionsequence for each day. This production sequence is used by the plant to createthe parts orders. It is also used as input to the assembly line control system sothat vehicles are started in the correct sequence.
Sample Production PlanAssume that Table 5-1 contains a list of vehicles that are to be scheduled tocreate a production plan. For this simple exercise, there are only three optionsfor each vehicle (i.e., grade, engine cylinder, and color). The grade can be eitherLE or XLE. Engine is either a four- or six-cylinder. Color has three choices: red,black, and blue.
The objective is to create a production schedule for these 10 vehicles over afive-day period and to achieve a level quantity of each option. The ideal sched-ule would contain an equal number of each grade, engine, and color per day. Butas you can see, achieving that would be impossible because the sum of eachoption is not divisible by 5. For example, there are six LE grades and four XLEgrades.
Production Scheduling and Operations 63
Table 5-1. Sample Set of Vehicles
Input Sequence
No. Grade Engine Color
1 LE 4 Cyl. Red2 XLE 6 Cyl. Black3 LE 4 Cyl. Blue4 LE 6 Cyl. Blue5 LE 4 Cyl. Blue6 LE 6 Cyl. Blue7 LE 6 Cyl. Red8 XLE 4 Cyl. Black9 XLE 4 Cyl. Red10 XLE 4 Cyl. Black
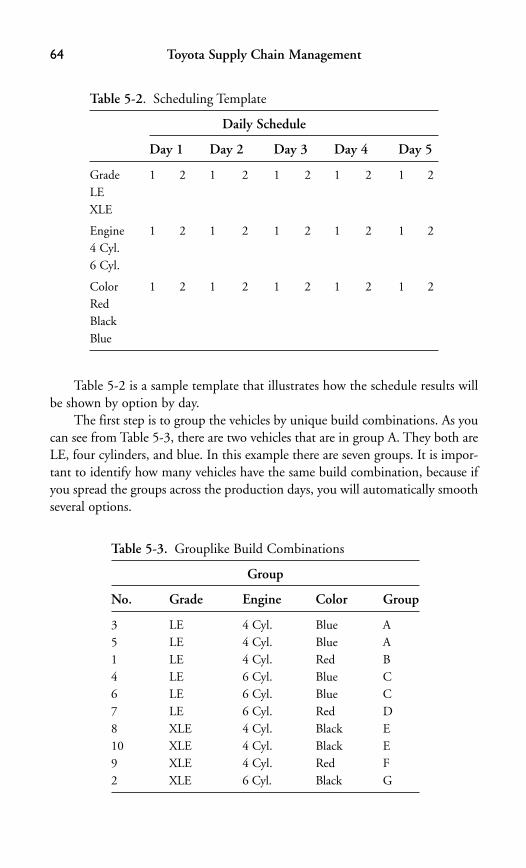
Toyota Supply Chain Management64
Table 5-2 is a sample template that illustrates how the schedule results willbe shown by option by day.
The first step is to group the vehicles by unique build combinations. As youcan see from Table 5-3, there are two vehicles that are in group A. They both areLE, four cylinders, and blue. In this example there are seven groups. It is impor-tant to identify how many vehicles have the same build combination, because ifyou spread the groups across the production days, you will automatically smooth several options.
Table 5-2. Scheduling Template
Daily Schedule
Day 1 Day 2 Day 3 Day 4 Day 5
Grade 1 2 1 2 1 2 1 2 1 2LEXLE
Engine 1 2 1 2 1 2 1 2 1 24 Cyl.6 Cyl.
Color 1 2 1 2 1 2 1 2 1 2RedBlackBlue
Table 5-3. Grouplike Build Combinations
Group
No. Grade Engine Color Group
3 LE 4 Cyl. Blue A5 LE 4 Cyl. Blue A1 LE 4 Cyl. Red B4 LE 6 Cyl. Blue C6 LE 6 Cyl. Blue C7 LE 6 Cyl. Red D8 XLE 4 Cyl. Black E10 XLE 4 Cyl. Black E9 XLE 4 Cyl. Red F2 XLE 6 Cyl. Black G
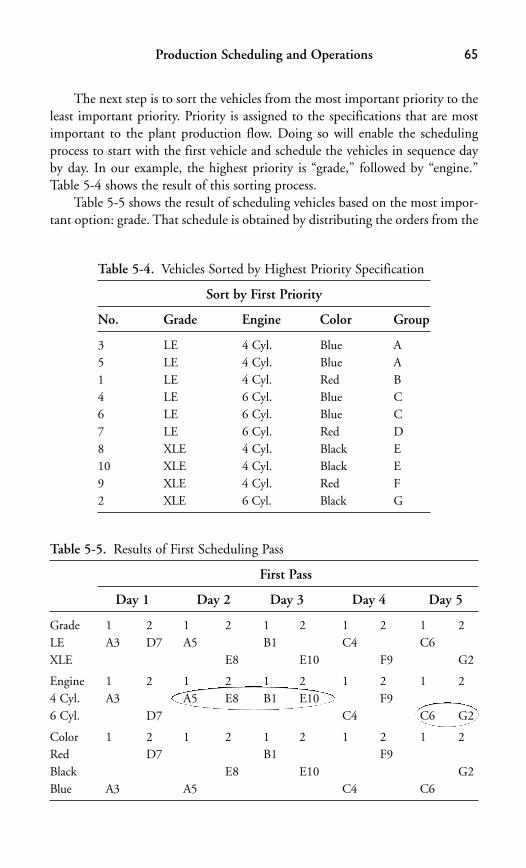
Production Scheduling and Operations 65
The next step is to sort the vehicles from the most important priority to theleast important priority. Priority is assigned to the specifications that are mostimportant to the plant production flow. Doing so will enable the schedulingprocess to start with the first vehicle and schedule the vehicles in sequence dayby day. In our example, the highest priority is “grade,” followed by “engine.”Table 5-4 shows the result of this sorting process.
Table 5-5 shows the result of scheduling vehicles based on the most impor-tant option: grade. That schedule is obtained by distributing the orders from the
Table 5-4. Vehicles Sorted by Highest Priority Specification
Sort by First Priority
No. Grade Engine Color Group
3 LE 4 Cyl. Blue A5 LE 4 Cyl. Blue A1 LE 4 Cyl. Red B4 LE 6 Cyl. Blue C6 LE 6 Cyl. Blue C7 LE 6 Cyl. Red D8 XLE 4 Cyl. Black E10 XLE 4 Cyl. Black E9 XLE 4 Cyl. Red F2 XLE 6 Cyl. Black G
Table 5-5. Results of First Scheduling Pass
First Pass
Day 1 Day 2 Day 3 Day 4 Day 5
Grade 1 2 1 2 1 2 1 2 1 2LE A3 D7 A5 B1 C4 C6XLE E8 E10 F9 G2
Engine 1 2 1 2 1 2 1 2 1 24 Cyl. A3 A5 E8 B1 E10 F96 Cyl. D7 C4 C6 G2
Color 1 2 1 2 1 2 1 2 1 2Red D7 B1 F9Black E8 E10 G2Blue A3 A5 C4 C6
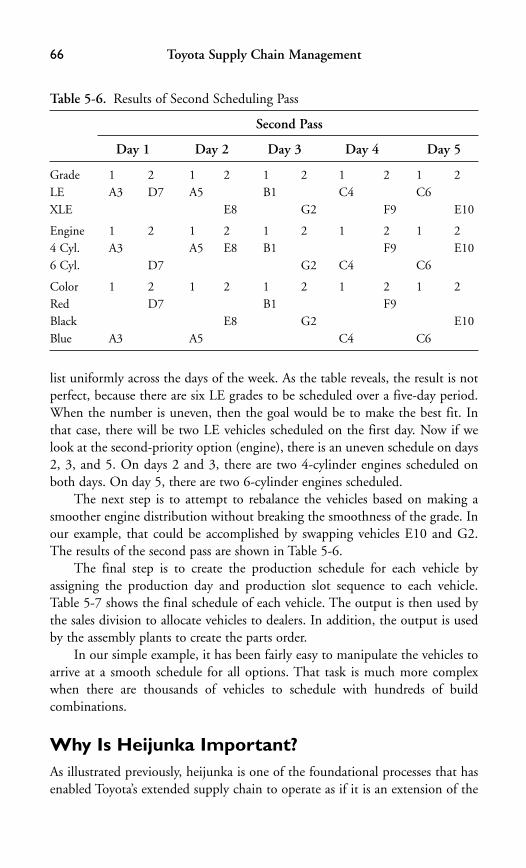
Toyota Supply Chain Management66
list uniformly across the days of the week. As the table reveals, the result is notperfect, because there are six LE grades to be scheduled over a five-day period.When the number is uneven, then the goal would be to make the best fit. Inthat case, there will be two LE vehicles scheduled on the first day. Now if welook at the second-priority option (engine), there is an uneven schedule on days2, 3, and 5. On days 2 and 3, there are two 4-cylinder engines scheduled onboth days. On day 5, there are two 6-cylinder engines scheduled.
The next step is to attempt to rebalance the vehicles based on making asmoother engine distribution without breaking the smoothness of the grade. Inour example, that could be accomplished by swapping vehicles E10 and G2.The results of the second pass are shown in Table 5-6.
The final step is to create the production schedule for each vehicle byassigning the production day and production slot sequence to each vehicle.Table 5-7 shows the final schedule of each vehicle. The output is then used bythe sales division to allocate vehicles to dealers. In addition, the output is usedby the assembly plants to create the parts order.
In our simple example, it has been fairly easy to manipulate the vehicles toarrive at a smooth schedule for all options. That task is much more complexwhen there are thousands of vehicles to schedule with hundreds of build combinations.
Why Is Heijunka Important?As illustrated previously, heijunka is one of the foundational processes that hasenabled Toyota’s extended supply chain to operate as if it is an extension of the
Table 5-6. Results of Second Scheduling Pass
Second Pass
Day 1 Day 2 Day 3 Day 4 Day 5
Grade 1 2 1 2 1 2 1 2 1 2LE A3 D7 A5 B1 C4 C6XLE E8 G2 F9 E10
Engine 1 2 1 2 1 2 1 2 1 24 Cyl. A3 A5 E8 B1 F9 E106 Cyl. D7 G2 C4 C6
Color 1 2 1 2 1 2 1 2 1 2Red D7 B1 F9Black E8 G2 E10Blue A3 A5 C4 C6
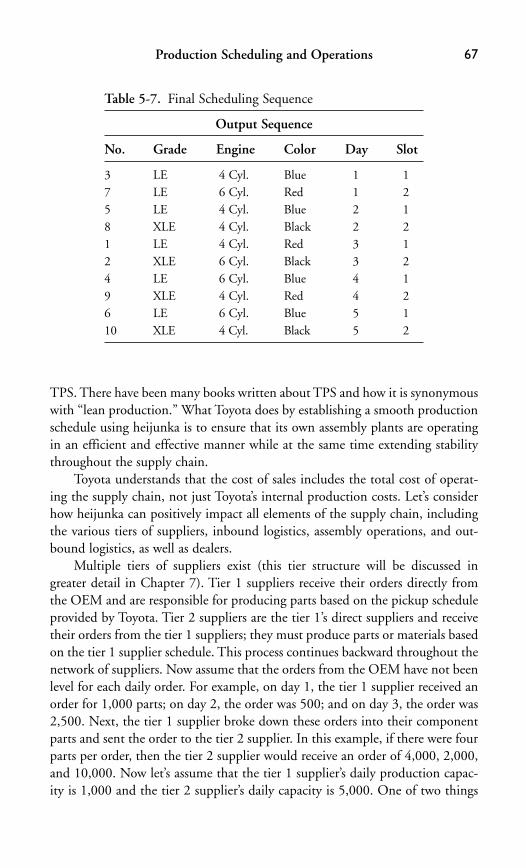
Production Scheduling and Operations 67
TPS. There have been many books written about TPS and how it is synonymouswith “lean production.” What Toyota does by establishing a smooth productionschedule using heijunka is to ensure that its own assembly plants are operatingin an efficient and effective manner while at the same time extending stabilitythroughout the supply chain.
Toyota understands that the cost of sales includes the total cost of operat-ing the supply chain, not just Toyota’s internal production costs. Let’s considerhow heijunka can positively impact all elements of the supply chain, includingthe various tiers of suppliers, inbound logistics, assembly operations, and out-bound logistics, as well as dealers.
Multiple tiers of suppliers exist (this tier structure will be discussed ingreater detail in Chapter 7). Tier 1 suppliers receive their orders directly fromthe OEM and are responsible for producing parts based on the pickup scheduleprovided by Toyota. Tier 2 suppliers are the tier 1’s direct suppliers and receivetheir orders from the tier 1 suppliers; they must produce parts or materials basedon the tier 1 supplier schedule. This process continues backward throughout thenetwork of suppliers. Now assume that the orders from the OEM have not beenlevel for each daily order. For example, on day 1, the tier 1 supplier received anorder for 1,000 parts; on day 2, the order was 500; and on day 3, the order was2,500. Next, the tier 1 supplier broke down these orders into their componentparts and sent the order to the tier 2 supplier. In this example, if there were fourparts per order, then the tier 2 supplier would receive an order of 4,000, 2,000,and 10,000. Now let’s assume that the tier 1 supplier’s daily production capac-ity is 1,000 and the tier 2 supplier’s daily capacity is 5,000. One of two things
Table 5-7. Final Scheduling Sequence
Output Sequence
No. Grade Engine Color Day Slot
3 LE 4 Cyl. Blue 1 17 LE 6 Cyl. Red 1 25 LE 4 Cyl. Blue 2 18 XLE 4 Cyl. Black 2 21 LE 4 Cyl. Red 3 12 XLE 6 Cyl. Black 3 24 LE 6 Cyl. Blue 4 19 XLE 4 Cyl. Red 4 26 LE 6 Cyl. Blue 5 110 XLE 4 Cyl. Black 5 2

could happen: either each supplier would stock extra inventory to enable it tofulfill the demand or it would ship short and create a back order until it couldcatch up. That would create a “bullwhip effect” (as examined in Chapter 13)and lead to inefficient operations at all tiers of suppliers, especially if these vari-ations could not be forecasted in advance. Thus, even with the best intentions,the variance of orders would exceed the variance of demand (the bullwhip effect)unless efforts were made to dampen the effect. Even though suppliers adjust andattempt to respond to these dramatic changes in demand, the inefficienciesresult in higher operating costs, which are passed along to the OEM.
Now let’s consider Toyota’s orders based on the production schedule usingheijunka. As we discussed earlier in this chapter, it is not possible to create a per-fect heijunka for all parts; however, a good heijunka result would be a variationof between �5 percent and −5 percent. If Toyota’s average parts order were1,000, then the expected daily order to the tier 1 supplier would be between 950and 1,050 parts. Therefore, the tier 1 order to the tier 2 supplier, based on fourparts per order, would range from 3,800 to 4,200 parts. In that case, because thevariation in daily orders would be very small, the suppliers could adjust theirdaily production by varying the level of overtime instead of maintaining highlevels of safety stock or risk shipping short.
The next segment of the supply chain is inbound logistics. Heijunka playsan important role in smoothing the daily shipments from tier 1 suppliers to theToyota assembly plants. Toyota uses third-party logistics partners to manage andoperate a fleet of trucks that picks up parts on a daily basis and delivers them tomultiple assembly plants. Heijunka of the parts volume for each supplier in thenetwork ensures a consistent flow of parts through the logistics network. Thatmaximizes transportation efficiency by facilitating a high utilization of trucksand drivers every day.
Once the parts arrive at the assembly plants, they come under the controlof the internal logistics group. Internal logistics is responsible for moving partsfrom the dock to the line side just-in-time. Kanbans are used to signal when theparts are needed for each line side station. Again, heijunka ensures a smoothflow of parts within the plant. That enables the forklift drivers to operate in anorderly manner on a regular internal route schedule.
Once the vehicles are produced, they are ready for shipment to dealers.Vehicles are transported by various methods including ship, rail, and truck. Inthe United States, however, most vehicles are transported by rail to a regionalrailhead. After the vehicles arrive at a railhead and are unloaded, a trucking com-pany picks them up and delivers them to the dealers. As discussed earlier, Toyotastrives to ensure that all components of the supply chain are streamlined andoperate efficiently and effectively. Therefore, if vehicles are produced andshipped randomly without regard to railhead destination, then vehicles arrive in
Toyota Supply Chain Management68

Production Scheduling and Operations 69
an uneven manner and eventually create a bottleneck. To prevent that from hap-pening, Toyota includes the destination code as one of the parameters that isconsidered in the heijunka process. That inclusion ensures a smooth and evenflow of vehicles through the distribution network.
Finally, the vehicles arrive at a dealer and are placed into inventory untilsold. (Remember driving past dealerships that proudly park their vehicles inlarge lots in front and around the dealership? Those vehicles are the inventory.)Again, you may question, how does heijunka affect the dealerships? Just as at therailhead, a bottleneck can occur at a dealer if too many vehicles arrive in a shortperiod of time. Dealership personnel must prep the vehicles once they arrive andget them ready for sale. It is best if this work is spread throughout the month.In addition, it is important to have a steady flow of vehicles to each dealer toavoid unnecessary buildup of inventory. Heijunka is again used to smooth thenumber of vehicles scheduled throughout the month by region. The region thenallocates its vehicles to the dealers proportionally based on sales volume. Doingso will ensure a smooth flow of vehicles to each dealer throughout the month.
In summary, heijunka plays a vital role in Toyota’s supply chain operations.It is used to create a smooth flow of parts from suppliers to the assembly plantas well as for maintaining a smooth flow of vehicles from each assembly plant tothe dealers.
Why Is Production Sequence Important?The sequence the vehicle is produced within the day is important because theassembly plant operations need to be well balanced to ensure that there are nobottlenecks within the production process or overburden on selected teams.Again, Toyota’s focus is to guarantee smooth operations throughout the assem-bly process. In an assembly plant, there are hundreds of workstations along theline that install parts on the vehicle as the vehicle body passes through. Theobjective is to make sure that each work team’s effort is similar and that the workcan be completed within the takt time. Therefore, the production sequence isestablished based on smoothing options that create extra work for one or morework teams.
Once the sequence is set within each day, then the estimated line-off time(or completion time) can be assigned to each vehicle. A typical production dayfor a plant that runs two production shifts starts at 6 a.m. and completes atabout 2 a.m. the next calendar day. So the first vehicle would have a plannedline-off date/time of production D: 06:01, whereas the last vehicle planned line-off date/time would be D � 1: 02:00.
The planned line-off date/time is used by sales to calculate the estimatedtime of arrival (ETA). The ETA is used by dealers to keep customers posted on

Toyota Supply Chain Management70
the scheduled arrival of their vehicle. The process to create the ETA will beexplained in Chapter 8.
The line-off date/time is also sent to the parts ordering process to determinewhen parts will need to be shipped from the suppliers to arrive just-in-time tobe installed on each vehicle. This process will be discussed in more detail inChapter 6.
How Does Toyota’s Scheduling Process Compare to Others?Master production scheduling (MPS) is the process used in the manufacturingplanning and control framework to initiate more production. A master produc-tion scheduling process plans production as forecasts are updated and also whenorders are received. The master production schedule is often determined at the group level. [The final assembly schedule (FAS) also coordinates between theproduction plan and the rest of the manufacturing processes by specifying theexact build sequence.] A check is made to ascertain whether the aggregate of the detailed planned build equals the volume planned by the MPS. The masterproduction schedule is the input to materials planning. Materials RequirementsPlanning (MRP) will be discussed and compared to Toyota’s method of materi-als planning in Chapter 6. At this time it is enough to note that the material planuses fixed lead times to decide when to schedule parts or assemblies.
Let us now compare these MRP processes to the scheduling processes atToyota. MRP processes share many similarities with scheduling processes atToyota; they have some differences too. As with scheduling at Toyota, there is anattempt to freeze the production plan using planning fences when developingthe MPS. Typically, the planning horizon is split into zones that are called “ice,”“slush,” and “water.” The ice part is frozen, the slush part is where some changesat the product family level are allowed, and the water part is open to changes.However, with MRP the attempt to manage the selling to match capacity is notundertaken with as much assiduousness as in Toyota.
It is well known that MRP tends to generate a significant amount of nerv-ousness. That is so because small perturbations to the demand can lead to sig-nificant variations within the plant as well as for suppliers. This phenomenon isinadvertent and unavoidable because of the rules used to plan production. InMRP, production is considered to be taking place in discrete time (weeks, days,or hours); thus, the quantity to be produced is often “batched” so that the batchis the right size and started at the right time. Any such attempt at batching canlead to large changes in production requirements because of a small change inproduction plans. For example, say an economic batch size is 50. The demandin a period is 48. The next batch may not be started until the next period if the

Production Scheduling and Operations 71
on-hand inventory is enough to cover current consumption requirements, evenif the safety stock is low. For example, if safety stock is 10, current consumptiondemand is 30, and on-hand inventory is 43, then the planner might decide notto release a batch for production. Now, assume that either a customer places anorder for five units or there is a change in forecast by the same five units. Thenit is likely that a batch of 50 is released for production immediately. Toyotaavoids such a scenario by using heijunka to create a level production plan. Thatstability prevents the nervousness associated with rules of batching in MRPwithin the plant and even when ordering from suppliers.
The materials plan is traditionally executed with a manufacturing executionsystem (MES). Often, the traditional scheduling process has to contend withmanaging orders through several complex steps to achieve the lead time prom-ised by the material planners. For example, a stamping shop might have severalprocesses. For material planning purposes, manufacturing a particular stampingis considered to be a single process. The average lead time plus some slack is usedto plan production of this part in the shop. The shop therefore has leeway inscheduling the individual orders such that they meet the lead time; safety stockto cover scrap and rework is also added. The inclusion of slack in planning andthe lack of step-by-step coordination inevitably lead to carrying inventory aswork-in-process or finished goods. They also lead to temporary surges in capac-ity requirements that are seemingly unpredictable. In Toyota’s process, the pro-duction plan is based on each shop working at its standard operations rate; thus,surges in workload are avoided. That approach makes scheduling easier toaccomplish. Deviations are obvious and visible; they can be traced and addressedas and when they occur.
We say that the traditional (and common) methods use position-basedplanning because the position of inventories dictates the production planningand scheduling, not the rate of demand and supply. In summary, the processesmentioned previously deviate fundamentally from Toyota’s because they useposition-based planning instead of rate-based planning. They also differ signifi-cantly because of the lack of a “self ” or “automatic” coordination/constrainingmechanism such as heijunka, which forces collaboration across production andlogistics planning, scheduling, and supplier planning processes.
Reflection Points■ Variety is planned and distributed across periods (using heijunka) to bal-
ance tasks.■ Velocity is maintained using a rate-based planning of flows balanced
across the supply chain. By eliminating bottlenecks, the velocity is maximized.

■ Variability is curtailed with heijunka to smooth out workload and load-ings. That variability reduction enables suppliers to plan their capacityreliably and thus lower costs.
■ Visibility is ensured by eliminating inventories, simplifying planning,ensuring buy-in, and so on.
The following are highlights of the learning practices:
■ Create awareness. Heijunka makes deviations evident and forces plannersto resolve issues as they arise. It enforces coordination at the supply chainlevel and makes problems evident to supply chain participants.
■ Establish capability. Production control planners undergo intensiveapprenticeship. Senior planners are asked to devote time to training.
■ Make action protocols. Methods for taking actions to resolve heijunka aredocumented. The sequence in which different constraints are consideredduring planning are discussed and documented.
■ Generate system-level awareness. Systemwide implications are captured byheijunka itself. It supersedes immediate concerns about local profit andloss. Heijunka makes deviations evident and forces planners to resolveissues as they arise. It enforces coordination at the supply chain level.
Endnote1. Yasuhiro Monden, Toyota Production System: An Integrated Approach to
Just-In-Time, 3d ed. Atlanta: Engineering & Management Press,December 1998.
Toyota Supply Chain Management72

73
Toyota adopts different planning methods depending on which types ofparts are involved. Some of the planning processes are unique to Toyotaand so are worth contrasting with general practice.
There are many parts ordering processes for the different categories of parts.The four broad part categories are local parts, long lead time parts, in-houseparts, and sequenced parts:
1. Local parts are parts supplied by suppliers located within the same globalregion as the assembly plants. For example, parts supplied by North Americansuppliers to assembly plants located in North America would be consideredlocal.
2. Parts supplied by Japanese suppliers to North American and Europeanassembly plants would be considered long lead time parts.
3. In-house parts, such as body panels, plastic bumpers, and engines, are pro-duced at the same site as the assembly plant.
4. Sequenced parts are produced at suppliers located near to the assemblyplant. Those parts are shipped to the assembly plant in the exact sequenceof the vehicles being produced. A typical sequenced part for assembly isseats.
Each of these categories of parts has a unique parts ordering process thatis described in this chapter. Note that the use of the term “parts” broadlyincludes individual parts as well as component assemblies. Also, parts ordersare issued for parts and assemblies that are shipped from tier 1 suppliers to theoriginal equipment manufacturer (OEM), which in this case is Toyota. Thetier 1 suppliers are responsible for ordering their parts and materials from theirsuppliers.
Parts Ordering
Chapter 6

Common Parts Ordering ProcessesSome prerequisite processes are common to all of the parts ordering categories.These are necessary parts quantity calculations, parts and supplier master databasemaintenance, and parts forecasting. Each of these processes will be explained inthe following paragraphs.
Necessary Parts QuantityThe necessary parts quantity calculation process translates the vehicle specifica-tion into the parts and components necessary to build the vehicle. The processuses a production schedule like the one discussed in Chapter 5 and a Toyotaspecification database that is similar to a bill of material (BOM).1 The specifica-tion database is maintained by the engineering group and contains all of thespecifications of each vehicle structure, including the necessary parts required tobuild each vehicle. The specifications are used by many functions within a man-ufacturing company including engineering, purchasing, manufacturing, andparts ordering. Toyota refers to its version of the BOM as the SpecificationsManagement System (SMS). Because Toyota produces many of the same vehi-cles at plants around the world, it is imperative that the SMS database be thesame source for vehicle structures.
Each plant also maintains a subset of the SMS database that provides the parts list for the vehicles produced at the plant. This database is the PlantSpecifications Management System, or PSMS. Each parts ordering group usesthe PSMS to identify the necessary parts and quantities required to build eachvehicle. A key point here is that each unique vehicle build combination will havea different set of parts. For example, assume there are two vehicles with almostidentical specifications:
■ Vehicle A: Blue, four-door sedan, four-cylinder engine without spoiler■ Vehicle B: Blue, four-door sedan, four-cylinder engine with spoiler
The only difference between the two is that vehicle B has a spoiler; there-fore, it would seem obvious that the only differences in the parts requirementsare the spoiler and fasteners needed to attach it to the trunk. However, manyspoilers contain a backlight. So, in addition to the spoiler parts, additional wiringharness parts are needed. This example emphasizes the need to consider eachunique vehicle combination when performing the parts calculation.
The output of the necessary parts calculation process is a complete parts listalong with the quantities needed for each vehicle. As will be explained later,Toyota retains the parts requirements by individual vehicles and does not aggre-gate the quantities by part number until the parts order is generated. In addition,each part is classified as local, long lead time, in-house, or sequenced.
Toyota Supply Chain Management74
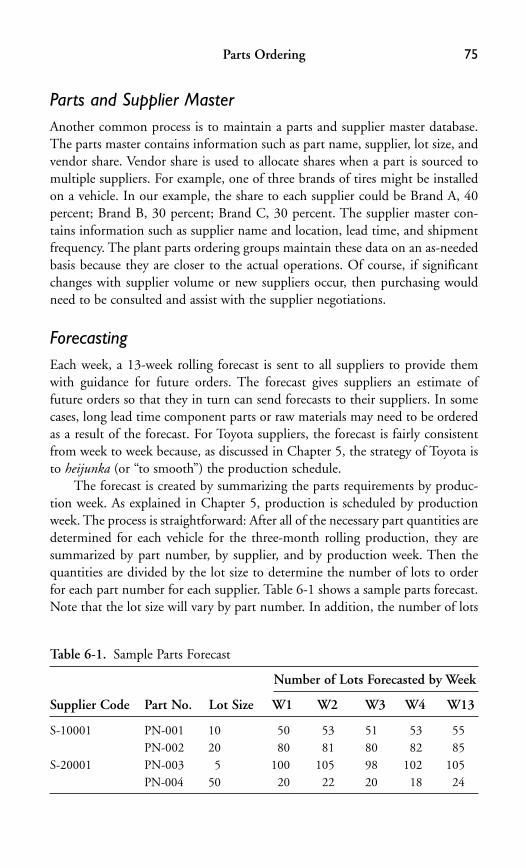
Parts and Supplier MasterAnother common process is to maintain a parts and supplier master database.The parts master contains information such as part name, supplier, lot size, andvendor share. Vendor share is used to allocate shares when a part is sourced tomultiple suppliers. For example, one of three brands of tires might be installedon a vehicle. In our example, the share to each supplier could be Brand A, 40percent; Brand B, 30 percent; Brand C, 30 percent. The supplier master con-tains information such as supplier name and location, lead time, and shipmentfrequency. The plant parts ordering groups maintain these data on an as-neededbasis because they are closer to the actual operations. Of course, if significantchanges with supplier volume or new suppliers occur, then purchasing wouldneed to be consulted and assist with the supplier negotiations.
ForecastingEach week, a 13-week rolling forecast is sent to all suppliers to provide themwith guidance for future orders. The forecast gives suppliers an estimate offuture orders so that they in turn can send forecasts to their suppliers. In somecases, long lead time component parts or raw materials may need to be orderedas a result of the forecast. For Toyota suppliers, the forecast is fairly consistentfrom week to week because, as discussed in Chapter 5, the strategy of Toyota isto heijunka (or “to smooth”) the production schedule.
The forecast is created by summarizing the parts requirements by produc-tion week. As explained in Chapter 5, production is scheduled by productionweek. The process is straightforward: After all of the necessary part quantities aredetermined for each vehicle for the three-month rolling production, they aresummarized by part number, by supplier, and by production week. Then thequantities are divided by the lot size to determine the number of lots to orderfor each part number for each supplier. Table 6-1 shows a sample parts forecast.Note that the lot size will vary by part number. In addition, the number of lots
Parts Ordering 75
Table 6-1. Sample Parts Forecast
Number of Lots Forecasted by Week
Supplier Code Part No. Lot Size W1 W2 W3 W4 W13
S-10001 PN-001 10 50 53 51 53 55PN-002 20 80 81 80 82 85
S-20001 PN-003 5 100 105 98 102 105PN-004 50 20 22 20 18 24
forecasted by week may vary, but that variance will be minimized because ofheijunka.
The forecast and parts orders are communicated to the suppliers either byElectronic Data Interchange (EDI)2 or via a supplier Web portal.
Local Parts OrderingLocal parts usually represent the largest number of part numbers. For eachvehicle type there could be 300 to 400 suppliers that are located within a fewdays’ travel time from the assembly plant. Although the suppliers receive aweekly forecast from Toyota, they must wait until they receive the final dailyorder prior to preparing the shipments. The final order is transmitted to thesuppliers each day.
The formula for calculating the daily parts order is very precise in order toensure that each part for each vehicle arrives so that it can be installed at the lineside station in the assembly plant just-in-time. The following are key items thatare used in the parts order calculation:
■ The necessary parts quantities calculation for each vehicle■ The operating condition at the assembly plant:
� The last vehicle lined off (the vehicle URN that was the last one offthe line at the end of the previous day’s production)
� Current operations schedule based on latest overtime plan by day� The installation point on the assembly line where each part is installed
and time offset calculated backward from the end of the line� Prior-day usage of parts based on kanban
■ Key information for each supplier:� Part numbers for each supplier� The lot size for each part� The location of the supplier’s plant and the lead time from the sup-
plier’s plant to the Toyota assembly plant
The objective of the daily parts ordering process is to send orders to eachsupplier for parts that will be needed for production based on the supplier’s leadtime.
The first step is to determine the adjusted vehicle production schedulebased on the latest operating conditions. In Chapter 5 we demonstrated howvehicles are scheduled by production day and then sequenced within each day.That sequence will be the production plan, if everything at the plant runs onschedule. That assumption is a big one, because many things can happen tocause the plant to get off schedule. Therefore, each day prior to the determina-tion of the daily parts order, the day-to-day production schedule is reset. The
Toyota Supply Chain Management76

revised production schedule is created by starting with the last vehicle lined offand working backward to determine how many vehicles will be built each daybased on the current operating plan. The daily operating plan is updated eachday to reflect changes in daily overtime and/or working hours and days. Forexample, if at the end of the prior production day there was an equipmentproblem that caused the plant to lose three hours of production, then that lostproduction would most likely be made up by working overtime the next threedays. Look at Table 6-2 to see the effect of this shift in the production schedule.The table reveals that on day two the actual vehicles produced were 850 versusthe plan of 1,000. It means that the plant is 150 vehicles behind the plan.Therefore, the daily schedule will be revised showing 150 vehicles will be madeup over the next three days. Observe the emphasis on not reacting too quickly, onsmoothing the rate to ensure that the system is not stressed unduly, and the pre-cision with which shortfalls are made up.
The importance of the adjustment is that if the parts were ordered based onthe original plan, then the parts would be arriving at the plant ahead of the timeneeded. The result would be too much inventory at the plant. Too much inven-tory in the Toyota Production System is considered muda, or waste; thus, theschedule is adjusted to avoid ordering too many or too few parts.
Another factor used to determine when to order each part is the actual leadtime for each supplier. To illustrate this point, refer to Table 6-3. This tableshows a situation where a daily parts order is to be placed to two suppliers withdifferent lead times. Part PN-001 is supplied from supplier S-10001, and thelead time is four days. This order will be issued on the sixteenth of the monthfor vehicles that will be produced on the twentieth. Part PN-003, on the other
Parts Ordering 77
Table 6-2. Plan versus Actual Production Adjustment
Item Day 1 Day 2 Day 3 Day 4 Day 5
Plan 1,000 1,000 1,000 1,000 1,000Actual 1,000 850Variance 0 (150)Revised plan 1,050 1,050 1,050
Table 6-3. Order Lead Time
Supplier Part No. Lead Time Order Day Production Day
S-10001 PN-001 4 days 16th 20thS-20001 PN-003 2 days 18th 20th

hand, is supplied from supplier S-20001 and the lead time is two days, so theorder will be issued on the eighteenth for the same vehicles to be produced onthe twentieth. The same process is repeated for all parts and all vehicles in theschedule until the part with the longest lead time has been ordered.
Keep in mind that all parts for a vehicle will not be ordered on the same daybecause each part may have a different lead time, depending on each supplier’slocation. Specifically, the aggregate order for parts is always linked to specificvehicle orders! This real-time connection between parts ordering and actualvehicle requirements keeps the supply line taut and coordinated throughout themanufacturing and supply systems.
Once the initial requirements are determined for each part, several adjust-ments need to be made before the order is finalized:
■ Specifications may change in the vehicle content after parts have beenordered because dealers can change some specifications up to five daysprior to production. That could mean that some parts that were orderedprior to the five-day freeze point were ordered incorrectly. Therefore,after the final vehicle specifications are known, parts ordered based onthe tentative specifications must be compared to the parts requirementsbased on the final specifications, and an adjustment is added to or sub-tracted from the next order.
■ Usage variations because of scrap, misuse, or inventory loss adjustmentsare calculated by comparing the actual usage based on the internal kan-bans to the expected usage based on the necessary parts calculation of thefinal vehicle specifications. These adjustments are added to or subtractedfrom the next order.
■ Operating conditions may also necessitate miscellaneous adjustmentsthat can also be manually added or subtracted.
Although this process may seem very similar to the traditional MRP,3 thereis one significant difference: traditional MRP systems rely on the parts inventorycount to determine what is on hand and on order. The inventory quantity isthen subtracted from the total parts requirement to determine the quantity tobe ordered. One risk in using inventory quantity in the parts calculation is thatit does not automatically adjust for scrap and/or misusage. Moreover, the con-nection between orders and parts gets broken in most MRP systems. It may existthrough information linkages, but not as tightly as Toyota intends—the com-pany aims to keep the physical vehicle orders and parts orders tightly coupled.That is achieved by insisting on accurate specifications, keeping vehicle partsrequirements separate, planning on adjustments on a frequent basis instead ofweekly or monthly, and by grouping parts that need different types of controlsand planning systems.
Toyota Supply Chain Management78

Once the quantities of each part and supplier have been determined, theactual order by lot and shipping time needs to be determined. One of Toyota’sphilosophies is to have “small lots, frequent deliveries,” so most suppliers willhave multiple shipments per day, or at least one shipment per day. The follow-ing is an example of a final parts ordering calculation:
1. The number of parts required (130) less carryover (0) equals parts to beordered (130)
2. The parts to be ordered (130) divided by lot size (25) equals 6 lots and 20carryover (Note: always round up to the next lot; the carryover will be sub-tracted from the next day’s order.)
3. The number of lots (6) divided by the number of shipments per day (3)equals 2 lots per shipment
Long Lead Time Parts OrderingLong lead time parts are handled differently than locally procured parts. Thereason is quite obvious: long lead time parts must be ordered several weeks inadvance of production. For example, most of the long lead time parts for Toyota’sNorth American and European plants are shipped from Japan with a lead time ofabout six weeks. But this means that there will be some inaccuracies because thefinal vehicle specifications are not frozen until about five to ten days prior to pro-duction. The final freeze point varies by each plant and is based on local lead timeconditions. The general rule of thumb is that 80 percent of the local parts leadtime should be shorter than the final freeze point. For example, if the freeze pointis five days, then 80 percent of local parts will have a lead time of five days or less.
Another factor that makes the planning tricky is that the work schedules aredifferent in Japan than in North America or Europe, and in some cases they vary by country. For example, Canada celebrates Thanksgiving in October,whereas the United States celebrates it in November. Japan does not recognizeThanksgiving, but the country shuts down in May for Golden Week.4
To accommodate these differences each month, the working calendars ofeach plant are mapped to the working calendar of Japan. Working backwardfrom the production schedule at the overseas assembly plant, each day’s vehicleschedule would be mapped back to the day it must be shipped from Japan. Thatprocedure gets a little more complicated because a production day of June 15 inthe United States means that the parts must be ordered from Japan around May1, assuming a six-week lead time. The actual shipment time is about four weeks,so these parts would be shipped in early May to arrive at the overseas plant onJune 15. Now, if there is a holiday in Japan during early May, then the partsordering schedule must be shifted to ensure that the shipment date is met. Theprocess of mapping these schedules is sometimes referred to as a “rundown.”
Parts Ordering 79

Refer to Table 6-4 to grasp how the concept works. In the example, the dailyproduction rate for the week of June 15 is 1,000 vehicles per day. Therefore, the parts required to build these vehicles will be shipped four weeks earlier, or theweek of May 18. So when the daily work schedules are the same, the shippingand production will mirror each other.
But bear in mind that May 22 is a holiday in Japan. In Table 6-4, you cansee that the parts required to build the 1,000 vehicles are spread evenly over thefirst four days of the week. The result is that 1,250 equivalent vehicles of partswill be shipped each of the four days preceding the holiday. Note: if the capac-ity in Japan cannot absorb this daily increase, then the pull ahead would bespread across more days. Keep in mind that the parts shipments are based on theexact sequence of the vehicle production, on the daily production schedule andvehicle sequence within the day. In other words, the 250 extra vehicle partsadded to each day would not be the original vehicles scheduled for Friday.Thursday’s shipments would consist of 1,000 of Friday’s plus 250 fromThursday’s. Wednesday’s would consist of 750 of Thursday’s plus 500 fromWednesday’s. This pattern would continue until all of Friday’s shipments weremade up. Again, you can see from this example that it is extremely important toorder parts based on the planned build sequence within each production day tomaintain a tight link between parts delivered and associated vehicle specifica-tions. This rundown schedule is created at the beginning of the order month;however, the actual parts orders are released on a daily basis.
As with the local adjustment process, the daily order for long lead time partswill include adjustments. Most of the adjustments will be the result of specifica-tion changes made by dealers after the initial parts order is released for the longlead time parts. Because of the long lead time, the adjustments could be consid-erable. Typically, Toyota caps the allowable change for long lead time parts to 10percent. They do so because safety stock must be kept for the maximum weekly
Toyota Supply Chain Management80
Table 6-4. Long Lead Time Parts Rundown Schedule
May June
18 19 20 21 22 15 16 17 18 19
Shipments 1,000 1,000 1,000 1,000 1,000Receipts 1,000 1,000 1,000 1,000 1,000Production 1,000 1,000 1,000 1,000 1,000Shipments 1,250 1,250 1,250 1,250 HolidayReceipts 1,250 1,250 1,250 1,250Production 1,000 1,000 1,000 1,000 1,000

change allowance times the number of weeks of lead time. For example, if thenormal weekly order for a part is 1,000 units and the allowable change is 10 per-cent, then the safety stock required to absorb these changes would be 600 units.The calculation is as follows:
1,000 � 10% � 100 per week, � 6 weeks � 600 units of safety stock
An example of how Toyota continues to learn and kaizen its operations isthe modifications the company has made to its long lead time parts orderingprocess over time. When Toyota initially began production at overseas plants,the company had a very simple approach to ordering long lead time parts. Theapproach was to take the total quantity of parts required for a month and divideby the number of production days and place a daily order based on the averageparts per day. What Toyota learned was that there were special circumstanceswhen this approach did not work. One of these circumstances was when therewas a running change implemented midmonth at a plant. A running changeduring a month would result in both a shortage of the old part and an overflowof the new part.
Table 6-5 illustrates this problem: the 100 pieces of the old part were neededduring the first half of the month, and then the new part was required for the lasthalf at the same 100-piece rate. The problem is that if parts were ordered basedon the average of the usage of both parts over the month, the daily order wouldbe 50 pieces of both parts over the month. At that rate, a shortage of the old part would be created as well as too many of the new parts during the first halfof the month.
Parts Ordering 81
Table 6-5. Midmonth Parts Change
Daily Rate
Part Type W1 W2 W3 W4
Actual Requirement
Old part 100 100New part 100 100
Order Based on Average
Old part 50 50 50 50New part 50 50 50 50
Order-Based Sequence
Old part 100 100New part 100 100
Once Toyota management analyzed this problem, they changed the methodof ordering based on the daily production plan and sequence. This is anotherexample of why the method of ordering based on the daily production plannedsequence is so important.
In-house Parts OrderingIn-house parts are parts produced at the assembly plant—for example, stampingparts and plastic parts. There are two primary methods for ordering in-houseparts: internal kanbans and sequenced orders.
The word kanban literally stands for the word card. In its simplest form, theplanning department assigns a specific number of kanbans for each part that isordered by a user department from a supplier department. Each kanban (orcard) authorizes the production of a fixed number of parts that are to be placedin a container. Each full container and the accompanying card are transportedto the user department. When the user department runs out of the part, beforeit starts using the parts from a full container, it removes the card from the con-tainer and places it on a kanban post. The kanban is then moved from the postto the supplier department, thereby authorizing the supplier department tomake another full container. The supplier department cannot produce unlessthere is a kanban. Thus, the number of parts in circulation at any one time cannever exceed the number authorized by the kanbans. Numerous articles havebeen written about the different types of kanbans and calculations of kanbans.Therefore, we do not dwell on these details here.
Sequence Parts OrderingSequence parts are parts such as seats and wheels ordered from a supplier at thetime the vehicle enters final assembly. The supplier then builds and ships theseparts in the exact sequence as the vehicles are being built. The actual order is gen-erated by sending an electronic transmission to the supplier based on a radio fre-quency scan of the vehicle number as it starts down the final assembly line. Theorder is not sent earlier than that because prior to final assembly the vehicle canget out of sequence during paint operations. The time between when the signalis sent to the supplier and when it is needed on the assembly line varies. It couldbe as many as five hours and as few as two. The supplier does not keep stock ofthese parts because it is impossible to provide a service level of 100 percent withsome types of parts (such as seats). Suppliers build the parts upon receipt of theorders and ship them in the precise sequence in a truck every 30 minutes or everyhour. Clearly, significant resources are expended to develop supplier capabilitiesto accomplish this level of performance (as described in Chapter 7).
Toyota Supply Chain Management82
Reflection Points■ Variety of parts is managed by linking parts delivery to production
sequence, particularly for sequence suppliers. Mix planning ensures thatthe aggregate mix across options is stable.
■ Velocity of parts flow is directly linked to production sequence and takttime; thus, supplier velocity is tied to production velocity.
■ Variability of orders is controlled by heijunka at the plant, which preventslarge order fluctuations of the supplier orders.
■ Visibility is maintained by tightly linking deliveries and lots to produc-tion sequence, which permits dealer order changes to be accommodatedby direct adjustments to part orders.
The following are several examples that demonstrate how Toyota extends itslearning across the extended enterprise:
■ Create awareness. In the parts ordering process, the deviations are imme-diately noticeable because there is little or no inventory. The only actionthat is taken in most cases (except for long lead time parts) is to slowdown or halt production. That slowdown or stoppage creates a sense ofurgency to identify the root cause of the deviation and to implement bothshort-term and long-term countermeasures.
■ Make action protocols. Adjustments to working production days areabsorbed by the production schedule by maintaining the sequence ofproduction to match shipments. There is constant effort to scientificallyexperiment with lead times and lot sizes.
■ Generate system-level awareness. Changes in specifications for a vehicle aredirectly linked to parts changes and thus orders to suppliers. A commonspecification management system enables many functions to understandthe impact of making changes to designs.
■ Adapt processes. Tailor its parts ordering system according to the specifictype of parts ordered. That accommodation makes it easier to link toother supply chain processes and thus make deviations across the supplychain evident to everyone. Toyota achieves that objective by keeping thephysical product orders and parts orders tightly coupled.
Endnotes1. BOM is a common industry term that refers to the bill of material. The
bill of material defines the structure of the end product working backfrom the product to each level of components and eventually to thelowest level of parts.
Parts Ordering 83
Toyota Supply Chain Management84
2. EDI, or Electronic Data Interchange, is a standard method of exchangingdata to and from OEMs and suppliers. There are many different types oftransaction types, each with a unique transaction code and format.
3. MRP is an acronym for Materials Requirements Planning—a process inthe manufacturing industry that is widely used to calculate parts orders.
4. Golden Week is a national holiday in Japan.

85
Imagine you are a supplier to Toyota. What is your role in the Toyota supplychain? What is your expected productivity improvement over time? Howwould your experience as a part of Toyota’s supply chain differ from your
experience supplying other auto original equipment manufacturers? How wouldyour processes have to operate to synchronize with Toyota’s system? How wouldyou have to adjust organizationally to collaborate with other suppliers to Toyota?How can the v4L framework enable an understanding of Toyota’s supplier man-agement system and its impact across the supply chain? These questions formthe basis for this chapter.
Measured Performance Differences for Toyota and SuppliersA study by John Henke from Planning Perspectives provides data regarding thesupplier Working Relations Index (WRI) across auto OEMs. This analysisincludes 1,112 buying situations of OEM-supplier relations. The index ranksOEMs based on 17 criteria, including: “supplier trust of the OEM, open andhonest communication, timely information, degree of help to decrease costs,extent of late engineering changes, early involvement in the product develop-ment process, flexibility to recover from canceled or delayed engineering programs, etc.” These criteria could thus be classified as focusing on the relation-ship, communication, help, and profit opportunity.1 In 2005, the working indexvalue for Toyota, Honda, and Nissan was between 298 and 415. The index forChrysler, Ford, and General Motors (GM) was between 114 and 196. Eighty-five percent of the suppliers to the Big 3 OEMs characterize their relationshipas “poor,” with around half the suppliers claiming they would prefer not to dobusiness with the OEM.
Managing Suppliers
Chapter 7
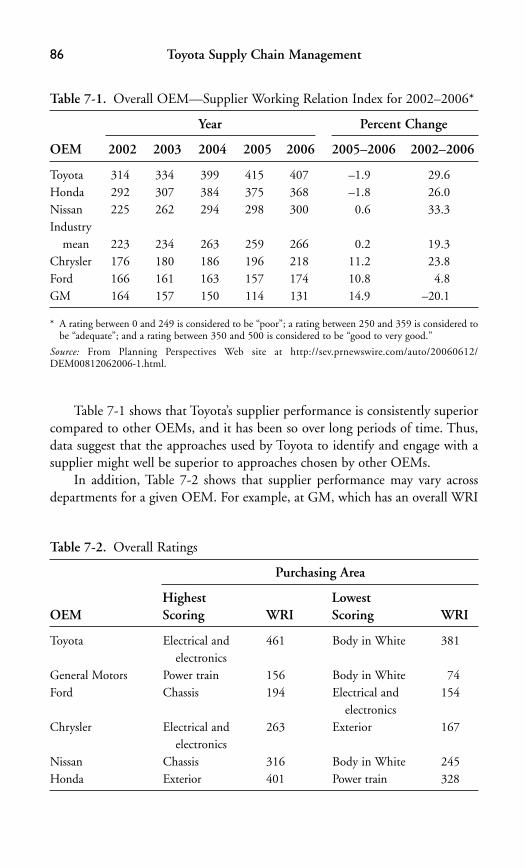
Table 7-1 shows that Toyota’s supplier performance is consistently superiorcompared to other OEMs, and it has been so over long periods of time. Thus,data suggest that the approaches used by Toyota to identify and engage with asupplier might well be superior to approaches chosen by other OEMs.
In addition, Table 7-2 shows that supplier performance may vary acrossdepartments for a given OEM. For example, at GM, which has an overall WRI
Toyota Supply Chain Management86
Table 7-1. Overall OEM—Supplier Working Relation Index for 2002–2006*
Year Percent Change
OEM 2002 2003 2004 2005 2006 2005–2006 2002–2006
Toyota 314 334 399 415 407 –1.9 29.6Honda 292 307 384 375 368 –1.8 26.0Nissan 225 262 294 298 300 0.6 33.3Industry
mean 223 234 263 259 266 0.2 19.3Chrysler 176 180 186 196 218 11.2 23.8Ford 166 161 163 157 174 10.8 4.8GM 164 157 150 114 131 14.9 –20.1
Table 7-2. Overall Ratings
Purchasing Area
Highest Lowest OEM Scoring WRI Scoring WRI
Toyota Electrical and 461 Body in White 381electronics
General Motors Power train 156 Body in White 74Ford Chassis 194 Electrical and 154
electronicsChrysler Electrical and 263 Exterior 167
electronicsNissan Chassis 316 Body in White 245Honda Exterior 401 Power train 328
* A rating between 0 and 249 is considered to be “poor”; a rating between 250 and 359 is considered tobe “adequate”; and a rating between 350 and 500 is considered to be “good to very good.”
Source: From Planning Perspectives Web site at http://sev.prnewswire.com/auto/20060612/DEM00812062006-1.html.
ranking of 131, the power train area is ranked at 156, while the Body in White2
group is at a very low 74. All other GM purchasing groups fall in between. Incontrast, Toyota scores an overall 407. Toyota’s electrical and electronics groupscores a very high 461, while its Body in White group is at 381. The ratings sug-gest that the purchasing function and Toyota’s management of relationships withsuppliers may affect their satisfaction with the working relationship.
The supplier performance is closely correlated with the desires expressed bythe OEMs. Suppliers for Toyota, Nissan, and Honda have been observed to beproviding greater improvements in product quality year after year than haveother OEMs. That increase reflects the priorities for quality versus cost focus bythe OEMs. GM has a fivefold focus on cost over quality; Ford and Chrysler afourfold focus on cost; Nissan a focus on cost 2.5 times that of quality; andHonda and Toyota have a weight of 1.7 on cost versus 1 on quality. ClearlyOEMs’ preferences get reflected in supplier performance.
An OESA/McKinsey study3 suggests that interface costs are estimated at5.2 percent of program cost. (The interface costs are expenses related to theissues in the WRI.) The study also estimates that 80 percent of the waste in theauto industry is a result of poor supplier management. Such waste occursbecause of misinterpretation of product specifications, a poor understandingand/or manufacture of complex parts, and ineffective coordination of capacityand demand. The estimated cost related to such waste is estimated to be $10 bil-lion. Clearly, then, supplier management represents an important supply chaincapability. The bottom line is that the way a supplier is managed affects productspecifications and innovation, delivery performance, cost, and quality.
Links to Toyota’s ProcessesA key feature of Toyota’s selling strategy is to build in schemes that prevent uni-lateral actions to change volumes or commitments. The use of a consensusapproach, fostered by visibility across the supply chain, minimizes actions thatresult in additional costs at different parts of the supply chain. As discussed inChapters 3 through 6, Toyota strives to reduce variability to ensure stable oper-ations by systematic mix planning, careful sales and operations planning, andsensitivity to the impact of product changes throughout the supply chain. Suchdeliberate planning provides suppliers with phased-in design changes and stableorder volumes.
As Chapter 3 suggested, in order to maintain the guarantee of stability inToyota’s supply chain, the optimal mix trades off revenue versus the cost impacton operations. As the number of variants offered in each region is reduced, thechoices for customers will be more limited. Toyota compensates for this limita-tion by increasing customer value so that customers are willing either to choose
Managing Suppliers 87

one of the offered choices or to wait for their preferred variant to be available.Thus, for Toyota’s strategy to limit customer choice to be competitive, it mustresult in a significant improvement in product value to the customer. Given thelarge role played by suppliers in Toyota’s supply chain, that value creation mustbegin at the suppliers.
Gary Dodd, former president of Tire & Wheel Assembly, a Toyota supplier,describes the level of collaboration between the supplier and Toyota. The focuson “bad news first” (so that problems identified can be fixed immediately) pro-vides an environment in which suppliers have a greater incentive to offer visibil-ity about their operations. In addition, the level of visibility provided to thesupplier about Toyota’s annual volume goals and discussions regarding its feasi-bility from the supplier’s perspective increase the probability that product andproduction objectives will be achieved.
Most studies of TQM suggest that stable processes are an important com-ponent of improving quality and productivity. Given that suppliers are offeredstable order commitments by Toyota, they are expected to use this opportunityto develop superior quality products and achieve productivity improvements. Asdescribed earlier, Toyota’s suppliers consistently deliver quality improvementsyear after year. In addition, suppliers attain productivity improvements byimplementing TPS practices. These quality and cost improvements are thenreflected in improved customer value. Thus, the supplier responsibility is to cap-italize on the order stability and deliver cost and quality improvements to a levelthat makes the supply chain competitive.
In addition to the quality and productivity focus, Toyota suppliers must beflexible so they can respond to daily order changes. They do not attempt to buildahead based on the forecast but instead wait until the final order is received. Forexample, a sequence supplier would have to be synchronized with the exact coloror mix of products as they move through the production line. But that sequencemay be expected to be adjusted in response to changes made by dealers, qualityissues, manufacturing backlogs, and so on. Therefore, the sequence suppliersmust wait until about four hours prior to delivery to receive the final order.
Choosing SuppliersAt Toyota, choosing a supplier is a long, drawn-out process that involves verify-ing whether the supplier will mesh with the supply network. In some cases, suppliers are selected because they have innovations that improve processes ordecrease costs. Both new and existing suppliers are expected to share their inno-vations with other suppliers that supply similar products. Thus, being a supplierbrings along with it an opportunity to receive ideas generated across the supplynetwork. Toyota’s goal is to minimize the number of suppliers and create
Toyota Supply Chain Management88
long-term partnerships by nurturing existing suppliers to expand and grow withToyota instead of growing the number of suppliers to induce competitive pricebidding.
Individual suppliers receive a contract for a fraction of the total market overthe life of a model. Empirical data collected by Japanese economist Asanuma4
suggest that suppliers are promised all of the orders associated with a market seg-ment (e.g., exports versus domestic) or a fixed fraction of a certain market (e.g.,a fraction of the domestic market volume) or all of the orders for a particular carmodel. The goal of the supplier is to maintain delivery performance, high qual-ity, productivity improvements, and so on, over the life of the model. Asanuma’sstudy suggests little use for the supplier as a source of slack capacity.
Asanuma studied the Japanese auto industry, the rice cooker industry, andthe electronics industry. These three industries differ in their product life cycles,ranging from four years to one year to a few months. Some key features in man-aging suppliers included independent but closely linked suppliers, long-termrelationships, frequent collaboration, exchange of employees between compa-nies over long periods, and cross-linked shareholding. The impact has beenobserved in terms of long-term cooperation in innovation, cost cutting, quickresponse to demand fluctuations, and high levels of trust. However, the extentof close relationships varies across suppliers and products and over time as iswarranted by competitive forces for the end product. Thus, while suppliers oftenare organized as a keiretsu (a group of companies with investments in oneanother), their role varies across product type.
Studies of the Japanese OEMs suggest a significant difference between U.S.and Japanese auto OEMs. Published reports show that Japanese auto supplierswon renewal of their contracts 90 percent of the time versus 71 percent for sup-pliers to U.S. auto OEMs. A study in 1992 found that a typical Toyota planthad only 125 suppliers compared to 800 for the typical General Motors plant.At the corporate level, Toyota had 224 suppliers compared to 5,500 suppliers forGeneral Motors. In addition, Japanese OEMs make about 27 percent of theircomponents in house versus 54 percent for U.S. auto OEMs. While Japaneseautomakers accounted for 33 percent of world output in 2002, Japanese suppli-ers accounted for less than 19 of the world’s top 100 auto suppliers. That ratiosuggests that Japanese suppliers are smaller than their U.S. counterparts. All ofthese statistics imply that there are differences between the approaches used byJapanese and U.S. auto OEMs to manage suppliers.
Toyota Supplier Selection5
The United Kingdom provides a good example of how Toyota selects its suppliers.A supplier must meet extremely tough conditions to qualify. When Toyota set
Managing Suppliers 89

up its plant in Derbyshire, England, in 1991, it initially started with a list of2,000 potential suppliers. It reduced that list to 400, which it then evaluatedusing criteria such as “assessment of management attitudes, production facilities,quality levels, and research-and-development capability.” The final group waswhittled down to 150. Some of the candidate companies had been discouragedby the amount of detail that had been requested. Others found that that require-ment was to their advantage and held that the advice on improving quality andcompetitive factors provided by the Japanese technicians saved the cost ofemploying outside consultants.
Toyota asked its potential suppliers to provide evidence that they could cutcosts immediately with improved designs. One supplier came up with a designthat was not only cheaper but simpler and better than that of Toyota’s ownJapanese supplier. The component was a simple gear stick knob costing pennies,but the British found a way of making it in two plastic parts instead of four, asin Japan. Jim Robinson, Toyota UK’s general manager for purchasing, said: “Weget suppliers thinking immediately about cost. In the case of the gear knob, itinvolves only a small cost. But if that part costs two pounds [approximatelyUS$2.90] today and we can make it for one pound [about US$1.45], that is ahuge saving over 200,000 cars a year.”6 He added that some of Toyota’s suppli-ers have doubled productivity with negligible defects.
Such success helps the whole economy. The change in the auto-parts indus-try was highlighted by the decision of Daimler-Benz, of Germany, to turn toBritain for component suppliers. More than 30 German executives met 100British component firms. Dr Gerhard Liener, a Daimler board member incharge of the company’s $35 billion materials purchases from 60,000 contrac-tors in 100 countries, made no bones about why he was in Britain. The arrivalof Japanese manufacturers, he said, had helped improve the technological andquality achievements of British supply firms.
Tiered Supplier Organization and Managing RelationshipsFor the auto OEMs, suppliers are organized into tiers, with tier 1 suppliers beingassemblers of systems, who manage all relationships with tier 2 suppliers, and soon. The bottom of the pyramid consists of tier 4 suppliers who form, perhaps,about 40,000 entrepreneurs who own a lot of the intellectual capital that isrequired to produce excellent components. There are many of those suppliersthat own patents, have customized machinery, and may be owned by an indi-vidual family. For example, a series of detailed interviews by Nishiguchi7 pro-vides examples of one tier 4 supplier who had 200 patents for a specific processand thus had considerable leverage in the supply chain. Similarly, another
Toyota Supply Chain Management90
supplier offered the flexibility to adjust for demand surges by adjusting his working hours to flex with demand surges. An example examined by Roy Vasherwas a situation in which a government regulation required a change in antirustcoatings. More than 4,000 parts were impacted by this change, but there wereonly a small number of suppliers that supplied the coating materials. Thus,Toyota was able to focus attention on a few suppliers to develop the new coat-ing materials to be provided to suppliers that coated the 4,000 parts. Workingwith these lower-tier suppliers was the key to making the necessary changes in atimely and efficient manner. Purchasing executive Jamey Lykins echoes the ideathat Toyota chooses suppliers across multiple tiers so as to guarantee availabilityof innovative solutions across the supply chain. He describes cases in whichToyota engineers and supplier personnel dedicate a somewhat substantial periodof time—say, three months—to solve a seemingly insurmountable problem butsucceed through collaboration. Such organizational approaches tap into theknowledge base of the supplier network effectively.
The extent of the business relationship between Toyota and its tier 1 sup-pliers exceeded 10 trillion yen in 1995. In addition to these 28 companies, in1995 there were 234 primary parts suppliers and another 77 manufacturers ofproduction equipment and other products. Data collected for the same periodshowed that, as a result of such a tiered system, 300 purchasing managers atToyota bought components for 3.6 million cars, thus generating 12,000 cars perpurchasing manager.
Pressure on Suppliers to PerformThe pressure on a supplier is maintained by using a staggered system of modelchanges, which in turn entails a staggered system of negotiations. The usualprice commitment by Toyota to a supplier is for a one-year period, and pricesare reviewed every six months, but the contract award is kept in place over themodel life. The impact is to keep the pressure on a supplier to perform evenwhile offering a long-term contract. The absence of desired performance afterwinning the contract will jeopardize chances to win a contract for other vehi-cle models made by the same supplier. This approach balances the stability oforders over a longer time frame with pressure that is uniformly maintained forcompliance.
Nishiguchi also suggests that an ALPS system of supplier organization(referring to the jagged outline of the Swiss Alps), with staggered contractuallinks across vehicle models, provides a secondary source for most componentswhile permitting sole sourcing for a component for a car model. The availabil-ity of alternate suppliers, who can step in readily, places pressure on the existingsupplier to conform.
Managing Suppliers 91

Depth of Supplier RelationshipsThe relationship with suppliers, from drawing-supplied to drawing-approvedones, can vary based on what is being produced. Intermediate relationships existas well, such as when the OEM provides rough drawings and the suppliers com-plete all details. A study by Asanuma8 suggests that there could be up to six dif-ferent levels of relationships between the OEM and the supplier:
1. The OEM provides drawings and detailed manufacturing instructions (e.g.,when small parts are assembled by an assembly-service provider).
2. The OEM provides drawings but the supplier designs the manufacturingprocess (e.g., when a supplier is providing stamping).
3. The OEM provides rough drawings and entrusts the completion of thedrawings and the entire manufacturing process to the supplier (e.g., whenproducts are plastic parts used for dashboards).
4. The OEM provides specifications while the supplier generates the draw-ings, but the OEM has detailed knowledge about the manufacturingprocess (e.g., when the product is a seat).
5. The OEM provides specifications, the supplier generates the drawings butthe OEM has limited knowledge about the manufacturing process (e.g.,when products are brakes, bearings, and tires).
6. The OEM purchases the product out of a catalog (e.g., with commodity off-the-shelf items).
Suppliers may provide flexibility during design but are subject to tight mon-itoring during manufacturing. Studies by Clark and Fujimoto9 suggest thatblack box suppliers, (i.e., suppliers that are offered considerable flexibilityduring product design) constitute a larger percentage of Toyota’s supply basethan for other OEM’s. But even this proportion varies across products, as stud-ies by Kamath and Liker indicate.10 They show that the relationship between theOEM and the suppliers is as a parent or as an equal. Their example suggests thatfor some crucial products, detailed specifications are provided. For other com-ponents, the relationship is at arm’s length, with considerable latitude providedto the supplier in product design. In Chapter 11 we suggest that this decisiondepends on what stage of development the supplier is at with regard to knowl-edge and practice of the Toyota Way.
When monitoring the manufacturing process is involved, data show a different pattern. Japanese OEMs exert considerable control over supplier manu-facturing processes, requiring information if there is a change such as a substi-tution in raw material supply or a reset of a machine. The data suggest that thisprocess control enables the OEMs to ensure stable component performance andquality, thus permitting just-in-time delivery and reducing receiving costs. Thedetailed monitoring of supplier performance requires OEM purchasing
Toyota Supply Chain Management92
managers to spend considerable time at supplier facilities. One OEM evenshares one desk and chair with three purchasing managers, the assumption isthat no more than one out of the three managers will be in the OEM facility,with the rest being in supplier locations. The Japanese word shukko refers to thistype of transplant who may well spend his or her entire career at the supplierfacility managing the relationship on behalf of the OEM. The role of the shukkovaries from being a temporary shukko to a more permanent one. This flexibil-ity both enables adjustment of the workforce across the supply chain and permits better coordination across the supply chain.
Helper11 characterizes the U.S. model of supplier management as involvingadversarial relationships, easy switching among suppliers, a high level of solesourcing, low information exchange, low commitment, price-based competitionfor supplier selection, and a search for new suppliers (if problems arise). In con-trast, the Japanese model encourages close relationships, competition over qual-ity, delivery, engineering capability rather than price, high levels of informationexchange, high levels of commitment, many suppliers, long-term relationships,and working with existing suppliers to resolve problems.
In addition, suppliers to lean producers are often required to make dailydeliveries and to be involved in product development. Thus, suppliers to leanproducers often are ensured a reasonable return as long as they make a good-faith effort to perform as they should.12 Anecdotal evidence suggests that oncesuppliers win business from Toyota, it is theirs to lose by not performing. Theaverage percentage of suppliers that maintained their buyer relationship was 84 percent in the Japanese auto industry.
Other authors suggest that Japanese OEMs absorb a part of the businessrisk for their suppliers based on the intensity of the business relationship.Stabilizing the corporate performance of selected suppliers enables improvementin the OEM’s components and product. Nishiguchi reports anecdotal evidenceof a Japanese supplier to a U.S. OEM who claims that doing business with U.S.buyers is easy because if things go wrong the supplier only has to claim that thework was due to buyer specifications and manufacturing instructions. (Suchexcuses are not permitted by its Japanese OEMs.) One supplier provides anexample of cable components ordered by a U.S. OEM that ended up being tooshort for the assembly to be successful. The OEM then announced that the carmodel was to be discontinued. However, as per the purchasing contract, theOEM paid the Japanese supplier to cover the few months of inventory alreadyin process.
The flip side of this type of relationship is highly unstable orders. AJapanese supplier provides an example of a 50 percent increase in an electricalcomponent by a U.S. OEM. Because past experience suggested that suchincreases were not real, the supplier collected data from the past and checked
Managing Suppliers 93

whether the order was real. The U.S. OEM purchasing department claimed thatit was just passing along order increases from sales and was not responsible forthe validity of costs associated with such order changes. The OEM thendemanded immediate fulfillment and, if not, airfreight of the order. Such inter-actions with suppliers would be unthinkable within the Toyota supply chain.
Evans and Wolf13 compare Toyota’s processes to the open source movementand their product improvements (e.g., Linux). They suggest that Toyota’sprocesses have a few characteristics that enable their success, namely:
■ Pervasive collaboration tools that have common standards and are com-patible with one another
■ Visibility and visual control not fogged by analysis■ Trust to share intellectual property without fear of abuse■ Modular view of teams and processes and flexible planning to keep goals
aligned with customer needs■ Encouragement of teams as a vehicle to solve problems
Given marked differences in supplier management by U.S. and JapaneseOEMs and the adoption of lean principles for manufacturing, is it important toadopt all of the components of the Toyota supplier management system to besuccessful? Are there other approaches? Honda, for example, claims a muchlooser relationship with suppliers and is also successful. For example, authorswho have studied Honda over several decades show that adjustments to thebalance between cooperation and competition have proven to be a competitiveweapon for Honda over a long period of time. The real answer might lie inunderstanding how the entire supply chain functions and whether the practicesare consistent from that viewpoint.
Assisting SuppliersA key feature of Toyota’s supply chain is the automaker’s role in supplier capa-bility development. Sako14 describes the use of jishuken at Toyota: “Jishuken isa closely knit gathering of middle-level production technologists from a stablegroup of companies who jointly develop better capabilities for applying theToyota Production System through mutual criticism and concrete application.”
Sako describes an example from the late 1990s involving 56 factories from52 separate suppliers that accounted for 80 percent of the purchasing costs spentby Toyota in Japan. Each jishuken company chooses a specific theme but workswithin the broad policy direction set by Toyota’s Operations ManagementConsulting Division. Toyota does not charge for its consultant’s time but makesit a resource that can be used by the Toyota Group. The supplier typically hostsa study over two months. Toyota’s senior engineers visit the supplier three timesevery two months while junior engineers from Toyota visit more frequently.
Toyota Supply Chain Management94
Members of the jishuken group meet every week. The study sessions consist ofconcrete performance targets such as productivity, cost reduction, inventoryturns, and the like. Most of the kaizen ideas suggested are implemented duringthe two months. At the end of the year, jishuken groups gather in one locationto present their achievements.
There are two types of assistance provided: individual and group. The indi-vidual assistance is provided to get some quick results. The focus is to deal withan immediate supplier problem such as a sharp drop in profits or difficulty inkeeping up with a model launch. Toyota’s experts then go to the supplier,observe, and suggest improvements. These improvements get quick results butdo not ensure that the supplier has imbibed the underlying principles. Thejishuken group develops supplier personnel and also assists Toyota. As a result offrequent jishukens, Toyota retains the manufacturing know-how for compo-nents it does not produce in-house. That approach enhances Toyota’s capabilityto do target costing—a technique to manage and reduce costs over a product’slife cycle.
In another example, during the recession in Japan, only three of its mainsuppliers saw profit increases, while 57 saw profit and revenue decreases. Toyotaresponded by creating a kaizen promotion section within its purchasing depart-ment. The group worked with suppliers to decrease pay and cut investments andthus enable recovery of loss. In addition, suppliers were able to enhance theirlong-term capability. All of this works on an informal, personal level. To preventsupplier information gathered by these working groups from being used toextract cost reductions, supplier productivity improvement results may not evenbe communicated to the purchasing group. Data seem to suggest that the sup-plier is permitted to keep the gains from improvement due to Toyota’s assistance.
Data collected from suppliers suggest that plants that supply Toyota have a14 percent higher output per worker, 25 percent lower inventories, and 50 per-cent fewer defects than operations that supply Toyota’s rivals.15 Between 1965and 1992, Toyota and its suppliers increased their labor productivity by 700 per-cent. During the same period, U.S. automakers and their suppliers improvedproductivity by 250 percent and 50 percent, respectively.
In the United States, Toyota has created the Bluegrass AutomotiveManufacturers Association (BAMA), modeled after the Japanese supplier asso-ciation. The supplier association holds general meetings bimonthly where pro-duction plans, policies, market trends, and the like are shared with the supplynetwork. In addition, committee meetings are held monthly to focus on qual-ity, cost, safety, and social activities that benefit all members of the network.
Like its organization in Japan, the Toyota Supplier Support Center (TSSC)in the United States requires that suppliers who use its services share their resultswith others. Doing so allows best practice suppliers to be showcased and
Managing Suppliers 95

Toyota Supply Chain Management96
encourages supplier openness. Toyota believes that the ability to see a workingsolution increases the chance that suppliers can replicate that knowledge. Mostprojects take at least one and a half years or longer from start to completion.Summit Polymers is an example quoted by Dyer and Hatch.16 Toyota consult-ants (two to four personnel) visited Summit every day for four months to pro-vide ongoing support for the next five years. In the United States, TSSCsuppliers have seen productivity (i.e., output per worker) increase by 123 per-cent and inventory reduced by 74 percent. Continental Metal Specialty (CMS),a supplier of metal stampings, found only four value-added steps out of 30.Toyota and CMS jointly reconfigured the production system and, throughprocess changes, eliminated 19 steps. Setups were reduced from 2 hours to 12minutes. Inventories were reduced to 10 percent of the original levels. The chair-man of CMS claims that 75 to 80 percent of the learning from their customershas been contributed by Toyota. Suppliers also got to keep all their benefits.Ultimately, Toyota does reap benefits during annual price reviews through atarget pricing exercise in which customer price is defined and used to work back-ward to a supplier cost target.
The jishuken concept is called the “plant development activity” (PDA) inthe United States. Because PDAs are context-specific, they permit transfer oftacit knowledge. In the United States, Toyota purchases lower volumes thanU.S. automakers. However, Toyota still provides suppliers with knowledge andtechnology to improve their productivity, and the company sends personnel tovisit supplier plants an average of 13 days per visit (versus 6 days for the U.S.automakers). Such assistance showed that suppliers decreased defects for Toyotaby 84 percent (versus 46 percent for the U.S. automakers), decreased invento-ries for Toyota by 35 percent (versus 6 percent for the U.S. automakers), andimproved sales per direct employee by 36 percent (versus 1 percent for U.S.automakers). All of these results were achieved in plants that supplied U.S.automakers.
Steven Spear,17 in a detailed study of process specifications at Toyota and itssuppliers, describes the processes as follows: The process starts with a descriptionof a pathway rule that specifies system design and decides who receives the prod-uct. The next specification is a connection rule that decides how requests will bemade to this supplier. The activity rule specifies work content, timing, sequence,and outcome. Finally the improvement rule specifies who is responsible for res-olution of problems, specifies a qualified teacher for assistance, and so on. Thatsequence of specifications of processes guarantees that the process as well as itsimprovement mechanisms is identified in advance. Such a process specificationpermits adaptability in the face of disturbances, external changes, and emergingopportunities. That sequence also conforms to the learning principles we iden-tify throughout the book.

The CCC21 SystemIn 2000, Toyota announced a plan to cut costs by 30 percent across the boardfor parts it buys to guarantee that it retains its competitive edge. By 2005, theprogram had already saved $10 billion over five years, but it had done so whileimproving quality (Figure 7-1).
In addition, for about 180 key parts the team identified the world’s mostcompetitive suppliers and created benchmarks for the supply base to meet. Inone case, the number of air-conditioning vents was decreased from 27 to 3, gen-erating a 28 percent cost reduction. Why 30 percent? The number came fromthe commonly called “China price,” that is, the expected price drop by movingorders to Chinese suppliers.
The following is a summary of the results achieved from that special initia-tive, CCC21.
Innovation at Toyota18
When it comes to being innovative and making fundamental changes in theorganization, Toyota has shown that size does not matter and even a giant canreinvent itself.
In July 2000, Toyota launched the Construction of Cost Competitivenessin the 21st Century program, also known as CCC21. That initiative focused oncutting the purchasing costs of 170 major components. Katsuaki Watanabe,Toyota’s president and CEO, spearheaded this effort because he was then a
Managing Suppliers 97
Since 2000, theConstruction of CostCompetitiveness forthe 21st Century—CCC21—has helpedToyota cut procurementcosts by nearly a third.But as the programwinds down, Toyota islooking for new places totrim the fat.
Cutting steel parts in carsfrom 610 to 500 to deal withthe soaring cost of steel Forcing some componentmakers to meet or beatrock-bottom prices offeredby suppliers in China Buying from more partsmanufacturers not affiliatedwith Toyota’s keiretsu,or corporate fraternity
SAVINGS SO FAR... ...AND WHAT’S NEXT
Toyota’s Cost Cutting
3BILLIONS OF DOLLARSCOST SAVINGS
2
1
0’00
FISCAL YEAR ENDING IN MARCHData: Toyota Motor Corp.
Data: Toyota Motor Corp.
’01 ’02 ’03 ’04 ’05 EST.
Figure 7-1. Toyota cost cutting results
purchasing specialist. This program brought together engineers from Toyota andthe parts suppliers, eliminating unnecessary costs with methods such as stan-dardizing parts across the entire Toyota range or reducing the number of com-ponents required to make a part. For example, reducing the parts in a horn from28 to 22 led to a 40 percent savings in cost. In another example, Toyota helpedto improve suppliers’ economies of scale by approving 3 inside hand grips, downfrom 35. At the end of five years, the program led to a total savings of US$9 billion.
Never satisfied with its success, Toyota started the Value Innovation (VI)program in 2005 to follow up on the CCC21 program, which goes beyond leanmanufacturing to lean product development practices. The VI program refo-cused Toyota on the production and design processes, continuing its quest forwaste elimination and cost reduction. Toyota expects the VI program to show itsmain benefits by 2010, raising the operating profit margin from 9.3 percent to10 percent.
What happens when that goal is achieved as well? Toyota already is think-ing of plans to use the benefits of the VI program to invest in technologies,researching new vehicle structures that will reduce weight and lower fuel con-sumption.
Toyota Checklist for Supplier AuditsThe Toyota purchasing organization expects suppliers to be available for com-prehensive system audits. The audit process specifies the goals and the associateddocuments that will be used to check for confirmation of compliance. TheComprehensive Assessment Tool (CAT) rates the supplier on a scale from 0 to5 on a set of specific performance measures, namely:
1. Mission2. Reporting structure3. Involvement of top management4. Localization and self-reliance5. Open mind to operating procedures such as kaizen6. Organization with respect to Toyota interactions
For each of the measures, equal weight is allocated to subparts such asvision, long-term plan, annual plan, finances, and risk management. The evalu-ation score out of a maximum of 100 units is used to provide a supplier assess-ment score.
To provide data to support its adherence to processes, the supplier in turnis expected to list procedures in place to accomplish each of the stated tasks.Those specific procedures include tracking to improve quality, scrap handling,
Toyota Supply Chain Management98
poka yoke management, warranty claims handling, returns processing, offlineinspections, and final shipping.
Supplier Guest EngineersOne key coordination mechanism used at Toyota is the role of supplier guestengineers at Toyota’s facility. The guest engineer is typically a specialist,employed by the supplier, who resides in the OEM’s (Toyota’s) organization.The role of this engineer is to provide tacit knowledge during product develop-ment and thus facilitate integration of the supplier’s expertise with the OEM’sneeds.
The common approach is for suppliers to send its design engineers toToyota to work for two to three years prior to product launch. After productmanufacturing starts, the design engineers return to their company and produc-tion engineers are sent to the OEM. Production engineers ensure that compo-nents are assembled correctly in the vehicle. They also report problems, suggestdesign changes for easier manufacture, and propose approaches for cost reduc-tion. Finally, the supplier development engineer’s role is to see to it that kaizenprocesses are implemented.
Significantly, Toyota had 5 design engineers per supplier while GeneralMotors had 0.2 guest engineers per supplier. The roles played by the guest engi-neers are shown in an empirical study by Daniel Twigg.19 The study also foundfour types of roles by guest engineers at an OEM location, from preconcept toconcept to product development through production phases.
The presence of supplier personnel within the Toyota facility enables fasterchanges in response to failures, quicker adjustment to information generated fromcustomer complaints, chances to reduce engineering change order processingtimes, and opportunities to generate kaizen-type cost improvements, among otherthings. These shared resources allow effective coordination between the supplierand Toyota. What is the benefit to frequent interactions with a supplier? A studyby Dyer20 suggests that defects decrease with increased supplier interaction.
Supplier Location DecisionsToyota’s planning for assembly plant sites assumes that most suppliers will belocated at a reasonable distance from the assembly plant and that their deliveryschedules will permit efficient operation of the assembly plant to produce vehiclesbased on the final vehicle mix and sequence. The low lot sizes of assembly plantparts orders imply that suppliers need to be located close to the assembly plant.
Toyota suggests that a planning rule be used of 50-mile-per-hour travel timefrom supplier location to assembly plant. That assumption is one factor that is
Managing Suppliers 99
used to determine when supplier parts orders are released. Many suppliers chooseto be located close to an assembly plant. In Japan, 85 percent of the volumecomes from suppliers located within a 50-mile radius of a plant (i.e., within aone-hour drive). In North America and Europe, the goal is for 80 percent of theparts to be delivered within three to five days lead time.
Similarly, supplier location closer to the OEM results in lower inventoriesfor the supplier and assembly plant. For Toyota in Japan, the average distance isshort, in contrast to other OEMs. The resulting inventory as a percentage ofsales is thus the lowest of the OEMs.
So, what can a supplier expect? Suppliers need to consider building facto-ries near Toyota plants, especially as Toyota continues to expand and build newplants around the globe. The proximity of supplier location to the Toyota plantenables frequent deliveries to be made to the assembly plant, and in return,observed lower inventories at the supplier and the Toyota plant. In addition, thecompleted vehicle has fewer defects, because frequent interaction due to moredeliveries enables quick feedback and more opportunities to fix defects.
Reflection PointsThis chapter provides a rich context to review the use of the v4L approach inmanaging suppliers at Toyota. There are several good examples of how the learn-ing principles are applied and linked to the v4L framework:
■ Variety of components produced by suppliers is consistent with theirflexibility. Because designs of components allow efficient manufactura-bility by suppliers, suppliers can reliably commit to capacity.
■ Velocity of the parts flow is matched between the assembly line and sup-pliers. Sequence suppliers receive orders in the precise sequence of assem-bly. Other suppliers have orders picked up during delivery milk runs toToyota. In short, the supplier velocity is matched to the assembly plantproduction rate.
■ Variability of orders to suppliers is stabilized through communication ofplanned volumes in advance, through JIT pickups and by limiting theamount of day-to-day fluctuation in orders.
■ Visibility of supplier operations and of Toyota plants is encouraged bythe approach at Toyota to discuss problems first. The attitude that it isbetter to inform Toyota of problems early so as to enable efficient solu-tions with the company’s assistance encourages increased visibility. Inaddition, frequent deliveries from suppliers ensure that Toyota is con-stantly informed about those suppliers’ performance.
Learning by the supplier system is guaranteed by the various supplier organ-izations as well as by proactive steps such as the CCC21 program, which
Toyota Supply Chain Management100
continually emphasize the need to reduce waste and increase efficiency. The fol-lowing are some of the key steps taken by Toyota and the suppliers to achievethat goal:
■ Create awareness. Constant pressure is placed on suppliers with a stag-gered system of model changes, supplier audits, and programs such asjishuken.
■ Establish capability. Long-term relationships are carefully nurtured.Suppliers are involved at early stages of design and given ample scope toexplore options and alternatives. Jishuken teams create capability both atthe supplier as well as at Toyota for understanding how each other’s sys-tems function.
■ Make action protocols. The work by the Toyota Supplier Support Centerhelps share best practices across the supply chain. The relationship-build-ing process with the supplier is itself carefully planned and organized tomaximize impact.
■ Generate system-level awareness. A modular view of teams’ processes andflexible planning are used to align the supply chain to the needs of the cus-tomer. Trust is fostered at the same time that value creation is emphasized.
■ Exercise control of processes. Once the design is finalized, control is exer-cised on processes as if they were in-house systems.
■ Facilitate communication. Communication is facilitated with a variety ofmethods, among them being that Toyota engineers are stationed for longperiods at the supplier and the supplier’s guest engineers are stationed atToyota.
■ Provide stability. Stability is provided to suppliers that require such sup-port by absorbing business risk at times of difficulty.
Endnotes1. “Strained Relationships with Suppliers Costing GM and Ford,” Planning
Perspectives, Inc., Birmingham, MI, 2006.2. “Body in White,” or BIW, refers to the car body including doors, hoods,
and deck lids but before other components are added to it.3. OESA-McKinsey Study on Customer Supplier Interface, 2003.4. Banri Asanuma, “Transactional Structure of Parts Supply in the Japanese
Automobile and Electric Machinery Industries: A Comparative Analysis,”Technical Report # 3, Socio-Economic Systems Research Project, KyotoUniversity, September 1986.
5. “British-Made Japanese Cars Mean Rising Sales for Parts Suppliers,”Agence France Presse, August 2, 1991.
6. “Japan Tunes UK Part Makers,” The Times, London, July 15, 1991.
Managing Suppliers 101

7. T. Nishiguchi, “Japanese Subcontracting: Evolution Towards Flexibility,”D.Phil. Thesis, University of Oxford, 1988.
8. B. Asanuma, “Manufacturer-Supplier Relationships in Japan and theConcept of Relation-Specific Skill,” Working Paper # 2, Faculty ofEconomics, Kyoto University, February 1988.
9. K. B. Clark and T. Fujimoto, “The Product Development Imperative:Competing in the New Industrial Marathon.” In Paula Baker Duffy, Ed.,The Relevance of a Decade: Essays to Mark the First Ten Years of the HarvardBusiness School Press, Boston: Harvard Business School Press, 1994.
10. R. R. Kamath and J. K. Liker, “A Second Look at Japanese ProductDevelopment,” Harvard Business Review 72, no. 6 (1994): 4–14.
11. S. Helper, “Strategy and Irreversibility in Supplier Relations: A Case Studyof the US Automobile Industry,” Business History Review 65 (Winter1991).
12. J. P. Womack, D. T. Jones, and D. Roos, The Machine that Changed theWorld: The Story of Lean Production. New York: Scribner, 1990.
13. P. Evans and B. Wolf, “Collaboration Rules,” Harvard Business Review 83,no. 7 (2005): 96–104.
14. M. Sako, “Supplier Development at Honda, Nissan, and Toyota:Comparative Case Studies of Organizational Capability Enhancement,”Industrial and Corporate Change 13, no. 2 (2004): 281–308.
15. J. F. Dyer and N. W. Hatch, “Using Supplier Networks to Learn Faster,”Sloan Management Review 45, no. 3 (2004): 57–63.
16. Dyer and Hatch, “Using Supplier Networks.”17. Steven J. Spear, “Just-in-Time in Practice at Toyota: Rules-in-Use for
Building Self-Diagnostic, Adaptive Work-Systems,” Harvard BusinessSchool Working Paper 02-043, December 2007.
18. “Toyota Aiming to Make US$2.7-bil.-Worth of Cost Cuts Annually,”Global Insight, December 12, 2007.
19. D. Twigg, “Managing Product Development within a Design Chain,”International Journal of Operations and Production Management 18, no. 5(1988): 508–524.
20. J. Dyer, “Specialized Supplier Networks as a Source of CompetitiveAdvantage: Evidence from the Auto Industry,” Strategic ManagementJournal 17, no. 4 (1998): 271–291.
Toyota Supply Chain Management102
103
L ogistics is an extremely important component of the supply chain. It hastwo roles: (1) inbound logistics, which is responsible for transportingparts and materials from the tier 1 suppliers to the OEM plants; (2) out-
bound logistics, which is responsible for the distribution of vehicles from theassembly plants to the dealers. In this chapter we will examine both of thesecomponents.
Inbound LogisticsInbound logistics encompasses two different operations: the first is the operationthat transports parts from local suppliers to the local plants; the second is a sep-arate operation, global inbound logistics, to transport parts from Japan to theNorth American and European plants. Because the inbound logistics opera-tional models are very similar in both North America and Europe, we willexplain only the North American operations. The local operation will bereviewed first, followed by an examination of the overseas operation.
Local Inbound LogisticsToyota’s success in operating a lean supply chain requires that the parts be trans-ported from the suppliers in an efficient and timely matter; therefore, Toyotaestablishes a partnership with a limited number of third-party logistics providers(3PLs) to deliver logistics services.
Toyota’s inbound logistics operation can best be described as a logistics network. The company organizes many of its suppliers into clusters based ongeographic location. Parts are picked up from those suppliers by trucks on a“milk route” (i.e., a circuit in which a truck picks up multiple parts from various suppliers along the way), and then they are delivered to a regional cross-dock. (Suppliers that are located close to the plants, however, ship parts direct.)
Logistics
Chapter 8

At the cross-dock (a staging facility that is used to transfer parts), the parts areunloaded and staged for pickup and delivery to one of the Toyota plants. Afterthe trucks arrive at the plant, the trailer is disconnected and parked in a num-bered space in a staging lot. The trailers are not unloaded until the productionprogress triggers the need for the trailer to be unloaded. As discussed inChapter 6, all incoming parts orders and deliveries are synchronized to the pro-duction rate. Doing so ensures that the parts unloaded and delivered to thelineside workstations are just what is needed and just-in-time.
Network LogisticsThe network logistics model enables Toyota to operate a very efficient and effec-tive inbound logistics operation. Figure 8-1 shows an example of a logistics network. The entities of the network are suppliers, cross-docks, and Toyotaplants. The entities are connected by a continuous flow of trucks that move containers of parts inbound to the plants or move empty containers back to thesuppliers. Plants include not only the assembly plants but also component plantsthat produce engines and transmissions. Toyota’s strategy is “small lots, frequentdeliveries.” The ideal situation is for each supplier to ship parts every day to eachplant. That course of events is where network design plays an important role.
Toyota Supply Chain Management104
Cross-DockCD 1
S1
S3
S2
Plant P2
Plant P1
Cross-DockCD 2
Cluster C1
S4
S6
S5
Cluster C2
T2
T1
T3
T4
T5
T6
Figure 8-1. Network logistics
The first step in network design is to analyze the location of the suppliersand identify clusters of them that are located in close proximity to one another.Next, a determination is made as to which cross-dock is located nearest to thesuppliers. The idea behind this design is that one truck picks up parts from multiple suppliers in what is called a “milk route.” The truck then delivers theparts to the nearest cross-dock. The parts are unloaded and the correspondingempty containers are picked up and returned to the suppliers on the next run.The parts are then staged for pickup by trucks that are scheduled to deliver fulltruckloads of parts directly to each plant.
In the example in Figure 8-1, there are two clusters of suppliers, two cross-docks, and two plants. Parts from suppliers S1, S2, and S3 in cluster C1 arepicked up by truck T1 and delivered to cross-dock CD1. Parts from suppliersS4, S5, and S6 in cluster C2 are picked up by truck T2 and delivered to cross-dock CD2. Then, truck T3 picks up parts from CD1 and delivers them to plantP1. Also, truck T5 picks up parts from CD1 and delivers them to plant P2.Truck T4 picks up parts from CD2 and delivers them to plant T2. Finally, truckT6 picks up parts from CD2 and delivers them to plant P1. As you can see fromthis example, there are two milk run routes picking up from suppliers and fourmain routes from two cross-docks to two plants.
The advantages of the network logistics structure is that it enables Toyota topick up from most suppliers on a daily basis while at the same time minimizingtransportation costs.1 However, the network is extremely complex to operateand manage. Toyota’s size enables it to maintain control over the logistics network by partnering with 3PL companies. The logistics partners provide adedicated fleet of trucks and drivers to operate Toyota’s logistics network. Inaddition, the entities in the network work closely with Toyota to design and planroutes. The shared transportation enables suppliers to receive small orders without increasing transportation costs.
Route PlanningRoute planning is a key function that ensures efficient and effective operations.It is done once per month and is based on the next production month plan.Such planning is part of the production plan discussed in Chapter 5 and theparts ordering and forecast discussed in Chapter 6. In these chapters heijunkawas discussed as a method for leveling parts orders by day. Without a level pro-duction and parts plan, developing a daily logistics route schedule and repeatingit for the whole month would not be feasible.
The creation of a logistics route plan to transport parts from hundreds of suppliers to multiple manufacturing plants is like the making of an airlineschedule. The planner needs to know the locations of the suppliers, cross-docks,
Logistics 105

and manufacturing plants. Then he needs to know the number of packages orcontainers of parts to be picked up from each supplier each day and to whichcross-dock and plant those materials are to be delivered. In addition, he needsto know how the containers of parts can be arranged and stacked within a truck.It is important to optimize the cubic space of each truck so that one doesn’t “shipair” and does avoid “blowouts”—in other words, one doesn’t ship partial loadsor create a condition in which all of the containers cannot be loaded on a truckbecause of weight or volume restrictions (a “blowout”).
Another critical piece of information is the road routes and distancesbetween all potential to/from destinations. A computer system is used to runsimulations to create multiple route plans; they are then evaluated by logisticsexperts who select the optimal routes. The process is very complex, and numer-ous variables have to be considered (e.g., total miles, average miles per hour,number of trucks needed, number of drivers needed, and risks because of roadconditions). The process used is an example of Toyota’s emphasis of combiningthe talents of human beings and the power of machines—Toyota doesn’t rely onthe computer system alone.
Under normal conditions, the routes would not vary significantly frommonth to month. But in cases where there is a major change in production(either up or down) or if there are new suppliers, the change in routes could bedrastic. That step would require more scrutiny to make sure that the plan iscorrect and that no error is in the simulation.
A Toyota logistics manager from the Princeton, Indiana, plant stated thatfor route planning, Toyota assumes a 50-mile-per-hour average speed of trucksand provides a desired route and travel time for deliveries. That time estimate isupdated when snow or other weather conditions prevail. The planning thusshifts to this inclement weather route and associated lead time. Such detailedplanning provides the plant with a good estimate of deliveries, and thus permitssynchronization of parts flow with plant requirements.
Other situations that might arise include port-related unloading issues,border crossing delays because of tightened security checks, and strikes. In suchcases, shipments are sometimes airlifted so that the flow is maintained. Thecapability to quickly react to impending crises enables alternate contingencyplans to be generated and implemented to keep the parts flowing.
Pipeline ManagementToyota strives to operate an extremely lean supply chain, so it is critical for theplant production control personnel to understand the status of all parts in thepipeline. The “parts pipeline” is defined as all parts that have been ordered froma supplier and have not been unloaded at the receiving plant.
Toyota Supply Chain Management106
Toyota uses a variety of methods to track parts throughout the pipeline. Theprocess starts with the parts order that is sent via Electronic Data Interchange(EDI), along with the kanban bar code label that the suppliers affix to the partsshipping container. Once the parts are shipped, the supplier sends an EDIAdvanced Shipping Notice (ASN). The truck driver scans the kanban bar codelabel and identifies the truck onto which the parts are loaded. Once the truckarrives and is unloaded at the cross-dock, the parts status is changed to showarrival at the cross-dock. Again, as parts are loaded onto another truck boundfor the plant, they are scanned and associated with the truck number. As thetruck enters the gate at the plant, the parts status is updated to show that theparts are in the plant yard. The trailers remain in the yard until productionprogress dictates that they should be unloaded at the dock. As the parts areunloaded, each container is scanned to confirm the arrival at the plant. Pipelinedata enable Toyota to have visibility into the parts pipeline. This pipeline data-base is especially important whenever there is a crisis situation such as partsshortage, short shipment, or transportation delay. It is thus clear that visibilityplays a key role in the management of the inbound parts logistics process.
Some of the metrics used to monitor inbound logistics are percent of cubiccapacity utilized, number of blowout loads, on-time pickup and delivery, andactual mileage versus plan.
Overseas Inbound LogisticsOverseas parts arriving from Japan are shipped via vessel to a port and thentransported by railcar to the assembly plant. Once the railcar arrives at theassembly plant rail yard, the container is offloaded onto a truck and driven tothe assembly dock. The trailers are parked in a large staging lot in a numberedspace that can be used to locate the trailer.
One of the unique aspects of the parts flow from Japanese suppliers is theuse of the vanning center. The vanning center is a consolidation point in Japanwhere parts are received from Japanese suppliers and packed for shipment to anoverseas manufacturing plant. The vanning center operation is linked to theoverseas parts shipping schedule described in Chapter 6. At the vanning center,parts are packed into plastic trays. These trays are then arranged into groups tofit into a module for shipment. The modules are then loaded into containers forshipment by a container ship to the overseas port. Figure 8-2 shows an exampleof the vanning packing process.
After the containers are loaded and shipped, it takes about four weeks forthe containers to arrive at the overseas plant. After the containers arrive, they arestaged in the lot outside the plant until needed. Normally, there are about threeto five days of inventory in the lot. However, the containers are not unloaded
Logistics 107
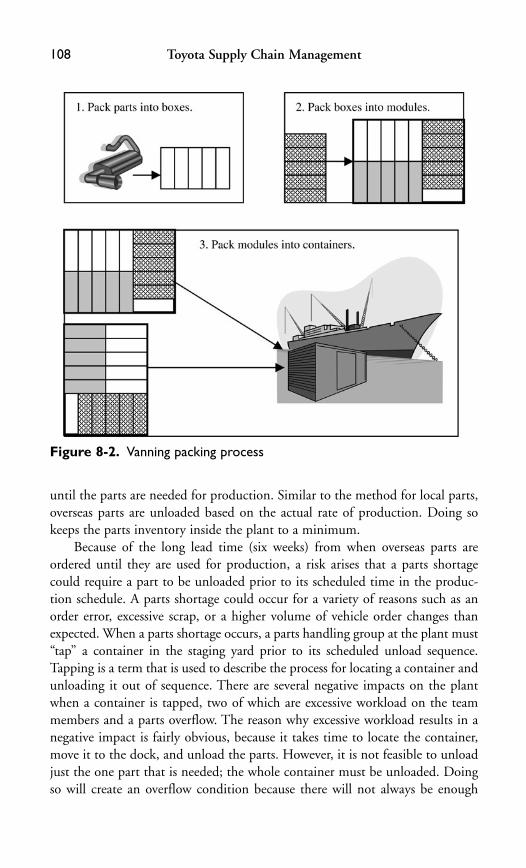
until the parts are needed for production. Similar to the method for local parts,overseas parts are unloaded based on the actual rate of production. Doing sokeeps the parts inventory inside the plant to a minimum.
Because of the long lead time (six weeks) from when overseas parts areordered until they are used for production, a risk arises that a parts shortagecould require a part to be unloaded prior to its scheduled time in the produc-tion schedule. A parts shortage could occur for a variety of reasons such as anorder error, excessive scrap, or a higher volume of vehicle order changes thanexpected. When a parts shortage occurs, a parts handling group at the plant must“tap” a container in the staging yard prior to its scheduled unload sequence.Tapping is a term that is used to describe the process for locating a container andunloading it out of sequence. There are several negative impacts on the plantwhen a container is tapped, two of which are excessive workload on the teammembers and a parts overflow. The reason why excessive workload results in anegative impact is fairly obvious, because it takes time to locate the container,move it to the dock, and unload the parts. However, it is not feasible to unloadjust the one part that is needed; the whole container must be unloaded. Doingso will create an overflow condition because there will not always be enough
Toyota Supply Chain Management108
Figure 8-2. Vanning packing process
space to store these extra parts in the normal flow racks. That, in turn, createsan additional workload because these parts need to be handled multiple timesand they could get misplaced.
The impact of variability at the plant is managed through appropriate useof buffer inventory for overseas logistics. That is facilitated by the visibility ofthe pipeline.
Long Lead Time Pipeline ManagementPipeline management is important for all parts, including local ones, but it isextremely important to monitor the pipeline for long lead time parts. Long leadtime parts have a supply lead time of three to six weeks compared to less thantwo weeks for local parts. In addition, the vehicle order specifications are notfrozen or finalized until about five to ten days prior to production. Therefore, ifthe dealers generate a high number of vehicle order specification changes, a partsshortage situation may be created because the long lead time parts orderedwould be based on the forecast not the final order.
Toyota has developed a long lead time parts pipeline system to track changesto vehicle specifications on a daily basis and translate them into daily changes inparts. These changes are then compared to the parts pipeline inventory by day tohighlight potential shortage and/or overflow conditions in advance. The resultsare presented in the form of graphs so that a visual representation is available of potential discrepancies that could result in a crisis situation. That informationenables the parts manager to evaluate the situation, take an inventory of theparts in question, and, if necessary, place a special order for parts to be “airshipped” to avoid a production interruption. (Air shipments, however, areexpensive and should be avoided unless a more expensive shutdown of produc-tion is imminent.)
To conclude this section on the inbound logistics operations at Toyota, itmay be instructive to examine how the partnership between Toyota and its 3PLproviders benefits not only to Toyota but also its partners.
Mutual Benefits from a PartnershipWhen Toyota partners with a supplier or a logistics provider, the benefits of therelationship are not for Toyota alone. The Transport Corporation of India (TCI)provides an example of how the partner can benefit. The company is a logisticsprovider in India that formed a joint venture with Toyota to deliver parts toToyota, both imported (from the port) and sourced from more than 70 local sup-pliers. Initially, TCI learned how to better manage the delivery of auto parts fromToyota; since then, it has carried the best practices over to other manufacturers.
Logistics 109
For example, using lessons learned from Toyota, in the two-wheeler segment(namely, bikes—a very popular mode of transport in India), TCI redesigneddelivery trucks to increase the number of vehicles carried from 50 to 58. TCIwent on to change them into flexible trucks, then to use trailers to carry 85 bikes,and then to improve the trailers so that they could carry 110 bikes. TCI alsoadded Global Positioning System (GPS) units to the trucks, so that manufactur-ers could directly track pending deliveries and plan their operations accordingly.In a country with poor roads choked with traffic and red tape at state borders,deliveries are liable to get stuck unpredictably; thus, tracking information can bevital to a manufacturer’s efficiency.
Starting out as a basic logistics company, TCI is now becoming a complexsupply chain management provider. Other manufacturers have started listeningto TCI. In some cases it has been asked to handle the entire inbound and out-bound logistics. In other areas—for example, perishable products like choco-lates—the company has made innovations such as linking the temperature of thetruck with the GPS unit. In a one-year period from 2004 to 2005, the company’sworth increased from approximately $160 million to nearly $200 million.2
Outbound LogisticsOutbound logistics is also known as product distribution, because the functionof outbound logistics is to distribute the finished products from the OEM plantsto the retailers. As discussed in Chapter 2, Toyota uses a different distributionflow in North America than in Europe. In addition, the relationship with the3PL providers for outbound logistics differs from that for dedicated 3PL providersfor inbound logistics. Although Toyota still considers outbound logistics providersto be its partners, those partners are not dedicated to Toyota because no one 3PLprovider can control all transportation activities end to end from the plant to the dealer. Therefore, Toyota relies on common carriers, railroads andtruck “car haulers,” to transport its vehicles from the assembly plants to the dealers.
Railroads ship many types of goods and raw material in addition to vehicles.They also ship vehicles from multiple manufacturers on the same trains. Truckingcompanies, like the railroads, ship vehicles for multiple manufacturers—in manycases, they mix vehicles from different manufacturers on the same truck.
North American Vehicle DistributionFigure 8-3 shows how vehicles move from the assembly plants through this dis-tribution network in North America. After the vehicles are produced, they areshuttled into a marshaling yard. (Details of the marshaling yard operations will
Toyota Supply Chain Management110

be explained next.) Once processing is completed in the marshaling yard, thevehicles are shuttled to the staging area for shipment. There are two options forshipment of vehicles to the dealers. The first option is rail shipment, in whichvehicles are loaded onto railcars, shipped to a railhead, and then loaded onto atruck for delivery to the dealers. The second option is for direct truckaway: vehi-cles are loaded onto trucks and delivered directly to dealers. Option 1 is used fordealers that are located a long distance from the plant, usually greater than 500miles. They represent about 75 percent of the volume. Option 2 is used for deal-ers near to the plant—within two to three days’ travel time.
Toyota includes in its contracts with the trucking partners an on-time deliv-ery objective of 48 hours from the time the vehicle is shuttled to the staging areato the time it is delivered to the dealership. A similar delivery standard does notexist for the railroads because so many variables, such as railcar switching timeat rail yards, demand for empty railcars, congestion at final destination railyards, etc., can impact rail shipment timing. Toyota also emphasizes quality bymonitoring damage metrics for all of the trucking and rail partners. The com-pany holds an annual meeting with all of its logistics providers to recognize thetop performers in both on-time performance as well as quality performance.That recognition provides an incentive for the logistics providers to improve andalso sets the benchmarks for future performance.
Marshaling Yard OperationsThe marshaling yard operation is extremely important, as it ensures the efficientand timely delivery of vehicles to their final destination. Figure 8-4 shows howvehicles flow through the marshaling yard. After the vehicles are produced in the assembly plant, they are shuttled to one of two areas. Vehicles that requireinstallation of accessories go to accessory staging; all other vehicles are shuttled
Logistics 111
Figure 8-3. North American vehicle distribution flow
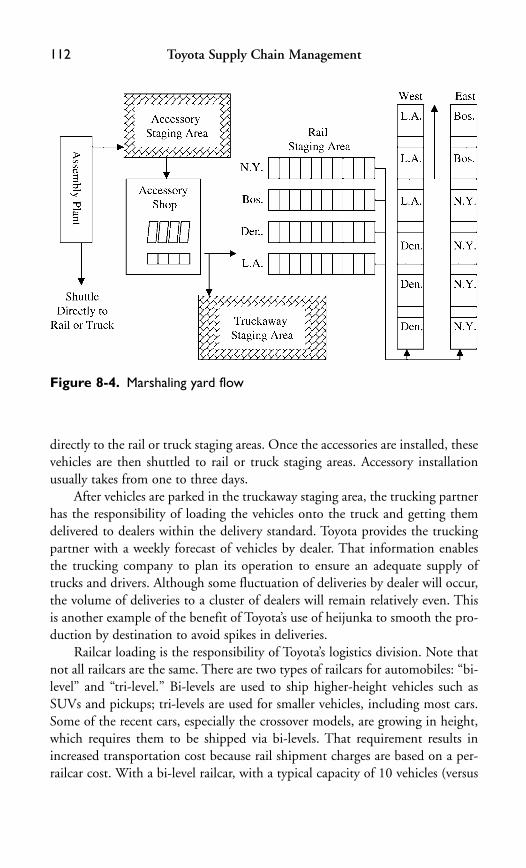
directly to the rail or truck staging areas. Once the accessories are installed, these vehicles are then shuttled to rail or truck staging areas. Accessory installationusually takes from one to three days.
After vehicles are parked in the truckaway staging area, the trucking partnerhas the responsibility of loading the vehicles onto the truck and getting themdelivered to dealers within the delivery standard. Toyota provides the truckingpartner with a weekly forecast of vehicles by dealer. That information enablesthe trucking company to plan its operation to ensure an adequate supply oftrucks and drivers. Although some fluctuation of deliveries by dealer will occur,the volume of deliveries to a cluster of dealers will remain relatively even. Thisis another example of the benefit of Toyota’s use of heijunka to smooth the pro-duction by destination to avoid spikes in deliveries.
Railcar loading is the responsibility of Toyota’s logistics division. Note thatnot all railcars are the same. There are two types of railcars for automobiles: “bi-level” and “tri-level.” Bi-levels are used to ship higher-height vehicles such asSUVs and pickups; tri-levels are used for smaller vehicles, including most cars.Some of the recent cars, especially the crossover models, are growing in height,which requires them to be shipped via bi-levels. That requirement results inincreased transportation cost because rail shipment charges are based on a per-railcar cost. With a bi-level railcar, with a typical capacity of 10 vehicles (versus
Toyota Supply Chain Management112
Figure 8-4. Marshaling yard flow

15 for a tri-level), the cost could be as much as 50 percent higher. This is anexample of a situation in which vehicle design can have a negative impact on thesupply chain operations and costs.
Consider what happened at one of the Toyota plants: A major change foran existing model increased the height of the car by only a few inches, whichresulted in the car being one inch too high to fit on a tri-level railcar. That extraheight meant that the new model had to be shipped via bi-level instead of tri-level, resulting in an increased transportation cost.
The process for loading railcars is as follows:
■ Stage for rail shipment. Vehicles are staged in lanes by destination andrailcar type. See Figure 8-4, which illustrates a rail staging area. Notehow vehicles are parked in lanes by destination. In this example, there isonly one lane per destination. If both bi-level and tri-level railcars wereto be used to ship to each destination, there would be two lanes for eachdestination.
■ Prestage empty railcars. Empty railcars are shuttled by the rail companyonto one or more rail spurs. These railcars are usually arranged in a stringof six. See Figure 8-4 for an illustration of two strings of six railcars.
■ Assign destinations to railcars. Once a new string of empty railcars is readyfor loading, the dispatcher must decide which destinations are to beloaded. If possible, all six railcars should be loaded with vehicles for thesame destination. The next best option is to combine destinations thatwill be on the same route; for example, vehicles shipped to New York andBoston would be picked up by an eastbound train. However, the dis-patcher can load vehicles for destinations only if the staging lane is full.The dispatcher must take inventory of what is in the staging lanes todetermine what can be loaded.
■ Load the vehicles. Vehicles are driven onto the railcars and scanned as theyare loaded so the tracking system knows which vehicles are loaded intoeach railcar.
■ Release the railcar for shipment. Once the complete string of railcars isloaded, the dispatcher contacts the rail company to pull the full load outof the yard and replace it with an empty string.
This process appears to be a straightforward one; however, it does not alwaysoperate effectively. The following situation that occurred at one of Toyota’s plantsin 2003 provides some insight into how conflicting objectives can result in anegative impact on downstream operations.
At one of Toyota’s North American assembly plants during 2003, there wasa great deal of tension between the plant marshaling yard management and the
Logistics 113
Toyota Supply Chain Management114
rail company local management. The main concern of the yard managementwas that they were under strict orders from the plant manager to load railcars asquickly as possible; that sense of urgency ensured that vehicles were moved outwith minimal delay so that delivery time to the dealers would be kept short. Theyard managers suspected that the rail company personnel did not share the samesense of urgency, because each day when the plant manager passed by the railyard on his way to work, he noticed that several railcars that were loaded the pre-vious day were still parked along the fence. When the yard managers discussedthe matter with the rail yard management, the reason given was that the rail yardpersonnel took several hours to shuttle railcars around and match them up withthe proper outbound trains.
This conflict continued for several months; there did not seem to be anyresolution. To make matters worse, the plant was planning a major increase inproduction within a year, so if this problem could not be resolved, the rail yardwould need to be expanded at a cost of several millions of dollars.
Toyota management decided that the situation was critical, and so they dis-patched an independent team from other Toyota locations. Team members couldobjectively study and evaluate the situation, recommend countermeasures, andattempt to find a compromise.
They arrived on site and met with the marshaling yard management torequest a detailed explanation of the railcar loading process. After taking awalking tour of the yard, they were directed to a whiteboard that showed thenumber of vehicles ready for shipment by destination. That board was the dis-patcher’s “bible” and indicated visually the actual inventory in the staginglanes available to be shipped by destination. It was continuously updatedduring the day, and as soon as there were enough vehicles to load six railcars,the dispatcher called for an empty string of railcars and proceeded to load thevehicles. Because the rail yard’s focus was to move the vehicles through theyard quickly, the sequence of the loading was based on FIFO, or first in, firstout. Rail yard personnel were very proud of their operation because one oftheir key metrics was “days of yard inventory” and they were averaging lessthan one day.
Next, the team met with the rail yard management (the rail yard is ownedby the rail company; these managers did not work for Toyota). The rail yardmanagers explained that the reason that some of the railcars were still sitting in the yard a day after they were loaded was because each string of six railcars had to be disassembled and rearranged into strings to connect to eitherthe eastbound or westbound trains. Also, the vehicles were not always loaded inthe proper sequence. The constant shuttling of railcars was a burden, and theyindicated that they would need to add more engines and people to handle theincreased volume.

The team asked, “Is there anything that Toyota could do to reduce yourworkload and increase the throughput?” The response was surprisingly quick.Rail yard managers suggested two changes to the process for loading railcars:
1. Load only vehicles with western destinations in the morning so that they canbe shipped on the westbound train that departs at 1 p.m. Then, load onlyvehicles with eastern destinations in the afternoon so they can be shipped onthe eastbound train at 9 p.m.
2. Load a string of six railcars based on the sequence in which the destinationswill be delivered. For example, if there are railcars going west to Los Angelesand there are both Denver and L.A. railcars on the string, place the L.A. rail-cars at the front and Denver railcars at the rear. With that arrangement,when the train arrives at Denver on the way to L.A., the Denver railcars cansimply be disconnected without affecting the L.A. railcars.
If the Toyota yard managers would agree to this change, then that decisionwould reduce the rail yard’s need to disassemble and rearrange each string of railcars.
The team went back to the Toyota marshaling yard managers and explainedthat loading the railcars without regard to destination was causing extra work forthe rail yard personnel. In fact, it was actually delaying the shipment to dealersbecause there were only two train departures per day: an eastbound train depart-ing at 9 p.m. and a westbound train departing at 1 p.m. So, if vehicles for west-bound destinations were loaded in the afternoon, they would not depart untilthe next day, and if vehicles for eastbound destinations were loaded in the morn-ing, they would not depart until 9 p.m.
The response from the Toyota yard managers was lukewarm. Although theycould understand the potential benefit, their concern was that such a changewould result in an increase in yard inventory and would most likely requireToyota to expand the yard capacity to accommodate the future increase involume. The team was concerned that an impasse seemed to have been reached,so they made a proposal: create a simulation based on the last month’s loadingdata to show what would have happened if the railcars were loaded based on theprocess recommended by the rail yard manager. The simulation showed that thesame number of railcars would be loaded each day and that there would not bea significant increase in yard inventory.
The next step was to do a pilot for two months to guarantee that therewould not be any operational problems. The pilot was successful, and the newloading process was implemented. The increased throughput was great enoughto avoid any expansion of either the marshaling yard or the rail yard. The ben-efit was not only a cost avoidance of millions of dollars but also a shortening ofthe vehicle delivery time because the railcars did not stagnate in the rail yard.
Logistics 115

This example illustrates that it is imperative for logistics managers to consider the impact on downstream operations when they are establishing ormodifying processes.
Tracking ProgressTracking the shipment of vehicles from the plant all the way to the dealer is crucial. Toyota has created a tracking system that receives input from the railcompanies on a real-time basis that reports the progress of each railcar. It also getsinput from the trucking companies when vehicles are delivered to the dealers.
Toyota uses this information internally to monitor the distribution progressthroughout the logistics network. It also provides an estimated time of arrival(ETA) to the dealers. The ETA calculation is based on the date and time of thefinal quality assurance (FQA). The FQA is the point in the marshaling yardprocess at which a vehicle is ready for shipment. The calculation is a follows:
ETA � FQA � estimated delivery elapse time
The estimated delivery elapse time is based on the recent actual history foreach route.
If a vehicle has not been produced, the ETA is still calculated; the FQA datemust also be estimated. Because many variables can impact the actual trans-portation time, Toyota provides the dealers with an estimated three- to five-dayarrival window instead of an exact date. That arrival window is updated as thevehicles get closer to delivery. The ETA information is used by the dealer to pro-vide its customers with expected delivery time.
Distribution Flow in EuropeToyota’s distribution flow in Europe is different than its flow in North Americabecause the dealers in Europe do not have enough space to maintain a largeinventory of vehicles. In fact, many dealers operate in an urban area and haveroom for only a few showroom vehicles. Figure 8-5 shows the normal flow in
Toyota Supply Chain Management116
Figure 8-5. Europe vehicle distribution flow

Europe. As in the North American flow, the vehicles are released from theassembly plant and shuttled to the marshaling yard. In Europe, there is no addi-tional processing in the marshaling yard. Instead, the vehicles are shuttleddirectly to the staging area for shipment via truck to one of the regional hubs.The hubs are where the installation of accessories and the application of theprice label take place. Once the vehicle is sold by a dealer, the hub is notified toprepare the vehicle for shipment and install the accessories. Then the vehicle isshipped via truck to the dealer.
One of the other differences in Europe is that most transportation is viatruck, not rail. Nevertheless, there is some limited use of rail for long-distanceroutes, and of course ferries or ships are used to cross waterways.
Another difference is the method for calculating the ETA. The ETA is basedon the FQA date and time from the hub, not the marshaling yard at the factory.Also, the ETA is a promise date, not a delivery window. The promise date reflectsthe latest estimated arrival date.
Toyota’s distribution processes in North America and Europe are just oneexample of how Toyota has the agility to adapt its processes to different environ-ments around the world.
The paragraphs that follow give an example of how other OEMs value theimportance of logistics as a key component of the supply chain.
Outbound Logistics at Ford and General MotorsAs Ford and General Motors try to reduce the cost and increase the reliability ofdelivery in their outbound logistics, they both have tried using specialists tomanage their operations. Ford created an alliance with UPS Logistics Group (asubsidiary of United Parcel Service) in 2000 and GM formed a joint venturewith the logistics and freight giant Con-way (then called CNF).
UPS did not actually transport cars for Ford but provided their logisticsexpertise for management and tracking of deliveries. Ford’s distribution net-work, based on a hub-and-spoke system with rail and ground transportation,utilized 14 different carriers that worked independently on their own lane opti-mization. UPS reengineered the network for simultaneous delivery planningacross all the carriers, enabling optimum analysis of vehicle demand, assignmentof sourcing, and scheduling of loads and delivery for all Ford dealers. Accordingto a joint press release by Ford and UPS in 2001,3 within one year they hadshaved off four days of delivery time. They saved $1 billion in inventory andmore than $125 million in annual inventory carrying costs for Ford.
General Motors went a step further to create the largest such venture in theautomotive industry, outsourcing its entire inbound and outbound logistics
Logistics 117
operation worldwide to a joint venture formed with Con-way.4 This new company, called Vector, was responsible for managing shipment of parts toplants, vehicles to dealers, and aftermarket parts and materials. The idea was touse a common information technology system to obtain seamless visibility ofmaterials, parts, and vehicles moving through GM’s supply chain worldwide. ByJuly 2002, GM had reduced logistics costs by 10 percent and reduced time fordelivery from 15 days (in 1999) to about nine days.5
Although this experiment was successful, GM ended the joint venture in2006 by buying out Con-way’s 85 percent share in the company. The reasoncited was a response to changing fortunes to support GM’s turnaround activitiesin North America.6
Reflection PointsToyota’s logistics operation is an excellent example of where Toyota’s organiza-tional learning practices are extended beyond the enterprise to include the 3PLpartners. The continuous sharing of the Toyota Way principles and use of v4Lwith their partners ensures that parts and vehicles are transported in an effectiveand timely manner.
■ Velocity. Parts inflow, production rate at the assembly plant, and raildepartures are synchronized to ensure heijunka across the supply chain.This process enables a steady velocity to be maintained.
■ Variety across vehicles affects vehicle height, which in turn affects load-ing efficiency in the railcar (bi-level or tri-level) and thus affects associ-ated costs. Destination of delivery affects vehicle options and flow timeand is in turn linked to parts inflow and finished goods outflow. Dealershave some limited flexibility to swap vehicle orders with other dealers’orders in the pipeline.
■ Variability is managed by combining pickups across suppliers to createmilk routes and the use of cross-docks. Tapping parts compensates forvariability by using pipeline inventory.
■ Visibility across the pipeline of parts inflow plays a key role in maintain-ing a lean system, particularly for long lead time parts. Scanners, ASNs,and the like enable visibility across the supply chain. Continuous moni-toring of outbound flows from the plant all the way to the dealers pro-vides visibility for dealers.
Toyota takes many steps to foster learning and continuous improvement inits logistics operations. These include the following:
■ Create awareness. Toyota monitors the pipeline both to obtain early signalsof problems that might arise and to take corrective action based on pipelineinformation. Progress of shipments is tracked with precise calculation.
Toyota Supply Chain Management118
■ Make action protocols. Trade-offs that must be considered when designingthe logistics systems (e.g., on-time pickup, capacity utilized, and totalactual mileage) are clearly defined. Contingency plans are drawn withcare to address exceptions that arise from time to time.
■ Generate system-level awareness. The information system makes the supplypipeline visible. System-level exceptions are studied to isolate majorissues, and those concerns are addressed on a priority basis.
■ Practice “go-and-see.” The highest-ranking managers go to the site with thelogistics problem so they can see firsthand. These managers take a sys-tems approach to solving problems, considering the impact bothupstream and downstream.
■ Make deviations visible. Toyota levels the workload with milk runs. Thatstep makes deviations obvious and immediately visible.
Endnotes1. Transportation costs are directly related to the cost of fuel. As the cost of
fuel increases, the cost of transportation will be negatively impacted.2. “We Are Doing a Lot More Than Just Basic Logistics,” Business Line, April
18, 2005.3. “Ford Motor Company and UPS Logistics Group Ahead of Schedule in
Vehicle Delivery Improvements,” Ford Motor Company press release,February 21, 2001.
4. “GM Joint Venture to Oversee Deliveries,” Automotive News, December18, 2000.
5. “GM System Reduces Parts Shortages,” Automotive News, July 1, 2002.6. “GM Buys Out Vector SCM, Brings Logistics Back In-house,” Logistics
Management, August 1, 2006.
Logistics 119

This page intentionally left blank
121
Dealers use a number of different processes to fulfill retail customerdemand. This chapter will explore the major ones; it will be subdi-vided into three areas: vehicle allocation, demand fulfillment options,
and dealer operations.
Vehicle AllocationAt Toyota, vehicle allocation in North America is a two-step process. In the firststep, the national sales company allocates vehicles to their regional areas. In thesecond step, the regional areas allocate these vehicles to dealers.
Regional AllocationThe regional allocation is performed monthly, about six weeks prior to the startof the production month. If the next production month is July, then the regionalallocation would occur in mid-May. The purpose of the regional area allocationis to allocate the quantity of vehicles by model to each region. The quantity iscalculated using a share or percentage of the total national market that eachregion will receive. The following are some of the factors that are used to deter-mine each region’s share:
■ Sales versus previous month and model-to-date objectives■ Regional weather conditions that can impact future sales such as floods,
snowstorms, drought, etc.■ Regional economic conditions and trends that impact future sales■ Competitive strategies that may affect market share in a region and
necessitate more aggressive marketing strategies
Dealer and DemandFulfillment
Chapter 9
Once the volume of each model is allocated to the regional area, the regionmust create a vehicle order for each unit. The regional vehicle order is an inputto the sales and operations planning process, which was described in Chapter 4.After the monthly order is scheduled by manufacturing, regions receive a filecontaining the details of each vehicle along with the tentative scheduled date.These data are used to perform the dealer allocation.
Dealer AllocationToyota uses three methods in the United States to allocate vehicles to dealers.The methods vary for the three Toyota brands: Toyota, Scion, and Lexus.
Toyota Brand AllocationDealer allocation is based on the fair share of the regional volume for eachmodel. That apportionment is intended to be a very objective calculation basedon a turn-and-earn concept. Turn-and-earn is a results-oriented methodologythat rewards the dealers for increasing their sales. The goal is to ensure that alldealers are treated fairly and to avoid the perception of favorable treatment.Therefore, the initial dealer allocation is based on each dealer’s share of theregional market, as calculated based on actual sales. The allocation is performedtwice each month and, unlike with the regional allocation, dealers are allocatedor assigned unique vehicles with full specifications.
The vehicle specifications that the dealer is allocated are matched to twoinputs that are provided by dealers. The dealers can maintain an allocation pref-erence database that describes the type of vehicle specifications that theydesire—or do not desire. We return to the example that dealers in Arizona maynot want dark colors and dealers in northern cities may want cold weather kits.Dealers can also submit special orders from customers.
Once the dealers receive their allocation of vehicles, they have a few days toaccept the vehicles. If there are reasons why dealers do not want some vehicles,they may turn down specific units. Those units will be placed in a supplemen-tal pool and offered to other dealers. In the situation where there is a surplus ofsome models because of slow sales, the region may offer dealers a financial incen-tive to take these slow-selling vehicles.
After the dealers accept the vehicles, they appear in a pipeline inventoryreport. At this time, dealers can make changes to some of the factory specifica-tions and also add accessories that will be installed at the marshaling yard and/orport. Now that the dealers know which vehicles are scheduled for productionand approximately when they will be built, they can use information regardingthese vehicles in combination with the dealer stock to fulfill demand.
Toyota Supply Chain Management122
Scion Brand AllocationThe method of allocating Scion is similar to the method of allocating the tradi-tional Toyota vehicles, with one major difference. For Scion, the vehicles allo-cated to each dealer are held at the port until the vehicle is sold. Once the vehicleis sold, additional accessories are installed based on customer request. Thoseaccessories can be installed at the port or at the dealer. The flexibility to addaccessories after the base vehicle is built enables Toyota to market to youngerbuyers. Younger buyers are usually first-time buyers and tend to want to person-alize their vehicle.
The model for distribution of the Scion is similar to the way Toyota distrib-utes vehicles in Europe. In Europe the vehicles are held at a hub until the dealerreceives a customer contract. Then additional accessories are installed and thevehicle is shipped to the dealer.
Lexus Brand AllocationThe primary difference between the Lexus allocation model and the other allo-cation models described previously is that Lexus vehicles are allocated to dealersbased on a quarterly sales plan. Unlike the Toyota models that are based onactual sales to “turn-and-earn,” Lexus’s vehicle allocation is based on the fore-casted sales of each dealer as a share of each region’s total sales. The allocationshare is revised each quarter to adjust for market changes. The allocation processis consistent with the idea that firms can take greater risk with products thathave a higher margin.
Toyota’s Order Fulfillment Process:U.S. ModelThere are four options for dealers to fulfill customer demand, as outlined inFigure 9-1.
The first option is to fulfill the customer’s order from dealer stock. Thesalesperson will attempt to influence the customer to select a vehicle already instock. Such an approach is preferred by the dealer because the sale can be consummated immediately, before the customer leaves the dealership. The sales-person is always concerned that once a customer leaves without the keys to thecar, she will change her mind and end up buying from another dealer or a competitor. The order-to-delivery lead time for vehicles purchased from stock isusually zero to two days.
The second option for fulfillment is a dealer trade. In that case, the sales-person can access a dealer locator system to determine if the vehicle is in anotherdealer’s stock in a nearby city or state. Usually the distance is limited to less than
Dealer and Demand Fulfillment 123
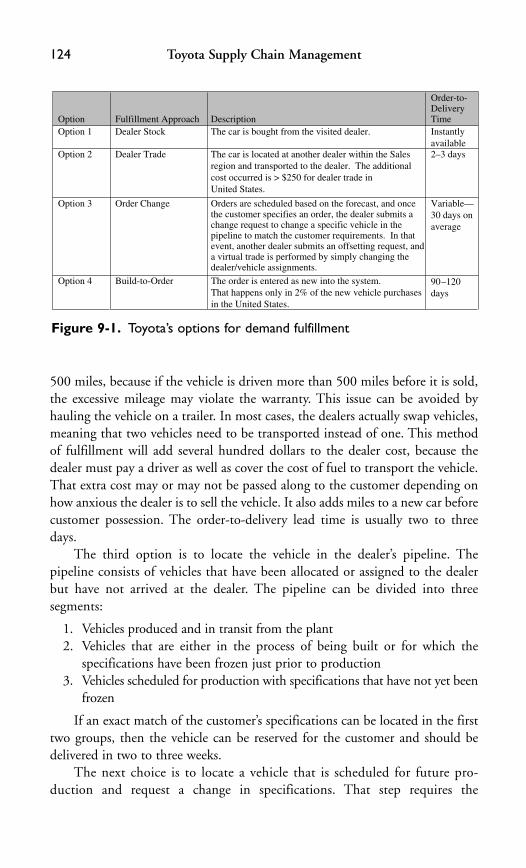
500 miles, because if the vehicle is driven more than 500 miles before it is sold,the excessive mileage may violate the warranty. This issue can be avoided byhauling the vehicle on a trailer. In most cases, the dealers actually swap vehicles,meaning that two vehicles need to be transported instead of one. This methodof fulfillment will add several hundred dollars to the dealer cost, because thedealer must pay a driver as well as cover the cost of fuel to transport the vehicle.That extra cost may or may not be passed along to the customer depending onhow anxious the dealer is to sell the vehicle. It also adds miles to a new car beforecustomer possession. The order-to-delivery lead time is usually two to threedays.
The third option is to locate the vehicle in the dealer’s pipeline. Thepipeline consists of vehicles that have been allocated or assigned to the dealerbut have not arrived at the dealer. The pipeline can be divided into three segments:
1. Vehicles produced and in transit from the plant2. Vehicles that are either in the process of being built or for which the
specifications have been frozen just prior to production3. Vehicles scheduled for production with specifications that have not yet been
frozen
If an exact match of the customer’s specifications can be located in the firsttwo groups, then the vehicle can be reserved for the customer and should bedelivered in two to three weeks.
The next choice is to locate a vehicle that is scheduled for future pro-duction and request a change in specifications. That step requires the
Toyota Supply Chain Management124
Option Fulfillment Approach Description
Order-to-DeliveryTime
Option 1 Dealer Stock The car is bought from the visited dealer. Instantlyavailable
Option 2 Dealer Trade The car is located at another dealer within the Sales region and transported to the dealer. The additional cost occurred is > $250 for dealer trade inUnited States.
2–3 days
Option 3 Order Change Orders are scheduled based on the forecast, and oncethe customer specifies an order, the dealer submits a change request to change a specific vehicle in the pipeline to match the customer requirements. In that event, another dealer submits an offsetting request, anda virtual trade is performed by simply changing the dealer/vehicle assignments.
Variable—30 days on average
Option 4 Build-to-Order The order is entered as new into the system.That happens only in 2% of the new vehicle purchasesin the United States.
90–120 days
Figure 9-1. Toyota’s options for demand fulfillment
manufacturing plant to agree to change the vehicle specification. The processis as follows:
■ The dealer submits an online request to change a vehicle that has still notbeen produced. The change request can be a simple one-for-one change;for example, “I have a red Camry and I want a blue Camry.” The changerequest can also be one-to-many or many-to-one; for example, “I have ared Camry and I want either a blue or white Camry,” or, “I have a blueCamry and a black Camry and I want a silver Camry.”
■ The next step is for the sales company’s computer system to analyzeand determine if any of the change requests can be satisfied by simplyswapping the vehicle with a dealer who has submitted a change that isthe exact reverse change request. For example, if a dealer in Bostonwants to exchange a blue Camry LE for a black Camry XLE and adealer in Chicago has a black Camry XLE and wants a blue Camry LE,then the computer can simply swap the dealer assignments. If thisonline swap is successful, then the virtual swap is made and both deal-ers will be notified.
■ If the above swap is not available, then the changes are sent to the man-ufacturing computer system that checks to ensure that the change can bemade without exceeding any of the manufacturing constraints. Eachassembly plant establishes a fluctuation allowance for each vehicleoption, including color. Each dealer change request is systematicallyevaluated to make sure that none of the allowances are exceeded. If thechange is accepted, the vehicle specifications are changed and the resultis sent back to the dealer via the sales company. Also, the dealer will benotified if the change cannot be accepted, so the dealer can modify it orleave it in a pending status to be reprocessed the next day. Vehicleschanged at the factory are usually delivered in 30 to 40 days.
■ The last resort (or fourth option) is to request a build-to-order vehiclefrom the regional office. That step would require the region to input thespecial order in the next month’s order cycle. A special request order typically has a very long lead time (usually three or more months).
In addition to the order-to-delivery lead time for each of the fulfillmentoptions as shown in Figure 9-2, it is also important to provide an accurate ETA(expected time of arrival) for the dealer to keep its customer updated. Not onlyshould a date be provided, but the actual progress should be updated daily, similarto the way UPS tracks packages. Initially, the ETA is calculated using the estimatedproduction build day and adding the standard transit time from the factory to thedealer. As can be seen from Figure 9-2, the longer lead time orders will result in aless accurate ETA. This calculation must take into account the standard deviation,
Dealer and Demand Fulfillment 125

because the transit time for each route will vary depending on many external factors. Toyota believes that it is better to underpromise and then overdeliver.
Choice versus Value Trade-offWhat is a dealer’s perspective on how customers respond to Toyota’s strategy tolimit the mix of vehicles produced in a market area? Steve Gates, an owner of aToyota dealership in Kentucky, explained that most customers are repeat customers; they have owned Toyota cars previously or are familiar with otherJapanese manufacturers and understand the concept that variety will be limitedso that quality and value can be maintained. The remaining customers mayrequire salesperson assistance to be guided to the increased features that accom-pany the limited variety, thus providing the “added value” for the cars offered.Steve Gates did not feel that limitations of variety were a deterrent. He did high-light the fact that dealers did have a voice in Toyota’s product planning and theirperceptions regarding customer needs were considered when allocations weremade.
The concept that Toyota offers added value is interesting, but can it bemeasured? How should one measure the “added value” of a Toyota? While qual-ity is measured and controlled by suppliers and assemblers using thousands (per-haps millions) of data points among all parts, how is a consumer to measure thedifference in value between a Toyota vehicle and one produced, say, by anAmerican or Korean competitor? One way of estimating value could be to com-pare used car values of vehicles in the same class: how much of its value does acar retain after three, five, or seven years of use? To measure the difference, weobtained suggested used car retail values from the Kelley Blue Book (KBB), whichreports the residual values for vehicles of different makes, models, and years.This value is calculated by analyzing thousands of actual transactions across theUnited States, producing prices for a varied set of mileage and vehicle condi-tions. These data are presented in Figure 9-3, which shows how Honda andToyota cars not only command a premium at initial sale but also retain their valuesmore than other vehicles sold at comparable prices. While Honda Accord andToyota Camry retained 85 percent and 89 percent of their values, respectively,
Toyota Supply Chain Management126
Schedule Production In-Transit Trade Stock Lead Time Percent Option0–2 days 60–70% 11–3 days 20–25% 2
1–2 weeks <5% 32–3 weeks <5% 33–6 weeks 5–10% 3>3 months <2% 4
MonthlyOrder
Order FulfillmentStockPipeline
Figure 9-2. Order-to-delivery time for U.S. market
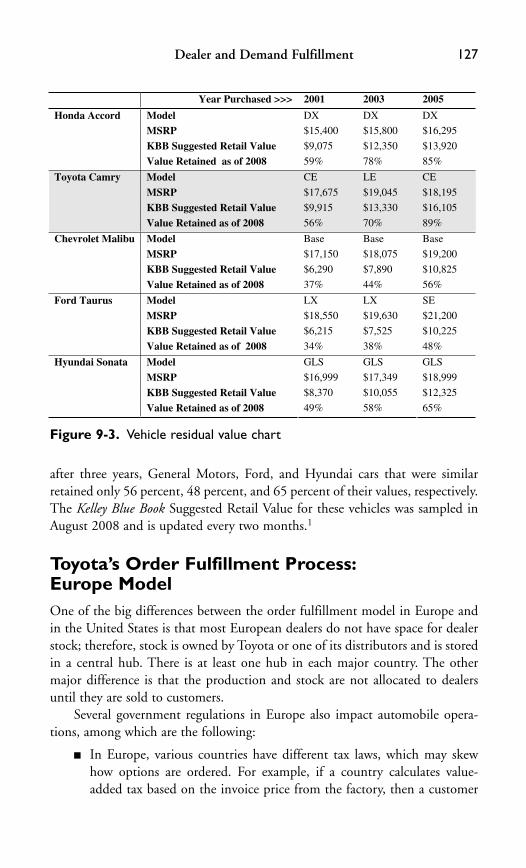
after three years, General Motors, Ford, and Hyundai cars that were similarretained only 56 percent, 48 percent, and 65 percent of their values, respectively.The Kelley Blue Book Suggested Retail Value for these vehicles was sampled inAugust 2008 and is updated every two months.1
Toyota’s Order Fulfillment Process:Europe ModelOne of the big differences between the order fulfillment model in Europe andin the United States is that most European dealers do not have space for dealerstock; therefore, stock is owned by Toyota or one of its distributors and is storedin a central hub. There is at least one hub in each major country. The othermajor difference is that the production and stock are not allocated to dealersuntil they are sold to customers.
Several government regulations in Europe also impact automobile opera-tions, among which are the following:
■ In Europe, various countries have different tax laws, which may skewhow options are ordered. For example, if a country calculates value-added tax based on the invoice price from the factory, then a customer
Dealer and Demand Fulfillment 127
Year Purchased >>> 2001 2003 2005
Model DX DX DX
MSRP $15,400 $15,800 $16,295
KBB Suggested Retail Value $9,075 $12,350 $13,920
Honda Accord
Value Retained as of 2008 59% 78% 85%
Model CE LE CE
MSRP $17,675 $19,045 $18,195
KBB Suggested Retail Value $9,915 $13,330 $16,105
Toyota Camry
Value Retained as of 2008 56% 70% 89%
Model Base Base Base
MSRP $17,150 $18,075 $19,200
KBB Suggested Retail Value $6,290 $7,890 $10,825
Chevrolet Malibu
Value Retained as of 2008 37% 44% 56%
Model LX LX SE
MSRP $18,550 $19,630 $21,200
KBB Suggested Retail Value $6,215 $7,525 $10,225
Ford Taurus
Value Retained as of 2008 34% 38% 48%
Model GLS GLS GLS
MSRP $16,999 $17,349 $18,999
KBB Suggested Retail Value $8,370 $10,055 $12,325
Hyundai Sonata
Value Retained as of 2008 49% 58% 65%
Figure 9-3. Vehicle residual value chart

may order a vehicle with very few options and contract with a dealer orprivate shop to install accessories.
■ Laws pertaining to the registration process could also affect the deliverytime. Some countries require several days to process the vehicle registra-tion, so even if the vehicle arrives at the dealer quickly, the customer maynot be able to take delivery until registration is approved.
■ In the past, the Block Exemption Agreement for automobiles affectedthe way OEMs set up their dealer network, which resulted in there beingmany small dealerships (for example, Germany has as many dealers asthe entire United States). That arrangement also negatively affected cus-tomers, because they ended up paying a 35 percent premium to getrepairs done at the local dealership. In addition, dealerships located inpremium real estate locations meant that dealer inventory space was lim-ited. However, the recent repeal of the Block Exemption Agreementmeans that the European dealer networks are expected to change consid-erably. Already several dealerships have been consolidated, and moreaggregation is expected. Manufacturers have to choose an exclusivedealer or exclusive territory. The impact is expected to decrease customercosts and increase competition.
In summary, the order fulfillment process in Europe is more complexbecause there are over 25 countries involved, each with different laws and poli-cies. Figure 9-4 illustrates the five options for fulfilling demand in Europe.
As in the U.S. market, in the European market too it is important to pro-vide an accurate ETA. Not only should a date be provided, but the actualprogress should be updated daily. For vehicles in the central hub, the ETA is cal-culated by adding the hub processing time to transit time from hub to dealer. Ifthe vehicle is not yet produced, the ETA is calculated using the estimated pro-duction build day and adding the standard transit time from the factory to thedealer. As can be seen in Figure 9-5, the longer lead time orders will result in aless accurate ETA. That calculation must take into account the standard devia-tion, because each route transit time will vary depending on external factors. Itis better to underpromise and then overdeliver. If too much buffer is built intothe estimate, however, then the customer may not be willing to wait. Figure 9-5shows the estimated order-to-delivery time for each option.
MetricsMetrics are an important method to monitor order fulfillment. The followingare some of the key metrics:
■ Sales. The total sales by model and by mix■ Daily selling rate. The sales divided by the selling days in a month
Toyota Supply Chain Management128

■ Dealer stock. The number of units in dealer stock that have not beendelivered to a customer or put into demo service
■ Company stock. The number of vehicles produced that are still at the fac-tory or in transit to the dealer
■ Days supply. The number of vehicles in stock divided by the daily sellingrate
■ Aged stock. The number of vehicles in stock over N days (usually 90 or120 days)
■ Order-to-delivery lead time. The number of days from the time the customer orders to the day of delivery
Dealer and Demand Fulfillment 129
OptionDemand Fulfillment Approach Description
Order-to-DeliveryTime
Option 1 Dealer Stock The car is bought from the visited dealer. This option is limited in Europe due to limited space atdealerships to store stock.
Instantlyavailable
Option 2 Dealer Swap The car is located at another dealer in the countryand transported to the dealer. Again this is limited in Europe for same reason as option 1.
3 days
Option 3 Central Hub The vehicle is sourced from central stock locationthat is controlled by Toyota. Once a customer signs a contract to purchase a vehicle, the dealer issues a call- off request to the hub for a vehicle. In addition, some accessories can be installed at the hub. After installation, the vehicle is shipped to dealer via truck.
7 days
Option 4 Order Match Vehicles are scheduled for production based on themix forecasted for each country. Once the customerspecifies his order, the pipeline of unsold vehicles is searched for the order that either matches or canbe changed to match the customer order. The primarydifference between the market in Europe and the market in the United States is that in Europe unsoldstock in pipeline is not assigned to a dealer. The unsold stock is allocated to a country so anydealer within a country can match any unsold stock.
Variable—30days on average
Option 5 Build-to-Order A build-to-order is entered into the system as anew order. The dealer sends an order request to the central country office, and the order isentered into the next monthly production order.
90–120days
Figure 9-4. Europe fulfillment model
Schedule Production In-Transit Hub Dealer Lead Time Percent Method0–2 days <5% 1a5–7 days 50–60% 1b
1–2 weeks <5% 2a2–3 weeks <5% 2b3–6 weeks 20–30% 2c>3 months <5% 3
MonthlyOrder
Order FulfillmentStockPipeline
Figure 9-5. Order-to-delivery time for European market
Dealer OperationsDealer operations are an important part of the automobile supply chain. Dealersreceive vehicles from the OEM, hold them in inventory, negotiate the sale witha customer, assist in financing, take a used vehicle in trade, prepare the vehiclefor delivery, and familiarize the customer with the vehicle features and opera-tions during the handover process. In addition, the dealer provides after-saleswarranty and service support.
Dealer operations include providing after-sales service and support toToyota’s customers. Toyota’s service chain management is based on establishingstrong links with its customers using a two-pronged strategy of supporting deal-ers and directly interacting with customers. The majority of customers are servedby dealers for their after-sales service needs. Therefore, Toyota has created anefficient supply network to provide reliable supply of service parts to dealers.Toyota also trains and helps dealers in providing excellent service. In addition,Toyota is not averse to using advanced technologies, such as e-commerce andtelematics, to directly interact with vehicle owners. We do not describe these sys-tems in detail as they are somewhat tangential to the description of the mainauto supply chain. Instead, we refer the reader to Lee, Peleg, and Whang’s casestudy2 for a detailed description on how the after-sales service systems at Toyotahelp build customer loyalty.
Dealer operations are considered so important that they merit a special sec-tion under the Toyota Way document titled “The Positioning of The Toyota Wayin Sales and Marketing.” The section related to dealers lays out the ideas thatform the basis for continuous improvement and learning, both for and aboutdealer operations. For example, the mission statement for sales and marketing is“Customer First/Lifetime Customers as Well as Radar for All of Toyota.” Thehistoric concept at Toyota is that benefit should first go to the customer, then tothe dealer; only after that does it go to Toyota. The sales operation is itselfbroken into five linked “targeted processes,” namely:
1. Obtain necessary information quickly.2. Drop into sales outlets with ease and without pressure from sales staff.3. Understand the value of the purchased vehicles.4. Obtain the vehicles with ease of mind.5. Own the vehicle with confidence.
Each of these items is further broken down into subprocesses with objec-tives and clearly defined metrics. The following are some specific ideas discussedin this chapter and outlined in the Toyota Way document:
■ The process of allocation, dealer feedback, and various methods toresolve issues related to the process are standardized and rigidly timed.
Toyota Supply Chain Management130

Those procedures allow problems to be noticed immediately and correctiveaction taken as soon as they have been identified. The system is practicaland allows for changes in orders but within the specified time limit andcost. The sequence of corrective actions is also scripted: look at dealerstock, then dealer trade, then dealer pipeline, and finally the scheduledpipeline of vehicles.
■ The amount of flexibility necessary to respond to requests is carefullycontrolled with a fluctuation allowance.
■ One of the missions of sales and marketing is to “support the dealer inconducting constant kaizen.” That objective involves planned sales activ-ities and measures based on Plan, Do, Check, and Act (PDCA), creatinga high-performing sales cycle and practice of field activities based on“Genchi Genbutsu,” or “go to the source.”
All that effort at sharing knowledge, learning, and process know-how paysoff. In a 2007 Dealer Attitude Study for Japan by J.D. Power Asia Pacific,3
Toyota was ranked the highest for the thirteenth consecutive year. The studymeasured dealer satisfaction with vehicle manufacturers or importers and deter-mined dealer attitudes toward the automotive sales business. It was based oneight factors: product attractiveness (31 percent), responsiveness to dealers (21percent), sales support (13 percent), service relations (12 percent), warranty (6percent), sales representatives (6 percent), vehicle ordering systems (6 percent),and parts (5 percent).
For Toyota, profitability of its supply chain partners—including dealers—is important for its success in the long term. Therefore, it is still trying toimprove its dealer operations and continuously increase the value delivered tocustomers. For example, Toyota Motor Europe (TME) is trying to determinehow best to make the Toyota Production System work for car retailing as well.To that end, it has created the Toyota Retailing System (TRS), which takes abottom-up approach to developing the best practices for Toyota dealers. Itworks somewhat like Wikipedia, the Web-based encyclopedia that is main-tained and improved by its own readers. Both Toyota’s production and retail-ing systems adhere to a straightforward problem-solving methodology calledPDCA, where problems are solved by teams, not individuals. This approachoffers the benefit of better structure and measurability in problem solving thanother methods have. The solution created by the team is used to create a kaizenmodule that can be shared with all other retailers in Europe through a commondatabase.
This bottom-up construction is a big advantage of TRS, says Dave Cussell,the general manager of market development at TME. In his view, dealers aremore open to listen to positive experiences from colleagues than to top-downcase histories presented by carmakers.
Dealer and Demand Fulfillment 131
Toyota Supply Chain Management132
Reflection PointsThe following is a summary of the link between ideas in this chapter and thev4L framework:
■ Variety differs in Europe, where customers expect more customizationthan in the United States. Dealers work to convince customers that thelimited variety is compensated by higher attribute levels.
■ Velocity of the dealer sales is matched to shipments to dealers to maintaina lean supply chain.
■ Variability of sales is minimized by mix planning, which restricts varietysold in each region.
■ Visibility of the product flows is ensured by providing each dealer with aspecific delivery date for a car. This date is updated as the product flowsthrough the supply chain. It permits the final customer to have a goodidea regarding the expected delivery date.
The following are highlights of the learning practices:
■ Create awareness. The dealers are made aware that the Toyota Wayextends to their processes.
■ Establish capability. Dealers are trained and supported in conductingconstant kaizen.
■ Make action protocols. The process of allocation, dealer feedback, and var-ious methods to resolve issues related to the process are standardized andrigidly timed.
■ Generate system-level awareness. Toyota uses both a top-down as well asbottom-up approach to provide the system level perspective for monitor-ing, planning, and continuously improving dealer operations.
Endnotes1. See Kbb.com, Frequently Asked Questions
(www.kbb.com/kbb/CompanyInfo/FAQ.aspx?section�UsedCar#uc_8).2. Hau Lee, Barchi Peleg, and Seungjin Whang, “Toyota: Service Chain
Management,” Case GS-41, Stanford Graduate School of Business,Stanford University, Stanford, CA, 2005.
3. J.D. Power 2007 Dealer Attitude Survey for Japan, J.D. Power AsiaPacific.
133
W hy would Toyota need to be concerned about crisis managementwhen it has implemented processes throughout the supply chainthat are synchronized and integrated to function like a fine Swiss
clock? The reality is that Toyota is not immune to disruption of its operationsbecause of natural disasters, strikes, fires, bankruptcies, and the like. Because ofthat vulnerability, Toyota has a process to respond to crisis situations.
But before we began with the discussion on how Toyota responds to crisissituations, let’s learn how a Japanese official reacted to a crisis situation. The fol-lowing is a true personal story.
An example of contingency planning involves one of the authors’ visits withhis family to the historic town of Koyasan in Japan. The rail ticket had been soldfor two days, but because of a misunderstanding the return trip was scheduledafter the first night, rather than after two nights as the family had planned. TheJapan Rail official immediately realized the problem and wanted to create a solu-tion that would hold whether the family traveled back the next day or the dayafter. He waited patiently for other lodging details to be finalized, and then hereprogrammed the ticketing system machines to recognize the return ticket foreither day. He requested that the family merely inform the ticketing staff whenthey arrived and the programs would be activated so that the travel would be asif there was no issue with the tickets. In other words, plan B was as efficient asplan A. Such contingency planning is a hallmark of Toyota—plan B is as smoothas plan A.
Crisis Management ProcessUnlike most of the Toyota operational process, crisis management is much lessstructured because the exact type and timing of a crisis event is unpredictable.In addition, there are two types of supply chain crises. The most obvious type
Crisis Management
Chapter 10

of crisis is one that occurs as a result of an unplanned event such as a fire or nat-ural disaster. However, Toyota also will declare a crisis situation to mobilizeinternal staff and suppliers to create a sense of urgency in order to develop a newtechnology that gains a competitive and/or strategic advantage. Such a situationis analogous to President Kennedy announcing in 1960 that the United Stateswould send a man to the moon within 10 years. The development of the ToyotaPrius was the result of one of these strategic crises.
The crisis management process consists of the following steps:
1. Identify the crisis. Identification of a crisis may seem to be a simple thing,because so many crisis events are also big media events (e.g., the terroristattacks of September 11, 2001; earthquakes; and hurricanes). However,many crises are much less obvious, such as suppliers that are in financialtrouble. Therefore, the responsibility to identify supply chain issues is notthat of the purchasing group alone. It is also important to detect a potentialcrisis before the actual event occurs. The following are some of the ways thata crisis or potential crisis can be identified:� The parts ordering group at a plant notices a pattern of short shipments� The quality control group at a plant detects a sudden change in parts
defects� The purchasing buyer discovers during a periodic review of the supplier’s
financial records that there has been a serious deterioration in thesupplier’s finances that could lead to filing for bankruptcy
� The purchasing buyer becomes aware of a potential strike at a supplier� News media report a natural disaster or terrorist attack
In the event that a supplier detects a problem first, then it is importantthat the supplier contacts purchasing or the plant to alert them of a prob-lem. This step is crucial, because it is human nature to attempt to resolvethe problem by one’s self. It is especially difficult for a supplier to admitthat it has a problem. Therefore, Toyota’s purchasing management contin-ually communicates to suppliers that Toyota wants to be alerted to allpotential problems. Gene Tabor, general manager of purchasing at ToyotaEngineering and Manufacturing North America, stated, “Call even if it is5 p.m. Friday afternoon. Don’t try to solve the problem yourself over theweekend. We are here to help.”1 Gene claimed that “every supplier willhave a problem; the question is how it is handled when it happens.” Thereare no extra staff resources to help suppliers; everyone from purchasing tothe assembly line team members may be used to solve a supply chain prob-lem. If a supplier has a financial issue and is required to wind down pro-duction, a team from Toyota will go to the supplier location and assistwith production changes while at the same time ensuring that all OEMs
Toyota Supply Chain Management134
receive a fair share of product. In addition, many times the subsuppliers tothe supplier in trouble may be requested to continue to work closely withan alternate supplier so that shipments to Toyota can be continued.
2. Communicate! Both internal and external communications must be timelyand effective. Initially, it is critical that all affected plants be alerted as wellas sales organizations. Ongoing daily phone conferences need to be con-ducted to obtain the latest status and to share information. In addition,status reports must be e-mailed to all interested parties on a daily basis.External communication has to be managed to avoid misinformationbeing leaked to the media. Community leaders in the affected area mustalso be kept informed on a regular basis.
3. Make an assessment. Preliminary assessment determines the potentialimpact of the crisis. Questions that must be asked to probe the scope ofthe crisis include: “Which supplier or suppliers are impacted?” “Whatparts will be affected?” “What models and plants are affected?” Anotheraspect would be to assess the timing of the crisis. Has the crisis eventalready occurred (e.g., a fire or earthquake), or is it something that mighthappen in the future (e.g., a strike)? If the crisis can be anticipated, Toyotacan get ahead of the curve by establishing the crisis team in advance toimplement mitigating actions before the event occurs. For example, in thesituation of a pending strike at a supplier, Toyota can build up inventoryand/or establish an alternative supplier.
4. Assign “crisis owner.” An owner is assigned to manage each crisis across theenterprise and the supply chain. The crisis owner is determined based onthe scope and type of the crisis. The following are some of the criteria usedto determine the owner:� Scope. If the scope is limited to one plant, then the owner would most
likely be a production control manager at the plant. On the other hand,if the crisis is worldwide, TMC headquarters in Japan might own andmanage the crisis. Most crises fall in the middle. They impact multipleplants in one region and are the responsibility of the regional manufac-turing headquarters.
� Type. Once the entity responsible for the crisis has been determined,then it must be decided which function owns the crisis within theentity. The following are some examples: (1) Supplier financial and/orsupplier employee relations issues would likely be assigned to purchas-ing, (2) parts shortages and/or supplier operation problems would beassigned to production control, and (3) parts quality issues would beassigned to quality. Even though who the owner is might vary, depend-ing on the scope and type of crisis, all functions and entities willsupport the owner when and where necessary.
Crisis Management 135
5. Assemble crisis team. There are two steps to assembling a crisis team. Thefirst step is to identify the representatives from all of the parties affected.The representatives are the people who will be the focal points for each ofthe interested organizations. Toyota does not have extra staff to addresscrisis situations; therefore, the personnel assigned to work on the crisismust reprioritize their work and make necessary time to support the effortto mitigate the crisis. The second step is to gather together the on-the-ground team that is dispatched to the scene of the crisis. This team is theeyes and ears for the extended team and also provides direct support toresolve the problem. One of the principles of the Toyota Way is “GenchiGenbutsu,” which means “go and see.” This on-site team is able to pro-vide the facts so that the crisis impact can be assessed and countermeasurescan be developed. The team also provides technical assistance as needed.
6. Mitigate:� Short-term mitigation. The immediate requirement is to implement
countermeasures to minimize the impact. As stated above, the on-siteteam works to resolve the problem by providing technical support. Theproduction control group works with the plant to ensure that partscontinue to be delivered to the plants on time and in the quantityneeded to avoid a disruption in production. The first step is to graspthe inventory of the affected parts at each plant as well of the parts inthe pipeline. Then decisions are made to air-ship parts or obtain extraparts from another supplier. In the event there are not adequate partsto maintain production, then scheduled overtime will be reduced ateach plant and, if necessary, production is stopped for the models thatare slowest in demand. On another front, the purchasing group inves-tigates the feasibility of establishing a new source for the parts. If thesupplier has a relationship with a Japanese parent company, then it maybe practical to obtain parts from the parent company in Japan on atemporary basis. With such parallel activities, Toyota proceeds with asense of urgency on multiple fronts, even though in many cases thecrisis is avoided or mitigated quickly.
� Long-term mitigation. Even as the crisis team is involved in the day-to-day activities to mitigate the crisis, Toyota managers are using theirproblem-solving skills to investigate potential long-term countermea-sures. The objective is to learn from the experience and to attempt toeither avoid that type of crisis from recurring in the future or, if it isimpractical to avoid, consider ways in which the impact could bereduced. For example, based on a particular experience, Toyota mightdecide to source parts to multiple suppliers or ensure that there is abackup source for critical parts.
Toyota Supply Chain Management136

7. Practice good corporate citizenship. Toyota practices its corporate citizenshipprinciples even during times of crisis. Two examples are Toyota’s corporatedonation to aid victims of a natural disaster and the company’s sense offairness to its competitors when multiple automotive manufacturers areaffected by the same supplier. Although the company may be deeplyinvolved with assisting a supplier with recovery from a crisis, Toyota willmake the best effort to see to it that each manufacturer receives its fairshare of the supplier’s production.
8. Reflect. Toyota learns from a negative experience through reflection. Aftereach crisis, a reflection report is prepared and shared throughout the organ-ization. The report will include an analysis of the problem along with theshort-term and long-term countermeasures. It also includes a reflection onwhat went right and what went wrong.
Crises StoriesToyota has reacted to several crisis situations—no two of them the same—in anumber of ways. Even though Toyota is not immune to crises, the company’sability to systematically manage them enables it not only to mitigate the impactof each crisis but also to strengthen the organization by learning from the experience.
Recovering from Disaster:The Aisin Seiki Story2
How do suppliers benefit from being part of the Toyota network? The story ofToyota’s recovery from the fire at the Aisin Seiki plant provides an excellentexample of how the supply chain reacted to a crisis. The story began at 4:18 a.m.on Saturday, February 1, 1997, when a fire erupted in the Aisin Seiki Kariyaplant number 1. By 8:52 a.m., the lines devoted to P-valves and two other brakeparts were completely destroyed. (The P-valve is a fairly standard product thatwas sourced solely to Aisin Seiki because of the supplier’s long partnership withToyota and its quality standards, dedicated machinery, and the like. The P-valveis a small rectangular object that controls pressure on rear wheels, thus prevent-ing skidding of the car.) The plant was responsible for delivering 32,500 P-valvesto Toyota and other companies such as Mitsubishi, Isuzu, and Suzuki. Becauseof just-in-time delivery of parts to Toyota, only two to three days of inventoryexisted in the system. The fire on February 1 caused Toyota to start idling plantswithin two days.
Almost immediately, Aisin Seiki sprang into action. At 5:30 a.m. it decidedto create an emergency response team that, later in the day, contacted all sup-pliers to ask for assistance in producing P-valves for Toyota. About 62 firms
Crisis Management 137

responded to this call for help. Among them were 22 of Aisin’s suppliers, Toyotaitself, 36 of Toyota’s regular suppliers, and 4 nonregular suppliers, including asewing machine manufacturer that had never made car parts. Because there were100 different types of P-valves, Aisin had to decide which valves would be madeat each of the available supplier locations.
The next day, drawings were faxed to potential manufacturing sites; theydid not contain detailed manufacturing specifications. Given the large volumeof calls and communication congestion, there was limited direct contact withAisin personnel as well. Toyota decided not to pressure these suppliers into pro-viding the part as a priority. In the absence of the specialized machinery at Aisinthat was destroyed in the fire, the P-valve production had to depend on a largenumber of improvised steps that used a significantly larger amount of labor.Historically, Aisin had 70 inspection steps per piece with specialized gauges.Therefore, to ensure that quality parts were being shipped to Toyota, all P-valveswere shipped to Aisin for quality checks before they went to Toyota.
Each of the suppliers used different supply chain processes to produce theP-valve, but because all the suppliers were trained on the Toyota productionsystem principle, those different approaches still fit within the Toyota way ofmanufacturing and delivery. The flexibility to create individual supply chains yetfit within the overall system is often held up as a shining example of the valueof standardizing processes across the supply chain.
One supplier, Denso, decided to outsource its existing production to freeup capacity to produce P-valves on more than 40 machines. It decided thatbecause of evolving design understanding, process learning, and the like, thesystem would be too complex to manage if it were outsourced. Another supplier,Taiho, met with its suppliers and chose 11 suppliers to assist by providingmachining centers at its plants. Toyota pulled employees from its experimentalprototype division and set up a temporary production facility. Supplier Kayabaoutsourced the P-valves to three of its suppliers and produced no valves itself.Each of these firms, in turn, created its own emergency response teams to coor-dinate production and delivery.
One supplier started delivering prototypes three days after the fire. Densodelivered its prototype on February 5, followed by two other large suppliers thesame day. Kayaba delivered prototypes on February 6 from one supplier andFebruary 7 and 8 from the other two suppliers. Volume production beganwithin a day or the same day of prototype approval.
Denso took the lead in identifying and eliminating bottlenecks across allsuppliers. Productivity improvement approaches were implemented to decreaseprocessing times at machines.
During this period there was constant flow of personnel across all of theselocations to disseminate information and resolve production bottlenecks.
Toyota Supply Chain Management138
Among them were Toyota personnel scattered across the production locationsand individual supplier personnel. All of these steps were taken without anycontracts regarding reimbursement of suppliers for costs. Meanwhile, Aisin Seikistarted increasing its own production and boosted its production level to 100percent by mid-March.
Aisin Seiki decided to compensate all of the suppliers for the costs incurredto manage this production, while Toyota compensated its supply base with 1 percent of its sales from January to March 1997. These funds in turn werepassed along to individual component suppliers and others so that it dissemi-nated throughout the system.
What does this show? Being part of the Toyota system and applying Toyotaprinciples, and knowing that everyone else can be counted on to follow theseprocesses as well, makes the system far more resilient to disruptions. The level oftrust in the supply chain means that Toyota can comfortably expect a supplier totake the lead and solve problems without the need for centralized coordination.Low inventory in the system means that bottlenecks anywhere are every supplier’sproblem. The sharing of resources and the flexibility of response permit innova-tive individual suppliers to be both efficient and responsive.
West Coast Port StrikeDuring 2002, there was an extended shutdown of the U.S. West Coast ports. Ithad a devastating impact on the North American auto industry, includingToyota, as highlighted in an article from Auto Parts Report,3 which stated:“Operations at many of the nation’s vehicle assembly and auto parts plants areslowly returning to normal after a federal judge ordered an injunction under the1947 Taft-Hartley Act to end lockout of about 10,500 union workers at U.S.West Coast ports. The lockout started Sept. 29th.”
The U.S. economy was losing up to $1 billion a day, and the automotiveindustry was particularly hard hit because imported parts and vehicles could notbe delivered. The Motor & Equipment Manufacturers Association (MEMA)estimated the value of automotive products and vehicles shipped into WestCoast ports to be at least $42 billion in 2002.
This port work stoppage is a good example of how Toyota responds to crisisevents when there is some advanced warning. In this case, negotiations wereongoing between management and the union for several months before thelockout actually occurred. Toyota was able to organize its crisis managementteam in advance to develop contingency plans. The following were some of theactions taken to mitigate the impact of the potential shutdown of the ports:
■ Build up inventory of parts at the North American plants by graduallyincreasing parts orders for several weeks prior to the projected shutdown.
Crisis Management 139
Doing so would enable Toyota to continue to operate its plants untilalternate shipping arrangements could be implemented.
■ Contract with air cargo companies to lease several cargo planes to trans-port parts during the shutdown.
■ Investigate alternative ports of entry where ships at sea could be diverted.For example, ports in Mexico and Canada remained open during thistime.
That advanced planning paid off, because Toyota was able to move quicklyto implement its initiatives to minimize the impact on North American plantoperations. The availability of fast air transportation shortened the inventorypipeline and enabled plants to receive parts shipments during the time when theports were closed. Those capabilities allowed plant velocity to be maintained atthe highest level possible. Likewise, adjusting inventory in advance based on vis-ibility of planned production provided effective temporary buffers. This exam-ple shows how Toyota compromised the “lean manufacturing” paradigm tomanage during the crisis.
9/11 Terrorist AttacksThe terrorist attacks on September 11, 2001 (9/11) are an example of a majorcrisis that certainly was not predicted. Toyota as well as other automotive com-panies did not have any opportunity to do any advance planning for that event.
One of the immediate impacts to the supply chain was the heightened secu-rity measures implemented at all ports as well as the border crossings betweenthe United States, Canada, and Mexico. Those increased security measures cre-ated an uncertainty for the delivery times for parts shipments coming into theUnited States, and there was not any indication of how long this slowdownwould last. Another impact that would become apparent in a short time was theslowdown in vehicle sales because of the ensuing recession.
Toyota had to assemble a crisis team with members from all NorthAmerican plants, North American sales companies, and TMC in Japan. Becauseof the nature of the crisis, Toyota had to take immediate action to temporarilystop production at its North American plants until an assessment could be madeof the impact of the crisis. The following are some of the actions that weretaken:
■ Production schedules and rates were adjusted to react to the slower deliv-ery of parts.
■ Sales prioritized the production volume of each model based on the pro-jected selling rate and dealer inventory.
Toyota Supply Chain Management140
■ Logistics evaluated the impact on parts shipments of additional securitychecks at border crossings and ports. That effort required an adjustmentof parts lead time schedules for some of its suppliers.
The adjusted system involved velocity changes to synchronize with deliver-ies, variety adjustment to prioritize parts use, and visibility across the system toenable rapid adjustments based on available parts.
Freescale Worldwide Capacity IssueFreescale is a leading manufacturer of semiconductor chips that it supplies to theauto industry. During 2005, Freescale was unable to produce wafers at a highenough volume to provide an adequate supply of chips to the auto industrybecause of manufacturing problems at one of its plants in France. At that time,auto industry sales were at a peak and all auto companies were producing andselling vehicles at very high levels. Therefore, when the news hit that Freescalewas not able to meet demand for an extended period of time, a worldwide autocrisis ensued. To make matters worse, the shortage situation was not one thatcould be resolved quickly; the problem would take several months to fix.
Toyota responded by assembling a crisis team that included sales and man-ufacturing groups in North America, Europe, and Japan. The following weresome of the multiple parallel actions that were initiated:
■ Establish daily communications with the crisis team.■ Dispatch a team to assist the plant in France that was the source of the
problem.■ Assess the on-hand and pipeline inventory of all related parts.■ Pull ahead pipeline inventory when necessary to maintain plant opera-
tions by air shipping parts to shorten lead time.■ Allocate common parts to vehicles in highest demand and slow produc-
tion of parts for slower-selling vehicles.■ Work closely with other auto manufacturers and Freescale to ensure that
Freescale’s production was allocated fairly to all auto companies.
Parts allocation based on variety with the highest demand enabled prioriti-zation of production. Daily communications and visibility made possible opti-mal use of all available inventories. Use of air shipments permitted shorteningof the pipeline, which provided greater physical inventory. Collaboration withthe supplier brought about reduction of variability in yields and improved partsavailability. Synchronization of production velocity with parts availabilityallowed plant production to continue and use the same principles as duringnormal operations.
Crisis Management 141
Dealing with the Asian Financial Crisis4,5,6,7
Attracted by market opportunities in the Association of Southeast Asian Nations(ASEAN) region, Toyota had steadily increased production in Thailand in the1990s. When the industry had hit a peak in 1996, Toyota had invested US$200million in a new facility to increase production capacity from 120,000 units to220,000 units a year.
As the financial crisis hit the region beginning in July 1997, auto sales inThailand started to slump, ultimately falling 60 percent from 1997 to 1998.However, Toyota saw the long-term potential for the region, and instead of scal-ing back production like other manufacturers, it instituted several other changesto help sustain its operations in the region:
■ Shift to exports. As local sales slumped, Toyota undertook a major restruc-turing of its operations to shift its Thailand production to exports. Forexample, Toyota Motor Thailand (TMT) increased exports of Hilux trucksto Australia from 600 in 1997 to 20,000 in 1998. To incorporate this shift,Hino, a Toyota-affiliated manufacturer in Japan, had to decrease its outputof Hilux trucks by the same number and had to be compensated by anadditional capital investment by Toyota. Vehicle specifications also had tobe harmonized across several countries. In addition to vehicle exports,Toyota also began exporting diesel engines from Thailand to Japan.
■ Sustain suppliers and parts manufacturers. To help parts suppliers throughthe decreased output levels, Toyota accepted price increases of 6 to 20percent, which was contrary to its policy of continuous price reduction;the company also provided preshipment payments to help suppliers dealwith the severe credit crunch. To absorb these costs, and also to providefinancing to car buyers, the Japanese parent also supplied additional cap-ital to the tune of 4 billion Thai baht to Toyota Motor Thailand.
■ Sustain the workforce. Toyota did not lay off any of the workers, takingthis time instead to retrain part of the workforce and send large teams toJapan to upgrade their skills. The number of employees was reduced tosome extent through an early-retirement scheme, and jobs done by out-side subcontractors were transferred in-house.
This long-term vision proved to be successful for Toyota, and today it dom-inates the Thai auto market, with a 2007 market share of 44.7 percent and lead-ership in both the car and commercial vehicle segments.
Prius StoryThe development of the Prius provides an example of a remarkable “going to themoon” type event at Toyota. At the time that plans for the Prius were finalized,
Toyota Supply Chain Management142
large cars were in vogue and gas was under $1 per gallon. Gas mileage was nota consideration for many people, and for those interested in the environment,riding a bicycle was thought to be a better thing to do than driving a car. It wasin this environment that Toyota developed the Prius, a car designed to better theaverage mileage of an automobile by 50 percent. (The highest-mileage car at thetime, the basic Corolla, had an average mileage of 30.8 miles per gallon.)
As Liker reports,8 the team consisted of a general manager and his groupof 10 middle managers who reported directly to a high-level committee ofboard members. The choice of a hybrid engine was significant because it hadnot (at the time) been proven on a mass production basis. As the projectunfolded, the deadline shrank to less than one year to develop the hybridengine and vehicle. At the time of this design goal, there was no plan regardinghow this goal would be attained. The team was provided a time frame of twoyears to develop such a car. Long before this design decision, Toyota had beenworking to best leverage the use of information technology in enhancing carperformance. A quote from a senior Toyota executive is appropriate: “Eachtime, a new business model changed the ground rules for the industry. Eachtime the new model seemed invincible. And each time, it gave way to chang-ing circumstances and a new business model. . . . Our old business model isbreaking down for four main reasons. One, we need to decentralize our man-ufacturing and R&D [research and development] activities. . . . Two, the prod-uct and process paradigms that Henry Ford established are themselves breakingdown. . . . Three, information technology is transforming the inner workingsof the automobile. It is also transforming the way we develop and make and sellour products. And four, the changing product paradigm and the growing role of information technology (IT) will open our industry to a vast array ofcompetitors.”9
Given such a long-ranging plan for the use of IT, it is not surprising that ITwas used significantly to coordinate the development of a battery that wouldoperate with an internal combustion engine. The challenge during the develop-ment of the Prius was the highly compressed time frame for the development ofthe car. All of the principal engineers worked eagerly to complete model devel-opment in 15 months. Some engineers were moved to a company dormitory tobe away from distractions and devote them to the project. As the projectevolved, over 1,000 engineers who were involved in the project left their fami-lies and moved into a dorm for about 18 months. Team members focused theirentire energies on creating a product that conformed to the principles of theToyota Way (described in further detail in Chapter 11) by enabling car tech-nologies that were consistent with the booming demands of emerging markets.In the process, they created value for consumers and the society by generatingenvironmental benefits.
Crisis Management 143
Toyota Supply Chain Management144
Clearly, the development of the Prius was an internal crisis trigger thatserved to motivate the product development team to create a car with new tech-nology in 15 months. But such pressures only serve to highlight the benefit ofwell-crafted processes and their success under testing circumstances.
Reflection PointsCrisis management at Toyota highlights how the v4L framework applies tomany different situations. Learning and leadership are equally necessary to facil-itate such execution. The following are links to the v4L framework:
■ Variety. Careful balancing of the variety of products produced and theassociated parts and capacity requirements, with available parts suppliers and in the pipeline, play an important role in maximizing thebenefits and minimizing the corresponding impact on the system.
■ Velocity. Synchronization of velocity across the supply chain is crucial toensure that bottlenecks are avoided.
■ Variability. Variability across the system is managed by insisting that newprocesses continue to follow accepted working processes so that qualityand performance will not be compromised.
■ Visibility. The role of managers in the system is both to create internalvisibility to enable effective coordination and to provide an on-site pres-ence to manage the problem. Also, a separate outside communicationsmanager provides visibility to the outside world.
The learning methods of Toyota are certainly applicable to crisis management:
■ Create awareness. Potential crises are identified by looking for patternssuch as a bunch of shipments that are delayed or deterioration in sup-plier’s financials.
■ Establish capability. Toyota communicates both internally and externallyto all interested parties so that they become aware of both the crisis man-agement process as well as the steps taken to mitigate the impact of thecrisis.
■ Make action protocols. The process of crisis management is scripted andcommunicated to supply chain participants.
■ Generate system-level awareness. Toyota selects the appropriate crisisowner and then discusses both short-term and long-term mitigation.
■ Produce the ability to teach. Toyota’s senior managers are able to articu-late the crisis management steps clearly and provide examples to illustrate.

Endnotes1. Interview with Gene Tabor, general manager of Toyota Purchasing, August
21, 2008.2. T. Nishiguchi and A. Beaudet, “Self Organization and Clustered Control
in the Toyota Group: Lessons from the Aisin Fire,” MIT InternationalMotor Vehicle Program, 1997.
3. “West Coast Port Shutdown Slowed Auto/Autoparts Production,”Autoparts Report, October 18, 2002.
4. “Toyota Chief Sees Auto Crisis Reaching Bottom,” The Nation (Thailand),October 8, 1998.
5. “Toyota Prepares Ground for Next-Century Blast,” The Nation(Thailand), February 22, 1999.
6. “Japanese Direct Foreign Investment and the Asian Financial Crisis,”Geoforum. 32, no. 1 (February 2001).
7. “Automakers Expect Rebound,” Bangkok Post, January 18, 2008.8. Jeffrey K. Liker, The Toyota Way. New York: McGraw-Hill, 2004.9. H. Okuda, “When Ground Rules Change,” speech at the Yale School of
Management, 1998.
Crisis Management 145

This page intentionally left blank
147
TheToyota Way is made up of four major elements: long-term philosophy,right process, development of people, and continuous solving of rootproblems. Taken together, they are the secret recipe for continuous
improvement, for creating value, and for developing people that will continuethe mission of creating value into the future. In the paragraphs that follow, wewill describe how these ideas are applied to supply chain management and howthey manifest themselves in all chapters in this book. You might already befamiliar with the components of the Toyota Production System. Writers such asMonden,1 Liker,2 and Suzaki,3 as well as Toyota’s own internal training docu-ments, have explained in detail how the principles form a whole and consistentapproach for running a manufacturing system. Moreover, they emphasize thatthe Toyota Way is not a collection of rules but a method for thinking about howsystems work and evolve.
Our goal is not to restate these findings but to take them as given andexplain how the Toyota Way applies to supply chain design and management.The focus is not limited to the production system; it also extends to the supplychain. One word of caution: when the authors initially inquired how Toyotamanages its supply chain, we were greeted with bemused expressions. As wespoke with several people within and outside Toyota, the reason for that reac-tion became clear—Toyota considers itself part of the value chain. Therefore,asking company representatives how they manage the company’s supply chain islike asking people how they manage the circulation to their feet.
As many people have said in the past, grand ideas by themselves do notmake a Toyota. Even a casual observer will agree that Toyota did not arrive at theworld markets all of a sudden but, as is common to many things that Toyotadoes, they arrived continuously over time. You only have to visit Toyota’s Web
The Toyota Way of ManagingSupply Chains
Chapter 11
site that describes its mission and also includes numerous statements over time4
to obtain a sense of the continuous developments. Considering the fact that 30 million Corollas have been sold in more than 140 countries, it is still easy toidentify the Corolla on the road in any part of the globe; however, it’s hard tovisualize all the design changes, supply chain reconfigurations, and channelchanges that have accompanied the global expansion of the production of thatsophisticated car since its introduction in Japan in 1966. On its Web site, Toyotaattributes the success to “the evolving elements of the ‘Corolla DNA,’ which hasbeen passed down from generation to generation within the Toyota MotorCorporation.” The Corolla has indeed arrived over time.
As Toyota has globalized, the organization has felt it necessary to documentthe philosophy and goals that have enabled it to develop into the leader in manu-facturing and supply chain management. The Toyota Way document (2001) wasproduced to keep the “Toyota DNA” strong as Toyota expanded globally.Similar documents were produced at Toyota Sales to record the history of thesales organization as well as to state the current understanding of the ToyotaWay. Introducing the Toyota Way, Fujio Cho, president of Toyota MotorCorporation, said that Toyota is “preparing to operate as a truly global companyguided by a common corporate culture.” The booklet identifies the “company’sfundamental DNA.” Cho urges every Toyota team member to “take professionaland personal responsibility for advancing the understanding and acceptance ofthe Toyota Way.”
After we wrote several chapters and conducted interviews with managerswho were familiar with the Toyota system and Toyota’s supply chain, we saw thatover and above simply using the ingredients of the Toyota Way the supply chainseemed to be capable of evolving and developing as challenges arose. Toyotamanages to keep the supply chain focused on the tasks ahead, and they do soover a long period of time. We recapitulate the ideas used by Toyota in thisregard from previous chapters. We also describe Yokoten—a method used topropagate best practices across the supply chain. We also compare the methodsembedded in the Toyota Way to other planning, control, and process improve-ment methods that have been proposed and adopted by manufacturing andservice organizations worldwide.
The ability to quickly identify problem patterns and solutions reminds usof a study by Herbert Simon and Jonathan Schaeffer5 of ordinary chess playersand grand masters. In their study, a feasible set of positions of 25 pieces on a chessboard were shown to ordinary chess players and grand masters for 5 to 10 seconds. Grand masters could replace more than 90 percent of the pieces correctly, while ordinary chess players replaced fewer than 30 percent. However,if the 25 pieces were placed randomly on the board, both groups could replaceabout 30 percent. In other words, when problems evolve following a pattern of
Toyota Supply Chain Management148

moves, seasoned managers can identify issues rapidly and thus evolve solutionsquickly. The Toyota Way, by emphasizing the use of specific problem-solvingapproaches, is designed to enable such pattern recognition and problem solving.One of the authors of this book, Roy Vasher, described a visit by a senior Toyotaexecutive to a facility in Kentucky he had never visited before. Despite a longplane ride that preceded his trip, the man walked through the plant soon afterhis arrival and identified problems based on his prior experience. The ability torecognize patterns of evolution enabled him to get to the root causes of theproblem rapidly.
The Essential Ingredients of the Toyota WayThe ingredients of the Toyota Way are unique and effective. To sequence theirdescription, this chapter’s layout follows Liker’s approach. Examples specific tohow Toyota applies these principles to managing its supply chain are drawnfrom previous chapters in this book. The trade-offs that are implicit in makingthese decisions are also illustrated.
Long-Term PhilosophyWe believe that our fundamental mission is to contribute to the economyand society through creating value, mainly by manufacturing high-qualityproducts and providing related services.
—Toyota Way document
The long-term philosophy of the Toyota Way is to create value for customers,suppliers, and the society.6 That view is consistent with the idea of maximizingsupply chain surplus. For example, we often hear that a firm should buy from alow-cost supplier and not from one whose price is low. A supplier who drops theprice to gain business may not necessarily increase supply chain value. But, a low-cost supplier is always likely to increase supply chain value if demand is suffi-ciently inelastic. Chapter 7 revealed that instead of simply opting for a low-costsupplier, Toyota views value creation as a joint effort toward increasing suppliercapabilities and reducing costs. Interviews with current Toyota managers DavidBurbidge, Gene Tabor, and Jamey Lykins reinforce the notion that Toyota’s collaborative approach aims to solve problems and reduce costs and, thereby, prices.In Chapter 5, we saw that great emphasis is placed on heijunka. That chapterexamined how Toyota keeps demand stable by using the 80/20 rule; these effortshelp in the identification of problems and create value for all participants in thesupply chain.
Likewise, we have heard and read about the pros and cons of price promo-tions. The famous case of Campbell’s promoting chicken soup during the winter
The Toyota Way of Managing Supply Chains 149
has made the rounds of every college and boardroom. By promoting demandjust when it is high, the supply chain experiences a double dose of spike indemand: one due to natural factors and the other due to forward buys that aremade to take advantage of the drop in price. Keeping prices steady certainlyimproves planning and efficiency. Data show that Toyota’s promotion cost forcars is under $700 versus over $2,000 for other domestic manufacturers. Stableprices also permit a focus on increasing value as a way to sell the product. Thatidea is at the core of Toyota’s philosophy, which goes beyond the average present-day corporation’s goal of maximizing “short-term” profit (or the net presentvalue at a steeply discounted rate). Instead of forswearing price promotions,Toyota attempts to increase value at the same price, thus forestalling competitivemoves to grab market share. The trade-off is obvious once it is articulated. Alow-cost strategy does not necessarily provide competitive edge into the future.However, accompanied by value-creating activities that are made possible by astable system, the strategy continuously pushes the technology frontier out andkeeps competition at bay.
Long-term philosophy goes beyond making profit. Value creation mightprovide the right focus. Supply chain planners need to consider how customervalues might change over the next 10 to 15 years. The focus of Toyota on thedevelopment of hybrid vehicles and on green manufacturing is an example oflong-term philosophy described in this book and elsewhere that at first glanceseems to contradict the goal of profit maximization. The Toyota Way documentstates: “current trends are assessed in light of a long-range vision of as much asten years.”
Managers might wonder how to formulate such a problem in the profitmaximization framework and how to make choices regarding the timeline ofplanning and what method to use for accumulating and comparing cash flows.What are the discount factors? How to evaluate the risk-return trade-offs? In aninterview, Katsuaki Watanabe, Toyota’s president, provides a rare insight intomaking the trade-offs.7 Watanabe mentions the three keys to long-term health:improve product quality, keep reducing costs, and develop human resources. Heexplicitly mentions that “we have to create a stronger foundation at every stageof the supply chain.”
Readers might pause and reflect that these principles are probably easy tofocus upon in isolation but not in combination. Watanabe goes on to say thatthe focus of current investments in new products, new technology, and humanresources is improving quality. Thus, an explicit prioritization is made. We haveseen that in previous chapters too: customers first, dealers second, and the plantthird. (As early as 1937, Kiichiro Toyoda, the founder of auto making at Toyota,set the price to dealers based on market price rather than cost. The Toyota Waydocument quotes: “The price for the dealer is to be 2,400 yen regardless of
Toyota Supply Chain Management150

cost.”) What does that prioritization do? Basically, Toyota makes the trade-offsobvious. If a firm’s focus is on only one idea of self-interest, such as growth, thatfirm can neglect its supply chain obligations. Every Toyota manager realizes thatthe obligations do not go away; instead, they are ranked as subordinate goals. Byspecifying that Toyota’s products will be among the top three products consid-ered by every customer while making a purchasing decision, the planner is con-strained to make choices that fit the long-term goal of creating value. The ToyotaWay document includes this statement: “Prioritization: Priorities are establishedand resources concentrated for the greatest possible outcomes.” It also urgesdecision making to focus on continuous improvement and optimization as awhole company overcoming barriers among functions and organizations.
As a final example of this thinking, we quote: “Toyota now stands at thethreshold of unprecedented transition in the race for survival in the 21st century.We must be careful not to become complacent through our past achievements,but unite and take on the challenges of the new world.”8
Right ProcessThe Toyota Way emphasizes having a good knowledge of the process beforeattempting to improve it. It insists on standardizing work. To many people,standardizing work in order to improve it often seems to be a contradiction,until one takes the teachings of W. Edwards Deming and Joseph M. Juran9 intoaccount. What is the purpose of standardization if the intent is to change theway work is done?
The statistical process control theory proposed by Juran states that everyprocess has natural variations. It is impossible to try to control natural (i.e., trulyrandom) variation, whereas it is important to look for variation that is system-atic. Thus, a standard process is one that is in control, stable, and, if it has to besatisfactory, also capable of meeting the customer’s requirements. Moreover, inorder to determine whether improvements should be aimed at reducing the natural variation or the systematic causes, it is necessary to isolate the twosources of variation: random and systematic. The techniques and solutionsrequired for dealing with each source of variation, random and systematic, aredifferent. In the section on learning, we shall see that one of the pitfalls of fastlearning is associating incorrect causes to effects because it leads to superstitiouslearning—that is, falsely associating success to irrelevant causes, such as touch-ing one’s nose before entering an office will lead to a good day at work.
Indeed, even the journey of feedback regarding this book from Toyota wastransformed into a process by Nancy Banks, our liaison at Toyota. The first stepthat was necessary was for us to get a signed contract from the publisher so thatToyota could be sure we were serious about the book and had a detailed plan.
The Toyota Way of Managing Supply Chains 151

Next, we shared drafts of the overall details with potential managers before wemet them. A visit to the plant was included in our trip so as to ground the aca-demic authors of the book into plant realities. All interviews were exchangedwith appropriate managers to ensure that their perspectives were reflected accu-rately. Finally, after style edits, the final copy was sent to Toyota for review. Thisprocess was designed to guarantee flow only if necessary, and managers con-tacted had specific roles that were directly related to chapter descriptions. Inother words, the designed process had a goal of being efficient while maximiz-ing our value creation writing this book.
The Toyota Way goes one step further. It proposes to design, plan, and exe-cute processes so that variations and scope for improvement become evident. Tothis end, the definition of the right process is enlarged to include steps that weinterpret using our v4L framework.
Managing Velocity Using Continuous Process FlowBy making the flow in the supply chain at the global level even and uniform tothe most practical extent, the designers of the supply chain are able to detect sys-tematic variations quickly. This detection is based on managing random varia-tions using well-designed systems and processes that adjust to the randomvariations with small and permissible perturbations. Chapters 4 and 5 revealedhow adjustments are made continuously as more accurate information becomesavailable. Possible adjustments are prioritized, with volume adjustments beingthe most difficult to make. Volume adjustments require overall consensus,whereas parts that are supplied from nearby sources can be adjusted withinpreset limits. So, if the mechanisms that have been prescribed to address varia-tions fail to match demand and supply, then it is a signal that a systematic shifthas occurred. The dealer interview describes how data regarding product vol-umes and appropriate sales stimulation are continuously shared between Toyotaand dealers. The inbound logistics process describes how milk runs ensurepickup in small volumes from suppliers on a continuous basis. All of theseprocesses ensure a flow view of the entire supply chain.
Managing Visibility Using a Pull SystemThe pull system is used to link successive production units together. Clearly, in asupply chain the role of a pull system is to match demand and supply by linkingthe flow of information to the flow of material. The extraordinary simplicity ofhaving suppliers that are located in close proximity to the plant minimizes theneed for coordinating activities at the operational level (but not at the planning
Toyota Supply Chain Management152
level). The pull system is also Toyota’s way of executing so that variations becomevisible. Let us take for example the famous seat supply case,10 in which a supplierdelivers seats to the assembly line. As cars leave the paint area, a signal is sent tothe seat supplier that indicates the seat required. Seats are made in the order inwhich the signal is received and delivered by truck to the assembly line just-in-timefor the seats to be put in place at the final assembly lines. In the normal course ofthings, a few seats might be damaged and a few might not fit the car. However,the case describes a situation in which not only do several cars wait in the “clinicarea” following assembly for replacement seats but also no one seems to be awareof the seat problem. Has the pull system failed? One view is that the problemsaccumulate because of the pull system. Another, and our view, is that the pullsystem worked. It has revealed systematic problems that need to be addressed. Oneor more seats waiting is to be expected because of random variations. Several carswaiting for replacement seats is a sign that something has gone wrong.
But how does the supply chain benefit by forcing the seat supplier or a tireand wheel assembly supplier to produce with a pull system? It forces the supplierto standardize the process, to level production, and to make its own suppliersdeliver in a smooth fashion. Thus, if a critical part holds up production, the Toyotaengineers as well as the seat supplier become alerted to the problem early. Thebenefit of managing random variations using the capabilities built into the systemsis that it allows for an early warning of truly systematic problems. Moreover, itbrings to bear the expertise of the supply chain community to solve problems.
Managing Visibility Using Visual ControlsVisual controls have several purposes. The first is to make problems visible, thusenabling the team member to recognize variation and forcing a decision to bemade within a given time. If the decision cannot be made by the team member,the case is deemed to be a special one and should be escalated. In a supply chain,as we have seen, it includes setting limits on the mix variations allowed andusing visits to suppliers and dealers to understand their processes. Toyota MotorCorp. Chairman Fujio Cho recently extended the definition of going to see theproblem to, “Have you seen it yourself?”11 We have also described the practiceof sending engineers to visit suppliers and dealerships. That customary actionreveals the second purpose of visual controls, especially in a supply chain: tolearn about different systems firsthand. One might wonder how much firsthandlearning is necessary to manage supply chains. We shall address this issue in thesection on The Theory of Learning. A third purpose of visual controls is to pro-vide transparency to any observer regardless of function or ownership. TheToyota Way document states: “We share a common understanding of actualconditions by using visual controls.”
The Toyota Way of Managing Supply Chains 153
Managing Visibility by Leveling the WorkloadHeijunka—the leveling of the workload—serves many purposes. First, it is aprerequisite to having continuous flow and pull production. Second, at thesupply chain level, it reduces artificial demand fluctuations, or the bullwhipeffect. Third, it provides visibility into systematic changes such as shift in prod-uct mix or slowing of demand, and allows the planner to use rate-based plan-ning techniques. It allows the match of production and sales rates (using theconcept of takt time). Thus, heijunka along with mix planning are keys to main-taining a stable supply chain. As Chapter 3 revealed, a mix strategy does notmean that the same product mix needs to be produced and supplied to everydealer in the world. The supply chain allows each dealer and each region to focuson the 80 percent that sells the best. At the national and even the regional level,the variations accumulate and are accommodated through careful planning to fitthe overall sales goals. Thus, what is produced is a much larger set than what issold at the dealer. That is another wonderful example of allowing local (orrandom) variations and adapting to them at the central level, where the control isbetter and planning more precise. Moreover, heijunka when applied to sales trendsprovides a quicker signal of bigger and more difficult issues to manage, such as therecent drop in sales of Tundras and the upswing in demand of the Prius. Everysupply chain manager, if asked which is more difficult to manage, mix or volumefluctuations, can use Toyota’s principles to articulate the trade-off precisely.
In an interview, Katsuaki Watanabe gives yet another use of heijunka,namely, in managing risk. It is difficult to respond to global shifts in demand.How does one supply more cars to the hot market in China or trucks in theUnited States and at the same time practice heijunka? The Toyota solution is touse production capacity in Japan to smooth out production. How does thatwork? Suppose we make the following assumptions: There will always be upsand downs in individual global markets, but collectively, these fluctuations willtend to cancel each other out. However, in order to meet an upswing in China,it might not be possible to supply from the relatively slow U.S. market (fortrucks) due to logistical problems as well as the tremendous effort required toretool the plant. Instead, a very flexible factory in Japan can be utilized to supplythe upswings. Watanabe calls this concept “global-link production.” The advan-tage is that all plants are used fully, demand is met, and flexibility is tested.
Managing Variability by Stopping the Line to Fix ProblemsThe virtues of stopping to fix problems are well known. In a supply chain, thatmethod might not work the best. In the seat example above, it is not possible tostop the line to fix the problem each time a defective seat is noticed. Doing so will
Toyota Supply Chain Management154

take too long and be too costly. Does that mean one gives up the principle? Whatexactly is the logic behind stopping to fix the problem? There are two concerns: (1) The link between cause and effect becomes attenuated the longer the correctiveaction is postponed. (Try an exercise in recall: go back and read the first hundredpages in this book; then try to recall what exactly you were reading prior to revisit-ing those 100 pages.) (2) Unless production or supply is halted, the problem isnever given the priority it requires for a permanent solution to be found. The latterissue is more subtle. It is possible to record problems so that the information is notcompletely lost, which addresses the first concern. But how would one design asupply chain that focuses attention on the special causes that need to be addressed?How should causes of root problems be uncovered and eliminated permanently?
Watanabe provides an example of how to do so in a supply chain. Soon afterhe took over as president of the company, several quality problems arose.Engineers were instructed to find the root cause. The investigators found thatthe problems were due to either design defects or insufficient lead time. Theydecided to experiment thoroughly and test a large number of prototypes. Inresponse, Watanabe states, “I will not allow the same problems to recur.” Hehalted several projects just as workers do when they stop production.
When we visited the Toyota plant in Kentucky, we were told of anotherinstance where this seemingly bullheaded persistence of eliminating defects pre-vailed. The problem was with the canopy of the Solara convertible; the firstcanopies delivered to Toyota had many quality defects. The supplier of thecanopies had moved close to the plant and set up a facility to supply exclusivelyto Toyota. The root cause required several changes to the management style andpractices of the supplier. A senior manager at the plant was told to work withthe supplier exclusively until all root causes were eliminated. The managerworked for several months at the supplier plant before returning to Toyota.
Managers usually seem perplexed when we discuss the idea of finding per-manent cures. In response, we tell them to find the most important cause forproblems and address it. That effort requires a combination of the prioritizationmethod (i.e., customer first, suppliers and dealers second, and factory last) aswell as tools to uncover the systematic issues that need addressing. Moreover, itrequires halting production once a threshold limit is exceeded, thus signaling aspecial case. The three have to be used in combination. The Toyota Way docu-ment provides guidance as “Focus on Concrete Proof/Exhaustive DueDiligence: Actions are undertaken only after thorough study and testing todetermine what must be done.”
Managing Variety Using Standardized TasksMost firms have realized the importance of standardizing tasks; however, thedegree of standardization often stops at the tasks that directly relate to producing
The Toyota Way of Managing Supply Chains 155

a product or, to a lesser extent, service. For example, how to machine a part isoften documented at length simply because an industrial engineer and a stop-watch can achieve the desired end. But how does a worker load a truck? Howare invoices filled? How are cars driven to the parking lot? In what sequence arelights switched on or off at a factory or office? How is food ordered for a meet-ing? People who work on projects are often frustrated by competing demands.How does one standardize their tasks? Help them prioritize?
The unfortunate problem is that 85 to 90 percent of the tasks in most supplychains are not performed according to a standard procedure. Many of these tasksinvolve repetitive activity such as loading and unloading trucks, moving materialin and out of warehouses, scheduling a route for picking up parts, and schedul-ing deliveries to dealers. In various chapters we have described these activities. Inorder to standardize pickups, a determination would need to be made as to howmany deliveries are necessary from each supplier. Then, the trucks would berouted so that those that have similar frequency are picked up together. Doing sowould allow the operator to find the route and routine that works the best. Theoperator can then be tasked with improvement of the process.
Wherever task standardization is difficult, it is possible to standardizerecording and reporting so that similar activities can be compared across multi-ple locations or with the same reference framework. Toyota uses reports on oneside of a standard A3 sheet in the same format to record problems and solutions.For example, if a heavy load needs to be moved across one plant to another, itshould be possible to quickly access how it was done previously or at a similarlocation.
Standardization also facilitates the transfer of successful practices across thesupply chains. The Toyota Way document puts it like this: “Successful practicesare adopted as standard and then transferred, spread, and entrenched in theorganization to leverage their effect.” Moreover, standardization facilitates coor-dination; for example, if there is a fire in the supplier’s factory (see the descrip-tion of the Aisin Seiki episode in Chapter 10), a rapid response to the crisis ispossible. Solutions can be brought to bear quickly because there is familiaritywith operations and operating systems.
Task standardization also enables senior managers to recognize issues wellbefore they go out of control by matching evolving patterns, similar to theinnate capacity of chess grand masters.
Managing Variety Using Reliable TestedTechnology That Serves People and ProcessesThe planning and control systems we have described are simple but effectivebecause they serve people and processes. Many of the planning systems used at
Toyota Supply Chain Management156

Toyota combine simplicity and visual controls into powerful tools. For example,new production lines are created virtually through use of ergonomic design inthe workplace. The program can identify such issues as excessive bending,requirement of excessive force, and tools that cannot reach recesses. Spreadsheetsthat use color codes are utilized to plan the mix of cars to ship to differentregions in Europe. Parts are associated with each car to be assembled in the pre-cise sequence. Toyota is also not averse to using the most advanced technologyif it serves people and processes. With the most recent technology, the car thatleaves the paint line signals the seat producer.
This emphasis on serving people and processes does not preclude experi-mentation. Often design projects begin with several parallel paths until carefulexperimentation leads to pruning and convergence on the technology.12
Applying the Above Process Design PrinciplesWhen inventories accumulate in a supply chain at different stages, they makedemand less visible and the reaction to changes slower than if there were lessinventory. (This topic is covered in detail in Chapter 13.) Inventory mightindicate a slow-moving product, defective items, problems with transportation,picking and packing bottlenecks, and the like. To keep products flowingrequires a synchronized supply chain, with each stage and each player not onlyknowing what to do but also when and where to deliver. Handoffs must bemade perfectly.
Now, imagine that the supply chain designer attempted to level out theflows to a large extent. Miraculously, many decisions that are difficult wouldbecome easier. For example, if the volume of shipments to a region were rela-tively stable, or the inbound transportation needs were relatively stable, thenthese activities could be conducted on a fixed schedule. Thus, visual controlscan be used. It is possible to standardize tasks, such as where to stop, what toload first, where to unload, where to drop off documents, and whom to con-tact for a problem or suggestion. Real problems surface quickly, because devia-tions become visible. For example, if deliveries had to leave a warehouse withintwo hours and were color coded by the time of the day, then identifying andfixing problems would be easy. But in order to do that, the work flow wouldhave to be stable and standard; otherwise, the manager would be firefighting to handle temporary surges with no permanent solution to the real problem,which is the demand surge (other than adding flexible capacity). Similarly,when a substantial degree of work is standardized, it is possible to use reliableand tested technology that serves your people and processes. Changes are easily evaluated. They can be studied in a controlled environment to see if the impact is substantial and then adopted into practice after being vetted by
The Toyota Way of Managing Supply Chains 157
Toyota Supply Chain Management158
a team. The team itself is aware of many of the issues, even before studying the problem.
Consider, for example, the use of recyclable containers. Even though the con-cept is simple, it is hard to evaluate the costs in a nonstandard environment. But ifevery shipping quantity and frequency were known, if the loading and unloadingmethods were specified, and if the routing patterns of the trucks were well estab-lished, then one could figure out the optimal size of the containers, the requirednumber of containers, the change in loading and unloading patterns, and the addi-tional cost to ship back the containers. It is no wonder that Toyota implementedthis idea smoothly and with visible improvements within a short span of time.Thus, reliable and tested technology does not mean it has to be “boring,” “tradi-tional,” or “inferior”; rather, it clearly balances requirements in the system.
In an increasingly complex world Toyota has continuously adapted itsprocesses to deal with complexity in a small but cumulative manner. One of themajor innovations that supports these process innovations is the concept of avirtual supply chain. How does this process compare with the production plan-ning techniques found in the literature? Consider first Materials RequirementsPlanning, or MRP. One of the drawbacks of MRP is that it does not includescheduling details that allow the planner to visualize how the system will workat a given point in time. Any manufacturing planning system that uses a “timebucket” that is greater than the rate at which operations take place requires anadditional system to synchronize the flow of parts into each vehicle as it getsproduced. Rate-based planning is also often inadequate for scheduling complextasks because it fails to observe the discrete handoffs in scheduling. Thus, bothMRP and rate-based planning methods miss out on certain details. However,Toyota’s system that assigns parts to each car exactly in the required sequencecombines the virtues of both systems. That illustration of visual controls is alsoan illustration of an innovation that combines the best of ideas available insupply chain management.
Developing Your People and PartnersAt a very broad level, Toyota believes that continuous improvement and respectfor people are at the core of its philosophy. Careful reading of the Toyota Wayguidelines reveals what is meant by respect: respect for customers, respect forsociety, respect for suppliers and dealers, and respect for employees. The ToyotaWay document puts it this way: “Our Company owes its existence to the sup-port and satisfaction of customers, stockholders, employees, business partnersand host societies who derive benefit from the added value Toyota provides. Ourcontinued success depends on providing ever-greater satisfaction of customersby placing their interest ahead of all others.”

Toyota commits to creating value for everyone. The commitment is genuine,based on numerous anecdotes and historical evidence. These commitments areas follows:
■ Time is to be used effectively. “A person’s life is an accumulation of time—just one hour is equivalent to a person’s life. Employees provide their pre-cious hours of life to the company, so we have to use it effectively;otherwise, we are wasting their life.” (Eiji Toyoda, former chairman ofthe Toyota Motor Company)
■ The nature of relationships is long term. For example, one of the authorsasked why a particular joint venture in India gave only a 10 percent shareto its local partner. The answer was that the partner was “terrific.” Thesenior manager added that the local partner was expected to graduallyearn enough to buy a larger share of the venture.
■ There is a commitment to make partnerships work. (See, for example, thediscussions in Chapter 7.) Among the many courses of action pursuedby Toyota is dispatching senior managers for months to improve opera-tions. The key issue is not just respect but also a commitment to createvalue for everyone.
Whether a relationship is transactional (one-time interaction) or relational(multiple interactions over time) depends to a great extent on respect. But thatis not the only determinant; another is improvement, which counterbalancesrespect. Look at it this way: transactional relationships are like meetings betweenstrangers in New York City who honk at each other from their cars. They existand create friction. That very friction might make such relationships work wellby making people cautious of venturing too close to another car. But when rela-tionships happen over a long time, honking at the other person whom you knowwell (e.g., a coworker or fellow student) and whom you will meet every day isfrowned upon. Relational partnerships cannot tolerate rudeness or disrespect;however, respect must be counterbalanced by demand for improvement andcontribution to the joint venture. If it is not, the incentive to stay abreast of thesystem as well as the changes in the environment will go away.
This focus has yet another implication. Continuous improvement can beviewed as improving a person or an organization. The Toyota Way states: “Webelieve each individual has the creative power for the independent achievementof his or her personal goals. We respect the values, abilities, and way of thinkingand motivation of all team members.” The Father of the Toyota ProductionSystem, Taiichi Ohno13 is quoted in the Toyota Way document as saying that“work is a contest of wit and wisdom with subordinates.”
Employees at Toyota are asked to think as if they were two levels higher inthe organization. Toyota prefers to give broad targets or vague instructions
The Toyota Way of Managing Supply Chains 159

instead of rules. That approach is used, in our viewpoint, to inculcate the habitof assessing and setting one’s own goals. That practice is fundamental to learn-ing about how the system works. For example, asking a supplier to reduce thenumber of deliveries of water to an office might not lead to the most creativesolution; a better approach would be to ask how to provide drinking water thebest way.
Toyota uses five kinds of subjective criteria to evaluate managers. One ofthem emphasizes how results were obtained; others look at the trust and respectthe manager has earned. Takeuchi, Osono, and Shimizu14 suggest that thedesired characteristics include willingness to listen and learn from others, enthu-siasm for making continuous improvements, comfort with working in teams,ability to quickly solve a problem, interest in coaching other employees, andmodesty. Clearly, these are not only fuzzy criteria but somewhat contradictorybecause quick solutions to problems do not seem consistent with modesty anda willingness to listen and learn. They provide great scope for developing people.
The system aims to develop exceptional people and teams, who will followthe philosophy and understand the system, by challenging them and helpingthem improve, both within Toyota and also in the extended network of partnersand suppliers. Toyota uses many methods for helping its suppliers under-stand and adopt the company’s way (see Chapter 7). In two fascinating articles,Ward and others and Tae-Hoon15 describe the different levels of relationshipsthat Toyota has with different suppliers. Those relationships range from suppli-ers that are given almost complete design freedom to suppliers who are given theentire design by Toyota. No matter which relationship is utilized, once thedesign is finalized, the production processes always seem to follow the morerigidly crafted Toyota Way principles.
How does one interpret that approach? We can use the framework devel-oped above: different suppliers might have attained different levels of under-standing of Toyota’s system. That provides a different way of viewing strategicsourcing. Strategic sourcing (or supplier scorecards) is a term used to signify twoaspects of sourcing:
1. Enormous effort is invested prior to selection of a supplier, but unless thesame level of effort (or more) is maintained, the supplier tends to slacken.
2. It is impossible to maintain the same level of communication and relation-ship with all suppliers—some might be more important than others, from astrategic consideration viewpoint.
A third consideration based on the Toyota Way might be the degree offamiliarity that a supplier has with both the buyer’s and the seller’s organizationand organizational processes. Thus, the knowledge and stage of development ofthe supplier is another consideration, strategic or not.
Toyota Supply Chain Management160
Womack16 in his weekly e-mails shares some aspect or other about lean pro-duction. His recent e-mail provided the following anecdote: “Many years ago,when I first visited Toyota in Japan, I had dinner with the purchasing directorand asked how he could be sure that Toyota was getting good performance fromits suppliers when only two suppliers were employed for a given category of needand when Toyota relied on target pricing rather than supplier bids. ‘How,’ I asked, ‘do you know you aren’t getting ripped off?’ After an incredulous look,he answered, ‘Because I know everything—every aspect of every value-creatingprocess—running from raw materials at suppliers through Toyota’s operations.That’s my job.’”
Continuously Solving the Root CausesHow does continuous improvement take place in a supply chain? In our view,continuous improvement is learning and implementing the lessons learned;thus, much of what has been written about continuous improvement can besubsumed into the broader context of organizational learning. As we shalldemonstrate, many of the methods used by Toyota in its effort to make contin-uous improvement happen are grounded strongly in theory.
The Toyota Way document states: “Learning is a continuous, company-wideprocess as superiors motivate and train subordinates; predecessors do the samefor successors; and the team members at all levels share knowledge with oneanother. Every team member should be motivated to learn for his or her owndevelopment.”
The Theory of LearningHuber17 writes about four learning-related constructs: knowledge acquisition,information distribution, information interpretation, and organizationalmemory. The reader can clearly identify how Toyota institutionalizes learningalong each of these constructs from the following:
Spear18 describes the gradual induction of a manager into the Toyota Wayof experimentation and continuous improvement. The manager is gradually ledinto learning the workings of the system through direct observation (knowledgeacquisition). Spear also recounts that the trainer concluded the training byhaving the manager present his findings to the plant manager, the shop man-ager, and group leaders. “Two-thirds of the audience actively took notes,” notedSpear (information distribution). Thus, sometimes direct observation is substi-tuted with structured formal presentations. Then the trainer taught the managerhow to structure experiments with a carefully reasoned hypothesis; for example, ifthis change were made, it would change cycle time by six seconds. The objective
The Toyota Way of Managing Supply Chains 161

of this exercise was as much to improve the system as to learn the workings ofthe system. Is the cause-effect relationship clear? Are there important variableswe have forgotten to take into account? The next lesson was to make small incre-mental changes. Once again, the purpose of this cautious but exploratoryapproach is to minimize the risk of overlooking some aspect and learning aboutthe system before moving to the next step (information interpretation). Finally,during the entire training the student was guided but never given direct answers.Toyota deploys coaches over a long period of time who are not only the reposi-tory of the lessons learned but also the chief conduits for passing them on to thenext generation of managers (organizational memory).
In addition, theory emphasizes the role of communication and the implica-tions of the learning rate as described below.
The Role of CommunicationFor a giant organization such as Toyota, communication is critical in order tolearn. The structure of Toyota is very complex. Its informal information systemmirrors that complexity. Takeuchi, Osono, and Shimizu19 write that informationflows freely up and down and across the hierarchy. Employees are urged to “listenintently in an open environment.” Senior salespeople share information withdealers and learn from dealers by talking to them. Toyota’s word for lateral com-munication is yokoten. Yokoten means “open out sideways.” Toyota has a globalstrategy to ensure yokoten. They have a matrix organization structure to ensurethat processes are standardized by the functional area. The management for eachaffiliate is responsible for day-to-day operations, but the functional managementis responsible for yokoten of processes. Figure 11-1 illustrates the structure. Thisis the “Guiding Hand” concept used by Toyota to spread the best supply chainpractices not only to the parts of the supply chain internal to Toyota but also todealers, suppliers, and contractors. The spread of practices is coordinated top-down. Herbert Simon20 writes that “an important component of organizationallearning is internal learning—that is, transmission of information from one orga-nizational member to another. Individual learning is very much a social, not asolitary, phenomenon.” Takeuchi, Osono, and Shimizu21 list ways that communi-cations are reinforced and employees and supply chain partners are keptinformed. They include giving freedom to people to voice contrary opinions,having frequent face-to-face interactions, and making tacit knowledge explicit.
Learning Rate ImplicationsA classic problem studied by researchers from many fields is how firms allocateresources to the exploration of new possibilities versus the exploitation of known
Toyota Supply Chain Management162
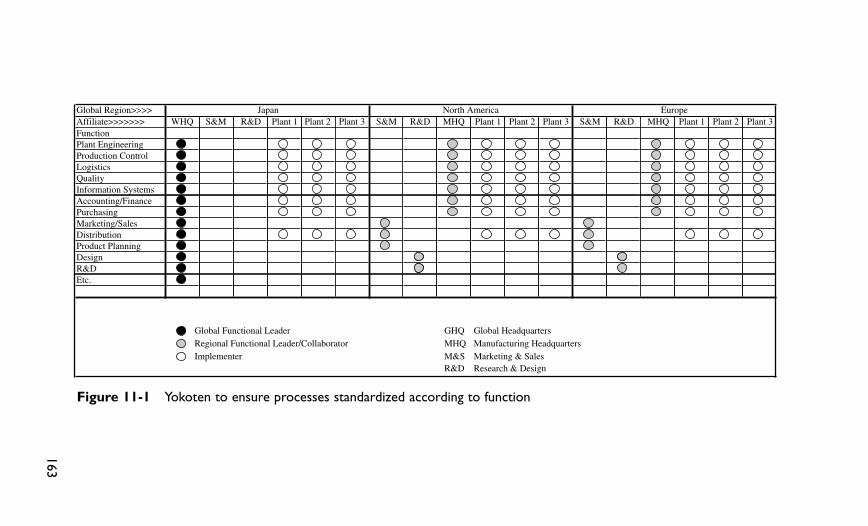
163
Global Region>>>>Plant 3
FunctionPlant EngineeringProduction ControlLogisticsQualityInformation SystemsAccounting/FinancePurchasingMarketing/SalesDistributionProduct PlanningDesignR&DEtc.
MHQ Manufacturing HeadquartersM&S Marketing & SalesR&D Research & Design
Europe
Global Functional Leader
Japan North AmericaAffiliate>>>>>>> WHQ S&M R&D Plant 1 Plant 2 Plant 3 S&M R&D MHQ Plant 1 Plant 2 Plant 3 S&M R&D MHQ Plant 1 Plant 2
GHQ Global HeadquartersRegional Functional Leader/CollaboratorImplementer
Figure 11-1 Yokoten to ensure processes standardized according to function

certainties. The returns of exploration are more long term, uncertain, and there-fore risky. As March22 puts it: what is good in the long term is not always goodin the short term. What is good for one part of an organization is not alwaysgood for another part of the organization (or the whole organization), and whatis good for an organization is not always good for the society. “As organizationslearn from experience, this distribution of consequences across time and spaceaffects the lessons learned,” says March. If distances are smaller, feedback isquicker. Thus, experiments that are more local and about the near term providefeedback quickly and tend to reinforce the “local” aspect of learning. Because ofthese differences, organizations that learn through feedback gained from experi-mentation and sharing knowledge of outcomes (or adaptive processes) tend toimprove exploitation rather than exploration. As organizations specialize andbecome more and more competent at exploitation, they tend to stay with whatthey do best. Thus, organizations might gain competence in inferior activities atthe expense of not switching to a superior activity. This effect is passed on toother firms with whom the firm interacts. There is also the effect of excessivespecialization. Specifically, in the models proposed by researchers, agents are“trapped by immediate positive feedback from competence within a rathernarrow domain.”23 For these reasons, March posits that organizations mightwant to control learning, and he suggests some ways of doing so.
For example, slow learning might preserve sufficient diversity amongemployees, thereby preserving exploration until convergence of ideas occur.Slow learning also avoids false association of causes to events (in the theory oflearning, that is called “superstitious learning for obvious reasons”). In manyplaces, we see the emphasis on slow learning in Toyota’s supply chain. Marchalso suggests that a modest amount of turnover preserves the heterogeneity untilnew employees are socialized into the organization and provided with the impetus for exploration. Too little turnover leads to greater homogeneity andless deviation from the “norm,” whereas substantial turnover dissipates learning.Toyota provides “turnover” by rotating its employees through a variety of tasks.
Even though a modest amount of turnover is good, rapid socializationreduces the impact of new thinkers on the organization. Therefore, employeesshould be brought up to speed slowly. At Toyota, even suppliers and dealers arebrought up to speed and attain full partnership slowly. Simon writes that “tasksof management are quite different in organizations that can recruit employeeswho are pre-fashioned, so to speak, than they are in organizations that wish tocreate and maintain, along some dimensions, idiosyncratic subcultures.” If theidiosyncratic aspect we wish to create is “systems thinking,” then Toyota’s man-agement has a formidable task. If it is protecting the bastion, then bureaucratictraining might be necessary. If anyone can step in and do the job, then a massproduction approach with limited on-the-job training might suffice.
Toyota Supply Chain Management164
Nevertheless, Toyota faces the risk of excessive exploitation by its supply chainpartners and thus has to inculcate similar thinking into each of its partners. Thatfact might explain the “vague” instructions given to its partners. For example,Toyota might ask a supplier to “explore the range of improvement possible.” Letus say the possible improvement is a 20 to 30 percent reduction in weight. Thesupplier might come back and present what it has learned about the design andwhat can be achieved. The target is then gradually narrowed down. As a generalmanager has said: “This process allows the (user) to understand trade-offs and settargets to produce the best possible design.”24 In universities, we train our Ph.D.students in a similar fashion. We give them vague targets, such as, “See what thisassumption does” or “Can you relax this?” or even, “You may have forgotten some-thing.” Many times, the student comes back and suggests, “You said, ‘Try doingthis,’ but I found something else”—we are looking for such opportunities to learn.
Herbert Simon25 elaborates that in some cases research ideas get constrainedby the market and customers; in other cases the needs of the customers are wellknown and the flow of ideas is in the opposite direction. In the former case,research can be facilitated by setting goals that have an element of explorationin them and by getting feedback on the results, both anticipated and otherwise.Simon acknowledges that for such transfer of ideas to occur, disparate groupsneed to respect one another’s skills, understand the others’ problems, and actu-ally have experienced, in sufficient numbers, the other groups’ activities andprocesses. For example, in a recent client engagement, one of the authors hadthe opportunity to work with a team member who had worked for several yearswith the client in many of the client’s businesses. The person could be reliablycounted upon to draw upon his experience and write down a business processin 85 percent of its detail. We realized that the remaining 15 percent could behad only by observing the processes at work! People were using rules written andunwritten to make decisions. Only by asking them for daily feedback based onour replication of their work were we able to uncover another 14 percent of therules. The last 1 percent still eludes us.
The Practice of LearningLearning requires optimism and the spirit to take up challenges. The Toyota Waydocument states that: “We accept the challenges with a creative spirit and thecourage to realize our own dreams without losing drive or energy. We approachour work vigorously, with optimism and a sincere belief in the value of our con-tribution.” It challenges its supply chain partners in a similar way and expects tobe challenged by them.
Toyota provides a system where thinking pervades the organization. More-over, Toyota has spread these ideas throughout its supply chain in its leadership
The Toyota Way of Managing Supply Chains 165
role. Its approach to learning conforms to the theory of learning that has beenreferenced in this book and can be described as follows:
■ Create awareness. Unless problems are seen, they will not be solved. Theeffort at raising awareness involves systems to report ideas, problems,deviations, and potential issues to one’s direct contact with no delay.
■ Establish capability. Unless a person is capable of solving a problem thatmight arise within the system boundaries set for him or her, that personwill be unable to contribute to solving the problem or for recognizing theneed for specialized help.
■ Make action protocols. Actions have to be taken within a set of constraintsand conform to certain standards. Doing so will help in the identifica-tion of the relationship between action and results. It will help codify theknowledge for future use. It will help to engender communication usingthe same language, format, and similar content.
■ Generate system-level awareness. As more and more experience is obtainedat solving problems, greater awareness needs to be instilled about otherareas that might be affected or that might impact one’s own performance.
■ Produce the ability to teach. As more and more system-level awareness and experience accumulates, the capability to teach others about thesemethods needs to be created.
The practicality of Toyota’s approach to learning is not only in establishingrules but also in translating thoughts to action. Managers at Toyota are taughtthat problems by themselves are frustrating unless people are shown a way tosolve them. The problem must be well defined, the goals measurable, and theproblem solvable in a given time with given resources. Likewise, learning shouldbe accomplished systematically. That part of the Toyota Way emphasizes thepracticality of making learning possible. Only by experimenting and scientifi-cally understanding the dynamics involved can one master the supply chain.
In addition to learning through experimentation, Toyota learns vicariously,using secondhand sources and anything else it can lay its hands on. The ToyotaWay document states, “We search for outstanding ideas inside the company andin the larger business community, regardless of their authorship, and investigatethem thoroughly. Benchmarking is used to measure Toyota’s accomplishmentsagainst those of other leading companies.” And: “We continue to search forbreakthroughs, refusing to be restrained by precedent or taboo.”
Toyota realizes that mastering thinking for the long term is important. Howdoes one accomplish goal setting in the long run? It is easy to have small suc-cesses if learning and problem solving as described previously are accomplished;however, it is very difficult to measure success and failure in the long run. Evenif an overall direction is available, the goals might seem far away and irrelevant
Toyota Supply Chain Management166

unless these ideas are applied over the long run. That keeps the focus on creat-ing value and moves attention away from action to planning. Once a “long-term” problem has been identified, all the steps mentioned previously should beused to ensure that employees remain targeted and motivated. Therefore, it isimportant to break up the goal into targets.26 Make it specific. Make peoplecapable. Take action systematically. Think systemwide after each step. Pass onthe learning. Make sure that each target is achievable with the available resourceswithin the allowed time. For example, productivity improvement is a long-rungoal. Simply exhorting employees to be more productive not only does not leadto results but it also results in frustration. Asking managers to reduce costs orimprove productivity is too general a directive. The Toyota method emphasizesthat targets be as specific as possible. If the manager or worker cannot controlcost, then the endeavor will not be motivating. Therefore, the target has to bemeaningful and focused. With regard to productivity, Toyota has many long-term goals. For example, Toyota sets a measure of hours of labor per car. Apotential target would be: make labor per car 5 percent better.
Internal competition is used to set standards and compare achievableimprovements. The target is made more specific by classifying labor into differ-ent categories: (1) labor actually making the product, (2) labor team leaders(supervisory), (3) maintenance, (4) accountants and purchasing, and so on.Different targets are set for different classifications.
Coordination and LeanGoing back 20 years, the national bestseller The Machine that Changed the World:The Story of Lean Production by Womack, Jones, and Roos devotes three chaptersto supply chain coordination, dealing with customers, and managing the leanenterprise. The main ideas in these chapters have been translated into action inthe Toyota supply chain setting. It is worth recapitulating the key differencebetween lean and mass production approaches to dealing with these three issues.“Don’t be fooled into thinking that Western suppliers have been moving towardlean supply. They have not. . . . Indeed, without a fundamental shift away from apower-based bargaining relationship, it is almost impossible to move toward leansupply.” In an almost fatalistic statement, the authors conclude the chapter onsupply chain coordination with, “How can the Western post-mass-productionsupply system move toward true lean supply? We suspect that the key means willbe the creation of lean-supply systems in the West by the Japanese producers.”
In the chapter on customer relationships, they write that coordination isessential even in distribution. Thus, lean manufacturing by taking away the luxuryof excess enforces careful planning to coordinate every activity. The present-dayefforts toward customer relationship management seem to reflect these concerns.
The Toyota Way of Managing Supply Chains 167

In the last of three prophetic chapters, Womack, Jones, and Roos write aboutthe emergence of the global enterprise. They note that Toyota trailed Honda andFord. Today, Toyota’s global presence rivals that of these firms. It seems to us thatthe principles of the lean production system underlie a great amount of the suc-cess of Toyota and other firms that have adopted them. Nevertheless, people areat the core of achieving these successes. As support to these ideas, we summarizebelow an e-mail from the chairman of the Lean Enterprise Institute (LEI) to allsubscribers:
Many firms have introduced lean tools, starting with value stream mapping,then attending conferences and performing experiments on lean. We do notmean that the rules are meaningless or that if they are practiced to less thanperfection, the results will be a disaster. As an example, look at the LeanEnterprise Institute (www.lean.org) that has advocated lean thinking for overa decade. Their “Five steps of lean implementation” are as follows: “specifyvalue, map the value stream, and make the remaining steps flow, let the cus-tomer pull, and then pursue perfection relentlessly.” Many organizations haveadopted some (or most) of these steps. For example, according to a survey by Industry Week/Manufacturing Performance Institute 2007 Census ofManufacturers, 17.8 percent say continuous improvement programs led to amajor increase in productivity and 67.2 percent report some increase.27
As John Kerr wrote in his summary of Lean: “Despite the difficulty ofimplementing a lean system, companies have begun to consider it as a process-improvement tool, not just for manufacturing, but also for everything fromtransportation management to accounting. The beauty of the lean philosophy isthat it focuses everyone on what matters, which is what the customer needs.This means that everything else is seen as non-essential and therefore as a costthat can be taken out, whether it is buffer stock or a business process thatrequires multiple manual sign-offs.”28 Despite the tremendous gains to be had,he cautions that several experts consider the PDCA cycle to be the hardest tofollow because it is people intensive. He also suggests that lean production canbe adopted by any manager.
ConclusionLiker in his book on the Toyota Way summarizes at the very end the choice thatmanagers have to make when deciding whether to treat the process managementideas of the Toyota Way as a toolkit or to adopt the Toyota Way to transform theorganization into a learning enterprise. He frames the question on whether thefocus is toward short-term success or long-term building of a top-notch learn-ing organization.
Toyota Supply Chain Management168
Somewhere in this debate it seems the humble beginnings of the ToyotaWay have been forgotten. Taiichi Ohno started with changes on the shop floorand they spread outward to the rest of the organization and outside it. Forexample, in the initial stages, Liker writes that Toyota did not have the bar-gaining power to convince suppliers to do things its way. All Toyota couldoffer was the opportunity to “grow together and mutually benefit in the longterm.” Even when Toyota became powerful it did not forget these beginnings.It views new supply chain partners cautiously. Matching value and commit-ment is essential before the supplier, dealer, designer, or contractor is takeninto the family. Despite this caution, it has managed to grow. Despite thefocus on the details, the Toyota supply chain functions as a single entity witha common purpose. Despite the long haul, it continues to produce superbsupply chain players.
The sustained learning, growth, and adaptation of Toyota never cease toamaze bystanders. The Toyota Way is a small description of Toyota’s endeavorsto create a world-class organization. Our description of it is an even smallersmall subset. We have tried to set out what we have learned by following itsways, albeit incompletely.
Endnotes1. Yasuhiro Monden, Toyota Production System: An Integrated Approach to
Just-In-Time, 3rd ed. Atlanta: Engineering & Management Press, 1998.2. Jeffrey K. Liker, The Toyota Way. New York: McGraw-Hill, 2004.3. Kiyoshi Suzaki, The New Manufacturing Challenge: Techniques for
Continuous Improvement. New York: The Free Press, 1987.4. www.toyota.co.jp/en/vision/message/index.html.5. Herbert Simon and Jonathan Schaeffer, “The Game of Chess,” in
R. J. Aumann and S. Hart, eds., Handbook of Game Theory, vol. 1. New York: Elsevier Science, 1992.
6. See, for example, the statement of the corporate philosophy on Toyota’sWeb site: www.toyota.co.jp/en/vision/philosophy/index.html.
7. “Lessons from Toyota’s Long Drive: An Interview with KatsuakiWatanabe,” Harvard Business Review 85, no. 4 (July–August 2007): 1–10.
8. Words of Hiroshi Okuda, as reported in the Toyota Way document,speaking in December 1995 after being appointed president in thesummer of 1995.
9. Dr. Deming and Dr. Juran were the foremost leaders in the quality movement during the last century. Both of them contributed significantlyto Japan’s emergence as a world-class manufacturing nation.
The Toyota Way of Managing Supply Chains 169

10. Kazuhiro Mishina, Toyota Motor Manufacturing, U.S.A., Inc. Boston:Harvard Business School Publishing, 1992.
11. Hirotaka Takeuchi, Emi Osono, and Norihiko Shimizu, “TheContradictions that Drive Toyota’s Success,” Harvard Business Review 86,no. 6, (June 2008): 96–104.
12. Allen Ward, Jeffrey K. Liker, John J. Cristiano, and Durward K. Sobek II,“The Second Toyota Paradox: How Delaying Decisions Can Make BetterCars Faster,” Sloan Management Review, Spring 1995, 43–61. See also ParkRae-Hoon, “Hierarchical Structures and Competitive Strategies in CarDevelopment: Inter-organizational Relationships with Toyota’s First-,Second- and Third-Tier Suppliers,” Asian Business & Management 6 (2007):179–198, for the choice between postponement and speculation strategies.
13. Taiichi Ohno was an employee of Toyota. He wrote several bestsellingbooks about the Toyota Production System.
14. Hirotaka Takeuchi, Emi Osono, and Norihiko Shimizu, “TheContradictions that Drive Toyota’s Success.”
15. Allen Ward, Jeffrey K. Liker, John J. Cristiano, and Durward K. Sobek II,“The Second Toyota Paradox: How Delaying Decisions Can Make BetterCars Faster,” Sloan Management Review, Spring 1995: 43–61; and ParkTae-Hoon, “Hierarchical Structures and Competitive Strategies in CarDevelopment: Inter-Organizational Relationships with Toyota’s First-,Second- and Third-Tier Suppliers,” Asian Business & Management 6(2007): 179–198.
16. James P. Womack is the chairman and founder of the Lean EnterpriseInstitute. He is a coauthor of the bestseller The Machine That Changed theWorld,” along with Daniel T. Jones and Daniel Roos. Boston: MIT Press,1991.
17. George P. Huber, “Organizational Learning: The Contributing Processesand the Literatures,” Organization Science 2 (1991): 88–115.
18. Steven J. Spear, “Learning to Lead at Toyota,” Harvard Business Review 82,no. 5 (May 2004): 78–86, 151.
19. Hirotaka Takeuchi, Emi Osono, and Norihiko Shimizu, “TheContradictions that Drive Toyota’s Success.”
20. Herbert A. Simon, “Bounded Rationality and Organizational Learning,”Organization Science 2, no. 1 (1991): 125–134.
21. Hirotaka Takeuchi, Emi Osono, and Norihiko Shimizu, “TheContradictions that Drive Toyota’s Success.”
22. J. G. March, “Exploration and Exploitation in Organizational Learning,”Management Science 2, no. 1 (1991): 71–87.
23. D. A. Levinthal and J. G. March (1993), “The Myopia of Learning,”Strategic Management Journal 14 (1993): 95–112.
Toyota Supply Chain Management170

24. Ward et al., “The Second Toyota Paradox.”25. Herbert A. Simon, “Bounded Rationality and Organizational Learning.”26. Christina Fang and Daniel Levinthal, “The Near-Term Liability of
Exploitation: Exploration and Exploitation in Multi-Stage Problems,”working paper, Stern School of Business, New York University, NY, 2007.
27. Jonathan Katz, “By the Numbers: Of All Firms Responding to theIW/MPI Census of U.S. Manufacturers,” IndustryWeek, December 1,2007, www.industryweek.com/ReadArticle.aspx?ArticleID�15327&SectionID�10.
28. John Kerr, “What Does ‘Lean’ Really Mean?” Logistics Management,May 1, 2006, www.logisticsmgmt.com/article/CA6334579.html.
The Toyota Way of Managing Supply Chains 171

This page intentionally left blank
173
The underlying principles associated with managing variety, velocity, andvariability across the supply chain—the focus of Toyota’s supply chainleadership and management process—are found in many different
industrial contexts. We provide several examples from service industries such ashealth care, insurance, banking, credit processing, and retailing. Products andservices covered include apparel, wine, brake linings, emerging market productdevelopment, concrete delivery, and more. In each of these cases, a supply chainleadership strategy delivered superior performance. If you are fired up and eagerto develop your individual industry application using the Toyota supply chainprinciples, this chapter offers several different application prototypes.
Banking ExampleGoland, Hall, and Clifford1 provide a description of how the application ofToyota principles to banking can yield significant results. They describe theback-office check processing operations for a bank that faced capacity shortfallsand demands for added capacity to process checks. A couple of managersdecided to follow the “Journey of Chuck the Check” by mapping the stepsinvolved in processing checks at the bank. What they discovered was astound-ing. More than 45 percent of the time, the check processing machines sat idle.Though checks could be sent for processing two times a day, most banksaccumulated checks and sent them in at the end of the day. Even when process-ing, the machines were subject to breakdowns, and checks had to be processedmore than once.
How to Apply Toyota WayPrinciples to Nonautomotive
Supply Chains
Chapter 12
Clearly, the process was not streamlined, and the capacity issues observedreflected deeper underlying problems. The managers then went back to the banksand worked to streamline the procedure of separating checks in batches beforethey were sent for processing. Checks that needed additional time at the bankbefore they were sent were kept until the evening, while others were shipped outearlier in the day. This smoothing of flows permitted the arrival of checks to thesorting facility to be better synchronized with capacity demands. Next, the bot-tleneck: check sorting equipment and its operation were examined and providedwith additional resources to ensure its availability during peak demand periods.
The impact was faster check processing and lower capacity utilization, thusproviding additional capacity to provide check processing capacity for otherbanks. What was a source of problems due to capacity-related congestion wasnot only improved with regard to service, but it was also converted to a revenueopportunity. Continuous improvement in this context would include examin-ing the process to identify sources of waste and scope for increasing value to cus-tomers. Such process changes can lead to learning more about customer needsand supplier technologies leading to further cycles of PDCA.
Hospital ExampleMango and Shapiro2 provide an application of Toyota supply chain principles toa cardiothoracic facility. Demand at the facility directly related to arrivals ofpatients for service. Capacity referred to the number of operating rooms or bedsavailable for a step in the process. Time to complete a step varied based onpatient- and doctor-related variables. The facility had frequently become a bot-tleneck, with patients kept waiting for surgery.
The typical process for a patient at the cardiothoracic facility involved:going to the operating room, then sometimes to the surgical anesthesia intensivecare unit or the cardiothoracic intensive care unit, followed by a step-down unit,then to a general unit, and discharge. The system discharged about five patientsper day, and demand exceeded capacity about 30 percent of the time.
A closer examination of the system showed that the time for surgery variedbetween 283 and 368 minutes, but when separated by surgeon, the time becamequite predictable. Thus, rather than build in variability as buffer time, thesystem scheduled the right amount of time based on a surgeon’s characteristics.Such a planning approach increased utilization and kept appointments on track.
The next variability observed was large demand surgeries on Fridays. Acloser examination showed that many people who developed chest pains overthe weekend went to see their primary care physician on Mondays or Tuesdaysand arrived at labs for testing a couple of days later. Thus, Fridays became abottleneck for operating rooms. The hospital decided to examine patients and
Toyota Supply Chain Management174
prioritize surgeries based on the type of blockage. That step spread out thedemand for operating rooms over the whole week. Finally, when a surgery wascompleted, the hospital created SWAT teams to clean and sterilize the operatingroom to return it to use.
The net effect was a streamlined facility with smoothed flow, reduced vari-ability for surgery times, and quick turnaround of bottleneck operating roomresources. Indeed, all of the elements of a Toyota supply chain thought processare illustrated in this example.
Continuous improvement might address further reduction in waste ofpatient and surgeon times, scheduling follow-ups and obtaining feedback, andthe like. That step would in time create opportunities to kaizen supplier opera-tions, service provider operations, and technology introduction.
IBM CreditHammer and Champy3 provide a classic example of how changing the processcan improve performance. The example concerns the credit division of IBM.This department was used by IBM salespeople to offer credit terms to businessesthat agreed to purchase IBM software or hardware.
The original system consisted of a series of steps. First, orders were takenover the phone by customer service representatives. Those orders were passedalong to a business department that focused on loan covenants based on busi-ness contexts. That step was followed by a credit check. The next departmentdetermined pricing. Finally, an administrator generated a letter providing alldetails and pulled together all related paperwork. That material was thenexpress-shipped to the salesperson. The average lead time for the entire process,from start to completion, was eight days, but the observed time took as long astwo weeks.
A couple of senior managers at IBM Credit decided to personally walk acredit request across all departments and discovered that the actual processingtime was 90 minutes, while the lead time (as mentioned earlier) was as long astwo weeks. The source of all of the delays was the batch and queue mode ofoperation, as each transaction waited at a step until its cohort batch of orderswas processed, and then waited in line to start the next step.
A closer examination of the process showed that about 20 percent of thetask types accounted for 80 percent of the volume. A careful standardization ofthe process for the 20 percent converted the steps into a menu-driven systemthat could be completely managed by one person. These generalists thus took acredit request from start to finish for 20 percent of the standard credit requests.Of course, standard rates for such requests may have potentially increased the risk of bad debts. The remaining 80 percent of requests that accounted for
How to Apply Toyota Way Principles 175

20 percent of the volume were still handled by specialists. The net result of sucha triage mode of operation was to increase the volume of credit requests handledby a factor of 100 (100 � old volume) while decreasing head count slightly.Clearly, redefining processes, changing work allocation, and standardizing taskssignificantly increased delivered performance.
Kaizen would probably start with continuous appraisal of client needs, cre-ation of a database to understand failures and long delays, further training inprocedures, and the creation of teams to identify and solve problems.
Ford Accounts PayableAnother example from the book by Hammer and Champy describes changesin the accounts payable process at Ford Motor Co. Ford’s accounts payabledepartment had 500 employees handling transactions. Their task involved rec-onciling three documents: the purchase order, the receiving document, and theinvoice.
In an attempt to streamline this department, Ford examined the accountspayable operation of a partner company, Mazda. Mazda operated its accountspayable department with five people. This stark contrast, despite company sizedifferences, suggested a need to redefine the process to reduce overhead.
The first step was to change the way product was received. All open pur-chase orders were included in a computer system. All receipts were against theseopen purchase orders only. Thus, reconciliation of the receiving document andthe purchase order was completed on receipt. Given this reconciliation, paymentwas scheduled as per the predetermined terms. This one change in the processreduced tasks for the accounts payable department significantly. In one section(engine components) the size of the staff decreased by over 80 percent.
The next change was to replace purchase orders with supplier-certified blan-ket purchase orders and vendor-managed inventory arrangements. Under thisscheme, as parts are used in assembly, they are replenished and vendor paymentsare scheduled. The net effect is to eliminate reconciliation of the purchase orderand receiving document with the invoice. Because this reconciliation is doneupon usage of components, the role of accounts payable changed to enable sup-plier monitoring and certification.
All of these changes synchronized steps across the supply chain and thusreduced the need for the overhead at accounts payable. That synchronicitydecreased capacity, increased efficiency, and thus improved overall performance.
Could the system be improved even further? Could suppliers be coaxed totake payments when cars are sold with their components? Under such an agree-ment, how would supplier designs change and what information would need tobe shared with suppliers? How would marketing campaigns have to be managed
Toyota Supply Chain Management176
to take into account supplier and OEM interests? Notice that all of these issuesdeal with continuous improvement in a synchronized supply chain.
The 7-Eleven Japan StoryWith sales of over $21 billion in Japan and inventory turns of over 55 along withgreater than 30 percent gross margins, management of 7-Eleven Japan’s supplychain,4 covering over 9,000 stores, provides a great case study of executionthroughout the day. The 7-Eleven Japan stores are located in residential areas,within walking distance from homes. Given the average small size of the stores,to have appropriate stockkeeping units (SKUs) in stock over the course of theday requires repeated store variety changes.
The process starts with information systems that detect customer choice ateach individual store. Analysis of individual stores and aggregation across storespermits shuffling inventory across stores to manage store-level variety and thusincrease SKU velocity. Store shelves are reconfigured more than three times aday to reflect demand preferences by time of day. While morning items mightfocus on breakfast-ready SKUs, the same store caters to dinners by the evening.Trucks are scheduled to make deliveries in 30-minute windows, and productsare unloaded and put away at stores without being checked against scheduleddeliveries. Delivery flexibility is ensured by adjusting transportation mode (thecompany uses motorcycles, boats, trucks, and helicopters). In one example ofthis flexibility, the company was reported to have used 7 helicopters and 125motorcycles to deliver 64,000 rice balls to the city of Kobe after a devastatingearthquake hit the area.
Managing inventory across stores enables the inventory impact of variabil-ity to be kept in check. Reshuffling SKUs through the course of the day enablesvariety to be synchronized with demand and demand velocity to be maximized.In short, 7-Eleven Japan provides a retailing example of Toyota’s supply chainmanagement.
It does not require great effort to imagine the scope for kaizen. For exam-ple, a metric that measures truck utilization, mileage, and on-time delivery on adelivery-by-delivery basis will uncover enough to start the PDCA cycle.
Rane Brake LiningsRane Brake Linings (RBL)5 has enacted changes that enable it to competeglobally as a manufacturer of brake linings. The company is a division of theRane Group and won the Deming prize in 2003. It is a major supplier of brakelinings to the Indian railways as well as to automotive companies. One of thecapabilities that RBL has developed that permits it to be a global competitor isthe ability to diagnose problems across the supply chain and solve system-level
How to Apply Toyota Way Principles 177
issues rapidly. One example of this capability involves the brake system providedto a two-wheeler company that experienced stickiness in the brakes. RBL wasthe brake provider that assembled the brake linings to stamped parts providedby a supplier. The resulting brake was assembled by the OEM into its product.Upon hearing of the issue faced by the OEM’s customers, RBL installed its ownengineers at every step in the supply chain. They then developed four differentdesigns over a 10-day period that carefully identified adjustments to the supplierstampings, adjusted the brake lining manufacture and assembly, and thenworked with the OEM to see that the parts were assembled appropriately at theOEM’s assembly operation. The net result was an improved brake system whilemanufacturing productivity was maintained. The ability to coordinate upstreamand downstream, develop multiple designs rapidly, and deploy the resultingdesigns suggests that there is a unique capability to synchronize across the supplychain. That ability to meld engineering design talent and manufacturing maywell be a competitive capability that enables RBL to compete globally.
Another capability that RBL has is its approach to maintaining productcosts through careful global sourcing. For example, one company was importingchemical inputs from Canada that were priced in dollars. There also was anopportunity to compensate for the rising dollar (at that time) by includingsources from Russia. The adjustment in product designs and approval wouldgenerate a cost reduction. But at the same time there was another effort toimprove productivity through a change in design of the existing product. Thephasing in of the new design and then the change in sourcing resulted in bothproduct design improvement as well as a cost reduction.
While Total Quality Management (TQM) approaches have not been shownto be profitable in many companies in mature markets, their success in emerg-ing and growing markets is a new story. RBL’s success after TQM implementa-tion and the associated productivity gains has enabled it to remain a strongcompetitor in the Indian market and engage effectively in global markets.
Progressive InsuranceThe typical insurance company operates its offices just during regular hours(ordinarily, 9 a.m. to 5 p.m.). Thus, when a client has an insurance claim, theclient’s call is usually recorded and followed by an attempt to contact the client.Following contact with the insurance company, the client is responsible, forexample, for taking the damaged automobile to a repair facility, renting a carwhile repair is being completed, submitting receipts, and paying the deductibleand thus completing the processing of the claim. The associated delays presenta challenge to clients since they are responsible for doing many of the steps nec-essary to get back to a normal state.
Toyota Supply Chain Management178
Progressive’s CEO Peter Lakrides had a different idea: “Process claimswhenever the client has a need and fulfill the need on site whenever possible.”6
Implementing this idea meant that customer service agents were distributed spa-tially in Ford Explorers around towns so that they could get to the site of an acci-dent quickly. The company invested in an information system that permitted alldata to be accessed wirelessly by the agent on site. Clients were offered theoption for a check cut on the spot of the accident to settle claims. If a client pre-ferred, Progressive took charge of the car, completed all repairs, and deliveredthe car to the customer. The customer was given a ride home with arrangementsfor a rental car to be provided. In short, Progressive became available when thecustomer wanted assistance.
The net impact was a significant market share increase for Progressive as ittargeted drivers who valued such superlative service. Because accidents wereobserved on site, both fraud claims and repair costs decreased. In short, improvedservice decreased overall costs, thus permitting increased profits. A supply chainview that takes the customer’s perspective has played a crucial role in Progressive’ssuccess.
Progressive can continue to improve with analysis of clients’ needs.Continuous improvement on these dimensions will require the most creativeproblem-solving teams imaginable.
Shouldice HospitalShouldice Hospital in Canada is often hailed as a great example of a service fac-tory. The genesis of this hospital was the observation by Dr. Shouldice duringthe period of World War II that hernia surgery, which was a nonemergency pro-cedure, was taking up three weeks of hospitalization during a time when hospi-tal capacity was scarce. However, in a single operating room, Dr. Shouldicecompleted surgery for about two hernias per day. The facility expanded toseveral more buildings, and all surgery now takes place in an 89-bed facility in Thornhill.
Shouldice Hospital has been dedicated to the repair of hernias for over 55years. The hospital focuses on the standard hernia surgery, staying away fromcomplicated cases that frequently involve older patients. The facility focuses onmaximizing the success rate by performing standardized steps, thus increasingthe learning curve benefits and associated success. The founder likens Shouldiceto McDonald’s, with its emphasis on standardized processes to produce its spe-cialties (e.g., fries at McDonald’s).
The hospital has spartan rooms with no entertainment. Surgeons meet thepatient on arrival and focus on surgery success. The large number of commonspaces and self-serve focus for patients encourages the view of the facility as a
How to Apply Toyota Way Principles 179
nonhospital environment. The hospital focuses on management of processesused in the operating system, care path and procedures as well as a dedicatedorganizational and physical design. As a result of its high volume, the system canoperate at low cost while delivering high quality. For example, hernia surgeriesat Shouldice average US$954, versus US$2,000 to US$4,000 elsewhere.
Analysis of Shouldice Hospital’s success suggests that the menu of servicesat the hospital limits what the facility does, but the volume of such activityenables increased success as well as speed. In addition, careful attention to detailand an emphasis on processes and efficiency put the focus on simplifying pro-cedures and kaizen. That results in a constant emphasis on improving theprocess by using data. The overall impact is high performance on the dimen-sions of cost and quality.
Although Shouldice is a well-studied example of a facility that performs aspecialized medical service (i.e., hernia operations), such focused operations arefound in other specialties. The Texas Heart Institute does bypass surgeries for$27,000 (which is $16,000 cheaper than the national average); it has a five-yearsurvival rate of over 92 percent, which is better than the rate at most other facil-ities. Likewise, Salick Health Care, Mid-America Dental, Hearing and VisionCare in Missouri, and the Mayo Clinic (which has a broader focus than theothers mentioned but is very process oriented) all provide examples of supplychain–like operations, like those used at Toyota, in the health-care industry.
Shouldice has kaizen built into its systems. Interestingly, the impetus forchange in procedures, processes, and equipment might also come fromShouldice’s “mass production” system rather than 100 percent top-down fromthe equipment designers or pharmaceutical firms.
ALDIALDI, a German-based retailer, is a “limited assortment discount internationalretailer.”7 The company was founded after 1945 and has global sales of over €33billion ($43 billion). It has more than 5,000 stores across Europe and Australiaand 600 stores in the United States. Unlike supermarkets that have between15,000 and 40,000 SKUs, ALDI stocks 700 items. These items are the most-needed, most-often-used products in the home. The store offers no baggingservice, no check cashing, and no special displays. Prices are 20 percent lowerthan at Wal-Mart. The company generates sales of €30 million ($39 million)per SKU versus Wal-Mart’s sales of 1.5 million per SKU. This figure is impres-sive, given that Wal-Mart is six times larger than ALDI.
The company keeps a sharp focus on price, and whenever a supplier lowersits price, ALDI’s retail price is lowered so as to maintain the lowest price in themarket. Executives in the company admit that adding 50 new items could
Toyota Supply Chain Management180

increase sales revenue by €1 billion ($1.3 billion), but the company limits itsassortment to 700 items. If any new items are added, existing ones are droppedto compensate. In many cases, the company produces its own brand, thusincreasing buying power.
In Europe, the retailer has 51 percent of the fruit juice market, 42 percent ofthe canned vegetable market, and 50 percent of the packaged and preserved meatsmarket. ALDI’s sharp focus on a small selection of SKUs (700) that constitutearound 80 percent of shoppers’ baskets, private label manufacturing that enablessupply chain efficiency, significant volumes that enable scale economies, lower pricepoints, and low service levels all create a unique and competitive retail environment.
Continuous improvement in this context would involve tracking changingcustomer tastes, more cost reduction, reduction of waste (e.g., in perishablegoods), and so on. The main metrics could be price compared to other storeswhile the most desired goods would be kept on the shelves.
Fujitsu Computer ServicesWomack and Jones8 describe the example of Fujitsu Computer Services and themanagement of its supply chain role for British Midland Airlines (BMI). WhenFujitsu Services started its contract with BMI, it was paid based on the numberof calls handled, and the focus was on the speed of processing calls.
But Fujitsu decided to analyze the calls and identify the reasons they weremade. It discovered, for example, that printer malfunctions accounted for a largepercentage (more than 26 percent) of calls. The problems arose with such thingsas printing baggage tags and boarding cards. Those issues translated into passen-ger delays, the need for backup printers, the necessity for quickly dispatchingcustomer service agents to fix the printers, and so on. The average time to fixthese errant printers was about 10 hours.
An analysis of the root cause of the problem, as well as the true impact onflight-related costs, suggested that BMI would have been better off spendingmore money on better printers. The new printers the company eventuallybought decreased calls by over 80 percent and cut down the time to fix printerproblems to less than three hours. A supply chain view enabled costs to bedecreased systemwide.
As a result, Fujitsu offered a new contract to BMI. The computer servicescompany would be paid based on the projected volume of calls but was free tofocus on system improvements that lowered overall costs. The result has been asystem in which Fujitsu monitors problems and anticipates issues before theyarise. In addition, by identifying customer issues, Fujitsu is able to develop newcustom products that can solve the customers’ problems and kaizen its supplychain operations.
How to Apply Toyota Way Principles 181

TescoTesco is a British retailer that has significantly improved its in-stock availabilitywhile decreasing inventories. While observed fill rates in grocery stores is 92 per-cent, Tesco’s systems ensure a fill rate of over 96 percent. Womack and Jones9
suggest specific steps taken by Tesco to improve its in-stock position.The retailer coordinates with large-volume suppliers for direct pickup from
its warehouses, cross-dock through its own warehouses, and delivery to stores.The quantities provided to stores follow a replenishment mode of operation alsoknown as a “pull system.” Replenishing sold products guarantees that the mix ofproduct shipped synchronizes with demand mix. Such a dynamic adjustment ofinbound shipments to synchronize with demand enables assortment matchingand thus ensures a uniform service level across SKUs. Shipping in quantities thatmatch demand also allows inventory levels to be lowered. But what is needed isan effective logistics system that can maintain efficiency by aggregating volumesacross stores to effectively use transport capacity.
The same approach has enabled Tesco to use a common back-end supplysystem to support multiple front-end retail formats. Tesco has local conveniencestores (Tesco Express), midsized stores (Tesco Metro), large stores (TescoSuperstore), hypermarkets (Tesco Extra), and Web-based stores (Tesco.com).Each of these retail formats is optimized to satisfy its customer base. But becausethey all share common back-end operations, it is possible to offer buying-effi-ciency-related pricing across these formats. In addition, collecting data fromcustomers with loyalty cards that can be used across formats enables a uniquewindow into the total shopping basket of customers.
Tesco’s multiformat supply chains suggest that it has a system similar toToyota’s common supply chain processes used to deliver different car experiencesto the customer and adjusted for different selling geographies across the world.The opportunities for kaizen are likewise numerous due to the common back-end system.
ZaraZara represents a new generation of supply chains in the apparel industry. Thefollowing anecdote regarding Zara says it all: “When Madonna went on tour inSpain in early 2001, she started in Madrid and ended in Barcelona 10 days later.The fashion that teenagers picked up from Madonna’s outfits were developed,manufactured and available in stores in Barcelona by the time the tour ended.This was a remarkable accomplishment, 10 days from design, development, andmanufacturing to store availability.”10
Toyota Supply Chain Management182

Zara is a multi-billion-dollar company with stores all over the world. TheSpanish company owns large sections of the apparel supply chain and managesthe entire chain to speed innovation and product availability. One secret is theconstant flow of customer requests and information from stores to the designstudios. Zara relies on a constant flow of product from plants to stores and doesnot replenish product.
The apparel firm sources the fabric from all over the world (e.g., Italy,China, Japan, and India). It owns its own cutting machines that cut the fabricin batches within each roll to minimize scrap. Independent sewing shops inEurope do all of the stitching. The apparel comes back to Zara where it isironed, packaged, and grouped by store. The company contracts with independ-ent trucking companies to distribute the products to stores that are solely ownedby Zara.
Customers expect fresh assortments every time they visit the store, and theydo not expect products to be in stock for a long time. By controlling most stepsin the supply chain, Zara is able to respond quickly to market trends. The degreeof vertical control at Zara also decreases the cost of errors in the forecast. ButZara may also have identified that having a fast supply chain enables it to chargea price premium for the market segment it targets. Reports indicate that it alsoleaves sufficient value for customers so that they return to the Zara stores farmore often than they do to competitors. In addition, Zara’s store managers keeptrack of customer requests for changes to existing designs and pass along thatinformation to buyers at Zara headquarters. That feedback from customers isincorporated, when appropriate, into new design changes that flow back to thestore.
In fact, Zara used the services of Toyota to design several of its operations.Zara’s kaizen during the season, fast cycle manufacturing, and control of thesupply chain have resulted in the synchronization of the supply of SKUs withdemand. That enables lower inventories and higher service levels and providesgreater value for customers.
Reflection PointsThe examples in this chapter show ideas related to the v4L framework appliedto different industries.
■ Variety is carefully chosen at Shouldice and ALDI in order to be able tooffer a distinct operational advantage and cost competitiveness.
■ Velocity of the flow of product at Progressive Insurance, IBM Credit, andFord Accounts Payable comes from a careful process design that ensuresrapid execution.
How to Apply Toyota Way Principles 183
■ Variability is managed at Rane Brake Linings, Tesco, Fujitsu, and thehospital and bank by smoothing flows, eliminating bottlenecks, andidentifying reasons for and adjusting plans to observed variability.
■ Visibility of data across the supply chain enables 7-Eleven Japan and Zarato offer rapid response and product changes that synchronize withdemand.
■ Learning is achieved by adopting systems to foster continuous improve-ment, and thus these firms can continue to deliver superior performancefor years to come.
Endnotes1. A. R. Goland, J. Hall, and D. A. Clifford, “First National Toyota,” The
McKinsey Quarterly, no. 4 (1998).2. P. D. Mango and L. A. Shapiro, “Hospitals Get Serious about
Operations,” The McKinsey Quarterly, no. 2 (2001).3. M. Hammer and J. Champy, Reengineering the Corporation: A Manifesto
for a Business Revolution. New York: HarperCollins, 2003.4. A. Ishikawa and Tai Nejo, “The Success of 7-Eleven Japan,” World
Scientific (2002).5. A. Iyer and S. Seshadri, “Transforming an Indian Manufacturing
Company: The Rane Brake Linings Case.” In Hau Lee and Chung-YeeLee, eds., Building Supply Chain Excellence in Emerging Economies. NewYork: Springer, 2006.
6. D. Bovet and J. Murtha, Value Nets: Breaking the Supply Chain to UnlockHidden Profits. Hoboken, NJ: Wiley, 2000.
7. John L. Mariotti, The Complexity Crisis: Why Too Many Products, Markets,and Customers Are Crippling Your Company and What You Can Do About It.Avon, Mass.: Adams Media, 2008.
8. J. T. Womack and D. Jones, “Lean Consumption,” Harvard BusinessReview (March 2005).
9. Ibid.10. “The Future of Fast Fashion,” The Economist (June 18, 2005): 57–58.
Toyota Supply Chain Management184

185
The beer game was introduced as an exercise in industrial dynamics in1960. And what has beer to do with automobiles? The beer game isused as a fun way to illustrate some of the pitfalls of operating a supply
chain. Certainly, beer gets the attention of students. Even though the productused in the game is beer, the processes are similar to most supply chains, includ-ing those involving automobiles. This chapter will compare and contrast howthe original beer game is played versus how Toyota’s managers would play thegame, which will illustrate how Toyota’s processes can streamline the supplychain.
The Beer Game RulesIn the beer game, four players play the roles of managing a serial supply chainas a retailer, distributor, wholesaler, and factory. A schematic of the beer game isshown in Figure 13-1. The retailer is the only one who observes customer demand.Each player fills demands from the immediate customer: the retailer fills the cus-tomer orders, the wholesaler fills the retailer’s orders, the distributor fills the whole-saler’s, and the factory serves the distributor. Each player carries inventory, whichis represented by large shaded squares in the figure. Orders can be filled onlyfrom inventory in these boxes. The factory produces beer.
The game is played one week at a time. Each player receives orders and triesto fill as much as he or she can. If orders are not filled, they are backlogged andhave to be satisfied in the future. Each player then places orders for the nextweek. Players possess only local information about their inventory: the demandby their immediate customer and the orders placed to their immediate supplier.
The Beer Game and theToyota Supply Chain
Chapter 13

The goal for each player is to minimize the cost of holding inventory and ofbacklogged orders. Holding inventory costs $1 per unit per week, whereas back-logged orders cost $2 per unit per week. The team with the smallest sum of thecosts of the four players wins.
The time to receive orders from the immediate supplier is two weeks. So ittakes two weeks for orders shipped by the distributor to reach the wholesaler.Similarly, the delay in shipping is two weeks between the wholesaler and theretailer and between the factory and the distributor. The factory receives orderstwo weeks after they are planned for production. The small square shaded boxesrepresent these delays. Figure 13-1 shows that there are 8 units en route to eachplayer, 4 being one week away (on truck) and 4 more being two weeks away (ontrain). The game is played one week at a time.
Order processing delays are two weeks between players—for example, theorder placed by the retailer one week reaches the wholesaler two weeks later.These delays are designated in the illustration by the small square boxes withquestion marks in them. The question marks indicate that the data are revealedonly to the player and only when they are needed. To reiterate, the informationdelays between stages are two weeks each, and the shipping delay between stagesis two weeks each.
The instructions given to players are as follows:
■ The purpose of this game is to experience firsthand the flow of materialsthrough a distribution system. Teams of four people will work tominimize the total cost (both carrying costs and stockout costs) of thedistribution network. The four positions of the team members are retailers,
Toyota Supply Chain Management186
Retailer8 4 4
Wholesaler8 4 4 4 4
Factory8 4
4
Demand
? ? ? ? ? ?
orders orders orders
?
?
Beer Beer Beer
BeerProduction
orders
Truck Train Truck Truck
Truck TrainTrain
Train
4 4 4 4Distributor
8 4 4 4
4?
Truck TrainTruck Train
Cases of Beer
Information / Orders
Figure 13-1. Beer game information/order flowSource: Courtesy of Rene Caldentey, Stern School of Business, New York University.Used with permission.
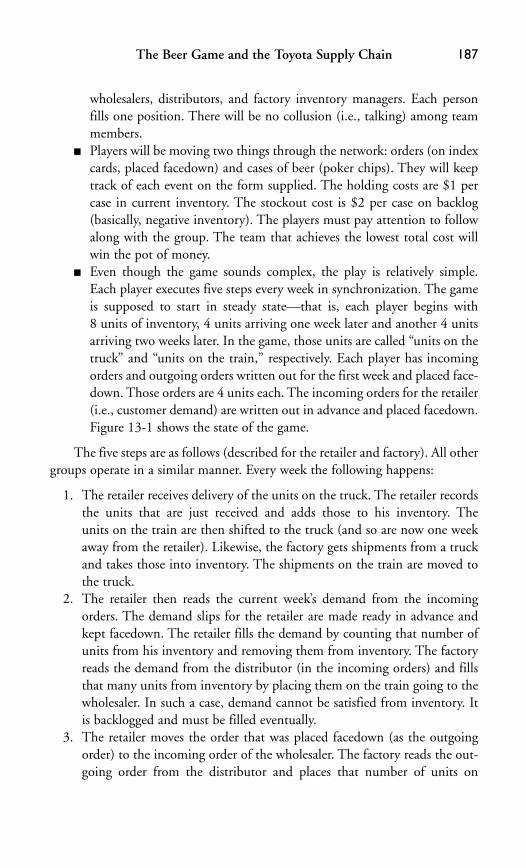
wholesalers, distributors, and factory inventory managers. Each personfills one position. There will be no collusion (i.e., talking) among teammembers.
■ Players will be moving two things through the network: orders (on indexcards, placed facedown) and cases of beer (poker chips). They will keeptrack of each event on the form supplied. The holding costs are $1 percase in current inventory. The stockout cost is $2 per case on backlog(basically, negative inventory). The players must pay attention to followalong with the group. The team that achieves the lowest total cost willwin the pot of money.
■ Even though the game sounds complex, the play is relatively simple.Each player executes five steps every week in synchronization. The gameis supposed to start in steady state—that is, each player begins with 8 units of inventory, 4 units arriving one week later and another 4 unitsarriving two weeks later. In the game, those units are called “units on thetruck” and “units on the train,” respectively. Each player has incomingorders and outgoing orders written out for the first week and placed face-down. Those orders are 4 units each. The incoming orders for the retailer(i.e., customer demand) are written out in advance and placed facedown.Figure 13-1 shows the state of the game.
The five steps are as follows (described for the retailer and factory). All othergroups operate in a similar manner. Every week the following happens:
1. The retailer receives delivery of the units on the truck. The retailer recordsthe units that are just received and adds those to his inventory. The units on the train are then shifted to the truck (and so are now one weekaway from the retailer). Likewise, the factory gets shipments from a truckand takes those into inventory. The shipments on the train are moved tothe truck.
2. The retailer then reads the current week’s demand from the incomingorders. The demand slips for the retailer are made ready in advance andkept facedown. The retailer fills the demand by counting that number ofunits from his inventory and removing them from inventory. The factoryreads the demand from the distributor (in the incoming orders) and fillsthat many units from inventory by placing them on the train going to thewholesaler. In such a case, demand cannot be satisfied from inventory. Itis backlogged and must be filled eventually.
3. The retailer moves the order that was placed facedown (as the outgoingorder) to the incoming order of the wholesaler. The factory reads the out-going order from the distributor and places that number of units on
The Beer Game and the Toyota Supply Chain 187
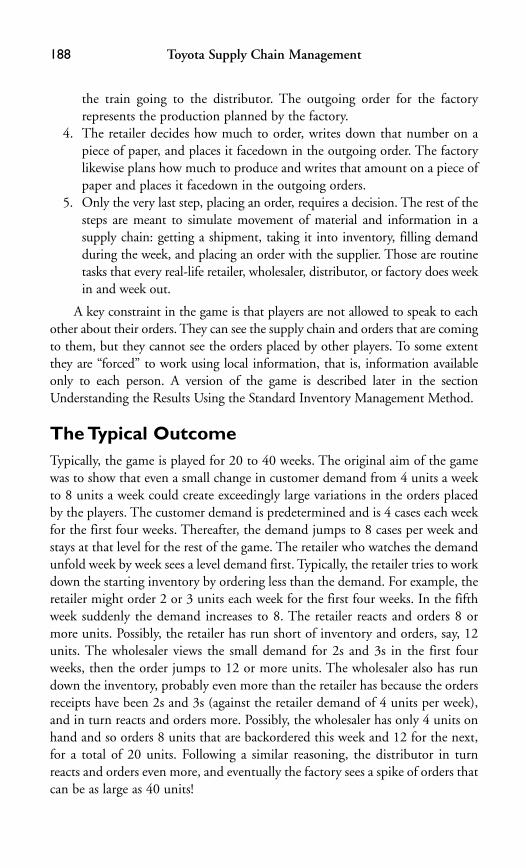
the train going to the distributor. The outgoing order for the factoryrepresents the production planned by the factory.
4. The retailer decides how much to order, writes down that number on apiece of paper, and places it facedown in the outgoing order. The factorylikewise plans how much to produce and writes that amount on a piece ofpaper and places it facedown in the outgoing orders.
5. Only the very last step, placing an order, requires a decision. The rest of thesteps are meant to simulate movement of material and information in asupply chain: getting a shipment, taking it into inventory, filling demandduring the week, and placing an order with the supplier. Those are routinetasks that every real-life retailer, wholesaler, distributor, or factory does weekin and week out.
A key constraint in the game is that players are not allowed to speak to eachother about their orders. They can see the supply chain and orders that are comingto them, but they cannot see the orders placed by other players. To some extentthey are “forced” to work using local information, that is, information availableonly to each person. A version of the game is described later in the sectionUnderstanding the Results Using the Standard Inventory Management Method.
The Typical OutcomeTypically, the game is played for 20 to 40 weeks. The original aim of the gamewas to show that even a small change in customer demand from 4 units a weekto 8 units a week could create exceedingly large variations in the orders placedby the players. The customer demand is predetermined and is 4 cases each weekfor the first four weeks. Thereafter, the demand jumps to 8 cases per week andstays at that level for the rest of the game. The retailer who watches the demandunfold week by week sees a level demand first. Typically, the retailer tries to workdown the starting inventory by ordering less than the demand. For example, theretailer might order 2 or 3 units each week for the first four weeks. In the fifthweek suddenly the demand increases to 8. The retailer reacts and orders 8 ormore units. Possibly, the retailer has run short of inventory and orders, say, 12units. The wholesaler views the small demand for 2s and 3s in the first fourweeks, then the order jumps to 12 or more units. The wholesaler also has rundown the inventory, probably even more than the retailer has because the ordersreceipts have been 2s and 3s (against the retailer demand of 4 units per week),and in turn reacts and orders more. Possibly, the wholesaler has only 4 units onhand and so orders 8 units that are backordered this week and 12 for the next,for a total of 20 units. Following a similar reasoning, the distributor in turnreacts and orders even more, and eventually the factory sees a spike of orders thatcan be as large as 40 units!
Toyota Supply Chain Management188

The factory might even produce as many as 60 units in response. Noticealso that the reaction is not simultaneous because of the delay in orders reach-ing each player. That sequence of overreacting stuffs the supply chain withunwanted material. Eventually, the players realize that they have overreacted,but it is too late. It takes quite a while (maybe even a year) to work down thesurplus inventory. The game is played for at least 20 weeks to demonstrate thebuildup of inventory and its gradual builddown. This phenomenon, in whicheach stage in the supply chain overreacts to changes in customer demand, hasbeen termed the “bullwhip effect.” This phenomenon has been widely docu-mented and studied. See, for example, the article on this subject by Lee,Padmanabhan, and Whang (1997),1 which is one of the top 10 most citedpapers in supply chain management.2
A plot of orders placed at different stages of the game in a typical experi-ment is provided in Figure 13-2. Notice the growth of spikes as orders aretracked from the customer to the retailer, then to the wholesaler, then to the dis-tributor, and then to the factory.
The beer game has been played internationally in management schools withstudents drawn from different programs: undergraduate, graduate, executiveeducation, and short programs. The results are always the same: The costsincurred by different players are very different from the “optimal” cost. Thedeviation in costs and the deviation in ordering and stocking pattern from theoptimal are systematic, thus illustrating the bullwhip effect. John Sterman, in his1989 article on the subject,3 analyzes the outcome as follows: he first suggests aheuristic (trial and error) to order cases in each week because the optimal rulecan be quite complicated. The heuristic performs quite well for the parametersof the game discussed above. It essentially involves making a correction for thedesired stocking level and a correction for the supply coming to the player. Theplayer orders the expected demand, plus a correction for the deviation in thestock from its ideal value and a correction for the deviation from the actual tothe ideal supply line (the supply coming to the player). In Sterman’s experi-ments, the optimal heuristic (the one with the best parameter values chosen bytrial and error) has costs that are 10 times smaller than the costs reported by theplayers. The same can be said about games that were played under our supervi-sion at different places and with different audiences.
How Would Toyota Play the Beer Game?This section describes how the beer game might be played at Toyota. First, weprovide a benchmark of how a “standard” inventory management methodapplies to the beer game; then we will provide the Toyota approach. The exam-ples used in the following paragraphs are very complex and beyond the scope of
The Beer Game and the Toyota Supply Chain 189
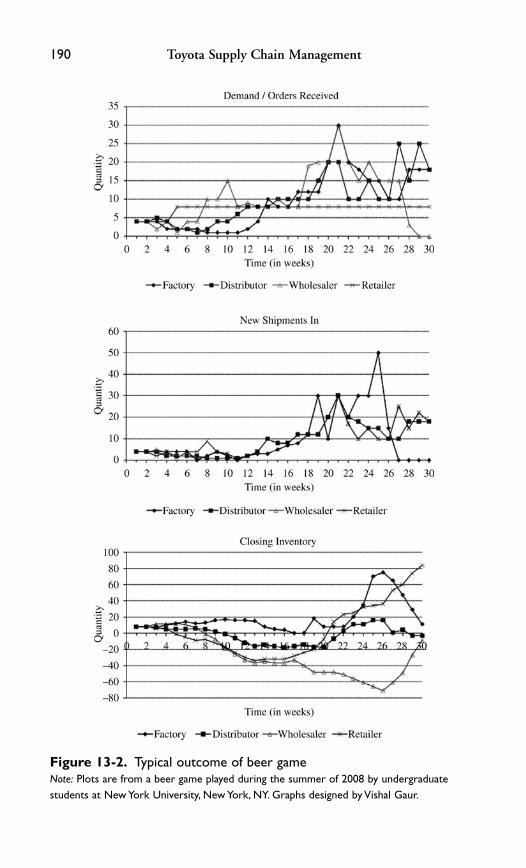
Toyota Supply Chain Management190
Figure 13-2. Typical outcome of beer gameNote: Plots are from a beer game played during the summer of 2008 by undergraduatestudents at New York University, New York, NY. Graphs designed by Vishal Gaur.

this book. We will briefly highlight some key figures in each example to exam-ine Toyota’s approach to the standard method; however, if you want to under-stand the logic behind the two approaches, you will need to analyze the logic ofeach example.
Understanding the Results Using the StandardInventory Management MethodFigure 13-3, which details the standard inventory management method, showsthat each player operates individually. Because the positions are symmetric, onlythe actions of the retailer are described; keep in mind that the rest of the play-ers act in a similar manner. The shaded line of the illustration shows the peri-ods. The demand is seen two lines below. It starts out at 4 per period untilperiod 10 and then jumps to 8 and stays at 8 for the rest of the game. Theretailer uses an “order-up-to” policy. He assumes that the lead time (LT) is fourperiods (a delay of two for the information to propagate and two for the physi-cal supply). He adds a safety stock (SS) of two weeks to that and computes thathis pipeline inventory (on hand plus on order) should be (LT � SS � 1), orseven weeks of supply. Each week he revises his demand forecast using a simpleexponential smoothing formula with a weight of (for example) 0.8:
The forecast for next week � 0.8 � the forecast made last week� 0.2 � this week’s demand
The retailer observes demand, adjusts next week’s forecast, uses the forecastvalue to compute the required pipeline inventory, and orders a quantity thatraises the end stock to the required value. For example, in period 11, thedemand forecast equals (0.8 � 4) � (0.2 � 8) � 4.8. The pipeline inventorydesired equals 7 weeks of supply (7 � 4.8), which equals 33.6. The end stockequals 20. Therefore, the retailer orders 13.6 units. Observe that this order raisesthe pipeline inventory to 33.6. Figure 13-3 reveals that this order reaches thewholesaler only in period 13 due to the communication delay. The wholesalerreacts with an order of 27.04. The distributor reacts in week 15 with an orderof 59.30 and the factory reacts with an order of 114.59 in week 17!
Note that the result of using the standard inventory management methodproduces the outcomes observed when the game is played.
At this stage, you might want to try to determine whether the simple butpowerful concept of learning through scientific experimentation can be repli-cated in a supply chain. Is it possible to learn Plan, Do, Check, and Act in asystem? What might be some of the prerequisites? The next section explainsbriefly how a supply chain leader achieves learning. We shall also see howToyota’s learning principles work when the beer game is played.
The Beer Game and the Toyota Supply Chain 191

192
DescriptionP 00 P 03 P 09 P 10 P 11 P 12 P 13 P 14 P 15 P 16 P 17 P 18 P 19 P 20 P 21 P 22 P 23
Retailer Pipeline Inventory Includes on hand and on order 28.00 28.00 28.00 28.00 33.60 38.08 41.66 44.53 46.82 48.66 50.13 51.30 52.24 52.99 53.59 54.08Demand 4.00 4.00 4.00 8.00 8.00 8.00 8.00 8.00 8.00 8.00 8.00 8.00 8.00 8.00 8.00 8.00End Stock 24.00 24.00 24.00 20.00 25.60 30.08 33.66 36.53 38.82 40.66 42.13 43.30 44.24 44.99 45.59 46.08Demand Forecast Uses exponential smoothing 4.00 4.00 4.00 4.00 4.80 5.44 5.95 6.36 6.69 6.95 7.16 7.33 7.46 7.57 7.66 7.73 7.78 Lead Time 4.00 4.00 4.00 4.00 4.00 4.00 4.00 4.00 4.00 4.00 4.00 4.00 4.00 4.00 4.00 4.00 Plus 1 1.00 1.00 1.00 1.00 1.00 1.00 1.00 1.00 1.00 1.00 1.00 1.00 1.00 1.00 1.00 1.00 No. of Periods Safety Stock 2.00 2.00 2.00 2.00 2.00 2.00 2.00 2.00 2.00 2.00 2.00 2.00 2.00 2.00 2.00 2.00Total Periods 7.00 7.00 7.00 7.00 7.00 7.00 7.00 7.00 7.00 7.00 7.00 7.00 7.00 7.00 7.00 7.00Base Stock Total periods × demand forecast 28.00 28.00 28.00 28.00 33.60 38.08 41.66 44.53 46.82 48.66 50.13 51.30 52.24 52.99 53.59 54.08 54.46Order Quantity Base Stock - End Stock 4.00 4.00 4.00 13.60 12.48 11.58 10.87 10.29 9.84 9.47 9.17 8.94 8.75 8.60 8.48 8.38
P 00 P 03 P 09 P 10 P 11 P 12 P 13 P 14 P 15 P 16 P 17 P 18 P 19 P 20 P 21 P 22 P 23Wholesaler Pipeline Inventory Includes on hand and on order 28.00 28.00 28.00 28.00 28.00 28.00 41.44 50.62 56.72 60.59 62.88 64.07 64.51 64.46 64.08 63.52
Demand 4.00 4.00 4.00 4.00 4.00 13.60 12.48 11.58 10.87 10.29 9.84 9.47 9.17 8.94 8.75 8.60End Stock 24.00 24.00 24.00 24.00 24.00 14.40 28.96 39.04 45.85 50.29 53.05 54.61 55.34 55.52 55.33 54.91Demand Forecast Uses exponential smoothing 4.00 4.00 4.00 4.00 4.00 4.00 5.92 7.23 8.10 8.66 8.98 9.15 9.22 9.21 9.15 9.07 8.98 Lead Time 4.00 4.00 4.00 4.00 4.00 4.00 4.00 4.00 4.00 4.00 4.00 4.00 4.00 4.00 4.00 4.00 Plus 1 1.00 1.00 1.00 1.00 1.00 1.00 1.00 1.00 1.00 1.00 1.00 1.00 1.00 1.00 1.00 1.00 No. of Periods Safety Stock 2.00 2.00 2.00 2.00 2.00 2.00 2.00 2.00 2.00 2.00 2.00 2.00 2.00 2.00 2.00 2.00Total Periods 7.00 7.00 7.00 7.00 7.00 7.00 7.00 7.00 7.00 7.00 7.00 7.00 7.00 7.00 7.00 7.00Base Stock Total periods × demand forecast 28.00 28.00 28.00 28.00 28.00 28.00 41.44 50.62 56.72 60.59 62.88 64.07 64.51 64.46 64.08 63.52 62.85Order Quantity Base Stock - End Stock 4.00 4.00 4.00 4.00 4.00 27.04 21.66 17.68 14.74 12.59 11.03 9.91 9.12 8.56 8.19 7.94
P 00 P 03 P 09 P 10 P 11 P 12 P 13 P 14 P 15 P 16 P 17 P 18 P 19 P 20 P 21 P 22 P 23Distributor Pipeline Inventory Includes on hand and on order 28.00 28.00 28.00 28.00 28.00 28.00 28.00 28.00 60.26 78.53 87.58 90.69 90.18 87.58 83.94 79.91
Demand 4.00 4.00 4.00 4.00 4.00 4.00 4.00 27.04 21.66 17.68 14.74 12.59 11.03 9.91 9.12 8.56End Stock 24.00 24.00 24.00 24.00 24.00 24.00 24.00 0.96 38.59 60.86 72.84 78.11 79.15 77.67 74.82 71.35Demand Forecast Uses exponential smoothing 4.00 4.00 4.00 4.00 4.00 4.00 4.00 4.00 8.61 11.22 12.51 12.96 12.88 12.51 11.99 11.42 10.85 Lead Time 4.00 4.00 4.00 4.00 4.00 4.00 4.00 4.00 4.00 4.00 4.00 4.00 4.00 4.00 4.00 4.00 Plus 1 1.00 1.00 1.00 1.00 1.00 1.00 1.00 1.00 1.00 1.00 1.00 1.00 1.00 1.00 1.00 1.00 No. of Periods Safety Stock 2.00 2.00 2.00 2.00 2.00 2.00 2.00 2.00 2.00 2.00 2.00 2.00 2.00 2.00 2.00 2.00Total Periods 7.00 7.00 7.00 7.00 7.00 7.00 7.00 7.00 7.00 7.00 7.00 7.00 7.00 7.00 7.00 7.00Base Stock Total periods × demand forecast 28.00 28.00 28.00 28.00 28.00 28.00 28.00 28.00 60.26 78.53 87.58 90.69 90.18 87.58 83.94 79.91 75.92Order Quantity Base Stock - End Stock 4.00 4.00 4.00 4.00 4.00 4.00 4.00 59.30 39.94 26.72 17.86 12.07 8.43 6.26 5.09 4.57
P 00 P 03 P 09 P 10 P 11 P 12 P 13 P 14 P 15 P 16 P 17 P 18 P 19 P 20 P 21 P 22 P 23Factory Pipeline Inventory Includes on hand and on order 20.00 20.00 20.00 20.00 20.00 20.00 20.00 20.00 20.00 20.00 75.30 100.18 106.86 103.34 94.75 84.23
Demand 4.00 4.00 4.00 4.00 4.00 4.00 4.00 4.00 4.00 59.30 39.94 26.72 17.86 12.07 8.43 6.26End Stock 16.00 16.00 16.00 16.00 16.00 16.00 16.00 16.00 16.00 -39.30 35.35 73.46 89.00 91.27 86.32 77.96Demand Forecast Uses exponential smoothing 4.00 4.00 4.00 4.00 4.00 4.00 4.00 4.00 4.00 4.00 15.06 20.04 21.37 20.67 18.95 16.85 14.73 Lead Time 2.00 2.00 2.00 2.00 2.00 2.00 2.00 2.00 2.00 2.00 2.00 2.00 2.00 2.00 2.00 2.00 Plus 1 1.00 1.00 1.00 1.00 1.00 1.00 1.00 1.00 1.00 1.00 1.00 1.00 1.00 1.00 1.00 1.00 No. of Periods Safety Stock 2.00 2.00 2.00 2.00 2.00 2.00 2.00 2.00 2.00 2.00 2.00 2.00 2.00 2.00 2.00 2.00Total Periods 5.00 5.00 5.00 5.00 5.00 5.00 5.00 5.00 5.00 5.00 5.00 5.00 5.00 5.00 5.00 5.00Base Stock Total periods × demand forecast 20.00 20.00 20.00 20.00 20.00 20.00 20.00 20.00 20.00 20.00 75.30 100.18 106.86 103.34 94.75 84.23 73.65Order Quantity Base Stock - End Stock 4.00 4.00 4.00 4.00 4.00 4.00 4.00 4.00 4.00 114.59 64.83 33.40 14.34 3.47 0.00 0.00
Total Inventory 104.00 104.00 104.00 104.00 109.60 114.08 131.10 143.16 183.80 207.78 275.88 306.25 313.79 308.37 296.36 281.73Periods 1, 2, 4 to 8 hidden
Figure 13-3. Beer game played the traditional way
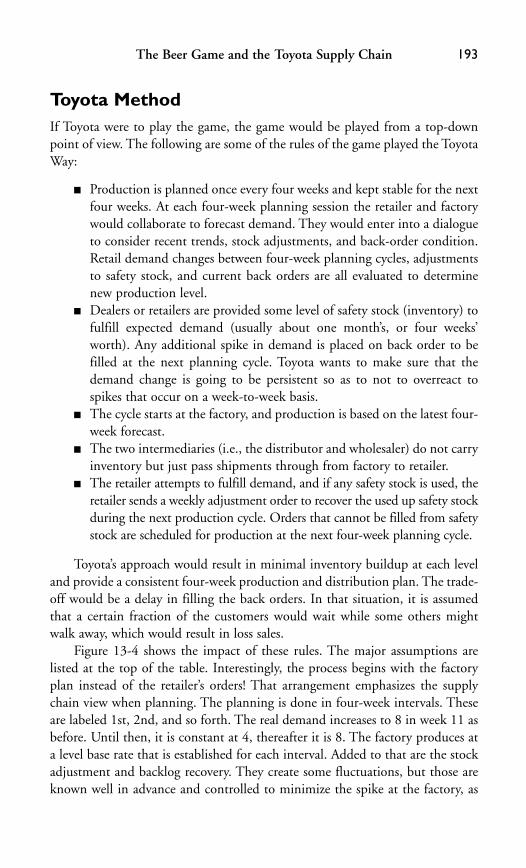
Toyota MethodIf Toyota were to play the game, the game would be played from a top-downpoint of view. The following are some of the rules of the game played the ToyotaWay:
■ Production is planned once every four weeks and kept stable for the nextfour weeks. At each four-week planning session the retailer and factorywould collaborate to forecast demand. They would enter into a dialogueto consider recent trends, stock adjustments, and back-order condition.Retail demand changes between four-week planning cycles, adjustmentsto safety stock, and current back orders are all evaluated to determinenew production level.
■ Dealers or retailers are provided some level of safety stock (inventory) tofulfill expected demand (usually about one month’s, or four weeks’worth). Any additional spike in demand is placed on back order to befilled at the next planning cycle. Toyota wants to make sure that thedemand change is going to be persistent so as to not to overreact tospikes that occur on a week-to-week basis.
■ The cycle starts at the factory, and production is based on the latest four-week forecast.
■ The two intermediaries (i.e., the distributor and wholesaler) do not carryinventory but just pass shipments through from factory to retailer.
■ The retailer attempts to fulfill demand, and if any safety stock is used, theretailer sends a weekly adjustment order to recover the used up safety stockduring the next production cycle. Orders that cannot be filled from safetystock are scheduled for production at the next four-week planning cycle.
Toyota’s approach would result in minimal inventory buildup at each leveland provide a consistent four-week production and distribution plan. The trade-off would be a delay in filling the back orders. In that situation, it is assumedthat a certain fraction of the customers would wait while some others mightwalk away, which would result in loss sales.
Figure 13-4 shows the impact of these rules. The major assumptions arelisted at the top of the table. Interestingly, the process begins with the factoryplan instead of the retailer’s orders! That arrangement emphasizes the supplychain view when planning. The planning is done in four-week intervals. Theseare labeled 1st, 2nd, and so forth. The real demand increases to 8 in week 11 asbefore. Until then, it is constant at 4, thereafter it is 8. The factory produces ata level base rate that is established for each interval. Added to that are the stockadjustment and backlog recovery. They create some fluctuations, but those areknown well in advance and controlled to minimize the spike at the factory, as
The Beer Game and the Toyota Supply Chain 193
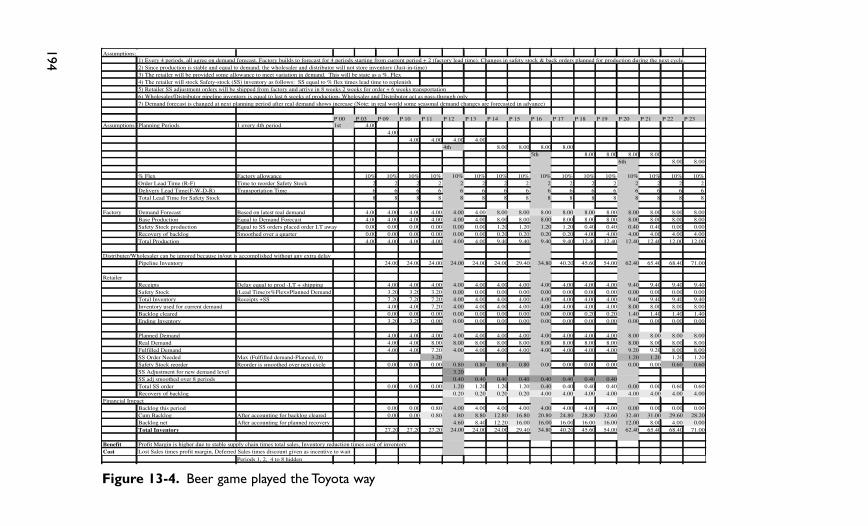
194
Assumptions:1) Every 4 periods, all agree on demand forecast. Factory builds to forecast for 4 periods starting from current period + 2 (factory lead time). Changes in safety stock & back orders planned for production during the next cycle.2) Since production is stable and equal to demand, the wholesaler and distributor will not store inventory (Just-in-time)3) The retailer will be provided some allowance to meet variation in demand. This will be state as a %. Flex4) The retailer will stock Safety-stock (SS) inventory as follows: SS equal to % flex times lead time to replenish 5) Retailer SS adjustment orders will be shipped from factory and arrive in 8 weeks 2 weeks for order + 6 weeks transportation6) Wholesaler/Distributor pipeline inventory is equal to last 6 weeks of production- Wholesaler and Distributor act as pass-through only7) Demand forecast is changed at next planning period after real demand shows increase (Note: in real world some seasonal demand changes are forecasted in advance)
P 00 P 03 P 09 P 10 P 11 P 12 P 13 P 14 P 15 P 16 P 17 P 18 P 19 P 20 P 21 P 22 P 23Assumptions Planning Periods 1 every 4th period 1st 4.00
4.004.00 4.00 4.00 4.00
4th 8.00 8.00 8.00 8.005th 8.00 8.00 8.00 8.00
6th 8.00 8.00
% Flex Factory allowance 10% 10% 10% 10% 10% 10% 10% 10% 10% 10% 10% 10% 10% 10% 10% 10%Order Lead Time (R-F) Time to reorder Safety Stock 2 2 2 2 2 2 2 2 2 2 2 2 2 2 2 2Delivery Lead Time(F-W-D-R) Transportation Time 6 6 6 6 6 6 6 6 6 6 6 6 6 6 6 6Total Lead Time for Safety Stock 8 8 8 8 8 8 8 8 8 8 8 8 8 8 8 8
Factory Demand Forecast Based on latest real demand 4.00 4.00 4.00 4.00 4.00 4.00 8.00 8.00 8.00 8.00 8.00 8.00 8.00 8.00 8.00 8.00Base Production Equal to Demand Forecast 4.00 4.00 4.00 4.00 4.00 4.00 8.00 8.00 8.00 8.00 8.00 8.00 8.00 8.00 8.00 8.00Safety Stock production Equal to SS orders placed order LT away 0.00 0.00 0.00 0.00 0.00 0.00 1.20 1.20 1.20 1.20 0.40 0.40 0.40 0.40 0.00 0.00Recovery of backlog Smoothed over a quarter 0.00 0.00 0.00 0.00 0.00 0.00 0.20 0.20 0.20 0.20 4.00 4.00 4.00 4.00 4.00 4.00Total Production 4.00 4.00 4.00 4.00 4.00 4.00 9.40 9.40 9.40 9.40 12.40 12.40 12.40 12.40 12.00 12.00
Distributer/Wholesaler can be ignored because in/out is accomplished without any extra delayPipeline Inventory 24.00 24.00 24.00 24.00 24.00 24.00 29.40 34.80 40.20 45.60 54.00 62.40 65.40 68.40 71.00
RetailerReceipts Delay equal to prod -LT + shipping 4.00 4.00 4.00 4.00 4.00 4.00 4.00 4.00 4.00 4.00 4.00 9.40 9.40 9.40 9.40Safety Stock (Lead Time)×%Flex×Planned Demand 3.20 3.20 3.20 0.00 0.00 0.00 0.00 0.00 0.00 0.00 0.00 0.00 0.00 0.00 0.00Total Inventory Receipts +SS 7.20 7.20 7.20 4.00 4.00 4.00 4.00 4.00 4.00 4.00 4.00 9.40 9.40 9.40 9.40Inventory used for current demand 4.00 4.00 7.20 4.00 4.00 4.00 4.00 4.00 4.00 4.00 4.00 8.00 8.00 8.00 8.00Backlog cleared 0.00 0.00 0.00 0.00 0.00 0.00 0.00 0.00 0.00 0.20 0.20 1.40 1.40 1.40 1.40Ending Inventory 3.20 3.20 0.00 0.00 0.00 0.00 0.00 0.00 0.00 0.00 0.00 0.00 0.00 0.00 0.00
Planned Demand 4.00 4.00 4.00 4.00 4.00 4.00 4.00 4.00 4.00 4.00 4.00 8.00 8.00 8.00 8.00Real Demand 4.00 4.00 8.00 8.00 8.00 8.00 8.00 8.00 8.00 8.00 8.00 8.00 8.00 8.00 8.00Fulfilled Demand 4.00 4.00 7.20 4.00 4.00 4.00 4.00 4.00 4.00 4.00 4.00 9.20 9.20 8.00 8.00SS Order Needed Max (Fulfilled demand-Planned, 0) 3.20 1.20 1.20 1.20 1.20Safety Stock reorder Reorder is smoothed over next cycle 0.00 0.00 0.00 0.80 0.80 0.80 0.80 0.00 0.00 0.00 0.00 0.00 0.00 0.60 0.60SS Adjustment for new demand level 3.20SS adj smoothed over 8 periods 0.40 0.40 0.40 0.40 0.40 0.40 0.40 0.40Total SS order 0.00 0.00 0.00 1.20 1.20 1.20 1.20 0.40 0.40 0.40 0.40 0.00 0.00 0.60 0.60Recovery of backlog 0.20 0.20 0.20 0.20 4.00 4.00 4.00 4.00 4.00 4.00 4.00 4.00
Financial ImpactBacklog this period 0.00 0.00 0.80 4.00 4.00 4.00 4.00 4.00 4.00 4.00 4.00 0.00 0.00 0.00 0.00Cum Backlog After accounting for backlog cleared 0.00 0.00 0.80 4.80 8.80 12.80 16.80 20.80 24.80 28.80 32.60 32.40 31.00 29.60 28.20Backlog net After accounting for planned recovery 4.60 8.40 12.20 16.00 16.00 16.00 16.00 16.00 12.00 8.00 4.00 0.00Total Inventory 27.20 27.20 27.20 24.00 24.00 24.00 29.40 34.80 40.20 45.60 54.00 62.40 65.40 68.40 71.00
Benefit Profit Margin is higher due to stable supply chain times total sales, Inventory reduction times cost of inventoryCost Lost Sales times profit margin, Deferred Sales times discount given as incentive to wait
Periods 1, 2, 4 to 8 hidden
Figure 13-4. Beer game played the Toyota way
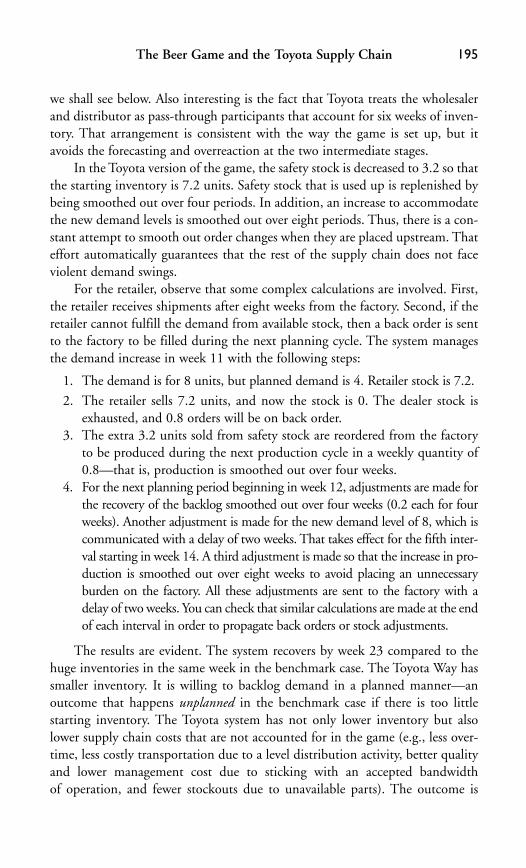
we shall see below. Also interesting is the fact that Toyota treats the wholesalerand distributor as pass-through participants that account for six weeks of inven-tory. That arrangement is consistent with the way the game is set up, but itavoids the forecasting and overreaction at the two intermediate stages.
In the Toyota version of the game, the safety stock is decreased to 3.2 so thatthe starting inventory is 7.2 units. Safety stock that is used up is replenished bybeing smoothed out over four periods. In addition, an increase to accommodatethe new demand levels is smoothed out over eight periods. Thus, there is a con-stant attempt to smooth out order changes when they are placed upstream. Thateffort automatically guarantees that the rest of the supply chain does not faceviolent demand swings.
For the retailer, observe that some complex calculations are involved. First,the retailer receives shipments after eight weeks from the factory. Second, if theretailer cannot fulfill the demand from available stock, then a back order is sentto the factory to be filled during the next planning cycle. The system managesthe demand increase in week 11 with the following steps:
1. The demand is for 8 units, but planned demand is 4. Retailer stock is 7.2.
2. The retailer sells 7.2 units, and now the stock is 0. The dealer stock isexhausted, and 0.8 orders will be on back order.
3. The extra 3.2 units sold from safety stock are reordered from the factoryto be produced during the next production cycle in a weekly quantity of0.8—that is, production is smoothed out over four weeks.
4. For the next planning period beginning in week 12, adjustments are made forthe recovery of the backlog smoothed out over four weeks (0.2 each for fourweeks). Another adjustment is made for the new demand level of 8, which iscommunicated with a delay of two weeks. That takes effect for the fifth inter-val starting in week 14. A third adjustment is made so that the increase in pro-duction is smoothed out over eight weeks to avoid placing an unnecessaryburden on the factory. All these adjustments are sent to the factory with adelay of two weeks. You can check that similar calculations are made at the endof each interval in order to propagate back orders or stock adjustments.
The results are evident. The system recovers by week 23 compared to thehuge inventories in the same week in the benchmark case. The Toyota Way hassmaller inventory. It is willing to backlog demand in a planned manner—anoutcome that happens unplanned in the benchmark case if there is too littlestarting inventory. The Toyota system has not only lower inventory but alsolower supply chain costs that are not accounted for in the game (e.g., less over-time, less costly transportation due to a level distribution activity, better qualityand lower management cost due to sticking with an accepted bandwidth of operation, and fewer stockouts due to unavailable parts). The outcome is
The Beer Game and the Toyota Supply Chain 195

commendable because the Toyota Way, which was not designed to play the beergame, nevertheless intuitively aims to uncover the rules proposed by Sterman toplay the beer game.
Interpreting the OutcomeOne way to interpret the outcome of the game is to insist that there is a system-atic flavor to the results. The results are due to the structure of the game, namely,the long lead times for supply, the delay in communicating orders, and the lackof communication between stages. But that is not the only way to interpret theoutcome. There are many other ways of explaining the outcome of the beergame. We classify them as follows:
■ Drawback due to the system. During the debrief session, players often tendto blame the system. They point out that if they had known the realdemand, the situation would not have happened; thus information avail-ability is said to be a constraint. Similarly, it takes two weeks for an orderto go from one stage to another; thus, information propagation delay isanother problem. Players also say that it takes two weeks at least to getsupplies—even longer if the immediate supplier is backlogged. Rushorders might solve the problem. Thus, supply lead time or delay is aproblem. Finally, they say that it is difficult to visualize the supply line—that is, to see how many units are in the pipeline headed toward them tofulfill past orders.
■ Use of heuristics. Sterman suggests that players fall victim to “mispercep-tions of feedback”; for example, the players do not account for actions thatthey have already taken, such as the impact of placing a huge order, whenviewing the response of the system. In other words, they fail to see that thesystem can handle regular-sized orders within the regular time but thatlarge orders need more time. Sterman also finds that players assume thatthe initial stock level of 8 in stock and 8 in the pipeline is optimal. Thatassumption is probably due to the lack of time for optimizing these values.Similarly, players tend to underestimate the time to get deliveries.
■ Inability to learn. When asked how to improve the system, many playersfirst say that they feel helpless. They mention their inability to controlthe system. Many attribute the cause of the dynamics (e.g., huge swingsresulting in excess shortages followed by excess inventory) to external fac-tors. As Sterman puts it: “These explanations reflect an ‘open loop’ con-ception of the origin of dynamics as opposed to a mode of explanationin which change is seen as arising from the endogenous interactions ofdecision makers with their environment.” Or, bluntly put, they have acollective inability to develop a policy to manage the system.
Toyota Supply Chain Management196

Here we can borrow from Peter Senge’s five disciplines of a learningorganization—systems thinking, personal mastery, mental models,building shared vision, and team learning—to explain the inability tolearn. Let us consider the five disciplines. Clearly, the beer game partic-ipants lack personal mastery because they are somewhat at the novicelevel, even if they are supply chain managers in real life. They haveprobably never been exposed to such rapid evolution in the systems they manage. Players have a mental model of how the supply chainfunctions. Whether right or wrong, these ideas are not shared withothers due to the rules of the game. For example, players might expect immediate delivery of orders. They may not realize that informa-tion delays create a lag in the last player (i.e., the factory) recognizingthat the demand has increased. The lack of synchronous flow of infor-mation and material is not obvious, and probably its effect is difficultto imagine!
The goal is to maximize supply chain profit, because the team withthe lowest cost wins. In the game, the lack of principles and practicesthat are necessary to translate goals into action leads to the disorderlyoutcome.
Finally, by focusing on being a retailer or distributor, the players failto see how playing their position can adversely affect others. In otherwords, by playing their position they fail to think of the supply chainas a system. They probably might not even learn that through repeatedplay, especially if the game were played over long distances. Playersbelieve that the enemy is “out there” by simply blaming everything andeveryone else but their own selves for the results. They say things like“the demand was random,” “we never got supply,” and “we were notallowed to talk.” The players additionally get trapped into the illusionof taking charge, preferring action to thought. In the beer game thereis a lot of frantic calculation done with the focus on placing an orderrather than trying to learn. Moreover, fixing attention on the orderingevent prevents the players from taking a long-term view, such as con-templating the impact of placing a very large order on the entire supplychain.
Technology Helps Mitigate the Bullwhip Effect in the Supply Chain4
Mitigating the bullwhip effect in the supply chain requires coordination, andmanufacturing on JIT principles requires precise timing between the manufacturerand the supplier. Looking to increase its business with Toyota, Dana Corp. has
The Beer Game and the Toyota Supply Chain 197

relied on technology to help it manage timing and coordination in its plant inOwensboro, Kentucky, for manufacturing truck frames.
Using a sequencing system based on Internet FTP (File Transfer Protocol) com-munication, Dana receives orders hourly from Toyota and uploads them into a “pro-duction instruction system.” That information is fed to all the component cells,where it is displayed on bulletin boards to let the cell know which model is currentlybeing produced. Instantaneous order delivery from Toyota means that lot sizes canbe as small as one to five. The result is that the plant is extremely lean, yet flexibleenough to produce 14 models for two unique platforms on a single assembly line.
As the plant completely relies on the order system to keep producing, mul-tiple standbys have been built in. The communication relies on a cluster ofservers with “hot failover” so that backup systems always track the state and cantake over from the primary system at any time. If everything shuts down, themanual alternative is to print order sheets and use those instead. In another useof technology, the plant’s team modified a machine that was meant to applymodel numbers to verify that the right type of frame had been assembled byscanning key parts of the frame.
Always an extremely lean plant, Dana has reaped benefits from this technol-ogy. In 2002, it reduced costs by US$1.8 million, while over a three-year periodit reduced the in-plant defect rate by 29 percent, raw materials inventory by 65 percent, and finished goods inventory by 29.6 percent.
As a tier 1 supplier, Dana also manages its own tier 2 suppliers who deliverparts just-in-time. A system of kanban cards and scheduled routes is used todeliver supplies to the floor, and drivers pick up cards for the next round as theydrop off supplies. On the outbound side, a trigger board of 25 lights (the size ofeach shipment) tracks each frame rolling off the assembly line at Toyota’s plant.A driver knows that when 25 lights are on, it’s time for the next delivery.
Reflection PointsThe manner in which the beer game is played can be related, at a somewhat deeplevel, to the two main themes in the book. We summarize these below. The fol-lowing learning methods are systematically used in stages in every process andby every one of the participants in the Toyota version of the game:
■ Create awareness. In the game, limits are placed so that once demandfluctuates beyond the stock level, it becomes noticed.
■ Establish capability. Collaboration between the retailer and the factory toestablish a new production plan empowers the team to take concertedaction.
■ Make action protocols. The reaction is constrained so that gradual changesare made to accommodate demand, adjust safety stock, and recover
Toyota Supply Chain Management198

backlog. The constraints are placed to help identify cause and effect.Clearly, the planner knows when the smoothed orders will arrive at theplant, when they will arrive at the distributor and wholesaler, and so on.Those events can be tracked and planned in advance. Notice too the sim-ilar way of reacting to changes, whether it be demand, safety stock, orback-order recovery.
■ Generate system-level awareness. The factory is placed at the forefront. Thewholesaler’s and distributor’s roles are subsumed into a pass-through.The entire supply chain becomes visible, with cause and effect of actionsat every stage becoming clearer as one moves up the chain. Notice thatwhat occurs is exactly the reverse of what happens in many supplychains, where the sales group is often unaware of the rest of the roles inthe supply chain. In the beer game scenario, the main burden of calcu-lation of changes is placed on the retailer. A reader well versed in thetheory of incentives might spot the necessity for centralizing the plan-ning. That step would be made because of the need for complex calcula-tions, which would require system-level considerations by the retailer.
Link to the v4L:
■ Variety is not explicitly considered in the beer game. But if an uncertaintyrelated to the product mix were added to the game, the impact of Toyota’sapproaches would be even more significant than in the typical game.
■ Velocity. Toyota’s approach to the game begins with the factory and itsproduction rate adjustments as a mechanism to regulate product flow inresponse to demand data.
■ Variability. New adjustments related to the data about demand aresmoothed over time to reduce the impact on order variability. Thatreduction in variability lowers inventory while lowering back-order levelsin a period. In other words, the responses to new data are distributedthroughout the system and over time.
■ Visibility (or lack of it) is a key component of the game. The lack of vis-ibility of underlying demand and absence of collaborative planningcreate most of the problems in the standard game. Notice that the Toyotaapproach to the game provides room for collaboration—and thus asmoother response to new demand level information.
Endnotes1. Hau L. Lee, V. Padmanabhan, and Seungjin Whang, “Information
Distortion in a Supply Chain: Bullwhip Effects,” Management Science 43,no. 4 (1997): 546–558.
The Beer Game and the Toyota Supply Chain 199
2. The beer game is clearly an abstraction of a real supply chain: real supplychains carry multiple products; the four players might work for the samefirm and thus have the ability to coordinate; some amount of informationsharing might be possible; and so on. Thus, the tendency might be to dis-miss the simulation as being of low value. In fact, the beer game is intro-duced as the first example in the compilations of problems in industrialdynamics (W. E. Jarmain, Problems in Industrial Dynamics. Cambridge,MA: MIT Press, 1963).
In the study of problems in industrial dynamics, no solution to and noexplanation of the phenomenon are offered simply because to anyonefamiliar with Jay Forrester’s book on industrial dynamics (Jay W. Forrester,Industrial Dynamics. Cambridge, MA: MIT Press, 1961), the outcome isobvious. Notably, even though many other examples are rarely mentionedin a core course in an MBA school, the beer game has captured the fancyof the academic and practitioner world. It probably displays a combinationof what can go wrong with systems, decision making, and learning (tooslowly) over time.
3. John D. Sterman, “Modeling Managerial Behavior: Misperceptions ofFeedback in a Dynamic Decision Making Experiment,” ManagementScience 35 (1989): 321–339.
4. Tonya Vinas, “In Sync with the Customer: Dana Plant Built for TPSRewarded with More and More Business for Toyota’s Growing TruckLine,” IndustryWeek (October 1, 2003).
Toyota Supply Chain Management200
201
The following are summaries of the interviews that we conducted withToyota executives as well as executives of the extended supply chain.Some of these comments were included throughout the book; how-
ever, we thought that including the summaries would be interesting to thereader because they bring many different viewpoints together in one place.
Interview on August 21, 2008, with Gene Tabor,General Manager, Purchasing-Supplier Relations,Supplier Diversity, and Risk ManagementThe purpose of the interview was to discuss how Toyota works with its suppli-ers and to better understand Toyota’s working relationship with suppliers.
Gene Tabor believes that Toyota starts with a foundation that assumes thatsupplier relationships focus on the long term. Toyota also focuses on clarity ofexpectations with written annual expectations and mechanisms to measure, provide feedback, monitor, and improve. The goal is predictability so that thebehavior of the supplier and Toyota, when an issue arises, can be forecasted byboth parties. Communications with suppliers happen at the two annual suppliermeetings as well as at ongoing meetings to enhance communications, expecta-tions, and implementation.
Gene tells suppliers, “No surprises are preferred. Call even if it is 5 p.m. ona Friday afternoon instead of waiting until Monday and try to resolve it overthe weekend.” He reiterated that the preferred mode at Toyota is “bad newsfirst” so that the supplier and Toyota can solve the problem. The supplier mayseek help by contacting Toyota directly, a Toyota manager visiting the suppliermay see a problem, or the supplier may seek help after a problem is discovered.
Reflections of Supply ChainParticipants
Chapter 14
Supplier support is not limited to purchasing. Several possible groups may talkto the supplier. They include procurement, quality control, supply chain, andothers. The relationship is in the form of a matrix with several possible contactswith Toyota interacting across the organization. The matrix has to “tighten up”to prevent problems from falling through the gaps. The most difficult issue isfinding the most efficient and effective approach for sorting, sifting, directing,and coordinating help to the suppliers; Toyota considers the process to be awork in progress.
Gene says that “every supplier will have a problem of some type; the questionis not if, but when it happens, how is it handled?” There are no extra resources tohelp suppliers; everyone, from purchasing to the line team members, may be usedto solve a problem. If a supplier has a financial issue and is winding down, a teamfrom Toyota will go to the supplier location and help to wind things down byworking with the customer group to ensure a fair share of product. Many timesthe subsuppliers may continue to work with another supplier to ship to Toyota.
How does Toyota ensure that supplier assistance is separated from purchas-ing negotiations? Toyota starts with “respect for people,” so that even if the sup-plier and Toyota do not agree, the supplier understands that the buyer is readyto listen and has the data to support a given case.
Interview on August 21, 2008, with Jamey Lykins,Toyota Purchasing General ManagerThe purpose of the interview was to understand how Toyota selects and develops suppliers.
Jamey Lykins says that Toyota’s view of procurement is to “cultivate themarket and farm it” rather than “hunt for suppliers and use.” He also says thatToyota’s view is that the concept of the market producing a continuous streamof innovations at ever-decreasing prices is a myth—the market has to be fosteredand harnessed to generate competitive offerings. That effort requires patienceand development of suppliers, among other things. Toyota accomplishes itsobjectives in many ways.
Toyota developed the idea of supplier pods, which reduce the frictionalcosts of doing business. These pods are focused on tier 1 suppliers with whomthe firm has long-term business relationships. The synergy within each pod isnot orchestrated by Toyota; instead, it is nurtured. In addition, Toyota carefullyselects suppliers at different tiers that have to be cultivated. In some cases, specific tier 3 or tier 4 suppliers are directly engaged by Toyota to ensure thatinnovative ideas are nurtured. In return for guaranteed markets for innovations,these smaller companies provide unique research and development capabilities(e.g., tool and die companies or plastic injection molding companies). The need
Toyota Supply Chain Management202
to retain connections even with these small firms is to ensure that the know-howfrom 30- to 40-year industry veterans is not lost.
Not all suppliers are treated equally. Some companies that are closely tied toToyota face greater-than-market pressures to outperform the market. Jameycited examples where Toyota engineers and supplier engineers have committedto reducing costs by over 50 percent for some critical parts.
The purchasing manager continuously evaluates suppliers based on the flexibility of the plant to reallocate resources, the capability of the company (i.e.,the skill set of the organization), and the competitiveness of the company as awhole. A supplier can be evaluated by Toyota managers who tour the shop floorto examine how it manages tasks, accommodates variability, standardizes work,maintains rhythm on the floor, solves problems, and so on. By watching tasksbeing performed, observing the layout of parts and steps, reviewing instructionsregarding task performance, and so on, evaluators will think of potential out-comes. The “red rabbit” test is also sometimes used to check how long it takesto identify a defect. In this test, a red part is added to the mix and the time untilit is discovered is identified. Toyota believes that if all of these issues are man-aged well, then quality will be improved and costs will be lowered.
If costs remain higher than deemed competitive, Toyota sends a team towork with the supplier to lower costs. In addition, Toyota also provides assis-tance to suppliers to improve performance. But the group that provides theassistance shares no information with the purchasing group.
Interview on August 21, 2008, with David Burbidge,Vice President of Production Control,ToyotaThe purpose of the interview was to discuss the role of production controlregarding production planning and scheduling.
David Burbidge described how the production plans are adjusted to accom-modate both minor hiccups in the production process as well as a major shift indemand. When a minor hiccup happens, the selectivity lanes at the paint shopand some inventory at the assembly line play a role to recover the schedule. Atthe paint shops, the mix of vehicles is adjusted to restore a smooth sequence. Inorder to do that effectively, the Yamazumi charts for each variant (i.e., charts thatshow the planned cycle times for each process) are used to ensure that associatesdo not get overburdened and thus guarantee quality. In addition, assemblybuffers at the end of each line enable production smoothing.
David then discussed the major rescheduling that took place in the case ofthe Toyota sports utility vehicle, the Sequoia. This SUV was launched with anannual volume estimate of 103,000. Most people at Toyota felt that the demand
Reflections of Supply Chain Participants 203

Toyota Supply Chain Management204
for the first year would be very high, but soon this volume was cut to 78,000then 72,000. Sales revised it again to 66,000 before launch. The actual lookedto be closer to 35,000, thus leaving 175 days of supply for the vehicle. As Daviddescribed the situation, it appeared to be the perfect storm. Just as Toyotalaunched the new SUV, consumer sentiment for these larger cars had turned,and the SUV was viewed as disreputable—shunned by the public (like, say, a furcoat) as an inappropriate purchase during a period of high fuel prices and globalwarming.
A decision was made to stop production of the Sequoia for three months.When such a determination is made, the recent suppliers are compensatedfinancially. Strategic suppliers help out Toyota by sharing the pain. Sequencesuppliers also get some help. The system has to plan both shutdown and start-up to ensure that quality is maintained. Some of the employees are shuttled toother Toyota plants around the country to replace temporary workers. Davidremarked that this was new territory for Toyota—it had seen a growing marketin the United States for 20 years and North America used the capacity in Japanas a buffer to ensure stable U.S. production.
Phone Interview on September 25, 2008,with Mike Botkin, General Manager of Logistics,ToyotaThe purpose of the interview was to discuss the logistics operation at Toyota inNorth America.
Mike Botkin is general manager of the North American Logistics division.The two departments that comprise this division are Logistics and PartsDistribution. Logistics, is responsible for route planning, operations of over-the-road logistics (inbound), cross-dock management, and initial planning for newprojects or model change. Outbound logistics of finished vehicles are theresponsibility of Toyota Motor Sales. Parts Distribution manages the supply ofservice parts from the plant to the service center. It supports service parts pro-duction and shipping preparation. This group is also responsible for quality,technical support, and overseas logistics and customs.
Describing the logistics, Mike mentioned that the preferred method ofrouting is from supplier to cross-dock to plant. The milk run is used whendemand is not satisfied from cross-dock and is not the norm. In case of milkruns, Toyota generates the routes and passes them on to a third-party logisticscompany. That arrangement was not always in place. In Japan, the supplier isresponsible for delivering to the plant. When Toyota came to the United States,two logistics partners were charged with doing the routing. They were providedwith such information as the delivery frequency and time windows. Over the

20 years that Toyota has been operating in the United States, they have developedthe expertise to do the routing themselves. Routes from the supplier directly tothe plant are planned at the plant. Routes integrated with other North Americanplants are determined by the logistics organization.
If weather delays or supplier issues occur, ordering is still based on the oldtimeline but a new transportation plan is manually generated. For example, if an8-hour route is delayed to 10 hours, a one-way move may be used to recover thetimeline. Such planning is done on a case-by-case basis. Some automation is utilized for communication and control of trucks. Lead time for each part andsupplier is synchronized with the route and assembly requirement.
Mike described heijunka at the plant as focused on smoothing of linesideworkload requirements (e.g., wire harness adjustments take more time on a vehi-cle with a sunroof assembly than on one that does not have that need). As aresult, other considerations such as the lot size and delivery sequence determinethe loading and smoothness of the logistics, handling, and transportation.
Service parts demand comes from dealers and repair shops, but demand forservice parts is erratic, as it is based on need. The parts depot, in the early daysof Toyota, had some buffers because of fewer models and parts. The only issuewas seasonality, but that could be planned for. As the number of modelsincreased, the parts count increased. The company is working through theprocess to smooth the flow.
Lead time is higher for international shipments, as they are shipped in seacontainers. Transportation costs are also large. The planners first try to deter-mine the number of containers per day required at a facility and build the containers for one production day. So when a container is unloaded at an assem-bly plant, it may contain all parts for 150 vehicles that are planned to be madeduring part of a day. If there are options, there may be inventory at the plant tohandle variations at the plant.
Variation is also created because of product mix. Consider the differencebetween a Camry and a Sequoia—the Camry is 10 cubic meters while the Sequoiais closer to 20. The smaller vehicle has a better chance for trailer efficiency. Thepackaging and lot sizes are thus impacted by the product. The other issue in NorthAmerica is that the vehicle is produced at the assembly plant. However, the sup-plier base is spread out in North America—perhaps over 300 miles from the plant,unlike in Japan where the distance from plant to supplier is less than 50 miles.Each plant manages logistics, but there is an attempt to standardize processes;thus, logistics at plants is decentralized. The expectation is that the planning willbe centralized in a few years, while deployment remains decentralized.
For example, in concept, it is expected that a delivery of a pallet is one forone with a returnable container. However, with variance in orders and in scheduling the completion of vehicles, such synchronization is a challenge.
Reflections of Supply Chain Participants 205
Toyota uses a core carrier program to pick up loads directly from supplierlocations. The transportation partner is expected to be safe, confirm parts countsat the order level, inform about short shipments, and deliver on time. Toyotameasures instances where the shipment error should have been caught, as wellas in and out time. In some cases, company observers ride along to confirm drivetimes. The trucking company manages the route—the expectation is that it canconfirm progress of the driver with a global positioning system or may contractthe monitoring to another company.
Interview on September 3, 2008, with SteveGates,Toyota DealerThe purpose of the interview was to discuss how Toyota dealers interact withToyota and to better understand the dealer’s role in the supply chain.
Steve Gates started by explaining the Toyota car allocation system to deal-ers. The allocation follows a “turn and earn” model where specific vehicles areallocated by region. One of the tasks of the dealer is to explain to customers thevalue proposition offered by Toyota. Most repeat customers who have ownedToyota cars earlier or are familiar with other Japanese manufacturers understandthe concept that variety will be limited to maintain quality and value. Theremaining customers require salesperson assistance to walk them through thevalue proposition of the increased features that accompany the limited variety,thus providing the “added value” for the cars offered. Steve did not feel that variety limitations were a deterrent. He did highlight the fact that dealers havea voice in Toyota’s product planning and their perceptions regarding customerneeds were considered when allocations were made.
Some regions such as Florida usually sell cars with no cold weather kits. Butother regions such as Kentucky and Indiana cannot sell cars without coldweather kits. Likewise, dealers in Cincinnati, Kentucky, and Michigan decidedthat an antilock brake system (ABS) would be an option most customers wouldnot be willing to pay for; thus, vehicles with these systems would not be stocked.So customers in these areas wanting antilock brake systems in their cars wouldget a car from Chicago that had to be traded for a car in the region. In theToyota system, there is a limited ability to do such trades.
Every quarter, the sales managers in each region meet with dealers to decidewhich cars should be built. This process is guided by Toyota Motor Sales (TMS),so dealers may not get exactly what they want. However, dealers get to influenceproduct configuration (e.g., dealers in the Kentucky region pushed for the newTundra truck to be sold with a big V8 engine and TMS acquiesced). Dealers getquick access to the highest levels at Toyota sales executives to provide feedbackregarding customer preferences.
Toyota Supply Chain Management206
While most vehicles are sold as carefully planned variants, the Scion is solddifferently. It continues to be allocated using the “turn-and-earn” model. The caris manufactured in Japan and shipped to the United States to the ports aroundthe country nearest to the dealers. But the product is held at the port and thenreleased to dealers against orders. The dealers have the choice of customizing the product at the port or at the dealership. Each customer is encouraged tocustomize his or her car through choice of decals, crests, and other accessories.The car and its accessories are presented to customers with fixed prices, so pric-ing is transparent with no negotiation. The customer waits for 7 to 10 days toget the car.
Dealerships that are allocated cars have the option to decline to take posses-sion, but that decision will affect future allocation preferences. The allocation isbased on the dealers’ share of the region sales. Each line is allocated separately sothat sales of one type of car (e.g., Prius) do not affect allocations of another (e.g.,Camry).
The Lexus dealers use a sales approach like Toyota’s. Lexus cars are usuallyoffered fully loaded with few options. Toyota Motor Sales knows the percentageof vehicles each dealer will sell, and it allocates accordingly. The Lexus approachto allocating cars is different from that of Audi or BMW which prefer to offermore flexibility to customize the cars.
Toyota’s relationship with dealers is like a partnership. The National DealerCouncil consists of 10 to 12 dealers, including Steve Gates. It provides a lot ofinput to Toyota regarding customer preferences. For example, the dealer coun-cil pushed for a large truck and got Toyota to produce the Tundra. They havealso proposed a smaller truck, which Steve referred to as a Home Depot truckthat customers would use to take things home from the Home Depot. There are1,200 Toyota dealerships across 12 regions that are represented by the dealercouncil.
Steve provided an anecdote regarding the collaboration between theNational Dealer Council and Toyota. Two years ago, the dealer council urgedTMC to increase Prius production from 125,000 to 150,000 cars. TMC askedthe dealers to target 225,000 cars. But a year later, in February 2007, the dealercouncil found it had too many cars and requested a $500-per-car incentive toreduce inventory. But in 2008, there was again a shortage of Prius, with mostdealers having a one-day supply (if all inventories in the pipeline were included).This collaboration between the dealers and Toyota is, in Steve’s words, a rarityin the auto industry.
Steve mentioned that the dealers adopt Toyota’s approaches toward kaizenand expect to increase their productivity. Sales associates who provide ideas forimprovement are rewarded individually. The goal is to decrease expenses with-out affecting the customer.
Reflections of Supply Chain Participants 207
Interview on August 20, 2008, with Gary Dodd,Former President of Tire & Wheel Assembly andFormer Executive with ToyotaThe purpose of the interview was to discuss how Toyota suppliers interact withToyota and to understand Toyota’s supply chain management from the supplier’sviewpoint.
Gary was one of the first general managers hired by Toyota. He worked ina matrix structure within Toyota from the very beginning, from the construc-tion of a project to the coordination of ongoing production operations. He waswith Toyota for 12 years. He was interested in starting a company and had con-versations with Toyota Chairman Fujio Cho regarding this goal. Gary leftToyota and started a supplier company, Tire & Wheel Assembly (T&WA),which delivers tire and wheel assembly—a sequence part. The supplier built afacility in Indiana and supplied the Toyota plant in Princeton, Indiana. Thecompany mounted tires on wheels with the variety suggested by Toyota. Therewas no room for downtime; modest inventory was on hand to ensure enoughparts to match takt time or line speed. T&WA has a record with Toyota of nevercreating a downtime.
When asked about the specific actions Toyota took to make life better forthe suppliers, Gary mentioned that there are huge differences between supply-ing to Toyota and supplying to other automakers. The main differences are thehigh level of support Toyota provides to suppliers, the high level of collabora-tion, and, when good things are done and all key performance indicators (KPIs)are in alignment, there is a lot of recognition and celebration. Toyota takes itskey suppliers to a resort and they all have an annual meet to play golf or tennis.In contrast, many other OEMs have a demanding approach with a lot of con-frontation. Most other OEMs leave it to the supplier to fix problems, but Toyotaassists with fixing problems, and suppliers are comfortable with Toyota’s assis-tance in fixing problems.
When Gary was in the original management team with Fujio Cho, theyused to have meetings twice a week. During the original period, managementteam members presented their accomplishments against goals. Mr. Cho toldthem they were selected because they were good, so he would assume that every-thing was fine but wanted to hear problems first so that they could be fixed.That approach was carried forward to suppliers; as they came onboard, theywere also told to talk about problems—problems were expected, and supplierswould get Toyota’s assistance to fix them.
How else does Toyota keep the pressure on suppliers to be competitive? Theother OEMs demand output. At Toyota too the pressure is maintained—every
Toyota Supply Chain Management208

supplier understands that Toyota want costs to decrease. But at Toyota the ques-tion is how to squeeze the waste by removing unnecessary costs. Several times ayear there is an exercise between the supplier and Toyota to reduce costs and thusreduce costs to Toyota and the supplier. It is very effective because everyone ispulling in the same direction.
Usually the group that helps decrease costs is different from the purchasinggroup. Sometimes, even after a lot of effort, there may not be any cost savings.If so, Toyota would be willing to let the costs stay as is. There is a lot of openbook reconciliation—for example, Toyota might accept a 1 percent cost reduc-tion one year and expect to do better another year.
The KPIs that Toyota uses to evaluate suppliers are on-time delivery, quality, and cost targets. The same KPIs are used internally to be compatiblewith Toyota’s expectations. These KPIs are looked at daily at the supplier organization and shared. In the beginning, suppliers were anxious about doing that and sharing a lot of information. Over a period of time, a level of mutual respect developed, and suppliers realized that that involvement wasbeneficial.
Toyota provides a great deal of visibility to the supplier for planning purposes. The annual supplier meeting provides a feel for Toyota’s plans for theupcoming year. After that, for all suppliers, there are individual meetings torelate the overall plan to the supplier’s volumes. The meeting is the time for suchhandoff discussions—to analyze the plans and understand their impact.
The supplier also gets a good sense of the volume and mix. If there aremarket changes, Toyota does some modest adjustments. There have been noinstances where major changes were made that could cause havoc with the sup-plier. When asked if this process would work now when there are large prod-uct mix changes, decreases in volumes, and the like, Gary replied that he didnot expect a change. He anticipates a shortening of time frames and expectsToyota to be working much harder to communicate with suppliers, workingmore closely with them. On a day-to-day basis, all of the Toyota data arereceived electronically and there are meetings to discuss the plans and opera-tions. If there are any issues—for example, if the plans are more aggressive thancan be accommodated due to equipment changes—the supplier is compen-sated. At the operational level, based on the T&WA takt time, the supplier getsa two-hour advance notice. An electronic order is sent to the supplier by Toyotawhen the vehicle body leaves the paint department. T&WA has to assembleand supply the tire and wheel assembly just-in-time for it to be mounted ontothe correct car.
Gary believes that the way Toyota deals with suppliers needs to be examinedmore closely to understand what leadership in a supply chain really means.
Reflections of Supply Chain Participants 209

Interview on September 23, 2008, with JeffreySmith,Vice President and General Manager,Toyota Business Unit, Johnson ControlsThe purpose of the interview was to discuss how Toyota and suppliers worktogether as partners.
Jeffrey Smith described the forecasts shared by Toyota with JohnsonControls Inc. (JCI), a primary seat supplier, to enable stable orders and thusfinancial planning and budgeting. The company gets a yearly forecast brokendown by months. Every week it also receives a rolling horizon 10-week forecast.Each time, the forecast for the next two weeks is firm, but the following weeksthe variation is under 5 percent. Forecasts provided to JCI then cascade to fore-casts to their subsuppliers and others. Heijunka at Toyota translates into a mixof seat types such as leather and cloth. That in turn creates smoother workload(due to differing work content of seat types) at JCI.
The role of design leadership for seats varies by model. In the past, JCI hasbeen responsible for rear seats while Toyota has had leadership for front seats forseveral models. The rear seats vary by automobile model and design choices, butthe front seat is quite independent of the rest of the car design. In the future,Jeff hoped that the roles would flip, with JCI taking leadership for front seatsand Toyota leading design for the rear seats.
Toyota collaborates to obtain efficiency improvements and provides directassistance when necessary. Jeff shared a description of what would happen ifthere were a problem with JCI’s seats with other OEMs. The general managerwould be invited into the customer’s plant and subjected to an uncomfortableinterrogation. Jeff contrasted that situation with what would happen if Toyotawere the OEM. Toyota would send the particular specific plant person whodealt with the problem or, if the problem were more complicated, a team. InToyota’s case, the team would come to JCI’s plant to assist in determining theroot cause and identifying potential countermeasures.
Jeff also described the negotiation process with Toyota’s purchasing man-agers. A seat would be broken down into specific commodities such as steel,foam, plastics, trim, and assembly. A cost index method benchmark would beused to identify a globally competitive cost point for each commodity.Likewise, details such as welding cost, injection molding cost, and assemblycosts would all be considered. At Toyota, the formula is Price − Cost � Profit;compare that with the traditional formula: Cost � Profit � Price. Given atarget price from Toyota, JCI would have a profit that would be the differencebetween the price and the cost. JCI’s focus then is how to decrease costs andthus increase profit. JCI has participated with Toyota with some initiatives inthis regard, such as CCC21, Value Innovation, Mass Innovation, and Gentani
Toyota Supply Chain Management210
(i.e., recent initiative focused on efficiency improvements, lowest cost sourcing,and flexibility).
Jeff described the recent issues of coordinating with Toyota during a 14-week plant shutdown in San Antonio. JCI has five other supplier locationsincluding plants in the United States and Mexico that will be affected by theshutdown. However, because JCI has been a partner with Toyota for over 25 years and has shared in its growth, he expected that Toyota would end upsharing the pain.
Jeff provided a current example of coordination with Toyota. JCI is sched-uled to deliver rear-seat frames for the new Toyota vehicle, the Venza. The seatswere to be made at a plant in Cadiz, Kentucky, an old plant built in the 1960s.From December 2007 through July 2008, Toyota’s Quality Developmentworked with JCI to bring the Cadiz plant welding capability up to Toyota’s lateststandards, including a rating of over 90 percent on its prescribed welding audit.The Cadiz plant had initially achieved a welding rating of 44 percent that hadimproved to 83 percent by June 2008. JCI then decided it would restructure itsoperations and shut down the Cadiz operation. That announcement resulted inthe necessity to move the Venza rear-seat frame manufacturing to its facility inAthens, Tennessee.
Before the move started, Toyota was informed that the new seat frameswould be made at a plant that had never supplied to Toyota. The move wasscheduled to happen over a one-week period. Toyota immediately sent its teamto Athens and observed a weld rating of 23 percent that increased to 75 percentin two weeks and reached 95 percent within five weeks of the move (before thestart of the full-scale manufacturing). The Toyota visits to Athens focused on“cut-and-etch” weld dissections and microscopic analysis. The Toyota team alsoinvited JCI to Toyota’s Georgetown plant to understand its systems. So Toyotawent into overdrive and provided intense support for Athens.
Jeff also described the process a while ago when JCI decided to consolidatetwo plants in Georgetown, Kentucky, into one facility. The move involvedsharing with Toyota a “high-level” plan/image six months prior to the move fol-lowed by a process change request including plans for human resources, IT,production control, equipment moves, building renovations, quality, and plantoperations. JCI set up a project room, or Obeya, to manage the effort. The relo-cation was completed during a one-week July shutdown. Because JCI suppliedmany of the seats for the biggest-selling car in North America, the Camry, therelocation of the seating operation had to be orchestrated flawlessly and start-up had to mirror Toyota Georgetown’s start-up. JCI was able to execute thatrisky move due to a good and very detailed plan as well as constant manage-ment attention and focus. The trust between Toyota and JCI was key to theseamless transition. Jeff ’s perspective was that good planning and attention to
Reflections of Supply Chain Participants 211

every detail is something JCI continues to learn from Toyota and practice inmany situations.
Interview on August 15, 2008, with AchimPaechtner, Former Senior Manager at Toyota of EuropeThe purpose of the interview was to understand the differences of the automo-bile supply chain in Europe versus North America. Achim Paechtner identifiedfour major differences in Europe:
1. With retailers, the major challenge Toyota faces is the heterogeneous environment: 27 countries, different practices, and history. In addition,exclusive and selective distribution was allowed in the past, but now OEMshave to choose one or another distribution agreement. Toyota chose exclu-sive distribution under which retailers are given a sales territory but retailerscan sell to third parties like supermarkets.
2. Retailers are reluctant to share data; for example, they do not share actualsales data with Toyota. That reluctance creates a challenge for sales fore-casting. Toyota is working to improve the forecasting process. In Spain,retailers send forecasts at N − 3 months, the retailer’s forecast is used, andthat is what Toyota can expect. In Germany, retailers forecast. If retailersare keen to get cars, they provide more accurate forecasts.
3. The car has a unique social status in Europe. The retailers are smaller thanelsewhere, so the available choice from the retailer’s lot is limited. However,there is great demand for individualized cars, driven by domestic manufac-turers that offer many million combinations. Other manufacturers (e.g.,BMW and Mercedes) have many options. Toyota is implementing the“Feature Model” strategy as a marketing and sales strategy to acceleratevehicle turns. The concept is to identify the most popular mix—for exam-ple, with the Yaris, the goal would be to identify the combinations thatrepresent 80 percent of sales—then advertise, keep the car in the show-room, and ensure that the retailer has demo cars and the vehicles in stock.That objective is a challenge in Europe because the habit of people is tohave a dream car with full spec. As the car becomes a status symbol withindividualization, delivery time increases. Toyota has tried to offer packagesof options to counteract this impact on lead time and to streamline themix. The hub also does some accessory installation, which is termed “post-production options” (PPOs). The hub may change the car to generate asource of profit. So the hub manager may order a car with no radio or CD
Toyota Supply Chain Management212

player, and use a cheaper or better source to install the item. The retailermay do the same to generate an additional source of profit.
4. The wait to get a car is longer. How long does a customer wait to get aToyota? That depends on the model involved, where the car is manufac-tured, and where it is sold. Certain models of Corollas are made in SouthAfrica, others in the United Kingdom. The time varies depending on wherethe car is built—six to eight weeks to ship from South Africa, but only threedays from the United Kingdom. Toyota tries to centralize stock so that assetswapping reduces time. (When a car is at the hub, it may or may not be allocated to a dealer, depending on what country is involved. The centralstock is owned by Toyota, not allocated to the dealer. Though cars would beallocated to dealer orders, there are dummy orders placed so that there is adequate stock.) Delivery time for special orders varies from 10 days to fiveto six months. The general plan is to supply 50 percent from the hub withinone week to 10 days, 30 percent from the pipeline, and the rest individual-ized—for the minicar and small car segment. One of the causes for long leadtimes might be Toyota’s global sourcing strategy. The decision to source partsand vehicles everywhere in the world, where prices are the lowest and quality fits, leads indeed to very long lead times (e.g., with parts fromTurkey, South Africa, and Thailand for European production or SouthAfrican vehicle production).
Reflection PointsThe Toyota supply chain is complex and evolving. That fact is a reminder thatthe company faces the same set of business issues as many other firms that oper-ate in the same environment. Nevertheless, the leadership provided by Toyotahas resulted in a tremendous alignment of supply chain participants excelling at the task of creating value. That feat is in no small measure due to the fact thatthe supply chain participants feel a sense of identity with the Toyota Way andthe v4L principles.
Reflections of Supply Chain Participants 213

This page intentionally left blank

215
Now that you have read about how Toyota manages its supply chain andalso how some other companies have implemented some of theseprinciples, it is important to reflect on the Toyota experience and also
look forward to the potential future innovations in the automotive supply chain.Our hope is that you have been able to clearly understand how Toyota’s
emphasis on organizational learning processes creates a careful balance of variety, velocity, variability, and visibility across the supply chain and that thesummary of the v4Ls at the end of many chapters was helpful to highlight the benefits of implementing Toyota’s processes. However, it should be noted thatToyota has not perfected supply chain processes, and by its emphasis on contin-uous improvement, these processes will evolve over time. In fact, that is one ofToyota’s strengths; Toyota does not rest on successes.
ReflectionIn this closing chapter, we would like to highlight Toyota’s strategic approach tothe principles of supply chain management. The following is a summary.
■ Take a holistic view of the comprehensive structure of the supply chain,which includes the following:� Supply chain–oriented design of products, plants, and packaging� Streamlined inbound and outbound logistics� Limited number of suppliers that are in close proximity to the plant
or cross-dock� Integrated supply chain and kaizen processes across the extended
enterprise■ Consider having suppliers and dealers as partners. Work closely with them
to operate the supply chain effectively and efficiently. Strive to ensure thatToyota partners share in profits during good times and experience some
Reflections
Chapter 15
of the pain during challenging times. Diligently pursue corporate respon-sibility of the supply chain to the society.
■ Ensure stability throughout the supply chain by managing mix andseeing to it that the production rates are synchronized with the use ofheijunka.
■ Break down the walls between functional groups within the supply chainto guarantee that overall supply chain efficiency takes precedence over localefficiencies; in other words, the whole is greater than the sum of the parts.
■ Provide leadership and direction for development, experimentation, andgrowth to the extended enterprise.
FutureA useful exercise is to look toward the future and consider some potentialchanges to the supply chain. Among them are the following:
■ Software-based design. Look for more use of software-controlled func-tions in products. One of the ways to reduce the number of parts thatvary with changes in options is to install the same set of equipment inevery vehicle and turn selected optional functions on and off with soft-ware controls via telematics similar to GM Onstar.1 For example, thesame instrument panel could be installed on all vehicles that includedthe equipment for premium radio, a navigation system, and the like.Then, when the customer purchased the vehicle, the features and func-tions could be selected from a menu on the screen in the dash. These features could be sold at the time of purchase and upgraded anytimeafter. In addition, these features and functions could be marketed to subsequent owners after the vehicle was resold.
■ Target marketing using the Web. Use the Internet to manage demand forselected models and/or options that are experiencing an imbalance in thesupply chain. That could be done on both a regional level and a nationallevel by publishing the “special of the week,” much like the airlines sendout weekly specials for flights that are undersold. To make it fair for alldealers and customers, the offer could be constructed so that the specialoffer is available to the first “n” number of customers to sign up. Forexample: “the first 1,000 customers to place an order for a new Camrywith V6 engine will receive a $500 rebate.” The advantage of such anapproach is that it could be targeted to selected options and turned onand off very quickly.
■ Changing nature of work. Consider the use of team-based collaborationwithin and across the supply chain using modern collaboration technology.
Toyota Supply Chain Management216
Foster team building across units of the same as well as differentorganizations that will challenge and explore ideas that span the supplychain.
■ Improve logistics flexibility. Consider use of adaptive merge-in-transit andreroute-in-transit capability to better match customer preferences toavailability. Perhaps a greater variety can be offered without an increasein costs due to flexible logistics.
■ Changing nature of learning and knowledge creation. The digital revolu-tion has enabled sharing of information as well as preferences. Developmethods and systems to explore this information as it relates to the supplychain; for example, for creating new products, new ordering systems, sug-gesting changes to existing customer service processes, experimentingwith new products and supply chain processes, and learning about newdevelopments in vehicle and related technologies. Develop learning sys-tems that can cater to a worldwide audience of employees and supplychain partners.
We hope that you will find Toyota Supply Chain Management useful in improv-ing your business supply chain processes!
Endnote1. Trademark of General Motors Corporation.
Reflections 217

This page intentionally left blank
219
We will use a set of specific numbers to highlight the 80/20 rule usedin the Mix Planning discussion in Chapter 3 and described indetail in the section “A Simulation Model.” Consider a sample auto
company that sells products in two different markets. The company is consider-ing (1) whether to offer two products in each of two markets or (2) whether tooffer one product in each market. We would like to consider conditions underwhich option 1 or option 2 would be the profitable choice.
Assume that an average of 100 customers represent demand each period andthus potential purchasers in each region. Also assume that the variance of thenumber of potential customers in a period is also 100. Suppose stockkeeping units(SKUs) 1 and 2 are offered in each of two separate regions, A and B. Suppose inregion A, the demand in any week could be driven by two different customer pop-ulations. Customer population 1 would have 47 percent of customers purchasingproduct 1 and 20 percent purchasing product 2, with the remaining customerspurchasing nothing. Customer population 2 would have 20 percent purchasingSKU 1, 20 percent purchasing SKU 2, and the remaining customers purchasingnothing. Suppose that in any week the probability that customers could comefrom either population (one or the other, not both) is 50 percent.
Note that given these numbers, the average demand for SKUs 1 and 2 consist of the probability that the customers belong to populations 1 or 2 andthe conditional probability that they purchase an SKU given they belong to apopulation. Thus, the average demand for SKU 1 is as follows:
(0.5 � 100 � 0.47) � (0.5 � 100 � 0.2) � 33.5
The variance in demand for this SKU arises out of two possible reasons: (1)the variance associated with each separate population’s purchase of the SKU and
Example of Why the 80/20Rule Is Valid
Appendix
(2) the mean demand that varies by population type. Using standard statisticalapproaches, we obtain the variance for SKU 1 as follows:
{0.5 � [(100 � 0.47) � (100 � 0.47)2]} �
{0.5 � [(100 � 0.2) � (100 � 0.2)2]} � (33.5)2
� 235.75
A similar set of calculations generates a mean of 20 and a variance of 20 forSKU 2.
Suppose region 2 has the same set of populations but with SKU 1 and SKU2 swapping parameters. The corresponding mean for SKU 1 in region 2 wouldbe 20, and the corresponding variance for SKU 1 would be 20. The mean forSKU 2 in region 2 would be 33.5 and the variance would be 235.75.
Across both regions, the overall mean demand for SKUs 1 and 2 would be53.5, and the overall standard deviation would be 15.35 for a coefficient of variation of 28.6 percent. (The coefficient of variation is the ratio of the stan-dard deviation and the mean demand.) Intuitively, the higher the coefficient ofvariation, the higher the quantity of stock carried to meet unexpected demand.
Could reducing variety while increasing value through synchronized selling,improved quality, and improved features reduce the variation while maintainingthe mean demand? Assume that SKU 1 is offered in region 1 and attracts 50 percent of the market. Similarly, suppose offering only SKU 2 in region 2generates 50 percent of the market. The corresponding mean demand is 50 units,and the standard deviation is 7.07 for a coefficient of variation of 14.14 percent.These parameters correspond to a more stable overall demand! In turn, thismeans that the plant and suppliers experience lower forecast error and thus canfocus their attention on quality improvement and value generation. Safetystocks can be low across the supply chain, thus lowering inventory costs. All ofthis can assist in improving supply chain profitability.
Appendix220
221
Action protocols, 2, 144beer game and, 198crisis management and, 144dealer and demand fulfillment and, 132logistics and, 119managing suppliers and, 101mix planning and, 35parts ordering and, 83production scheduling and operations
and, 72sales and operations planning and, 53
Aisin Seiki plant fire, 137–139ALDI, Toyota Way applied to, 180–181Annual sales and operations planning, 23,
37–41component planning in, 40creating buy-in and, 40–41planning process for, 38–40
Asian financial crisis, 142Assembly plant operations, 55–60Assembly shop, 57–58Audits, supplier, Toyota checklist for, 98–99Automobile industry:
customers of, 7–9distribution models used by, 9–11incentives offered in, 26products of, 5–7(See also specific manufacturers)
Awareness, creating, 2, 144beer game and, 198crisis management and, 144dealer and demand fulfillment and, 132
logistics and, 118managing suppliers and, 101mix planning and, 35parts ordering and, 83production scheduling and operations
and, 72sales and operations planning and, 53
Awareness, system-level, generating, 2, 144beer game and, 198crisis management and, 144dealer and demand fulfillment and, 132logistics and, 119managing suppliers and, 101mix planning and, 35parts ordering and, 83production scheduling and operations
and, 72sales and operations planning and, 53
BAMA (Bluegrass Automotive ManufacturersAssociation), 95
Banking, Toyota Way applied to, 173–174Beer game, 185–200
interpreting outcome of, 196–197mitigation of bullwhip effect in supply
chain by technology, 197–198rules for, 185–188standard inventory management method
for understanding results of,191–192
at Toyota, 189, 191, 193–196typical outcome of, 188–189, 190
Index
Bluegrass Automotive ManufacturersAssociation (BAMA), 95
BMI (British Midland Airlines), FujitsuComputer Services supply chainrole of, 181
Body shop, 56–57Botkin, Mike, reflections on supply chain,
204–205British Midland Airlines (BMI), Fujitsu
Computer Services supply chainrole of, 181
Build combinations, 6–7Bullwhip effect, in supply chain, mitigation by
technology, 197–198Burbidge, David, reflections on supply chain,
203–204Buyers, serious, 7
Capability, establishing, 2, 144beer game and, 198crisis management and, 144dealer and demand fulfillment and, 132managing suppliers and, 101mix planning and, 35parts ordering and, 83production scheduling and operations
and, 72sales and operations planning and, 53
Capacity planning, 41–42Casella Wines, mix planning by, 33–34CCC21 (Construction of Cost
Competitiveness in the 21stCentury) system, 97–98
Chrysler Group:incentives offered by, 26supplier performance and, 85, 86
CMS (Continental Metal Specialty), 96Commercial fleets, 8–9Communication:
facilitating, managing supplies and, 101Toyota Way and, 162, 163
Comparing Complexity in Your Business(George and Wilson), 34
Construction of Cost Competitiveness in the21st Century (CCC21) system,97–98
Consumers, retail, 7–8Continental Metal Specialty (CMS), 96
Continuously solving root problems, ToyotaWay and, 161
Continuous process flow, managing velocityusing, 152
Control, of processes, managing supplies and, 101
Coordination, Toyota Way and, 167–168Crisis management, 133–145
examples of, 137–144process for, 133–137
Customers of automobile companies, 7–9effect on supply chain, 9employees as, 8fleet, 8–9retail, 7–8suppliers as, 8
Dealer allocation, 19, 122–123choice versus value trade-off and, 126–127
Dealer operations, 130–131Dealers in supply chain, 14–16Dell, customer types and supply chain of, 9Deviations, making visible, 119Distribution (see Outbound logistics)Distribution models, 9–11Dodd, Gary, reflections on supply chain,
208–209
Employees, of automobile companies, as customers, 8
Europe:distribution flow in, 116–117order fulfillment process for, 127–128
European distribution model, 11
Fleet customers, 8–9Fleet orders, 49–50Ford:
customer types and supply chain of, 9incentives offered by, 26outbound logistics at, 117–118supplier performance and, 85, 86Toyota Way applied to accounts payable at,
176–177Forecasting:
parts ordering and, 19–20, 75–76sales, 17–18
Freescale worldwide capacity issue, 141
Index222

Fujitsu Computer Services, Toyota Wayapplied to, 181
Gates, Steve, reflections on supply chain,206–207
General Motors (GM):incentives offered by, 26outbound logistics at, 117–118supplier performance and, 85–87
Global allocation, 46Global markets, of Toyota, 1“Go-and-see,” 119Government entities, as customers, 9Guest engineers, from suppliers, 99
Heijunka, 18, 66–69Hertz, 9Honda:
incentives offered by, 26supplier performance and, 85, 86
Hospital, Toyota Way applied to, 174–175
IBM Credit, Toyota Way applied to, 175–176Inbound logistics, 12–13, 103–110
local, 103–105mutual benefits from partnerships and,
109–110network, 104–105overseas, 107–109route planning and, 105–107
Incentives, 26In-house parts, parts ordering for, 73, 82Innovation at Toyota, 97–98Inspection process, 58–59Internal capacity planning, 41–42Inventory management, standard, understand-
ing results of and beer game,191–192
Japanese distribution model, 11Jishuken concept, 96
Knowledge creation, 217
Lean supply, Toyota Way and, 167–168Learning:
changing nature of, 217practice of, Toyota Way and, 165–167theory of, Toyota Way and, 161–162
Learning principles, 2–3, 184Learning rate, Toyota Way and, 162, 164–165Lexus, dealer allocation of, 123Line, stopping, managing variability by,
154–155Local inbound logistics, 103–105Local parts, parts ordering for, 73, 76–79Logistics, 103–119
improving flexibility of, 217inbound (see Inbound logistics)outbound (see Outbound logistics)package design for, 22
Logistics planning, 20Logistics providers, mutual benefits from
partnerships with, 109–110Long lead time parts, parts ordering for,
73, 79–82Long lead time pipeline management, 109Long-term philosophy, Toyota Way and,
149–151Lykins, Jamey, reflections on supply chain,
202–203
Marketing, complexity reduction and, 28–29Marshaling yard operations, 111–116Metrics, order fulfillment and, 128–129Mix planning, 17, 25–36
complexity reduction and, 27–29non-Toyota examples of, 33–34objective of, 26–27by sales region, 29–32simulation model of, 32–33
Monthly order, 42–43
Necessary parts quantity, 74Network logistics, 104–1059/11 terrorist attacks, 140–141Nissan:
incentives offered by, 26supplier performance and, 85, 86
North American production distributionmodel, 10
North American vehicle distribution, 110–116marshaling yard operations and, 111–116
OEMs [see Supplier(s)]Operational processes, 17–20
relationship to physical flow, 21
Index 223
Order fulfillment process, 123–129Europe model for, 127–128metrics and, 128–129United States model for, 123–127
Original equipment manufacturers (OEMs)[see Supplier(s)]
Outbound logistics, 13–14, 110–118distribution flow in Europe and, 116–117at Ford and General Motors, 117–118North American vehicle distribution and,
110–116tracking progress and, 116
Overseas inbound logistics, 107–109Overseas production distributed in North
America, 10–11
Package design for logistics, 22Paechtner, Achim, reflections on supply chain,
212–213Paint shop, 57Partners, developing, Toyota Way and, 158–161Parts and supplier master database, 75Parts ordering, 73–84
forecasting and, 19–20, 75–76for in-house parts, 73, 82for local parts, 73, 76–79for long lead time parts, 73, 79–82necessary parts quantity and, 74parts and supplier master database and, 75for sequence parts, 73, 82
PDA (plant development activity), 96PDCA (Plan, Do, Check, and Act), 53People, developing, Toyota Way and, 158–161Philosophy, long-term, Toyota Way and,
149–151Physical flow, 12–16
relationship of processes to, 21Pipeline management, 106–107
long lead time, 109Plan, Do, Check, and Act (PDCA), 53Planning processes, 21–23Plant design for capability and flexibility, 22Plant development activity (PDA), 96Plastic shop, 58Prius, development of, 142–144Problems:
managing variability by stopping line to fix,154–155
root, continuously solving, Toyota Wayand, 161
Process design principles, applying, ToyotaWay and, 157–158
Product complexity, reduction of, 27–29Product distribution (see Outbound logistics)Production, in supply chain, 13Production calendar, 43Production planning process, 43–46Production scheduling, 18–19, 60–66
comparison of processes for, 70–71inputs and, 60–61production sequence and, 63sample production plan and, 63–66scheduling process for, 61–62
Production sequence:importance of, 69–70in production scheduling, 63
Product planning and design, 22complexity reduction and, 27–29
Progressive Insurance, Toyota Way applied to,178–179
Pull system, managing visibility using, 152–153Purchasing, 23
Rane Brake Linings, Toyota Way applied to,177–178
Regional allocation, 46, 121–122Rental companies, as customers, 8Retail consumers, 7–8Right process, Toyota Way and, 151–152Route planning, 105–107
Sales aggregation and adjustment, 50–51Sales and operations planning (S&OP), 37–53
annual, 23, 37–41capacity planning and, 41–42comparison of planning methods and, 51–52final sales order preparation and, 46–49global/regional allocation and, 46monthly order and, 42–43production calendar and, 43production planning process and, 43–46sales aggregation and adjustment and, 50–51special conditions and, 49–50
Sales line, inspection process and, 58–59Sales order, final order preparation and, 46–49Sales ordering/forecasting, 17–18
Index224

Sales regions, mix planning by, 29–32Scion, dealer allocation of, 123Scion distribution model, 11Sequence parts, parts ordering for, 73, 82Serious buyers, 7Serious shoppers, 7–87-Eleven, Toyota Way applied to, 177Shoppers, serious, 7–8Shouldice Hospital, Toyota Way applied to,
179–180Smith, Jeffrey, reflections on supply chain,
210–212Software-based design, 216S&OP [see Sales and operations planning
(S&OP)]Sourcing, complexity reduction and, 27–29Stability, managing supplies and, 101Stamping shop, 55–56Standardized tasks, managing variety using,
155–156Supplier(s), 85–102
assisting, 94–96of automobile companies, as customers, 8CCC21 system and, 97–98choosing, 88–89depth of supplier relationships and, 92–94links to Toyota’s processes, 87–90location decisions and, 99–100mutual benefits from partnerships with,
109–110performance differences among, 85–87pressure to perform and, 91selection at Toyota, 89–90supplier guest engineers and, 99in supply chain, 12tiered supplier organization and managing
relationships and, 90–91Toyota’s checklist for audits of, 98–99
Supplier capacity, 42
Tabor, Gene, reflections on supply chain,201–202
Target marketing using the Web, 216Teaching, producing ability to teach and, 3, 144Technology, mitigation of bullwhip effect in
supply chain by, 197–198Terrorist attacks of 9/11, 140–141Tesco, Toyota Way applied to, 182
Titleist, mix planning by, 34Toyota Production System (TPS), 5Toyota Supplier Support Center (TSSC),
95–96Toyota Way, 1, 147–171, 173–184
ALDI example of, 180–181applying process design principles and,
157–158banking example of, 173–174communication and, 162, 163continuously solving root problems and, 161coordination and lean supply and, 167–168developing people and partners and,
158–161Ford accounts payable example of,
176–177Fujitsu Computer Services example of, 181hospital example of, 174–175IBM Credit example of, 175–176learning rate and, 162, 164–165long-term philosophy and, 149–151managing variability by stopping line to fix
problems and, 154–155managing variety using reliable tested tech-
nology that serves people andprocesses and, 156–157
managing variety using standardized tasksand, 155–156
managing velocity using continuous processflow and, 152
managing visibility by leveling workloadand, 154
managing visibility using pull system and,152–153
managing visibility using visual controlsand, 153
practice of learning and, 165–167Progressive Insurance example of, 178–179Rane Brake Linings example of, 177–178right process and, 151–1527-Eleven example of, 177Shouldice Hospital example of, 179–180Tesco example of, 182theory of learning and, 161–162Zara example of, 182–183
TPS (Toyota Production System), 5Tracking progress, outbound logistics and, 116TSSC (Toyota Supplier Support Center), 95–96
Index 225

United States:order fulfillment process for, 123–127West Coast port strike in, 139–140(See also North American entries)
Vanning packing process, 107–108Variability as v4L principle, 3, 184
beer game and, 199crisis management and, 144dealer and demand fulfillment and, 132logistics and, 118managing by stopping line to fix problems,
154–155managing supplies and, 100mix planning and, 35parts ordering and, 83production scheduling and operations and,
72sales and operations planning and, 53
Variety as v4L principle, 3, 183beer game and, 199crisis management and, 144dealer and demand fulfillment and, 132logistics and, 118managing supplies and, 100managing using reliable tested technology
that serves people and processes,156-157
managing using standardized tasks,155–156
mix planning and, 35parts ordering and, 83production scheduling and operations and,
71sales and operations planning and, 52
Vehicle allocation, 121–122Vehicle specifications, 5–7Velocity as v4L principle, 3, 183
beer game and, 199
crisis management and, 144dealer and demand fulfillment and, 132logistics and, 118managing supplies and, 100managing using continuous process flow,
152mix planning and, 35parts ordering and, 83production scheduling and operations
and, 71sales and operations planning and, 53
v4L framework, 2–4learning principles and, 2–3, 184principles of (see Variability as v4L
principle; Variety as v4L principle;Velocity as v4L principle; Visibility as v4L principle)
Visibility as v4L principle, 3, 184beer game and, 199crisis management and, 144dealer and demand fulfillment and, 132logistics and, 118managing by leveling workload, 154managing supplies and, 100managing using pull system, 152–153managing using visual controls, 153mix planning and, 35parts ordering and, 83production scheduling and operations and,
72sales and operations planning and, 53
Visual controls, managing visibility using, 153
West Coast port strike, 139–140Work, changing nature of, 216Workload, managing visibility by leveling, 154
Zara, Toyota Way applied to, 182–183
Index226
Ananth V. Iyer is the Susan Bulkeley Butler Chair in operations management atthe Krannert School of Management, Purdue University. He has supply chainexpertise in a wide range of industries, from groceries and apparel to garbagepickup and automobiles.
Sridhar Seshadri is a professor of operations management in the IROMDepartment at the McCombs School of Business, University of Texas at Austin.He has done extensive research on supply chain contracts and risk management.
Roy Vasher is a former Toyota senior executive. Vasher played a leading role inToyota’s North American and European initiatives to streamline the supplychain to reduce order-to-delivery lead time. Currently he is president of RPVConsulting, LLC.
About the Authors
Related Documents