Presentation to Investors Ryuzo Sakamoto President November 4, 2010 (Analysts’ Meeting) TOYOBO Co., Ltd.

Toyobo 2010_11_04presentation
Jul 16, 2015
Welcome message from author
This document is posted to help you gain knowledge. Please leave a comment to let me know what you think about it! Share it to your friends and learn new things together.
Transcript

Presentation to Investors
Ryuzo SakamotoPresident
November 4, 2010(Analysts’ Meeting)
TOYOBO Co., Ltd.

2
Significant recovery in operating income, exceeding the previous forecast
\bn.
H1 H2 H1 H2 H1 H2(Forecasts)
202.5 164.8 154.9 163.9 169.7 170.3
9.7 1.5 3.0 8.5 10.9 11.1Operating income
FY 3/11
Net sales
FY 3/09 FY 3/10
Highlights
H1 FY 3/11 Results
FY 3/11 Forecasts
-Rise in shipments for flat panel displays, electronics, and automotive fields-Launch of new products improves product portfolio-Constraints on fixed cost through cost reduction measures (CR100)
Posted net loss due to the loss on valuation of investment securities
Full-year forecasts for profit are unchanged, with continued healthy demand expected in lifestyle and safety, environment, and life science fields.

Contents
Results for the 1st Half of FY 3/11
Forecasts for FY 3/11
Appendix
III Progress of Medium-Term Plan (FY 3/11-FY 3/14)
I
II

I. Results for the 1st Half of FY 3/11
5
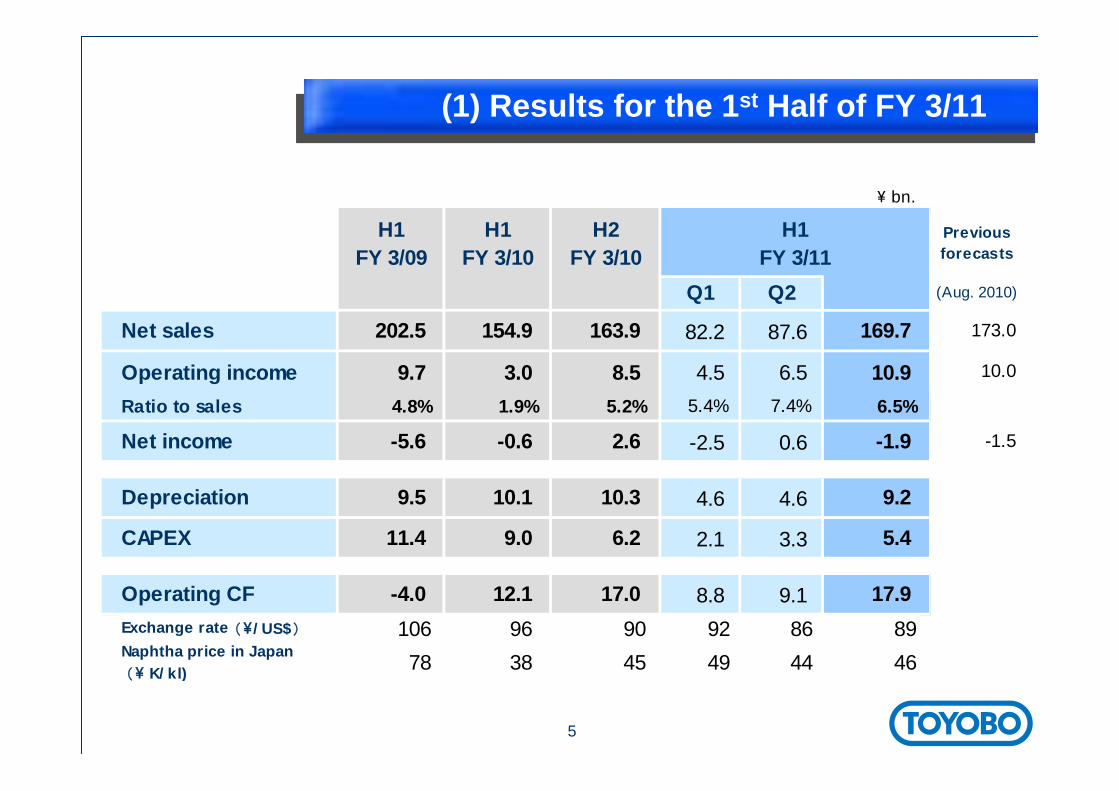
bn.\
(Aug. 2010)
Net sales 202.5 154.9 163.9 82.2 87.6 169.7 173.0
Operating income 9.7 3.0 8.5 4.5 6.5 10.9 10.0
Ratio to sales 4.8% 1.9% 5.2% 5.4% 7.4% 6.5%
Net income -5.6 -0.6 2.6 -2.5 0.6 -1.9 -1.5
Depreciation 9.5 10.1 10.3 4.6 4.6 9.2
CAPEX 11.4 9.0 6.2 2.1 3.3 5.4
Operating CF -4.0 12.1 17.0 8.8 9.1 17.9 Exchange rate ( /US$\ ) 106 96 90 92 86 89Naphtha price in Japan ( K/kl)\
78 38 45 49 44 46
Previousforecasts
H1FY 3/10
H2FY 3/10
H1FY 3/09
H1FY 3/11
Q1 Q2
(1) Results for the 1st Half of FY 3/11

6
bn.\
Total assets 443.8 438.4 421.7
Inventories 75.8 62.5 62.4
Net assets 134.0 131.1 127.0
Shareholders' equity 98.3 107.1 103.0
(Equity ratio) 22.1% 24.4% 24.4%
Minority interests 35.7 24.0 24.0
Interest-bearing debt 178.9 171.0 161.0
D/E ratio 1.82 1.60 1.56
ROA : Operating income / Total assets 2.5% 2.6% 5.2%
Mar. 31,2009
Mar. 31,2010
Sep. 30,2010
(2) Financial Position

7
bn.\
H1FY 3/09
H1FY 3/10
H2FY 3/10
H1FY 3/11
H1FY 3/09
H1FY 3/10
H2FY 3/10
H1FY 3/11
Films & Functional Polymers 69.7 55.3 59.7 64.0 4.8 1.2 4.9 6.9
Industrial Materials 41.6 28.7 34.4 34.5 2.9 0.7 1.6 2.4
Life Science 17.0 15.7 16.7 14.9 1.9 1.7 2.3 1.7
128.3 99.7 110.8 113.5 9.6 3.6 8.8 11.0 Operating income ratio 7.5% 3.6% 8.0% 9.7%
Textiles 59.9 45.9 42.5 44.3 1.0 0.2 0.2 0.3
Real Estate and Others 14.3 9.3 10.7 12.0 0.9 0.7 1.1 1.2 Elimination & Corporate - - - - -1.8 -1.6 -1.7 -1.5
202.5 154.9 163.9 169.7 9.7 3.0 8.5 10.9Total
Net Sales Operating Income
Specialty Businesses
(3) Results by Segment
8
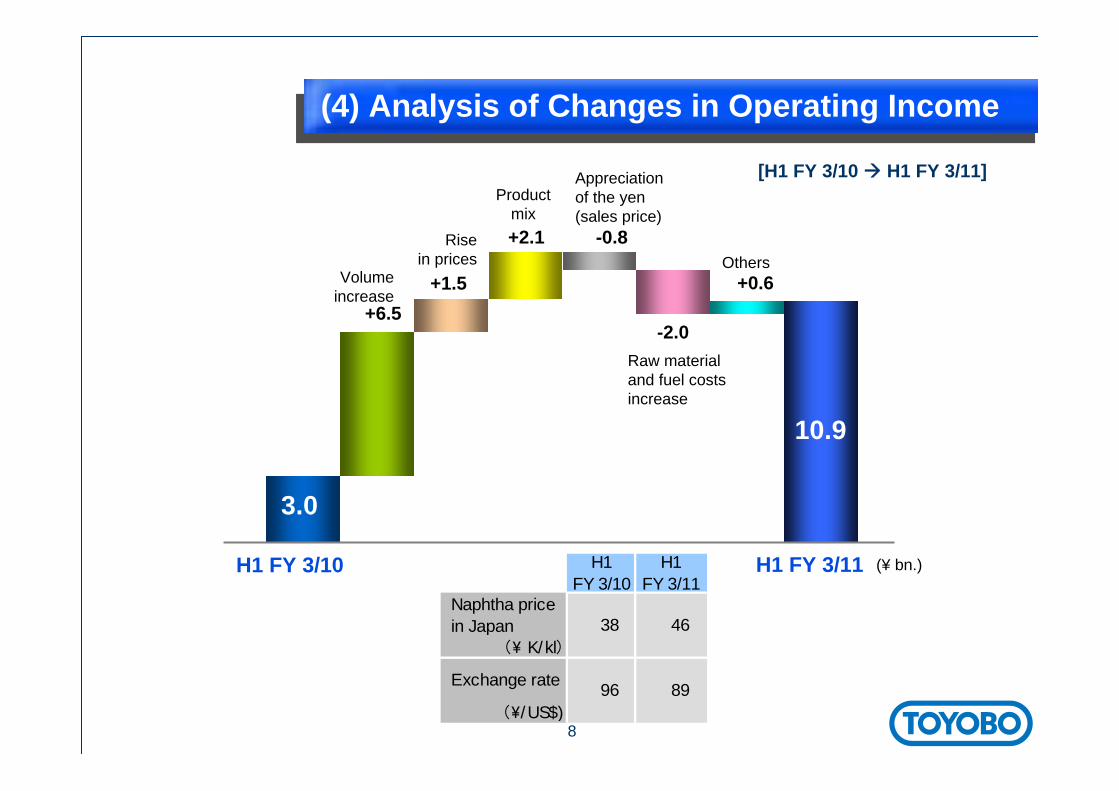
-2.0
-0.8
+1.5+6.5
+0.6
H1 FY 3/10
3.0
+2.1
10.9
Volumeincrease
Raw material and fuel costs increase
Others
Appreciationof the yen(sales price)
Rise in prices
Productmix
[H1 FY 3/10 H1 FY 3/11]
(4) Analysis of Changes in Operating Income
Naphtha pricein Japan
( K/kl\ )
Exchange rate
( /US$)\
H1FY 3/10
H1FY 3/11
96 89
38 46
H1 FY 3/11 (¥ bn.)
9
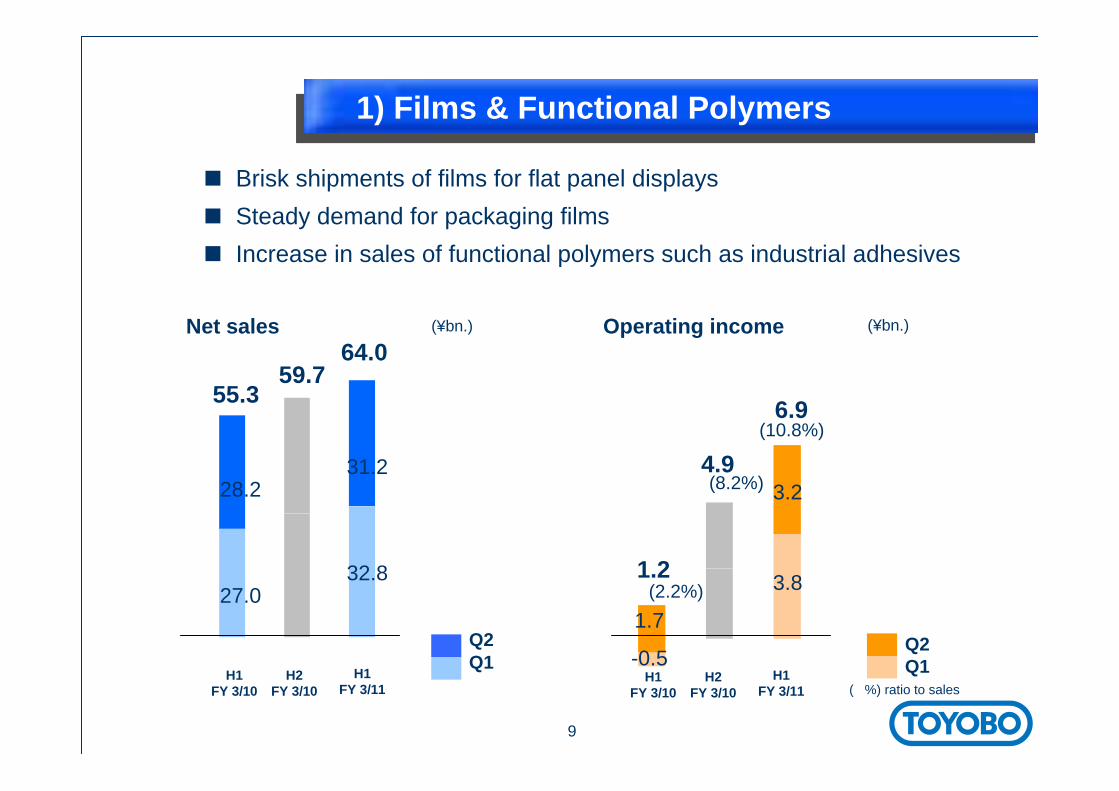
Brisk shipments of films for flat panel displaysSteady demand for packaging films
1) Films & Functional Polymers
Increase in sales of functional polymers such as industrial adhesives
Net sales Operating income
Q1Q2
28.2
27.0
31.2
32.8
-0.5
3.2
3.8
1.7
(10.8%)
( %) ratio to sales
55.359.7
64.0
1.2
4.9
6.9
(2.2%)
(8.2%)
(¥bn.)
H1FY 3/10
H2FY 3/10
H1FY 3/11
H1FY 3/10
H2FY 3/10
H1FY 3/11
(¥bn.)
Q1Q2
10
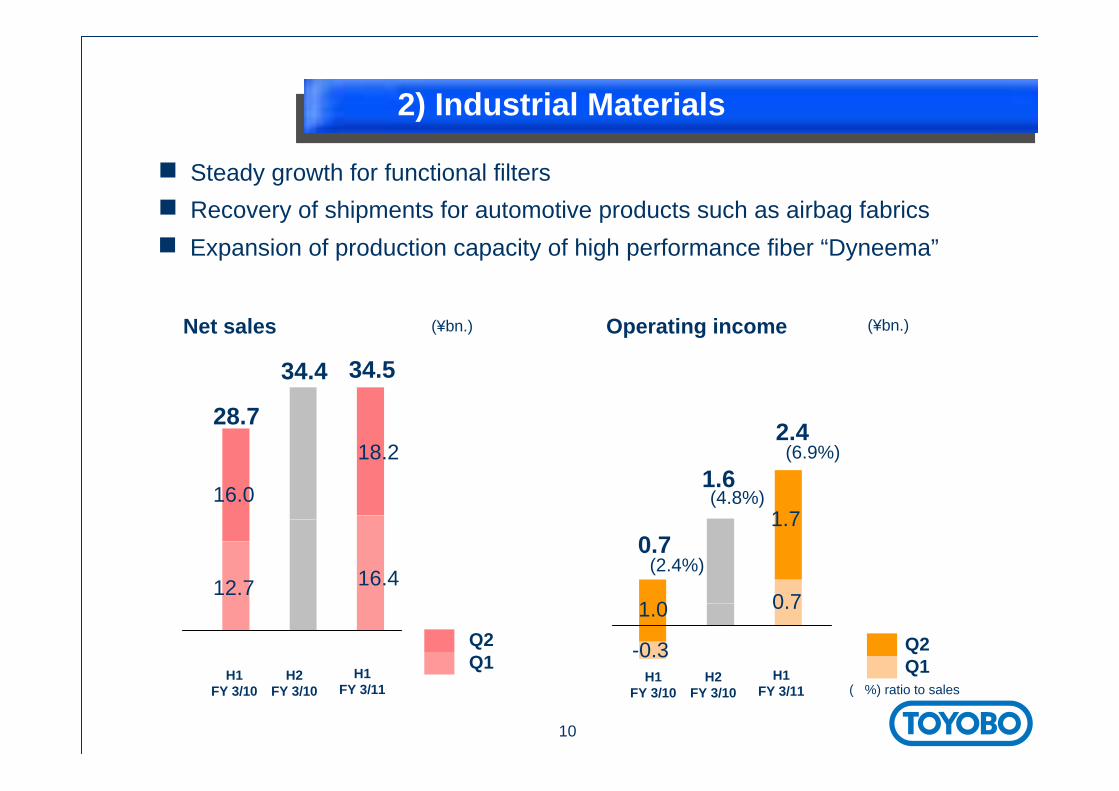
【 Net sales 】
16.0
12.7
18.2
16.4
-0.3
1.7
0.71.0
(6.9%)
28.7
34.4 34.5
0.7
1.6
2.4
(2.4%)
(4.8%)
H1FY 3/10
H2FY 3/10
H1FY 3/11
H1FY 3/10
H2FY 3/10
H1FY 3/11
Q1Q2
2) Industrial Materials
Steady growth for functional filters Recovery of shipments for automotive products such as airbag fabricsExpansion of production capacity of high performance fiber “Dyneema”
Net sales Operating income(¥bn.) (¥bn.)
Q1Q2
( %) ratio to sales

11
8.7
7.0
8.1
6.8
0.6
1.1
0.6
1.2
(11.4%)
15.716.7
14.9
1.7
2.3
1.7(11.1%)
(13.7%)
3) Life Science
Increase in sales of bioproducts such as diagnostic enzymes
Medical membranes affected by government price revisionsToyobo RO membranes adopted for use in one of the largest seawater desalination plants in the Middle East
H1FY 3/10
H2FY 3/10
H1FY 3/11
H1FY 3/10
H2FY 3/10
H1FY 3/11
Q1Q2
Net sales Operating income (¥bn.) (¥bn.)
Q1Q2
( %) ratio to sales
12
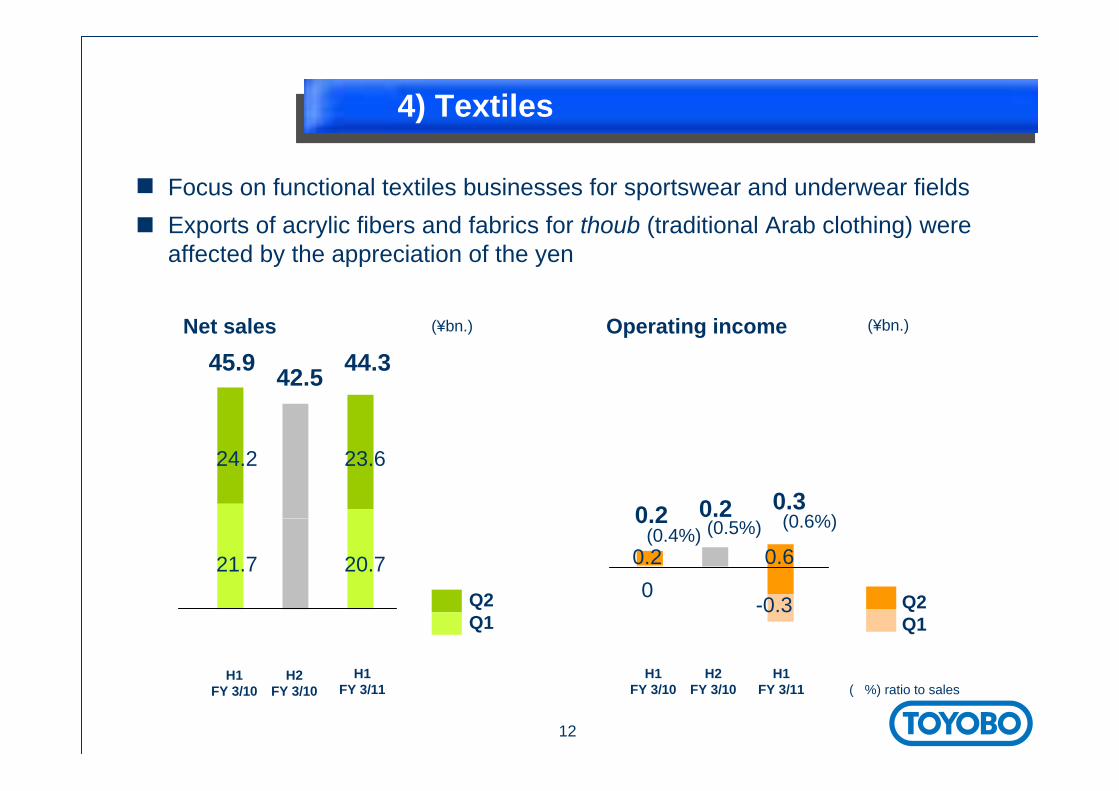
24.2
21.7
23.6
20.70
0.6
-0.3
0.2
(0.6%)
45.9 42.5 44.3
0.2 0.2 0.3(0.4%) (0.5%)
4) Textiles
Focus on functional textiles businesses for sportswear and underwear fields Exports of acrylic fibers and fabrics for thoub (traditional Arab clothing) were affected by the appreciation of the yen
Q2
H1FY 3/10
H2FY 3/10
H1FY 3/11
H1FY 3/10
H2FY 3/10
H1FY 3/11
Q1Q2
Q1
Net sales Operating income(¥bn.) (¥bn.)
( %) ratio to sales

II. Forecasts for FY 3/11
14
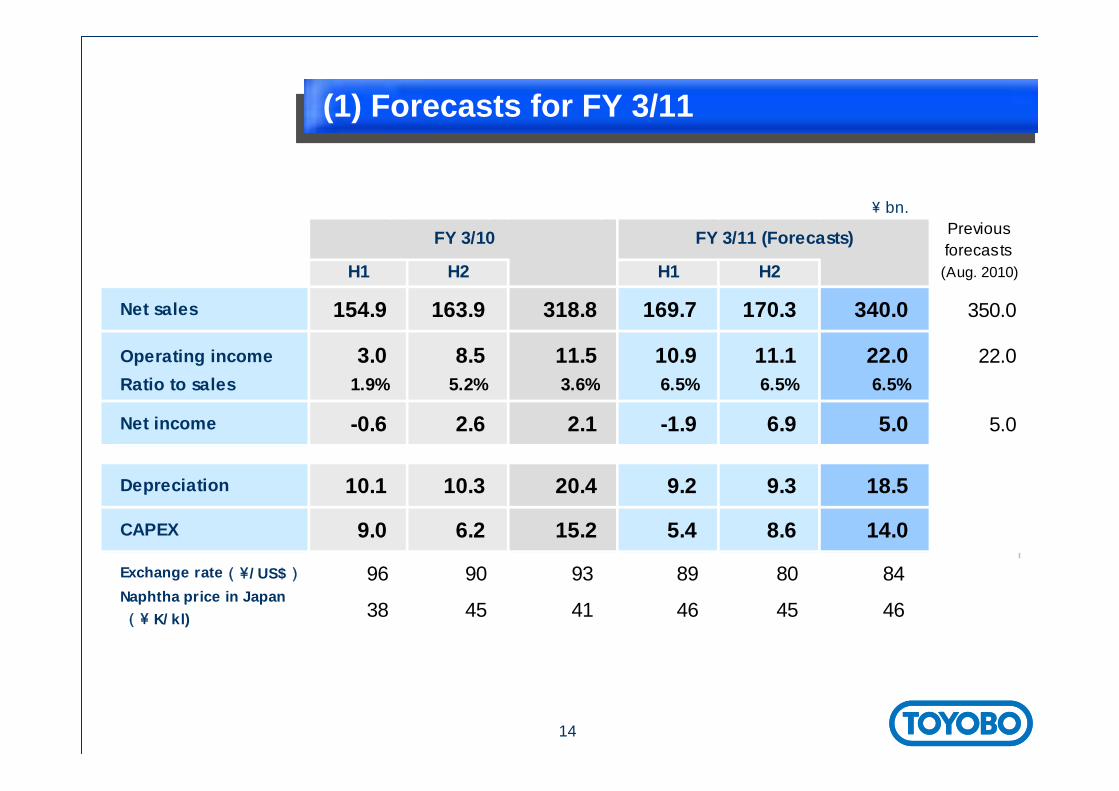
bn.\
Previousforecasts(Aug. 2010)
Net sales 154.9 163.9 318.8 169.7 170.3 340.0 350.0
Operating income 3.0 8.5 11.5 10.9 11.1 22.0 22.0Ratio to sales 1.9% 5.2% 3.6% 6.5% 6.5% 6.5%
Net income -0.6 2.6 2.1 -1.9 6.9 5.0 5.0
Depreciation 10.1 10.3 20.4 9.2 9.3 18.5
CAPEX 9.0 6.2 15.2 5.4 8.6 14.0
Exchange rate( /US$\ ) 96 90 93 89 80 84 Naphtha price in Japan ( K/kl)\ 38 45 41 46 45 46
FY 3/10
H1 H1
FY 3/11 (Forecasts)
H2H2
(1) Forecasts for FY 3/11
15
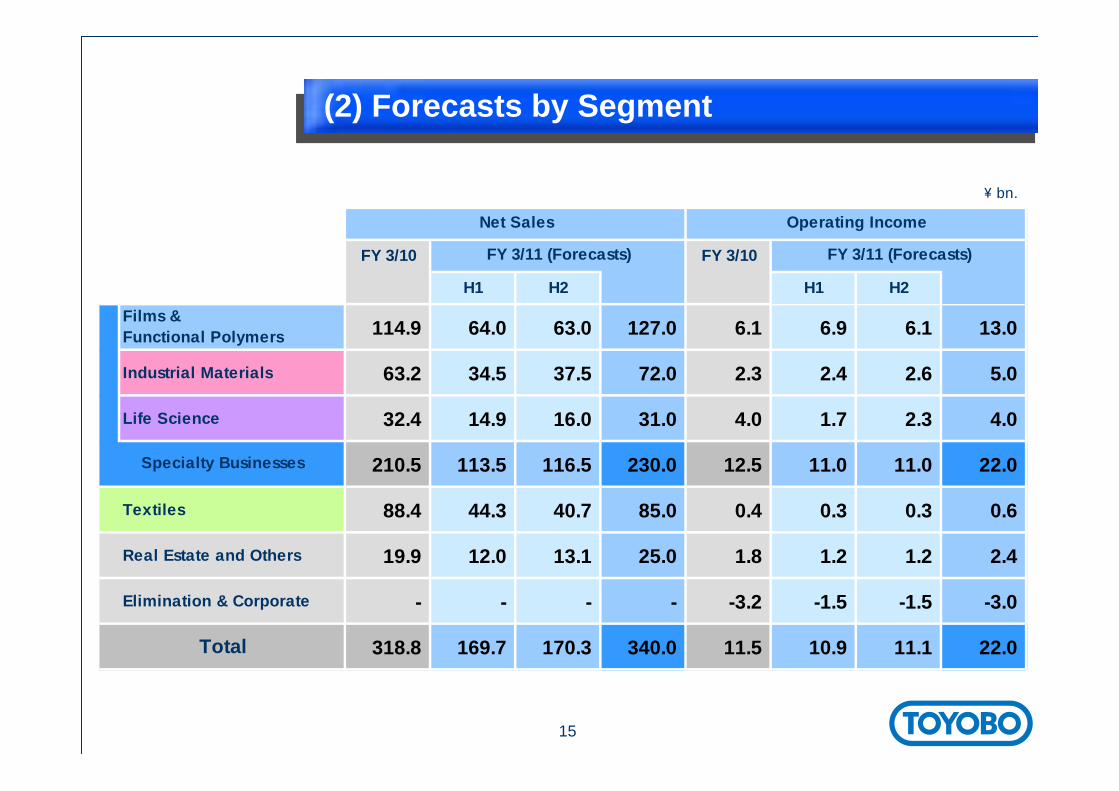
bn.\
FY 3/10 FY 3/10
H1 H2 H1 H2
Films &Functional Polymers 114.9 64.0 63.0 127.0 6.1 6.9 6.1 13.0
Industrial Materials 63.2 34.5 37.5 72.0 2.3 2.4 2.6 5.0
Life Science 32.4 14.9 16.0 31.0 4.0 1.7 2.3 4.0
210.5 113.5 116.5 230.0 12.5 11.0 11.0 22.0
Textiles 88.4 44.3 40.7 85.0 0.4 0.3 0.3 0.6
Real Estate and Others 19.9 12.0 13.1 25.0 1.8 1.2 1.2 2.4
Elimination & Corporate - - - - -3.2 -1.5 -1.5 -3.0
318.8 169.7 170.3 340.0 11.5 10.9 11.1 22.0 Total
FY 3/11 (Forecasts) FY 3/11 (Forecasts)
Net Sales Operating Income
Specialty Businesses
(2) Forecasts by Segment
16
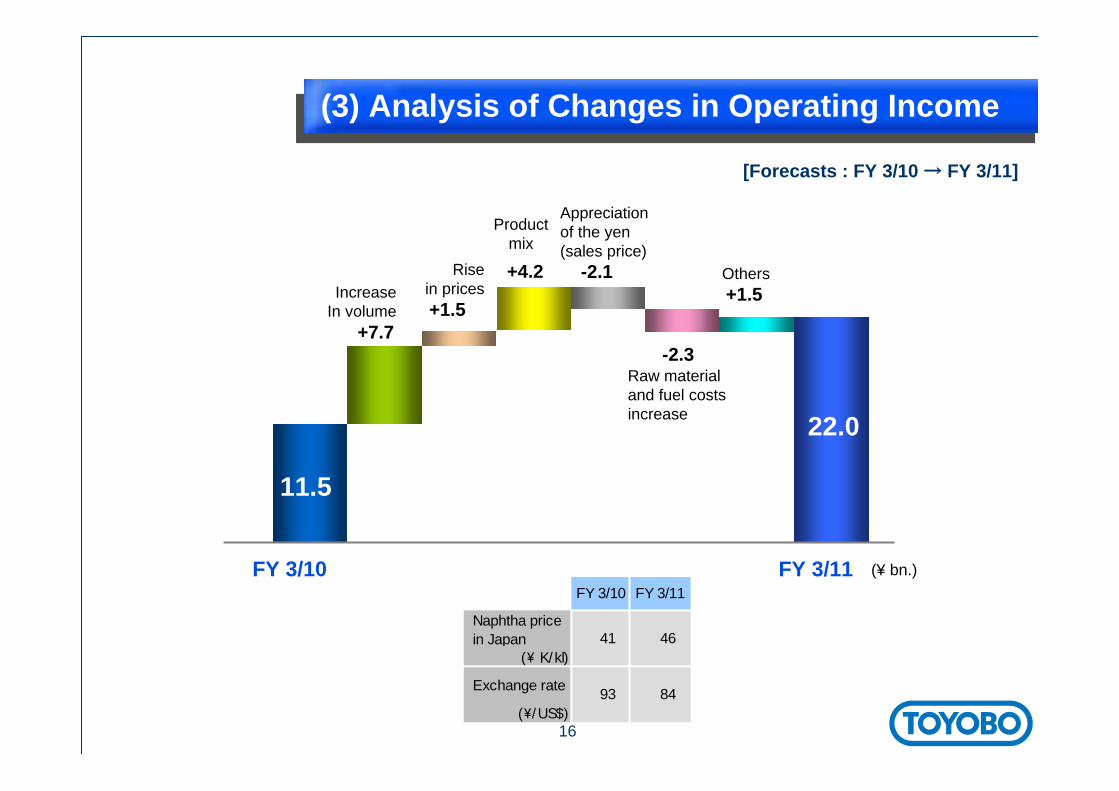
-2.3
-2.1
+1.5+7.7
+1.5
FY 3/10
11.5
22.0
+4.2
(¥ bn.)
IncreaseIn volume
Others
Appreciationof the yen(sales price)
Rise in prices
Productmix
Naphtha pricein Japan
( K/kl)\
Exchange rate
( /US$)\
FY 3/10 FY 3/11
93 84
41 46
Raw material and fuel costs increase
[Forecasts : FY 3/10 → FY 3/11]
(3) Analysis of Changes in Operating Income
FY 3/11

III. Progress of Medium-Term Plan

18
““The category leader for providing new value in the environment,The category leader for providing new value in the environment,life science, and highlife science, and high--function products fieldsfunction products fields””
(1) Medium-Term Plan
0
500
1,000
1,500
2,000
2,500
3,000
3,500
4,000
4,500
2005 2006 2007 2008 2009 2010予想 2013計画
0
50
100
150
200
250
300
350
400
450
売上高(スペシャルティ) 売上高(繊維・その他) 営業利益(右軸)
401.9431.4
367.3
426.7400.0
318.8340.0
29.9 30.427.1
11.5
22.0
30.0
11.2
Medium-Term Plan
450
400
350
300
250
200
150
100
50
0
45
40
35
30
25
20
15
10
5
0
Sales in the specialty businessesSales in the textiles, real estate and other businessesOperating income
FY 3/06 3/07 3/08 3/09 3/10 3/11 3/14Forecast Plan
““The category leader for providing new value in the environment,The category leader for providing new value in the environment,life science, and highlife science, and high--function products fieldsfunction products fields””
¥ bn.
・Expand specialty businesses・Restructure textiles business
New growthNew growthstagestage

19
Continual reform of the business portfolioContinual reform of the business portfolio
(2) Strategies and Action Plan
1) Capital investment
2) Overseas business development
3) Improvement of the product portfolio
4) Improved asset efficiency
StrategiesStrategies
Action PlanAction Plan
Aggressive Aggressive expansion of expansion of sspecialty pecialty bbusinesses usinesses
20
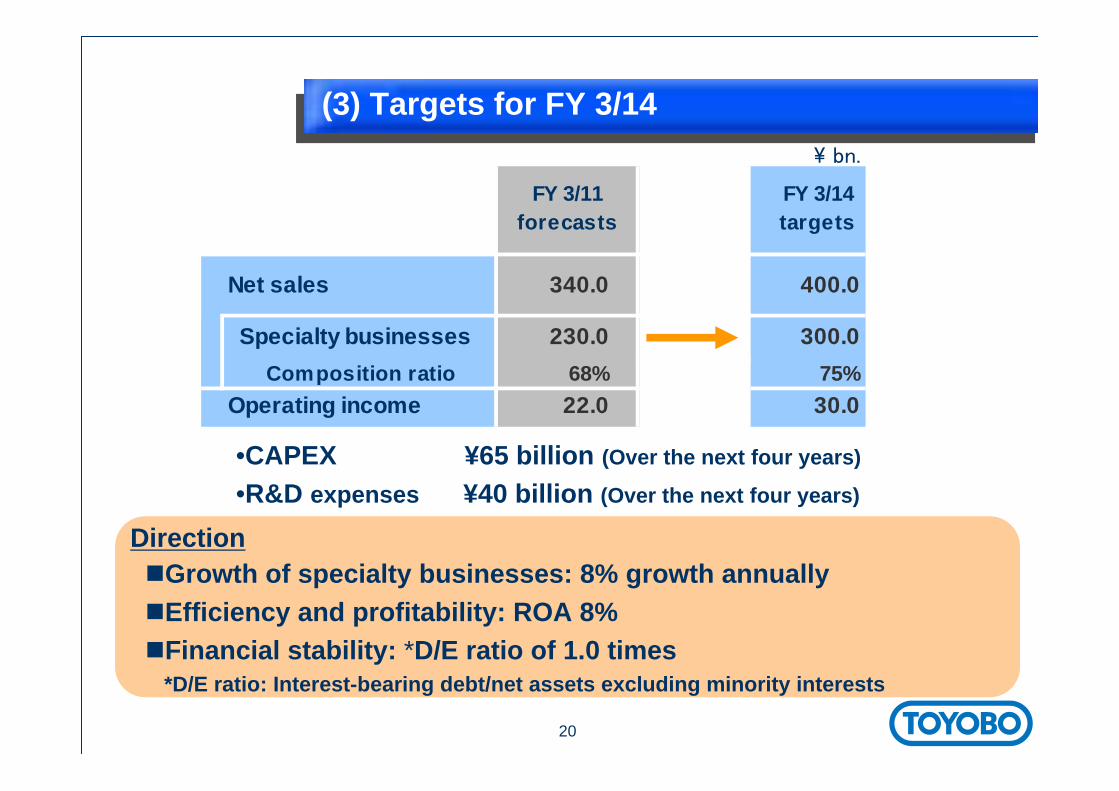
•CAPEX ¥65 billion (Over the next four years)
•R&D expenses ¥40 billion (Over the next four years)
\ bn.
Net sales 340.0 400.0
Specialty businesses 230.0 300.0Composition ratio 68% 75%
Operating income 22.0 30.0
FY 3/11forecasts
FY 3/14targets
(3) Targets for FY 3/14
Growth of specialty businesses: 8% growth annuallyEfficiency and profitability: ROA 8%Financial stability: *D/E ratio of 1.0 times
*D/E ratio: Interest-bearing debt/net assets excluding minority interests
Direction
21
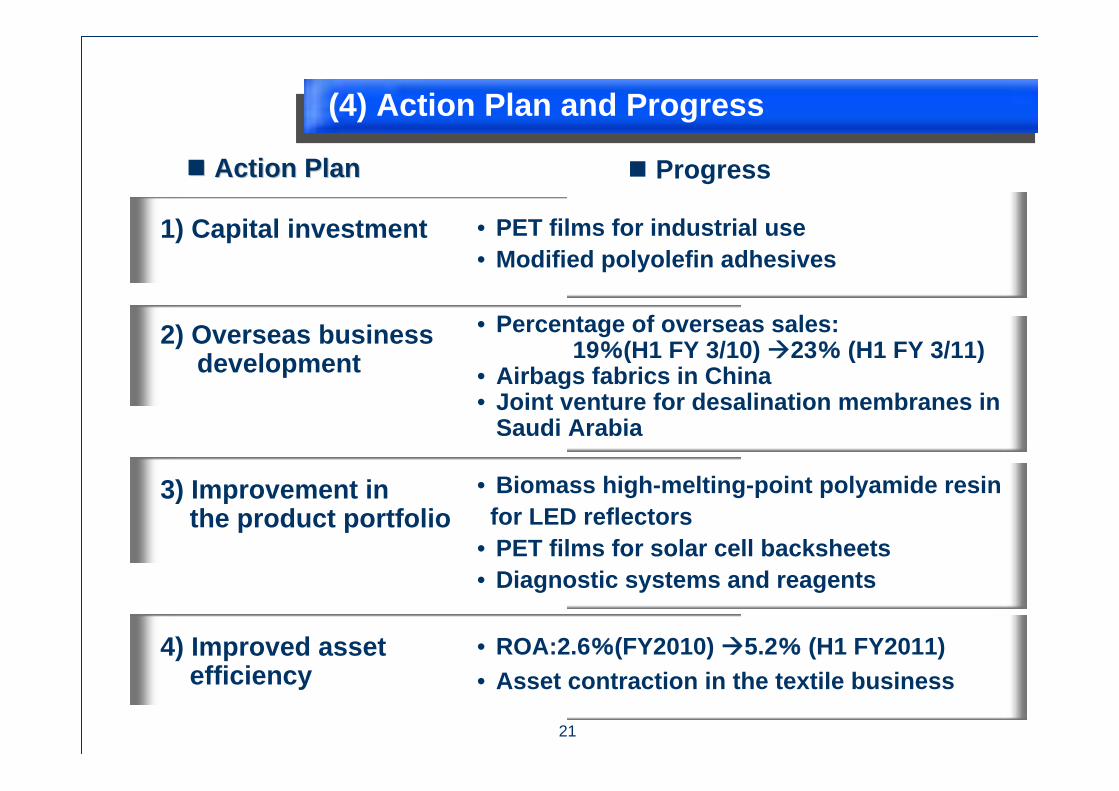
(4) Action Plan and Progress
Progress
• Percentage of overseas sales:19%(H1 FY 3/10) 23% (H1 FY 3/11)
• Airbags fabrics in China• Joint venture for desalination membranes in
Saudi Arabia
1) Capital investment
2) Overseas businessdevelopment
Action PlanAction Plan
• PET films for industrial use• Modified polyolefin adhesives
• Biomass high-melting-point polyamide resin for LED reflectors
• PET films for solar cell backsheets• Diagnostic systems and reagents
3) Improvement in the product portfolio
4) Improved asset efficiency
• ROA:2.6%(FY2010) 5.2% (H1 FY2011)• Asset contraction in the textile business

Appendix

Summary1. In June 2003, an accident involving body armor (BA) using Zylon fiber occurred in Pennsylvania, USA. (This
is the only accident in which a bullet penetrated BA.)2. The injured/deceased persons and purchasers of the same type of BA sued the BA manufacturer and
Toyobo for damages.3. An ex-director of the BA manufacturer filed a lawsuit based on the U.S. False Claims Act.
The U.S. Government (DOJ) participated as a plaintiff in this lawsuit.4. DOJ also filed a lawsuit relating to BA except for the BA mentioned above. 5. Class action by the purchasers has been settled. (Amount: ¥4.4 billion in total. Extraordinary loss
posted in the first half of FY 3/06.)Actions by the injured/deceased persons (product liability cases) have been settled.
6. In a lawsuit filed by German state governments, a lower court dismissed the action, ruling that it did not have jurisdiction, and a settlement was reached while the case was pending before the U.S. Court of Appeals.
7. In a lawsuit filed by Second Chance Body Armor, a bench trial started in November 2009.
<Progress of litigation> (As of November 2, 2010)Classaction
Product liability Government-related
Plaintiff PurchasersPennsylvania
policeman, etc. Arkansas State US DOJ, et al.Second Chance
Body ArmorPoint BlankSolutions
First ChoiceArmor &
Equipment
Tw o Germanstates
Status Settled(05/10/26)
Settled(06/1, 06/11, 07/1)
No progressafter receipt of
claims
Discovery isproceeding.
Trial isproceeding.
A complaint isserved.
A complaint isserved.
Settled(09/2/26)
Numberof cases 10 4 1 2 1 1 1 1
Government-related BA manufacturer
Appendix 1)Status of Litigation related toBody Armor using ZYLON Fiber

24
Appendix 2) Forecasts of Sales by Segment
bn.\
FY 3/11 FY 3/14Forecasts Plan
Films & Functional Polymers 127.0 160.0 +33.0
Industrial Materials 72.0 85.0 +13.0
Life Science 31.0 55.0 +24.0
Specialty Businesses 230.0 300.0 +70.0
Textiles 85.0 82.0 - 3.0
Real Estate and Others 25.0 18.0 - 7.0
340.0 400.0 +60.0Total
Change
25
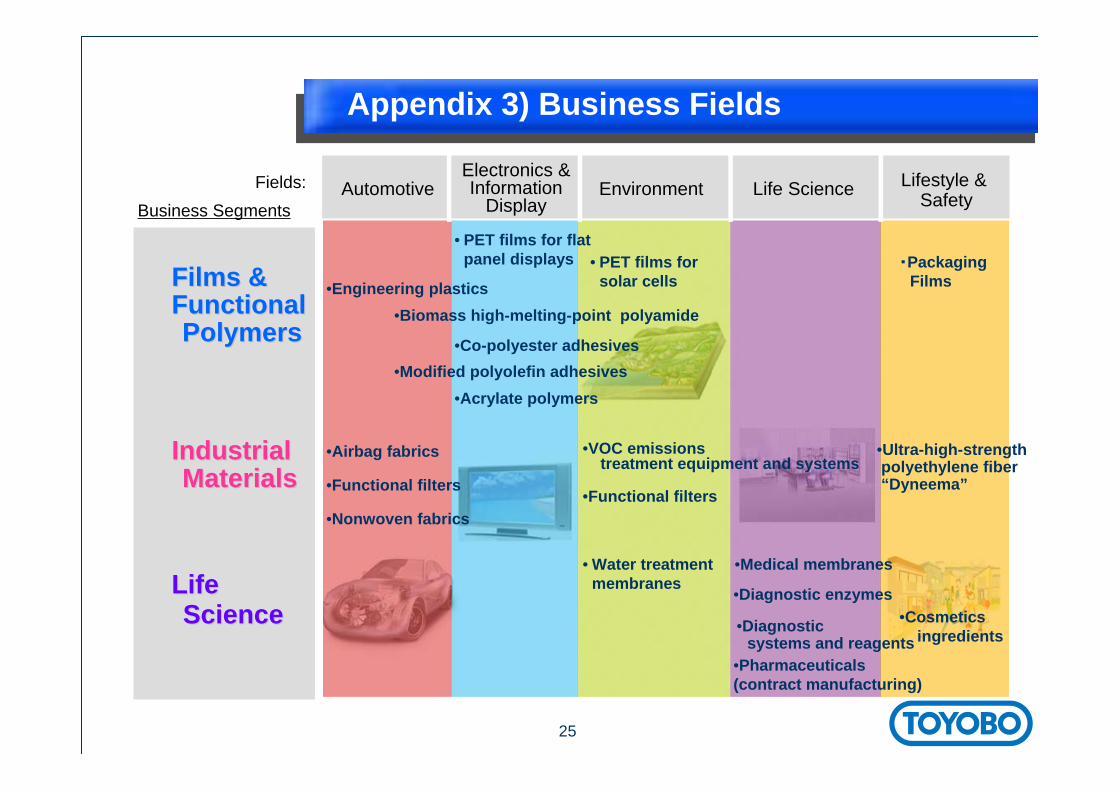
Appendix 3) Business Fields
• PET films for flat panel displays
LifeLifeScienceScience
Industrial Industrial MaterialsMaterials
Films &Films &Functional Functional PolymersPolymers
Fields: Business Segments
•Airbag fabrics •VOC emissions treatment equipment and systems
• Water treatmentmembranes
•Functional filters
•Engineering plastics
•Functional filters
•Pharmaceuticals(contract manufacturing)
•Diagnostic enzymes
•Diagnostic systems and reagents
•Medical membranes
•Ultra-high-strengthpolyethylene fiber“Dyneema”
•Biomass high-melting-point polyamide
• PET films for solar cells
AutomotiveElectronics &Information
DisplayEnvironment Life Science Lifestyle &
Safety
•Modified polyolefin adhesives•Co-polyester adhesives
•Acrylate polymers
•Nonwoven fabrics
•Cosmeticsingredients
・Packaging Films

26All Rights Reserved
The business performance forecasts and targets included in
the business plans contained in this presentation are based on
information known to the Company’s management as of the
day of presentation. Please be aware that the content of the
future forecasts may differ significantly from actual results, due
to a number of unforeseeable factors.
Please Note
Related Documents