This is an Accepted Manuscript, which has been through the Royal Society of Chemistry peer review process and has been accepted for publication. Accepted Manuscripts are published online shortly after acceptance, before technical editing, formatting and proof reading. Using this free service, authors can make their results available to the community, in citable form, before we publish the edited article. We will replace this Accepted Manuscript with the edited and formatted Advance Article as soon as it is available. You can find more information about Accepted Manuscripts in the Information for Authors. Please note that technical editing may introduce minor changes to the text and/or graphics, which may alter content. The journal’s standard Terms & Conditions and the Ethical guidelines still apply. In no event shall the Royal Society of Chemistry be held responsible for any errors or omissions in this Accepted Manuscript or any consequences arising from the use of any information it contains. Accepted Manuscript Environmental Science Nano rsc.li/es-nano View Article Online View Journal This article can be cited before page numbers have been issued, to do this please use: E. Vejerano, Y. Ma, A. Holder, A. Pruden, E. Subbiah and L. Marr, Environ. Sci.: Nano, 2015, DOI: 10.1039/C4EN00182F.

Welcome message from author
This document is posted to help you gain knowledge. Please leave a comment to let me know what you think about it! Share it to your friends and learn new things together.
Transcript
This is an Accepted Manuscript, which has been through the Royal Society of Chemistry peer review process and has been accepted for publication.
Accepted Manuscripts are published online shortly after acceptance, before technical editing, formatting and proof reading. Using this free service, authors can make their results available to the community, in citable form, before we publish the edited article. We will replace this Accepted Manuscript with the edited and formatted Advance Article as soon as it is available.
You can find more information about Accepted Manuscripts in the Information for Authors.
Please note that technical editing may introduce minor changes to the text and/or graphics, which may alter content. The journal’s standard Terms & Conditions and the Ethical guidelines still apply. In no event shall the Royal Society of Chemistry be held responsible for any errors or omissions in this Accepted Manuscript or any consequences arising from the use of any information it contains.
Accepted Manuscript
Environmental ScienceNano
rsc.li/es-nano
View Article OnlineView Journal
This article can be cited before page numbers have been issued, to do this please use: E. Vejerano, Y.
Ma, A. Holder, A. Pruden, E. Subbiah and L. Marr, Environ. Sci.: Nano, 2015, DOI: 10.1039/C4EN00182F.
Nano impact statement
As more engineered nanomaterials are incorporated into consumer products, nanomaterials will inevitably
enter the waste stream, and it is certain that some will be incinerated. The toxicity of nanomaterials
stemming from the incineration on nanowaste is unknown. Incineration can modify the physico-chemical
properties of a nanomaterial and the emitted particulate matter and potentially alter their toxicity.
Page 1 of 14 Environmental Science: Nano
Env
iron
men
talS
cien
ce:N
ano
Acc
epte
dM
anus
crip
t
Publ
ishe
d on
13
Janu
ary
2015
. Dow
nloa
ded
on 1
5/01
/201
5 18
:58:
59.
View Article OnlineDOI: 10.1039/C4EN00182F
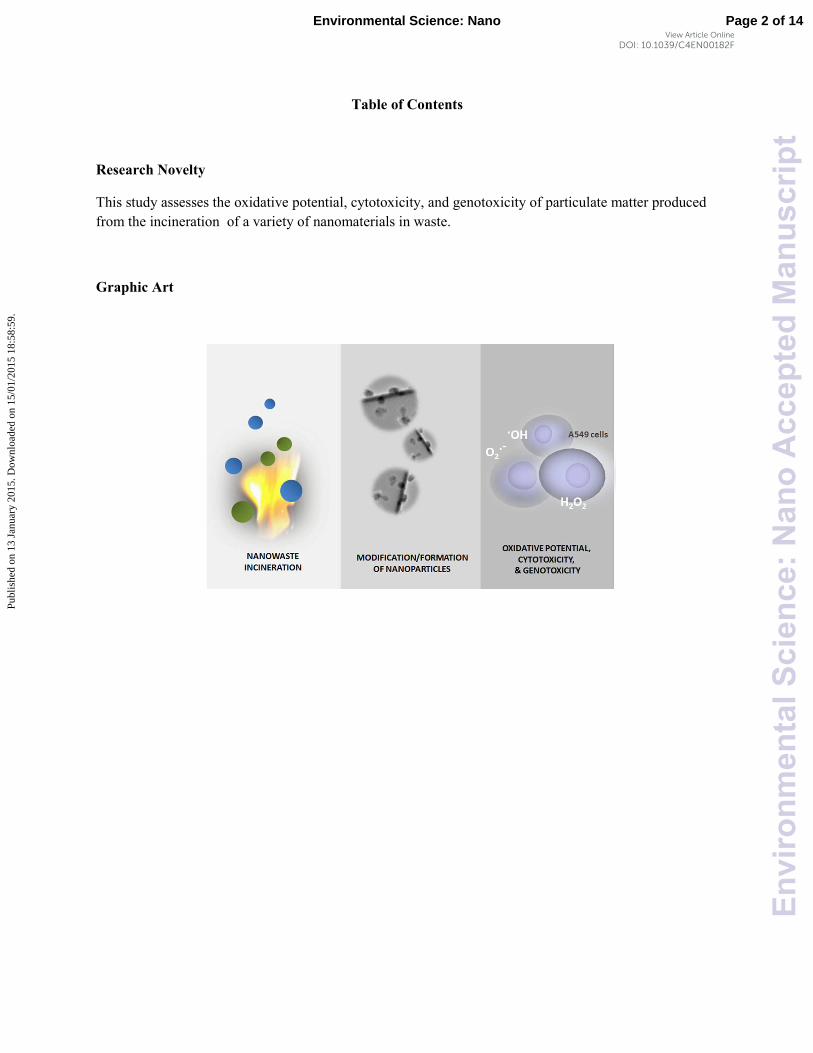
Table of Contents
Research Novelty
This study assesses the oxidative potential, cytotoxicity, and genotoxicity of particulate matter produced
from the incineration of a variety of nanomaterials in waste.
Graphic Art
Page 2 of 14Environmental Science: Nano
Env
iron
men
talS
cien
ce:N
ano
Acc
epte
dM
anus
crip
t
Publ
ishe
d on
13
Janu
ary
2015
. Dow
nloa
ded
on 1
5/01
/201
5 18
:58:
59.
View Article OnlineDOI: 10.1039/C4EN00182F
Environmental Science:Nano RSCPublishing
ARTICLE
This journal is © The Royal Society of Chemistry 2014 Environ. Sci.: Nano, 2014, 00, 1-3 | 1
Cite this: DOI: 10.1039/x0xx00000x
Received 00th January 2013,
Accepted 00th January 2013
DOI: 10.1039/x0xx00000x
www.rsc.org/
Toxicity of Particulate Matter from Incineration
of Nanowaste
Eric P. Vejerano, Yanjun Ma, Amara L. Holder, Amy Pruden, Subbiah Elankumaran, and Linsey C. Marra
Disposal of some nanomaterial-containing waste by incineration and the subsequent formation of
particulate matter (PM) along with hazardous combustion by-products are inevitable. The effect
of nanomaterials on the toxicity of the PM is unknown. We assessed the oxidative potential (OP)
and toxicity of PM resulting from the incineration of pure nanomaterials and of paper and plastic
wastes containing Ag, NiO, TiO2, ceria, C60, Fe2O3, or CdSe/ZnS quantum dots (CdSe QD) at
mass loadings ranging from 0.1 wt% to 10 wt%. We measured reactive oxygen species (ROS)
using the dichlorofluorescein assay, and we also measured consumption of ascorbic acid,
dithiothreitol (DTT), glutathione (GSH), or uric acid antioxidants from raw and solvent-extracted
PM, denoted “cleaned PM.” We determined cytotoxicity and genotoxicity of PM to A549 human
lung epithelial cells with the WST-1 cell viability and histone immunofluorescence assays,
respectively. In most cases, the presence of nanomaterials in the waste did not significantly
affect the OP of PM; however, PM derived from waste containing Ag, TiO2, and C60 had elevated
ROS response in the GSH and DTT assays. The ratio of reduced to oxidized glutathione was
significantly higher for cleaned PM compared to raw PM for almost all nanomaterials at almost all
concentrations, indicating that combustion by-products adsorbed on raw PM play an important
role in determining OP. The presence of nanomaterials did not significantly modify the
cytotoxicity or genotoxicity of the PM. Different antioxidants used to assess OP had varying
sensitivity towards organic compounds v. metals in PM. The presence of these seven
nanomaterials at low concentrations in the waste stream is not expected to exacerbate the
hazard posed by PM that is produced by incineration.
INTRODUCTION
New and novel applications of nanomaterials have driven rapid growth in nanoscience and nanotechnology. Disposal is inevitable, and some of the nanomaterials will be incinerated. Incineration produces large amounts of combustion by-products, including particulate matter (PM), also known as fly ash. Many modern incineration plants are equipped with air pollution control devices that capture PM and hazardous pollutants effectively, but some pollutants can circumvent air pollution control devices.1 Additionally, open burning, which is still prevalent in some parts of the world for waste disposal, is a potential source of exposure to humans and animals. Many epidemiological studies have linked exposure to PM with various diseases ranging from asthma to cancer.2-8 Studies on the toxicity of nanoparticles and PM are abundant in the literature, but the toxicity of PM from incineration of waste containing nanomaterials has not been
investigated, to our knowledge. We recently reported that because of the highly catalytic surface of some nanomaterials, their incineration can lead to the formation of elevated amounts of combustion by-products that can adsorb onto PM.9 Some nanomaterials retain their physical and chemical properties during combustion,10 while others are altered. The combination of these factors can potentially modify the toxicity of PM in combustion exhaust. While the characteristics of PM that impart toxic effects are unknown, toxicity is generally attributed to the generation of reactive oxygen species (ROS):11-14 hydrogen peroxide, superoxide, and the hydroxyl radical, the latter being the most damaging.15-18 ROS are essential in cellular processes, chemical signal transduction, and immune function, and as a source of energy, but the overproduction of ROS causes oxidative stress: the body overreacts and triggers a stress response.19-27 Biological systems can counter ROS via antioxidants such as
Page 3 of 14 Environmental Science: Nano
Env
iron
men
talS
cien
ce:N
ano
Acc
epte
dM
anus
crip
t
Publ
ishe
d on
13
Janu
ary
2015
. Dow
nloa
ded
on 1
5/01
/201
5 18
:58:
59.
View Article OnlineDOI: 10.1039/C4EN00182F
ARTICLE Environmental Science: Nano
2 | Environ. Sci.: Nano, 2014, 00, 1-3 This journal is © The Royal Society of Chemistry 2014
endogenous glutathione, ascorbic acid, and uric acid, but elevated formation of ROS can make the defense system fail and can cause structural damage to cellular and molecular components.28-30 For instance, 1.4-nm gold, 25-nm silver, and Fe2O3 nanoparticles generate ROS that cause cell damage and alter gene expression.31-33 Non-metallic nanomaterials such as fullerenes can also generate ROS.34 Some nanomaterials may also induce cytotoxic or genotoxic responses, including necrosis, apoptosis, or necroptosis. Cytotoxicity of nanomaterials proceeds via a number of different mechanisms and can be assessed using, for example, colorimetric methods to measure mitochondrial enzymatic activity and cell membrane integrity. Multi-walled carbon nanotubes in sufficient dose induce apoptosis in human lymphocytes,35 gold nanoparticles can compromise cell membrane integrity,36 and <10-nm silver nanoparticles exhibit toxicity to human lung cells.37 Nanomaterials are predicted to induce genotoxicity via mechanisms such as gene mutations, clastogenic effects such as those exerted by ROS, and aneugenic mechanisms such as disruption of the spindle/mitotic apparatus.38, 39 Colloidal aqueous suspensions of fullerenes have been observed to exhibit genotoxic effects on some bacteria.40 Silver nanoparticles can cause DNA damage via elevated ROS concentrations, with the damage being enhanced by the deposition of nanoparticles onto the DNA.41 We have employed an array of acellular and cell-based assays to investigate the OP, cytotoxicity, and genotoxicity of PM produced from incineration of waste containing nanomaterials. We examined metals/metal oxides, fullerenes, and quantum dots, selected to be representative of the major classes of nanomaterials in current use. Metals are of interest because some, such as iron, catalyze ROS formation,14 which can produce pro-inflammatory effects.42-44 Results can be used to inform risk assessments of nanotechnology and the development of policies to ensure the safe disposal of nanomaterials.
RESULTS
We measured the OP of PM produced by the incineration of waste containing one of seven types of engineered nanomaterials: Ag, NiO, TiO2, ceria, Fe2O3, C60, or CdSe/ZnS quantum dots (CdSe QD). The PM was collected from the exhaust on filters and resuspended in ethanol. To separate the
effects of organic compounds adsorbed to particles, we evaluated both raw PM (rPM) and cleaned PM (cPM), from which organic compounds had been removed by solvent extraction. In addition to three different loadings of the nanomaterial in the waste (0.1, 1, and 10 wt%), we also considered incineration of the pure nanomaterial without any other waste. Controls included rPM and cPM negative controls generated by incineration of waste with no added nanomaterials and a positive control of H2O2. We tested the PM for OP, cytotoxicity, and genotoxicity and defined differences between treatments to be significant at p<0.05. We did not assess the toxicity of the pure nanomaterials in cellular systems because there is already abundant literature on this subject.
Hydrodynamic size of PM
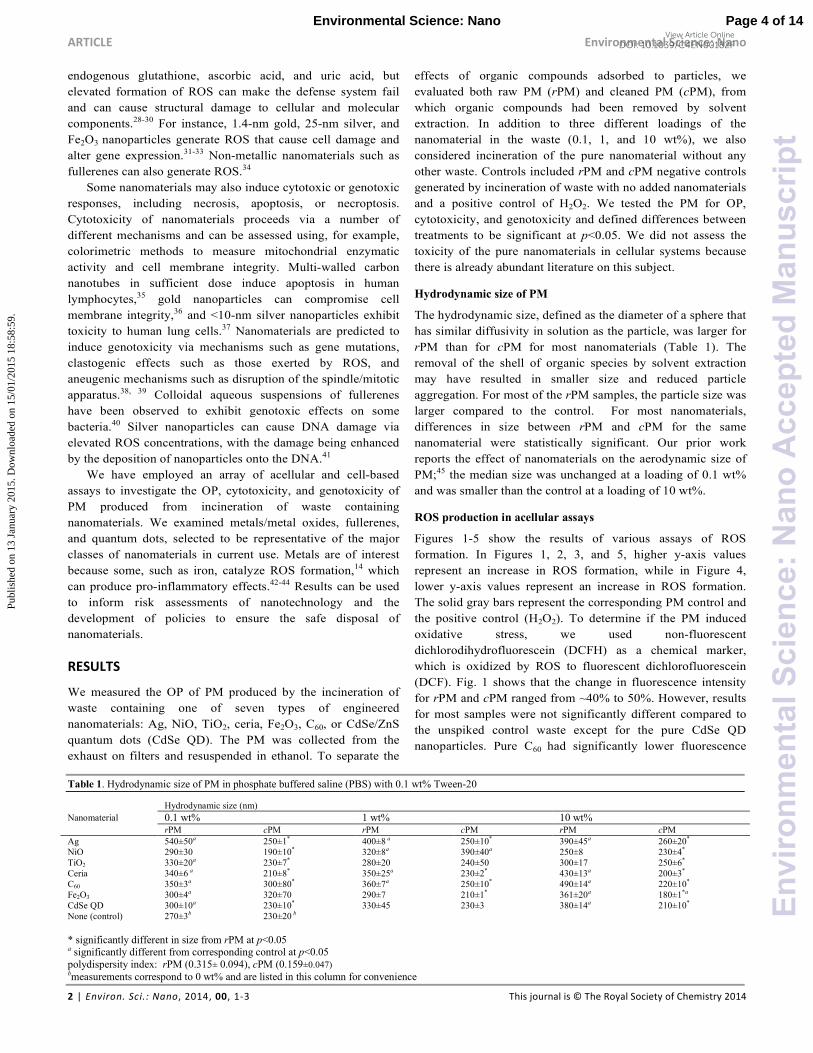
The hydrodynamic size, defined as the diameter of a sphere that has similar diffusivity in solution as the particle, was larger for rPM than for cPM for most nanomaterials (Table 1). The removal of the shell of organic species by solvent extraction may have resulted in smaller size and reduced particle aggregation. For most of the rPM samples, the particle size was larger compared to the control. For most nanomaterials, differences in size between rPM and cPM for the same nanomaterial were statistically significant. Our prior work reports the effect of nanomaterials on the aerodynamic size of PM;45 the median size was unchanged at a loading of 0.1 wt% and was smaller than the control at a loading of 10 wt%.
ROS production in acellular assays
Figures 1-5 show the results of various assays of ROS formation. In Figures 1, 2, 3, and 5, higher y-axis values represent an increase in ROS formation, while in Figure 4, lower y-axis values represent an increase in ROS formation. The solid gray bars represent the corresponding PM control and the positive control (H2O2). To determine if the PM induced oxidative stress, we used non-fluorescent dichlorodihydrofluorescein (DCFH) as a chemical marker, which is oxidized by ROS to fluorescent dichlorofluorescein (DCF). Fig. 1 shows that the change in fluorescence intensity for rPM and cPM ranged from ~40% to 50%. However, results for most samples were not significantly different compared to the unspiked control waste except for the pure CdSe QD nanoparticles. Pure C60 had significantly lower fluorescence
Table 1. Hydrodynamic size of PM in phosphate buffered saline (PBS) with 0.1 wt% Tween-20
Nanomaterial Hydrodynamic size (nm) 0.1 wt% 1 wt% 10 wt% rPM cPM rPM cPM rPM cPM
Ag 540±50a 250±1* 400±8 a 250±10* 390±45a 260±20*
NiO 290±30 190±10* 320±8a
390±40a 250±8 230±4*
TiO2 330±20a 230±7* 280±20 240±50 300±17 250±6*
Ceria 340±6 a 210±8* 350±25a 230±2* 430±13a 200±3*
C60 350±3a 300±80* 360±7a 250±10* 490±14a 220±10*
Fe2O3 300±4a 320±70 290±7 210±1*
361±20a 180±1*a
CdSe QD 300±10a 230±10* 330±45 230±3 380±14a 210±10*
None (control) 270±3b 230±20 b * significantly different in size from rPM at p<0.05 a significantly different from corresponding control at p<0.05 polydispersity index: rPM (0.315± 0.094), cPM (0.159±0.047) bmeasurements correspond to 0 wt% and are listed in this column for convenience
Page 4 of 14Environmental Science: Nano
Env
iron
men
talS
cien
ce:N
ano
Acc
epte
dM
anus
crip
t
Publ
ishe
d on
13
Janu
ary
2015
. Dow
nloa
ded
on 1
5/01
/201
5 18
:58:
59.
View Article OnlineDOI: 10.1039/C4EN00182F
Environmental Science: Nano ARTICLE
This journal is © The Royal Society of Chemistry 2014 Environ. Sci.: Nano, 2014, 00, 1-3 | 3
intensity than did the cPM control. The differences in fluorescence intensity between rPM and cPM were not significantly different for a specific nanomaterial at a specific mass loading except for 10 wt% ceria, 0.1 wt% C60, and 0.1wt% and10 wt% Fe2O3 (Table 2).
Antioxidants, such as ascorbic acid, act to scavenge ROS, and therefore their depletion can indicate the presence of ROS.46 rPM and cPM consumed 40% to 70% of ascorbic acid (Fig. 2) for waste containing nanomaterials and lower amounts for certain pure nanomaterials. However, ascorbic acid consumption for most rPM and cPM samples was not significantly different compared to the respective PM control
except for rPM produced by 10 wt% CdSe QD. Ascorbic acid consumption was also significantly lower than the PM control for pure TiO2, ceria, C60, and CdSe QD nanoparticles. In most cases, the consumption of ascorbic acid in samples containing the same loading and type of nanomaterials was not significantly different between cPM and rPM except in a few
Fig. 1 Formation of DCF by raw PM (rPM) and cleaned PM (cPM). * indicates
significant difference relative to the corresponding unspiked rPM or cPM
control at p<0.05. The change in flourescence intensity was compared relative
to the blank (ethanol). The PM concentration in suspension was 3.5 µg/mL.
Fig. 2 Ascorbic acid consumption of raw PM (rPM) and cleaned PM (cPM). *
indicates significant difference relative to the corresponding unspiked rPM or
cPM control at p<0.05. The PM concentration in suspension was 3.5 µg/mL.
Table 2. Difference of means between cleaned PM (cPM) and raw PM (rPM) for the different assays
Difference of means (│cPM│ – │rPM│)
Nanomaterial 0.1 wt% 1 wt% 10 wt% DCF (%)a
Ag -2.8 0.39 -4.6 NiO 0.31 -2.9 -4.1 TiO2 -2.0 -0.09 -5.6 Ceria -0.75 -0.14 -5.9* C60 -8.0* -0.54 0.98 Fe2O3 -5.9* -0.96 5.0* CdSe QD -4.7 -0.68 0.83 None (control) 2.7 AA (%) b
Ag -11* -11* -15* NiO -9.4 -7.5 -16 TiO2 -15* -6.5 -11 Ceria -7.0 -6.4 -14 C60 -8.5 -19* -14 Fe2O3 -7.1 -11 -5.3 CdSe QD -8.7 -14 -34* None (control) 2.0 UA (%) b
Ag 0.2 -0.2 0.4 NiO -0.2 0.1 0.4 TiO2 -0.4 -0.6 -0.4 Ceria -1 -0.2 0.1 C60 -1* -0.4 0 Fe2O3 -0.7 -0.4 0.2 CdSe QD -0.6 0.2 -0.4* None (control) 0.2 GSH/GSSG
Ag 13* 47* 1.2* NiO 28* 83* -3.0* TiO2 -1.4* -21* 14* Ceria 5.3* 79* 25* C60 4.6* 4.8* 10* Fe2O3 16* 14* 0.51* CdSe QD 20* 1.2* -5.9* None (control) 13* DTT (%)b
Ag 19* 14* 23* NiO 18* 23* 36* TiO2 18* 28* 26* Ceria 17* 27* 29* C60 14* 23* 20* Fe2O3 16* 21* 21* CdSe QD 19* 14* 23* None (control) 15*
Positive values for dichlorofluorescein (DCF), ascorbic acid (AA), uric acid (UA), and dithiothreitol (DTT) indicate that cPM had higher OP than rPM. Negative values for reduced glutathione/oxidized glutathione (GSH/GSSG) indicate that cPM had higher OP than rPM. a % change in fluorescent intensity, b % antioxidant consumed. * indicates significant difference between rPM and cPM at p < 0.05
Page 5 of 14 Environmental Science: Nano
Env
iron
men
talS
cien
ce:N
ano
Acc
epte
dM
anus
crip
t
Publ
ishe
d on
13
Janu
ary
2015
. Dow
nloa
ded
on 1
5/01
/201
5 18
:58:
59.
View Article OnlineDOI: 10.1039/C4EN00182F
ARTICLE Environmental Science: Nano
4 | Environ. Sci.: Nano, 2014, 00, 1-3 This journal is © The Royal Society of Chemistry 2014
cases as shown in Table 2. The positive control, H2O2,
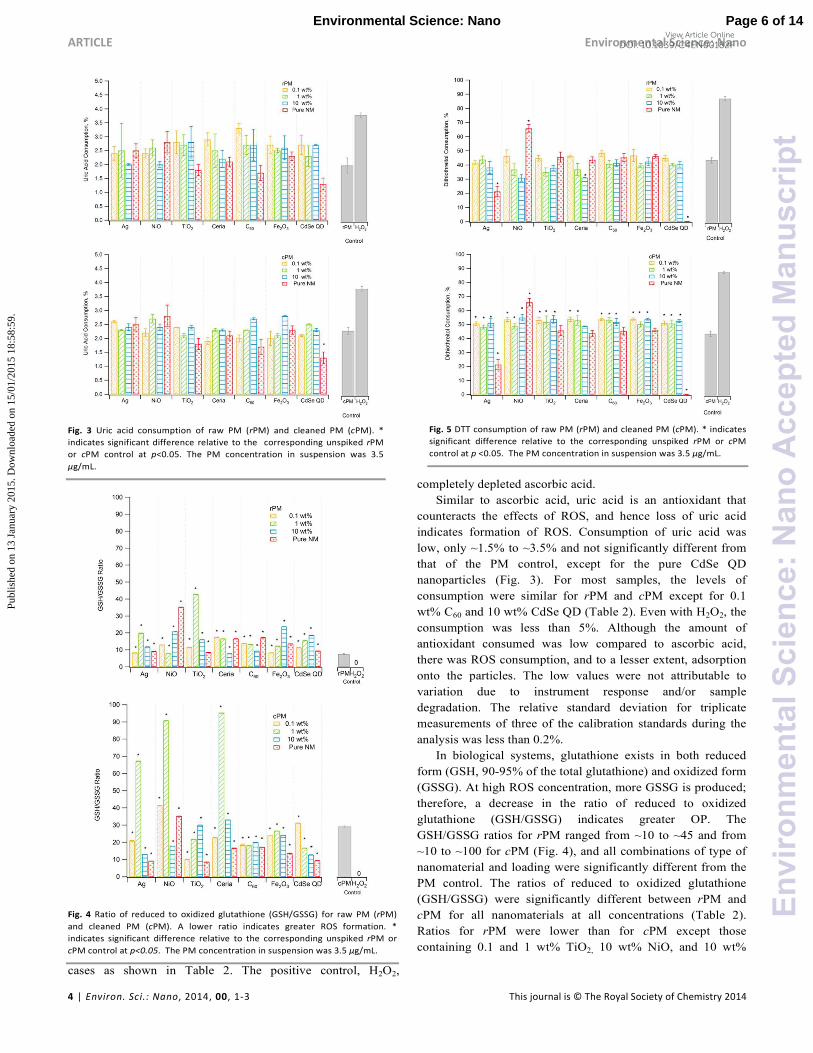
completely depleted ascorbic acid. Similar to ascorbic acid, uric acid is an antioxidant that counteracts the effects of ROS, and hence loss of uric acid indicates formation of ROS. Consumption of uric acid was low, only ~1.5% to ~3.5% and not significantly different from that of the PM control, except for the pure CdSe QD nanoparticles (Fig. 3). For most samples, the levels of consumption were similar for rPM and cPM except for 0.1 wt% C60 and 10 wt% CdSe QD (Table 2). Even with H2O2, the consumption was less than 5%. Although the amount of antioxidant consumed was low compared to ascorbic acid, there was ROS consumption, and to a lesser extent, adsorption onto the particles. The low values were not attributable to variation due to instrument response and/or sample degradation. The relative standard deviation for triplicate measurements of three of the calibration standards during the analysis was less than 0.2%. In biological systems, glutathione exists in both reduced form (GSH, 90-95% of the total glutathione) and oxidized form (GSSG). At high ROS concentration, more GSSG is produced; therefore, a decrease in the ratio of reduced to oxidized glutathione (GSH/GSSG) indicates greater OP. The GSH/GSSG ratios for rPM ranged from ~10 to ~45 and from ~10 to ~100 for cPM (Fig. 4), and all combinations of type of nanomaterial and loading were significantly different from the PM control. The ratios of reduced to oxidized glutathione (GSH/GSSG) were significantly different between rPM and cPM for all nanomaterials at all concentrations (Table 2). Ratios for rPM were lower than for cPM except those containing 0.1 and 1 wt% TiO2, 10 wt% NiO, and 10 wt%
Fig. 3 Uric acid consumption of raw PM (rPM) and cleaned PM (cPM). *
indicates significant difference relative to the corresponding unspiked rPM
or cPM control at p<0.05. The PM concentration in suspension was 3.5
µg/mL.
Fig. 5 DTT consumption of raw PM (rPM) and cleaned PM (cPM). * indicates
significant difference relative to the corresponding unspiked rPM or cPM
control at p <0.05. The PM concentration in suspension was 3.5 µg/mL.
Fig. 4 Ratio of reduced to oxidized glutathione (GSH/GSSG) for raw PM (rPM)
and cleaned PM (cPM). A lower ratio indicates greater ROS formation. *
indicates significant difference relative to the corresponding unspiked rPM or
cPM control at p<0.05. The PM concentration in suspension was 3.5 µg/mL.
Page 6 of 14Environmental Science: Nano
Env
iron
men
talS
cien
ce:N
ano
Acc
epte
dM
anus
crip
t
Publ
ishe
d on
13
Janu
ary
2015
. Dow
nloa
ded
on 1
5/01
/201
5 18
:58:
59.
View Article OnlineDOI: 10.1039/C4EN00182F
Environmental Science: Nano ARTICLE
This journal is © The Royal Society of Chemistry 2014 Environ. Sci.: Nano, 2014, 00, 1-3 | 5
CdSe QD. The rPM control had higher OP (lower ratio) than did the samples with nanomaterials. Dithiothreitol (DTT) is not present in biological systems but is highly sensitive to oxidation from components in PM that are redox-active, and hence DTT is used routinely in assessing OP of PM. Oxidation of DTT by ROS converts DTT to its disulfide form. Loss of DTT indicates OP. Consumption of DTT by the PM ranged from 30% to 55% (Fig. 5). DTT depletion was not significantly different compared to that in the PM control. Pure NiO nanoparticles consumed significantly more DTT than did the PM control, and pure CdSe QD and Ag consumed less. In fact, pure CdSe QD did not consume any measurable DTT. For
cPM, DTT consumption for all samples, except pure TiO2, 10 wt% ceria, pure ceria, pure C60, and pure Fe2O3 was significantly different compared to the cPM control. For cPM, DTT consumption in all samples, except pure TiO2, 10 wt% ceria, pure ceria, pure C60, and pure Fe2O3 was significantly different compared to the cPM control. In addition, differences in DTT loss between rPM and cPM were significant for all nanomaterials at all concentrations (Table 2).
Cytotoxicity and genotoxicity response
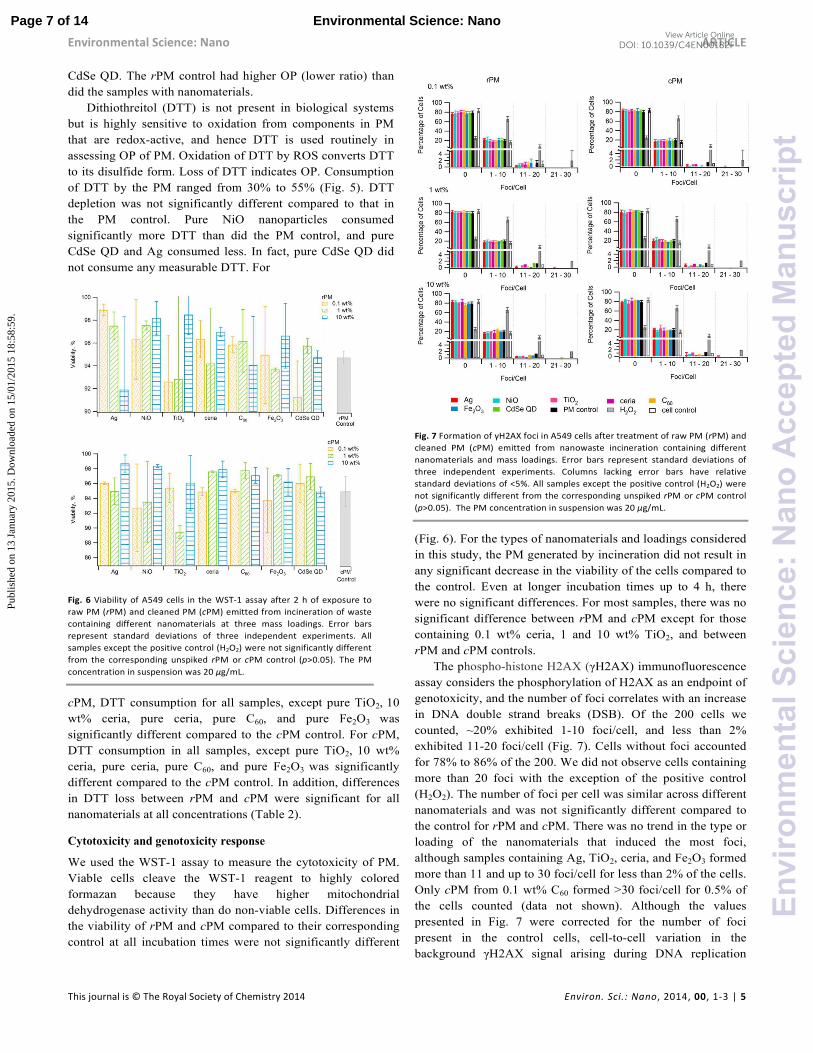
We used the WST-1 assay to measure the cytotoxicity of PM. Viable cells cleave the WST-1 reagent to highly colored formazan because they have higher mitochondrial dehydrogenase activity than do non-viable cells. Differences in the viability of rPM and cPM compared to their corresponding control at all incubation times were not significantly different
(Fig. 6). For the types of nanomaterials and loadings considered in this study, the PM generated by incineration did not result in any significant decrease in the viability of the cells compared to the control. Even at longer incubation times up to 4 h, there were no significant differences. For most samples, there was no significant difference between rPM and cPM except for those containing 0.1 wt% ceria, 1 and 10 wt% TiO2, and between rPM and cPM controls. The phospho-histone H2AX (γH2AX) immunofluorescence assay considers the phosphorylation of H2AX as an endpoint of genotoxicity, and the number of foci correlates with an increase in DNA double strand breaks (DSB). Of the 200 cells we counted, ~20% exhibited 1-10 foci/cell, and less than 2% exhibited 11-20 foci/cell (Fig. 7). Cells without foci accounted for 78% to 86% of the 200. We did not observe cells containing more than 20 foci with the exception of the positive control (H2O2). The number of foci per cell was similar across different nanomaterials and was not significantly different compared to the control for rPM and cPM. There was no trend in the type or loading of the nanomaterials that induced the most foci, although samples containing Ag, TiO2, ceria, and Fe2O3 formed more than 11 and up to 30 foci/cell for less than 2% of the cells. Only cPM from 0.1 wt% C60 formed >30 foci/cell for 0.5% of the cells counted (data not shown). Although the values presented in Fig. 7 were corrected for the number of foci present in the control cells, cell-to-cell variation in the background γH2AX signal arising during DNA replication
Fig. 6 Viability of A549 cells in the WST-1 assay after 2 h of exposure to
raw PM (rPM) and cleaned PM (cPM) emitted from incineration of waste
containing different nanomaterials at three mass loadings. Error bars
represent standard deviations of three independent experiments. All
samples except the positive control (H2O2) were not significantly different
from the corresponding unspiked rPM or cPM control (p>0.05). The PM
concentration in suspension was 20 µg/mL.
Fig. 7 Formation of γH2AX foci in A549 cells after treatment of raw PM (rPM) and
cleaned PM (cPM) emitted from nanowaste incineration containing different
nanomaterials and mass loadings. Error bars represent standard deviations of
three independent experiments. Columns lacking error bars have relative
standard deviations of <5%. All samples except the positive control (H2O2) were
not significantly different from the corresponding unspiked rPM or cPM control
(p>0.05). The PM concentration in suspension was 20 µg/mL.
Page 7 of 14 Environmental Science: Nano
Env
iron
men
talS
cien
ce:N
ano
Acc
epte
dM
anus
crip
t
Publ
ishe
d on
13
Janu
ary
2015
. Dow
nloa
ded
on 1
5/01
/201
5 18
:58:
59.
View Article OnlineDOI: 10.1039/C4EN00182F
ARTICLE Environmental Science: Nano
6 | Environ. Sci.: Nano, 2014, 00, 1-3 This journal is © The Royal Society of Chemistry 2014
primarily in the S and G2/M phases of the cell cycle47, 48 may contribute to the foci we counted. We have divided the category x-axes of Fig. 7 into four bins: no foci, 1-10 foci/cell, 11-20 foci/cell, and 21-30 foci/cell. Counting the number of foci per cell better distinguishes the extent of genotoxic response of A549 cells from the background γH2AX contribution.
DISCUSSION
Little is known about the extent to which the interaction of nanomaterials and waste during combustion might modify the toxicity of the PM that is generated.49, 50 Nanomaterials themselves in the PM might be toxic, or they could enhance or mitigate toxic effects of other components of the PM. Results of our study suggest that the addition of nanomaterials to the incineration waste stream does not significantly affect the OP, cytotoxicity, or genotoxicity of PM in the fly ash under conditions tested, except for elevated ROS response in the GSH and DTT assays with Ag, TiO2, and C60. However, there are a number of caveats that should be considered.
Limitations
Only a small amount (0.023 – 180 mg/g) of nanomaterials partitioned into the PM versus the bottom ash.45 For most nanomaterials, their mass fractions in PM were no more than 0.62% at any loading in the waste. The one exception was C60, with mass fractions in the PM up to 26%. Thus, the subsequent discussion hinges on the fact that the amount of nanomaterials in samples subjected to ROS and toxicity assays was very low in most cases, but it is possible that they catalyzed formation or destruction of other toxic compounds in the PM. Results of the ROS assays must be interpreted with caution because of potential interference of PM with the assays. Initially, we performed the experiment at a PM concentration in suspension relevant to human exposure, ~20 µg/mL calculated for a 24-h exposure for a child at rest assuming that 65% of PM at a concentration of 35 µg/m3 (24-h National Ambient Air Quality Standard for PM2.5) is deposited in the lungs51 and that the mucus and alveolar fluid volume is 12.6 mL.52, 53 However, at this PM concentration, the fluorescence intensity of DCF, which should have increased, actually decreased, possibly because of the high surface area of PM that adsorbed the DCF and the enzyme. Thus, we used a lower concentration (3.5 µg/mL) of PM based on recommendations from studies of carbon black, which has similar optical properties to those of our PM.54 At this concentration, we estimate the amount of the antioxidants that could adsorb to the particle surface to be <~0.2% for TiO2, which has the highest specific surface area among the nanomaterials, assuming perpendicular adsorption geometry. Another concern is the stability of the antioxidants, and, thus, the incubation time. Autooxidation, especially for ascorbic acid, dithiothreitol, and glutathione becomes dominant at incubation times longer than 1 h.55 Therefore, we decided to simply measure antioxidant loss after 1 h, instead of measuring
the consumption rate. We did not use shorter incubation times than 1 h because then there would be no significant losses for most of the antioxidants.51 The loss of antioxidants may be due to oxidative loss (both from ROS and non-ROS such as oxygen), adsorption onto particles, or both. Since the calculated amount of antioxidants adsorbing onto particles is small compared to the measured depletion, oxidative loss by ROS is presumed to be the dominant mechanism. This is supported by the appearance of GSSG from oxidation of GSH by ROS. Oxidation of GSH by oxygen over 1 h is a less likely explanation as it requires pH greater than 8.5 and copper salt as a catalyst.56 As with any acellular and in vitro assays, this study does not accurately reflect OP in vivo, and ROS formation can be underestimated or overestimated in some instances. We used particles in a physiological buffer that lacks the complexity of a biological system. Proteins, lipids, and other biological components can cause particles to aggregate and alter the toxicity of PM. In biological systems, the superoxide anion radical can liberate Fe2+ bound in Fe-S cluster proteins and amplify the formation of hydroxyl radicals.57 Also, relatively inert species with no OP in vitro can become active in vivo, and soluble metals in aqueous/biological media can increase ROS production. In addition, since the biological defense system is protected by an array of antioxidants, OP might have been overestimated when measured using a single antioxidant, as the compounded effects of the antioxidants were not considered. Despite these limitations, this work still offers valuable information since the relative trend of ROS formation for the various nanomaterials could still be valid in cellular system. To address some of the limitations of the acellular assays, we assessed the cytotoxicity and genotoxicity response of A549 human lung epithelial cells to PM using the WST-1 and the γH2AX assays, respectively. At the tested concentration of nanomaterials, either as pure or in the PM of incinerated waste, no cytotoxicity or genotoxicity was evident. This may be due to the small amount of nanomaterials that partitioned into the PM,45 although other work has shown that even at higher concentrations, silver nanoparticles deposited at the air-liquid interface cause negligible cytotoxicity and only a mild inflammatory response to A549 cells.58 However, Ag, TiO2, and C60 are of concern because they can catalyze the formation of high amounts of furans9 or perhaps other pollutants that are more genotoxic. Another consideration is that cumulative toxicity over time is more likely to occur under natural settings than those imposed by experimental conditions. Other factors may also explain the negative results. Nanomaterials that generate ROS through a Fenton-like reaction depend on the interaction between the surface of PM and the bulk media. Metal nanomaterials may act as condensation nuclei for organic species, and they may not be available for reactions if they are buried underneath layers of organic species. Although our results suggest that some nanomaterials in consumer products that are incinerated45 will not modify the toxicity of the PM in the exhaust, these results should be interpreted with caution.
Page 8 of 14Environmental Science: Nano
Env
iron
men
talS
cien
ce:N
ano
Acc
epte
dM
anus
crip
t
Publ
ishe
d on
13
Janu
ary
2015
. Dow
nloa
ded
on 1
5/01
/201
5 18
:58:
59.
View Article OnlineDOI: 10.1039/C4EN00182F
Environmental Science: Nano ARTICLE
This journal is © The Royal Society of Chemistry 2014 Environ. Sci.: Nano, 2014, 00, 1-3 | 7
Particle size
Although particle size and surface area are critical factors in determining the toxicity of PM,59 our results suggest that they were not the dominant determinants of toxicity under the conditions examined in this study. rPM and cPM that were similar in size exhibited significantly different toxicity in the GSH/GSSG and DTT assays.
Organics
ROS can be generated by ROS-active adsorbed organic components or through conversion of labile components to ROS-active species. In the ascorbic acid assay, rPM displayed higher OP than did cPM in some cases, suggesting that some adsorbed organic species actively oxidize ascorbic acid or generate species that oxidize it. PAHs are abundant in combustion-generated PM. They are ROS-inactive in vitro, although the presence of ascorbic acid60 or other reductants and superoxide anion radicals might convert some of the PAHs and organic species to ROS-active quinonic species.46, 61, 62 Our study on combustion by-product emissions9 shows that Ag and TiO2 catalyze the formation of furans. While the toxicity of furans is not attributed to ROS formation, the highly electrocatalytic nature of Ag may perhaps also catalyze the formation of other species that are unmonitored but are ROS-active, such as environmentally persistent free radicals.63 These species may be responsible for the elevated antioxidant consumption (glutathione and ascorbic acid) of rPM relative to cPM containing Ag (Table 2). Among the nanomaterials considered in this study, C60 persists best through the combustion zone.45 The higher fluorescence intensity for rPM compared to cPM containing 0.1 wt% C60 suggests that adsorbed organic species are dominant in catalyzing ROS formation. The majority of the literature reports little or no toxicity for C60 in vitro, but it has been shown to generate ROS in vivo64, 65 when irradiated. Since this work took place under non-irradiated conditions, the increase in consumption of antioxidants is primarily attributed to the adsorbed organic species and metals rather than C60. This hypothesis is supported further by 1) the similar OP between rPM and cPM from 10 wt% C60 waste despite the elevated amount of C60 in rPM (i.e., the cleaning procedure removed some C60), 2) the similar level of ascorbic acid consumption for rPM and cPM compared to the control, and 3) the lower OP of pure C60 nanoparticles in most assays. Indeed, carbon black, which contains organic species and metals, has been reported to promote greater ROS formation than fullerenes because of adsorbed organic components.65
Metals
Aside from organics, metals in certain oxidation states can also generate ROS.66 Redox-active metals can donate electrons to forming superoxide anion radicals that can then dismutate, forming hydrogen peroxide. Hydrogen peroxide can then react with metals and form hydroxyl radicals. The elevated magnitude of antioxidant consumption for cPM compared to
rPM in some assays, especially ascorbic acid for Ag, GSH/GSSG for TiO2 at 1 wt%, and DTT for all nanomaterials, suggests that the extraction of organic species from PM exposes the catalytic surface of metals, resulting in higher OP. As shown in Table S1, PM from the control waste contained substantial amounts of metals, which originated from the paper, polyethylene, and poly(vinyl chloride). Although most metals in PM, such as exogenous iron, exist mainly in their higher oxidation states67 and are immobilized in the particle,68 and therefore are ROS-inactive, reductants can convert them to a form that is ROS-active. Whereas metals in PM are usually present in higher oxidation states, and thus are ROS-inactive, metals in nanomaterials that are incinerated with the waste are in a different form (e.g., crystalline phase) and could potentially generate ROS. For most nanomaterials, OP is one of the primary mechanisms of toxicity.69 The combination of ROS formation70-72 by the nanoparticles and release of the core metal (Cd)72 may be responsible for the higher OP for 10 wt% CdSe QD rPM.
Differences between ROS assays
It appears that the different antioxidants have varying sensitivity towards a specific class of chemical species in PM. For instance, adsorbed organic species are more sensitive towards glutathione and ascorbic acid, while metals are most sensitive towards DTT. Therefore, a battery of assays should be used to assess and to establish the toxicity of PM, and results of acellular assays should be validated with cell-based assays. Most results in the literature have suggested that the DTT assay is insensitive to metals as it only measures the superoxide anion radical. However, the higher activity for cPM, which likely has more exposed metals, in the present work agrees with other studies that also observed higher DTT activity for some transition metals compared to organic components.73-75. The higher DTT consumption of cPM cannot be attributed to redox-cycling organic species, as they were mostly removed. Also, the DTT assay may be sensitive to the form of metals, whether they are bound on the surface of the particles or soluble.76 The GSH/GSSG and DTT assays may be sensitive to different species in the PM, as they indicated a difference in OP between rPM and cPM (Table 2). rPM exhibited stronger OP in the GSH/GSSG assay but lesser OP in the DTT assay compared to cPM. We hypothesize that in a biological system, initially organic species are responsible for ROS generation. However, as the shell of organic species is exfoliated from the particle over time, the metal-containing core of the PM becomes exposed, amplifying ROS generation. The results suggest that the OP of the PM more strongly depends on the adsorbed organic or inorganic components than the presence of the nanomaterials, at least at the very low levels seen in this study. Previous nanomaterial and aerosol characterization. In our previous study,45 we characterized PM generated by incineration of waste dosed with 0.1 wt% and 10 wt% nanomaterials. At a loading of 0.1 wt%, the median size of the PM was ~390 nm, similar in size to PM produced from the
Page 9 of 14 Environmental Science: Nano
Env
iron
men
talS
cien
ce:N
ano
Acc
epte
dM
anus
crip
t
Publ
ishe
d on
13
Janu
ary
2015
. Dow
nloa
ded
on 1
5/01
/201
5 18
:58:
59.
View Article OnlineDOI: 10.1039/C4EN00182F
ARTICLE Environmental Science: Nano
8 | Environ. Sci.: Nano, 2014, 00, 1-3 This journal is © The Royal Society of Chemistry 2014
control waste that did not contain any nanomaterials. At a loading of 10 wt%, the median size of the PM was significantly smaller, ~325 nm. TEM analysis of PM that was collected on a filter and suspended in methanol revealed formation of fractal aggregates of carbonaceous PM, and there were no apparent differences in size and morphology by type of nanomaterial, including the control (Fig. S1). The majority of nanomaterials partitioned into the bottom ash and retained their original size and morphology, although they formed large aggregates. We observed phase transition of anatase-TiO2 to rutile-TiO2 in the bottom ash. The phase transition of TiO2,
77 the formation of Ag-O and chemisorbed oxygen may have contributed to an increase in OP. We were not able to find any nanomaterials in the PM to subject them to elemental and diffraction analysis, but we hypothesize that they may have undergone similar changes compared to nanomaterials in the bottom ash. It is also possible that they may have been modified further as they reacted with numerous combustion by-products upon entering and exiting different combustion zones. For most samples, the absence of a significant difference in toxicity from the control hinges on the fact that only a small amount of nanomaterials partitioned into the PM. The mass of nanomaterials that partitioned into the PM that was used in the toxicity assays ranged from 0.125 to 7.06 ng, except for C60, which resulted in several hundreds of nanograms in the PM (Table 3). Furthermore, only one-sixth of this amount was used in the acellular assays.
CONCLUSIONS
Incineration as end-of-life treatment for nanowaste has perhaps the greatest potential among disposal methods for transforming nanomaterials and affecting emissions to the environment, particularly those of PM as a combustion by-product. In this study, the presence of certain nanomaterials did not affect the OP, cytotoxicity, and genotoxicity of PM generated by incineration under the conditions investigated. However, PM emitted from incineration of waste containing three of the nanomaterials (Ag, TiO2, and C60) exhibited elevated OP, while
four of the nanomaterials (NiO, ceria, Fe2O3, and CdSe QD) did not. These results suggest an urgent need to study the toxic effects of these nanomaterials in more detail, as they are currently produced and used in relatively large quantities. One limitation of the current experimental protocol is the small dose of PM; there may be significant differences in the toxicity of the particles at higher doses. This study relies heavily on chemical markers, whose sensitivity to different components of PM varies. To complement the results from this study, we suggest future research focusing on a marker such as gene expression and assessing OP in cellular systems, using a battery of cellular-based assays, as the present study included only two assays. Additionally, the interaction among the nanomaterials, organic pollutants, and chemical markers may be diffusion-limited, and observation of any significant toxic effects may require longer exposure times. A more complete assessment of the toxicity of PM generated from nanowaste incineration will include in vivo and in vitro studies with both subchronic and chronic exposures, as some toxic effects only appear when a significant amount of a toxicant has accumulated in the organism.
EXPERIMENTAL
Nanomaterials
Seven nanomaterials were investigated: silver (Ag, coated with poly(vinyl pyrrolidone)), NanoAmor, 30-50 nm, 5-10 m2 g-1, ≥99.5%), nickel oxide (NiO, NanoAmor, 10-20 nm, 50-80 m2 g-1, ≥99.8%), titania (TiO2, particle size <25nm, specific surface area 200-220 m2 g-1, purity ≥99.7%), ceria (NanoAmor, 15-30 nm, 30-50 m2 g-1, ≥99.9%), C60-fullerene (C60, SES Research, ≥99.8%), iron oxide (Fe2O3, <30 nm, ≥99%), and CdSe/ZnS quantum dots (CdSe QD). The nanoparticles were dispersed in ethanol, with the exception of C60 which was dissolved in toluene. All chemicals were purchased from Sigma-Aldrich unless otherwise noted.
Particle collection and clean-up
Waste containing a mixture of equal amounts of paper, polyethylene, and poly(vinyl chloride) spiked with nanomaterials was incinerated at 850 oC with 1 L/min of clean and particle-free air. The resulting PM was collected onto a polytetrafluoroethylene (PTFE) filter (diameter 47 mm, pore size 0.1 µm) as described elsewhere.9 In the interest of trying to separate the effects of adsorbed organic species from effects stemming from the core of the PM, extracts of both raw PM (rPM) and cleaned PM (cPM) were prepared. PM was cleaned by extracting the adsorbed organic species in a series of solvents by sonicating for 15 min, centrifuging at 20,000g for 10 min, and removing the supernatant. Extraction was repeated with 1 mL cyclohexane, then 1 mL acetone, then three times with 1 mL of cyclohexane:acetone solution (1:1, v/v), and finally with 1 mL dichloromethane. Residual solvent was removed by air-drying for 12 h at ambient temperature and
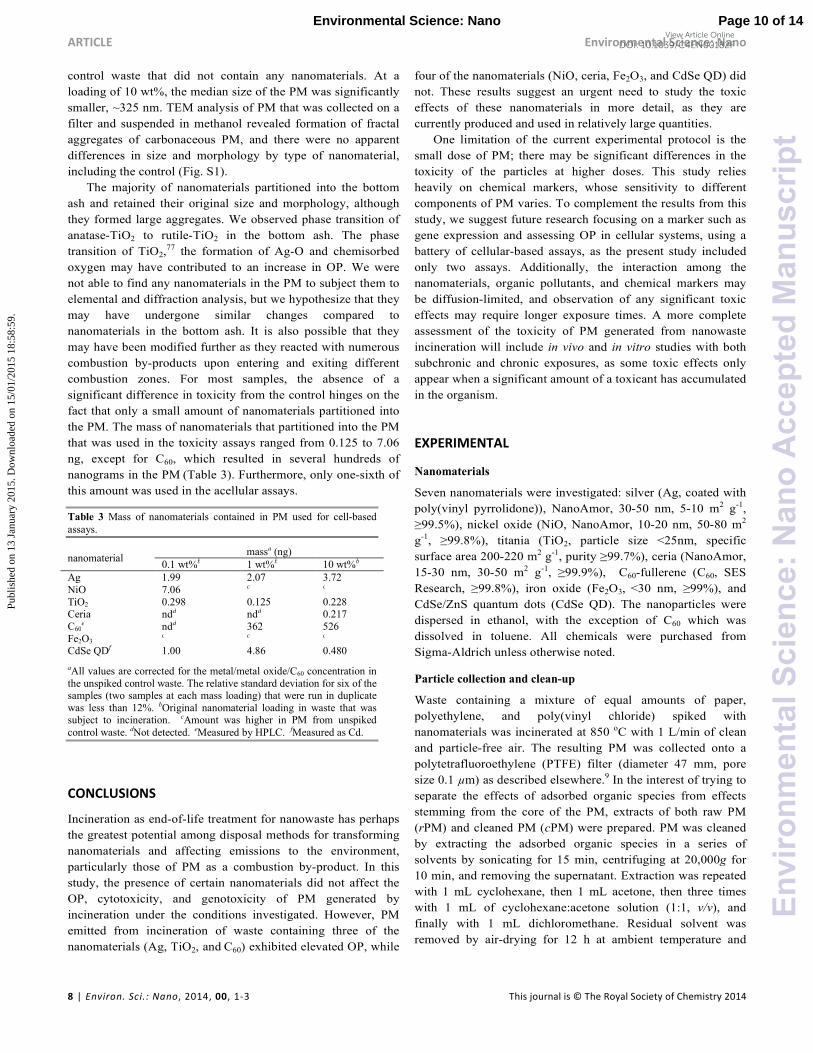
Table 3 Mass of nanomaterials contained in PM used for cell-based assays.
nanomaterial massa (ng) 0.1 wt%b 1 wt%b 10 wt%b
Ag 1.99 2.07 3.72 NiO 7.06 c c
TiO2 0.298 0.125 0.228 Ceria ndd ndd 0.217 C60
e ndd 362 526 Fe2O3 c c c
CdSe QDf 1.00 4.86 0.480 aAll values are corrected for the metal/metal oxide/C60 concentration in the unspiked control waste. The relative standard deviation for six of the samples (two samples at each mass loading) that were run in duplicate was less than 12%. bOriginal nanomaterial loading in waste that was subject to incineration. cAmount was higher in PM from unspiked control waste. dNot detected. eMeasured by HPLC. fMeasured as Cd.
Page 10 of 14Environmental Science: Nano
Env
iron
men
talS
cien
ce:N
ano
Acc
epte
dM
anus
crip
t
Publ
ishe
d on
13
Janu
ary
2015
. Dow
nloa
ded
on 1
5/01
/201
5 18
:58:
59.
View Article OnlineDOI: 10.1039/C4EN00182F
Environmental Science: Nano ARTICLE
This journal is © The Royal Society of Chemistry 2014 Environ. Sci.: Nano, 2014, 00, 1-3 | 9
pressure. The following samples were tested: rPM, cPM, pure nanomaterial in suspension, PM produced from unspiked wastes, and H2O2 as a positive control. The final particle suspensions were resuspended in ethanol and stored at -20 oC. The particle suspensions were sonicated in a bath sonicator three times for 5 s just prior to use in the assays to minimize formation of free radicals from the homolytic cleavage of water.
Dichlorofluorescein (DCF) assay
The DCF assay78 is a widely used acellular measure of ROS. Briefly, 0.5 mL of 2’,7’-dichlorodihydrofluorescein diacetate (H2-DCFHDA) was hydrolyzed with 2 mL of 0.01 N NaOH to 2’,7’-dichlorodihydrofluorescin, incubated in the dark for 30 min, and then neutralized with 25 mL of 100 mM, pH 7.4 phosphate-buffered saline (PBS). Twenty two milliliters of horse radish peroxidase (HRP) solution in PBS, containing 4.95 units/mL was then added to the H2-DCFHDA. A 20-µL suspension of particles prepared as described above was added to 1 mL of the prepared reaction mixture in an amber microcentrifuge tube. The final particle concentration was 3.5 µg/mL. The suspension was incubated in an orbital mixer at 37±0.5 oC for 1 h. After incubation, the suspension was equilibrated in a water bath at 25 oC for 5 min, centrifuged at 20,000g for 10 min, and filtered through a nylon membrane filter (diameter 4 mm, pore size 0.2 µm). A 200-µL aliquot was plated into a 96-well microtiter plate. Formation of DCF was monitored as an increase in fluorescence intensity at 490 nm excitation and 520 nm emission wavelengths with a multiplate fluorescence reader (SpectraMax M2e, Molecular Devices). Ethanol was used as a blank and 10 µM H2O2 as a positive control. ROS formation was quantified as the relative percentage of fluorescence less the blank. Since a high concentration of PM interferes with the DCF assay54 we supplemented the measurement of OP with measurement of the depletion of antioxidants, described below.
Ascorbic (AA) and uric acid (UA) assays
A 20-µL suspension of PM (180 µg/mL) was added to 1 mL of 20 µM ascorbic acid solution in PBS, vortexed, and incubated at 37±0.5 oC for 1 h in the dark on a shaker. After incubation, the samples were equilibrated to 25 oC for 5 min, augmented with 500 µL of 100 µM of dithiothreitol (DTT) to prevent auto-oxidation, filtered through a nylon membrane filter (diameter 4 mm, pore size 0.2 µm), and refrigerated at -80 oC prior to analysis. All analyses were completed within 24 h after incubation with the antioxidants. Samples for the uric acid assay were prepared in a similar manner, except no DTT was added. The uric acid solution (20 µM) was prepared by dissolving uric acid in 1 mL of 0.01 N NaOH, diluting with PBS, and then neutralizing with an equimolar amount of HCl. Ethanol was used a blank and 10 µM H2O2 as a positive control. Values were reported as relative percentage of antioxidant consumed less the blank. Analysis was performed isocratically with a high-performance liquid chromatography (HPLC, LC-MS 2020,
Shimadzu Inc.) equipped with an ultraviolet absorption detector. Sample volumes of 10 µL were eluted with a 0.1 M KH2PO4-H3PO4 (pH 2.1) mobile phase through a 25-cm reverse-phase column. Samples were refrigerated at 15 oC during the analysis. Calibration standards were run with each set of samples, and a linear response was confirmed with three of the calibration standards after injection of 12 samples. The ascorbic acid and uric acid signals were monitored at 254 nm and 280 nm, respectively. Ascorbic acid analysis was performed within 3 h to minimize the opportunity for auto-oxidation.
Glutathione (GSH) assay
Consumption of glutathione was measured by the enzymatic recycling assay as described elsewhere.79 Briefly, 1 mL of 50 µM of reduced glutathione solution in PBS was added to a 20-µL of suspension of particles and treated as described above. After incubation, 50-µL aliquots of the samples were plated in a 96-well microtiter plate, and 150 µL of the reaction mixture containing 30 µM 5,5’-dithio-bis(2-nitrobenzoic acid) (DTNB) and 0.171 unit/mL glutathione reductase (a gift from Bio-Research Products, Inc.) in 100 mM PBS (pH 7.4) containing 20 µM ethylenediaminetetraacetic acid (EDTA) (referred hereafter as PBS-EDTA) was added. The samples were incubated for 5 min at ambient temperature, and 50 µL of 38 µM reduced nicotinamide adenine dinucleotide phosphate (NADPH) solution in PBS-EDTA was added to initiate the reaction. After 25 min, the absorbance was read at 405 nm with a multiplate reader (µQuant, BioTek) to measure the total glutathione. Since no other thiol-containing compound other than glutathione was present, for the exclusive measurement of reduced glutathione, glutathione reductase in the reaction mixture was replaced with PBS-EDTA. The amount of oxidized glutathione was determined from the total glutathione (oxidized and reduced glutathione) less the reduced glutathione.
Dithiothreitol assay
The DTT assay followed a previously described procedure.73 Briefly, 1 mL of 50 µM DTT solution in PBS was added to 20 µL of sample. The suspension was treated as described above. After incubation, the reaction was quenched with 500 µL of 10 % (v/v) trichloroacetic acid, which also prevented further DTT oxidation. Sample aliquots of 100 µL were plated in a 96-well microtiter plate, and 150 µL of 30 µM DTNB in Tris-HCl (pH 8.9) buffer was added. The mixture was agitated, incubated for 10 min, and the absorbance was read at 405 nm with a multi-plate reader (µQuant, BioTek).
Cell culture
A549 human alveolar lung epithelial cells (ATCC, #CCL-185, Manassas, VA) were routinely subcultured in Dulbecco's Modified Eagle Medium (DMEM, Thermo Scientific HyClone, Logan, UT) supplemented with heat-inactivated 10% fetal bovine serum (FBS) and 1% penicillin-streptomycin (Thermo Scientific HyClone, Logan, UT). The cells were maintained in a humidified incubator at 37 °C and 5% CO2.
Page 11 of 14 Environmental Science: Nano
Env
iron
men
talS
cien
ce:N
ano
Acc
epte
dM
anus
crip
t
Publ
ishe
d on
13
Janu
ary
2015
. Dow
nloa
ded
on 1
5/01
/201
5 18
:58:
59.
View Article OnlineDOI: 10.1039/C4EN00182F
ARTICLE Environmental Science: Nano
10 | Environ. Sci.: Nano, 2014, 00, 1-3 This journal is © The Royal Society of Chemistry 2014
WST-1 cytotoxicity test
A 96-well polystyrene plate was seeded with 20,000 cells/well in 100 µL media. After 12 hr, once the cells adhered, they were treated with 37 µL of sample containing 20 µg/mL of the PM suspension. The suspensions were prepared by dispersing PM and cPM in 0.1% (v/v) Tween-20 in PBS solution (pH 7.4). After treatment, the cells were incubated at 37 oC for 24 h, and then 13.7-µL of the WST-1 reagent (Roche, Indianapolis, IN) was added to each sample. The absorbance was read after 2, 3, and 4 h of incubation (Tecan Safire2 Microplate Reader, Tecan US Inc., Research Triangle Pa, NC) at 440 nm with a reference wavelength of 660 nm. Samples were run three times with three replicates for each run. At the PM concentration used, there was no significant difference in absorbance between the sample containing PM in the cell media and the sample that contained only the cell media and no PM.
Phospho-histone H2AX (γH2AX) immunofluorescence assay for
genotoxicity
A 96-well polystyrene plate was seeded with 1×10⁴ cells/well. The cells were then treated with 37 µL of sample containing 20 µg/mL of the PM suspension and incubated for 24 h. Cells were then fixed with 4% paraformaldehyde for 15 min and permeabilized in 0.25% Triton X-100 for 15 min. Bovine serum albumin in PBS at 1% (v/v) was used as blocking serum for 1 h, and cells were incubated with a rabbit polyclonal anti-γH2AX antibody (1:500, Santa Cruz Biotechnology Inc.) for 1 h at room temperature. The wells were washed three times with PBS, and were incubated with Alexa Fluor 488 Goat Anti-Rabbit IgG (H+L) Antibody (1:500, Life Technologies Corporation) and Hoechst 33342 (10 µg/mL, Life Technologies Corp.) for 1 h. The cells were washed three times with PBS and visualized under a fluorescent microscope equipped with FITC and DAPI filters (Olympus). Cells without treatment and those treated with 100 µM H2O2 were incubated for 10 min at 37 oC to serve as negative and positive controls, respectively. Images were acquired using a 40× objective with a fluorescent microscope (EcLipse TS 100, Nikon, Melville, NY). Images for 200 cells were analyzed using ImageJ 1.47 with a macro designed to subtract the response of the background and to count the number of foci within a defined nuclear mask. Hydrodynamic size measurement
The hydrodynamic size of PM suspensions in PBS with 0.1 wt% Tween-20 was measured by dynamic light scattering (DLS, Malvern Zetasizer Nano). PM suspensions at a concentration of 35µg/mL were sonicated for 30 s prior to measurement. A more detailed characterization of the PM exhaust other than the hydrodynamic size is presented in our previous study.45
Analysis of PM by Transmission Electron Microscopy (TEM)
PM on filters was suspended in acetone-free methanol. The suspension was sonicated for 2 min, diluted 100×, and then sonicated again, prior to drop-casting 10 µL of the suspension
onto a 200 mesh, lacey-carbon-coated copper TEM grid. The samples were stored under vacuum or nitrogen until analysis. A Philips EM420 TEM (Philips Corporation) operated at 120 kV was used to acquire images.
Statistical analysis
Differences in the data set were analyzed with one-way ANOVA with Dunnet’s post-hoc test at p<0.05 for comparison with PM from the control using the Igor ProTM statistical package. Differences between PM and cPM were compared using a two-tailed Student’s t-test at p<0.05.
AUTHOR INFORMATION
Corresponding Author
*Phone: (540) 231-6071; fax: (540) 231-7916; e-mail: [email protected].
ACKNOWLEDGEMENTS
This work was supported by a grant from the Environmental Protection Agency-Science to Achieve Results under grant number 83485601 and by the Virginia Tech Institute for Critical Technology and Applied Science. We thank Jodie Smiley for assistance and Drs. Kevin Edgar and Yong Woo Lee for sharing their lab resources. We acknowledge use of the facilities at the Nanoscale Characterization and Fabrication Laboratory at Virginia Tech.
Notes and references
aCorresponding author, Civil and Environmental Engineering Department, Virginia Tech, 411 Durham Hall, Blacksburg, VA 24061. Fax: 540 231 7916; Tel: 540 231 6071; e-mail: [email protected].
†Electronic Supplementary Information (ESI) available: TEM micrographs of PM, metal content in the waste. See DOI: 10.1039/b000000x/
1. F. Cangialosi, G. Intini, L. Liberti, M. Notarnicola and P. Stellacci, Waste Manage. (Oxford), 2008, 28, 885–895.
2. V. E. Archer, Arch. Environ. Health, 1990, 45, 325-334. 3. M. Bobak and D. A. Leon, Lancet, 1992, 340, 1010-1014. 4. J. S. Evans, T. Tosteson and P. L. Kinney, Environ. Int., 1984, 10,
55-83. 5. L. B. Lave and E. P. Seskin, Science, 1970, 169, 723-733. 6. F. W. Lipfert, J. Environ. Econ. Manage., 1984, 11, 208-243. 7. H. Özkaynak and G. D. Thurston, Risk Anal., 1987, 7, 449-461. 8. C. A. Pope, 3rd, M. J. Thun, M. M. Namboodiri, D. W. Dockery,
J. S. Evans, F. E. Speizer and C. W. Heath, Jr., Am. J. Respir.
Crit. Care. Med., 1995, 151, 669-674. 9. E. P. Vejerano, A. L. Holder and L. C. Marr, Environ. Sci.
Technol., 2013, 47, 4866-4874. 10. T. Walser, L. K. Limbach, R. Brogioli, E. Erismann, L. Flamigni,
B. Hattendorf, M. Juchli, F. Krumeich, C. Ludwig, K. Prikopsky, M. Rossier, D. Saner, A. Sigg, S. Hellweg, D. Gunther and W. J. Stark, Nat. Nano., 2012, 7, 520-524.
Page 12 of 14Environmental Science: Nano
Env
iron
men
talS
cien
ce:N
ano
Acc
epte
dM
anus
crip
t
Publ
ishe
d on
13
Janu
ary
2015
. Dow
nloa
ded
on 1
5/01
/201
5 18
:58:
59.
View Article OnlineDOI: 10.1039/C4EN00182F
Environmental Science: Nano ARTICLE
This journal is © The Royal Society of Chemistry 2014 Environ. Sci.: Nano, 2014, 00, 1-3 | 11
11. J. Y. Han, K. Takeshita and H. Utsumi, Free Radical Biol. Med., 2001, 30, 516-525.
12. A. K. Prahalad, J. Inmon, L. A. Dailey, M. C. Madden, A. J. Ghio and J. E. Gallagher, Chem. Res. Toxicol., 2001, 14, 879-887.
13. A. K. Prahalad, J. M. Soukup, J. Inmon, R. Willis, A. J. Ghio, S. Becker and J. E. Gallagher, Toxicol. Appl. Pharmacol., 1999, 158, 81-91.
14. A. M. Knaapen, T. M. Shi, P. J. A. Borm and R. P. F. Schins, Mol. Cell. Biochem., 2002, 234, 317-326.
15. A. P. Breen and J. A. Murphy, Free Radical Biol. Med., 1995, 18, 1033-1077.
16. G. Cohen, S. Yakushin and D. Dembiec-Cohen, Anal. Biochem., 1998, 263, 232-239.
17. H. W. Gardner, Free Radical Biol. Med., 1989, 7, 65-86. 18. A. W. Girotti, Free Radical Biol. Med., 1985, 1, 87-95. 19. S. A. Gurgueira, J. Lawrence, B. Coull, G. G. K. Murthy and B.
Gonzalez-Flecha, Environ. Health Perspect., 2002, 110, 749-755. 20. K. Hirakawa, S. Oikawa, Y. Hiraku, I. Hirosawa and S.
Kawanishi, Chem. Res. Toxicol., 2002, 15, 76-82. 21. G. Oberdorster, R. M. Celein, J. Ferin and B. Weiss, Inhalation
Toxicol., 1995, 7, 111-124. 22. G. Oberdorster, J. Ferin, J. Finkelstein and S. Soderholm, Acta
Astronaut, 1992, 27, 251-256. 23. G. Oberdorster, J. Ferin, S. Soderholm, R. Gelein, C. Cox, R.
Baggs and P. E. Morrow, 1994. 24. A. Peters, D. W. Dockery, J. E. Muller and M. A. Mittleman,
Circulation, 2001, 103, 2810-2815. 25. W. A. Pryor, K. Stone, L. Y. Zang and E. Bermudez, Chem. Res.
Toxicol., 1998, 11, 441-448. 26. G. L. Squadrito, R. Cueto, B. Dellinger and W. A. Pryor, Free
Radical Biol. Med., 2001, 31, 1132-1138. 27. A. Valavanidis, A. Salika and A. Theodoropoulou, Atmos.
Environ., 2000, 34, 2379-2386. 28. T. S. Hiura, N. Li, R. Kaplan, M. Horwitz, J.-C. Seagrave and A.
E. Nel, J. Immunol., 2000, 165, 2703-2711. 29. N. Li, C. Sioutas, A. Cho, D. Schmitz, C. Misra, J. Sempf, M.
Wang, T. Oberley, J. Froines and A. Nel, Environ. Health
Perspect., 2003, 111, 455-460. 30. T. Xia, P. Korge, J. N. Weiss, N. Li, M. I. Venkatesen, C. Sioutas
and A. Nel, Environ. Health Perspect., 2004, 112, 1347-1358. 31. B. Wang, J.-J. Yin, X. Zhou, I. Kurash, Z. Chai, Y. Zhao and W.
Feng, J. Phys.Chem. C, 2012, 117, 383-392. 32. M. I. Khan, A. Mohammad, G. Patil, S. A. H. Naqvi, L. K. S.
Chauhan and I. Ahmad, Biomaterials, 2012, 33, 1477-1488. 33. Y. Pan, A. Leifert, D. Ruau, S. Neuss, J. Bornemann, G. Schmid,
W. Brandau, U. Simon and W. Jahnen-Dechent, Small, 2009, 5, 2067-2076.
34. Y. Yamakoshi, N. Umezawa, A. Ryu, K. Arakane, N. Miyata, Y. Goda, T. Masumizu and T. Nagano, J. Am. Chem. Soc., 2003, 125, 12803-12809.
35. M. Bottini, S. Bruckner, K. Nika, N. Bottini, S. Bellucci, A. Magrini, A. Bergamaschi and T. Mustelin, Toxicol. Lett., 2006, 160, 121-126.
36. C. M. Goodman, C. D. McCusker, T. Yilmaz and V. M. Rotello, Bioconjugate Chem., 2004, 15, 897-900.
37. A. Gliga, S. Skoglund, I. Odnevall Wallinder, B. Fadeel and H. Karlsson, Part. Fibre Toxicol., 2014, 11, 11.
38. L. M. Sargent, A. A. Shvedova, A. F. Hubbs, J. L. Salisbury, S. A. Benkovic, M. L. Kashon, D. T. Lowry, A. R. Murray, E. R. Kisin, S. Friend, K. T. McKinstry, L. Battelli and S. H. Reynolds, Environ. Mol. Mutagen., 2009, 50, 708-717.
39. S. Pfuhler, R. Elespuru, M. J. Aardema, S. H. Doak, E. Maria Donner, M. Honma, M. Kirsch-Volders, R. Landsiedel, M. Manjanatha, T. Singer and J. H. Kim, Environ. Mol. Mutagen., 2013, 54, 229-239.
40. S. Matsuda, S. Matsui, Y. Shimizu and T. Matsuda, Environ. Sci.
Technol., 2011, 45, 4133-4138. 41. P. V. AshaRani, G. Low Kah Mun, M. P. Hande and S.
Valiyaveettil, ACS Nano, 2008, 3, 279-290. 42. Y. Kumagai, T. Arimoto, M. Shinyashiki, N. Shimojo, Y. Nakai,
T. Yoshikawa and M. Sagai, Free Radical Biol. Med., 1997, 22, 479-487.
43. A. E. Nel, D. Diaz-Sanchez and N. Li, Curr. Opin. Pulm. Med., 2001, 7, 20-26.
44. P. H. N. Saldiva, R. W. Clarke, B. A. Coull, R. C. Stearns, J. Lawrence, G. G. K. Murthy, E. Diaz, P. Koutrakis, H. Suh, A. Tsuda and J. J. Godleski, Am. J. Respir. Crit. Care. Med., 2002, 165, 1610-1617.
45. E. P. Vejerano, E. C. Leon, A. L. Holder and L. C. Marr, Environ.
Sci.: Nano, 2014, 1, 133-143. 46. N. Li, T. Xia and A. E. Nel, Free Radical Biol. Med., 2008, 44,
1689-1699. 47. S. H. MacPhail, J. P. Banáth, Y. Yu, E. Chu and P. L. Olive,
Radiat. Res., 2003, 159, 759-767. 48. X. Huang, T. Tanaka, A. Kurose, F. Traganos and Z.
Darzynkiewicz, Int. J.Oncol, 2006, 29, 495-501. 49. M. C. Arnold, A. R. Badireddy, M. R. Wiesner, R. T. Di Giulio
and J. N. Meyer, Arch. Environ. Contam. Toxicol., 2013, 1-10. 50. M. Heinlaan, A. Ivask, I. Blinova, H.-C. Dubourguier and A.
Kahru, Chemosphere, 2008, 71, 1308-1316. 51. H. Zielinski, I. S. Mudway, K. A. Berube, S. Murphy, R. Richards
and F. J. Kelly, Am. J. Physiol. Lung Cell. Mol. Physiol., 1999, 277, L719-L726.
52. G. E. Hatch, in Comparative Biology of the Normal Lung, ed. R. A. Parent, CRC, London, 1994, pp. 617–630.
53. M. B. Snipes, R. O. McClellan, J. L. Mauderly and R. K. Wolf, Health Phys., 1989, 57, 69–78.
54. A. Kroll, M. Pillukat, D. Hahn and J. Schnekenburger, Arch.
Toxicol., 2012, 86, 1123-1136. 55. R. Kandar, P. Drabkova and R. Hampl, J. Chromatogr. B, 2011,
879, 2834-2839. 56. M. B. Young and H. A. Young, J. Am. Chem. Soc., 1942, 64,
2282-2287. 57. M. A. Kohanski, D. J. Dwyer, B. Hayete, C. A. Lawrence and J. J.
Collins, Cell, 2007, 130, 797-810. 58. A. L. Holder and L. C. Marr, BioMed Research International,
2013, 2013, 1-11. 59. J. M. Hillegass, A. Shukla, S. A. Lathrop, M. B. MacPherson, N.
K. Fukagawa and B. T. Mossman, Wiley Interdisc. Rev. Nanomed.
Nanobiotechnol., 2010, 2, 219-231.
Page 13 of 14 Environmental Science: Nano
Env
iron
men
talS
cien
ce:N
ano
Acc
epte
dM
anus
crip
t
Publ
ishe
d on
13
Janu
ary
2015
. Dow
nloa
ded
on 1
5/01
/201
5 18
:58:
59.
View Article OnlineDOI: 10.1039/C4EN00182F
ARTICLE Environmental Science: Nano
12 | Environ. Sci.: Nano, 2014, 00, 1-3 This journal is © The Royal Society of Chemistry 2014
60. J. Verrax, M. Delvaux, N. Beghein, H. Taper, B. Gallez and P. B. Calderon, Free Radical Res., 2005, 39, 649-657.
61. A. Baulig, M. Sourdeval, M. Meyer, F. Marano and A. Baeza-Squiban, Toxicol. In Vitro, 2003, 17, 567-573.
62. S. Lomnicki, H. Truong, E. Vejerano and B. Dellinger, Environ.
Sci. Technol., 2008, 42, 4982-4988. 63. W. Gehling and B. Dellinger, Environ. Sci. Technol., 2013, 47,
8172-8178. 64. J. W. Arbogast, A. P. Darmanyan, C. S. Foote, F. N. Diederich, R.
L. Whetten, Y. Rubin, M. M. Alvarez and S. J. Anz, J. Phys.
Chem., 1991, 95, 11-12. 65. N. R. Jacobsen, G. Pojana, P. White, P. Møller, C. A. Cohn, K.
Smith Korsholm, U. Vogel, A. Marcomini, S. Loft and H. Wallin, Environ. Mol. Mutagen., 2008, 49, 476-487.
66. D. Jassby, J. Farner Budarz and M. Wiesner, Environ. Sci.
Technol., 2012, 46, 6934-6941. 67. U. E. A. Fittschen, F. Meirer, C. Streli, P. Wobrauschek, J. Thiele,
G. Falkenberg and G. Pepponi, Spectrochim. Acta B, 2008, 63, 1489-1495.
68. U. Kukier, C. F. Ishak, M. E. Sumner and W. P. Miller, Environ.
Pollut., 2003, 123, 255-266. 69. H. Meng, T. Xia, S. George and A. E. Nel, ACS Nano, 2009, 3,
1620-1627. 70. N. Chen, Y. He, Y. Su, X. Li, Q. Huang, H. Wang, X. Zhang, R.
Tai and C. Fan, Biomaterials, 2011, 33, 1238-1244. 71. M. Green and E. Howman, Chem. Commun., 2005, 121-123. 72. I. Pujalte, I. Passagne, B. Brouillaud, M. Treguer, E. Durand, C.
Ohayon-Courtes and B. L'Azou, Part. Fiber Toxicol., 2011, 8, 10. 73. J. G. Charrier and C. Anastasio, Atmos. Chem. Phys., 2012, 12,
9321-9333. 74. P. Lin and J. Z. Yu, Environ. Sci. Technol., 2011, 45, 10362-
10368. 75. A. Eiguren-Fernandez, M. Shinyashiki, D. A. Schmitz, E.
DiStefano, W. Hinds, Y. Kumagai, A. K. Cho and J. R. Froines, Environ. Res., 2010, 110, 207-212.
76. A. K. Cho, C. Sioutas, A. H. Miguel, Y. Kumagai, D. A. Schmitz, M. Singh, A. Eiguren-Fernandez and J. R. Froines, Environ. Res., 2005, 99, 40-47.
77. K. Hirakawa, M. Mori, M. Yoshida, S. Oikawa and S. Kawanishi, Free. Rad. Res., 2004, 38, 439-447.
78. R. Cathcart, E. Schwiers and B. N. Ames, Anal. Biochem., 1983, 134, 111-116.
79. M. A. Baker, G. J. Cerniglia and A. Zaman, Anal. Biochem., 1990, 190, 360-365.
Page 14 of 14Environmental Science: Nano
Env
iron
men
talS
cien
ce:N
ano
Acc
epte
dM
anus
crip
t
Publ
ishe
d on
13
Janu
ary
2015
. Dow
nloa
ded
on 1
5/01
/201
5 18
:58:
59.
View Article OnlineDOI: 10.1039/C4EN00182F
Related Documents