1 TOWARDS ZERO ENERGY BUILDINGS: LESSONS LEARNED FROM THE BEDZED DEVELOPMENT Janet Young The Bartlett School of Graduate Studies University College London A thesis submitted for the degree of Doctor of Philosophy University College London September 2015

Welcome message from author
This document is posted to help you gain knowledge. Please leave a comment to let me know what you think about it! Share it to your friends and learn new things together.
Transcript

1
TOWARDS ZERO ENERGY BUILDINGS: LESSONS
LEARNED FROM THE BEDZED DEVELOPMENT
Janet Young
The Bartlett School of Graduate Studies
University College London
A thesis submitted for the degree of
Doctor of Philosophy
University College London
September 2015

2
Declaration
I, Janet YOUNG, confirm that the work presented in this thesis is my own. Where
information has been derived from other sources, I confirm that this has been
indicated in the thesis.

3
Abstract
In order for the UK to meet carbon reduction targets and increased demand
for housing from a growing population, houses need to be built that use less
energy.
Designers have responded by designing low energy buildings but little
research has been undertaken on the actual performance of such buildings in
use. This study compares the performance in use of 24 dwellings at the
Beddington Zero Energy Development (BedZED) designed as a zero energy
development. A unique feature is that, for the first time in energy monitoring
studies, measurement of dwelling performance in use was undertaken both
in the newly built dwellings and dwellings occupied previously by the study's
participants.
The results show that the dwellings achieved their design temperature during
the heating season and that occupants were generally satisfied with winter
comfort levels. Energy usage was lower in the new properties than previous
dwellings and lower than comparable new dwellings at the time, broadly
achieving the Passivhaus standard. The dwellings achieved a good standard
of airtightness although there were some reports of condensation. Internal
temperatures in the summer months showed a potential to overheat during
hot spells and occupants were less satisfied with summer comfort. It is
considered that this was partly because occupants were not familiar with how
to cool their homes.
The study reviewed Energy Performance Certificates issued for BedZED
properties sold/rented and found them to be inconsistent and inaccurate.
This has implications for the marketability of future low energy homes if not
addressed by industry. It also found inconsistency in the application of
measurement systems in the various models used.

4
Acknowledgements
There are many people and organisations that have helped me complete the
research and writing of this thesis.
I am particularly grateful to my supervisor at UCL, Tadj Oreszczyn, who has
supported and guided me through this long endeavour. Also to Alex
Summerfield who assisted with the classification and organisation of my data
and Payel Das who advised on statistical analysis techniques. I am grateful
to Sung Hong and Dejan Mumovic for completing an on-site survey on one of
the case study properties.
There are also many people who had the vision for the original BedZED
development and helped build it. In particular, these include Dickon
Robinson, Development Director at Peabody Trust, Pooran Desai and Nicole
Lazarus of Bioregional, architect Bill Dunster and energy engineer Chris
Twinn. Nic Wedlake and Tessa Barraclough of Peabody provided
information about BedZED’s energy use and gave their time to explain it.
I am grateful to Ian Orme and Sarah Gubbins of Rickaby Thompson
Associates who installed data loggers, downloaded monitoring data for two
phases of the study and conducted the occupancy surveys.
The residents of BedZED, who agreed to participate in this study, gave
access to their homes for a long period and also provided useful insights
which assisted with the interpretation of data.
Elaine Cloutman-Green provided the necessary drive and motivation to
encourage me to finish writing when I was close to giving up.
Most of all, I am grateful to David Harbud who has stoically supported me
through the many years it has taken to complete this thesis and without
whom I would never have finished.
5
Table of Contents
Chapter 1 Introduction ................................................................................. 18
1.1 Research Context ............................................................................. 18
1.2 Research Aim, Hypothesis and Research Questions ........................ 19
1.3 Research Significance ...................................................................... 20
1.4 Thesis Structure ................................................................................ 21
Chapter 2 Literature Review ........................................................................ 25
2.1 Introduction ....................................................................................... 25
2.2 Scientific context ............................................................................... 26
2.3 Policy context .................................................................................... 27
2.4 Demand for Energy ........................................................................... 28
2.5 Building Regulations ......................................................................... 35
2.6 Modelling and Measurement systems ............................................... 36
2.7 Human Factors.................................................................................. 43
2.8 Passive Design, Low Energy and Zero Energy houses .................... 54
2.9 Passivhaus ........................................................................................ 57
2.10 Performance Gap .............................................................................. 61
2.11 BedZED in the literature .................................................................... 62
2.12 Conclusions ...................................................................................... 62
Chapter 3 Comparative Low Energy Case Studies ...................................... 64
3.1 Introduction ....................................................................................... 64
3.2 Pennyland ......................................................................................... 65
3.3 Linford ............................................................................................... 67
3.4 Milton Keynes Energy Park ............................................................... 68
3.5 Brixton Super-Insulated Houses ........................................................ 70
3.6 Retrofit Studies : York Energy Demonstration Project and the Warm Front Programme .............................................................................. 71
3.7 Carbon Reduction in Buildings (CaRB) ............................................. 72
3.8 Comparative Case Studies Conclusions ........................................... 73
Chapter 4 BedZED Case Study ................................................................... 74
4.1 Introduction ....................................................................................... 74
4.2 BedZED Development Team ............................................................ 74
4.3 BedZED Timelines ............................................................................ 75
4.4 BedZED Location .............................................................................. 75

6
4.5 BedZED Scheme .............................................................................. 77
4.6 BedZED Design Aims ....................................................................... 77
4.7 Land Use ........................................................................................... 77
4.8 Passive Design Principles ................................................................. 78
4.9 Building Physics ................................................................................ 85
4.10 Zero Energy ...................................................................................... 86
4.11 BedZED Energy Strategy .................................................................. 87
4.12 BedZED SAP Calculation .................................................................. 89
4.13 Designed Energy Usage ................................................................... 90
4.14 Whole Life Energy Use ..................................................................... 93
4.15 Mechanical and Electrical Systems ................................................... 94
4.16 CHP Design ...................................................................................... 97
4.17 Sizing the CHP plant ......................................................................... 99
4.18 Daylighting Design .......................................................................... 102
4.19 Ventilation Design ........................................................................... 103
4.20 Heating Design................................................................................ 105
4.21 Other BedZED studies .................................................................... 108
4.22 Before BedZED ............................................................................... 110
4.23 Case Study Conclusions ................................................................. 112
Chapter 5 Summer Overheating ................................................................ 114
5.1 Introduction ..................................................................................... 114
5.2 Weather Trends .............................................................................. 114
5.3 Definition of Hot Spells .................................................................... 115
5.4 Summer Comfort ............................................................................. 115
5.5 Impact of Hot Spells on Health ........................................................ 116
5.6 Building Design for Summer Temperatures .................................... 117
5.7 Air Conditioning ............................................................................... 118
5.8 Summer Temperatures in 2003....................................................... 119
5.9 Summer Overheating Conclusions .................................................. 120
Chapter 6 Methods .................................................................................... 121
6.1 Introduction ..................................................................................... 121
6.2 Outline Methodology ....................................................................... 121
6.3 Case Study ..................................................................................... 121
6.4 Experiment versus Observation ...................................................... 122
6.5 Modelling versus Monitoring ........................................................... 123

7
6.6 Methods Selected to address the Research Questions .................. 125
6.7 Statistical Testing ............................................................................ 126
6.8 Longitudinal Study ........................................................................... 128
6.9 Sample ............................................................................................ 128
6.10 Data Used in this Thesis ................................................................. 132
6.11 Classification of Data ...................................................................... 145
6.12 Statistical Analysis Tools ................................................................. 152
6.13 Methods Conclusions ...................................................................... 153
Chapter 7 Energy Usage Results and Analysis ......................................... 154
7.1 Introduction ..................................................................................... 154
7.2 Phase 1 Energy Usage ................................................................... 154
7.3 Phase 2 Energy Usage ................................................................... 155
7.4 Phase 3 Energy Usage at BedZED ................................................. 160
7.5 Overall BedZED Energy Use Summary .......................................... 164
7.6 BedZED Energy Performance Certificates (EPCs) ......................... 167
7.7 Energy Usage Discussion ............................................................... 176
7.8 Energy Usage Conclusions ............................................................. 181
Chapter 8 Internal Temperatures Results and Analysis ............................. 183
8.1 Introduction ..................................................................................... 183
8.2 Winter Internal Temperatures ......................................................... 183
8.3 Summer Internal Temperatures ...................................................... 188
8.4 Overall Analysis of Internal Temperatures ...................................... 199
8.5 Internal Temperature Conclusions .................................................. 204
Chapter 9 Airtightness Results and Analysis ............................................. 205
9.1 Introduction ..................................................................................... 205
9.2 Air Tightness Tests carried out at BedZED by others ..................... 206
9.3 Infra-Red Thermography and Air Infiltration Tests carried out for this thesis .............................................................................................. 206
9.4 Relative Humidity Results ............................................................... 208
9.5 Comparison of Air Infiltration Tests ................................................. 210
9.6 Air Tightness Conclusions ............................................................... 210
Chapter 10 Occupant Survey Results ....................................................... 212
10.1 Introduction ..................................................................................... 212
10.2 Participant Profiles .......................................................................... 212

8
10.3 Occupant Survey Results ................................................................ 213
10.4 Comparison of Occupant Survey Results with Internal Temperature Results ............................................................................................ 225
10.5 Comparison of Occupant Survey Results with RH Results ............. 232
10.6 Occupant Surveys Conclusions ...................................................... 237
Chapter 11 Changes to BedZED during the Development Process .......... 239
11.1 Introduction ..................................................................................... 239
11.2 Changes during the Construction phase ......................................... 239
11.3 Changes during the Operational phase ........................................... 240
11.4 Zero Energy and Renewables ......................................................... 241
11.5 Development Process Conclusions ................................................. 241
Chapter 12 Longitudinal Study .................................................................. 243
12.1 Introduction ..................................................................................... 243
12.2 Building Analysis ............................................................................. 244
12.3 Comparison of Internal Temperatures ............................................. 246
12.4 Comparison of Energy Usage ......................................................... 259
12.5 Occupant Behaviour ........................................................................ 261
12.6 Overall Satisfaction with Heating, Hot water and Ventilation ........... 263
12.7 Ventilation and Condensation ......................................................... 264
12.8 Health .............................................................................................. 267
12.9 Energy Bills ..................................................................................... 268
12.10 Appliance Use ............................................................................ 269
12.11 Longitudinal Study Conclusions ................................................. 270
Chapter 13 Discussion .............................................................................. 272
13.1 Introduction ..................................................................................... 272
13.2 Energy Usage ................................................................................. 273
13.3 Modelling and Measurement ........................................................... 273
13.4 Adjusting for External Weather Conditions ...................................... 275
13.5 Winter Temperatures ...................................................................... 275
13.6 Summer Temperatures ................................................................... 276
13.7 Human Factors................................................................................ 277
13.8 Design Changes during the Development Process ......................... 279
13.9 Zero Energy or Low Energy? .......................................................... 279
13.10 Limitations of SAP models ......................................................... 280
13.11 EPCs .......................................................................................... 281

9
13.12 Longitudinal Study...................................................................... 281
13.13 Data ........................................................................................... 283
13.14 Discussion Conclusions ............................................................. 283
13.15 Hypothesis Conclusion ............................................................... 284
Chapter 14 Conclusions ............................................................................ 285
14.1 Introduction ..................................................................................... 285
14.2 Principal Conclusions ...................................................................... 285
Chapter 15 Limitations of the Study and Future Work ............................... 292
References ................................................................................................ 294
Appendices ................................................................................................ 307

10
Table of Tables
Table 2.1: Changes in Population, Households and Energy Usage ......... 30
Table 2.2: Forecast Changes in UK Population Size ................................ 31
Table 2.3: Modelled Changes in Domestic Energy Usage 1971 - 2011 .... 32
Table 2.4: Mean SAP rating by tenure, 1996 – 2011 ................................ 40
Table 2.5: Recommended comfort criteria for dwellings ........................... 46
Table 2.6: Passivhaus standard................................................................ 57
Table 3.1: Insulation standards required by UK Building Regulations compared to Pennyland & Linford ............................................ 68
Table 3.2: Brixton Super-insulated Design Standard ................................ 70
Table 4.1: BedZED dwelling components ................................................. 82
Table 4.2: Comparison of BedZED Fabric U-values with 1995 Building Regulations elemental method ................................................ 82
Table 4.3: Dwelling Energy Use................................................................ 87
Table 4.4: Typical breakdown of fuel bill costs ......................................... 88
Table 4.5: Comparison of energy consumption at BedZED and typical dwellings .................................................................................. 88
Table 4.6: Predicted annual electrical energy requirements for each house type at BedZED ............................................................. 91
Table 4.7: Predicted annual heat requirements by number of occupants at BedZED .............................................................. 92
Table 4.8: Design Energy Requirement for BedZED property types......... 92
Table 4.9: Sizing the BedZED CHP system ............................................ 101
Table 4.10: Annual Energy from PV at BedZED ....................................... 109
Table 4.11: Annual renewable and non-renewable energy use at BedZED ................................................................................. 110
Table 4.12: Summary of energy rating results for pre-BedZED properties ............................................................................... 111
Table 6.1: Survey samples for each element of BedZED study .............. 129

11
Table 6.2: BedZED case study sample – size of dwellings .................... 131
Table 6.3: BedZED case study sample – number of occupants in the dwelling .................................................................................. 131
Table 6.4: BedZED case study sample – tenure type ............................. 131
Table 6.5: Phase 1 Occupant Survey ..................................................... 134
Table 6.6: Record of Logger Data Collection for Phase 1 and Phase 2 .. 137
Table 6.7: Organisation of Core Data for Phases 1 and 2 ...................... 146
Table 6.8: Classification of BedZED Phase 3 Data................................. 152
Table 7.1: Phase 1 pre-BedZED weekly energy usage .......................... 154
Table 7.2: BedZED Weekly electricity usage .......................................... 156
Table 7.3: BedZED electricity usage by sub-meter ................................. 157
Table 7.4: BedZED Phase 2 electricity usage adjusted for heat ............. 158
Table 7.5: BedZED Phase 3 Average Energy Usage per property ......... 161
Table 7.6: BedZED Phase 3 Energy Usage standardised for floor area........................................................................................ 161
Table 7.7: BedZED Phase 3 measured energy usage per degree day... 162
Table 7.8: Phase 3 actual energy usage by property type standardised for floor area ..................................................... 163
Table 7.9: BedZED Study Electricity Usage for three Phases ................ 164
Table 7.10: BedZED Study Heat Usage for three Phases ........................ 165
Table 7.11: BedZED Total Energy Usage compared to Design, standardised to m2 ................................................................. 165
Table 7.12: Hodge & Haltrecht BedZED Energy usage ............................ 166
Table 7.13: Summary of BedZED EPCs ................................................... 168
Table 7.14: BedZED EPC Ratings Summary ........................................... 171
Table 7.15: Building Element Energy Efficiency from BedZED EPCs....... 172
Table 7.16: Description of Main Heating System from BedZED EPCs ..... 173
Table 7.17: Description of Main Heating Controls from BedZED EPCs .... 174
Table 7.18: EPCs issued for Phase 2 BedZED properties ........................ 175

12
Table 7.19: BedZED floor areas ............................................................... 177
Table 7.20: BedZED number of occupants ............................................... 179
Table 8.1: Summary of internal temperatures standardised to external temp of 5°C ............................................................................ 186
Table 8.2: External temperatures °C recorded at BedZED during August 2003 hot spell ............................................................ 188
Table 8.3: Summary of summer internal temperatures at external temperatures of 20ºC and 25ºC compared to notional design standards ................................................................... 194
Table 9.1: Results of Air Infiltration Rate Tests ....................................... 208
Table 9.2: Property B Temperature and RH Results .............................. 209
Table 9.3: Property B RH Analysis ......................................................... 209
Table 9.4: BedZED Air Infiltration Test Results compared to Design...... 210
Table 10.1: Number of participants completing Phases 1 and 2 occupant surveys ................................................................... 212
Table 10.2: Number and age of participants in Phases 1 and 2 occupant surveys ................................................................... 213
Table 10.3: Time of day that dwellings are occupied from Phases 1 and 2 occupant surveys ................................................................ 213
Table 10.4: Electrical appliances used by households, Phases 1 and 2... 214
Table 10.5: Low energy light bulbs, Phases 1 and 2 ................................ 214
Table 10.6: Ease of heating controls operation, Phases 1 and 2 .............. 215
Table 10.7: Ease of hot water controls operation, Phases 1 and 2 ........... 215
Table 10.8: Effectiveness of controls at maintaining comfortable temperatures, Phases 1 and 2 ............................................... 216
Table 10.9: Comfort levels during winter, Phases 1 and 2 ........................ 216
Table 10.10: Additional heating use, Phases 1 and 2 ................................. 217
Table 10.11: Comfort levels during summer, Phase 2 ................................ 218
Table 10.12: Additional cooling, Phase 2 .................................................... 219
Table 10.13: Window opening to control temperature, Phase 2 ................. 221
Table 10.14: Effectiveness of ventilation system, Phases 1 and 2 ............. 222
13
Table 10.15: Window opening for air quality improvement, Phases 1 and 2 ............................................................................................. 222
Table 10.16: Adequacy of hot water, Phases 1 and 2 ................................ 222
Table 10.17: Awareness of fuel bills, Phases 1 and 2 ................................ 223
Table 10.18: Phase 1 Incidence of health problems associated with the living environment .................................................................. 223
Table 10.19: Phase 2 Incidence of health problems associated with the living environment experienced for the first time .................... 224
Table 10.20: Condensation, Phases 1 and 2 .............................................. 224
Table 10.21: Winter clothing weight preferences, Phases 1 and 2 ............. 224
Table 10.22: Satisfaction with heating, hot water and ventilation, Phases 1 and 2 ................................................................................... 225
Table 10.23: Goh and Sibley BedZED Occupant Survey Results .............. 230
Table 10.24: RH Results, Phase 2.............................................................. 235
Table 10.25: RH Comparison, Phase 2 ...................................................... 236
Table 12.1: Phase 1 Cohorts .................................................................... 244
Table 12.2: Construction date for Phase 1 dwellings ................................ 245
Table 12.3: Cohort 1 building comparison ................................................ 245
Table 12.4: Summary of changes to internal temperatures Phases 1 and 2 standardised to external temperature of 5°C ............... 251
Table 12.5: Comparison of Electricity Usage during Phases 1 and 2 ....... 259
Table 12.6: Adjusted Comparison of Electricity Usage during Phases 1 and 2 ...................................................................................... 260

14
Table of Figures
Figure 2.1: Energy Consumption by Sector 1970 – 2011 .......................... 29
Figure 2.2: Average winter internal and external temperatures 1970 - 2010 ......................................................................................... 33
Figure 4.1: Location of BedZED ................................................................. 76
Figure 4.2: Typical block at BedZED from south east corner ..................... 78
Figure 4.3: Section through typical block, ground and first floor maisonette ............................................................................... 79
Figure 4.4: Typical Ground Floor and First Floor plans .............................. 80
Figure 4.5: Sunspace at BedZED also showing photovoltaic cells in external glazing ........................................................................ 81
Figure 4.6: Section through typical BedZED external wall and installed wall section .............................................................................. 84
Figure 4.7: BedZED Building Physics ........................................................ 85
Figure 4.8: Sourcing materials for BedZED ............................................... 94
Figure 4.9: Schematic of Mechanical and Electrical Systems at BedZED ................................................................................... 95
Figure 4.10: Future eco-park at BedZED providing biomass for fuel ........... 96
Figure 4.11: Schematic of Combined Heat and Power plant at BedZED ..... 98
Figure 4.12: Comparative total household energy consumption in new houses ................................................................................... 102
Figure 4.13: Interior view of BedZED ......................................................... 103
Figure 4.14: Roof wind cowls at BedZED .................................................. 105
Figure 4.15: Finned return to heated towel rail from hot water cylinder in airing cupboard and fan panel ............................................... 106
Figure 6.1: Data collected for BedZED Case Study ................................. 132
Figure 7.1: BedZED mean electricity consumption compared to number of occupants ............................................................. 159
Figure 7.2: Appliance use at BedZED ...................................................... 160
Figure 7.3: Phase 3 energy usage by property type standardised for floor area ................................................................................ 163

15
Figure 7.4: Design and actual energy use at BedZED ............................. 167
Figure 7.5: Energy Efficiency Ratings from BedZED EPCs ..................... 168
Figure 7.6: Environmental Impact (CO2) Ratings from BedZED EPCs .... 169
Figure 7.7: Combined Energy Efficiency and Environmental Impact (CO2) Ratings from BedZED EPCs ........................................ 170
Figure 7.8: Estimated Annual Energy Use from BedZED EPCs .............. 171
Figure 7.9: Fuel dials on display in typical BedZED kitchen ..................... 180
Figure 7.10: BedZED occupant survey: Does having the fuel dials on display make a difference to your use of fuel and appliances? ............................................................................ 181
Figure 8.1: Internal bedroom temperatures standardised to external temp of 5°C ............................................................................ 184
Figure 8.2: Internal living room temperatures standardised to external temp of 5°C ............................................................................ 185
Figure 8.3: Mean internal temperatures across studies standardised to external temperature of 5°C ................................................... 187
Figure 8.4: Mean external temperatures °C recorded at BedZED during August 2003 hot spell ................................................. 189
Figure 8.5: Mean living room temperatures standardised to external temp of 20° C ......................................................................... 190
Figure 8.6: Mean bedroom temperatures standardised to external temp of 20°C .......................................................................... 191
Figure 8.7: Mean bedroom temperatures standardised to external temp of 25°C .......................................................................... 192
Figure 8.8: Mean living room temperatures standardised to external temperature of 25°C .............................................................. 193
Figure 8.9: Mean average daily internal temperatures standardised to external temperature of 25°C ................................................. 195
Figure 8.10: Living room temperatures standardised to external temperature of 25°C showing floor location ........................... 196
Figure 8.11: Bedroom temperatures standardised to external temperature of 25°C showing floor location ........................... 197
Figure 8.12: Mean internal temperatures across studies standardised to external temperature of 20°C ................................................. 198

16
Figure 8.13: Mean Internal Temperatures compared to Design ................. 200
Figure 8.14: Mean internal temperatures in sunspaces for two properties ............................................................................... 201
Figure 8.15: Mean internal temperatures in bathrooms for two properties ............................................................................... 203
Figure 10.1: Phase 2 occupant survey: comfort level of your home during the summer ................................................................. 218
Figure 10.2: Phase 2 occupant survey: additional cooling ......................... 220
Figure 10.3: Comparison of internal living room temperatures standardised to external temp of 5°C with overall occupant satisfaction levels with heating, hot water and ventilation ...... 226
Figure 10.4: Comparison of living room temperatures standardised to external temperature of 25°C with results of overall occupant satisfaction with heating, hot water and ventilation ............................................................................... 228
Figure 10.5: Comparison of bedroom temperatures standardised to external temperature of 25°C with results of overall occupant satisfaction with heating, hot water and ventilation ............................................................................... 229
Figure 10.6: Phase 1 and 2 Occupant Surveys - Window Opening ........... 231
Figure 10.7: Phase 1 and 2 Occupant Surveys – Condensation ............... 233
Figure 10.8: Phase 1 and 2 Occupant Surveys - Draughts ........................ 237
Figure 12.1: Comparison of bedroom temperatures Phases 1 and 2 standardised to external temperature of 5°C ......................... 247
Figure 12.2: Comparison of living room temperatures Phases 1 and 2 standardised to external temperature of 5°C ......................... 249
Figure 12.3: Occupant surveys: How would you describe the comfort level of your home during the winter? .................................... 252
Figure 12.4: Occupant surveys: How effective are the controls at maintaining comfortable temperatures in the home? ............. 253
Figure 12.5: Occupant surveys: How easy do you find it to operate the heating controls? ................................................................... 254
Figure 12.6: Occupant surveys: Do you use any additional form of heating? ................................................................................. 256

17
Figure 12.7: Phase 1 dwellings - Living Room Temperatures compared to SAP .................................................................................... 257
Figure 12.8: Phase 1 dwellings: Living Room Temperatures compared to mean U-values ................................................................... 258
Figure 12.9: Occupant surveys: How much clothing do you normally wear in the home in winter? ................................................... 262
Figure 12.10: Occupant surveys: How satisfied are you with the heating, hot water and ventilation in your home? ................... 263
Figure 12.11: Occupant surveys: Is there any condensation or mould in your home? ........................................................................ 264
Figure 12.12: Occupant surveys: Do you open windows to improve air quality? .................................................................................. 265
Figure 12.13: Occupant surveys: Do you consider your home to be draughty? ............................................................................... 266
Figure 12.14: Occupant surveys: Have you experienced asthma or a similar health problem either in your previous home or for the first time in BedZED? ....................................................... 267
Figure 12.15: Occupant surveys: Do you know how much your annual fuel bills are? .......................................................................... 268
Figure 12.16: Occupant survey - number of appliances .......................... 269

18
Chapter 1 Introduction
1.1 Research Context
The UK Government is concerned about rising levels of carbon emissions
which contribute to climate change. It has been known for some time that
fossil fuel energy use is a significant contributor to carbon emissions and that
domestic energy use makes up a significant proportion of overall energy use.
The UK has committed to addressing this with its support for the UN
commitment in Kyoto in 1998 and European Union legislation in the form of
the Energy Performance of Buildings Directive in 2002 and the recast
Directive in 2010 with its commitment to reducing targeted greenhouse gas
emissions by 80% by 2050, enacted in the 2008 Climate Change Act. The
2011 Carbon Plan stated that by 2050 all buildings will need to have an
emissions footprint close to zero. Earlier Governments have also been
concerned with the rising cost of energy and the impact on low income
households who have had to spend an increasing proportion of their income
on energy. There is also a body of research that makes the link between
poor levels of warmth and health and more recent research highlights the
impact of overheating on health. So in addition to reducing carbon
emissions, there have been initiatives to reduce energy usage in dwellings to
keep energy affordable and minimise health impacts.
The vehicle for ensuring that new buildings meet the Government’s
commitments to reducing carbon emissions is Part L of the Approved
Documents to the Building Regulations which govern the conservation of
Fuel and Power in new dwellings, last revised in 2013.
The case study used in this research is the Beddington Zero Energy
Development (BedZED) in the London Borough of Sutton. The development
was designed to have 82 dwellings and 19 live-work units. It was designed
holistically around sustainable land and resource use, passive design
principles, renewable energy, a green transport plan and a plan for
sustainable food sourcing. Peabody Trust (now Peabody) funded the

19
BedZED development in 1999 with construction starting in the same year and
completing in 2002.
Data were collected in three phases specifically for this PhD: the principal
phase (Phase 2) involved regular temperature, relative humidity and
electricity usage monitoring in a sample of 24 properties on the BedZED
development for a period of almost two years. A preceding phase (Phase
1) collected similar data in 14 properties occupied by BedZED residents
before moving into the BedZED development. Occupant surveys were
undertaken during Phase 1 and at the end of Phase 2. A heat loss survey
was undertaken in a sample dwelling at the end of Phase 2. In the final
phase, eight years after the development was completed (Phase 3), energy
consumption data were collected for the whole development and Energy
Performance Certificates (EPCs) issued on BedZED properties were
downloaded and analysed.
1.2 Research Aim, Hypothesis and Research Questions
The aim of this research is to use a detailed case study of a new build
housing development to investigate the application of zero/low energy design
techniques and evaluate the results taking into account changes in the
design during the construction and changes in occupant behaviour after
moving into the development.
The hypothesis for the study is:
“There is a performance gap between predicted and actual energy
performance in low energy dwellings and this is due to occupant behaviour”.
The research questions that will test this hypothesis are as follows:
How do the constructed units perform compared with the theoretical
design performance?

20
What is the difference, if any, between the constructed units and the units
as designed?
Why is there a difference?
What conclusions can be drawn about this and can the energy model or
design practices be changed to reflect this?
Have participants changed how they use energy at home as a result of
moving to the new development?
1.3 Research Significance
The significance of this thesis is that it provides an in-depth assessment of a
case study housing scheme designed on holistic principles of minimising the
impact of the development on the environment, not just in terms of building
construction and operation but also other aspects of occupants’ lifestyles
including transport and food purchases. Even ten years after the
development was completed, it remains the largest of its kind in the UK
although the Little Kelham development in Sheffield will be larger when
completed.
There can be many reasons why buildings do not perform as built: the design
might not deliver the performance required; the construction process might
be flawed or may change in response to unforeseen requirements once the
project gets underway; building users might not use the building as expected;
or a combination of these factors. Evaluating the actual performance of
dwellings in use provides valuable feedback to designers about what does
and doesn’t work and feeds forward into future design and developments.
This is particularly important in the light of the Government’s commitment to
zero carbon emissions from new buildings.
The thesis evaluates how the original construction and design aims have
been achieved in use. The following qualities make this study unique:

21
1. An in-depth study of the performance of this newly built housing
scheme which was the first large scale zero energy development in
the UK;
2. A longitudinal comparison of the participants in the study sample,
enabling a comparison of the same participants in their zero energy
dwellings with their former homes;
3. An assessment of summer overheating in well-insulated dwellings
during one of the hottest summers on record;
4. Analysis of EPCs issued on the UK’s first large-scale zero energy
development.
This study was completed over the period 2002 – 2014. The main data
collection (Phases 1 and 2) took place during 2002-2004 with subsequent
data collection in 2013 – 2014 (Phase 3). The original intention had been to
complete the study in 2005 but this was delayed owing to career reasons.
The study still offers new insights into what remains one of the most
innovative housing developments built in the UK and the additional time
provided an opportunity for additional data collection.
1.4 Thesis Structure
This section summarises the structure and content of each chapter.
1.4.1 Chapter 2 Literature Review
The chapter provides the rationale and justification for the thesis through a
summary of scientific studies that chart the link between buildings and
climate change and the political and legislative response of the UK. It
analyses changes in domestic energy demand over time. It highlights human
factors research relevant to this thesis. It analyses the taxonomy for low
energy and zero energy housing developments and it describes energy
measurement systems in use and their applicability to such developments.

22
1.4.2 Chapter 3 Comparative Low Energy Case Studies
This chapter discusses other low energy and energy efficient housing
developments which provide the source of measurement and evaluation
methods used in the BedZED study and discussed in Chapter 6 Methods.
Additionally, the results from some of these other case studies are compared
with the results from the BedZED case study in future chapters.
1.4.3 Chapter 4 BedZED Case Study
This chapter introduces the BedZED case study with reference to original
project documents. The scale of ambition for BedZED is discussed from the
original design theory for the development to the energy strategy and passive
design principles applied to the construction design. The chapter also
describes the dwellings lived in by a sample of occupants prior to moving to
BedZED in preparation for the longitudinal comparison in Chapter 12.
1.4.4 Chapter 5 Summer Overheating
This chapter discusses the growing importance of summer temperatures and
overheating for building designers and occupants. It summarises the trend
towards higher summer temperatures and discusses definitions of hot spells.
The chapter explains the significance of summer temperatures and hot spells
with regards occupant comfort and the impact on health. The hot spell in
2003 that occurred during the Phase 2 monitoring period for this study is
discussed.
1.4.5 Chapter 6 Methods
This chapter sets out the methods for testing the hypothesis, drawing upon
the earlier case studies discussed in Chapter 3. The justification for using a
case study is addressed. The three phases of data collection for this study
are discussed and the data analysis methods that have been adopted.

23
1.4.6 Chapter 7 Energy Usage Results and Analysis
This chapter is the first of six chapters that presents the study results. This
chapter summarises the actual performance of the dwellings at BedZED with
regards energy usage, drawing upon results from Phase 2 and Phase 3. It
analyses and discusses the EPCs issued for BedZED.
1.4.7 Chapter 8 Internal Temperatures Results and Analysis
This chapter compares the internal temperatures achieved at BedZED with
the design target. It comprises analyses of both winter and summer
temperatures including the hot spell in August 2003 and it compares the
BedZED results to some of the other case studies discussed in Chapter 3.
1.4.8 Chapter 9 Air Tightness Results and Analysis
This chapter compares the air tightness results achieved at BedZED with the
design. It includes the results from air tightness tests and a heat loss survey
carried out at a sampled property and it also analyses relative humidity
readings for the property.
1.4.9 Chapter 10 Occupant Surveys Results and Analysis
This chapter presents the results from the two occupancy surveys carried out
on samples of BedZED residents. The findings are analysed to evaluate the
perceptions and views of occupants about their properties and to provide
useful qualitative evidence to compare to the monitoring data.
1.4.10 Chapter 11 Changes to BedZED during the Development Process
This chapter refers to source documents from the project and discusses
changes made to the design during the development and occupation phases
to establish whether any changes impacted on the actual performance of the
BedZED properties in use.

24
1.4.11 Chapter 12 Longitudinal Study
A unique feature of this study was the inclusion of a measurement phase
prior to participants taking up residence in BedZED. This longitudinal
element provided a baseline of occupants’ behaviour in their previous homes
and enabled the study to assess whether it changed as a result of moving
into the new dwelling.
1.4.12 Chapter 13 Discussion
This chapter discusses the findings of the study in the light of the research
questions set out in section 1.2. It discusses the key differences identified
between design and performance in chapters 7 – 12 and puts forward
reasons for the differences.
1.4.13 Chapter 14 Conclusions
This chapter discusses the key findings from the research study.
1.4.14 Chapter 15 Limitations of the Study and Future Work
This chapter sets out the limitations of the study and makes
recommendations for future follow up work.

25
Chapter 2 Literature Review
2.1 Introduction
The purpose of this chapter is to review the literature that provides the
rationale and justification for the research topic. It provides policy context for
the thesis with a brief summary of scientific research on climate change and
the UK’s policy response. This includes the Government’s legally binding
commitments to balance its carbon budget through emissions reduction and
mitigate the impact of climate change.
The chapter provides a brief review of forecast demand for energy and the
impact of demographic changes.
The chapter then reviews the Government’s strategy to address climate
change and energy reduction for construction with an analysis of the
regulatory environment for construction and the commitment to zero carbon
new buildings. To introduce energy performance assessments later in the
study, the chapter briefly discusses energy measurement systems used for
construction and housing. This information is contextualised with a summary
of energy efficiency trends from national Housing Stock studies.
The chapter goes on to review the literature on human factors associated
with the provision of energy efficient housing, specifically the definition of
comfort and the issue variously known as rebound, comfort taking or take-
back and which is thought to affect performance of dwellings in use.
The chapter concludes with a summary of the taxonomy used to describe
and classify zero energy and low energy buildings in preparation for the
BedZED case study that forms the basis of research for this thesis. BedZED
is an early example of a housing development that was described as zero
energy and designed without the normal whole heating system usually found
in new housing construction. For all these reasons, BedZED is an interesting
case study which helps inform the Government’s energy and emissions

26
reduction strategy for new housing development and new building
regulations.
2.2 Scientific context
The impact of extracting and using energy on the environment was first
observed in the nineteenth century by Svante Arrhenius who calculated the
relationship between atmospheric levels of carbon dioxide and ground
temperatures (Arrhenius 1896). In 2007, the Intergovernmental Panel on
Climate Change published reports assessing the available scientific
information on climate change. They confirmed that most of the observed
increase in global average temperatures since the mid-20th century is very
likely due to the observed increase in anthropogenic greenhouse gas
concentrations and that, for the next two decades, a warming of about 0.2°C
per decade was projected for a range of emissions scenarios (IPCC 2007).
The latest IPCC assessment (2014) confirms that “Human influence on the
climate system is clear”. IPCC scenarios show that even with low-emission
mitigation strategies, mean temperatures are forecast to increase by a further
1 - 2°C above pre-industrial levels and high emission scenarios by as much
as 4°C or more above pre-industrial levels. The consequences of increased
temperatures could include severe and widespread impacts on unique and
threatened systems, substantial species extinction, large risks to global and
regional food security, and the combination of high temperature and humidity
compromising human activities such as growing food or working outdoors in
some areas for parts of the year (IPCC 2014).
Governments have responded variously with mitigation strategies to minimise
or slow down the predicted temperature increases. Some are also
developing adaptation strategies which seek to adapt the built environment to
the expected changes in weather patterns resulting from climate change.
This thesis focuses on mitigation approaches.

27
2.3 Policy context
The Kyoto Protocol to the United Nations Framework Convention on Climate
Change set a long term commitment to maintain global temperature rises
below 2°C and the signatory parties agreed to a reduction commitment in
CO2 emissions. The European Union’s contribution to this global target was a
target to reduce emissions by 8% between 2008 and 2012 (UN 1998). The
Kyoto Protocol was signed by all European Union member states and the
European Union subsequently published the EU Directive on the Energy
Performance of Buildings (EPBD) in December 2002. This legislation
recognised that buildings were responsible for about 40% of Europe’s energy
consumption and it bound EU member states to achieving a reduction in total
end energy consumption and an 8% reduction of CO2 emissions by 2010
when compared to the base year of 1990 in order to comply with the EU’s
commitment to the Kyoto Protocol (EC 2002). The 2010 recast of the EPBD
in 2010 establishes the ‘nearly zero energy building’ as the building target
from 2018 for all public owned or occupied by public authorities buildings and
from 2020 for all new buildings (EC 2010).
In 2006, the UK Government introduced the Code for Sustainable Homes
(DCLG 2006a) as part of a commitment that all new homes would be zero
carbon from 2016. It stated its intention to use this as the basis for future
developments of the Building Regulations in relation to carbon emissions
from and energy use in homes and so provide greater regulatory certainty to
housing developers. It estimated that, if the rate of housing development
matched what was required, by 2050 one third of the total housing stock
could have been built in accordance with the Code. The Code comprised six
levels with Level 6 defined as a home with zero carbon emissions resulting
from heating, lighting, hot water and all other energy uses in the home. A
Zero Carbon home would go beyond insulation and heat loss calculations
and require designers to have regard to a comprehensive set of requirements
to reduce the environmental impact of the dwelling in construction and in use
and for the dwelling to be completely zero carbon which is defined as zero
net emissions of CO2 from all energy use in the home.

28
In 2007, the Government set out its intention in a policy statement to achieve
a zero carbon goal in three steps: by 2010 to a 25% improvement in the
energy/carbon performance set in Building Regulations; by 2013, to a 44%
improvement; then, finally in 2016, to zero carbon. It defined zero carbon
as, over a year, the net carbon emissions from all energy use in the home
would be zero (DCLG 2007).
The Climate Change Act enacted in 2008 commits the UK by law to ensuring
that the net UK carbon account for 2050 will be at least 80% lower than the
1990 baseline excluding international aviation and shipping. The 1990
baseline was defined as “the aggregate amount of net UK emissions of
carbon dioxide for that year, and the net UK emissions of each of the other
targeted greenhouse gases for the year that is the base year for that gas”
(Parliament UK 2008). The subsequent Carbon Plan published in 2011 set
out how the UK Government intends to meet its Climate Change Act 2050
carbon budget obligations across all sectors. For buildings, the aim was that
“by 2050 all buildings will need to have an emissions footprint close to zero”
(HM Government 2011).
2.4 Demand for Energy
This section reviews the literature about changes in demand for energy and
some aspects of energy supply.
2.4.1 Demand
Over the last 40 years, domestic energy consumption has increased, see
Figure 2.1.

29
Figure 2.1: Energy Consumption by Sector 1970 – 2011
Source: Table 1.02 DECC 2014
Between 1970 and 2011, energy use by the domestic sector increased by
4.1% from 58 million tonnes of oil equivalent (mtoe) to 60.4 mtoe. Overall,
energy consumption fell as a consequence of reduced industry consumption
which goes some way to offset the increases from transport and other
sectors.
There are a number of factors that affect how much energy is used in
dwellings: the number and size of dwellings, population and household size
and what energy is used for within dwellings. Table 2.1 shows that while the
overall UK population and domestic energy consumption has increased over
the last 40 years, energy use per household and per person has reduced.
0
50
100
150
200
250
Industry Transport Domestic Services Total
Mill
ion
s o
f to
nn
es
of
oil
eq
uiv
ale
nt
(Mto
e)
1970 2011

30
Table 2.1: Changes in Population, Households and Energy Usage
1971
2011 % change
(changes in number)
Sources
Population (millions)
55.91 63.2
2
+13%
(+7.3)
1ONS 2011
2ONS 2012a
Households (millions)
18.63 26.3
4 +41%
(+7.7)
3ONS 2009
4ONS 2012b
Number people per household
3 2.4 -20%
(-0.6)
Overall domestic energy consumption (MWh)
674,540,0005
702,452,0005
+4.14%
(+27,912,000)
5DECC 2014
data converted from mtoe to MWh using DECC 2013a conversion factor
Mean annual energy consumption per household (KWh)
36,266 26,709 -26%
(-955)
Mean annual energy consumption per person (KWh)
12,067 11,115 -8%
(-952)
Although energy use by dwellings increased overall between 1971 and 2011,
Table 2.1 suggests that this is a function of increased population size (+13%)
and number of households (+41%). When measured at an individual
property level, energy use fell by 26% between 1971 and 2011. Reasons
may include the impact of energy efficiency initiatives and also changes in
energy pricing. If energy consumption per household had remained at 1971
levels, then overall domestic energy consumption would have increased by
significantly more than the 4% shown in the 40 year period.
Further analysis of demographic change since 2011 shows that in 2013 there
were 26.4m households in the UK (ONS 2013a), maintaining the upward
trend illustrated in Table 2.1. The proportion of adults living alone almost

31
doubled in the 40 years between 1973 and 2011 from 9% to 16% (ONS
2013b) contributing to the reduction in household size and increase in the
number of households. Looking ahead, the UK population is forecast to
increase by a further 15% over the next 25 years, shown in Table 2.2.
Table 2.2: Forecast Changes in UK Population Size
Year Millions
2012 63.7
2017 65.8
2022 68
2027 70.0
2032 71.7
2037 73.3
Source: ONS 2013c
If energy consumption per person remained unchanged from 2011 levels,
this would result in a 15% increase in energy used by dwellings. The
relevance of these demographic changes on domestic energy use is two-fold.
Firstly, a net increase in energy consumption to support the increasing
population size. Secondly, a marginal increase in energy usage per person
resulting from smaller household units distributed across the existing housing
stock, that is, we now occupy more space per person which needs more
energy to condition it. These demographic changes impact on the UK’s
ability to meet statutory carbon emissions reduction targets required by the
Climate Change Act. Carbon reduction targets are absolute and not relative
to the number of households. It means that even more energy efficiency and
carbon reduction programmes are required to offset the overall increase in
usage in addition to reducing baseline carbon emissions.
The breakdown of what domestic energy is used for has changed. Table 2.3
incorporates Palmer and Cooper’s modelled results for the 40-year period
1971-2011 using the Building Research Establishment Housing Model for
Energy Studies (1970-2008) and the Cambridge Housing Model (2008
onwards). The Palmer and Cooper data for total domestic energy usage are
63% and 55% less than the DECC usage figures for 1971 and 2011. Their

32
modelled data suggest an overall increase in energy use by the domestic
sector of 9.3%, more than twice that of the DECC actual data quoted in Table
2.1. The difference between the total energy used is thought to be because
the DECC data in Table 2.1 is primary energy equivalent (which includes the
energy used during the production process and its relative efficiency, e.g. of
the power station) whereas the energy in Table 2.3 is delivered energy and is
therefore a lower figure. The comparison also shows a reduced difference
between primary and delivered energy by 2011, indicating the improved
efficiency of energy production during that time period. Additionally, Table
2.3 is modelled whereas Table 2.1 is based on measured energy flows.
Comparing measured with modelled data is one of the key research
questions for this thesis. However, within those limitations, Palmer and
Cooper’s models provide an indication of changing trends in what domestic
energy is used for.
Table 2.3: Modelled Changes in Domestic Energy Usage 1971 - 2011
TWh % increase
1971 2011
Space heating 230.1 279.6 21.5
Hot Water 125.6 82.6 -34.2
Lighting 10.7 14.0 30.8
Appliances 21.5 62.8 192.1
Cooking 25.6 12.8 -50.0
Total 413.5 451.8 9.3
Source: Palmer & Cooper 2013 Appendix 1, Tables 5b,c,d,e.f
Table 2.3 shows an overall increase in energy used for space heating,
lighting and appliances, partially offset by reductions in energy used for hot
water and cooking. The table is a simple comparison of energy used and
does not take into account the change in the number of homes with whole
house heating which increased from 28% of total number of dwellings in
1971 to 91% in 2011 (Table 6a, Palmer & Cooper 2013). There is also no
reference to the output achieved by heating systems and improved
technological efficiency. Palmer and Cooper’s modelling suggests that in
1970, during the winter, the average internal temperature in homes with

33
central heating was estimated to be 13.7°C. By 2011, this estimate had risen
by 4°C to 17.7°C. Figure 2.2 suggests that the modelled Mean Internal
Temperature (MIT) in all homes has increased including those without central
heating.
Source: Palmer & Cooper (2013) Graph 6o
Figure 2.2: Average winter internal and external temperatures 1970 - 2010
In their research, Elwell et al took into account external temperatures and
showed that the mean balance temperature for UK dwellings (the
temperature at which the heat demand to reach the desired internal
temperature is just met by free heat gains) has not increased over the period
1998 to 2014 as a consequence of improved efficiency in boilers and fabric
heat loss (Elwell, Biddulph, Lowe et al 2014).
The size of dwellings is relevant. The size of households fell from 3 to 2.4
persons between 1971 and 2011; if the size of new dwellings fell
commensurately, this could go some way to mitigating overall domestic
energy consumption. The 2011 English House Survey found the mean
average total usable floor area of UK dwellings (which equates to NIA as
defined by the RICS Code of Measuring Practice 2007) in 2011 was 91.2m2
across all households, tenures and age of properties excluding integral
garages, balconies, stores accessed from the outside only and the area
34
under partition walls (DCLG 2013, Table 12). The register of Energy
Performance Certificates shows that average floor area of new dwellings in
2012 was 89.7m2 and in 2013 was 93.6m2 (Table 2, DCLG 2014c). No clear
trend is yet emerging that new dwellings are getting smaller contrary to RIBA
research that found that the size of the average new UK home was 76m²
(Roberts-Hughes 2011).
Over time, a reduction in the size of dwellings might reduce further the
energy used for space heating and lighting since these are dependent on
property size. However the number of new housing units completed in the
UK for the last full recorded year (2012) was 143,690 (DCLG 2014a). At that
rate, the existing housing stock is not being replaced fast enough to counter
the effect of increased demand and smaller household size. Given the
increase in overall population size and numbers of households, it is likely that
the new dwellings are adding to the housing stock rather than replacing it.
In summary, the ONS forecast of a 15% increase in population between 2012
and 2037 and the proportionately larger number of homes resulting from
smaller households mean that energy consumed in the domestic sector could
rise further without new technological solutions. In 2007, Boardman
estimated that by 2050 there could be 23% more households with a
commensurate increase in energy consumption (Boardman 2007). In their
2010 paper Vale and Vale highlighted the paradox that houses in many
developed countries have become more energy efficient but occupants
demanded greater floor area and amenity, offsetting some or all of the
energy savings from more efficient design.
The significance of increased demand is even greater when applied globally.
United Nations global population projections estimate that the population will
increase from 6.9bn in 2010 to 9.5bn by 2050 (UN 2012). The US
Department of Energy estimated that global energy consumption will
increase by 56% between 2010 and 2040, from 524 quadrillion Btus in 2010
to 820 quadrillion Btus in 2040 with the majority of the increase coming from
developing economies (EIA 2013).

35
The projected increased demand for energy plus commitments to reduce
absolute carbon emissions from energy use provides the rationale for the
Government’s commitments towards zero carbon building discussed earlier
in this chapter and the justification for evaluating the actual performance in
use of the BedZED case study.
2.4.2 Supply
The 2009 EU Renewable Energy Directive required the UK to obtain 15% of
all energy from renewable sources by 2020 (EC 2009). This represents an
increase in the share of renewables in just over a decade by almost a factor
of seven from about 2.25% in 2008. By 2012, 4.1% of the UK’s energy
consumption was from renewable sources, much of this from traditional
renewable sources such as hydro-power rather than new sources of
renewables such as wind power (DECC 2013b). To achieve the target,
strategies to meet the remaining 10.9% will need to be delivered within the
eight years from 2012.
The requirement to source more energy from renewables is a further
rationale for this thesis which includes an assessment of the effectiveness of
the BedZED on-site renewable energy sources.
2.5 Building Regulations
Buildings make a significant contribution to climate change both directly in
their use of energy for heating and lighting and running electrical appliances
and also indirectly in their construction and sourcing of materials. Part L of
the Building Regulations (HM Government 2014) sets standards for energy
efficient performance of new buildings and enables the Government to
comply with its obligations under the Energy Performance of Buildings
Directive to improve the energy efficiency of new buildings and thereby
reduce energy consumption and carbon emissions.
36
2.6 Modelling and Measurement systems
There are two types of systems relevant to this study. Energy modelling
systems model typical performance for a construction and housing type, for
example design principles such as building orientation, solar shading,
heavyweight or lightweight construction, construction design such as cavity
wall thickness or window design. The outputs from the Palmer and Cooper
models have already been discussed (Palmer & Cooper 2013). The second
is performance measurement systems that measure actual buildings in use.
This study compares the energy model (SAP) produced prior to the
construction of the case study development with the actual performance
achieved in a sample of dwellings. This section of the chapter describes
modelling systems used in industry in preparation for later chapters.
2.6.1 BREDEM
The energy modelling systems used in the UK are based on the Building
Research Establishment Domestic Energy Model (BREDEM). Until the
release of BREDEM in 1990 little, if any, attempt had been made to establish
a comprehensive means of assessing a broad range of environmental
considerations in buildings (Cole 1998). BREDEM was developed in the
early 1980s by the Building Research Establishment for various applications
including energy efficiency analysis, determination of investment cost
effectiveness of investment and/or the assessment of improvement in
average internal thermal conditions (Anderson 1985). It estimates energy
requirements in different dwelling types, forecast running costs of a property,
most appropriate measures for upgrading existing dwellings, savings from
energy efficiency measures and internal temperature conditions for a given
energy input (Energy Saving Trust 1996).
2.6.2 NHER
The National Home Energy Rating (NHER) was launched in 1990 and based
on the BREDEM model. It models the energy efficiency of a dwelling in
terms of energy system running costs per m2. It takes into account house
design and construction, location, heating system efficiency and controls, fuel

37
type used, lighting system and appliances, the number of occupants and the
way the dwelling is heated. NHER is a non-linear scale originally ranging
from 0-10, with 10 being the most energy efficient. The scale was updated
in 2006 to 1-20 with 20 being the most energy efficient (Jie 2010). Houses
built to the 1995 Building Regulations (in force at the time that the BedZED
case study sought building regulations approval) typically scored between 6
and 8, while the UK average rating was approximately 4 (Todd 1997). Todd
discusses how the NHER index score depends on many factors, including
occupancy patterns that can affect the energy used in identical houses by up
to a ratio of 5:1. The NHER index is calculated primarily using fuel costs,
normalises for building size and takes account of heating systems and
insulation levels in the building. The index aims to give the same values to
houses with the same heating appliances, level of insulation and fuel
conversion efficiency.
NHER has different levels of analysis, each with different data requirements
and producing ratings to different degrees of accuracy. The simplest is level
0 and is designed to provide a very crude NHER assessment of all the
dwellings based on minimum information; the most complex analysis is a
complete NHER (level 2/3) assessment and requires a full set of data on the
property (Todd 1997). NHER Level 2 surveys were undertaken for the
Phase 1 dwellings occupied by BedZED case study participants prior to
moving into BedZED.
2.6.3 Standard Assessment Procedure (SAP)
The BREDEM method also underpins the SAP. SAP is based on annual
energy costs for space and water heating and predicts energy use and CO2
emissions. The SAP calculation assumes a standard occupancy pattern,
derived from the measured floor area of the dwelling and a standard heating
pattern. The rating is normalised for floor area so that the size of the dwelling
does not strongly affect the result which is expressed on a scale of 1 – 100,
where the higher the number the better the performance (BRECSU 1996).
The SAP rating can be difficult to interpret as it uses a logarithmic scale to
convert fuel cost per m2 to a rating. The SAP model can, however, also

38
calculate normative energy and fuel costs. SAP ratings depend on many
variables including thermal insulation, efficiency and control of the heating
system, ventilation characteristics, solar gain characteristics, and the price of
fuel.
In 1995, SAP was incorporated into the revised Part L of the Buildings
Regulations. Thereafter, new dwellings and conversions that required
Building Regulations consent, had to have a SAP rating to demonstrate
compliance with Part L of the Building Regulations. Since its adoption by the
Building Regulations, SAP has become the national standard method. From
2005 lighting was included in the calculation and from 2009 thermal mass
was explicitly modelled. The latest version of SAP, SAP 2012, takes account
of geographical location (but not as it affects space heating energy use due
to changes in external temperature). The number of occupants and
occupancy lifestyles such as fuel used for cooking and appliances are not
included as variables in the SAP model (Griffiths 2010).
SAP has undergone considerable evolution in the last decade including
moving from annual degree day calculations to monthly calculations using
external temperature.
2.6.4 Comparing NHER and SAP
NHER was a pre-cursor to SAP with high levels of training required. It was
designed to be more flexible in its modelling, taking more account of the
impact that geographical variation in climate had on space heating and
allowing different occupancy patterns to be used. This flexibility was
constrained in SAP, particularly in early versions, so as to make the
calculations manageable by hand and to allow the same home located in
different parts of the UK to have the same rating.
McNeil states on the National Energy Services Ltd website that an average
dwelling in England would score between 4.5 and 5.5 on the NHER scale,
whereas a gas-heated masonry semi-detached dwelling meeting Building
Regulations Part L1a 2006 would score NHER 10. A dwelling with an NHER

39
rating of 20 achieves zero CO2 emissions along with zero net running costs
(McNeil 2010). SAP ratings are used to underpin EPCs so a dwelling with a
SAP rating of 92 or more would be in the EPC A band.
2.6.5 Housing Stock Studies
A number of studies record the energy efficiency of houses. The largest
scale study of multiple housing types is the English Housing Survey (EHS).
This is a continuous national survey commissioned by the Department for
Communities and Local Government (DCLG) and merges the former English
House Condition Survey and Survey of English Housing. It collects
information about people’s housing circumstances and the condition and
energy efficiency of housing in England. It consists of two surveys: an
interview of almost 14,000 households and a physical inspection of almost
15,000 properties. The data are used to monitor the condition and energy
efficiency of the housing stock so that policies and resources can be targeted
to where they are most needed.
The latest EHS headline report for 2011-12 shows that energy efficiency of
the English housing stock has continued to improve. Table 2.4 shows that
between 1996 and 2011 the average SAP rating of a dwelling increased by
12 SAP points from 45 to 57 and the proportion of dwellings achieving the
highest Energy Efficiency Rating (EER) Bands has increased considerably
since 1996 (DCLG 2013). The EHS therefore provides a high level
assessment of the changing profile of housing and measures improvements
to the overall housing stock as a consequence of policy and regulatory
changes. The survey tracks overall trends and is not intended to provide
detailed examination of which design solutions work. For that, detailed case
studies such as this BedZED case study are required.

40
Table 2.4: Mean SAP rating by tenure, 1996 – 2011
1996 2001 2003 2004 2005 2006 2007 2008 2009 2010 2011
Owner occupied 43.9 45.6 46.4 47.0 47.4 48.1 49.3 50.4 52.0 53.7 55.3
Private rented 40.5 43.8 45.4 46.7 47.1 47.6 48.9 50.1 51.9 53.8 55.4
Private sector 43.5 45.3 46.3 47.0 47.4 48.0 49.2 50.3 51.9 53.7 55.4
Local authority 47.6 50.2 52.0 53.7 54.7 55.3 55.7 56.8 58.3 59.9 61.9
Housing Assoc. 52.6 55.9 55.9 56.6 57.8 58.2 58.3 59.0 60.8 62.6 63.8
Social sector 48.6 52.1 53.6 54.9 56.1 56.7 57.0 57.9 59.6 61.4 62.9
All tenures 44.6 46.7 47.6 48.5 49.0 49.6 50.6 51.7 53.2 55.0 56.7
Source: Table 13, English Housing Survey Headline Report 2011-12 (DCLG 2013)
2.6.6 Energy Performance Certificates (EPCs)
In 2007, EPCs were mandated through Statutory Instrument 2007/991 (HM
Government 2007) under the Energy Performance of Buildings Directive
2002/91/EC (EC 2002). This requires an EPC to be issued for all dwellings
sold or rented. The EPC includes two ratings: an energy efficiency rating
and an environmental impact rating that measures CO2 emissions. Ratings
are derived from a SAP calculation and are combined into a sliding scale of A
– G with A being the most energy efficient and least environmental impact.
The 2007 English House Condition Survey found that the majority of existing
UK dwellings would receive a band D or E energy efficiency rating with the
overall average being a band E (Watts, Jentsch & James 2011).
The limitations of using SAP for EPCs were recognised by Murphy, Khalid
and Counsell, particularly with regards to low energy dwellings. They
proposed a refinement to the current SAP methodology to address concerns
in using SAP for the production of EPCs, notably in how SAP calculates the
energy requirement for low energy dwellings (Murphy et al 2011). A number
of BedZED properties have been sold since the introduction of EPCs and the
ratings in these EPCs are discussed in Chapter 7.
2.6.7 Homes Energy Efficiency Database
The performance in use of houses is monitored by the Homes Energy
Efficiency Database (HEED) operated by the Energy Saving Trust. It contains

41
data on the UK housing stock and energy efficiency measures dating back to
1995. Since 2008, the Carbon Emissions Reduction Target (CERT) requires
all domestic energy suppliers with a customer base greater than 250,000
customers to make savings in the amount of CO2 emitted by householders.
Suppliers meet this target by promoting the uptake of low carbon energy
solutions to domestic energy users. CERT data are collected by individual
energy suppliers and then collated, anonymised, and processed by a data
processing bureau before being provided to the Energy Saving Trust for
loading into HEED (Energy Saving Trust 2013a).
The HEED database collects information about housing characteristics
including property age, construction features, heating systems and whether
any micro generation technologies are installed. It contains at least one
piece of information for around 48% of all UK dwellings, with an average of
over 10 items per dwelling, principally information about property age and
type. HEED also collects details of domestic energy meter readings (Energy
Saving Trust 2013b). DECC has also built a framework called National
Energy Efficiency Data-framework (NEED) to enable statistical analysis of
the data collected in HEED. The results from this BedZED study could
support future development of the national database and comparative studies
of energy efficiency performance.
2.6.8 Why measure actual performance?
From April 2006 and after the completion of the BedZED development, SAP
2005 and its subsequent updates was adopted as the basis for checking new
dwellings for compliance with UK Building Regulations relating to the
conservation of fuel and power (HM Government 2010a). However, as
Banfill identified, buildings are assessed on their design rather than on the
performance of the completed construction (Banfill and Peacock 2007). The
exception to this is pressure testing to ensure compliance with air tightness
standards and the Robust Details approach used for acoustic performance.
The use of Robust Details, which are high performance construction details,
is permitted by Part E of the Building Regulations as an alternative to pre-
completion testing (HM Government 2010b). The Government has recently

42
consulted on future zero carbon homes regulations and how an Allowable
Solutions method might work for zero carbon design. It cites the work of the
Zero Carbon Hub which has looked into how the gap could be closed
between design and as-built performance of new homes (DCLG 2014b).
Sanders and Phillipson illustrated the significance of the gap between design
and performance. They found that measured energy savings are about half
of the savings predicted theoretically from the design and that about half of
the discrepancy is due to higher internal temperatures in the houses
concerned (Sanders & Phillipson 2006). Until SAP 2009, earlier versions of
SAP did not take account of thermal mass, leading to the BedZED architect
to state “it is important that a tool capable of a full thermal analysis is used in
order to show the effect of the thermal mass and other aspects of building
physics accurately. For this reason standard assessment tools such as UK
SAP/NHER or SBEM are avoided” (Dunster et al 2008). SAP 2009 now
includes thermal mass in its calculation. One aspect of this study is to
compare the original assumptions used in the design and energy strategies
and the SAP calculation with actual performance measurements of the
development in use including assessments of performance in EPCs issued
using RdSAP.
2.6.9 Ecological Footprint
Although not covered by legislation, another perspective in the literature
relating to modelling and measurement and relevant to the BedZED case
study is the concept of ecological footprint.
In their Living Planet Report published in 2000, the World Wildlife Fund
(WWF) stated that the Earth’s natural ecosystems had declined by about
33% over the previous 30 years and the ecological impact of humanity on the
Earth had increased by about 50% over the same period and was exceeding
the biosphere’s regeneration rate (WWF International 2000). This was the
first report to include a calculation of the ecological footprint which measures
a population’s consumption of food, materials, and energy in terms of the
area of biologically productive land or sea required to produce the resources

43
and to absorb the corresponding waste. The footprint varied significantly
across countries but WWF concluded that, overall, the world was consuming
at a rate at least 30% more than the area available and therefore depleting
the natural resources (WWF International 2000).
Bioregional were part of the BedZED development team and their
sustainable development philosophy was influenced by the WWF’s Living
Planet Report. Underpinning the BedZED concept was the rationale that if
“everyone on the planet consumed as much as the average person in the
UK, we’d need three planets to support us” (Desai & Riddlestone 2002).
Their philosophy was to reduce ecological footprint by two thirds, by which
they meant the consumption of raw materials and fossil fuels so that
resources are consumed sustainably and equitably on a global level. This
sustainable vision permeated the BedZED development and was pivotal to
the vision of a zero energy housing estate that would be capable of
producing as much energy as it used.
2.7 Human Factors
This section discusses how people use their homes and how they impact on
energy used. As discussed earlier, energy modelling is based on
assumptions including some or all of: the location and orientation of
buildings, heat loss, type and efficiency of heating and hot water systems,
type of fuel used and the number of occupants. Human behaviour is also a
factor in energy consumption and of interest to policy makers. Over time, as
regulations have changed to reduce the amount of energy consumed in
dwellings, it might be reasonable to assume that energy used at an individual
dwelling level would reduce. However, this assumes that user behaviour
remains unchanged when the dwelling or technology in the dwelling is
changed. There is some evidence that users respond to improved energy
efficient homes by consuming some of the energy saved by way of higher
comfort levels. This is known variously as “taking back”, “comfort-taking” or
the “rebound” effect.
44
Bell, Lowe and Roberts (1996) noted that there are many behavioural and
social barriers to energy efficiency as well as the more obvious practical
ones. They found that on the whole, people are unsure what to do, given
their individual circumstances and find it easier to adjust to price rises rather
than spend money on improving the performance of their property or heating
system. People are concerned with their levels of comfort and often do not
get the best out of heating systems because the systems themselves can be
difficult to understand. They queried whether if people then move into a
better performing property which can be heated to the same levels for less
money, will they maintain the same comfort levels and make a financial
saving or will they increase their comfort level and pay more? This
relationship between improved energy efficiency and human behaviour is a
question for this thesis.
2.7.1 Thermal Comfort
Many of the early standards for comfort are underpinned by the work of
Fanger who examined the physiological response to the environment and
undertook a series of experiments on a range of different subjects in steady
state thermally controlled chambers (Fanger 1986). These resulted in what
Fanger termed the “predicted mean vote” (PMV) which predicts the mean
thermal sensation of a group of people on a scale from cold (-3) to hot (+3)
together with the predicted percentage of people dissatisfied (PPD) with the
environment. The PMV/PPD model which applies to steady-state conditions
now forms the basis of the International Standard (BSI 2006).
Subsequently the applicability of these laboratory-derived relationships was
questioned by Humphreys et al (Humphreys, Nicol & Raja 2007) in the
context of people occupying buildings where they are living or working. They
asked building occupants to rate the environment at their place of work and
developed a theory of adaptive comfort where people would adapt their
comfort depending on external environmental conditions, for example, feeling
more comfortable indoors at higher temperatures when it is warmer outside.
Adaptive models have gradually been introduced into thermal standards as
the empirical evidence to support their use has strengthened.

45
Energy models need assumptions about what temperature occupants would
find comfortable. Fanger’s equation is based on the assumption that thermal
comfort is a function of environmental factors such as air temperature, mean
radiant temperature, air movement and air humidity and that these are
influenced by individual levels of activity and clothing (Fanger 1986). Fanger
found that comfort requirements for the winter ranged from 20-24°C,
assuming sedentary activity and that this would be acceptable to about 80%
of occupants.
Dear and Brager discussed thermal comfort in naturally ventilated buildings
(Dean and Brager 2002). They noted the limitations of heat balance models
with regards people’s adaptation to their environments through personal
control or perceptions of comfort. They concluded that it is not reasonable to
assume that there can be a “one size fits all” with regards thermal comfort.
They suggested that environments kept at a single temperature were
outdated and a more appropriate goal is to enable people to control their own
environment better.
More recently, Orosa and Oliveira (2011) discussed the fit of Fanger’s
Predicted Mean Vote approach to modelling thermal comfort for naturally
ventilated buildings. They found that people living in naturally ventilated
spaces appeared to adapt to a wider range of temperatures than people
living in air conditioned spaces.
Turning to industry standards for comfort modelling, the Chartered Institution
of Building Services Engineers’ (CIBSE) recommended comfort criteria for
dwellings are set out in Table 2.5.

46
Table 2.5: Recommended comfort criteria for dwellings
Winter operative temperature °C
Summer operative temperature °C
Air conditioned
Summer operative temperature °C
Non air conditioned
Benchmark summer peak and overheating criteria °C
Bathrooms 20-22 23-25
Bedrooms 17-19 23-25 23 26
Hall/stairs/landings 19-24 21-25
Kitchen 17-19 21-23
Living Rooms 22-23 23-25 25 28
WCs 19-21 21-23
Source: CIBSE 2006a
CIBSE noted that sleep may be impaired at temperatures above 24°C and
that while temperature is usually related to the likelihood of comfort or
discomfort, it may be related to other factors such as productivity or health.
If the benchmark temperature is exceeded the building has overheated and if
this occurs for more than a set amount of time, the building is said to suffer
from overheating. For dwellings, the overheating criterion is 1% of the
annual occupied hours over the benchmark.
Shove, Chappells, Lutzenhiser et al (2008) took a pragmatic view of comfort.
They cited the priority for policy makers to ensure that all households are
adequately and affordably heated to an acceptable level, generally taken to
be circa 21°C in the living room and circa 18°C for the rest of the dwelling.
However, they noted that in the 1996 English House Condition Survey,
people reported that they are satisfied with home temperatures within a much
wider range. This illustrates the difference between design aspirations and
people’s actual response to buildings. The CIBSE design criteria enable
buildings to be designed to allow most people to be comfortable; but in a
given situation people will tend to make the best of it. This BedZED case
study includes an analysis of the extent of control that participants had over
their environment and how it affected their satisfaction levels.
The emerging importance of summer comfort is highlighted by Chappells and
Shove in their 2005 paper where they considered the impact of higher

47
temperatures and potential demand for cooling within dwellings. They noted
that Government policy (DTI 2003) had been focused on ensuring that all UK
homes were adequately, affordably and efficiently heated with a particular
priority being to bring all fuel-poor households up to a decent standard and to
ensure that peak demand can be met in exceptionally cold weather. But
apart from recognising that air conditioning may become more widespread in
the future, there was little about how comfort expectations may change and
how the existing building stock will need to be adapted to respond to global
warming. Chappells and Shove stated that if the Government’s approach to
cooling paralleled the approach towards heating, then steps would have to be
taken to provide households with adequate and affordable cooling (Chappells
& Shove 2005).
In contrast, Strengers (2008) wrote about the Australian experience where air
conditioning in dwellings is already standard. She noted that although people
have reported being comfortable across a wide range of temperatures from
6°C to 30°C that comfort expectations are converging towards artificially
heated and cooled environments and occupants are less likely than
previously to use other strategies such as opening windows to cool their
environment. One interpretation of this could be that the more control that is
provided centrally in buildings for overall comfort conditions, the more
standardised occupants’ expectations of comfort become and the less
tolerant they are of conditions outside that comfort range.
The space heating required for a property to achieve a comfortable internal
temperature is dependent on external temperatures which vary seasonally
and from year to year. Heating degree days are used to standardise internal
temperature data to different external temperatures to enable comparison of
the performance of heating systems from year to year. Heating degree days
are a measure of how much (in degrees), and for how long (in days), the
outside air temperature was below a certain level. They are commonly used
in calculations relating to the energy consumption required to heat buildings.
The same method applies to cooling degree days. Mourshed (2012) defined
degree-days as the summation of temperature differences between ambient

48
outdoor temperature and the base/balance point temperature. He further
defined the base temperature as the outdoor air temperature at which
heating or cooling systems do not need to run to maintain comfort conditions.
At the set point temperature (the specified indoor air temperature), the heat
loss from the space is equal to the heat gain from the sun, occupants, lights
and equipment.
In summary, comfort needs to be defined in terms that can be input into
energy models when designing buildings. Air temperature is generally used
and, taking Fanger’s equation and assuming medium weight clothing and
sedentary activity, this will generally produce an internal temperature
requirement of circa 21°C.
2.7.2 Changes in behaviour following energy efficiency interventions
This section discusses changes in behaviour following energy efficiency
interventions. It discusses whether occupants maintain the same indoor
temperatures and consume less energy or whether they increase indoor
temperatures and consume the same energy. The assumption that better
efficiency will lead to reduced consumption was identified in the nineteenth
century by William Jevons who argued that in fact the efficient use of fuel
tended to result in an increase in consumption, subsequently called the
Jevons paradox:
“It is wholly a confusion of ideas to suppose that the economical use of
fuel is equivalent to a diminished consumption. The very contrary is the
truth”.
(Jevons 1865)
The Jevons paradox was picked up in Saunders’ 1992 work on the
Khazzoom-Brookes postulate which asserts that energy efficiency
improvements might increase rather than decrease energy consumption with
the potential for energy conservation policies worsening rather than
improving climate change (Saunders 1992).

49
The work by Schnieders on German low energy ‘passive’ houses (2003)
suggests that people living in these houses regard a mean internal
temperature of 22°C as comfortable. Schnieders found that for the circa 100
buildings in his study, the mean indoor temperature across the whole
measurement period was above 20˚C. Occupants typically set temperatures
between 21˚C and 22˚C and achieved a range from 17-25˚C in occupied
houses. He concluded that when the insulation standard of a building is
improved, a trend towards higher indoor temperatures can generally be
observed.
Sanders and Phillipson (2006) compared actual energy savings resulting
from cavity wall and loft insulation retro-fit projects across 13 different
studies. They noted that actual savings were commonly found to be less
than expected from the predictions of models such as BREDEM, on average
about 50% less. Of that 50% about 15% could be attributed to “comfort
taking” whereby occupants increased internal temperatures rather than using
less energy. The greater part of the shortfall was however owing to poor
engineering estimates of potential savings, inadequate performance of
equipment, deficiencies in installation and so on. They found that standard
engineering models may overestimate energy savings from energy efficiency
improvements in household heating systems by up to a half. They concluded
that behavioural change is just one explanation of temperature take-back but
not the only explanation of shortfall. They estimated that for household
heating and cooling in OECD countries, the direct rebound effect is likely to
be less than 30%.
Sorrell (2007) also found that many energy efficiency improvements do not
reduce energy consumption by the amount predicted by simple engineering
models. Improvements result in lower energy usage and bills with the result
that consumption increases. Instead of taking the financial saving from more
efficiently designed dwellings and heating systems, occupants increased the
internal temperature of their home and/or heat their home more
comprehensively for longer periods. Sorrell terms this the “rebound” effect
(variously termed “comfort taking” and “take-back” in other studies) and

50
where the effects are sufficiently large to lead to an overall increase in energy
consumption (the Khazzoom-Brookes postulate), Sorrell terms this “backfire”.
It has the potential to negate some policy benefits of improved energy
efficiency, such as carbon emissions targets. He notes that as the
consumption of a particular energy service increases, there will be a
saturation effect. For example, direct rebound effects from improvements in
the energy efficiency of household heating systems should decline rapidly
once whole-house indoor temperatures approach the maximum level for
thermal comfort which Sorrell found was around 21°C. However, this finding
should be treated with caution because it is not clear exactly how the internal
temperature is derived, for example whether 21°C is the demand
temperature set by the occupant using thermostats or actual measured
temperatures during, say, the heating season and standardised to external
temperatures.
In a study to quantify ‘take back’, Hamilton, Davies, Ridley et al (2011)
analysed data from a national evaluation of the Warm Front domestic energy
efficiency scheme which was a major domestic energy efficiency
refurbishment programme for existing housing to reduce fuel poverty. It
comprised retrofit of cavity wall insulation, loft insulation, draught stripping
and installation of energy efficient heating systems. Monitoring data were
collected for two–four week periods during the winters of 2001-02 and 2002-
03 (Oreszczyn, Hong, Ridley et al 2006, Hong, Oreszczyn & Ridley 2006).
The programme gathered detailed indoor environmental and energy
efficiency data from around 1,600 dwellings. They calculated that the take
back factor was circa 6%, that is, the energy saving from a retro-fit to an
existing property will be lower by circa 6% than planned as a result of the
occupants choosing to increase the temperature. A follow up to Warm
Front, the 2011 Energy Follow up Survey (EFUS), monitored 823 dwellings
over 13 months and found that mean internal temperatures standardised to
an external temperature of 5°C saturated at 18.4°C in living rooms and
18.7°C in bedrooms (Hamilton 2014). EFUS confirmed that dwellings that
receive energy efficiency improvements will increase temperatures and

51
reduce potential energy savings that might be predicted on the assumption
that there would be no change in internal temperature.
Love (2014) found that after retro-fitting insulation into 13 dwellings, mean
internal temperatures also increased. However, rather than take-back, Love
found that the reason for increased temperatures is not changing occupant
behaviour but the improved thermal efficiency of the building fabric. She also
found that the number of hours that properties were heated decreased. She
concluded that the better-insulated buildings cool down more slowly and
therefore need heating for less time. The ability of high mass construction to
heat up and cool down slowly was one of the key design principles of the
BedZED scheme.
Gauthier and Shipworth’s research finds another perspective on thermal
comfort (Gauthier & Shipworth 2014). They probed the difference between
occupant behaviour and perception in relation to internal temperatures and
found that occupants’ perceptions about temperatures can be markedly
different from actual body temperatures experienced. Their findings could
impact on post-intervention occupant surveys of the kind undertaken at
BedZED which sought to correlate participants’ views about comfort with
actual monitored data.
Another perspective was found in a study of 3,400 German homes. Sunnika-
Blank and Galvin (2012) found that occupants used on average 30% less
heating energy than the calculated rating before any interventions such as
retro-fit are delivered. They found that, the worse a home is thermally, the
more economically the occupants tended to behave when using their space
heating. They described this concept as the pre-bound effect and note that
it is important for policy-makers since retro-fits cannot save energy that is not
being consumed in the first place.
Another factor that may affect energy efficiency policies is picked up by Kelly.
In his paper investigating whether energy efficient homes in England
consume more energy, Kelly (2011) found that dwellings with a propensity to

52
consume more energy due to higher occupancy rates, higher household
incomes, larger floor areas, increased energy patterns and warmer internal
temperatures are more likely to have higher SAP ratings. He concluded that
occupiers of such homes would consume even larger amounts of energy if it
were not for the fact that these homes were already relatively more efficient
when compared to the rest of the building stock. He recommended that
policy makers should target occupant behaviour in such homes with
economic penalties and incentives and homes with low SAP rates should be
targeted for whole home efficiency upgrades.
However, such policies could only be substantiated by good measurement
data. The literature discussed above illustrates that energy efficiency policies
and energy modelling can be over-optimistic about the level of energy
savings that can be achieved. Punitive economic policies targeted at such
cases would need to be supported by evidence and carefully designed to
avoid unintended consequences. For example, in their paper about the
effect of energy efficiency improvements in low-income homes, Milne and
Boardman estimated that if energy retrofit works were carried out in an
average income UK household with a mean internal temperature of 16.5°C,
only 70% of the energy efficiency benefit would result in reduced fuel
demand with the remaining 30% used to increase internal temperatures and
that figure increases to 50% where the mean internal temperature is 14°C
(Milne & Boardman 2000). In this instance, taking some of the benefit of the
measure through increased temperatures seems reasonable in the light of
the low baseline but this approach is less reasonable in the higher SAP rated
homes described by Kelly above.
In conclusion, an intervention, whether moving into a more energy efficient
home or retrofitting an existing one, could produce a different outcome from
that modelled. This might be because occupants heat their homes to a
higher temperature (rebound) or they weren’t heating their homes as well as
expected prior to the intervention (pre-bound). Alternatively the new
technical system may mean that the house is maintained at a higher
temperature without any intervention from the occupant, a technical rebound
53
owing to whole house heating or an insulated home cooling down less
quickly. These findings have implications for the development of new low-
energy houses.
The above studies have mostly examined the impact of small changes in
efficiency as a result of retrofitting existing buildings or have not been
longitudinal in nature. There is now a body of data on monitored internal
temperatures in UK dwellings and evidence that occupants can feel
comfortable in the range of 18 - 21˚C. There is less evidence that people will
live in super-insulated homes without an occupant-controlled heating system
and what, if any, changes in behaviour occur when people move into them.
This forms the basis of this study.
2.7.3 Changing occupant expectations
Comfort expectations change over time. In their study to track variations in
indoor winter temperatures, Mavrogianni, Johnson, Ucci et al (2013) found
that an increase of up to 1.3°C per decade may have occurred in UK mean
dwelling indoor temperatures from 1978 to 1996. In an earlier paper, Healy
(2008) discussed the reasons for this increase which he describes as an
increase in occupant preference for “thermal monotony”. Causes include the
increased take-up of central heating and air conditioning resulting in a
standardised homogenous “comfort zone”, increased wealth in modern
societies, relatively lower fuel prices and better building and services
technology for energy efficient buildings.
In order to record changes in indoor domestic winter temperatures,
Mavrogianni et al (2013) undertook a comparison of indoor temperatures in
1978 and 2006 using the Building Research Establishment’s Housing Model
for Energy Studies (BREHOMES). They found that the mean internal
temperature increased by 5.7°C between 1970 and 2006 despite the fact that
these two years were characterised by similar external temperature
conditions with the difference in mean external temperature for the two years
being only 1°C. By 2006, 91% of UK homes had central heating compared
to 31% in 1970. They compared the results of their modelling with a number
54
of other studies that had been carried out using measurements on site, both
spot measurements and occupant recorded measurements. While there are
limitations with all these methods they found a clear upward trend for indoor
temperatures.
Meyer (2002) argued that once people are accustomed to a high level of
comfort, they are not willing to compromise. He argued that as a result,
human adaptability to future thermal conditions is bound to become narrower
in the future. Others predict that there is still potential for behavioural
change: Leaman and Bordass (1999) described the “forgiveness factor”
which is used to describe the higher levels of tolerance that occupants have
with low energy and passive heating, cooling and ventilation systems.
What does this mean for the BedZED case study? There is disagreement in
the literature about whether occupants will tolerate a wide comfort range
around the industry benchmarks but the literature is clear that over time,
dwellings are being heated to higher temperatures than previously and closer
to industry benchmarks.
2.8 Passive Design, Low Energy and Zero Energy houses
This section provides the context behind passive design and the history of
low energy and zero energy houses and their definitions. It sets the scene
for the discussion of low energy case studies in Chapter 3 and the BedZED
case study in Chapter 4.
Hachem and Athienitis (2013) set out the key principles of passive design.
These are good thermal mass, adequate shading and favourable building
shape and orientation. They define good thermal mass as good wall
insulation and window design, recommending for example in northern cold
climates, south facing windows covering 35-40% of the elevation to maximise
solar gain. They also recommend use of controlled reflective blinds on all
windows to reduce summer overheating. The overall orientation and form of
buildings is also important to passive design with southern orientated
buildings better able to benefit from solar energy generation and solar gains.
55
Rectangular buildings are also considered to be the optimal shape for
reducing energy since this shape offers the least surface area to volume and
therefore reduces heat loss.
Free heat gains are also an important element of passive design. Roby
(2013) defined free heat gains as the energy contributions to space heating
of a building from the normal activities that take place in it, including
occupants’ body heat and heat from cooking, washing, lighting, and electrical
appliances.
Although the terms “low energy” and “zero energy” buildings have been in
use for some time, there is not yet agreement over terminology. Marszal,
Heiselberg, Bourrell et al (2011) noted the lack of a commonly agreed
definition of a Zero Energy Building which results in a wide range of
terminology and a number of different methodologies being adopted. Sartori,
Napolitano and Voss (2012) asserted that there is a conceptual
understanding of a zero energy building (ZEB) as an energy efficient building
that will be able to generate electricity, or other energy carriers, from
renewable sources in order to compensate for its energy demand. They
stated that it is therefore implicit that this focuses on buildings that are
connected to an energy infrastructure (for example, a national grid) and not
autonomous buildings by which they mean buildings that generate energy for
their own consumption only. The Autonomous House was coined in the
1970s and comprised a dwelling that collected its own energy and water,
grew its own food and treated its own waste on site. (Vale and Vale 2010).
Many of the Autonomous House concepts were adopted in the original
BedZED development. Sartori et al (2012) argued that the term Net ZEB
can be used to refer to buildings that are connected to the energy
infrastructure, while the term ZEB is more general and may include
autonomous buildings. Their definition of a Net ZEB underlines the fact that
there is a balance between energy taken from and supplied back to the
energy grids over a period of time, nominally a year. The concepts adopted
by BedZED are discussed in Chapter 4.
56
The Government’s aspiration that all new houses had to be zero carbon by
2016 was originally set out in the Building a Greener Future policy document
(DCLG 2007). The policy required emissions from both regulated and
unregulated energy to be accounted for. Regulated energy comprises
building-related energy uses such as heating, cooling, hot water, ventilation,
auxiliary services and lighting. Unregulated energy comprises user-related
energy uses such as cooking and plug-in appliances. In the published policy
document, there was no requirement to include embodied energy in the
assessment of a zero carbon home, for example, energy used for the
extraction, manufacture, transport and construction of buildings and
materials.
In the recast of the Energy Performance of Buildings Directive in 2010 (EC
2010), the European Union stated that by the end of 2020 all new buildings
should be “nearly zero-energy” with the very low amount of energy required
covered to a very significant extent by energy from renewable sources
including energy produced on site. In the same year, a revised edition of the
Building Regulations Part L Approved Document, Conservation of Fuel and
Power was issued (HMG 2010a), now superseded by the 2013 edition (HMG
2014). The Building Regulations sets a Target Emissions Rate for carbon
emissions, expressed in terms of CO2 emissions, in kg/m2/year emitted as
the “result of the provision of the specified fixed building services for a
standardised household when assessed using approved calculation tools”.
The tools require designers to adjust the calculation to take account of
heating fuel type (fuel factor). However, the factor for “any fuel with a CO2
emission factor less than that of mains gas” is given the same factor as
mains gas which does not capture the environmental benefits of using
renewable energy over mains gas. The footnote to the fuel factor table says
that the fuel factors will be kept under review as progress is made towards
the zero carbon target.
Heffernan, Xi Liang and De Wilde (2013), also supporters of the use of “Net”
to indicate a connection to the grid, took Zero Carbon Hub’s UK Zero Carbon
House (ZCH) standard as a model. This standard requires dwellings to have

57
a fabric energy efficiency of no greater than 39 kWh/m2/annum for
apartments and mid terrace houses or 46 kWh/m2/annum for end-of-terrace,
semi-detached and detached houses (Zero Carbon Hub 2011). However,
compared to the ‘Passivhaus’ standard where the maximum specific heat
demand is 15 kWh/m2/annum, a ZCH will potentially be permitted to use
200% more energy for heating than a Passivhaus.
2.9 Passivhaus
The Passivhaus standard was developed by Dr Wolfgang Feist in the 1990s
and there are now estimated to be over 30,000 buildings built to the
Passivhaus standard (Mead & Brylewski 2015). Based on passive design
principles the standard aims to reduce heat energy use and provide
comfortable indoor conditions. The standard requires high levels of
insulation, very high levels of airtightness and the use of whole house
mechanical ventilation. The standard is summarised in Table 2.6.
Table 2.6: Passivhaus standard
Specific Heating Demand
(or) specific heating load
≤15kWh/m2/annum
≤ 10W/m2
Specific Cooling Demand ≤15kWh/m2/annum
Specific Primary Energy Demand
(all domestic energy use including appliances)
≤ 120kWh/m2/annum
Airtightness ≤0.6ach @50pascals (n50)
Thermal Comfort ≥16°C
Source: Mead & Brylewski 2015
The most important element of Passivhaus design is continuous envelope
insulation with no thermal bridges. In addition to reducing heat loss, this
maintains good internal comfort conditions both in winter and summer,
providing there is good shading and ventilation in summer. While the
Passivhaus standard is an energy performance standard that provides very
good energy efficiency standards, it does not cover broader environmental
themes such as sustainably sourced materials, biodiversity and so on.

58
Passivhaus design aims to minimise the requirement for space heating and
cooling and to provide good air quality and thermal comfort. The specification
consists of very airtight building envelopes with no more than 0.6 air changes
per hour at a pressure differential of 50 pascals, a mechanical ventilation
system with heat recovery to provide fresh air and compensate for the low
levels of air leakage and the space heating demand (and cooling, if required)
is reduced to 15kWh/m2 or less. The Passivhaus design featured in the
BRE’s 1996 review of ultra-low energy houses was calculated to use energy
at a rate of 31 kWh/m2/annum, excluding solar contribution and the actual
performance of the case study reviewed was 32 kWh/m2/annum of which 10
kWh/m2/annum was for the space heating (Oliver & Willoughby 1996) which
puts these properties under the maximum 15 kWh/m2/annum for heat.
Ridley, Clarke, Bere et al 2013) reported on monitored performance of the
first new London dwelling certified to the Passivhaus standard, the Camden
Passive House. The annual space heating demand achieved the 15 kWh/m2
Passivhaus target and the overall annual primary energy demand of 125
kWh/m2 was marginally above the 120 kWh/m2 target. A recent case study
of two Passivhaus dwellings in Wales reported that the properties achieved
9.3 and 25.6 kWh/m2/annum for space heating compared to the design target
of 10 kWh/m2/annum and the Passivhaus standard of 15 kWh/m2/annum for
heat. The biggest contributor of CO2 emissions was electrical appliance use
(Ridley, Bere, Clarke et al 2014).
Taking all energy into account in his German Passivhaus study, Cutland
stated that the total primary energy demand of a Passivhaus including space
heating, cooling, domestic hot water, lighting, fans, pumps, white goods and
all appliances should be no more than 120 kWh/m2/annum (Cutland 2012)
which is a higher load than the case study reviewed by the BRE in the early
1990s. The 120 kWh/m2/annum was also the target adopted by the German-
led CEPHEUS project which measured the performance of over 100
Passivhaus homes (Schnieders 2003). Schnieders’ conclusions were that
these houses succeeded in very low space heat consumption during the
heating season and comfortable summer conditions with indoor temperatures

59
rarely rising above 25°C. There was also a high degree of user satisfaction
with the dwellings.
In their 2012 study, Mlecnik, Schütze, Jansen et al analysed a number of
post-occupancy evaluations of nearly zero-energy houses in Austria,
Germany, Switzerland and the Netherlands. They concluded that comfort
and health conditions (particularly criteria such as indoor temperature,
humidity and noise level) and their operability (for example of mechanical
ventilation systems) are important factors influencing occupants’ perceptions
of energy-efficient houses. They reported that a number of studies have
found that occupants perceive that their living conditions improved after
moving into Passivhauses, particularly with regard to winter thermal comfort
and indoor air quality. However, occupants often feel more comfortable
during the winter than during the summer. Mlecnik et al quoted one study
where 40% of occupants installed additional solar shading suggesting issues
with the original design for that development. Another study highlighted the
importance of reducing internal heat gains from appliances and lighting in
order to avoid overheating in summer. But three other studies reported high
levels of satisfaction with summer comfort conditions. In conclusion, there
would not appear to be inherent issues achieving winter and summer comfort
conditions with low energy housing designs but the literature does highlight
some adverse results. The authors concluded that this could be related to
design or technical defects and they also emphasised the importance of
providing good information to occupants about how to use the dwellings
effectively.
Prior to 1985, very few dwellings in the UK had been built to a super-
insulated standard. In 1985, the Commission of European Communities
funded a scheme of 12 timber-framed dwellings to be built in Milton Keynes,
four of which would be super-insulated which comprised heavily-insulated
fabric, airtightness and controlled ventilation. These were among the first
super-insulated properties in the UK (Ruyssevelt 1987). By the time the
BRE published their 1996 report on ultra-low energy homes (almost 20 years
ago), there were 40 different examples in the UK and 12 overseas at that

60
time. However in terms of the impact of low energy housing design on the
overall housing stock, Vale & Vale estimated in their 2010 paper that there
were around 12,000 Passivhaus standard houses in Europe comprising an
estimated 0.006% of all European housing stock. So although low in total
numbers built, the industry does have experience of building a variety of low
and zero housing designs.
Although the move towards low carbon/zero energy development as a way to
reduce emissions is still in its infancy, the introduction of Feed In Tariffs in
2010 made the installation of domestic renewable installations more
attractive to householders but the circa 400,000 installations installed by
June 2012 have an installed capacity of only 1,333 MW (Palmer & Cooper
2013).
Another relevant factor in the light of the Government’s commitment to
reducing emissions and moving towards zero-energy housing (and the
separate issue of increasing housing demand) is housing density. Hamilton,
Summerfield, Steadman et al (2010) proposed a method for working out
relationships between new building and increasing densification of existing
low energy developments with additional building. In so doing, they highlight
the factor of site density. If on-site renewable energy is provided then there
is an economic and environmental argument to use the infrastructure
optimally. Conversely, the higher the density of development, the less
potential there is for on-site energy generation. The challenge of balancing
site density with on-site energy generation is relevant to the BedZED case
study which was designed for suburban densities and was constructed with
an on-site biomass Combined Heat and Power (CHP) plant.
As policy makers clarify their requirements and put in place regulations to
achieve the policy aims of the recast European Directive, designers have
continued to interpret the emerging requirements for practical application
within the industry. Wang, Gwilliam and Jones (2009) put forward this
definition of a zero energy building:

61
“A zero energy building refers to a building with a net energy
consumption of zero over a typical year. It implies that the energy
demand for heat and electrical power is reduced, and this reduced
demand is met on an annual basis from renewable energy supply. The
renewable energy supply can either be integrated into the building
design or it can be specifically provided for the building, for example as
part of a community renewable energy supply system. It also normally
implies that the grid is used to supply electrical power when there is no
renewable power available, and the building will export power back to
the grid when it has excess power generation. This ‘two way’ flow should
result in a net positive or zero export of power from the building to the
grid.”
Wang and Gwilliam’s definition of a zero energy building assumes that the
national grid takes surplus energy generated from buildings and delivers it to
buildings at times when their on-site renewables cannot meet local demand.
This approach depends on the diversity of demand and supply and the
inherent energy storage in the system. Wang and Gwilliam’s definition
resembles very closely the approach adopted in the design philosophy for
BedZED.
2.10 Performance Gap
The Zero Carbon Hub (2014) analysed 94 studies of new housing and found
“clear evidence of a gap between the designed and as-built energy
performance of new homes.” There is potential for the performance gap to
emerge at all stages of the asset life span from concept design through to
construction, testing and modelling.
Burman, Momovic and Kimpian (2014) found overwhelming evidence for the
theory of a Performance Gap. Although their principal field of study is
schools and office buildings, they quoted a number of housing case studies
with performance gaps ranging from 20% to 68%. They attributed the
discrepancy between actual and theoretical performance to four sources:
inaccurate inputs into models; inadequate modelling methods; construction
and commissioning processes; and inefficient building management. These
reasons for the discrepancy have shaped the research questions for this

62
thesis. Ridley, Clarke, Bere et al (2013) also noted that occupant behaviour
is an important factor in the performance of low energy buildings.
2.11 BedZED in the literature
The BedZED case study is discussed in Chapter 4 using original source
documents from the project. The impact of BedZED, the UK’s first large
scale zero housing development, is clear from the literature: the Energy
Saving Trust published an Energy Efficiency Best Practice report in 2002
towards the end of the construction phase (Energy Saving Trust 2002).
Around the same period, Nicole Lazarus of BioRegional published two
toolkits that described the green materials sourcing strategy for the
development (Lazarus 2002) and how to produce affordable carbon neutral
developments (Lazarus 2003). Simon Corbey’s MSc thesis published in
2005 provided a holistic analysis of the BedZED development (Corbey 2005)
and the architect, Bill Dunster, produced “The ZEDbook” in 2008 which was a
mixture of analysis of the BedZED scheme and a toolkit for designers
(Dunster, Simmons & Gilbert 2008). The continuing interest in BedZED is
seen from, for example, the publication of “BedZED Seven Years on” by
Hodge and Haltrecht (Hodge & Haltrect 2009), a review of BedZED by Tom
Chance (Chance 2009) and a paper on ecovillages “A review of progress in
BedZED and Masdar City (Zhu, Kung & Zhou 2015).
2.12 Conclusions
This chapter provides background for the research topic through a literature
review. It analyses the scientific basis for the field of investigation and the
growing body of domestic and international political commitments to
addressing how energy is used in buildings. It describes demand
considerations including increased demand for energy from a larger
population of smaller households. The chapter discusses Government policy
and regulations applicable to the construction industry to use energy more
efficiently, modelling systems prescribed and measurement systems
available. The chapter examines human factors in particular thermal comfort
63
and the extent to which this is predictable in the delivery of solutions for using
energy more efficiently in buildings. There is much research about the
impact of human factors and design factors on the actual performance of
improved energy efficiency but not, as yet, consistent agreement. Finally the
chapter discusses the concept of zero energy buildings and finds differences
in exact details and definitions. And while the number of low and zero
energy houses is relatively low as a proportion of the total housing stock,
there are now a number of built examples for industry to draw upon. This
helps support the implementation of Government policies
There is little doubt that major improvements in the energy efficiency of
dwellings in developed countries will be required if there is any chance of
achieving carbon targets as well as increased use of renewables.
Governments around the world are therefore introducing regulations to
motivate the design and refurbishment of buildings to zero or near zero
carbon. However there is also increased evidence of a performance gap
between modelled and measured performance, some of which is attributed to
change in internal temperature in dwellings in efficient buildings. There is
little evidence in the UK as to how such highly efficient zero carbon buildings
will perform or be rated by their occupants. This study aims to provide that
evidence.
64
Chapter 3 Comparative Low Energy Case Studies
3.1 Introduction
This chapter discusses low energy and energy efficient housing case studies
that provide the source of measurement and evaluation methods used in the
BedZED study. The results from some of these case studies are also
compared with the results from the BedZED case study in future chapters.
Previous Case Studies
There are precedents for undertaking case studies which focus on a single
housing development. Typically such Post-Occupancy Evaluations are
completed after the construction of a new housing design or after an
intervention to existing housing, such as refurbishment, insulation and
heating systems improvements. Such case studies tend to include
monitoring after construction is completed to determine its effectiveness, for
example, the Linford, Pennyland and Milton Keynes studies (Everett, Horton
& Doggart 1985, Lowe, Chapman & Everett 1985 and Edwards 1990).
These are relevant to this BedZED case study for three reasons. Firstly,
they trialled some of the methods that have been applied to this BedZED
case study. Secondly, the findings from these studies contributed to the
broader knowledge base about how to design housing that is energy efficient
and easy to build. Thirdly, they evaluated the success of the technologies at
a property level. With so little housing stock renewed annually – only 13.4%
of the housing stock in England was built since 1990 (DCLG 2013), it would
be difficult to measure the effectiveness of new energy efficiency construction
techniques solely from data collected by, say, the English House Survey
given the slow rate of replacement and the time-lag between construction,
occupation and surveys.
The Home Energy Efficiency Database (HEED) is compiling a record of
energy efficiency improvements to the UK housing stock and this provides an
anonymised source of information about property characteristics such as
heating systems, insulation and micro-generation technologies (Energy

65
Saving Trust 2013a, 2013b). This is supported by the National Energy
Efficiency Data-Framework (NEED) which enables detailed statistical
analysis of energy efficiency (DECC 2013a). Over time this will provide a
national dataset of energy performance for housing.
The methods used in this BedZED case study research draw heavily upon
the Pennyland and Linford studies both published in 1985 and the Milton
Keynes Energy Park which was reported in 1990 and follow-up studies
published in 2007 and 2010.
3.2 Pennyland
The Pennyland study (Lowe et al 1985) involved the design, layout,
construction and monitoring of an estate of 177 low energy houses in Milton
Keynes with the aim of producing a cost effective mass-market low energy
housing design for the UK. Half the estate was built to the 1982 UK Building
Regulations standard with 50mm cavity wall insulation, 80mm roof void
insulation, single glazed windows and no floor insulation. The other half was
built to Danish standards and comprised 100mm cavity wall insulation,
140mm roof insulation, double glazed windows and ground floor edge
insulation. The majority of houses were equipped with a conventional gas
fired boiler and partial radiator heating system, with radiators installed in the
downstairs rooms and the bathroom only. At this time, comprehensive
whole-house heating systems were not universal in the UK. Following the oil
crisis in 1973, the Building Regulations had been changed in 1976 to
increase inter alia the energy efficiency performance of new dwellings with U-
values of 1.0 W/m2K for exposed walls, floors and non-solid ground and
exposed floors, 1.7 W/m2K for semi-exposed walls, average 1.8 W/m2K for
walls and windows combined and 0.6 W/m2K for roofs (DoE 1976).
However, as now, while the regulations set maximum heat loss standards,
houses did not have a minimum comfort requirement which is determined by
occupant expectations and the market response to them.

66
Pennyland used a number of methods for thermal performance monitoring.
Construction was inspected for build-ability by a team of researchers from the
BRE. The purpose of this was to ensure that any good practice noted in the
study could be easily replicated by the wider building industry. External
thermographic surveys were carried out and air tightness tests undertaken on
a sample of houses. A social survey was carried out by Milton Keynes
Development Corporation.
The principal performance monitoring involved the measurement of energy
consumption and internal temperatures over two heating seasons. Energy
performance was monitored by reading gas and electricity meters on a
monthly basis. A special house temperature meter was developed for the
project which recorded the temperature in three rooms of the house and
which measured the cumulative difference between each of these and an
external temperature sensor, which was considered to be an attempt to
record real degree-days for each house. Weather data were recorded at
the nearby Linford site, including air temperature, solar radiation, wind speed
and wind direction on an hourly basis. The study found a wide variation in
gas consumption and reported large effects of different occupant behaviour.
Pennyland used a computer model to assess the energy effects of various
passive solar measures incorporated into the design. These were avoidance
of over-shading of one house by another, correct orientation, concentrating
the glazing on the south side of the house and varying the total area of
glazing. It found clear energy benefits from these measures, but little benefit
from increasing the glazing beyond 40% of the south-facing wall area. They
also showed that a southerly orientation for a house both maximised the
passive solar gains and minimised the peak summer temperatures. Surveys
of midsummer internal temperatures carried out on hot July days were
satisfactory. The authors concluded that additional thermal mass in the
Pennyland design was not necessary to minimise overheating with the
normal medium-weight construction used in the control group being
adequate. They concluded that the additional thermal mass of the passive
solar design was not cost effective. However, the study also noted the trend

67
towards whole house heating and since that time the demand for higher
internal temperatures has increased, as discussed in Chapter 2 of this thesis.
A conclusion of Pennyland was that specifying low U-values for building
elements does not fix the total amount of energy consumed but other factors
such as air-tightness and heating efficiency are also very important.
Relationships between different design elements are now better understood
and the combination of a number of different design principles and
technologies is a feature of the BedZED development.
3.3 Linford
Linford was a field trial involving the design, construction and monitoring of
eight low energy houses in Milton Keynes at a time when there was little
knowledge in the UK about the detailed performance of well insulated
passive solar houses (Everett et al 1985). The study aimed to assess the
interactive effects of high levels of insulation, passive solar and incidental
heat gains and the performance of the heating system. Houses were
monitored over two years including the 1981-82 and 1982-83 heating
seasons, during which time seven houses were occupied and one was
unoccupied. Monitoring comprised recording temperatures, gas and
electricity consumption, heat flows and solar radiation in order to establish
the thermal performance of the houses. Additionally a thermographic survey
and a build-ability study were carried out. The thermographic survey gave
an insight into the quality of the installed insulation and highlighted the
position of cold bridges. The build-ability study was carried out by the
Building Research Establishment (BRE) who concluded that generally the
insulation was easy to incorporate into the construction. Some problems
were identified with the design. For example, there was potential for cold
bridges over window lintels if glass fibre wall batts were not installed with
care. The study noted that placing large areas of glazing on the south side
of the houses could potentially produce overheating during the summer.
However, measurements during a heatwave in July 1983 found this not to be
a great problem with the houses’ thermal mass and ventilation keeping peak

68
internal temperatures below external temperatures. These findings support
the later design philosophy for BedZED which relied on extensive south-
facing glazing for solar gain. However, BedZED also incorporated heavy
mass construction which was not the case for Linford.
To put Pennyland and Linford in context, Table 3.1 shows the insulation
standards adopted by these two studies (based on Danish Building
Regulations standards) and compared to the UK Building Regulations in
operation at the time.
Table 3.1: Insulation standards required by UK Building Regulations compared to Pennyland & Linford
UK 1982 Building Regulations
Pennyland Linford
Walls 50mm fibreglass 100mm fibreglass 100m fibreglass
Roof 80mm fibreglass 140mm fibreglass 140mm fibreglass
Windows Single glazed Double glazed Double glazed
Floor None 25mm polystyrene edge insulation
25mm polystyrene edge insulation
Both Pennyland and Linford found a variance in the amount of energy used
by the different low energy houses. Pennyland concluded that this was a
result of changed occupant behaviour. Linford did not interrogate the
reasons for the different consumption levels but noted that occupants were
delighted by the significant reduction in their fuel bills compared with their
previous houses. It would have been useful to set a baseline before carrying
out the study so that the variance could be better understood. Accordingly,
this thesis included a longitudinal study.
3.4 Milton Keynes Energy Park
Another relevant case study is the Milton Keynes Energy Park. This
consisted of 160 new houses that incorporated higher standards of energy
performance than required by the Building Regulations in operation at the
time. Floor insulation, increased wall insulation, double glazing and
condensing boilers that corresponded to the building standards that would

69
apply a decade later in the 1995 edition of the Building Regulations were
installed (Edwards 1990, DoE 1995). Edwards’ review of the development
referred to the higher incidence of conservatories which she stated was
“crucial ...to the design, construction and use… if a positive energy benefit is
to be achieved from the passive solar gain”. Later, BedZED included
sunspaces for the same reason.
In the Milton Keynes Energy Park study, gas and electricity consumption was
monitored hourly over a period of 18 months, from January 1989 to April
1991. In a sub-sample of 29 dwellings, hourly internal temperatures and
relative humidity were also measured. A detailed social survey was
undertaken which asked households how they used their homes and also
recorded physical changes to dwellings during the monitoring period. The
results after one year’s monitoring showed that average energy use was 33%
less than the UK national average. However, it is not clear from Edwards’
paper whether the Milton Keynes results were compared to all UK houses or
to new UK houses built to the standards of the day.
A follow-up study of the Milton Keynes Energy Park was undertaken in 2005-
07 (Summerfield, Lowe, Bruhns et al 2007). This study aimed to measure
whether internal temperatures and energy use had remained the same or
changed over time. This longitudinal study found no significant change
overall over the 15 year period in average internal temperatures. However,
there was evidence that daily gas consumption had increased by 10% and
that electricity usage had increased by more than 30%. Although the
authors were careful to caveat their findings owing to the small sample of 15
dwellings selected, there is no evidence of occupants increasing the overall
comfort level of their homes over time but some evidence of increased
energy consumption for hot water, appliances and lighting.
And while there is no evidence of “take-back” over the 15 year period, the
authors made the point that “take back” is more likely to occur when
improvements are made.

70
In 2010, Summerfield, Pathan, Lowe et al (2010b) reviewed both the original
1990 Milton Keynes Energy Park project and the 2005 follow-up study. They
found that the energy efficiency improvements from fabric insulation
delivered over the medium-term. They also found that occupants do not
appear to upgrade their properties further when new energy efficient
technologies become available but rather they wait until a component fails.
The authors concluded that energy-efficiency measures should be carried out
to maximum effect, rather than in half measures, since once they have been
implemented and provide comfort with lower energy costs, little evidence is
found of the occupants undertaking further improvements such as increased
loft insulation or renewed draught stripping, unless forced to by component
failure. Their conclusion supports the comprehensive super-insulation
philosophy adopted for the BedZED development. The three phases of
monitoring at the Milton Keynes Energy Park also highlight the value of
longitudinal monitoring to track longer term effects of energy efficiency
initiatives and occupant behaviour over time.
3.5 Brixton Super-Insulated Houses
The Brixton super-insulated dwellings case study consisted of nine super-
insulated properties constructed in 1991 and monitored for an 18-month
period (Ridley 1995, Summerfield, Lowe, Firth et al 2006). The case study
was part of a larger development of circa 100 dwellings for a social housing
landlord. The basic housing design was modified for nine properties to
achieve a super-insulated standard, see Table 3.2.
Table 3.2: Brixton Super-insulated Design Standard
U-value
Walls
W/m2/K
Roof
W/m2/K
Floor
W/m2/K
Windows
W/m2/K
Air changes/
hour
0.19 0.12 0.28 1.2 0.2-1
Source: Ridley 1995, Table 4.1.2
A further five properties were also included in the study as a control. The
predicted SAP ratings for the control properties and the super-insulated
71
properties were 76 and 95 respectively. Energy usage and internal
temperature monitoring in living rooms, kitchens and hallways, but not
bedrooms, was undertaken in the completed dwellings for an 18-month
period (Ridley 1995, Summerfield, Lowe, Firth et al 2006).
The study found that energy used for space heating the super-insulated
houses was significantly less, circa 52%, than for the control houses and the
super-insulated houses also achieved a 0.7°C higher mean temperature than
the control houses. The main issue found with the super-insulated houses
was air-tightness; the properties did not achieve the design air-tightness and
the mechanical ventilation and heat recovery system proved expensive to
operate.
3.6 Retrofit Studies : York Energy Demonstration Project and the Warm Front Programme
The York Energy Demonstration Project was a series of retrofit projects to
York Council’s social housing stock that comprised various energy efficient
improvements for circa 230 dwellings. The study found that energy
consumption was reduced by between 20-47% depending on the package of
measures applied. The paper provided a high level analysis of the
economics of the project, taking into account long term benefits and shorter
term capital affordability constraints (Bell & Lowe, 2000). Although this
project did not include formal occupant satisfaction analysis, the authors
conducted a single open ended interview with one occupant which
highlighted some perverse behaviour and which illustrates the value of
including more comprehensive occupant surveys in such projects.
The Warm Front programme comprised 1,372 existing dwellings variously
retro-fitted with cavity wall and loft insulation, draught stripping and new
heating systems. Properties were monitored for a 2-4 week period during the
two winters of 2001-02 and 2002-03. The programme was evaluated by
recording the energy efficiency performance of the houses in the programme
before and after the interventions (Oreszczyn, Hong, Ridley et al 2006, Hong,

72
Oreszczyn & Ridley 2006). The study found that insulation reduced space
heating energy consumption by 10% in centrally heated properties and 17%
in non-centrally heated properties but the installation of new central heating
systems did not have a significant impact in reducing fuel consumption even
after adjusting for the increased internal temperature (Hong, Oreszczyn &
Ridley 2006). The Energy Follow Up Survey (EFUS) in 2011-12 of 823
dwellings found, inter alia, that there are real differences in internal
temperatures between households, in that older households tend to have
higher temperatures than younger or non-retired households (Hamilton
2014). This is another interesting finding in the context of the demographic
changes discussed in Chapter 2.
As a retrofit programme for existing housing, the use of pre- and post-
intervention monitoring for the Warm Front enabled the authors to assess the
success of the programme. The Warm Front’s pre- and post-intervention
approach was adapted for this BedZED case study with the aim of assessing
the significance of participants’ behaviour on the performance of the BedZED
houses.
3.7 Carbon Reduction in Buildings (CaRB)
Summerfield, Lowe, Firth et al (2006) and Summerfield, Pathan, Lowe et al
(2010b) discussed the case studies included in the Carbon Reduction in
Buildings (CaRB) Building Data Repository project. The CaRB project
compiled field study data for the existing building stock in the UK and
assessed how energy use changed over time (Lomas 2010). The project
compiled results from different energy monitoring studies in a consistent way
so that studies could more easily be compared and energy demand data
tracked over time. The project collected both building energy usage and also
social data and carried out longitudinal studies using existing data from
earlier studies where available, such as the Milton Keynes study discussed
above (Summerfield, Pathan, Lowe et al 2010b). The methods developed
for CaRB for data formatting have been applied to this BedZED case study,
enabling direct comparison with other studies.

73
The BedZED data from this study were uploaded into the CaRB repository by
Dr Alex Summerfield of UCL Energy Institute. The CaRB repository provides
a consistent format for comparing the results from this BedZED case study to
other case studies. The data available from the CaRB database include the
Milton Keynes Energy Park study, the Brixton super-insulated study and the
Warm Front study.
3.8 Comparative Case Studies Conclusions
This chapter shows that case studies are a source of detailed information
about how energy-efficient housing performs in use. Actual performance
information is collected through field studies and compared to pre-
construction design and modelling. There is now a body of case studies in
this field and tried and tested methods to call upon. The development of
standard protocols by the CaRB study for compiling data from such studies
enables easier comparison between studies to be made.

74
Chapter 4 BedZED Case Study
4.1 Introduction
The case study used in this thesis is the Beddington Zero Energy
Development (BedZED), located in Hackbridge in the London Borough of
Sutton. This chapter discusses the key parties involved in the development
with reference to original source documents produced prior to construction by
the design and development team. The original aims and objectives of the
BedZED development are summarised and the design theory relating to the
building physics and passive design principles, including the designed SAP
and air tightness, the building fabric and services design are discussed,
together with how these would contribute to the stated aim of the
development to be zero energy.
The dwellings occupied by BedZED residents prior to moving into the
BedZED development are described in preparation for the longitudinal study
in Chapter 12. This section includes a summary of National Home Energy
Rating (NHER) surveys undertaken on pre-BedZED properties.
4.2 BedZED Development Team
The BedZED concept design was developed in 1999 in a partnership
between Bioregional Development Group and Bill Dunster Architects (BDA),
with building physics and associated mechanical and electrical design input
from Arup. BDA specialised in sustainable development in particular low
energy and renewable energy technologies. The practice worked from Hope
House, a prototype live/work property that tested many design aspects later
incorporated into BedZED. Bioregional Development Group was an
environmental organisation with the aim of bringing local sustainability into
mainstream business and industry. Their role in BedZED was to integrate
the building design with transport, materials selection, recycling and
renewable energy (Peabody Trust 2000).

75
Peabody Trust (now Peabody) agreed to fund, procure, build and market the
development in 2000. Peabody is registered charity and housing association
with a mission to “help the poor of London”. It had an active development
programme to build new housing in London, the majority for rent to housing
association tenants at affordable rents, with the remainder sold or rented at
market rents to help cross-subsidise the cost of properties built for rent to
housing association tenants. Peabody also had an active research
programme and, at the time that BedZED was initiated, was trialling a range
of innovative construction and development techniques (Peabody Trust
2000). BedZED offered Peabody Trust the opportunity to build the first large
zero energy development in the UK, using a variety of concepts and
technologies that had individually been applied elsewhere but which had not
been combined in a single development. At the time of construction and
initial operation, the thesis author worked for Peabody. Her role comprised,
inter alia, setting technical standards for properties and evaluating their
quality and performance.
4.3 BedZED Timelines
The concept design was completed in 1999. Peabody decided to fund the
development in 2000 and construction started on site in the same year.
Construction completed in phases in 2002 and the first occupants moved in
in 2002. For this study, Phase 1 took place between February and October
2002 and comprised a study of the participants in their former homes.
Phase 2 took place between August 2002 and December 2004 and
comprised a study of participants in their BedZED homes. Phase 3 took
place between January 2008 and July 2014 and comprised a study of all
BedZED properties.
4.4 BedZED Location
Figure 4.1 shows the location of BedZED.

76
© Peabody
Figure 4.1: Location of BedZED

77
4.5 BedZED Scheme
When construction was completed, BedZED comprised 82 dwellings with a
mix of one and two-bedroomed flats and three and four-bedroomed
maisonettes and townhouses. There were also 19 live-work units some of
which were later converted to dwellings. There was a mix of tenures
comprising privately owned, shared ownership and social rented properties.
Some 2,500m2 of space was allocated for 19 work-live units plus studios,
shops and community facilities. The breakdown of property types, size and
number of occupants prepared by Corbey (2005) is in Appendix 1.
4.6 BedZED Design Aims
At the time of construction, the aim of the development was unique in the UK
in that the design aimed to be carbon neutral from cradle to grave. BedZED
would make significant use of passive design principles, there would not be a
typical central heating system and the scheme also planned to provide all its
energy requirements from renewable resources.
BedZED aimed to be a carbon neutral development with no net addition of
CO2 to the atmosphere. BedZED buildings were designed to achieve a 60%
reduction in energy demand including a 90% reduction in heat demand
compared to typical new dwellings built to the 1995 Building Regulations in
operation at the time of design and electricity consumption would be reduced
by 10% compared to typical domestic houses. The predicted total energy
consumption for BedZED was 75 kWh/m2/annum compared to the standard
required by the 1995 Building Regulations of circa 163 kWh/m2/annum (Arup
1999a).
4.7 Land Use
The site was a former sewage works and as a brownfield site enabled the
recycling of redundant suburban land for housing, an important theme of the
recently published Urban Task Force report (Rogers 1999) which promoted

78
recycling of brownfield land to meet housing development targets together
with good integration with public transport. The development achieved an
overall density of 50 dwellings per hectare compared to an average of 25
dwellings per hectare for new housing at that time (TCPA 2003), 120
workspaces per hectare and over 4,000m2 of green open space per hectare.
This was an important part of the design philosophy because at these
densities, around three million new homes could be provided on the existing
stock of 28,800 hectares of derelict brownfield land while staying within a
three-storey limit required by many planning authorities (Energy Saving Trust
2002).
4.8 Passive Design Principles
The site was laid out to maximise the benefits of passive design. Housing
units were designed into blocks orientated west to east, so that one elevation
would be facing due south to make use of solar gain and to minimise heating
requirements, shown in Figure 4.2.
© Bioregional
Figure 4.2: Typical block at BedZED from south east corner

79
The project architect, Bill Dunster, described the BedZED prototype:
“The idea was to show how it was possible to combine workspace with
housing while matching the residential densities of the surrounding
dormitory suburb, and actually increasing overall standards of amenity –
particularly gardens and public open space. This was achieved by
matching south facing rows of single aspect residential terraces with
north-facing live/work units or workspace. By placing gardens on the
workspace roof, it was possible to give almost every home a garden or
terrace, while achieving high levels of cool northlight within the office
space.”
Dunster, Simmons & Gilbert (2008)
Figures 4.3 and 4.4 show the typical design and layout of a BedZED property
and the location of sunspaces and gardens provided for all properties.
© zedfactory.com
Figure 4.3: Section through typical block, ground and first floor maisonette

80
The section in Figure 4.3 runs north to south (left to right) with the south-
facing sunspace for each property on the right hand side. The roof garden is
allocated to the top storey flat and ground floor properties have a ground floor
garden. Blocks have a three-storey glazed southern aspect with a fully
glazed enclosed sunspace. The north facing aspect is two storeys with
workspaces located on this side, retaining the southern aspect for dwelling
space. Each dwelling above the ground floor has its own roof top garden on
the north face. Houses have minimum glazing on the north face to prevent
heat loss.
Ground floor plan First floor plan
© zedfactory.com
Figure 4.4: Typical Ground Floor and First Floor plans

81
The floor plans in Figure 4.4 show that the outer wall of the building forms the
inner wall of the sunspace with the sunspace located at the bottom of the
plan and coloured orange. The sunspace design was predicated on windows
being closed in winter and the inner doors between the dwelling and the
sunspace opened to allow sunlight to penetrate into the house. The design
assumed that in summer windows would be opened to ventilate excess heat
out and inner doors kept closed to keep the dwelling cool. At least 50% of
the external window area of the outer glazed screen was openable and
internal balcony floors shade the internal glass wall. Dunster stated (2008)
that the sunspace acts as a buffer, reducing heat losses from the building on
the south elevation. Photovoltaics were installed within the sunspace
glazing (roof and elevation windows) on the upper storeys, shown in Figure
4.5.
© Peabody
Figure 4.5: Sunspace at BedZED also showing photovoltaic cells in external glazing
Table 4.1 lists the principal components of the BedZED dwellings relevant to
this study, recorded in the Health & Safety File (Peabody Trust 2002b).

82
Table 4.1: BedZED dwelling components
Element Construction
Structure Grade 43 steel beams and columns, re-used from former railway station
Roof 200mm pre-cast concrete hollow core units, insulated with
300mm Styrofoam and sedum roof
External Walls Brick and block, some cedar cladding, insulated with
300mm Rockwool
Floors 200mm pre-cast concrete hollow core units
300mm expanded polystyrene
External Windows, doors and roof lights
Rationel timber windows, argon filled triple glazing on all elevations except south facing, double glazing on south facing
Photovoltaics BP Solar PV laminated units
CHP B9 wood gas CHP designed to produce 130 kW of electricity and 200kW heat
Source: Peabody Trust 2002b
Table 4.2 compares the minimum standards required by the 1995 Building
Regulations (using the elemental method) with the standards adopted for the
BedZED design.
Table 4.2: Comparison of BedZED Fabric U-values with 1995 Building Regulations elemental method
Element 1995 Regs
W/m2K
BedZED
W/m2K
BedZED material
Roof 0.25 0.10 300mm styrofoam
Exposed Walls 0.45 0.11 300mm Rockwool
Floors 0.45 0.10 300mm expanded polystyrene
External Windows, doors and roof lights
3.3 1.2 Argon filled triple glazing on all elevations except south facing, double glazing on south facing
Source: Energy Saving Trust (2002) Table 1
Buildings at BedZED were designed as heavy mass, highly insulated
structures. Walls were constructed of 100mm blockwork with a fully
insulated 300mm cavity and a 100mm brick external skin and some parts of
the façade were clad in cedar. Floors and ceilings were constructed of
205mm concrete hollow core beams with a 30mm concrete screed on top.
Soffits were un-plastered to expose the high thermal capacity of the concrete

83
which enabled the walls and ceilings to trap heat in the winter and cool in the
summer. Daytime warmth would be stored by the structure for slow release
at night in the winter in the same way that bricks in electric storage heaters
store heat for later release. The reverse applied in summer with night time
cool stored for slow release through the daytime in the summer, levelling out
peaks and troughs in the ambient temperature (Dunster et al 2008).
Figure 4.6 shows the designed and installed wall construction.

84
© zedfactory.com
© Peabody
Figure 4.6: Section through typical BedZED external wall and installed wall section

85
4.9 Building Physics
The building physics principles applied to BedZED aimed to maximise the
passive design principles of high mass construction and solar heat gains with
minimal shading from adjoining buildings. The building envelope would be
very air tight to minimise heat losses and buildings would be orientated so
that dwellings were south facing with workspaces facing north, as illustrated
in Figure 4.7.
© Arup
Figure 4.7: BedZED Building Physics
The principal benefit of this south-orientated, high mass, super-insulated
construction was that dwellings could be designed without conventional
heating systems or air conditioning. The designed heat loss was so low,
Heat Loss Parameter of 0.86 W/m2K in the original SAP calculation (Arup
1999b), that heat losses would be offset by incidental gains from occupants,
cooking and hot water use, waste heat from appliances and solar gains from
the south facing windows. For this to work effectively, the high mass, super-
insulated construction needed to be air tight. Air tightness was designed at
two air changes per hour at a differential pressure of 50 pascals (2 ach at 50

86
Pa) or 3m3/hr/m2. By comparison, the current standard for Passivhaus is
lower at 0.6 ach at 50 Pa (BRE 2015) and the current Building Regulations is
higher at 10 m3 (h.m2) at 50 Pa, (DCLG 2014).
4.10 Zero Energy
The term “ZED” derived from Zero Energy Development and was driven by
the desire for a net ‘zero energy development’. The original scheme design
documents defined this as a development that will produce at least as much
energy as it consumes and the original intention was that only energy from
renewable sources would be used to meet the energy needs of the
development (Bioregional 1999). The BedZED zero energy concept aimed
to have a holistic energy profile over the lifetime of the buildings, by
minimising energy used in both the construction and buildings operations and
offsetting the energy used by the production of energy from the buildings by
renewable energy, the surplus of which would be transferred back to the
national grid.
The BedZED zero energy ambition was not limited to buildings but also
encompassed transport, the whole building life from the selection of the site
and provision of workspaces to minimise commuting, construction, energy
used by residents to run the buildings and travel and also provision of
recycling facilities to minimise consumption of raw materials. The original
definition of ZED fits closely with current definitions of Net Zero Energy
Buildings discussed in Chapter 2 in terms of energy in use and connectivity
to the national grid, but ZED goes further since it also includes all embodied
energy and all energy used by occupants for working, leisure and travel.
There are therefore some aspects of the Autonomous House in the BedZED
concept. Only energy used within dwellings is examined in this thesis.
Arup (1999a) stated that an objective of BedZED building physics and
resulting mechanical and electrical design was to match the building’s energy
demand to available renewable energy sources so that there would be no net
fossil fuel carbon dioxide emissions. It is not clear from the original concept
design whether this relates to renewable energy sources from the site only.

87
Arup noted that renewable energy sources were generally more expensive
and more difficult to match to normal demand than fossil fuels because they
are dependent on external events, such as the amount of and intensity of
sunshine. A key requirement of the building physics design was therefore to
substantially reduce the demand for energy. In turn, low levels of energy
demand enabled more capital to be made available for each renewable unit
of energy supplied. In this way, technology that was relatively expensive at
the time, such as photovoltaics, would be more affordable because fewer
units were needed. The low energy demand design also meant that capital
saved by omitting plant such as heating and cooling systems could instead
be used to pay for the enhanced building fabric.
4.11 BedZED Energy Strategy
The BedZED energy strategy comprised the use of passive design principles
described above to minimise energy demand and energy supplied by a
biomass-fuelled CHP unit and photovoltaic cells (PV). At the time that
BedZED was designed, energy consumption in typical domestic houses was
between 150 and 288 kWh per m2 floor area per annum (kWh/m2/annum)
and typical dwellings built to the 1995 Building Regulations in force at the
time would have a total energy consumption of circa 162.5 kWh/m2/annum.
The predicted total energy demand from BedZED dwellings was expected to
be less than half of typical new housing, shown in Table 4.3.
Table 4.3: Dwelling Energy Use
Total energy KWh/m2/annum
Typical housing built to 1985 Building Regulations
230
Typical housing built to 1995 Building Regulations
163
BedZED housing
75
Source: Arup 1999a
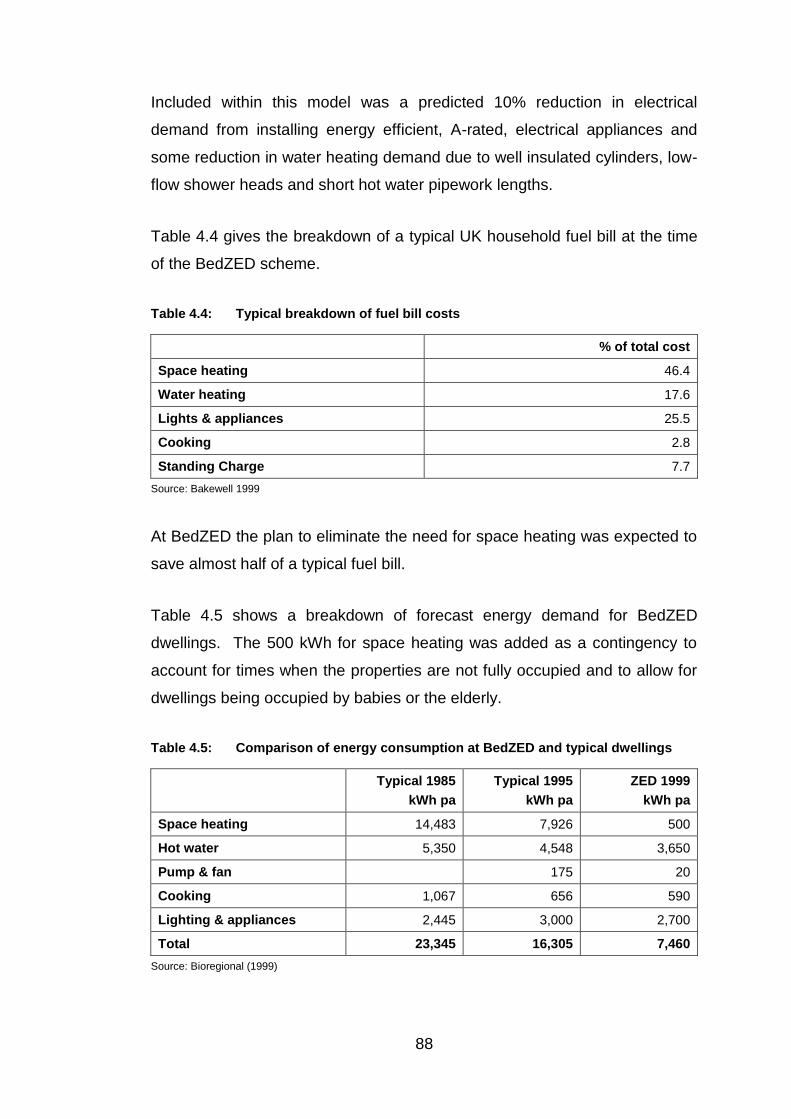
88
Included within this model was a predicted 10% reduction in electrical
demand from installing energy efficient, A-rated, electrical appliances and
some reduction in water heating demand due to well insulated cylinders, low-
flow shower heads and short hot water pipework lengths.
Table 4.4 gives the breakdown of a typical UK household fuel bill at the time
of the BedZED scheme.
Table 4.4: Typical breakdown of fuel bill costs
% of total cost
Space heating 46.4
Water heating 17.6
Lights & appliances 25.5
Cooking 2.8
Standing Charge 7.7
Source: Bakewell 1999
At BedZED the plan to eliminate the need for space heating was expected to
save almost half of a typical fuel bill.
Table 4.5 shows a breakdown of forecast energy demand for BedZED
dwellings. The 500 kWh for space heating was added as a contingency to
account for times when the properties are not fully occupied and to allow for
dwellings being occupied by babies or the elderly.
Table 4.5: Comparison of energy consumption at BedZED and typical dwellings
Typical 1985
kWh pa
Typical 1995
kWh pa
ZED 1999
kWh pa
Space heating 14,483 7,926 500
Hot water 5,350 4,548 3,650
Pump & fan 175 20
Cooking 1,067 656 590
Lighting & appliances 2,445 3,000 2,700
Total 23,345 16,305 7,460
Source: Bioregional (1999)
89
Arup estimated that ZED houses would use less energy for water heating
than a typical 1995 house owing to well insulated cylinders, low flow shower
heads and short hot water pipework lengths. Energy demand for pumps and
fans was also reduced owing to passive wind driven ventilation with their
passive heat recovery units and the absence of heating pumps. Cooking
demands were estimated to be lower than for a typical 1995 house due to
installation of induction hobs and occupant awareness of energy saving
techniques.
The Energy Saving Trust summarised the four strands of the BedZED zero-
carbon energy strategy as follows. Firstly the energy efficient design of
buildings comprised reducing heat losses and making use of solar gain to the
point where it is feasible to eliminate conventional central heating systems
altogether. Secondly, energy demand was reduced by energy efficient and
hot-water-saving appliances which set the design capacity for the CHP
system. Thirdly, the use of renewable energy sources in the form of a
biomass-fuelled CHP and photovoltaic power cells integrated into the
sunspace roofs meant that BedZED could become a net exporter of
renewable energy. Finally the green transport plan minimised residents’ use
of fossil-fuel cars and the need to commute to work (Energy Saving Trust
2002).
4.12 BedZED SAP Calculation
Prior to detailed design, Arup completed thermal modelling for BedZED and
also produced a generic SAP calculation for a hypothetical dwelling. The
SAP calculation, but not the thermal modelling, was made available for this
study and provides useful insights into early design assumptions. Arup’s
SAP calculation was completed in 1999 using SAP version 9.53. It assumed
a two-storey, south facing 100m2 well-insulated property with 23m2 of glazing.
The SAP calculation resulted in a SAP rating of 150, reported as 100 since
this was the maximum possible score with the SAP tool, illustrating one of the
limitations of the early versions of the SAP procedure for low energy
developments.

90
The underpinning assumptions for the BedZED SAP calculation appear to be
that the high level of insulation coupled with large expanse of south facing
glazing would result in a relatively low base temperature of 9.7°C compared
to a traditional base temperature of 15.5°C (CIBSE 2006b) thus minimising
the requirement for space heating. The calculation assumes significant solar
gains (864W) from the large expanse of glazing. As part of this study, a
typical two storey maisonette elevation drawing was measured and the area
of glazing found to be broadly in line with the SAP assumption: 26m2 actual
compared to the SAP assumption of 23m2.
Glazing on the top floors of dwellings also had PV installed integral to the
glazed units. This will have reduced some of the solar gain (see Figure 4.5)
although the solar will have been converted to renewable energy.
The SAP calculation assumed that the heating system efficiency would be
100%. It is assumed that this is because the designers had “designed out”
the need for traditional space heating in the dwellings in the form of individual
central heating systems. However the provision of back up space heating
via the hot water storage cylinder and finned tube heating element, only
expected to be required in unoccupied properties with no incidental gains,
meant that the domestic hot water supply was effectively part of the space
heating strategy. Despite minimising pipe runs and locating them within
buildings where possible, it is assumed that in practice there would have
been some heat loss on pipe runs between the CHP/central boilers and
dwellings. It was not possible to measure this specifically, but Chapter 7
reviews the designed and actual energy usage at BedZED and also the
EPCs issued for BedZED properties are discussed together with the
challenges of using the RdSAP calculation for properties like BedZED.
4.13 Designed Energy Usage
BedZED domestic electrical requirements were based on typical demand
from house-types and assumed that occupants used energy efficient
appliances. The design team recognised that that this was a best case
scenario. They noted that one “worst case” family would cancel out about

91
four “best case” families, with the result that the site- wide mean was likely to
be more than their “typical” consumption figures used in the table below.
The design team assumed that all options for residents in the households
were equally likely, i.e. there would be roughly equal numbers of flats with
single young people, single old people, young couples and elderly couples.
The estimates of electrical energy requirements are shown in Table 4.6.
Table 4.6: Predicted annual electrical energy requirements for each house type at BedZED
House type Worst case scenario
kWh/year
Typical scenario
kWh/year
Best case scenario
kWh/year
Suggested figure for CHP
sizing*
kWh/year
1 bed flat 4,343 1,723 989 2,247
2 bed flat 4,867 2,028 1,189 2,596
3 bed maisonette
5,863 2,657 1,663 3,298
3/4 bed house
6,137 2,882 2,449 3,533
*ratio of 1 property from worst case to four properties from typical category/5
Source: Bioregional (1999) from Total Energy Strategy p56, Arup calculations
The scenarios in Table 4.6 are in line with the design estimates of 3,290
kWh/annum for electricity for a typical property.
Domestic heat requirements were based on estimated number of occupants
because heat would primarily be taken in the form of hot water. Assumptions
were made about the predicted number of people in each dwelling size,
together with the maximum number. The 300 litre hot water cylinders with a
3kW immersion heater installed in all properties would store hot water
produced by the CHP for the heavy morning and evening hot water demands
(Bioregional 1999). Estimated heat requirements are shown in Table 4.7.
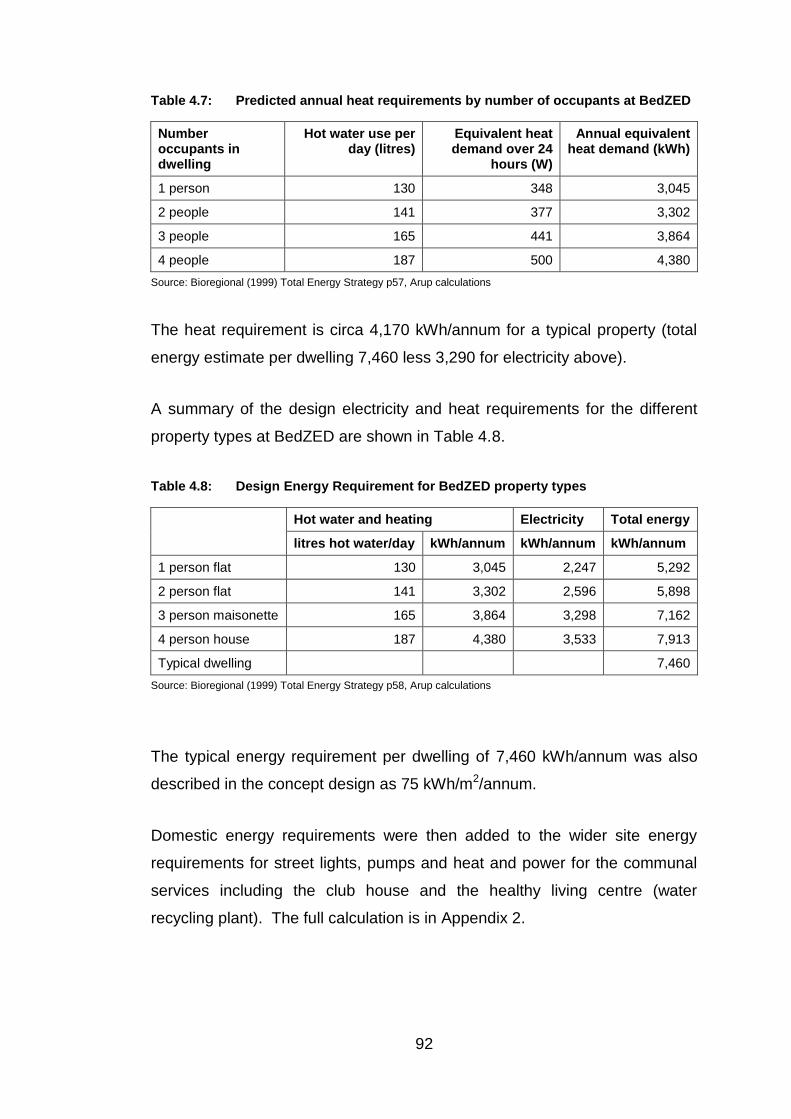
92
Table 4.7: Predicted annual heat requirements by number of occupants at BedZED
Number occupants in dwelling
Hot water use per day (litres)
Equivalent heat demand over 24
hours (W)
Annual equivalent heat demand (kWh)
1 person 130 348 3,045
2 people 141 377 3,302
3 people 165 441 3,864
4 people 187 500 4,380
Source: Bioregional (1999) Total Energy Strategy p57, Arup calculations
The heat requirement is circa 4,170 kWh/annum for a typical property (total
energy estimate per dwelling 7,460 less 3,290 for electricity above).
A summary of the design electricity and heat requirements for the different
property types at BedZED are shown in Table 4.8.
Table 4.8: Design Energy Requirement for BedZED property types
Hot water and heating Electricity Total energy
litres hot water/day kWh/annum kWh/annum kWh/annum
1 person flat 130 3,045 2,247 5,292
2 person flat 141 3,302 2,596 5,898
3 person maisonette 165 3,864 3,298 7,162
4 person house 187 4,380 3,533 7,913
Typical dwelling 7,460
Source: Bioregional (1999) Total Energy Strategy p58, Arup calculations
The typical energy requirement per dwelling of 7,460 kWh/annum was also
described in the concept design as 75 kWh/m2/annum.
Domestic energy requirements were then added to the wider site energy
requirements for street lights, pumps and heat and power for the communal
services including the club house and the healthy living centre (water
recycling plant). The full calculation is in Appendix 2.

93
4.14 Whole Life Energy Use
The BedZED energy strategy was based on fully exploiting the use of low-
technology building fabric form and materials and avoiding heavy
dependence on sophisticated electrical and mechanical systems in individual
buildings which would require maintenance and cyclical renewals. As far as
practical, capital would be invested into long life passive building fabric
components which are generally difficult and costly to upgrade during future
refurbishment. This aligns with the later findings from Summerfield, Pathan,
Lowe et al (2010b) that the installation of energy efficiency measures should
be maximised in the construction phase as they are unlikely to be retro-fitted
later. Over the long design life of the building this strategy was intended to
result in the lowest ‘cradle to grave’ embodied and consumed energy needs.
Figure 4.8 shows the sourcing strategy for construction materials for
BedZED. The aim was to source from a 25 mile radius from the site where
possible to minimise transportation energy and recycled materials were
actively sourced by the design team.

94
© Peabody
Figure 4.8: Sourcing materials for BedZED
Embodied energy of building components used is not analysed in this study
but given the relevance to the energy strategy, would be worthy of a future
study to assess the impact of reduced transportation of materials on the
overall energy footprint of BedZED and the actual component performance in
use.
4.15 Mechanical and Electrical Systems
The high level mechanical and electrical design for BedZED is summarised in
Figure 4.9.

95
© Arup
Figure 4.9: Schematic of Mechanical and Electrical Systems at BedZED
Figure 4.9 shows that the primary source of heat and electricity was from the
CHP unit. This was designed to be fuelled from urban tree waste, chipped,
dried and fed into the CHP via a gasifier. The long term plan for the biomass
fuel was to grow short rotation willow coppice and space was earmarked for
this purpose at the BedZED site, item 19 in Figure 4.10.

96
© zedfactory.com
Figure 4.10: Future eco-park at BedZED providing biomass for fuel

97
4.16 CHP Design
The original design concept was that the CHP would be biomass fuelled by
sustainable sources of timber grown on site with zero CO2 emissions that
would provide hot water and power to all properties in the development as
well as power for the site infrastructure such as street lighting and the living
machine which recycled waste water for re-use. Until the short-rotation
willow crop was established at the BedZED site, tree waste was initially
sourced as the biomass fuel for the CHP from the London Borough of
Croydon. The CHP was designed to supply hot water for which daily total
demand is relatively constant throughout the year. But because demand for
hot water fluctuates during the day, heat storage was provided by the hot
water cylinders in each property so that the CHP could continuously trickle-
charge them. The site’s mixed use of dwellings and offices would also serve
to smooth out demand fluctuations across the day with an export/import
connection to the National Grid allowing the constant CHP electrical output to
be matched to demand changes.
BedZED’s CHP unit would generate electricity for lighting and appliance use
within dwellings and also distribute hot water around the site via a district
heating system of insulated pipes. A schematic diagram of the system is
shown in Figure 4.11.

98
© Arup
Figure 4.11: Schematic of Combined Heat and Power plant at BedZED
The CHP system was designed with an import/export meter to the grid, to
enable excess electricity to be sold back to the National Grid and imported as
required.
By storing hot water in each dwelling the additional capital cost of installing
boiler plant to match peak loads was avoided. The CHP heat distribution
pipework to each property was sized to minimise the amount of energy
required for pumping, with cylinder demand controlled by simple direct-acting
thermostatic two-port valves. Cylinder immersion heaters provided a hot
water standby facility and emergency back-up in case of failure of the CHP
plant. (Arup 1999a)
The design intention was that energy use would also be minimised by
encouraging occupants to monitor their reduced energy usage once the
dwellings were occupied. At the time, this was often not practical for new
developments because energy supply authorities wanted external access to

99
the meters. In BedZED, energy meters were prominently located in kitchens
in order to make occupants aware of their own consumption.
4.17 Sizing the CHP plant
Arup used the electrical and heat energy estimates, summarised in Table
4.8, to size the Combined Heat and Power (CHP) system, using a safety
margin of circa 20% higher than peak capacity required (Twinn 2014).
For site electricity requirements, the CHP plant was sized so that over the
year it produced enough electricity to match the energy consumed. The aim
was not to cover for peaks in demand. During peak periods, electricity
would be imported from the grid (with the design team intending to source
“green electricity” for these periods) and an equivalent amount exported to
the grid at off peak times (Bioregional 1999).
The heat from the CHP would be used primarily to heat domestic hot water
and for some supplementary heating via the towel rails and by heating air via
an integral finned tube heater in the airing cupboards. The 300 litre hot
water cylinders with 3kW immersion heater installed in all properties would
store hot water produced by the CHP for the heavy morning and evening hot
water demands. The heat required for hot water supply was not expected to
vary greatly over the year, but any supplementary heating requirement would
be greatest in winter. Accordingly the design team based their estimates of
heat requirements on a winter day.
The additional heating requirement was more difficult to quantify. In summer
amounts were expected to be small with some heat required from time to
time such as on cooler evenings or to dry clothes. The design team’s
thermal modelling showed that if the high insulation and low infiltration
targets were achieved together with a 40% heat recovery on the ventilation
system, no additional space heating would be required for a typical winter,
providing dwellings were occupied. A key design consideration was
avoiding the room temperature falling during un-occupied periods since there
was no conventional heating system to bring temperatures back up to normal

100
when occupants returned. The design team’s analysis showed that there was
little energy benefit to be gained in such a super-insulated high thermal mass
home in allowing room temperatures to drift downwards during intermittent
occupancy. Another consideration was maintaining room temperatures in
adjacent homes, given the additional heat lost through party walls, should
unoccupied adjacent dwellings be allowed to become colder. If the dwellings
were unoccupied, around 500W (12W/m2) incidental heat gains normally
provided by the occupants and their activities (e.g. TV, cooking, lights, etc.)
would be missing and hence a backup would be required to meet heat
losses. The heat gains required in unoccupied houses would be partially
offset by the fact that when the house is unoccupied there is no hot water
demand, saving around 400W (~8.2W/m2). They estimated the output from
the finned tube heater to be around 50 to 100W. To cover the additional
heating in sparsely occupied or unoccupied dwellings, they allowed extra
gains of 3.5 W/m2 in all dwellings.
The design team’s figures gave a daily site wide demand for additional
heating on a winter day as around 3.2 GJ (890 kWh), and including the hot
water a total daily site heat demand of 7.1 GJ (1960 kWh). The calculations
underpinning these requirements can be found at Appendix 2 and a summary
is provided at Table 4.9.

101
Table 4.9: Sizing the BedZED CHP system
Hot Water kWh/day
Extra Heating kWh/day
Electricity kWh/day
Dwellings 825.2 443.3 722.5
Offices (live work units) 54.7 244.7 188.6
Other (clubhouse, healthy living etc.)
191.9 203.8 455.8
Site infrastructure (streetlights, pumps etc.)
250.8
Total Heat 1,963.6
Total Electricity 1,617.7
Over CHP hours (17/day) 115.5 95.1
Losses (heat 20%, elec 5%) 138.6 99.8
Design margin (10%) *152.4 *109.8
CHP heat required kW/day 153
CHP elec required kW/day 110
*rounding
source: Appendix 2 CHP Sizing Calculation from Bioregional (1999) Total Energy Strategy p59, Arup calculations
The CHP performance specification required a flow temperature of 80ºC and
return temperature of 60ºC. Modern district heating schemes with pre-
insulated pipework would assume 5% heat loss from pipework of their
delivered peak demand whereas at BedZED the losses were assumed to be
circa 20% because of the very small amounts of heat being delivered to the
dwellings compared to a conventional district heating scheme. Consequently
where possible the pipelines were routed inside the buildings. Any pipeline
heat losses inside buildings would be treated as incidental gains since they
would help to keep internal spaces warm.
The CHP performance requirements were tendered and detailed design
undertaken by the CHP supplier.
Figure 4.12 shows how the design team’s estimated energy use in a typical
BedZED household compared to typical UK new houses at the time
(Bioregional 1999).
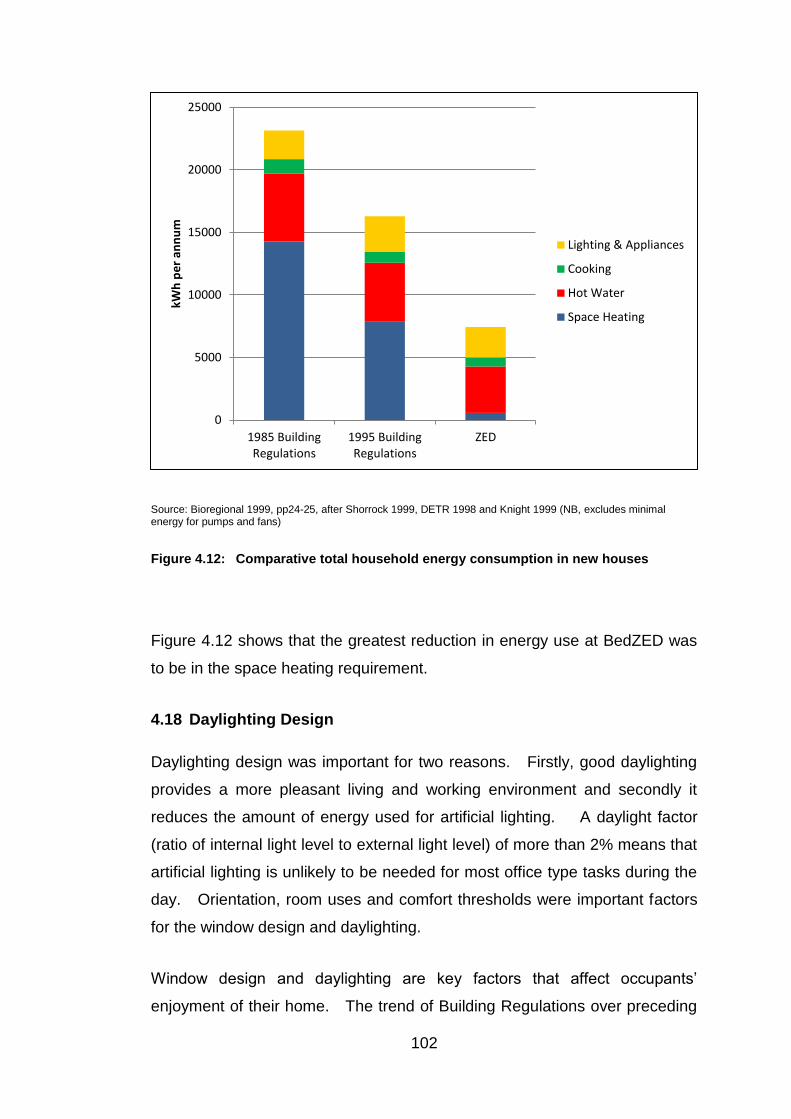
102
Source: Bioregional 1999, pp24-25, after Shorrock 1999, DETR 1998 and Knight 1999 (NB, excludes minimal energy for pumps and fans)
Figure 4.12: Comparative total household energy consumption in new houses
Figure 4.12 shows that the greatest reduction in energy use at BedZED was
to be in the space heating requirement.
4.18 Daylighting Design
Daylighting design was important for two reasons. Firstly, good daylighting
provides a more pleasant living and working environment and secondly it
reduces the amount of energy used for artificial lighting. A daylight factor
(ratio of internal light level to external light level) of more than 2% means that
artificial lighting is unlikely to be needed for most office type tasks during the
day. Orientation, room uses and comfort thresholds were important factors
for the window design and daylighting.
Window design and daylighting are key factors that affect occupants’
enjoyment of their home. The trend of Building Regulations over preceding
0
5000
10000
15000
20000
25000
1985 BuildingRegulations
1995 BuildingRegulations
ZED
kWh
pe
r an
nu
m
Lighting & Appliances
Cooking
Hot Water
Space Heating

103
years had been increased energy efficiency of building envelopes, higher
levels of insulation and reduced heat loss. One consequence of this was that
new houses were being built with smaller windows and reduced overall
window area. Bill Dunster, the BedZED architect, was keen to demonstrate
that there were alternative design approaches to small windows which would
perform well in energy efficiency terms and provide good daylighting levels.
The completed dwelling is illustrated in Figure 4.13.
© Peabody
Figure 4.13: Interior view of BedZED
4.19 Ventilation Design
The BedZED building physics model depended upon good control of
ventilation to minimise heat loss and eliminate the need for a conventional
heating system. The building envelope was intended to achieve a very high
level of air-tightness of 2 ach at 50 Pa test pressure.
The BedZED ventilation design was based on natural ventilation to minimise
capital costs and use and maintenance of electrically operated fans.

104
Occupant-controlled opening windows of an area equal to 5% of the floor
area were provided for purge ventilation and cooling in all habitable rooms.
For night-time cooling secure locking windows allowed them to be held open
with a minimum clear 50mm opening. At the time of design, the typical
approach for the supply of fresh air to dwellings was to fit trickle ventilators to
windows. However in a low energy building without radiators, trickle
ventilators could have been a significant energy drain, particularly on a
wintery cold and windy day. BedZED sought to provide pre-heated fresh air
by using passive stack ventilation with heat recovery. This took advantage of
the sealed building envelope to create a balanced air supply and exhaust
using a combination of internal heat buoyancy and wind pressure through a
vertical pipe inside a duct flat plate heat exchanger fitted with a roof wind
cowl. The passive stack ventilators were provided for exhausting local
moisture/pollutants. The ventilation cowls, shown in Figure 4.14, were sited
on the top of each block and designed to provide fresh air to each dwelling
and heat recovery on the stale air being discharged. Supply air would enter
living rooms and bedrooms and the exhaust air extracted from the kitchens,
bathrooms and toilets. One side draws out air from the higher outlet in the
rooms and the other pushes air in to the lower inlet, by taking advantage of
naturally occurring pressure changes. By-pass flaps stop high winds from
over ventilating rooms.
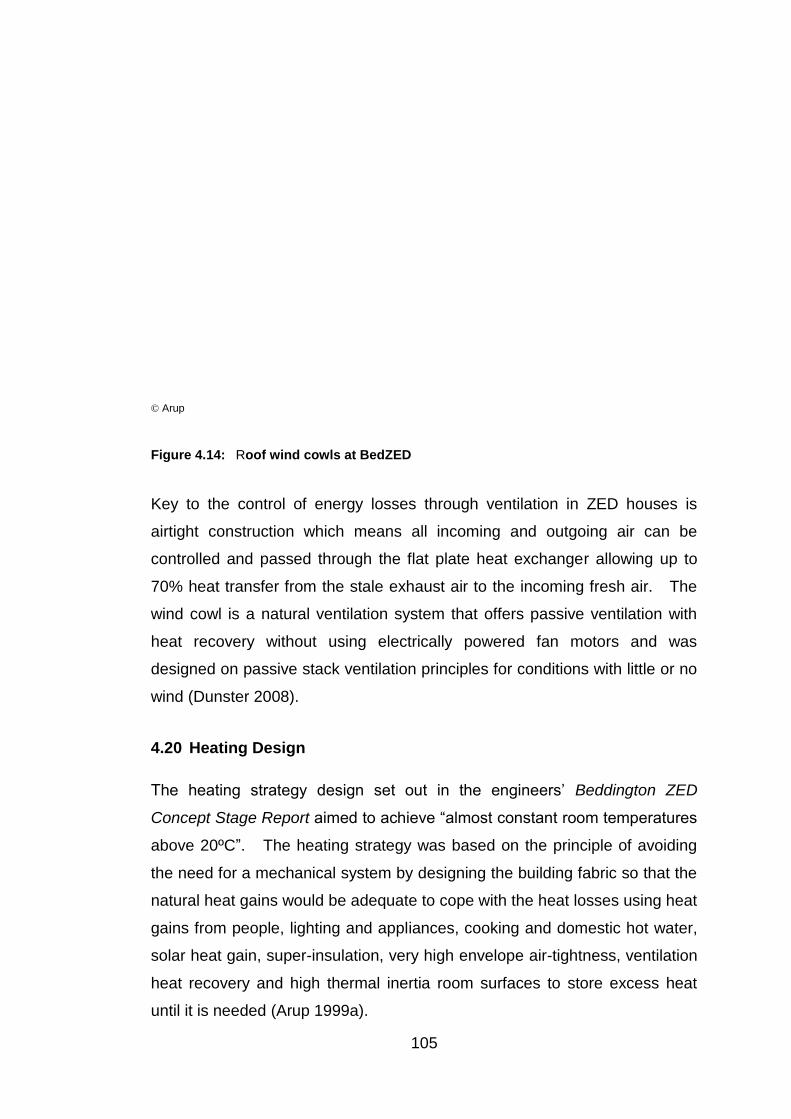
105
© Arup
Figure 4.14: Roof wind cowls at BedZED
Key to the control of energy losses through ventilation in ZED houses is
airtight construction which means all incoming and outgoing air can be
controlled and passed through the flat plate heat exchanger allowing up to
70% heat transfer from the stale exhaust air to the incoming fresh air. The
wind cowl is a natural ventilation system that offers passive ventilation with
heat recovery without using electrically powered fan motors and was
designed on passive stack ventilation principles for conditions with little or no
wind (Dunster 2008).
4.20 Heating Design
The heating strategy design set out in the engineers’ Beddington ZED
Concept Stage Report aimed to achieve “almost constant room temperatures
above 20ºC”. The heating strategy was based on the principle of avoiding
the need for a mechanical system by designing the building fabric so that the
natural heat gains would be adequate to cope with the heat losses using heat
gains from people, lighting and appliances, cooking and domestic hot water,
solar heat gain, super-insulation, very high envelope air-tightness, ventilation
heat recovery and high thermal inertia room surfaces to store excess heat
until it is needed (Arup 1999a).
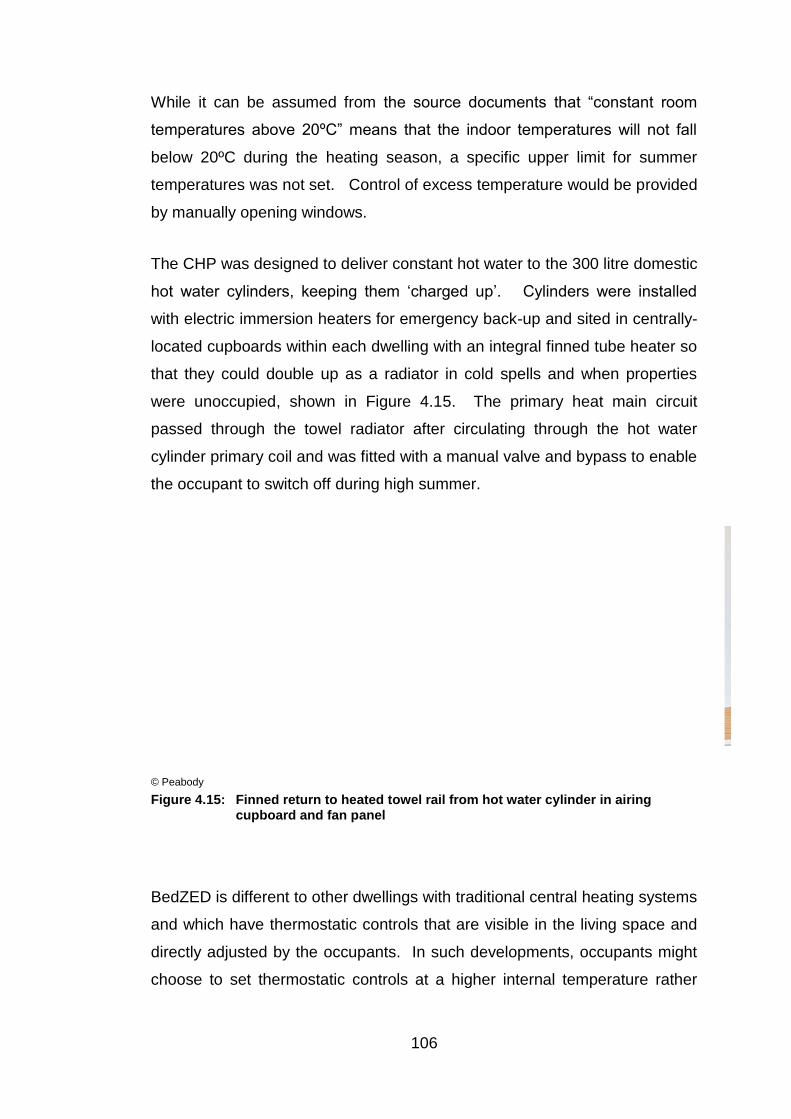
106
While it can be assumed from the source documents that “constant room
temperatures above 20ºC” means that the indoor temperatures will not fall
below 20ºC during the heating season, a specific upper limit for summer
temperatures was not set. Control of excess temperature would be provided
by manually opening windows.
The CHP was designed to deliver constant hot water to the 300 litre domestic
hot water cylinders, keeping them ‘charged up’. Cylinders were installed
with electric immersion heaters for emergency back-up and sited in centrally-
located cupboards within each dwelling with an integral finned tube heater so
that they could double up as a radiator in cold spells and when properties
were unoccupied, shown in Figure 4.15. The primary heat main circuit
passed through the towel radiator after circulating through the hot water
cylinder primary coil and was fitted with a manual valve and bypass to enable
the occupant to switch off during high summer.
© Peabody
Figure 4.15: Finned return to heated towel rail from hot water cylinder in airing cupboard and fan panel
BedZED is different to other dwellings with traditional central heating systems
and which have thermostatic controls that are visible in the living space and
directly adjusted by the occupants. In such developments, occupants might
choose to set thermostatic controls at a higher internal temperature rather

107
than reducing the amount of energy used for heating (take-back, discussed in
Chapter 2).
To increase the internal temperature at BedZED, occupants would need to
adjust the thermostat on the hot water storage cylinder and/or the heated
towel rail since the waste heat from the cylinder contributes to background
warmth of the property. The Residents’ Handbook states that the immersion
heater will come on automatically if the internal temperature of the property
falls below a set level, generally 18°C (for instance if the dwelling is empty) to
avoid the property draining heat from its neighbours (Peabody Trust 2002).
Occupants could therefore increase the internal temperature of their home by
switching on the immersion heater and/or setting the temperature of the hot
water cylinder higher (initial setting 50ºC) in order to increase the waste heat
from the hot water cylinder. The BedZED Residents’ Manual also describes
how occupants can increase internal temperature by increasing the
thermostat on the finned tube heater above the standard setting of 18°C.
However it also states that this is not recommended since it will result in a
reduction in hot water temperatures.
In summary, it is clear that the operation and control of the background space
heating and hot water systems at BedZED are quite different to the typical
whole heating systems and thermostatic controls that most people in the UK
are now used to (see section 2.4.1: 91% of households had whole house
heating by 2011).
Traditional gas-fired central heating systems require statutory inspection and
maintenance by landlords so for Peabody, the landlord, eliminating these
was an additional benefit. It would save time and money for both the landlord
but also the tenants and owner-occupiers. Providing homes that were
cheaper to heat would also help tackle fuel poverty since social housing
tenants would have lower fuel bills.

108
In conclusion, if BedZED were successful in reducing energy consumption,
the potential for the Government’s carbon reduction policy objectives would
be considerable.
4.21 Other BedZED studies
4.21.1 Resident Satisfaction Survey
Peabody Trust and Samantha Elvy carried out a general resident satisfaction
survey for the BedZED development and released their findings in May 2004
(Ellis & Elvy, 2004). The survey sought residents’ views on the whole
development including their overall view of the design of the estate and their
homes, the location and neighbourhood, refuse and parking facilities, estate
lighting, security, internal design and layout, fixtures and fittings, sunspace
and gardens, internal services, the cost and value, defects and repairs, the
information provided to residents, communal facilities and activities, the
sense of community, transport and travel patterns.
Like the post-occupancy survey for this study, the Peabody Trust survey was
undertaken when there were operating problems with the CHP plant.
Regarding internal services (electricity, water, heating and hot water and
using renewable energy), the Peabody Trust survey reported some gaps in
residents’ awareness about how to operate their internal services. Half the
sample said they had noticed a reduction in their fuel bills since moving to
BedZED.
In the section on sunspace design, the feedback from residents was that it
was a particularly popular design feature with many residents saying that it
was one of the most enjoyable aspects of their home. Two residents (from a
sample of 38) said that it got too hot in the summer. Two participants cited
the lack of control over the bathroom radiator as a problem and three
participants quoted the overheating in the summer as a problem.

109
4.21.2 Renewable Energy
The monitoring for this thesis did not include renewable energy generated
and therefore other sources are discussed here. The design specification
proposed to install a total of 777m2 of photovoltaic (PV) panels comprising
1,138 laminates with a peak power of 109 kW on rooftops and in south-facing
second floor windows (Arup 2000). The original intention had been that they
would provide the power for 40 electric vehicles which would be operated as
a car club. However, the uptake of electric vehicles was much lower than
planned and therefore the electricity produced by the photovoltaics was used
by the site as a whole with surplus supplied back to the grid.
Hodge and Haltrecht (2009) quoted an estimate from BP Solar that the array
would provide 88,000 kWh of electricity per annum. In his 2005 thesis,
Corbey estimated that the energy produced by the PV in 2004 was 31,200
kWh. Corbey made his estimate by reading the PV display board at BedZED
where the total energy produced at the time of his writing was 78MWh over a
three year period. He omitted the first six months because the panels were
not operational to arrive at his annual estimate of 31,200 kWh (Corbey 2005).
The results from the Corbey study and the Hodge and Haltrecht study are
compared with the original design intent and presented at Table 4.10.
Table 4.10: Annual Energy from PV at BedZED
kWh Source
98,000 Design, Arup 2000
88,000 Hodge & Haltrect 2009
31,200 Corbey 2005
Using Corbey’s estimates, actual PV produced was approximately one third
of that designed. The renewable energy produced by the PVs was not used
for an electrical car pool but was used by the dwellings.
Corbey estimated how much non-renewable energy was used by the site in
2004 and this is summarised in Table 4.11.
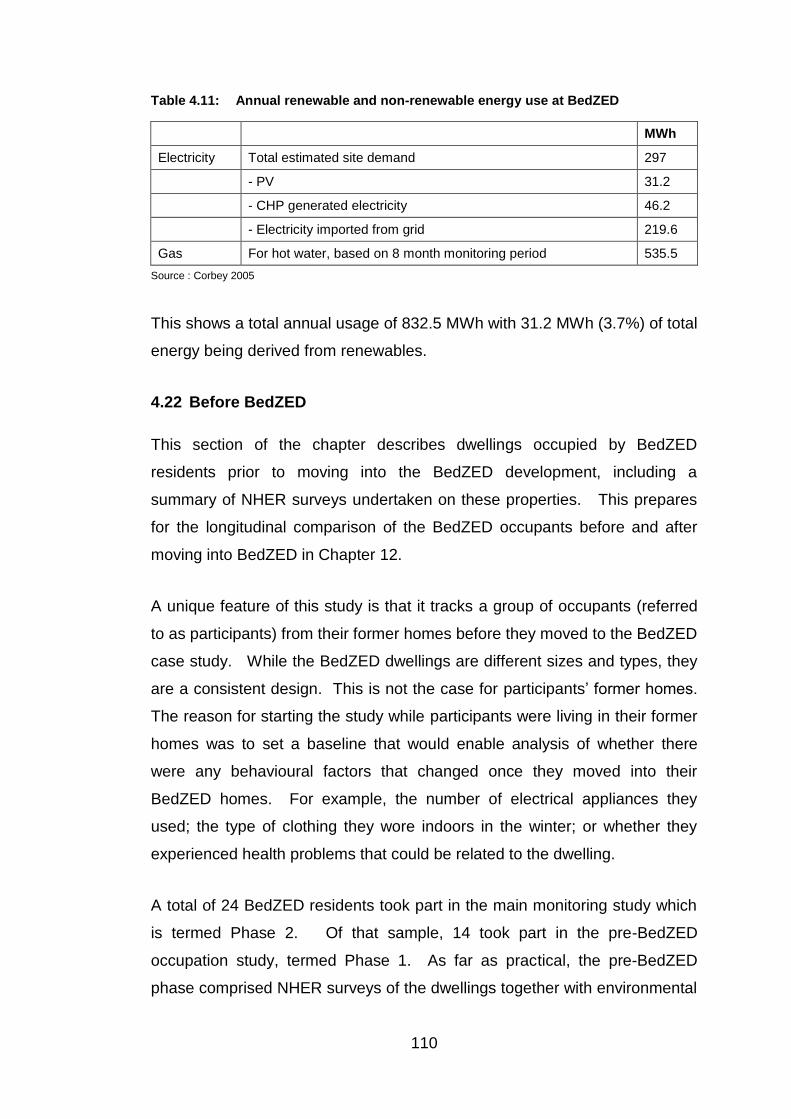
110
Table 4.11: Annual renewable and non-renewable energy use at BedZED
MWh
Electricity Total estimated site demand 297
- PV 31.2
- CHP generated electricity 46.2
- Electricity imported from grid 219.6
Gas For hot water, based on 8 month monitoring period 535.5
Source : Corbey 2005
This shows a total annual usage of 832.5 MWh with 31.2 MWh (3.7%) of total
energy being derived from renewables.
4.22 Before BedZED
This section of the chapter describes dwellings occupied by BedZED
residents prior to moving into the BedZED development, including a
summary of NHER surveys undertaken on these properties. This prepares
for the longitudinal comparison of the BedZED occupants before and after
moving into BedZED in Chapter 12.
A unique feature of this study is that it tracks a group of occupants (referred
to as participants) from their former homes before they moved to the BedZED
case study. While the BedZED dwellings are different sizes and types, they
are a consistent design. This is not the case for participants’ former homes.
The reason for starting the study while participants were living in their former
homes was to set a baseline that would enable analysis of whether there
were any behavioural factors that changed once they moved into their
BedZED homes. For example, the number of electrical appliances they
used; the type of clothing they wore indoors in the winter; or whether they
experienced health problems that could be related to the dwelling.
A total of 24 BedZED residents took part in the main monitoring study which
is termed Phase 2. Of that sample, 14 took part in the pre-BedZED
occupation study, termed Phase 1. As far as practical, the pre-BedZED
phase comprised NHER surveys of the dwellings together with environmental

111
monitoring for a period of approximately four to six weeks in the period
February to October 2002. Participants were also surveyed about how they
used the dwellings and how satisfied they were with the environmental
performance of the dwelling.
The NHER surveys illustrated the variety of dwellings that the participants
lived in prior to moving to BedZED. Three participants lived in properties
built around or before 1900, six lived in properties built since 1980 and the
other three lived in properties built between 1930 and 1976. There was also
a variety of construction styles, some solid walled properties, mixture of
pitched and flat roofs, three properties were wholly single glazed and three
properties a mixture of single and double glazed. Heating systems were
also different. Three properties had gas-fired wet central heating systems,
one had a gas warm air system, five properties had off-peak electrical
storage heaters and three properties used individual room heaters for
heating. Table 4.12 summarises the energy rating results for properties
occupied prior to BedZED. SAP results ranged from 29 up to 68 compared
to the design SAP of 100 for BedZED.
Table 4.12: Summary of energy rating results for pre-BedZED properties
Property SAP NHER
B 50 6.5
D 29 3.5
F 55 6.7
J 40 5.6
N 35 3.8
P 61 7
Q 58 7.2
R 51 5.8
S 66 8
V 29 4
X 61 8.4
AB 68 8.4

112
Marketing literature promoted BedZED as “the UK’s first truly green village”
(Peabody Trust 2000). However, although there were a number of surveys
to assess occupants’ satisfaction with various aspects of the BedZED
scheme, none of the surveys reviewed to date, including the two surveys
undertaken for this study asked occupants why they moved to BedZED.
Therefore it is not possible to assess whether the energy performance of the
BedZED homes was a significant factor in their decision.
4.23 Case Study Conclusions
A unique feature of the BedZED development was that it brought together so
many technologies and techniques in one development. While the individual
design principles and technologies used in BedZED had previously been
tried out separately, they had not been built altogether in a single
development. BedZED aimed to harness the comprehensive benefits of all
these technologies.
Research has shown that human behaviour can change if the energy
efficiency of people’s homes is improved, for example, by higher internal
temperatures rather than reduced energy bills. Tracking the study’s
participants from their pre-BedZED homes to BedZED could provide new
insights into this body of research. However, there were some specific
factors which might affect these results. For example, the scheme attracted
a very high profile at the time of its construction and occupation (and during
the monitoring phase of this study). This might potentially distort occupants’
behaviour by, for example, making occupants far more conscious about their
energy use than a more typical development.
The BedZED building and systems design was quite different from standard
dwellings. This could present a challenge if, for example, occupants wanted
to easily increase internal temperatures. Since there were no traditional wall
mounted thermostatic controls, occupants would need to increase the
thermostat on the hot water storage tank and/or plug in stand-alone electrical
heaters to provide additional space heating.

113
Assumptions were made about how BedZED buildings would perform in use.
This case study measures actual energy used and internal temperatures
achieved in the surveyed dwellings. Additionally, it analyses what
participants thought about the energy performance of their homes.
The next chapter discusses the literature on summer overheating.

114
Chapter 5 Summer Overheating
5.1 Introduction
Since the energy supply crisis of the 1970s, the focus of building design and
regulations with regards internal temperatures has been to minimise heat
loss to reduce fuel poverty and carbon emissions from domestic energy
used. Most of the literature relating to domestic systems, environmental
impact and user comfort has focused on heating, insulation and the cost of
providing heating and hot water. This chapter discusses the emergence of
overheating within dwellings. It discusses the literature relating to the
growing importance of summer temperatures and overheating for building
designers and occupants. It summarises the trend towards higher summer
temperatures and discusses definitions of hot spells. The chapter explains
the importance of summer temperatures and hot spells with regards
occupant comfort and the impact on health.
Overheating is important for two reasons. Firstly internal temperatures
impact on human comfort in dwellings and building design needs to reflect
changing external conditions in order to maintain comfort levels. Secondly, if
internal temperatures increase beyond acceptable comfort levels during hot
spells, occupants are likely to install electrical cooling systems, such as air
conditioning. This will increase electricity use and contribute to increased
carbon emissions. Summerfield, Lowe and Oreszczyn (2010a) predicted that
domestic fuel consumption will increase owing to a demand for cooling when
average external summer temperatures rise above 18°C.
5.2 Weather Trends
In the last decade, a growing body of research has focused on summer
temperatures. In the UK, the Central England temperature has increased by
about 1°C since the 1970s with 2006 being the warmest on record. Under
the Intergovernmental Panel on Climate Change’s medium emissions
scenario, the UK is projected to warm even further with mean daily maximum
temperatures in summer increasing by up to 5.4°C in Southern Britain and
115
2.5°C in Northern Britain by the 2080s. The warmest day of the summer is
projected to increase in the range of 2.4°C - 4.8°C by the 2080s depending
on location (Eames, Kershaw and Coley 2011).
The theory of Urban Heat Islands is relevant to BedZED. This theory states
that urban settings absorb larger amounts of solar radiation during the day
than rural settings and cool less at night. The additional heat emissions from
the urban population are also a source of heat (Mavrogianni, Davies, Batty et
al 2011).
5.3 Definition of Hot Spells
Although there is no generally agreed definition of a heatwave, Hajat et al
defined a heatwave as a three day rolling average above the 97th percentile
value of 21.5°C (Hajat, Kovats, Atkinson et al 2002) based on their analysis
of 21 years of data between 1976 and 1996. Using this definition, Wright,
Young & Natarajan (2005) concluded that the heatwave experienced in the
summer of 2003 ran from the 3rd to the 13th August. For the purposes of
their study, Wright et al interpreted the heatwave period as the continuous
set of days when the daily average temperature was above 20°C.
Monitoring data were collected throughout this entire period for the BedZED
Phase 2 sample.
5.4 Summer Comfort
Internal temperatures are an important indicator of occupant comfort.
CIBSE Environmental Design Guidance recommends thresholds for general
summer indoor comfort temperatures for non-air conditioned dwellings in
warm summer conditions. Summer operative temperatures for non-air-
conditioned dwellings are deemed to be 25°C and 23°C for living rooms and
bedrooms with summer peak and overheating deemed to occur at 26°C and
28°C respectively. CIBSE define operative temperature as a combined
single value for air temperature and mean radiant temperature. The
guidance states that overheating occurs when more than 1% of the annual
occupied hours have internal temperatures of more than 28°C. When

116
bedrooms achieve temperatures over 24°C, quality of sleep may be
compromised and 26°C should not be exceeded unless ceiling fans are
installed (CIBSE 2006).
In the BedZED project documentation reviewed, there is no specific
reference to a summer design temperature. On the subject of summer
temperatures, the concept design stated that passive cooling using thermal
inertia would be used to avoid mechanical cooling. It also referred to
building massing that minimises over-shading, south facing glazed
sunspaces and no external shading to block the beneficial solar heating
effect (Arup 1999a).
In this BedZED study, temperatures were recorded as mean average daily
temperatures rather than occupied hours (which would take account of
occupant interventions such as opening windows). Because no specific
design temperature for the summer months was set for the project, the
CIBSE benchmark of 26°C for bedrooms and 28°C for living rooms has been
adopted in the analysis. Occupancy data were not collected. Another
recent study did collect occupancy data by installing occupancy sensors
within dwellings. While there were issues with this method, learning from that
experience and adopting the approach in future studies would provide a
much richer source of data for the assessment of overheating (Love 2014).
5.5 Impact of Hot Spells on Health
The impact of dwellings that are too cold on occupants’ health is well
documented. The comprehensive document review by Thomson, Thomas,
Sellstrom et al (2009) found that housing improvements, particularly warmth
improvements, led to health improvements for occupants with little evidence
of detrimental impacts. The significance of overheating was discussed in
Hajat et al’s 2002 study. They took mortality and climate data over the 20-
year period from January 1976 to December 1996 for Greater London and
found that heat-related deaths begin to increase when average daily
temperature rises above the relatively low average external temperature of
19°C with a linear relationship between deaths and temperature above 19°C.

117
The study found a 3.34% increase in deaths for every 1°C increase in
average temperature above this value. The duration of exposure to high
temperatures was also found to be an important factor in increased mortality.
5.6 Building Design for Summer Temperatures
Orme, Palmer & Irving (2003) highlighted that increased summer overheating
could lead to an increase in the use of domestic air conditioning. They stated
that the key physical house characteristics shown to influence overheating
are thermal mass, solar gain, ventilation and incidental gains and that natural
night-time cooling of the thermal mass, for example, window opening, is the
most effective way to prevent overheating. Wright et al found that during hot
spells rooms in general stayed considerably warmer than outdoors at night
and suggested that better use could be made of night ventilation. They also
called into question the wisdom of heavyweight construction for bedrooms
(Wright et al 2005).
An interesting perspective on heavyweight construction and overheating is
offered by Mavrogianni, Wilkinson, Davies et al’s 2012 study. This paper
comprised dynamic thermal simulations of 3,456 combinations of dwelling
types to establish the likelihood of high indoor summer temperatures. They
found that retrofitting roof/loft insulation and windows would reduce average
daytime living room temperatures but retrofitting wall and, to a lesser extent,
floor insulation would increase internal temperatures. They concluded that
internal solid wall insulation may potentially increase overheating during a
warm spell if no night time ventilation is provided.
Conversely, Gaze, Swainson, Hodgson et al (2008) found the potential for
overheating could be minimised in low-energy buildings by a combination of
good ventilation, shading/solar design and appropriately located thermal
mass. They downplayed the significance of thermal mass compared to air-
tightness and thermal insulation. They explained that the inclusion of thermal
mass, and controlled night ventilation to remove heat build-up within the
building fabric offers the potential to minimise the variation of internal
temperatures throughout the day and night. If night time ventilation is not
118
undertaken the thermal mass of the building fabric would become
increasingly hot over an extended period of hot weather and take a
significant period of time to cool after a change to cooler conditions. This
could exacerbate the perception of overheating and lack of ability to control
temperatures, potentially encouraging mechanical cooling options.
Beizaee, Lomas & Firth (2013) published one of the first national scale
studies of summertime temperatures in English dwellings. They recorded
temperatures in living rooms and bedrooms in 207 homes during the
relatively cool summer of 2007 and found that older homes built before 1919
and detached homes tended to be cooler than other property types. They
found that living rooms in flats were significantly warmer than other dwelling
types and top floor flats particularly susceptible to overheating. They
attributed this to modern housing being better insulated and to flats having a
reduced external wall area to volume compared to detached houses and
therefore cooling down more slowly. They surmised that their results could
be a result of external solid walls having a higher U-value than cavity walls.
They stated that higher U-values of older properties enable excess internal
heat to be lost more readily while the thermal mass causes internal air to
respond slowly to external temperature variations and internal heat gains.
In summary, the literature is not wholly clear about the potential for high
mass, low U-value construction to overheat compared to other designs.
However, in the literature reviewed there is a consistent theme of the
importance of ventilation and particularly night-time ventilation to control
overheating.
5.7 Air Conditioning
Peacock et al assessed whether predictions of higher summer temperatures
would require UK dwellings to plan for a cooling season with associated
mechanical cooling (Peacock, Jenkins & Kane 2010). They quoted evidence
from the United States which suggests that the market for domestic air
conditioning is likely to be determined by overall cooling degree days and not
extreme events such as the 2003 hot spell. They used a simulation to

119
calculate when external summer temperatures in the UK would produce
demand for domestic air conditioning. This is a function of both building
design and also how used people are to air conditioned environments outside
the home (work, leisure, transport) and therefore how normal air conditioning
is. They proposed that the two principal criteria for overheating are the
proportion of internal temperature readings that exceed 28°C (which accords
with the assumption made in this study for summer design temperatures for
living rooms) and also the number of ‘‘cooling nights’’ in a year. They quote
empirical data from He, Young, Pathan et al (2005) which states that, once
bedroom temperatures reach 23.9°C, occupants will act to reduce the
temperature. If there is air conditioning, the results of their simulation are
that, were occupants of UK dwellings to respond in the same way as
occupants of US dwellings, then 18% of homes in the UK would have
installed domestic air conditioning by 2030.
Chappells and Shove (2005) took a different view. They noted that people’s
expectations about comfortable indoor temperatures are becoming narrower
with the expectation that temperatures will be maintained between 21–23°C,
requiring ever more efficient ways of maintaining indoor temperatures. They
suggested that people’s expectations of comfort should be challenged and
that instead of further standardisation of indoor climate, people should expect
a greater diversity and variety in the built environment.
In summary, installing air conditioning in dwellings would have a significant
impact on domestic energy consumption and overall carbon emissions. It is
preferable to design out the need for air conditioning in the first place.
However, as previously discussed in relation to thermal comfort, there is also
a behavioural aspect to overheating and air conditioning. For this study,
BedZED participants were therefore asked for their perceptions about
comfort in the summer months.
5.8 Summer Temperatures in 2003
The summer of 2003 was particularly hot. Johnson, Kovats, McGregor et al
(2005) estimated 2,091 (17%) more deaths occurred in England during the

120
heatwave than the average for the same period over the previous five years.
Lomas and Kane cite statistics reported by the World Health Organisation
that there were potentially 70,000 excess deaths between June and
September across Europe as a whole in the summer 2003 heatwave (Lomas
and Kane 2013) whereas Wright et al estimated a lower total of 35,000
additional deaths across Europe with the elderly most affected by the heat
wave (Wright et al 2005). The monitoring Phase 2 of this study included the
summer of 2003 and these data are analysed for this thesis.
5.9 Summer Overheating Conclusions
Designing for summer temperatures is of growing importance given the trend
for increased summer temperatures and the impact on occupant comfort and
health of higher temperatures. It is also important for designers to design for
higher summer temperatures given that overheating could result in occupants
using more air conditioning and therefore increasing energy use and carbon
emissions from dwellings.

121
Chapter 6 Methods
6.1 Introduction
This chapter sets out the methods for testing the hypothesis, drawing upon
the earlier case studies discussed in Chapter 3. The chapter begins with the
justification for using a case study and an analysis of case study methods. It
describes the three phases of data collection used in this study. While other
studies have conducted follow-ups of occupants after they have moved into
energy efficient properties, the unique feature of this case study is the pre-
occupation data collected before the participants moved to a new
development and post-occupation data collected over a decade and
spanning design, construction, occupation and certification, together
providing a longitudinal study of one of the first generation of zero carbon
developments. Finally, the chapter sets out the methods used to classify and
analyse the data collected for this thesis.
6.2 Outline Methodology
The thesis uses a hybrid of research methods to test the hypothesis and the
primary method used is the case study. The case study selected is the
BedZED mixed-use, mixed tenure development described in Chapter 4 and
this research focuses on the housing element. The research comprises an
uncontrolled experiment with intervention: it involves monitoring the energy
use and internal temperatures of a sample of households in their original
homes and then in their new homes with social aspects evaluated through
occupant surveys.
6.3 Case Study
Yin (1994) defined a case study as an empirical inquiry that investigates a
contemporary phenomenon within its real-life context, especially when the
boundaries between phenomenon and context are not clearly evident.

122
This is relevant to this study because the boundary between the
phenomenon (the buildings monitored in the case study) and the context (the
high profile nature of the scheme, the participants attracted to the scheme)
may be blurred. It was important to measure actual building performance
because, for instance, some participants, mindful of the high profile
sustainable nature of the scheme, might have changed how they used their
dwelling to fit in with the design: they might have kept their home cooler in
winter than previously or might have worn thicker clothing instead of
increasing the internal temperature. It was important to distinguish these
contextual factors because they may challenge the assumptions made at
design stage and affect the replicability of the concept. Living in a high
profile experiment might have changed occupant behaviour because
occupants were aware of the impact of their behaviour on the environment.
Mitchell (1983) stated that the benefit of a case study is not that the features
of the subject studied are a representative sample of the population studied,
but that the rich detail that emerges in a case study provides “illuminating
insights”. One aim of this study is that by studying this case in detail,
insights into the limitations of energy modelling and other assumptions
governing design and construction of low energy housing will be uncovered
which will enable models to be improved and refined or technology and
practices changed to better achieve the theoretical potential. While the case
selected was not typical of most housing developments in the UK, the
innovative nature of the scheme made it highly suitable for testing the limits
of assumptions made in conventional energy modelling and provided useful
information for zero carbon policy and practice.
6.4 Experiment versus Observation
Under definitions put forward by Eberhardt & Thomas (1991), this study
consists of an intervention analysis. The study comprises a series of events
which are uncontrolled by the researcher but where there is an intervention,
that is, the removal of the sample from their former homes to BedZED. One
123
aim of the study is to determine whether the change in dwellings effects a
behaviour modification.
Manly (1992) stated that a potential problem with observational studies is that
a prima facie conclusion may be invalid because of the confounding effects
of uncontrolled variables. That is, there may be no way of knowing whether
an effect observed in the data is due to a change in the variable of interest, or
is instead due to changes that happen to also occur in other variables at the
same time. This is particularly relevant to this study because of the nature of
the intervention – the participants moved to a unique development which was
different in design to their previous homes. One uncontrollable element of
the study, for example, could be that energy prices may have changed during
the study period, creating changes in energy use by the occupants.
Confounding effects are addressed, as far as practical, by focusing on actual
monitored data: energy used and internal temperatures achieved (controlling
for external temperature), rather than measuring the amount spent by
participants on energy.
There was no control group in the study. It was hoped that the social
housing dwellings might form a control group since occupants within this
tenure tend to have less choice about where to live. However, the overall
number of social housing units at BedZED was small (ten) and participation
from this group in the research was modest with only two social housing
households taking part in the study. While it is possible to use national
domestic energy consumption data, such as the Digest of UK Energy
Statistics (DUKES), for comparison purposes, those data are too high level to
form a control data set. It was concluded that a control group was just not
practical for a case study of this type.
6.5 Modelling versus Monitoring
Energy modelling comprises a forecast of how buildings will perform using
computer-based simulations compared with monitoring which measures
actual performance. In their 2010 paper, Summerfield, Lowe and Oreszczyn
set out two new approaches to energy modelling called ADEPT and STEP

124
(2010a). Both models enable policy makers and consumers to assess at a
macro level whether energy reduction programmes are on track. The models
are complementary to but do not replace detailed models such as
BREHOMES which model energy consumption at a single property level.
While models are useful to assess whether policies are broadly on track and
to map trends, they are not a substitute for property level monitoring which
provides a more granular level of analysis of a group of properties.
Beizaee, Lomas and Firth described the benefits of monitoring over
modelling (Beizaee et al 2103). They stated that dynamic thermal modelling
has been used to predict the possibility of overheating for different UK house
types, constructions, occupant behaviours and climate change scenarios.
They posited that such studies cannot capture true occupant behaviour and
occupant interaction with heating and ventilation systems. The design team
for BedZED used dynamic thermal modelling but this research shows that
they did not fully predict how occupants would interact with the building
design in hot temperatures. Other modelling completed prior to development
included a generic SAP calculation for the whole scheme. And a key
element of the Phase study is the analysis of EPCs produced for the BedZED
development and which are based on SAP models.
Monitoring studies do not take place in scientific laboratories but in real
homes. As such, they are subject to unpredictable or uncontrollable human
behaviour. As Beizaee et al highlighted, occupants may move data loggers,
potentially putting them near a heat source such as in direct sunlight or near
an electronic device. And there is inherent data uncertainty if only one
logger is placed in a room without a second logger to provide a control
reading. Beizaee et al stated that future monitoring studies may be able to
make more use of digital technology such as smart meters and gateways to
provide a channel from which to collect data from wireless temperature,
occupancy and other sensors. Such technology was not available at the
time of this study. Centralised logging systems were originally proposed but
were discounted on the grounds of cost and the impact on the construction
programme.
125
Kane, Firth & Lomas’s paper suggested that models such as BREDEM do
not fully reflect how people use their homes and in particular the diversity of
use across different occupancy groups such as older, retired people and
people who work (Kane et al 2015). They posited that reliance upon these
models could misrepresent the benefits of energy efficiency measures to
some groups of society. This thesis discusses monitoring carried out on
BedZED and the limitations of SAP when applied to low energy houses.
6.6 Methods Selected to address the Research Questions
Yin (1994) stated that a case study is an appropriate choice of method where
the research study is researching a “how or why” question about a
contemporary set of events over which the investigator has little or no control.
The hypothesis for this thesis is “There is a performance gap between
predicted and actual energy performance in low energy dwellings and this is
due to occupant behaviour”. The hypothesis requires the following research
questions to be answered and these comprise the “how or why” questions
appropriate to a case study. The principal questions for this study were set
out in section 1.2 and are re-stated here:
How do the constructed units perform compared with the theoretical
design performance?
What is the difference, if any, between the constructed units and the units
as designed?
Why is there a difference?
What conclusions can be drawn about this and can the energy model or
design practices be changed to reflect this?
Have participants changed how they use energy at home as a result of
moving to the new development?

126
It is proposed to answer these questions using the following methods:
Monitoring and analysis of the performance of a sample of
dwellings with regards energy used and internal temperatures
achieved over varying time periods spanning a decade;
A longitudinal study to monitor the performance of a sample of
dwellings occupied prior to moving into the case study
development;
Comparison of the results of the case study with the original design
intent in order to assess whether the performance varied from the
design and if so, why;
Comparison of the results of the case study with the results of the
dwellings occupied prior to moving into the case study to identify
whether there are any occupant behavioural changes resulting
from moving into low energy dwellings.
The strength of the case study is its ability to deal with a full variety of
evidence – documents, surveys and observations, all of which are used in
this research study.
6.7 Statistical Testing
It is essential that limitations in the data are highlighted prior to conclusions
being drawn. Fielding and Fielding (1986) stated that if diverse kinds of data
support the same conclusion, confidence is increased. In this study, a range
of data has been collected, both quantitative and qualitative. The
confidence level of the data has been tested for validity and reliability using a
range of methods.
6.7.1 Validity
A fundamental precept of a case study is that for it to be externally valid, it
must be possible to generalise the results to a wider population of interest.

127
The importance of a case study is not that it is necessarily a representative
sample of the population, but that the findings embody some general
principles or learning that is relevant beyond the case study. Thus, while
this case selected is a unique housing development, the research questions
selected (how the dwellings perform compared to design and why there is a
difference) could be applied to any housing development.
The unique nature of the example selected may enable deeper insights to be
made. For example, there is no conventional space heating system in the
case selected. This may have affected occupants’ perceptions of comfort
more than if they had moved to a more conventionally designed scheme. It
could be difficult to determine whether comfort perceptions are based on the
perception that their new home may be cooler because there is no
conventional heating system, or whether it is indeed cooler. Therefore the
pre-occupancy phase, which surveyed participants in their previous home
and also collected energy monitoring data, tested these perceptions and
provided objective and consistent data from data loggers about how the
participants used their homes and their preferences with regards to comfort.
Although construction completed in 2002 and the principal monitoring phase
(Phase 2) completed in 2004, the continuing importance of this case study is
emphasised by Chance (2009) who states that BedZED remains one of the
most coherent visions of sustainable living in the world. Learning from low
energy developments like BedZED is essential if the UK’s carbon emission
targets are to be met. Other developments at the same scale as BedZED
are now being completed, such as the Little Kelham development in Sheffield
comprising 153 Passivhaus dwellings.
6.7.2 Reliability
To ensure that the data collected and analysed were reliable, externally
accredited and auditable data collection systems that met ISO 9002 quality
assurance standard were used where available. The National Home Energy
Rating (NHER) system surveys of the pre-BedZED properties were
undertaken by Rickaby Thompson Associates (RTA) who were fully

128
accredited NHER surveyors. And the NHER survey itself has ISO 9002
quality assurance.
Environmental monitoring within dwellings was undertaken using HOBO H8
series Temperature and RH data loggers supplied by Tempcon
Instrumentation. The H8 data loggers were accurate to ±0.7ºC and ±3% RH.
Tempcon employed a quality system registered to ISO 9002 and loggers
were supplied with calibration equipment and BoxCar Pro 4.0 software to
enable data analysis and export.
Temperature data files for each logger at each site were merged with
external temperature data by site, data and time, to form a single dataset by
Dr A J Summerfield at the UCL Energy Institute, using an automatic
import/export macro developed in SAS 9.1 for the CaRB project. Through
CaRB, this process had been tested on other datasets and enabled a direct
comparison with the results from other studies.
6.8 Longitudinal Study
A unique feature of this study was the inclusion of a measurement phase
prior to the participants taking up residence in BedZED. The purpose of this
was to track over time participants' behaviour and assess whether it changed
as a result of moving into the new dwelling. The longitudinal element of the
study enabled a baseline of participants' behaviour and preferences to be set
before moving to BedZED.
6.9 Sample
Statistical sampling was not used. There were 82 dwellings in the BedZED
development and all prospective occupants were invited to participate in this
study. It was wholly voluntary and no incentives or rewards were offered.
From these 82 dwellings, 24 households agreed to participate in the main
part of the study (Phase 2). They are referred to as “the participants” and
represent 29% of the total households. Compared to the size of other field

129
trials, the BedZED sample size falls part way between the 1980 Linford study
of 8 dwellings and the 1985 Pennyland study of 177 dwellings described in
Chapter 3.
Of the 24 participants in Phase 2, 14 agreed to take part in Phase 1 which
focused on participants' previous homes. These 14 households represented
17% of the total BedZED households. All Phase 2 participants were invited
to take part in Phase 1 but reasons for not taking part in the earlier phase
were various: some lived in shared accommodation or hostels and it would
not be possible to make a direct comparison with their sole occupancy in
Phase 2; other participants were close to completing their purchase of a
BedZED property and there was not enough time to take part in the Phase 1
survey as they were about to move.
The Phase 1 sample was further classified into three cohorts: Cohort 1 which
had an NHER building survey of their pre-BedZED home; Cohort 2 had
temperature monitoring and energy usage readings; and Cohort 3 which took
part in the occupancy survey. A full schedule of participants for each of
these Phases and Cohorts is at Table 6.1.
Table 6.1: Survey samples for each element of BedZED study
Participant Phase 1 Phase 2 All elements
Cohort 1
Building
Cohort 2 Monitoring
Cohort 3 Survey
Monitoring Survey
A
B
C
D *
E
F
G
H
J
K
L
M

130
Participant Phase 1 Phase 2 All elements
Cohort 1
Building
Cohort 2 Monitoring
Cohort 3 Survey
Monitoring Survey
N
P
Q
R
S
T
V
W
X
Z
AB
AE
Total 12 11 11 24 19 8
*Property D: energy usage data available for Phase 1 but not internal temps
For the longitudinal comparison, care was taken to ensure that results from
the same sample of participants were compared. For example, there were
11 participants in the pre-occupancy monitoring. In the longitudinal
comparison, the results from these 11 participants were compared to the
post-occupancy results from the same 11 participants.
Phase 3 comprised all BedZED properties. Energy usage data was
anonymised and was not therefore comparable to the sample used in Phase
1 and 2. The EPCs analysed for this thesis were not anonymised, enabling
a comparison with the Phase 2 sample.
Tables 6.2, 6.3 and 6.4 provide a breakdown of the BedZED sample by size
of dwelling, number of occupants in the household and tenure type.

131
Table 6.2: BedZED case study sample – size of dwellings
1 bed 9
2 bed 5
3 bed 9
4 bed 1
Total 24
Table 6.3: BedZED case study sample – number of occupants in the dwelling
1 occupant 9
2 occupants 7
3 occupants 3
4 occupants 4
5 occupants 1
Total 24
Table 6.4: BedZED case study sample – tenure type
Outright Sale 14
Shared Ownership 8
Social Housing 2
Total 24
Some details of participants’ age and gender were volunteered during the
two occupant surveys but these data were incomplete, see Table 10.2.

132
6.10 Data Used in this Thesis
Figure 6.1 summarises the three phases of data collection in the study.
Figure 6.1: Data collected for BedZED Case Study
Other data were collected but not used such as water consumption readings.
The data used in this case study are described in more detail below.
6.10.1 Phase 1
Phase 1 comprised 14 dwellings occupied by households prior to moving to
BedZED.
Level 1 NHER survey
The author commissioned Rickaby Thompson Associates (RTA) to carry out
NHER surveys on 12 properties using version 3.5/build:51 and she analysed
the results. Two further participants had volunteered for this phase but they
were living in shared accommodation and the NHER survey was not
appropriate. The NHER survey compiled details of the physical fabric of the
• NHER Level 1 Survey
• Met Office weather station temperature readings
• Dwelling internal temperature readings
• Energy usage readings
• Occupant survey
Phase 1
Sampled dwellings occupied prior to BedZED
February 2002 – October 2002
• Generic SAP calculation for BedZED development
• Met Office weather station temperature readings
• Local external weather station temperature readings
• Sampled dwelling internal temperature readings
• Dwelling electricity consumption readings
• Air tightness tests and heat loss survey
• Relative Humidity (RH) readings
• Occupant survey
• Review of design changes during construction phase
Phase 2
Sampled dwellings at BedZED
August 2002 – December 2004
• Anonymised heat and electricity meter readings, 2011-2013
• Degree days data, 2011-2013
• Energy Performance Certificates
Phase 3
All BedZED dwellings
January 2008 – July 2014

133
dwelling, its size and age, the heating system type and age, ventilation and
lighting systems. The survey includes a prediction of space heating costs
and CO2 emissions. A SAP rating was also calculated.
Dwelling Internal Temperature Readings
For Phase 1, the author commissioned RTA to install data loggers in living
rooms and principal bedrooms for an average period of nine weeks prior to
the participant moving to BedZED. The actual position of the logger
depended on furniture layouts but would typically be on a fixed shelf or piece
of furniture that wouldn’t be regularly moved. Loggers collected internal
temperature readings at 30 minute intervals. Data were downloaded by RTA
and analysed by the author.
External Weather Station Temperature Readings
Participants lived in different locations in their pre-BedZED dwellings. The
monitoring periods for the pre-occupancy phase, Phase 1, were not long
enough to warrant setting up external weather stations at each dwelling.
Accordingly, the author procured data from the Meteorological (Met) Office
for the Kenley Airfield Weather station in Surrey for the Phase 1 period. The
Kenley data were provided in the form of a daily maximum and daily
minimum reading for both temperature and relative humidity.
Energy Usage
RTA took electricity and gas meter readings when data loggers were installed
and removed in Phase 1. The data were analysed by the author.
Occupant survey
The author designed a questionnaire survey for Phase 1 participants in their
previous homes before they moved to BedZED. The survey design is
included in Appendix 3. The survey collected a mixture of quantitative data
such as the number of electrical appliances used by the household and
qualitative data about lifestyle and preferences such as whether the
participants found the dwelling warm enough. Where questions were about

134
occupant perceptions, a grading system was used to provide a consistent,
common framework for all respondents. For example, one question asked
how easy the heating system controls were to operate. The respondent is
required to grade the ease of use from 1-5 where 1 is easy and 5 is very
difficult.
RTA administered the surveys face-to-face when they carried out the NHER
surveys. Owing to the advanced construction and move-in programme there
was not enough time to pilot the questionnaire prior to using it for the Phase
1 surveys. The pre-occupancy survey included the following main headings
listed in Table 6.5. The thesis author carried out data analysis of the survey
results.
Table 6.5: Phase 1 Occupant Survey
Category Question Summaries
1 Household Details
Number and age of people in household
When home is occupied
Electrical appliances and low-energy light bulbs used
Fuel used for cooking.
2 Heating System
Ease of operating controls and whether they are adjusted
Effectiveness of controls at maintaining comfort
Comfort levels in winter, hot and cold spots in the home, whether additional forms of heating used.
3 Hot Water System
Does system supply enough hot water
Is temperature comfortable
Does occupant know how to adjust temperature.
4 Fuel Costs Does occupant know how much their fuel cost and if so, how much spent per annum on gas and electricity.
5 Ventilation Does occupant have mechanical ventilation
Does occupant open windows to improve air quality
Does occupant consider home to be draughty.
6 Other Has household experienced health problems linked to the home
Is there mould or condensation
Overall satisfaction with heating, hot water and ventilation systems
How much clothing is worn in the home during winter
6.10.2 Phase 2
Phase 2 comprised 24 BedZED dwellings and covers the design and
construction phase and the first two years of occupation.

135
SAP Rating
Arup, M&E engineers for BedZED, completed the SAP calculation. Their
generic SAP rating for the development was analysed to identify design
assumptions in comparison to the actual performance in use. The author
carried out a further SAP calculation as part of this study, using construction
drawings for a one-bedroomed flat to enable a direct comparison with the
generic rating.
Dwelling Internal Temperature Readings
As for Phase 1, internal temperatures were recorded by Tempcon HOBO
data loggers. In Phase 2, the author commissioned RTA to install two
loggers in each of the 24 sampled BedZED properties, one in the living room
and one in the bedroom. In some properties, additional loggers were sited in
the bathroom, second bedroom or sunspace. As for Phase 1, loggers were
set to record temperature and relative humidity at 30 minute intervals.
Phase 2 data were collected for almost two years and results downloaded by
RTA at approximately three monthly intervals by gaining access to the
dwellings, downloading data into the BoxCar Pro software programme held
on a laptop and resetting the loggers for the next period. The first interval
was set for six weeks to check for operating problems or defects with
individual loggers. The monitoring period of August 2002 to June 2004
enabled data collection throughout the two heating seasons of 2002-03 and
2003-04 and the hot summer of 2003. The period also allowed the high
mass construction to dry out during the first year.
There were some cases of loggers that failed and these were generally re-set
at the next data download. There were also cases where participants
moved loggers or they became lost. Again, where practical, this was
rectified at the next data download. However, the most common issue
encountered during the monitoring process was lack of access to properties
to download the data from the loggers. The data loggers stored
approximately four months of data and so if the download appointment was
missed, approximately a further month of data would be stored in the logger

136
but not the full three months of the next logging period. The impact of this
was that some data were missing from the dataset.
Table 6.6 shows the number of data downloads collected during Phase 1,
prior to participants moving to BedZED and Phase 2, after moving into
BedZED. The author supervised and managed RTA and completed data
validation and analysis.

13
7
Table 6.6: Record of Logger Data Collection for Phase 1 and Phase 2
%
Maximum potential monitoring periods 216 Total full data downloads 150 69
Total part 13 6
Total missing 53 25
RECORD OF LOGGER DATA COLLECTION
Property Ref EX A B C D E F G H J K L M N P Q R S T V W X Z AB AE
Phase 1 - Pre BedZED
Various dates part
Feb - Oct 02
Phase 2 - BedZED
Aug 02 - Oct 02 part part part part
Oct 02 - Dec 02 part part part part
Dec 02 - Mar 03 part part part LM part part
Mar 03 - May 03 part part
May 03 - Aug 03 LM
Aug 03 - Oct 03 LM
Oct 03 - Jan 04
Jan 04 - Mar 04 part
Mar 04 - Jun 04 part part
Key data uploaded part some data missing no data LM logger moved during period

138
Table 6.6 shows that 69% of data was collected successfully during the
Phase 2 monitoring period and a further 6% of partial data collected. 25%
of data were not downloaded from loggers, generally as a result of not being
able to access the property on that date. This is probably an over-estimate of
the data lost because in practice, the loggers were able to record up to four
months data.
At an early stage of designing the study, the author considered the feasibility
of installing a monitoring system with remote access to data. This would
have enabled data to be downloaded remotely and removed the need for
access to each dwelling every three months to download data, unless a fault
developed. It would have required loggers to be permanently fixed in
location which would have had the additional benefit that the loggers could
not be inadvertently moved and would have improved further the consistency
of results. This option was not pursued because at the time of designing the
study, the construction programme was so far advanced that it was not
feasible to specify, procure and install a permanent monitoring system in the
dwellings. For future studies, it is recommended that monitoring
requirements are identified at an early stage of design so that the option of
an integrated monitoring system with remote access can be fully considered.
This would minimise the access issue encountered in this study although it
would be wise to allow for some additional access to properties early in the
programme to resolve teething problems.
RTA downloaded data from loggers into the BoxCar Pro software and
exported to individual Excel spreadsheets produced for each dwelling for
each monitoring period. The spreadsheets comprised temperature and
relative humidity readings for each logger for the period. Any issues or
interventions that affected the data were recorded on the spreadsheet, for
example, that the logger had failed to launch properly or that the occupant
had moved the logger. Data was supplied to the author for validation and
analysis.

139
Data reliability was checked at the time of downloading and any perceived
issues that affected the reliability of the data were recorded on the data
spreadsheet. Further checks were made against all the data to ensure that
the data loggers had not failed or been moved but that they continued to
collect data in the same property and location. The internal temperature
readings were plotted for each property against external readings from the
Met Office weather stations (Phase 1 and first part of Phase 2) and the local
weather station set up at BedZED (second part of Phase 2). Any significant
or abrupt changes to both temperature and relative humidity readings were
investigated to ensure that the loggers were not disturbed.
External Weather Station Temperature Readings
For the first part of Phase 2, external temperature data in the form of a daily
maximum and daily minimum reading was obtained from the Met Office for
the Kenley Airfield Weather station in Surrey. In March 2003, seven months
into Phase 2, the thesis author commissioned RTA to establish a local
weather station at BedZED and, in line with the internal loggers, temperature
and relative humidity were recorded at 30 minute intervals.
Energy Usage Readings
RTA collected electricity meter readings from each sampled dwelling at each
visit to download internal temperature data. Data consisted of kWh usage
from the main meter in all dwellings and also the sub-meters that had been
installed in 16 of the dwellings. Although properties also had heat meters
installed, there were operational problems with the provision of heat from the
site CHP system. This resulted in some disruption to the CHP provision of
hot water to properties with the result that participants may have derived
more of their hot water from immersion heaters than expected and may have
used temporary space heaters. Such usage would have affected electricity
usage readings in the sample properties. Exact dates of when the CHP
system was non-operational are not known and heat data from the CHP
system during the monitoring period are not available. For properties that
had sub-meters installed, the author has carried out analysis of the energy
140
used by the immersion heaters compared to other electricity use. This
enabled her to make some assumptions about the proportion of electricity
used for heat for the Phase 2 sample.
Air-tightness and heat loss survey
During the BedZED construction process, six empty, newly-constructed
properties were pressure tested by the building contractor using a specialist
consultant to assess air tightness. The tests were undertaken prior to
completion of snagging items and handover and were made available for this
study.
At the end of Phase 2, and specifically for this study, on-site infrared
thermography and whole-house air infiltration rate tests were carried out in
one of the sampled dwellings. The purpose was to measure actual
airtightness and heat loss performance of the building fabric compared to the
design. The tests were undertaken by Sung H Hong and Dejan Mumovic of
UCL Bartlett School of Graduate Studies (Hong & Mumovic 2005). Two
separate air infiltration rate tests were carried out with the four wall openings
to the passive stack vent in both open and closed conditions. The sunspace
was excluded from the test. An infra-red camera was also used to detect
any cold air ingress along window seals while the dwelling was
depressurized forcing cold exterior air into the dwelling. The airtightness test
and infra-red thermograph were undertaken at the end of the Phase 2
monitoring period to give the high mass structure as long as possible to dry
out.
Dwelling Relative Humidity (RH) Readings
RH readings were recorded at 30 minute intervals at the same time as the
internal temperature readings by the HOBO data loggers and were
downloaded onto spreadsheets by RTA. The author analysed RH results for
the property surveyed in the heat loss and airtightness survey and the six
properties that reported condensation in the occupant survey.

141
Occupant surveys
A follow up occupant survey was undertaken at the end of Phase 2 and the
survey design is included at Appendix 4. The survey was left by RTA with
participants when the loggers were collected at the end of the study.
Participants returned completed surveys to the author by post and the author
completed analysis of the surveys. The purpose of administering two
surveys was to identify whether participants had made any adjustments to
the way in which they used their home.
The survey administered at the end of Phase 2 was broadly similar to the
Phase 1 survey but with some amendments and additions. These changes
reflected feedback during the occupancy phase and some of the emerging
findings from the data analysis, in particular, the apparent overheating of the
dwellings during hot spells which had not been foreseen before the start of
the study. In the Phase 1 survey, participants were asked only about
heating. For Phase 2, additional questions were added to ask participants
about summer comfort conditions. The survey was also adjusted to reflect
the nature of the development. For example, the open question about which
fuel was used for cooking was omitted since all dwellings at BedZED had
electric cookers installed.
The following changes were made:
1. Question 1.5 in the post-occupancy survey on the type of fuel used
for cooking was amended because all cookers and hobs were pre-
installed at BedZED and ran on electricity.
2. Additional question 2.7 added to the post-occupancy survey to ask
about comfort level of home during the summer. Additional
question 2.10 added to ask whether additional forms of cooling
were used.

142
3. Question 4.2 about the cost of fuel used was amended in the post-
occupancy survey to reflect the single fuel supply at BedZED, ie
electricity only.
4. Question 4.3 from the pre-occupancy survey requesting copies of
fuel bills was omitted from post-occupancy survey since meter
readings were taken during the occupancy period.
5. New question 4.3 added to post-occupancy survey to ask whether
having fuel dials on display made a difference to participants’ use
of fuel and appliances, since this was a design feature of the
BedZED properties.
6. Questions 5.1 to 5.3 about ventilation amended from the pre-
occupancy survey which asked whether there was a mechanical
ventilation system, how effective it was and whether the occupant
opened windows to improve air quality. In the post-occupancy
survey these questions asked whether the occupant found the
BedZED ventilation system effective and whether they opened
windows to improve the air quality and whether they opened
windows to control the temperature of their home.
7. Question 6.1 in the pre-occupancy survey which asked whether the
participants had any asthma or similar health problems that could
be associated with the living environment was amended in the
post-occupancy survey to ask whether any participants had
experienced asthma or similar for the first time since moving to
BedZED.
8. Finally at the end of the post-occupancy survey, a section was
added to enable participants to add additional comments.
A further issue considered during the survey re-design was the need to be
aware of the "goldfish bowl" syndrome of living on a high profile

143
development. There was a risk that some participants would reach survey
fatigue owing to the high levels of interest from researchers and the media in
the development. This meant that the length of the survey was a factor and
care was taken to try and minimise the size of the survey and not repeat
questions asked by other surveys. Peabody Trust managed all research
projects at the site to reduce occupant annoyance. Other surveys identified
participants’ views about the move to BedZED and the key study referred to
is the BedZED Resident Satisfaction Survey Report by Peabody Trust (Ellis
& Elvy 2004).
Review of design changes during the construction and operational phases
A review of minutes of project team meetings was undertaken to identify any
design or construction changes that may have been material to the
performance of the BedZED properties. Although not a complete record of
design changes or construction issues, minutes were available for the period
1999-2000. Additional commentary was also received from Chris Twinn,
lead energy engineer on the project design team (Twinn 2014). The literature
was also consulted (Hodge & Haltrecht 2009).
6.10.3 Phase 3
Phase 3 covered the period 2010-14 and comprised two main elements,
anonymised energy usage for the whole development and Energy
Performance Certificates (EPCs) issued on all BedZED properties sold or
leased following the 2007 legislation requiring EPCs.
Energy Usage
Anonymised heat and electricity meter readings for all BedZED properties for
the three year period 2010-2013 were compiled. The purpose of this was to
enable a truer assessment of energy use than Phase 2 which did not have
heat data. By Phase 3, the biomass CHP had been replaced with centralised
gas-fired boilers and was operating normally. Meters in individual properties
recorded actual usage of heat and electricity. These data also contributed to
the longitudinal element of the case study.

144
Peabody provided energy usage data for the whole development,
anonymised in line with Data Protection requirements. It was not therefore
possible to extract the data for the sampled properties or participants in
Phase 2. However, since the data covered the whole development they
provided evidence of the performance of the development as a whole against
design intentions.
The energy usage data were recorded at each property according to
individual household consumption, centrally collected and then billed back to
occupants. The anonymised data were supplied by Peabody’s energy
supplier and checked by Peabody staff. Some of the data comprised
estimated readings and it is not possible to distinguish actual readings from
estimated. Additionally, some data were incomplete and missing, for
example, house-type or number of bedrooms. Such readings were omitted
from the analysis. The energy data provided covered years 2010-11, 2011-
12 and 2012-13. The data supplied for 2010-11 were less comprehensive
than the data for 2011-12 and 2012-13: only 36% of the 10-11 data
comprised monitoring periods of more than 300 days compared to 69% for
11-12 and 77% for 12-13. The 10-11 data were therefore omitted from the
analysis. There is a risk that the residual data used in this study is not wholly
reliable but since the same data are also used for billing purposes by the
utility suppliers, this is considered to be a reasonable control on the level of
accuracy since occupants would challenge incorrect bills, particularly if they
were being over-charged.
The data supplied were broken down into heat and electricity for each
individual property which was described according to the house-type, e.g. flat
or maisonette and number of bedrooms and tenure, e.g. social housing. To
standardise the data to size of property, the house-type was compared with
the property sizes in the Core Building Worksheet used for this study in order
to extract the area of each property. Measurement of properties is
discussed later in the chapter.

145
Energy Performance Certificates (EPCs)
EPCs were mandated in 2007 for all dwellings sold or rented and comprise
an energy efficiency rating and an environmental impact rating measuring
CO2 emissions. Ratings are combined into a sliding scale of A – G with A
being the most energy efficient and least environmental impact. The ratings
are derived from the Reduced Data SAP (RdSAP) method for existing
dwellings (DECC 2013c). A search of the Landmark Information Group site
was undertaken to identify EPCs issued for BedZED properties, including the
Phase 2 sample. At the time of the search, 43 EPCs had been issued for
BedZED dwellings and these were all downloaded and analysed for this
study.
EPCs are issued when properties are sold or rented out and they mark the
final stage in this study which has traced occupants from before they move to
BedZED, to living at BedZED and then moving on.
6.11 Classification of Data
6.11.1 Classification of Monitoring Data for Phases 1 & 2
The author organised the data for this research according to a method
designed by Dr Alex Summerfield of UCL Energy Institute for the Warm Front
study. The data were organised into three major sets according to protocols
developed for the Carbon Reduction in Buildings (CaRB) project
(Summerfield, Lowe, Firth et al 2006). This enabled the study to benefit
from a tried and tested classification system and also capture the data in a
format that could be retained for easier comparison with other studies, see
comparisons in Chapter 8.
The three datasets were core building worksheet; core occupant worksheet;
and core logger worksheet. The information compiled on each worksheet is
shown in Table 6.7. The author organised all the data for these datasets
from the raw data collected during the study.

146
Table 6.7: Organisation of Core Data for Phases 1 and 2
Worksheet
Data
Core building worksheet Phase 1 and 2 (pre-BedZED and BedZED)
Property reference number
Postcode
Local authority area
Dwelling type, e.g. ground, mid or top floor flat
Dwelling age
Floor area m2 GIA
Number of bedrooms
Number of rooms
Logger position, e.g. bedroom, living room
Core occupant worksheet Phase 1 or 2 (pre-BedZED and BedZED)
Property reference number
Name
Postal address
Number in household
Tenure
Core logger worksheet Phase 1 or 2 (pre-BedZED and BedZED)
Property reference number
Location within property, e.g. bedroom, living room
Logger reference
Start date of logger period
Finish date of logger period
Logger period file reference
This method enabled the collection of energy monitoring data in a consistent
way and comparisons to be made between different research studies. Inter
alia, the coding structure includes categories such as detached, terrace,
purpose-built and converted flat and descriptions of which storey flats are
located on. The extent of exposed external surfaces and the size of the
property are relevant to the energy used. The coding structure is based on
house-types and requires property size data and number of bedrooms and
the occupant data sheet requires the number of occupants per household.
The measurement dataset for each logger was compiled according to the
following format: Property reference; internal location reference; logger
147
reference; start date of logger data; stop date for logger data; Excel file
reference. Each individual download of data was recorded as a separate
logger period. Generally these were three monthly with the first period being
six weeks.
Individual data files for each logger at each site were merged with external
temperature data by site, data and time, to form a single dataset. Owing to
the scale of this task, this process was carried out by Dr Alex Summerfield,
using an automatic import/export macro developed in SAS 9.1.
The BedZED CHP design calculations were predicated on property sizes and
an assumed number of occupants per property, making a direct comparison
between the design and the actual results possible. However, some of the
descriptors used in the design calculations could be clearer. For example, a
2 person flat could be a one bedroomed flat or 2 bedroomed flat. There are
merits in both the space driven method (since space heating demand is more
likely to be affected by the size of a property) and the occupant driven
method (since hot water demand is more likely to be affected by the number
of occupants). By organising available data into the Building, Occupant and
Logger worksheets, the protocol used for data classification in this study
aimed to provide the most comprehensive dataset possible.
6.11.2 Calculation of Standardised Internal Temperature
Measurements were recorded at 30 minute intervals for mean average
periods of 65 days for Phase 1 and 657 days for Phase 2. For Phase 1, this
resulted in approximately 80,000 data points per dwelling for internal
temperatures taken from the loggers in the living rooms and bedrooms. For
Phase 2 this resulted in up to circa 1,500,000 data points per dwelling for
living room and bedroom internal temperatures plus some additional data
points for second bedrooms, bathrooms and sunspaces. The exact number
of data points has not been calculated but will be lower than the figure quoted
because some the measurements were not downloaded as described earlier.

148
The difference between the external and internal temperatures is the single
most important factor affecting energy use in dwellings (Palmer, Cooper,
Armitage et al 2012). External temperatures were therefore also recorded in
at a weather station set up at BedZED from 5th March 2003, six months after
the start of Phase 2 monitoring. Prior to this site being set up, data from the
Kenley weather station were used as the nearest Met Office site to BedZED.
Two temperature variables were measured by the loggers: external and
internal temperatures. To enable analysis of the data and comparability of
the data with other time periods during the study and also other studies, it
was necessary to standardise the internal temperature readings to fixed
external temperatures. Indoor temperatures were analysed in relation to
these external temperature readings and standardised to fixed external
temperatures of 5°C, 20°C and 25°C. The average external temperature
during the heating season in Great Britain during the two heating seasons in
the Phase 2 monitoring study for this case study were 7.5°C and 7.2°C
(Palmer et al 2012) and so, the standardized temperature for the heating
season in this study at 5°C corresponds to colder external temperatures than
the UK average.
A series of standardised internal temperature curves were produced from the
external and internal temperature data. Indoor temperatures were analysed
in relation to external temperature readings and regression curves produced
for each property in the sample following methods developed by Oreszczyn
et al (Oreszczyn, Hong, Ridley & Wilkinson 2006). Indoor temperatures
were standardised to ensure comparability between properties included in
the study and to enable comparison with other studies.
For each dwelling, average results for indoor temperatures against outdoor
temperatures were produced and plotted as regression curves using
dwelling-specific regression equations for each logger location in each
property using a 95% confidence interval. In this merged form, it was
possible to generate daily or other averages and compare estimates for the
indoor temperatures across sites under standard external conditions. The

149
estimates were obtained on daily internal versus external temperature data
using a smoothed regression technique on the available data at each site
and were generated by Dr A J Summerfield of UCL Energy Institute using the
'PROC LOESS' routine in SAS 9.1.
From these curves, 24-hour mean internal temperatures were calculated to
show the internal temperatures standardised to fixed points of external
temperatures of 5°C, 20°C and 25°C. The 5°C external temperatures
represent the heating season and the 20°C and 25°C temperatures represent
summer temperatures. A daily average temperature of 25°C is very high and
enables analysis of potential overheating particularly since the BedZED
Phase 2 monitoring period for this study included the hot summer of 2003.
The internal temperature results were compared to the design temperature of
20°C for the winter period and proxy design temperatures of 26°C for
bedrooms and 28°C for living room for the summer period.
The full set of curves for Phase 1, Phase 2 and results from other studies
can be found in Appendix 5, 6 and 7 respectively. Estimates were obtained
from the smoothed curve graphs using lines drawn from the x axis at the key
points as follows:
Phase 2
Average bedroom temperatures when external temperatures were 5ºC
Average living room temperatures when external temperatures were
5ºC
Average sunspace temperatures when external temperatures were
5ºC
Average bathroom temperatures when external temperatures were
5ºC

150
Average bedroom temperatures when external temperatures were
20ºC
Average living room temperatures when external temperatures were
20ºC
Average bedroom temperatures when external temperatures were
25ºC
Average living room temperatures when external temperatures were
25ºC
Longitudinal comparison between Phases 1 & 2
Average living room temperatures when external temperatures were
5ºC
Average bedroom temperatures when external temperatures were 5ºC
The majority of the measurement for Phase 1, the pre-occupancy phase,
took place in February to April when external temperatures did not go above
20ºC.
6.11.3 Degree Days Data
It was not possible to standardise Phase 3 data to exact weather conditions
during the two year period to ensure that the periods monitored were
identical and to adjust for seasonal variations such as hot spells or heating
seasons. The data were provided on an annual basis and most of the
properties included in the data set did not include full year readings, i.e. 365
days. Approximately one third of the data for 2010-11 comprised more than
300 days of data compared to approximately two thirds for 2011-12 and three
quarters for 2012-13 comprising more than 300 days of data. 2010-11 data
were not used and to account for differing external weather conditions for the
11-12 and 12-13 data, the data were standardised to the annual number of
151
degree days. The monthly number of degree days in these three years for
the Carshalton weather station (reference IEngland183) near the BedZED
development was obtained from www.degreedays.net. Since the energy
usage data were provided as annual totals, monthly degree days data were
also consolidated into annual totals for comparison purposes. For each
category of electricity and heat, data were corrected as follows:
kWh/m2/annum degree days.
6.11.4 Measuring Property Sizes
The Phase 1 NHER surveys calculated property floor areas using Net
Internal Area (NIA). While the RICS Code of Measuring Practice (RICS
2007) prescribes standard methods of measuring floor area for industry,
there is not a formula for converting one method to another since these will
vary from building to building. An industry rule-of-thumb is that an efficient
design would produce a ratio of NIA to Gross Internal Area (GIA) of circa
85% (Davis Langdon Everest 2004) and this has been applied here. If the
actual ratio of NIA to GIA were lower this would result in lower kWh/m2
measurements for the pre-BedZED properties.
The additional data supplied were broken down into heat and electricity for
each individual property which was described according to the house-type,
e.g. flat or maisonette and number of bedrooms. This was compared with
the property sizes in the Core Building Worksheet used for this study in order
to extract the area of each property. Property sizes in the Core Building
Worksheet were taken from the architects’ measurements on drawing
schedules. These measurements are Gross Internal Area (GIA), defined by
the RICS Code of Measurement Practice as the area of a building measured
to the internal face of the perimeter walls at each floor level including internal
walls and partitions (RICS 2007). This method of measurement is in line
with the method of measurement required for dwelling dimensions in the
Standard Assessment Procedure where floor dimensions are obtained by
measuring between the inner surfaces of external or party walls, disregarding
the presence of any internal walls.

152
6.11.5 Classification of Phase 3 Monitoring Data
Phase 3 data were anonymised and property addresses were not available.
Data were standardised to property sizes. Accompanying information
included property type, which was classified into Flat, Flat Loft style, House
and Maisonette, and the number of bedrooms. Taking account of the
classification used in Phase 2 (in turn based on CaRB) property sizes taken
off architectural drawings and also the measurements in Corbey’s thesis (see
Appendix 1), assumptions were made about floor areas and these are shown
in Table 6.8.
Table 6.8: Classification of BedZED Phase 3 Data
GIA m2
1 – bed property 46.28
2 – bed property 64.68
3 – bed property 108.3
4 – bed property 154.5
6.12 Statistical Analysis Tools
A range of standard statistical tests were used in the study to analyse the
data using Statistical Analysis System (SAS) 9.1. Regression curves were
produced for each logger in each dwelling in Phases 1 and 2 of the study,
using dwelling-specific regression equations for each logger location, using a
95% confidence interval. Curves show the relationship between the external
temperatures and the internal temperatures recorded within the properties.
Microsoft Excel 2010 was used to calculate means, standard deviations and
confidence intervals on the data points drawn from the regression curves.
IBM SPSS Statistics 22 was used to produce correlations between, for
example, number of occupants and electricity used and to carry out ANOVA
tests to calculate, for example, whether differences between internal
temperatures in living rooms and bedrooms were significant.

153
6.13 Methods Conclusions
The study is unique in that it includes a pre-occupancy phase where
participants are measured and surveyed in their previous dwellings prior to
moving to the new, low-energy BedZED properties. This enabled a
benchmark to be established for each participant prior to the main study
phase when participants took up residence at BedZED and was a unique
opportunity to identify and track over time the human factors that impact on
how dwellings are used. In addition, the study was undertaken over a ten
year period allowing the buildings to be followed through the construction,
occupation and then subsequent certification at point of sale.
It had been intended to track the implementation of the design through the
construction phase to the occupancy phase but very little data were available
about the construction phase. However, a sample of air tightness tests was
available for six properties and these were compared to the air tightness test
undertaken on a completed and occupied dwelling. Project meeting minutes
from the construction phase were also reviewed and these provided insights
into design discussions.
The next chapters present the results obtained from the three phases of data
collection.

154
Chapter 7 Energy Usage Results and Analysis
7.1 Introduction
This chapter presents the results and analysis of energy usage at BedZED
from Phases 2 and 3 of the study, enabling a comparison of BedZED
performance to the design and with reference to the Phase 1 pre-BedZED
dwellings. The results contribute evidence towards answering the first three
research questions for this study: how do the constructed units perform
compared with theoretical design performance; what is the difference if any;
and why is there a difference.
Section 4.13 discussed the original design for energy usage at BedZED,
which was 7,460 kWh/annum for a typical property or 75 kWh/m2/annum.
7.2 Phase 1 Energy Usage
The Phase 1 (pre-BedZED) electricity results shown in Table 7.1 are from
three pre-BedZED properties (B, D, R) that had separate gas heating
systems and where heat and electricity were measured separately. Other
properties had electrical heating and these readings could not be split
between heat and electricity. Other properties’ readings were missing.
Phase 1 heat data comprised gas usage in three properties (D, J, R),
including gas used for cooking as well as heat. Monitoring data were
available for these properties for just over 8 weeks except for property D
where data was collected for just over two weeks. Phase 1 data are not
adjusted for degree days.
Table 7.1: Phase 1 pre-BedZED weekly energy usage
sample size Mean kWh/week
Electricity 3 130.0
Heat 3 175.7

155
7.3 Phase 2 Energy Usage
7.3.1 Phase 2 Data Issues
The energy usage data collected during Phase 2 covered two heating
seasons. Electricity usage readings were taken at the 24 properties
included in the Phase 2 sample, including sub-meters where these were
available, for example, immersion heater, lighting circuits. Heat data were
not available either at the property level or centrally from the CHP plant
owing to the problems with the CHP plant during the Phase 2 period,
discussed more fully in Chapter 11. These operational problems meant that
the supply of heat to BedZED properties was inconsistent during the Phase 2
monitoring period leading to the possibility that additional electrical demand
could have been recorded at the individual property level, either from the
immersion heater being a back-up for hot water or additional heating being
used in the property.
7.3.2 Phase 2 Electricity Usage Results
Table 7.2 shows mean overall electricity usage by the BedZED sample
during Phase 2.

156
Table 7.2: BedZED Weekly electricity usage
kWh/week m2
NIA
kWh/m2/week
NIA Number
occupants in household
Number bedrooms
Number appliances
A 84.2 90.9 0.9 2 3 9
B 49.9 39.4 1.3 1 1 3
C 56.4 39.4 1.4 3 1 3
D 85.5 92.4 0.9 4 3
E 58.6 58.7 1.0 2 2 5
F 34.3 39.4 0.9 1 1 2
G 70.6 92.4 0.8 2 3 6
H 88.3 90.9 1.0 4 3
J 39.3 39.4 1.0 1 1 6
K 44.9 39.4 1.1 1 1 4
L 46.8 39.4 1.2 1 1 6
M 31.5 39.4 0.8 1 1 5
N 48.7 52.6 0.9 1 2 6
P 58.5 92.4 0.6 3 3 7
Q 52.9 59.1 0.9 2 2 5
R 166.4 131.3 1.3 4 4 8
S 71.1 59.1 1.2 3 2 7
T 48.6 39.4 1.2 1 1 4
V 45.4 92.4 0.5 4 3 3
W 60.5 92.4 0.7 2 3
X 45.9 92.4 0.5 5 3
Z 132.7 92.4 1.4 2 3
AB 36.5 39.2 0.9 1 1
AE 70.5 45.5 1.5 2 2 4
Mean 63.7 66.2 1.0 2.2 2.1 5.2
The number of appliances is recorded only for those participants who
completed the post-occupancy survey. Even with some heat usage captured
in the electricity readings, the mean average usage of 63.7kWh per week is
broadly in line with the design estimate of 3,290kWh/annum for a typical
property (63.3kWh/week).

157
Table 7.3 shows the proportion of energy used for electricity only (main
power supply and lighting) and for heat (immersion heaters) for the 15 out of
24 properties that had sub-meters.
Table 7.3: BedZED electricity usage by sub-meter
Property Main
% kWh
Lighting
% kWh
Total elec
% kWh
Immersion (heat)
%kWh
A 90.08 2.24 92.32 7.68
B 60.73 0.62 61.35 38.65
E 75.88 4.11 79.98 20.02
G 85.02 3.63 88.65 11.35
H 66.69 1.24 67.92 32.08
J 89.04 4.43 93.46 6.54
K 91.10 1.19 92.29 7.71
L 80.44 1.10 81.54 18.46
M 75.16 2.14 77.30 22.70
N 76.54 1.82 78.36 21.64
Q 83.66 0.59 84.25 15.75
R 84.89 3.29 88.18 11.82
S 84.55 2.76 87.32 12.68
T 69.19 4.79 73.98 26.02
Z 84.50 5.69 90.19 9.81
Min 60.73 0.59 61.35 6.54
Max 91.10 5.69 93.46 38.65
Mean 79.83 2.64 82.47 17.53
Std Dev 8.97 1.61 9.45 9.45
If the above analysis is typical for the sample, then 18% of the electricity
readings for Phase 2 were heat and not electricity. Adjusting the mean
average electricity use in Table 1 gives the results shown in Table 7.4.

158
Table 7.4: BedZED Phase 2 electricity usage adjusted for heat
kWh/week
Phase 2 readings from Table 7.1 63.7
Adjustment factor from Table 7.2 82.47%
Adjusted Phase 2 result 52.53
Design 63.3
Actual usage compared to design -17%
Table 7.4 shows that the electricity usage at BedZED was 17% lower than
the design if the electricity readings are adjusted for heat. Since heat
readings from the CHP were not available during Phase 2, it is not possible
to calculate the total energy usage.
Analysis of the number of occupants in each dwelling compared to the
weekly kWh consumption (adjusted as set out in Table 7.4) was undertaken
for the Phase 2 data and the results presented in Figure 7.1. Two outlier
properties (R and Z) with a much higher kW/week were excluded from this
comparison. Properties R and Z used a mean average of 166.4 and 132.7
kWh electricity per week respectively. Property R was the largest property
by floor area in the sample at 154.5m2 (GIA) and property Z the second
highest at 108.7m2 (GIA). Nine properties in total were the same size as
property Z.

159
Figure 7.1: BedZED mean electricity consumption compared to number of occupants
As expected, Figure 7.1 illustrates some correlation between the number of
occupants and electricity use.
The breakdown of appliances used by the BedZED sample is shown in
Figure 7.2. The most popular appliance is a washing machine, followed by a
television. “A-rated” white goods were provided as standard in BedZED
homes including fridge freezers and washing machines.
0
1
2
3
4
5
6
0
10
20
30
40
50
60
70
80
90
100
Nu
mb
er
occ
up
ants
kWh
pe
r w
ee
k
Individual properties
kWh per week Number Occupants

160
Figure 7.2: Appliance use at BedZED
7.4 Phase 3 Energy Usage at BedZED
For Phase 3, electricity and heat data were analysed for all BedZED
dwellings for the two year period from 2011-12 to 2012-13.
7.4.1 Phase 3 Data Issues
Following the completion of Phase 2, some live-work units were converted
into dwellings. The data supplied for Phase 3 did not distinguish between
live-work units or dwellings. The significance of a change of use from live-
work to residential is considered to be that properties were occupied for
shorter periods than the original design; live-work units would be expected to
be occupied continuously whereas dwellings may be vacant during the day if
all occupants were away at school or work.
7.4.2 Phase 3 Energy Usage Results
Table 7.5 summarises heat, electricity and total energy usage per property
for Phase 3.
0
10
20
30
40
50
60
70
80
90
100
% r
esp
on
de
nts
re
gula
rly
usi
ng
app
lian
ce
10
2
19
4
10 9
3
11
17
10
4

161
Table 7.5: BedZED Phase 3 Average Energy Usage per property
Design
kWh/annum
2011-12
kWh/annum
2012-13
kWh/annum
Mean
kWh/annum
Difference of
mean to design
Heat 4,170 4,918 5,769 5,344 +28%
Electricity 3,290 2,553 2,740 2,647 -20%
Total 7,460 7,471 8,509 7,990 +7%
Table 7.5 shows that electricity usage is 20% less than the design (Phase 2
data showed 17% lower than design), heat usage is 28% higher and overall
energy usage 7% higher than the design. There is a reasonable level of
confidence in these data since the electricity results for Phase 2 and Phase 3
are broadly comparable and the Phase 3 data were used by the energy
supplier for billing purposes. The overall energy usage of 7% higher than
design is considered to be a successful outcome.
The data shown in Table 7.5 have not been standardised to account for the
different sizes of property. Table 7.6 shows the data standardised to m2.
Table 7.6: BedZED Phase 3 Energy Usage standardised for floor area
Design
kWh/m2/annum
2011-12 kWh/m
2/annum
2012-13 kWh/m
2/annum
Mean
kWh/m2/annum
Difference of mean to design
Heat 76.24 90.72 83.48
Electricity 40.59 42.77 41.68
Total 75 116.83 133.49 125.16 +67%
Table 7.6 gives very different results to the results in Table 7.5 which are not
standardised to floor area. Assumptions about property size could be one
reason. In the original concept design, a typical BedZED dwelling was
assumed to be 100m2. This was also the proxy used for the indicative SAP
rating. If the 100m2 proxy were used for the mean average energy use of
7,990 kwh/annum shown in Table 7.5, this would give a result of 80
kWh/m2/annum, only 7% more than the design of 75 kWh/m2/annum stated
in the concept design documents (Bioregional 1999 p20). However, the
difference between the concept design and actual type, number and size of

162
properties built can be materially different. This is discussed further in
section 7.7.1.
The Phase 3 data supplied were not standardised to weather conditions.
To assess whether there was any difference between the two years’ data and
check the reliability of the mean average used above, Table 7.7 shows the
data checked against degree days.
Table 7.7: BedZED Phase 3 measured energy usage per degree day
2011-12 2012-13 Difference Difference
%
Electricity kWh/annum 2,553 2,740 187 +7.3
Heat kWh/annum 4,918 5,769 851 +17.3
Degree days 1,594 2,159
Electricity kWh/ degree day 1.60 1.27 0.33 -26.0
Heat kWh/degree day 3.09 2.67 0.42 -15.7
Table 7.7 shows that when the data are corrected for degree days, the
additional demand for heat in 2012-13 was lower than the colder external
temperatures, a reduction of 15% in contrast to the absolute increase in heat
demand of 17.3%. Electricity demand is not generally related to external
weather conditions but the adjusted data are included here for completeness.
Further analysis was carried out to establish whether there were any
differences between property types, standardising data for m2. Table 7.8
shows the results and these are summarised in Figure 7.3.

163
Table 7.8: Phase 3 actual energy usage by property type standardised for floor area
Property Size 2011-12 Number Properties
2011-12
kWh/m2/per
annum
2012-13 Number Properties
2012-13
kWh/m2/per
annum
Mean
kWh/m2/per
annum
Heat
1 bedroom 40 86.48 36 108.41 91.03
2 bedrooms 24 92.05 26 84.31 82.28
3 bedrooms 24 45.52 19 66.97 49.04
4 bedrooms 3 59.02 2 81.32 72.04
Electricity
1 bedroom 40 50.85 36 50.31 52.76
2 bedrooms 24 42.71 26 48.37 56.50
3 bedrooms 24 23.01 23 25.88 24.19
4 bedrooms 3 27.39 2 28.54 31.93
Total Energy
1 bedroom 137.33 158.72 143.79
2 bedrooms 134.76 132.67 138.78
3 bedrooms 68.53 92.85 73.23
4 bedrooms 86.41 109.86 103.97
Figure 7.3: Phase 3 energy usage by property type standardised for floor area
0
20
40
60
80
100
120
140
160
1 bed 2 bed 3 bed 4 bed
kW
h/m
2/a
nn
um
Heat Electricity

164
It could be argued that the results in Table 7.8 and Figure 7.3 show the
impact on energy use of the trend towards smaller households identified in
Table 2.1. There is a marked reduction in total energy use by floor area for
three- and four-bedroomed properties compared to one- and two-bedroomed
properties. However it must be noted that the number of four-bedroomed
properties in this sample was very low. The results show the impact of
smaller dwellings/smaller households which are far more intensive per m2
than larger households.
7.5 Overall BedZED Energy Use Summary
Table 7.9 summarises electricity usage for the three phases of this study.
Table 7.9: BedZED Study Electricity Usage for three Phases
sample size kWh/week
BedZED design 63.3
Phase 1 pre-BedZED 3 130.0
Phase 2 - BedZED 24 52.5
Phase 3 - BedZED 87-91 51.0
The Phase 1 results in Table 7.9 show that for these properties, BedZED
comfortably achieved its design intention to reduce electricity consumption by
10%. Phase 2 results are based on all 24 properties included in the
BedZED monitoring sample over the near two years’ monitoring period.
Phase 3 data cover two years’ usage and are based on electricity meter
readings for the whole development, including some properties that were
formerly live-work units. The results of both Phase 2 and 3 confirm that
BedZED met the design requirements for electricity use.
Table 7.10 shows heat energy usage for Phases 1 and 3. Heat data was not
available during Phase 2.

165
Table 7.10: BedZED Study Heat Usage for three Phases
Sample Size kWh/week
BedZED design 80.2
Phase 1 pre-BedZED 3 175.7
Phase 2 - BedZED n/a
Phase 3 - BedZED 83-91 102.8
The results for Phase 3 in Table 7.10 show that BedZED did not achieve the
design heat usage of 80.2kWh. However, the higher heat usage is offset in
part by the lower electricity consumption. Overall the energy design target
for an average dwelling was 7,460 kWh/annum or 143.46 kWh/week. From
the Phase 3 data, an average BedZED dwelling achieved 7,990 kWh/annum
or 153.8kWh/week suggesting that overall BedZED exceeded the designed
energy use by 7%. To put this in context, this is only a third of mean average
domestic energy usage of 26,709 kWh in 2011 (Table 2.1).
Analysing the data by floor area suggests that BedZED properties performed
worse than the total usage data, see Table 7.11.
Table 7.11: BedZED Total Energy Usage compared to Design, standardised to m2
1995 Building Regs
BedZED Design BedZED
Phase 3
Total kWh/m2/annum
Heat and Electricity
163 75 125.2
Table 7.11 shows that, when standardised to m2, BedZED energy use
exceeded the design by 67%, although it performed 23% better than other
standard new build properties of the time. As previously discussed, the 75
kWh/m2/annum design target for energy use at BedZED was based on an
indicative property size of 100m2.
Hodge and Haltrecht’s energy usage results compiled seven years after the
construction was completed is shown in Table 7.12. This study took meter
readings from 56 properties in January and March 2007 and then November
and January 2008. Electricity and heat data were compiled for periods of

166
between 126 and 434 days and then aggregated to calculate annual
consumption.
Table 7.12: Hodge & Haltrecht BedZED Energy usage
Mean kWh/dwelling/annum Mean kWh/m2/annum
Electricity 2,579 34.4
Heat 3,526 48.0
Total 6,105 82.4
Source: Hodge & Haltrecht (2009) combined from tables on pp16, 17 & 18
The Hodge results in Table 7.12 show that overall average energy usage at
82.4 kWh/m2/annum was close to the designed performance of 75
kWh/m2/annum. Hodge and Haltrecht adjusted the total units of electricity
and heat consumed to get a mean average consumption per day and these
results were then multiplied by 365 to provide an annual consumption (Hodge
& Haltrecht 2009). The results were therefore not corrected for degree days
and there is a risk that some of the results were collected principally for the
March to November 2007 period, that is, outside the main heating season.
By the time the Hodge study was undertaken, hot water was being supplied
by a communal gas-fired boiler and circa 20% of electricity was being
generated by the photovoltaics with the remainder being taken from the
national grid although there continued to be problems with the meters, some
of them being out of action.
Figure 7.4 plots Phase 3 energy usage against design, standardised to m2,
and compared to the Building Regulations standard applicable at to BedZED
and the Hodge results.

167
Figure 7.4: Design and actual energy use at BedZED
Figure 7.4 shows that BedZED performed better than the Building
Regulations in force at the time of design but it did not meet the design
performance of 75kWh/m2 per annum stated in the design concept
documents.
7.6 BedZED Energy Performance Certificates (EPCs)
Energy Performance Certificates (EPCs) were mandated in 2007 for all
dwellings sold or rented and comprise two ratings, an energy efficiency rating
and an environmental impact rating, which measures CO2 emissions.
By November 2014, 43 EPCs for BedZED undertaken by 25 different EPC
assessors had been uploaded to the national EPC Register, hosted by the
Landmark Information Group. This represents approximately half of the
original 82 dwellings (some live-work units were subsequently converted to
dwellings). A data summary for the 43 EPCs is provided at Table 7.13.
163
75 82.4
125.2
0
20
40
60
80
100
120
140
160
180
1995 Bdg Regs BedZED Design Hodge Phase 3
kWh
/m2 /
ann
um

168
Table 7.13: Summary of BedZED EPCs
Floor Area
Energy Efficiency Rating
Environmental Impact
Energy Use kWh/m2 CO2 emissions
tonnes/annum
m2 Current Potential Current Potential Current Potential Current Potential
Mean 67.5 76.5 78.8 80.1 81.0 175.4 174.5 1.7 1.7
Max 114.0 95.0 100.0 108.0 111.0 412.0 370.0 5.0 4.5
Min 34.0 26.0 32.0 48.0 52.0 34.0 0.0 -0.9 -0.4
Std Dev
24.4 11.2 10.6 12.7 12.1 77.2 84.3 1.2 1.1
An analysis of the certificates shows a surprising variation of ratings, given
that BedZED was built to a single design standard. While occupiers may
have made some alterations to BedZED properties since moving in, it is not
considered likely that occupant alterations would have resulted in such
diverse ratings. Figures 7.5 and 7.6 show the energy efficiency and
environmental impact ratings respectively for the 43 certificates and Figure
7.7 combines the results into a single chart.
Figure 7.5: Energy Efficiency Ratings from BedZED EPCs
0
10
20
30
40
50
60
70
80
90
100
1 3 5 7 9 11 13 15 17 19 21 23 25 27 29 31 33 35 37 39 41 43
EPC
En
erg
y Ef
fici
en
cy R
atin
g
Individual BedZED property EPCs

169
Figure 7.6: Environmental Impact (CO2) Ratings from BedZED EPCs
Figure 7.5 shows that the lowest energy efficiency rating was 26 and the
highest 95. Figure 7.6 shows that Environmental Impact (CO2) ratings range
from 48 to 108. While the distribution of ratings looks broadly similar for
both sets of ratings, there is some variation between the two different sets of
ratings. Figure 7.7 consolidates the ratings into a single chart and this shows
the differences at a property level.
0
20
40
60
80
100
120
1 3 5 7 9 11 13 15 17 19 21 23 25 27 29 31 33 35 37 39 41 43
EPC
En
viro
nm
en
tal I
mp
act
(CO
2 R
atin
g)
Individual BedZED property EPCs

170
Figure 7.7: Combined Energy Efficiency and Environmental Impact (CO2) Ratings from BedZED EPCs
From Figure 7.7, it can be seen that, for example, the highest ratings for
environmental impact are not the same properties that score highest for
energy efficiency. Property 38 has the highest environmental impact rating
and property 43 has the highest energy efficiency rating.
To provide some context, the number of new dwellings registered in 2013
(DCLG 2014c) was analysed. Of the 141,467 certificates issued, 68% were
given an energy efficiency rating A (the highest rating) or B compared to 30%
(13 number) of the BedZED dwellings which were completed in 2002. 83%
of the new dwellings registered were given an environmental impact rating
based on CO2 emissions of A (the highest) or B compared to 37% (16
number) of BedZED dwellings. It is worth noting that BedZED would be
treated as existing dwellings and not new-build by EPC surveyors.
The overall ratings for the BedZED dwellings are summarised in Table 7.14.
0
20
40
60
80
100
120
1 3 5 7 9 11 13 15 17 19 21 23 25 27 29 31 33 35 37 39 41 43
Energy Efficiency Rating Environmental Impact (CO2) Rating

171
Table 7.14: BedZED EPC Ratings Summary
Energy Efficiency
rating
A
92+
B
81-91
C
69-80
D
55-68
E
39-54
F
21-38
G
1-20
Total
Number 4 9 24 5 0 1 0 43
Environmental Impact rating
A
92+
B
81-91
C
69-80
D
55-68
E
39-54
F
21-38
G
1-20
Number 9 7 22 3 2 0 0 43
Variations between assessors’ ratings of energy used by BedZED properties
were also found. Figure 7.8 shows that the ratings ranged from 34
kWh/m2/annum to 412 kWh/m2/annum. The actual kWh/m2/annum
calculated from Phase 3 data and the design kWh/m2/annum are included by
way of comparison.
Figure 7.8: Estimated Annual Energy Use from BedZED EPCs
It is interesting that Figure 7.8 shows that the mean EPC rating at 175.3
kWh/m2/annum is higher than 163 kWh/m2/annum, the standard produced by
new dwellings built to the 1995 Building Regulations in operation at the time
BedZED was built. One reason for such variation could be the unique design
features of BedZED which energy assessors may not be familiar with, for
0
50
100
150
200
250
300
350
400
450
1 3 5 7 9 11 13 15 17 19 21 23 25 27 29 31 33 35 37 39 41 43
kWh
/m2
pe
r an
nu
m
Individual BedZED property EPCs
Series1 Actual Energy Use 125.2 kWh/m2 Mean EPC 175.3 kWh/m2
Design Energy Use 75 kWh/m2

172
example, the centralised boilers providing heat principally in the form of hot
water and the absence of radiators and traditional controls within the
dwellings. For example, EPCs carried out by different assessors were
compared for two semi-detached houses with similar floor areas (81m2 and
88m2). One assessor calculated the energy use at 412 kWh/m2/annum
(property 43 in Figure 7.8). A second assessor calculated the energy use to
be 65 kWh/m2annum (property 4 in Figure 7.8). If a ±10% tolerance were
applied to the EPC estimates of energy use (actual energy use 125
kWh/m2annum), 11 EPCs are within tolerance, which represents only 26% of
the total analysed.
Table 7.15 illustrates a similar variation in the assessment of energy
efficiency performance in the component elements of BedZED construction.
Table 7.15: Building Element Energy Efficiency from BedZED EPCs
1*
Very Poor
2*
Poor
3*
Average
4*
Good
5*
Very Good
Walls 41 2
Roof 14 6
Windows 9 34
Main Heating 6 1 2 34
Main Heating Controls 14 22 3 4
Hot Water 5 4 8 24 2
Count 25 27 36 143 4
A more detailed analysis of the description of building elements given in the
EPCs highlights considerable variability in element descriptions: ten
certificates stated properties were fully triple glazed compared to 33 that
stated double glazing. It is surprising that, given that the windows were
designed to a very high specification and all windows being triple glazed
except the double glazed windows on the southern aspect (average U-value
1.0W/m2K) that none of the certificates assessed the windows as Very Good.
Table 7.16 shows the considerable variability in the way in which assessors
described the main heating systems in the BedZED properties.

173
Table 7.16: Description of Main Heating System from BedZED EPCs
Number Description in EPC
4 No system present, electric heaters assumed)
1 Electric storage heaters
1 Room heaters, electric
2 Boilers and radiators, electric
1 Warm air, electric
24 Community scheme
6 Community scheme with CHP
2 Community scheme with CHP and mains gas
1 Air source heat pump, warm air electric
1 Ground source heat pump, warm air, electric
It is notable that only two assessors specifically cited that the central boiler
system uses mains gas although the assessors that produced the 30 EPCS
that cite Community Scheme and Community scheme with CHP may have
assumed they were gas-fired but they did not select that more detailed
description when compiling the EPC. In contrast, nine assessors state that
the heating system is electrically powered (the first five descriptions on the
list above).
The component with the most varied descriptions in the BedZED EPCs is
heating controls. Table 7.17 shows this variability.

174
Table 7.17: Description of Main Heating Controls from BedZED EPCs
Number Description in EPC
4 None
1 No time or thermostatic control of room temperature
1 Manual charge control
2 Room thermostats only
3 Programmer and room thermostat
6 Flat rate charging, room thermostat only
7 Flat rate charging, no thermostatic control of room temperature
7 Flat rate charging, programmer and room thermostat
2 Flat rate charging, programmer, no room thermostat
6 Charging system linked to use of community heating, room thermostat only
1 Charging system linked to use of community heating, programmer and room thermostat
3 Unit charging, programmer and TRVs
The absence of a traditional heating system and heating controls is unusual
for recently constructed buildings but a simple internet search would quickly
provide clues to the unique scheme design.
Another factor that may explain these results is the format of the Reduced
Data SAP (RdSAP) method for existing dwellings (DECC 2013c) which is
used to calculate EPCs for existing buildings. The fields provided do not lend
themselves easily to BedZED element features. For example, in Table S6
Wall U-values in the RdSAP (DECC 2013c p131), the maximum cavity filled
thickness is 200mm and the best possible U-value in the whole table is 0.12
W/m2/K compared to the 300mm filled cavity and 0.1 W/m2/K of the BedZED
wall design. There is a similar challenge with ground floor insulation (Tables
S11 and S12), with the best performing choice being 150mm of insulation at
a U value of 0.22 W/m2/K compared to the 0.1 W/m2/K of the BedZED floor
design which is also achieved by 300mm of insulation. And for heating
controls, the SAP 2012 guidance directs assessors to Section 9.14 which
sets out a series of conditions that must be met for time and temperature
zone control. These conditions assume, for example, that if hot water is
heated by the same device as space heating, then there are separate

175
controls. It is possible to see that assessors might find it challenging to
assess the heating system at BedZED using this standard format.
Eight of the 43 properties were included in the BedZED Phase 2 sample
used in this study and the results for these eight properties are summarised
in Table 7.18.
Table 7.18: EPCs issued for Phase 2 BedZED properties
Property Date of Certificate
Total Floor
Area m2
Energy Efficiency
Rating
Environmental Impact Rating
Energy Use
kWh/m2
CO2
emissions
tonnes/year
A 29/01/2009 109 81 80 133 2.3
B 23/03/2011 47 82 101 198 -0.1
C 01/12/2011 35 71 74 229 1.6
Q 16/09/2009 67 73 60 331 3.4
S 11/06/2012 58 69 73 182 2
T 25/05/2011 34 73 77 208 1.4
V 19/03/2010 85 58 72 215 2.8
AB 10/01/2013 46 75 86 170 0.9
Mean 60.1 72.8 77.9 208.3 1.8
Table 7.18 shows a range of energy efficiency ratings from 58 to 82 and
energy use from 133 kWh/m2 to 331 kWh/m2 for the sample of eight. The
mean average energy use for the 43 properties is 175.4 kWh/m2 and for the
sample of eight above it is 208.3 kWh/m2. This contrasts with the Phase 3
results from this study which show that the overall energy use for BedZED is
125.2 kWh/m2. The EPCs are overstating the amount of energy used by
BedZED dwellings.
There was also some discrepancy between property sizes with the sizes on
the EPCs varying by -13 to +20%. This would also affect the calculation of
the kWh/m2, adding to the recurring issue of how property sizes are
calculated in energy assessments. The EPC for property B states that the
property contributes -0.1 tonnes of CO2 emission per annum and that the
property benefits from biomass community heating and solar PV. This is

176
incorrect as at the time of the EPC, the biomass CHP had been switched to a
gas-fired CHP. The surveyor was therefore incorrect in his assumptions.
In conclusion, there is inconsistency between assessors completing EPCs.
Many of the surveyors do not view the absence of a conventional space
heating system as a positive attribute and score the lack of controls over the
heating and hot water systems poorly. While these scores appear to be
driven primarily by the way that the EPC standard template is set up, it is
interesting to compare these low scores to the BedZED participants’ views
about their control over heating and hot water systems in the occupancy
surveys’ results in Chapter 10.
7.7 Energy Usage Discussion
The trend towards smaller households and the potential impact on overall
energy demand were discussed in Chapter 2. The analysis of BedZED
energy usage illustrates the impact of single person living and that potentially
smaller households will not proportionately use less energy per m2. There
are some possible explanations for the difference between the design
assumptions and actual usage and these are discussed in the following
sections.
7.7.1 Property Sizes
For the initial BedZED energy design, the engineers used a schedule of
property areas provided by the architects to calculate energy requirements
making high level assumptions about the number of occupants and floor
areas. The aim was a realistic average to allow sizing of the plant, pipework,
etc (Twinn 2014). It is difficult subsequently to apply these assumptions
directly to actual properties and occupants. For example the engineers
refer to a flat with a maximum capacity of two people and a predicted number
of occupants as one. For this study, this is assumed to be a one-bedroomed
flat.
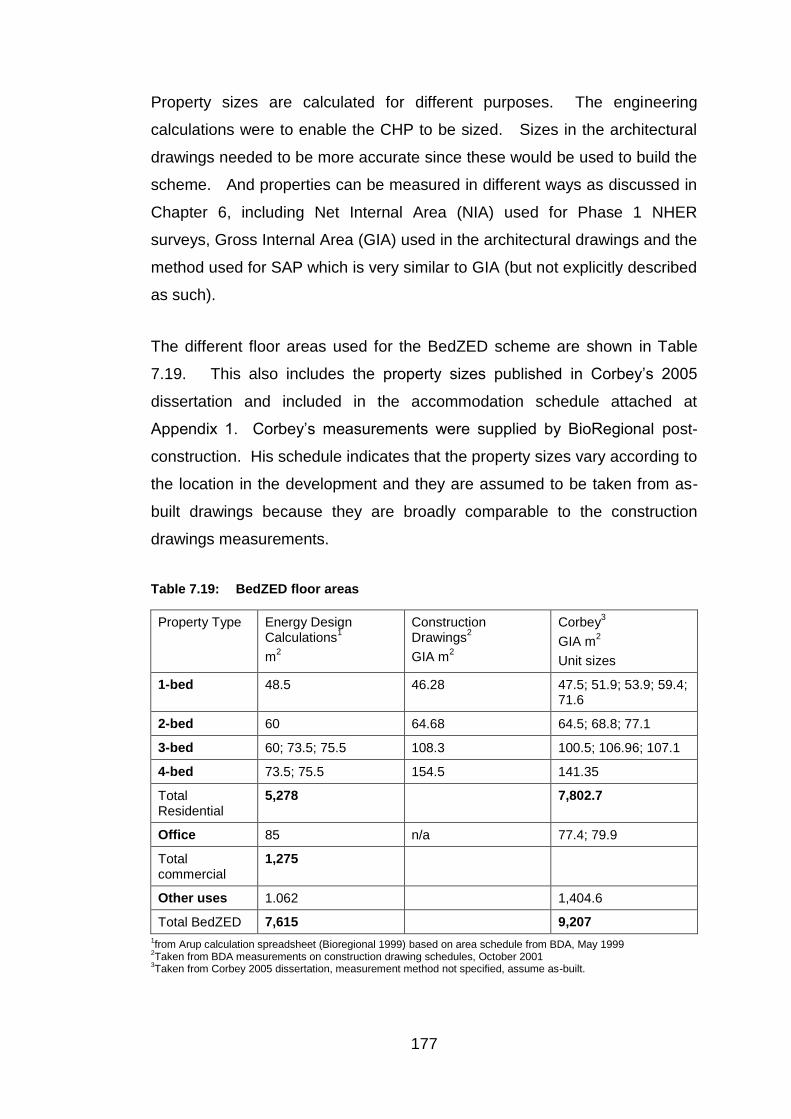
177
Property sizes are calculated for different purposes. The engineering
calculations were to enable the CHP to be sized. Sizes in the architectural
drawings needed to be more accurate since these would be used to build the
scheme. And properties can be measured in different ways as discussed in
Chapter 6, including Net Internal Area (NIA) used for Phase 1 NHER
surveys, Gross Internal Area (GIA) used in the architectural drawings and the
method used for SAP which is very similar to GIA (but not explicitly described
as such).
The different floor areas used for the BedZED scheme are shown in Table
7.19. This also includes the property sizes published in Corbey’s 2005
dissertation and included in the accommodation schedule attached at
Appendix 1. Corbey’s measurements were supplied by BioRegional post-
construction. His schedule indicates that the property sizes vary according to
the location in the development and they are assumed to be taken from as-
built drawings because they are broadly comparable to the construction
drawings measurements.
Table 7.19: BedZED floor areas
Property Type Energy Design Calculations
1
m2
Construction Drawings
2
GIA m2
Corbey3
GIA m2
Unit sizes
1-bed 48.5 46.28 47.5; 51.9; 53.9; 59.4; 71.6
2-bed 60 64.68 64.5; 68.8; 77.1
3-bed 60; 73.5; 75.5 108.3 100.5; 106.96; 107.1
4-bed 73.5; 75.5 154.5 141.35
Total Residential
5,278 7,802.7
Office 85 n/a 77.4; 79.9
Total commercial
1,275
Other uses 1.062 1,404.6
Total BedZED 7,615 9,207
1from Arup calculation spreadsheet (Bioregional 1999) based on area schedule from BDA, May 1999
2Taken from BDA measurements on construction drawing schedules, October 2001
3Taken from Corbey 2005 dissertation, measurement method not specified, assume as-built.

178
Table 7.19 shows that the original concept energy design calculations for the
development were based on a far smaller buildings footprint of 7,615m2 than
the actual built development at 9,207m2. Although there are differences
between the construction drawing measurements and the as-built drawings,
the unit sizes are broadly aligned. However when compared with the property
sizes assumed for the engineering calculations, there is a considerable
variation between the size of the larger dwellings which are understated in
the engineering calculations resulting in an under-estimate of the residential
footprint of circa 21%. The engineering calculations did include an additional
20% contingency for sizing the CHP and so this is unlikely to have resulted in
an undersized CHP system. However, this comparison does illustrate the
challenge in producing reliable data about energy use at the early feasibility
stage. Then as designs are developed in the detailed design stage, the
overall size of buildings and therefore the heat and electricity demand can
change considerably from original assumptions at the feasibility stage.
Section 7.5 found that energy usage was broadly in line with design but the
usage per m2 was found to be higher than the design metric of 75
kWh/m2/annum. That design metric was modelled on a typical dwelling size
of 100m2. It can be seen from Table 7.19 that the total residential floor area
of 5,278m2 used in the energy design calculations was understated since that
floor area would equate to 53 dwellings, much lower than the actual 82
dwellings that were built.
The difference between the engineering estimate of size and the others does
not explain the higher actual kWh/m2 compared to design. If anything, the
smaller footprint for the engineering calculations would have increased the
design kWh/m2. What this does show is the need to update design targets
that are set at an early stage of the design using an indicative number of
properties and an indicative dwelling size as the design is developed.

179
7.7.2 Number of Occupants
The monitoring data and surveys undertaken in Phase 2 were a sample of
the whole development, 24 dwellings out of a total of 82. Some information
about the number of occupants was collected in the post-occupancy surveys
but the information was not comprehensive. However, the Corbey study
included the number of occupants at BedZED in 2005 and so his more
comprehensive data are compared to the assumptions made in the
engineering calculations. The number of occupants is expected to have a
direct impact on the amount of hot water consumed and some impact on
energy used for appliances. Conversely, fewer occupants than modelled
could result in lower internal heat gains requiring booster space heating in
the heating season. A comparison of the design assumptions of number of
occupants and the actual number of occupants is presented in Table 7.20.
Table 7.20: BedZED number of occupants
Property type Energy Design Calculations
1
Corbey2
Residential 213 209
Offices (live-work) 106 33
Other uses 80 24
Total 399 266
1from Arup calculation spreadsheet (Bioregional 1999)
2from Corbey (2005)
Table 7.20 shows that, by 2005, the actual number of people occupying
dwellings at BedZED was broadly in line with the design assumptions; 209
people in occupation compared to the original assumption of 213. However,
the number of people occupying live-work units and using the other facilities
such as the nursery and offices was considerably lower than the assumptions
made at the design stage. While different property uses impact differently on
electricity and heat consumption, overall a lower live-work occupancy level
would be expected to reduce energy consumption since the units would not
be occupied all the time. And a number of the live-work units were
converted to dwellings by the time Phase 3 was undertaken.

180
7.7.3 Occupant Behaviour
Part of the energy strategy for BedZED was to ensure that fuel dials were
visible in the dwelling in order to raise awareness of fuel consumption and
encourage reduced fuel use. Darby set out a commonly shared view that
that providing occupants with feedback about how much energy they use
helps to drive energy efficient behaviour. She stated that local displays
could give a benefit of improved understanding and control, although this
would be partly dependent on the quality of display (Darby 2008).
Figure 7.9 shows the location of the fuel dials in a typical BedZED kitchen.
During Phase 2, just electricity readings were available; heat readings were
not available owing to the operational issues with the CHP. Even by 2007,
in their follow-up study of BedZED Seven Years on, Hodge and Haltrecht
(2009) reported that there were problems with the meters within BedZED
dwellings.
© Peabody
Figure 7.9: Fuel dials on display in typical BedZED kitchen
In the Phase 2 post-occupancy survey, BedZED participants were asked
whether the fuel dials made a difference to their use of fuel and appliances
and the results are in Figure 7.10 and 17 responses were received.

181
Figure 7.10: BedZED occupant survey: Does having the fuel dials on display make a difference to your use of fuel and appliances?
82% of respondents said that the dials made no difference to their use of fuel
and appliances. This seems very high. It could be that, given their decision
to move to BedZED in the first place, the participants were already very
aware of their energy consumption. One participant stated that the dials
were not on display, just accessible and another participant said that the
question was not applicable as there were no sub-meters. Another
explanation could be that participants were more inclined to take account of
their energy use via their bills.
7.8 Energy Usage Conclusions
The results presented in this chapter provide evidence to answer the first
three research questions for this study: how do the constructed units perform
compared with theoretical design performance; what is the difference if any;
and why is there a difference.
BedZED comfortably achieved its aim to reduce electricity usage by 10%
compared to standard dwellings, achieving electricity usage of 52.53
kWh/week at BedZED (Table 7.4) compared to 73.67 kWh/week achieved at
typical properties built to the 1995 Building Regulations (Table 4.5).
0
10
20
30
40
50
60
70
80
90
Yes No
% r
esp
on
de
nts
3
14

182
Total energy use was 7% higher than designed at 7,990 kWh per property
compared to the design of 7,460 kWh (Section 4.11), principally because of
higher than expected heat usage but this is considered to be a successful
outcome.
The 125 kWh/m2/annum achieved at BedZED was considerably higher than
the 75 kWh/m2/annum design target, but lower than the typical new building
standard of 163 kWh/m2/annum of the time. The BedZED total energy
usage is broadly in line with the Passivhaus standard of 120 kWh/m2/annum
for total energy demand, discussed in Chapter 2 (Schnieders 2003, Cutland
2012), and is 40% less than the mean average estimates in the BedZED
EPCs. The 75 kWh/m2/annum design target should have been updated as
the design was developed and demonstrates the importance of design
targets being thoroughly tested and assured and updated during design
development. The average 175.3 kWh/m2/annum recorded by the BedZED
EPCs overstates the actual energy use by 40%.
The analysis in this chapter illustrates the sensitivity of real performance data
to variables that are unknown at the early design stage of a project when
design assumptions have to be made. It also illustrates the importance of
analysing the data from a number of perspectives: total usage data are vital
but the relative efficiency of usage to property size and number of occupants
is also important given the changing demographics discussed in Chapter 2.
The effect of external weather conditions is important particularly if the
monitoring data are limited to one or two years, since these may not be
typical. This analysis illustrates the limitations of data collected over a two
year period since trends cannot be determined with such a relatively small
dataset.

183
Chapter 8 Internal Temperatures Results and Analysis
8.1 Introduction
Section 4.20 discussed the original design target for BedZED, which was to
achieve an internal temperature of 20ºC. This chapter discusses the results
obtained during the Phase 2 monitoring period to help answer the research
question of whether the constructed units perform compared to design with
regards internal temperatures achieved.
8.2 Winter Internal Temperatures
Typically, housing developments designed with traditional whole house
heating systems are designed around the concept of the heating season
where the dwelling’s heating system operates once external temperatures fall
below a certain point. The unmodified heating degree day concept assumes
that whole house heating systems will operate once the external temperature
falls below 15.5°C (Perry & Hollis 2005). This study examines, inter alia,
whether this approach fits with very well insulated homes like BedZED which
are designed without standard whole house heating systems and associated
thermostatic controls.
8.2.1 BedZED Winter Internal Temperatures
Figures 8.1 and 8.2 show mean internal temperatures recorded in bedrooms
and living rooms when the external temperature was 5ºC. Three properties,
Z, H and R had additional data loggers in second bedrooms.
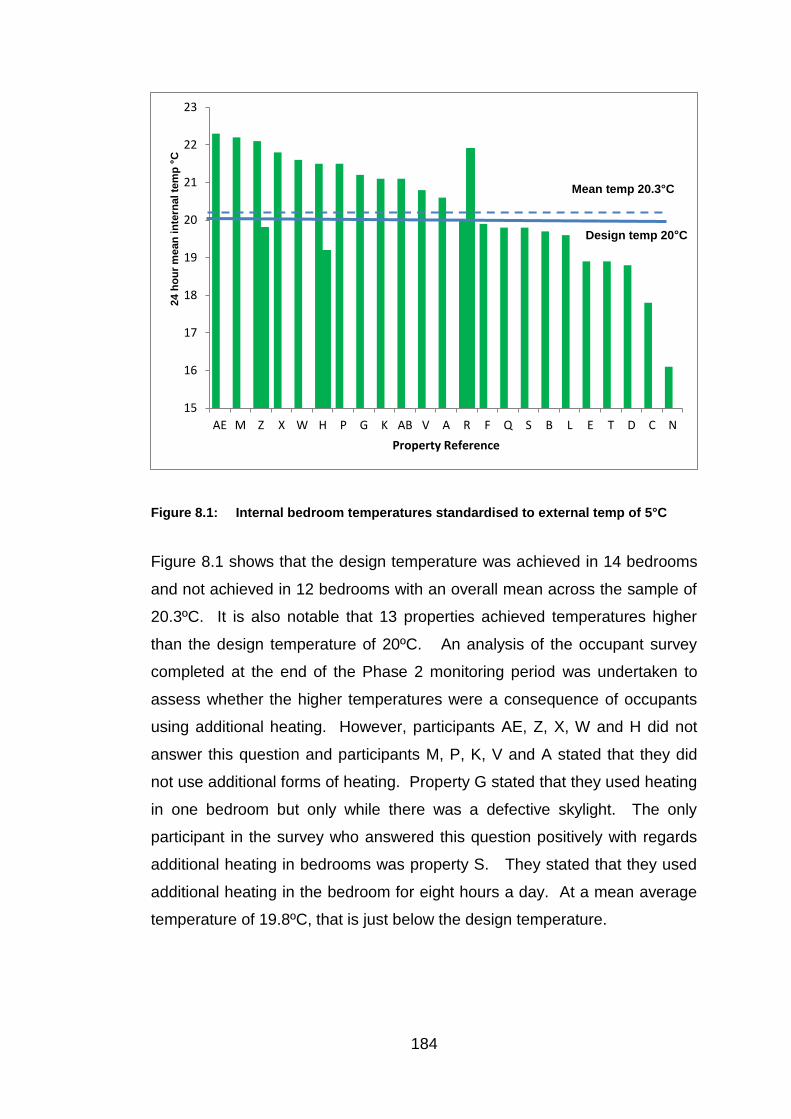
184
Figure 8.1: Internal bedroom temperatures standardised to external temp of 5°C
Figure 8.1 shows that the design temperature was achieved in 14 bedrooms
and not achieved in 12 bedrooms with an overall mean across the sample of
20.3ºC. It is also notable that 13 properties achieved temperatures higher
than the design temperature of 20ºC. An analysis of the occupant survey
completed at the end of the Phase 2 monitoring period was undertaken to
assess whether the higher temperatures were a consequence of occupants
using additional heating. However, participants AE, Z, X, W and H did not
answer this question and participants M, P, K, V and A stated that they did
not use additional forms of heating. Property G stated that they used heating
in one bedroom but only while there was a defective skylight. The only
participant in the survey who answered this question positively with regards
additional heating in bedrooms was property S. They stated that they used
additional heating in the bedroom for eight hours a day. At a mean average
temperature of 19.8ºC, that is just below the design temperature.
15
16
17
18
19
20
21
22
23
AE M Z X W H P G K AB V A R F Q S B L E T D C N
24 h
ou
r m
ean
in
tern
al te
mp
°C
Property Reference
Design temp 20°C
Mean temp 20.3°C

185
Figure 8.2 shows that the mean temperature achieved in living rooms over
the monitoring period when the external temperature was 5ºC was 21.4ºC,
which exceeded the design temperature of 20ºC.
Figure 8.2: Internal living room temperatures standardised to external temp of 5°C
Figure 8.2 shows that the design temperature was achieved in all living
rooms apart from two properties. The design temperature was more
consistently achieved in the living rooms compared to bedrooms.
Overall, across all the sampled properties, the average temperature achieved
in living rooms when the external temperature was 5ºC was 21.4 ºC and the
average temperature achieved in bedrooms when the external temperature
was 5ºC was 20.3 ºC. BedZED was therefore successful in achieving the
design heating temperature in living rooms and bedrooms during the heating
season.
Table 8.1 shows the range of average internal temperatures together with the
statistical standard deviation and confidence intervals (assuming 95%
15
17
19
21
23
25
27
AE Z P M X G K S W V A L R D H E C AB F B T N Q
24
ho
ur
me
an
in
tern
al te
mp
°C
Property Reference
Design Temp 20ºC
Mean temp 21.4ºC

186
confidence level). The standard deviation and confidence interval measures
provide a further illustration of the consistency of living room temperatures
compared to bedroom temperatures during the heating season.
Table 8.1: Summary of internal temperatures standardised to external temp of 5°C
Living Room Bedroom
Mean °C 21.4 20.3
Lowest °C 18.5 16.1
Highest °C 25.3 22.3
Median °C 21.4 20.3
Standard Deviation 1.29 1.49
Count 23 26
Confidence Interval 95% ± °C 0.53 0.57
Table 8.1 shows that the range between maximum and minimum in mean
temperatures is 6.2ºC for bedrooms and 6.8ºC for living rooms. A one-way
ANOVA statistical test was undertaken between mean bedroom and living
room temperatures. The resulting p value of .012 demonstrates that the
difference between the different room types is significant. Living rooms are
likely to have more solar gains since they all faced south and are enclosed by
sunspaces which provide a buffer to external temperatures. They may also
have had more incidental gains from electrical appliances sited in living
rooms which give off heat. Some living rooms are open plan to kitchens and
the heat loss from cooking may also be a contributory factor to higher
temperatures and greater range of temperatures. Occupancy levels may be
higher in living rooms with the corresponding incidental gains.
8.2.2 Comparison of Winter Temperatures at BedZED with other studies
The BedZED winter internal temperature results were compared to results
from the 1990 and 2005 Milton Keynes (MK) studies; the Warm Front (WF)
programme both pre- and post-intervention and the 2011 Energy Follow Up
Study (EFUS); and the Brixton super-insulation programme which had living
room data only. The BedZED data were collected exclusively for this study
and the comparative data were sourced from the CaRB study. Figure 8.3

187
compares mean internal temperatures achieved at BedZED with other
studies standardised to an external temperature of 5ºC.
Figure 8.3: Mean internal temperatures across studies standardised to external temperature of 5°C
Figure 8.3 shows that, for both living room and bedroom comparisons,
BedZED achieved the highest internal temperatures of the studies. Milton
Keynes had been constructed some years before BedZED and did not
incorporate the extent of passive design features that BedZED did.
Conversely, Milton Keynes was installed with gas heating systems unlike the
design approach at BedZED which eliminated the need for conventional
heating systems. Warm Front included packages of insulation upgrades and
modern heating systems but, as a retrofit project, could not incorporate all the
elements of passive design such as the building orientation and construction
of a sunspace that were included at BedZED. The Brixton houses were
designed as super-insulated dwellings and built in 1991 although a
comparison between Brixon (Table 3.2) and BedZED (Table 4.2) shows that
BedZED was designed with higher U values.
15.5
17.8
18.7
19.2
19.6
20.3
17.8
19.2
18.4
19.6
20
20.8
21.4
15
16
17
18
19
20
21
22
WF pre WF post EFUS MK 1990 MK 2005 Brixton BedZED
Me
an
in
tern
al te
mp
era
ture
ºC
Bedrooms Living rooms

188
In summary, the results of this comparison validate the design approach
taken at BedZED and demonstrate that the properties performed well in the
heating season compared to other energy efficiency interventions.
8.3 Summer Internal Temperatures
As discussed in section 4.20, a specific summer design temperature was not
set in the BedZED concept design. In order to analyse the BedZED results,
the CIBSE benchmarks of 26°C for bedrooms and 28°C for living rooms are
adopted, recognising that the occupied hours data were not available which
is required to assess overheating using the CIBSE approach.
The Phase 2 monitoring period included the hot spell of August 2003. Using
Wright’s definition of the 2003 hot spell to be the 3rd to the 13th August
inclusive (Wright 2005), Table 8.2 and Figure 8.4 show the external
temperatures recorded at the BedZED weather station during the hot spell
period.
Table 8.2: External temperatures °C recorded at BedZED during August 2003 hot spell
Date 3 Aug
4 Aug
5 Aug
6 Aug
7 Aug
8 Aug
9 Aug
10 Aug
11 Aug
12 Aug
13 Aug
Max 30.3 31.1 30.7 35.7 29.5 30.7 34.0 37.0 34.4 31.1 29.5
Min 11.0 14.5 17.1 20.2 18.3 17.1 17.9 17.9 19.4 18.3 17.9
Mean 20.9 22.7 23.5 27.9 24.5 24.4 26.4 27.4 26.6 24.5 23.5
By way of comparison, Met Office records show that the highest temperture
recorded in August 2003 was 38.5°C at Brogdale in Kent on 10 August 2003
(Met Office 2011).

189
Figure 8.4: Mean external temperatures °C recorded at BedZED during August 2003 hot spell
8.3.1 Summer Temperature Results at external temperature of 20ºC
Figure 8.5 shows BedZED summer mean internal temperature results for
living rooms when the external temperature was 20°C.
0
5
10
15
20
25
30
3rd 4th 5th 6th 7th 8th 9th 10th 11th 12th 13th
Me
an
ave
rag
e d
ail
y t
em
pe
ratu
re º
C
August 2003

190
Figure 8.5: Mean living room temperatures standardised to external temp of 20° C
Figure 8.5 shows that all living room temperatures were above the ambient
temperature of 20°C by at least 3°C and one property (AE) was 9°C above
the ambient temperature. While these results do not exceed the notional
design temperature of 28°C except in the case of AE, this is hot.
Figure 8.6 shows BedZED summer mean internal temperature results for
bedrooms when the external temperature was 20°C. Property R had an
additional data logger in a second bedroom. Data were not available for
these periods from other additional bedroom loggers in properties H and Z.
15
17
19
21
23
25
27
29
31
AE Z L T F Q H P C AB J B A S E W X R M K N G D V
24 h
ou
r m
ean
in
tern
al te
mp
era
ture°C
Property
Notional 28°C design temperature
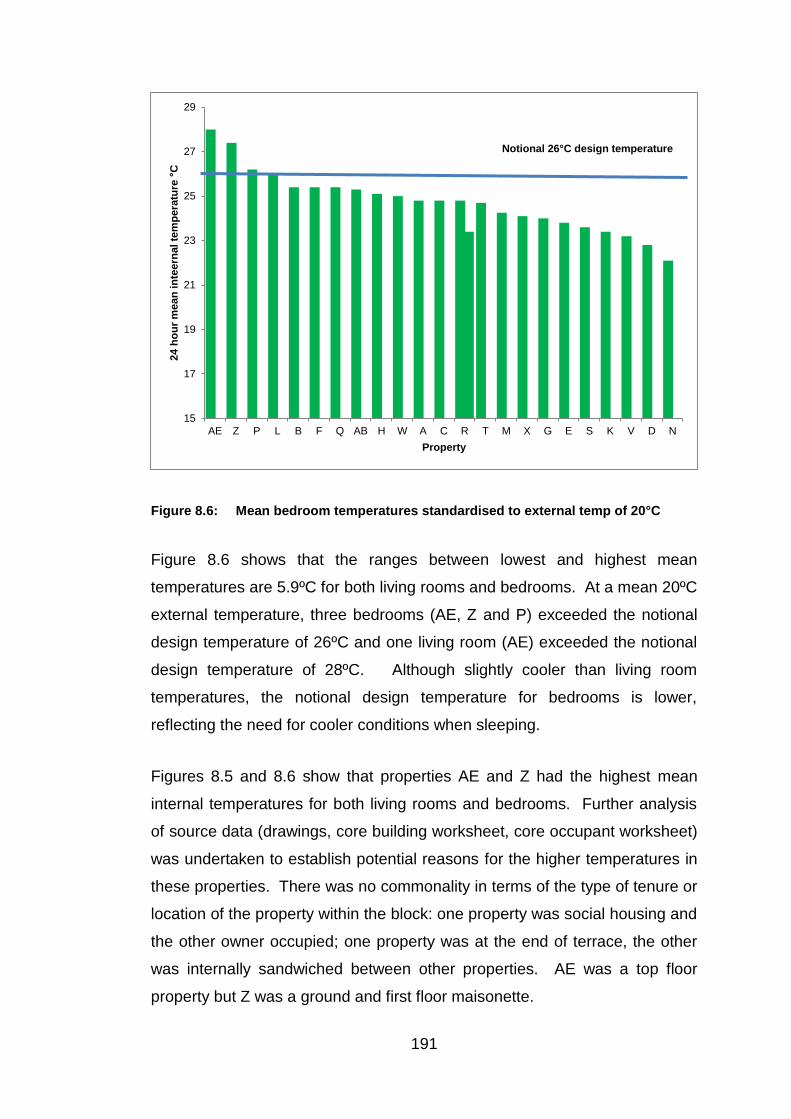
191
Figure 8.6: Mean bedroom temperatures standardised to external temp of 20°C
Figure 8.6 shows that the ranges between lowest and highest mean
temperatures are 5.9ºC for both living rooms and bedrooms. At a mean 20ºC
external temperature, three bedrooms (AE, Z and P) exceeded the notional
design temperature of 26ºC and one living room (AE) exceeded the notional
design temperature of 28ºC. Although slightly cooler than living room
temperatures, the notional design temperature for bedrooms is lower,
reflecting the need for cooler conditions when sleeping.
Figures 8.5 and 8.6 show that properties AE and Z had the highest mean
internal temperatures for both living rooms and bedrooms. Further analysis
of source data (drawings, core building worksheet, core occupant worksheet)
was undertaken to establish potential reasons for the higher temperatures in
these properties. There was no commonality in terms of the type of tenure or
location of the property within the block: one property was social housing and
the other owner occupied; one property was at the end of terrace, the other
was internally sandwiched between other properties. AE was a top floor
property but Z was a ground and first floor maisonette.
15
17
19
21
23
25
27
29
AE Z P L B F Q AB H W A C R T M X G E S K V D N
24 h
ou
r m
ean
in
teern
al te
mp
era
ture
°C
Property
Notional 26°C design temperature

192
Post-occupancy surveys were also consulted. The occupant of Property Z
did not complete a survey. The occupant of property AE was generally
dissatisfied with the heating, hot water and ventilation and reported that it
was difficult to operate the heating controls. This occupant further stated that
the property was too hot in summer and some rooms too cold in winter.
There may be a link between the occupant’s difficulty with operating the
heating controls, the higher than average temperatures and their
dissatisfaction, but firm conclusions cannot be drawn.
8.3.2 Summer Temperature Results at external temperature of 25°C
Figures 8.7 and 8.8 show BedZED mean internal temperature results for
bedrooms and living rooms respectively when external temperatures were
25°C.
Figure 8.7: Mean bedroom temperatures standardised to external temp of 25°C
15
17
19
21
23
25
27
29
31
33
AE Z L E AB P F C W B Q H A R T G M V N D
24
ho
ur
inte
rnal
me
an t
em
pe
ratu
re °
C
Property
NB Property R had loggers in two bedrooms
Notional 26ºC design temperature

193
Figure 8.8: Mean living room temperatures standardised to external temperature of 25°C
Figures 8.7 and 8.8 show that at 25°C, the general pattern is that most of the
average internal temperatures recorded exceed the external ambient
temperature. Of the 21 loggers in bedrooms, 15 recorded mean internal
temperatures higher than 25°C. Of the 22 loggers in living rooms, 19
recorded mean internal temperatures higher than 25°C. Applying the
notional design temperatures, at 25°C five living rooms exceed 28°C and 15
out of the 21 bedrooms measured exceed 26°C.
Figures 8.7 and 8.8 also show that the properties with higher internal
temperatures at external temperatures of 20°C, i.e. properties AE and Z, also
have the highest temperatures at 25°C. Similarly, property L has the third
highest living room temperature at 20°C and is equal second with Z when
external temperatures are 25°C.
Table 8.3 summarises the results from Figures 8.5, 8.6, 8.7 and 8.8.
15
17
19
21
23
25
27
29
31
33
AE L Z E T AB A F C H Q S P J B W R N M D G V
24 h
ou
r in
tern
al m
ean
tem
pe
ratu
re °
C
Property
Notional 28ºC design temperature

194
Table 8.3: Summary of summer internal temperatures at external temperatures of 20ºC and 25ºC compared to notional design standards
External temperature
20ºC 25ºC
Mean internal temperature °C Living Room 25.4 27.1
Bedroom 24.7 26.4
Number properties over CIBSE standard value (% of total)
Living (28ºC) 1 (4%) 5 (23%)
Bedroom (26ºC) 3 (12.5%) 15 (71%)
One-way ANOVA statistical tests applied to mean bedroom and living room
temperatures at 20ºC found no statistical significance difference between the
two rooms (p = >0.05) and that the “mean of means” in the above table is
representative of the results from each property. These results are different
from the heating season results which did show a significant difference
between the living room and bedroom internal temperatures.
Overall, in summer conditions, properties perform well against notional
design temperatures at 20ºC but bedrooms begin to overheat when the
external temperature is 25ºC. Figure 8.9 illustrates how the dwellings
perform at a property level. Each data point represents one logger position.
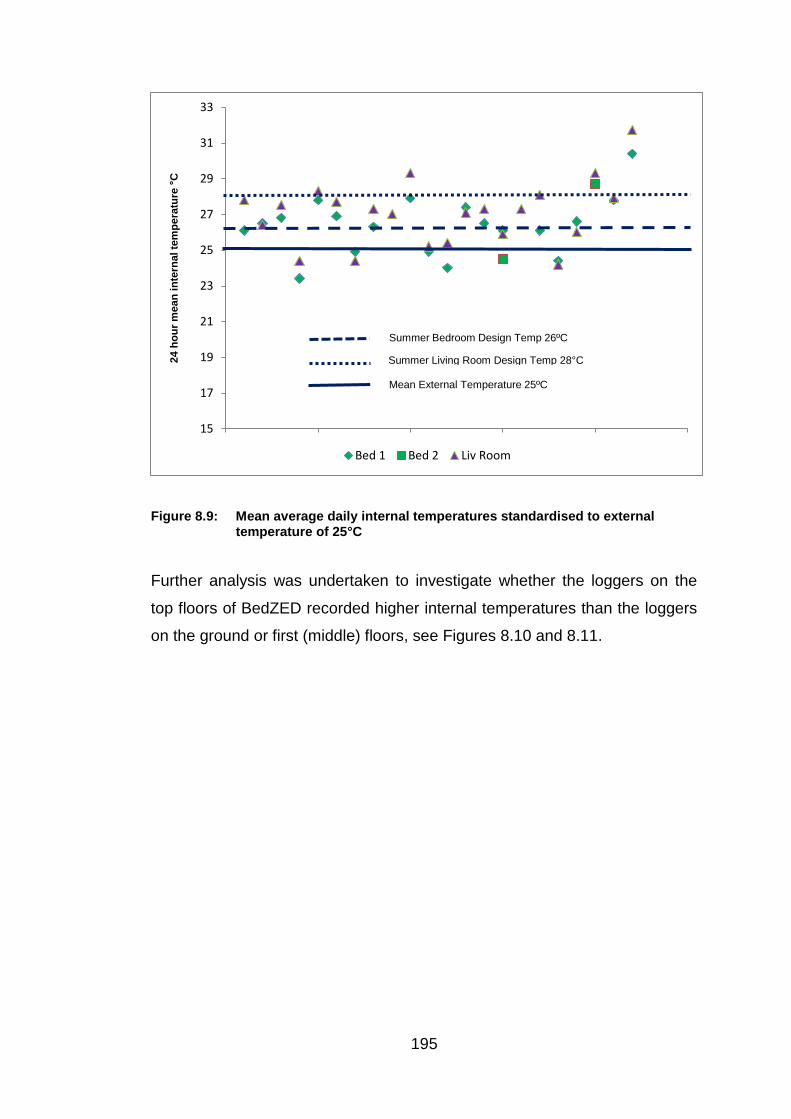
195
Figure 8.9: Mean average daily internal temperatures standardised to external temperature of 25°C
Further analysis was undertaken to investigate whether the loggers on the
top floors of BedZED recorded higher internal temperatures than the loggers
on the ground or first (middle) floors, see Figures 8.10 and 8.11.
15
17
19
21
23
25
27
29
31
33
24 h
ou
r m
ean
in
tern
al te
mp
era
ture
°C
Bed 1 Bed 2 Liv Room
Summer Bedroom Design Temp 26ºC
Mean External Temperature 25ºC
Summer Living Room Design Temp 28°C

196
Figure 8.10: Living room temperatures standardised to external temperature of 25°C showing floor location
0
5
10
15
20
25
30
35
AE L Z E T AB A F C H Q S P J B W R N M D G V
24
ho
ur
inte
nal
me
an t
em
pe
ratu
re º
C
Property
Top Floor Middle Floor Ground Floor
Notional 28ºC design
temperature

197
Figure 8.11: Bedroom temperatures standardised to external temperature of 25°C showing floor location
Figures 8.10 and 8.11 do not show a strong correlation between the location
of the logger and temperature. Property Z, which has its living room logger
sited on the ground floor records the third highest mean average temperature
and the three lowest bedroom temperatures (V, N, D) are sited on the first
(middle) floor.
As discussed in Chapter 4, the design philosophy for BedZED was that the
high mass construction would operate as a heat sink, day time warmth being
stored by the structure for slow release at night in the winter and night time
cool stored for slow release during the day in summer. The post-occupancy
survey aimed to find out how participants used their dwellings and to
compare the results of the temperature monitoring with participants’ views
about summer comfort. This is discussed in more detail in Chapter 10.
In section 8.2.1, it was discussed whether the reason for higher internal
temperatures in living rooms in the heating season might be a function of
0
5
10
15
20
25
30
35
AE Z L E AB P F C W B Q H A R1 T G M R2 V N D
24
ho
ur
inte
rnal
me
an t
em
pe
ratu
re º
C
Property
Top Floor Middle Floor Ground Floor
Notional 26ºC design
temperature

198
additional solar gain owing to the south facing sunspaces enclosing living
rooms. However this does not explain why there is no significant difference
in the cooling season also. Other factors may be relevant such as additional
ventilation resulting from active window opening by participants. Further data
would be required to establish why there is a difference in the heating season
but not in the cooling season. This would need to include, for example, more
details about occupancy behaviour such as window opening, use of
appliances and cooking.
8.3.3 Comparison of BedZED summer temperatures with other studies
Figure 8.12 shows mean internal temperatures in living rooms and bedrooms
across studies standardised to an external temperature of 20ºC. The
comparison includes BedZED, the two Milton Keynes studies undertaken in
1990 and 2005 and living room data only for the Brixton super-insulated
study, bedroom data were not collected.
Figure 8.12: Mean internal temperatures across studies standardised to external temperature of 20°C
The comparison shows that at 20ºC, BedZED has the lowest internal
bedroom temperature and the highest living room temperature. The higher
25.7 25
24.7 25.4
24.4 24.4
25.5
15
17
19
21
23
25
27
MK 1990 MK 2005 Brixton BedZED
Mean
in
tern
al
tem
pera
ture
ºC
Bedrooms Living rooms

199
living room temperatures at BedZED are thought to be attributable to the
sunspaces built onto the south facing elevation which also includes the living
rooms and participants potentially not optimising ventilation strategies to cool
down the internal spaces.
All studies show higher internal temperatures compared to the external
ambient temperature of between 5.5ºC for the living room at BedZED to
5.7ºC for the bedroom at Milton Keynes 1990. However, temperatures are
so close in range that there cannot be said to be a significant difference.
8.4 Overall Analysis of Internal Temperatures
8.4.1 Performance of BedZED compared to Design
Figure 8.13 summarises the mean internal temperatures in BedZED
dwellings when external temperatures are 20ºC and 25ºC and compares with
the internal temperatures when external temperatures are 5ºC.

200
Figure 8.13: Mean Internal Temperatures compared to Design
Figure 8.13 shows that the dwellings perform well according to the winter
design temperature but there is potential overheating in bedrooms during
summer when daily external temperatures reach 25ºC. With a notional
summer design temperature of 26ºC applied, BedZED bedrooms perform
well up to external temperatures of 20ºC (mean internal temperature 24.7ºC)
but at a 24 hour external temperature of 25ºC, the mean internal temperature
increases to 26.4ºC. With a notional summer design temperature of 28ºC,
living rooms perform well with a mean internal temperature of 25.5ºC when
the external temperature is 20ºC and mean internal temperature of 27.1ºC
when the external temperature is 25ºC.
BedZED occupants did complain of overheating during the summer months
and the design team visited the site to explain how best to keep properties
cool by, for example, opening windows at night but closing during the day
(Twinn 2014).
0
5
10
15
20
25
30
35
5 20 25
24
ho
ur
me
an in
tern
al t
em
pe
ratu
re °
C
External temperature °C
Bedroom Living Room
BedZED winter design temp 20°C
CIBSE summer bedroom design temp 26°C
CIBSE summer living room design temp 28°C

201
8.4.2 Additional Analysis - Sunspaces and Bathrooms
For a small number of properties, additional internal temperature data were
collected for other rooms besides living rooms and bedrooms. Data loggers
were installed in sunspaces in properties E and S and in bathrooms in
properties H and R. Sunspaces face south and are designed as an integral
part of the passive design, acting as a buffer between the outside and the
internal areas. Bathrooms are internal to the property and have a fitted
towel rail fitted connected to the hot water system. Figure 8.14 shows
internal temperatures recorded in sunspaces and compared to living rooms
and bedrooms at different external temperatures.
Figure 8.14: Mean internal temperatures in sunspaces for two properties
Figure 8.14 illustrates that when external temperatures are 5°C there is a
marked temperature difference between the sunspaces and the living
rooms/bedrooms in these two properties confirming the function of the
sunspace as a buffer between external and internal temperatures. (N.B.
insufficient data were available for temperatures above 20°C for the logger in
Property S’s bedroom.) From the data available, it can be seen that there is
0
5
10
15
20
25
30
E 5°C S 5°C E 20°C S 20°C E 25°C S 25°C
24
ho
ur
me
an in
tern
al t
em
pe
ratu
re °
C
Property and mean external temperature
Sunspace Liv Room Bedroom

202
less difference between the sunspace internal temperatures and the
temperatures in the living rooms and bedroom at 20°C and above. The
sunspace with the higher internal temperature, property E, has lower internal
temperatures in the living room and bedroom than property S which has a
lower mean temperature in the sunspace but higher temperatures than E in
the living room and bedroom. Both properties are the same size and sited
on the same floor level of different blocks and all sunspaces face south.
Consulting the Phase 2 post-occupancy survey, both participants said that
they found the comfort level of their home in the summer comfortable overall.
The participant in property S remarked that the sunspace was too cold in
winter whereas the participant in property E did not comment on their
sunspace. Other participants who quoted the sunspaces in their post-
occupancy survey include occupant B who stated that the sunspace was too
cold in winter. Participants G and P state that there was mould growing in
the sunspace during the winter which suggests low temperatures and a lack
of ventilation. Different approaches to ventilation could account for the
different results in the properties which had loggers installed in the
sunspaces. It is assumed that participants might not have fully understood
the purpose of the sunspace to act as a buffer between external
temperatures, both the colder temperatures in the winter and the warmer
temperatures in the summer and may have been using the sunspace as an
extension of their living space. To be reliable, further research would need
to be undertaken to assess temperatures of sunspaces in a larger sample of
properties and an assessment of occupants’ understanding of the purpose of
the sunspaces should also be undertaken at the same time.
Figure 8.15 shows temperature differences in bathrooms, living rooms and
bedrooms.

203
Figure 8.15: Mean internal temperatures in bathrooms for two properties
Figure 8.15 shows that there is little difference between the bathroom and
other rooms monitored in properties H and R. The temperatures for all
rooms illustrated are higher than the external temperature apart from the
second bedroom at property R when mean external temperatures reach
25°C. At BedZED, bathrooms are enclosed rooms with the result that
occupants cannot open windows for additional ventilation.
In the Phase 2 post-occupancy survey, ten out of 19 participants stated that
their homes were too hot overall, see Table 10.11. While no occupants
reported using additional cooling in the bathroom, three participants (J,L,V)
stated that it was difficult to control the temperature of the heated towel rail in
the bathroom and two participants (F,P) reported that the bathroom was too
hot in summer. While the sample of two properties is small, the results for
the bathroom temperatures are more consistent than the sunspaces. This
could be because the bathrooms at BedZED are internally sited and are not
affected by, for example, occupants opening windows and/or the direction of
0
5
10
15
20
25
30
H 5°C R 5°C H 20°C R 20°C H 25°C R 25°C
24
ho
ur
me
an e
xte
rnal
te
mp
era
ture
°C
Property and mean external temperature
Bathroom Liv Room Bedrooms Bedrooms

204
prevailing winds which could impact on the temperatures in the externally
located sunspaces.
8.5 Internal Temperature Conclusions
The results presented in this chapter provide evidence to answer the first two
research questions for this study: how do the constructed units perform
compared with theoretical design performance and what is the difference if
any?
The results show that BedZED achieved its 20ºC design temperature in the
winter months but overheated in hot weather. Compared to other low energy
case studies, BedZED performed better in winter than the other case studies
examined with higher temperatures achieved in both bedrooms and living
rooms. In summer, BedZED bedrooms were the coolest in the case study
comparison but BedZED living rooms the hottest. The higher living room
temperatures at BedZED are thought to be attributable to the sunspaces built
onto the south facing elevation which also includes the living rooms with
participants potentially not optimising ventilation strategies to cool down the
internal spaces.
The reasons for the difference in summer temperatures are examined in
more detail in Chapter 10 which analyses the results from the occupants’
surveys.
205
Chapter 9 Airtightness Results and Analysis
9.1 Introduction
Achieving designed heat loss and air-tightness standards were important for
meeting the overall energy design for BedZED. The more air tight the
buildings, the less heat would be lost. The consequence of excessive heat
loss would be that internal design temperatures and comfort would not be
achieved and occupants might supplement the internal temperature with
additional space heating, thus increasing fuel consumption. Conversely,
inadequate ventilation could lead to internal air quality problems such as
condensation or mould growth within dwellings.
The Energy Saving Trust stated that a ventilation rate (uncontrolled and
controlled) of 0.5 to 1.5 air changes per hour for a whole dwelling is good
practice to keep indoor relative humidity below 70% which is the trigger point
for condensation to occur (Energy Saving Trust 2006).
The BedZED concept design provided for a very high envelope air tightness
of 2 air changes per hour (ach) at 50 Pa test pressure (Arup 1999a) and this
was carried forward to the air leakage testing specification which set out the
maximum permitted air leakage rate as 2 ach at 50 Pa. (Arup 2001).
A wind-assisted passive stack heat recovery ventilation system was installed
at BedZED. The aim was that the roof-mounted wind cowls would harness
natural wind currents to create air pressure sufficient to provide a healthy
fresh air supply to the building with no running energy cost (such as fans or
heaters) since heat exchangers in the wind cowls would recover up to 70% of
heat from exhaust air and natural pressure differences (wind and/or stack)
provide the air movement. BedZED’s double and triple-glazed windows (U-
value 1.0W/m2K) would also reduce the likelihood of surface condensation.

206
9.2 Air Tightness Tests carried out at BedZED by others
During the construction of BedZED, Building Sciences Limited (BSL) carried
out air leakage pressurisation tests in December 2001 on six completed
properties in accordance with CIBSE guidance on testing buildings for air
leakage (CIBSE 2000). BSL found results varying from 2.98 to 3.83 ach at a
differential pressure of 50 Pa. with a mean average result of 3.28 ach at
50Pa. (Building Sciences Limited 2001). The report identified a number of
building snags that needed correcting, in particular missing or poorly applied
mastic seals around external doors and windows. No report was available
for this study to show whether the air leakage was reduced on completion of
all building snagging work.
In 2005, Living Space Sciences carried out five tests on a BedZED property
(Dunster 2008). They calculated an air infiltration rate of 2.2 ach at 50 Pa
from blower door tests. Using a tracer gas decay measurement test, they
determined that the average ventilation rate was 0.11 ach when the
ventilation inlet was sealed, rising to 0.45 ach when the ventilation inlet was
unsealed. This is a good result and in theory enough to maintain the relative
humidity below 70%.
9.3 Infra-Red Thermography and Air Infiltration Tests carried out for this thesis
Air infiltration rate and heat loss tests were conducted specifically for this
thesis on one dwelling from the Phase 2 sample. The tests took place after
the buildings had been occupied for about two years and after the completion
of the temperature and relative humidity monitoring undertaken as part of this
study. By this time all construction was completed, the snags identified in
the earlier construction stage tests completed by BSL were assumed to have
been addressed and the properties assumed to have dried out. Sung H
Hong and Dejan Mumovic of UCL conducted infra-red thermography and
whole-house air infiltration rate tests to a sample dwelling and provided initial
analysis of the the results (Hong and Mumovic 2005). The purpose of the
tests was to investigate the building fabric performance of the sample

207
dwelling which was a top storey, end-of-terrace, studio flat with exposed roof.
The tests were carried out on 10th December 2004 between the hours of
10:30 to 13:00. These tests and results were produced exclusively for this
study and have not been used elsewhere.
Two separate infiltration rate tests were carried out with the four wall
openings to the passive stack vent in open and closed conditions using
blower door tests. In common with the earlier construction pressure tests
undertaken by BSL, the sunspace was excluded from the test. The total
tested internal volume was 103.4m3.
9.3.1 Results of Infra-Red Thermography Test
The full results are in Appendix 8.
The overall conclusion of the infra-red thermography test was that the
building appears to have continuous insulation but with some small areas of
detailing that showed some heat loss. These were considered unlikely to be
the cause of major heat loss or condensation since the temperature
difference was quite small. For example, a small strip of cold area was
detected along the ceiling edge above the living room. The reason for this
could be cold air ingress from a gap possibly caused by missing edge
insulation or a gap between the roof flashing and the edge of the roof
concrete slab. The design team were aware of some workmanship issues
during the construction period including detailing and missing insulation
(Twinn 2014). Unlike the sealants to doors and windows, snags to insulation
is much less likely to be picked up during construction snagging owing to the
difficulty gaining access once roof and wall finishes are installed.
Generally, the infra-red thermography test showed that there was good
insulation throughout. The infra-red camera was also used to detect cold air
ingress along window seals while the case study flat was depressurized
forcing cold exterior air into the flat. The test result showed very good seal
along the joints of window frames to wall and along the casement window to

208
frame. No mould growth was detected in the dwelling and this can be
attributed to the high surface of temperature of the walls and the ceilings, the
reasonable insulation levels illustrated by the thermography test and the fact
that measured ventilation rates with the ventilation system open were close
to the designed ventilation rates. Given the improvement between the
construction and post-construction air infiltration tests, it is assumed that the
workmanship issues identified by the BSL tests were addressed before the
properties were handed over.
9.3.2 Results of Air Infiltration Tests
Tests were carried out with passive vents open and closed and with and
without pressurisation and the results are shown in Table 9.1.
Table 9.1: Results of Air Infiltration Rate Tests
Passive vent condition
Closed
Open
Pressurised at 50 pascals
(air changes per hour)
2.5 3.1
Background (no pressurisation)
(air changes per hour)
0.12 0.16
Source: Hong & Mumovic 2005
The results were that in normal conditions with the passive vents open the
property achieved 3.1 ach at 50 Pa. and achieved 2.5 ach at 50 Pa. when the
vents were closed.
9.4 Relative Humidity Results
There is a risk with airtight buildings like BedZED that high levels of moisture
might accumulate within the dwelling and trigger condensation and mould
growth if there is not an effective controlled ventilation strategy such as the
one provided by the passive stack ventilation system.

209
Relative humidity (RH) readings were compiled for this property during Phase
2 monitoring, except for the period October 2003 to January 2004, and the
results are presented in Tables 9.2 and 9.3.
Table 9.2: Property B Temperature and RH Results
Bedroom °C
Living room °C
Bedroom %RH
Living room %RH
Max 38.32 31.93 84.60 80.40
Mean 22.38 21.76 53.05 51.43
Min 12.93 14.47 22.00 25.40
Std. Dev 3.62 3.68 9.53 9.22
Table 9.3: Property B RH Analysis
Bedroom Living Room
Number data points 22,626 24,101
Number data points over 70% 507 411
% data points over 70% RH 2.24 1.71
The results show a very similar RH in the bedroom and the living room with
the mean RH being 53% and 52% respectively. The RH was over 70%
(often regarded as a critical RH for mould growth) in the bedroom for only
2.2% of the time during the monitoring period and 1.7% of time in the living
room. The highest RH readings tended to occur in the evening and the
morning. Since the occupant was generally out at work during the day this is
in line with expectations; the higher RH readings are likely to have occurred
when the occupant was cooking or showering. The low RH is consistent
with the lack of condensation in this property observed during the infra-red
thermography tests in Appendix 8, the reasonably high internal temperatures
and the air tightness tests which evidence that the ventilation stacks are
working properly. An interrogation of the results of the occupant survey
completed for this property at the end of Phase 2 also shows that this
participant did not report condensation in their property.
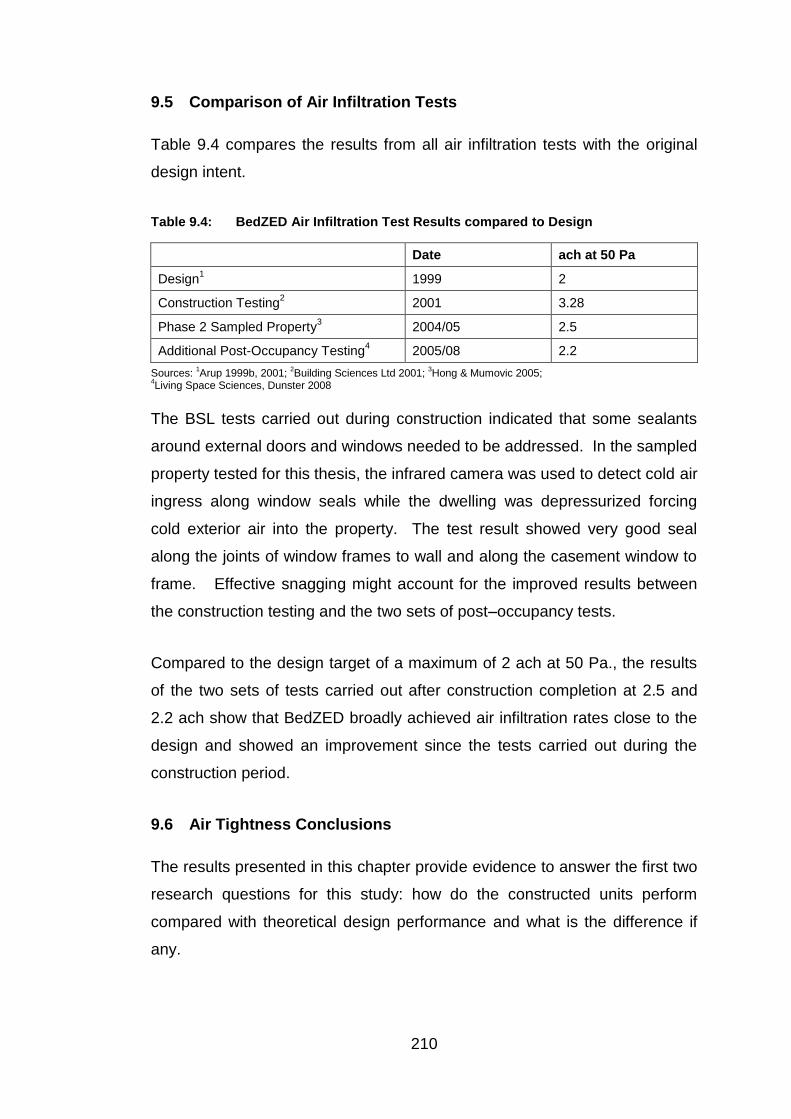
210
9.5 Comparison of Air Infiltration Tests
Table 9.4 compares the results from all air infiltration tests with the original
design intent.
Table 9.4: BedZED Air Infiltration Test Results compared to Design
Date ach at 50 Pa
Design1 1999 2
Construction Testing2 2001 3.28
Phase 2 Sampled Property3 2004/05 2.5
Additional Post-Occupancy Testing4 2005/08 2.2
Sources: 1Arup 1999b, 2001;
2Building Sciences Ltd 2001;
3Hong & Mumovic 2005;
4Living Space Sciences, Dunster 2008
The BSL tests carried out during construction indicated that some sealants
around external doors and windows needed to be addressed. In the sampled
property tested for this thesis, the infrared camera was used to detect cold air
ingress along window seals while the dwelling was depressurized forcing
cold exterior air into the property. The test result showed very good seal
along the joints of window frames to wall and along the casement window to
frame. Effective snagging might account for the improved results between
the construction testing and the two sets of post–occupancy tests.
Compared to the design target of a maximum of 2 ach at 50 Pa., the results
of the two sets of tests carried out after construction completion at 2.5 and
2.2 ach show that BedZED broadly achieved air infiltration rates close to the
design and showed an improvement since the tests carried out during the
construction period.
9.6 Air Tightness Conclusions
The results presented in this chapter provide evidence to answer the first two
research questions for this study: how do the constructed units perform
compared with theoretical design performance and what is the difference if
any.

211
At 2.5 ach at 50 Pa., BedZED broadly achieved its designed air tightness
level of 2 ach at 50 Pa. The sampled dwelling showed good air tightness and
minimum heat loss from background air infiltration. The RH results
demonstrate that the ventilation was operating effectively. Additional RH
results are included in Chapter 10 which discusses results from the
occupants’ surveys and reports from those survey participants that reported
condensation in their homes.

212
Chapter 10 Occupant Survey Results
10.1 Introduction
The results from occupant surveys presented in this chapter provide
evidence to answer the final research question for this study: have
participants changed how they use energy at home as a result of moving to
the new development?
The Phase 1 occupant survey was conducted at the end of the Phase 1
monitoring period prior to participants moving to BedZED. The Phase 2
survey was conducted at the end of the Phase 2 monitoring period after
participants had lived at BedZED for almost two years. The occupant survey
questionnaires are in Appendix 3 and 4. The number of participants in each
survey is summarised in Table 10.1 with the full list in Table 6.6.
Table 10.1: Number of participants completing Phases 1 and 2 occupant surveys
Phase 1 Phase 2
Participants 14 24
Surveys Completed 11 19
Not all participants answered every question in both surveys.
10.2 Participant Profiles
Table 10.2 compares the age profile of participants who took part in the two
occupancy surveys although not all Phase 2 participants answered this
question (12 out of 19). In Phase 1, 10% of occupants in the sampled
households were under 5 years of age with 19% in the Phase 2 occupancy
survey. It is not possible to draw conclusions from the different age profiles
in these two surveys given the two year time lapse between the surveys and
potential change in household make-up although there were no participants
that were over 65 years of age in either survey.

213
Table 10.2: Number and age of participants in Phases 1 and 2 occupant surveys
Age Group Phase 1 Survey Phase 2 Survey
Under 5 2 4
6-15 1 1
16-25 2 4
26-35 8 7
36-45 7 3
46-55 1 1
56-65 0 1
Over 65 0 0
Total occupants in scope 21 21
% under 5 10 19
% over 65 0 0
Total number of responses to question 11 12
Table 10.3 shows the results to the survey question about the times of day
that participants occupied their homes. For this question, ten participants
responded to the Phase 1 survey although one participant (J) stated that
since she worked a night shift, she did not complete the times that she was at
home.
Table 10.3: Time of day that dwellings are occupied from Phases 1 and 2 occupant surveys
Phase 1 Adults
Phase 1 Children
Phase 2 Adults
Phase 2 Children
total daytime (morning, lunch, afternoon)
9 6 25 12
total evening (evening and night)
18 4 38 14
% daytime 33* 60 40 46
% evening 66* 40 60 54
Total responses 11 19
*rounding
10.3 Occupant Survey Results
Table 10.4 shows results for a question about the number of electrical
appliances used by the household.

214
Table 10.4: Electrical appliances used by households, Phases 1 and 2
Appliance Phase 1 Phase 2
Refrigerator 5 10
Freezer 3 9
Fridge/freezer 6 10
Electric shower 2 4
Washing machine 9 19
Tumble Drier 2 2
Dishwasher 1 4
Microwave 7 10
Television 14 17
Personal computer 7 11
Other 2 3
Total appliances 58 99
Appliances per household 5.3 5.2
Total number of responses to question 11 19
Table 10.5 shows the extent of low energy light bulb use and in which rooms.
BedZED was fitted out with low energy lamps when occupants moved in and
the purpose of this question was to establish whether participants in the
study already used low energy light bulbs and also whether they would
continue to do so, two years in, in the Phase 2 survey. Since this study was
completed, all light bulbs sold in the UK are low energy.
Table 10.5: Low energy light bulbs, Phases 1 and 2
Phase 1 Phase 2
None 6 0
1 room 4 0
2 rooms 1 0
3 rooms 0 3
4 rooms 0 3
More than 4 rooms 0 13
Total number of responses to question 11 19

215
Table 10.6 shows how easy or not participants found the heating controls to
use. Participants were asked to score the ease of use on a range of 1 to 5,
with 1 being easy and 5 being very difficult. The additional answer of “not
applicable” was introduced for the Phase 2 survey to assess whether
BedZED residents considered whether they did have control over their
heating systems, given the fairly prescriptive design of the system.
Table 10.6: Ease of heating controls operation, Phases 1 and 2
Phase 1 Phase 2
1 Easy 8 2
2 Fairly easy 1 1
3 OK 1 4
4 Difficult 0 2
5 Very difficult 1 5
Not applicable 2
Total number of responses to question 11 16
A similar question was asked about how easy occupants found it to use the
hot water controls, and, as with the question about heating controls, an
additional “not applicable” answer was also included in the Phase 2 survey.
The results are in Table 10.7.
Table 10.7: Ease of hot water controls operation, Phases 1 and 2
Phase 1 Phase 2
1 Easy 9 3
2 Fairly easy 2
3 OK 2 5
4 Difficult 2
5 Very difficult 4
Not applicable 2
Total number of responses to question 11 18
Participants were asked about the effectiveness of the controls to maintain
comfortable temperatures in their home. An additional option of “not
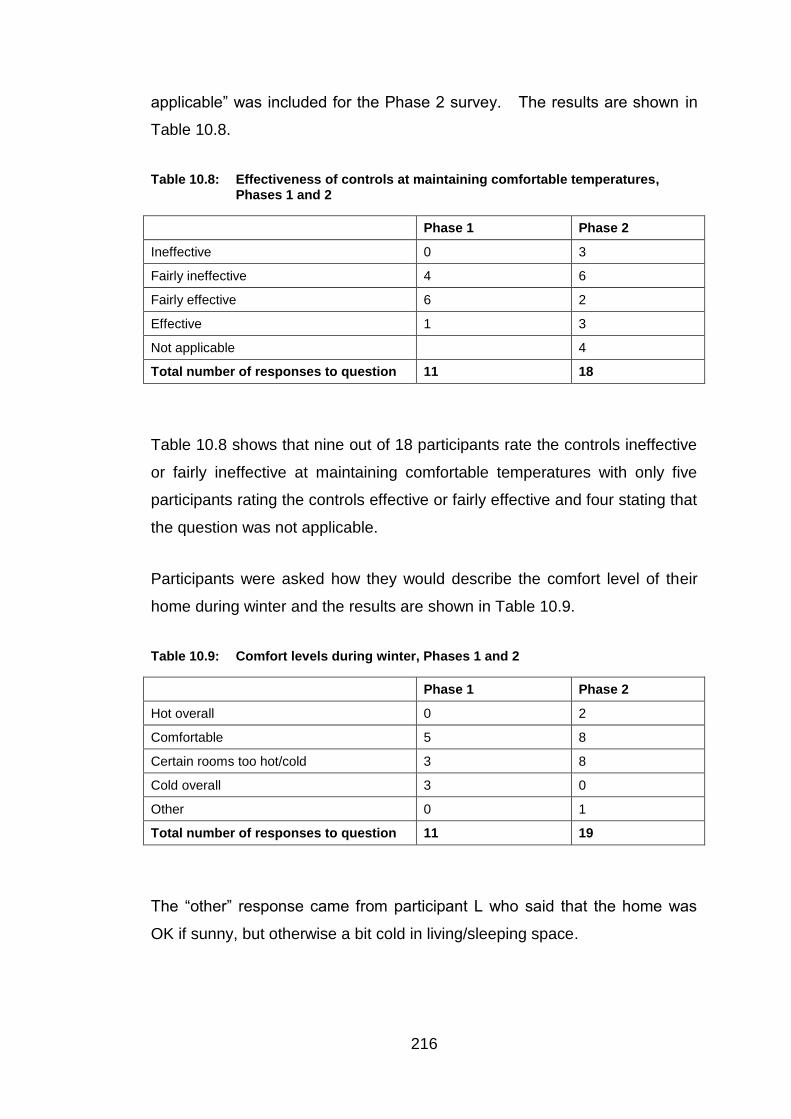
216
applicable” was included for the Phase 2 survey. The results are shown in
Table 10.8.
Table 10.8: Effectiveness of controls at maintaining comfortable temperatures, Phases 1 and 2
Phase 1 Phase 2
Ineffective 0 3
Fairly ineffective 4 6
Fairly effective 6 2
Effective 1 3
Not applicable 4
Total number of responses to question 11 18
Table 10.8 shows that nine out of 18 participants rate the controls ineffective
or fairly ineffective at maintaining comfortable temperatures with only five
participants rating the controls effective or fairly effective and four stating that
the question was not applicable.
Participants were asked how they would describe the comfort level of their
home during winter and the results are shown in Table 10.9.
Table 10.9: Comfort levels during winter, Phases 1 and 2
Phase 1 Phase 2
Hot overall 0 2
Comfortable 5 8
Certain rooms too hot/cold 3 8
Cold overall 3 0
Other 0 1
Total number of responses to question 11 19
The “other” response came from participant L who said that the home was
OK if sunny, but otherwise a bit cold in living/sleeping space.

217
Participants were asked if they used any form of additional heating, such as
electric fan heaters, and if so where. The results for this question are at
Table 10.10.
Table 10.10: Additional heating use, Phases 1 and 2
Phase 1 Phase 2
Living Room 2 4
Kitchen 0 0
Bathroom 3 0
Bedrooms 3 2
Other 0 2
None 0 9
Total number of responses to question 8 17
The BedZED dwellings were thermostatically controlled albeit not via a
traditional wall thermostat. The trickle fan was considered by some to be too
noisy and so they used standalone electric fans instead. In their 2009 study,
Hodge and Haltrecht found that 39% of BedZED households used electric
fans on occasion for between one and two months of the year and 42% used
some additional electric heating on average during the coldest two months of
the year. This does not imply that residents were using fans/heaters
consistently during that time - it could be only for an hour or two on the very
hottest/coldest days of the year. This aligns with the findings of post
occupancy survey carried out for this research.
Participants were not asked directly about comfort levels in the summer in
the Phase 1 pre-occupancy survey because it was not anticipated that
summer comfort would be an issue at BedZED. When there were reports of
overheating during the hot spell in summer 2003 an additional question about
summer comfort was included in the Phase 2 post-occupancy survey and the
results included in Table 10.11.

218
Table 10.11: Comfort levels during summer, Phase 2
Responses
Hot overall 10
Comfortable 5
Certain rooms too hot/cold 4
Cold overall
Other
Total number of responses to question 19
Figure 10.1 shows that over 50% of survey participants found their properties
hot overall and less than 30% find their homes comfortable during the
summer. These findings that more participants find their home comfortable
in winter than in summer align with the findings of the Mlecnik 2012 study
discussed in Chapter 2.
Figure 10.1: Phase 2 occupant survey: comfort level of your home during the summer
A follow on question asked which rooms were too hot or cold. The four
participants who answered this question stated that the living room, bedroom
0
10
20
30
40
50
60
Hot overall Comfortable Some rooms toohot/cold
Cold overall Other
% r
esp
on
de
nts
10
5
4

219
and sunspace (B); bedrooms (D), bathroom (F) and all rooms except north
facing bedrooms (R) were too hot.
In the Phase 2 survey, an additional question asked occupants whether they
used any additional forms of cooling such as fans or air conditioning units
and the results are shown in Table 10.12. Of the 18 participants who
answered this question, three reported that they used additional cooling in
more than one room.
Table 10.12: Additional cooling, Phase 2
Living Room 3
Kitchen 1
Bathroom 0
Bedrooms 7
Other 1
None 10
Total number of responses to question 18
Figure 10.2 shows that more than half of the participants who responded to
this question (ten out of 18) did not use additional forms of cooling.
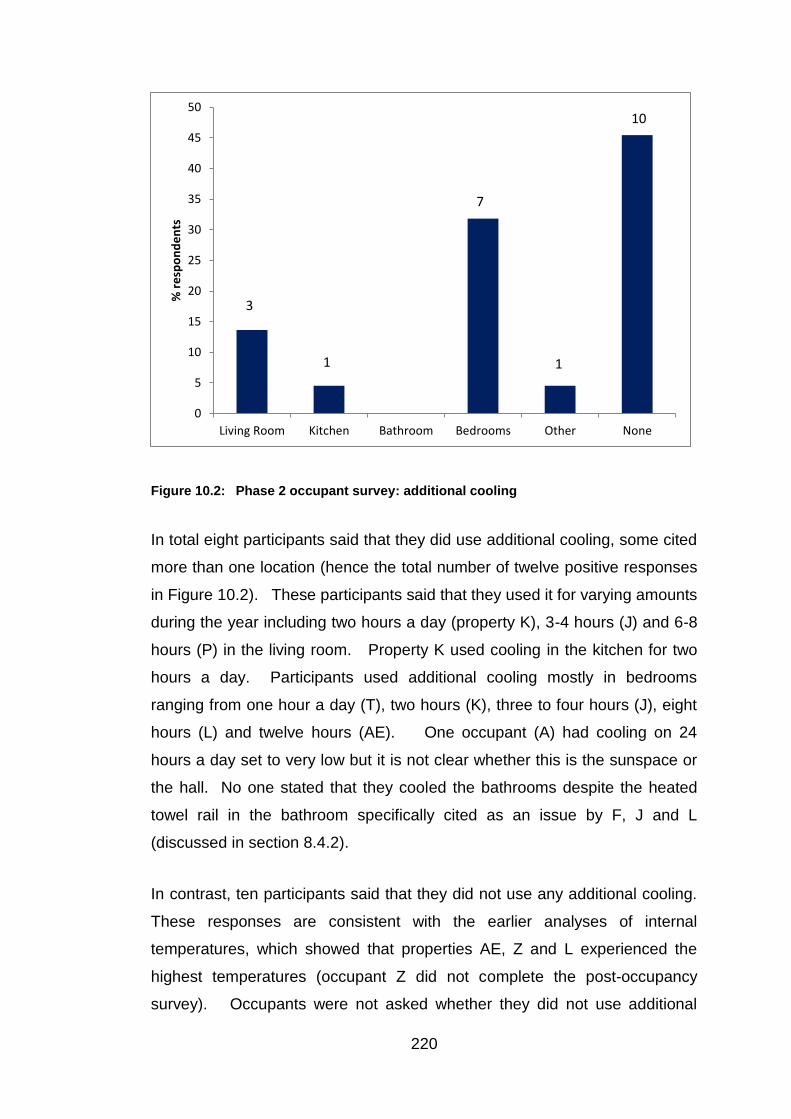
220
Figure 10.2: Phase 2 occupant survey: additional cooling
In total eight participants said that they did use additional cooling, some cited
more than one location (hence the total number of twelve positive responses
in Figure 10.2). These participants said that they used it for varying amounts
during the year including two hours a day (property K), 3-4 hours (J) and 6-8
hours (P) in the living room. Property K used cooling in the kitchen for two
hours a day. Participants used additional cooling mostly in bedrooms
ranging from one hour a day (T), two hours (K), three to four hours (J), eight
hours (L) and twelve hours (AE). One occupant (A) had cooling on 24
hours a day set to very low but it is not clear whether this is the sunspace or
the hall. No one stated that they cooled the bathrooms despite the heated
towel rail in the bathroom specifically cited as an issue by F, J and L
(discussed in section 8.4.2).
In contrast, ten participants said that they did not use any additional cooling.
These responses are consistent with the earlier analyses of internal
temperatures, which showed that properties AE, Z and L experienced the
highest temperatures (occupant Z did not complete the post-occupancy
survey). Occupants were not asked whether they did not use additional
0
5
10
15
20
25
30
35
40
45
50
Living Room Kitchen Bathroom Bedrooms Other None
% r
esp
on
de
nts
3
1
7
1
10

221
cooling because the temperature was tolerable or because they were
adhering to the zero energy ethos of the BedZED development and striving
to minimise the use of additional electrical appliances. So it is not clear
whether this participant response would be replicable on a larger scale or
whether a larger population would be more inclined to use cooling during hot
spells.
Following the occupation of BedZED and the initial feedback about summer
temperatures, participants were additionally asked in the Phase 2 survey
whether they opened windows to try and control the temperature of their
home and the results are at Table 10.13.
Table 10.13: Window opening to control temperature, Phase 2
Responses
Yes 19
No 0
Total number of responses to question 19
All 19 participants confirmed that they opened windows to control the
temperature. This was part of the passive design principles for BedZED and
the Residents’ Manual explains that the dwellings should be ventilated at
night during the summer so that the heat absorbed by the high mass
structure can be removed and the property cooled for the next day.
However, occupants were not asked when they opened their windows to cool
their properties; they may have been opening them during the day which
would not have had the same cooling effect and potentially contributing to the
higher internal temperatures recorded.
In both surveys, participants were asked about the effectiveness of their
ventilation system to remove moisture and odours from their homes. Six
participants from Phase 1 said they had ventilation systems. The results are
at Table 10.14.

222
Table 10.14: Effectiveness of ventilation system, Phases 1 and 2
Phase 1 Phase 2
Yes 5 10
No 1 8
Total number of responses to question 6 18
Almost half of the respondents did not think the ventilation system at BedZED
was effective at removing moisture and smells. Two participants in the
Phase 2 survey provided additional comments; one stated that the ventilation
system brought the smell of a neighbour’s cigarettes into their home (anon)
and the second (AE) that the bathroom fan did not always work.
A further question asked participants whether they opened windows to
improve air quality and the results are at Table 10.15.
Table 10.15: Window opening for air quality improvement, Phases 1 and 2
Phase 1 Phase 2
Yes 10 16
No 1 3
Total number of responses to question 11 19
Participants were asked whether their hot water system provided enough hot
water and the results are at Table 10.16. Two of the 18 Phase 2 participants
who answered this question commented that there was sometimes not
enough hot water, but they had selected “yes” overall in their answer.
Table 10.16: Adequacy of hot water, Phases 1 and 2
Phase 1 Phase 2
Yes 9 18
No 2 0
Total number of responses to question 11 18
Participants were asked if they knew how much their fuel bills were per
annum and the results are at Table 10.17. One participant (M) was unable

223
to answer this in Phase 1 as the cost was included in their rent. Over a third
of participants in the Phase 2 survey did not know what their fuel was costing
them at BedZED. This was because there were operational problems with
the CHP and with billing arrangements during the first two years.
Table 10.17: Awareness of fuel bills, Phases 1 and 2
Phase 1 Phase 2
Yes 6 11
No 2 7
Other 1 1
Total number of responses to question 9 19
The final part of the occupancy survey was a series of questions related to
participants’ health, preferences and overall satisfaction with the systems in
their homes. Participants were asked whether anyone in their household
had asthma or similar health problem that could be associated with the living
environment. The Phase 1 results for this question are at Table 10.18.
Table 10.18: Phase 1 Incidence of health problems associated with the living environment
Responses
Yes 4
No 7
Total number of responses to question 11
For Phase 2, the question was slightly amended to assess whether there
were any new cases of health problems related to the living environment.
The results for this question are at Table 10.19. Of the two participants who
said that their household was affected, one (G) cited noise transference
between properties and the second (AE) said that their asthma had got
worse.

224
Table 10.19: Phase 2 Incidence of health problems associated with the living environment experienced for the first time
Responses
Yes 2
No 19
Total number of responses to question 19
Participants were asked whether there was any condensation or mould
growth in their homes. The results for both Phases are at Table 10.20 and
are discussed in more detail in section 10.5.
Table 10.20: Condensation, Phases 1 and 2
Phase 1 Phase 2
Yes 6 6
No 5 12
Total number of responses to question 11 18
Participants were asked about their clothing weight preferences during winter
and the results are at Table 10.21.
Table 10.21: Winter clothing weight preferences, Phases 1 and 2
Phase 1 Phase 2
Just a thin layer, eg T-shirt, shirt, blouse 3 6
Medium layers, eg T-shirt/shirt + thin sweater/cardigan
4 9
Heavy layers, eg T-shirt/shirt + heavy sweater/fleece 4 4
Total number of responses to question 11 19
Participants were asked how satisfied overall they were with the heating, hot
water and ventilation in their home according to a five-point range from Very
Good to Very Poor. The results for both Phases are at Table 10.22.
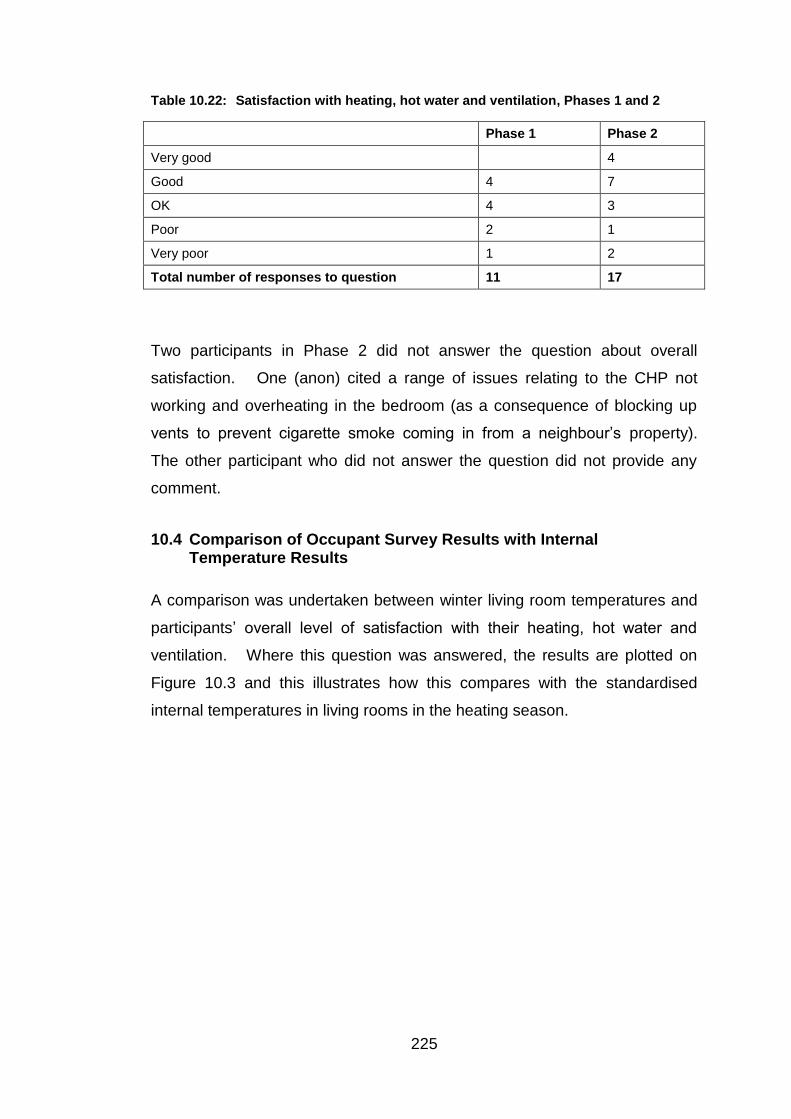
225
Table 10.22: Satisfaction with heating, hot water and ventilation, Phases 1 and 2
Phase 1 Phase 2
Very good 4
Good 4 7
OK 4 3
Poor 2 1
Very poor 1 2
Total number of responses to question 11 17
Two participants in Phase 2 did not answer the question about overall
satisfaction. One (anon) cited a range of issues relating to the CHP not
working and overheating in the bedroom (as a consequence of blocking up
vents to prevent cigarette smoke coming in from a neighbour’s property).
The other participant who did not answer the question did not provide any
comment.
10.4 Comparison of Occupant Survey Results with Internal Temperature Results
A comparison was undertaken between winter living room temperatures and
participants’ overall level of satisfaction with their heating, hot water and
ventilation. Where this question was answered, the results are plotted on
Figure 10.3 and this illustrates how this compares with the standardised
internal temperatures in living rooms in the heating season.

226
Figure 10.3: Comparison of internal living room temperatures standardised to external temp of 5°C with overall occupant satisfaction levels with heating, hot water and ventilation
Figure 10.3 shows that 14 participants were satisfied with the heating, hot
water and ventilation compared to 3 that were dissatisfied.
There does not appear to be a correlation between the internal temperatures
during the heating season and overall satisfaction. Participants P, M, E and
F said that they were very satisfied and their properties ranked 3rd, 4th, 16th
and 19th warmest in the sample. Conversely, participants AE and K said that
they were very dissatisfied and their properties ranked 1st and 5th warmest in
the sample and their properties achieved the design temperature of 20ºC.
The cause for their dissatisfaction must lie elsewhere. In a further question
about how easy it was to operate the control systems for heating and hot
water, occupant AE said that they found them “difficult” and occupant K said
they found them “very difficult”. This could be a contributory factor to their
dissatisfaction.
1
2
3
4
5
6
15
17
19
21
23
25
27
AE P M G K S V A R D E C F B T N Q
Occu
pa
nt
Sati
sfa
cti
on
1 =
po
or,
5 =
very
go
od
Mean
in
tern
al te
mp
era
ture
ºC
Property
Internal Temperature Occupant Satisfaction

227
Another reason might be that the two participants were used to keeping their
homes at much higher temperatures than BedZED but since neither
occupant took part in Phase 1, it is not possible to make a comparison of
internal temperatures. However, occupant K did provide additional
comments at the end of the post-occupancy survey. They said “I would love
the temperature of the flat to be lower inside when it’s warm/hot outside.
Sometimes the heat is unbearable.” K’s dissatisfaction with internal
temperatures appears to be more aligned with summer temperatures than
the winter temperatures shown in Figure 10.3. Finally, AE was a social
housing tenant. In Chapter 6, it was suggested that social housing tenants
might have provided a control study if a large enough number had agreed to
participate (section 6.4) since they had less choice about moving to BedZED
compared to owner occupiers. While it is not possible to draw conclusions
from a single property, it is notable that AE experiences the highest internal
temperatures and the lowest satisfaction rating.
A comparison was undertaken of occupants’ overall satisfaction with the
heating, hot water and ventilation when external temperatures were 25°C.
The results for satisfaction and living room temperatures are shown in Figure
10.4 and for satisfaction and bedroom temperatures in Figure 10.5.

228
Figure 10.4: Comparison of living room temperatures standardised to external temperature of 25°C with results of overall occupant satisfaction with heating, hot water and ventilation
1
2
3
4
5
15
17
19
21
23
25
27
29
31
33
AE E T A F C Q S P J B R N M D G V
Occu
pa
nt
Sati
sfa
cti
on
1 =
po
or
5 =
very
go
od
Mean
In
tern
al T
em
pe
ratu
re º
C
Property
Internal Temperature Occupant Satisfaction

229
Figure 10.5: Comparison of bedroom temperatures standardised to external temperature of 25°C with results of overall occupant satisfaction with heating, hot water and ventilation
There is no clear correlation between internal summer temperatures and
participants’ overall satisfaction with the heating, hot water and ventilation.
In line with the literature, the participants’ response to overheating seems to
be more a problem in bedrooms than living rooms, with seven participants
installing cooling (e.g. fans or air conditioning units) in bedrooms compared
to three in the living room. CIBSE guidance on summer comfort sets lower
operative and peak temperatures for bedrooms compared to other rooms in
dwellings. As discussed, overheating is considered to be more of an issue
during the night because of the impact on sleep patterns.
A subsequent survey of BedZED residents in 2007 by Goh & Sibley (2008)
found that over half (56%) of BedZED residents thought their homes too hot
in the summer, shown in Table 10.23. That larger survey corroborates the
results of this study with regards summer temperatures.
1
2
3
4
5
15
17
19
21
23
25
27
29
31
33
AE E P F C B Q A R1 T G M R2 V N D
Occu
pa
nt
sati
sfa
cti
on
1 =
po
or
5 =
very
go
od
Mean
in
tern
al te
mp
era
ture
ºC
Property
Internal Temperature Occupant Satisfaction

230
Table 10.23: Goh and Sibley BedZED Occupant Survey Results
Scale
Too cold
Just right
Too hot
Scale 1 2 3 4 5 6 7
Winter months % 20 44 20
Summer months % 10 56
Notes:
71 households (86.6% of total households) took part
30% respondents use electrical fan on average for 1-2 months
42% respondents use electrical heater on average for 1-2 months
Source: Table 5, Goh & Sibley (2008)
Goh & Sibley attributed summer overheating to the fact that the excess heat
from the hot water cylinder and the towel rail in the bathroom were not locally
controlled. They also speculated whether households used the windows and
sunspace to cool dwellings as originally intended in the design.
71% of the 71 households surveyed by Goh and Sibley had installed curtains
or blinds in sunspaces albeit primarily for privacy reasons. In their thermal
simulation study of nine UK dwellings, He, Young, Pathan et al (2005) found
that the provision of window blinds and a large roof overhang to provide solar
shading had little effect on passive cooling techniques, reducing cooling
demand by only 2%. However the use of window opening regimes for late
evening and early mornings produced a 90% reduction in demand for
cooling. They attribute the reason for this to thermal storage effects of
structure and to the time lag associated with this, so the previous evening’s
cooling load will carry forward to the next day.
In his 2008 book, the BedZED architect Bill Dunster stated that “regrettable
cost savings were made by the client to omit opening roof lights on the top
floor sunspaces, making it harder to ventilate warm air build up”. He noted
that the problem of ventilating warm air build up is not experienced in the
lower maisonettes, where a combination of low level windows and doors and
high level tilt turn windows provide good cross ventilation. The literature
discussed earlier in this chapter points towards active window opening as the

231
most effective method of managing overheating. The decision to omit
opening roof lights may have contributed to the reports of overheating in
some properties. That said, all participants surveyed in this study confirmed
that they opened windows to control the temperature of their home and this is
illustrated in Figure 10.6.
Figure 10.6: Phase 1 and 2 Occupant Surveys - Window Opening
The three Phase 2 participants in Figure 10.6 who did not open windows to
control air quality, also stated that there was no condensation or mould
growth in their homes. All three households comprised one occupant only,
which may also have been a factor.
The occupancy surveys carried out for this thesis did not explore the time of
day when occupants opened windows but in his thesis, Corbey recorded
anecdotal evidence from BedZED occupants about overheating. He noted
that operating the window units takes a degree of learning, in that on very hot
days the best way of keeping the unit cool is to ventilate the sunspace and
shut the internal door from the sunspace to the dwelling (Corbey 2005).
20
30
40
50
60
70
80
90
100
Phase 1 to improve airquality
Phase 2 to improve airquality
Phase 2 to controltemperatures
% r
esp
on
de
nts
Yes No
11
1
16
3
19

232
The BedZED energy engineer took part in meetings with BedZED residents
and reported that there was not enough understanding about how to deal
with overheating. He reported that residents were extending their living area
into the sunspace and leaving the door between the dwelling and the
sunspace permanently open with the result that, when the sunspace heated
up from solar gain, so did the living space and after a few days the dwelling
mass heated up. Thermal inertia then meant that it would take time before
internal temperatures reduced. He advised that sunspaces should be kept
closed during the day and their windows opened. At night, all windows could
be opened to cool down the whole dwelling (Twinn 2014).
The BedZED Residents Manual provided guidance for occupants in its
troubleshooting section which recommends that during very hot windless
days, windows should be closed during the day and opened during the cooler
evening and early morning so that room surfaces are cooled ready for the
following day (Peabody Trust 2002). Based on Corbey’s findings and
correspondence from the project team energy engineer (Twinn 2014), it is
clear that optimum window opening during hot spells was not fully
understood by occupants.
10.5 Comparison of Occupant Survey Results with RH Results
Section 9.4 found no condensation in the sampled BedZED property tested
for air infiltration and infra-red thermography as part of this study. However,
an analysis of the Phase 2 survey results for condensation shown in Table
10.20 provides a different perspective. This analysis is presented in Figure
10.7 and shows that 33% of participants who answered this question said
that there was condensation or mould in their home.

233
Figure 10.7: Phase 1 and 2 Occupant Surveys – Condensation
33% seems high for new properties. NHBC state that:
“Condensation is common in new and newly converted homes while
construction materials dry out. If allowed to persist it can sometimes
cause mould on walls and ceilings” (NHBC 2014).
The post-occupancy survey was undertaken in June 2004, some two years
after construction completion and it was expected by that time that the
properties would be fully dried out. The air tightness tests discussed in
Chapter 9 found high levels of air tightness in the sampled property which
could lead to condensation in the absence of a controlled ventilation strategy.
Participants’ responses to the Phase 2 occupancy survey show that the new
dwellings suffer from less condensation than their former homes which is to
be expected given that they are newly built and in excess of minimum
building regulations applying at the time. However, the reported incidence
of condensation or mould in six out of 18 homes is high.
0
10
20
30
40
50
60
70
80
90
100
Pre BedZED Post BedZED
% r
esp
on
de
nts
Yes No
7 6
12 5

234
Analysis of comments provided by three of the six respondents to this
question provides further insights. Occupant V states that the problem is
condensation dripping from the roof lights. This could be condensation but is
more likely to be penetrating dampness from poor sealants in the roof light
units, an issue raised by Occupant G in response to a different question. The
other two participants who provided comments to this question stated that the
condensation was in the sunspace and occurred in winter when the area was
sealed up. Occupant P reported having to open up the exterior windows to
allow more ventilation into the sunspace and this would have partially
negated the buffering effect of the conservatory. Another occupant
highlighted a general ventilation issue; in response to the question about
whether the ventilation system was effective, they (anon) stated that they had
blocked up the vent because they were getting the smell of cigarettes from
their neighbour’s property. While this occupant did not report condensation
or mould in their property, blocking up the vents should affect the ventilation
of their dwelling and could create the conditions for condensation. If the
tracer gas measurements in one property were representative of the stock
then blocking the vents will reduce the ventilation by about a quarter: from
0.45 to 0.11 ach.
The relative humidity (RH) readings for Phase 2 were analysed for the six
properties that reported condensation (C, G, P, S, V, T) plus the property that
had the airtightness survey conducted as part of this study (B), already
reported in Chapter 9 but included here for comparison. The results are
shown in Table 10.24.

235
Table 10.24: RH Results, Phase 2
Property Bedroom % RH
Living room % RH
Sunspace % RH
B Max 84.60 80.40
Mean 53.05 51.43
Min 22.00 25.40
Std. Dev 9.53 9.22
% > 70%RH 2.24 1.71
C Max 93.80 88.40
Mean 53.81 50.97
Min 23.60 23.20
Std. Dev 11.78 10.15
% > 70%RH 9.48 3.25
G Max 85.70 96.20
Mean 54.87 51.43
Min 24.30 24.20
Std. Dev 9.23 9.34
% > 70%RH 6.88 2.49
P Max 99.00 99.00
Mean 59.21 60.29
Min 23.30 24.80
Std. Dev 9.58 7.67
% > 70%RH 14.99 10.74
S Max 96.30 99.00 100.00
Mean 56.64 55.10 59.27
Min 23.80 22.70 21.80
Std. Dev 10.71 12.17 15.79
% > 70%RH 13.64 11.56 30.42
T Max 81.40 84.40
Mean 49.21 45.57
Min 24.80 23.20
Std. Dev 8.21 8.11
% > 70%RH 0.43 0.11
V Max 77.10 78.60
Mean 50.69 49.80
Min 24.50 25.90
Std. Dev 7.79 6.51
% > 70%RH 0.10 0.04
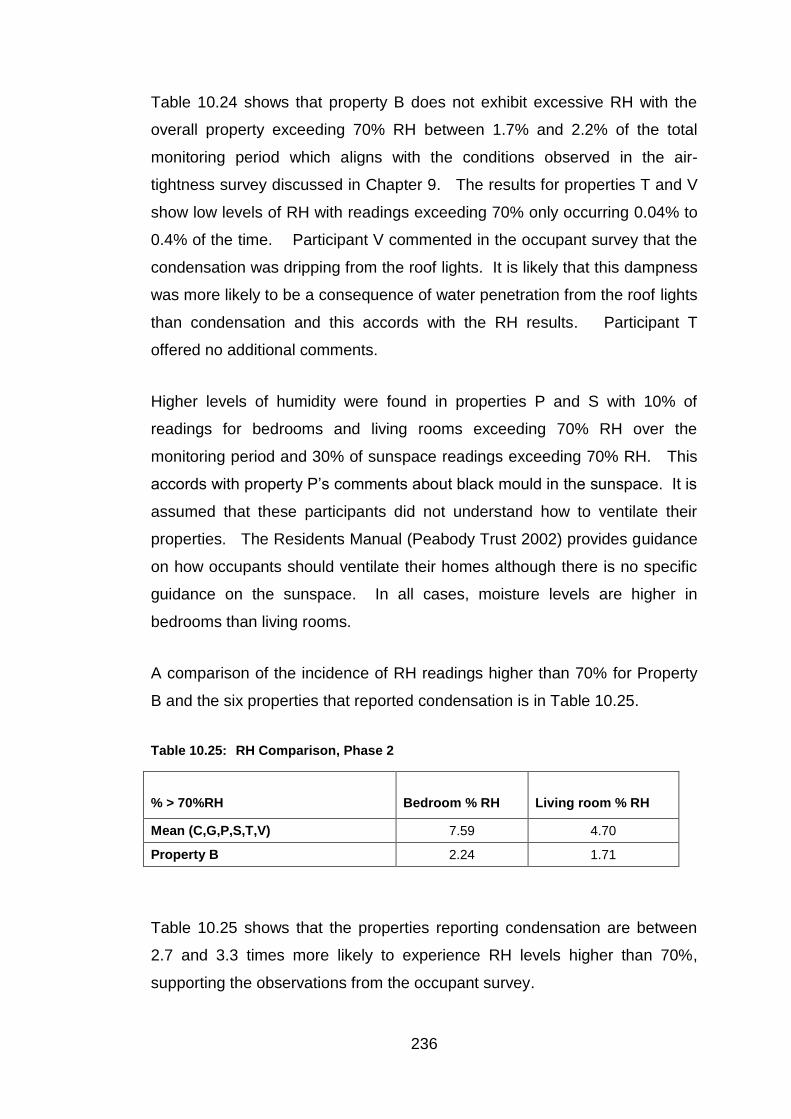
236
Table 10.24 shows that property B does not exhibit excessive RH with the
overall property exceeding 70% RH between 1.7% and 2.2% of the total
monitoring period which aligns with the conditions observed in the air-
tightness survey discussed in Chapter 9. The results for properties T and V
show low levels of RH with readings exceeding 70% only occurring 0.04% to
0.4% of the time. Participant V commented in the occupant survey that the
condensation was dripping from the roof lights. It is likely that this dampness
was more likely to be a consequence of water penetration from the roof lights
than condensation and this accords with the RH results. Participant T
offered no additional comments.
Higher levels of humidity were found in properties P and S with 10% of
readings for bedrooms and living rooms exceeding 70% RH over the
monitoring period and 30% of sunspace readings exceeding 70% RH. This
accords with property P’s comments about black mould in the sunspace. It is
assumed that these participants did not understand how to ventilate their
properties. The Residents Manual (Peabody Trust 2002) provides guidance
on how occupants should ventilate their homes although there is no specific
guidance on the sunspace. In all cases, moisture levels are higher in
bedrooms than living rooms.
A comparison of the incidence of RH readings higher than 70% for Property
B and the six properties that reported condensation is in Table 10.25.
Table 10.25: RH Comparison, Phase 2
% > 70%RH
Bedroom % RH
Living room % RH
Mean (C,G,P,S,T,V) 7.59 4.70
Property B 2.24 1.71
Table 10.25 shows that the properties reporting condensation are between
2.7 and 3.3 times more likely to experience RH levels higher than 70%,
supporting the observations from the occupant survey.

237
When asked about draughts, the proportion of participants experiencing
draughts since moving to BedZED reduced, illustrated in Figure 10.8.
Figure 10.8: Phase 1 and 2 Occupant Surveys - Draughts
Analysing the responses to the Phase 1 survey half said that the draughts
came from windows, three of the six also said that the draughts came
through doorways. In the Phase 2 survey, the faulty window seals were
raised by participants V and G. Given the high levels of air-tightness at
BedZED, it is surprising that two participants stated that they did experience
draughts. One of these (G) also reported faulty window seals which could
explain the draughts and the same participant reported condensation in the
sunspace which they addressed by opening the exterior windows. Again,
this could account for draughts.
10.6 Occupant Surveys Conclusions
The results presented in this chapter provide insights into the human factors
relevant to the study and help to answer the final research question which is
0
10
20
30
40
50
60
70
80
90
100
Pre BedZED Post BedZED
% r
esp
on
de
nts
Yes No
6
6
17
2
238
“have participants changed how they use energy at home as a result of
moving to the new development?”
Overall, 82% of survey participants rated the heating, hot water and
ventilation as OK, good or very good (Table 10.22). The surveys show a
higher level of satisfaction with the winter temperatures achieved at BedZED
(42% selecting “comfortable”, Table 10.9) and a lower level of satisfaction
with summer temperatures (26%, Table 10.11). The surveys provide an
insight into the reasons for occupants’ dissatisfaction. 44% of participants
who answered this question stated that they found the heating controls
“difficult” or “very difficult” to operate and a further 13% stated that the
question was not applicable (Table 10.6), indicating a low level of confidence
in the BedZED occupants that they can operate their heating controls
effectively.
Given the air tightness of BedZED, a good ventilation system is essential to
provide fresh air and remove moisture. However the occupant survey
results indicate that almost half of the respondents did not think the
ventilation system at BedZED was effective at removing moisture and smells
(Table 10.14). The survey shows that all participants employed active
window opening to control the temperature of their home but the internal
temperature results during hot spells indicate overheating and the results of
the occupants’ surveys indicate that less than 30% find their homes
comfortable during the summer (Figure 10.1). Other studies suggest that
this is partly attributable to a lack of understanding on when to open windows
to achieve optimum cooling.
These findings are further tested in Chapter 12 with the longitudinal study
which directly compares the same sample of occupants in Phase 1 and
Phase 2.

239
Chapter 11 Changes to BedZED during the Development Process
11.1 Introduction
This chapter refers to project source documents and discusses changes
made to the design during the development and occupation phases which
may have impacted on the actual performance of the BedZED properties in
use. The results of this analysis help to answer the first three research
questions for this study: how do the constructed units perform compared with
theoretical design performance; what is the difference if any; and why is there
a difference.
11.2 Changes during the Construction phase
A review of the available project documentation did not highlight any major
changes to the design or the components that would have affected the
performance of the dwellings in use (Peabody Trust 1999-2000). For
example, the August 1999 project design meeting discussed the design of
the airing cupboard and the trade-off between insulating the hot water
cylinder compared to reducing the effectiveness of the cupboard as a clothes
dryer, with a view to installing uninsulated cylinders (Peabody Trust 1999-
2000). However this was not permitted under the Building Regulations and
insulated cylinders were installed.
Of more concern was workmanship on site. In correspondence, the energy
engineer stated that he had been made aware in retrospect of instances
where wall insulation had been missed, finned tube heaters being missed out
and other workmanship concerns that may have adversely affected the
energy performance (Twinn 2014).
The infra-red thermography test discussed in Chapter 9 provides some
evidence of insulation detailing issues at wall and ceiling junctions although
these issues did not affect the thermal performance in the tested dwelling.

240
11.3 Changes during the Operational phase
The CHP plant was designed to provide all heat and electricity to BedZED
properties with a connection to the national grid for import and export in the
event of under-supply or over-supply. The design had assumed that 100%
of the site electricity requirements for power to buildings would be met by the
CHP together with the hot water demand for washing. Back-up supply
arrangements were to draw power from the national grid for individual
immersion heaters within dwellings.
The performance of the CHP was inconsistent. The CHP plant installed at
BedZED was a prototype designed by the supplier and was fully automated
with daily automatic start-up and shut down and automatic de-ashing. Plant
maintenance was expected to be weekly for routine checks with scheduled
maintenance carried out quarterly. However, a number of problems arose in
the operation of the plant. These included the design of new untested
equipment such as the automatic ash removal and the reliability of some
equipment that needed to operate continuously such as the woodchip
grabber and slide valves. The main issue that affected the operation was tar
condensing from the wood gas, exacerbated by cooling of the plant during
the nightly shut down (Hodge & Haltrecht 2009, Twinn 2014).
Lazarus stated that during the first winter of occupation, 2002-03, the CHP
and heating system were still being commissioned and that this affected the
supply of hot water to properties and so the contribution of incidental gains
toward the space heating (Lazarus 2003).
Hodge and Haltrecht stated that the CHP never consistently reached the
design outputs (Hodge & Haltrecht 2009).
After completion of Phase 2 of this thesis, Peabody Trust de-commissioned
the biomass system and installed centralised gas boilers to provide heat for
the district hot water system.

241
The issues with the operation of the CHP were discussed in Chapter 7 since
this resulted in heat energy data not being available for the Phase 2
monitoring period.
11.4 Zero Energy and Renewables
A key element of the BedZED design was that the scheme would be zero
energy. Inherent to this was that the development would be self-sufficient in
non-carbon energy. Renewable energy would be provided from the biomass
CHP and from photovoltaic (PV) panels.
The monitoring undertaken for this thesis did not include an assessment of
the PV panels. Other sources have been consulted to assess this and are
discussed in Chapter 4.
At its conception, the project had been called Beddington Zero Energy
Development, abbreviated to BedZED. Later, the full name of the project
was changed to Beddington Zero (Fossil) Energy Development. It is
assumed that the name change was to make clear that BedZED would use
energy and was not autonomous but that the energy used would be
renewable and not fossil fuels. Other work presented in section 4.21.2
shows that the renewable energy from PV at BedZED was approximately a
third of the designed output. More significantly, the failure of the biomass
CHP, which was to play a significant role in the zero carbon nature of
BedZED, meant that the renewable energy design was not achieved.
11.5 Development Process Conclusions
The evidence in this chapter shows that the failure of the biomass CHP in the
operational phase resulted in the zero carbon design not being achieved.
The system was a prototype system which the manufacturer and operator
was unable to make fully operational. By the operational stage with BedZED
fully inhabited, it would have been very difficult to replace the failed biomass
242
CHP with another experimental system and the decision was taken to use a
tried and tested method in the form of gas-fired boilers.
There is some evidence that workmanship issues on site during the
construction phase may have compromised the thermal performance of the
units as constructed. This is corroborated in part from the infra-red
thermography survey carried out on a sample dwelling for this study and
discussed in section 9.3.1. However, there is also evidence that the air-
tightness performance improved between the construction air-tightness tests
and the post-completion tests (Table 9.4), suggesting that some of these
construction issues had been addressed prior to handover of the completed
properties.

243
Chapter 12 Longitudinal Study
12.1 Introduction
A unique feature of this study was the inclusion of a measurement phase
prior to participants taking up residence in BedZED. The purpose of this
was to track over time occupant behaviour and assess whether it changed as
a result of moving into the new dwelling. This chapter provides evidence for
the fifth research question for this study: have participants changed how they
use energy at home as a result of moving to the new development?
The longitudinal study set a baseline for participants' behaviour and
preferences, before they moved to the new BedZED dwellings. It also aimed
to assess how participants responded to the improved energy efficiency of
their new homes: do they benefit from the improved energy efficiency by
maintaining internal temperatures at the levels of their previous dwellings or
do they "take back" the improvements in energy efficiency in some way by,
say, wearing lighter clothes in winter as a consequence of higher internal
temperatures?
This chapter compares the actual performance of BedZED dwellings in use
(Phase 2) with the performance of dwellings occupied prior to moving to
BedZED (Phase 1) by comparing actual internal temperatures and energy
used and an evaluation of occupant responses in two surveys.
Phase 1 comprised three elements: an NHER survey, an occupant survey
and temperature monitoring. The participants and properties included in
these elements vary from element to element depending on the occupant’s
particular circumstances. The reasons for not completing one element were
varied: some participants were staying in shared households or
hostels/hotels where it was not practical to carry out temperature monitoring
or to relate the monitoring back to the specific participants who moved into
BedZED; other participants were unable to take part owing to short
timescales between exchanging contracts on a BedZED property and moving

244
in; other participants in the main Phase 2 monitoring were unwilling to take
part until they moved in.
Table 12.1 summarises the participants in each of the Phase 1 cohorts. Full
details are in Table 6.1.
Table 12.1: Phase 1 Cohorts
Cohort 1 Building B D F J N P Q R S V X AB
Cohort 2 Monitoring B F L M N P Q R S V AB
Cohort 3 Survey B F J M N P Q R S V
All cohorts B F N P Q R S V
To ensure consistency in data analysis, individual comparisons between
Phase 1 and Phase 2 are made according to the relevant cohort and not to
the Phase 1 sample as a whole.
The whole Phase 1 sample comprised 14 households prior to moving to
BedZED. Cohort 1 comprised participants who had an NHER survey
completed for their pre-BedZED dwelling. In total, twelve NHER surveys
were completed on pre-BedZED homes and the NHER surveyor also
calculated indicative SAP equivalent score using SAP v9.6. Cohort 2
comprised 11 participants who had data loggers installed in living rooms and
bedrooms collecting temperature and RH monitoring at 30 minute intervals
for a period of approximately four to six weeks. Cohort 3 comprised ten
participants who completed the occupancy survey. One of the participants
(AB) did not complete the survey at the end of Phase 2 and therefore the AB
occupant survey results are not included in the longitudinal comparison.
12.2 Building Analysis
Table 12.2 shows the range of different age and constructions of the pre-
BedZED dwellings contrasting with the BedZED dwellings that were all
constructed to the same design and standards. The pre-BedZED properties

245
were distributed across the full range of dwelling ages. Half of the dwellings
were built post-1982 and so would have been built with some insulation.
Table 12.2: Construction date for Phase 1 dwellings
Age of construction Number of dwellings
pre-1900 1
1900-29 2
1930-49 1
1950-65 1
1966-76 1
1982-90 2
1991-95 2
1995+ 2
A comparison of Phase 1 (pre-BedZED) and Phase 2 (BedZED) buildings
surveyed in Cohort 1 is provided at Table 12.3.
Table 12.3: Cohort 1 building comparison
Property SAP £/yr energy
(NHER)
Heat Loss
a
(U-value) W/m
2K
pre-BZ
m2 NIA
BZ
m2 GIA
BZ
m2 NIA
(proxy)
% change in property size
B 50.0 290 0.6 29.8 46.3 39.4 32.1
D 29.0 611 1.8 53.0 108.7 92.4 74.4
F 55.0 272 0.8 31.3 46.3 39.4 25.8
J 40.0 310 2.3 53.4 46.3 39.4 -26.3
N 35.0 459 2.3 52.3 61.9 52.6 0.7
P 61.0 392 0.6 56.5 108.7 92.4 63.5
Q 58.0 322 0.8 37.7 69.5 59.1 56.7
R 51.0 713 1.6 100.9 154.5 131.3 30.2
S 66.0 391 1.7 59.4 69.5 59.1 -0.5
V 29.0 466 1.1 49.5 108.7 92.4 86.7
X 61.0 273 0.73 32.33 108.7 92.4 185.8
AB 68 242 0.95 34.34 46.1 39.2 14.1
Mean 50.3 392.5 1.3 49.2 81.3 69.1 45.3
aAverage U-value of property from NHER survey
246
Table 12.3 illustrates that the mean average SAP of the pre-BedZED cohort
was 50.3. By comparison, the SAP score calculated in 1999 by Arup for
Building Regulations approval for a generic two-storey BedZED dwelling of
100m2 was 150, reported as 100 in line with SAP reporting protocols (Arup,
1999b). This compared to an average SAP for English housing of 46.7 in
2001 (DCLG 2013). So the previous dwellings occupied by the BedZED
residents who took part in this study were only slightly higher scoring on the
SAP rating scale than the English average and the highest scoring being
property AB with a SAP of 68.
Of particular interest is the finding that, with only two exceptions (J,S) the
majority of this group moved into larger properties than before, a mean
increase in property size from 49m2 to 69m2 and an overall increase in floor
area of 45%. By way of comparison, the national average property size of
87m2 at the time being even higher than this BedZED cohort (DCLG 2006b).
For this cohort of participants, there is a clear trend towards larger properties
as discussed in Chapter 2. Other things being equal, additional floor area
would be expected to lead to higher overall energy usage as a function of
increased demand for space heating.
12.3 Comparison of Internal Temperatures
For the pre-BedZED Phase 1 dwellings, data were collected in 2002 for
periods between one and twelve weeks with a mean period of 8½ weeks.
Phase 2 monitoring at the BedZED properties took place over 23 months.
Phase 1 data were principally collected over the cooler months of the year
and it is possible to compare the performance of the pre- and post-BedZED
dwellings when external temperatures were 5°C. However there was
insufficient monitoring data collected during the warmer months to compare
the two Phases at higher external temperatures. Cohort 2 (properties
B,F,L,M,N,P,Q,R,S,V,AB) provides a direct comparison of pre- and post-
BedZED internal temperatures.
Internal temperature comparisons are shown in Figures 12.1 and 12.2 for
bedrooms and living rooms respectively.

247
Figure 12.1: Comparison of bedroom temperatures Phases 1 and 2 standardised to external temperature of 5°C
Figure 12.1 shows mean bedroom temperatures when external temperatures
were 5ºC during Phase 1 (pre-BedZED) and Phase 2 (BedZED) for Cohort 2.
All properties that had measurements for both phases experienced higher
internal temperatures at BedZED apart from properties N, R and S. The
difference in internal temperatures between Phases 1 and 2 ranges from -
+3.6ºC (N) to -6.6ºC (M), with a mean difference of +0.8ºC.
The participant in property N experienced a reduction of 3.6ºC at BedZED
compared to their former home. They moved from an older flat conversion
built between 1900 and 1920 with a SAP rating of 35. The pre-BedZED
property was 52.3m2 NIA which broadly equates to the 61.9m2 GIA BedZED
flat assuming that the NIA/GIA efficiency ratio of the pre-BedZED property
was 85% (see discussion of NIA/GIA in Chapter 6). In their former home,
the participant of property N spent about £200-300 per annum on energy bills
compared to £300-400 at BedZED. They rated their overall satisfaction with
the heating, hot water and ventilation at their former home as “poor”
compared to a rating of “good” at BedZED. In both occupancy surveys, they
15
16
17
18
19
20
21
22
23
M R2 P AB V R1 F Q S B L N Mean
Me
an 2
4 h
ou
r in
tern
al t
em
pe
ratu
re
BedZED Pre-BedZED
248
stated that they wore heavy clothing indoors during the winter. It is
interesting that they are paying about £100 per annum more for energy at
BedZED, experiencing lower internal temperatures and are more satisfied
overall with the heating, hot water and ventilation.
The participant in property S experienced a reduced internal temperature at
BedZED of 0.3ºC compared to their former home. They had previously lived
in a flat built between 1966-76 with a SAP rating of 66 and which measured
59.4m2 NIA or 68.3m2 GIA assuming that NIA/GIA efficiency ratio of the pre-
BedZED property was 85% (as above) and which broadly equates to the new
BedZED flat which measured 69.5m2 GIA. At their previous home, the
participant in property S assessed their heating, hot water and ventilation as
“OK”. They reported that their living room was too cold in winter. At
BedZED, they reported that the overall heating, hot water and ventilation
were “poor”. Here they found the bedrooms too cold in winter. The mean
internal temperature recorded in their previous property was 20.1 ºC and at
BedZED was 19.8ºC, that is, just below the design temperature of 20ºC.
They also report that they wear medium weight clothing indoors in winter
compared to the thin layers at their previous home. The participant did not
answer the question on energy costs for BedZED and so no comparison can
be drawn about costs. The reason for their dissatisfaction could be attributed
to the fact that the bedroom does not achieve the design temperature and
this could have affected the participants’ comfort despite them wearing
heavier clothing after moving into BedZED.
Occupant M experienced the biggest improvement in internal temperatures,
increasing from 15.6ºC in their former home to 22.2ºC at BedZED. They
rated the heating, hot water and ventilation at BedZED as Very Good (the
highest rating) and stated that they wore thin layers at BedZED compared to
medium layers previously.

249
Figure 12.2: Comparison of living room temperatures Phases 1 and 2 standardised to external temperature of 5°C
Figure 12.2 shows mean living room temperatures when the external
temperature was 5ºC during Phase 1 (pre-BedZED) and Phase 2 (BedZED).
All properties recorded higher mean living room temperatures at BedZED
apart from Property Q. The difference in internal temperatures between
Phases 1 and 2 ranges from -4ºC to 6.6ºC, with a mean difference of 2.5ºC,
higher than the 0.8ºC increase for bedroom temperatures.
The mean internal temperature of the living room during Phase 1 for Property
Q was 22.5ºC compared to 18.5ºC, at BedZED. Property Q was built in
1995 and had a SAP rating of 58. Reviewing occupant Q’s responses to the
occupant survey at the end of Phase 2, they stated that they were satisfied
overall with the heating and hot water at BedZED. They reported some
concern about winter temperatures but this appears to be confined to the
sunspace (which was not designed as a living space) and the occupant also
reported that they used a back-up space heater for about two hours a day in
the winter months. Their previous home had been a flat built around 1995
with electric space heating. This would have been relatively well-insulated,
15
16
17
18
19
20
21
22
23
P M S V L R AB F B N Q Mean
Me
an 2
4 h
ou
r te
mp
era
ture
BedZED Pre-BedZED

250
likely to have been built to the 1985 Building Regulations. They report that
their annual energy costs at BedZED are about £200-£300 which was the
same cost range that they reported in the Phase 1 survey based on their
previous home. The principal change for this occupant between the two
surveys is that they report that they now wear medium-weight clothing in the
winter compared to just a thin layer at their previous home. This could
account for the reduced internal temperature but overall satisfaction with
BedZED. They also appear to have gained additional floor area in their new
home. Although still a two-bedroomed flat, their floor area has increased
from 37.7m2 NIA to 69.5m2 GIA, an increase of approximately 38%
(assuming NIA/GIA efficiency ratio of 85%, as above). This may have also
contributed to their overall satisfaction since they were paying the same
energy costs for more space albeit they had to adapt their behaviour through
the clothes they wore in response to the internal temperature.
Figures 12.1 and 12.2, plotting bedroom and living room temperatures for
both the BedZED and pre-BedZED properties, show little correlation. For
example, the warmest BedZED property was not the warmest pre-BedZED
property and the coldest BedZED property was not the coldest pre-BedZED
property. This suggests that internal temperature is not a simple variable
selected by the participants but the result of a more complex interaction
between fabric, services and occupants. Love (2014) found that retro-fitting
better insulation to existing dwellings resulted in higher temperatures and
shorter heating times. She concluded that the increased temperatures were
a result of better thermal efficiency of the building fabric rather than occupant
behaviour change because temperatures were higher when the heating was
off. It is seen later in the chapter that BedZED participants did not consider
that they could control the services within their homes.
Table 12.4 summarises the changes in internal temperatures between
Phases 1 and 2 Cohort 2 for bedrooms and living rooms.
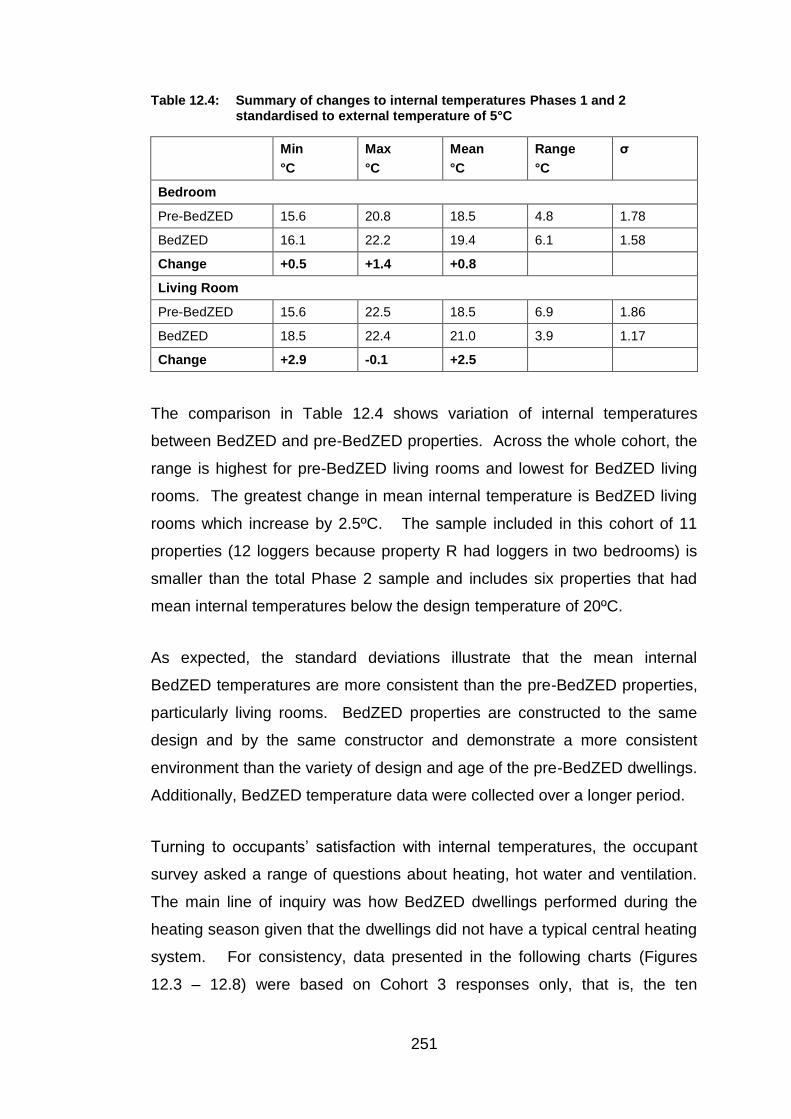
251
Table 12.4: Summary of changes to internal temperatures Phases 1 and 2 standardised to external temperature of 5°C
Min
°C
Max
°C
Mean
°C
Range
°C
σ
Bedroom
Pre-BedZED 15.6 20.8 18.5 4.8 1.78
BedZED 16.1 22.2 19.4 6.1 1.58
Change +0.5 +1.4 +0.8
Living Room
Pre-BedZED 15.6 22.5 18.5 6.9 1.86
BedZED 18.5 22.4 21.0 3.9 1.17
Change +2.9 -0.1 +2.5
The comparison in Table 12.4 shows variation of internal temperatures
between BedZED and pre-BedZED properties. Across the whole cohort, the
range is highest for pre-BedZED living rooms and lowest for BedZED living
rooms. The greatest change in mean internal temperature is BedZED living
rooms which increase by 2.5ºC. The sample included in this cohort of 11
properties (12 loggers because property R had loggers in two bedrooms) is
smaller than the total Phase 2 sample and includes six properties that had
mean internal temperatures below the design temperature of 20ºC.
As expected, the standard deviations illustrate that the mean internal
BedZED temperatures are more consistent than the pre-BedZED properties,
particularly living rooms. BedZED properties are constructed to the same
design and by the same constructor and demonstrate a more consistent
environment than the variety of design and age of the pre-BedZED dwellings.
Additionally, BedZED temperature data were collected over a longer period.
Turning to occupants’ satisfaction with internal temperatures, the occupant
survey asked a range of questions about heating, hot water and ventilation.
The main line of inquiry was how BedZED dwellings performed during the
heating season given that the dwellings did not have a typical central heating
system. For consistency, data presented in the following charts (Figures
12.3 – 12.8) were based on Cohort 3 responses only, that is, the ten
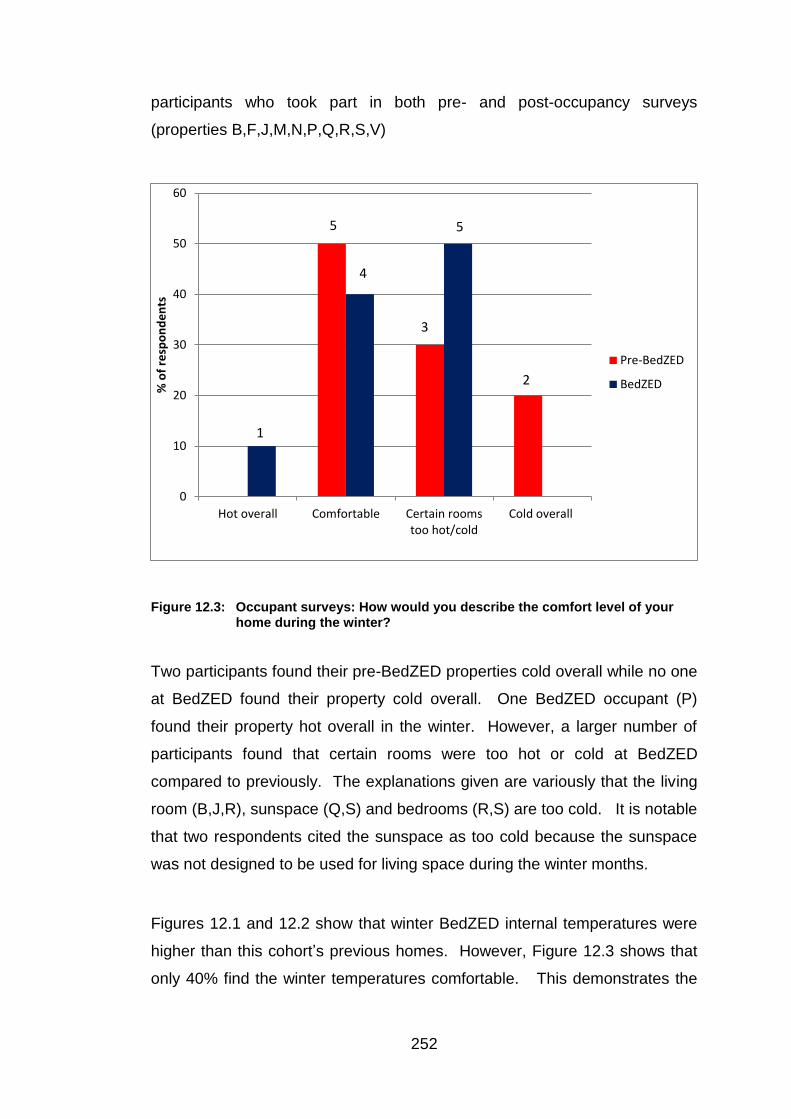
252
participants who took part in both pre- and post-occupancy surveys
(properties B,F,J,M,N,P,Q,R,S,V)
Figure 12.3: Occupant surveys: How would you describe the comfort level of your home during the winter?
Two participants found their pre-BedZED properties cold overall while no one
at BedZED found their property cold overall. One BedZED occupant (P)
found their property hot overall in the winter. However, a larger number of
participants found that certain rooms were too hot or cold at BedZED
compared to previously. The explanations given are variously that the living
room (B,J,R), sunspace (Q,S) and bedrooms (R,S) are too cold. It is notable
that two respondents cited the sunspace as too cold because the sunspace
was not designed to be used for living space during the winter months.
Figures 12.1 and 12.2 show that winter BedZED internal temperatures were
higher than this cohort’s previous homes. However, Figure 12.3 shows that
only 40% find the winter temperatures comfortable. This demonstrates the
0
10
20
30
40
50
60
Hot overall Comfortable Certain roomstoo hot/cold
Cold overall
% o
f re
spo
nd
en
ts
Pre-BedZED
BedZED
1
5
4
3
5
2

253
difference between actual measured readings and occupants’ expectations of
comfort, particularly in a new dwelling.
Section 4.15 described how the space heating and control system at
BedZED differs from other dwellings with traditional central heating systems
and thermostatic controls that are visible in the living space and directly
adjusted by the occupants. Given the complexity of adjusting the controls at
BedZED, a more likely action to increase internal temperatures above the
design temperature would be for the occupants to use additional space
heaters. A number indicated that they did so in the Phase 2 post-occupancy
survey although the original design assumed that occupants would only do
this if babies or the elderly were living there.
To examine this in more detail, Figure 12.4 shows how effective cohort 3
considered the controls to be at maintaining comfortable temperatures in the
home.
Figure 12.4: Occupant surveys: How effective are the controls at maintaining comfortable temperatures in the home?
0.0
10.0
20.0
30.0
40.0
50.0
60.0
70.0
Ineffective Fairlyineffective
Fairlyeffective
Effective Notapplicable
% o
f re
spo
nd
en
ts
Pre-BedZED BedZED
3
1 1 1
3
6
2
3
3

254
Figure 12.4 shows that five participants said that the BedZED controls were
ineffective or fairly ineffective, three said that the question was not applicable
and two said that they were effective or fairly effective. Overall 50% of
BedZED participants rated the controls fairly ineffective or worse compared
to the 30% of the same group of participants before they moved into
BedZED.
The “Not Applicable” answer was not supplied in the survey, and so it is
interesting that three BedZED respondents stated that this question was not
applicable to them. This suggests a lack of awareness that the controls
could be adjusted. A further question about the ease of operation of the
controls at BedZED suggests that the participants did not find the controls
easy to operate. These results are shown in Figure 12.5.
Figure 12.5: Occupant surveys: How easy do you find it to operate the heating controls?
Despite the variety of properties in the pre-BedZED sample, it is notable that
Figure 12.5 shows that 80% of respondents found the controls easy or fairly
easy to operate in their previous homes compared with only 10% at BedZED.
0
10
20
30
40
50
60
70
80
easy fairly easy OK difficult verydifficult
notapplicable
% r
esp
on
de
nts
Pre-BedZED
BedZED
7
1 1 1 1
3
4
2

255
6 of the 10 respondents found the BedZED controls difficult to adjust or
considered the question to be irrelevant.
The comments provided to this question from the whole Phase 2 sample (i.e.
not only confined to this longitudinal sample of ten participants) are also
informative here. One respondent said that they had not received full
operating manuals for the thermostatic controls; another occupant said that
“there aren’t really any controls”. No explanatory comments were received
from participants F and P who stated that the question was not applicable
although the controls on the heated towel rail and the hot water cylinder
indirectly control the waste heat from both and which constitute some of the
incidental gains that provide space heating at BedZED. The BedZED
Residents’ Manual (Peabody Trust 2002) provides information about all these
controls but it is not known whether the respondents of this survey had read
and understood the manual. In conclusion, this suggests a missed
opportunity to provide additional information to BedZED occupants about
how to get the best out of their homes, particularly given the innovative
design of the heating system.
Turning to the provision of additional space heating, participants were asked
whether they used any supplementary heating and the results are in Figure
12.6.

256
Figure 12.6: Occupant surveys: Do you use any additional form of heating?
For their pre-BedZED dwelling, one participant (S) said that they had
additional heating in the bedroom and bathroom, however the incidence has
only been included once in the above table (recorded against bedrooms). It is
interesting that three respondents said they used additional heating in
BedZED living rooms compared with only two in the pre-BedZED properties
and Table 12.4 showed that the BedZED living room temperatures were
2.5°C higher than previous living rooms and BedZED bedrooms 0.8°C higher
than previous bedrooms. Some of this gain will have resulted from the
additional space heating but overall there are fewer participants (five) using
additional space heating at BedZED than before (seven). However, it had
been assumed that BedZED occupants would not use any supplementary
space heating unless there were babies or elderly people living at the
property.
Figures 12.7 and 12.8 compare mean internal living room temperatures to
SAP ratings and mean average U-values of the pre-BedZED properties in
Phase 1 Cohort 1 dwellings respectively for which data were available
0
10
20
30
40
50
60
None Living Room Bedroom Bathroom Other
% o
f re
spo
nd
en
ts
Pre-BedZED
BedZED
3
5
2
3 3
1
2
1

257
(properties B,F,J,N,P,Q,R,S,V,AB) to establish whether there is a correlation
between the building design and actual temperatures measured. Each data
point represents one property.
Figure 12.7: Phase 1 dwellings - Living Room Temperatures compared to SAP
R² = 0.0188
15
16
17
18
19
20
21
22
23
15 25 35 45 55 65 75
Me
an
24
ho
ur
tem
pe
ratu
re w
he
n e
xte
rna
l te
mp
era
ture
is
5°C
SAP rating

258
Figure 12.8: Phase 1 dwellings: Living Room Temperatures compared to mean U-values
The line of best fit illustrates that the dwellings with higher SAP ratings have
circa 0.6°C higher internal temperatures and that properties with the lowest
U-value have circa 1.6°C higher temperatures. The charts indicate that no
linear relationship exists between the internal temperature in the pre-BedZED
properties and U-value (R2 = 0.085) or SAP (R2 = 0.019). The range of
internal temperatures observed is 5°C, from 15.8°C to 20.8°C. For example,
Property AB had the highest SAP rating of 68 and an internal mean
temperature of 16.4°C. Property V has the lowest SAP rating of 29 and
internal mean temperature of 19°C. The occupant of property V stated in the
Phase 1 (pre-BedZED) survey that they used additional heating in the
bedroom for short periods of an hour during cold spells. The results of this
analysis provide some insight into the behaviour of the BedZED participants
and what they think about their previous dwellings. With only one pre-
BedZED property (Q) maintaining a 24-hour mean internal temperature of
over 20ºC, these temperatures are not excessive for the winter months.
R² = 0.0853
15
16
17
18
19
20
21
22
23
0 0.5 1 1.5 2 2.5
Me
an
24
ho
ur
tem
pe
ratu
re w
he
n e
xte
rna
l te
mp
era
ture
is
5°C
U-value W/m2K

259
The R2 values are very low and no firm conclusions can be drawn from the
comparisons of Phase 1 temperatures with the building design/fabric. The
poor correlation coefficients for the plots are indicative that there may be an
effect but it is a weak relationship given the small sample size
The Warm Front retro-fit study of circa 1,600 dwellings did find a relationship
between dwelling heat transfer characteristics and internal temperatures.
Following energy efficiency improvements to dwellings, internal temperatures
increased as occupants took back some of the improvement in the form of
higher internal temperatures (Hamilton, Davies, Ridley et al 2011). This
would not seem to apply to the BedZED study because the participants
surveyed did not seem to be confident in the operation of the heating
controls.
12.4 Comparison of Energy Usage
Energy usage data were collected for seven dwellings in the Phase 1
dwellings but lack of sub-metering meant that it was not possible to exclude
heat usage data from dwellings which were electrically heated. Table 12.5
compares the electricity usage for two properties, D and R, across Phases 1
and 2. D and R were selected for this comparison because their pre-
BedZED properties had heat provided by gas and so the electricity usage
figures for the two Phases are consistent.
Table 12.5: Comparison of Electricity Usage during Phases 1 and 2
Phase 1 Phase 2 % reduction
kWh/week kWh/week
D 101.50 71.12 30
R 253.15 146.69 42
For Phase 2, property R had sub-meters fitted and used approximately 12%
of total electricity on heat for immersion heaters, therefore the Phase 2 usage
for R has been reduced by 12% (see Table 7.3). Property D did not have
sub-meters installed in Phase 2 and the usage has therefore been adjusted

260
in line with Table 7.4, i.e. the electricity usage reduced by 18%. Table 12.5
shows that these two households significantly reduced their electricity usage
when they moved to BedZED. A-rated low energy white goods were
installed as standard at all BedZED properties as well as low energy lamps in
light fittings.
In both cases, participants D and R had moved into larger properties at
BedZED. While increased floor area is more likely to affect heat
requirements, it could also affect electricity consumption, particularly lighting
but also appliance use if the move were accompanied by an increase in the
size of the household. Accordingly, table 12.6 standardises electricity usage
data for property size and shows that when usage is standardised to floor
area, both households reduced their electricity use by over 50% on moving to
BedZED.
Table 12.6: Adjusted Comparison of Electricity Usage during Phases 1 and 2
Phase 1 Phase 2 % reduction
kWh/m2/week kWh/m
2/week
D 1.67 0.8 53
R 2.18 1.1 51
The number of appliances used by D is not known and it is therefore not
possible to assess whether there is any change in the number of appliances.
Occupant R used 9 appliances in Phase 1 and 8 in Phase 2. This appears to
be because they no longer have an oil-filled panel radiator.
In summary, the comparison shows that these households reduced their
electricity consumption when they moved to BedZED. It shows that if the
results from these two properties were representative, that the original design
aim to reduce electricity consumption at BedZED by 10% was comfortably
achieved.

261
12.5 Occupant Behaviour
In their post-occupancy evaluation of an EcoHomes “excellent” case study,
Gill, Tierney, Pegg et al (2010) found that energy-efficiency behaviours
account for 51% and 37% of the variance between dwellings in heat and
electricity consumption respectively. The comparison of occupant behaviour
between Phases 1 and 2 of this study aimed to find out whether participants
actively changed their behaviour to increase efficient energy use at BedZED.
In both surveys, participants were asked about how much clothing they
normally wore in the home in winter in order to assess whether they changed
their behaviour when they moved to BedZED. For example, if internal
temperatures were lower, were participants adding extra layers of clothing or
were they using additional heating and would either of these scenarios result
in lower satisfaction levels? The question asked "How much clothing do you
normally wear in the home in winter?" and the choice of responses was:
Just a thin layer, e.g. T-shirt, shirt or blouse
Medium layers, e.g. T-shirt/shirt and thin sweater/cardigan
Heavy layers, e.g. T-shirt/shirt and heavy sweater/fleece.
The results are in Figure 12.9.

262
Figure 12.9: Occupant surveys: How much clothing do you normally wear in the home in winter?
Figure 12.9 shows a shift of one person towards medium-weight clothing
from thin layers but it also shows a shift of one person from heavier-weight
clothing to medium-weight. One occupant (B) has been classified in the
medium weight bracket although they also responded positively to the heavy
layers question stating that they wear a fleece indoors during cold spells. If
that response had been included in the heavy layers category instead of
medium layers, the chart would have shown a positive shift towards wearing
heavier-weight clothes indoors.
With this small sample, it would be unreliable to conclude that BedZED
participants “took back” the improved environmental conditions by reducing
clothing layers rather than reducing their heating requirements further. And
we have seen from the questions about controls, that the BedZED
participants found it difficult to operate the heating (and hot water) controls.
The nature of the heating controls at BedZED was such that occupants were
not expected to regularly adjust temperature settings.
0
10
20
30
40
50
60
70
Thin layer Medium layers Heavy layers
% r
esp
on
de
nts
Pre-BedZED
BedZED
4
9
2
3
6
3
2

263
12.6 Overall Satisfaction with Heating, Hot water and Ventilation
In both Phases, participants were asked about how satisfied they were with
the heating, hot water and ventilation in their home. The results are
presented in Figure 12.10.
Figure 12.10: Occupant surveys: How satisfied are you with the heating, hot water and ventilation in your home?
Overall, responses show that the majority is satisfied with the heating, hot
water and ventilation in their properties with 80% saying that the systems are
good or very good. In comparison, only 40% rated their pre-BedZED
properties as good. There is a clear trend towards more satisfaction with the
heating, hot water and ventilation than previously. One respondent (R)
stated that they were “not very satisfied but it was OK” and cited the fact that
the CHP was not working. This response was allocated to the “OK”
category. There were no other comments provided by other respondents to
this question although some of the general responses at the end of the
survey are informative. Two respondents cite summer overheating as an
0
10
20
30
40
50
60
Very good Good OK Poor Very poor
% r
esp
on
de
nts
Pre-BedZED
BedZED
3
4
5
4
1 1
1
1 1
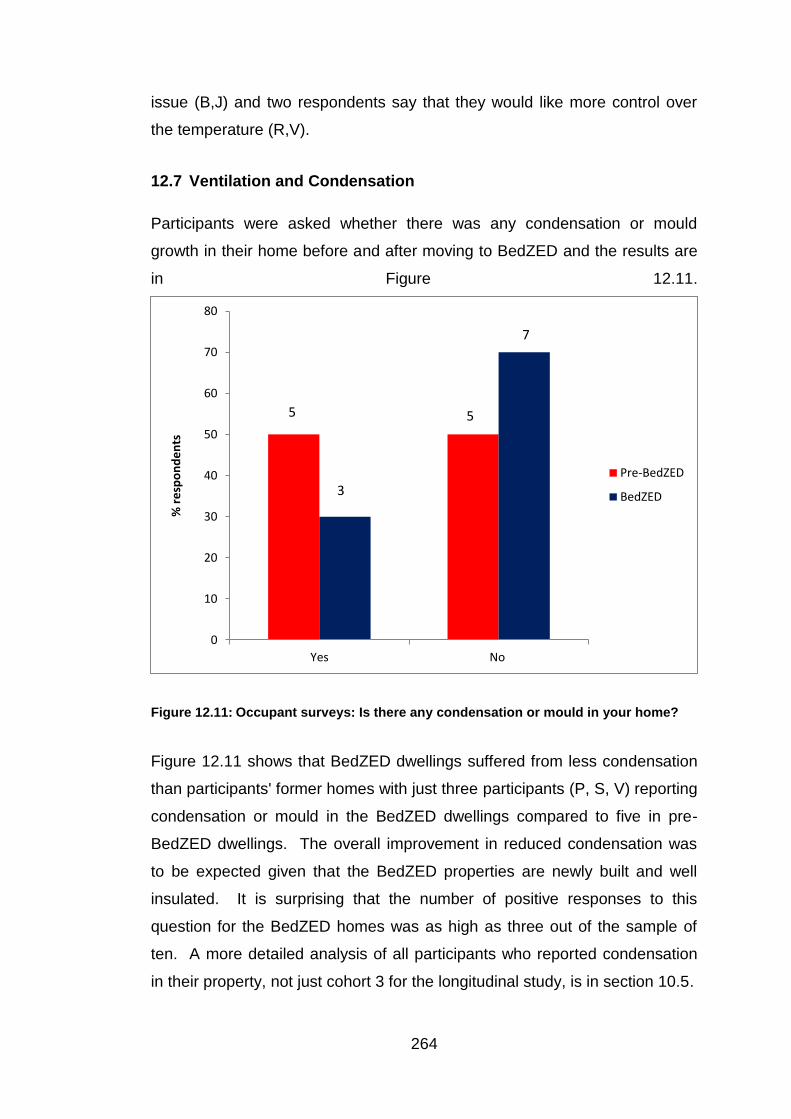
264
issue (B,J) and two respondents say that they would like more control over
the temperature (R,V).
12.7 Ventilation and Condensation
Participants were asked whether there was any condensation or mould
growth in their home before and after moving to BedZED and the results are
in Figure 12.11.
Figure 12.11: Occupant surveys: Is there any condensation or mould in your home?
Figure 12.11 shows that BedZED dwellings suffered from less condensation
than participants' former homes with just three participants (P, S, V) reporting
condensation or mould in the BedZED dwellings compared to five in pre-
BedZED dwellings. The overall improvement in reduced condensation was
to be expected given that the BedZED properties are newly built and well
insulated. It is surprising that the number of positive responses to this
question for the BedZED homes was as high as three out of the sample of
ten. A more detailed analysis of all participants who reported condensation
in their property, not just cohort 3 for the longitudinal study, is in section 10.5.
0
10
20
30
40
50
60
70
80
Yes No
% r
esp
on
de
nts
Pre-BedZED
BedZED
5
3
5
7
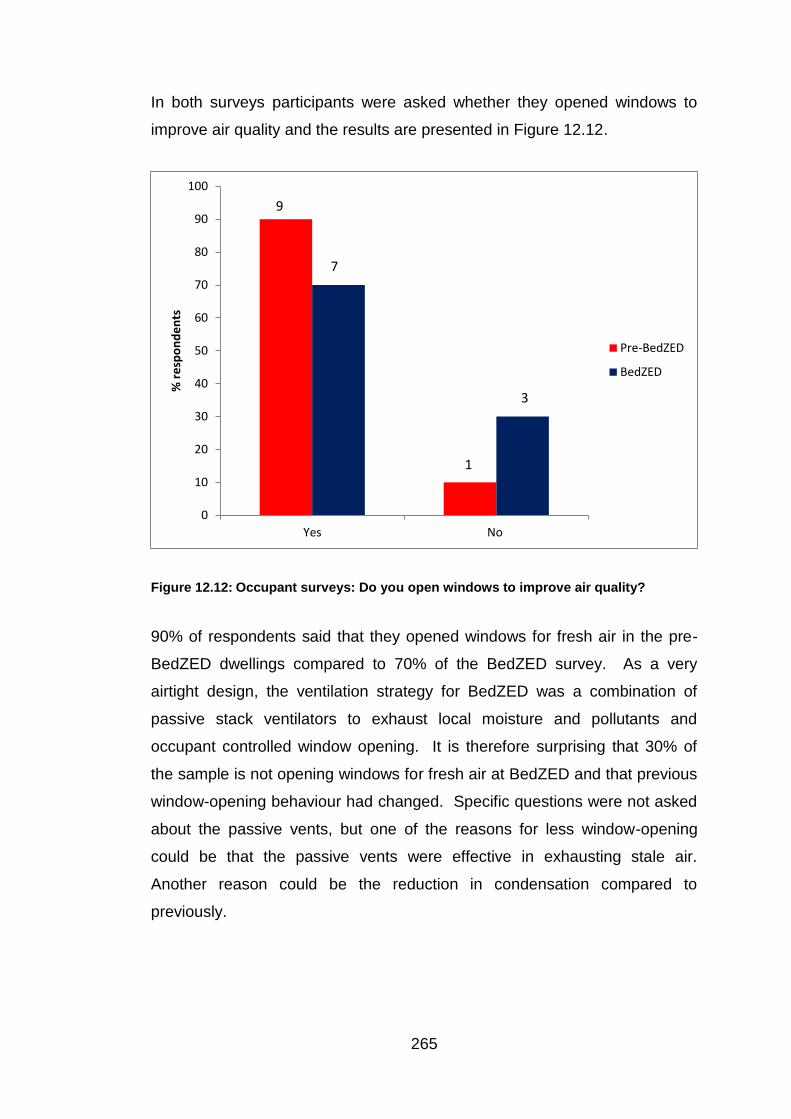
265
In both surveys participants were asked whether they opened windows to
improve air quality and the results are presented in Figure 12.12.
Figure 12.12: Occupant surveys: Do you open windows to improve air quality?
90% of respondents said that they opened windows for fresh air in the pre-
BedZED dwellings compared to 70% of the BedZED survey. As a very
airtight design, the ventilation strategy for BedZED was a combination of
passive stack ventilators to exhaust local moisture and pollutants and
occupant controlled window opening. It is therefore surprising that 30% of
the sample is not opening windows for fresh air at BedZED and that previous
window-opening behaviour had changed. Specific questions were not asked
about the passive vents, but one of the reasons for less window-opening
could be that the passive vents were effective in exhausting stale air.
Another reason could be the reduction in condensation compared to
previously.
0
10
20
30
40
50
60
70
80
90
100
Yes No
% r
esp
on
de
nts
Pre-BedZED
BedZED
9
7
1
3

266
Since air-tightness is an important element of the building design for BedZED
participants were also asked about the draughtiness of their homes in both
surveys and the results presented in Figure 12.13.
Figure 12.13: Occupant surveys: Do you consider your home to be draughty?
There is a clear reduction in the incidence of draughts in the BedZED survey
compared to the pre-BedZED survey. The pre-BedZED properties were of
varying ages and standards of construction and half were reported to be
draughty by the participants surveyed. In the post-occupancy survey, only
one participant (S) out of the ten reported that their BedZED dwelling is
draughty and the cause of the draughts is the windows. No further
explanation is offered although an occupant not included in this longitudinal
comparison, (G), cited problems with seals to roof lights. It is not clear
whether this snagging issue was also the cause of the draughts experienced
by occupant S.
0
10
20
30
40
50
60
70
80
90
100
Yes No
% o
f re
spo
nd
en
ts
Pre BedZED
Post BedZED
5
1
5
9
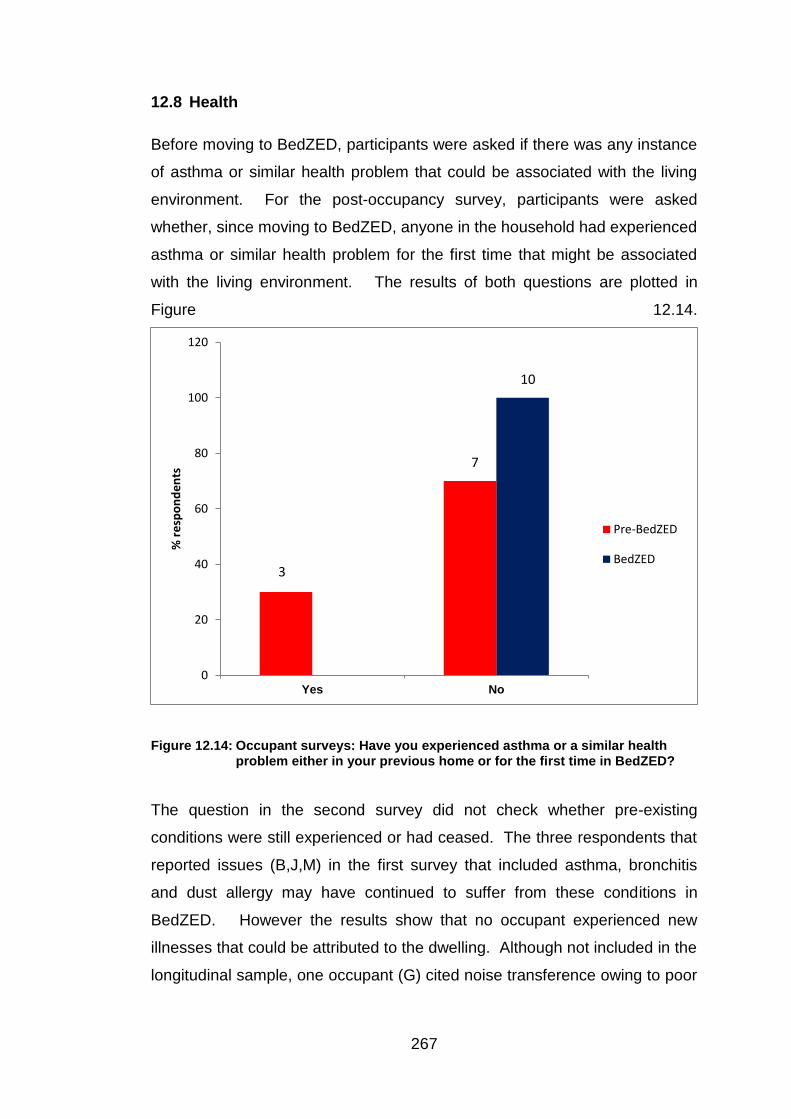
267
12.8 Health
Before moving to BedZED, participants were asked if there was any instance
of asthma or similar health problem that could be associated with the living
environment. For the post-occupancy survey, participants were asked
whether, since moving to BedZED, anyone in the household had experienced
asthma or similar health problem for the first time that might be associated
with the living environment. The results of both questions are plotted in
Figure 12.14.
Figure 12.14: Occupant surveys: Have you experienced asthma or a similar health problem either in your previous home or for the first time in BedZED?
The question in the second survey did not check whether pre-existing
conditions were still experienced or had ceased. The three respondents that
reported issues (B,J,M) in the first survey that included asthma, bronchitis
and dust allergy may have continued to suffer from these conditions in
BedZED. However the results show that no occupant experienced new
illnesses that could be attributed to the dwelling. Although not included in the
longitudinal sample, one occupant (G) cited noise transference owing to poor
0
20
40
60
80
100
120
Yes No
% r
esp
on
de
nts
Pre-BedZED
BedZED3
7
10

268
acoustic insulation between dwellings and said that this was affecting their
sleep and their general health overall.
It would have been useful to know whether any of the participants in the first
survey who reported some health problems had experienced any change in
those problems. However this question was not put to participants.
12.9 Energy Bills
In both surveys, participants were asked about their fuel bills, whether they
were aware of how much they were spending on fuel and the actual amount
that they spent. The results are in Figure 12.15.
Figure 12.15: Occupant surveys: Do you know how much your annual fuel bills are?
The reason why one participant (P) was unsure about their bills in the pre-
BedZED dwelling was because fuel costs were included in their rent.
Occupant P did not answer the question in the post-occupancy survey and so
was allocated to the “other” category to maintain the integrity of the
comparative sample sizes. It is difficult to draw direct comparisons between
0
10
20
30
40
50
60
70
Yes No Other
% r
esp
on
de
nts
Pre-BedZED
BedZED
5
6
3 3
2
1

269
pre- and post-BedZED occupancy because BedZED bills were for electricity,
heat and also water charges, whereas prior to BedZED, bills could have
included gas bills as well as electricity but did not include water bills. What
is striking about this comparison is that six BedZED participants said that
they were clear about how much their bills were when at the time there were
issues with the operation of the CHP system serving the development. More
responses would have been expected like that from occupant R who
answered “other” to this question in the Phase 2 survey, stating that they
were aware of their fuel bills when they first moved in but they had
subsequently become confusing.
12.10 Appliance Use
Figure 12.16 shows the number of electrical appliances in each dwelling for
each Phase. The purpose of this comparison was to see if the move to
BedZED prompted changes in the number of electrical appliances used.
Figure 12.16: Occupant survey - number of appliances
0
1
2
3
4
5
6
7
8
9
10
B F J M N P Q R S V
Nu
mb
er
app
lian
ces
Pre-BedZED BedZED

270
There was an increase in the total number of appliances used at BedZED by
the longitudinal cohort from 47 to 52. At an individual dwelling level, five
participants increased the number of appliances used, three reduced the
number and two were unchanged. The biggest change was occupant M who
increased from only two appliances (a fridge and a TV) to five appliances.
12.11 Longitudinal Study Conclusions
The purpose of this chapter was to provide evidence to answer the fifth
research question for this study: have participants changed how they use
energy at home as a result of moving to the new development?
At the time of the study, this was the first longitudinal study of a group of
occupants moving from older dwellings to new built dwellings. The main
conclusion is that, on average, across the longitudinal cohort, the new
BedZED homes were 2.5°C warmer in the living rooms and 0.8°C warmer in
the bedrooms at an external temperature of 5°C compared to previous
homes. The proportions of this rise attributable to a direct “comfort taking” is
difficult to judge particularly given the participants’ reports that they do not
consider they can easily control internal temperatures. Participants’ overall
satisfaction with the heating, hot water and ventilation increased from 40% in
their former homes to 80% at BedZED.
The higher temperatures are in large part due to the design of the property
and its systems which made it difficult for the participants to maintain higher
or lower temperatures than the design temperature. BedZED participants
were less satisfied with their ability to control the heating, hot water and
ventilation than in their previous homes. Some participants adjusted clothing
to compensate and others relied on pro-active window opening which was
part of the overall design philosophy. People do like to be able to control the
heating and ventilation in their homes. Better induction and information
about how to do so in passively-designed dwellings like BedZED is important
since control in these properties will require different behaviours to a
traditionally heated dwelling with room thermostats.

271
BedZED properties used less electricity than previous dwellings although this
is based on a small sample of two participants. BedZED properties suffered
from less condensation and mould than the previous properties but the level
experienced was still at an unacceptable level for new properties.
A further finding of the longitudinal study is that most of the participants
included in the sample moved into a larger property at BedZED with an
overall increase in property footprint size of 45%. While the design of
BedZED reduced overall energy use compared to other newly built properties
(see Chapter 7), if this trend for larger properties were extrapolated nationally
the increase in energy use from larger dwelling footprints could offset energy
savings made from efficient design. That said, the average size of BedZED
properties was lower than the national average.

272
Chapter 13 Discussion
13.1 Introduction
The hypothesis for this study is “There is a performance gap between
predicted and actual energy performance in low energy dwellings and this is
due to occupant behaviour”. To test this hypothesis on the BedZED case
study, the following research questions were set:
How do the constructed units perform compared with the theoretical
design performance?
What is the difference, if any, between the constructed units and the units
as designed?
Why is there a difference?
What conclusions can be drawn about this and can the energy model or
design practices be changed to reflect this?
Have participants changed how they use energy at home as a result of
moving to the new development?
Energy modelling of building components and technologies normally
assumes perfect quality control during the manufacture and construction of
buildings and predictable use of the finished products by users. As buildings
become progressively more energy efficient any discrepancy between
modelling and actual energy used becomes more important. Energy
modelling does not predict design changes that are made during construction
but these changes can have a significant effect on the performance of the
completed system. Additionally, energy modelling makes assumptions
about occupant behaviours and human factors, which can also affect the
performance of the completed system. These assumptions are normally
based on limited or historical empirical evidence. However, this comparison

273
does illustrate the challenge in producing reliable data about energy use at
the early feasibility stage. Then as designs are developed in the detailed
design stage, the overall size of buildings and therefore the heat and
electricity demand can change considerably from original assumptions at the
feasibility stage. .
The results and analysis in Chapters 7 – 12 identify differences in the
performance of the BedZED dwellings compared to design and differences in
how the study participants used their BedZED dwellings compared to their
previous homes. This chapter discusses the key differences in the context
of the research questions.
13.2 Energy Usage
The results presented in Chapter 7 show that BedZED achieved its aim to
reduce electricity usage by 10% compared to standard dwellings. Total
energy use was 7% higher than designed, principally because of higher than
expected heat usage, but overall this is considered to be a successful
outcome.
BedZED did not meet its ambitious overall design target of 75
kWh/m2/annum, the 125 kWh/m2/annum achieved at BedZED being
considerably higher than the 75 kWh/m2/annum design target, but much
lower than the typical new building standard of 163 kWh/m2/annum of the
time. However, the BedZED total energy usage is broadly in line with the
Passivhaus standard of 120 kWh/m2/annum for total energy demand
described in Chapter 2 (Schnieders 2003, Cutland 2012).
13.3 Modelling and Measurement
The 75 kWh/m2/annum design target was based on a notional dwelling size
of 100m2 at the concept design stage. The overall footprint for BedZED at
7,615m2, which was used to calculate the site energy requirements and size
the CHP at the feasibility stage, was built out at 9,207m2, some 21% higher.
Given that the actual energy use is broadly in line with design (+7%) and the
274
floor area of BedZED considerably higher than design (+21%) it is concluded
that the 75 kWh/m2/annum design target should have been updated as the
design was developed.
The research questions are founded on a comparison between theory and
practice and key to this comparison is how measurement systems are
deployed. With regards to the fourth research question, this research has
identified a number of areas where the use of energy models and design
practices can be changed to effect improvements in the delivery of low
energy dwellings. This includes the method used to measure floor area; the
assumptions made about floor area during the different stages of design
(feasibility, outline and detailed design); and the assumptions made by
surveyors when completing EPCs.
There were three different measurement systems for property sizes used in
the study, all of them standard methods: the method used in SAP; NIA used
in NHER surveys and GIA used in the architectural drawings. It is not
possible to directly convert from one measurement system to another
although there are industry rules-of-thumb and they were used in this study.
It is recommended that energy models use consistent methods of
measurement in future to simplify energy analysis and reduce room for error.
The change in the overall footprint size of the BedZED scheme illustrates the
dynamic nature of the design development process. It is typical for a scheme
to be changed from inception to construction as a consequence of, for
example, planning, funding or technical constraints. It is therefore important
for the original energy models to be updated as the design is developed to
ensure that the design targets will still be met.
While the kWh/m2/annum metric is a useful way of comparing the energy use
of different schemes on a like-for-like basis, it does not account for the
different intensity of use between different sized households. Figure 7.3
shows that smaller dwellings (one- and two-bedroomed properties) have a
higher kWh/m2/annum than larger dwellings (three- and four-bedroomed
275
properties), illustrating the greater intensity of energy use by smaller
households. Table 2.1 presents data relating to population size, household
size and energy use by household. It shows that the number of households
is increasing faster than the population but that energy use by households is
falling in relative terms.
A basic parameter for normalising energy use is property size and yet the
different methods of calculating floor area have proved a challenge in
compiling these data. This highlights the problem in determining the
performance gap between theory and practice.
13.4 Adjusting for External Weather Conditions
The raw data collected in Phase 3 suggest a trend towards increasing heat
demand but when corrected to external temperatures using degree day data,
the trend reverses, thus illustrating the difficulties of interpreting actual
performance against design; the design target has to be normative whereas
real data fluctuates according to weather and occupancy. For measurement
of actual performance to be useful, it should take account of the external
weather conditions during the monitoring period so that data from one
season can be meaningfully compared to other seasons’ data. There are
standard methods for correcting data for weather fluctuations but these are
not routinely applied to domestic properties and are more complex in very
low energy properties.
13.5 Winter Temperatures
BedZED achieved its winter design temperature of 20°C and performed best
out of the low energy case studies analysed both for living rooms and
bedrooms. There is evidence that some occupants used supplementary
heating in winter but it is not possible to distinguish whether this was solely
when the CHP was non-operational. The Phase 2 study sample was asked
a number of questions about the heating and hot water in BedZED. To the
very specific question about the comfort level of their home during winter
276
(Table 10.9), eight out of the 19 participants who answered the question
chose Comfortable. A further eight chose “certain rooms too hot/cold”, two
chose “hot overall” and one (L) chose “other” stating that it was OK if sunny
but otherwise a bit cold in the living/sleeping space. Other respondents
quoted some rooms being too cold for example, the sunspace (Q) and the
rear bedroom (V).
It is interesting that the monitoring data show that there was no performance
gap in the mean average temperature of BedZED dwellings compared to
design but that the study participants have a different perception. This
highlights the difference between statistical averages and how people
actually experience comfort. In their answers to the survey, participants
highlight the cold spots (and hot spots) in their home but the questionnaire
requires them to select an overall (mean average) response.
13.6 Summer Temperatures
BedZED overheated in summer. Although a specific design target for
summer was not set, analysis of mean average temperatures during summer
months and a hot spell shows evidence of overheating. At 20°C external
temperature, all BedZED living rooms in the Phase 2 sample experienced
temperatures of between 3°C and 9°C higher than the external ambient
temperature. Of the 19 survey participants who answered the question
about how comfortable they found their home during the summer, five said
they found it comfortable overall but with some caveats (E stated that the
bedrooms got too hot and V stated that the living room got too hot). The
other 14 participants stated that it was too hot overall or certain parts of the
property were too hot. However, for context, BedZED bedrooms performed
better in hot weather compared to other low energy case studies analysed.
Design may play a part in the reasons for overheating. Hot water pipes from
the CHP were run underneath dwellings where practical in order to reduce
the heat losses between the CHP and the dwellings with any pipeline heat
losses inside buildings treated as incidental gains. While this is beneficial

277
during colder temperatures, it could contribute to overheating during hot
spells.
Another cause of the overheating could be a lack of understanding of how to
operate the (at the time) novel dwelling with passive design features in
particular, window opening. The literature highlights the importance of
window opening to reduce overheating. For this study, while all participants
surveyed confirmed that they opened windows to control temperatures, there
is some evidence that BedZED residents did not fully understand how to get
the best performance out of their homes in summer, in particular the use of
the sunspace as a buffer rather than a living space and the need to open
windows at night to cool down dwellings rather than during the day.
13.7 Human Factors
The variability of human response to comfort is illustrated by the comparison
of internal temperatures and occupant satisfaction levels. For the winter
temperatures, it was expected that there would be a correlation between
temperatures that achieved the winter design target and overall satisfaction
with heating and other systems, see Figure 10.3. A correlation was also
expected between the summer high temperatures and overall satisfaction
with heating and other systems, see Figures 10.4 and 10.5. However there
is no correlation between these measures.
There was clear dissatisfaction with the heating controls. Although the
controls enabled the BedZED properties to achieve the design temperature in
the winter months, survey participants expressed dissatisfaction with the
ability of the controls to maintain comfortable temperatures (Figure 12.4) and
the ease of operating the controls (Figure 12.5). The longitudinal study is
useful here because it clearly shows that the survey participants recognised
that their BedZED homes were warmer in winter than their previous homes
(Figure 12.3). But the survey participants rated the effectiveness of the
BedZED controls to heat their home (Figure 12.4) and the ease of operation
(Figure 12.5) more poorly than the controls at their previous homes. The
278
final question about survey participants’ overall satisfaction with the heating,
hot water and ventilation (Figure 12.10) highlights that the majority (80%) of
the longitudinal cohort rated these systems “Good” or “Very Good” at
BedZED compared with only 40% for their previous homes. It can be
concluded that the BedZED participants did not like the lack of
personalisation in the form of room thermostats that the BedZED controls
assumed and which are now standard for most UK dwellings.
At the time that BedZED was built, the average UK dwelling air infiltration
rate was 13.1 ach at 50 Pa. (Stephen 1998) and for newer properties, built
between 1987 and 1994, the average air infiltration was 9.6 ach at 50 Pa.
(Stephen 2000). At 2.5 ach at 50 Pa, BedZED displayed a good level of
airtightness, an important facet of the low energy passive design. A good
ventilation system is essential to provide fresh air and remove moisture and
the results of the airtightness test carried out for this study supports the
findings of other studies that the ventilation system is effective (Table 9.1).
However the occupant survey results indicate that almost half of the
participants who answered this question did not think the ventilation system
at BedZED was effective at removing moisture and smells. The survey also
shows that all participants employed active window opening to control the
temperature of their home but the internal temperature results during hot
spells indicate overheating. Other studies suggest that this is partly
attributable to a lack of understanding on when to open windows to achieve
optimum cooling. Taken together, these results indicate a gap between
actual measured performance and occupant perception.
There were reports by some of the participants that their homes suffered
from condensation. This was not borne out by the RH readings for those
properties (Table 10.24) except for property S that reported condensation in
the sunspace. The passive ventilation system did not extend into the
sunspaces and occupants would need to actively ventilate the sunspace, for
example by opening windows, to reduce condensation. Participants G, P
and S reported that condensation was a problem in the sunspace, and of
these three, only property S had a data logger installed in the sunspace and

279
this did record humidity levels conducive to condensation. It can therefore
be assumed that other occupants actively ventilated the sunspace to control
condensation.
It is interesting that the majority of survey participants said that the fuel dials
on display in kitchens to raise awareness of energy usage made no
difference to their behaviour (Figure 7.10) because this is contrary to the
literature (Darby 2008).
13.8 Design Changes during the Development Process
The principal design change during the BedZED development process was
the failure of the biomass CHP in the operational phase. This meant that the
CHP, which was to provide zero carbon energy to the development, did not
achieve its initial aim to be zero carbon. The designed contribution from
renewables, both biomass and PV, did not happen in practice and there are
many lessons to be learned for future zero carbon regulations if the UK is to
achieve its planned targets for carbon emissions in new buildings. If such
properties are to secure and maintain market value, changes are required to
the design, construction, operation and assessment of such buildings.
13.9 Zero Energy or Low Energy?
In a paper on domestic energy use and carbon emissions scenarios to 2050,
Utley and Shorrock (2005) stated that the ultimate goal is to achieve a carbon
neutral dwelling. Energy consumption should be as low as possible and
properties well insulated so that as little heat as possible is lost from the
structure. So was BedZED zero energy, zero carbon or low energy?
At its conception, the project had been called Beddington Zero Energy
Development, abbreviated to BedZED. Later, the full name of the project
was changed to Beddington Zero (Fossil) Energy Development presumably
to reflect the use of renewable energy rather than fossil fuels and/or grid
electricity.

280
It can be argued that the Zero (fossil) Energy Development name more
accurately reflects the aim of the project, which was to not use fossil fuels
rather than wholly eliminate the use of energy. However, the operational
failure of the biomass CHP and the conversion to gas meant that the majority
of energy used by the scheme was in fact fossil fuel.
The literature review in Chapter 2 discusses the taxonomy for developments
which include renewable energy production. There is presently a debate as
to whether it is preferable to connect such buildings to the national grid or for
them to remain “autonomous”. In the case of BedZED, it can be seen that
BedZED could not have been autonomous even if the CHP had been
successful since it was always planned to connect BedZED to the national
grid and supply and draw down grid energy according to fluctuations in site
energy demand. In their review of the scheme seven years after the
buildings were completed, Hodge and Haltrecht stated (2009) that it is not
sensible to say that all energy should be generated on-site in all cases. It
may be more practical and efficient for developers to focus on reducing the
demand for energy in their developments and to source the energy required
from renewable energy sources from the grid.
In summary, BedZED was not Zero Energy or Zero (fossil) Energy.
However, the actual energy use is very close to the Passivhaus standard and
therefore BedZED can be described as a low-energy building.
While the literature review in Chapter 2 found some confusion over
definitions of zero-energy buildings, it also found an increasing confidence on
the part of industry to apply zero-energy and low-energy principles and
technologies through the increasing number of such houses already built
from which to draw upon both in the UK and overseas.
13.10 Limitations of SAP models
The study challenges were not limited to the performance data collected.
Despite the improvements made to the SAP rating methodology during this

281
research period, it continues to have some limitations when applied to low
energy schemes like BedZED. Some of the original constraints of the early
method that did not, for instance, model thermal mass have now been
addressed. However the use of the RdSAP for producing EPCs for existing
buildings does not fit well with existing low energy buildings. It is essential
that these limitations are addressed if low energy buildings are to maintain
their marketability in future.
13.11 EPCs
The EPC assessments carried out at BedZED were inconsistent and
understated the low energy nature of the dwellings leading to potentially
unreliable labelling of low energy buildings. It was striking that from the 43
EPCs assessed for BedZED, the mean average energy usage was predicted
to be 175 kWh/m2/annum compared to the actual 125 kWh/m2/annum,
providing evidence of a performance gap between actual and reported
benefits in BedZED EPCs.
In addition to the need for the RdSAP to be reviewed, the skills of EPC
assessors when rating very energy efficient buildings are found to be
inconsistent. There is a need for more guidance and training for EPC
assessors on the assessment of low energy buildings. Occupants who may
have purchased a low energy BedZED property on the assumption of its low
energy credentials might find their premium eroded by a poor EPC rating and
this in turn could undermine the Government’s policy of zero carbon
buildings.
13.12 Longitudinal Study
The longitudinal occupant study enabled a further dimension to be applied to
the performance data analysed for Phase 2.
The BedZED dwellings included in this study achieved higher winter
temperatures than participants’ previous homes, BedZED living rooms were

282
2.5°C warmer and bedrooms 0.8°C warmer on average than the participants’
previous homes. Participants’ overall satisfaction with the heating, hot water
and ventilation increased from 40% in their former homes to 80% at BedZED.
The proportions of this increased internal temperature rise that can be
attributed to a direct “comfort taking” is difficult to judge given the participants’
views that they do not consider they can easily control internal temperatures.
This is in large part due to the fact that the design of the heating controls at
BedZED were quite prescriptive and it was difficult for participants to maintain
higher or lower temperatures than the design temperature. This is reflected
in answers to the question about participants’ ability to control the heating,
hot water and ventilation at BedZED and in their previous homes. The
comparison of Phase 1 and Phase 2 answers to this question (Figure 12.5)
shows that participants were less satisfied with the controls at BedZED than
formerly. Some participants adjusted clothing to compensate although there
was not a noticeable trend or change in people’s clothing habits. Some
participants relied on pro-active window opening to control temperatures
although the latter was part of the overall design philosophy. People do like
to be able to control the heating and ventilation in their homes. Better
induction and information about how to do so in passively-designed dwellings
like BedZED is important since control in these properties will require
different behaviours to a traditionally heated dwelling with room thermostats.
BedZED properties used less electricity than previous dwellings although this
is based on a small sample of only two participants. BedZED properties
suffered from less condensation and mould than the previous properties but
the level reported was still at an unacceptable level for new properties.
The most significant finding of the longitudinal study is that most of the
sampled participants moved into a larger property at BedZED with an overall
increase in property size of 45%. That said, the average size of BedZED
properties was lower than the national average. If this trend for larger
properties were extrapolated nationally the increase in energy use from
283
larger dwelling footprints has to the potential to offset energy savings made
from more efficient design.
13.13 Data
Answering the research questions required reliable data to enable the
comparison between that which was designed or modelled and the actual
performance. The challenge of interpreting actual energy usage from
suppliers’ data for Phase 3 of this study illustrates the need for a more
consistent approach. Data were supplied in a mixture of actual and
estimated consumption and Data Protection legislation prevented it being
compared to data collected for the sampled properties in the earlier phase.
Despite the fact that the data were also used for billing purposes, there was
difficulty obtaining consistent energy usage data for the BedZED scheme
with the result that one year’s data were not used in the study.
13.14 Discussion Conclusions
This chapter discussed the results presented in chapters 7 – 12 in order to
answer the research questions. The first two research questions relate to the
difference, if any, between the completed BedZED units compared to the
theoretical design.
Evidence has been supplied to show that the constructed units performed
according to the design on the key criteria of winter comfort, energy use and
airtightness. The units overheated in hot spells but did not perform
significantly worse than other low energy dwellings and the principal cause of
overheating is considered to be attributable to occupants not fully
understanding how to ventilate their homes optimally to cool them down.
Occupants were dissatisfied with the controls on their heating and hot water
systems and it is considered that this is because the controls were not
designed for the personalisation of comfort that most people now expect in
modern dwellings through, e.g., room thermostats.

284
13.15 Hypothesis Conclusion
The hypothesis for this study is “There is a performance gap between
predicted and actual energy performance in low energy dwellings and this is
due to occupant behaviour”. The study finds that there is a performance gap
in the following areas and for the following reasons:
BedZED dwellings overheated in hot temperatures and this is attributed
principally to the occupants’ lack of understanding about how to cool their
properties.
Actual energy use was broadly in line with the design although there was a
performance gap in the energy forecasts calculated by EPC assessors using
RdSAP software. The reason for this gap is thought to be due to the
inflexibility of the RdSAP tool in its application for very low energy buildings
like BedZED and also a lack of awareness by the EPC assessors about the
nature and design of low energy buildings like BedZED which resulted in
them overstating the energy usage.
There is a performance gap between the prescriptive design of the heating
system controls and the expectations of occupants who are used to more
personalised control of their living environment.

285
Chapter 14 Conclusions
14.1 Introduction
This research consists of a detailed case study of 24 dwellings in a zero-
energy development. Data collected included energy usage, internal
temperatures, air-tightness, RH readings, occupancy surveys and EPCs
issued at the point of sale/rental. The unique feature of the study was the
longitudinal aspect; the three phases of data collection and analysis that
span the full property life cycle of design, construction, occupation and point
of sale provide a rich source of information about BedZED. This chapter
contains the main conclusions from the study.
14.2 Principal Conclusions
The study found evidence of a performance gap between predicted and
measured energy performance but the gap was not as expected. The
literature relating to performance gaps finds that actual energy performance
is often significantly higher than standardised and theoretical performance
(Burman, Mumovic & Kimpian 2014). For BedZED, the actual energy usage
was broadly in line with design with overall energy use 7% higher than the
original concept design. However, the predicted energy usage in EPCs
carried out on almost half of the BedZED properties that have been let or
sold since 2008 is over-estimated by 40% compared to the measured results.
This is an important finding because it has the potential to undermine the
contribution that low energy properties can make to achieving the
Government’s statutory requirement to reduce carbon emissions by 80% by
2050 as set out in the 2008 Climate Change Act.
If we are to achieve the scale of carbon reduction required by 2050, then
energy usage data need to be more readily available to researchers in a
consistent format. Suppliers’ energy data compiled for Phase 3 of the study
and discussed in Chapter 7 were difficult to interpret and required significant
cleaning firstly by the landlord and then by the author. The data were
supplied in a mixture of actual and estimated consumption, which limited its

286
reliability in the data analysis. Supplier data have the potential to be a
comprehensive source of data for future studies but there is still work to be
done to ensure that data are captured consistently to enable such analysis.
BedZED achieved its design temperature during the heating season.
BedZED was the first large-scale housing development in the UK to be
constructed without dedicated central heating systems but with a requirement
to achieve a consistent level of comfort in the heating season. This is an
important finding that demonstrates housing can be built without whole house
heating systems and can perform to modern comfort expectations in the
heating season.
BedZED bedrooms overheated in hot weather. Living rooms were hotter
than other case studies. Given that a unique feature of BedZED was that
whole house heating was not installed, it is understandable why the focus
was on achieving the design temperature during the heating season. The
risk is that occupants will be more inclined to use mechanical cooling in
future hotter summers. At the time that BedZED was conceived, summer
overheating was not a major consideration for UK housing design. The
engineers did model both summer and winter temperatures in their pre-
construction energy modelling but a summer design temperature was not
explicitly stated in the concept design for BedZED. In future designers
should set a cooling season design temperature and model the effects of hot
spells. The 1995 Building Regulations in force during the design and
construction phase of BedZED did not require designers to limit the effect of
heat gains in the summer but the current edition of the Regulations does
require dwellings to have appropriate passive control measures to limit the
effect of heat gains on internal temperatures in the summer. It encourages
the use of window sizing, solar shading and high thermal capacity but does
not prohibit the use of mechanical cooling (HMG 2014).
This research found that the overheating might be partly explained by
participants not fully understanding how to cool their properties. It is ironic
that these early adopters of low carbon lifestyles may in fact be the greatest

287
losers if the rest of the world does not follow their lead. These occupants live
in properties that tend to overheat when the world does get warmer yet these
properties use less energy than other properties and so contribute less to
climate change.
The predicted rise in global temperatures and the health impacts of summer
hot spells mean that overheating is now an issue of concern for designers.
Since hot spells are likely to become more frequent as a consequence of
climate change, modelling should take account of hot spells as part of
designers’ adaptive strategy to ensure that dwellings will maintain a
reasonable level of comfort during cooling seasons without having to resort to
mechanical solutions. This needs to take account of the fact that UK
residents need to be briefed about how to use high-mass dwellings in hot
weather in order to minimise overheating and how to use sunspaces to
optimise comfortable conditions in the home.
BedZED achieved a good standard of air tightness, broadly in line with
design and good compared with other new properties built at the time.
However, reports of condensation and mould are of concern. All participants
opened windows regularly and there is no evidence that the passive vents
did not operate correctly. The incidents of mould and condensation recorded
by participants in this study are partly related to construction snags and partly
a lack of guidance on ventilating the sunspaces, which did not have passive
vents installed. It is essential that future projects have sufficient site quality
control to ensure that buildings are built as designed and any workmanship
issues rectified during construction. It is also essential that occupants are
provided with guidance about ventilating the sunspaces.
BedZED did not achieve its original design philosophy of zero energy nor its
subsequent zero (fossil) energy ambition. The principal reason for this is
because the prototype biomass CHP system could not be made to be
operational and had to be switched to gas-fired boilers. The secondary
reason, from the literature studied, is that the renewable energy from the
installed solar PV was less than expected. This has important lessons for the

288
Climate Change Act requirements to reduce carbon emissions and the 2010
recast of the Energy Performance of Buildings Directive, which requires all
new buildings to be nearly zero energy by 2020. The latest version of the
Building Regulations (HMG 2014) has set only modest improvements for
increased efficiency in the Conservation of Fuel and Power.
The construction industry does not use consistent measurement systems in
modelling and monitoring, making comparisons difficult. There were three
different measurement systems for property sizes used in the study: the
method used in SAP; NIA used in the NHER surveys; and GIA used in
architectural drawings. However it is not possible to directly convert from one
measurement system to another although there are industry rules of thumb
that have been applied in this study. Designers and energy modellers should
use consistent methods of measurement recommended by the RICS when
modelling low energy designs and these calculations should be updated
when the design is changed. This would ensure that future schemes are
modelled consistently and would facilitate subsequent monitoring and
comparison. The application of Building Information Modelling to future
schemes will enable consistent measurement approaches throughout the
whole development lifecycle of buildings.
It is important for designers of low energy, air-tight buildings to take account
of human factors. People like to have more personal control over the
temperature of their homes than the standard BedZED design gave them.
Study participants were not wholly clear about how to get the best out of their
innovatively designed homes. They did not feel confident in controlling the
heating and hot water systems or the different practices that are required for
a low energy dwelling, such as the use of the sunspace as a buffer rather
than a living space, and the need to open windows at night in hot weather to
cool down dwellings rather than during the day. This demonstrated how
design assumptions about occupant performance may cause different results
in actual performance during occupation. These practices, which are typical
in Mediterranean countries, need to be better explained to residents moving
into super-insulated dwellings like BedZED who may not be familiar with such

289
approaches. As new technologies are introduced such as super-insulation,
use of sunspaces and conservatories as buffer zones, custom and practice
may not change immediately resulting in problems such as overheating.
Modelling makes assumptions about human factors but these cannot be fully
predicted. Participants were broadly satisfied with the heating, hot water
and ventilation but less satisfied with the controls for these systems than their
previous dwellings. The fuel dials put on display in kitchens to raise
awareness of energy usage made no difference to the behaviour of the
majority of BedZED residents. In Chapter 12, evidence is provided that
participants found it harder to use the heating controls at BedZED than their
former properties. The BedZED Residents’ Handbook does explain how to
get the best out of the heating and hot water systems but BedZED was
unusual for a modern development in that it did not have conventional wall
thermostats which most occupants now take for granted and which offer
personalised control of the living space. This finding is supported by the
EPC reports for BedZED properties completed by independent surveyors
who mostly rated the heating controls at BedZED as poor. It is clear that for
innovative buildings like BedZED that additional guidance and familiarisation
is required both for occupants moving into them and for professionals in the
field.
It is important for energy models to be updated during the development
process. The difference between very initial assumptions about the footprint
size of BedZED at the initial outline design stage and the constructed
footprint was around 21%. Although engineering design does build in
significant sizing margins, it is preferable to update energy models as the
detailed design is developed to ensure that the design assumptions
underpinning the scheme remain relevant. There appeared to be no
provision in the delivery phase of the BedZED project to formally review and
update original design assumptions. This could have provided assurance
that design changes did not adversely impact on the project aims.

290
Despite improvements to the SAP rating tool over the lifetime of this study,
there are still improvements required to ensure that it is suitable for use on
low energy buildings like BedZED. The inconsistent Energy Performance
Certificates gives cause for concern given the importance of zero carbon
dwellings as a way of meeting the Government’s climate change
commitments. EPCs are a mandatory requirement for a property purchase
or rental and may inform the purchaser’s decision. The use of the RdSAP
template to produce EPCs does not lend itself fully to low energy buildings
like BedZED and should be further adapted in the light of the Government’s
aim to build zero carbon buildings, e.g. to include options such as super-
insulation for walls and floors. Surveyors carrying out EPC inspections using
the RdSAP tool need more guidance and training on the tool’s application to
low energy buildings like BedZED.
The literature review in Chapter 2 discussed increased overall demand for
energy resulting from a growing population of smaller households. Since the
Government’s carbon reduction targets are absolute reduction targets,
energy efficiency interventions will need to be even more effective in order to
counter the growth in the number of households. There is not year clear
evidence whether the size of dwellings is reducing commensurate to
reducing household size nationally but the BedZED longitudinal study found
that residents increased their footprint by some 45% when they moved to
BedZED. If the BedZED trend were replicated nationally without a
corresponding move towards much more low energy dwellings, this could
have significant policy implications since the total amount of floor space per
person would increase and the associated energy requirements with it.
If the Government is going to succeed in meeting its carbon reduction
targets, it is essential that a common definition is adopted for low energy
buildings that factor in the requirement for zero carbon. The Building
Regulations should play a key role here.
The benefit of a consistent approach to compiling data from different energy
monitoring studies is illustrated by the comparisons in this study between

291
BedZED and other studies using the protocols developed for the CaRB
study. This provided a broader context for the BedZED results and will
enable further consistent comparisons with other studies in the future.

292
Chapter 15 Limitations of the Study and Future Work
BedZED was a unique design and its relevance to other new-build
developments may be limited. The applicability of this case study to the
wider housing stock is likely to be limited given the small sample size and its
unique features. There is a risk that the first occupants who moved into
BedZED were more likely to be evangelical about the design and ethos of the
development and may not be representative of the general population.
Participating in the study was voluntary and all participants included in the
study were self-selected. There is therefore a risk of “self-selection” bias in
the results.
Although electricity readings at a property level were available, it was not
possible to compile a full dataset for heat energy use in Phase 2 because the
CHP was not fully operational and CHP energy readings were not available.
This meant that it was not possible to compile a holistic assessment of all
energy use in Phase 2 and complete a full longitudinal comparison for the
energy use for Phases 1 and 2. Phase 3 data for the whole BedZED
development enabled an assessment of energy use but since this was not
provided at a property level, it was not possible to complete that part of the
longitudinal study.
This study benefited from a rich dataset but the Phase 2 monitoring period
encountered some data loss because participants were sometimes unable to
provide access for data downloads. A remotely accessible monitoring
system integrated into individual dwellings was not practical for this study
given timescales and other constraints but this would have provided a more
comprehensive dataset, eliminating the need for appointments to download
data from loggers which resulted in up to 25% of the potential BedZED
dataset being lost. Timescales also limited the Phase 1 data collection
phase and also the opportunity to pilot the occupant survey. Nonetheless,
the data that were collected provides a rich set of measurements that has
been analysed for this development and which can be used for comparative
purposes with other studies.
293
Very little information was collected about occupancy patterns within
dwellings. More detail about when the dwelling was occupied would have
enabled more analysis of energy usage and comfort conditions. Later
studies have attempted to capture this information (eg Love 2014) and
although in its infancy and with its own challenges, this approach is
recommended for future studies.
It would be useful to examine in more detail the relationship between the high
mass/low U-value construction and summer overheating and window-
opening behaviour. This study found that BedZED was prone to
overheating during hot spells and that occupant behaviour may be a factor.
It would be useful to conduct a controlled study during a future hot spell to
test the benefits of controlled window opening on internal temperatures.
Such a study should also record occupancy levels in line with CIBSE
guidance.

294
References
ANDERSON, B.R., CLARK, A.J., BALDWIN, R. & MILBANK, N.O. (1985) BREDEM: The BRE Domestic Energy Model BRE Information Paper 16/85, BRE, Garston.
ARRHENIUS, S. (1896) XXXI “On the Influence of Carbonic Acid in the Air upon the Temperature of the Ground” in The London, Edinburgh and Dublin Philosophical Magazine and Journal of Science vol. 41 (251) pp. 237-276
ARUP (ARUP & PARTNERS) (1999a) Beddington ZED Concept Stage Report, Arup and Partners Consulting Engineers, project report
ARUP (ARUP & PARTNERS) (1999b) BedZED SAP rating calculation, Arup & Partners Consulting Engineers, project report
ARUP (ARUP & PARTNERS) (1999c) BedZED Mechanical, Electrical and Public Health Services Scheme Stage Report, Arup & Partners Consulting Engineers, project report
ARUP (ARUP & PARTNERS) (2000) Photovoltaic Installation Specification, Arup & Partners Consulting Engineers, project document
ARUP (ARUP & PARTNERS) (2001) Performance Specification for Air Leakage Testing, Arup & Partners Consulting Engineers, project report
BAKEWELL, C (1999) Beddington Zero Energy Development Energy Analysis, Bioregional, Carshalton Surrey
BEDZED (2000) BedZED Summary Progress Report February 2000, Unpublished report from BedZED project management team for Peabody Trust
BANFILL, P.F.G. & PEACOCK, A.D. (2007) “Energy Efficient New Housing, the UK Reaches for Sustainability” in Building Research & Information, vol 35 (4) pp. 426-436, Routledge
BEIZAEE, A., LOMAS, K.J. & FIRTH, S.K. (2013) “National survey of summertime temperatures and overheating risk in English homes” in Building and Environment vol 65 pp 1-17, Elsevier
BELL, M., LOWE, R. & ROBERTS, P. (1996) Energy Efficiency in Housing, Avebury Aldershot
BELL, M. & LOWE, R. (2000) “Energy efficient modernisation of housing: a UK case study” in Energy and Buildings, vol. 32 (3) pp. 267-288, Elsevier
BIOREGIONAL (1999) Beddington Zero Energy Development Total Energy Strategy, Bioregional Development Group, Carshalton, project report
BOARDMAN, B. (2007) Home Truths: A Low-Carbon Strategy to Reduce UK Housing Emissions by 80% by 2050, University of Oxford Environmental Change Institute, University of Oxford

295
(BRECSU) BUILDING RESEARCH ENERGY CONSERVATION SUPPORT UNIT (1996) The Government’s Standard Assessment Procedure for energy rating of dwellings, Building Research Establishment, Watford
(BSI) BRITISH STANDARDS INSTITUTE (2006) BS EN ISO 7730:2005 Ergonomics of the thermal environment — Analytical determination and interpretation of thermal comfort using calculation of the PMV and PPD indices and local thermal comfort criteria, British Standards Institute
BUILDING SCIENCES LIMITED (2001) Pressure Test Report No 6 Beddington Zero Energy Development, Building Sciences Limited, project report
BURMAN, E., MUMOVIC, D. & KIMPIAN, J. (2014) “Towards measurement and verification of energy performance under the framework of the European directive for energy performance of buildings” in Energy, vol 77, pp. 153-163, Elsevier CHANCE, T. (2009) “Towards sustainable residential communities; the Beddington Zero Energy Development (BedZED) and beyond” in Environment and Urbanization, vol. 21 pp. 527-544, Sage
CHAPPELLS, H. & SHOVE, E. (2005) “Debating the future of comfort: environmental sustainability, energy consumption and the indoor environment” in Building Research & Information, vol. 33 (1) pp. 32–40, Routledge
CIBSE (2000) Technical Memorandum 23: Testing Buildings for Air Leakage, CIBSE, London
CIBSE (2006a) Environmental Design, CIBSE Guide A, 7th ed., CIBSE, London
CIBSE (2006b) Degree Days: Theory & Application, TM 41, CIBSE, London
COLE, R.J. (1998) “Emerging trends in building environmental assessment methods” in Building Research & Information vol. 26 (1) pp.3-16, E&FN Spon
CORBEY, S (2005) The BedZED lessons (Thesis, MSc Architecture), Advanced Environmental and Energy Studies, University of East London
CUTLAND, N. (2012) Lessons from Germany’s Passivhaus Experience, NHBC Foundation IHS BRE Press, Watford
DARBY, S. (2008) “Energy feedback in buildings: improving the infrastructure for demand reduction” in Building Research & Information, vol. 36 (5), pp. 499–508
DAVIS LANGDON & EVEREST (2004) “Cost Model – Affordable Housing” in Building, vol 2004 (6), downloaded 14:10:14 from: http://www.building.co.uk/cost-
model-affordable-housing/3032093.article
(DCLG) DEPARTMENT FOR COMMUNITIES & LOCAL GOVERNMENT (2006a) Code for Sustainable Homes, Department for Communities and Local Government, London
(DCLG) DEPARTMENT FOR COMMUNITIES & LOCAL GOVERNMENT (2006b) English House Condition Survey 2004, DCLG, downloaded 14:10:14
296
from: http://webarchive.nationalarchives.gov.uk/20120919132719/www.communities.gov.uk/documents/housing/pdf/151924.pdf
(DCLG) DEPARTMENT FOR COMMUNITIES & LOCAL GOVERNMENT (2007) Building a Greener Future: Policy Statement, DCLG, London
(DCLG) DEPARTMENT FOR COMMUNITIES & LOCAL GOVERNMENT (2013) English Housing Survey, Headline Report 2011-12, DCLG, London
(DCLG) DEPARTMENT FOR COMMUNITIES & LOCAL GOVERNMENT (2014a) Live Tables on House Building, Permanent Dwellings Started and Completed, by tenure, United Kingdom (Quarterly), downloaded 28:05:14 from https://www.gov.uk/government/statistical-data-sets/live-tables-on-house-building
(DCLG) DEPARTMENT FOR COMMUNITIES & LOCAL GOVERNMENT (2014b) Next Steps to Zero Carbon Homes – Allowable Solutions, DCLG, London, downloaded 21:09:14 from: https://www.gov.uk/government/uploads/system/uploads/attachment_data/file/327842/140626_Government_Response_to_Consultation_-_Next_Steps_to_Zero_Carbon_H__FINAL.pdf
(DCLG) DEPARTMENT FOR COMMUNITIES & LOCAL GOVERNMENT (2014c) Energy Performance of Buildings Certificates: Statistics Release Q1 2008 to Q4 2013 England and Wales 30 April 2014
DEAR, R.J. de & BRAGER, G.S. (2002) “Thermal comfort in naturally ventilated buildings: revisions to ASHRAE Standard 55” in Energy and Buildings, vol 34, pp. 549-561
(DECC) DEPARTMENT OF ENERGY & CLIMATE CHANGE (2013a) Digest of UK Energy Statistics (DUKES), downloaded 26:05:14 from: https://www.gov.uk/government/publications/energy-consumption-in-the-uk
(DECC) DEPARTMENT OF ENERGY & CLIMATE CHANGE (2013b) UK Renewable Energy Roadmap Update 2013, DECC, downloaded 01:06:14 from: www.gov.uk/decc
(DECC) DEPARTMENT OF ENERGY & CLIMATE CHANGE (2013c) The Government’s Standard Assessment Procedure for Energy Rating of Dwellings 2012 version 9.92, 2013 update, BRE, Garston, downloaded 30:12:14 from: http://www.bre.co.uk/filelibrary/SAP/2012/SAP-2012_9-92.pdf
(DECC) DEPARTMENT OF ENERGY & CLIMATE CHANGE (2014) Energy Consumption in the UK, Overall Data Tables 2014 Update, Office of National Statistics
DESAI, P., & RIDDLESTONE, S. (2002) Bioregional solutions for living on one planet Green books, Schumacher Society, Bristol
(DoE) DEPARTMENT OF THE ENVIRONMENT (1976) SI 1976 No 1676 Building and Buildings: The Building Regulations, HMSO, London
(DoE) DEPARTMENT OF THE ENVIRONMENT AND THE WELSH OFFICE (1995) The Building Regulations 1991 Approved Document L : Conservation of Fuel and Power 1995 edition, HMSO, London

297
(DTI) DEPARTMENT OF TRADE AND INDUSTRY (2003) Our Energy Future, creating a low carbon economy, The Stationery Office, Norwich
DUNSTER, B., SIMMONS, C., GILBERT, B. (2008) The ZEDbook: Solutions for a shrinking world, Taylor & Francis, Abingdon
EAMES, M., KERSHAW, T., & COLEY, D. (2011). “On the creation of future probabilistic design weather years from UKCP09” in Building Services Engineering Research & Technology, vol 32 (2), pp 127–142, Sage
EBERHARDT, L.L & THOMAS, J.M. (1991) “Designing Environmental Field Studies” in Ecological Monographs, vol. 61 (1) pp. 53-73
(EC) EUROPEAN COMMISSION (2002) Directive 2002/91/EC of the European Parliament and of the Council of 16 December 2002 on the Energy Performance of Buildings, Official Journal of the European Communities, 2 (2003) L1
(EC) EUROPEAN COUNCIL (2009) Council Regulation of 23 April 2009 on the promotion of the use of energy from renewable sources, OJ L140/16
(EC) EUROPEAN COMMISSION (2010) Directive 2010/31/EU of the European Parliament and of the Council of 19 May 2010 on the energy performance of buildings (recast), Official Journal of the European Union
EDWARDS, J. (1990) "Low energy dwellings in the Milton Keynes Energy Park" in Energy Management vol 26 (2) pp 32-33
(EIA) US ENERGY INFORMATION ADMINISTRATION (2013) International Energy Outlook 2013 with projections to 2040, US Department of Energy, downloaded on 01:06:14 from www.eia.gov/ieo/
ELLIS, R. & ELVY, S. (2004) BedZED Resident Satisfaction Survey Report, Peabody Trust, internal report, not published
ELWELL, C.A., BIDDULPH, P., LOWE, R. & ORESZCZYN, T. (2014) Determining the impact of regulatory policy on UK gas use using Bayesian analysis on publicly available data, unpublished report, UCL Energy Institute (submitted for publication)
ENERGY SAVING TRUST (1996) Energy Efficiency Best Practice Programme, General Information Leaflet 31: Building Research Establishment Domestic Energy Model (BREDEM), Energy Saving Trust, London
ENERGY SAVING TRUST (2002) Energy Efficiency Best Practice in Housing, General Information Report 89 BedZED – Beddington Zero Energy Development, Sutton, Energy Saving Trust, London
ENERGY SAVING TRUST (2006) Good Practice Guide 268 Energy Efficient Ventilation in Dwellings, A Guide for Specifiers, Energy Saving Trust, London
ENERGY SAVING TRUST (2013a) Guidance Notes on CERT Reports from HEED, downloaded 23 December 2013, http://www.energysavingtrust.org.uk/
Organisations/Government-and-local-programmes/Programmes-we-deliver/Homes-Energy-Efficiency-Database/CERT-reports-from-HEED

298
ENERGY SAVING TRUST (2013b) HEED Online 2 Data Interpretation Guide v 2.01, downloaded 23 December 2013, http://www.energysavingtrust.org.uk/
Publications2/Housing-professionals/HEED-PDFs/HEED-Online-2-Data-Interpretation-Guide-v2.01
EVERETT, R., HORTON, A. & DOGGART, J. (1985) Linford Low Energy Houses Energy Research Group, Open University, Milton Keynes, UK
FANGER, P.O. (1986) “Thermal Environment – Human Requirements” in The Environmentalist vol. 6 (4) pp 275-278
FIELDING, N.G. & FIELDING, J.L. (1986) Linking Data, Sage, London
GAUTHIER, S. & SHIPWORTH, D. (2014) “The gap between what is said and what is done: a method for distinguishing reported and observed responses to thermal discomfort” in Counting the Cost of Comfort in a changing world, Proceedings of 8th Windsor Conference, Cumberland Lodge, Windsor, UK, 10-13 April 2014. London: Network for Comfort and Energy Use in Buildings, http://nceub.org.uk
GAZE, C., SWAINSON, M., HODGSON, G. & BALSON, T. (2008) BRE Information Paper 9/08 Part 2 Applying the Code for Sustainable Homes on the BRE Innovation Park, BRE, Watford
GILL, Z., TIERNEY, M.J., PEGG, I.M. & ALLEN, N. (2010) “Low Energy Dwellings: the contribution of behaviours to actual performance” in Building Research and Information (2010) vol 38 (5) pp 491–508, Routledge
GOH, A.T., & SIBLEY, M. (2008) “607: Sustainable Housing Development: Design Towards Zero Energy For Space Heating” in PLEA 2008 25th Conference on Passive and Low Energy Architecture, Dublin, 22nd to 24th October 2008.
GRIFFITHS, W. (2010) BRE Information Paper 10/10 SAP for beginners, BRE
HACHEM, C. & ATHIENITIS, A. (2013) “Using Passive Design” in ASHRAE Journal, January 2013, pp 72-74, ashrae.org
HAMILTON, I.G., SUMMERFIELD, A.J., STEADMAN, J.P., STONE, A. & DAVIES, M. (2010) “Exploring energy integration between new and existing developments” in Building Research Information, vol. 38 (6) pp. 593-609
HAMILTON, I.G, DAVIES, M., RIDLEY, I., ORESZCZYN, T., BARRETT, M., LOWE, R., HONG, S., WILKINSON, P. & CHALABI, Z. (2011) “The impact of housing energy efficiency improvements on reduced exposure to cold – the ‘temperature take back factor’” in Building Services Engineering Research & Technology, vol. 32(1) pp. 85-98, Chartered Institution of Building Services Engineers
HAMILTON, I.G. (2014) CEE: Energy efficiency and temperature, University College London, UCL Energy Institute, Personal communication for DECC, unpublished

299
HAJAT, S., KOVATS, R.S., ATKINSON, R.W. & HAINES, A. (2002) “Impact of Hot Temperatures on Death in London: A time series approach” in Journal of Epidemiology and Community Health, vol. 56 pp. 367-372, www.jech.com
HE, J., YOUNG, A.N., PATHAN, A. & ORESZCZYN, T., (2005) “Air conditioning energy use in houses in Southern England” Proceedings of the DYNASTEE (Dynamic Analysis, Simulation and Testing Applied to The Energy and Environmental Performance of Buildings) Conference, Athens
HEALY, S. (2008) “Air-conditioning and the ‘homogenization’ of people and built environments” in Building Research Information, vol. 36 (4) pp 312-322, Routledge
HEFFERNAN, E., XI LIANG, W.P. & DE WILDE, P. (2013) “Redefining zero? A critical review of definitions of zero energy buildings and zero carbon homes” CIBSE Technical Symposium, Liverpool John Moores University, Liverpool, UK, 11-12 April 2013
(HMG) HM GOVERNMENT (2007) SI 2007 No 991 Building and Buildings, England and Wales, The Energy Performance of Buildings (Certificates and Inspections) (England and Wales) Regulations, Her Majesty’s Stationery Office, London
(HMG) HM GOVERNMENT (2010a) Building Regulations 2010 Approved Document L1A Conservation of Fuel and Power in New Dwellings edition, RIBA Enterprises Ltd, London
(HMG) HM GOVERNMENT (2010b) Building Regulations 2010 Approved Document E Resistance to the Passage of Sound, RIBA Enterprises Ltd, London, downloaded 21:09:14 from: http://www.planningportal.gov.uk/uploads/br/BR_PDF_ADE_2003.pdf
(HMG) HM GOVERNMENT (2011) The Carbon Plan, Delivering our Low Carbon Future, downloaded 26:05:14 from: https://www.gov.uk/government/uploads/system/uploads/attachment_data/file/47613/3702-the-carbon-plan-delivering-our-low-carbon-future.pdf
HMG (HM GOVERNMENT) (2014) Building Regulations 2010, Approved Document L1a Conservation of Fuel and Power in new dwellings 2013 edition, downloaded 20:09:14 from: http://www.planningportal.gov.uk/uploads/br/BR_PDF_AD_L1A_2013.pdf
HODGE, J. & HALTRECHT, J. (2009) BedZED Seven years on – the impact of the UK’s best known eco-village and its residents, Bioregional Development Group, London
HONG, S.H. & MUMOVIC, D. (2005) BedZed Thermography and Air Infiltration Rate Test Results, UCL Bartlett School of Graduate Studies, unpublished report
HONG, S.H., ORESZCZYN, T. & RIDLEY, I. (2006) “The impact of energy efficient refurbishment on the space heating fuel consumption in English dwellings” in Energy and Buildings vol 38 (10) pp 1171-1181, Elsevier

300
HOUGHTON, J. & BOLIN, B. (1992) Climate Change 1992: The Supplementary Report to the IPCC Scientific Assessment, Intergovernmental Panel on Climate Change, Cambridge, New York and Melbourne
HUMPHREYS, M.A., NICOL, J.F. & RAJA, I.A. (2007) “Field Studies of Indoor Thermal Comfort and the Progress of the Adaptive Approach” in Advances in Building Energy Research, vol 1, pp 55-88, Taylor & Francis
IPCC (2007) “Summary for Policy Makers” in Climate Change 2007: The Physical Science Basis. Contribution of Working Group I to the Fourth Assessment Report of the Intergovernmental Panel on Climate Change, Cambridge University Press, Cambridge
IPCC (2014) “Summary for Policy Makers” in Climate Change 2014: Impacts, Adaptation, and Vulnerability. Contribution of Working Group II to the Fifth Assessment Report of the Intergovernmental Panel on Climate Change, downloaded 26:05:14 from http://ipcc-
wg2.gov/AR5/images/uploads/IPCC_WG2AR5_SPM_Approved.pdf
JEVONS, W.S. (1865) “Of the Economy of Fuel” in The Coal Question: an inquiry concerning the Progress of the Nation and the Probable Exhaustion of our Coal-Mines, pVII.3, Macmillan, London & Cambridge
JIE, L. (2010) “A Review of the Proposals for Amending the Energy Efficiency Provisions in the Building Regulations” in Proceedings of 2010 Third International Conference on Information and Computing, Wuxi, Jiang Su, June 2010, vol.4, pp.27-30
JOHNSON, H., KOVATS, R.S., McGREGOR, G., STEDMAN, J., GIBBS, M., WALTON, H., COOK, L., BLACK, E. (2005) “The impact of the 2003 heatwave on mortality and hospital admissions in England” in Health Statistics Quarterly no 25, HMSO, Newport
KANE, T., FIRTH, S.J. & LOMAS, K.J. (2015) “How are UK homes heated? A city-wide socio-technical survey and implications for energy modelling” in Energy & Buildings, vol 86, pp 817-832, Elsevier
KELLY, S. (2011) “Do homes that are more energy efficient consume less energy? A structural equation model of the English residential sector” in Energy, vol. 36 (9) pp. 5610-5620, Elsevier
LAZARUS, N. (2003) BedZED:Toolkit Part II, Bioregional Development Group
LEAMAN, A. & BORDASS, B. (1999) “Productivity in buildings: the “killer” variables in Building Research & Information, vol 27 (1) pp. 4-19
LOMAS, K.J. (2010) “Carbon reduction in existing buildings: a transdisciplinary approach” in Building Research and Information, vol 38 (1) pp 1-11, Routledge
LOMAS, K.J. & KANE, T. (2013) “Summer time temperatures and thermal comfort in UK homes” in Building Research & Information, vol 41 (3) pp 259-280, Routledge

301
LOVE, J.A. (2014) Understanding the interactions between occupants, heating systems and building fabric in the context of energy efficient building fabric retrofit in social housing, PhD Thesis, UCL Energy Institute, London
LOWE, R., CHAPMAN, J. & EVERETT, R. (1985) The Pennyland Project, Open University Energy Research Group, ERF 053/ETSU-S-1046, Milton Keynes
MANLY, B.F.J. (1992) The Design and Analysis of Research Studies, Cambridge University Press, Cambridge
MARSZAL, A.J., HEISELBERG, P., BOURRELL, J.S., MUSALL, E., VOSS, K., SARTORI, I. & NAPOLITANO, A. (2011) “Zero Energy Building: A review of definitions and calculation methodologies” in Energy and Buildings, vol. 43 (4) pp. 971-979, Elsevier
MAVROGIANNI, A., DAVIES, M., BATTY, M., BELCHER, S.E., BOHNENSTENGEL, S.I., CARRUTHERS, D., CHALABI, Z., CROXFORD, B., DEMANUELE, C., EVANS, S., GIRIDHARAN, R., HACKER, J.N., HAMILTON, I., HOGG, C., HUNT, J., KOLOKOTRONI, M., MARTIN, C., MILNER, J., RAJAPAKSHA, I., RIDLEY, I., STEADMAN, J.P., STOCKER, J., WILKINSON, P., YE, Z. (2011) “The comfort, energy and health implications of London’s urban heat island” in Building Services Engineering Research and Technology vol 32 (1) pp. 35–52
MAVROGIANNI, A., WILKINSON, P., DAVIES, M., BIDDULPH, P. & OIKONOMOU, E. (2012) “Building characteristics as determinants of propensity to high indoor summer temperatures in London dwellings” in Building and Environment vol. 55 pp. 117- 130, Elsevier
MAVROGIANNI, A., JOHNSON, F., UCCI, M., MARMOT, A., WARDLE, J., ORESZCZYN, T., SUMMERFIELD, A. (2013) “Historic Variations in Winter Indoor Domestic Temperatures and Potential Implications for Body Weight Gain” in Indoor and Built Environment, April 2013; vol. 22, 2: pp. 360-375, first published on October 19, 2011
McNEIL, L. (2010) What is an NHER Rating?, National Energy Services website, downloaded 01:06:14 from http://www.nesltd.co.uk
MEAD, K., & BRYLEWSKI, R. (2010) Passivhaus Primer: Introduction - An aid to Understanding the Key Principles of the Passivhaus Standard, BRE, Watford
MET OFFICE (2011) Extremes: National Meteorological Library & Archive, Fact Sheet 9,Weather Extremes downloaded 28:09:14 from: http://www.metoffice.gov.uk/media/pdf/c/f/Fact_sheet_No._9.pdf
MEYER, W. B. (2002) “Why indoor climates change: a case study” in Climatic Change, November 2002 vol. 55 pp. 395-407, Kluwer Academic Publishers, The Netherlands
MILNE, G. & BOARDMAN, B., (2000) “Making cold homes warmer: the effect of energy efficiency improvements in low-income homes” in Energy Policy vol. 28, pp. 411-424, Elsevier

302
MITCHELL, J.C. (1983) “Case and Situation Analysis” in Sociological Review vol. 31 (2) pp. 187-211
MLECNIK, E., SCHÜTZE, T., JANSEN, S.J.T., de VRIES, G., VISSCHER, H.J. & van HAL, A. (2012) “End-user experiences in nearly zero-energy houses” in Energy and Buildings vol. 49 pp. 471-478, Elsevier
MOURSHED, M. (2012) “Relationship between annual mean temperature and degree-days” in Energy and Buildings, vol 54, pp 418-425, Elsevier
MURPHY, G.B., KHALID, Y. & COUNSELL, J. (2011) “A Simplified Dynamic Systems Approach for the Energy Rating of Dwellings” in Proceedings of 12th Conference of International Building Performance Simulation Association, Sydney, 14-16 November 2011, pp. 1187-1194
NHBC (2014) Guide to your new home, downloaded from: http://www.nhbc.co.uk/NHBCPublications/LiteratureLibrary/HomeownerDocuments/filedownload,15900,en.pdf#page=8
OLIVER, D. & WILLOUGHBY, J. (1996) Best Practice Programme Report 38: Review of ultra-low energy homes, BRECSU, BRE, Watford
(ONS) OFFICE FOR NATIONAL STATISTICS (2009) “Households and Families” in Social Trends 39, ONS downloaded on 01:06:14 from www.ons.gov.uk
(ONS) OFFICE FOR NATIONAL STATISTICS (2011) “Population” in Social Trends v 41(1) pp 1-19, Office for National Statistics, downloaded on 29:05:14 from http://www.ons.gov.uk/ons/rel/social-trends-rd/social-trends/social-trends-
41/social-trends-41---e-society
(ONS) OFFICE FOR NATIONAL STATISTICS (2012a) 2011 Census: Population Estimates for the United Kingdom, 27 March 2011, ONS Statistical Bulletin, downloaded on 01:06:14 from www.ons.gov.uk
(ONS) OFFICE FOR NATIONAL STATISTICS (2012b) Families and Households 2001 – 2011, ONS Statistical Bulletin, downloaded on 01:06:14 from www.ons.gov.uk
(ONS) OFFICE FOR NATIONAL STATISTICS (2013a) Families and Households, Statistical Bulletin, ONS, downloaded on 01:06:14 from www.ons.gov.uk
(ONS) OFFICE FOR NATIONAL STATISTICS (2013b) An overview of 40 years of data (General Lifestyle Survey Overview - a report on the 2011 General Lifestyle Survey) downloaded on 27:05:14 from www.ons.gov.uk
(ONS) OFFICE FOR NATIONAL STATISTICS (2013c) National Population Projections, 2012-based Statistical Bulletin, downloaded on 27:05:14 from www.ons.gov.uk
ORESZCZYN, T., HONG, S.H., RIDLEY, I & WILKINSON, P. (2006) “Determinants of winter indoor temperatures in low income households in England” in Energy and Buildings vol. 38 pp. 245–252, Elsevier

303
ORME, M., PALMER, J. & IRVING, S. (2003) "Control of over-heating in well insulated housing", Proceedings of the CIBSE/ASHRAE Conference (24-26 September 2003) in Building Sustainability, Value & Profit, Edinburgh
OROSA, J.A. & OLIVEIRA, A.C. (2011) “A new thermal comfort approach comparing adaptive and PMV models” in Renewable Energy, vol 36, pp 951-956, Elsevier
PALMER, J., COOPER, I., ARMITAGE, P., TILLSON, A., HUGHES, M., CHENG, V., SUMMERTON, P. & MADAN, R. (2012) United Kingdom Housing Energy Fact File 2012, Department of Energy and Climate Change, London
PALMER, J. & COOPER, I. (2013) United Kingdom Housing Energy Fact File 2013, Department of Energy and Climate Change
PARLIAMENT UK (2008) Climate Change Act, HM Stationery Office, London
PEABODY TRUST (1999- 2000) Minutes of BedZED Design Team Meetings, unpublished
PEABODY TRUST (2000) Beddington Zero Energy Development, Pioneering Green Village, marketing literature, Peabody Trust
PEABODY TRUST (2002a) BedZED Residents’ Manual, Peabody Trust and the zedfactory
PEABODY TRUST (2002b) BedZED Health and Safety File, volumes 1-14
PEACOCK, A.D., JENKINS, D.P., KANE, D. (2010) “Investigating the potential of overheating in UK dwellings as a consequence of extant climate change” in Energy Policy vol. 38 (7) pp 3277-88, Elsevier
PERRY, M. & HOLLIS, D. (2005) “The Generation of Monthly Gridded Datasets for a range of Climatic Variables over the UK” in International Journal of Climatology vol. 25 (8) pp. 1041 – 1054, Wiley
RIDLEY, I. (1995) Super-insulated Houses for Housing Associations, PhD Thesis, Research in Building Group, University of Westminster, UK
RIDLEY, I., CLARKE, A., BERE, J., ALTAMIRANO, H., LEWIS, S. DURDEY, M., & FARR, A. (2013) “The monitored performance of the first new London dwelling certified to the Passive House standard” in Energy and Buildings, vol 63 pp. 67-78, Elsevier
RIDLEY, I., BERE, J., CLARKE, A;, SCHWARTX, Y. & FARR, A. (2014) “The side by side in use monitored performance of two passive and low carbon Welsh houses” in Energy and Buildings, vol. 82 pp. 13-26
RICS (2007) Code of Measurement Practice Guidance Note, 6th edition, RICS, Coventry
ROBERTS-HUGHES, R. (2011) The Case for Space: the size of England’s new homes, RIBA, downloaded on 01:06:14 from: http://www.architecture.com/Files/RIBAHoldings/PolicyAndInternationalRelations/HomeWise/CaseforSpace.pdf

304
ROBY, H. (2013) A Supplementary Dictionary of Renewable Energy and Sustainability, Oxford University Press
ROGERS, R. (1999) Towards an urban renaissance: final report of the Urban Task Force, Urban Task Force, Spon, London
RUYSSEVELT, P.A. (1987) Superinsulated Houses for the UK, PhD Thesis, Polytechnic of Central London
SANDERS, C. & PHILLIPSON, M. (2006) Review of Differences between Measured and Theoretical Energy Savings for Insulation Measures, Centre for Research on Indoor Climate and Health, Glasgow Caledonian University
SARTORI, I., NAPOLITANO, A. & VOSS, K. (2012) “Net Zero Energy Buildings: a consistent definition framework” in Energy and Buildings vol 48 pp. 220-232, Elsevier
SAUNDERS, H. (1992) “The Khazzom-Brookes Postulate and Neoclassical Growth” in Energy Journal vol 13 (4) pp 131-148, International Association for Energy Economics
SCHNIEDERS (2003) “CEPHEUS – measurement results from more than 100 dwelling units in passive houses” in Proceedings of European Council for an Energy Efficient Economy (ECEEE) 2003 Summer Study, Sweden
SHOVE, E., CHAPPELLS, H., LUTZENHISER, L. & HACKETT, B. (2008) “Comfort in a lower carbon society” in Building Research & Information, vol. 36 (4) pp. 307-311, Routledge
SORRELL, S. (2007) The Rebound Effect: an assessment of the evidence for economy-wide energy savings from improved energy efficiency, UK Energy Research Centre
STEPHEN, R. (2000) Airtightness in UK dwellings, BRE Information Paper 1/00, BRE, Watford
STEPHEN, R. K. (1998) Airtightness in UK dwellings: BRE’s test results and their significance, BRE Report 359, BRE, Watford
STRENGERS, Y. (2008) “Comfort expectations: the impact of demand-management strategies in Australia” in Building Research & Information, vol 36 (4) pp 381–391, Routledge
SUMMERFIELD, A.J., LOWE, R.J., FIRTH, S.K., WALL, R. & ORESZCZYN, T. (2006) “The case for joined-up research on carbon emissions from the building stock: adding value to household and building energy datasets” In Proceedings of the RICS Annual Conference Cobra 2006, London, UK
SUMMERFIELD, A.J., LOWE, R.J., BRUHNS, H.R., CAEIRO, J.A., STEADMAN, J.P. & ORESZCZYN, T. (2007) “Milton Keynes Energy Park Revisited: Changes in internal temperatures and energy usage” in Energy and Buildings vol. 39 (7) pp. 783-791, Elsevier
SUMMERFIELD, A.J., LOWE, R.J. & ORESZCZYN, T. (2010a) Two models for benchmarking UK domestic delivered energy, Building Research & Information, vol. 38 (1) pp. 12-24, Routledge
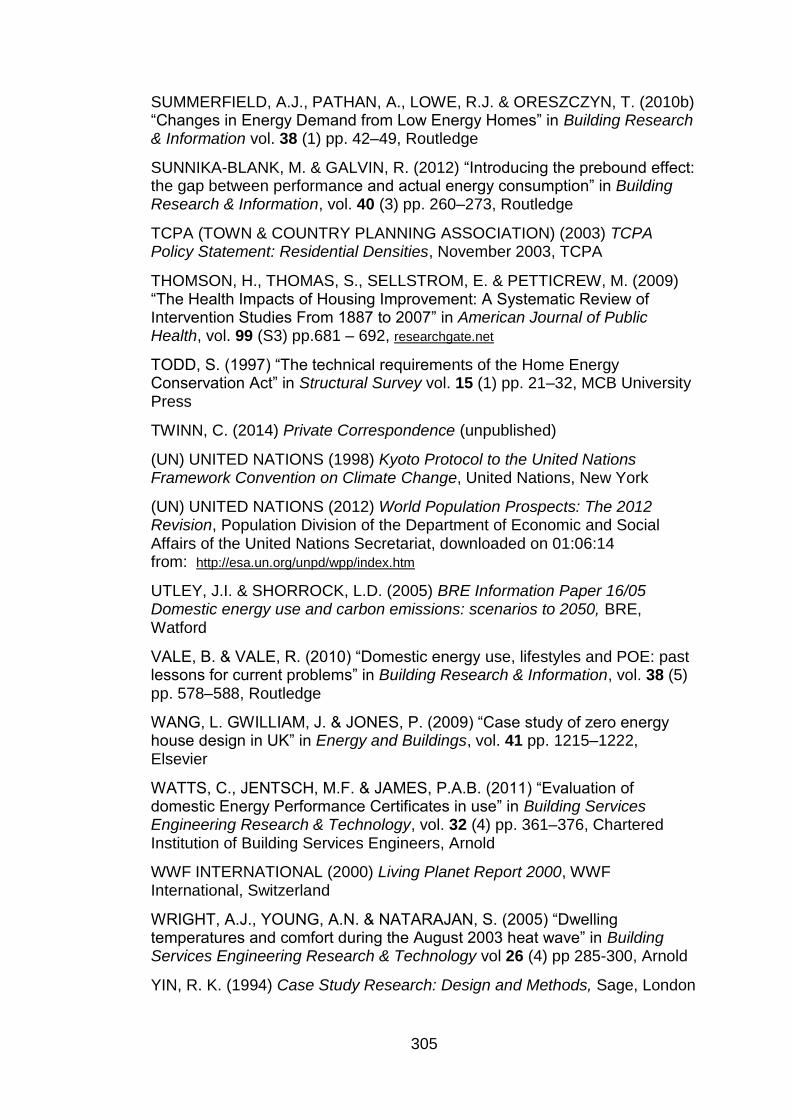
305
SUMMERFIELD, A.J., PATHAN, A., LOWE, R.J. & ORESZCZYN, T. (2010b) “Changes in Energy Demand from Low Energy Homes” in Building Research & Information vol. 38 (1) pp. 42–49, Routledge
SUNNIKA-BLANK, M. & GALVIN, R. (2012) “Introducing the prebound effect: the gap between performance and actual energy consumption” in Building Research & Information, vol. 40 (3) pp. 260–273, Routledge
TCPA (TOWN & COUNTRY PLANNING ASSOCIATION) (2003) TCPA Policy Statement: Residential Densities, November 2003, TCPA
THOMSON, H., THOMAS, S., SELLSTROM, E. & PETTICREW, M. (2009) “The Health Impacts of Housing Improvement: A Systematic Review of Intervention Studies From 1887 to 2007” in American Journal of Public Health, vol. 99 (S3) pp.681 – 692, researchgate.net
TODD, S. (1997) “The technical requirements of the Home Energy Conservation Act” in Structural Survey vol. 15 (1) pp. 21–32, MCB University Press
TWINN, C. (2014) Private Correspondence (unpublished)
(UN) UNITED NATIONS (1998) Kyoto Protocol to the United Nations Framework Convention on Climate Change, United Nations, New York
(UN) UNITED NATIONS (2012) World Population Prospects: The 2012 Revision, Population Division of the Department of Economic and Social Affairs of the United Nations Secretariat, downloaded on 01:06:14 from: http://esa.un.org/unpd/wpp/index.htm
UTLEY, J.I. & SHORROCK, L.D. (2005) BRE Information Paper 16/05 Domestic energy use and carbon emissions: scenarios to 2050, BRE, Watford
VALE, B. & VALE, R. (2010) “Domestic energy use, lifestyles and POE: past lessons for current problems” in Building Research & Information, vol. 38 (5) pp. 578–588, Routledge
WANG, L. GWILLIAM, J. & JONES, P. (2009) “Case study of zero energy house design in UK” in Energy and Buildings, vol. 41 pp. 1215–1222, Elsevier
WATTS, C., JENTSCH, M.F. & JAMES, P.A.B. (2011) “Evaluation of domestic Energy Performance Certificates in use” in Building Services Engineering Research & Technology, vol. 32 (4) pp. 361–376, Chartered Institution of Building Services Engineers, Arnold
WWF INTERNATIONAL (2000) Living Planet Report 2000, WWF International, Switzerland
WRIGHT, A.J., YOUNG, A.N. & NATARAJAN, S. (2005) “Dwelling temperatures and comfort during the August 2003 heat wave” in Building Services Engineering Research & Technology vol 26 (4) pp 285-300, Arnold
YIN, R. K. (1994) Case Study Research: Design and Methods, Sage, London

306
ZERO CARBON HUB (2011) Allowable Solutions for Tomorrow’s New Homes: Towards a workable framework, Zero Carbon Hub, London
ZERO CARBON HUB (2014) Closing the gap between design and as-built performance, Evidence Review Report, Zero Carbon Hub, London ZHU, D., KUNG, M. & ZHOU, L. (2015) “Analysis of Sustainable Energy Systems in Ecovillages: A Re- Progress in BedZED and Masdar City” in Low Carbon Economy vol. 6 pp 1-6, Scientific Research Publishing Inc. USA

307
Appendices
6Appendix 1: BedZED Accommodation Schedule………………………...308
Appendix 2: CHP Sizing Calculation……………………………………….309
Appendix 3: Phase 1 Questionnaire (pre-BedZED)………………………310
Appendix 4: Phase 2 Questionnaire (BedZED)…………………………...314
Appendix 5: Phase 1 Temperature Summaries (pre-BedZED)………….319
Appendix 6: Phase 2 Temperature Summaries (BedZED)………………334
Appendix 7: Temperature Summaries from other Case Studies………...363
Appendix 8: BedZED Air-tightness and Infra-Red Thermography Tests..365

308
Appendix 1: BedZED Accommodation Schedule
Source: Corbey 2005

30
9
Appendix 2: CHP Sizing Calculation Source: Bioregional 1999
BEDZED SITE DISTRICT HEATING REQUIREMENTS
HOT WATER & HEATING W kWh/annum ELECTRICITY USE
1 person 130 litres hot water/day 348 3045 1 person flat 2247 kWh/annum
2 people 141 377 3302 2 person flat 2596
3 people 165 441 3864 3 person mais 3298
ASSUMPTIONS 4 people 187 500 4380 4 person house 3533
CHP runs 17 hours/day office 0.67 litres/m2 0.043 kWh/m2 office 54 kWh/m2/annum
Heat distribution losses 20 % shop 1.6 litres/m2 0.103 shop 396
Elec distribution losses 5 % nursery 1.6 litres/m2 0.103 nursery 20
additional gains (flat) 3.5 W/m2 clubhouse 25 6 mins shower 810 litres/day clubhouse 74
additional gains (office) 8 W/m2
healthy 3.1 litres/m2
0.199 healthy 44
delta T 55 °C
DWELLINGS
maximum
people
predicted
people
unit
floor
area m2number
of units
predicted
total
people
total
floor area
m2
per day
per unit
litres
hot water
per day
litres
energy
per day
MJ
extra heat
from towel rail
+ HW cylinder
+ pipework etc
over 24 hrs
W/m2 W MJ per unit kWh
all units
kWh MJ
per day
BLOCK A Flat 2 1 48.5 6 6 291 130 780 180 3.5 170 88 2596 15576 153.6
Maisonette 4 3 75.5 6 18 453 165 990 229 3.5 264 137 3533 21198 209.1
BLOCK B Flat 2 2 48.5 6 12 291 141 846 195 3.5 170 88 2596 15576 153.6
Maisonette 4 4 75.5 6 24 453 187 1122 259 3.5 264 137 3533 21198 209.1
BLOCK C Flat 2 1 48.5 6 6 291 130 780 180 3.5 170 88 2596 15576 153.6
Maisonette 4 3 75.5 6 18 453 165 990 229 3.5 264 137 3533 21198 209.1
BLOCK D Flat 2 2 48.5 5 10 242.5 141 705 163 3.5 170 73 2596 12980 128
Maisonette 4 4 75.5 5 20 377.5 187 935 216 3.5 264 114 3533 17665 174.2
BLOCK E Maisonette 3 2 62 4 8 248 141 564 130 3.5 217 75 3298 13192 130.1
Maisonette 4 3 75.5 4 12 302 165 660 152 3.5 264 91 3533 14132 139.4
BLOCK F Flat 3 2 60 5 10 300 141 705 163 3.5 210 91 3298 16490 162.7
Flat 3 3 60 5 15 300 165 825 191 3.5 210 91 3298 16490 162.7
Flat 3 2 60 5 10 300 141 705 163 3.5 210 91 3298 16490 162.7
BLOCK G Maisonette 4 3 75.5 5 15 377.5 165 825 191 3.5 264 114 3533 17665 174.2
Maisonette 4 4 75.5 5 20 377.5 187 935 216 3.5 264 114 3533 17665 174.2
Flat 4 3 73.5 3 9 220.5 165 495 114 3.5 257 67 3533 10599 104.5
82 213 5278 2971 1596 2601
OFFICES
BLOCK A Unit 7.1 85 6 42.5 510 57 341.7 79 8 680 353 4590 27540 271.6
BLOCK B Unit 7.1 85 6 42.5 510 57 341.7 79 8 680 353 4590 27540 271.6
BLOCK C Unit 7.1 85 3 21.3 255 57 170.85 39 8 680 176 4590 13770 135.8
15 106.3 1275 197 881 679
OTHER
Shop 342 1 20 342 547 547.2 126 8 2736 236 135432 135432 1335.8
Nursery 170 1 20 170 272 272 63 8 1360 118 3400 3400 33.5
Club House 110 1 10 110 810 810 187 8 880 76 8140 8140 80.3
Healthy Living Centre 440 1 30 440 1364 1364 315 8 3520 304 19360 19360 190.9
4 80 1062 691 734 1641
Streetlights 35 nr 400 W 14 hours/day 706
Floodlights 8 5000 W 1 498872 144
RW pumps 6 500 W 2 losses 24943.6 22
Heating pumps 1 500 W 17 10%design 49887.2 31
3860 + 3211 573703
TOTALS 101 399 7615 7071 5822 MJ/day
units people area total heat
over CHP hours 115.5 kW over CHP hours 95.1 kW
TOTAL HEAT 115.5 kW TOTAL ELEC 95.1 kW
losses 23.1 kW losses 4.8 kW
10% design margin 13.9 kW 10% design margin 10 kW
CHP HEAT REQD 153 kW CHP ELEC REQD 110 kW
from heat exchanger output
Electric kWh annual Extra heatHot water

310
31
0
Appendix 3: Phase 1 Questionnaire (pre-BedZED)
PRE-OCCUPANCY QUESTIONNAIRE

311
31
1

312
31
2
2.7 Do you use any additional form of heating (eg electric fan heater). If so, where and how long per day
Hours per day
Living Room
________
Kitchen
________
Bathroom
________
Bedrooms
________
Other
________
3 Hot Water System
3.1 Does the hot water system provide enough hot water when you require it?
Yes
No
3.2 If no, do you use another source for hot water? eg kettle
_________________________________________________________________
3.3 Is the temperature of the hot water comfortable?
Too hot
OK
Too cold
3.4 If the water is too hot or too cold, have you tried to adjust the temperature?
Yes
No
4 Fuel Costs
4.1 Do you know how much your gas/electricity bills are per annum?
Yes
No
4.2 If yes, how much on average?
Less than £100
£100-£200
£200-300
£300-400
Greater than £400
4.3 Please provide a copy of your gas and electricity bills for the last year

313
31
3
5 Ventilation
5.1 Do you have a mechanical ventilation system? Eg extract fans?
Yes
No
5.2
If yes, is it effective at removing steam and odours from the home?
Yes
No
5.3 Do you open windows to improve air quality?
Yes
No
5.4 Would you consider your home to be draughty?
Yes
No
5.5 If yes, which part of your home do the draughts typically come from?
Windows
Doors
Other __________________________________
6 Other
6.1 Has there been any instance of asthma or similar health problem that could be
associated with the living environment?
Yes
No
6.2 Is there any condensation or mould growth in the home?
Yes
No
6.3 On the whole, how satisfied are you with the heating, hot water and ventilation in your present home?
Very good
Poor
Good
Very poor
OK
Other ___________________________
6.4 How much clothing do you normally wear in the home in winter?
Just a thin layer, e.g. T-shirt, shirt, blouse
Medium layers, e.g. T-shirt/shirt + thin sweater/cardigan
Heavy layers, e.g. T-shirt/shirt + heavy sweater/fleece

314
31
4
Appendix 4: Phase 2 Questionnaire (post-BedZED)
POST-OCCUPANCY QUESTIONNAIRE

315
31
5

316
31
6

317
31
7

318
31
8
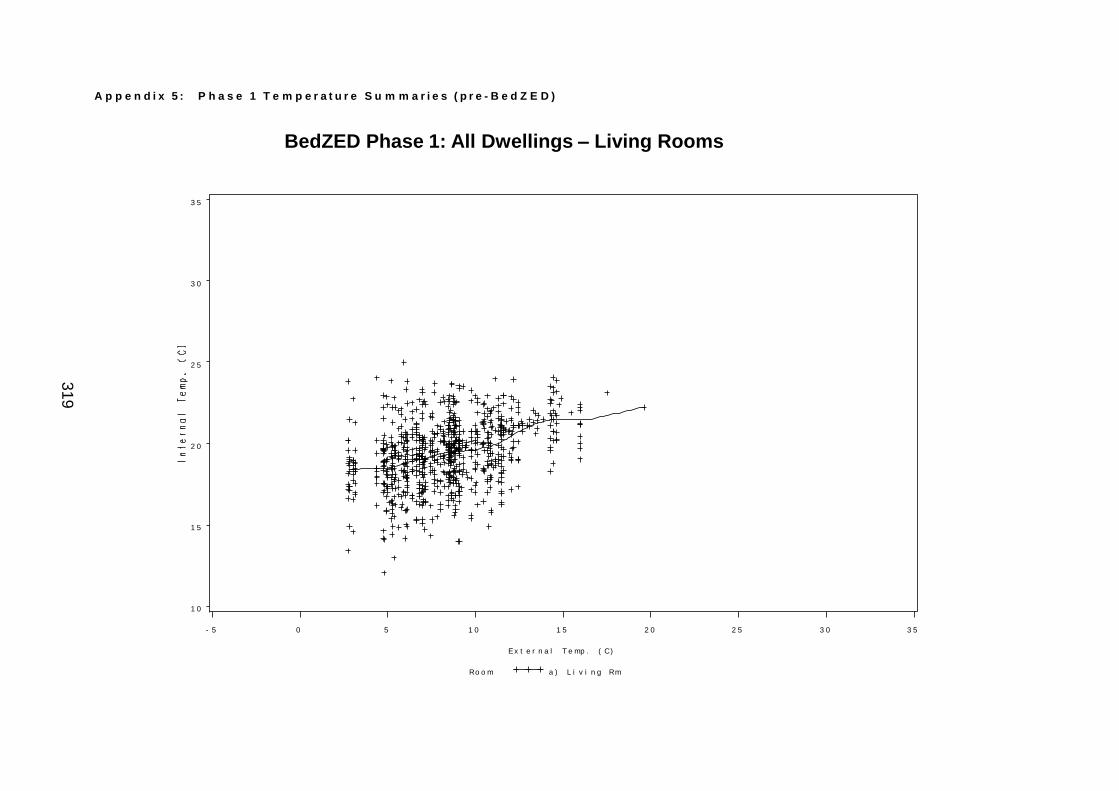
31
9
A p p e n d i x 5 : P h a s e 1 T e m p e r a t u r e S u m m a r i e s ( p r e - B e d Z E D )
Ro o m= a ) L i v i n g Rm
Ro o m a ) L i v i n g Rm
1 0
1 5
2 0
2 5
3 0
3 5
Ex t e r n a l T e mp . ( C)
- 5 0 5 1 0 1 5 2 0 2 5 3 0 3 5
BedZED Phase 1: All Dwellings – Living Rooms

32
0
Ro o m= b ) Be d r m 1
Ro o m b ) Be d r m 1
1 0
1 5
2 0
2 5
3 0
3 5
Ex t e r n a l T e mp . ( C)
- 5 0 5 1 0 1 5 2 0 2 5 3 0 3 5
BedZED Phase 1: All Dwellings – Bedrooms

32
1
d we l l i d = BZ 1 B
Ro o m a ) L i v i n g Rm b ) Be d r m 1
1 0
1 5
2 0
2 5
3 0
3 5
Ex t e r n a l T e mp . ( C)
- 5 0 5 1 0 1 5 2 0 2 5 3 0 3 5
BedZED Phase 1: Dwelling B

32
2
d we l l i d = BZ 1 F
Ro o m a ) L i v i n g Rm b ) Be d r m 1
1 0
1 5
2 0
2 5
3 0
3 5
Ex t e r n a l T e mp . ( C)
- 5 0 5 1 0 1 5 2 0 2 5 3 0 3 5
BedZED Phase 1: Dwelling F

32
3
d we l l i d = BZ 1 J
Ro o m a ) L i v i n g Rm b ) Be d r m 1
1 0
1 5
2 0
2 5
3 0
3 5
Ex t e r n a l T e mp . ( C)
- 5 0 5 1 0 1 5 2 0 2 5 3 0 3 5
BedZED Phase 1: Dwelling J

32
4
d we l l i d = BZ 1 L
Ro o m a ) L i v i n g Rm b ) Be d r m 1
1 0
1 5
2 0
2 5
3 0
3 5
Ex t e r n a l T e mp . ( C)
- 5 0 5 1 0 1 5 2 0 2 5 3 0 3 5
BedZED Phase 1: Dwelling L

32
5
d we l l i d = BZ 1 M
Ro o m a ) L i v i n g Rm b ) Be d r m 1
1 0
1 5
2 0
2 5
3 0
3 5
Ex t e r n a l T e mp . ( C)
- 5 0 5 1 0 1 5 2 0 2 5 3 0 3 5
BedZED Phase 1: Dwelling M

32
6
d we l l i d = BZ 1 N
Ro o m a ) L i v i n g Rm b ) Be d r m 1
1 0
1 5
2 0
2 5
3 0
3 5
Ex t e r n a l T e mp . ( C)
- 5 0 5 1 0 1 5 2 0 2 5 3 0 3 5
BedZED Phase 1: Dwelling N

32
7
d we l l i d = BZ 1 P
Ro o m a ) L i v i n g Rm b ) Be d r m 1
1 0
1 5
2 0
2 5
3 0
3 5
Ex t e r n a l T e mp . ( C)
- 5 0 5 1 0 1 5 2 0 2 5 3 0 3 5
BedZED Phase 1: Dwelling P
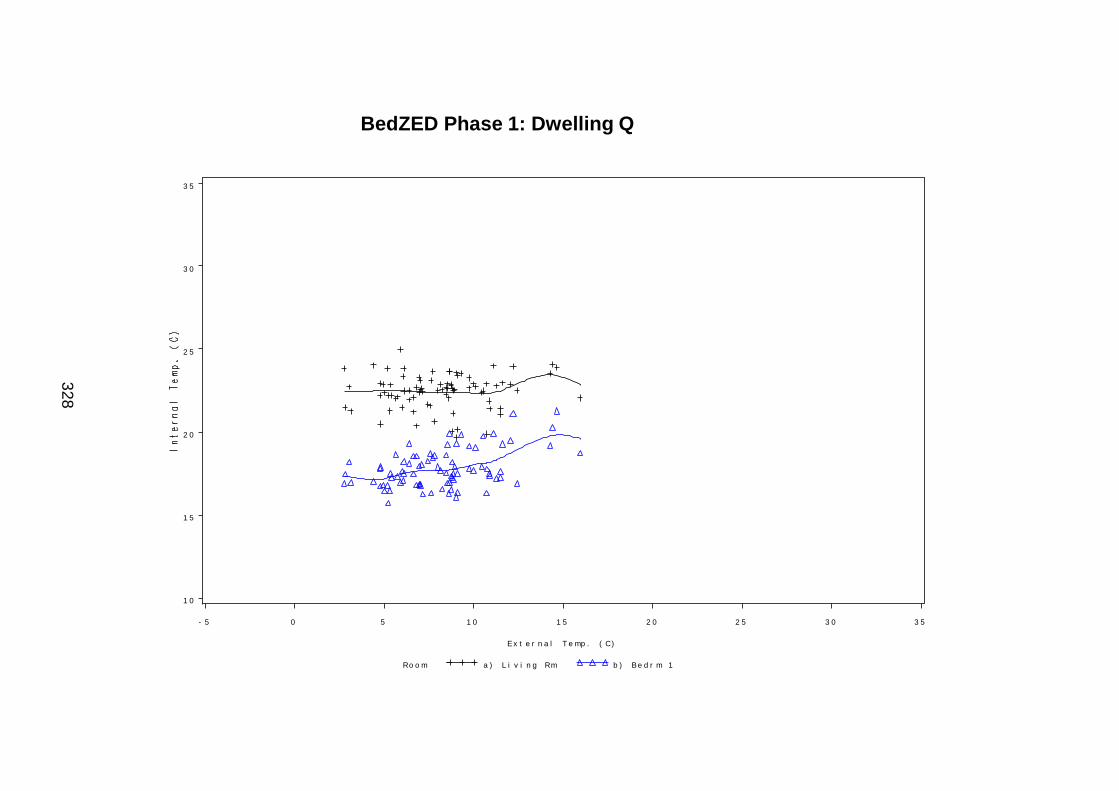
32
8
d we l l i d = BZ 1 Q
Ro o m a ) L i v i n g Rm b ) Be d r m 1
1 0
1 5
2 0
2 5
3 0
3 5
Ex t e r n a l T e mp . ( C)
- 5 0 5 1 0 1 5 2 0 2 5 3 0 3 5
BedZED Phase 1: Dwelling Q

32
9
d we l l i d = BZ 1 R
Ro o m a ) L i v i n g Rm b ) Be d r m 1
1 0
1 5
2 0
2 5
3 0
3 5
Ex t e r n a l T e mp . ( C)
- 5 0 5 1 0 1 5 2 0 2 5 3 0 3 5
BedZED Phase 1: Dwelling R

33
0
d we l l i d = BZ 1 S
Ro o m a ) L i v i n g Rm b ) Be d r m 1
1 0
1 5
2 0
2 5
3 0
3 5
Ex t e r n a l T e mp . ( C)
- 5 0 5 1 0 1 5 2 0 2 5 3 0 3 5
BedZED Phase 1: Dwelling S

33
1
d we l l i d = BZ 1 V
Ro o m a ) L i v i n g Rm b ) Be d r m 1
1 0
1 5
2 0
2 5
3 0
3 5
Ex t e r n a l T e mp . ( C)
- 5 0 5 1 0 1 5 2 0 2 5 3 0 3 5
BedZED Phase 1: Dwelling V

33
2
d we l l i d = BZ 1 X
Ro o m a ) L i v i n g Rm b ) Be d r m 1
1 0
1 5
2 0
2 5
3 0
3 5
Ex t e r n a l T e mp . ( C)
- 5 0 5 1 0 1 5 2 0 2 5 3 0 3 5
BedZED Phase 1: Dwelling X

33
3
d we l l i d = BZ 1 AB
Ro o m a ) L i v i n g Rm b ) Be d r m 1
1 0
1 5
2 0
2 5
3 0
3 5
Ex t e r n a l T e mp . ( C)
- 5 0 5 1 0 1 5 2 0 2 5 3 0 3 5
BedZED Phase 1: Dwelling AB

33
4
A p p e n d i x 6 : P h a s e 2 T e m p e r a t u r e S u m m a r i e s ( B e d Z E D )
Ro o m= a ) L i v i n g Rm
Ro o m a ) L i v i n g Rm
1 0
1 5
2 0
2 5
3 0
3 5
Ex t e r n a l T e mp . ( C)
- 5 0 5 1 0 1 5 2 0 2 5 3 0 3 5
BedZED Phase 2: All Dwellings – Living Rooms

33
5
Ro o m= b ) Be d r m 1
Ro o m b ) Be d r m 1
1 0
1 5
2 0
2 5
3 0
3 5
Ex t e r n a l T e mp . ( C)
- 5 0 5 1 0 1 5 2 0 2 5 3 0 3 5
BedZED Phase 2: All Dwellings – Bedroom 1
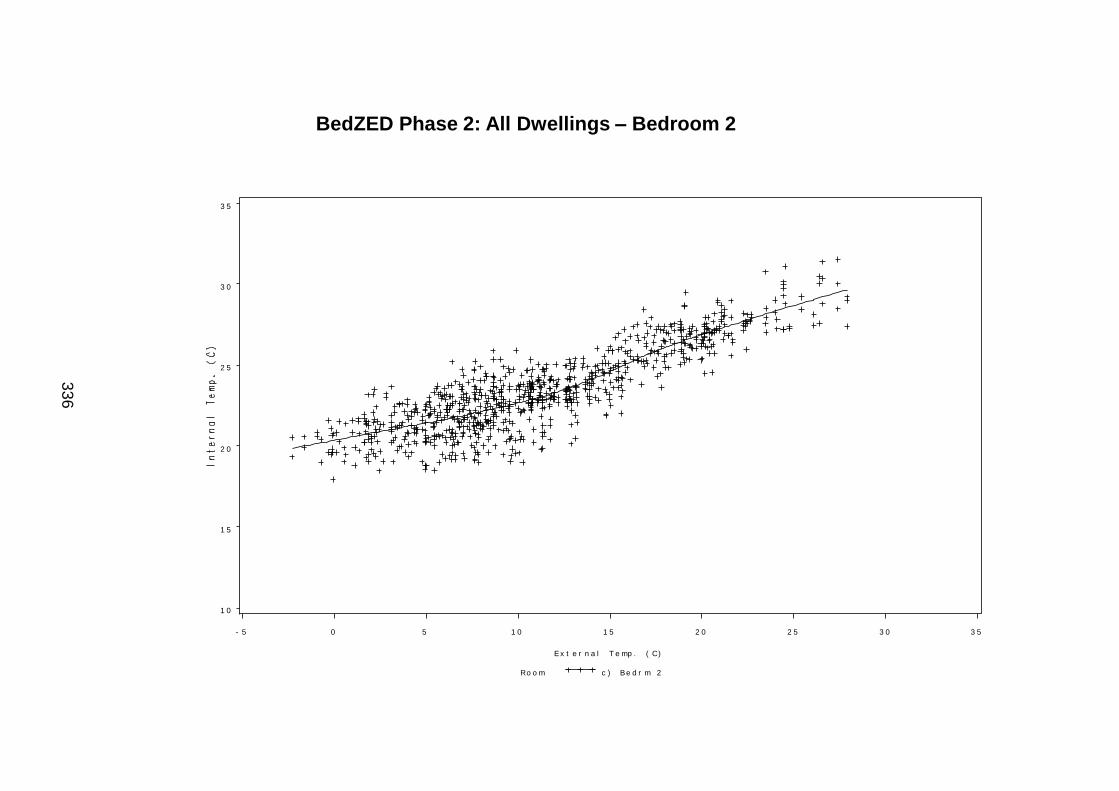
33
6
Ro o m= c ) Be d r m 2
Ro o m c ) Be d r m 2
1 0
1 5
2 0
2 5
3 0
3 5
Ex t e r n a l T e mp . ( C)
- 5 0 5 1 0 1 5 2 0 2 5 3 0 3 5
BedZED Phase 2: All Dwellings – Bedroom 2

33
7
Ro o m= d ) Ba t h r m
Ro o m d ) Ba t h r m
1 0
1 5
2 0
2 5
3 0
3 5
Ex t e r n a l T e mp . ( C)
- 5 0 5 1 0 1 5 2 0 2 5 3 0 3 5
Ro o m= d ) Ba t h r m
Ro o m d ) Ba t h r m
1 0
1 5
2 0
2 5
3 0
3 5
Ex t e r n a l T e mp . ( C)
- 5 0 5 1 0 1 5 2 0 2 5 3 0 3 5
BedZED Phase 2: All Dwellings – Bathrooms
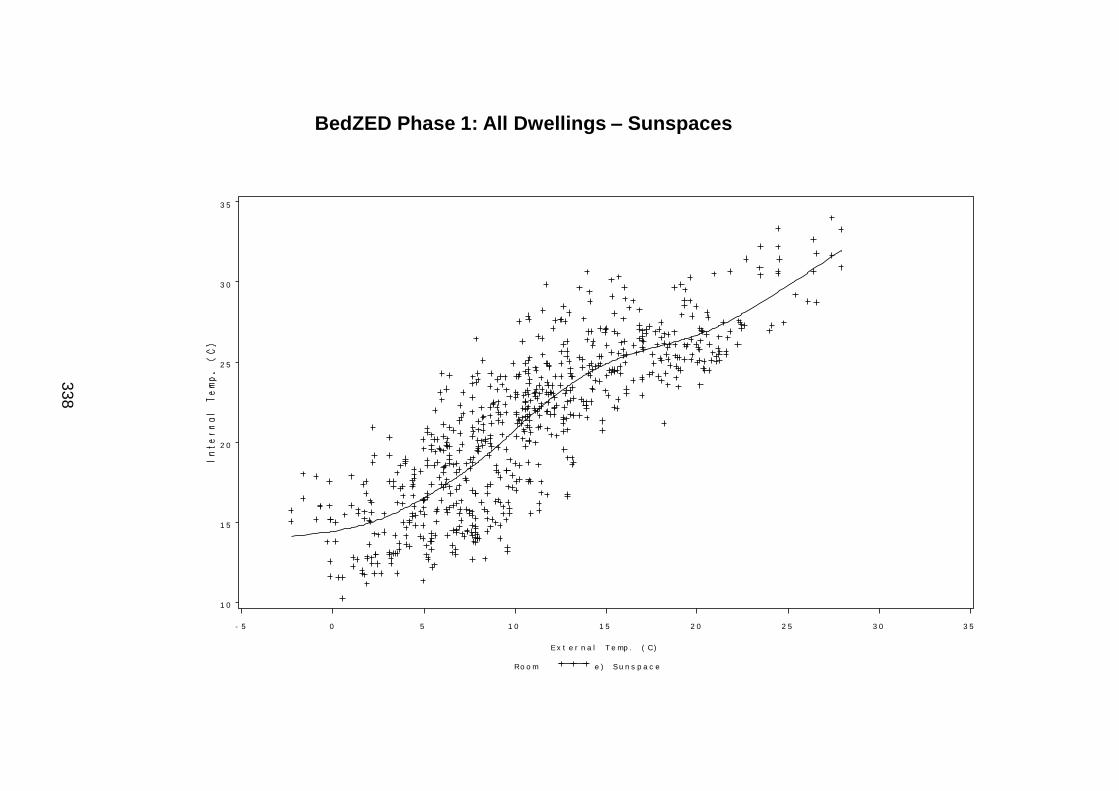
33
8
Ro o m= e ) Su n s p a c e
Ro o m e ) Su n s p a c e
1 0
1 5
2 0
2 5
3 0
3 5
Ex t e r n a l T e mp . ( C)
- 5 0 5 1 0 1 5 2 0 2 5 3 0 3 5
BedZED Phase 1: All Dwellings – Sunspaces

33
9
d we l l i d = BZ 2 A
Ro o m a ) L i v i n g Rm b ) Be d r m 1
1 0
1 5
2 0
2 5
3 0
3 5
Ex t e r n a l T e mp . ( C)
- 5 0 5 1 0 1 5 2 0 2 5 3 0 3 5
BedZED Phase 2: Dwelling A

34
0
d we l l i d = BZ 2 B
Ro o m a ) L i v i n g Rm b ) Be d r m 1
1 0
1 5
2 0
2 5
3 0
3 5
Ex t e r n a l T e mp . ( C)
- 5 0 5 1 0 1 5 2 0 2 5 3 0 3 5
BedZED Phase 2: Dwelling B

34
1
d we l l i d = BZ 2 C
Ro o m a ) L i v i n g Rm b ) Be d r m 1
1 0
1 5
2 0
2 5
3 0
3 5
Ex t e r n a l T e mp . ( C)
- 5 0 5 1 0 1 5 2 0 2 5 3 0 3 5
BedZED Phase 2: Dwelling C

34
2
d we l l i d = BZ 2 D
Ro o m a ) L i v i n g Rm b ) Be d r m 1
1 0
1 5
2 0
2 5
3 0
3 5
Ex t e r n a l T e mp . ( C)
- 5 0 5 1 0 1 5 2 0 2 5 3 0 3 5
BedZED Phase 2: Dwelling D

34
3
d we l l i d = BZ 2 E
Ro o m a ) L i v i n g Rm b ) Be d r m 1 e ) Su n s p a c e
1 0
1 5
2 0
2 5
3 0
3 5
Ex t e r n a l T e mp . ( C)
- 5 0 5 1 0 1 5 2 0 2 5 3 0 3 5
BedZED Phase 2: Dwelling E

34
4
d we l l i d = BZ 2 F
Ro o m a ) L i v i n g Rm b ) Be d r m 1
1 0
1 5
2 0
2 5
3 0
3 5
Ex t e r n a l T e mp . ( C)
- 5 0 5 1 0 1 5 2 0 2 5 3 0 3 5
BedZED Phase 2: Dwelling F

34
5
d we l l i d = BZ 2 G
Ro o m a ) L i v i n g Rm b ) Be d r m 1
1 0
1 5
2 0
2 5
3 0
3 5
Ex t e r n a l T e mp . ( C)
- 5 0 5 1 0 1 5 2 0 2 5 3 0 3 5
BedZED Phase 2: Dwelling G

34
6
d we l l i d = BZ 2 H
Ro o m a ) L i v i n g Rm b ) Be d r m 1 c ) Be d r m 2 d ) Ba t h r m
1 0
1 5
2 0
2 5
3 0
3 5
Ex t e r n a l T e mp . ( C)
- 5 0 5 1 0 1 5 2 0 2 5 3 0 3 5
BedZED Phase 2: Dwelling H

34
7
d we l l i d = BZ 2 J
Ro o m a ) L i v i n g Rm b ) Be d r m 1
1 0
1 5
2 0
2 5
3 0
3 5
Ex t e r n a l T e mp . ( C)
- 5 0 5 1 0 1 5 2 0 2 5 3 0 3 5
BedZED Phase 2: Dwelling J

34
8
d we l l i d = BZ 2 K
Ro o m a ) L i v i n g Rm b ) Be d r m 1
1 0
1 5
2 0
2 5
3 0
3 5
Ex t e r n a l T e mp . ( C)
- 5 0 5 1 0 1 5 2 0 2 5 3 0 3 5
BedZED Phase 2: Dwelling K

34
9
d we l l i d = BZ 2 L
Ro o m a ) L i v i n g Rm b ) Be d r m 1
1 0
1 5
2 0
2 5
3 0
3 5
Ex t e r n a l T e mp . ( C)
- 5 0 5 1 0 1 5 2 0 2 5 3 0 3 5
BedZED Phase 2: Dwelling L

35
0
d we l l i d = BZ 2 M
Ro o m a ) L i v i n g Rm b ) Be d r m 1
1 0
1 5
2 0
2 5
3 0
3 5
Ex t e r n a l T e mp . ( C)
- 5 0 5 1 0 1 5 2 0 2 5 3 0 3 5
BedZED Phase 2: Dwelling M
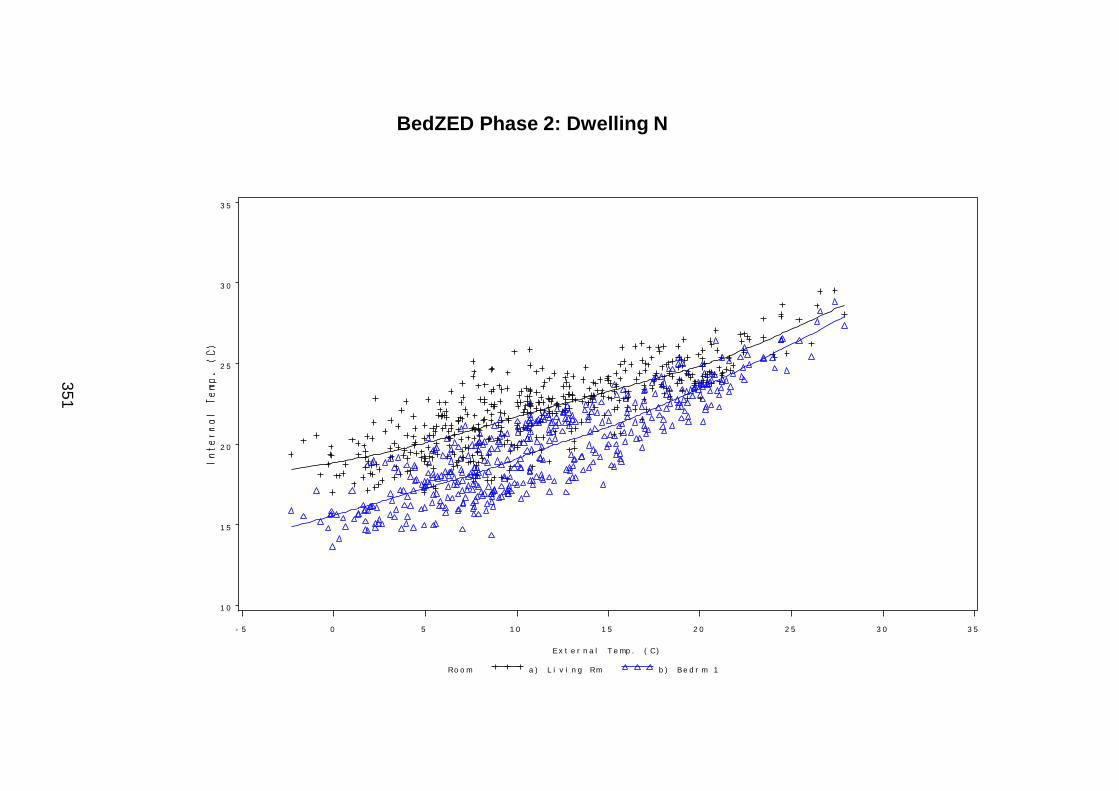
35
1
d we l l i d = BZ 2 N
Ro o m a ) L i v i n g Rm b ) Be d r m 1
1 0
1 5
2 0
2 5
3 0
3 5
Ex t e r n a l T e mp . ( C)
- 5 0 5 1 0 1 5 2 0 2 5 3 0 3 5
BedZED Phase 2: Dwelling N

35
2
d we l l i d = BZ 2 P
Ro o m a ) L i v i n g Rm b ) Be d r m 1
1 0
1 5
2 0
2 5
3 0
3 5
Ex t e r n a l T e mp . ( C)
- 5 0 5 1 0 1 5 2 0 2 5 3 0 3 5
BedZED Phase 2: Dwelling P

35
3
d we l l i d = BZ 2 Q
Ro o m a ) L i v i n g Rm b ) Be d r m 1
1 0
1 5
2 0
2 5
3 0
3 5
Ex t e r n a l T e mp . ( C)
- 5 0 5 1 0 1 5 2 0 2 5 3 0 3 5
BedZED Phase 2: Dwelling Q

35
4
d we l l i d = BZ 2 R
Ro o m a ) L i v i n g Rm b ) Be d r m 1 c ) Be d r m 2 d ) Ba t h r m
1 0
1 5
2 0
2 5
3 0
3 5
Ex t e r n a l T e mp . ( C)
- 5 0 5 1 0 1 5 2 0 2 5 3 0 3 5
BedZED Phase 2: Dwelling R

35
5
d we l l i d = BZ 2 S
Ro o m a ) L i v i n g Rm b ) Be d r m 1 e ) Su n s p a c e
1 0
1 5
2 0
2 5
3 0
3 5
Ex t e r n a l T e mp . ( C)
- 5 0 5 1 0 1 5 2 0 2 5 3 0 3 5
BedZED Phase 2: Dwelling S

35
6
d we l l i d = BZ 2 T
Ro o m a ) L i v i n g Rm b ) Be d r m 1
1 0
1 5
2 0
2 5
3 0
3 5
Ex t e r n a l T e mp . ( C)
- 5 0 5 1 0 1 5 2 0 2 5 3 0 3 5
BedZED Phase 2: Dwelling T

35
7
d we l l i d = BZ 2 V
Ro o m a ) L i v i n g Rm b ) Be d r m 1
1 0
1 5
2 0
2 5
3 0
3 5
Ex t e r n a l T e mp . ( C)
- 5 0 5 1 0 1 5 2 0 2 5 3 0 3 5
BedZED Phase 2: Dwelling V

35
8
d we l l i d = BZ 2 W
Ro o m a ) L i v i n g Rm b ) Be d r m 1
1 0
1 5
2 0
2 5
3 0
3 5
Ex t e r n a l T e mp . ( C)
- 5 0 5 1 0 1 5 2 0 2 5 3 0 3 5
BedZED Phase 2: Dwelling W
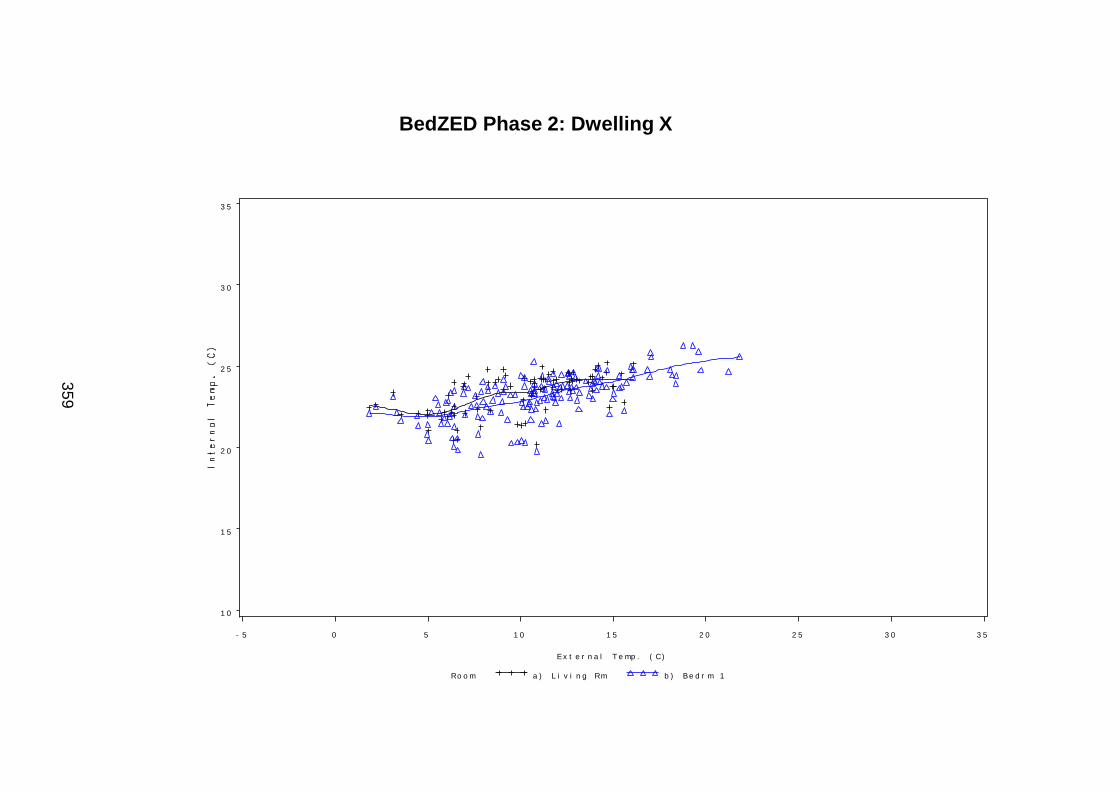
35
9
d we l l i d = BZ 2 X
Ro o m a ) L i v i n g Rm b ) Be d r m 1
1 0
1 5
2 0
2 5
3 0
3 5
Ex t e r n a l T e mp . ( C)
- 5 0 5 1 0 1 5 2 0 2 5 3 0 3 5
BedZED Phase 2: Dwelling X

36
0
d we l l i d = BZ 2 Z
Ro o m a ) L i v i n g Rm b ) Be d r m 1 c ) Be d r m 2
1 0
1 5
2 0
2 5
3 0
3 5
Ex t e r n a l T e mp . ( C)
- 5 0 5 1 0 1 5 2 0 2 5 3 0 3 5
BedZED Phase 2: Dwelling Z

36
1
d we l l i d = BZ 2 AB
Ro o m a ) L i v i n g Rm b ) Be d r m 1
1 0
1 5
2 0
2 5
3 0
3 5
Ex t e r n a l T e mp . ( C)
- 5 0 5 1 0 1 5 2 0 2 5 3 0 3 5
BedZED Phase 2: Dwelling AB

36
2
d we l l i d = BZ 2 AE
Ro o m a ) L i v i n g Rm b ) Be d r m 1
1 0
1 5
2 0
2 5
3 0
3 5
Ex t e r n a l T e mp . ( C)
- 5 0 5 1 0 1 5 2 0 2 5 3 0 3 5
BedZED Phase 2: Dwelling AE

36
3
A p p e n d i x 7 : I n t e r n a l T e m p e r a t u r e S u m m a r i e s f r o m o t h e r C a s e S t u d i e s

36
4

365
Appendix 8 : BedZED Air-tightness and Infra-Red Thermography Test Results
Cold spots at junction of wall and ceiling
possibly due to incorrect edge detailing
above the bathroom ceiling.
The higher wall surface temperature is
due to the party wall facing the next door
heated space.
Infra-red Thermography Test : Bathroom Ceiling
21.6°C
24.6°C
22
23
24
AR01
SP01
LI01
22.3°C
24.4°C
23
24
AR01
SP01
LI01
18.4°C
21.3°C
19
20
21
AR01
SP01
LI01

366
Cold area visible along the end of east wall and the concrete ceiling joint, possibly caused by missing insulation or cold air ingress between the roof flashing and the edge of the roof concrete slab
Cold area visible at junction of roof and walls, possibly caused by incorrect edge detailing at the junction of the walls and roof.
Infra-red Thermography Test : Living Room Ceiling
16.8°C
20.9°C
17
18
19
20
AR01
SP01
LI01
19.6°C
22.2°C
20
21
22
AR01
SP01
LI01

367
Thermographic test suggests an area of missing roof insulation
Infra-red Thermography Test : Bedroom Ceiling
Cold spot at junction of wall and ceiling suggests possible incorrect edge detailing. Decrease in surface temperature of the ceiling towards the colder sunspace.
Infra-red Thermography Test : Kitchen ceiling
19.2°C
22.2°C
20
21
22
AR01
SP01
LI01
19.1°C
21.7°C
20
21
AR01
SP01
LI01

368
No missing roof insulation. Cold spots along the ceiling possibly caused by cold air ingress between the roof insulation and the concrete slab
Air ingress through the letter box
Infra-red Thermography Test : North facing entrance hall
15.5°C
20.6°C
16
17
18
19
20
AR01
SP01
LI01
22.4°C
25.0°C
23
24
AR01
SP01
LI01
15.3°C
20.1°C
16
17
18
19
20
AR01
SP01
LI01
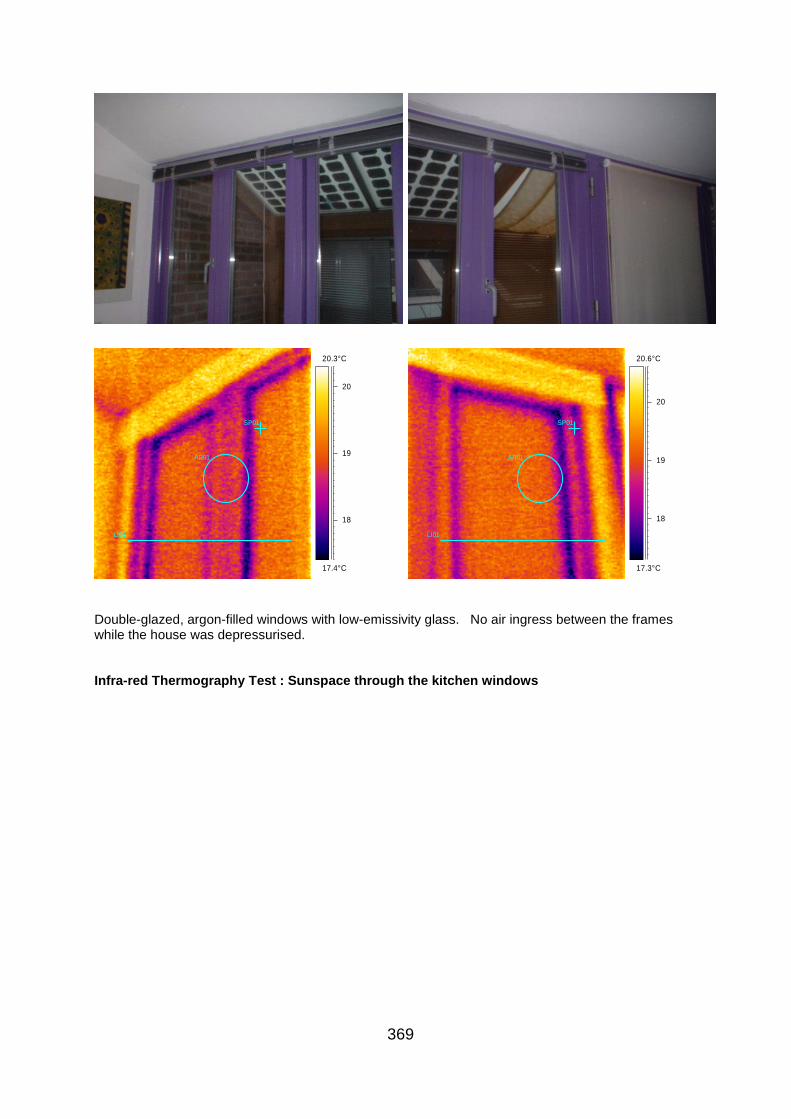
369
Double-glazed, argon-filled windows with low-emissivity glass. No air ingress between the frames while the house was depressurised.
Infra-red Thermography Test : Sunspace through the kitchen windows
17.4°C
20.3°C
18
19
20
AR01
SP01
LI01
17.3°C
20.6°C
18
19
20
AR01
SP01
LI01

370
No air ingress between the frames while the house was depressurised
Infra-red Thermography Test: Glazed doors leading into Sunspace
14.9°C
19.9°C
15
16
17
18
19
AR01
SP01
LI01
15.1°C
20.4°C
16
17
18
19
20
AR01
SP01
LI01
14.8°C
19.7°C
15
16
17
18
19
AR01
SP01
LI01
14.5°C
20.0°C
15
16
17
18
19
20
AR01
SP01
LI01
13.6°C
19.0°C
14
15
16
17
18
19
AR01
SP01
LI01
11.6°C
17.6°C
12
13
14
15
16
17
AR01
SP01
LI01

371
Triple glazed argon-filled window with low emissivity glass. No air ingress between the frames while the house was depressurised.
Infra-red Thermography Test : East facing window
Triple-glazed, argon-filled window with low emissivity glass. No air ingress between the frames while the house was depressurised.
Infra-red Thermography Test : North facing window
14.2°C
20.4°C
15
16
17
18
19
20
AR01
SP01
LI01
14.3°C
20.5°C
15
16
17
18
19
20
AR01
SP01
LI01
14.4°C
21.3°C
15
16
17
18
19
20
21
AR01
SP01
LI01

372
Bathroom wall opening to the passive stack vent. Cold air ingress during depressurisation indicates the bathroom passive vent is open and functioning.
Infra-red Thermography Test : Bathroom passive stack ventilation
Bedroom wall opening to the passive stack vent. Cold air ingress during depressurisation indicates the passive vent in the bedroom is open and functioning.
Infra-red Thermography Test : Bedroom passive stack ventilation
15.6°C
24.2°C
16
18
20
22
24AR01
SP01
LI01
17.9°C
21.1°C
18
19
20
21AR01
SP01
LI01

373
Kitchen passive stack vent opening above the cupboards. Cold air ingress during depressurisation indicates the passive vent in the kitchen is open and functioning.
Infra-red Thermography Test : Kitchen passive stack ventilation
15.2°C
22.5°C
16
17
18
19
20
21
22
AR01
SP01
LI01

374
No missing cavity wall insulation. The main source of fabric heat loss is through the windows and the door. Higher heat loss through the main living space windows indicate higher indoor temperature compared to the sunspace.
Rooftop windows for daylight are the main source of heat loss through the roof.
External Infra-red Thermography Test: West Elevation
3.0°C
7.2°C
3
4
5
6
7AR01
SP01
LI01
3.0°C
7.6°C
3
4
5
6
7
AR01
SP01
LI01
2.0°C
8.6°C
2
3
4
5
6
7
8
AR01
SP01
LI01

375
No missing cavity wall insulation. External Infra-red Thermography Test : East Elevation
Greater heat loss in the middle flat indicates extra source of space heating or windows open to the sunspace.
External Infra-red Thermography Test : South Elevation
3.3°C
8.3°C
4
5
6
7
8AR01
SP01
LI01
2.6°C
8.0°C
3
4
5
6
7
8AR01
SP01
LI01
2.0°C
7.6°C
2
3
4
5
6
7
AR01
SP01
LI01
Related Documents