Towards understanding the effect of uncertainty in the number of contributors to DNA stains John S. Buckleton a , James M. Curran b, * , Peter Gill c a The Institute of Environmental Science and Research Ltd., Private Bag 92021, Auckland, New Zealand b Department of Statistics, University of Auckland, Private Bag 92019, Auckland, New Zealand c The Forensic Science Service, Trident Court, Solihull Parkway, Birmingham Business Park, Solihull B37 7YN, UK Received 31 May 2006; received in revised form 12 September 2006; accepted 13 September 2006 Abstract DNA evidence recovered from a scene or collected in relation to a case is generally declared as a mixture when more than two alleles are observed at several loci. However, in principle, all DNA profiles may be considered to be potentially mixtures, even those that show not more than two alleles at any locus. When using a likelihood ratio approach to the interpretation of mixed DNA profiles it is necessary to postulate the number of potential contributors. However, this number is never known with certainty. The possibility of a, say three-person mixture, presenting four or fewer peaks at each locus of the CODIS set was explored by Paoletti et al. [D.R. Paoletti, T.E. Doom, C.M. Krane, M.L. Raymer, D.E. Krane, Empirical analysis of the STR profiles resulting from conceptual mixtures, J. Forensic Sci. 50 (2005) 1361–1366]. In this work we extend this analysis to consider the profiler plus and SGM plus multiplices. We begin the assessment of the risk associated with current practice in the calculation of LR’s. We open the discussion of possible ways to surmount this ambiguity. # 2006 Elsevier Ireland Ltd. All rights reserved. Keywords: Likelihood ratio; Mixtures; Binary model 1. Introduction In forensic DNA analysis a sample associated with a crime may be genotyped and compared with genotypes obtained from individuals of interest to the investigation. Any number of alleles may be observed in the sample from the crime scene at each locus. Typically if only one or two alleles per locus are observed then the sample is treated as originating from one donor. This is often termed a single contributor stain or a simple stain. If more than two alleles are observed at multiple loci in the crime sample then it will most likely be treated as a DNA mixture. DNA mixtures may be comprised of any number of contributors and combine in any proportion. The individual who contributed the most DNA is usually referred to as the major contributor. A contributor who is present at low levels compared with other contributors is referred to as a minor contributor. There is usually a reasonable proportionality between the fraction of DNA contributed and the peak areas. As a general rule a major contributor will make larger allelic peaks than a minor contributor, although there may be considerable variation from locus to locus. If a minor contributor represents less than ten percent of the amplified product, it is often hard to separate the minor contributor’s alleles from stutter effects. Scientists using modern DNA interpretation techniques for mixtures are likely to pay attention to the peak heights or areas of the peaks when making judgements about the number of contributors. The peak heights or areas are termed the quantitative information. For example, if a locus showed two peaks but one was markedly larger than the other, the analyst may interpret this as an indication that the stain is a mixture. Such an effect is termed peak imbalance. Scientists may also use the peak height or area information during the interpretation stage of their assessment [2]. Many commentators, including ourselves, consider the Bayesian approach through the use of a likelihood ratio to be the preferred way to interpret mixtures. The likelihood ratio requires the estimation of the probability of the evidence, E, www.elsevier.com/locate/fsig Forensic Science International: Genetics 1 (2007) 20–28 * Corresponding author. Tel.: +64 9 3737 599; fax: +64 9 3737 018. E-mail addresses: [email protected] (J.S. Buckleton), [email protected] (J.M. Curran), [email protected] (P. Gill). 1872-4973/$ – see front matter # 2006 Elsevier Ireland Ltd. All rights reserved. doi:10.1016/j.fsigen.2006.09.002

Welcome message from author
This document is posted to help you gain knowledge. Please leave a comment to let me know what you think about it! Share it to your friends and learn new things together.
Transcript

www.elsevier.com/locate/fsig
Forensic Science International: Genetics 1 (2007) 20–28
Towards understanding the effect of uncertainty in the
number of contributors to DNA stains
John S. Buckleton a, James M. Curran b,*, Peter Gill c
a The Institute of Environmental Science and Research Ltd., Private Bag 92021, Auckland, New Zealandb Department of Statistics, University of Auckland, Private Bag 92019, Auckland, New Zealand
c The Forensic Science Service, Trident Court, Solihull Parkway, Birmingham Business Park, Solihull B37 7YN, UK
Received 31 May 2006; received in revised form 12 September 2006; accepted 13 September 2006
Abstract
DNA evidence recovered from a scene or collected in relation to a case is generally declared as a mixture when more than two alleles are
observed at several loci. However, in principle, all DNA profiles may be considered to be potentially mixtures, even those that show not more than
two alleles at any locus. When using a likelihood ratio approach to the interpretation of mixed DNA profiles it is necessary to postulate the number
of potential contributors. However, this number is never known with certainty. The possibility of a, say three-person mixture, presenting four or
fewer peaks at each locus of the CODIS set was explored by Paoletti et al. [D.R. Paoletti, T.E. Doom, C.M. Krane, M.L. Raymer, D.E. Krane,
Empirical analysis of the STR profiles resulting from conceptual mixtures, J. Forensic Sci. 50 (2005) 1361–1366]. In this work we extend this
analysis to consider the profiler plus and SGM plus multiplices. We begin the assessment of the risk associated with current practice in the
calculation of LR’s. We open the discussion of possible ways to surmount this ambiguity.
# 2006 Elsevier Ireland Ltd. All rights reserved.
Keywords: Likelihood ratio; Mixtures; Binary model
1. Introduction
In forensic DNA analysis a sample associated with a crime
may be genotyped and compared with genotypes obtained from
individuals of interest to the investigation. Any number of
alleles may be observed in the sample from the crime scene at
each locus. Typically if only one or two alleles per locus are
observed then the sample is treated as originating from one
donor. This is often termed a single contributor stain or a simple
stain. If more than two alleles are observed at multiple loci in
the crime sample then it will most likely be treated as a DNA
mixture.
DNA mixtures may be comprised of any number of
contributors and combine in any proportion. The individual
who contributed the most DNA is usually referred to as the
major contributor. A contributor who is present at low levels
* Corresponding author. Tel.: +64 9 3737 599; fax: +64 9 3737 018.
E-mail addresses: [email protected] (J.S. Buckleton),
[email protected] (J.M. Curran), [email protected]
(P. Gill).
1872-4973/$ – see front matter # 2006 Elsevier Ireland Ltd. All rights reserved.
doi:10.1016/j.fsigen.2006.09.002
compared with other contributors is referred to as a minor
contributor. There is usually a reasonable proportionality
between the fraction of DNA contributed and the peak areas. As
a general rule a major contributor will make larger allelic peaks
than a minor contributor, although there may be considerable
variation from locus to locus. If a minor contributor represents
less than ten percent of the amplified product, it is often hard to
separate the minor contributor’s alleles from stutter effects.
Scientists using modern DNA interpretation techniques for
mixtures are likely to pay attention to the peak heights or areas
of the peaks when making judgements about the number of
contributors. The peak heights or areas are termed the
quantitative information. For example, if a locus showed two
peaks but one was markedly larger than the other, the analyst
may interpret this as an indication that the stain is a mixture.
Such an effect is termed peak imbalance. Scientists may also
use the peak height or area information during the interpretation
stage of their assessment [2].
Many commentators, including ourselves, consider the
Bayesian approach through the use of a likelihood ratio to be
the preferred way to interpret mixtures. The likelihood ratio
requires the estimation of the probability of the evidence, E,

J.S. Buckleton et al. / Forensic Science International: Genetics 1 (2007) 20–28 21
given the prosecution hypothesis, Hp, and the alternative
defence hypothesis, Hd. That is
LR ¼ PrðEjHpÞPrðEjHdÞ
In a conventional approach to mixture analysis, there is
usually an explicit assumption of the number of unknown
(untyped) contributors to the evidential mixture under each
hypothesis. This number is usually fixed by the analyst, but may
easily be varied in response to queries from the court. The
leading alternative method to the LR is the exclusion
probability, pE. Buckleton et al. [2] give a definition of the
exclusion probability as:
‘‘The probability that a random person would be excluded as
a contributor to the observed DNA mixture.’’
The exclusion probability approach does not assume the
number of contributors and this is seen by many as a
considerable advantage. However, it has also received much
adverse comment [3–5].
Strictly the true number of contributors to a sample is never
known. Even apparently single contributor stains that show only
one or two alleles per locus could be mixtures, with one
contributor masked by another. This is called the masking effect.
These matters are complicated by effects such as allelic dropout,
stutter and related contributors. The possibility of a three-person
mixture for example, presenting four or fewer peaks at each locus
of the CODIS set was explored by Paoletti et al. [1].
The assumption of a fixed number of contributors has
become a contentious matter in Australian courts. The
argument follows:
To calculate the LR the number of contributors is assumed.
This number is not known for certain, hence the calculation
cannot be shown to be based on valid assumptions.
In this paper we extend the work of Paoletti et al. [1] using
simulation with the Profiler Plus set of loci, which is in common
use in Australia and the SGM+TM set of loci, which is in use in
New Zealand and the UK. Paoletti et al. [1] combined actual
observed profiles to create mixtures but also used simulation by
randomising the observed alleles. They attributed the difference
between their simulated sets and the sets made by combining
actual observed profiles to the presence of relatives in the
database although the presence of substructure is an equally
viable explanation. We follow the work of Paoletti et al. to begin
the assessment of the risk associated with common practice in the
calculation of likelihood ratios, LRs. We seek to assess the
incidence of situations where the number of contributors that
maximises the probability of the evidence under Hd is greater
than the minimum required to explain the number of peaks. In
such cases the LR will not be minimised by assuming the
minimum number of contributors under Hd as is typical practice.
We also discuss some potential ways forward. We reject the
argument that we cannot present any assessment of such
evidence. In our view this argument requires that the
assessment of all evidence must be perfect and based on
completely valid models. Such a requirement would, if strictly
applied, exclude all forensic and indeed other evidence in court.
There is an often quoted maxim from the well known industrial
statistician George Box which seems appropriate here:
‘‘All models are wrong, but some of them are useful.’’
We point out that studies that lead to an awareness of the
limitations of an approach do not necessarily reduce the validity
of using that approach. Instead they may actually add strength
to our confidence in the use of the model.
2. Method
The effect of masking on the number of alleles presenting at
a multiplex was investigated by simulation. It is important to
note that although these results have been derived by
simulation, it is possible to calculate them theoretically. We
have done this theoretical calculation for one locus and varying
numbers of contributors. Our simulation results conform to
these theoretical expectations. The reason we have chosen to
use simulation is that exhaustive computation becomes very
difficult with multiple loci and multiple contributors.
Contributors were simulated by drawing alleles at their
relative frequency independently. The allele probabilities used
were from the 2004 New Zealand Caucasian population
database (paper in draft). Each contributor was simulated
independently of any other contributor.
The simulation of contributors ignored any correlation
between the two alleles of one contributor (also termed the
inbreeding coefficient and often measured by F IT or F) or
between the alleles of different contributors (also termed
coancestry and often measured by FST or u). Such correlations
are believed to exist but are accepted to be small, especially in
cosmopolitan populations. Ignoring these small correlations
has no effect if the mixture arises from contributions from
individuals of two different subpopulations. However, if
individuals are from the same subpopulation there will be an
increased chance of masked alleles. Any increase in the chance
of masked alleles from this effect will be small for human
populations with realistic levels of subdivision.
The masking effect would also be larger if the contributors to
a mixture were close relatives. For example, if the contributors
to a stain are father and daughter then we expect, at most, three
alleles per locus. Cases where a mixture of close relatives is
likely are often known to the investigators, such as a case of the
murder of a mother and her three daughters.
It is well known that alleles give rise to stutter peaks [12].
The stutters of a major contributor may be of a similar size
(peak height/area) to the allelic peaks of a minor contributor.
This may give rise to additional peaks which may inflate the
number of peaks observed or more likely to mask true allelic
contributions. Stuttering has not been factored into our
simulation. However, the phenomenon is well understood by
caseworkers and is considered in all casework.
When the amount of DNA is limited, alleles may also drop
out [15], i.e. will not be visualised in the electropherogram
because insufficient molecules have been amplified to generate

Table 1
The probability of observing a given number of alleles in a two-person mixtures
for simulated profiles at the SGM+TM loci
Loci No. of alleles
1 2 3 4
D3 0.011 0.240 0.559 0.190
vWA 0.008 0.194 0.548 0.250
D16 0.016 0.287 0.533 0.164
D2 0.003 0.094 0.462 0.441
D8 0.011 0.194 0.521 0.274
D21 0.007 0.147 0.505 0.341
D18 0.003 0.095 0.472 0.430
D19 0.020 0.261 0.516 0.203
THO 0.016 0.271 0.547 0.166
FGA 0.003 0.116 0.500 0.381
Table 2
The probability of observing a given number of alleles in a three-person
mixtures for simulated profiles at the SGM+TM loci
Loci No. of alleles showing
1 2 3 4 5 6
D3 0.000 0.053 0.366 0.463 0.115 0.002
vWA 0.000 0.037 0.285 0.468 0.194 0.016
D16 0.001 0.086 0.397 0.411 0.100 0.005
D2 0.000 0.008 0.104 0.385 0.393 0.110
D8 0.001 0.041 0.258 0.436 0.236 0.029
D21 0.000 0.023 0.192 0.428 0.302 0.055
D18 0.000 0.007 0.109 0.392 0.396 0.096
D19 0.003 0.078 0.352 0.401 0.152 0.014
THO 0.001 0.074 0.395 0.439 0.088 0.002
FGA 0.000 0.012 0.144 0.424 0.346 0.074
Table 3
The probability of observing a given number of alleles in a four person mixtures
for simulated profiles at the SGM+TM loci
Loci No. of alleles showing
1 2 3 4 5 6 7 8
D3 0.000 0.011 0.178 0.497 0.291 0.023 0.001 0.000
vWA 0.000 0.008 0.107 0.406 0.377 0.097 0.005 0.000
J.S. Buckleton et al. / Forensic Science International: Genetics 1 (2007) 20–2822
a signal. The effect is most likely to occur with the minor
contributor(s) and will result in fewer peaks being observed
than there are alleles. Again this effect has not been factored
into our simulation. However, again the phenomenon is well
understood by caseworkers who typically have developed rules
to determine when dropout needs to be considered.
3. Results
3.1. The assessment of allelic overlap for the Profiler Plus
and SGM+TM multiplexes
We begin with the simplest two-person mixture. We initially
assess the probability that a two-person mixture could be
confused with a single contributor stain assuming that a full
profile has been obtained.
Table 1 gives the proportion of 10,000 simulated two-person
mixtures showing 1, 2, 3 or 4 alleles at each of the 10 SGM+TM
loci.
The probability that only one or two alleles would be present
at all of the ten loci is estimated1 as approximately 4.4 � 10�8.
Peak imbalance may alert the analyst to the difficulty in the
small fraction of two-person mixtures that show only one or two
alleles per locus. Taken at face value this analysis suggests that
the chance of confusing a two-person mixture with a simple
stain is very small.
Next we extend this approach to simulated three and four
person mixtures. The results appear in Tables 2 and 3.
From this simulation we estimate2 that 3.3% of three-person
mixtures would present four or fewer alleles for the SGM+TM
loci. The result using the Profiler PlusTM loci was 6.2% (data
not shown). This compares with the values of 3.18–3.39% from
the CODIS set as reported in Paoletti et al. [1]. Again peak
imbalance may indicate the presence of the third contributor. In
1 Assuming independence between loci, the probability of observing one or
two alleles at all ten loci is given by the product of the probability of observing
one or two alleles at each locus. These probabilities can be calculated by adding
the first two columns of Table 1.2 The method is the same as the two contributor case, except this time the first
four columns are summed for each locus.
addition there is some minor information in the fact that a three-
person mixture showing four or fewer alleles has a distribution
more weighted towards three or four alleles than does a true
two-person mixture. However, the fraction of three-person
mixtures exhibiting sufficient masking to show only four or
fewer alleles was surprisingly high.
The simulation of four person mixtures suggests that 0.014%
of four person mixtures would show four or fewer alleles and
that 66% would show six or fewer alleles for the SGM+TM loci.
The results for the Profiler PlusTM loci were 0.6% and 75%
(data not shown). The equivalent values for the CODIS set from
Paoletti et al. were 0.02% showing four or fewer and 76.35%
showing six or fewer.
3.2. The effect on the LR
In this section we considered the effect of ambiguity in the
number of contributors on the subsequent interpretation of the
case.
3.3. An apparent suspect and complainant mixture
We begin with the most common apparent two-person
mixture. We have simulated the profiles for a complainant and a
suspect. These are combined to form the mixture. Therefore,
D16 0.000 0.027 0.240 0.458 0.238 0.036 0.001 0.000
D2 0.000 0.001 0.020 0.148 0.363 0.345 0.112 0.012
D8 0.000 0.009 0.103 0.340 0.377 0.151 0.019 0.001
D21 0.000 0.005 0.058 0.262 0.392 0.231 0.049 0.003
D18 0.000 0.000 0.023 0.166 0.382 0.321 0.101 0.008
D19 0.000 0.025 0.199 0.399 0.282 0.086 0.010 0.000
THO 0.000 0.020 0.222 0.501 0.241 0.016 0.000 0.000
FGA 0.000 0.001 0.034 0.215 0.398 0.281 0.068 0.004

J.S. Buckleton et al. / Forensic Science International: Genetics 1 (2007) 20–28 23
the mixture can be explained by the complainant and the
suspect and this is likely to be what the prosecution hypothesis,
Hp. In many cases the defence will not wish to concede that the
suspect is a contributor but it is not contentious and typically in
their interests to concede that DNA from the complainant is
present. In such cases it would be normal practice to form a
hypothesis on the defence’s behalf that suggests the contribu-
tion of the complainant and one unknown contributor. In the
following simulation we allow the number of unknown
contributors to vary and calculate an LR. The exact form of
the LR will vary depending on the number of peaks at that
locus, the genotype of the suspect and the complainant, and
the hypothesised number of unknown contributors. Typical
formulae for many common situations appear in Buckleton
et al. [2, Chapter 7]. For each simulated profile it is then
possible to determine the number of contributors that gives the
maximum, minimum, or any other LR. In this paper we will
report the number of contributors that gives the minimum LR.
However, we would like to be careful not to appear to condone a
policy of seeking the minimum LR irrespective of plausibility.
In this aspect, as in all casework, it is important that the
hypotheses under consideration are reasonable and not fatuous.
There is a significant element of realism to this simulation.
In most human populations u is near 0, but laboratories typically
use a larger figure. This is very close to what we have simulated.
In Fig. 1 we give a summary of this simulation. We have
varied u across an extensive range of values from 0 to values
that are unrealistically high for human populations. Although
extending across an unrealistic range this shows the trend well.
Examination of the data from this simulation shows that the
fraction of mixed profiles that minimise the LR at more than the
minimum number of required contributors increases as u is
Fig. 1. The number of contributors that minimises the LR across a very wide range o
explained as complainant and suspect.
raised. We have looked at the characteristics of those profiles
that have LR’s minimising at more than the minimum number
of contributors. An apparent two-person mixture cannot have
more that four peaks per locus but may have fewer. Therefore,
the total number of peaks in a ten-locus profile can vary up to
40. The profiles that require more than the minimum number of
contributors tend to be the ones with the larger number of peaks
(data not shown).
Recall that the mixture is simulated using u = 0. Most human
populations exhibit low values for u. We see that the apparent
need to postulate more contributors increases as u is increased
above realistic values.
3.4. An apparent suspect, boyfriend and complainant
mixture
We follow the procedure outlined above and simulate a
three-person mixture that can be explained as the suspect, the
complainant and her consensual partner (boyfriend).
The prosecution hypothesis, Hp, is therefore likely to be that
the contributors are the complainant, her boyfriend, and the
suspect. The defence may not wish to concede that the suspect
is a contributor but it is not likely to be contentious and
typically in the defence interests to concede that DNA from the
complainant and the boyfriend is present. It would be normal
practice to form a hypothesis on the defence’s behalf that
suggests the contribution of the complainant, the boyfriend and
one unknown contributor. However, this ‘‘standard’’ defence
hypothesis constrains the number of contributors to three. As
above we allow the number of unknown contributors to vary
and calculate an LR.
Summary results are presented graphically in Fig. 2.
f values for u for a simple mixture analysed with the SGM+ multiplex that can be
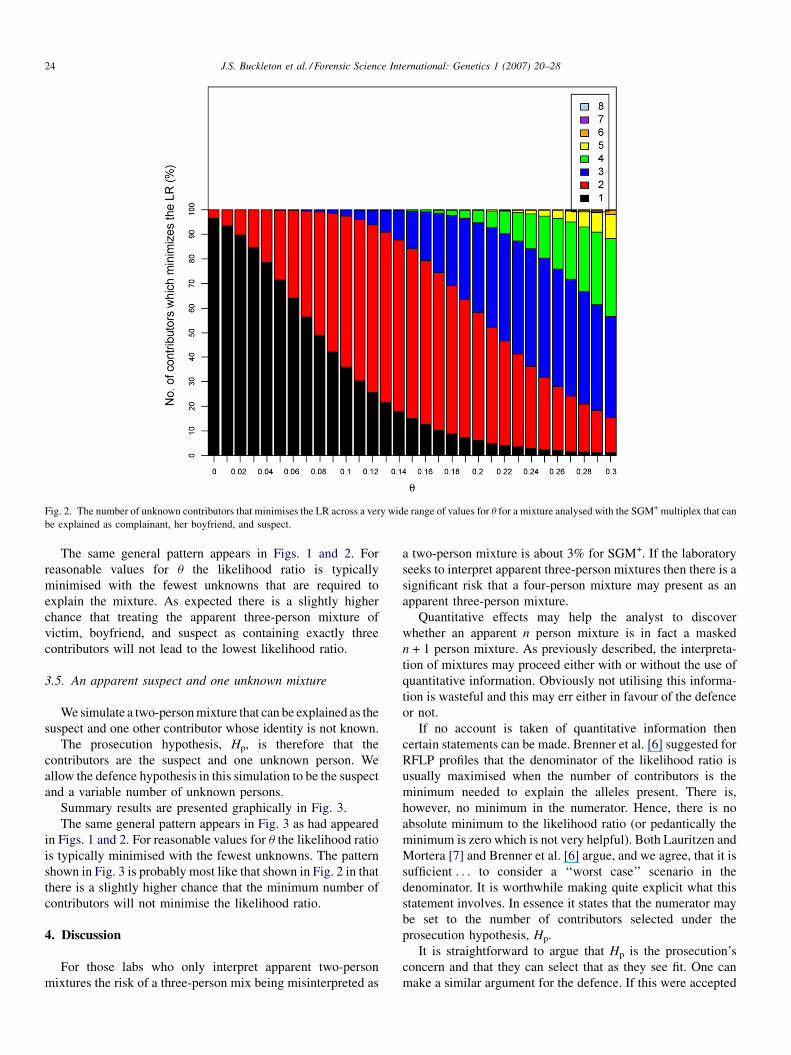
Fig. 2. The number of unknown contributors that minimises the LR across a very wide range of values for u for a mixture analysed with the SGM+ multiplex that can
be explained as complainant, her boyfriend, and suspect.
J.S. Buckleton et al. / Forensic Science International: Genetics 1 (2007) 20–2824
The same general pattern appears in Figs. 1 and 2. For
reasonable values for u the likelihood ratio is typically
minimised with the fewest unknowns that are required to
explain the mixture. As expected there is a slightly higher
chance that treating the apparent three-person mixture of
victim, boyfriend, and suspect as containing exactly three
contributors will not lead to the lowest likelihood ratio.
3.5. An apparent suspect and one unknown mixture
We simulate a two-person mixture that can be explained as the
suspect and one other contributor whose identity is not known.
The prosecution hypothesis, Hp, is therefore that the
contributors are the suspect and one unknown person. We
allow the defence hypothesis in this simulation to be the suspect
and a variable number of unknown persons.
Summary results are presented graphically in Fig. 3.
The same general pattern appears in Fig. 3 as had appeared
in Figs. 1 and 2. For reasonable values for u the likelihood ratio
is typically minimised with the fewest unknowns. The pattern
shown in Fig. 3 is probably most like that shown in Fig. 2 in that
there is a slightly higher chance that the minimum number of
contributors will not minimise the likelihood ratio.
4. Discussion
For those labs who only interpret apparent two-person
mixtures the risk of a three-person mix being misinterpreted as
a two-person mixture is about 3% for SGM+. If the laboratory
seeks to interpret apparent three-person mixtures then there is a
significant risk that a four-person mixture may present as an
apparent three-person mixture.
Quantitative effects may help the analyst to discover
whether an apparent n person mixture is in fact a masked
n + 1 person mixture. As previously described, the interpreta-
tion of mixtures may proceed either with or without the use of
quantitative information. Obviously not utilising this informa-
tion is wasteful and this may err either in favour of the defence
or not.
If no account is taken of quantitative information then
certain statements can be made. Brenner et al. [6] suggested for
RFLP profiles that the denominator of the likelihood ratio is
usually maximised when the number of contributors is the
minimum needed to explain the alleles present. There is,
however, no minimum in the numerator. Hence, there is no
absolute minimum to the likelihood ratio (or pedantically the
minimum is zero which is not very helpful). Both Lauritzen and
Mortera [7] and Brenner et al. [6] argue, and we agree, that it is
sufficient . . . to consider a ‘‘worst case’’ scenario in the
denominator. It is worthwhile making quite explicit what this
statement involves. In essence it states that the numerator may
be set to the number of contributors selected under the
prosecution hypothesis, Hp.
It is straightforward to argue that Hp is the prosecution’s
concern and that they can select that as they see fit. One can
make a similar argument for the defence. If this were accepted

Fig. 3. The number of unknown contributors that minimises the LR across a very wide range of values for u for a mixture analysed with the SGM+ multiplex that can
be explained as a suspect and one unknown.
J.S. Buckleton et al. / Forensic Science International: Genetics 1 (2007) 20–28 25
then it would remove all difficulties. We discuss some the
consequences of this approach in Appendix A.
5. Conclusion
There is a risk that the number of contributors to a mixture
may be wrongly specified by the analyst who assigns this as the
minimum number required to explain the profile. We have
assessed this risk for certain situations. This analysis estimates
the frequency with which this would occur as 3.3% for SGM+
and 6.2% for Profiler Plus which is of a similar order to the
value 3.18–3.39% given by Paoletti et al. The true risk may be
slightly higher or lower than we have estimated due to the
presence of unaccounted factors in our simulation. The use of
quantitative data should identify some profiles where masking
has occurred, but artefacts such as stutter and the possibility of
allelic dropout may raise the risk of misinterpretation.
Suggested ways of moving forward are discussed in the
appendix. We believe that some of these are too complex for
presentation in court and, in addition, may require information
on the prior probability that a stain contains a certain number of
contributors. These priors are likely to be difficult to assess.
The matter is further complicated by the fact that there is no
accepted method to assess the probability of peak heights or
areas given certain genotype combinations. Investigation,
therefore, of the effect of uncertainty in the number of
contributors and the effect of quantitative information is very
difficult. However, this assessment was pursued in a speculative
manner to attempt to highlight areas of most risk. It seems
likely that current procedures for assessing apparent two-
person mixtures are adequate pending the development of
better quantitative methods. We have been unable to highlight
any new areas of concern in this regard and simply repeat
previous warnings regarding the currently used binary model.
In closing we repeat our belief that interpretation methods do
not need to be perfect to be useful. All current models have
strengths and weaknesses and the pursuit of an interpretation
approach that was completely perfect in all regards is certain to
fail. It is important that the risk associated with the use of any
model be assessed and this is what we have attempted in this
paper. It is also important that research that leads to
improvement in our approaches is encouraged and part of this
paper hopes to highlight areas of potential research.
Appendix A
The currently applied approach in most laboratories in
most cases assigns the number of contributes as the minimum
required to explain the number of peaks. Such an approach
would leave the prosecution and defence hypotheses non-
exhaustive. By non-exhaustive we mean that prosecution
and defence hypotheses are non-complementary, i.e. they do
not represent the entire set of possible hypotheses between
them.
Consider the prosecution hypothesis: Hp, the stain contains
the DNA of the complainant and the suspect (and no others).
J.S. Buckleton et al. / Forensic Science International: Genetics 1 (2007) 20–2826
If we add the defence hypothesis chosen by maximising the
probability of the evidence with respect to the number of
contributors, as suggested, it may take the form: Hd, the stain
contains the DNA of the complainant and one unknown person
(and no others).
Clearly these two hypotheses omit all the possibilities
containing a larger number of contributors and hence are not
exhaustive. It has not been argued extensively in the literature
whether or not the hypotheses need to be exhaustive. Buckleton
et al. [2] argue that they should be exhaustive or at least care
must be taken that no relevant hypotheses are omitted in the
denominator. In the context that we are considering here we can
define relevance as any hypothesis with a significant product for
the prior and the likelihood. The same conclusion is supported
by Balding [8]. To explain this we need to consider the situation
if we take an exhaustive approach (at least exhaustive as far as
relevant hypotheses are concerned, we omit unreasonable
hypotheses). Brenner et al. [6] suggested an expansion to the
LR:
LR ¼ PrðEjHpÞPrðEjHdÞ
¼P1
i¼1 PrðEjnc ¼ i;HpÞPrðnc ¼ ijHpÞP1j¼1 PrðEjnc ¼ j;HdÞPrðnc ¼ jjHdÞ
(1)
where E represents the evidence and nc is the number of
contributors. The priors on the number of contributors are
the terms of the form Pr(nc = ijHp) or Pr(nc = jjHd). These
priors may be an unfamiliar concept to many readers and they
are likely to be quite controversial if we attempt to use them in
real casework. They represent the assignment of the prob-
ability that there are, say, three contributors to a mixture,
before we have seen the profiling results. The warning given
above would apply if we omitted any hypothesis where the
product Pr(Ejnc = j, Hd)Pr(nc = jjHd) was large (in relation to
the other probabilities). These comprise hypotheses with a
non-zero prior that also gives a high probability for the
profiling evidence.
Examination of Figs. 1–3 suggest that there is only a
moderate risk of giving a non-minimal LR in the most common
mixture types if the LR is computed using the minimum
number of contributors required to explain the number of peaks.
This supports, at least in these circumstances, Brenner et al.’s
much earlier statement that the denominator is usually
maximised by the minimum number of contributors required.
It is worthwhile noting that there is no mathematical
requirement that the number of contributors under Hp needs to
be the same as the number under Hd. It is theoretically possible
that the distributions of the priors on the number of contributors
could differ under Hp and Hd. However, it is quite difficult to
think of circumstances where they would differ dramatically.
For example, in a case where the complainant stated that she
had been raped by one man and has had no recent consensual
partners, we would expect a vaginal swab to show zero, one or
two contributors regardless of whether the suspect was indeed
the donor. The kind of condition that may alter this expectation
would be the information that the suspect was aspermic, which
may alter our expectation towards fewer contributors under Hp
but not under Hd.
If we follow Brenner et al. [6] and maximise the
denominator and allow the prosecution to select the value of
nc that best suited their scenario then a putative expression
could be
LR� PrðEjnc ¼ i;HpÞPrðnc ¼ ijHpÞPrðEjnc ¼ min;HdÞ
as long as Hp specifies a number of contributors nc = i then the
prior term is equal to one, i.e. Pr(nc = ijHp) = 1. Assigning the
prior on Hp now incorporates the difficulty in specifying the
number of contributors. This would require some care to
explain in court.
However, we explore the circumstances where the full
expression given in Eq. (1) could be used.
Where no account is taken of quantitative information then
uncertainty in the number of contributors can be accounted for
using priors on nc and the formulations of Weir et al. [9] or
Curran et al. [10]. The former applies the product rule to
mixtures without assessment of quantitative information, the
latter applies the subpopulation correction but again does not
account for quantitative effects. These formulae could be used
to calculate the probability of the mixed profile varying the
number of unknown contributors. Using the prior probabilities
Eq. (1) could then be assessed.
However, it is very unlikely that such an approach will be
practical for consideration in court because of:
1. t
he need to specify priors and2. t
he complexity of the approach.We turn now to a discussion of the issue of the effect of
quantitative data. Various attempts have been made to assess
the probability of the peak areas or heights given the
genotypes. Notable amongst these are methods based on
normal approximations [11] and a suggestion of a Monte
Carlo approach [2]. However, none of these are in widespread
use. The method in most widespread use is based on the
judgement of the operator or on a set of rules [2,12–14]. This is
termed the binary approach and it allows contributing
genotype combinations to pass or fail. Those that pass are
used in the analysis. At this time it is largely implemented for
two-person mixtures but development for three-person
mixtures is proceeding. Many people consider three-person
mixtures uninterpretable unless one profile is clearly in much
larger proportion than the other two, and then only the major
profile is reported. The task of trying to determine the effect of
uncertainty in the number of contributors on the binary
approach is made very difficult by the fact that it has not been
attempted extensively for three-person mixtures. However,
some comments may still be valid. In particular, it is necessary
to bear in mind that there are known limitations to the binary
approach that are quite separate from the effect of uncertainty
in the number of contributors. The deficiencies in the binary
approach centre on those instances when the combination of
genotypes specified by the prosecution is not the best fit to the
peak areas [2].
J.S. Buckleton et al. / Forensic Science International: Genetics 1 (2007) 20–28 27
When considering peak area, the data in a DNA profile
consist of a vector of peak areas at each of the potential allelic
positions. Many of these areas may be small or below
‘‘threshold’’. It is easiest, but not necessary, to restrict attention
to those peaks above threshold. We denote the data as D. We
require
LR ¼ PrðDjHpÞPrðDjHdÞ
¼P1
i¼1 PrðDjnc ¼ i;HpÞPrðnc ¼ ijHpÞP1j¼1 PrðDjnc ¼ j;HdÞPrðnc ¼ jjHdÞ
Again we can make use of the observation thatP1
i¼1 PrðDjnc ¼ i;HpÞPrðnc ¼ ijHpÞP1j¼1 PrðDjnc ¼ j;HdÞPrðnc ¼ jjHdÞ
� PrðDjnc ¼ i;HpÞPrðnc ¼ ijHpÞPrmaxðDjnc ¼ j;HdÞ
where Prmax(Djnc = j, Hd) is the maximum value for this
probability with respect to nc and i is the number of contributors
selected by the prosecution.
Various efforts have been made to estimate probabilities or
probability densities of the kind Pr(Djnc = i, Hd). This term can
be examined by introducing the alleles specified by the
hypotheses. It is necessary, however, when considering peak
areas to keep these alleles paired into genotypes. Using an
adaptation of the terminology of Weir et al. [9] we write U0 as
the set of unknown genotypes and T0 as the set of known
genotypes. There may be many different sets of unknown
genotypes consistent with the mixture. We denote the kth set
U0k. As stated, in principle there are as many potential genotype
combinations for the unknown contributors as there were with
no consideration of peak area. However, many of these
combinations give a very poor fit to the peak areas but in
principle there is no harm in retaining these combinations.
Given this
PrðDjnc ¼ i;HÞ ¼X
k
PrðDjU0k; T 0; nc ¼ i;HÞ
� PrðU0kjT 0; nc ¼ i;HÞPrðT 0jnc ¼ i;HÞ
where the summation is over all genotype combinations of
the unknown contributors given the fixed total number
of contributors, nc. It seems reasonable to assume that
Pr(T0jnc = i, H) = 1. Hence
PrðDjnc ¼ i;HÞ ¼X
k
PrðDjU0k; T 0; nc ¼ i;HÞ
� PrðU0kjT 0; nc ¼ i;HÞ
This can be read as the probability of the unknown
genotypes, iGHk ¼ PrðU0kjT 0; nc ¼ i;HÞ, required to explain
the mixture multiplied by the probability of the peak areas
given these genotypes, iFHk ¼ PrðDjU0k; T 0; nc ¼ i;HÞ. Those
combinations giving poor fits to the data are expected to give
small values for iFHk . Exploratory models have been
developed to investigate the probability of the peak areas
given the genotypes, iFHk , but none have been universally
accepted and none have been used extensively in casework.
The binary approach in effect assigns values of 0 or 1 to these
terms depending on whether the genotype combinations pass
or fail a set of rules designed to assess goodness of fit to the
peak areas.
In order to assess the effect of a change to the total number of
contributors, nc, we need to examine the relative magnitudes of
sums of the typeP
kiFk
iGk. We signify those in the numerator
asP
kiF
Hp
kiG
Hp
k and those in the denominator asP
kiF
Hdk
iGHdk .
The sum of the terms of the type, iGHk , behaves exactly as it did
when no consideration was made of area. That is, the addition
of an unknown contributor above the minimum required to
explain the number of alleles has a tendency to reduce each iGHk
in most but not all cases. When additional unknown
contributors are added there are more of these terms in the
summation but each is smaller. This statement is simply a
restatement of the assertion by Brenner et al. [6] that the
maximum for the denominator (their emax) certainly exists and
typically corresponds to the minimum number of people
required to explain the observed alleles.
However, when considering area we do not need to consider
the sum of the iGHk terms alone but rather the sum of these terms
multiplied by the term expressing the probability of the areas
given the genotypesP
kiFk
iGk. In order for this sum to be larger
for larger nc some or many of the multipliers iFHk must be
sufficiently larger to compensate for the reduction in iGHk . This
condition implies that there is a significantly better fit to the
peak areas for at least some or many of the genotype
combinations with the addition of the extra unknown. It seems
likely that the addition of an unknown will lead to larger iFHk
only when this addition significantly improves the fit to the
peak areas. This could function as a condition. If the scientist
can subjectively perceive that no increase in nc is warranted to
improve the fit to the areas then the minimum nc is likely (but
not certain) to maximise the denominator. If we return to the
observation that the sum in the numerator with respect to the
number of contributors cannot be less than one of the terms and
we seek that value of nc that maximises the denominator then
LR� PrðDjnc ¼ i;HpÞPrðnc ¼ ijHpÞPrmaxðDjnc ¼ j;HdÞ
�P
kiF
Hp
kiG
Hp
kPk
iFHd
kiGHd
k
Prðnc ¼ ijHpÞ
The binary model would approximate this by setting the
terms iFHp
k and iFHdk to 0 or 1. Again if we assume that Hp
specifies the number of contributors then the prior
Pr(nc = ijHp) = 1 and hence
LR �P
kiF
Hp
kiG
Hp
kPk
iFHd
kiGHd
k
Clearly the optimal approach is to see fully quantitative
models that can assess Pr(nc = i, H) for varying numbers of
contributors. Pending these treatments it is likely that the
approximation given above will suffice. This approximation is
actually the status quo, when utilising the binary approach. It
requires:

J.S. Buckleton et al. / Forensic Science International: Genetics 1 (2007) 20–2828
1. T
hat the information about the number of contributors bespecified under Hp and that the judge or jury assess this when
they assign a prior to Hp. This will clearly take some skill to
convey well in court.
2. T
hat the value of nc that will maximise the denominator beassessed subjectively. This requires that the number of
contributors that gives the best fit or fits to the peak areas be
estimated.
3. T
hat the assignment of the values 0 and 1 to the terms iFHpk
and iFHdk be done in a reasonable way. This latter requirement
is really a condition of the binary model rather than a
condition relating to uncertainty in the number of
contributors.
References
[1] D.R. Paoletti, T.E. Doom, C.M. Krane, M.L. Raymer, D.E. Krane,
Empirical analysis of the STR profiles resulting from conceptual mixtures,
J. Forensic Sci. 50 (2005) 1361–1366.
[2] J.S. Buckleton, C.M. Triggs, S.J. Walsh, Forensic DNA Evidence
Interpretation, CRC Press, Boca Raton, FL, 2005.
[3] National Research Council Committee on DNA Forensic Science, The
Evaluation of Forensic DNA Evidence, National Academy Press,
Washington, DC, 1996.
[4] C. Brenner, What’s wrong with the ‘‘exclusion probability’’, 1997.
www.dna-view.com/exclusn.htm (last accessed on May 1, 2006).
[5] B.S. Weir, Court experiences in the USA: People v. Simpson, in: Proceed-
ings of the First International Conference on Human Identification,
London, 1999.
[6] C. Brenner, R. Fimmers, M.P. Baur, Likelihood ratios for mixed stains
when the number of donors cannot be agreed, Int. J. Legal Med. 109
(1996) 218–219.
[7] S.L. Lauritzen, J. Mortera, Bounding the number of contributors to mixed
DNA stains, Forensic Sci. Int. 130 (2002) 125–126.
[8] D.J. Balding, Weight-of-Evidence for Forensic DNA Profiles, John Wiley
and Sons, Chichester, 2005.
[9] B.S. Weir, C.M. Triggs, L. Starling, L.I. Stowell, K.A.J. Walsh, J.S.
Buckleton, Interpreting DNA mixtures, J. Forensic Sci. 42 (1997) 213–
222.
[10] J.M. Curran, C.M. Triggs, J.S. Buckleton, B.S. Weir, Interpreting
DNA mixtures in structured populations, J. Forensic Sci. 44 (1999)
987–995.
[11] I.W. Evett, P.D. Gill, J.A. Lambert, Taking account of peak areas when
interpreting mixed DNA profiles, J. Forensic Sci. 43 (1998) 62–69.
[12] T. Clayton, J.P. Whitaker, R.L. Sparkes, P. Gill, Analysis and interpretation
of mixed forensic stains using DNA STR profiling, Forensic Sci. Int. 91
(1998) 55–70.
[13] P. Gill, R.L. Sparkes, R. Pinchin, T. Clayton, J.P. Whitaker, J.S. Buckleton,
Interpreting simple STR mixtures using allelic peak areas, Forensic Sci.
Int. 91 (1998) 41–53.
[14] M. Bill, P. Gill, J. Curran, T. Clayton, R. Pinchin, M. Healy, J. Buckleton,
PENDULUM—a guideline based approach to the interpretation of STR
mixtures, Forensic Sci. Int. 148 (2005) 181–189.
[15] P. Gill, J.P. Whitaker, C. Flaxman, N. Brown, J.S. Buckleton, An inves-
tigation of the rigor of interpretation rules for STR’s derived from less that
100 pg of DNA, Forensic Sci. Int. 112 (2000) 17–40.
Related Documents